12 minute read
MAPPING CATCHMENT INTERVENTIONS


Water quality and diffuse pollution in rainfall events in feeder streams
In addition to nutrient content, the study of pollutant concentrations during specific rainfall events is useful to understand contaminant dynamics. The plots shown in Figure 9 highlight the different type of behaviour generally observed with TON and DOC, resulting in different hysteresis loop patterns in the catchment: TON generally present in the stream is being diluted by rain water during storms (i.e. concentrations decrease as flow increases), indicating that there is no immediate increase in concentration as an input of diffuse pollution; DOC, however is increasing in concentration during the event and peaks simultaneously to the peak in discharge, which indicates that it is flow and rainfall driven, with sources of DOC (such as manures or slurries on fields) being directly connected to the water course during times of high rainfall. These two different types of behaviour are reflected in two different hysteresis loops: clockwise for TON, and anticlockwise for DOC.
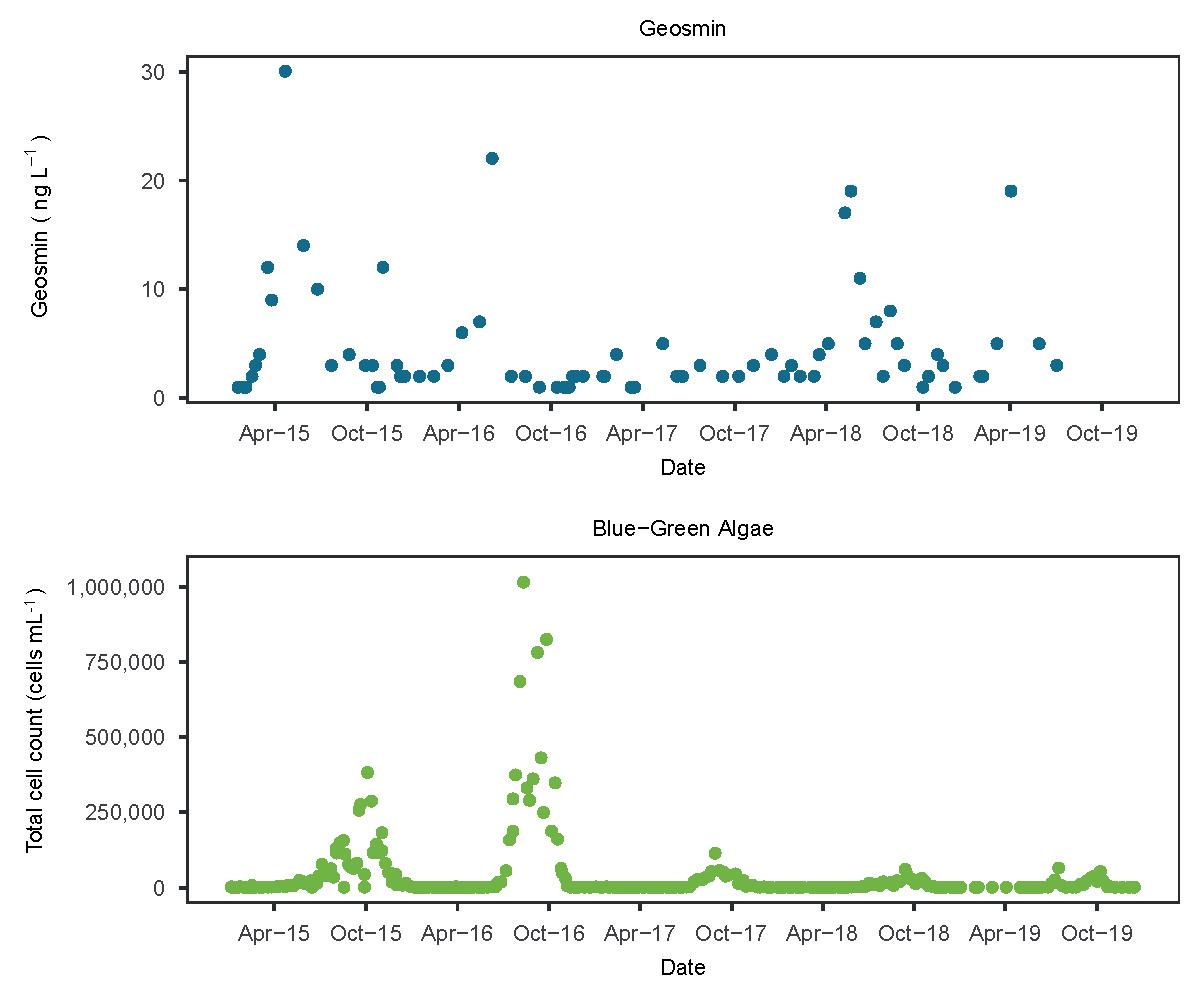
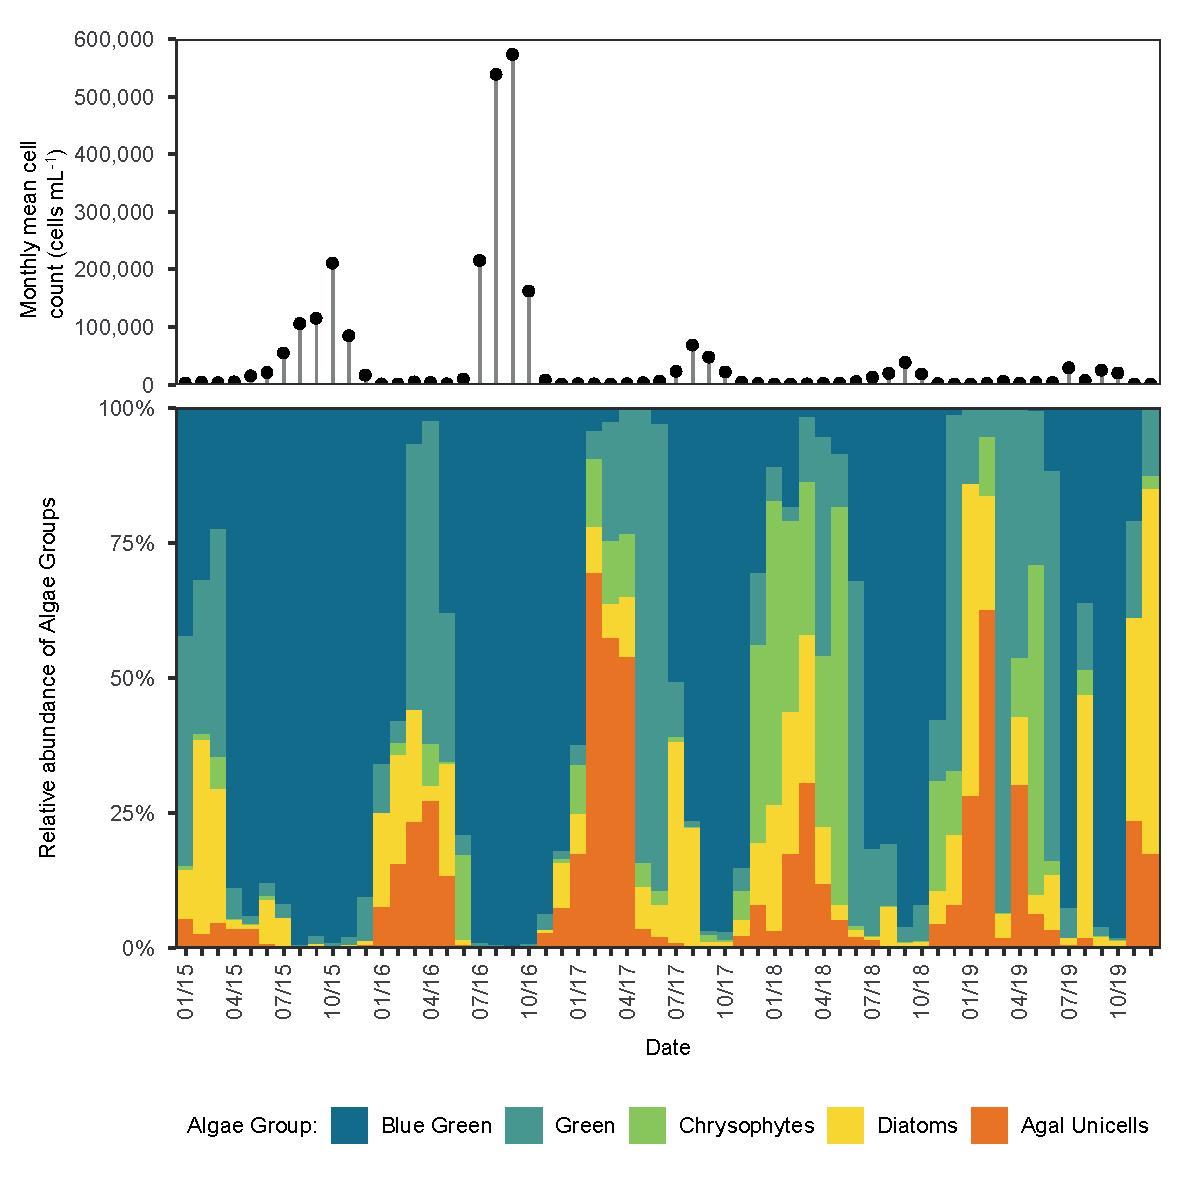
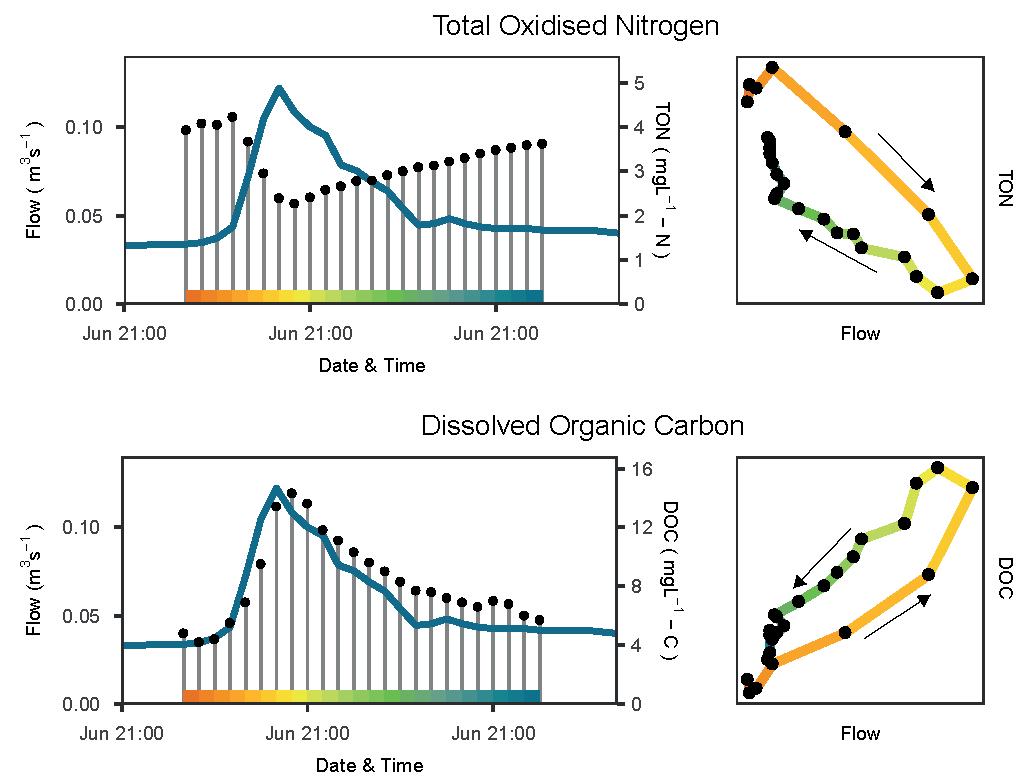
Figure 9 Relationship between flow (m3 s-1) and water quality parameters (i.e.
Dissolved Organic Carbon and Total Oxidised Nitrogen) for one rainfall event in the Sancreed Brook sub-catchment, with associated hysteresis loop.
Figure 10
Monthly averages of total algal blooms (A) with corresponding abundance of species (B) between 2014 and 2019 in the raw water at Drift WTW.
A
B Blue-green algae and nutrient content in the reservoir
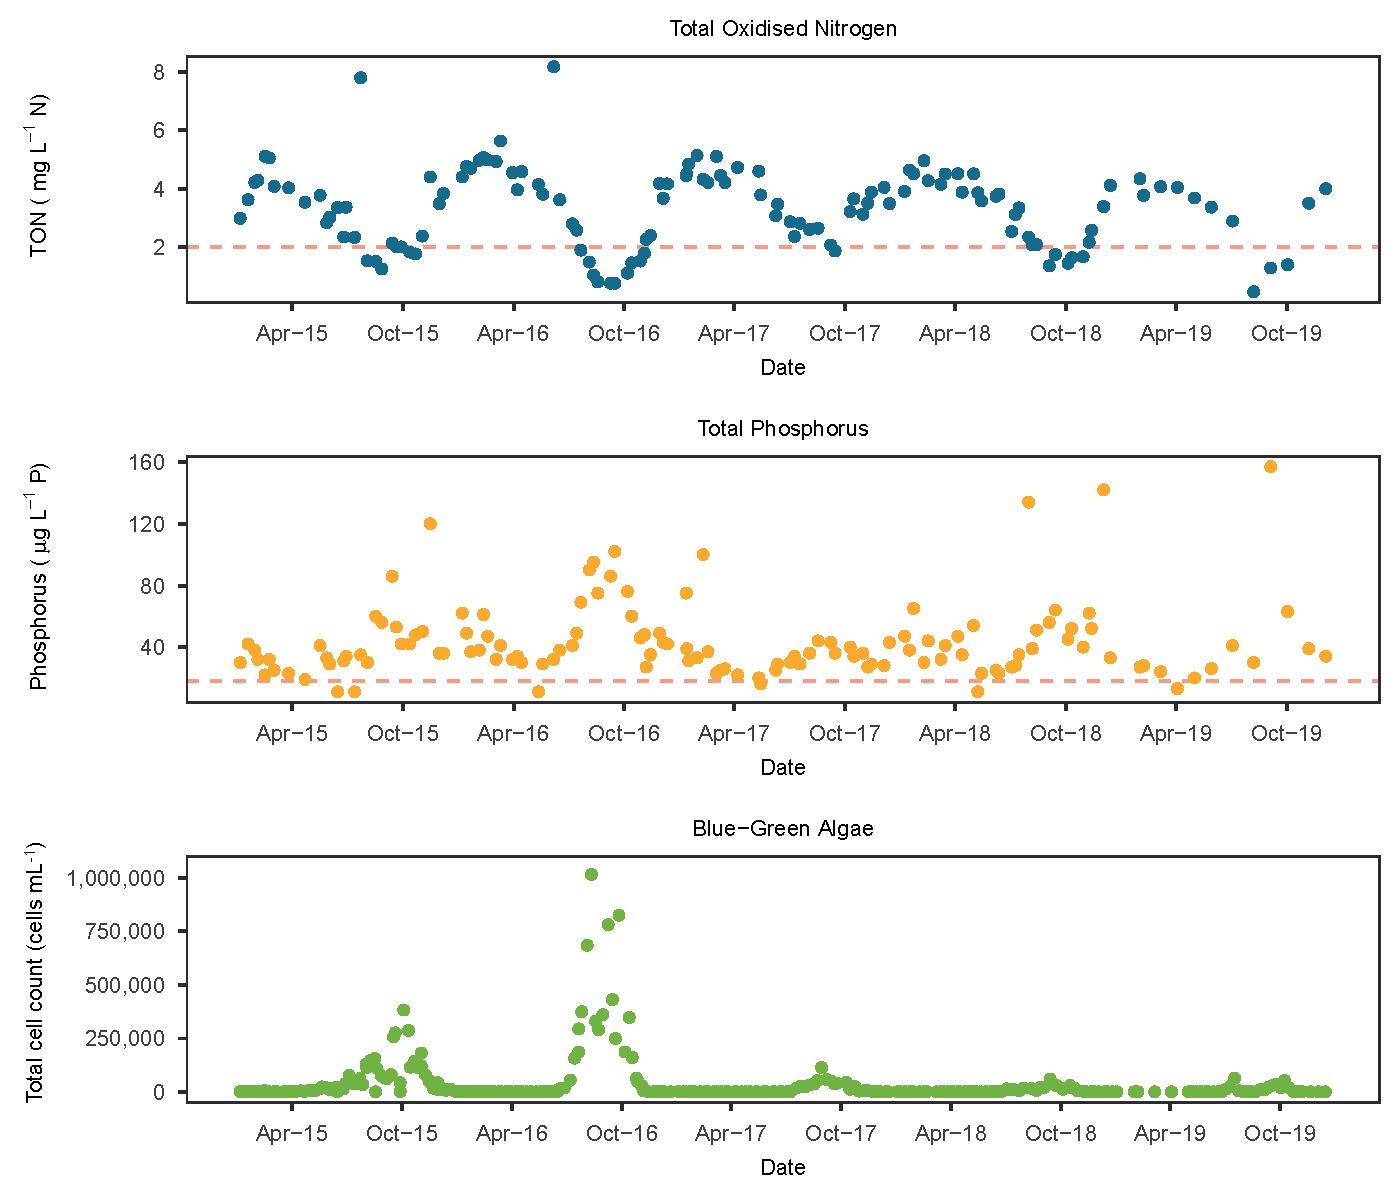
Algal blooms have been identified as an issue in Drift reservoir. Spot samples collected by SWW at the water treatment works (Figure 10A) show the occurrence of summer algal peaks in Drift reservoir, which was identified as problematic and costly for the water treatment works. Peaks in 2015 and 2016 were particularly prominent, however, their amplitude seems to decrease in the subsequent years. Figure 10B shows the overwhelming presence of cyanobacteria during these peaks whilst other species are only noticeable at other times. Cyanobacteria have been identified as particularly problematic in Drift reservoir due to its significant impact on the treatment process. In addition, the reduction in nutrient concentrations in the reservoir was an objective of Upstream Thinking. However, the result of the spot samples in raw water at the WTW (Figure 11) shows that nutrient concentrations remained high. For phosphorus, samples consistently fell outside of the WFD target indicting good status (i.e. above 15.76 µg L-1); TON concentrations showed a seasonal pattern, going below the 2 mg-N L-1 in the autumn-winter. Neither nutrient shows a clear sign of improvement. This particular result is likely to be linked with the existing nutrient content of the reservoir, which is clearly high, as a legacy of nutrient inputs in previous years. However, in addition, recent levels of input to the reservoir during rainfall events (Figure 11) above these levels are likely to have contributed to the currently high nutrient content of the reservoir. In reservoirs, geosmin which causes taste and odour problems in drinking water, can originate from algae die-back. We would therefore expect increased concentrations of geosmin to occur after algal blooms. Interestingly, geosmin data (Figure 12) shows that this is not necessarily the case. This is, for example, noticeable with peaks in algae occurring in Autumn 2016 that do not result in a significant increase in geosmin; conversely, a number of geosmin peaks seem to occur and be unrelated to algal blooms. This means that geosmin could originate from sources in catchment, i.e. from soil, although a more in depth study would need to be carried out to draw firm conclusions. Overall, the reduced amplitude of blue-green algal blooms since 2017 is a positive result for the Upstream Thinking objectives. More investigations in the coming years will enable us to identify the importance of climate, within reservoir dynamics and input of nutrients in the catchment in driving algal blooms. This should enable us to better quantify the benefit brought by catchment management to reservoirs and reduce algal blooms and associated water treatment costs.
Figure 11 Total
Oxidised Nitrogen (top), Phosphorus (middle) and bluegreen algae cell count (bottom) between 2014 and 2019 in raw water at Drift WTW; red lines indicate the exceedance limit for each nutrient concentrations in the catchment.
Figure 12 Geosmin
(top) and blue-green algae concentrations (bottom) between 2015 and 2019 in raw water at Drift WTW.
Pesticide detections within the catchment
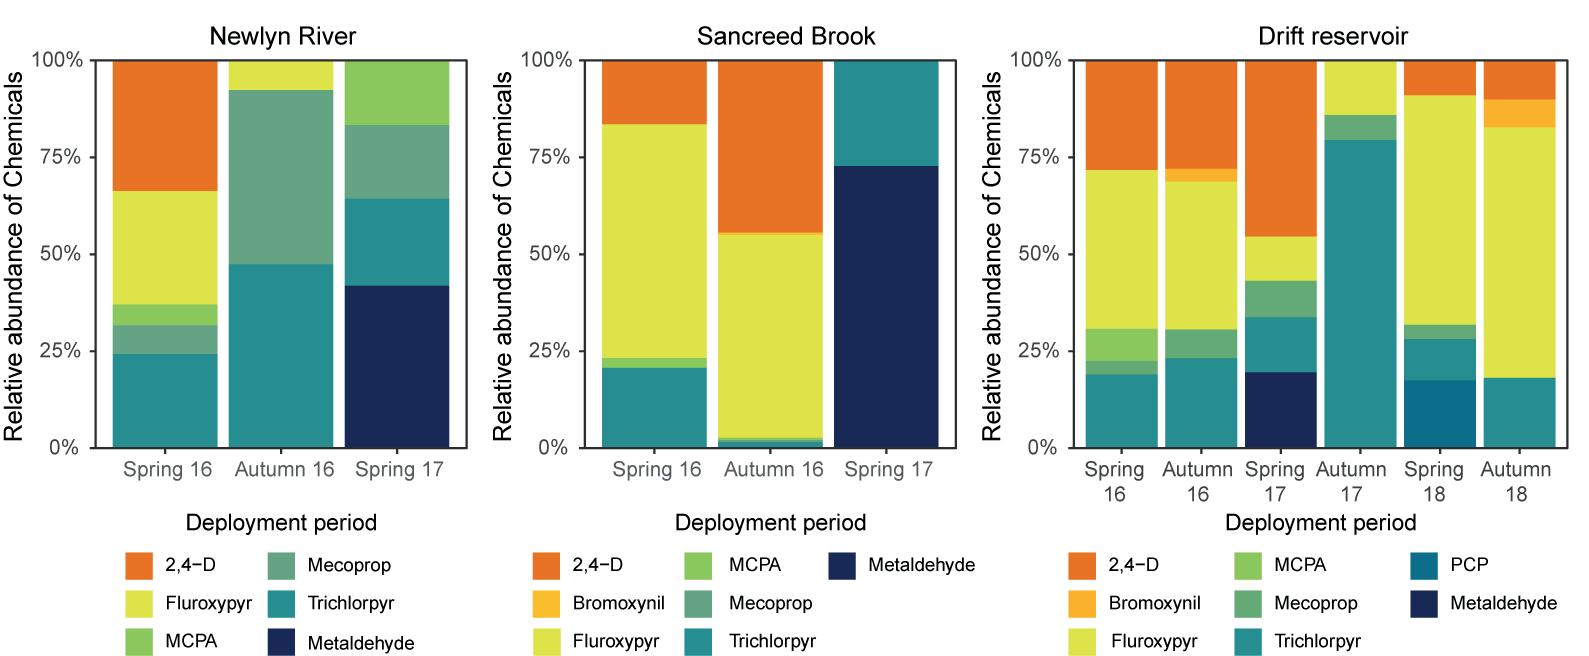
Another concern in the catchment has been pesticides getting to the reservoir. Chemcatchers were used to get a better understanding of concentrations at specific times of the year, i.e. 6 weeks in the spring and 6 weeks in the autumn. Chemcatcher deployments in the Drift catchment show a high number of compounds detected (i.e. up to 8 compounds for Drift reservoir, 6 for the Newlyn River, and 7 for the Sancreed Brook). In all locations, 2,4-D, Fluroxypyr and Trychlopyr represents the majority of the compounds detected (Figure 13). These compounds are routinely used as pesticides on farmland. The total number of detections per site and deployment period ranged between 4 and 15 (Table 1). There is also a slight decrease in the overall number of detections in the Drift reservoir between the first half of the project (Spring 2016 to Spring 2017) and the second half (from Autumn 2017). Although this difference is not statistically significant, it is positive.
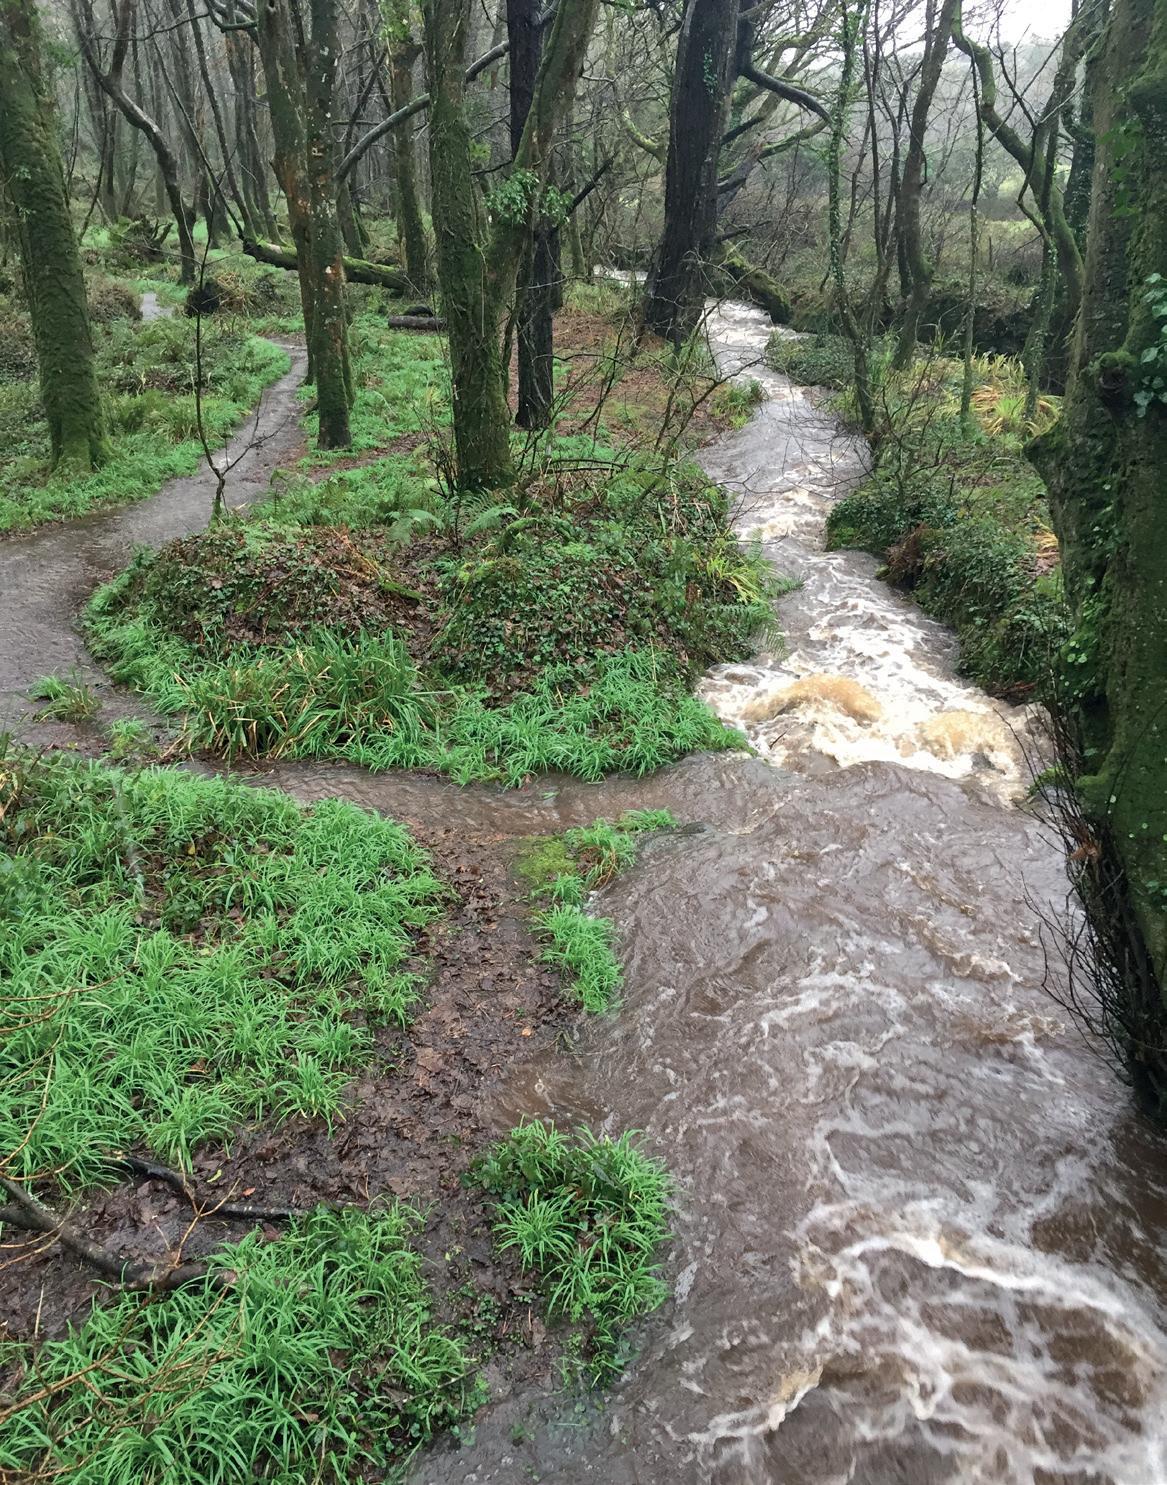
High flow in the Newlyn River; Photo by Paul Henderson.
Spring 16 Autumn 16 Spring 17 Autumn 17 Spring 18 Autumn 18
Total number of detections
Sancreed brook 9 13 4 N/A N/A N/A
Newlyn river 13 9 9 N/A N/A N/A
Drift WTW 15 15 14 7 13 9
Nb single exceedances >100 ng L-1
Exceedance over 500 ng L-1 Sancreed brook 0 0 0 N/A N/A N/A Newlyn river 0 0 0 N/A N/A N/A Drift WTW 0 0 0 0 0 0
Sancreed brook 0 0 0 N/A N/A N/A Newlyn river 0 0 0 N/A N/A N/A Drift WTW 0 0 0 0 0 0
Max value (ng L-1)
Total number of compounds Sancreed brook 8 22 1 N/A N/A N/A
Newlyn river Drift WTW 3 4 2 N/A N/A N/A
3 9 2 5 4 2
Sancreed brook 4 6 2 N/A N/A N/A Total number of compounds 5 3 4 N/A N/A N/A Drift WTW 5 5 5 3 5 4
Table 1 Summary of pesticide detections in the Drift catchment between spring 2016 and autumn 2018. The blue
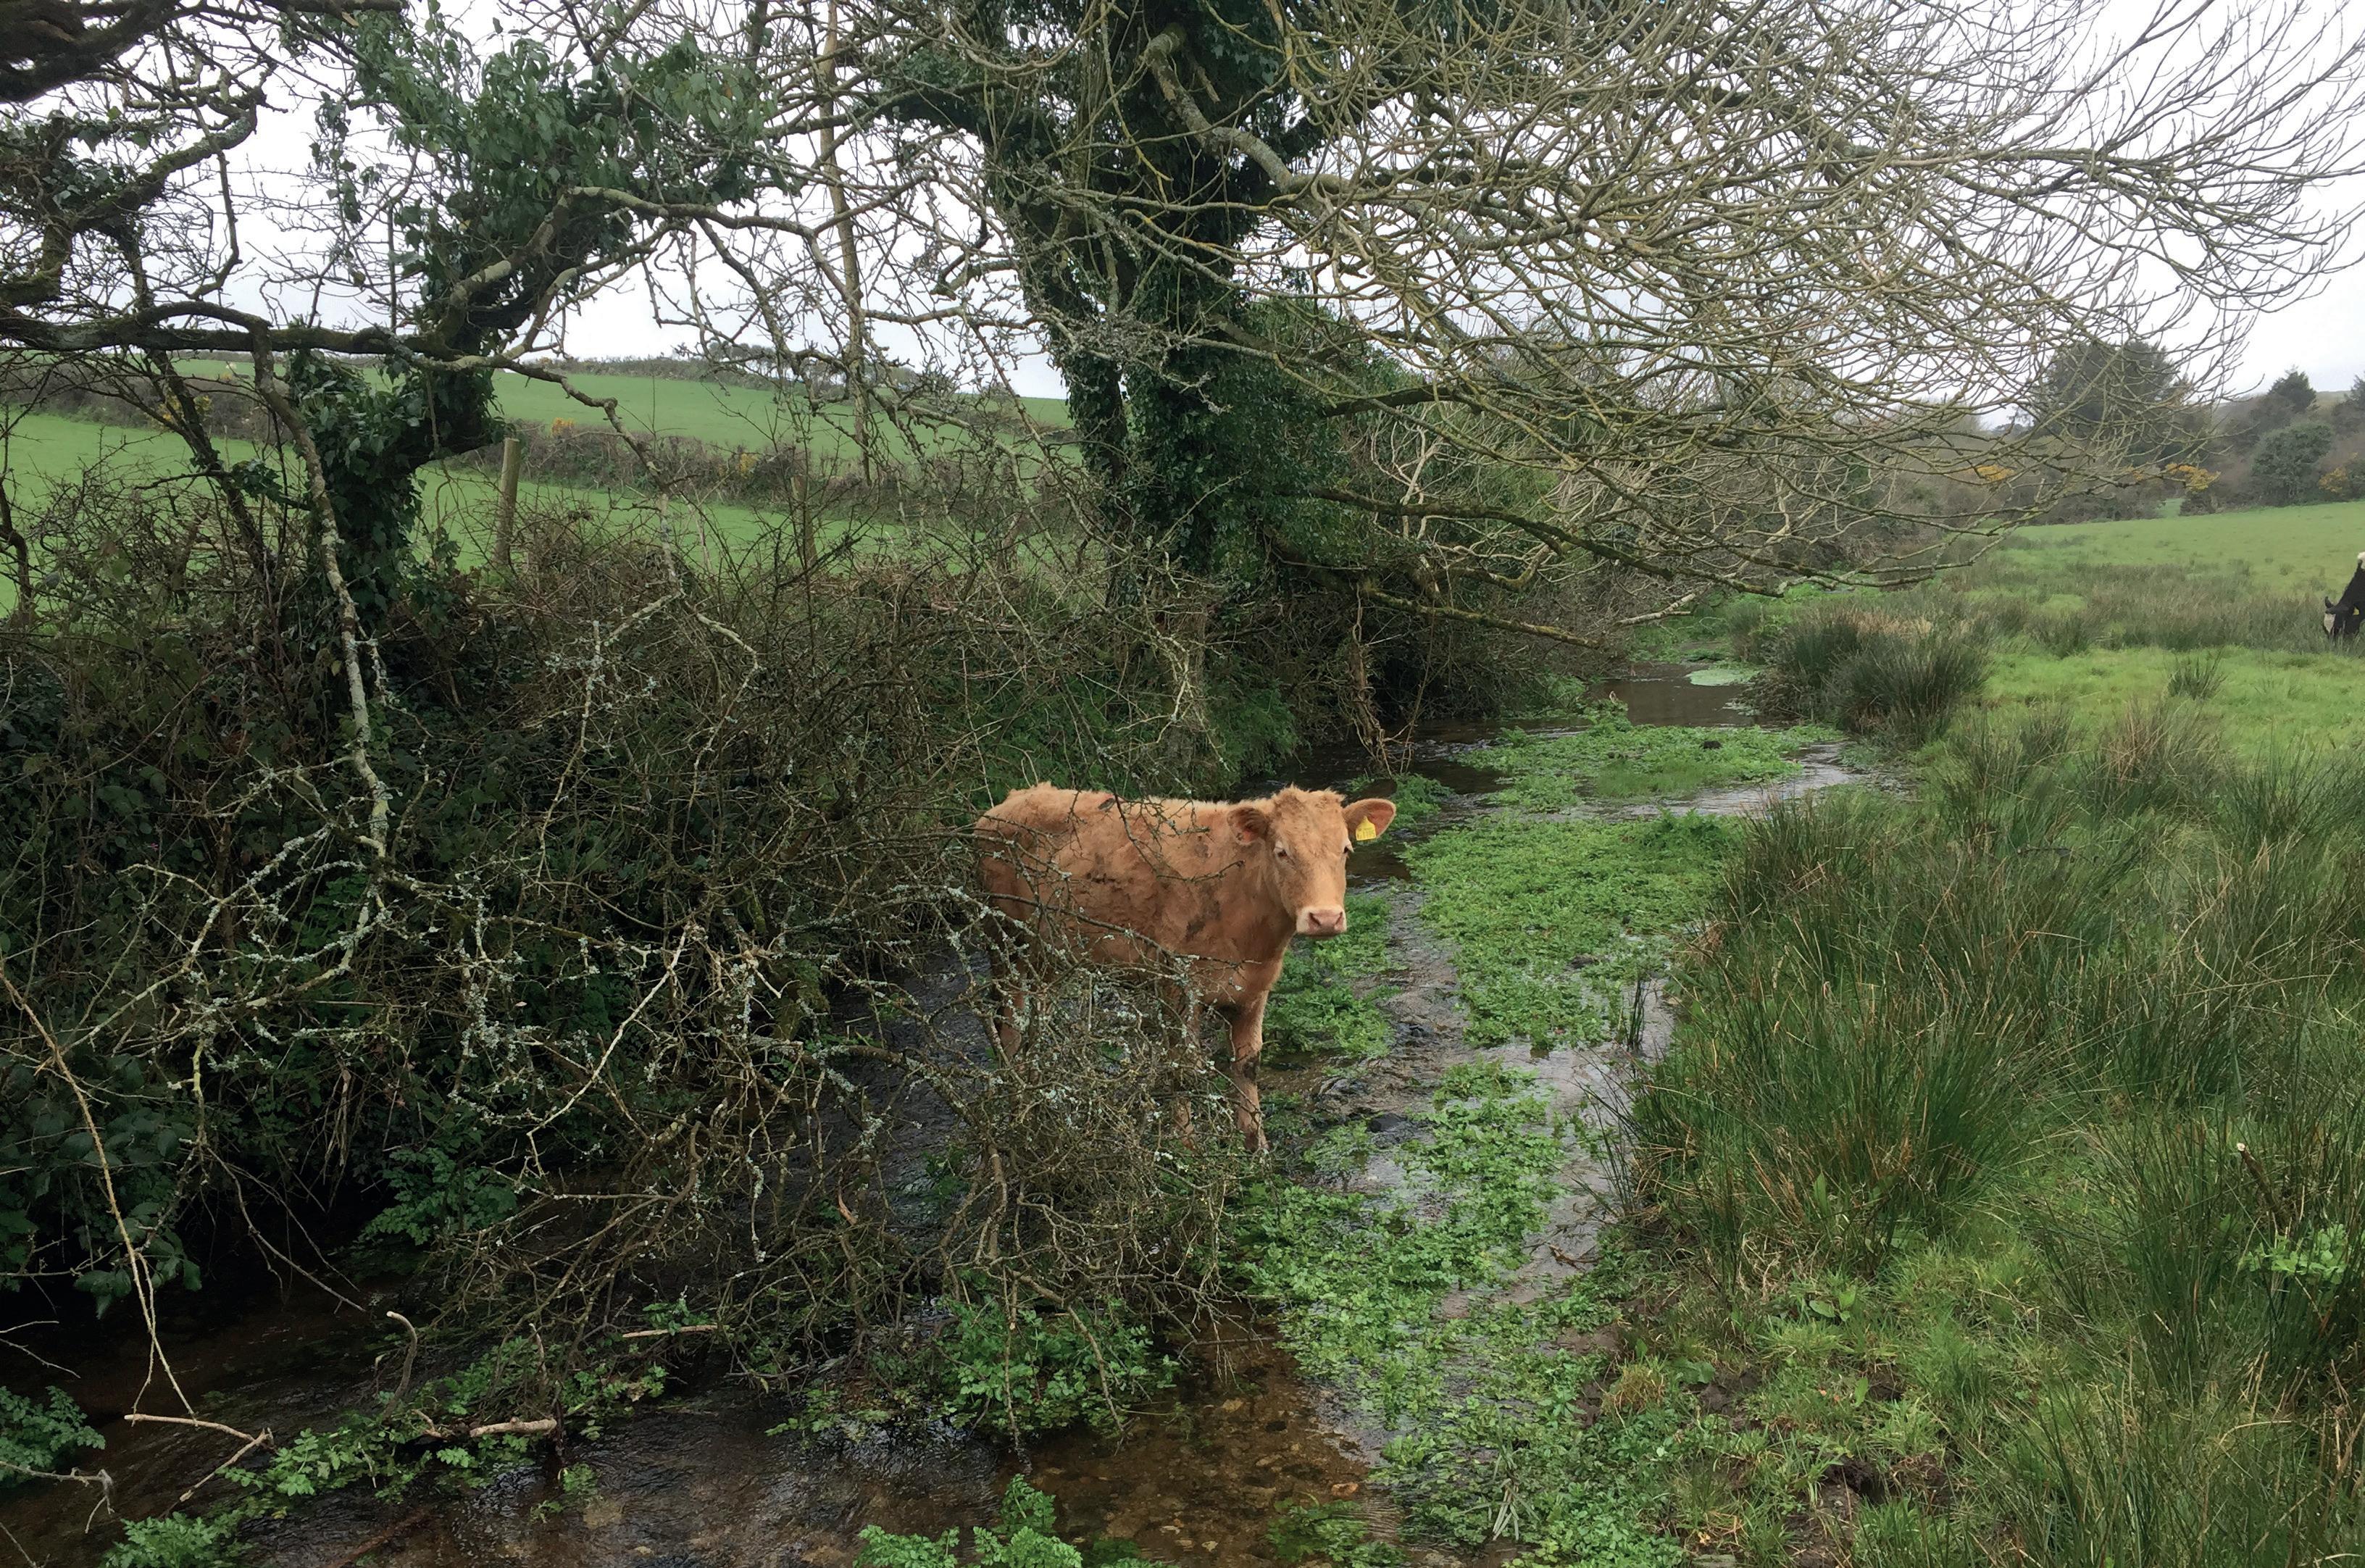
shading indicates a severity scale separately applied to each parameter, from light blue (low) to dark blue (high); N/A indicates that no deployments were carried out. Cattle in the Sancreed Brook; Photo by Paul Henderson.
Certain compounds are also sporadically detected, such as metaldehyde (found in slug pellets) in Spring 2016 in all three locations, and PCP (weed killer) in Spring 2018 only (although the monitoring period of the feeder streams stopped in Autumn 2017). With an overall maximum concentration of 22 ng L-1 in the Sancreed Brook, no site had a single detection above the regulatory limit of 100 ng L-1 (in treated water), or a cumulated concentration over 500 ng L-1, which is very positive.
Figure 13 Relative abundance (%) of
chemicals detected between Spring 2016 and Autumn 2018 at Drift reservoir, and between Spring 2016 and Spring 2017 for the Newlyn River and the Sancreed Brook.
§ Upper Tamar Lake has been identified as “at-risk” for pesticides (in particular MPCA, mecoprop and metaldehyde) and blue-green algae caused by excess nutrients; § Water quality investigations showed a decrease in turbidity in the feeder stream to the reservoir at high flow between 2016-2017 and 2018-2019; however, this reduction is not yet detectable in the overall turbidity of the raw water at the WTW; § Two different rainfall event dynamics have affected the delivery of Soluble
Reactive Phosphorus to the feeder stream, indicating the contribution of either a deep zone within the soil, or from a more distant, agricultural source further up catchment. This information is important to tackle sources of diffuse pollution; § Algal blooms are not concomitant with nutrient input to the reservoir, and are therefore likely to be driven, to some extent, by climate combined with existing nutrient loads in reservoir; § A number of high pesticide detections were observed in the catchment and reservoir (e.g. 2,4D, Fluroxypyr and Trichlopyr; the number of detections ranged between 6 and 18 per deployment period).
About the catchment
Background site information
The Tamar catchment is located along the boundary of Devon and Cornwall. The catchment drains an area of about 1,800 km2 . Upper Tamar Lake is a reservoir catchment located the north of the Tamar catchment (Figure 1). The area is predominantly rural. To the south are the Tamar estuary and the city of Plymouth where the majority of the population is based.
Catchment Challenges
Upper Tamar Lake at risk for pesticides (in particular MCPA and mecoprop), metaldehyde and bluegreen algal blooms caused by excess nutrients.
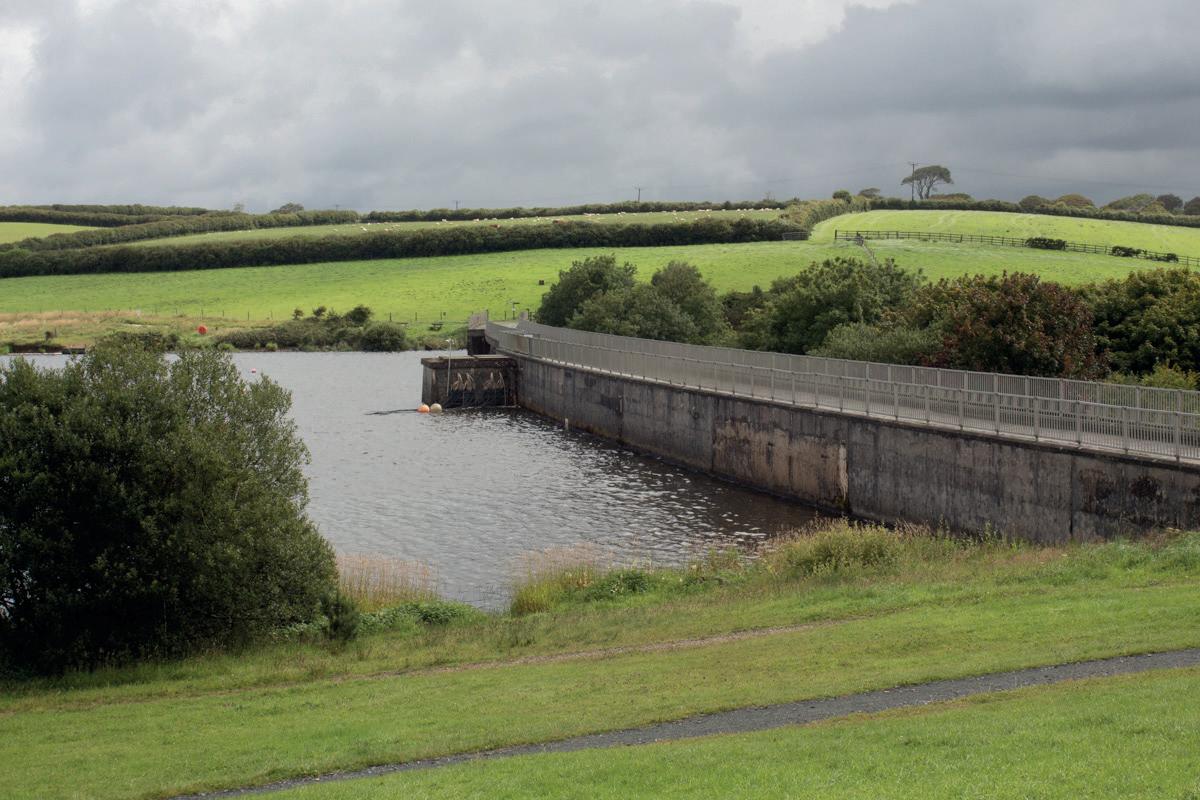
Figure 1
Upper Tamar Lake; photo by Emilie GrandClement.
Catchment activities
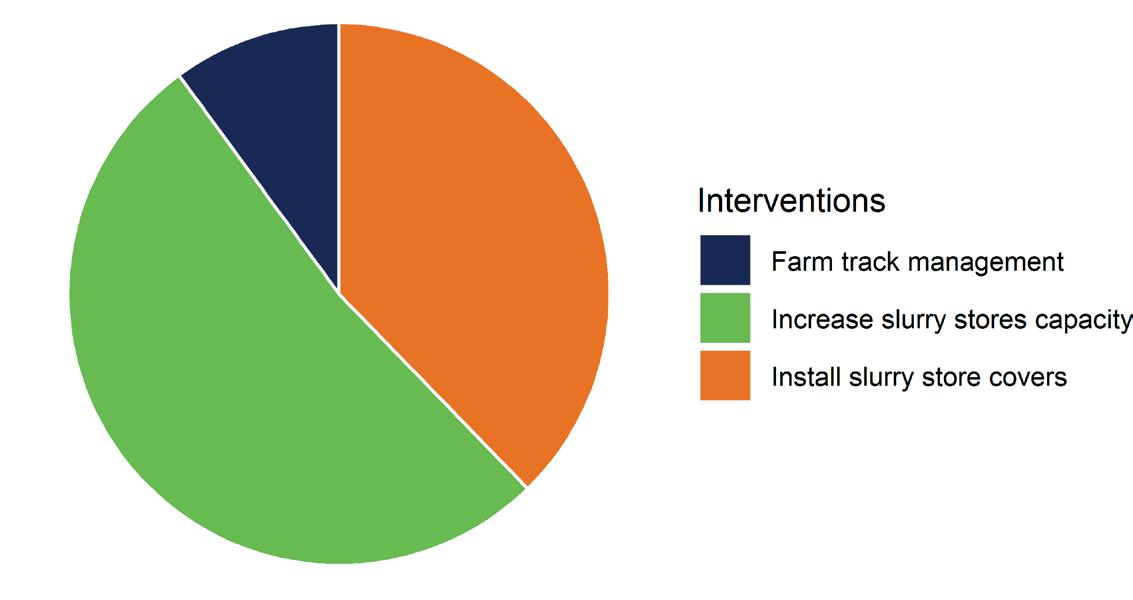
Through Upstream Thinking, project partners have targeted the most polluting areas of the catchments and have focussed around activities such as farm track management, fencing off rivers and establishing buffer strips. As of May 2019, 77% of the Upper Tamar area has been engaged in Upstream Thinking by both Westcountry Rivers Trust (WRT) and Devon Wildlife Trust (DWT) (Figure 2). Physical interventions completed via Upstream Thinking, which were quantifiable within the Farmscoper software, amounted to a cumulative area of almost 6,000 ha. The most commonly used interventions are shown in Figure 3. In addition, ca. 4 ha of culm, or species rich grassland, were restored in the catchment by DWT.
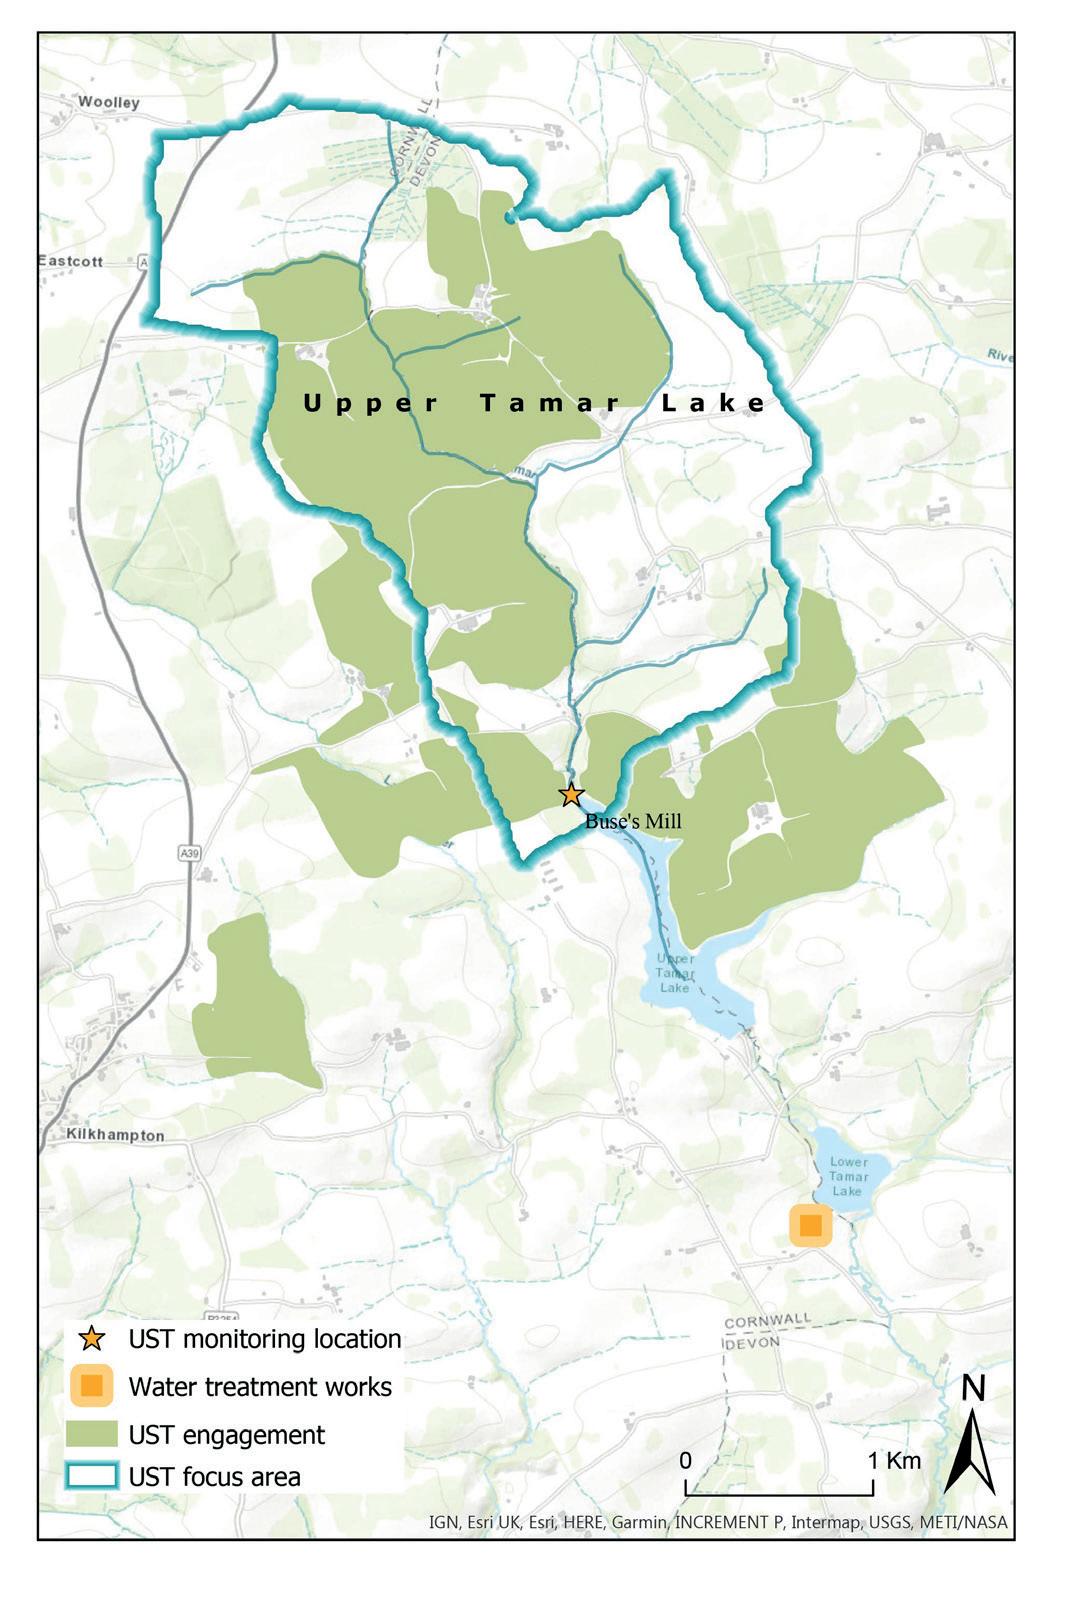
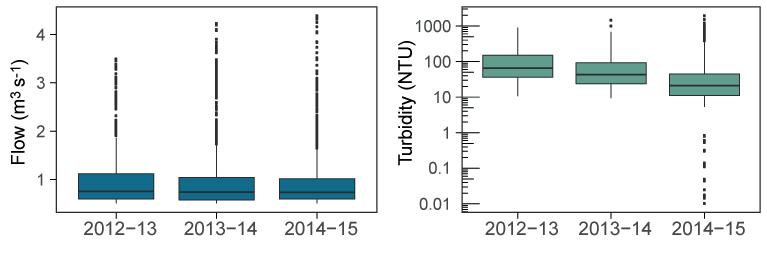
Figure 2 Map of
engagement by WRT and DWT as part of UsT in the Upper Tamar Lake catchment.
Figure 3 Top interventions
(quantified in Farmscoper) used in the Upper Tamar Lake catchment.
Figure4 High flow (Q5 and above)
measured per hydrological year (left) and corresponding turbidity (NTU) measurements in feeder stream to Upper Tamar Lake plotted on a log scale.
Water quality at Upper Tamar Lake
Turbidity in feeder streams
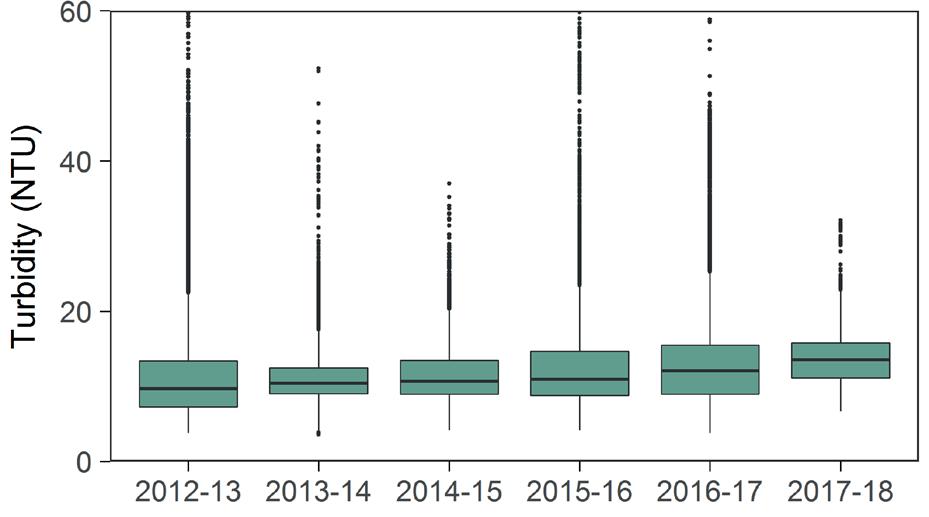
Continuous measurements of turbidity in the feeder stream to Upper Tamar Lake (Figure 4) performed by the University of Exeter indicate a slight decrease in the turbidity or suspended sediment inputs to the lake at high flow (i.e. Q5 flows and above, with stream flow remaining unchanged between hydrological years) between 20162017 and 2018-2019. However, this positive, recent change is not yet detectable in the overall turbidity of the raw water at the Water Treatment Works (WTW), with no significant change being observed in concentrations between the hydrological years of 2012-2013 and
Figure5 Overall
changes in turbidity between 2012-2013 and 2017-2018 for all flow records at Tamar Lake WTW.
2017-2018 (Figure 5). These results therefore highlight some positive change in turbidity at a small scale that contributes to the lack of deterioration in the reservoir and, over time, will hopefully lead to a reduction in sediment content in the reservoir.
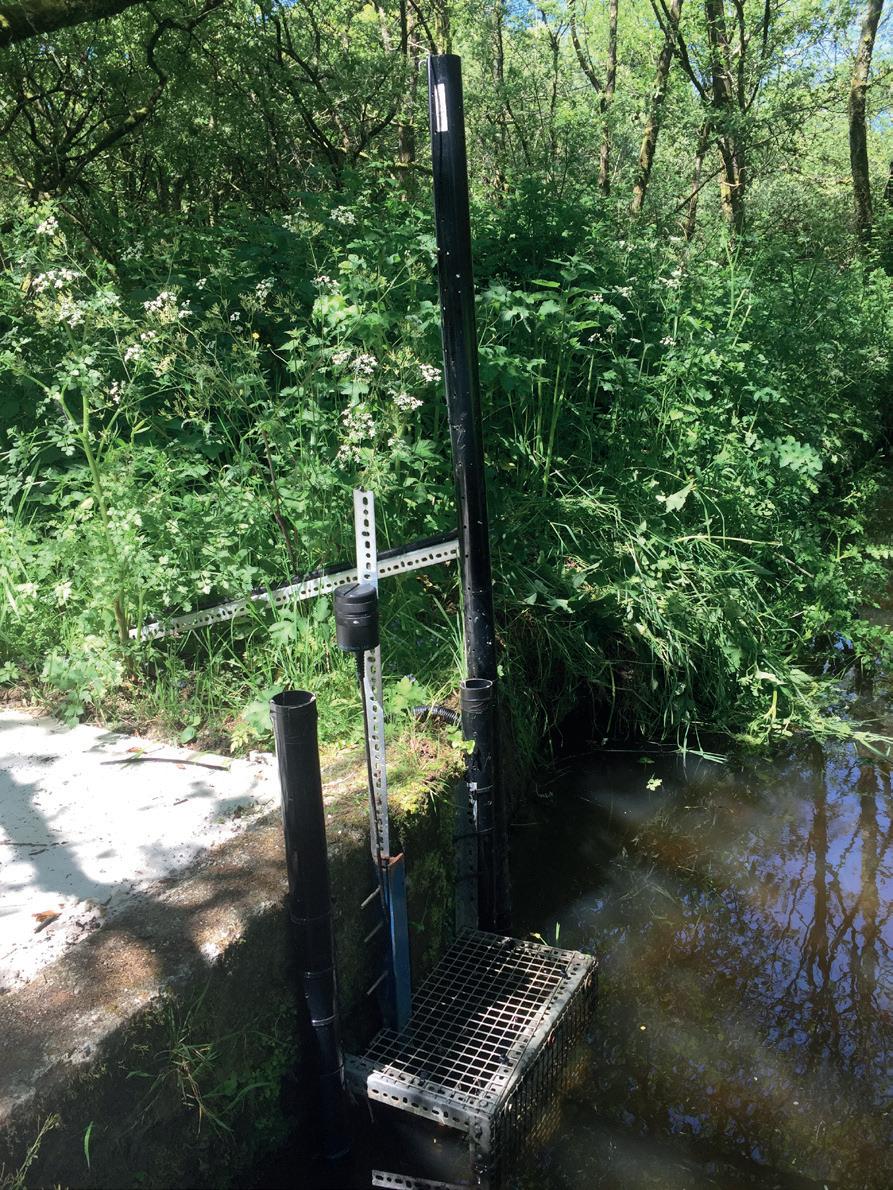
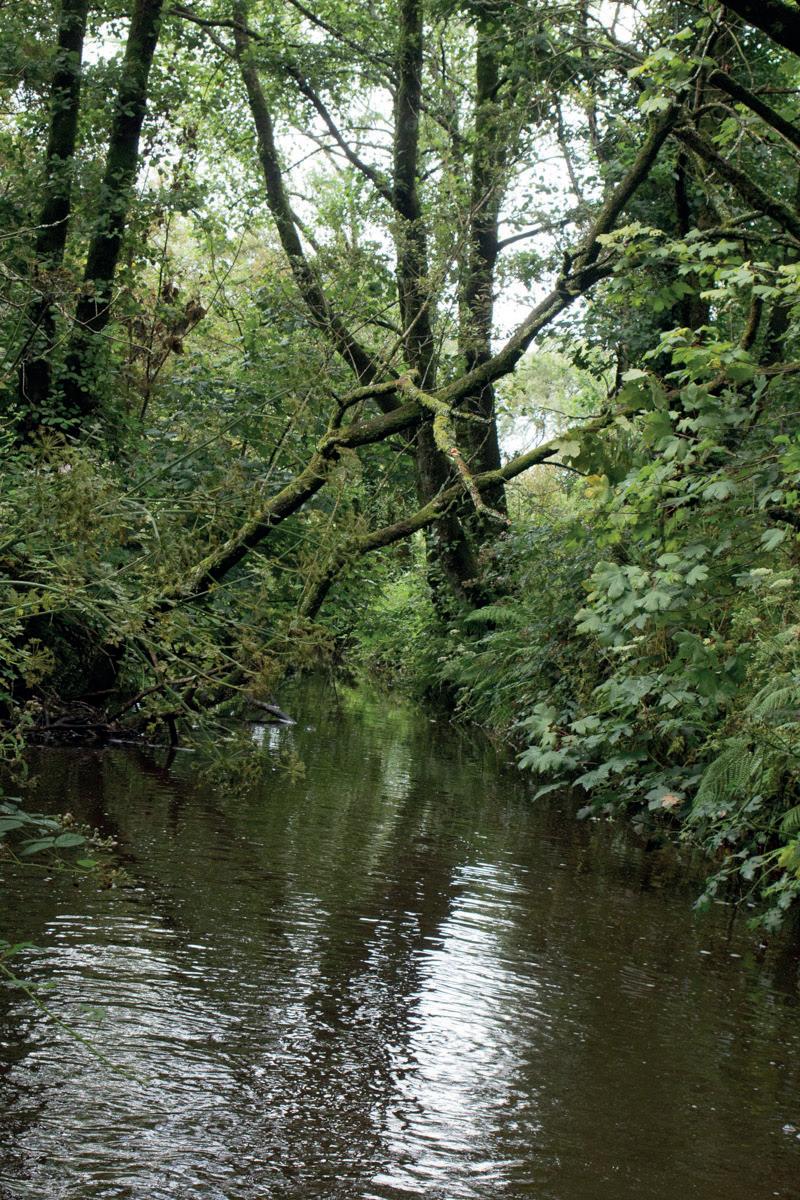
Continuous sensors (left) placed in the feeder stream (right) to Upper Tamar Lake; photo by Paul Henderson.
Samples were also collected in the feeder stream to the lake (Figure 6) during rainfall events and analysed for nutrient inputs to the reservoir. Soluble Reactive Phosphorus (SRP) measurements during two distinct rainfall events in the feeder stream show the occurrence of two clear patterns at different times. In one case, a peak of SRP occurs just before peak flow (Figure 6, top), which results in a clockwise hysteresis loop. During another event (Figure 6, bottom), the SRP response is delayed and occurs after the peak in stream flow, leading to an anticlockwise hysteresis loop. It has been shown that these differences indicate two different rainfall event dynamics, caused by a difference in the delivery of SRP to the stream. In the case of an anticlockwise loop, the SRP source might originate from another, more distant, source or from the contribution of a deeper zone within the soil compared to the clockwise loop. Such changes in behaviour in nutrient delivery is most likely to be driven by differences in rainfall event characteristics, i.e. rain intensity, duration and antecedent conditions.
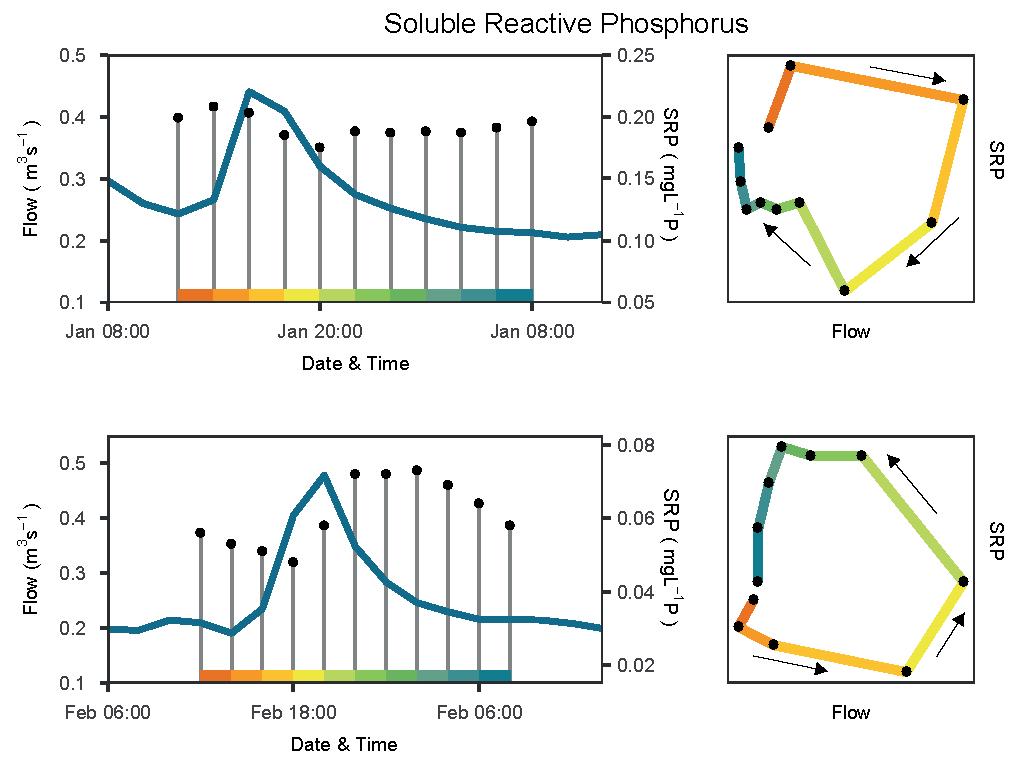
Figure6 Relationship between
flow (m3 s-1) and Soluble Reactive Phosphorus (mg L-1) during different rainfall events, with associated hysteresis loop.
Seasonality in the reservoir
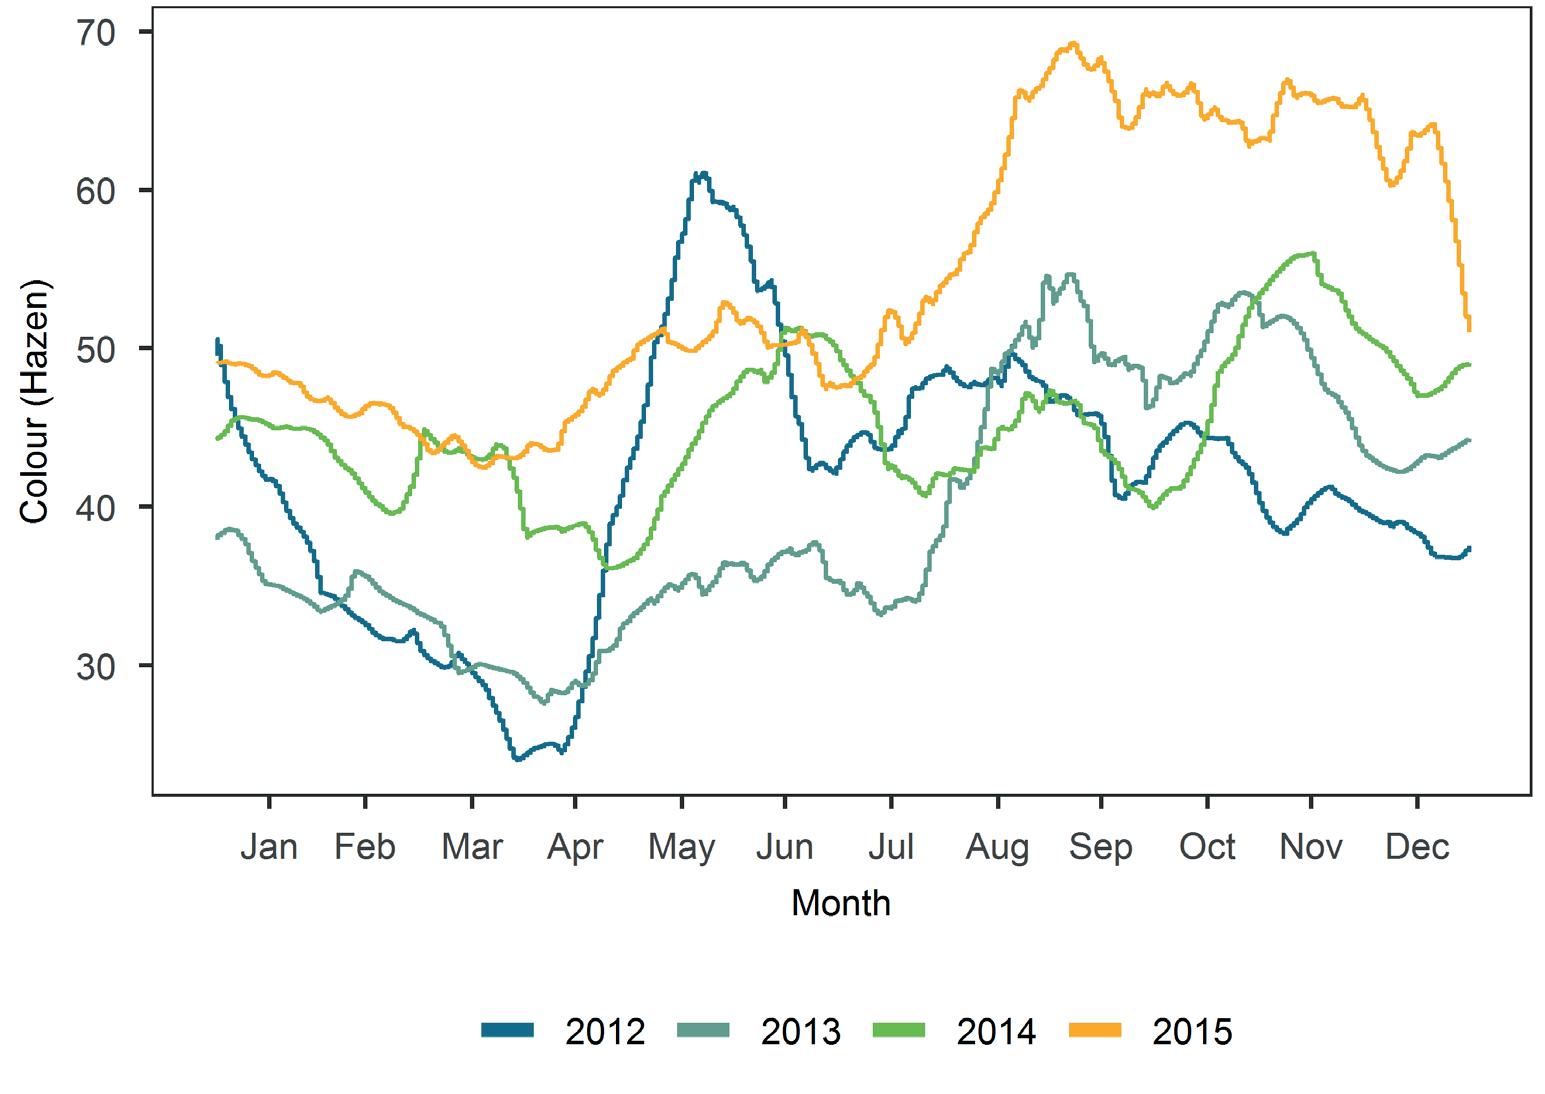
Using the continuous data collected by SWW at the WTW can give some information on the seasonal variation and inter-annual variability. In particular, daily colour variations plotted throughout the year for 2012 to 2015 (Figure 7) show an interesting pattern: the general occurrence of two peaks of colour a year, the first one in late spring / early summer (e.g. May – June), and the second one, sometimes more sustained, in late summer (i.e. starting in August – September). There are marked inter-annual differences highlighting the importance of climatic and general environmental factors on water quality, and on colour especially. For instance, 2012 is now considered one of the wettest on record. The impact of such unusual conditions, marked by high rainfall from April to June can be seen by a peak in colour at ca. 60 Hazen. This is due to high rainfall washing contaminants from farmland down the catchment and into the reservoir.
Figure7 Daily colour variations
throughout the year between 2012 and 2015 at Upper Tamar Lake raw water.
Upper Tamar Lake; photo by Emilie Grand-Clement.