28 minute read
WATER QUALITY MODELLING


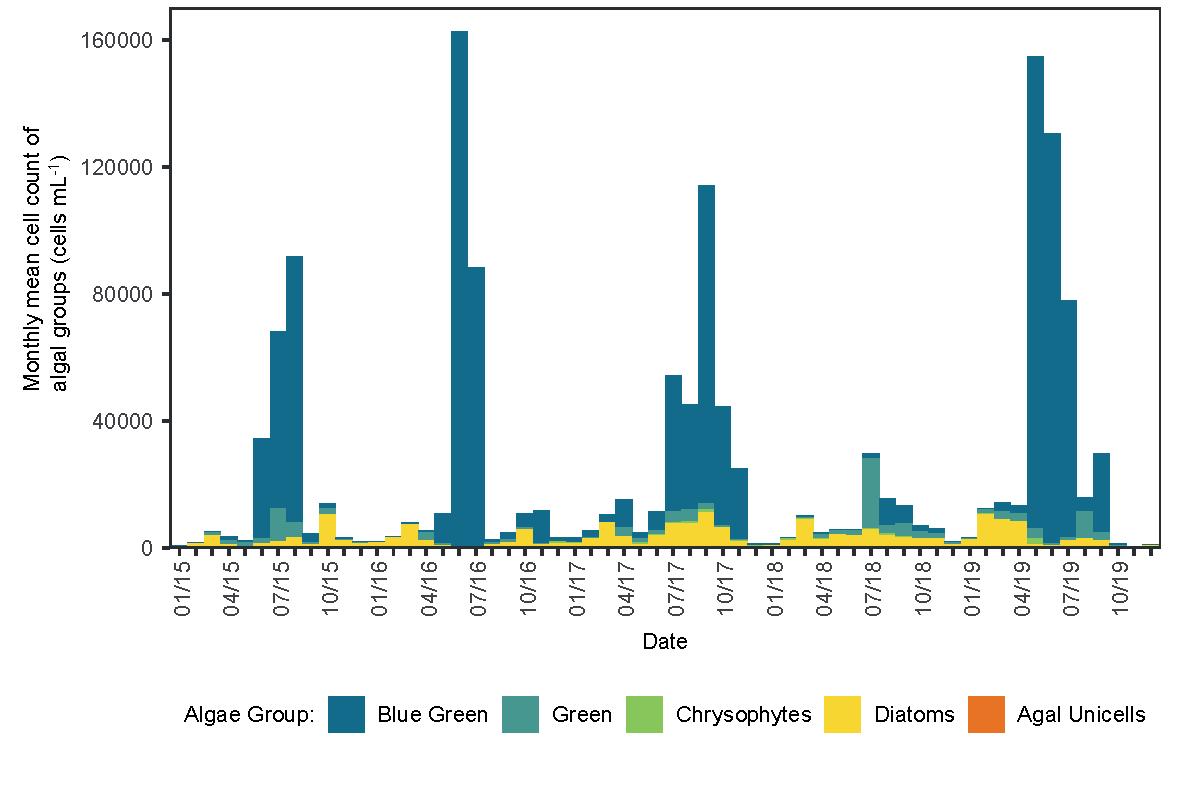
Figure 8 Monthly averages of total algal blooms cell count (cells
mL-1) and corresponding abundance of species between 2014 and 2019 at Tamar Lake.
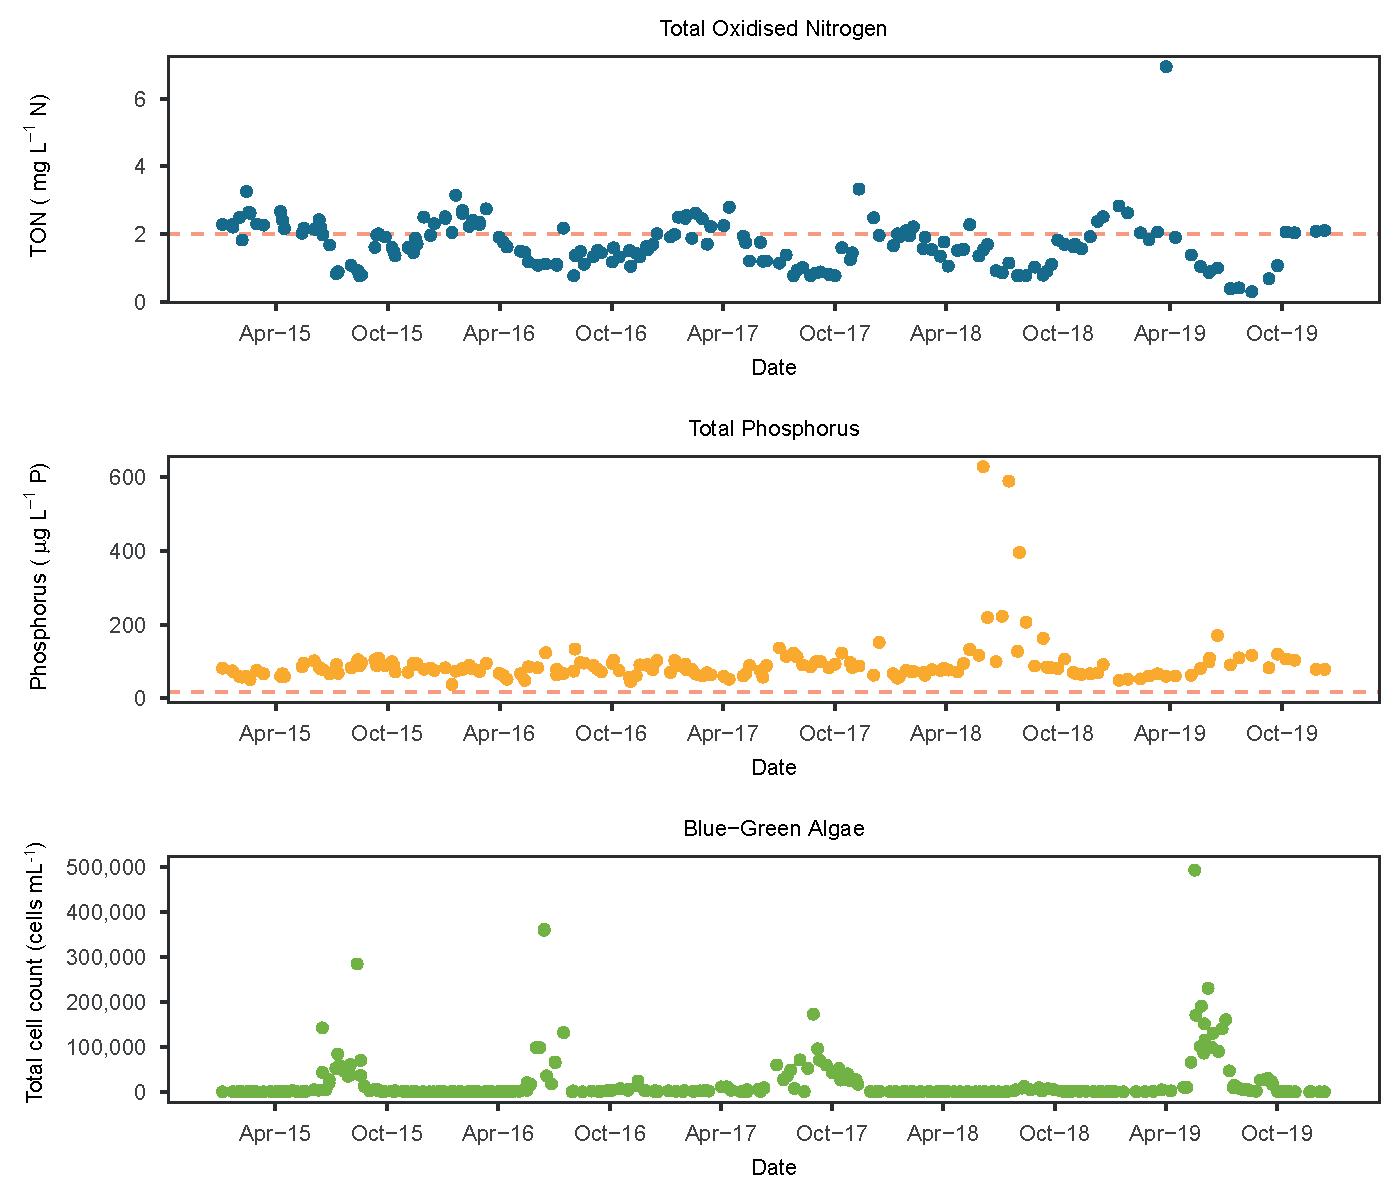
Figure 9 Total Oxidised Nitrogen (top), Total Phosphorus
(middle) and blue-green algae cell count (bottom) between 2014 and 2019 in Tamar Lake reservoir; red lines indicate the exceedance limit for each nutrient concentrations.
Blue-green algae content in the reservoir
The monthly mean algal counts (Figure 8) as well as measured values across the timeseries (Figure 9) show the occurrence of several algal blooms at Upper Tamar Lake occurring generally in the summer (i.e. June-July). Although a number of outliers were recorded in the dataset (e.g. 300,000 to 500,000 cells mL-1), the peaks in concentrations during blooms tend to be lower, generally reaching up to 200,000 cells mL-1 . In later years, algal blooms were also observed to extend into the autumn (i.e. 2017, 2018 and 2019). These blooms are overwhelmingly composed of the toxic blue-green algae species (Figure 9), although diatoms can make a significant part of the total group and are consistently present.
The occurrence of these blooms are often linked to certain environmental characteristics driving algal growth, such as higher temperatures or dry conditions. However, they do not match seasonal peaks in nutrients (Figure 9), as was observed in other locations (see Figure 7 p40): peaks in Total Oxidised Nitrogen (TON) occur in winter, and the seasonal trend in Total Phosphorus (TP) is not clear. It is therefore likely that seasonal variations in algal blooms are largely driven by climate, and the generally high content of nutrient already present in the reservoir. This is a long-term problem that needs to be investigated further by looking at both the nutrient inputs and the overall content already present in the reservoir.
Pesticide detections within the catchment
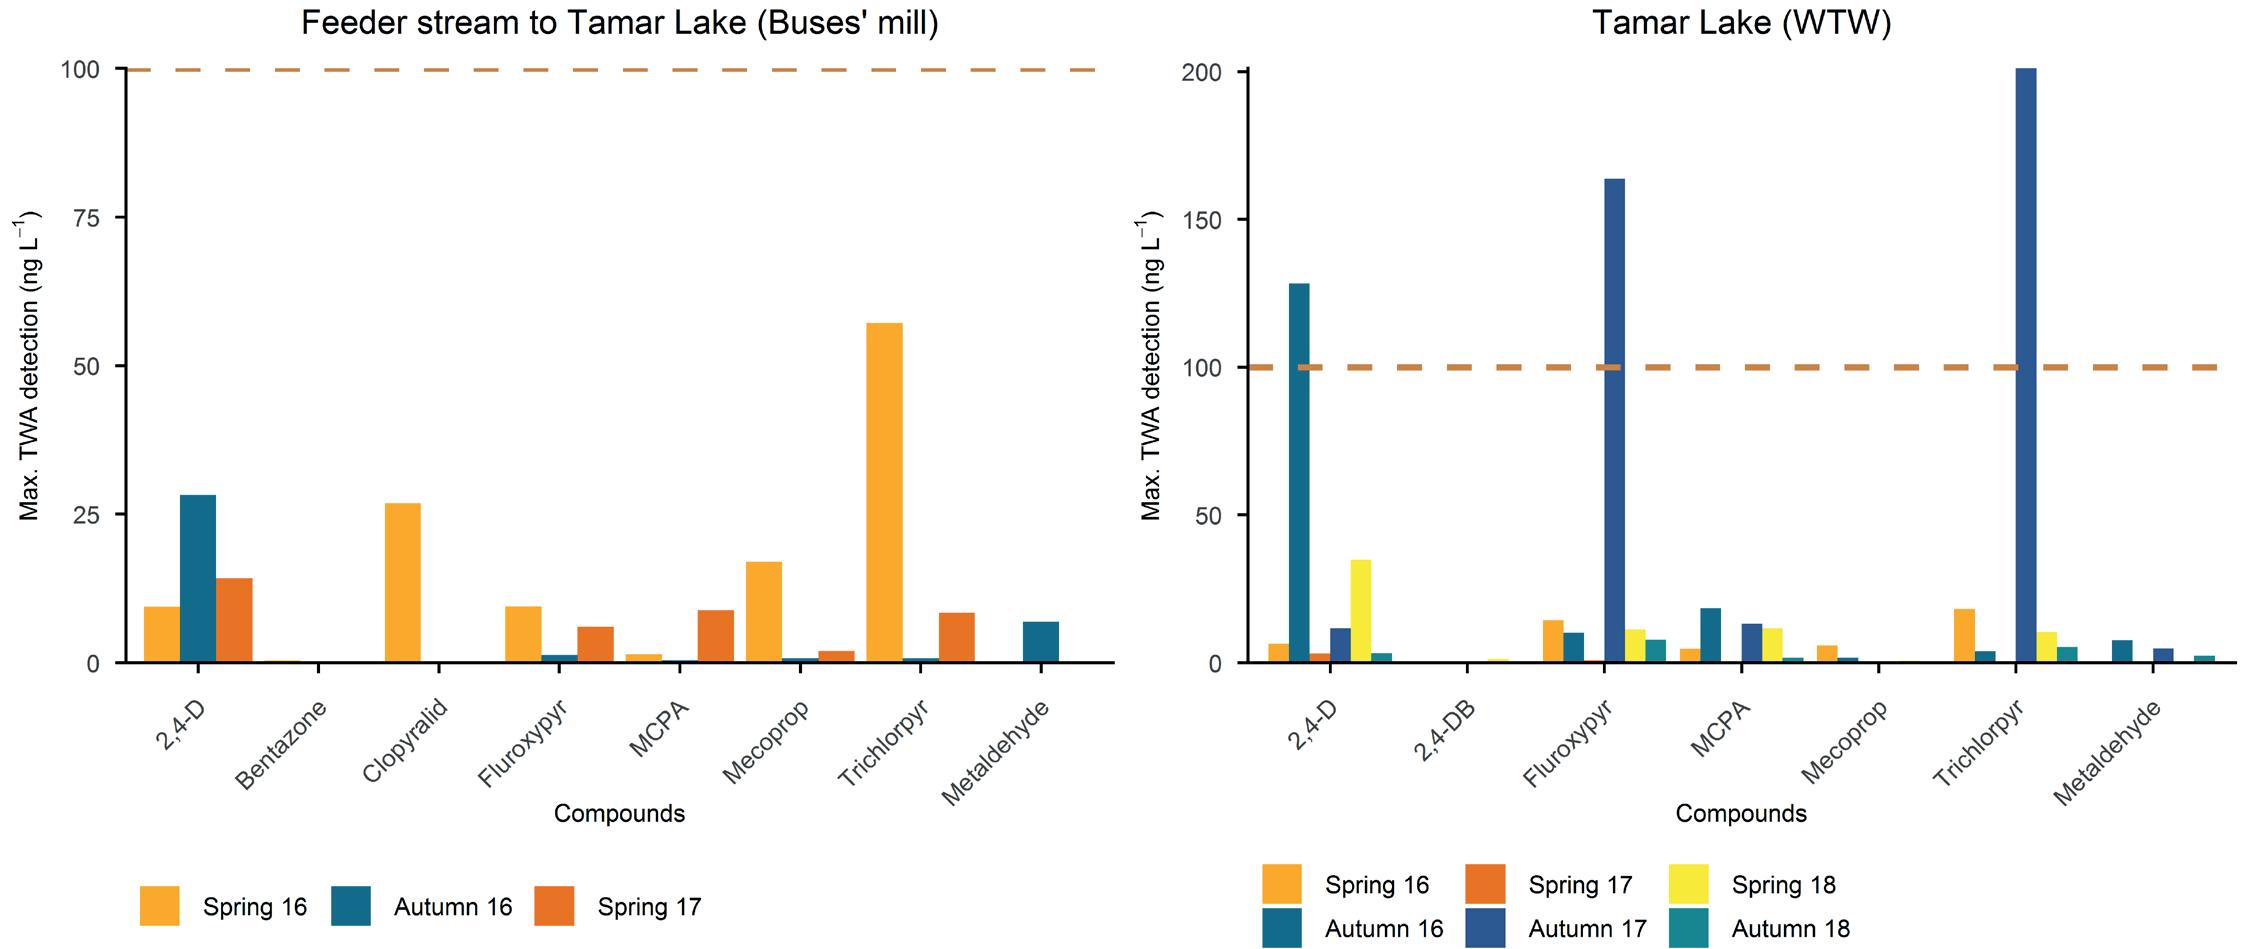
Pesticide detections in both feeder stream and reservoir show a high number of compounds being used consistently on intensive farmland in the catchment, with 2,4D, Fluroxypyr and Trichlopyr being detected above the 100 ng L-1 in the lake in autumn deployment (Figure 10). MCPA and Mecoprop are also an issue, but to a lesser extent. The autumns of 2016 and 2017 seem to be the most affected times. Overall, the total number of detections (including all chemicals throughout the 6 week period) ranges between 6 and 18 per deployment period. Although there is no obvious decrease during Upstream Thinking, this data helps project partners to understand pesticide sources (i.e. arable farmland), pattern and address its future use in the catchment.
Figure 10 Maximum
concentrations (measured as time weighted average) and compounds detected in feeder stream (left) and in Upper Tamar Lake (right) per deployment period, with the red dotted line indicating the 100 ng L-1 regulatory limit per pesticide; note the difference in the scales between the plots.
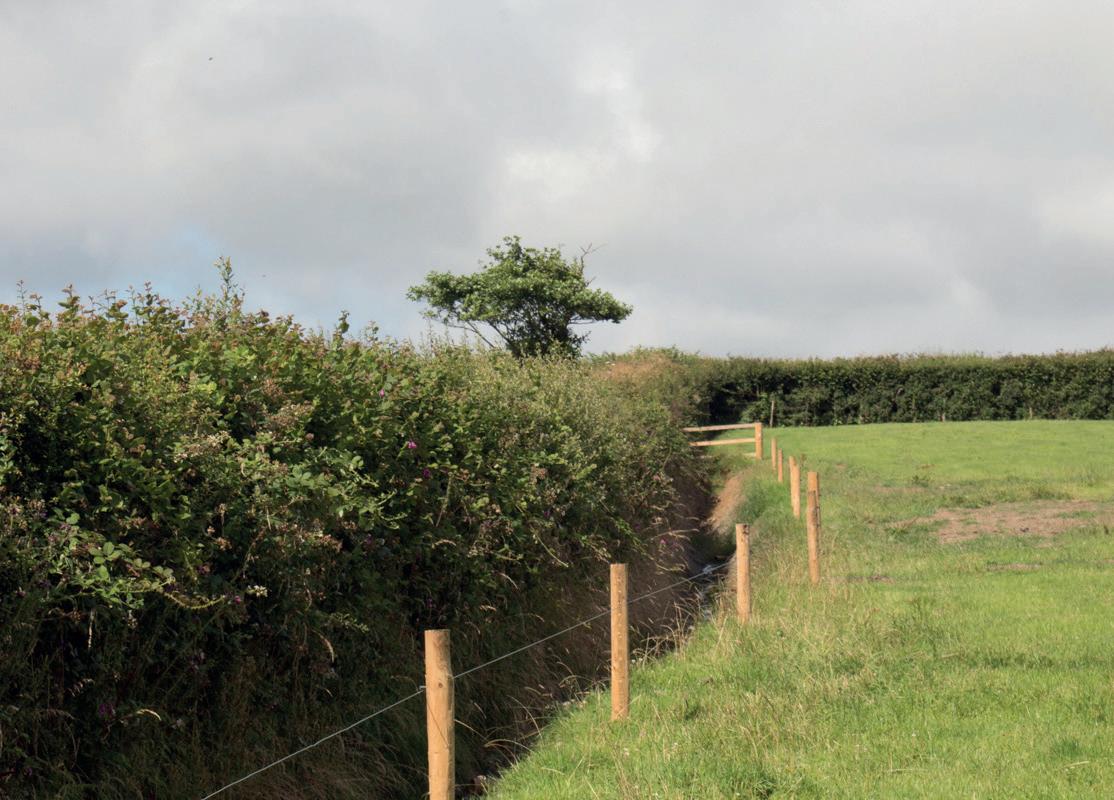
Fencing off ditches at Upper Tamar Lake; photo by Emilie GrandClement.
REFERENCES
1. Bieroza, M.Z., and Heathwaite, A.L. (2015). Seasonal variation in phosphorus concentration–discharge hysteresis inferred from high-frequency in-situ monitoring. Journal of Hydrology, 524, 333-347.
About the catchment
Background site information
The River Cober catchment (Figure 1 and Figure 2) lies within the Cober and Lizard EA Operational catchment which falls within the wider Cornwall West and Fal EA Management Catchment. It drains a 53.75 km2 area of West Cornwall. The River Cober (Upper and Lower) itself rises at Nine Maidens Down, winding across Porkellis Moor and passing alongside Helston to reach Cornwall’s largest natural lake, the Loe Pool. Agricultural activity within the catchment is centred around intensive dairy farming, with rough grazing taking place on marginal land. Interventions in the catchments were led by Cornwall Wildlife Trust (CWT).
Catchment Challenges
The River Cober was identified as at-risk for pesticides and ammonium. Ammonium has been problematic in the past and can have significant impacts on the water treatment and its cost. The primary source of this pollutant is manure and slurry from agriculture. Concentrations of ammonium can increase rapidly under spate or flood conditions when the sources of ammonium are directly connected to the surface streams and rivers. To deal with this issue, the water treatment works has auto-shutdown facilities in place, which prevent the works from abstracting and treating water when its quality deteriorates beyond certain thresholds. As the security of the water supply is compromised during these periods, it is important that they do not persist for too long.
Catchment Activities
Activities in the Cober catchment started in 2015, i.e. later than some other Upstream Thinking catchments. Ammonium can originate from diffuse and point source pollution and therefore a focus of CWT activity in the Cober catchment was to work with farmers to identify opportunities to improve dirty water management and prevent ammonium runoff. In addition, work was undertaken to improve land management to reduce erosion, buffer run-off and reduce nutrient inputs to the soil and streams.
§ The water quality issues in the Cober catchment have been identified as ammonium levels (over 2 mg L-1) and pesticides (MCPA and Mecoprop in particular); § Ammonium levels were elevated for ca. 1.88% of the time, but the threshold of 2 mg L-1 was exceeded in 0.85% of time, adding up to around 74 hours per year (on average across the study period); § Overall, a positive contribution of Upstream Thinking in the catchment is likely to have reduced the frequency of ammonium detections in the catchment since 2015, as seen in the continuous ammonia signal; § Use of the Chemcatcher passive sampling devices has shown high numbers of pesticide detections throughout the monitoring period; the regulatory limit of 100 ng L-1 per compound and per detection was exceeded on four occasions in the River Cober; § MCPA and Mecoprop remain present throughout the catchment; metaldehyde has not been detected in the Releath Stream.
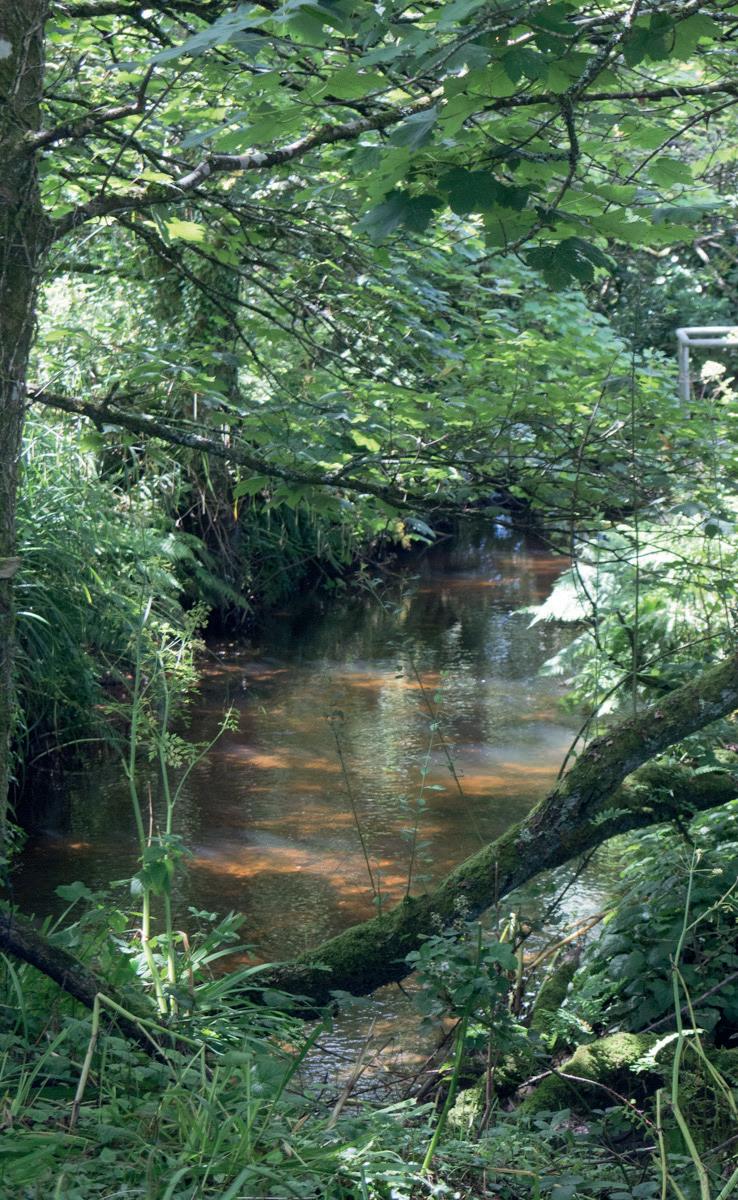
Figure1 The River
Cober; picture by Emilie GrandClement
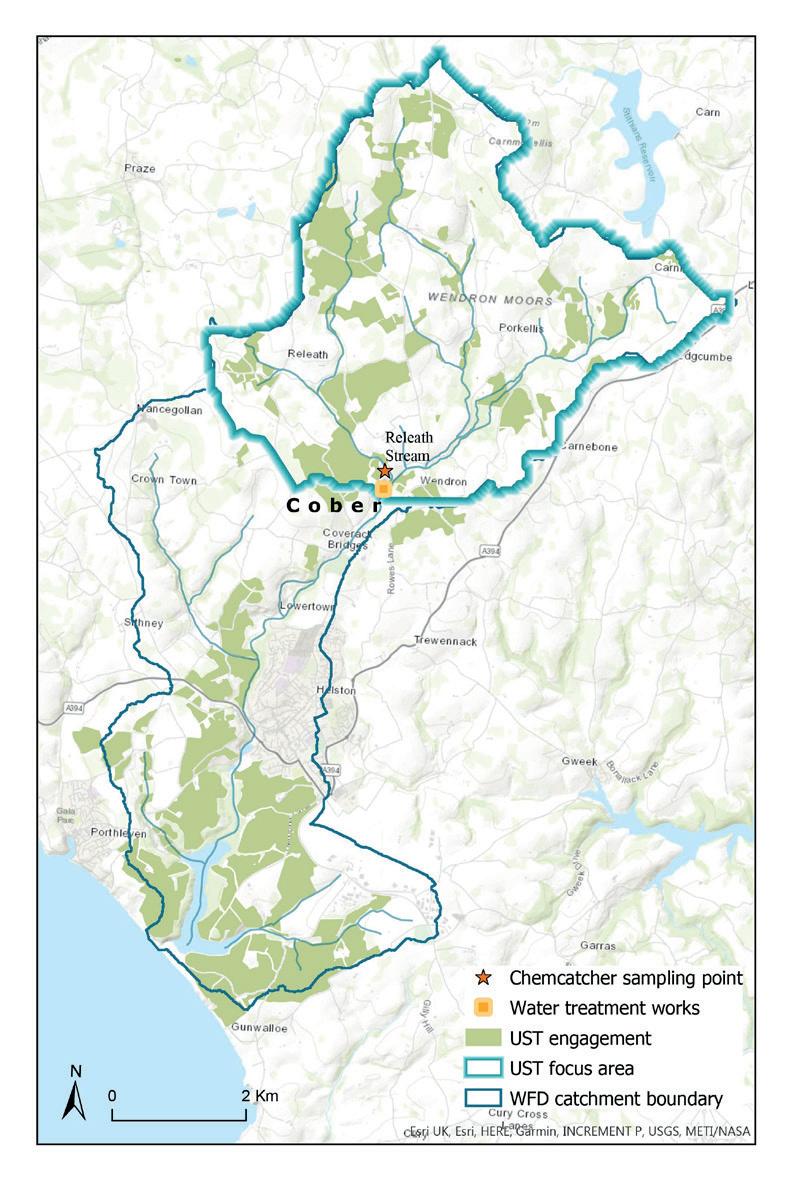
Figure 2 Map of engagement by the CWT as part
of UsT in the Cober catchment.
Figure 4 Timeseries for rainfall,
flow and ammonium samples and continuous measurements alongside a threshold (orange dotted line) of 0.2 mg L-1 .
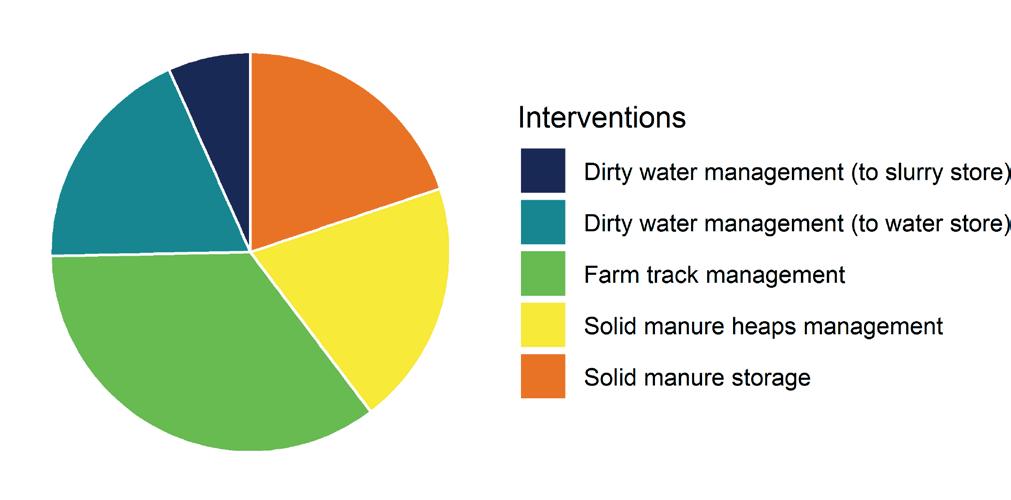
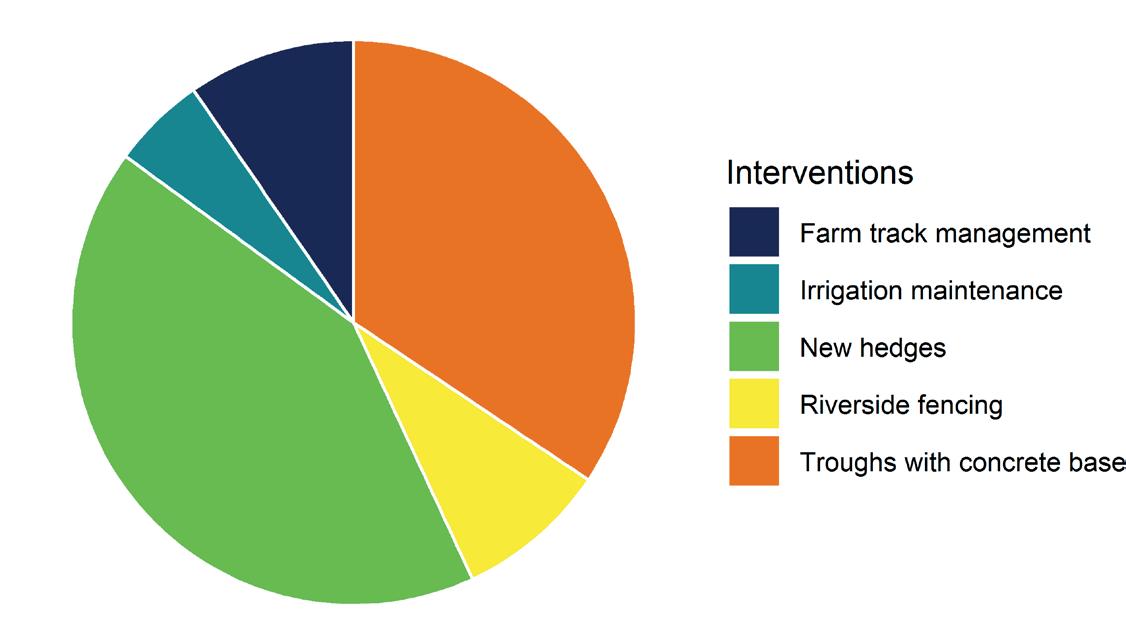
Figure 3 Top 5 interventions
(quantified in Farmscoper) used in the Cober catchment.
Figure 2 illustrates the level of farm engagement in UsT2 within the Cober catchment. Whilst the area of catchment engaged appears small (8% of the total UsT focus area), this is mainly because only a small number of farms could be targeted for very specific interventions following identification of key opportunities to reduce ammonium, based on farm type (dairy), proximity to watercourse and land slope. Physical interventions completed via UsT, which were quantifiable within the Farmscoper software, amounted to a cumulative total of 1,026 ha. The most commonly used interventions are shown in Figure 3. They are mostly aimed at targeting nutrients, although farm track management is also thought to have an impact on sediment losses to streams and rivers.
Water quality in the Cober catchment
Ammonium in river water
In the River Cober, the mean concentration of ammonium from samples analysed over the last 15 years is 0.23 mg L-1; in the Releath Stream the mean concentration is 0.094 mg L-1. For the period 2015 to 2018 this drops to 0.044 mg L-1 and 0.064 mg L-1 for the Cober and the Releath, respectively. Concentrations in the blended raw water at the SWW water treatment works were typically lower, with an average of 0.032 mg L-1 over the last 15 years, increasing to 0.047 mg L-1 more recently. The median values for sampling points are at or below the limits of detection, showing a positive contribution of Upstream Thinking in the catchment to reducing the frequency of ammonium detections in the catchment.
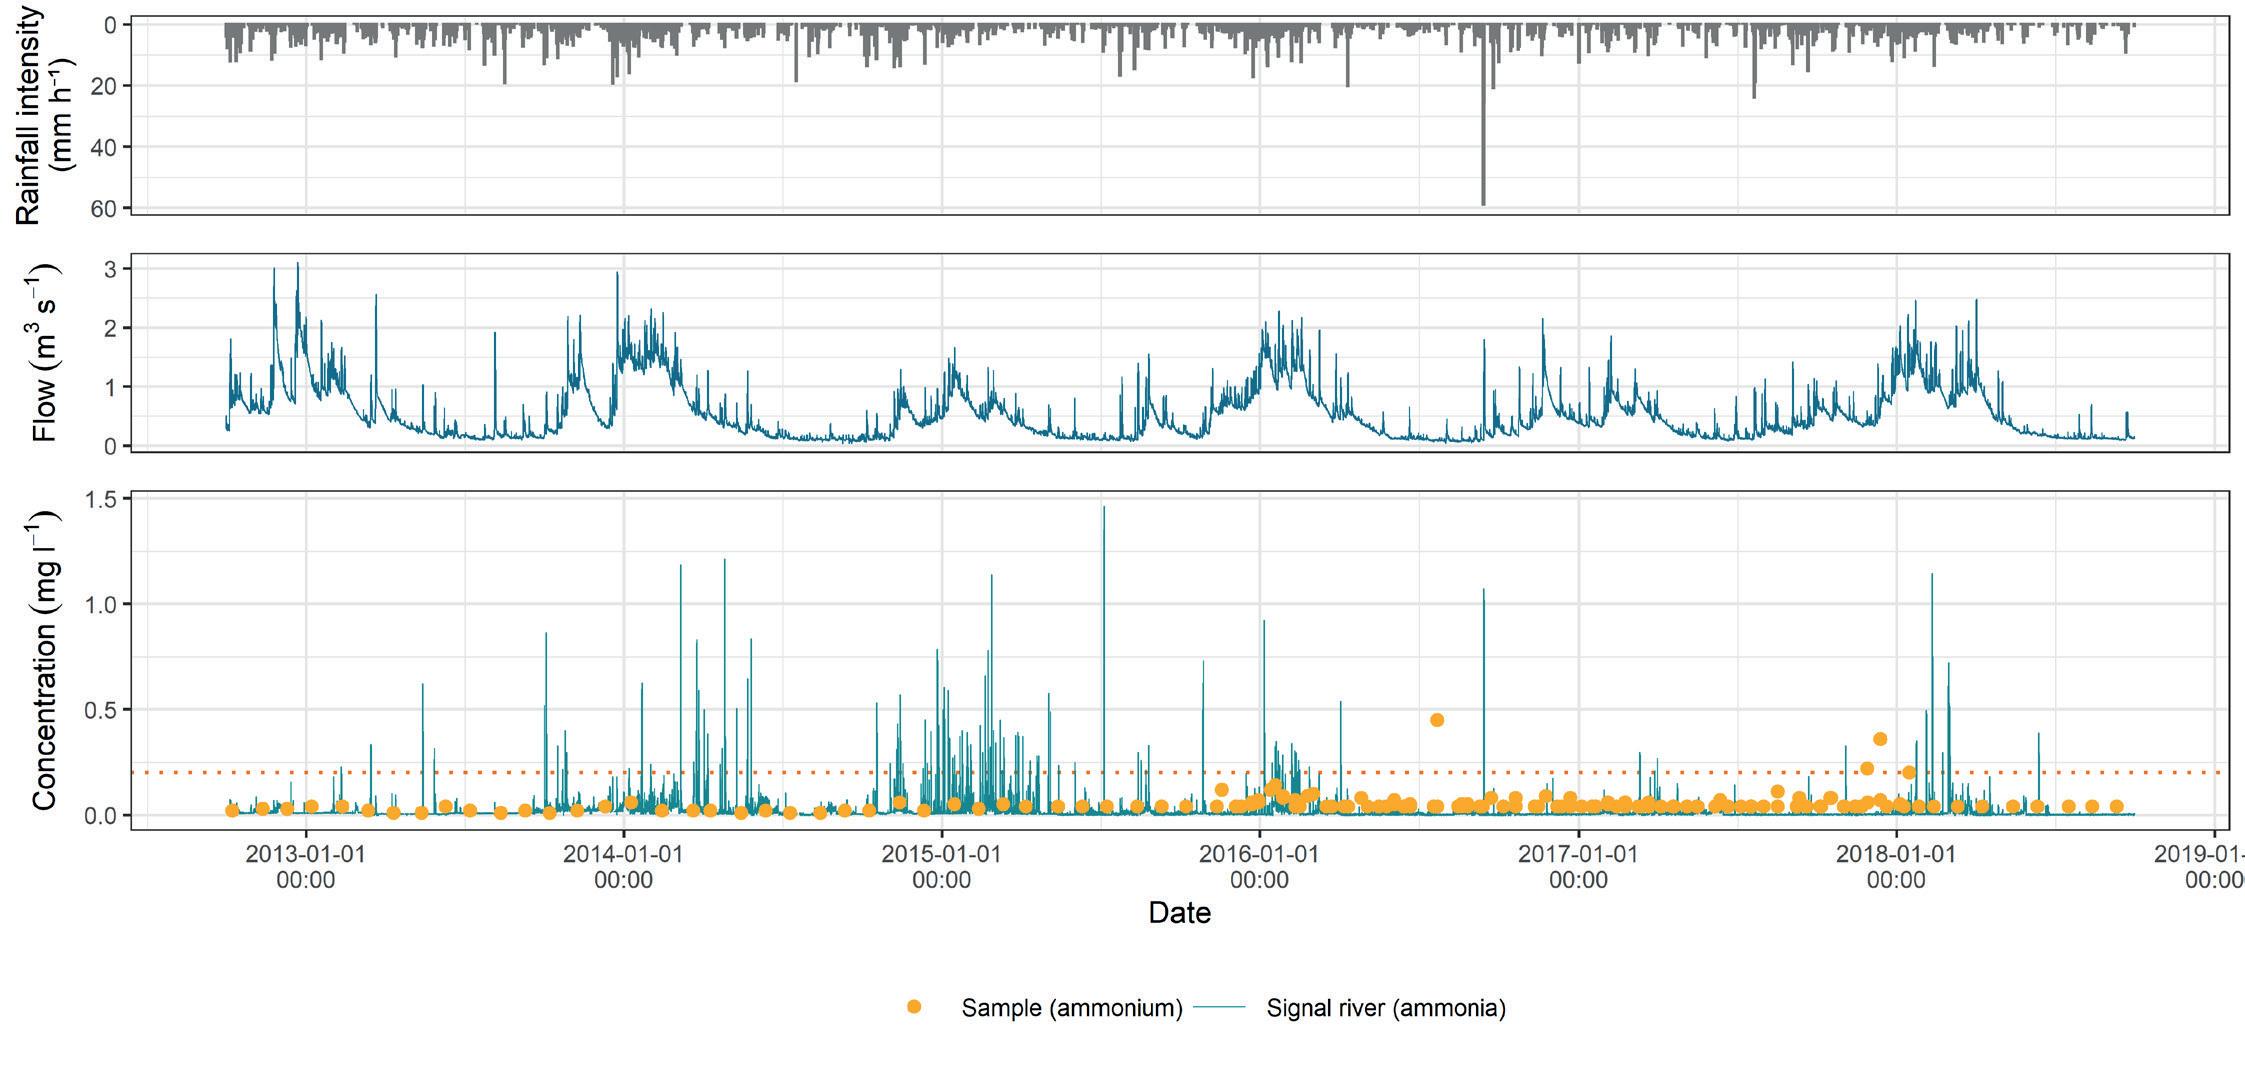
High-frequency signals from sensors in the river also play an important role in understanding the behaviour of ammonium. Figure 4 shows the seasonal patterns in flow, ammonium signal, and ammonium samples, with a threshold value of 0.2 mg L-1 displayed. Above this level, the works are temporarily shut down to protect the drinking water supply, as such levels are difficult to remove from drinking water. Values for ammonium are elevated over this threshold for a small proportion of the time (0.85%). Each year these exceedances occur on multiple occasions for short periods of time, adding up to around 74 hours per year (on average across the study period). The signal is elevated for a greater proportion of time (1.88%) over winter in January, February and March (Table 1) and more peaks are seen during these months. Sensor levels for ammonium are, in general, lowest in the summer (July, August and September).
Time threshold Time Period Hours exceeded Percentage of time Winter (OND) 10.6 hr 0.48% Winter (JFM) 41.3 hr 1.88% Summer (AMJ) 19.6 hr 0.89% Summer (JAS) 3.1 hr 0.14% Hydrological year 74.2 hr 0.85%
Table 1 Average time
per season where the signal exceeds the shutdown threshold of 0.2 mg L-1 .
Table 2 Total number of detections, exceedances
above 100 ng L-1, maximum concentrations detected and total number of compounds detected in the river Cober and the Releath stream between spring 2016 and autumn 2018. The blue shading indicates a severity scale separately applied to each parameter, from light blue (low) to dark blue (high).
Pesticide detection in the Cober catchment
Since 2016, the Cober catchment has experienced a high number of pesticide detections (i.e. between 3 and 16) in all streams monitored (Table 2). This number of detections appears to be slightly lower in the second half of the monitoring period (i.e. between Autumn 2017 and Autumn 2018), with the number of detections in Autumn 2017 being the lowest across all sites.
Total number of detections
Exceedances over 100 ng L-1
Max concentration of individual pesticide (ng L-1)
Total number of compounds
Spring 16 Autumn 16 Spring 17 Autumn 17 Spring 18
Autumn 18 R. Cober (Burras bridge) N/A N/A 15 5 8 11 R. Cober (Porkellis bridge) 15 11 16 3 10 9 SWW asset - R. Cober 14 12 15 5 12 14 SWW asset - Releath stream 15 13 14 10 9 8 R. Cober (Burras bridge) N/A N/A 1 0 1 0 R. Cober (Porkellis bridge) 0 1 0 0 0 0 SWW asset - R. Cober 0 1 0 0 0 0 SWW asset - Releath stream 0 0 0 0 0 0 R. Cober (Burras bridge) N/A N/A 132 1 197 3
R. Cober (Porkellis bridge) 92 153 29 1 57 2
SWW asset - R. Cober 40 110 4 11 9 2
SWW asset - Releath stream 7 31 27 13 29 3
R. Cober (Burras bridge) N/A N/A 7 3 4 5 R. Cober (Porkellis bridge) 5 5 6 2 5 5 SWW asset - R. Cober 5 5 6 3 5 6 SWW asset - Releath stream 5 6 6 5 4 5 Similarly, the catchment is experiencing very high single contaminant detections, with values going beyond the regulatory limit of 100 ng L-1 on four occasions in the River Cober (e.g. between 110 and 197 ng L-1), one of which was at SWW’s water treatment works. Although the Releath Stream has a high number of detections, they never exceed 31 ng L-1 .
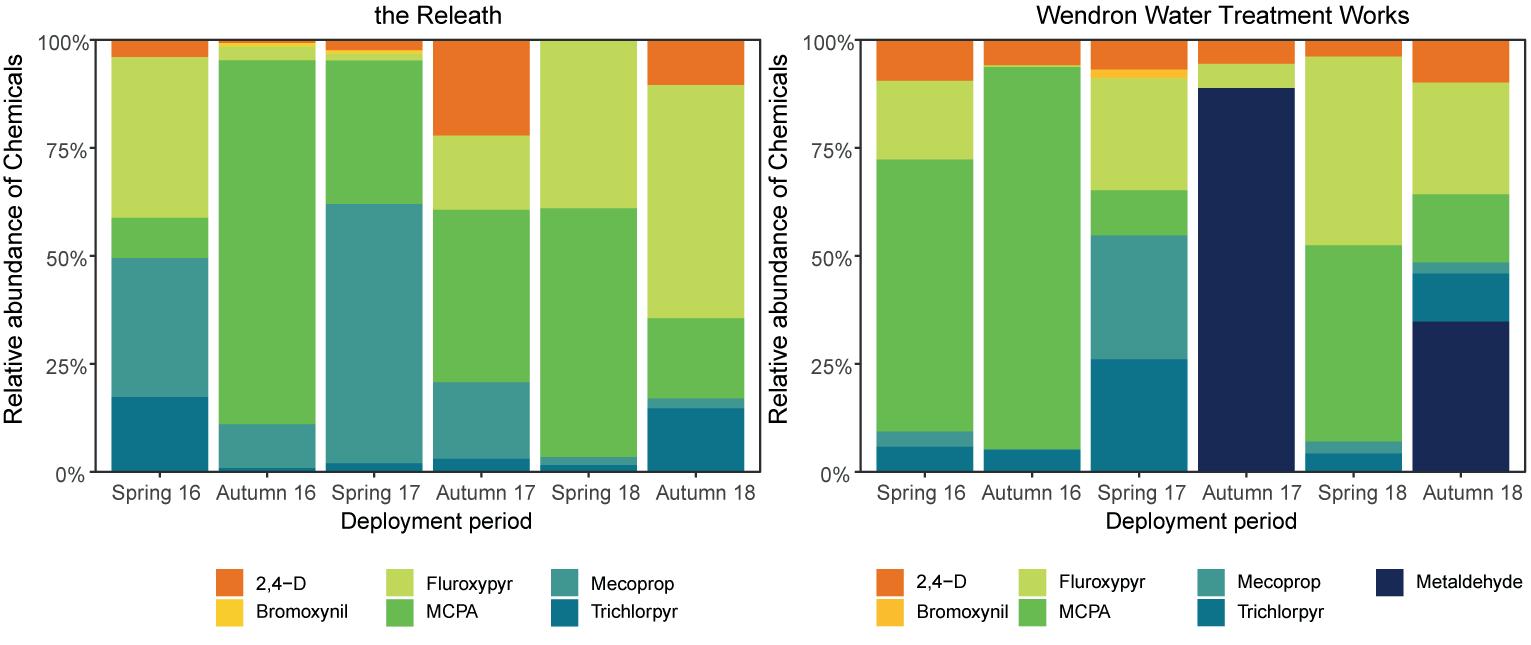
Between two and seven different chemicals were found at each location. Figure 5 shows a comparison between the Releath Stream and the River Cober. The same chemicals are found in both streams, highlighting their usage throughout the catchment. MCPA and Fluroxypyr in particular are found in very high concentrations; the usage of Mecoprop is also consistent across sites and deployment periods but at lower concentrations. All of these compounds can be used in grasslands, which represents one of the main land use types in the catchment. Metaldehyde (the active ingredient found in slug pellets) is the only compound that has been detected in the River Cober (Autumn 2017 and 2018), but never in the Releath. This compound is typically used on edible crops, and may therefore have been used on the 22% of the catchment in arable land. Overall, this data is invaluable information for the Cornwall Wildlife Trust to target pesticide usage in the catchment.
Figure 5 Relative abundance of compounds detected at
SWW water treatment works, with water originating from the Releath Stream (left) and the River Cober (right).
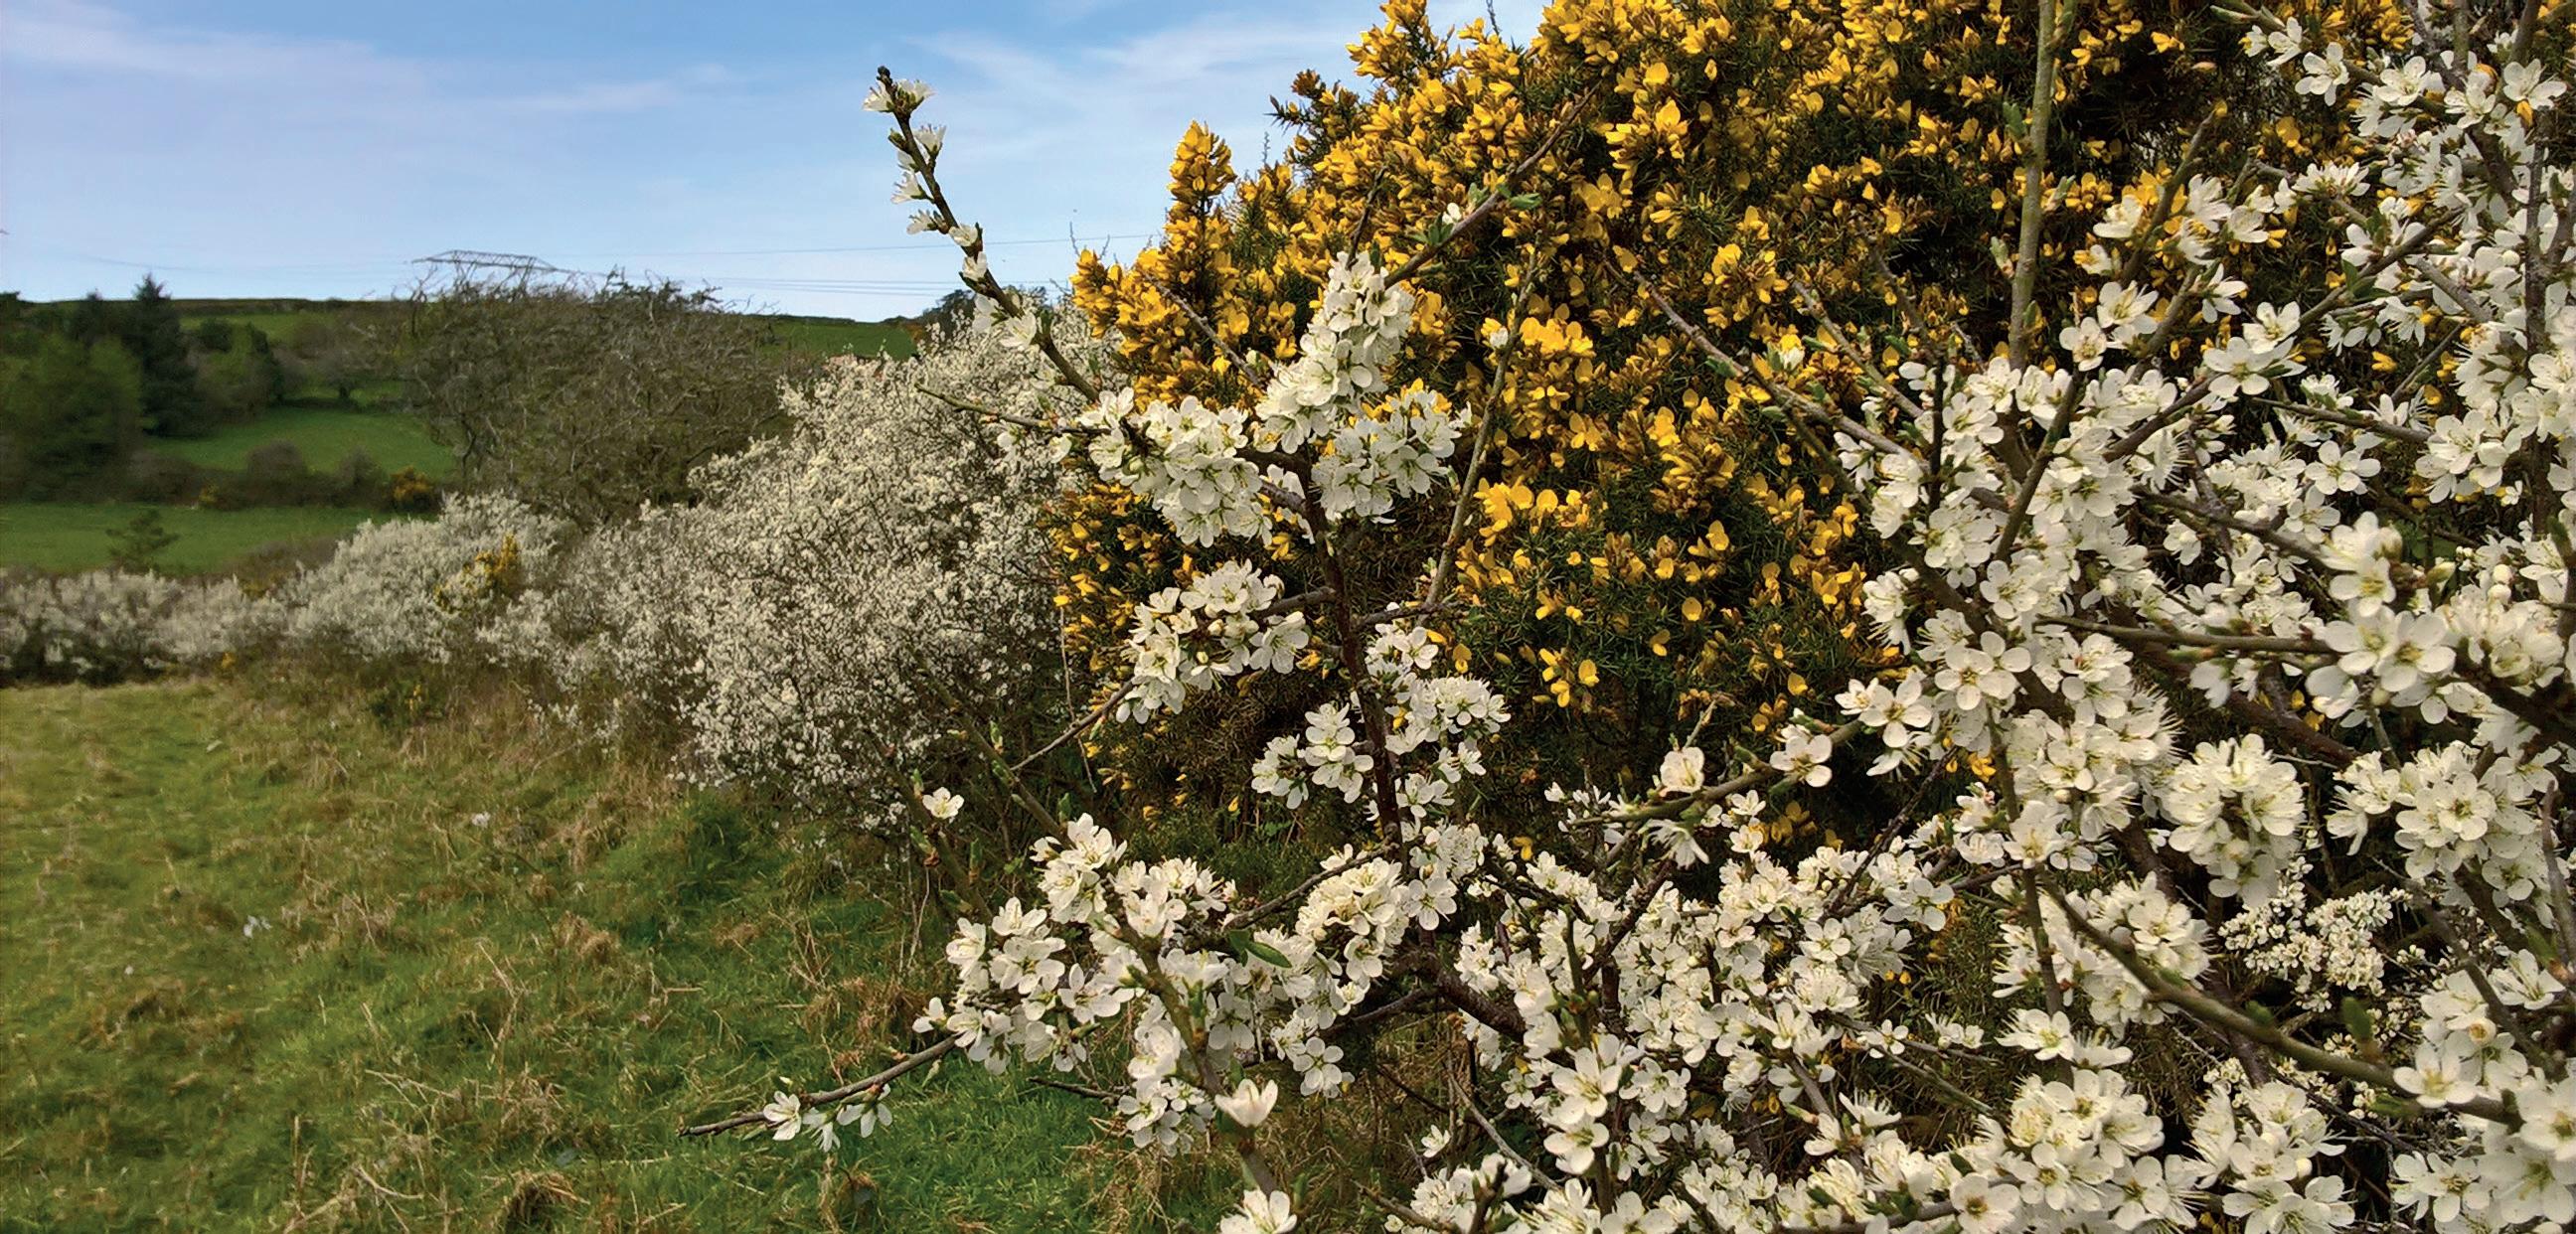
Spring hedge in Cornwall; photo by Sue Hocking (CWT).
About the catchment
Background site information
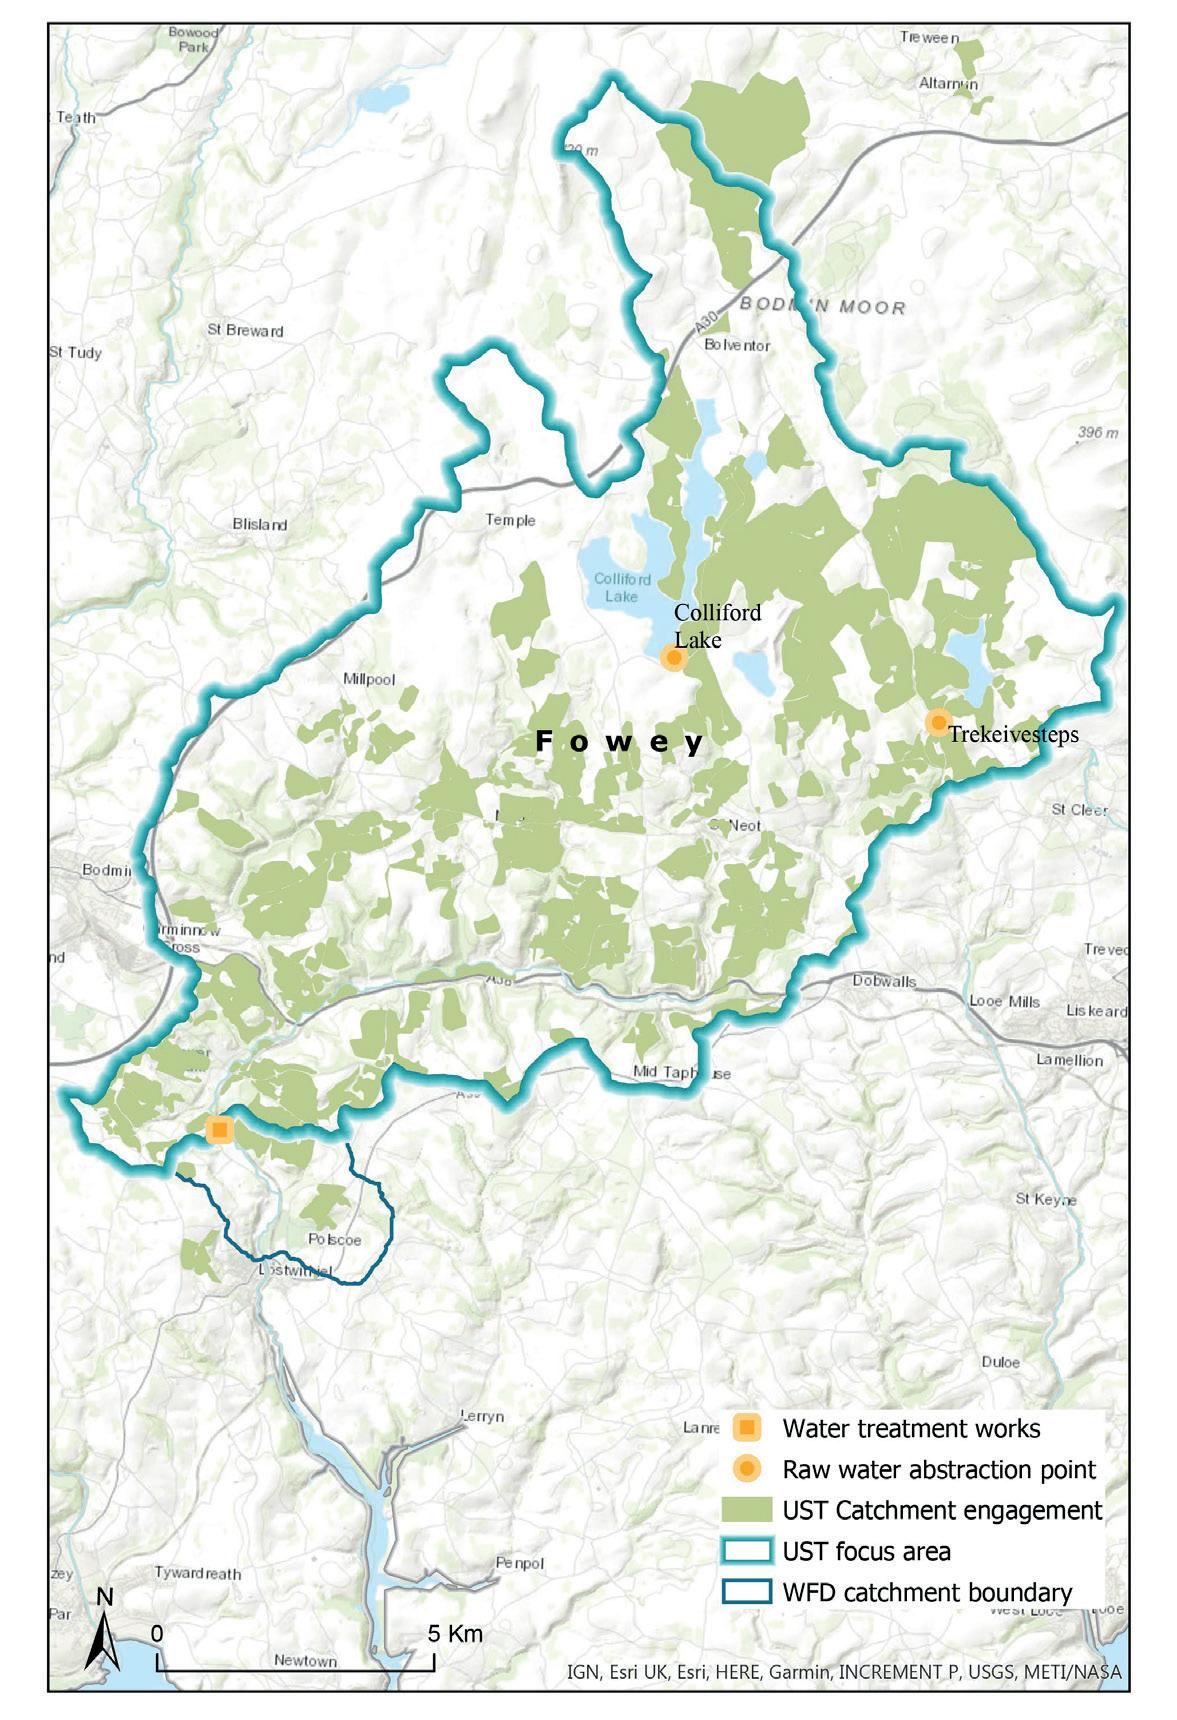
The Fowey catchment falls within the Colliford Strategic Supply Area, south-west of Bodmin Moor, in Cornwall (Figure 3). SWW abstracts water from the Lower River Fowey for potable supply, with water being fed directly to the water treatment works. Additionally, another abstraction is being used in the catchment (Figure 1). Catchment intervention measures are being delivered by West Country Rivers Trust. Catchment Challenges
The River Fowey is at risk for pesticides, in particular MCPA and Mecoprop, both used for broadleaf weeds control, and for metaldehyde, a common pesticide against slugs and snails.
Catchment Activities
§ The River Fowey is at risk for pesticides, namely MCPA, mecoprop and metaldehyde. § Water quality monitoring has also shown a slight decrease in turbidity throughout the 2012-2013 to 2017-2018 period, all flow conditions considered; at low flow the decrease is noticeable for both turbidity and colour, which may be attributable to UsT interventions. As such change is not yet visible at high flows, it is hoped that it will be noticeable after continued engagement and further interventions are implemented in the catchment. § Although a number of pesticides are detected along the River Fowey and at SWW assets, the he maximum concentration measured in river water (as time weighted average) are consistently below 100 ng L-1, and the total concentration of all pesticides is below 500 ng L-1, thereby fulfilling the Upstream Thinking objectives. § The frequency of pesticide detections in the raw water in the lower
River Fowey has not decreased significantly with time; however, the work carried out has highlighted the most problematic compounds that occur in the river water, enabling project partners to target their actions in the catchment.
Figure 1 Map of engagement
by WRT as part of UsT in the Fowey catchment.
Catchment activities delivered through Upstream Thinking 2 have mostly focused on capital grants, such as yard infrastructure to support livestock or dairy enterprises. There have also been pesticide amnesties and support for field trials of alternative methods. As of May 2019, 33% of the Fowey catchment has been engaged in Upstream Thinking 2 by Westcountry Rivers Trust (WRT) (Figure 1), with physical activities focussing on such things as fencing off rivers to prevent livestock access, minimising the volumes of dirty water produced and management of manure. These interventions are known to reduce nitrogen and phosphorus levels in water1 .
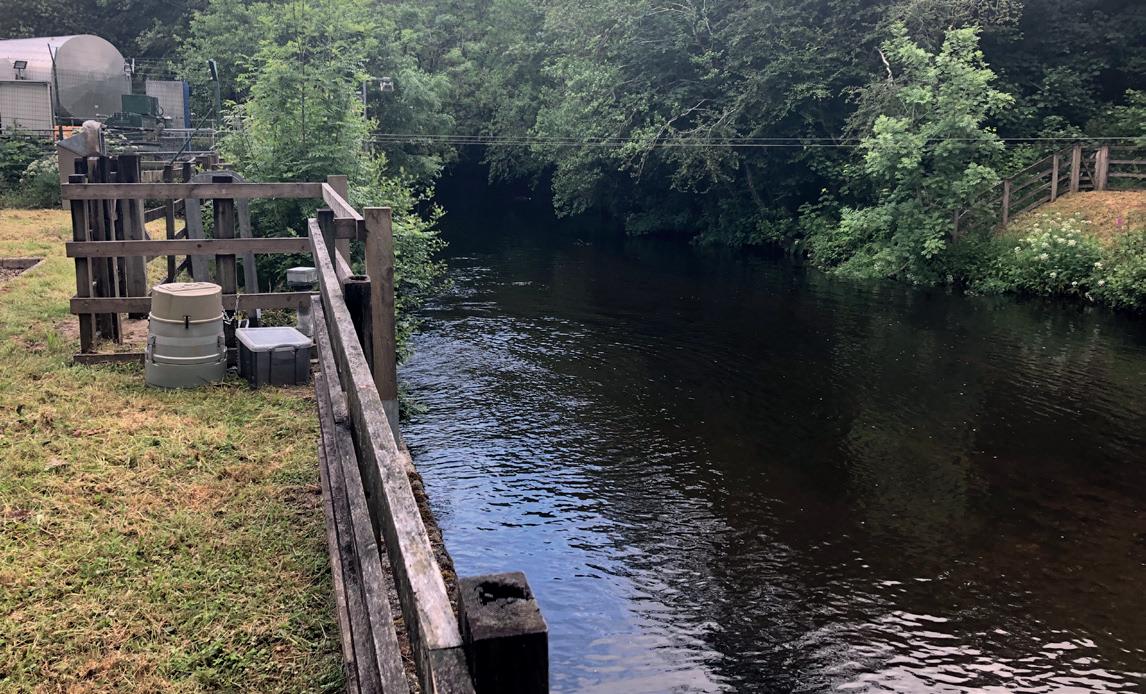
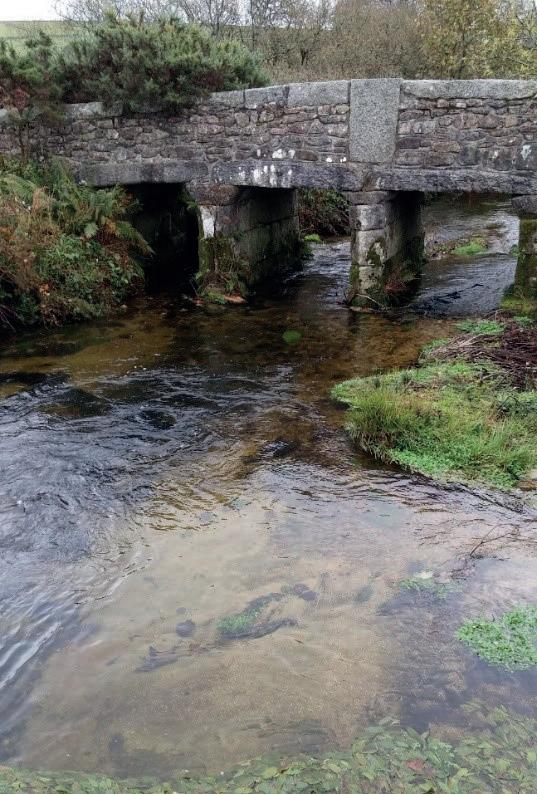
The River Fowey at SWW’s WTW; photo by Emilie Grand-Clement.
Water quality in the Fowey catchment
Long-term changes in water colour and suspended sediment pollution
When all flow is considered (Figure 2), continuous measurements at the water treatment works in the River Fowey show no significant decrease in colour between hydrological years. However, a slight decrease in turbidity (representing suspended sediment concentrations in water) is observed. More precisely, mean turbidity has been reduced from 7.5 NTU in 2012-2013 to 3.8 NTU in 2017-2018, although maximum values remain the same, with peaks reaching 150 NTU on occasion. Reduction of both colour and turbidity in water is important to reduce primary water treatment costs in drinking water. When only low flow is considered (Figure 3), both colour and turbidity show a significant decrease between 2012-2013 and 2017-2018: mean colour values change from 15 to 12.9 Hazen, whilst mean turbidity values decrease from 5.4 to 1.4 NTU over the same period. As low flow periods often coincide with high water demand, such results are encouraging, as cleaner water abstracted in the summer months may be less costly to treat. Amongst the interventions used in the catchment, only fencing off watercourses from livestock is likely to have an impact on sediment losses and turbidity, which might explain the small decrease, but also highlights the potential to address these problems more significantly if further measures are adopted across the catchment.
Figure 2 Variations in flow (top), colour (middle)
and turbidity (bottom) per hydrological year in the River Fowey between 2012-2013 and 20172018, all flow values considered.
Figure 3 Low flow (≤Q70) variations (top) and
corresponding values in colour (middle) and turbidity (bottom) per hydrological year in the river Fowey between 2012-2013 and 2017-2018. The red arrow shows the observed trend between 2012-2013 and 2017-2018.
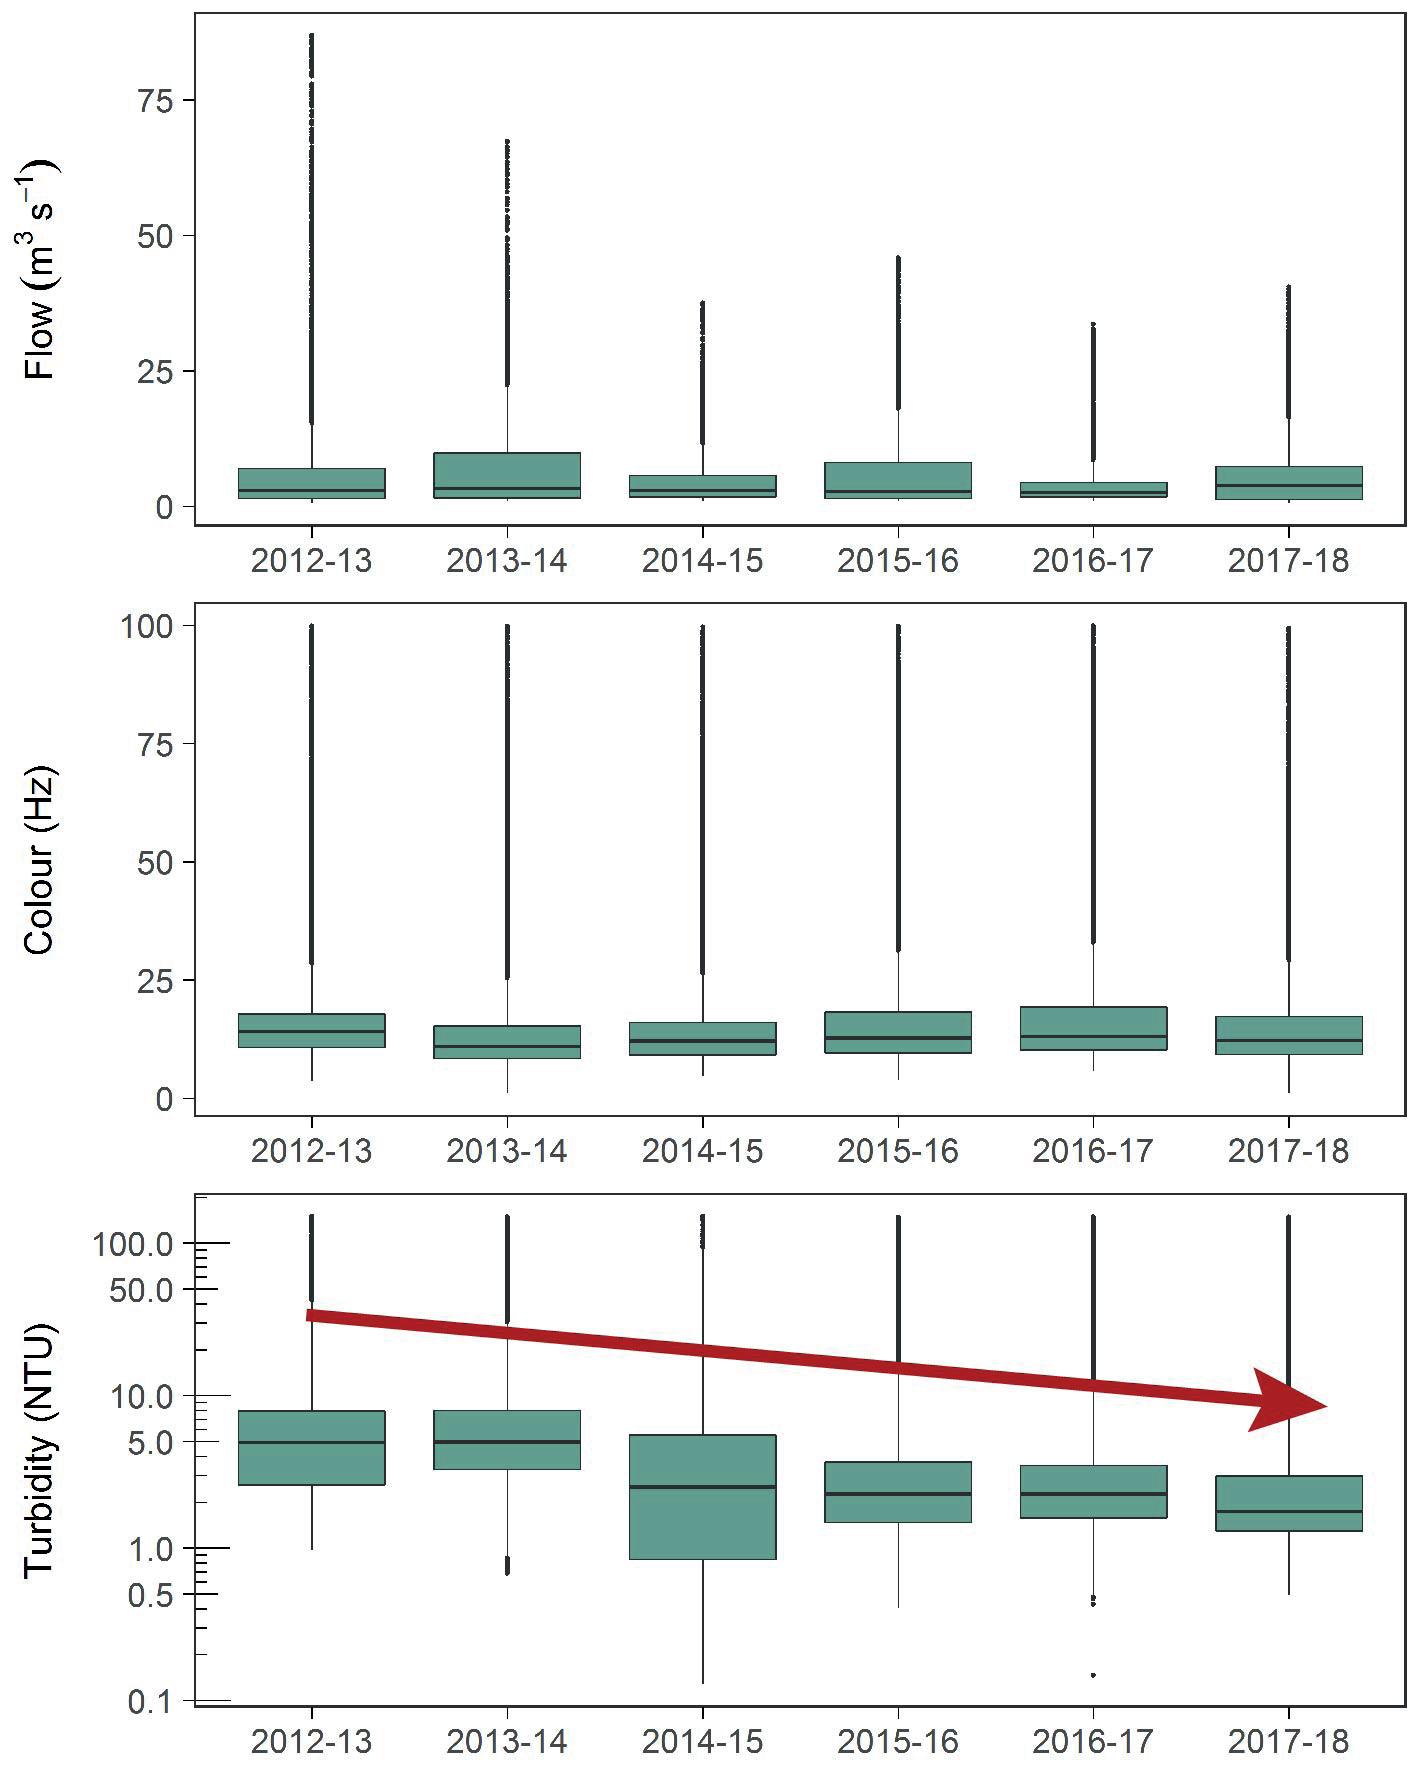
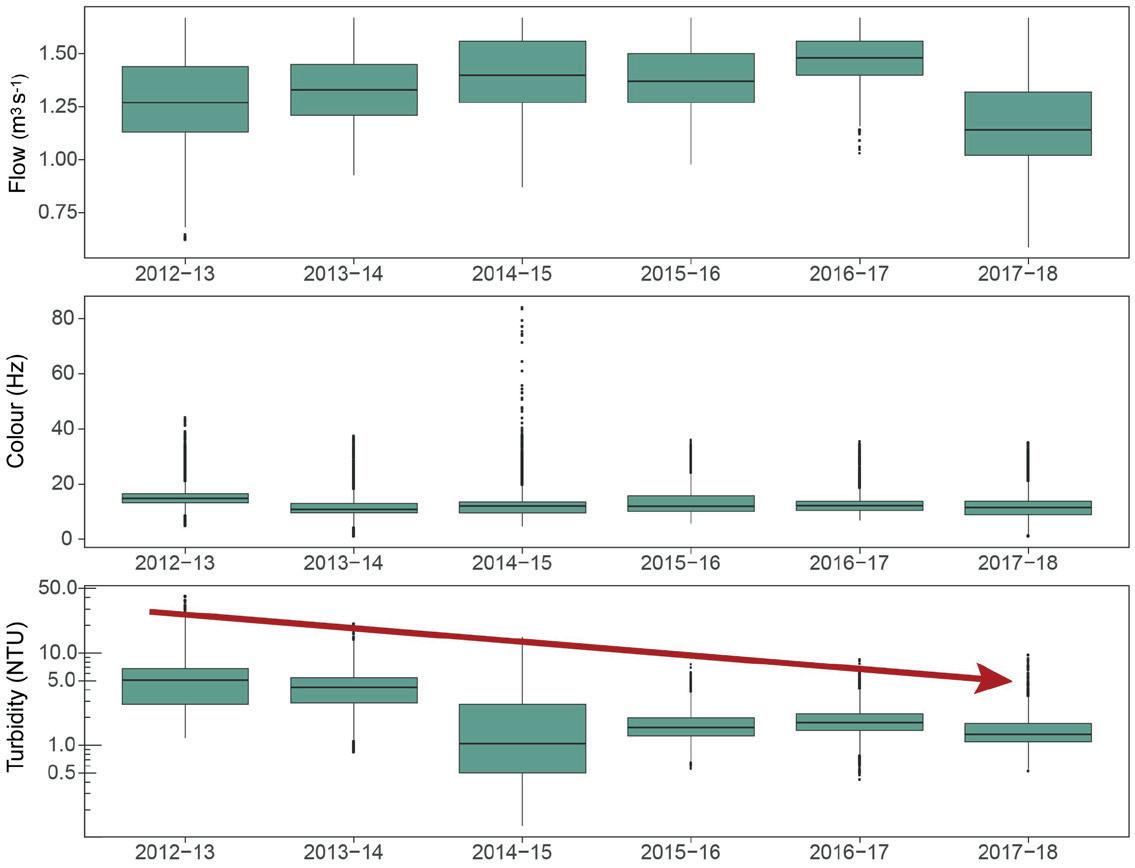
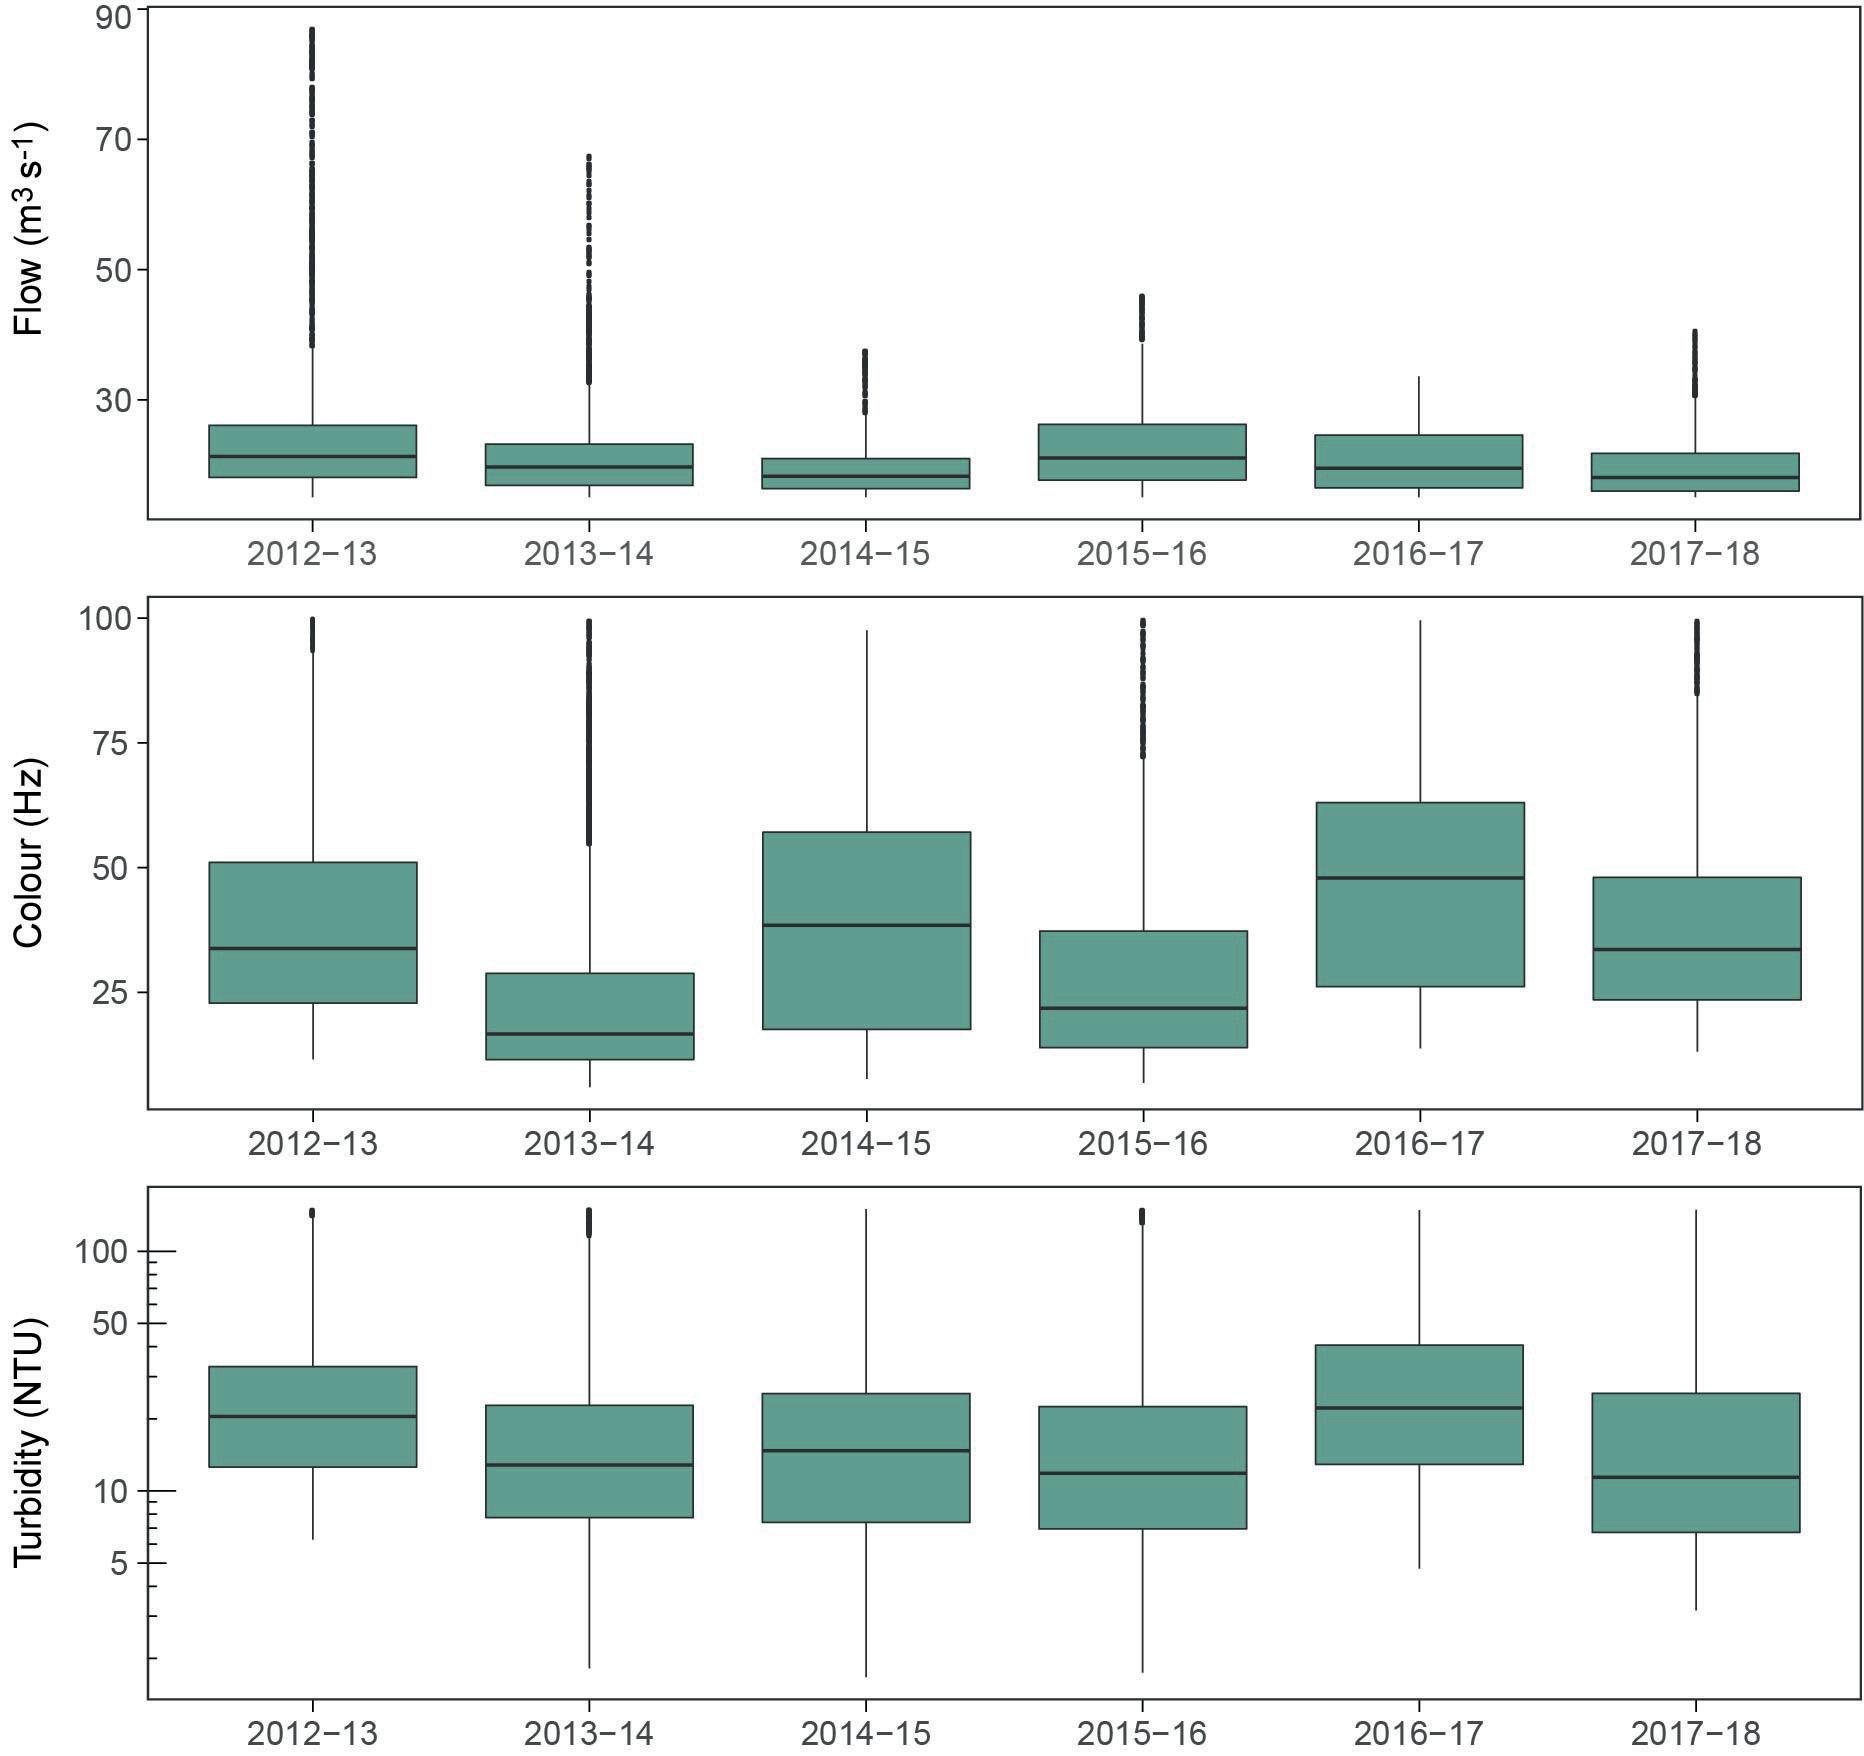
Figure 4 High flow (≥Q5) variations (top) and
corresponding values in colour (middle) and turbidity (bottom) per hydrological year in the River Fowey between 2012-2013 and 2017-2018.
In the Fowey catchment; photo by Hazel Kendall (WRT).
However, such change is not observed at high flow (Figure 4), with the difference between years likely due to inter-annual variability. Moreover, high flow conditions are likely to be the most problematic periods for WTWs due to higher diffuse pollution and contaminant concentrations delivered by rainfall events. This lack of change at high flow might indicate that a more extensive range of measures is needed to affect the catchment at large scale. Pesticide detections within the Fowey catchment

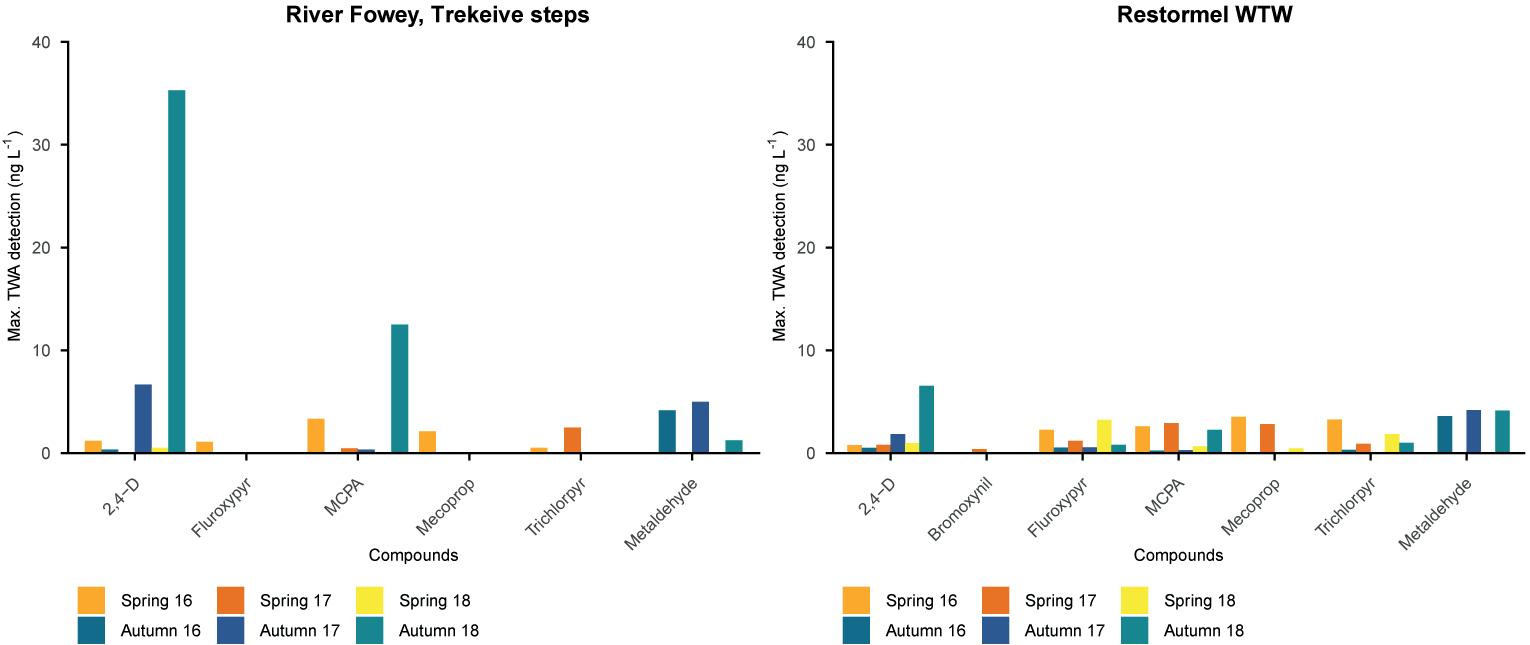
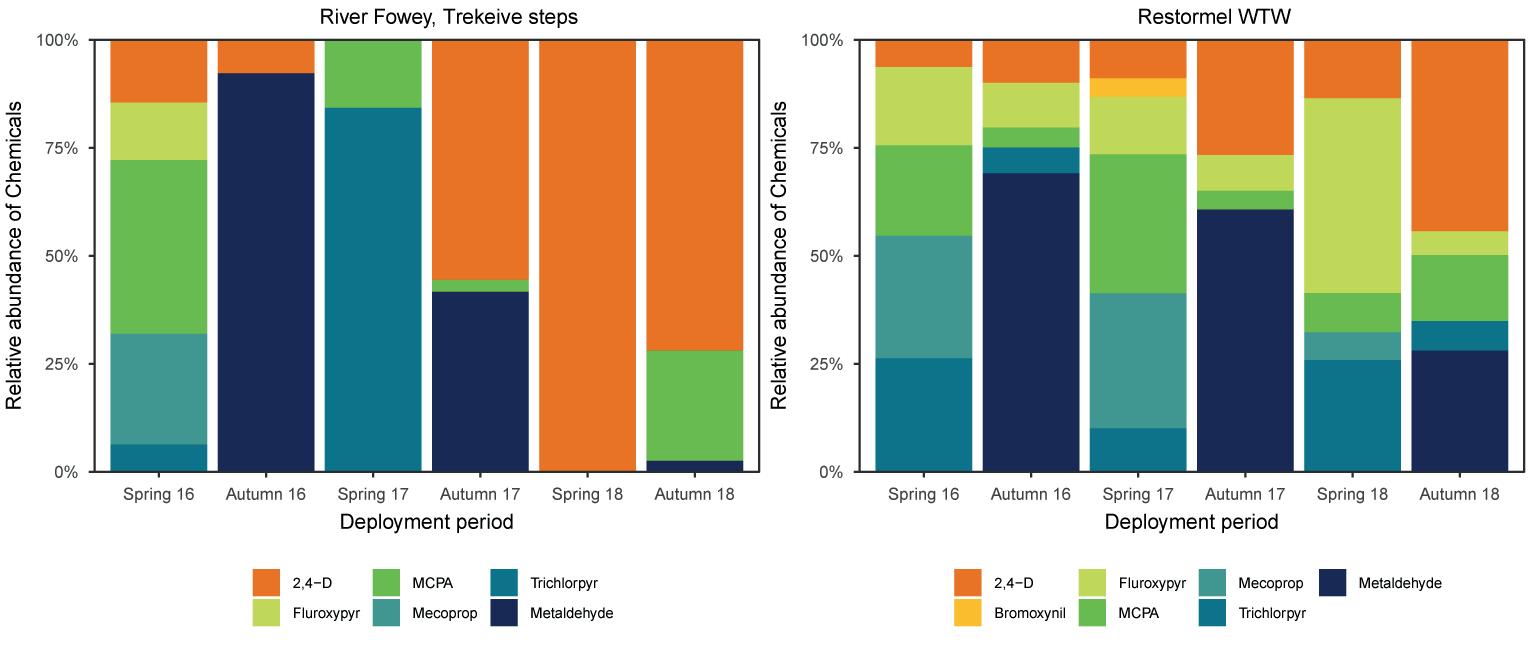
Detections in the Fowey catchment were generally low (Figure 5), with a maximum detection of 35 ng L-1 for 2,4-D at the Trekeive steps abstraction point (autumn 2018), and never reached either the 100 ng L-1 per compound or the cumulated concentration of 500 ng L-1 regulatory limits. Higher concentrations experienced upstream indicate a source of certain compounds higher in the catchment, and a dilution downstream closer to the WTW. There is, however, no significant change between seasons throughout the project. In fact, the highest detections occurred in autumn 2018, highlighting the need for continued catchment interventions and pesticide amnesties in the Fowey catchment. Most pesticides in the Fowey catchment are present consistently across most deployment periods and on both locations, such as for example 2,4-D or metaldehyde (in autumn deployments only) as shown on Figure 6. This is a useful assessment of the range of compounds to target in the catchment. For example, MCPA, which had been identified as a particularly problematic compound by the EA between 2009 and 2013, is still detected regularly at the water treatment works, but at low concentrations, whilst Mecoprop (identified as another problematic compound) is being detected during all spring deployments. Most of the pesticides detected at Restormel WTW are also found upstream at Trekeive steps, however their respective proportions vary between deployment periods. Only Bromoxynil is solely found at the WTW, albeit in low concentrations, indicating an intermediate source between Trekeive steps and Restormel WTW.
The Fowey catchment: a patchwork of woodland, intensive grassland and arable land use; photo by Emilie Grand-Clement.
REFERENCES
1. Cuttle, S.P., et al. (2016). A methodcentric ‘User Manual’ for the mitigation of diffuse water pollution from agriculture. Soil Use and Management, 32, 162-171.
§ The whole of the Exe catchment is at risk for pesticides (i.e. MCPA,
Mecoprop, Chlorotoluron, Triclopyr) § Turbidity in the River Exe is driven by rainfall events and increased river flow; high turbidity events occur more frequently in winter, reducing across the study period in line with the overall reductions in flow observed. § Although no pesticide detection reached the regulatory limit of 100 ng L-1 in treated water, the number of detections at both SWW drinking water treatment works was high; consistently high and numerous detections in the River Batherm, the River Burn and the River
Lowman make them hotspots for pesticides. § All compounds of concern for the EA are still detected in the catchment apart from Chlorotoluron, highlighting the need for continued work on the pesticide amnesty.
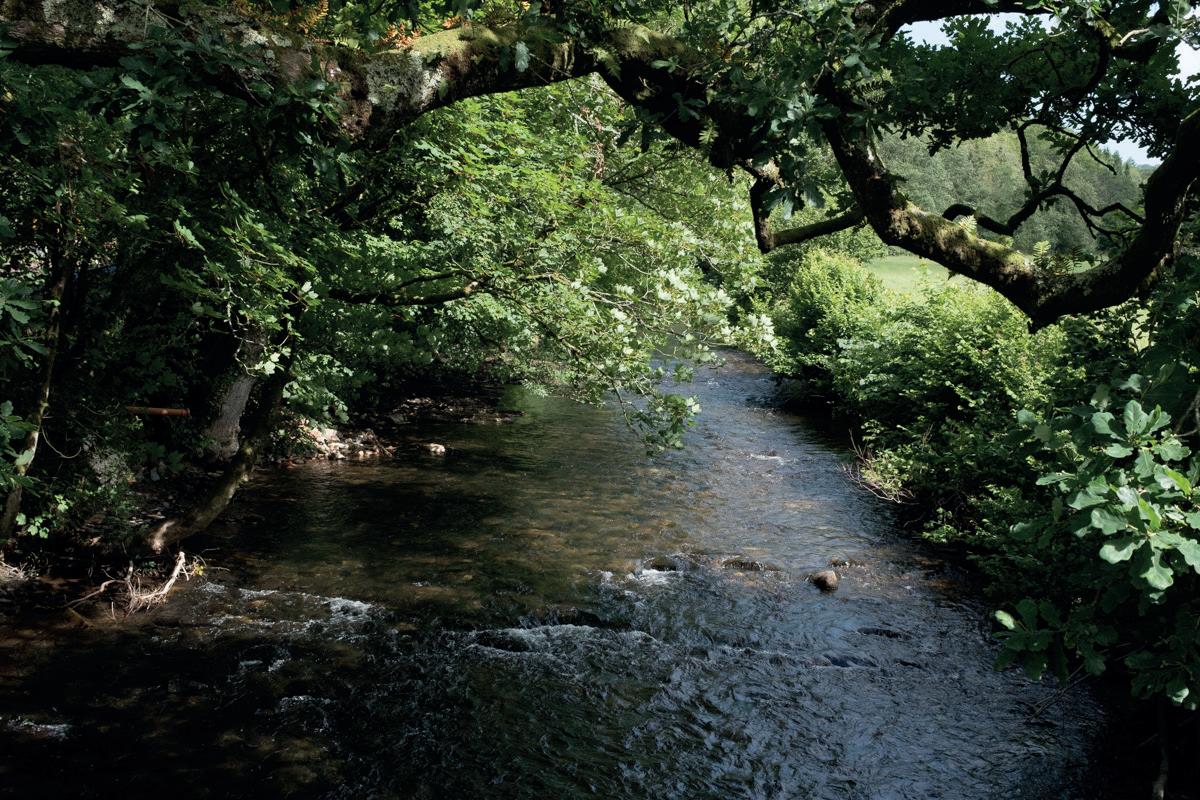
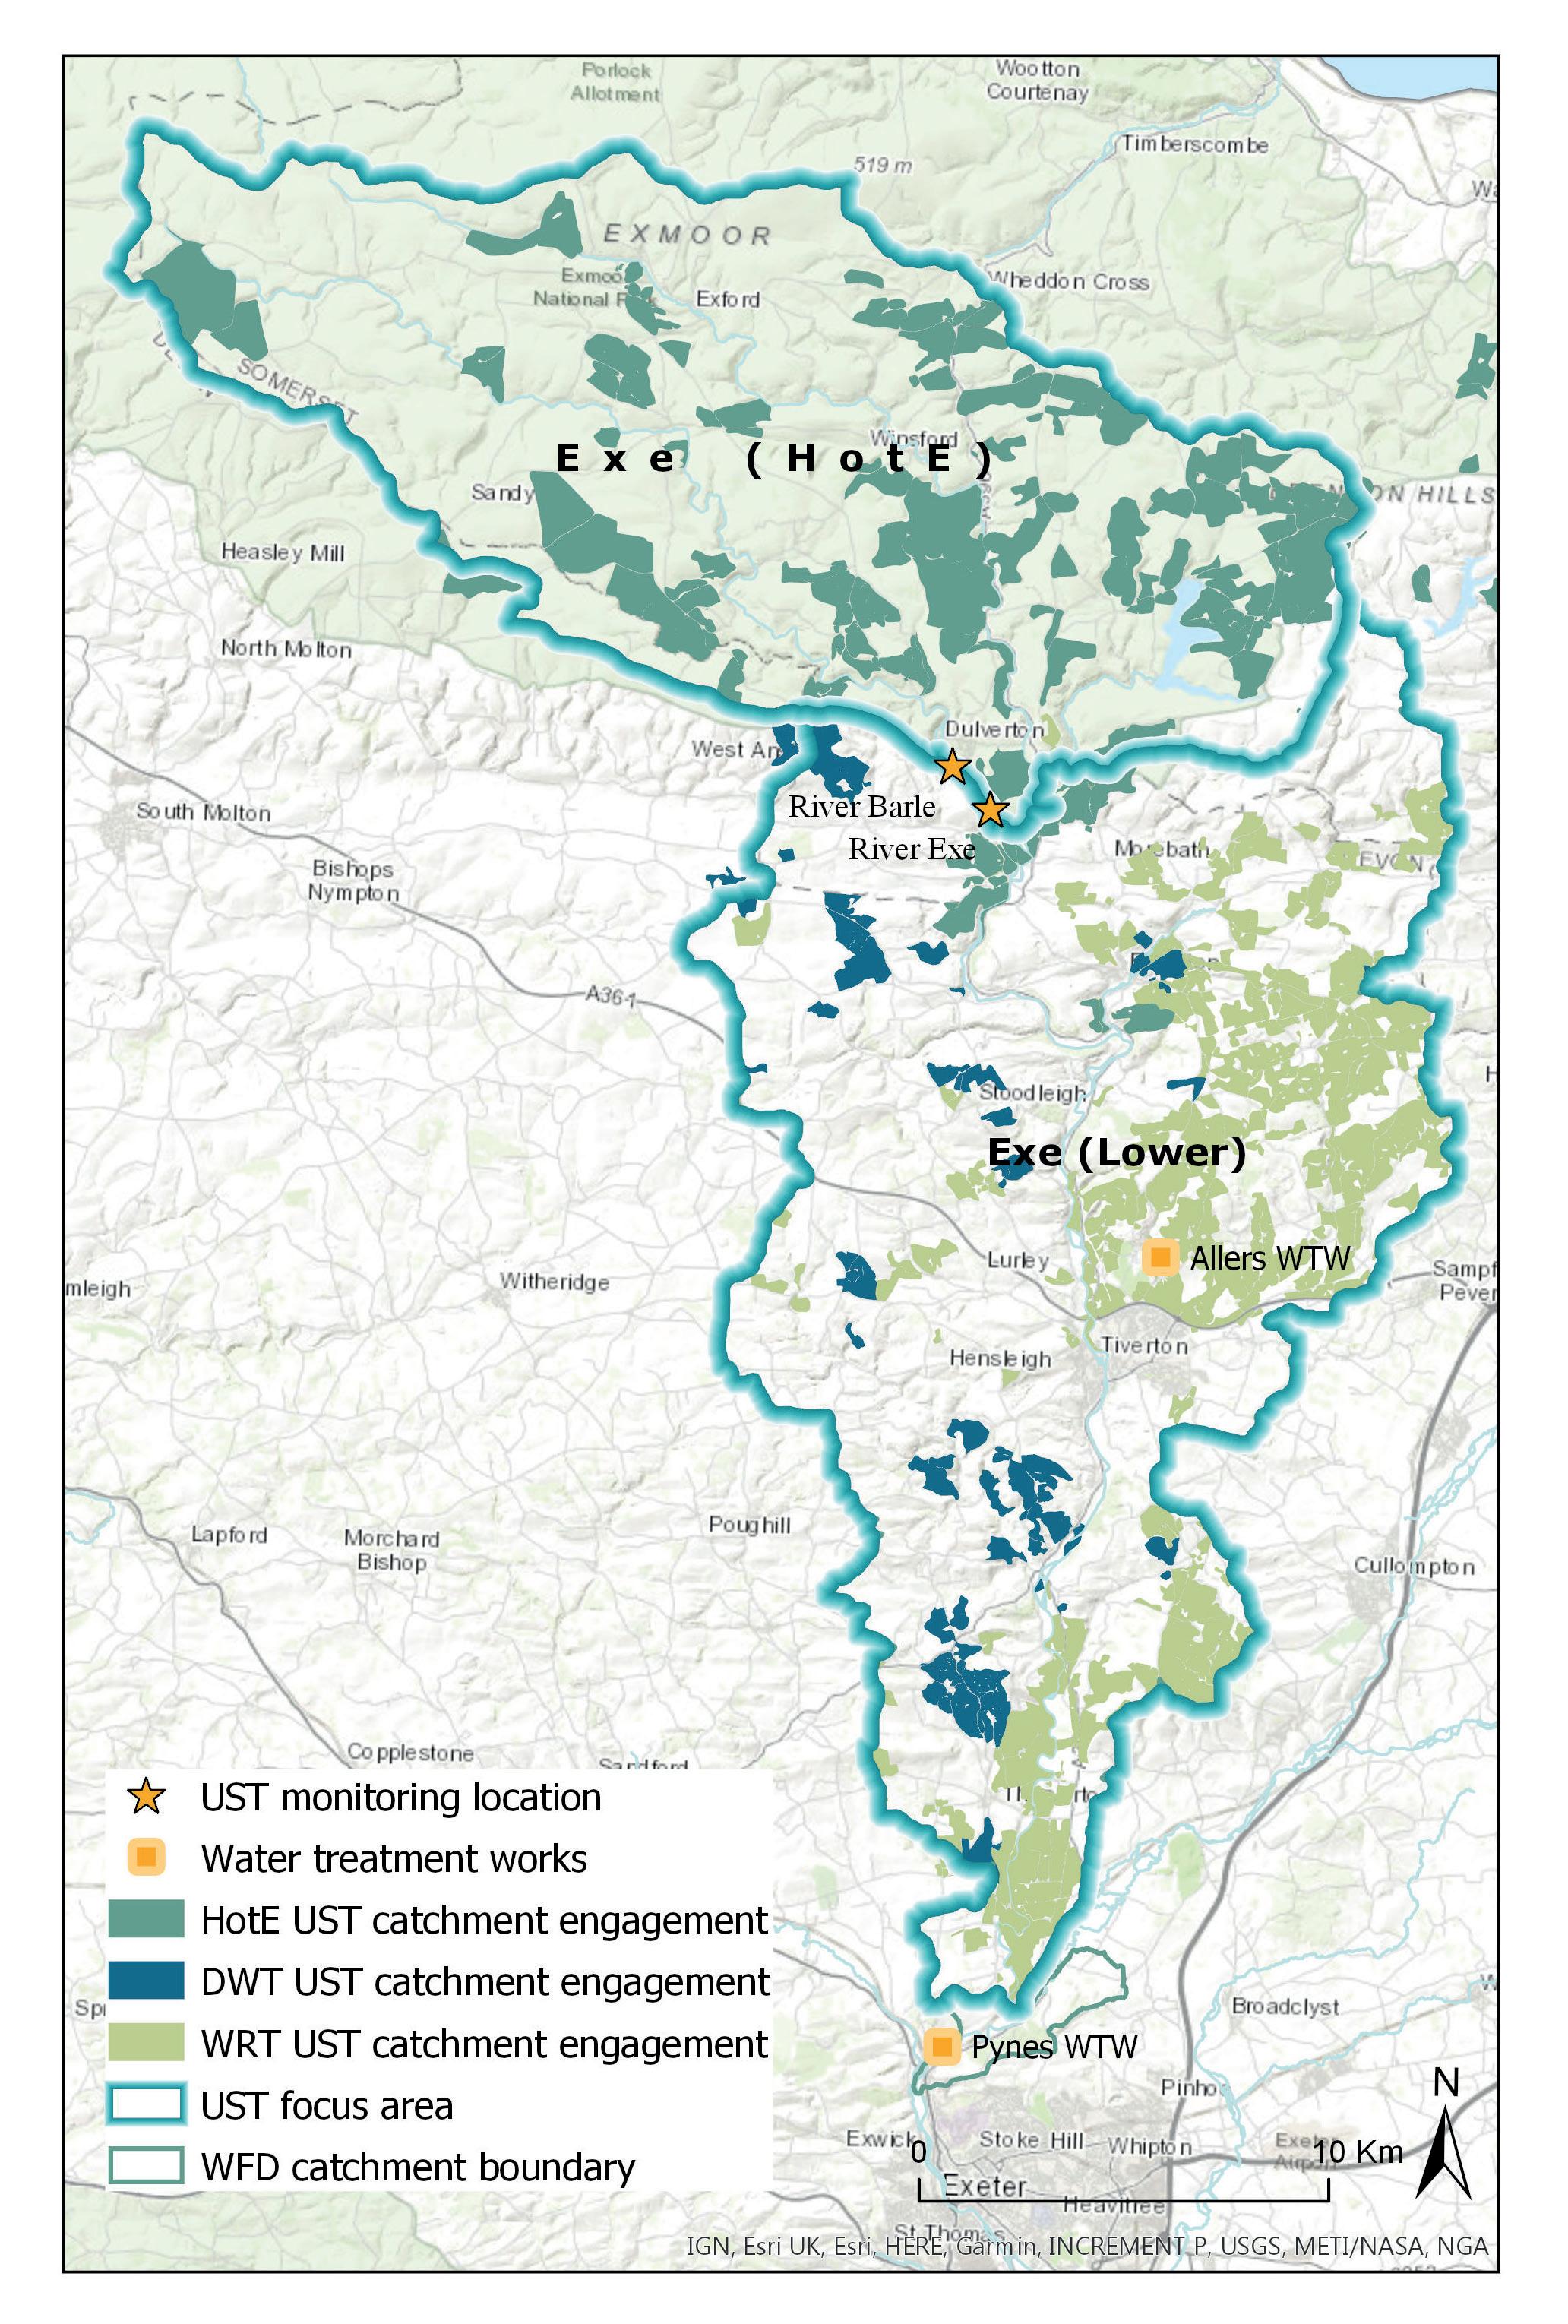
Figure 1 Map of engagement in the Exe by ENPA (through the
HotE project), DWT and WRT as part of Upstream Thinking, also showing UoE monitoring locations and water treatment works.
About the catchment
Background site information
The Exe catchment (Figure 1) is within the Wimbleball Strategic Supply Area. The Upper part of the catchment, from the source of the river in the north to Brushford, lies within Exmoor National Park and falls within the Headwaters of the Exe (HotE) catchment programme. The catchment covers an area of 27,559 hectares and includes the Rivers Barle, Quarme, Pulham and Haddeo, as well as other smaller tributaries. The area is included in the Devon East Management Catchment and the Exe Main Operational Catchment. The HotE catchment area includes farmland, moorland and some forestry plantations and other woodlands areas. The main land uses in the catchment are upland farming, forestry and game shoots. Recreation and access are also very important in this catchment. Catchment management work for the HotE project was led by Exmoor National Park, with the interventions delivered by FWAG-SW. Further south, Allers and Pynes abstractions and water treatment works provide drinking water for mid-Devon and Exeter, supplying a population of large towns, including Tiverton and Exeter. In both 2015 and 2019, most water bodies in the catchment fell in the Moderate and Good classes of the WFD for their ecological status. For the chemical status, however, there has been a dramatic degradation in the time frame: all water bodies had the “good” chemical status in 2015 but all failed in 2019. The EA states that agriculture and land management is the main reason for this deterioration. Catchment management in the lower part of the Exe was delivered by Devon Wildlife Trust (DWT) and Westcountry Rivers Trust (WRT)
Catchment Challenges
For the period 2015-2020, the whole of the catchment is at risk for pesticides – particularly MCPA, Mecoprop, Chlorotoluron, Triclopyr, used as a broadleaf weed killer, and metaldehyde (used in slug pellets).
Catchment Activities
Interventions in the HotE project have focused on mitigating sediment loss and reducing pesticides. As of May 2019, almost 30% of the HotE catchment had been engaged in UsT2 with physical activities including establishment of new hedges, farm track management and other works to provide alternative livestock drinking and protect watercourses. Physical interventions completed via UsT, which were quantifiable within the Farmscoper software, amounted to a cumulative total of over 3,500 ha. The most commonly used interventions are shown in Figure 2. In the lower part of the catchment, activities during UsT2 have focussed on providing advice and guidance to farmers to improve management for pesticides, water quality and water resource issues, and biodiversity. As of May 2019, almost 30% of the Lower Exe had been engaged in UsT2 with physical activities including fencing off rivers from livestock, establishing buffer strips, management of dirty water, farm track management and constructing troughs with concrete bases. Physical interventions completed via UsT, which were quantifiable within the Farmscoper software, amounted to a cumulative area of over 700 ha. The majority of interventions included the building of troughs with a concrete base, which is likely to help reduce sediment loading of waters as well as nutrient loadings. Other commonly used interventions included dirty water and farm track management, in-field grass buffer strips and riverside fencing. The predicted impact of interventions in the overall Exe catchment on DOC and nitrate is presented (Figure 5 p32).
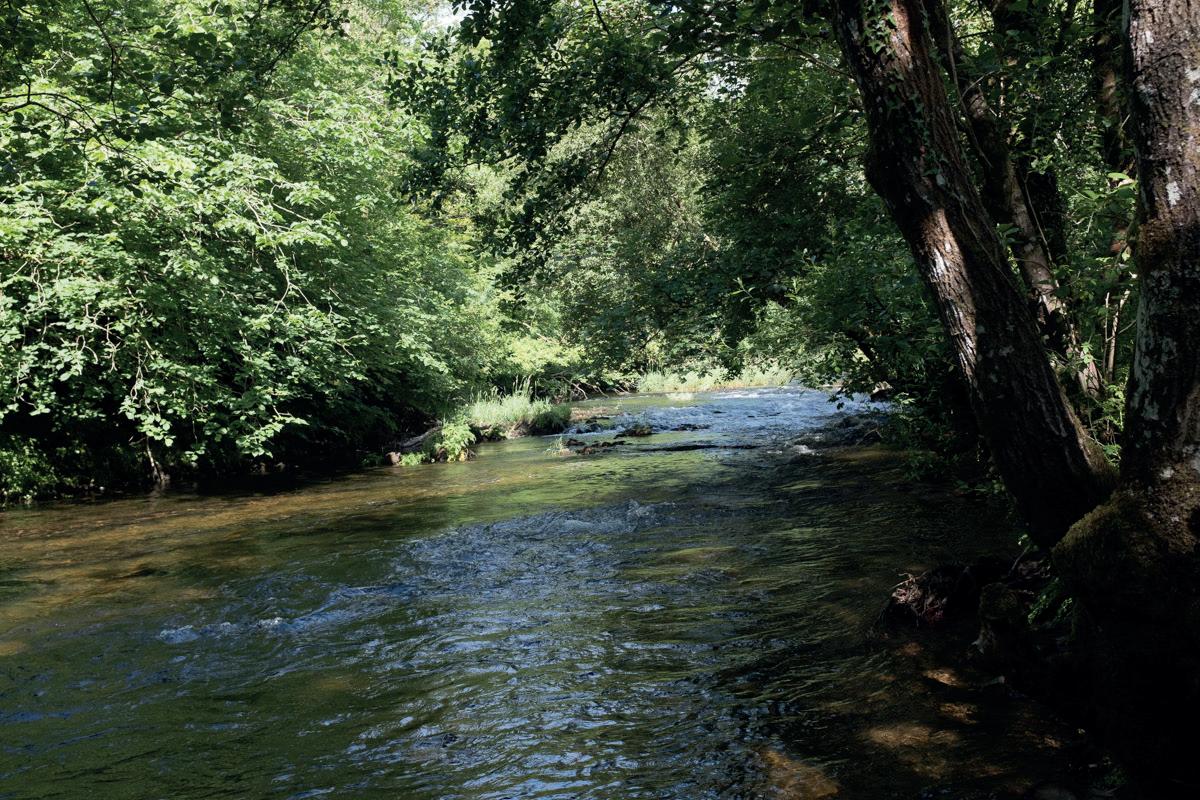
The two main rivers in the Exe catchment: The River Barle at Dulverton (top) and the River Exe at Brushford (bottom).
Water quality in the Lower Exe catchment
An understanding of the levels and behaviour of key contaminants in the lower River Exe was built up from spot samples and high-frequency signals at the SWW water treatment works. A summary of the high frequency data for the river water is shown in Table 1. Across all the data collected for this site, the values for the highest colour peaks (occurring alongside peaks in rainfall events) are unavailable, either due to the timings of manual samples or due to the sensor limits for the high frequency data. Across the study period, the values for the different contaminants generally follow the behaviour seen across the river sites (for more information about these overall patterns see Figure 2 p22.
Parameter Data completeness* Min Max Mean Median
Colour (Hazen) 82.5% 0 99.96 10.47 9.19
Conductivity (µS cm-1) Dissolved Oxygen (%) pH 91.9%
91.6%
92.3% 56.6 366.1 173.12 168.8
53.08 143.84 94.92 94.92
6.002 9.37 7.56 7.52
Turbidity (NTU) 91.5% 0
* Percentage of record with data (after quality control) 492.65 9.12 4.45
Table 1 River water
(Northbridge intake) summary statistics for water quality signals covering the period October 2012 to October 2018.
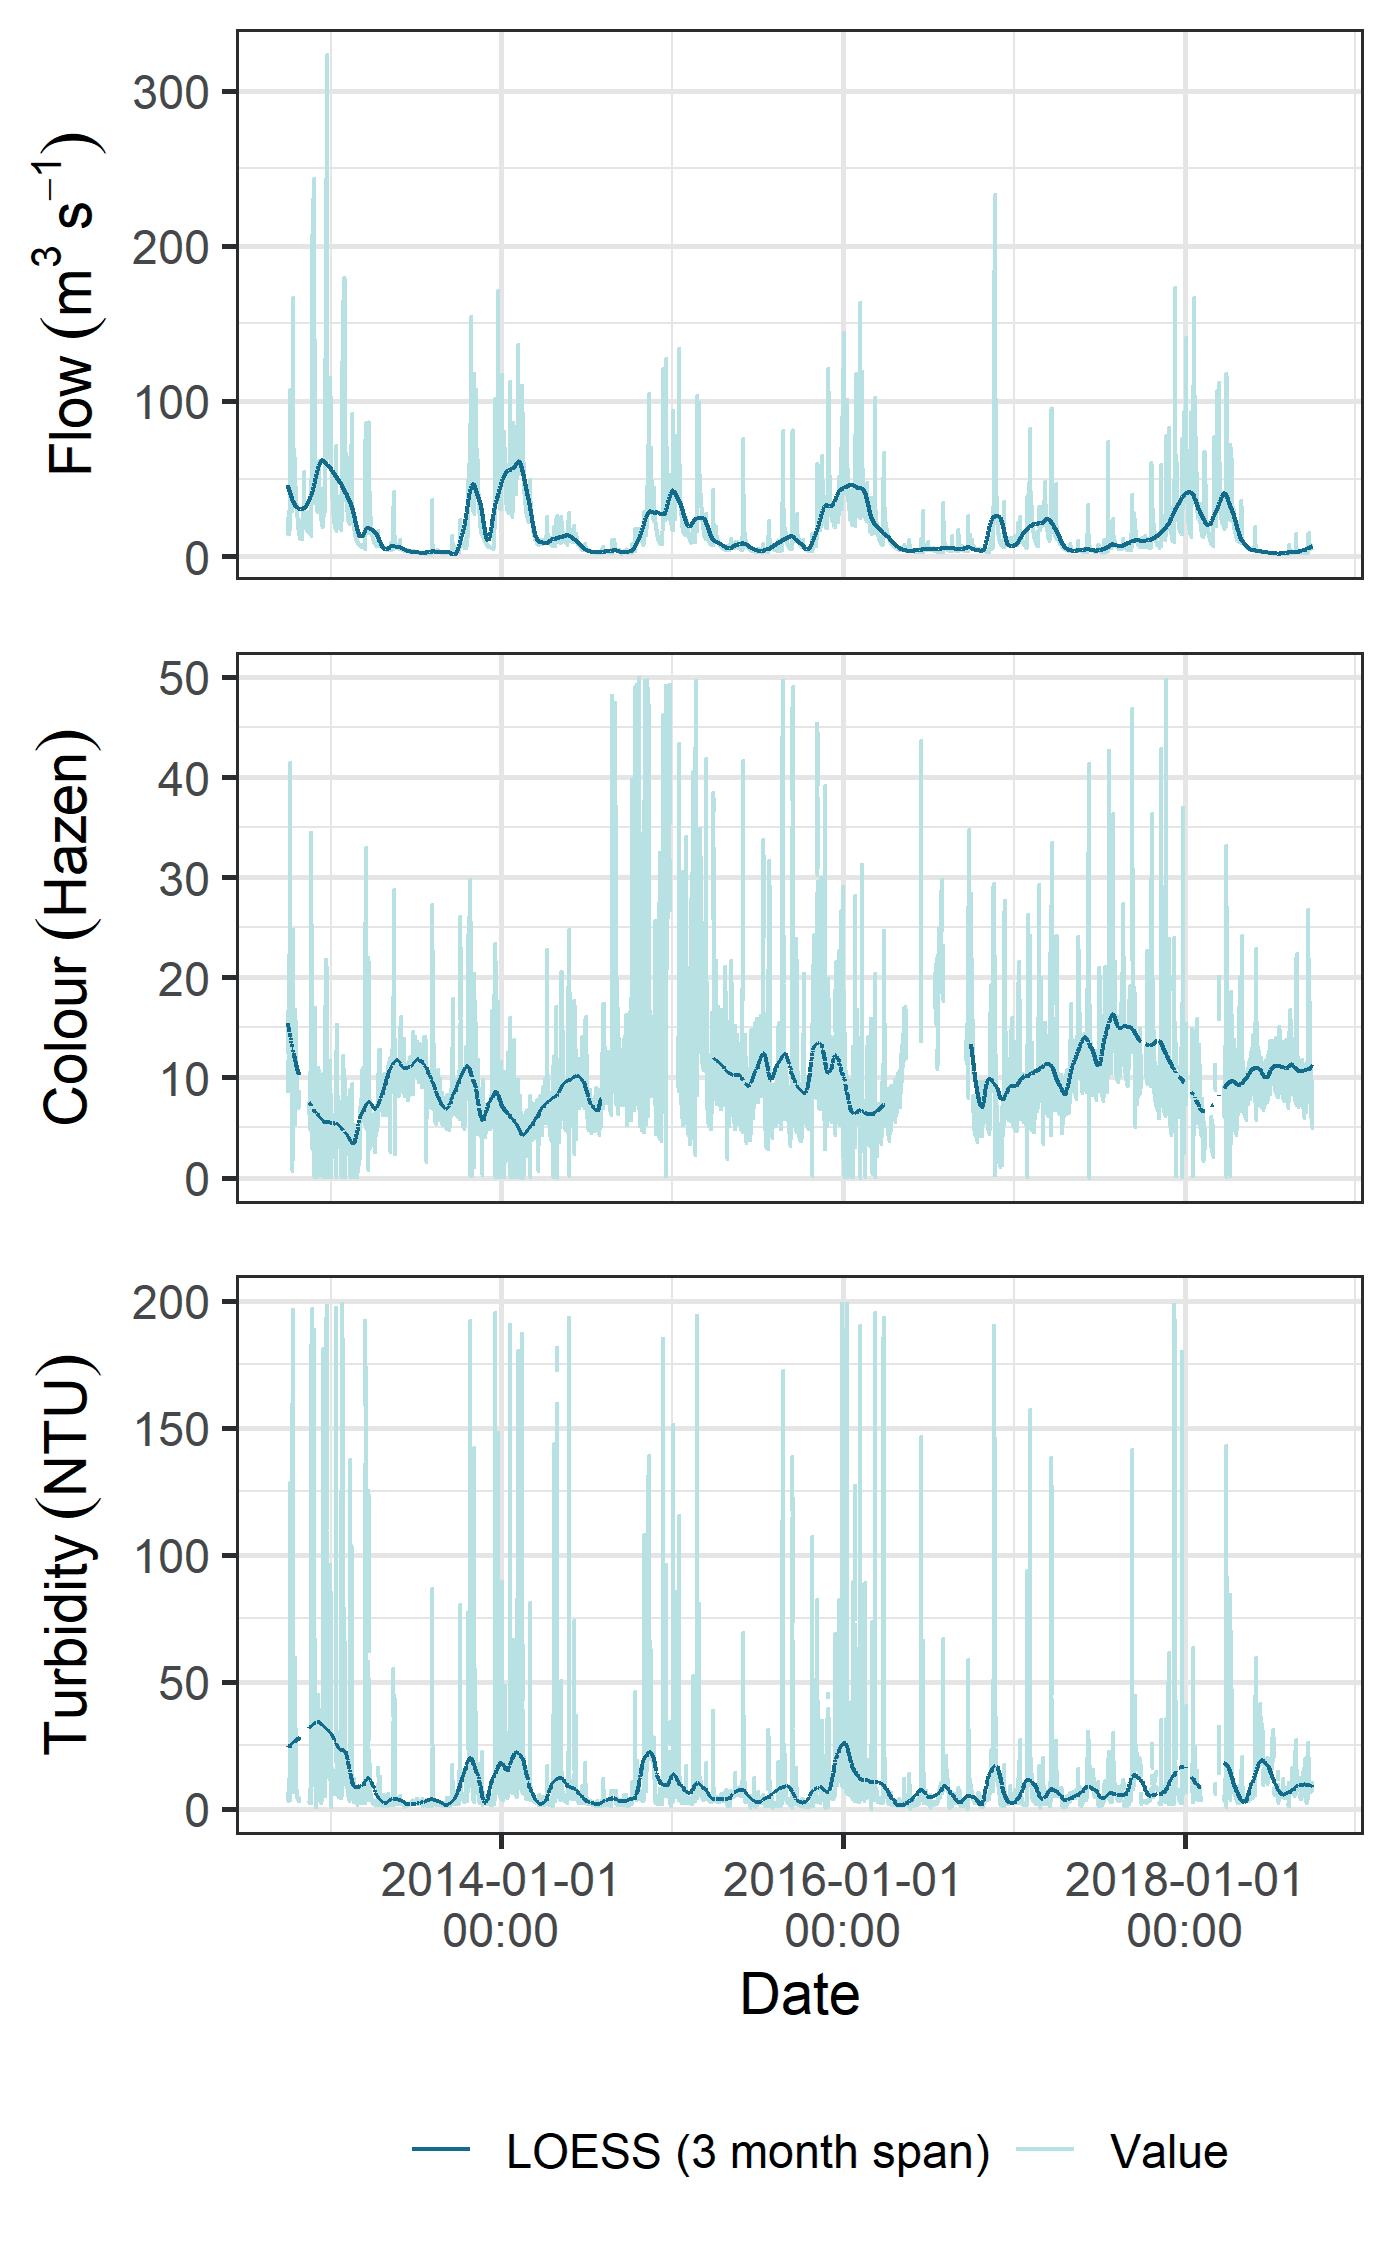
Seasonal change in water quality
Figure 3 shows the seasonal variation in the signal recorded in the river. Colour values were typically at their lowest in the late winter and spring and highest in late summer. Turbidity values were highest during the wetter hydrological winter, with the exception of the dry winter of 2016 to 2017.
Figure 3 Smoothed and recorded values show annual variation and seasonal cycles for flow, colour and turbidity across the study period. Some of the underlying highfrequency recorded values of colour and turbidity are limited for display purposes.
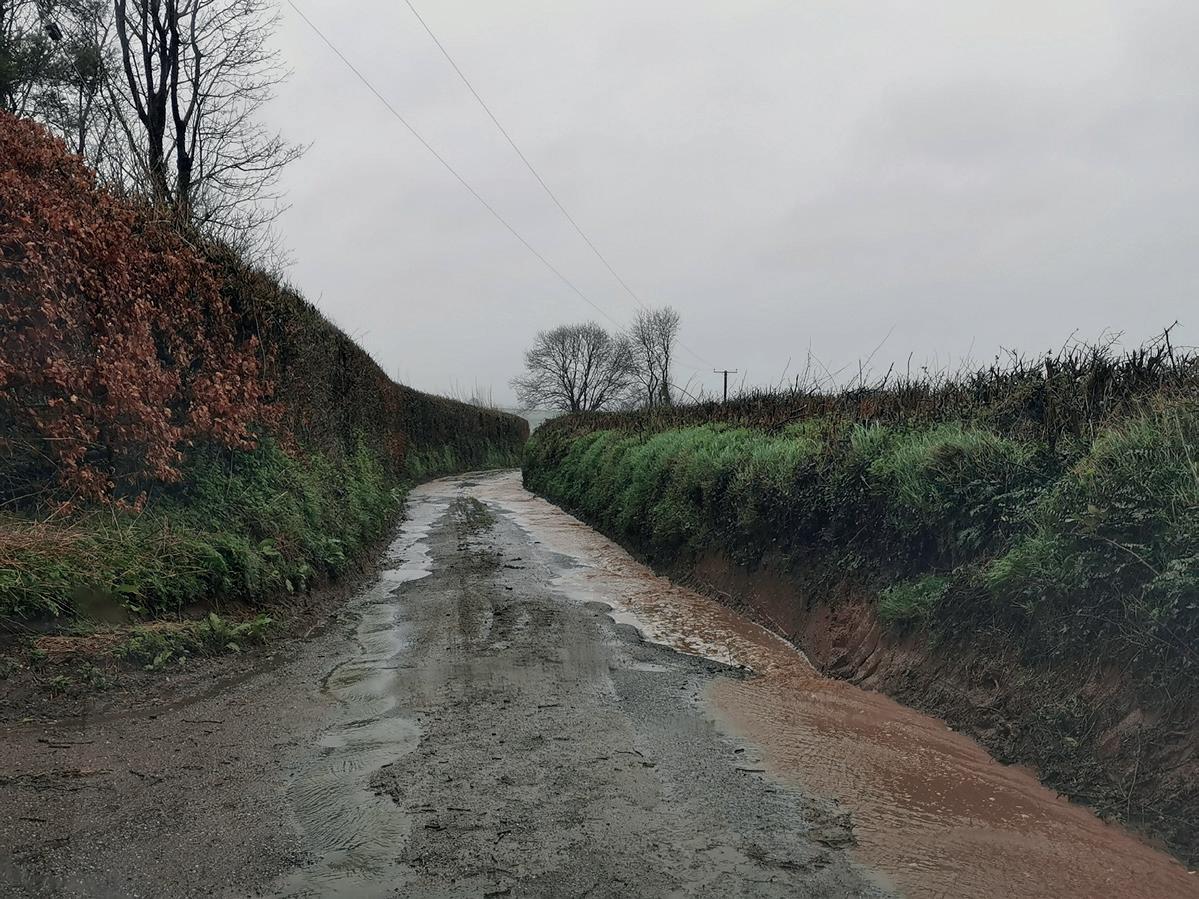
Field runoff on the road in the Lower Exe (photo by DWT).
Water quality during rainfall events
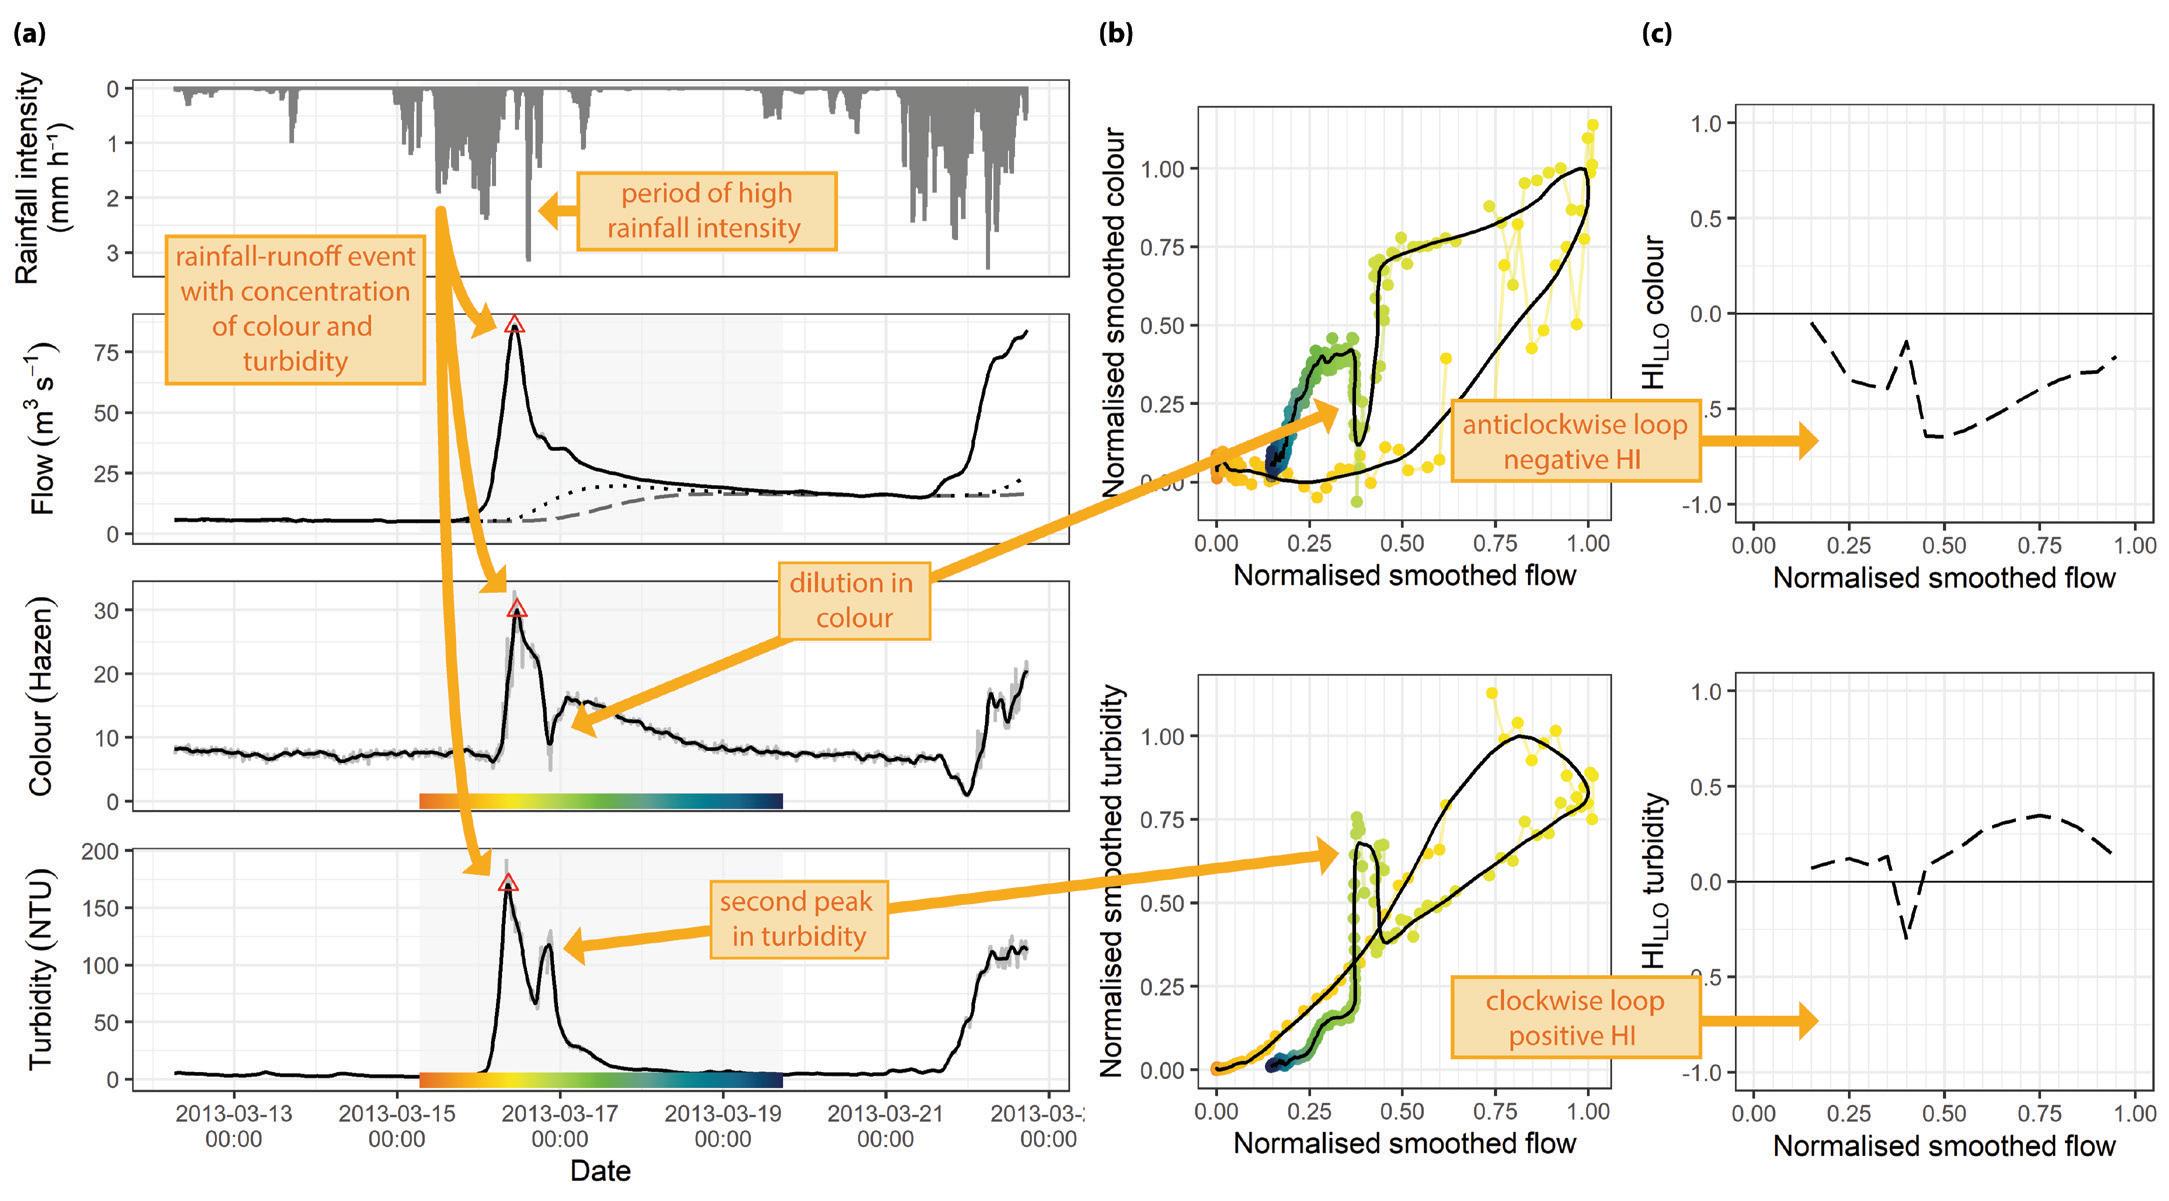
The seasonal patterns for colour and turbidity are influenced by the concentration and dilution effects of the rainfall in the catchment, and the flow conditions in the river. These event scale patterns are related to both contaminant sources and to how they are transported within the catchment. On the shorter event time scale, the Lower Exe colour displays complex behaviour. Rainfall events are associated with both dilution and concentration, and either behaviour, or both, may be seen during a single flow event. This variability reflects the size of the catchment and the changing dominance of processes affecting overall concentrations in the river. However, even where there are initial dilution effects, generally the highest values for colour still occur after the flow peaks with hysteresis loops formed in an anticlockwise direction. This suggests more distant sources for colour, perhaps from degraded peat in the moorland headwaters of the catchment, or slower pathways for colour enriched waters. Where events show continued concentration effects at the end of the quick flow recession and into the base flow recession, this can also indicate the difference in the transport for colour (throughflow and base flow). The behaviour of turbidity is more consistent, with all rainfall events analysed showing a concentration effect. For the majority of events analysed the peaks in turbidity occur while the flow in the river is still rising. This ‘first-flush’ effect is typical for turbidity, and can indicate rapid mobilisation (erosion and transport of sediment) at the start of a rainfall event. The occurrence of the turbidity peak before the flow peak also indicates close proximity to the source (relative to catchment size). However, as there are no notable dilution effects on the falling limb of the events and events often display anticlockwise hysteresis loops, the catchment is not considered to display ‘sediment exhaustion’. The continued higher level of turbidity throughout the event, gradually reducing with reduced flows, may represent the transport of sediment from more distant sources2 . An example of these different behaviours is shown in Figure 5. During this rainfall event there is an initial concentration of colour peaking 45 minutes after the peak in flow. This is then followed by dilution during a period with increased rainfall intensity, but only a small change in flow. There is then a return to higher colour values, gradually decreasing during the remainder of the flow recession. Turbidity also shows elevated concentrations during the rainfall event. However, in contrast, it peaks over an hour before the flow peak, and the increased period of rainfall intensity triggers a sudden increase in turbidity and a second sharp peak. This second peak indicates the occurrence of rapid erosion (such as a bank collapse) or increased transport from nearby sources due to a sudden increase of surfacerunoff in a saturated catchment. The behaviour described can also be clearly seen in the hysteresis loops for the event (Figure 4b), and in the Hysteresis Index (HI) values calculated for the event (Figure 4c) with colour response lagging being flow (anticlockwise loop and negative HI), and the turbidity increase occurring more rapidly, but more in-sync with the changes in flow (clockwise loop and overall positive but low HI).
Figure 4 Example of a rainfall event in late winter for the Lower Exe showing (a) time series, (b) hysteresis
loops, and (c) the Hysteresis Index calculated across the range of flow conditions for the event.
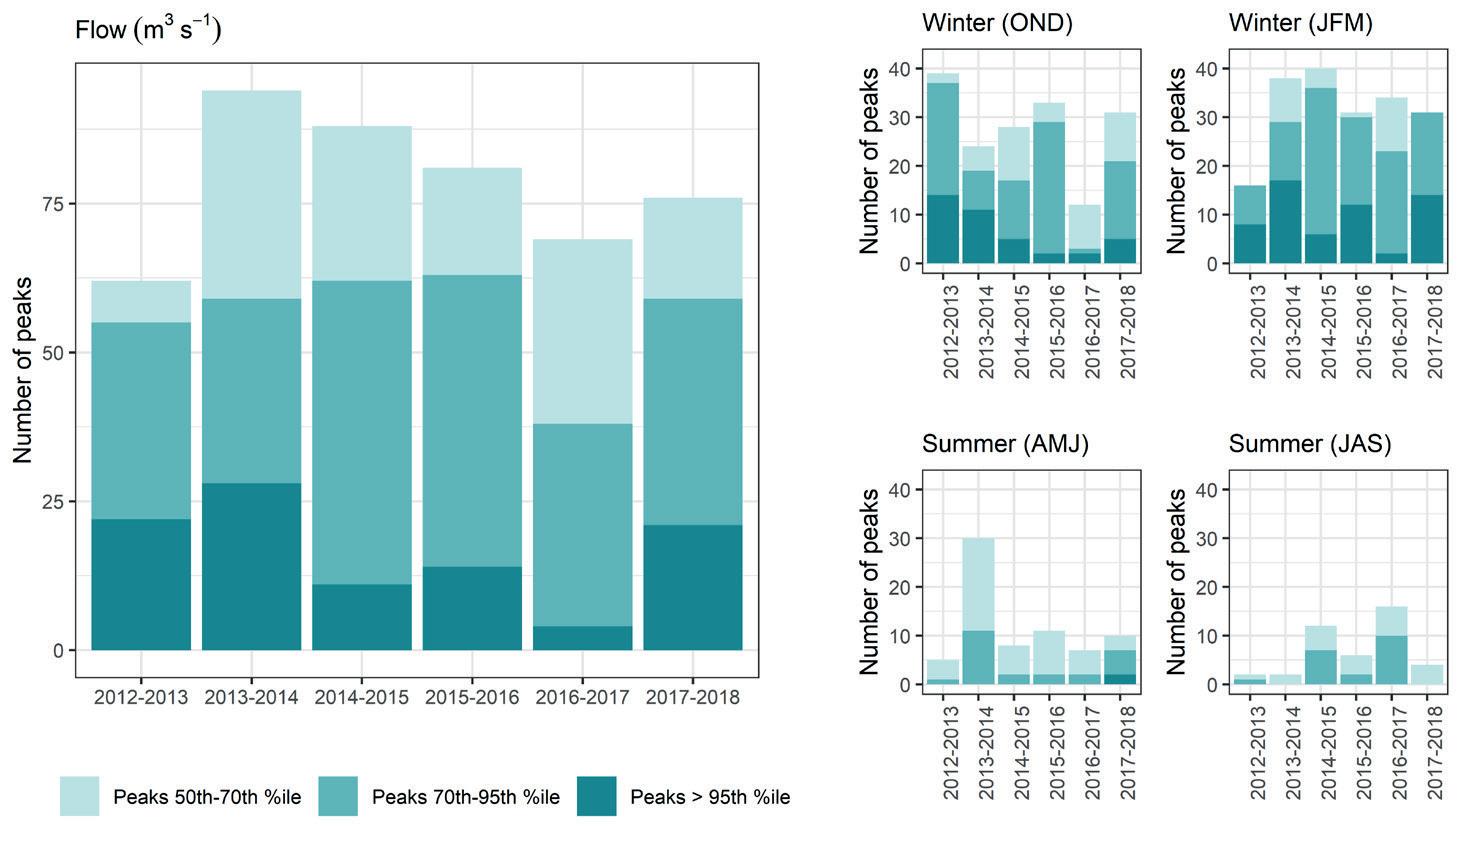
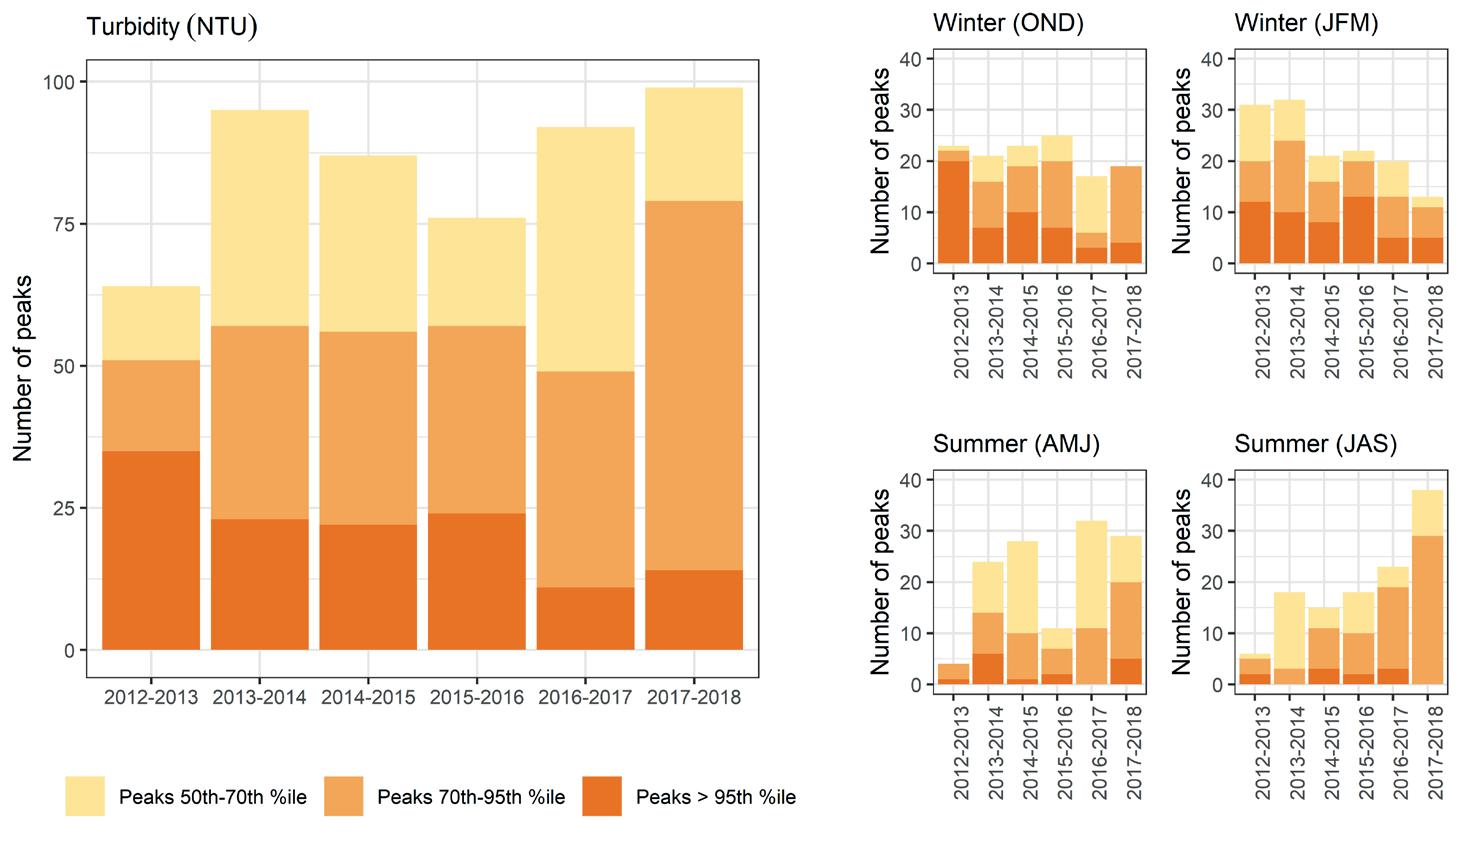
Peaks in turbidity in the River Exe
The annual pattern in the number of turbidity peaks reflects the annual change in peaks of flow. Generally summer peaks in turbidity have a lower magnitude than winter peaks (Figure 5). The overall number of turbidity peaks with a magnitude over the long-term median rose between 2012 and 2018, however there was a fall in the number of peaks in the highest magnitude category (peaks in the top 5% of all turbidity records). Generally, the number of peaks in winter fell, and the reduction in the number of very high magnitude turbidity peaks is pronounced in the early winter months. The number of peaks over the long-term median in summer increased, yet there was no notable increase in very high turbidity peaks during this period.
Figure 5 Number of peaks (local
maxima) for flow and turbidity exceeding the overall median value; data are presented across the hydrological year (left), and in each of the seasons separately (right).
Grazing in the Exe catchment; photo by Ross Cherrington (WRT). REFERENCES
1. Lawler, D.M., Petts, G.E., Foster, I.D.L., and
Harper, S. (2006). Turbidity dynamics during spring storm events in an urban headwater river system: the Upper
Tame, West Midlands, UK. Science of the
Total Environment, 360 (1–3), 109–26. 2. Vale, S.S., and Dymond, J.R. (2020).
Interpreting nested storm event suspended sediment-discharge hysteresis relationships at large catchment scales. Hydrological Processes, 34 (2), 420–440. Total number of detections
Nb single exceedances >100 ng L-1
Max value (ng L-1)
Total number of compounds
Spring 16 Autumn 16 Spring 17 Autumn 17 Spring 18
Autumn 18 Allers WTW 10 11 16 8 16 14 Pynes WTW 19 20 21 14 19 19 Allers WTW 0 0 0 0 0 0
Pynes WTW 0 0 0 0 0 0
Allers WTW 15 5 9 6 23 3
Pynes WTW 25 13 15 6 12 6 Allers WTW 5 6 6 4 6 6
Pynes WTW 7 8 9 6 7 7
Pesticide detections in the Lower Exe catchment
The results of passive sampling monitoring in the Lower Exe are presented in Table 2. Overall the total number of detections on either sites were consistently high throughout the monitoring period (i.e. varying between 8 and 21), with higher values measured further down the catchment, highlighting the contribution of streams located between monitoring locations. Similarly, a number of tributaries within the catchment are hotspots: the River Batherm, the River Burn and the River Lowman have experienced high number of detections (i.e. consistently between 16 and 21 per deployment) but also high detections that frequently go above the 100 ng L-1 mark (e.g. 309 ng L-1 for the River Batherm in Spring 2018). These high detections are not picked up further down the catchment, where the maximum concentrations (as a time weighted average) recorded reached 25 ng L-1 at Pynes WTW, and 23 ng L-1 at Allers. The total number chemicals detected at Pynes WTW is significantly larger than that detected at Allers, with values of 12 and 8 respectively (Table 2). This reflects the nature of the catchment, and the importance of agriculture in the lower part of the catchment, whereas the upper part (i.e. above Allers WTW) is more pastoral. Amongst the compound of concern, only Chlorotoluron was not detected in the catchment; other compounds (i.e. MCPA, Mecoprop, Triclopyr) were present at each monitoring period. Metaldehyde was detected during autumn deployment, which coincides with its prime application period. Overall, both maximum concentrations measured as time weighted average, and the number of compounds detected in each location indicates that pesticides remains a significant problem in the catchment. Such information is invaluable to justify continued efforts of pesticides amnesty in the catchment.
Table 2 Total number of detections, exceedances
above 100 ng L-1, maximum concentrations detected and total number of compounds detected in the River Exe at SWW assets between spring 2016 and autumn 18. The blue shading indicates a severity scale separately applied to each parameter, from light blue (low) to dark blue (high).
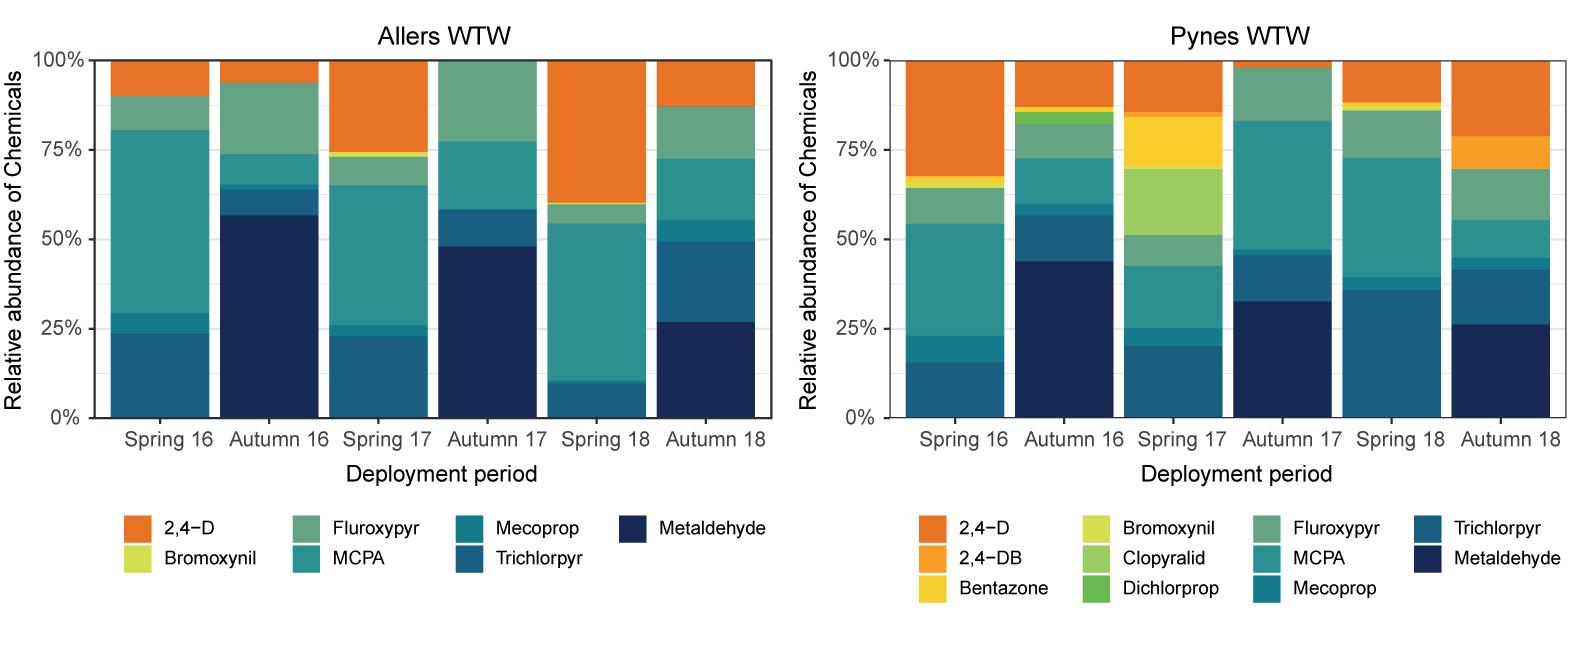
Figure 7 Relative abundance of


