Northern Beaches Market Update


$21,500,000 Highest sale price
40.7 Average days on market - House
37.3 Average days on market - Unit
7,179 Total residential properties leased
$2,985,511 Median House price
$6000 /week Highest lease price
$1,352,353 Median Unit price 36 Enquiries per campaign - average
$1,122 /week Average rental price - House $156,000 Average household income

$645 /week Average rental price - Unit 45 - 49 Largest population age range
Source: Data is provided by CoreLogic and REA, based on statistical market data. Whilst all reasonable effort is made to ensure the information in this publication is current, Upstate does not warrant the accuracy or completeness of the data and information contained in this publication.
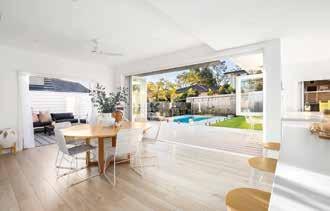
The Northern Beaches region saw exponential growth late 2021 and well into 2022. Unlike other regions, the Northern Beaches offers a lot of ongoing and desirable value through its exceptional lifestyle and steady growth rate. Consequently, a lot of out-of-area buyers are now drawn to this idyllic lifestyle change. But beyond that, our 2022 property market report shows how promising the local real estate market is.
Because from what we’ve observed this year, the local market is looking particularly strong for residential sales. Although the market softened during the last few months of 2022 due to interest rate hikes and inflation, our data and first-hand experience shows that this year saw nearly the same trend in enquiries during the same months last year. Upstate sales enquiry levels this year far exceed our competitors across the Northern Beaches market, as evidenced by data from realestate.com. au (see graph). Upstate also closed some phenomenal deals this year, including our highest sale ever for an apartment in the historic block, Dungowan, in Manly at over $7.5 million.
There is talk of interest rates not going as high as we expected, and there is even the possibility they may reduce towards the end of 2023. So, if you’re holding back because of all the news about rates, the market still looks healthy, despite all the media hype – and it’s shaping up to look even better in the coming months.
If you are thinking of selling or want an updated property appraisal, speak to your local Upstate team today on 02 9971 9000 or scan the code for a free digital valuation.

The Northern Beaches biggest team and database in a single office.
attract significantly more enquiries than the market average.
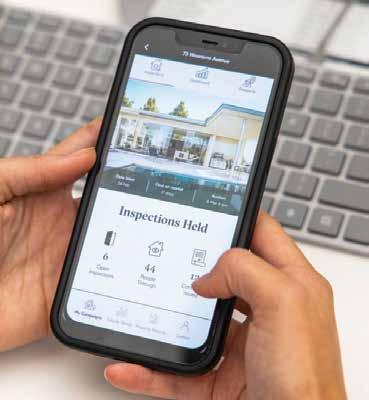
Discover a better way to sell, keep up to date and have complete peace of mind, anywhere, anytime with our innovative Upstate App. The selling process is right at your fingertips, with a live dashboard displaying current enquiries and buyer interest stats, trends, campaigns, offers, attendee numbers and more. You can be sitting at a café or enjoying the bustle of your day and message your agent directly while reviewing all of your property updates at a glance. Vendors can stay connected during the campaign, throughout every step of the selling journey with our exclusive phone app. This allows vendors to have 24/7 access to all of the stats, figures and
updates about the property, prospective buyers and monitor up-to-minute offers and open home information.

Never be left wondering again. Our Upstate digital property valuation tool is now live and ready to make you a property expert in seconds. From market appraisals, suburb statistics, market trends, peak selling periods, sales and growth charts to details of nearby properties –you’ll have everything you need to make informed decisions at your fingertips.
Real Estate moves fast. Our report makes you move faster. Simply enter a property address and you’ll become a property expert in seconds. It’s super easy.


