Pine Resource Analysis
Prepared for Virginia Department of Forestry

© 2022 Forest2Market
The Virginia Department of Forestry (VDOF) engaged Forest2Market to conduct an independent analysis of pine resources across the state of Virginia and to recommend three locations for a new, high-capacity sawmill operation. For the three locations, analyses of past, present, and future pine sawtimber demand, inventory, and prices were performed.
To identify three locations in Virginia that are favorable for new sawmill development, a unique regional site assessment (heat map) was utilized which leveraged related pine sawtimber availability, price, and market characteristics data to create a colorized map of favorability.
Once three sites were identified with the heat map, two high-capacity sawmill production scenarios of 300 million board feet (MMBF) and 400 MMBF annually were used in the analysis to test the supply and price reactions as well as forest sustainability in the supply basins.

© 2022 Forest2Market • forest2market.com
Introduction
2
Regional Site Assessment

Regional Site Assessment
The heat map analysis utilizes base elements (data) related to pine sawtimber feedstock supply, demand, price, and other macroeconomic and geospatial factors pertinent to a sawmill’s operations in order to produce a weighted heat map that illustrates the relative favorability of geographic areas to each other.
Many of the base elements are reported at the county level while other factors, such as distance to interstate, measure distance with spatial interpolation techniques.
The most favorable locations for a high-capacity sawmill are displayed in dark green, and the least favorable locations in red. Regions in lighter shades of green boast favorable base elements that may attract a potential sawmill.
Forest2Market identified three highly favorable locations in VEDP Opportunity Zones:

o Forksville
o Jarrat

o Vernon Hill
Source: https://gis.vedp.org/datasets/89d63a87bbfe41c3b96b32bfadb0bfb2_31/about
© 2022 Forest2Market • forest2market.com
Basin Analysis

Basin Analysis Methodology

After identifying three favorable locations for a new, high-capacity sawmill, Forest2Market developed supply basins surrounding the locations with radii of 75 road-miles.
Independent, in-depth analysis of each supply basin was performed. This analysis included both historic and current market conditions as well as two exclusive forecasted demand scenarios for future levels of pine inventory, demand, competition, price and sustainability.
o Scenario 1 is a state-of-the-art sawmill capable of producing 300 MMBF annually. The pine sawtimber demand for this hypothetical mill is 1,140,000 tons annually. This facility is projected to begin operations in 2H2024 and to reach full operating capacity in 2026.
o Scenario 2 is a state-of-the-art sawmill capable of producing 400 MMBF annually. The pine sawtimber demand for this hypothetical mill is 1,520,000 annually. This facility is projected to begin operations in 2H2024 and to reach full operating capacity in 2026.
Throughout this analysis, the US Forest Service’s Forest Inventory and Analysis data and Forest2Market’s proprietary Delivered Price Benchmark data have been leveraged to determine current forest inventory, market demand and harvest levels, pine sawtimber prices, and pine sawtimber sustainability.
© 2022 Forest2Market • forest2market.com
Forksville Supply Basin

Forksville Supply Basin Profile

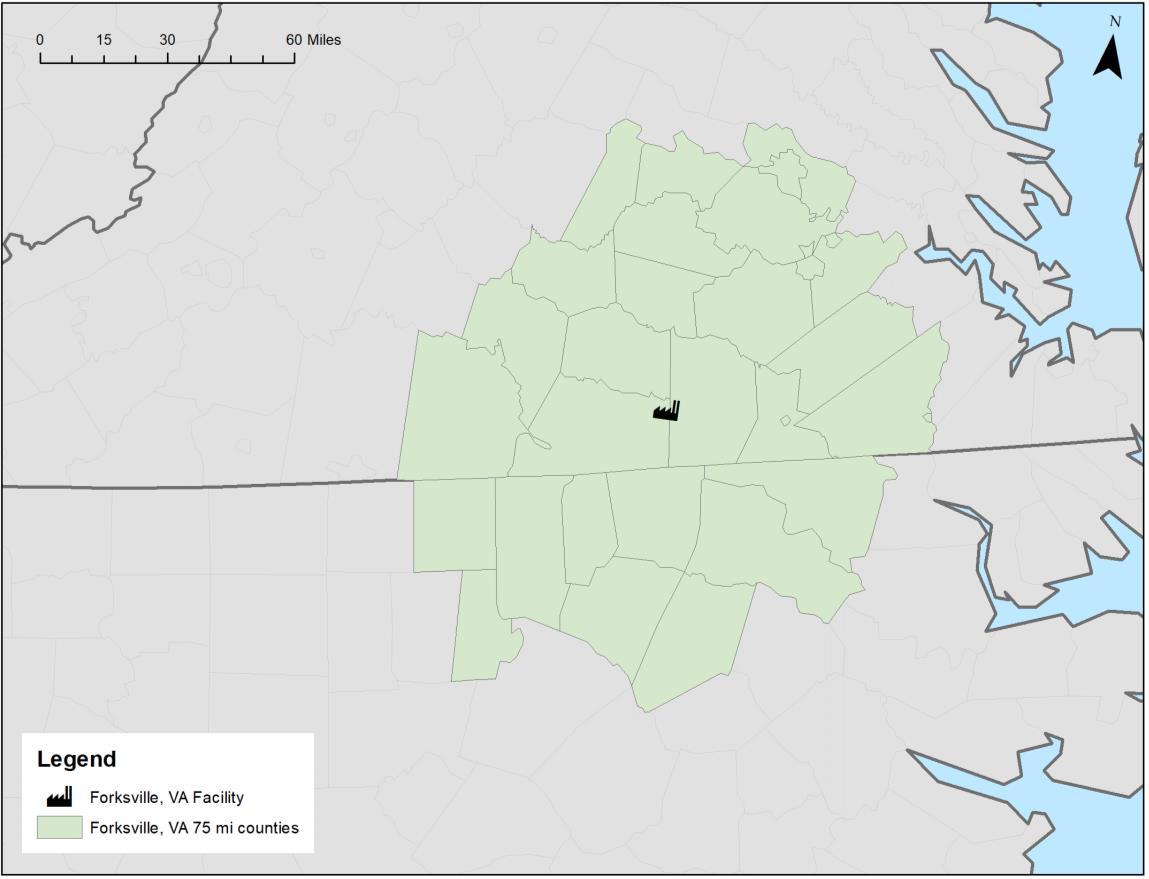
Forksville, VA is approximately 75 miles southwest of Richmond. The surrounding supply basin is comprised of 7.4 million total acres, of which 4.9 million acres (67%) are timberland.
Private timberland ownership makes up a majority at 4.7 million acres. NonIndustrial Private Forestland (NIPF) owners manage 3.4 million acres, and corporate owners manage 1.3 million acres within the region.
© 2022 Forest2Market • forest2market.com
8
Private Pine Acres

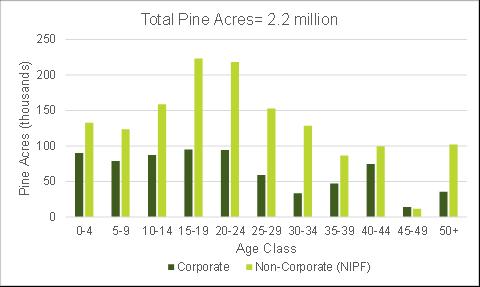
A total of 2.2 million pine acres are managed between corporate and NIPF owners. A significant percentage of the acres are in the 15 to 24-year age classes indicating a near to mid-term supply of pine sawtimber.
Standing pine inventory in the basin is at 196.0 million tons; 128 million tons are planted pine and 68 million tons are natural pine.
Corporate owners manage 41.6 million tons (66%) of their pine inventory as pine pulpwood and 21.4 million tons (34%) as pine sawtimber. NIPF owners manage 90.4 million tons (68%) as pine pulpwood and 42.5 million tons (32%) as pine sawtimber.
© 2022 Forest2Market • forest2market.com
9 90.4 68% 42.5 32%
NIPF Pine Inventory
41.63 66% 21.5 34%
Pine Pulpwood Pine Sawtimber
Corporate Pine Inventory
Pine Pulpwood Pine Sawtimber
Sawtimber Consumers Map
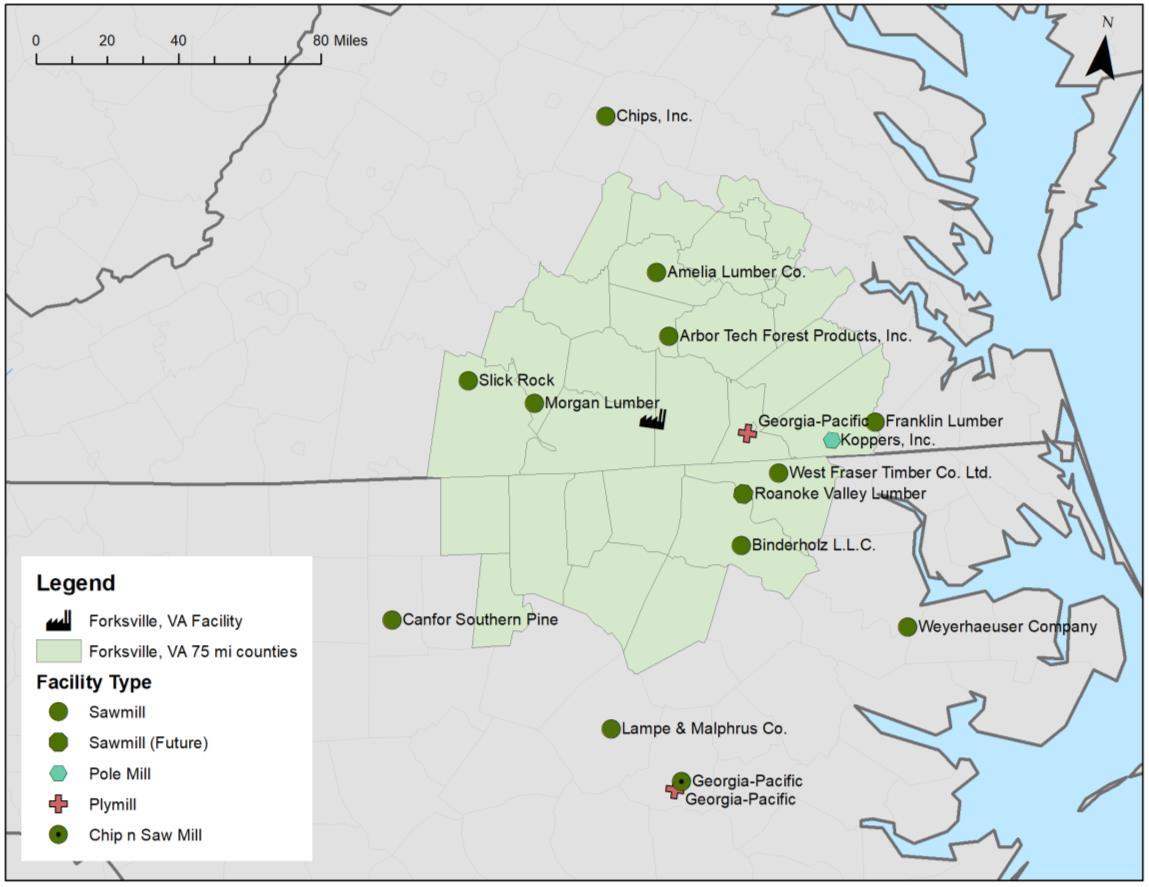

Sixteen (16) manufacturing competitors purchase pine sawtimber from the supply basin, including 12 sawmill facilities, 2 plymill/veneer facilities, 1 chip-n-saw mill, and 1 pole mill facility.
Two of the sawmill facilities are just entering the market and will increase demand for pine sawtimber from historic levels. Binderholz restarted operations in 1H2022, and Roanoke Valley Lumber will be fully operational in 2025.
Combined, the sixteen facilities have the capacity to consume 3.4 million tons of pine sawtimber annually from the Forksville basin.
© 2022 Forest2Market • forest2market.com
10
Residual Chip Consumers Map
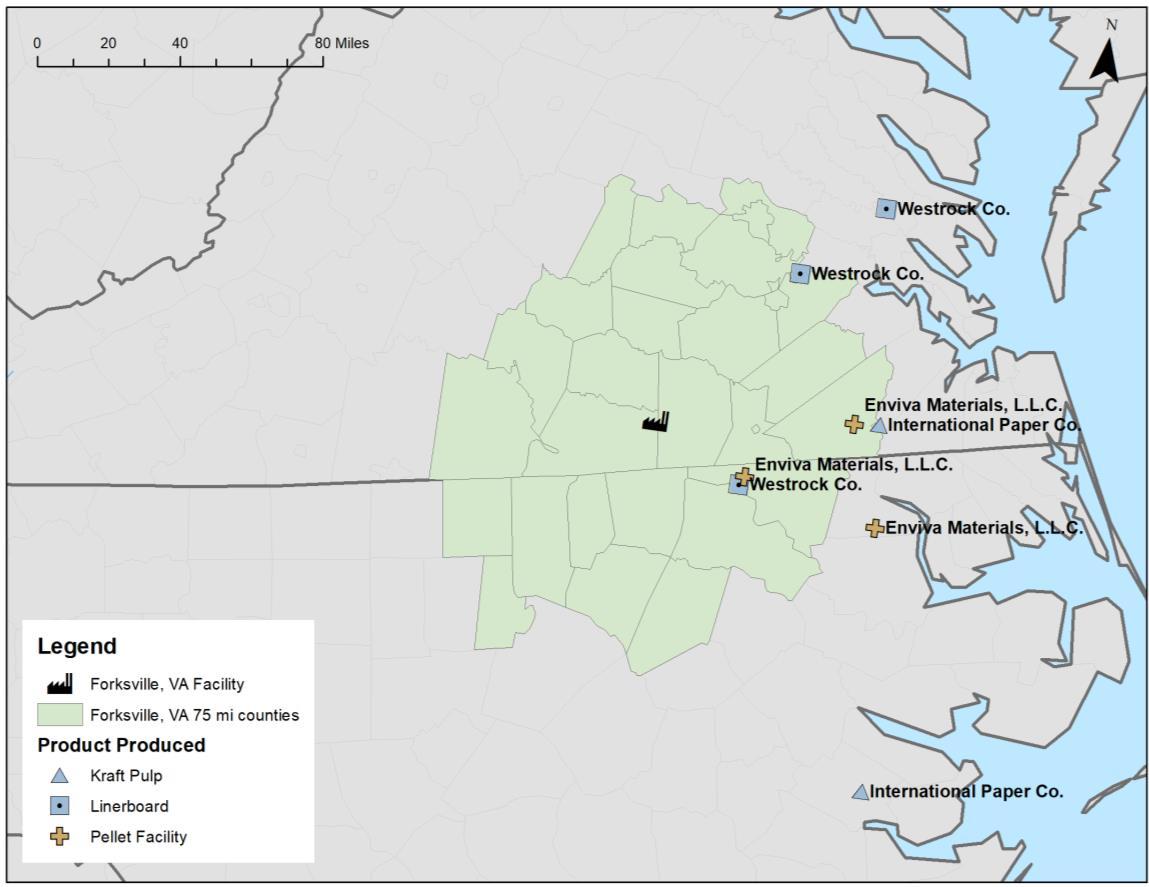
Eight (8) manufacturing facilities purchase pine sawmill residual chips from the market in the supply basin, including 5 pulp/paper facilities and 3 wood pellet facilities.
These facilities have the combined capacity to consume 0.5 million tons of pine residual chips annually.

© 2022 Forest2Market • forest2market.com
11
Pine Sawtimber Demand Projections
Historically, pine sawtimber demand has averaged 1.7 million tons annually.
A significant increase to 3.4 million tons will occur between 2022 and 2025 as Binderholz and Roanoke Valley Lumber enter the market.
In Scenario 1, pine sawtimber demand will increase to 5.0 million tons by 2028 as the VDOF mill enters the market. Between 2028 and 2041, demand will fluctuate with macroeconomic factors and end the forecast period at 4.8 million tons of demand.
Scenario 2 mirrors Scenario 1 with an additional 0.4 million tons of demand; pine sawtimber demand reaches 5.4 million tons in 2028. This scenario will end the forecast with 5.1 million tons of pine sawtimber demand in 2041.

© 2022 Forest2Market • forest2market.com
12 0.0 1.0 2.0 3.0 4.0 5.0 6.0 2007 2009 2011 2013 2015 2017 2019 2021 2023 2025 2027 2029 2031 2033 2035 2037 2039 2041 Demand (mm tons) Pine Sawtimber Demand Projections
1 Scenario 2 1.0 2.0 3.0 4.0 5.0 6.0 2007 2009 2011 2013 2015 2017 2019 2021 2023 2025 2027 2029 2031 2033 2035 2037 2039 2041 Demand (mm tons) Pine Sawtimber Demand Projections History
1 Scenario 2
History Scenario
Scenario
Pine Sawtimber Price Projections
Delivered pine sawtimber prices are comprised of stumpage, handling, and freight.
In Scenario 1, delivered pine sawtimber price will increase $15.11 per ton from 2021 prices in response to the three new sawmills by 2028. After 2028, pine sawtimber price will decrease approximately $0.40 per ton annually, ending $9.86 per ton higher than 2021 prices.
In Scenario 2, delivered pine sawtimber price will increase $24.34 per ton from 2021 prices by 2028 as the additional demand stresses pine sawtimber supply. From 2029 through 2041, pine sawtimber price will decrease $0.72 per ton annually, ending $15.00 per ton higher than 2021 prices.
*Delivered prices along the y-axis are intentionally not displayed due to confidentiality purposes. Please consult with Forest2Market for information.

© 2022 Forest2Market • forest2market.com
13
2007 2009 2011 2013 2015 2017 2019 2021 2023 2025 2027 2029 2031 2033 2035 2037 2039 2041 Delivered Price ($ per ton)
PineSawtimber PriceProjections
Historical Scenario1 Scenario2
Residual Chip Price Projections

Residual chip prices are displayed as free on board (FOB) sawmill prices.
In Scenario 1, residual chip prices will decrease $8.67 per ton from 2021 in response to increased supply from the new sawmills by 2026. After 2026, residual chip prices will increase approximately $0.20 per ton annually, ending $5.61 per ton lower than 2021 prices.
In Scenario 2, residual chip prices will decrease $6.36 per ton from 2021 prices by 2026 as additional supply from the sawmills becomes available. From 2026 through 2041, residual chip prices will increase $0.20 per ton annually, ending $6.36 per ton lower than 2021 prices.
Historical Scenario 1 Scenario 2
© 2022 Forest2Market • forest2market.com
14 Delivered prices along the y-axis are intentionally not displayed due to confidentiality purposes. Please consult with Forest2Market for information. 2007 2009 2011 2013 2015 2017 2019 2021 2023 2025 2027 2029 2031 2033 2035 2037 2039 2041 FOB Sawmill Price ($ per ton)
Residual Chip Price Projections
Pine Sawtimber Sustainability
• Current pine sawtimber inventory in the Forksville basin is 64.0 million tons. Across the 20-year forecast period, inventory will increase in both demand scenarios. In 2041, pine sawtimber inventory will reach 96.8 million tons in Scenario 1 and 89.1 million tons in Scenario 2.
• Growth-to-removal ratio (GRR) is used to quantify forest sustainably in a region by reflecting the balance of tree growth to removals. A value greater than 1.0 indicates greater sustainability while a value below 1.0 indicates a less sustainable forest.
• The current GRR is 1.72, which will decline to 1.36 in 2029 before remaining relatively flat throughout the remainder of Scenario 1 to end at 1.30. In Scenario 2, GRR will initially decline to 1.26 in 2029 before dipping slightly to 1.20 in 2036 and 2037, then it rebounds at the end of the forecast period to 1.25.

© 2022 Forest2Market • forest2market.com
15 64.0 96.8 89.1 50 60 70 80 90 100 2021 2022 2023 2024 2025 2026 2027 2028 2029 2030 2031 2032 2033 2034 2035 2036 2037 2038 2039 2040 2041 Timberland Inventory (million tons) PineSawtimber
Scenario1 Scenario2 1.36 1.30 1.72 1.26 1.25 0.80 1.00 1.20 1.40 1.60 1.80 2021 2022 2023 2024 2025 2026 2027 2028 2029 2030 2031 2032 2033 2034 2035 2036 2037 2038 2039 2040 2041 GrowthtoRemoval Ratio (5year Rolling Average) Pine
Scenario1 Scenario2
InventoryProjections
SawtimberGrowth-to-RemovalRatioProjections
Forksville Summary

The Forksville basin is an attractive location for a new sawmill in both scenarios. There are 2.2 million acres of pine timberland which contain 132.1 million tons of pine pulpwood and 64.0 million tons of pine sawtimber inventory. For the two forecast scenarios:
o Pine sawtimber demand will increase to 5.0 million tons by 2028 in Scenario 1. Demand will increase to 5.4 million tons by 2028 in Scenario 2.
o Delivered pine sawtimber prices will peak at $15.11 per ton above 2021 prices in Scenario 1 and $24.34 per ton above 2021 prices in Scenario 2. Residual chip prices will bottom at $8.67 per ton lower than 2021 prices in Scenario 1, and $6.36 per ton lower than 2021 prices in Scenario 2.
o Pine sawtimber GRR is currently 1.72 and will decrease to 1.30 in Scenario 1, and 1.25 in Scenario 2. Pine sawtimber inventory will increase from 64.0 million tons to 96.8 million tons in Scenario 1, and 89.1 million tons in Scenario 2.
© 2022 Forest2Market • forest2market.com
16
Jarrat Supply Basin

Jarrat Supply Basin Profile

Jarrat, VA is approximately 55 miles south of Richmond.
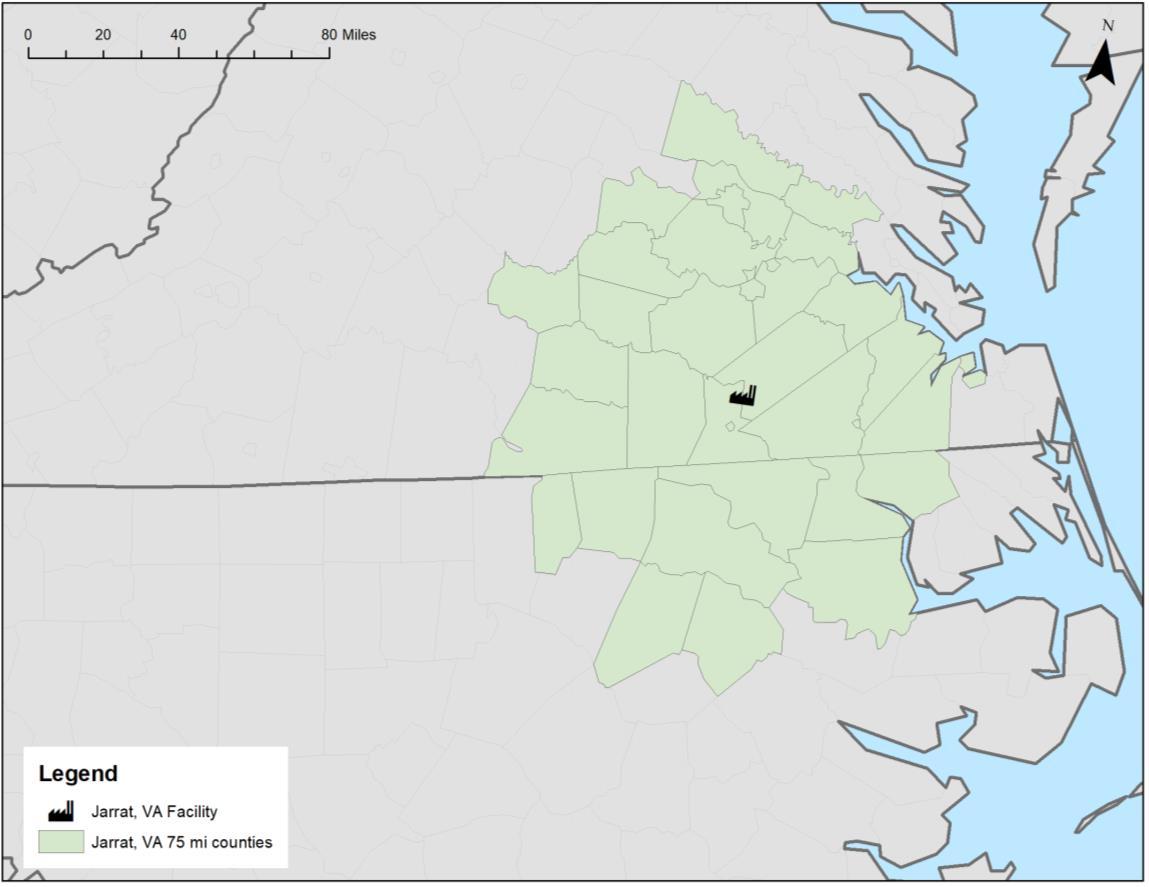
The surrounding supply basin is comprised of 7.4 million total acres, of which 5.3 million acres (72%) are timberland.
Private timberland ownership is near exclusive at 5.0 million acres. NonIndustrial Private Forestland (NIPF) owners manage 3.4 million acres, and corporate owners manage an additional 1.6 million acres within the region.
© 2022 Forest2Market • forest2market.com
18
Private Pine Forests
A total of 2.3 million pine acres are managed between corporate and NIPF owners. A significant percentage of the acres are in the 15 to 24-year age classes indicating a near to midterm supply of pine sawtimber. Longer term, young acres in 0 to 14-year age classes will age to pine sawtimber.
Standing pine inventory is at 196.9 million tons; 139.5 million tons are planted pine and 57.4 million tons are natural pine.
Corporate owners manage 47.6 million tons (65%) of their pine inventory as pine pulpwood and 25.5 million tons (35%) as pine sawtimber. NIPF owners manage 82.8 million tons (67%) as pine pulpwood and 41.0 million tons (33%) as pine sawtimber.

© 2022 Forest2Market • forest2market.com
19 0 50 100 150 200 250 0-4 5-9 10-14 15-19 20-24 25-29 30-34 35-39 40-44 45-49 50+ Pine Acres (thousands) Total PineAcres = 2.3 million Corporate Non-Corporate (NIPF) 47.6 65% 25.5 35% Corporate
82.8 67% 41.0 33% NIPF
Pine Inventory Pine Pulpwood
Pine Sawtimber
Pine Inventory
Pine Pulpwood Pine Sawtimber
Sawtimber Consumers Map
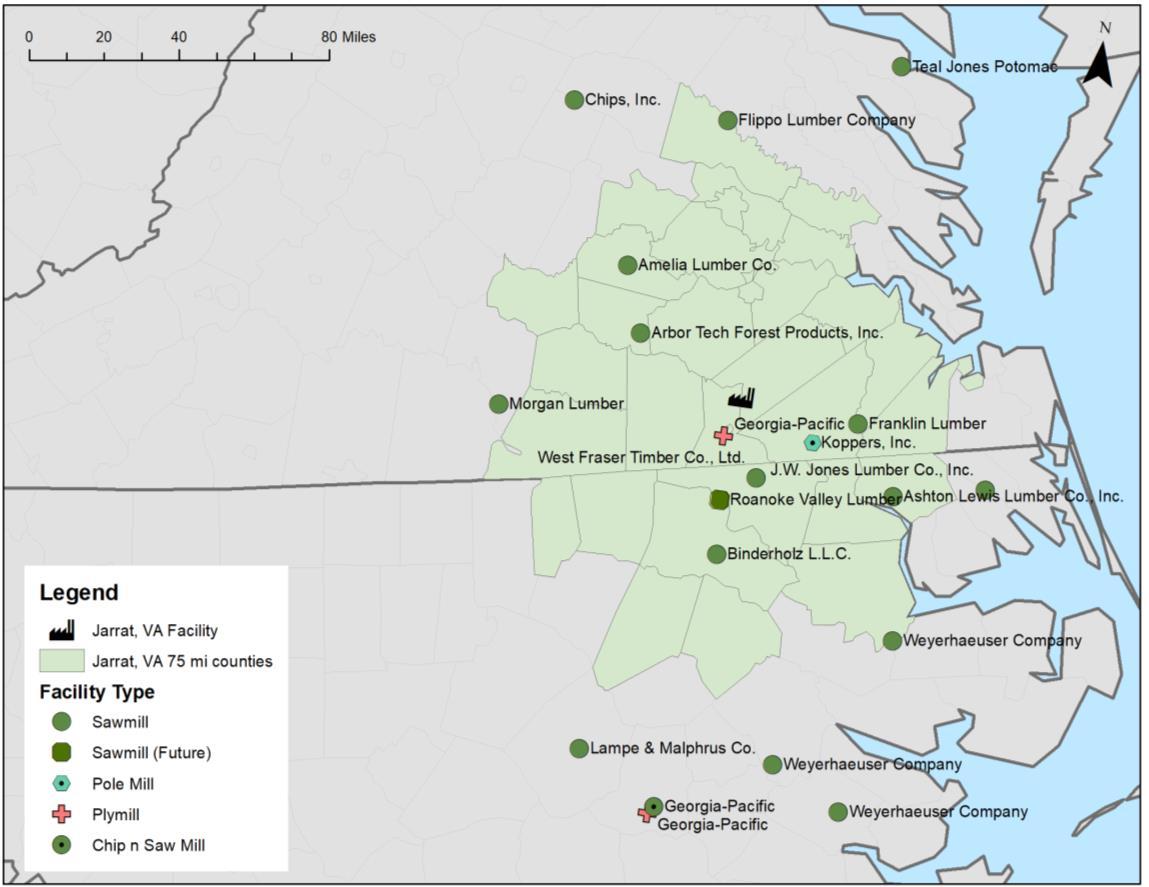

Twenty (20) manufacturing competitors purchase pine sawtimber from the market, including 16 sawmill facilities, 2 plymill/veneer facilities, 1 chip-n-saw mill, and 1 pole mill facility.
Two of the sawmill facilities are just entering the market and increasing demand for pine sawtimber. Binderholz restarted operations in 1H2022, and Roanoke Valley Lumber will be fully operational in 2025.
Combined, the 20 facilities have the capacity to consume 3.5 million tons of pine sawtimber annually from the Jarrat basin.
© 2022 Forest2Market • forest2market.com
20
Residual Chip Consumers Map
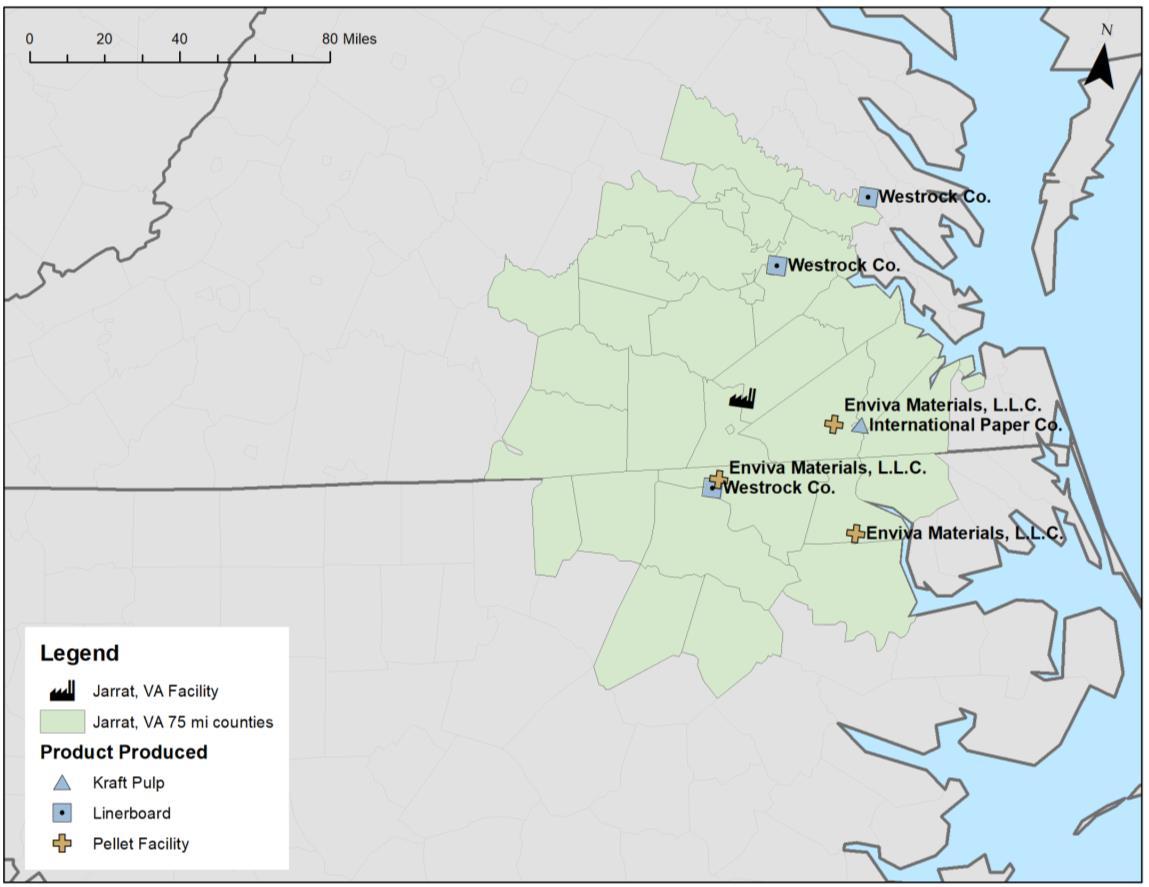
Seven (7) manufacturing facilities purchase pine sawmill residual chips from the supply basin, including 4 pulp/paper facilities and 3 wood pellet facilities.
These facilities have the combined capacity to consume 0.6 million tons of pine residual chips annually.

© 2022 Forest2Market • forest2market.com
21
Pine Sawtimber Demand Projections
Historically, pine sawtimber demand has averaged 2.1 million tons annually.
A significant increase in demand to 3.5 million tons will occur between 2022 and 2025 as Binderholz and Roanoke Valley Lumber enter the market.
In Scenario 1, pine sawtimber demand will increase to 5.9 million tons by 2028 as the VDOF mill enters the market. Between 2028 and 2041, pine sawtimber demand will fluctuate with macroeconomic factors and end the forecast period at 5.7 million tons of demand.
Scenario 2 mirrors Scenario 1 with an additional 0.4 million tons of demand; pine sawtimber demand will reach 6.3 million tons in 2028. This scenario will end the forecast with 6.1 million tons of pine sawtimber demand in 2041.

© 2022 Forest2Market • forest2market.com
22 1.0 2.0 3.0 4.0 5.0 6.0 7.0 2007 2009 2011 2013 2015 2017 2019 2021 2023 2025 2027 2029 2031 2033 2035 2037 2039 2041 Demand (mm tons)
Pine Sawtimber Demand Projections
History Scenario 1 Scenario 2
Pine Sawtimber Price Projections
Delivered pine sawtimber prices are comprised of stumpage, handling, and freight.
In Scenario 1, delivered pine sawtimber price will increase $17.97 per ton from 2021 prices in response to demand from three new sawmills by 2028. After peaking in 2028, pine sawtimber prices will decrease approximately $0.35 per ton annually, ending the forecast period $13.41 per ton higher than 2021 prices.
In Scenario 2, delivered pine sawtimber price will increase $32.70 per ton from 2021 prices by 2028 as the additional demand stresses pine sawtimber supply. From 2029 through 2041, pine sawtimber prices will decrease $0.67 per ton annually, ending the forecast period $24.01 per ton higher than 2021 prices.
*Delivered prices along the y-axis are intentionally not displayed due to confidentiality purposes. Please consult with Forest2Market for information.

© 2022 Forest2Market • forest2market.com
23
2007 2009 2011 2013 2015 2017 2019 2021 2023 2025 2027 2029 2031 2033 2035 2037 2039 2041 Delivered Price ($ per ton)
PineSawtimber PriceProjections
Historical Scenario1 Scenario2
Residual Chip Price Projections

Residual chip prices are displayed as free on board (FOB) sawmill prices.
In Scenario 1, residual chip prices will decrease $7.45 per ton from 2021 prices in response to increased supply from the new sawmills by 2026. In 2034, residual chip prices will decrease $8.75 per ton lower than 2021 prices. From 2035 to 2041, residual chip prices will increase approximately $0.44 per ton annually, ending the forecast period $5.69 per ton lower than 2021 prices.
In Scenario 2, residual chip prices will decrease $8.25 per ton from 2021 prices by 2026. In 2034, residual chip prices will decrease $9.54 per ton lower than 2021 prices. From 2034 to 2041, residual chip prices will increase $0.43 per ton annually, ending the forecast period $6.53 per ton lower than 2021 prices.
Historical Scenario 1 Scenario 2
© 2022 Forest2Market • forest2market.com
24
2007 2009 2011 2013 2015 2017 2019 2021 2023 2025 2027 2029 2031 2033 2035 2037 2039 2041 FOB Sawmill Pirce ($ per ton)
Delivered prices along the y-axis are intentionally not displayed due to confidentiality purposes. Please consult with Forest2Market for information.
Residual Chip Price Projections
Pine Sawtimber Sustainability
Current pine sawtimber inventory is 66.5 million tons. Inventory will increase in both demand scenarios. In 2041, pine sawtimber inventory will reach 92.8 million tons in Scenario 1 and 87.4 million tons in Scenario 2.
The current GRR is 1.81 and will decline to 1.26 in 2029 before slowly tapering throughout the remainder of Scenario 1 to end at 1.15. In Scenario 2, GRR will initially decline to 1.20 in 2029 before slowly tapering to 1.09 at the end of the forecast period.

© 2022 Forest2Market • forest2market.com
25 1.26 1.15 1.81 1.20 1.09 0.80 1.00 1.20 1.40 1.60 1.80 2.00 2021 2022 2023 2024 2025 2026 2027 2028 2029 2030 2031 2032 2033 2034 2035 2036 2037 2038 2039 2040 2041 GrowthtoRemoval Ratio (5year Rolling Average) Pine
Scenario1 Scenario2 66.5 92.8 87.4 60 65 70 75 80 85 90 95 100 2021 2022 2023 2024 2025 2026 2027 2028 2029 2030 2031 2032 2033 2034 2035 2036 2037 2038 2039 2040 2041 Timberland Inventory (million tons) PineSawtimberInventoryProjections Scenario1 Scenario2
SawtimberGrowth-to-RemovalRatioProjections
Jarrat Summary

The Jarrat basin is an attractive location for a new sawmill. There are 2.3 million acres of pine timberland which contain 130.4 million tons of pine pulpwood and 66.5 million tons of pine sawtimber inventory. For the two sawmill forecast scenarios:
o Pine sawtimber demand will increase to 5.9 million tons by 2028 in Scenario 1. Demand will increase to 6.3 million tons by 2028 in Scenario 2.
o Delivered pine sawtimber prices will peak at $17.97 per ton above 2021 prices in Scenario 1 and $32.70 per ton above 2021 prices in Scenario 2. Residual chip prices will bottom at $8.75 per ton lower than 2021 prices in Scenario 1, and $9.54 per ton lower than 2021 prices in Scenario 2.
o Pine sawtimber GRR is currently 1.81 and will decrease to 1.15 in Scenario 1 and 1.09 in Scenario 2. Pine sawtimber inventory will increase from 66.5 million tons to 92.8 million tons in Scenario 1, and 87.4 million tons in Scenario 2.
© 2022 Forest2Market • forest2market.com
26
Vernon Hill Supply Basin

Vernon Hill Supply Basin Profile
Vernon Hill, VA is approximately 60 miles south of Lynchburg.
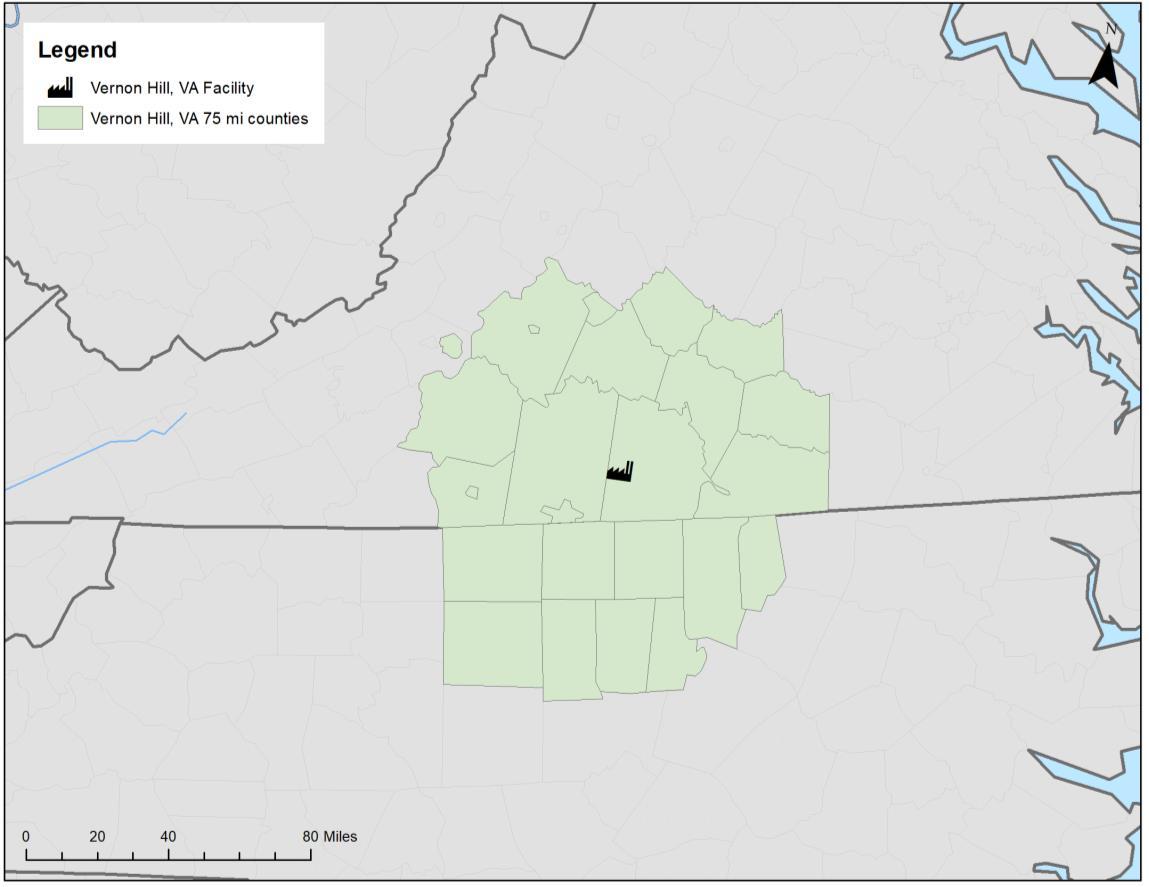

The surrounding supply basin is comprised of 6.6 million total acres, of which 4.2 million acres (64%) are timberland.
Private timberland ownership is 3.9 million acres. Non-Industrial Private Forestland (NIPF) owners manage 3.2 million acres, and corporate owners manage 0.7 million acres within the region.
© 2022 Forest2Market • forest2market.com
28
Private Pine Forests

A total of 1.3 million pine acres are managed between corporate and NIPF owners in the Vernon Hill basin. A significant percentage of the acres are in the 10 to 24-year age classes indicating a near to mid-term supply of pine sawtimber.
Standing pine inventory is at 103.7 million tons; 59.8 million tons are planted pine and 43.9 million tons are natural pine.
Corporate owners manage 17.9 million tons (62%) of their pine inventory as pine pulpwood and 10.8 million tons (38%) as pine sawtimber. NIPF owners manage 52.4 million tons (63%) as pine pulpwood and 30.1 million tons (37%) as pine sawtimber.
© 2022 Forest2Market • forest2market.com
29 0 20 40 60 80 100 120 140 160 0-4 5-9 10-14 15-19 20-24 25-29 30-34 35-39 40-44 45-49 50+ Pine Acres (thousands) Age Class Total PineAcres = 1.3 million Corporate Non-Corporate (NIPF) 52.4 63% 30.1 37% NIPF Pine Inventory Pine Pulpwood
17.9 63% 10.7 37% Corporate Pine Inventory
Pine Sawtimber
Pine Pulpwood Pine Sawtimber
Sawtimber Consumers Map
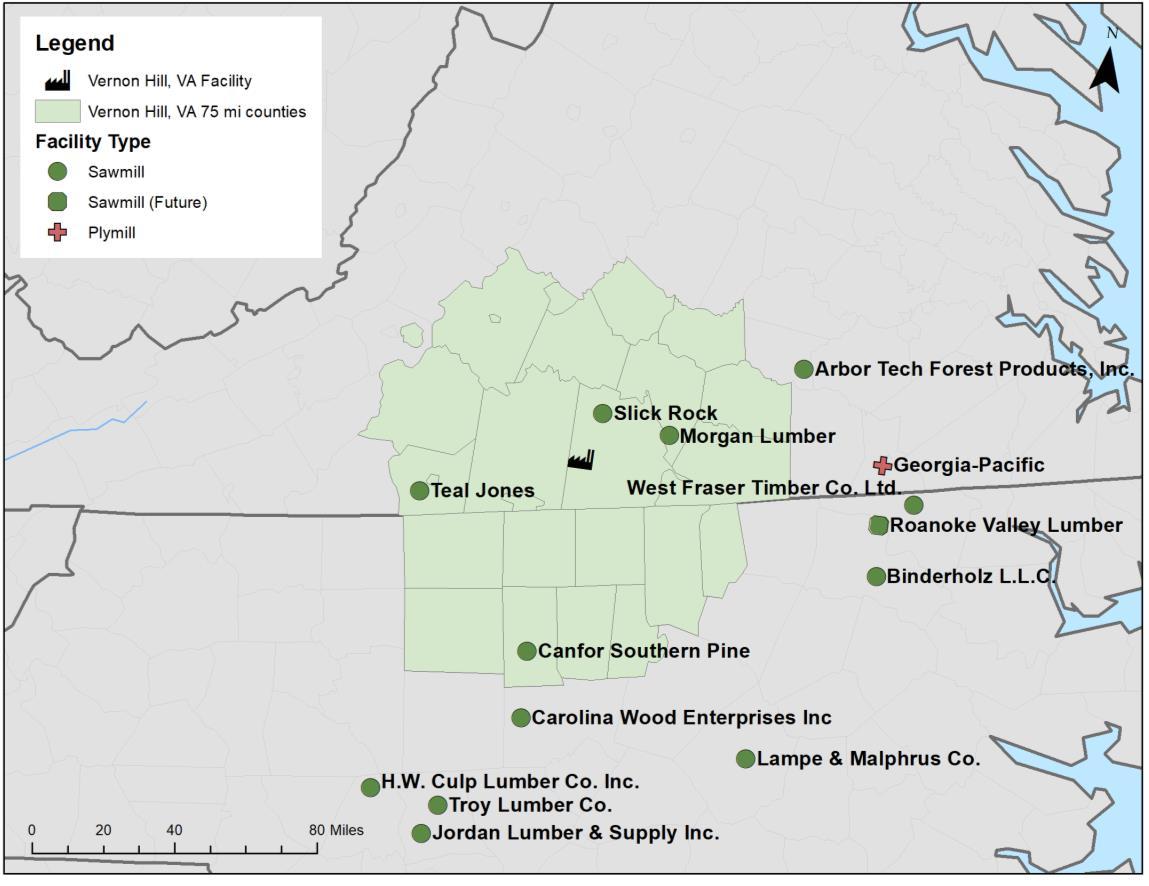

Fourteen (14) manufacturing competitors purchase pine sawtimber from the supply basin, including 13 sawmill facilities and 1 plymill.
Two of the sawmill facilities are just entering the market and increasing demand for pine sawtimber. Binderholz restarted operations in 1H2022, and Roanoke Valley Lumber will be fully operational in 2025. The combined impact of these sawmills will be less significant in this market compared to the previous markets.
Combined, the 13 operating facilities have the capacity to consume 1.5 million tons of pine sawtimber annually from the Vernon Hill basin.
© 2022 Forest2Market • forest2market.com
30
Residual Chip Consumers Map
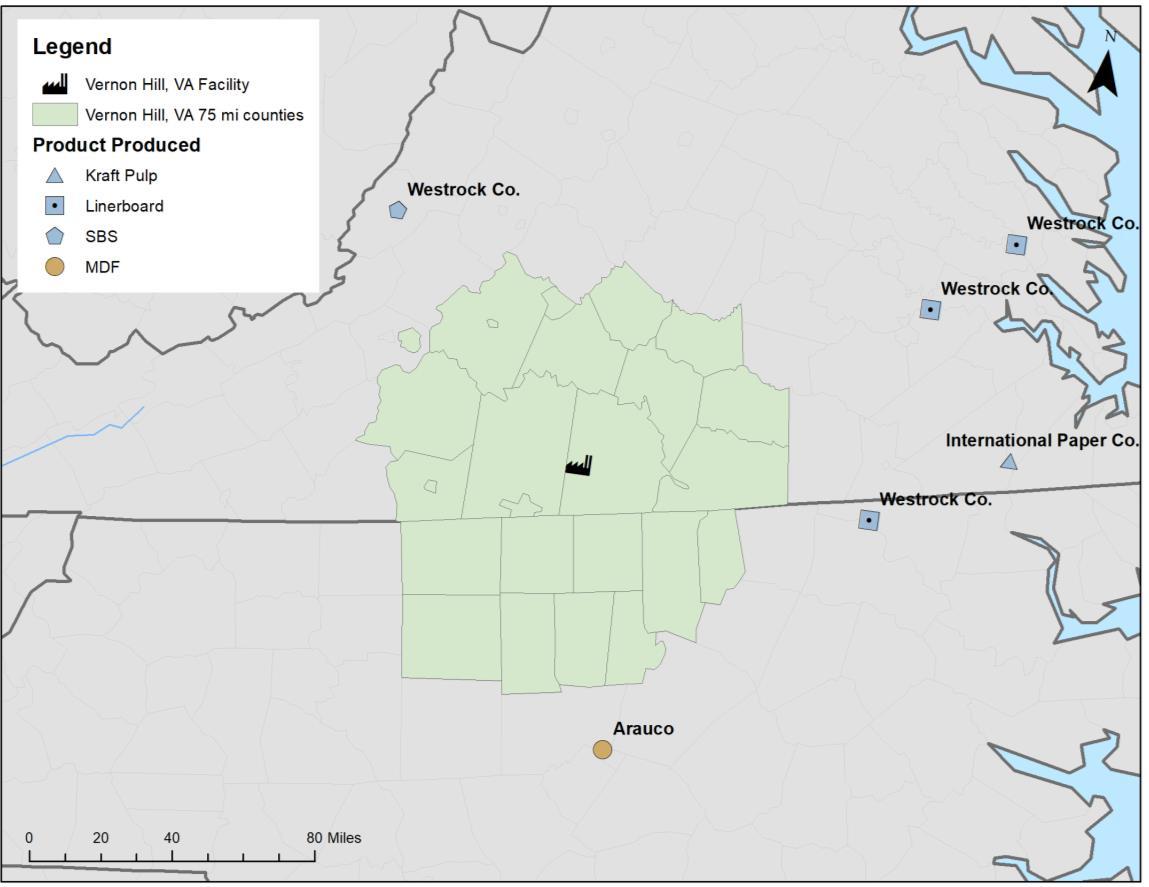
Six (6) manufacturing facilities purchase pine sawmill residual chips from the market, including 5 pulp/paper facilities and 1 medium density fiberboard mill. These facilities have the combined capacity to consume 0.4 million tons of pine residual chips annually.

© 2022 Forest2Market • forest2market.com
31
Pine Sawtimber Demand Projections
Historically, pine sawtimber demand has averaged 0.7 million tons annually.
A slight increase in pine sawtimber demand to 1.5 million tons will occur as Binderholz and Roanoke Valley Lumber enter adjacent markets.
In Scenario 1, pine sawtimber demand will increase to 2.6 million tons by 2026. Between 2026 and 2041, pine sawtimber demand will fluctuate with macroeconomic factors ending the forecast period at 2.6 million tons of demand.
Scenario 2 mirrors Scenario 1 with an additional 0.4 million tons of demand, reaching 3.0 million tons of demand in 2026. This scenario will end the forecast with 3.0 million tons of pine sawtimber demand in 2041.

© 2022 Forest2Market • forest2market.com
32 0.0 0.5 1.0 1.5 2.0 2.5 3.0 3.5 2007 2009 2011 2013 2015 2017 2019 2021 2023 2025 2027 2029 2031 2033 2035 2037 2039 2041 Demand (mm tons)
Pine Sawtimber Demand Projections History Scenario 1 Scenario 2
Pine Sawtimber Price Projections

Delivered pine sawtimber prices are comprised of stumpage, handling, and freight.
In Scenario 1, delivered pine sawtimber price will increase $20.80 per ton from 2021 prices in response to demand from three new sawmills by 2027. After 2027, pine sawtimber price will decrease approximately $0.57 per ton annually, ending the forecast period $12.85 per ton higher than 2021 prices.
In Scenario 2, delivered pine sawtimber price will increase $28.42 per ton from 2021 prices by 2027 as the additional demand stresses pine sawtimber supply. From 2027 through 2041, pine sawtimber price will decrease $0.74 per ton annually, ending the forecast period $18.10 per ton higher than 2021 prices.
© 2022 Forest2Market • forest2market.com
33
2007 2009 2011 2013 2015 2017 2019 2021 2023 2025 2027 2029 2031 2033 2035 2037 2039 2041 Delivered Price ($ per ton)
Delivered prices along the y-axis are intentionally not displayed due to confidentiality purposes. Please consult with Forest2Market for information.
PineSawtimber PriceProjections
Historical Scenario1 Scenario2
Residual Chip Price Projections

Residual chip prices are displayed as free on board (FOB) sawmill prices.
In Scenario 1, residual chip prices will decrease $5.73 per ton from 2021 prices in response to increased supply from the new sawmills by 2026. After 2026, residual chip prices will increase approximately $0.21 per ton annually, ending the forecast period $2.62 per ton lower than 2021 prices.
In Scenario 2, residual chip prices will decrease $5.63 per ton from 2021 prices by 2026. From 2026 through 2041, residual chip prices will increase $0.21 per ton annually, ending the forecast period $2.47 per ton lower than 2021 prices.
Historical Scenario 1 Scenario 2
© 2022 Forest2Market • forest2market.com
34 Delivered prices along the y-axis are intentionally not displayed due to confidentiality purposes. Please consult with Forest2Market for information. 2007 2009 2011 2013 2015 2017 2019 2021 2023 2025 2027 2029 2031 2033 2035 2037 2039 2041 FOB Sawmill Price ($ per ton)
Residual Chip Price Projections
Pine Sawtimber Sustainability
Current pine sawtimber inventory is 40.8 million tons. Across the 20-year forecast period, inventory will increase in both demand scenarios. In 2041, pine sawtimber inventory will reach 69.9 million tons in Scenario 1 and 68.1 million tons in Scenario 2.
The current GRR is 1.96 and will slowly decline to 1.64 in 2033 before an increasing rate of decrease through 2041. For Scenario 1, pine sawtimber GRR will drop to 1.25 by 2041. In Scenario 2, GRR will initially decline to 1.60 in 2033. From 2034 through 2041, the rate of decline will increase, and the forecast period will end with a GRR of 1.20.

© 2022 Forest2Market • forest2market.com
35 40.8 69.9 68.1 30 40 50 60 70 80 2021 2022 2023 2024 2025 2026 2027 2028 2029 2030 2031 2032 2033 2034 2035 2036 2037 2038 2039 2040 2041 Timberland Inventory (million tons) PineSawtimber
Scenario1 Scenario2 1.64 1.25 1.95 1.60 1.20 0.80 1.00 1.20 1.40 1.60 1.80 2.00 2021 2022 2023 2024 2025 2026 2027 2028 2029 2030 2031 2032 2033 2034 2035 2036 2037 2038 2039 2040 2041 GrowthtoRemoval Ratio (5year Rolling Average)
Scenario1 Scenario2
InventoryProjections
Pine
SawtimberGrowth-to-RemovalsRatioProjections
Vernon Hill Summary

The Vernon Hill basin is an attractive location for a new sawmill.
There are 1.3 million acres of pine timberland which contain 70.3 million tons of pine pulpwood and 40.8 million tons of pine sawtimber inventory. For the two sawmill forecast scenarios:
o Pine sawtimber demand will increase to 2.6 million tons by 2026 in Scenario 1. Demand will increase to 3.0 million tons by 2028 in Scenario 2.
o Delivered pine sawtimber prices will peak at $20.80 per ton above 2021 prices in Scenario 1 and $28.42 per ton above 2021 prices in Scenario 2. Residual chip prices will bottom at $5.73 per ton lower than 2021 prices in Scenario 1, and $5.63 per ton lower than 2021 prices in Scenario 2.
o Pine sawtimber GRR is currently 1.96 and will decrease to 1.25 in Scenario 1 and 1.20 in Scenario 2. Throughout the forecast period, pine sawtimber inventory will increase from 40.8 million tons to 69.9 million tons in Scenario 1 and 68.1 million tons in Scenario 2.
© 2022 Forest2Market • forest2market.com
36
Conclusion

Conclusion

All three of the basins can sustainably support a new state of the art, high-capacity sawmill. Throughout the 20-year forecast period, all basins will experience pine sawtimber inventory growth over 20 million tons and GRRs will remain above 1.05 across all demand scenarios.
The primary differences between the basins are the current level of pine inventory and the impacts from new demand (i.e., the supply and demand economics of the market). As a result, log cost and residual chip revenue becomes the deciding measurement in ranking the basins. In Scenario 1, Forksville has the lowest forecast average delivered log cost, followed by Jarrat and Vernon Hill. In Scenario 2, Vernon Hill has a lower forecast average delivered chip cost than Jarrat. In terms of highest residual chip revenue, Forksville has the highest residual chip revenue followed by Jarrat and Vernon Hill in both scenarios.
© 2022 Forest2Market • forest2market.com
38 Forksville
Average Pine Sawtimber Delivered Price Change $10.75 $13.43 $14.31 $17.24 $24.61 $19.75 Average Pine Residual Chip - FOB, Sawmill Price Change $6.36 $5.82 $4.25 $6.94 $6.53 $4.35 Inventory Change 32.8 26.3 29.1 25.1 20.9 27.3 Average GRR 1.37 1.29 1.61 1.30 1.21 1.48 Forecast - Key Measurement Scenario 1 - 300 MMBF Scenario 2 - 400 MMBF Price Sustainability
Jarrat Vernon Hill Forksville Jarrat Vernon Hill

Contact Us 15720 Brixham Hill Avenue Suite 550 Charlotte, NC 28277 Phone: +1.704.540.1440 Fax: +1.704.540.6301 forest2market.com


