
Santa Barbara Area Market Report
SANTA BARBARA AREA REAL ESTATE THROUGH MARCH 2024


Hello!
Welcome and thank you for reading our First Quarter 2024 Market Report. As is always the case, the market continues to evolve. We finally saw an uptick in Inventory (on a year-overbasis), however, our market continues to remain undersupplied as demand pushed our South County Median Price up another 8% to just under $1.7MM.
We hope you find this report helpful but every market is unique. If you have any questions, or would like more specific information about your neighborhood or property, please feel free to contact us. The entire team at Village is committed to serving you in 2024.
Best re gards,
Renee GrubbSOUTH SANTA BARBARA COUNTY
MARCH 2024 YTD
AVERAGE SALES PRICE • YTD
$3,369,358 +5% change from 2023
MEDIAN SALES PRICE • YTD
$2,200,000 +10% change from 2023


SOUTH SANTA BARBARA COUNTY MARCH 2024 YTD
AVERAGE SALES PRICE • YTD
$1,055,893 -11% change from 2023
MEDIAN SALES PRICE • YTD
$910,000 -8% change from 2023
In the First Quarter, there were 274 closings across the South County. This marks a notable milestone as it represents a 14% increase compared to Q1 2023, the first year-over-year increase since the pandemic ended. As we have noted how sales have decreased consistently since peak covid due to restricted inventory, we are finally seeing an uptick in sellers willing to place their properties on the market. As an example, as of March 15th, Available Inventory in Santa Barbara (proper) was 389 listings, up 71% from March 2023 while Montecito Inventory was up 50% YoY.
While Months of Supply still reflects a highly undersupplied market at just over 2 months, this represents some relief from what has been an extremely restricted market.
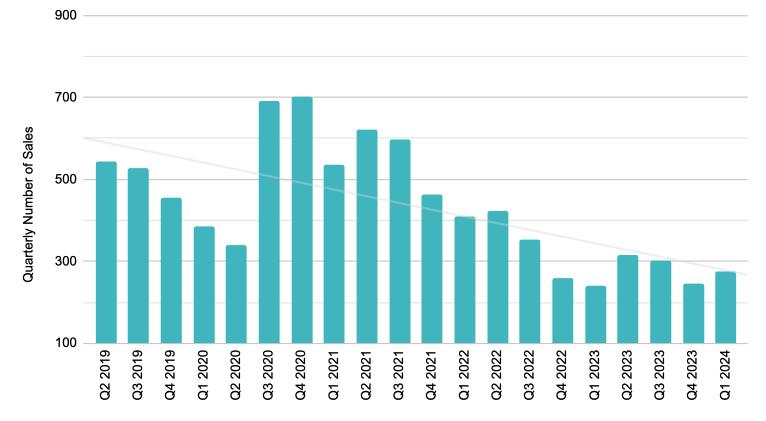
SOUTH SANTA BARBARA COUNTY · THROUGH MARCH 2024
As a result of our long-term undersupplied market, pricing has appreciated substantially over the past five years. While effectively flat from Q4, Median Price rose 8% in Q1 compared to Q1 2023, to just under $1.7MM. Notably, the increase in Median Price was driven by double digit gains in Montecito and Goleta offset by declines in Carp and Hope Ranch, with Santa Barbara proper remaining flat. Furthermore, sales in Montecito accounted for a higher percentage of sales, with 15% of all sales in the South County compared to 12% in Q1 2023.



$1,104,279
$1,104,279

$1,687,029
$1,289,588 TOTAL
$802,824
$800,000

Sales activity in Carp was down 4% from Q1 2023, with 23 closed. Median Price ($886,000), was down 18% over the same time period as there were only six sales over $1MM. Interestingly, five properties were sold off-market. The most notable sale in Carp this Quarter was 8109 Puesta Del Sol for $4MM.


Summerland only had one sale this Quarter (2561 Golden Gate Ave for $3.7MM), down from five in Q1 2023.


$3,700,000
$3,700,000


$6,557,083
$5,150,000

$7,195,776
$5,207,500
$3,100,000

The Montecito market demonstrated notable demand in Q1. There were 41 closed sales, up from 29 in Q1 2023 (+41%).
Median Price in Q1 was just under $5.2MM, up 14% from Q1 2023. There were six sales over $14MM and three over $25MM in the Quarter, the most notable being 777 Romero Canyon ($25.1MM), 319 San Ysidro Rd ($32MM), and 875/888 Park Ln ($36.8MM).


There were 124 closed sales in Q1, a 17% increase from Q1 2023. The Median Price of $1.73MM, remained steady from one year ago. With 9 closings over $4MM in the Quarter, the most notable sales were 2700 Holly Rd for $5.6MM and 3139 Cliff Drive for $8.75MM.


$2,159,272
$1,800,000

$2,693,885
$2,100,000 TOTAL
$1,130,872
$1,010,000


$6,162,900
$6,618,000

In Hope Ranch, there were three sales in the Quarter, down from seven in Q1 2023. Median Price was down 7% to $6.1MM, but is skewed due to the limited number of transactions.
The three sales were 4157 Lago Dr ($4.4MM), 710 Monte Dr ($6.6MM), and 4161 Creciente Dr ($7.5MM)


Goleta also experienced a marked change in activity. There were 82 sales in Q1, up 17%. At just under $1.4MM, Median Price also increased by double digits (12%). Notably, there were 16 sales over $2MM (20%), highlighted by the sale of 4720 Boulder Ridge Rd ($3.6MM).


$1,623,859
$1,525,000

$1,790,403 MEDIAN SALES PRICE
$1,595,000 TOTAL
$987,816
$900,000

SANTA YNEZ VALLEY
MARCH 2024 YTD
SANTA YNEZ VALLEY
MARCH 2024 YTD
AVERAGE SALES PRICE
YTD
$2,387,173 +26.5% change from 2023
MEDIAN SALES PRICE
YTD
$1,537,500 +11.8% change from 2023


AVERAGE SALES PRICE • YTD
$738,950 +26% change from 2023
MEDIAN SALES PRICE • YTD
$682,500 +12% change from 2023


TOTAL
$1,297,200 MEDIAN
$1,130,000
Solvang and Ballard

$1,728,750
TOTAL
3
$1,555,500
TOTAL
$723,500
MEDIAN
$644,500


TOTAL SALES · YEAR TO DATE
9
AVERAGE SALES PRICE · YTD
$3,825,889
MEDIAN SALES PRICE · YTD
$1,560,000

TOTAL SALES · YEAR TO DATE
2
AVERAGE SALES PRICE · YTD
$2,010,000
MEDIAN SALES PRICE · YTD
$2,010,000


“Our global partners ensure your home is seen by interested buyers across the world.”
RENEÉ GRUBB
Founder & CEO
We are fortunate to be in a place that people all over the world desire to be. We cultivate strategic global relationships that ultimately benefit you by putting your home in front of those people.