4 minute read
1.2 Crude oil: Historical developments
32 CHAPTER 1 COMMODITY MARKETS
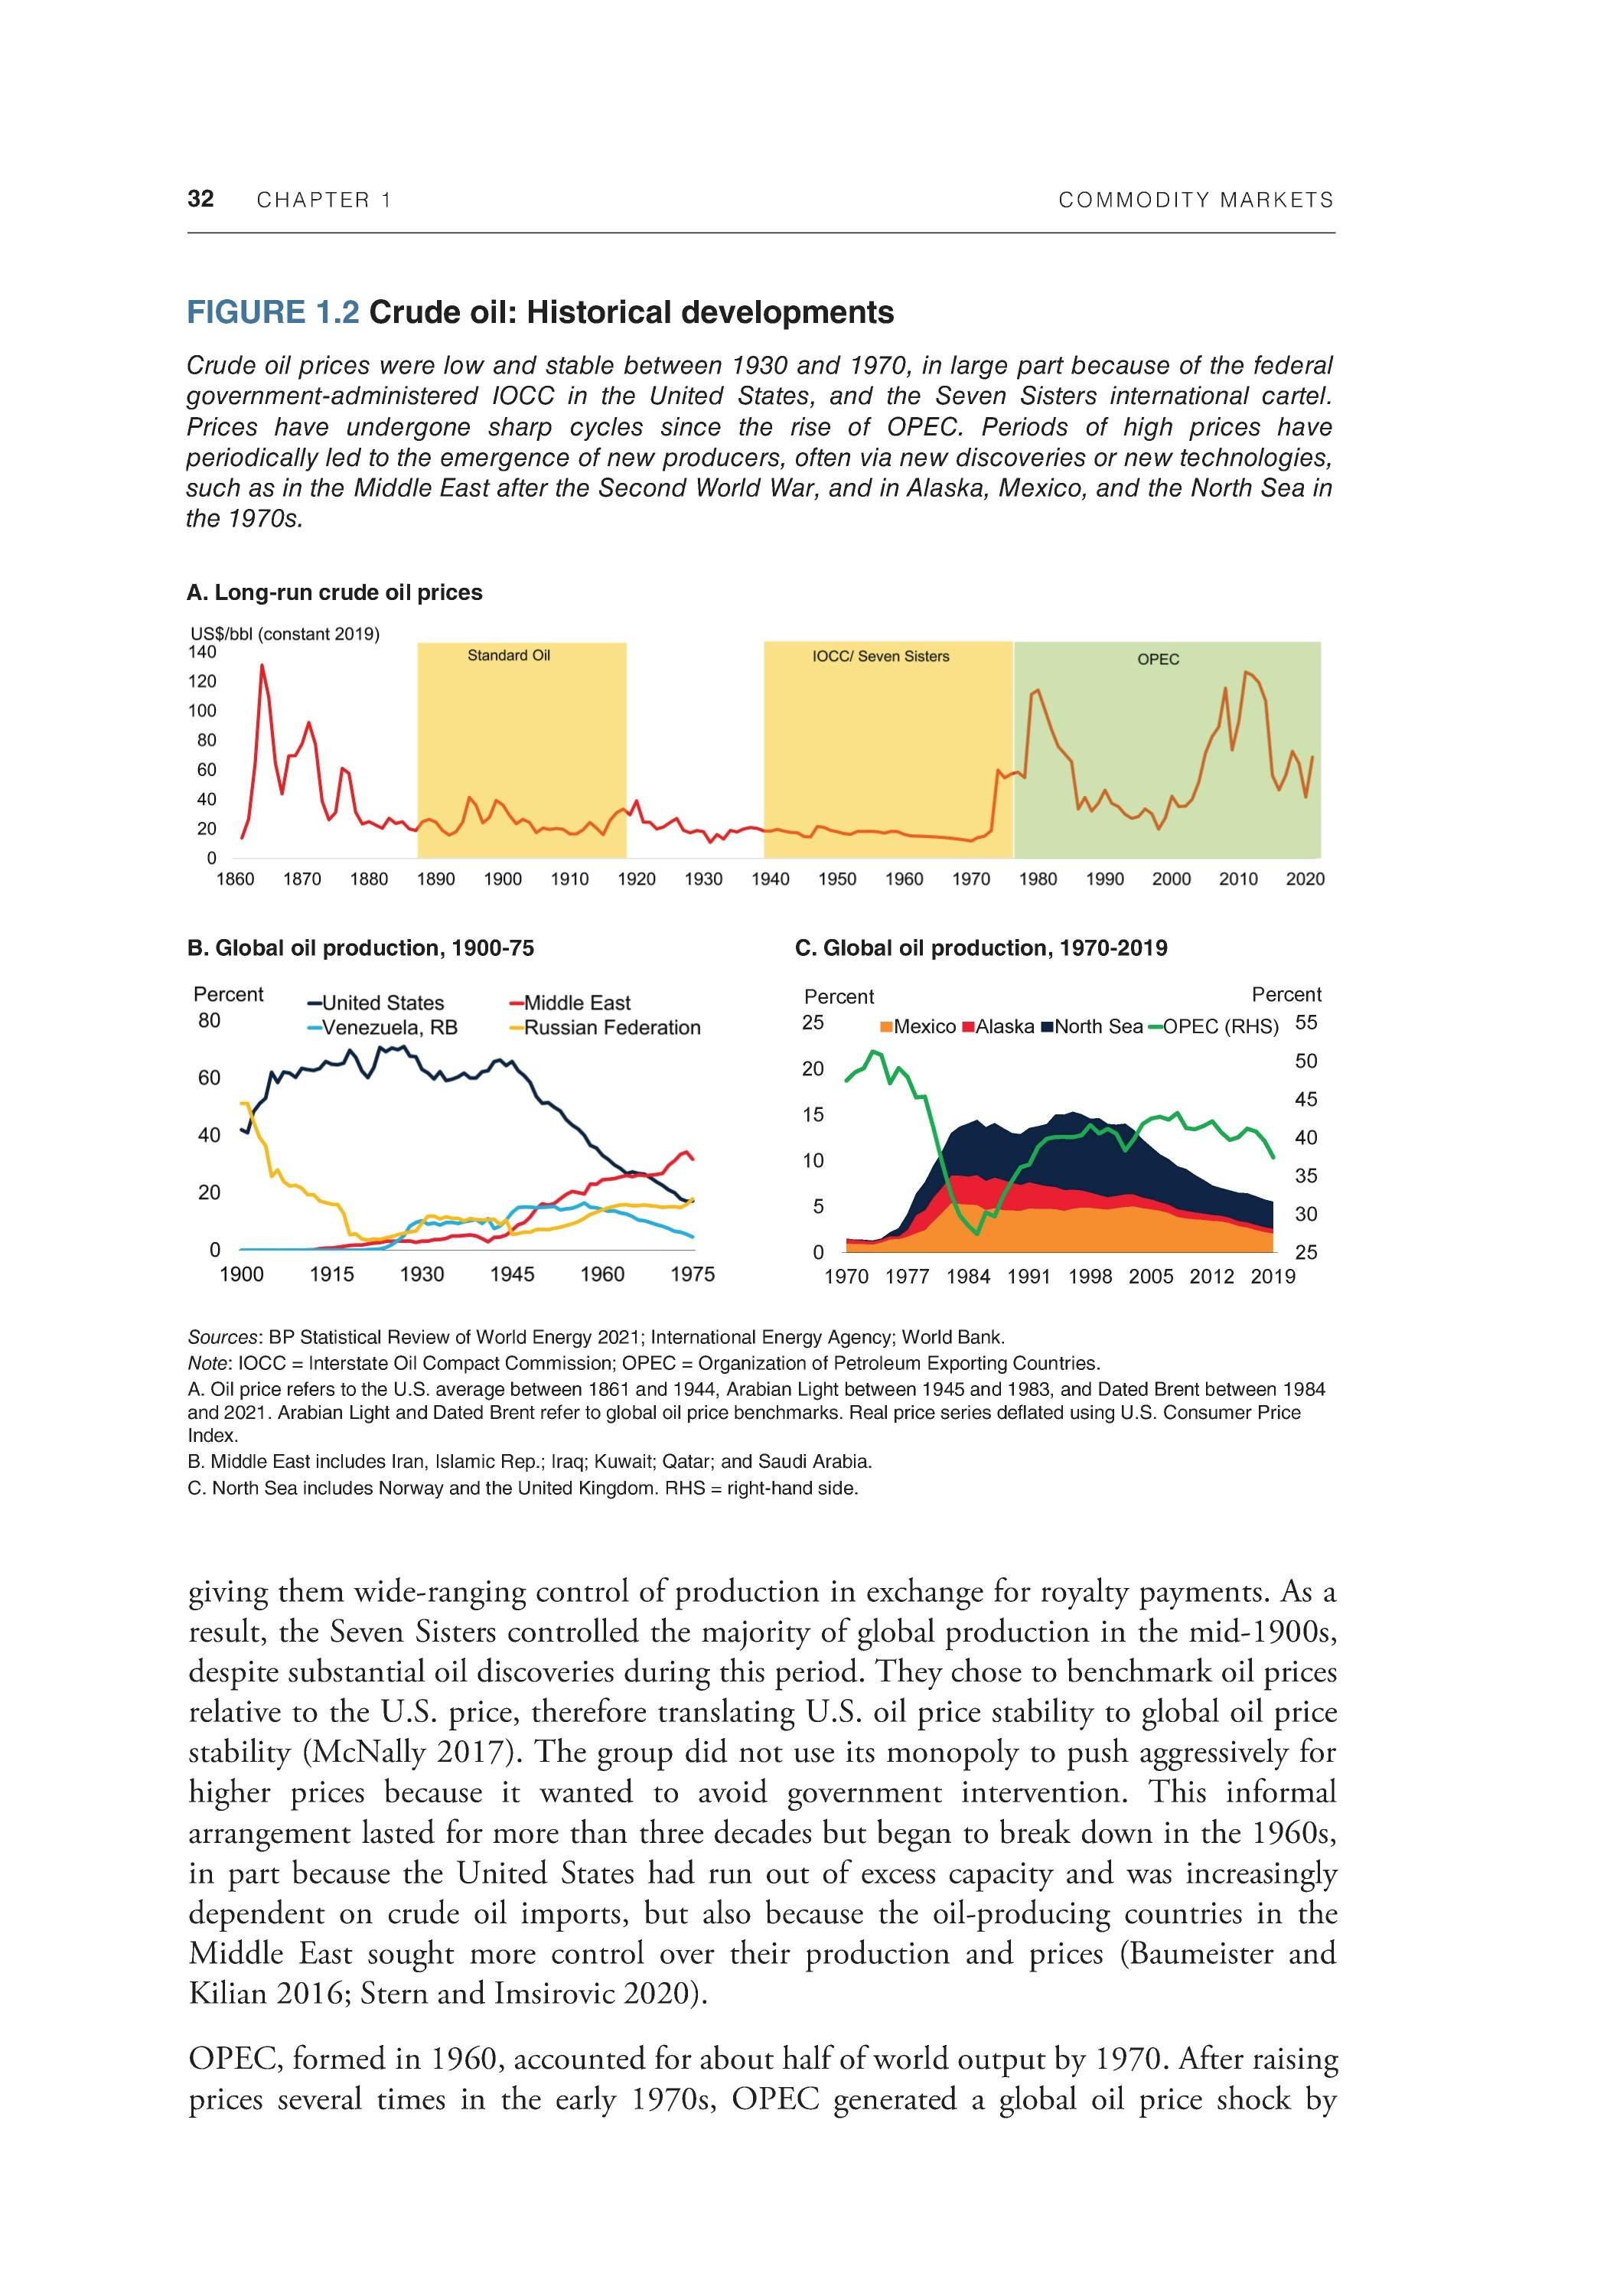
FIGURE 1.2 Crude oil: Historical developments
Crude oil prices were low and stable between 1930 and 1970, in large part because of the federal government-administered IOCC in the United States, and the Seven Sisters international cartel. Prices have undergone sharp cycles since the rise of OPEC. Periods of high prices have periodically led to the emergence of new producers, often via new discoveries or new technologies, such as in the Middle East after the Second World War, and in Alaska, Mexico, and the North Sea in the 1970s.
A. Long-run crude oil prices
B. Global oil production, 1900-75
C. Global oil production, 1970-2019
Sources: BP Statistical Review of World Energy 2021; International Energy Agency; World Bank. Note: IOCC = Interstate Oil Compact Commission; OPEC = Organization of Petroleum Exporting Countries. A. Oil price refers to the U.S. average between 1861 and 1944, Arabian Light between 1945 and 1983, and Dated Brent between 1984 and 2021. Arabian Light and Dated Brent refer to global oil price benchmarks. Real price series deflated using U.S. Consumer Price Index. B. Middle East includes Iran, Islamic Rep.; Iraq; Kuwait; Qatar; and Saudi Arabia. C. North Sea includes Norway and the United Kingdom. RHS = right-hand side.
giving them wide-ranging control of production in exchange for royalty payments. As a result, the Seven Sisters controlled the majority of global production in the mid-1900s, despite substantial oil discoveries during this period. They chose to benchmark oil prices relative to the U.S. price, therefore translating U.S. oil price stability to global oil price stability (McNally 2017). The group did not use its monopoly to push aggressively for higher prices because it wanted to avoid government intervention. This informal arrangement lasted for more than three decades but began to break down in the 1960s, in part because the United States had run out of excess capacity and was increasingly dependent on crude oil imports, but also because the oil-producing countries in the Middle East sought more control over their production and prices (Baumeister and Kilian 2016; Stern and Imsirovic 2020).
OPEC, formed in 1960, accounted for about half of world output by 1970. After raising prices several times in the early 1970s, OPEC generated a global oil price shock by
COMMODITY MARKETS CHAPTER 1 33
quadrupling the price in 1973-74. A second price shock occurred in 1979-80 when the Iranian revolution and war between Iraq and Islamic Republic of Iran resulted in a significant loss of global oil production and a sharp increase in prices.
Although oil producers benefited from increased oil revenue, the high prices reduced oil demand and encouraged the development of non-OPEC oil production. Between 1979 and 1983, global oil demand fell by 10 percent, or 6 mb/d, with demand in AEs declining by 18 percent. Oil-importing countries mandated increases in fuel efficiency standards and encouraged the use of substitutes, for example, by prohibiting the construction of oil-powered electricity power stations.2 At the same time, high oil prices resulted in a sharp increase in non-OPEC supply, particularly from high-cost sources (Gately 1986). Output from Alaska, the Gulf of Mexico, and the North Sea rose from 2.2 percent of global production in 1975 to 14.0 percent in 1985, with market share taken at the expense of OPEC.
Because of these developments, oil prices declined every year between 1980 and 1985. To offset the sustained declines in prices, OPEC set production quotas for the first time in March 1982. Quotas were successively lowered, and Saudi Arabia accepted the role of a swing producer, absorbing the brunt of production cuts. However, noncompliance by other OPEC members was widespread, and by mid-1985 Saudi Arabia's oil production had fallen by more than three-quarters (Hamilton 2010). In 1985, Saudi Arabia changed its strategy and announced that it would cease its role as swing supplier and increase production, causing oil prices to collapse. In addition to raising Saudi Arabia's market share, the price war was meant to invoke production discipline among all OPEC members. OPEC again set quotas in 1987, along with a price target. However, apart from a spike at the onset of the Gulf War in 1990, prices continued to slide, reaching a low of US$10.00 per barrel of crude oil (bbl) in 1999.

The 1970s oil crisis and nationalization of company assets helped trigger the broader development of the oil market, including the emergence of market pricing mechanisms. The New York Mercantile Exchange introduced the WTI (West Texas Intermediate) oil futures contract in 1983, and the Brent contract was launched shortly thereafter. Today, there are three main oil price benchmarks—Brent, WTI, and Dubai—as well as many regional price benchmarks.3 Oil futures are widely traded on futures exchanges, with WTI the most active. Of all commodity markets, oil futures have the longest horizon, although liquidity declines rapidly as the contract term lengthens.
2 Oil demand was also depressed by a steep rise in interest rates caused by the Federal Reserve's policy of reducing inflation, and by a global economic recession.
3 Brent refers to crude oil produced in the North Sea. It is used to price two-thirds of the world's trade in crude oil, including that produced in Africa, Europe, and some parts of the Middle East (ICE 2021). WTI is the U.S. benchmark, and Dubai is generally used to price crude oil exports from the Persian Gulf to Asia. Differences between types of crude oil are primarily based on their sulfur content and their density, which determine if they are "sweet" or "sour" and "light" or "heavy" (EIA 2012). Brent and WTI are light, sweet crude oils, whereas Dubai is at the opposite end of the scale as a heavy, sour oil. In general, crude oil grades that are lighter and sweeter are more valuable than heavy, sour oils, because it is easier to produce gasoline and diesel from them.


