9 minute read
1.3 Crude oil: Developments since 2000
34 CHAPTER 1 COMMODITY MARKETS
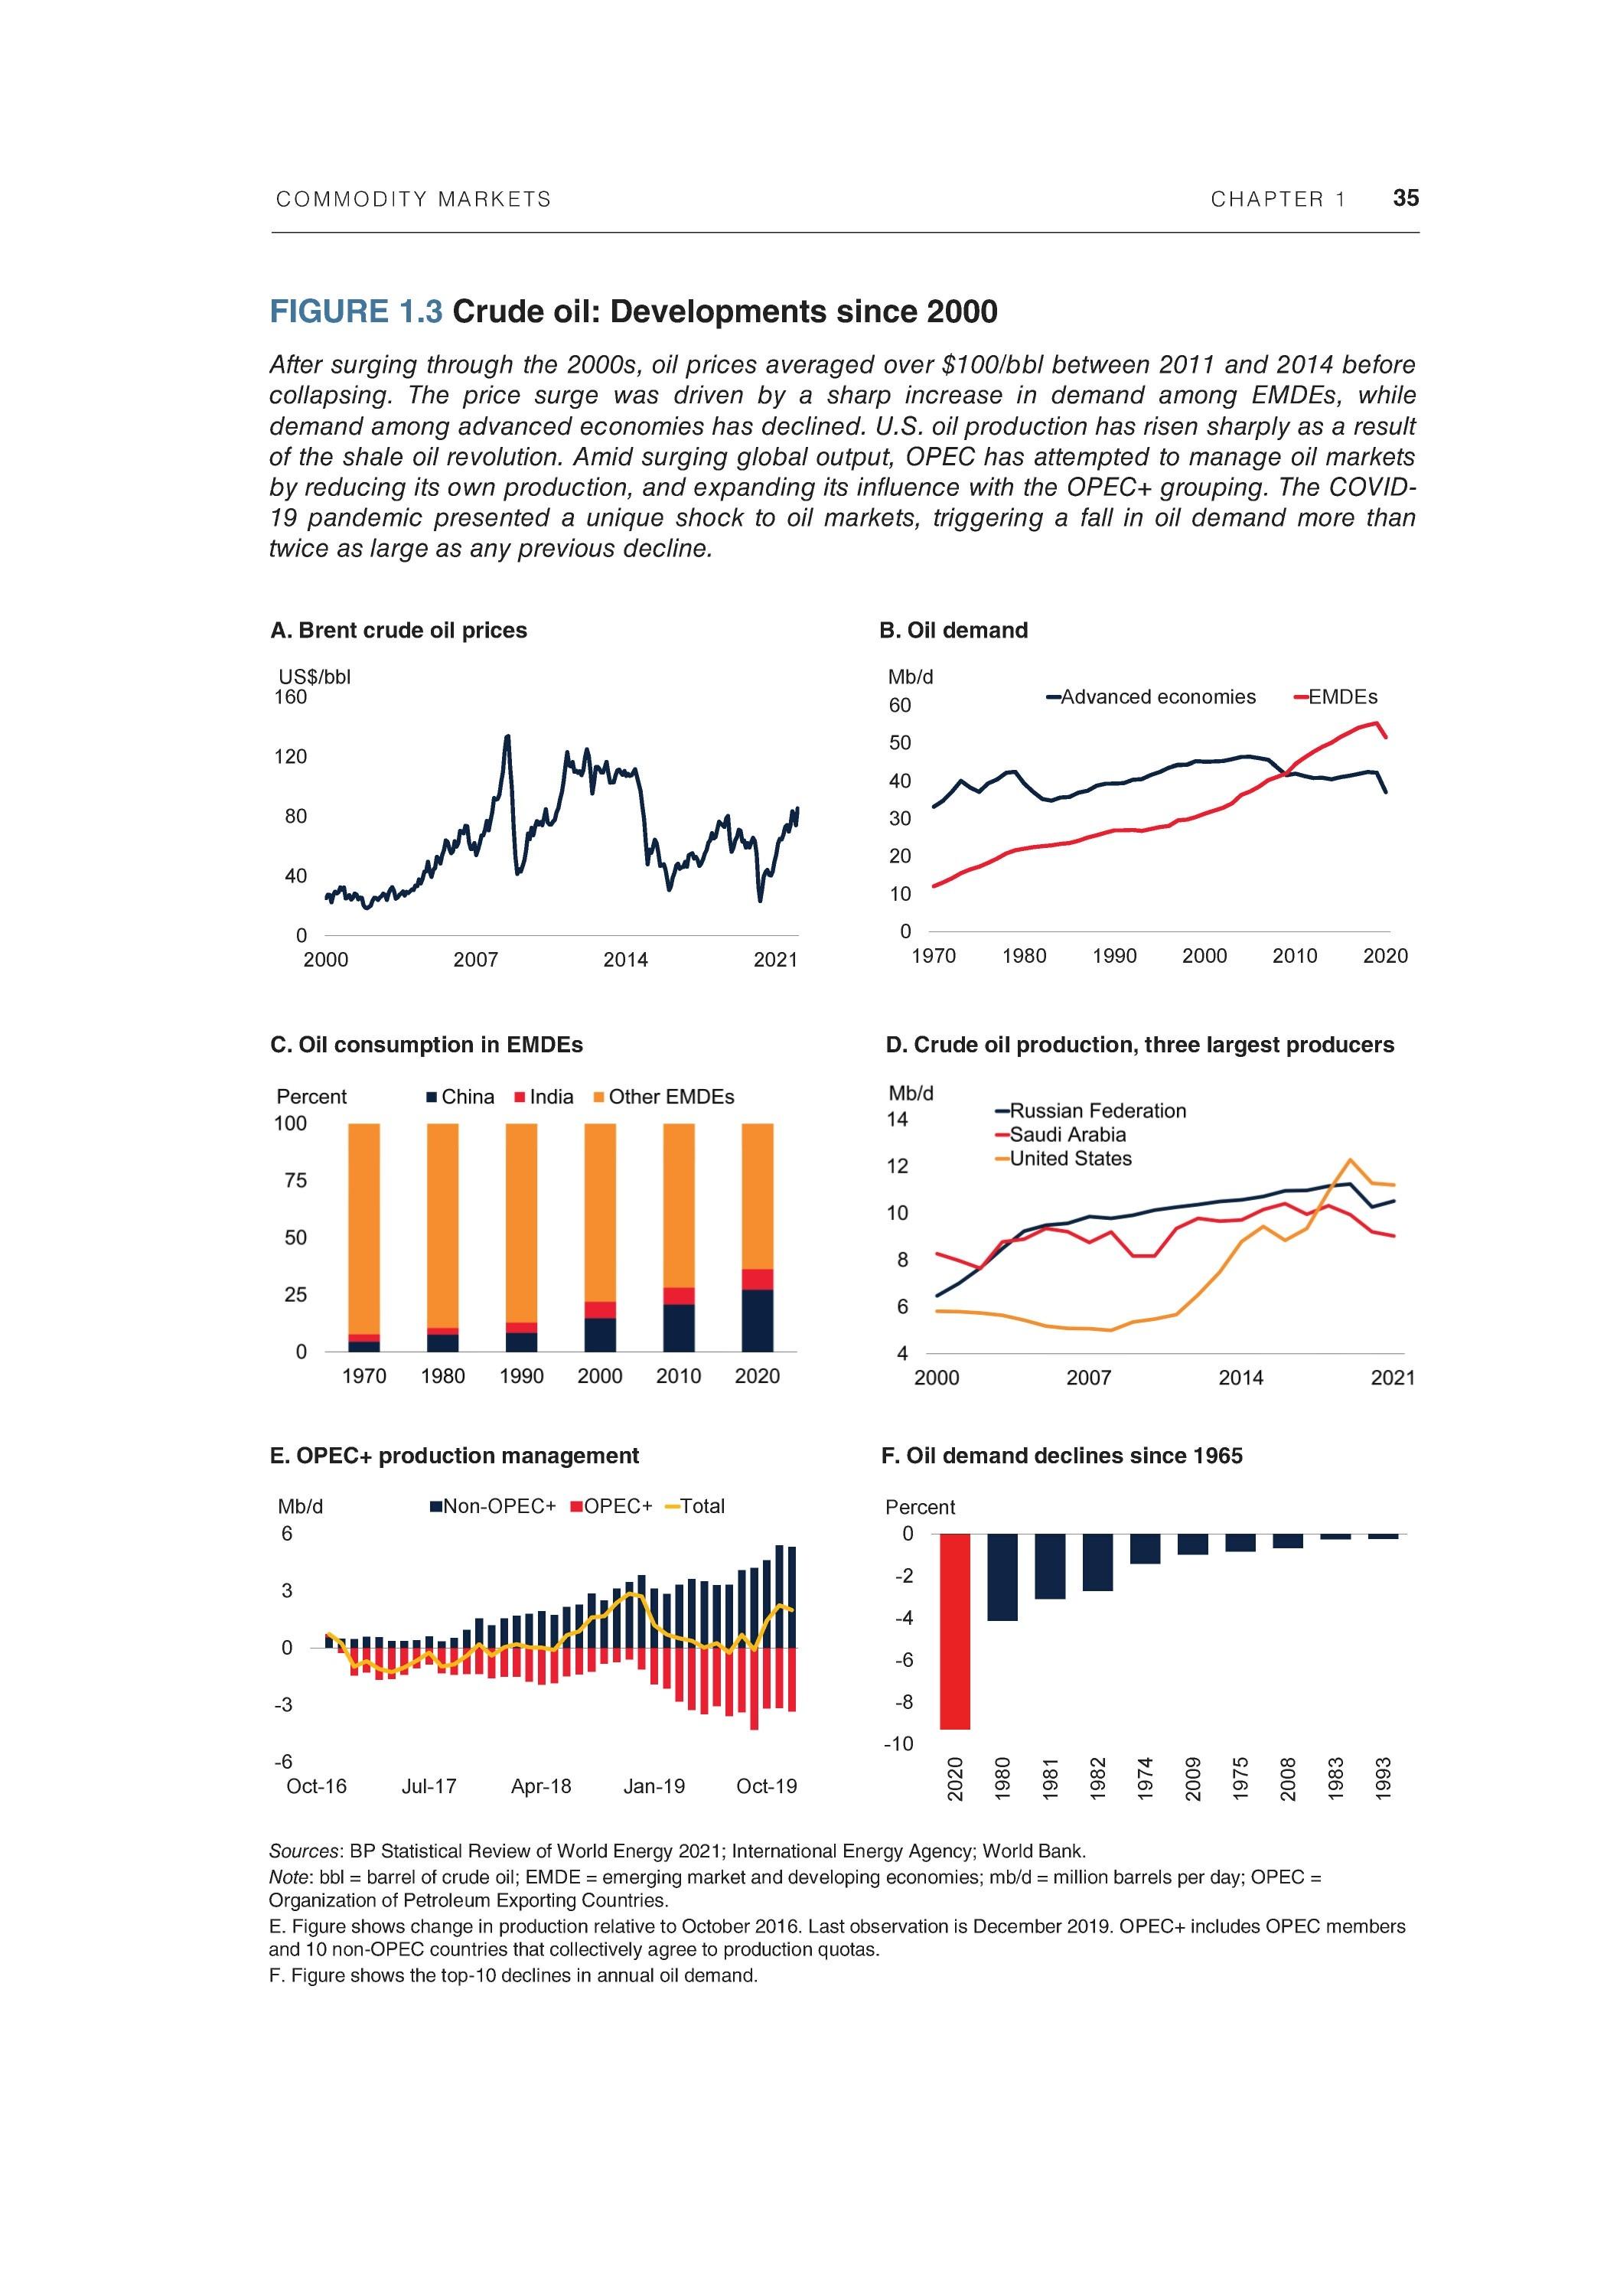
The 2000s saw a surge in oil prices, mainly reflecting larger-than-expected demand among EMDEs (figure 1.3; World Bank 2018). Oil consumption in China rose by nearly 70 percent during 2000-08, and in India by 40 percent. In contrast, oil demand among AEs was broadly unchanged over this period. In addition to increases in demand, only modest increases in supply from OPEC contributed to rising prices (Baumeister and Peersman 2013; Kilian 2009; Kilian and Murphy 2014). At the peak in 2008, oil prices reached well over $100/bbl. The boom ended abruptly during the global financial crisis, but oil prices recovered rapidly thanks to robust growth in China and production cuts among OPEC countries.
Between January 2011 and mid-2014, oil prices plateaued at just over $100/bbl. In contrast, most other commodity prices gradually declined over this period because of weak global demand and rising supplies. Through 2013, the impact of soft global demand on oil prices was offset by geopolitical factors on the supply side. These factors included a collapse in exports from Libya due to internal conflict, as well as reduced exports from the Islamic Republic of Iran following the imposition of sanctions by the United States and the European Union (Baumeister and Kilian 2016).
Oil prices began to drop in mid-2014 and continued to decline until a trough of $407 bbl was reached at the start of 2016—a decline of more than 70 percent from the highs earlier in the decade. Several factors were at play. High and stable prices before 2014 facilitated the development of other forms of crude oil, most notably U.S. shale oil, as well as Canadian tar sand production and biofuels. U.S. crude oil production increased by 55 percent between 2011 and 2014, and its share of global oil production rose from 7.6 percent to 11.2 percent. In addition, oil supply disruptions arising from geopolitical events—including conflict in Libya, the impact of sanctions on the Islamic Republic of Iran, and fears of supply outages in Iraq—had less impact on production than expected, and oil demand, although continuing to grow, consistently came out below market expectations (Baffes et al. 2015).
The drop in prices was exacerbated by a change in OPEC strategy. At its meeting in November 2014, OPEC opted to maintain a production level of 30 mb/d instead of anticipated production cuts (OPEC 2014). This decision signaled that OPEC would no longer act as the swing oil producer and would let prices be set by the marginal producer, U.S. shale. Shale oil projects differ from conventional drilling projects in that they have a shorter life cycle and relatively low capital costs, and production tends to respond more rapidly to price changes (Kilian 2020).
The sharp fall in prices was expected to have a substantial negative impact on U.S. shale production. However, the U.S. shale industry adapted to lower prices and sharply reduced production costs via efficiency gains and innovation. As a result, U.S. production declined only modestly in 2016 before recovering rapidly as prices rebounded. In 2018, U.S. crude oil production rose by a record 1.5 mb/d. With this increase, the United States overtook the Russian Federation and Saudi Arabia to become the world's largest oil producer, accounting for nearly 15 percent of global production (EIA2018).
COMMODITY MARKETS CHAPTER 1 35
FIGURE 1.3 Crude oil: Developments since 2000
After surging through the 2000s, oil prices averaged over $100/bbl between 2011 and 2014 before collapsing. The price surge was driven by a sharp increase in demand among EMDEs, while demand among advanced economies has declined. U.S. oil production has risen sharply as a result of the shale oil revolution. Amid surging global output, OPEC has attempted to manage oil markets by reducing its own production, and expanding its influence with the OPEC+ grouping. The COVID19 pandemic presented a unique shock to oil markets, triggering a fall in oil demand more than twice as large as any previous decline.
A. Brent crude oil prices B. Oil demand
C. Oil consumption in EMDEs D. Crude oil production, three largest producers
E. OPEC+ production management F. Oil demand declines since 1965

Sources: BP Statistical Review of World Energy 2021; International Energy Agency; World Bank. Note: bbl = barrel of crude oil; EMDE = emerging market and developing economies; mb/d = million barrels per day; OPEC = Organization of Petroleum Exporting Countries. E. Figure shows change in production relative to October 2016. Last observation is December 2019. OPEC+ includes OPEC members and 10 non-OPEC countries that collectively agree to production quotas. F. Figure shows the top-10 declines in annual oil demand.
36 CHAPTER 1 COMMODITY MARKETS
As in the previous period, the increase in the U.S. share of oil production came at the expense of OPEC. In response to the rapid increase in U.S. production and relatively low prices, in December 2016 OPEC reached an agreement with 10 non-OPEC countries to cut oil production by a collective 1.2 mb/d.4 The group became known as OPEC+ and continues to collectively set production targets. Between 2017 and 2019, OPEC+ had some success in maintaining prices, although it came at the expense of market share and may have served to benefit the U.S. shale industry.
In 2020, the COVID-19 pandemic had a large impact on oil markets (Kabundi and Ohnsorge 2020). The one-month decline in oil prices in April 2020 was the largest on record, with the WTI price briefly turning negative (World Bank 2020). Oil consumption fell sharply because of government restrictions to stem the spread of the pandemic, with demand declining by almost 10 percent in 2020, more than twice as large as any previous decline (World Bank 2020). Amid plummeting prices, OPEC and its partners agreed in April 2020 to cut production by a record 9.7 mb/d.5 Prices rose during the remainder of the year and accelerated in 2021 as the global economy recovered. While production rose, some producers struggled to increase output, hindered by various factors, including shortages of labor, transportation bottlenecks, and bad weather (World Bank 2021).
Oil markets were once again disrupted by the war in Ukraine. In response to the invasion, several countries, including Canada, the United Kingdom, and the United States announced they would ban or phase out imports of oil from Russia. The International Energy Agency estimated about 3 mb/d of Russia's production was disrupted as a result. The longer-term implications of the war in Ukraine are examined in box 1.1.

Coal
Coal has been used extensively as a fuel throughout history and was instrumental in the industrial revolution. Thermal (or steam) coal, which accounts for more than 80 percent of global coal consumption, is chiefly used for electricity generation. The remainder is coking or metallurgical coal and is used to smelt iron ore for steel production. China is the largest consumer of coal, accounting for more than half of the world's consumption. China also accounts for half of global production, followed by India (10 percent), Indonesia (7 percent), and Australia and the United States (about 6 percent each).
Before the 1960s, international trade of coal was limited, mostly land-based, and regional, reflecting the high cost of transportation—even today, transportation costs can make up half of total costs of coal supply (Paulus 2012). Former West Germany, for
4 The 10 non-OPEC countries are Azerbaijan, Bahrain, Brunei, Kazakhstan, Malaysia, Mexico, Oman, Russia, Sudan, and South Sudan.
5 The group had previously failed to reach an agreement at its meeting in March 2020, which triggered the end of the existing cuts. Saudi Arabia announced it would increase oil production by more than 2 mb/d, to 12 mb/d, exacerbating the fall in prices.
COMMODITY MARKETS CHAPTER 1 37
example, exported coal to other countries in Western Europe while Poland and the Soviet Union supplied Eastern European countries. There was also some land-based trade between Canada and the United States. The only seaborne coal trade was from the United States (the world's largest producer at that time) to Japan and Western Europe.
An international market for coal began forming after the oil price shocks of the 1970s, which made coal competitive with crude oil for power generation despite higher transportation costs. The increasing use of coal for electricity generation was facilitated by the International Energy Agency's decision to ban its member countries from building new oil-fired electricity plants (IEA 1979). As a result, global coal consumption rose more than one-fifth between 1970 and 1980, leading to large increases in coal prices (figure 1.4). In addition, several countries—including Australia, Canada, and South Africa—developed their coal reserves and became coal exporters. The result was a doubling of the quantity of coal traded between 1970 and 1990 (Warell 2005).
Coal prices began to decline in the 1980s and plateaued in the 1990s despite continued growth in coal consumption. The decline was driven by supply-side factors, including the emergence of additional coal exporters in the 1980s, including China, Colombia, and Indonesia, as well as technological developments, particularly in the United States, where the cost of producing coal fell sharply (Ellerman 1995). Between 1985 and 1995, the labor productivity of coal miners in the United States doubled, from 2.7 tons per employee per hour to 5.4 tons (EIA 2021). The 1980s saw the first international coal price benchmark, which was the outcome of negotiations between a leading Australian coal supplier, BHP Billiton, and Japanese power and steel companies.6

The coal market changed significantly from 2000 onward as rapid growth in EMDEs, notably China, led to a surge in demand (Baffes, Kabundi, and Nagle 2022; World Bank 2018). Global coal consumption rose by almost 50 percent during 2000-08, with China accounting for more than two-thirds of the increase. Although China rapidly increased domestic production of coal, the increase was insufficient to meet the rise in domestic demand. As a result, the country became a significant importer of coal, driving up global prices (which peaked in mid-2008). The global financial crisis caused prices to fall sharply as the global economy contracted, but prices bounced back rapidly as the economy recovered, with China once again driving the increase in demand.
Demand for coal peaked in 2014 and has slightly declined since, as China's growth has slowed and shifted away from manufacturing and investment toward consumption and services (World Bank 2019a). Coal demand has been further affected by the U.S. shale revolution, which led to plentiful supplies of low-cost natural gas, enabling gas-to-coal switching in electricity generation (EIA 2020). Concerns about climate change and pressures to reduce carbon emissions alongside a fall in the cost of solar- and wind-
6 Today there are three widely used international coal price benchmarks: (1) free on board (fob) spot price at Richards Bay, representing thermal coal exports from South Africa, (2) fob spot at Newcastle, representing thermal coal exports from Australia, and (3) fob spot at Bolivar, representing thermal coal exports from Colombia, although numerous other prices are also used. Coal is also traded on several futures exchanges.


