2 minute read
percent, 20 percent, and 30 percent of population


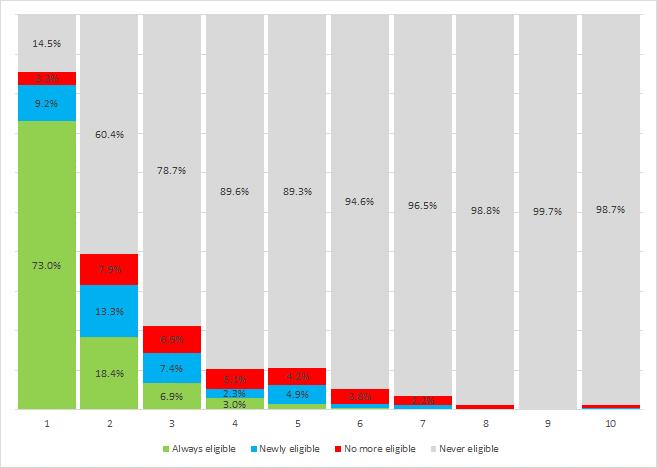
higher the overlap, the more accurate is the scoring formula. Figure 2 shows the overlap between the ‘true’ welfare distribution and the estimated welfare based on the current PMT formula in the bottom 10 percent, 20 percent, and 30 percent of the total population.
International comparisons show that the performance of the predicted welfare through the PMT formula in Georgia is relatively high, especially for the bottom decile (Figure 2). Usually the overlap is lower in the bottom decile and increases as we consider a larger percentage of the population. The level of overlap depends on the design of the formula and on the quality of the household survey data and ultimately on the conditions of the country and the underlying causes of poverty. In Georgia, the high level of overlap in the bottom decile could be the result of the large coverage of TSA in this group.
Advertisement
Figure 2: Percentage of population overlap between ‘true’ and estimated welfare within the bottom 10 percent, 20 percent, and 30 percent of population
Source: Authors’ analysis of the 2018 HIES, Uzbekistan Listen to Citizens of Uzbekistan (L2CU) 2018, and 2014 HIES in Mongolia. The ‘true welfare’ is based on the observed household consumption aggregate, net of transfer amount (where this exists). In the three countries, the ‘estimated welfare’ is the one estimated through the theoretical PMT formulae in each of the respective countries.
Overall, the performance of the current PMT model is good compared to what is achieved in other countries. However, the performance has been declining over time due to both design issues and implementation challenges.
One implementation issue we identified is the inconsistency in how monetary and nonmonetary values are treated when calculating the PMT score. The coefficients of the current formula reflect the relationship between consumption expenditure and monetary/nonmonetary households’ characteristics at 2013 prices. If we re-estimate the same relationship after prices have increased, the coefficients will inevitably change. The practice since 2013 has been to calculate the score based on monetary variables (income, revenues, and utility expenditures) at current nominal prices, which have inevitably inflated the predicted consumption. While the estimation was conducted at 2013 prices, there was no mechanism in place to adapt the formula to price changes.
The lack of such adjustment mechanism turned out to be problematic, especially in the context of significant inflation, leading to an overestimation of the ‘consumption’ part of the formula, inflating the final household