5 minute read
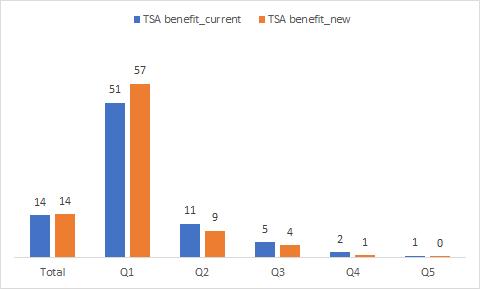
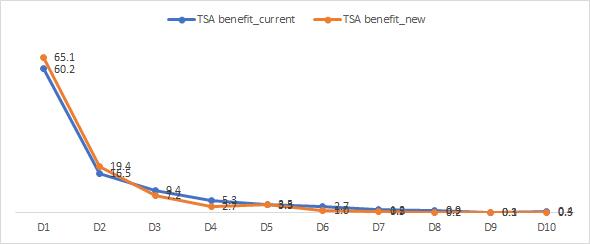
Figure 6: Coverage and targeting accuracy under the current and proposed model
Note: ‘True’ welfare is measured as aggregate consumption per equivalent adult, net of the seasonal adjustment used for the estimation of the formula.
The theoretical performance of the proposed model is higher than the current model also in terms of coverage of the poor, beneficiary, and benefit incidence. We simulate the coverage of TSA eligible households under the current and new models in a budget neutral scenario. The estimated program expenditure based on the current PMT model would be GEL 403 million and the total coverage of eligible households (with score less than 65,000 as per the existing regulation) under perfect targeting would be 13.9 percent of the population. With the same budget of GEL 403 million, we could afford to increase the eligibility threshold to 66,860 and hence cover more households, about 14.2 percent of the total population (holding the benefit amounts constant according to the benefit formula rules that were enforced in 2018)31 (Figure 6). The efficiency gains would come from improvements in coverage of the poorest quintile and marginal improvements in the benefit incidence in bottom deciles. The coverage of the poorest quintile would increase substantially from 51 percent to 57.3 percent, while the coverage of the remaining quintiles (leakage) would decrease. The targeting accuracy measured as the share of budget accruing to the poorest decile in case of perfect targeting would improve from 60 percent to 65 percent: 94.5 of the TSA budget would go to households in the poorest two quintiles based on the new model as opposed to 91.3 as per the current model. It should be noted that that these projections overestimate the actual results since implementation bottlenecks usually decrease targeting efficiency.
Advertisement
Figure 6: Coverage and targeting accuracy under the current and proposed model
A. Coverage B. Benefit incidence
Source: HIES 2018.

The positive gains in terms of improved coverage of the poor and targeting outcomes should be balanced with the costs of implementing and transitioning to a new PMT formula. The improved targeting outcomes of the proposed new model are mostly due to the better use of the information collected rather than additional new variables. For example, rather than pooling all income sources in one ‘revenue’ index, as in the current formula, we separated income sources as separate variables. With an eye to reduce the administrative costs we did not consider variables with the potential to create implementation complications
31 In 2018, each member of households with score < 30,000 would receive GEL 60 and additional GEL 10 per child, each member of households with score between 30,001 and 57,000 would receive GEL 50 and additional GEL 10 per child, each member of households with score between 57,001 and 60,000 would receive GEL 40 and additional GEL 10 per child, each member of households with score between 60,001 and 65,000 would receive GEL 30 and additional GEL 10 per child, and households with score above 100,000 would only receive GEL 10 per child. In January 2019, the child allowance increased from GEL 10 to GEL 50.
or wrong incentives (that is, IT assets). Table 4 marks the variables that are ‘new’ from an administrative point of view, that is, that would be required to be added in the family declaration form. Only 13 variables are new32 whereas 19 variables are removed (see Table B1.2 in Annex B for a full summary). For this reason, the declaration form would not need to change much and the administrative cost of storing and verifying the new variables is assessed to be minimal compared to the benefits that would be achieved in terms of reduced exclusion and inclusion errors.
The transition to a new formula would also lead to adjustment costs that will need to be properly managed. There will be some winners and losers resulting from the proposed new PMT, respectively, gaining and losing eligibility to the TSA. Figure 6 shows that with the same allocated budget, the overall the coverage would increase (hence more households would be eligible). For instance, 62,749 new households would be eligible (winners) based on the new PMT, while 28,639 households would lose their eligibility moving to the new PMT formula. The winners will therefore outnumber the losers. Furthermore, targeting will be more equitable, as the winners will be highly concentrated in the poorest quintile and the losers mostly concentrated in the top three quintiles (Figure 7). Importantly, 55 percent (25 percent) of the winners belong to the poorest quintile (decile) while 71 percent of the losers are from households in the upper four quintiles. Further analysis of administrative data (households registered in the SVHD) will allow to learn more about the number and typologies of households gaining and losing eligibility under the proposed new formula. Adjustment costs will potentially include behavioral responses to the anticipation of possible losses of the TSA benefit: households might, for instance, cut down on consumption (already below subsistence levels) by way of precaution. Changes in coefficients might also modify incentives to the supply of labor and the purchase of movable assets. Previous analysis on Georgian TSA33 shows that TSA does not distort labor supply. A randomized experiment in Indonesia (Banerjee et al. 2020) further shows that changes to the treatment of asset ownership in the PMT have little or no effect on households’ purchasing decisions.
32 New variables that will need to be considered for the calculation are number of young cattle, number of horses, number of sheep, number of goats, number of pigs, number of members with employer-provided insurance, number of members abroad, number of members who have worked in the past three months, ownership of refrigerators, washing machines, satellite receivers, access to individual system of hot water, and access to individual heating system. Variables that will be removed from the formula are beehives, poultry, tractors, revenues from social package and pensions, presence of children of full age living as independent family, household head’s gender, presence of children (age less than 16), possession of garage, cellar/kitchen, unfinished house or structure/workshop, cattle shed, storage hut, basement, commercial area, total area of other owned accommodation (apartment/house), total area of other country houses owned by the household, and whether cars, passenger vehicles, or trucks are of Soviet manufacturing. 33 Carraro, Honorati, Marguerie 2020.


