

Appendix II: Vulnerability Assessment Image: ONE Architecture & Urbanism

This document characterizes the City of Newark’s climate hazards today and provides a framework for incorporating climate change resilience into future planning and development. It addresses the requirement to integrate a climate change-related hazard vulnerability assessment into municipal land use planning, as outlined in law P.L. 2021, c6 and amending New Jersey’s Municipal Land Use Law. Newark’s historic patterns of development – its urban density, prevalence of impervious surfaces, and intensive coastal development – are indicative of its dynamic growth and economic activity, and at the same time have contributed to air and water pollution, ecosystems degradation, and social vulnerabilities that climate change will exacerbate. The increasing frequency and severity of extreme weather events points to an urgent need for climate preparedness, policy, and coordination. This report identifies Newark’s exposures, sensitivities, and adaptation activities in support of developing a prioritized understanding of planning needs and efforts for the coming decade with a view toward adaptation priorities for the longer-term (late 21st century).
Newark is the largest city in New Jersey. The city population has increased 12.8% since 2010 to 311,549 and added 25,000 jobs since 2012. The population is expected to grow 10% by 2030. Meanwhile, by 2070 over 80,000 Newarkers will live in areas affected by stormwater flooding and 58,000 live in areas at risk of coastal storm surge 1. Extreme heat is also a major risk for Newark communities, with average summer temperatures 10-15 degrees Fahrenheit greater than other New Jersey municipalities. Newark has a poverty rate of 27.4%, making it one of the poorest cities in the state. This along with a significant foreign-born population and extremely low homeownership rate (22.3%) make addressing social vulnerability a major concern for any climate resilience planning.
Sea level rise exacerbates the effects of other climate change-driven processes, including drought, extreme precipitation, and extreme heat. Specific findings for Newark’s climate and hazard vulnerabilities include:
● New Jersey is warming faster than the rest of the Northeast and the world. Annual average temperatures increased by 3.5°F since 1895, and annual temperatures are projected to increase by 4.1°F to 5.7°F by 20502
● Newark ranks second among cities nationwide for heat intensity with an index of 7.71°F. The geographic reach, frequency, and duration of heat waves are projected to increase in the coming decades and anticipated to cause a 55% increase in heat-related mortalities3
● Extensive impervious surfaces and a lack of tree canopy contribute to Newark’s urban heat island challenges. 63.2% of Newark is covered by impervious surfaces, whereas tree canopy covers only 7.9% of the city, compared to 40.3% in Essex County.
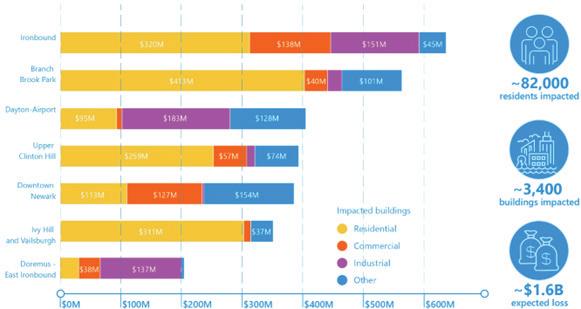
● Flash floods affect 10.4 square miles of Newark (40.2% its land area) today. These events impact 1 in 4 Newarkers and result in an estimated $1.4 – 1.6B in losses45
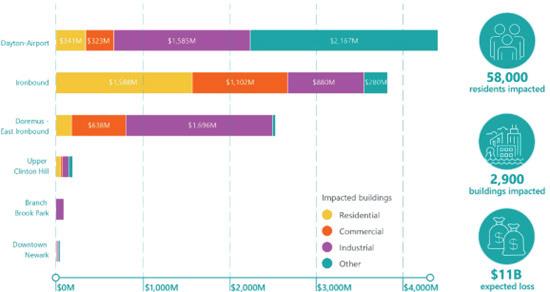
● By 2070, coastal storm events could impact 9.6 square miles of Newark (36.9% of its land area), resulting in an estimated $11B in economic losses
and impacting 58,000 residents and 2,900 buildings. The impacts are concentrated in the East and South Wards6
● Air pollution: 56 of Newark’s 122 public schools are located within 1,000 feet of a high emission roadways.
● Newark has more than 770 properties with a known presence of contaminants, including 440 designated brownfields. There is extensive acreage of brownfields in the East Ward.
● Newark is among the poorest cities in its region with a poverty rate of 27.4%. Each ward in Newark has census tracts with over 0.75 Social Vulnerability Index. Notably, 55.9% of Newarkers lack citizen status, 29% are foreign born, 23.8% speak English “less than well,” 34.4% of Black households, and 33.7% of Hispanic households do not have assets. The rate of homeownership is 22.3%, and 39% of Newarkers lack access to a personal vehicle.
● COVID-19 pandemic resulted in unemployment growth from 7% to 17%, while a workforce gap persisted as of 2022 (nearly 150,000 jobs but a workforce of 123,000 people)7
The Newark360 Master Plan outlines planning pillars, goals, and actions for the coming decade. The final section of this vulnerability assessment provides a comprehensive crosswalk that relates master plan actions to the climate hazards and vulnerabilities they address. See page 26 for further information.
The climate and global temperatures shifts have occurred several times in the last millennia according to scientific records. At present, we are living through a period of climate change caused by human activities, resulting from industrial, agricultural, and transportation-based greenhouse gas emissions, and occurring at a rate ten times faster than in previous eras. These shifting climate patterns are characterized by increasing average global temperatures, which are not only melting glaciers at the poles and contributing to sea level rise but also intensifying storm events, extreme heat, droughts, and many other global climate impacts.
Since 1988, the Intergovernmental Panel on Climate Change has been a global leader in the development of knowledge around climate change science, its impacts, and potential regulation. The comprehensive assessments prepared by the IPCC inform governments at all levels as to the pace of climate change and its current and potential future trends up to the year 2100. These trends generally reference Representative Concentration Pathways, or different climate futures based on potential greenhouse gas concentration trajectories. National, regional, and local climate assessments represent nested scales of information that allow translation of global conditions to a city- or neighborhood- or site-scale understanding of climate impacts and adaptation and resilience opportunities. In the context of Newark, the National Climate Assessment, Scientific Report on Climate Change, and NJ DEP’s regional initiative, Resilient Northeastern New Jersey (Resilient NENJ), all build on and incorporate academic research alongside the latest Federal and State level research and legislation to build the basis for planning 8
Newark’s climate is characterized by warm, humid summers and cold winters with snow. The city has been impacted by extreme weather events throughout its history. Climate change is contributing to more frequent and extreme weather events, including hurricanes, flash floods, and heat waves. Newark ranks as the third highest in the state for social vulnerability, which further exacerbates the impact of extreme weather on its communities9
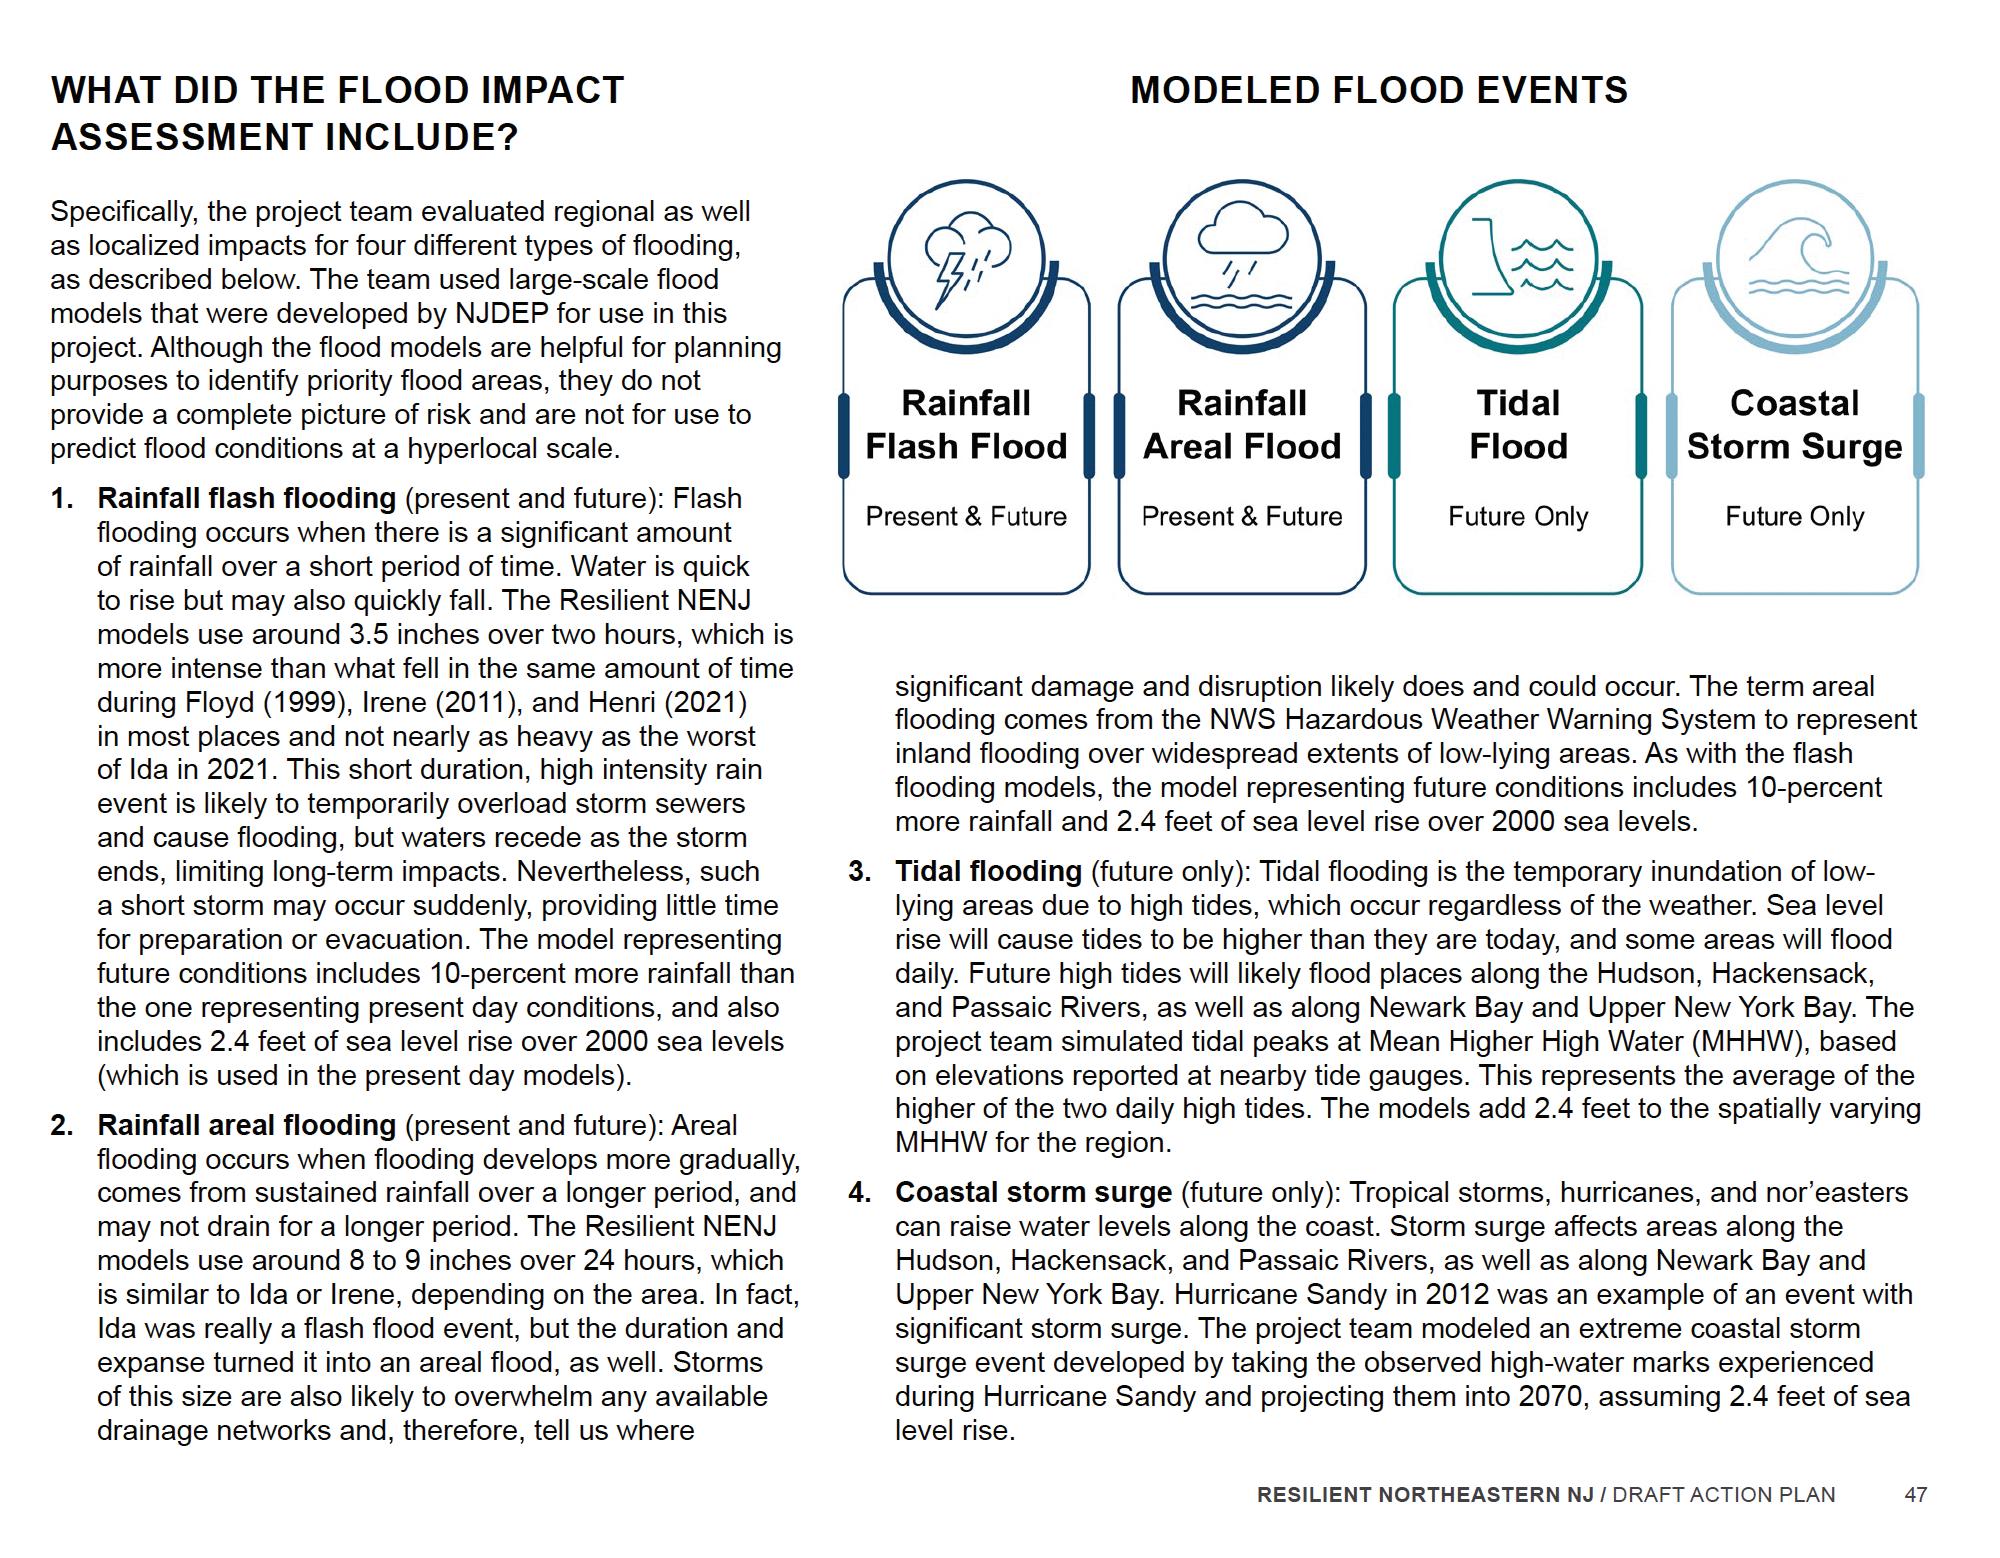
With increasing average temperatures and rising sea levels, Newark’s primary climate threats include tropical storms, hurricanes, tidal flooding, extreme rainfall events, and the heat waves. The four flood risk models developed by Resilient New Jersey –flash flooding (rainfall), areal flooding (rainfall), tidal flooding, and coastal storm surge – extend the FEMA flood zones with additional data and future projections and help evaluate the comprehensive impacts of the primary hazards10. In addition to these primary threats, Newark faces a set of hazards that are less impactful but still require consideration within the broader picture of vulnerability assessment: rising groundwater levels and pollution, droughts and wildfires, air pollution, invasive species and resulting illnesses, and further habitat fragmentation11
Since 2000, Newark has been impacted by seven named storm events and nearly annual summer heat waves.
Remnants of Hurricane Ida 9/1/2021 09/02/2021 n/a 7.76 inches
Widespread transportation system impacts; homes and cars flooded
Tropical Storm Henri 08/21/2021 08/23/2021 n/a 8.42 inches
Tropical Storm Elsa 07/08/2021 07/10/2021 n/a 1.78 inches
Flooded basements, sewer collapse, and sinkholes
Severe flooding observed
Superstorm Sandy 10/21/2012 10/31/2012 10/29/2012 2-4 inches12
12-foot storm surge; severe infrastructure damage; 255,469 power outages counted in Essex County 13
Hurricane Irene 8/21/2011 8/30/2011 8/28/2011 10 inches14
Tropical Cyclone Hanna 15 8/28/2008 9/8/2008 9/6/2008 3.75 inches16
Remnants of Hurricane Gordon 9/14/2000 9/21/2000 9/18/2000 2.14 inches17
Significant property and roadway damage, power outages
Power outages and flooding reports
Poor drainage leading to flooding in low-lying areas
Climate vulnerability assessments and resiliency planning initiatives are typically linked to a specific greenhouse gas emissions scenario. Consistent with Resilient NENJ, this assessment refers to projections related to the RCP/SSP5-8.5 or a “business-as-usual” scenario. Using projections that relate to RCP 8.5 implies taking a conservative view of human change and pursuing the highest level of preparedness: planning for the consequences of 9°F (4.9°C) temperature increase with 6.63 ft of sea level rise by 210018. State-level reports are based on a moderate emissions scenario of 5.4°F (3°C) temperature rise and 3.97 ft of sea level rise locally, corresponding with global environmental actions taken19
Choosing a climate scenario for planning relates to the balance between the hazard risk mitigation and the economic feasibility of the resiliency measures. Over a ten-year time-horizon (consistent with the Newark360 master plan), the differences between these scenarios may be minor. However, there is a need to take a longer-term perspective in order to prepare Newark for resilient future, and importantly, to avoid investments and planning that creates maladaptation, actions that render the city and its communities more vulnerable to climate impacts in the future. Planning based on a moderate emissions scenario over a longer timeframe could potentially create the conditions for future displacement of Newarkers from the coastal zone and result in critical infrastructure at risk.20
Data on climate change projections referenced in this assessment are drawn from State documents and resources such as NJDEP’s New Jersey Scientific Report on Climate Change (2020) and Sea-Level Rise Guidance for New Jersey (2021), as well as Rutgers University’s State of the Climate: New Jersey 2021, which describes sea level rise and coastal storm projections under various climate scenarios and point to the potential acceleration of urban heat. The Scientific Report aims to cover the full range of climate hazards including average annual
temperature increase, heavier rainfalls, and tropical storms and subsequent flooding events, droughts, groundwater pollution, ocean acidification and intrusion, wildfires, wetlands degradation, and invasive species.
FEMA’s Flood Insurance program provides floodplain maps based on modeling of historical riverine and coastal events but excludes flash flooding; however, Newark’s Flood Insurance Rate Maps (FIRMs) were last updated before Superstorm Sandy and currently remain under review and revision. The updated flood zones will most likely incorporate considerable parts of the East Ward including the Port and the Airport. Recent major events – Superstorm Sandy and the remnants of Hurricane Ida – illustrate that FEMA flood zones are not precise enough to be relied on to indicate the location and probability of flooding to occur. 21
Other local reports and data include assessments and geodata from Rutgers’ NJADAPT tool, which provides a municipal-level assessment of potential flood exposure based on socioeconomic composition, housing status, and other considerations. 22 NJDEP’s Resilient Northeastern New Jersey program (Resilient NENJ, 2021-2022) has developed a Draft Action Plan (July 2022) that is supported by both a flood impact assessment (coastal, tidal, areal, and flash flood events considered and modeled) and a high-level climate hazards assessment that includes topics such as extreme heat, air pollution, hazardous materials, and vector-borne diseases. However, certain climaterelated risks such as wildfires and ecological risks (e.g., the potential for habitat fragmentation) are beyond the scope of Resilient NENJ. In the absence of updated FIRMs, Resilient NENJ utilizes Superstorm Sandy flood extents as a baseline for planning and models Sandy with sea level rise (+2.4 ft, 2070) to project future coastal flood risks. The program also developed areal and flash flood models that describe the depth and extent of rainfall flooding today. Thus, there are currently no maps or projections available to describe projected rainfall flooding (or urban heat) in Newark beyond the 2020s.
The City of Newark sits at the eastern edge of New Jersey’s Piedmont Plains, a low rolling landscape divided by a series of higher ridges running parallel to the coast, generally northeast to southwest. 23 At the coastal edge of the Plains, elevations descend from several hundred feet to sea level. The shores of Newark Bay were historically characterized by marshes and wetlands.
The landscape of Newark today little resembles its pre-colonial form. Since the arrival of Dutch colonists in the 17th century, the city was transformed from a landscape of creeks and extensive wetlands fronting Newark Bay into a major transportation center with extensive rail access and port facilities crowding the waterfront. 24 The growing demand for space for
industry resulted in the transformation of the Passaic shoreline and draining of coastal wetlands and marshes, in total one-third of what is the city’s land area today. Land reclamation, the extensive use of fill, and the adaptation of natural resources altered the salinity profile of the Meadowlands and permanently changed its flora and fauna.
Coastal and rainfall flood events highlight the significance of Newark’s geologic formation and physical topography. Buried watercourses resurface as flooded streets and low points during rainstorms, and extreme weather events like Superstorm Sandy inundate these historical marsh and wetland areas. Planning for resilience must learn from and work with the city’s underlying natural systems.
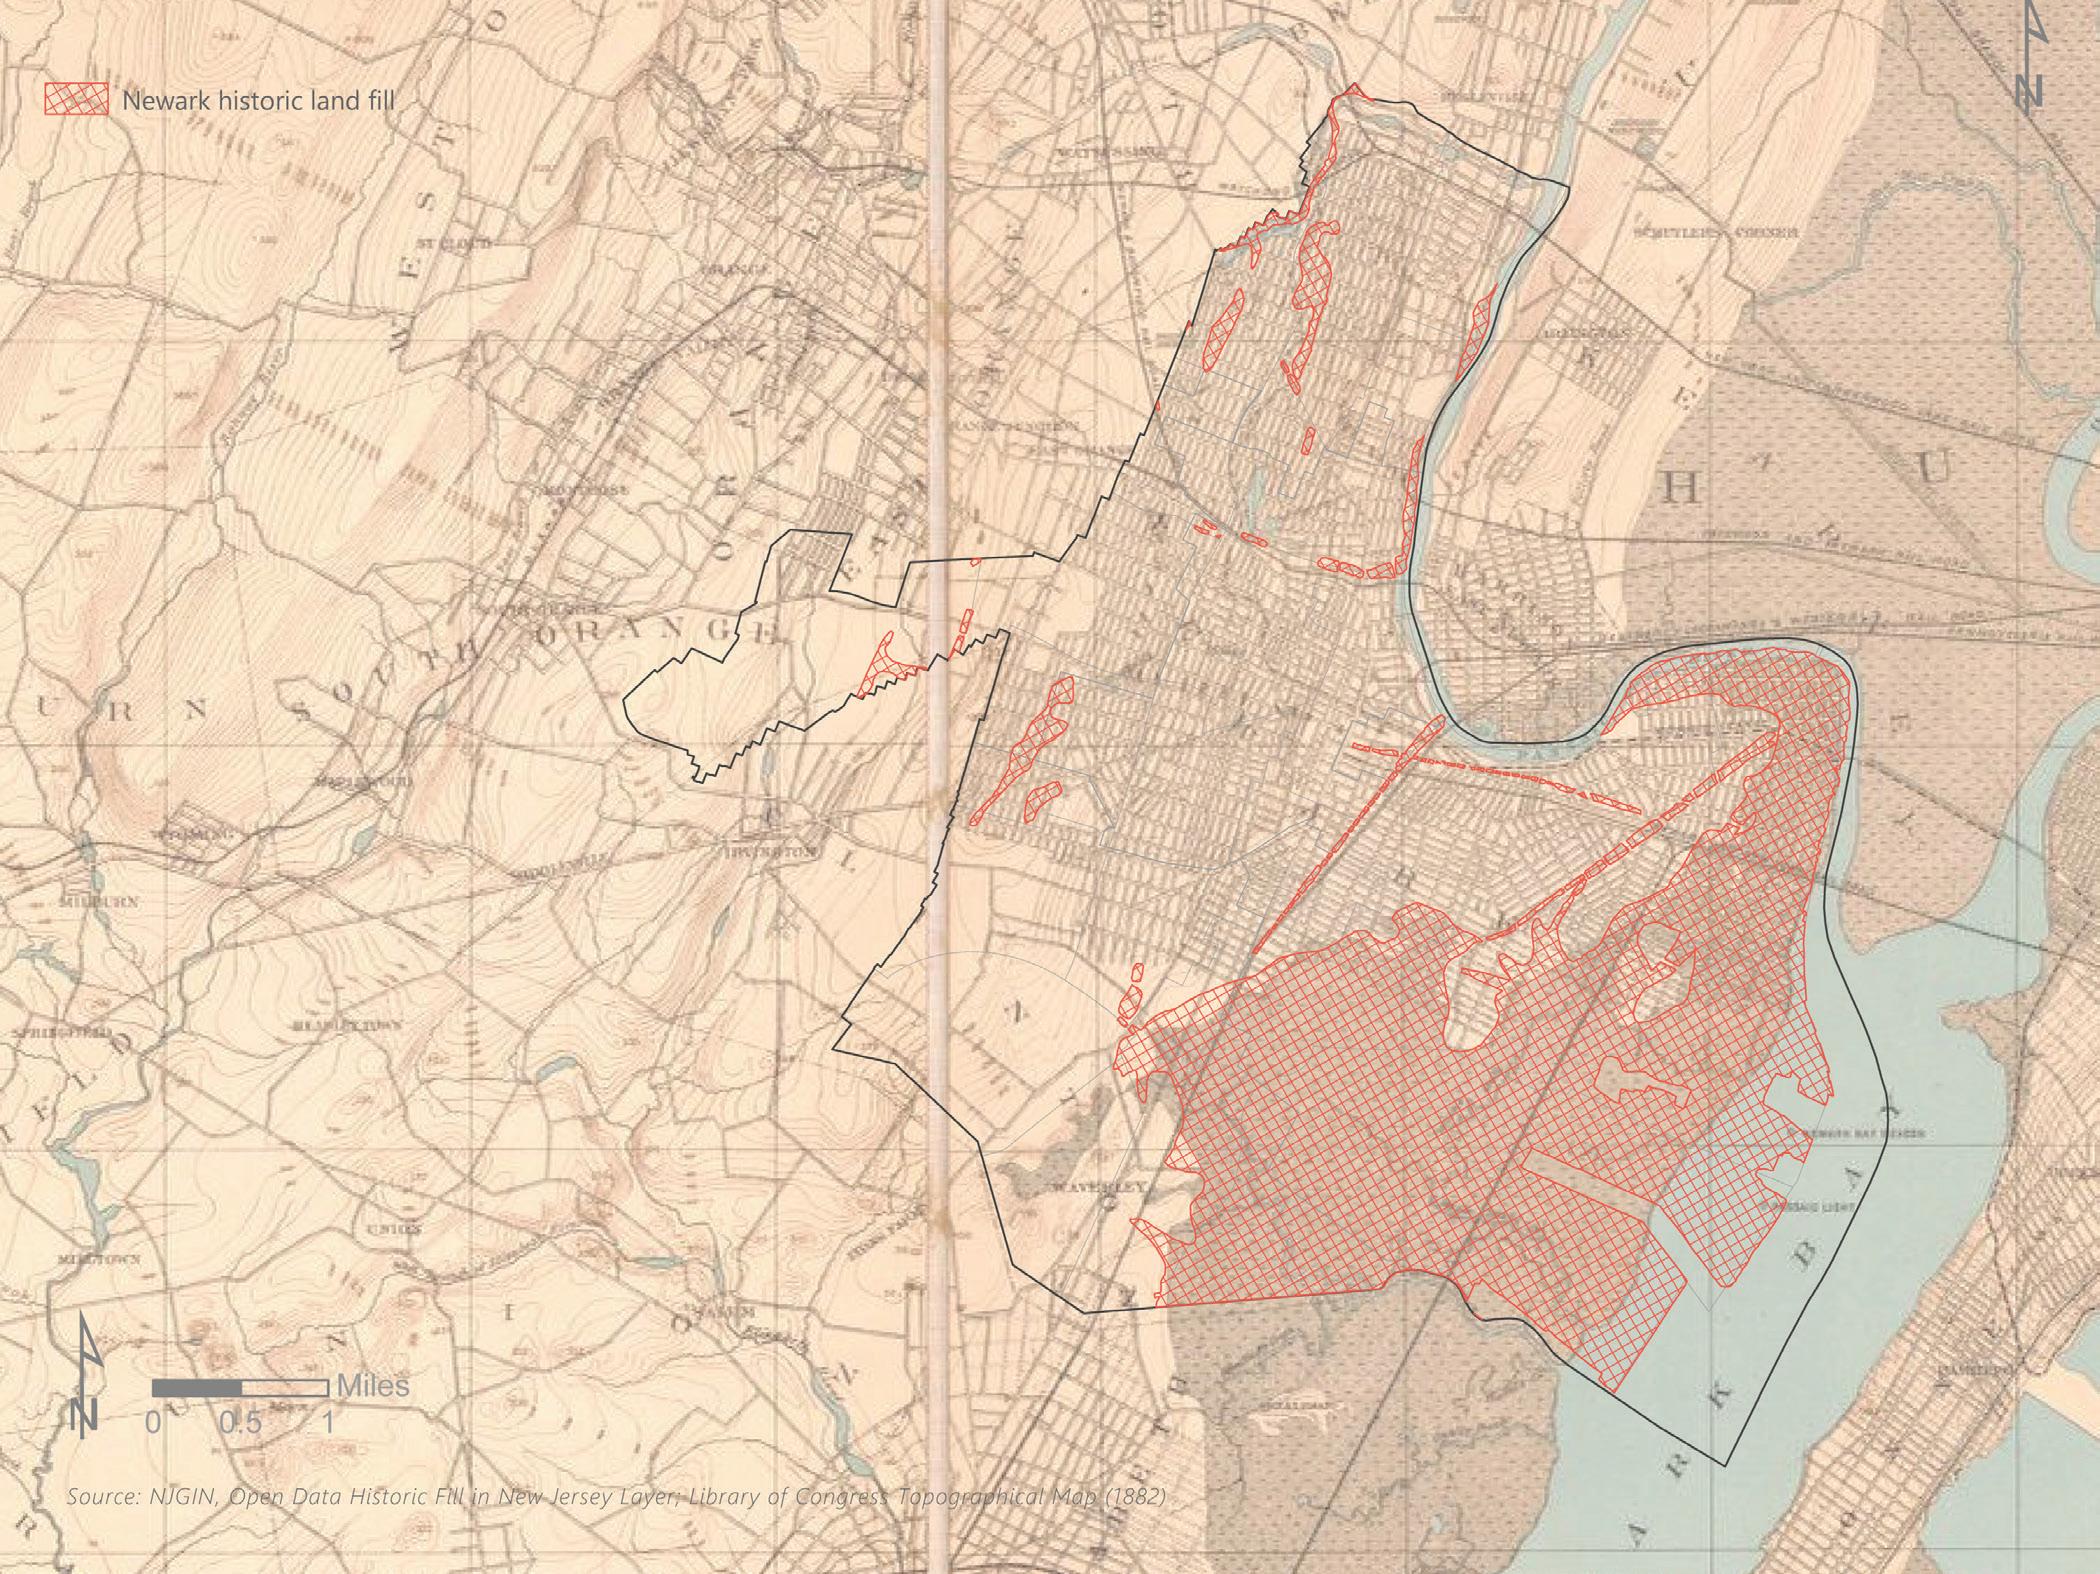 Figure 1 Areas where wetlands and marshes were filled in Newark, approximately 5,538 acres in total 25
Coastal flooding due to sea level rise is a major consequence of climate change globally. While the rate of sea level rise differs regionally due to the ocean circulation, land movement, and local geomorphology, the northeast is projected to experience some of the largest increases in the U.S.26
As described above, extensive areas of Newark were built on historic marshes and filled wetlands, and these areas today face the greatest risk of flooding and tidal inundation – including parts of the East Ward as well as the port and airport facilities. Flood events bring direct risks to lives and damage to homes, businesses, and infrastructure as well as secondary risks such as cutting off key evacuation and circulation routes, with the potential to trap Newarkers in place or prevent access to critical facilities. While there are various models that project sea level rise in New Jersey, the consensus indicates a
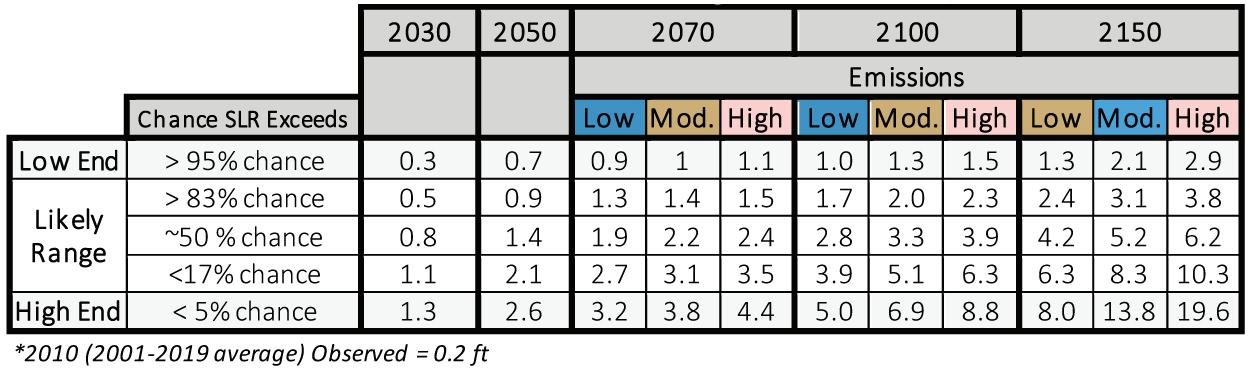
projection of at least 0.7 ft sea level rise by 2030, with up to 6.9 ft by the end of the century. This will shrink the coastal zone and exacerbate the effect of storm surge events. If no action is taken, Newark is projected to lose a land area of over 90 acres by 2070.27
NJDEP guidance indicates that planning for most building and infrastructure activities should use the high end of the likely range (<17% chance) projections, while critical assets should incorporate sea level rise high end estimates (<5% chance) into their planning.28 The recent regulatory reform initiative New Jersey Protecting Against Climate Threats (NJ PACT), required under New Jersey Executive Order 100, updates State regulations and permitting processes to integrate climate change considerations and introduces stronger regulations for structures in the floodplain.29
Figure 2 Sea level rise projections (50% exceedance; high emissions scenario) 30
Area flood extent (1%, 24hr rainfall event)
< 1ft
1-2ft
2-5ft 5-10ft > 10ft
Extreme precipitation and heavier rain events stem from ocean warming, which drives increased evaporation, and from the increased presence of greenhouse gases in the atmosphere, which hold more water vapor. Across the U.S., rainfall patterns are projected to shift toward longer dry periods with more intense rain events. While the future scale of this hazard remains uncertain, the Northeast faces the greatest increases in average annual rainfall. Rain events can cause both areal and flash floods in lowlying areas that lack drainage capacity.
Rain-driven flooding is already affecting Newark residents, community assets, and infrastructure today, causing widespread flooding particularly in the Ironbound, Dayton and the airport, Ivy Hill, and Vailsburg neighborhoods as well as at Branch Brook Park. 31 Scientific observations indicate that the frequency of annual precipitation has risen 10% in
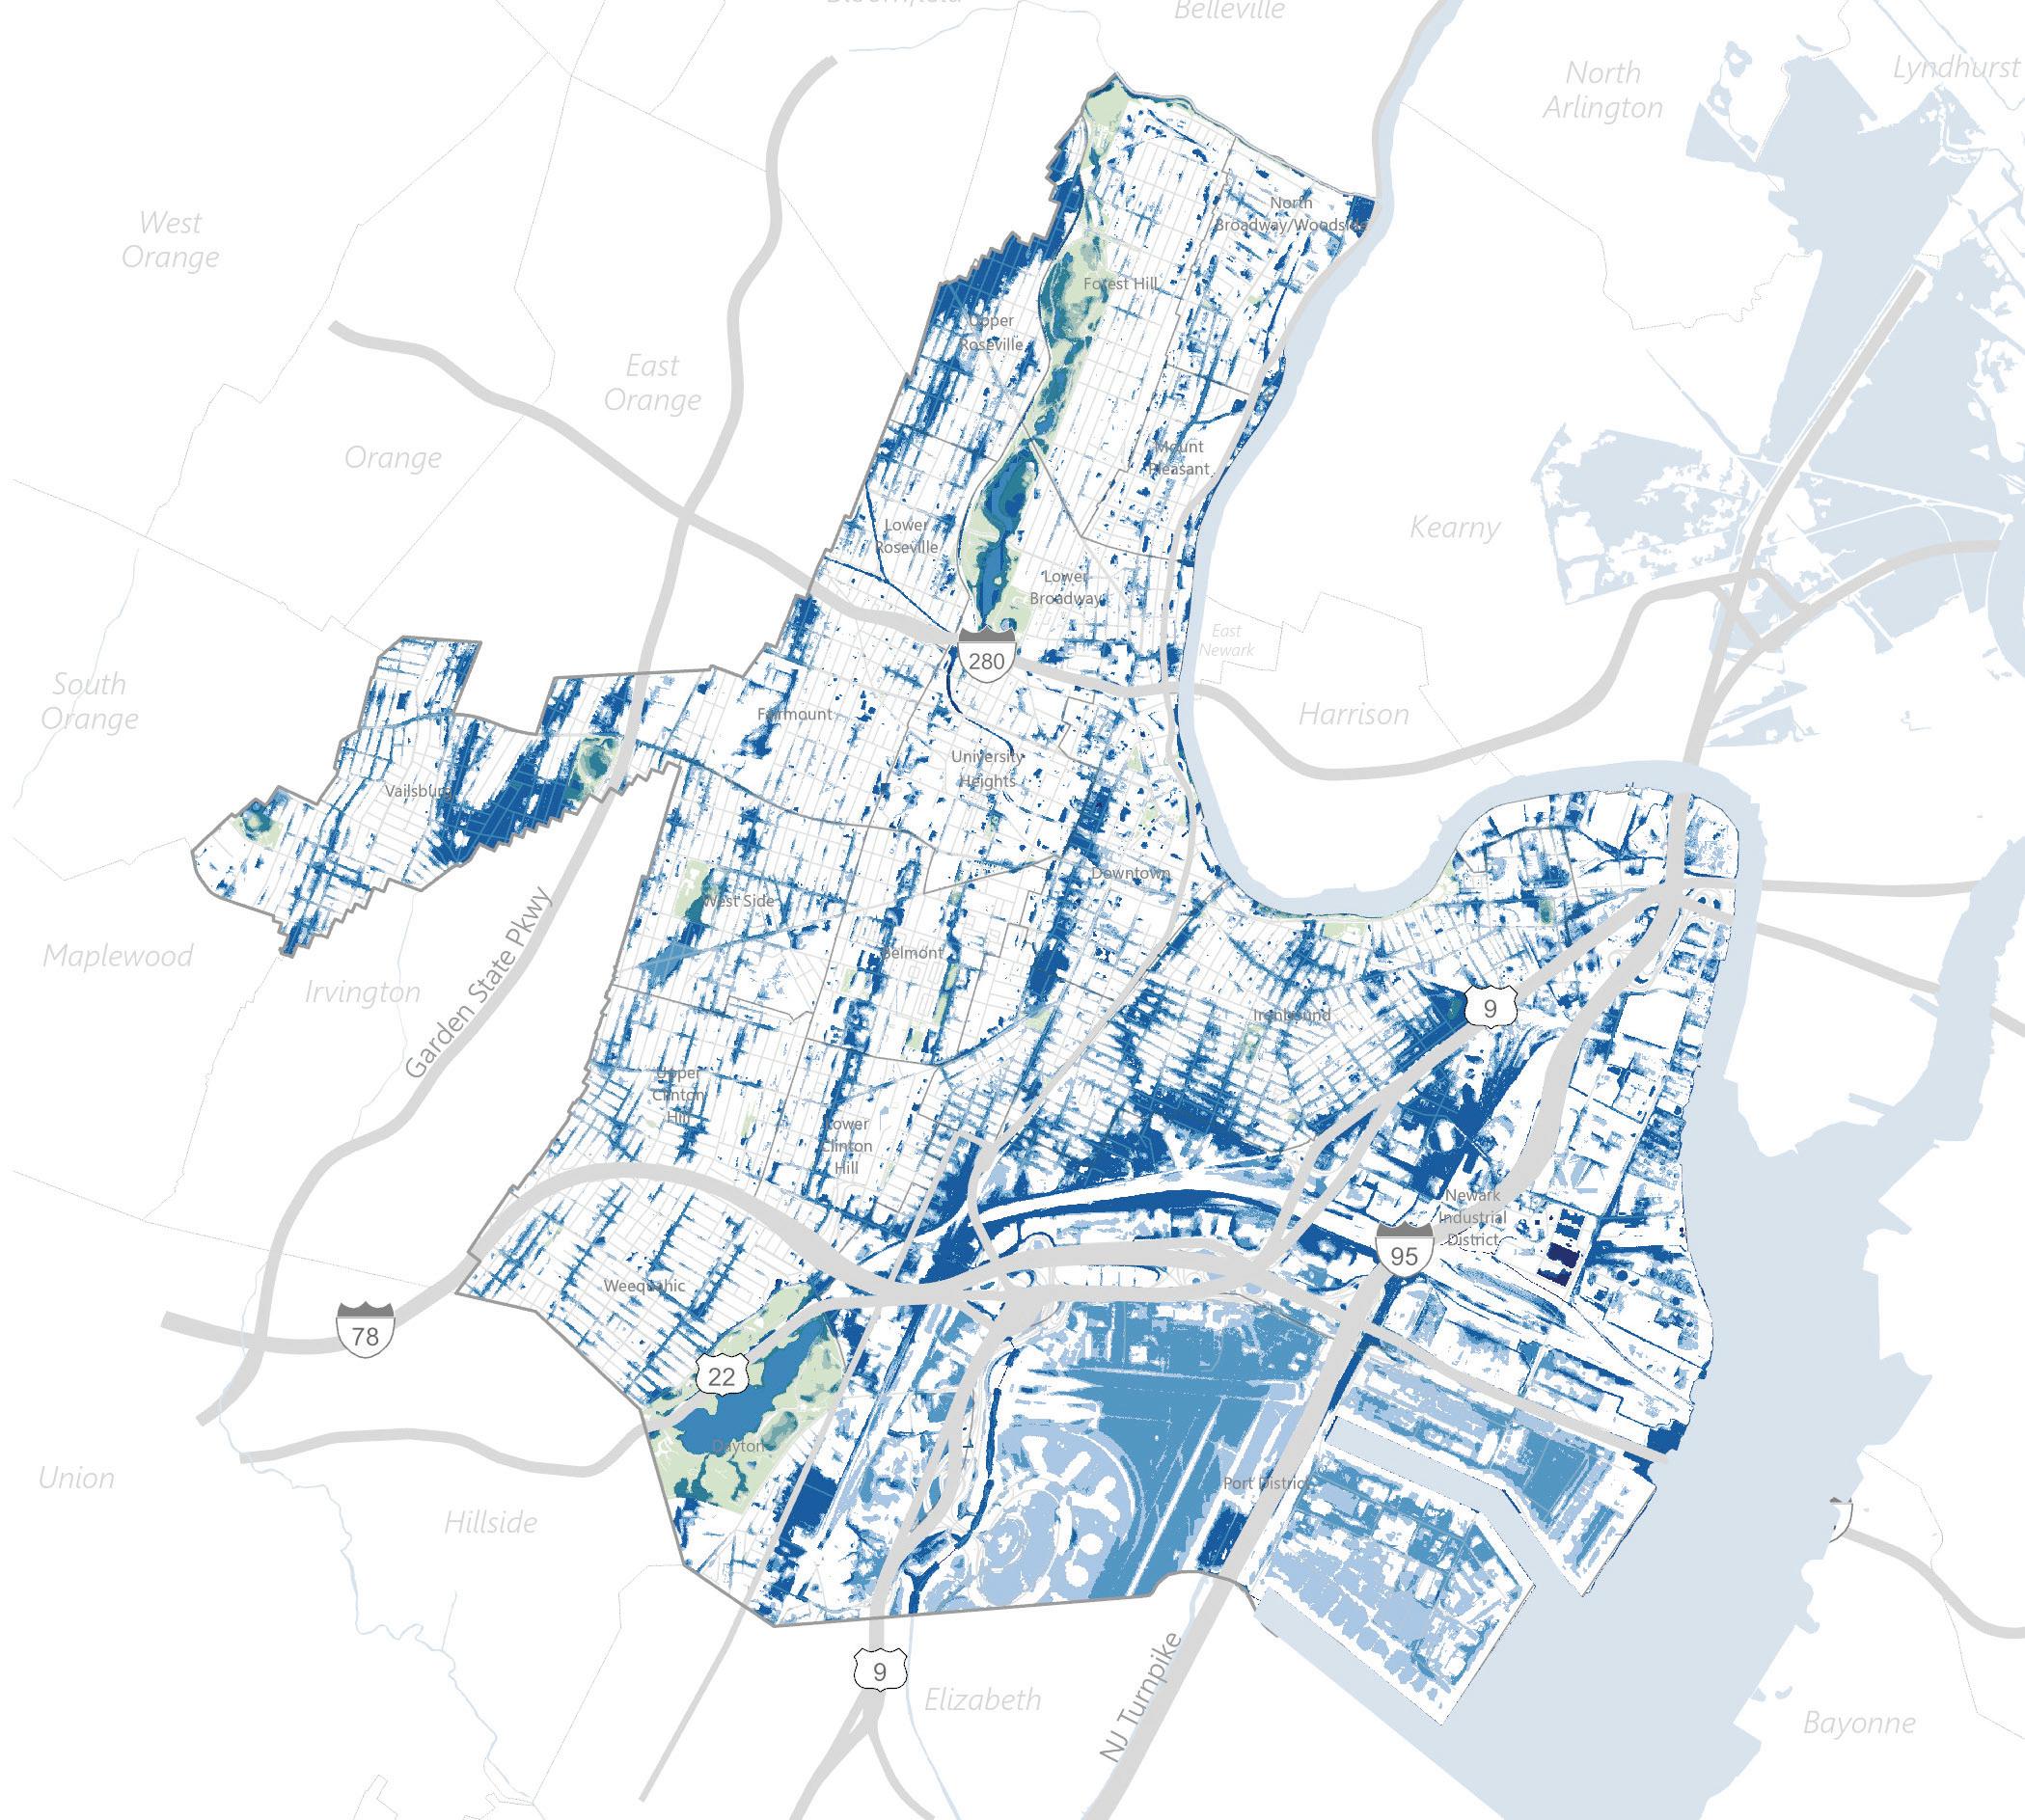
the last two decades, with dry years recorded 17% less. 32 By 2050, Newark is projected to experience a 4–11% increase in annual precipitation with a higher intensity and frequency of tropical storms, rainfalls, and related floods. 33 A record level of 65 inches of precipitation – almost 40% above the centennial normal – was detected in 2018. Future annual totals are expected to exceed these records.34
Cloudburst events can lead to flash flooding, with the potential to cause damage to properties and infrastructure, disrupt daily activities, and pose a hazard to human life and safety. In particular, flash flooding is a major concern for the reliability of Newark’s transportation infrastructure and connectivity, since it can restrict the mobility of all residents, workers, and visitors moving through the city.
Figure Modeled rainfallFlash flood extent (2%, 2hr rainfall event)
Figure 4 Modeled rainfall flooding < 1ft
1-2ft 2-5ft 5-10ft > 10ft
FIGURE 05. Damages from rainfall flooding
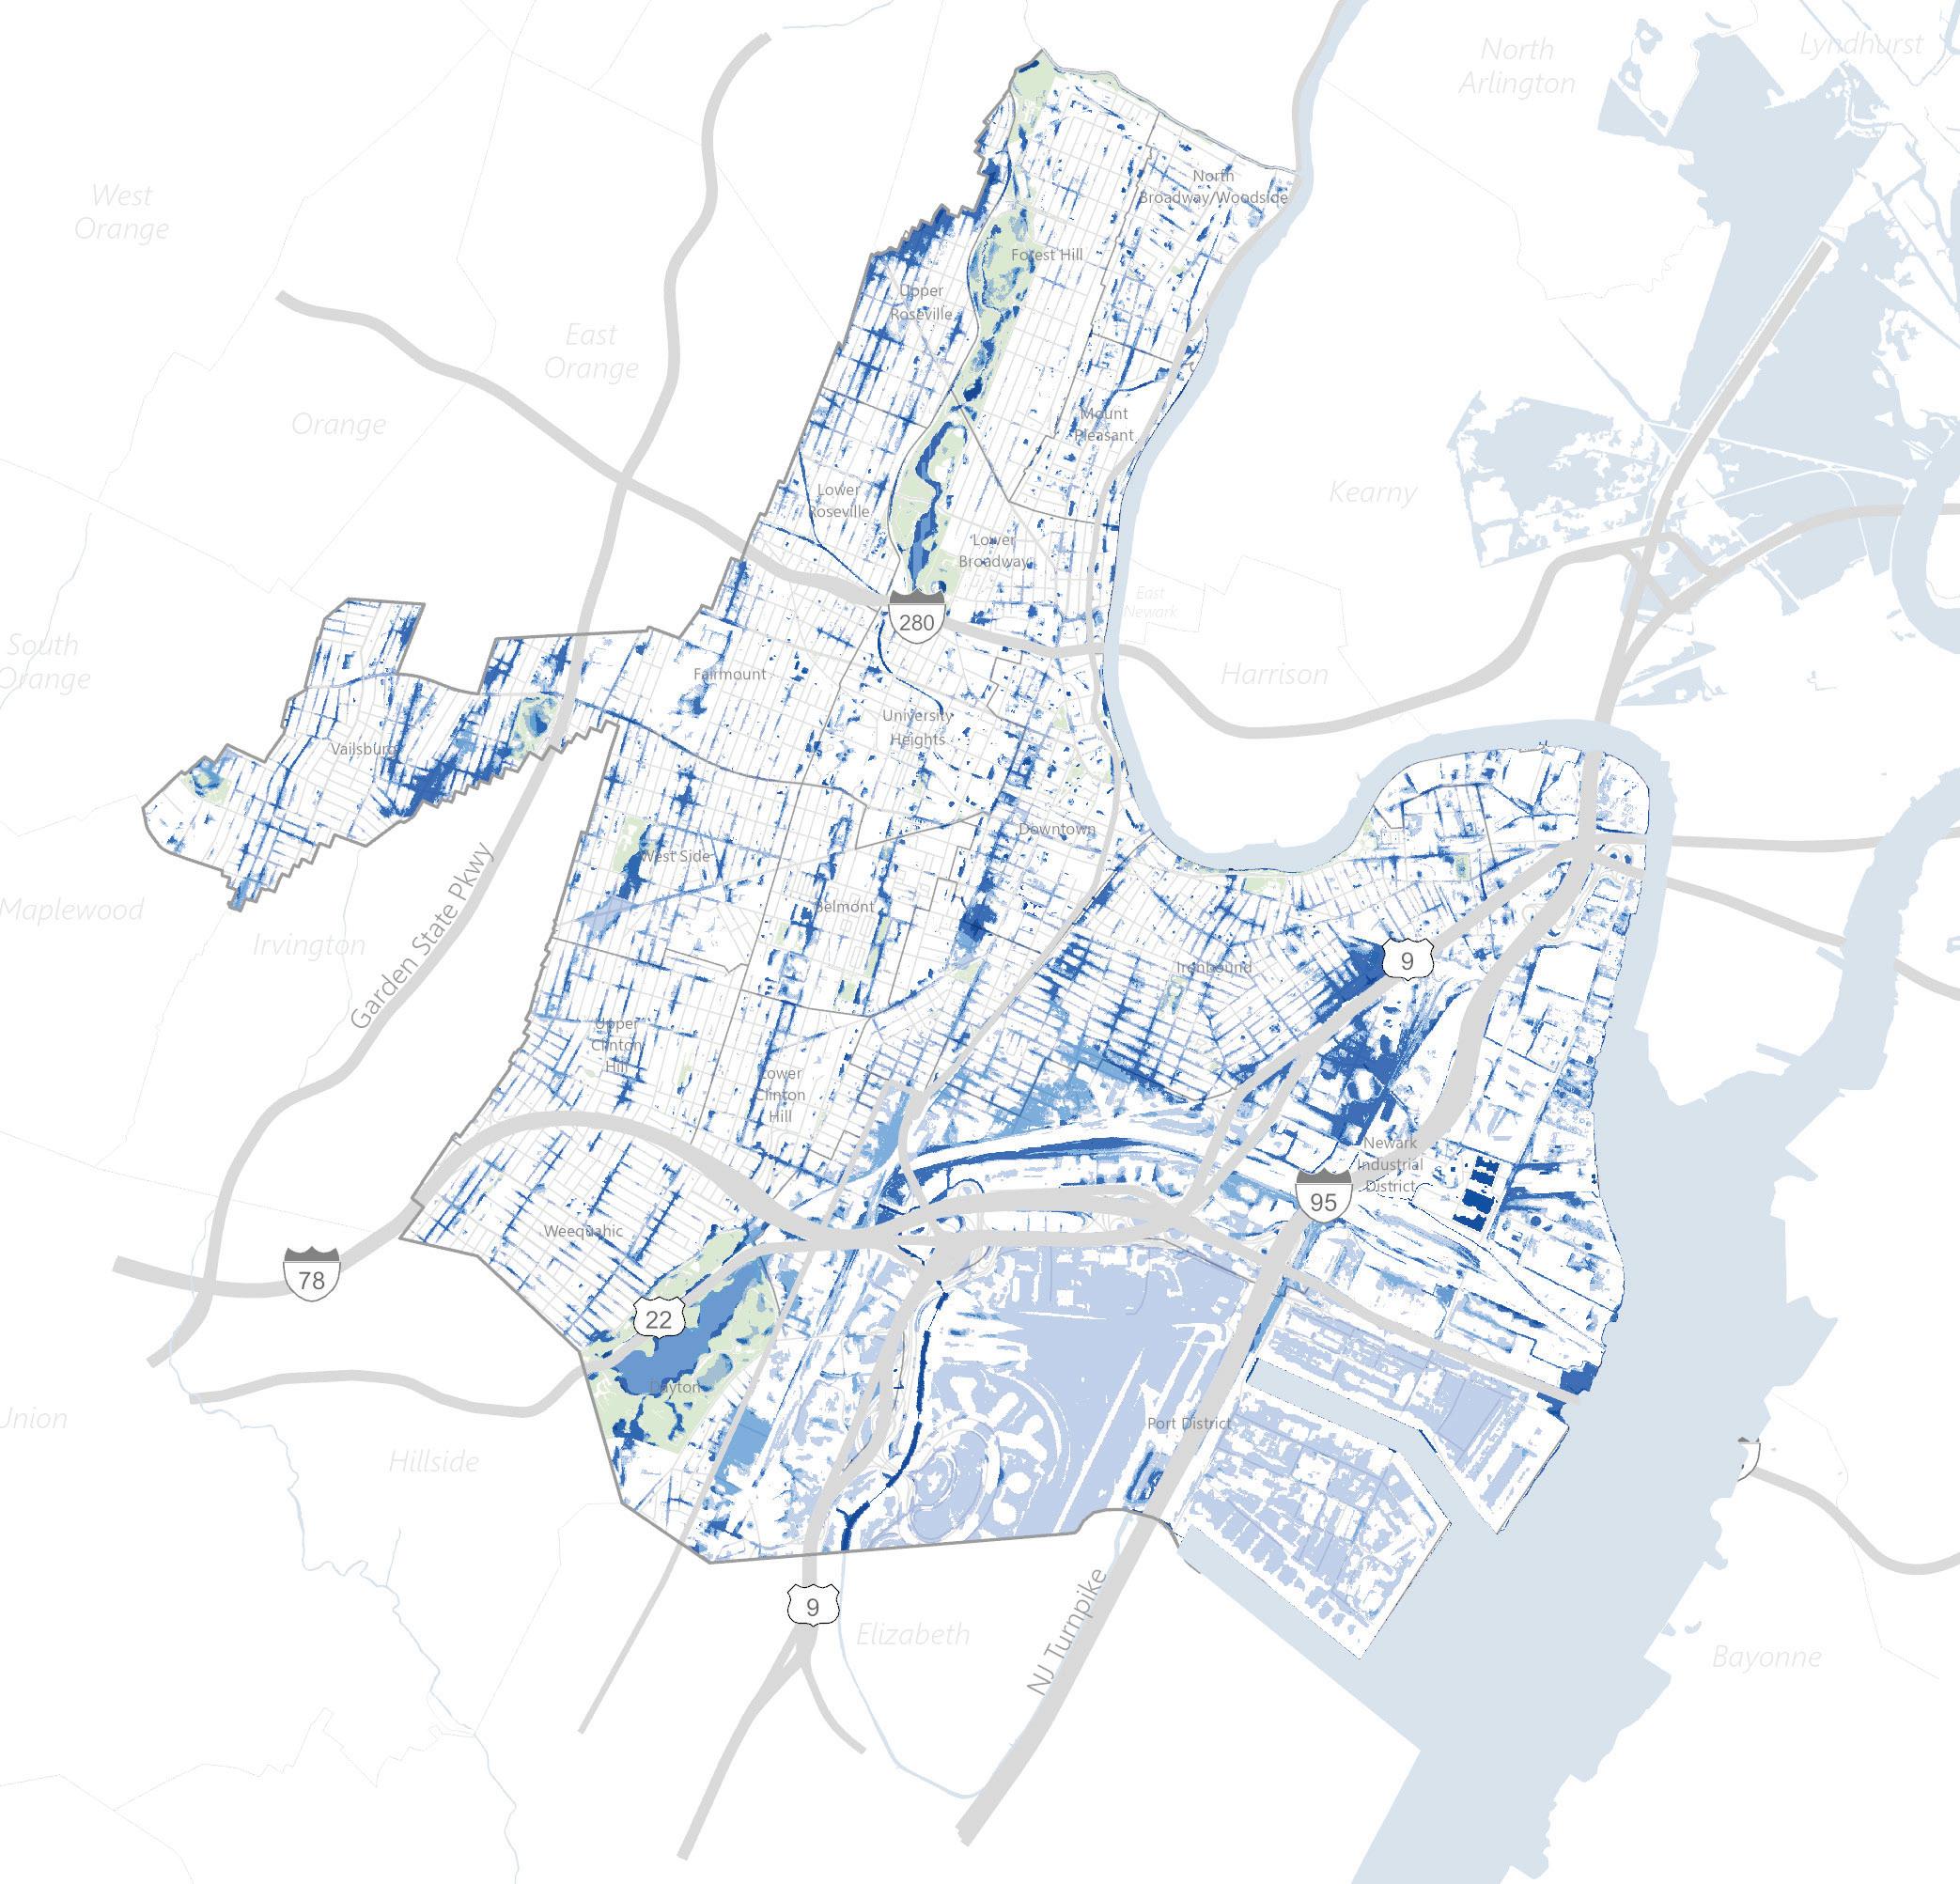
Figure 5 Modeled tidal and coastal flooding 39
Hurricane Sandy high water mark + 2.4ft sea level rise (2070)
< 1ft
1-2ft
2-5ft
5-10ft
> 10ft
Mean higher high water + 2.4ft sea level rise (2070)
< 1ft
1-2ft 2-5ft 5-10ft > 10ft
Climate change is contributing to more intense tropical storms and an increase in the annual number of severe coastal storms. 3637 Coastal storm surge already affects the Newark waterfront along the Hudson, Hackensack, and Passaic Rivers, as well as areas fronting Newark Bay. During Superstorm Sandy (2012), a 12-ft storm surge caused flooding even in inland areas of the city. Sea level rise and higher daily tides will translate to greater flood risk in Newark’s coastal zone in the coming decades.
Superstorm Sandy exposed the vulnerability of Newark’s coastal zone and critical assets to storm surge and coastal flooding, including the Newark-
Elizabeth Marine Terminal, Newark Airport, the Ironbound neighborhood, as well as residential areas along the Northeast Corridor and industry in Doremus (see Fig. 61, page 71 – Newark Today). While sea level rise is not projected to expand the footprint of flooding significantly during coastal storm events, it will contribute to making severe events more common and the floodplain deeper. The USACE Newark Flanking Plan, currently in development, aims to partly address coastal flood risk for the East Ward, including 1,640 buildings in which 32,100 residents live, for a total of $4.59 billion in avoided losses 38
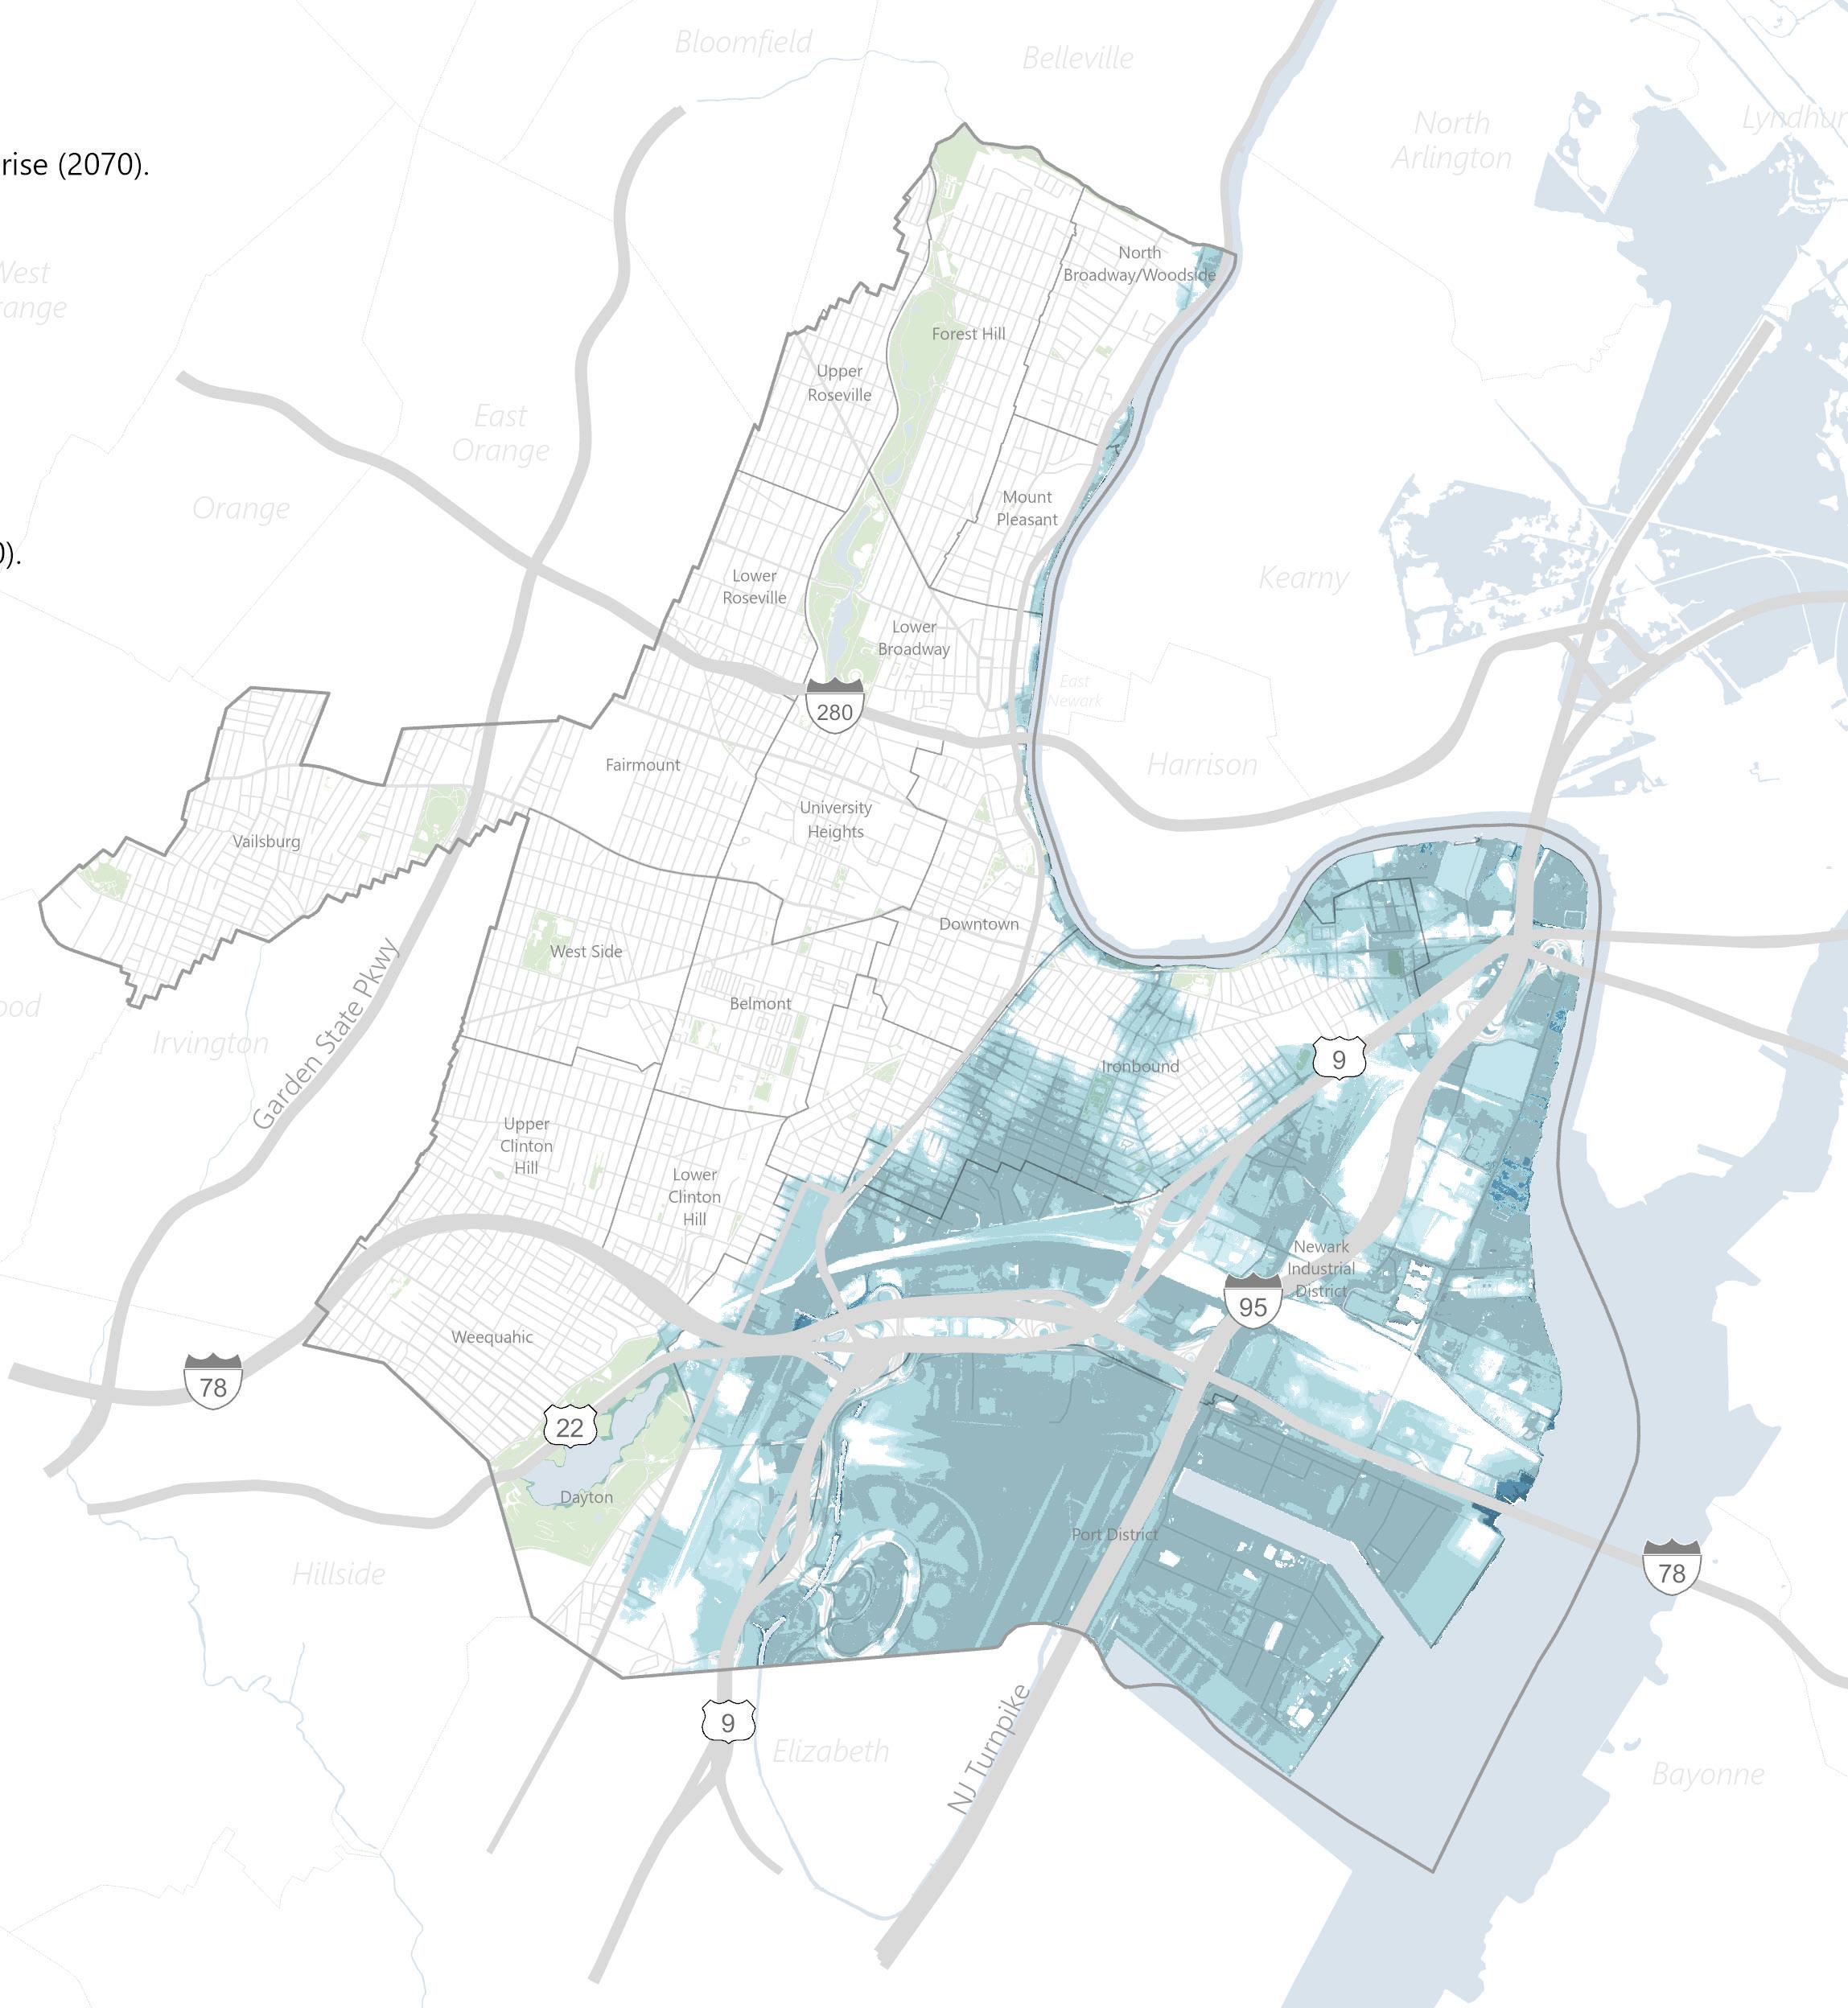
Figure 7 Projected 2070 damages due to coastal storm surge (modeled Superstorm Sandy event + 2.4ft sea level rise) 41
Extreme heat is the deadliest climate hazard in the U.S. today on an annual basis. Increasing greenhouse gas concentrations in the atmosphere contribute to heat trapping and result in the greenhouse effect. Annual average temperatures are climbing at an accelerating rate, and heatwaves are becoming more frequent and longer in duration. This is especially true in highly urban areas where heat accumulating surfaces drive urban heat island effect. The effects of these events include higher energy consumption, air pollution, water loss, and negative health impacts, especially related to the respiratory and cardiovascular diseases.
Newark already experiences disproportionate impacts from heat; a 2021 study found Newark to have the second highest heat intensity in the U.S. 42 Human-induced transportation, industrial, and air conditioning heat emissions coupled with a lack of tree canopy and extensive paved surfaces foster rising temperatures. Newark surface temperatures
are currently 10 - 20°F greater than adjacent suburban and rural communities, and up to 15°F greater in the hot spots than in the green areas.43 Extreme surface temperatures of 100°F and higher have been detected in 12 city locations, including areas of concentrated impervious surfaces, synthetic turf fields, parking lots, and other dark surfaces. 44 The lack of trees and vegetation reduce natural cooling via evapotranspiration and shading public spaces and buildings.
The average annual temperature increases projected for Newark exceed average rates in the Northeast region and globally. Historical observations show an approximate increase of 3.5°F annually in New Jersey between 1895-2019. By 2050, warming is projected to increase by 4.1 – 5.7°F, with longer expected heatwaves and a 55% increase in correlated mortalities.45 Approximately 70% of future summers are expected to be hotter than the warmest current summers. 46
Sea level rise in the coming decades will change groundwater levels and contribute to saltwater intrusion, particularly in coastal areas. The rising water table can also exacerbate other climate change impacts, such as drought, flash floods, and water supply challenges. While Newark receives its drinking water from inland sources, changes in groundwater levels can increase the risk of groundwater and soil contamination and increased health risks in areas of wastewater discharge (i.e., close to the Passaic River).48
Newark contains seven separate watersheds within three distinct watershed management areas: Lower Passaic & Saddle; Hackensack, Hudson and Pascack; and Arthur Kill. Discharges in these areas and by extension water quality are impacted by watershed management in adjacent areas to the west, which demands a regional approach to pollution mitigation.4950
Groundwater level rise and saltwater intrusion are expected to impact buildings and infrastructure in the coming decades. Basements will be subject to increased hydrostatic pressure and groundwater infiltration, while community assets and underground infrastructure will be exposed to higher rates of corrosion, stormwater and wastewater systems will face declining capacity, and soil and wastewater contamination carried by rising water may affect the sources of drinking water causing health threats.51
Droughts are less frequent environmental events in the northeast compared to inundation risk. Nonetheless, climate change is causing more frequent dry periods due to increased evapotranspiration and soil dryness. 52
The potential impacts to Newarkers include reduced water supply for irrigation and other non-potable uses, food availability, and energy production. New Jersey’s most recent severe drought occurred between October 2016 to April 2017. 53 While average annual precipitation is expected to increase, climate projections indicate that Newark may experience more intense dry periods between storm events in the future.54
Several types of droughts are expected to impact Newark’s region in the coming years: meteorological drought (average precipitation in a region), hydrological drought (decreased precipitation, affecting streamflow, soil moisture, and groundwater recharge), and agricultural drought (when water supply cannot meet crop demands). Drought conditions can bring permanent changes to the water supply statewide.
Increasing average temperatures and changes in precipitation patterns are projected to trigger increased energy consumption and lead to deteriorating atmospheric conditions in the coming decades. Smog and poor air quality are additional risks, caused not only by soil erosion and dryness but also potentially by wildfires in other areas of the state.
Vehicle emissions not only contribute to climate change by producing carbon emissions but also contribute directly to poor air quality. Vehicles driven on Newark’s roads produce approximately 2,100 metric tons of carbon dioxide equivalents (MTCO2e) daily or 750,000 MTCO2e annually – the equivalent of burning over 410,000 tons coal.56 As a city bisected by highways and with extensive land area devoted to airport and port facilities, Newark faces the persistent impact of transportation-driven pollution that affects both human health and the City's precious if limited natural resources. Socially vulnerable Newarkers and especially children (who are highly susceptible to respiratory deceases) face a disproportionate impact from transportation infrastructure that is mainly utilized by non-citizens. Sandwiched between major roads and transportation facilities, the Ironbound neighborhood is especially affected by pollution from motor vehicles.57
An increasing risk of wildfire regionally creates a local risk in Newark for airborne small particulate matter (PM2.5) and ozone. 58 In the State of New Jersey, 1,500 wildfires contribute annually 7,000 acres of forest loss and damage with corresponding threats to adjacent communities.59 The observed magnitude of risk is growing and expecting to accelerate. In Essex County, 30% of the total land area (total population 103,635) is located in low to moderate wildfire hazard areas, and 2% of the land area is classified as high to extreme wildfire hazard (total population 5,196).60 Associated health issues include severe respiratory sicknesses such as lung cancer, chronic obstructive pulmonary disease, cardiovascular disease, and asthma. These threats disproportionately affect vulnerable communities lacking access to healthcare.
Longer warm seasons bring with them an increased risks of infectious diseases (such as Covid-19) along with the conditions for diseases borne by mosquitos and ticks, such as Lyme disease. As of 2017, New Jersey ranked second nationally for confirmed Lyme cases, with an 8.8% increase between 2007 and 2019. Disease risks for urban populations are increasing as well, with warming temperatures and flooding contributing to a growing population of the Asian Tiger mosquito, which can carry the West Nile Virus. 61
Ecosystem health is closely connected with regional climate resilience. Rising temperatures are transforming habitat conditions and viability as well as driving habitat migration. Newark possesses limited natural areas and fragmented habitats today; the City’s primary habitats are its parklands, Passaic riverfront, and Newark Bay. Native species extinction is undermining the stability of these riverine and coastal ecosystems. New Jersey has articulated a state priority to return degraded natural resources to a functioning status and support wildlife corridor connectivity.62 Newark falls into the Passaic and Hackensack Rivers Conservation Focal Areas (CFAs): habitats for multiple keystone bird species as well as urban peregrine sites. 63 The animals that live in these CFAs support the whole ecosystem, making these areas especially vulnerable and recommended for biodiversity protection and conservation.
The City of Newark contains some of the most socially vulnerable census tracts in the state. Social vulnerability “refers to the degree to which people can expect to be challenged when faced with significant disruptions.”64 The Centers for Disease Control and Prevention provides estimates for aggregated social vulnerability to define the degree of socio-economic challenge at the census tract level. The CDC’s Social Vulnerability Index is based on 15 factors, including poverty, unemployment, high school attendance, percentages of older and younger populations, people with disabilities, single-parent households, racial minorities, English proficiency, housing types, etc.65 Social risks overlayed with the climate challenges put an increased burden on some neighborhoods. As such, Lower Clinton Hill, Lower Roseville, Mount Pleasant, and parts of Ironbound and North Broadway have the highest rates of housing insecurity in the US.66
This vulnerability assessment introduces a comprehensive estimation of risks communities experience, bringing together the following factors at the parcel level: CDC SVI, major health issue indices, and overburdened community groups under
the NJ environmental justice law. It incorporates environmental health conditions, for example the proximity to contaminated sites and the distance to publicly-owned green spaces. Newark’s most socially vulnerable areas are located in the Central and North Wards, whereas climate hazard related threats are concentrated now and in the future in the East Ward. Each of the wards, however, faces risks from climate events and other hazards; prioritizing climate preparedness and investment in critical assets will be key to support Newark communities in increasing resilience to climate hazards and supporting disaster recovery.
Looking toward the coming decades, climate change not only has the potential to exacerbate existing social vulnerabilities but also to precipitate migration, both from more climate vulnerable places abroad and within the U.S. Newark has a significant foreign-born population (32.5% as of 2021 vs. 13.5% nationally), which is indicative of the strength of Newarkers’ connections abroad. As a city with relatively robust water resources and a relatively cooler climate for the continental U.S., Newark may need to plan for climate-driven population growth as part of its housing strategy.
Areas vulnerable both to extreme risk and high flood risk
Urban heat island effect
Extreme heat areas over 100F
Extreme heat areas over 95F
Heat impacted areas without access to green space
Tidal flood extent (MHHW levels-projected 2070)
Coastal flood extent (Superstorm Sandymodeled 2070)
Flash flood extent (2%, 2hr rainfall eventmodeled current)
Areal flood extent (1%, 24hr rainfall eventmodeled current)
Moderate
High
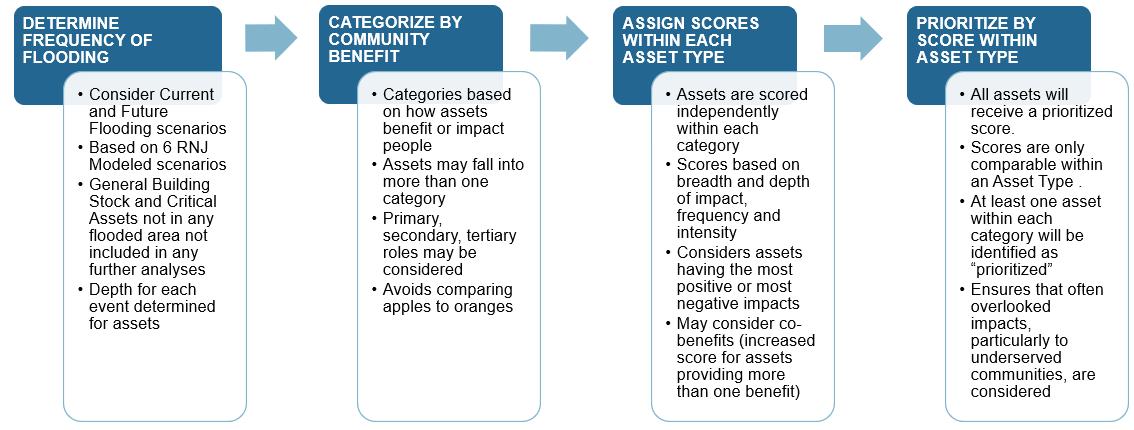
The prioritization methodology ranks assets within different asset types and associates them with community benefit categories.By prioritizing assets within an asset type, decision makers can see which assets within a type are more impacted by flooding. This also keeps the prioritization objective as ranking across asset types would require someone to say, for example, that a school is more important than a hospital or vice versa–and there’s no fair way to make that comparison.
The adaptive capacity and resilience of Newark communities and built environment depends in large part on the City’s critical infrastructure and community assets. The primary climate-related factors affecting these assets spatially are flooding and extreme heat. This vulnerability assessment draws on Resilient Northeastern New Jersey’s methodologies, which look at existing community assets and their projected exposure to three types of flood events (combining current and 2070 models) to assign a relative priority to each. Unlike for flooding, there is not a specific methodology to build spatial projections for future extreme heat impacts, therefore the assessment uses current data to identify the areas of highest environmental vulnerability.
Resilient NENJ established categories of community assets and uses a ranking method to prioritize within each. These categories include infrastructure, emergency facilities, public health, quality of life, and environmental health. Comparison within each asset
category helps identify a short list of core elements for infrastructural resilience, but any prioritization across asset types would require additional engagement of community members and local decision-makers.
By considering their community benefit categories, we ensure that decision makers can make decisions knowing how the assets support the community. That way, assets that are often not considered during a typical risk assessment, like those supporting quality of life and the impact on ecosystems.The figure below provides an overview of the asset prioritization process. Specific details are provided in sections discussing assigning asset scores and prioritizing within categories.
Critical assets are defined as essential to sustain a community through a disaster and are especially important to the protection and recovery of vulnerable groups. 69 Resilient NENJ’s assessment includes an assessment and prioritization of:
Asset types includeitems which are considered important due to their role in community safety, their contribution to critical utilities, or their importance being highlighted by community member input.
● 129 infrastructure assets (transportation, utilities, water supply),
● 78 emergency response facilities (shelters, police, and fire stations),
Asset types in Resilient NENJ include:
● 315 public health services (hospitals, schools, and community centers),
Airports
● 416 community quality of life services (libraries, worship places, and community gardens),
Bike Lanes
● 57 parks, and
Bus Routes
Cemeteries
Commuter Rail EMS Fire stations
● 75 flood protection assets (including 69 green infrastructure projects and 6 urban amenities)
Child care centers
Heavy Rail Hospital and medical centers
Colleges
Hurricane Evacuation Routes
The report includes planned flood protection infrastructure as a separate asset category and estimates the vulnerability levels of these future assets.
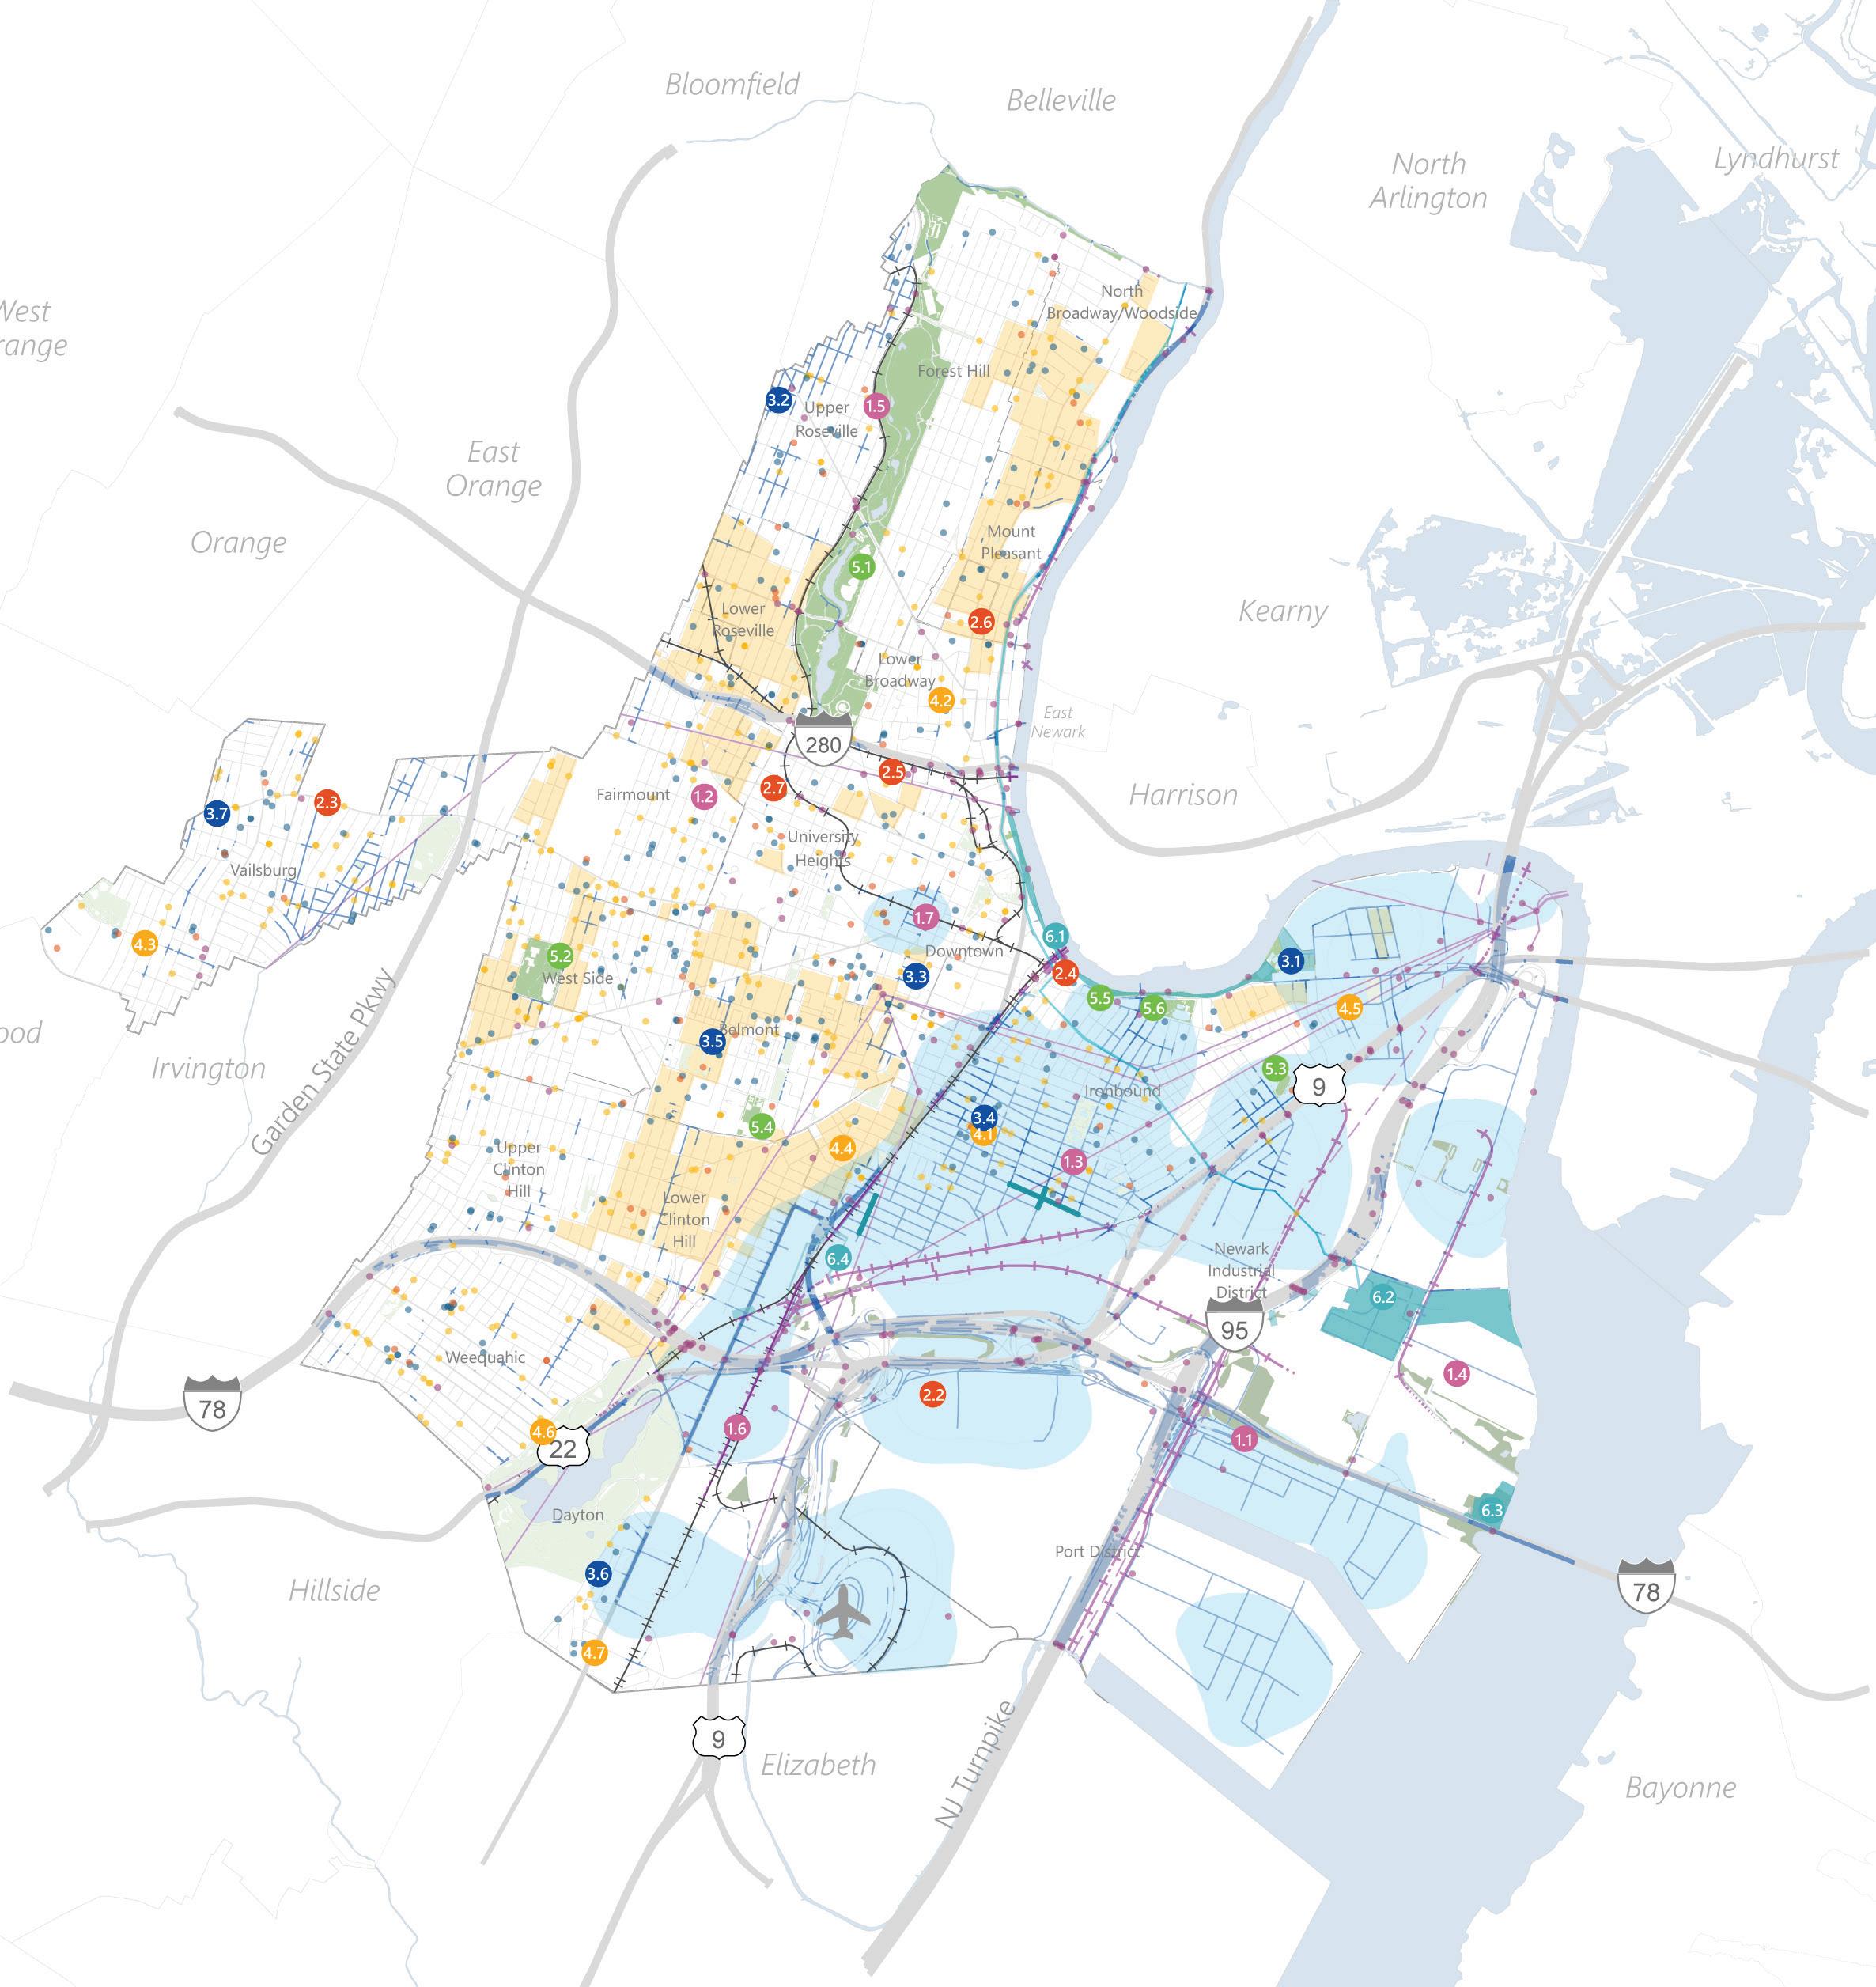
The table below highlights the assets within six classes, prioritized according to the Resilient NENJ methodology and their exposure to current and future hazard events.71 The prioritized score is calculated by multiplying the risk exposure score by the breadth score for each asset type. The exposure ranking method combines projected parameters by multiplying expected depth scores by an estimated frequency score.72 Urban heat island effect is less geographically determined due to the multiple variables controlling for atmosphere temperatures. UHI exposure is ranked according to:
◌
1: areas with summer temperatures higher than 95F,
◌
2: areas with summer temperatures higher than 95F and lacking access to green space, and
◌
3: the areas with summer temperatures higher than 100F
The same principle is applied to assess Newark’s highest environmental vulnerability areas (see pg. XX).
1.1 18.6Substations Port street East 0005 50
1.2 18.6Substations Unknown 172895 West 2000 21
1.3 18.6Substations Ironbound East 0005 50
1.4 11.2Substations Unknown 133201 East 0003 30
1.5 2Rail Stations Davenport Ave. North 6600 120
1.6 1Light Rail Newark Airtrain East 6407 171
0.5Rail Stations Washington St Central 2000 21
150Hurricane Evacuation RouteNew Jersey Turnpike East 3303 93
12Shelters Newark, 1 Brewster Road East 2207 113
12Shelters Boylan Recreation Center, 926 S. Orange Ave West 6400 100
4.7Police Stations NJ Transit Police Department, 1 Penn Plaza East East 0005 50
3.8EMS Newark Fire Department Rescue 1, 191 Orange St. Central 2000 22
2.3Shelters Technology High School, 223 Broadway Central 2200 40
0EMS Inner City Transit Medical Transportation, 371 Central AvenueCentral 2000 21
27.8Public Housing Terrell Homes, 23 Riverview Terrace East 2205 90
3.3Hospitals and Medical CentersColumbus Hospital, 495 N 13th St North10400 140
1.6Child Care Centers The Chen School, Inc., 24 Maiden Lane Central 2000 20
0.9Child Care Centers Story Hall Daycare Center, 158 Chestnut St. East 0005 52
0.7Hospitals and Medical CentersThe Health Center at Central High School, 246 18th Ave Central10600 161
0.5Hospitals and Medical CentersThe Rainbow Room - Dayton Street School, 226 Dayton St. South 4400 80
0.5Child Care Centers Zone Four, 1132 South Orange Avenue West 4000 40
of Worship Spiritual Assembly Of The Bahais Of Newark, 93 Vesey St. East 0005 52
of Worship Iglesia De Dios En Espiritu y En Verdad, 65 Mlk Central 2000 20
of Worship Household Of Faith, 105 Norman Rd West 2200 40
of Worship Ministerio Bethel International, 78-88 Pennsylvania Ave East 2000 21
East 0003 31
South 2000 20
South 2000 20
North/Central131200 260
West141000 241
East101005
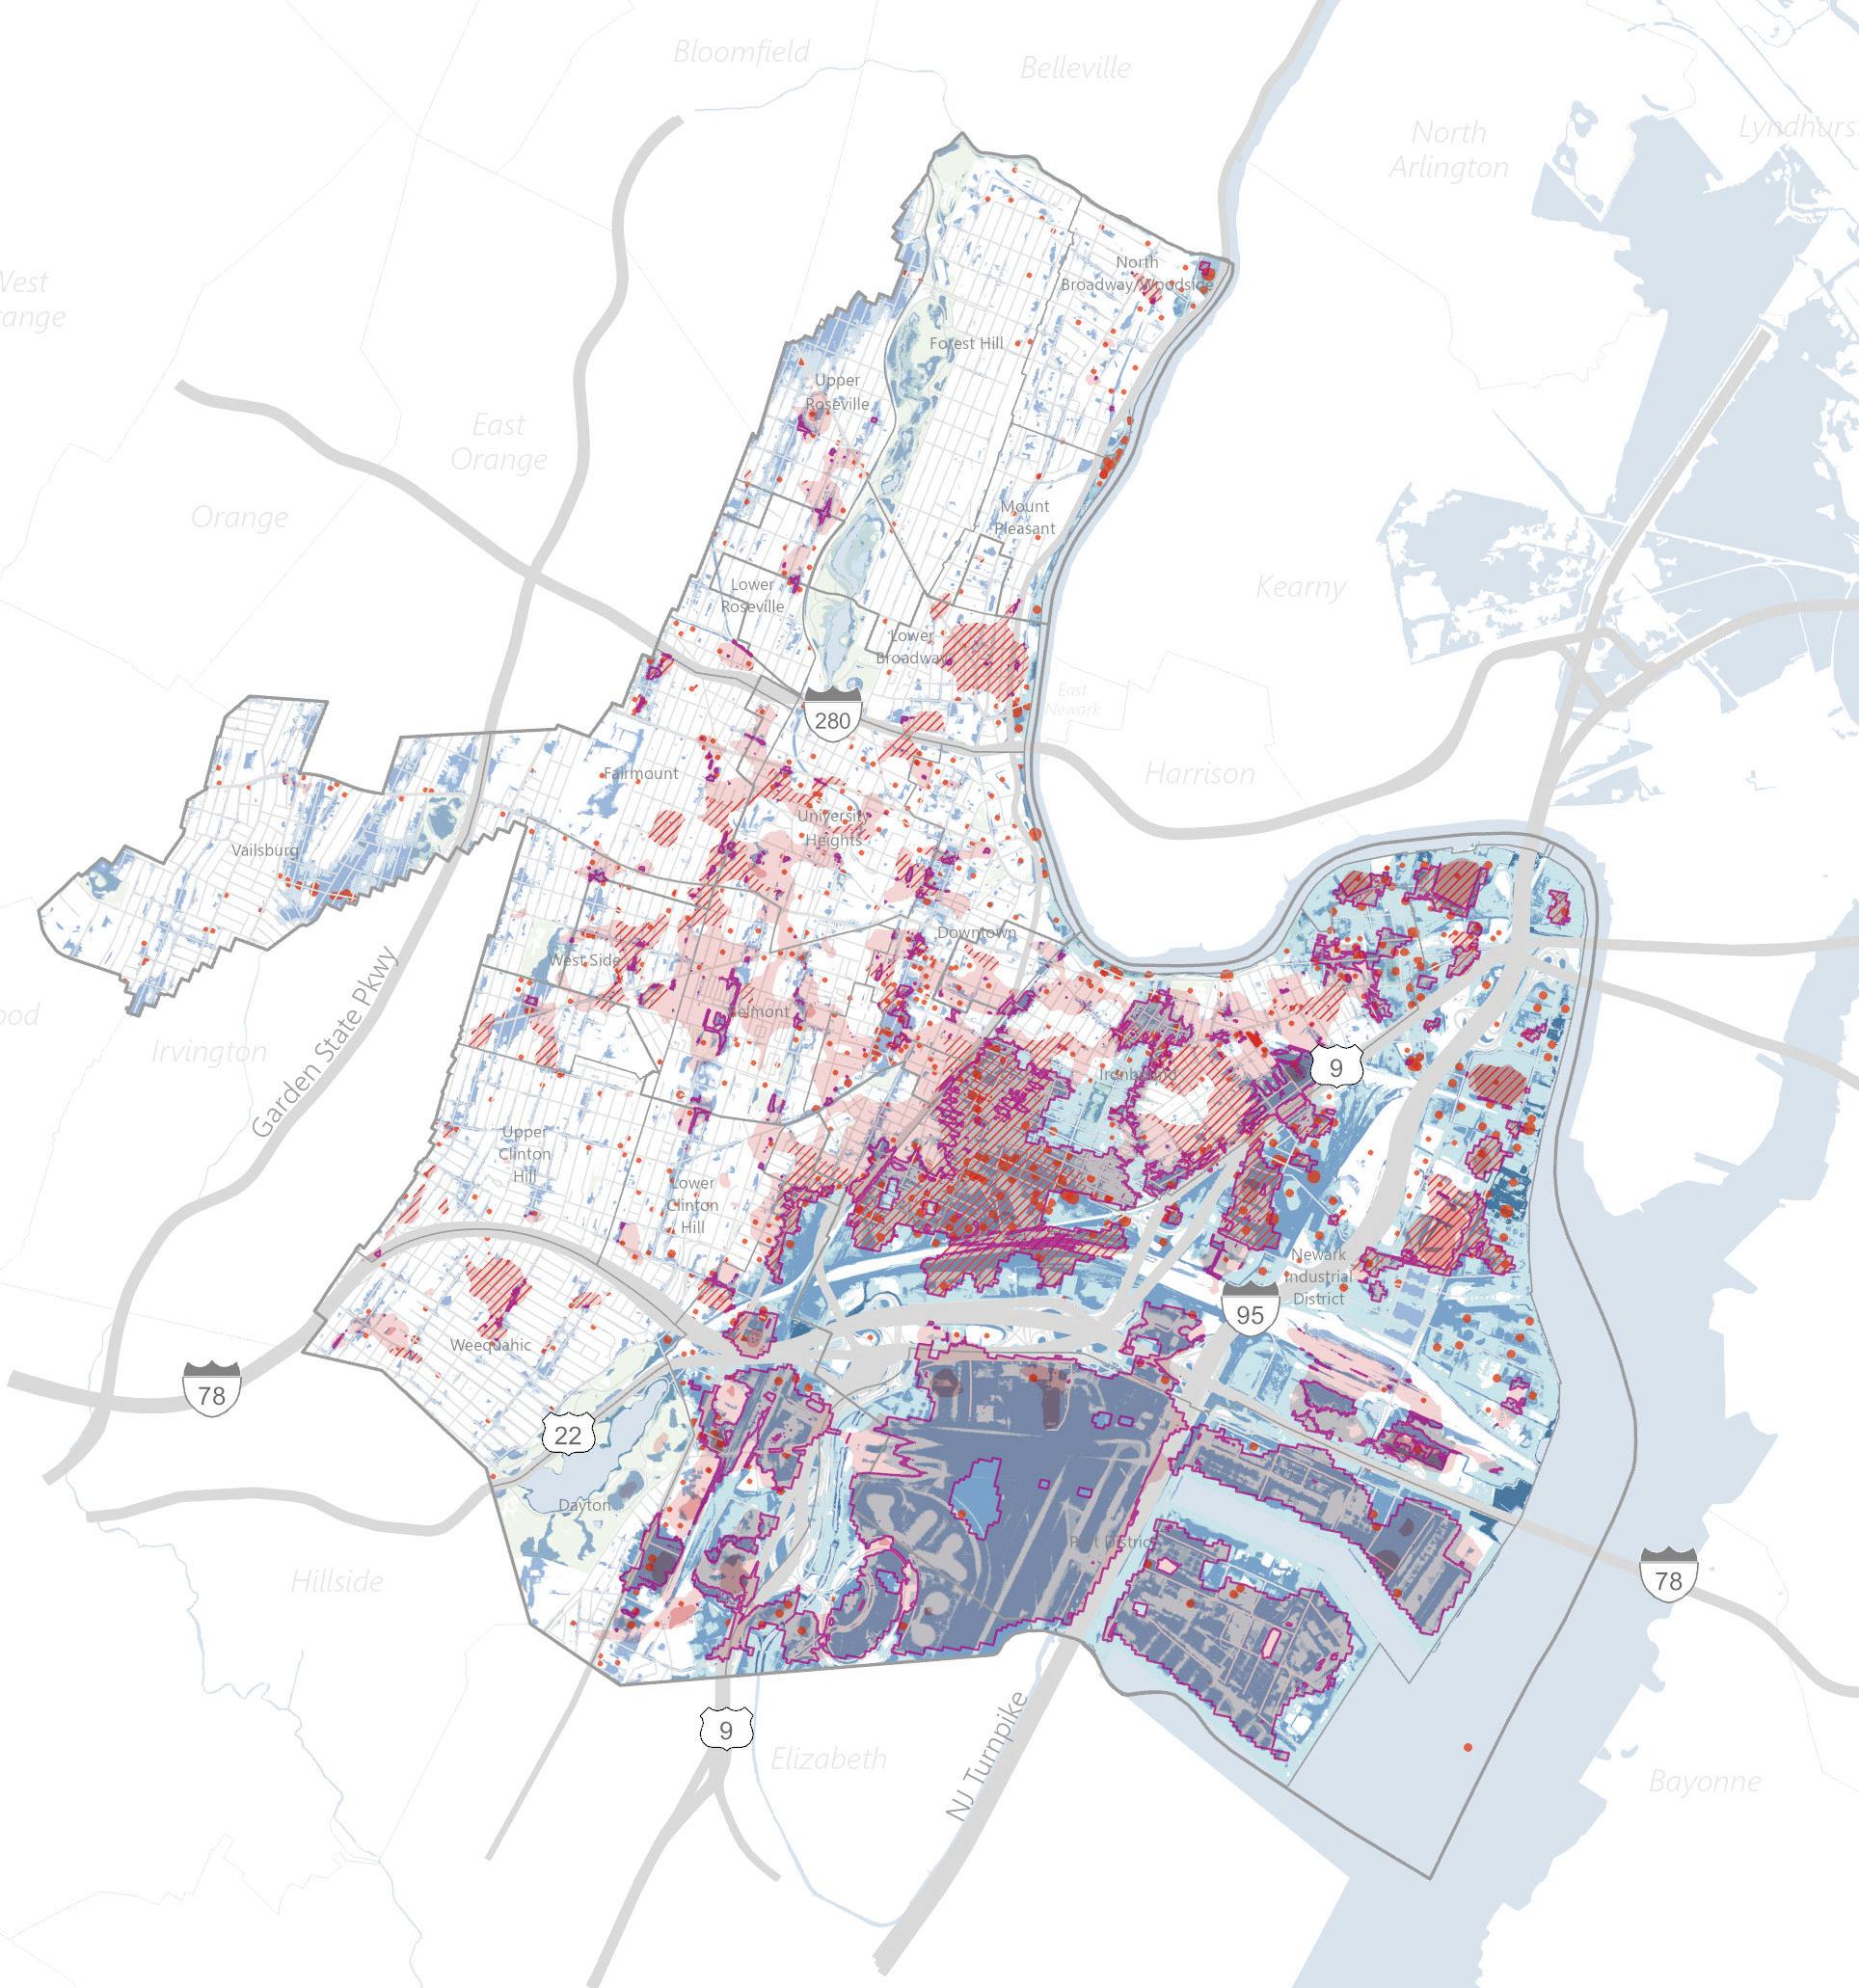
This approach is focused on the community infrastructure capacities, drawing from the short list of assets. This report adds an additional spatial dimension of vulnerability evaluation. The areas of highest vulnerability help focus sustainable development on the most socially, environmentally, and economically threatened parts of the city, prioritized, and tailored according to local needs. The most environmentally vulnerable areas are prone to climate risks from several events with the exposure scores over 30 according to the RNJ methodology –
75
Priority assets
Infrastructure Emergency response
Public health
Quality of life Parks
Flood protection
Infrastructure Emergency response
Public health
Quality of life Parks
Priority parks (per RNJ ranking)
Flood protection
Light commuter rail
Repeated flooded rail lines
Repeated flooded streets
Natural gas pipelines
Transmission lines
Vulnerable areas
Socially vulnerable (SVI over 95%)
Economically vulnerable (>500M$/sqm projected losses-2070)
overlayed with UHI scores of 2 or greater. The areas of greatest social vulnerability are residential zones with a Social Vulnerability Index of 0.95 and higher.74 Areas of economic vulnerability are projected to bear direct damages of greater than $500M per square mile. According to the assessment, economic vulnerabilities and environmental risks are concentrated in the East Ward, and blocks with high social vulnerability are distributed across the North, Central, and the South Wards.
Newark’s assets and vulnerabilities include:
● 35.8 miles of major roads and highways that serve as evacuation routes – including Interstate 78, Highway 1, and NJ Turnpike – are at risk today and a 2070 projected coastal flood event. 7.7 miles of roads and highways are impacted by rainfall flood events, limiting access throughout the region and leaving communities without safe evacuation routes.76
● The main electric transmission lines pass through areas of extreme flood risk in the East Ward, increasing the risk of a major power outage.
● 12 city electrical substations are located in areas of severe flood risk; six are in high-heat areas.
● Power generation facilities providing 2,700 megawatts of power, as well as Wastewater Treatment Plants are at least partially exposed to projected flood events. Two of five major facilities are situated in the areas of extreme flood risk, and 2 are exposed to urban heat island effect.77
● 175 of 269 infrastructural assets are exposed to the flood risks with 80 of them in the areas of higher risks of over 10 scores.
● 49 of the infrastructural objects are in the high urban heat island areas, including 9 substations and 24 gas stations.
Transportation networks provide critical evacuation routes during major hazard events, but Newark’s highway corridors also create significant barriers to access major facilities. Moreover, Newark has among the lowest rates of car ownership nationally, with 39% of Newarkers lacking a personal vehicle.
Newark’s critical regional and national infrastructural assets – Newark Liberty International Airport and the Port of Newark-Elizabeth Marine Terminal, the largest on the East Coast – are vulnerable to coastal and rainfall flooding (about 1 ft during a rain event and 10 ft during a Sandy-type coastal storm in 2070, which risks overtopping the Airport floodwall). In addition, Airport and Port lands represent nearly 1/3 of the highest temperature locations in the city, posing health risks for adjacent neighborhoods. 78
Coastal storms and related flooding are projected to cause twice the value of direct damage as rainfall flooding. Newark’s floodplain extends from the shore of Newark Bay and the Passaic River to Route 21 and the Northeast Corridor rail line. The Passaic Valley Sewerage Commission treatment plant provides treatment for Newark and neighboring areas – the single facility to do so.
Shelters, hospitals, police stations, and fire stations support continuity of services and sustain key functions for communities during and after a crisis or disaster. Especially in the East Ward, many of these facilities are at risk of flooding during coastal storms, limiting their capacity to support disaster response and exacerbating the risks that socially vulnerable residents already face.79 Four of the seven primary emergency response facilities have flood exposure scores greater than 10, in addition to extreme heat exposure.
Community and public health facilities provide essential services to Newarkers, including preventive, urgent, and emergent healthcare services. The COVID-19 pandemic underscored the need for hospitals and other healthcare facilities to be accessible for Newarkers in all neighborhoods and highlighted the range of services these facilities provide. There are 315 public health facilities offering essential services to Newarkers, including hospitals, municipal buildings, nursing homes, childcare centers, schools, that also represent major centers of employment within the city. Many facilities remain dependent on City power, water, and sewer systems, as well as public transportation for patients’ access – and 75 of them are within the areas of flood exposure risk. Almost 1 in 3 of these facilities (108 total) are exposed to high urban heat risk, additionally threatening the access to healthcare.
Facilities such as libraries, places of worship, community gardens, and other neighborhood assets make an important contribution to community quality of life and provide gathering spaces that support building the interpersonal connections that reduce social vulnerability. Newark’s churches rank relatively lower for flood risk exposure than some other critical assets, indicating there is a potential opportunity to activate these facilities and their community networks in disaster response and climate education and adaptation.
Among Newark’s wards, the East Ward is the most vulnerable in terms of ecosystem health, with only around 40 acres of parklands, three of which Resilient NENJ considers prioritized assets. The South Ward contains the greatest park acreage (302 acres), while the most prioritized community assets are Branch Brook Park and West Side Park (267 acres and 21 acres, respectively). Apart from these park assets, Newark has very limited ecological resources and faces broad ecosystem vulnerability: for example, only 7.9% of Newark is covered by tree canopy, as compared to 40.3% of Essex County overall. Concentrations of trees around Branch Brook Park, Weequahic Park, and Vailsburg contrast with areas almost entirely devoid of tree cover in the Ironbound, Downtown, and areas east of McCarter Highway. These same areas are prone to highest summer temperatures, heightened air pollution, and limited stormwater capture infrastructure.80 Thousands of acres of the city lack access to green space; these places are vulnerable to both heatwaves and stormwater inundation due to their concentrations of impervious surfaces.81 Generally, the eastern half of Newark city lags behind the western half in tree cover and park access while containing the majority of highway assets, pollutiongenerating activities, and extensive impervious surfaces. 82
Facilities aimed at reducing coastal flood risks – currently in various design, planning at implementation stages – are primarily located adjacent to the Passaic River and to address flooding from Newark Bay. Superstorm Sandy demonstrated that these areas face the greatest exposure in Newark to coastal storm risk. South Street Area Drainage System Improvements, Newark Riverfront Park, and PVSC Resiliency Projects are mostly complete, with three other projects in planning or design. Across all five wards, 24 of 69 green infrastructure projects are currently under construction or complete, with the Central Ward leading in terms of implementation progress (10 out of 17) and East Ward leading in terms of total number (19).
Newark city agencies and staff have been extensively involved in regional resilience coordination through the Resilient New Jersey program. The following comprises a list of the key sources and data consulted in the development of the vulnerability assessment.
STATE
NJ Department of State Office of Planning Advocacy. (2001). State Plan: Statewide Goals, Strategies and Policies.
NJ Department of Environmental Protection. (2020). Water Quality Trends in Nutrients in New Jersey Streams, Water Years 1971-2016. https://www.nj.gov/dep/dsr/wq/water-quality-trends-nutrients-1971-2016.pdf
NJ Department of Environmental Protection. (2020). New Jersey Scientific Report on Climate Change.
NJ Department of Environmental Protection. (2019). Connecting Habitat Across New Jersey. https://www.nj.gov/ dep/fgw/ensp/chanj.htm
NJ Department of Environmental Protection. New Jersey Protecting Against Climate Threats. https://www.nj.gov/ dep/njpact/
NJ Department of Environmental Protection. (2021). Sea Level Rise Guidance for New Jersey.
NJ Geographic Information Network Open Data Historic Fill in New Jersey Layer. (1882). Library of Congress Topographical Map.
NJ Geographic Information Network. (2021). Unemployment Rates and Labor Force Estimates. https://www. nj.gov/labor/labormarketinformation/employment-wages/unemployment-rates-labor-force-estimates/index. shtml
NJ TRANSIT. (2021). NewBus Newark Study.
Office of the New Jersey State Climatologist. (2020). https://climate.rutgers.edu/stateclim/
Rutgers NJ Climate Change Resource Center. Vulnerable Populations Exposure Snapshot Newark. https:// climatesnapshots.rutgers.edu/0714/socialVulnerability/
Rutgers NJ Climate Change Resource Center. (2020). Sea Level Rise in New Jersey Projections and Impacts. https://njclimateresourcecenter.rutgers.edu/climate_change_101/sea-level-rise-in-new-jersey-projections-andimpacts/
State of New Jersey. (2019). All-Hazard Mitigation Plan. https://www.nj.gov/njoem/mitigation/pdf/2019/mit2019_ section5-4_Drought.pdf
Sustainable Jersey and the Sustainability Institute at The College of New Jersey. (2017). Urban Heat Island Assessment.
Resilient Northeastern New Jersey. (2021). About Our Region.
Resilient Northeastern New Jersey. (2022). Additional Climate Resilience Assessment.
Resilient Northeastern New Jersey. (2022). Additional Hazard Assessment.
Resilient Northeastern New Jersey. (2022). Critical Community Assets Feature Class, SVI.
Resilient Northeastern New Jersey. (2022). Flood Risk Projections.
Resilient Northeastern New Jersey. (2022). Draft Action Plan.
Resilient Northeastern New Jersey. (2022). Flood Impact Assessment.
Agency for Toxic Substances and Disease Registry. (2018). CDC/ATSDR Social Vulnerability Index (SVI). https:// www.atsdr.cdc.gov/placeandhealth/svi/data_documentation_download.html
Brown, Daniel P. and Kimberlain, Todd. (2008). Tropical Cyclone Report, Hurricane Hanna. National Hurricane Center. https://www.nhc.noaa.gov/data/tcr/AL082008_Hanna.pdf
Climate Central. (2021). Hot Zones: Urban Heat Islands. https://assets.ctfassets.net/ cxgxgstp8r5d/1XZZjkLYwtcmKL5k3wEinl/5f8c9b5b2d8dd56e1bda7f51278fc3d2/2021_UHI_Report.pdf
Del Greco, Stephen. National Climatic Data Center. (2020). Storm Data and Unusual Phenomena. Federal Emergency Management Agency. (2020). Flood Insurance Study, Essex County, New Jersey. https://map1. msc.fema.gov/data/34/S/PDF/34013CV001B.pdf?LOC=46896f23acac22e87d674fcfb9aa6bbc
Home Facts. (2022). Hurricane Information for Newark, NJ. https://www.homefacts.com/hurricanes/New-Jersey/ Essex-County/Newark.html
M.J. Bradley & Associates. (2020). Newark Community Impacts of Mobile Source Emissions.https://www.njeja.org/ wp-content/uploads/2021/04/NewarkCommunityImpacts_MJBA.pdf
National Oceanic and Atmospheric Association Tides and Currents. Tidal Datums, MHHW 2070 Projections. https://tidesandcurrents.noaa.gov/datum_options.html.
Saint-Fort, Yvanna and Driscoll, Rose. (2014). Two Years Later: Hurricane Sandy in Essex County. Patch. https:// patch.com/new-jersey/newarknj/2-years-later-hurricane-sandy-essex-county
Strategic Foresight Initiative. (2011). Climate Change, Long Term Trends and their Implications for Emergency Management. https://www.fema.gov/pdf/about/programs/oppa/climate_change_paper.pdf
The Trust for Public Land. (2021). Heat Severity USA.
US Bureau of Census. (2021). QuickFacts, Newark City, New Jersey. https://www.census.gov/quickfacts/ newarkcitynewjersey
Watson, Kara M., Collenburg, Jerilyn V., and Reiser, Robert G. (2014). Hurricane Irene and associated floods of August 27-30, 2011, in New Jersey. U.S. Geological Survey Scientific Investigations Report 2013-5234, 149. https:// pubs.usgs.gov/sir/2013/5234/pdf/sir2013-5234.pdf
The Newark360 Plan Land Use Element describes current land uses in the City, development trends, a land use vision, and future land use plan that establishes a basis for potential zoning changes and redevelopment plan amendments for the next decade. The land use element has been coordinated with the pillars, goals, and actions outlined in “Newark Tomorrow” and developed with sensitivity and responsiveness to the climate risks outlined in this assessment.
Newark360 addresses climate hazards and resilience through specific uses and recommendations as well as overarching statements of strategy included in the Land Use Element. These are briefly described below. Resiliency recommendations & topics for further study
● Create resilience hubs to be implemented in all districts.
● Develop a new set of zoning standards, based on best practices for high-risk coastal communities, with higher standards to protect buildings from flooding (coordinated with NJ PACT).
● Mitigate stormwater flooding and extreme heat with a stormwater management ordinance, revised impervious coverage standards, and new requirements for permeable paving.
● Develop a comprehensive climate adaptation / resilience plan for the East Ward in advance of further zoning changes and redevelopment.
● Expand tree planting and canopy enhancement through clearer requirements and discouragement of alternatives / variances; develop an urban forestry plan.
● Facilitate the deployment of solar panels – as a permitted accessory use and new requirements
● Integrate a chapter into the zoning that establishes green building standards.
● Smart growth: leverage urban redevelopment and infill to reduce contributions to climate change.
● Storm resiliency: develop a comprehensive East Ward Climate Resilience Plan; work with critical asset owners to advance hardening of critical infrastructure for flood resilience.
● Environmental sustainability: promote a renewed relationship to conserving natural resources (see Appendix I: Land Use Recommendations for full list).
Newark360’s goals and actions have been developed with an awareness of the city and region’s climate hazards and vulnerabilities, now and in the future. The following tables outline how the master plan actions address these challenges.
◌
Score of 1 denotes a direct effect on mitigating the hazard or reducing social vulnerability to that hazard
◌
Score of 2 denotes secondary or possible effect on mitigating the hazard or reducing social vulnerability to that hazard
◌
Scores reflect the actions’ ability to address the hazard, not the social exposure to the hazard.
Goal 1: Connect Newarkers to well-paying jobs within the city.
1.1.1 Work with mid-sized businesses within the city and incentivize them to hire local.
1
1.1.2 Introduce young Newarkers to opportunities in the local Green Economy. 2 1
1.1.3 Add bus routes and other bus treatments to improve how Newarkers move around the city outside the downtown core. 1 1
Newark is a city of prosperity where new and legacy residents can leverage the Brick City’s richness to build their American Dream Coastal flooding & storm events Rainfall Flooding Extreme Heat Air Pollution Contam ination & soil pollution Social VulnerabilityGoal 2: Protect our residents from vulnerabilities.
1.2.1 Reduce homelessness in Newark significantly over the next five years through delivery of various housing solutions and supportive services.
2 2 1 1
1.2.2 Enable increased development of housing units for Newarkers who are disabled and invest in making sidewalks and public spaces fully accessible. 1
1.2.3 Facilitate development of housing units for seniors, including retrofits for existing housing to allow residents to age in place.
2 2 1 1
1.2.4 Include healing and trauma-informed design/policy strategies in thinking about the re-entry workforce. 1
1.2.5 Expand development of youth-centric services and spaces. 1
Goal 3: Continue to leverage our educational and medical anchor institutions.
1.3.1 Continue to partner with universities/ colleges and look for opportunities to expand pipeline opportunities for Newark’s residents and youth to land STEM and other higher-wage jobs. 1
1.3.2 Work with institutions to fund and create a Newark Promise program to support college and/or advanced skills development for Newark residents. 1
1.3.3 Work with institutions such as the Newark Alliance to capitalize a reinvestment “pool” to support neighborhood development initiatives.
2 2 2 2 2 1
Coastal flooding & storm events Rainfall Flooding Extreme Heat Air Pollution Contamination & soil pollution Social VulnerabilityCoastal flooding & storm events
Rainfall Flooding Extreme Heat Air Pollution
Contam ination & soil pollution Social Vulnerability
Goal 4: Leverage our assets – the Airport, Sea Port, and Industrial Districts as economic engines for the city.
1.4.1 Enhance Newark’s position as an Airport City with needed redevelopment and study.
2 2 2 2 2 2
1.4.2 Continue to pursue Greater Newark Smart Port Regional Growth Cluster. 2
Goal 5: Continue to foster new jobs, clean industries, and a range of industry sectors.
1.5.1 Prioritize and support cultural, arts, and other creative sector jobs to build on Newark’s strong cultural brand.
1.5.2 Ensure that employment centers have the zoning necessary to accommodate shifts in emerging business use and space. 2 2
1.5.3 Leverage the Newark Liberty Airport and Penn Station as marketing spots and popup locations for local businesses. 2
1.5.4 Encourage and catalyze conversion of the Sea Port, and Industrial Districts to greener locations and operations.
1 2 2 1 1 1
1.5.5 Increase green economic opportunities for businesses including the green business challenge, energy efficiency, fleet deployment and green infrastructure. 2 2 2
1.6.1 Implement a startup micro capital fund aimed at neighborhood businesses. 2
1.6.2 Provide ongoing organizational support for small businesses beyond launch of business, commercial corridor managers, and networking resources. 2
1.6.3 Build capacity of Newark’s Business Improvement Districts (BIDs) and Special Improvement Districts (SIDs) to support small businesses and commercial corridors. 2
1.6.4 Promote Newark’s maker economy with grant funding, workshops, and the reuse of public spaces and vacant storefronts. 2
1.6.5 Nurture businesses that serve residents in every ward outside of 9-5 hours. 2
1.7.1 Utilize the Land Bank to promote local noninstitutional ownership of commercial property and increase homeownership. 2 1
1.7.2 Expedite transfer of city owned vacant lots to the Newark Land Bank to preserve affordability and create Community Land Trusts (CLT) and Limited Equity Cooperatives (LEC) to build longterm wealth and equity for Newarkers. 2 1
Coastal flooding & storm events Rainfall Flooding Extreme Heat Air Pollution Contam ination & soil pollution Social VulnerabilityNewark is a city of culture where our individual history, art, faith, and stories are central to our collective identity, our economy, and our neighborhoods.
Hazards Exposure Coastal flooding & storm events Rainfall Flooding Extreme Heat Air Pollution Contamination & soil pollu tion Social Vulnerability
Goal 1: Support Newark’s diverse and vibrant arts and culture scene.
2.1.1 Provide economic support for the arts in Newark through funding and investment in physical improvements.
2.1.2 Support the vision of the Newark Arts and Education Arts District.
2
2 2 2
2.1.3 Create a cohesive branding and identity strategy including public realm master plan for districts and cultural corridors. ,
2.1.4 Support and expand Newark’s historic districts.
2.1.5 Update the zoning code to allow and encourage Newark to be a 24/7 city for arts and entertainment.
Goal 2: Bring new vibrancy to our existing historic buildings and public spaces.
2.2.1 Remove policy and regulatory barriers to allow for and encourage more adaptive reuse.
2.2.2 Create a historic preservation revolving fund by using application and mitigation fees.
2.2.3 Activate and support public arts, murals, and monuments to enliven public spaces.
2 2
2 2
2
Coastal flooding & storm events Rainfall Flooding Extreme Heat Air Pollution Contamination & soil pollu tion Social Vulnerability
2.2.4 Bring art into parks and recreation centers. 2
2.2.5 Support cultural events in parks and other public spaces. 2
2.2.6 Administer a citywide marketing campaign for parks.
Goal 3: Support Newark’s artists and makers.
2.3.1 Create and maintain dedicated live/work housing for artists in arts districts. 2
2.3.2 Target and preserve lower cost employment spaces/business incubator spaces to keep options for future entrepreneurs. 2
Newark is a city of neighborhoods where each neighborhood is attractive and distinct in character, with high quality of life for existing residents to stay and new households to move in.
Goal 1: Enhance the accessibility, functionality, experience, and condition of Newark’s existing parks.
3.1.1 Conduct a park system master plan that builds on the Newark360 Master Plan. 1 1 1 1 1 1
3.1.2 Improve pedestrian and bicycle access to parks. 1 1
Coastal flooding & storm events Rainfall Flooding Extreme Heat Air Pollution Contamination & soil pollu tion Social Vulnerability
3.1.3 Make parks more accessible for Newarkers of all ages and abilities. 1 1 1
3.1.4 Establish a park classification system, and a baseline of amenities by type. 2
3.1.5 Establish maintenance standards and focus resources on maintenance. 2 2
3.1.6 Continue to leverage park, open space, and recreational partnerships. 2 2 2
3.1.7 Make neighborhood parks excel as community gathering places. 1
3.1.8 Add recreational value throughout the park system. 2
3.1.9 Integrate parks with green infrastructure. 1 1 1 1 2
Goal 2: Pursue opportunities to expand the park system and add usable green space to the city.
3.2.1 Identify strategically-located vacant and under-utilized sites for park development. 1 1 1 1 1
3.2.2 Create successful joint-use recreational sites at schools.
1 1 2 2 1
Rainfall Flooding Extreme Heat Air Pollution
Contam ination & soil pollution Social Vulnerability
3.2.3 Tap public space and recreation opportunities provided by other institutions 2
3.2.4 Bring park qualities into the street environment. 1 1 1 2 2
3.2.5 Generate new public space as part of new development. 2 2 2 2 2 2
Goal 3: Connect Newark neighborhoods to each other and to job centers.
3.3.1 Create mobility hubs within each neighborhood. 1 1
3.3.2 Improve pedestrian/bike environments under highway overpasses with lighting, traffic calming strategies, and other safety measures. 1 1
3.3.3 Explore capping the Interstate 280 Highway. 1 1 1 1
3.3.4 Convert McCarter Highway to a Boulevard 1 1
Goal 4: Invest in and expand our neighborhood corridors.
3.4.1 Build on distinct neighborhood and cultural identities to attract local and regional business.
3.4.2 Examine opportunities for mixed-use zoning approaches that can accommodate hybrid business models. (e.g. pop-up retail, showroom, light manufacturing, distribution space typical of a maker; or mixed use event / co-working space).
2 2
3.4.3 “Upzone” along key corridors and around transit hubs. 2 2
Goal 5: Ensure affordable housing at all income levels, calibrated to needs of each neighborhood.
3.5.1 Allow and promote accessory dwelling units for single-family households to add density without full development. 2
3.5.2 Support Land Bank efforts on preserving affordable housing. 1 1
3.5.3 Use historic district/landmark designation to increase the number of new affordable housing units for large multifamily projects in historic buildings. 2
Goal 6: Increase neighborhood health, resilience, and preparedness for climate change impacts.
3.6.1 Advance planning and implementation for Resilient Northeastern New Jersey (RNJ) tools and strategies to address coastal flooding and manage rainfall events.
3.6.2 Increase permeable surfaces and expand planted areas to combat urban heat island effect and improve stormwater management.
1 1 1 2 2 2
1 1 2 2 2
Coastal flooding & storm events Rainfall Flooding Extreme Heat Air Pollution Contamination & soil pollution Social VulnerabilityCoastal flooding & storm events
Flooding
&
tion
3.6.3 Leverage existing community facilities to create resilience hubs and community health centers. 2 2 1 1
3.6.4 Incentivize the transformation and restoration of brownfields and contaminated sites. 1 1 1 1 1
3.6.5 Create an East Ward Strategic Climate Adaptation Plan. 1 1
Newark is a city of families – traditional and nontraditional – putting down roots and thriving.
Goal 1: Ensure housing security for Newark families.
4.1.1 Operationalize Mayor Baraka’s Housing Goals. 1
4.1.2 Provide widespread resources to promote homeownership and expand first time homebuyer programs. 1
4.1.3 Include bigger housing units in new developments to accommodate large families of different cultures. 1
Goal 2: Improve the quality of Newark’s building stock.
4.2.1 Implement a facade improvement program and promote the reuse of vacant neighborhood storefronts for entrepreneurs and small-scale makers. 2
4.2.2 Address vacancy and blight by expanding the city’s vacant building ordinance. 2
4.2.3 Incentivize retrofits of existing buildings for energy efficiency, indoor air quality, and lead abatement.
2 2 1
4.2.4 Expand home weatherization program, including targeted outreach to eligible property owners. 2 1
Goal 3: Enable Newarkers of all ages and abilities to safely move around the city.
4.3.1 Create, adopt, implement, and enforce a Vision Zero policy and plan. 1
4.3.2 Implement interventions on intersections that have the most fatalities 1
4.3.3 Implement and enforce Complete Streets projects on major corridors.
4.3.4 Expand bike lane network for Newarkers to increase equitable access to alternative modes.
2 2 1 2
2 2 1 2
4.3.5 Address safe routes to schools and parks with focus on pedestrian safety and ADA access. 2
Goal 4: Leverage sustainable development to improve outdoor air quality.
4.4.1 Develop and support a citywide tree canopy initiative.
4.4.2 Create landscape buffers to protect communities from highways and sources of pollution.
2 1 1 2
2 2 1 1
4.4.3 Identify and mitigate point source pollution from heavy industry and energy infrastructure. 2 1 1 1
Coastal flooding & storm events Rainfall Flooding Extreme Heat Air Pollution Contamination & soil pollution Social VulnerabilityGoal 5: Expand access to resources for healthier living.
4.5.1 Designate and support urban agriculture zones within each Ward 2 2 2 2 1
4.5.2 Create and incentivize neighborhood based fresh food access/grocery stores. 1
4.5.3 Create and incentivize neighborhood based health clinics. 1
Newark is a city of strength where systems and infrastructure support the health, safety, and cohesion of Newarkers.
G oal 1: Address the legacy of environmental injustice by investing in community development.
5.1.1 Initiate a Green Zone designation process for communites.
5.1.2 Expand city programs and resources to support Green Zone communities.
1 1 1 1 1 1
1 1 1 1 1 1
5.1.3 Facilitate housing upgrades to support cost-burdened households. 2 2 2 1
Goal 2: Create capacity to manage stormwater equitably.
5.2.1 Create a phased stormwater fee and utility to fund stormwater infrastructure upgrades.
5.2.2 Mandate green and blue roofs as part of public building upgrades and retrofit projects.
1 2
1 1 2 2
Rainfall Flooding Extreme Heat Air Pollution Contamination & soil pollu tion Social VulnerabilityCoastal flooding & storm events Rainfall Flooding Extreme Heat Air Pollution Contamination & soil pollution Social Vulnerability
5.2.3 Establish standards for new development to include robust stormwater capture.
5.2.4 Designate priority sites and areas for green infrastructure investment.
Goal 3: Bridge the digital divide for all Newarkers.
1 1 2
1 1 2 2 2
5.3.1 Explore the use of wireless mesh networks to provide low-cost internet access. 1
5.3.2 Grow the affordable fiber offering to small businesses and residents. 1
5.3.3 Create and expand strong hotspots in public parks, schools, libraries, and transit stops. 1
Goal 4: Leverage the energy transition to build a cleaner, greener, smarter, and more efficient city
5.4.1 Provide public EV charging stations, piloted at public spaces (libraries, parks) and on street meters/kiosks. 1
5.4.2 Explore community-based solar projects at schools and parks. 1
5.4.3 Explore microgrids for public buildings. 1
5.4.4 Collaborate with NJ TRANSIT to implement smart technology in the transportation network with a focus on safety and equity. 1 1
Coastal flooding & storm events Rainfall Flooding Extreme Heat Air Pollution Contamination & soil pollution Social Vulnerability
5.4.5 Create energy-efficiency and clean energy requirements for new construction and provide training for new tenants. 1 2
5.4.6 Institute zero waste initiatives. 1 1 1
Goal 5: Expand regional connectivity and recreation networks.
5.5.1 Strengthen and expand the regional bike and pedestrian network. 1 2
5.5.2 Expand and leverage access to and across the Passaic River. 1
Goal 6: Improve existing transit infrastructure.
5.6.1 Improve mobility operations under the City of Newark’s jurisdiction. 1 1
5.6.2 Improve and add bus shelters to increase ridership and safety. 1 1
5.6.3 PATH train extension. 2 5.6.4 Improve roadway conditions. 2
5.6.5 Establish NewarkGo as a permanent program. 1 1
1 Resilient NENJ. (2022). Flood Impact Assessment, p. 82
2 NJDEP. (2020). New Jersey Scientific Report on Climate Change, p. 29
3 Climate Central. (2021). Hot Zones: Urban Heat Islands, p. 3 https://assets.ctfassets.net/ cxgxgstp8r5d/1XZZjkLYwtcmKL5k3wEinl/5f8c9b5b2d8dd56e1bda7f51278fc3d2/2021_UHI_Report.pdf
4 US Bureau of Census. (2021). QuickFacts, Newark City, New Jersey
5 Resilient NENJ. (2022). Flood Impact Assessment, p. 82
6 Resilient NENJ. (2022). Flood Impact Assessment, p. 82
7 NJGIN, City of Newark, US Census – American Community Survey
8 NJDEP. (2020). New Jersey Scientific Report on Climate Change, p. 6-9.
9 ATSDR. (2018). CDC/ATSDR Social Vulnerability Index (SVI). https://www.atsdr.cdc.gov/placeandhealth/svi/data_ documentation_download.html
10 Resilient NENJ. (2022). Flood Impact Assessment, p. 36
11 NJDEP. (2020). New Jersey Scientific Report on Climate Change, p. 106, 126, 131
12 FEMA. (2020). Flood Insurance Study, Essex County, New Jersey. https://map1.msc.fema.gov/data/34/S/ PDF/34013CV001B.pdf?LOC=46896f23acac22e87d674fcfb9aa6bbc
13 Saint-Fort, Y. and Driscoll, R. (2014). Two Years Later: Hurricane Sandy in Essex County. Patch. https://patch.com/new-jersey/newarknj/2-years-later-hurricane-sandy-essex-county
14 Watson, K.M., Collenburg, J.V., and Reiser, R.G. (2014). Hurricane Irene and associated floods of August 27-30, 2011, in New Jersey. U.S. Geological Survey Scientific Investigations Report 2013-5234, 149 p. 12. https://pubs.usgs.gov/ sir/2013/5234/pdf/sir2013-5234.pdf
15 Home Facts. (2022). Hurricane Information for Newark, NJ. https://www.homefacts.com/hurricanes/New-Jersey/ Essex-County/Newark.html
16 Brown, D.P. and Kimberlain, T. (2008). Tropical Cyclone Report, Hurricane Hanna. National Hurricane Center. https://www.nhc.noaa.gov/data/tcr/AL082008_Hanna.pdf
17 Del Greco, S. National Climatic Data Center. (2020). Storm Data and Unusual Phenomena, p. 82
18 Resilient NENJ. (2022). Additional Climate Resilience Assessment, p. 4
19 NJDEP. (2021). Sea Level Rise Guidance for New Jersey, p. 3
20 NJDEP. (2020). New Jersey Scientific Report on Climate Change, p. 6-9
21 Resilient NENJ. (2022). Flood Impact Assessment, p. 36
22 Rutgers Municipal Snapshots base their assessment on Total Water Level, which combines sea-level rise and
extreme water level information from NOAA to assess exposure to a variety of coastal flood events to complement FEMA flood mapping. Rutgers. Vulnerable Populations Exposure Snapshot Newark. https://climatesnapshots.rutgers.edu/0714/ socialVulnerability/
23 NJ Geological Survey. (2006). Physiographic Provinces of New Jersey
24 NJGIN Open Data Historic Fill in New Jersey Layer. (1882). Library of Congress Topographical Map
25 NJGIN Open Data Historic Fill in New Jersey Layer. (1882). Library of Congress Topographical Map
26 NJDEP. (2021). Sea Level Rise Guidance for New Jersey, p. 3.
27 NOAA Tides and Currents. Tidal Datums, MHHW 2070 Projections. https://tidesandcurrents.noaa.gov/datum_ options.html
28 NJDEP. Sea Level Rise Guidance for New Jersey. (2021). p. 10
29 NJDEP. New Jersey Protecting Against Climate Threats. https://www.nj.gov/dep/njpact/
30 Rutgers’ NJ Climate Change Resource Center. (2020). Sea Level Rise in New Jersey Projections and Impacts. https://njclimateresourcecenter.rutgers.edu/climate_change_101/sea-level-rise-in-new-jersey-projections-and-impacts/
31 Resilient NENJ. (2022). Flood Impact Assessment, p. 82
32 NJDEP. (2020). New Jersey Scientific Report on Climate Change, p. 37
33 NJDEP. (2020). New Jersey Scientific Report on Climate Change, p. 33
34 Office of the New Jersey State Climatologist. (2020). https://climate.rutgers.edu/stateclim/
35 Resilient NENJ. (2022). Flood Risk Projections; NJGIN
36 Resilient NENJ. (2022). Flood Impact Assessment, p. 67.
37 Resilient NENJ. (2022). Additional Climate Resilience Assessment, p. 13
38 Resilient NENJ. (2022). Flood Impact Assessment, p. 54-55
39 Resilient NENJ. (2022). Flood Risk Projections; NJGIN
40 Resilient NENJ. (2022). Draft Action Plan, p. 47
41 Resilient NENJ. (2022). Flood Impact Assessment, p. 82-83
42 Climate Central. (2021). Hot Zones: Urban Heat Islands, p. 3
43 Sustainable Jersey and the Sustainability Institute, TCNJ. (2017). Urban Heat Island Assessment, p. 3
44 Sustainable Jersey and the Sustainability Institute, TCNJ. (2017). Urban Heat Island Assessment, p. 3
45 NJDEP. (2020). NJ Scientific Report on Climate Change, p. 29
46 Resilient NENJ. (2022). Additional Hazard Assessment, p. 18
47 Resilient NENJ. (2022). Additional Hazard Assessment, p. 20. (Site-specific annual multi-model mean derived from 18 downscaled CMIP5 (Climate Model Intercomparison Project) models. RCP 8.5 scenario).
48 NJDEP. (2020). NJ Scientific Report on Climate Change, p. 30; Resilient Northeastern New Jersey. (2022). Additional Hazards Assessment, p. 16
49 Newark360. (2022). Newark Today, p. 62; NJ Department of State Office of Planning Advocacy. (2001). State Plan: Statewide Goals, Strategies and Policies, p. 42
50 NJDEP. (2020). Water Quality Trends in Nutrients in New Jersey Streams, Water Years 1971-2016, p. 8. https:// www.nj.gov/dep/dsr/wq/water-quality-trends-nutrients-1971-2016.pdf
51 Resilient NENJ. (2022). Additional Hazard Assessment. p. 16
52 NJDEP. (2020). NJ Scientific Report on Climate Change, p. 41
53 Resilient NENJ. (2022). Additional Hazard Assessment, p. 18
54 State Of New Jersey. (2019). All-Hazard Mitigation Plan, 5.4 Drought, p. 11. https://www.nj.gov/njoem/ mitigation/pdf/2019/mit2019_section5-4_Drought.pdf
55 NJDEP. (2020). New Jersey Scientific Report on Climate Change, p. 41
56 Newark360. (2022). Newark Today, p. 56
57 MJB&A. (2020). Newark Community Impacts of Mobile Source Emissions, p. 11. https://www.njeja.org/wpcontent/uploads/2021/04/NewarkCommunityImpacts_MJBA.pdf
58 MJB&A. (2020). Newark Community Impacts of Mobile Source Emissions, p. 11. https://www.njeja.org/wpcontent/uploads/2021/04/NewarkCommunityImpacts_MJBA.pdf
59 NJDEP. (2020). New Jersey Scientific Report on Climate Change, p. 67
60 State of New Jersey. (2019). All-Hazard Mitigation Plan – Ch. 5.12 Wildfire, p. 2, 27, 28
61 NJDEP. (2020). New Jersey Scientific Report on Climate Change, p. 67
62 Resilient NENJ. (2022). Additional Hazard Assessment, p. 28
63 NJDEP. (2019). Connecting Habitat Across New Jersey. https://www.nj.gov/dep/fgw/ensp/chanj.
64 Resilient NENJ. (2022).
65 Our Region. p. 46, G-7 Resilient NENJ. (2022). Draft Action Plan. p. 42
66 ATSDR. CDC/ATSDR Social Vulnerability Index Fact Sheet. https://www.atsdr.cdc.gov/placeandhealth/svi/fact_ sheet/fact_sheet.html
67 Newark360. (2022). Newark Today, p. 38-39: ATSDR. Social Vulnerability Index. https://www.atsdr.cdc.gov/ placeandhealth/svi/index.html
68 Resilient NENJ. (2022). Projected Flood Risks; NJGIN; The Trust for Public Land. (2021). Heat Severity USA; ATSDR. Social Vulnerability Index
69 Resilient NENJ. (2022). Flood Impact Assessment, Appendix C, Methodology and Data, p. 28.
70 Resilient NENJ. (2022). Flood Impact Assessment, p. 31-32 Resilient
71 NENJ, (2022). Flood Impact Assessment, Appendix C, Methodology and Data, p. 28-32
72 Resilient NENJ, (2022). Flood Impact Assessment, Appendix C, Methodology and Data, 2022, Tables 15, 16
73 Resilient NENJ, (2022). Flood Impact Assessment, Appendix D, Asset Summaries
74 ATSDR, CDC/ATSDR Social Vulnerability Index (SVI). https://www.atsdr.cdc.gov/placeandhealth/svi/faq_svi.html
75 Resilient NENJ. (2022). Critical Community Assets Feature Class; SVI
76 Newark 360. Newark Today, p. 54-55: NJ TRANSIT. (2021). NewBus Newark Study
77 Resilient NENJ. (2022). Flood Impact Assessment, p. 8, 29
78 Newark 360. Newark Today, p. 50
79 Resilient NENJ. (2022). Flood Impact Assessment, p. 82-83
80 Newark360. (2022). Newark Today, p. 56
81 Resilient NENJ. (2022). Additional Hazard Assessment, p. 23
82 Newark360. (2022). Newark Today, p. 57