RECREATION
JOSE BARRAZA
ROSE CAGLIA
JON DOHLIN
KELLY KUCHARSKI
KIMBERLY MCCOY, CHAIR
SCOTT MILLER
HARMAN SINGH
CHRISTINE SOTO
LAURA WARD, VICE CHAIR
CITY OF FRESNO STAFF
CONSULTANT TEAM
WRT
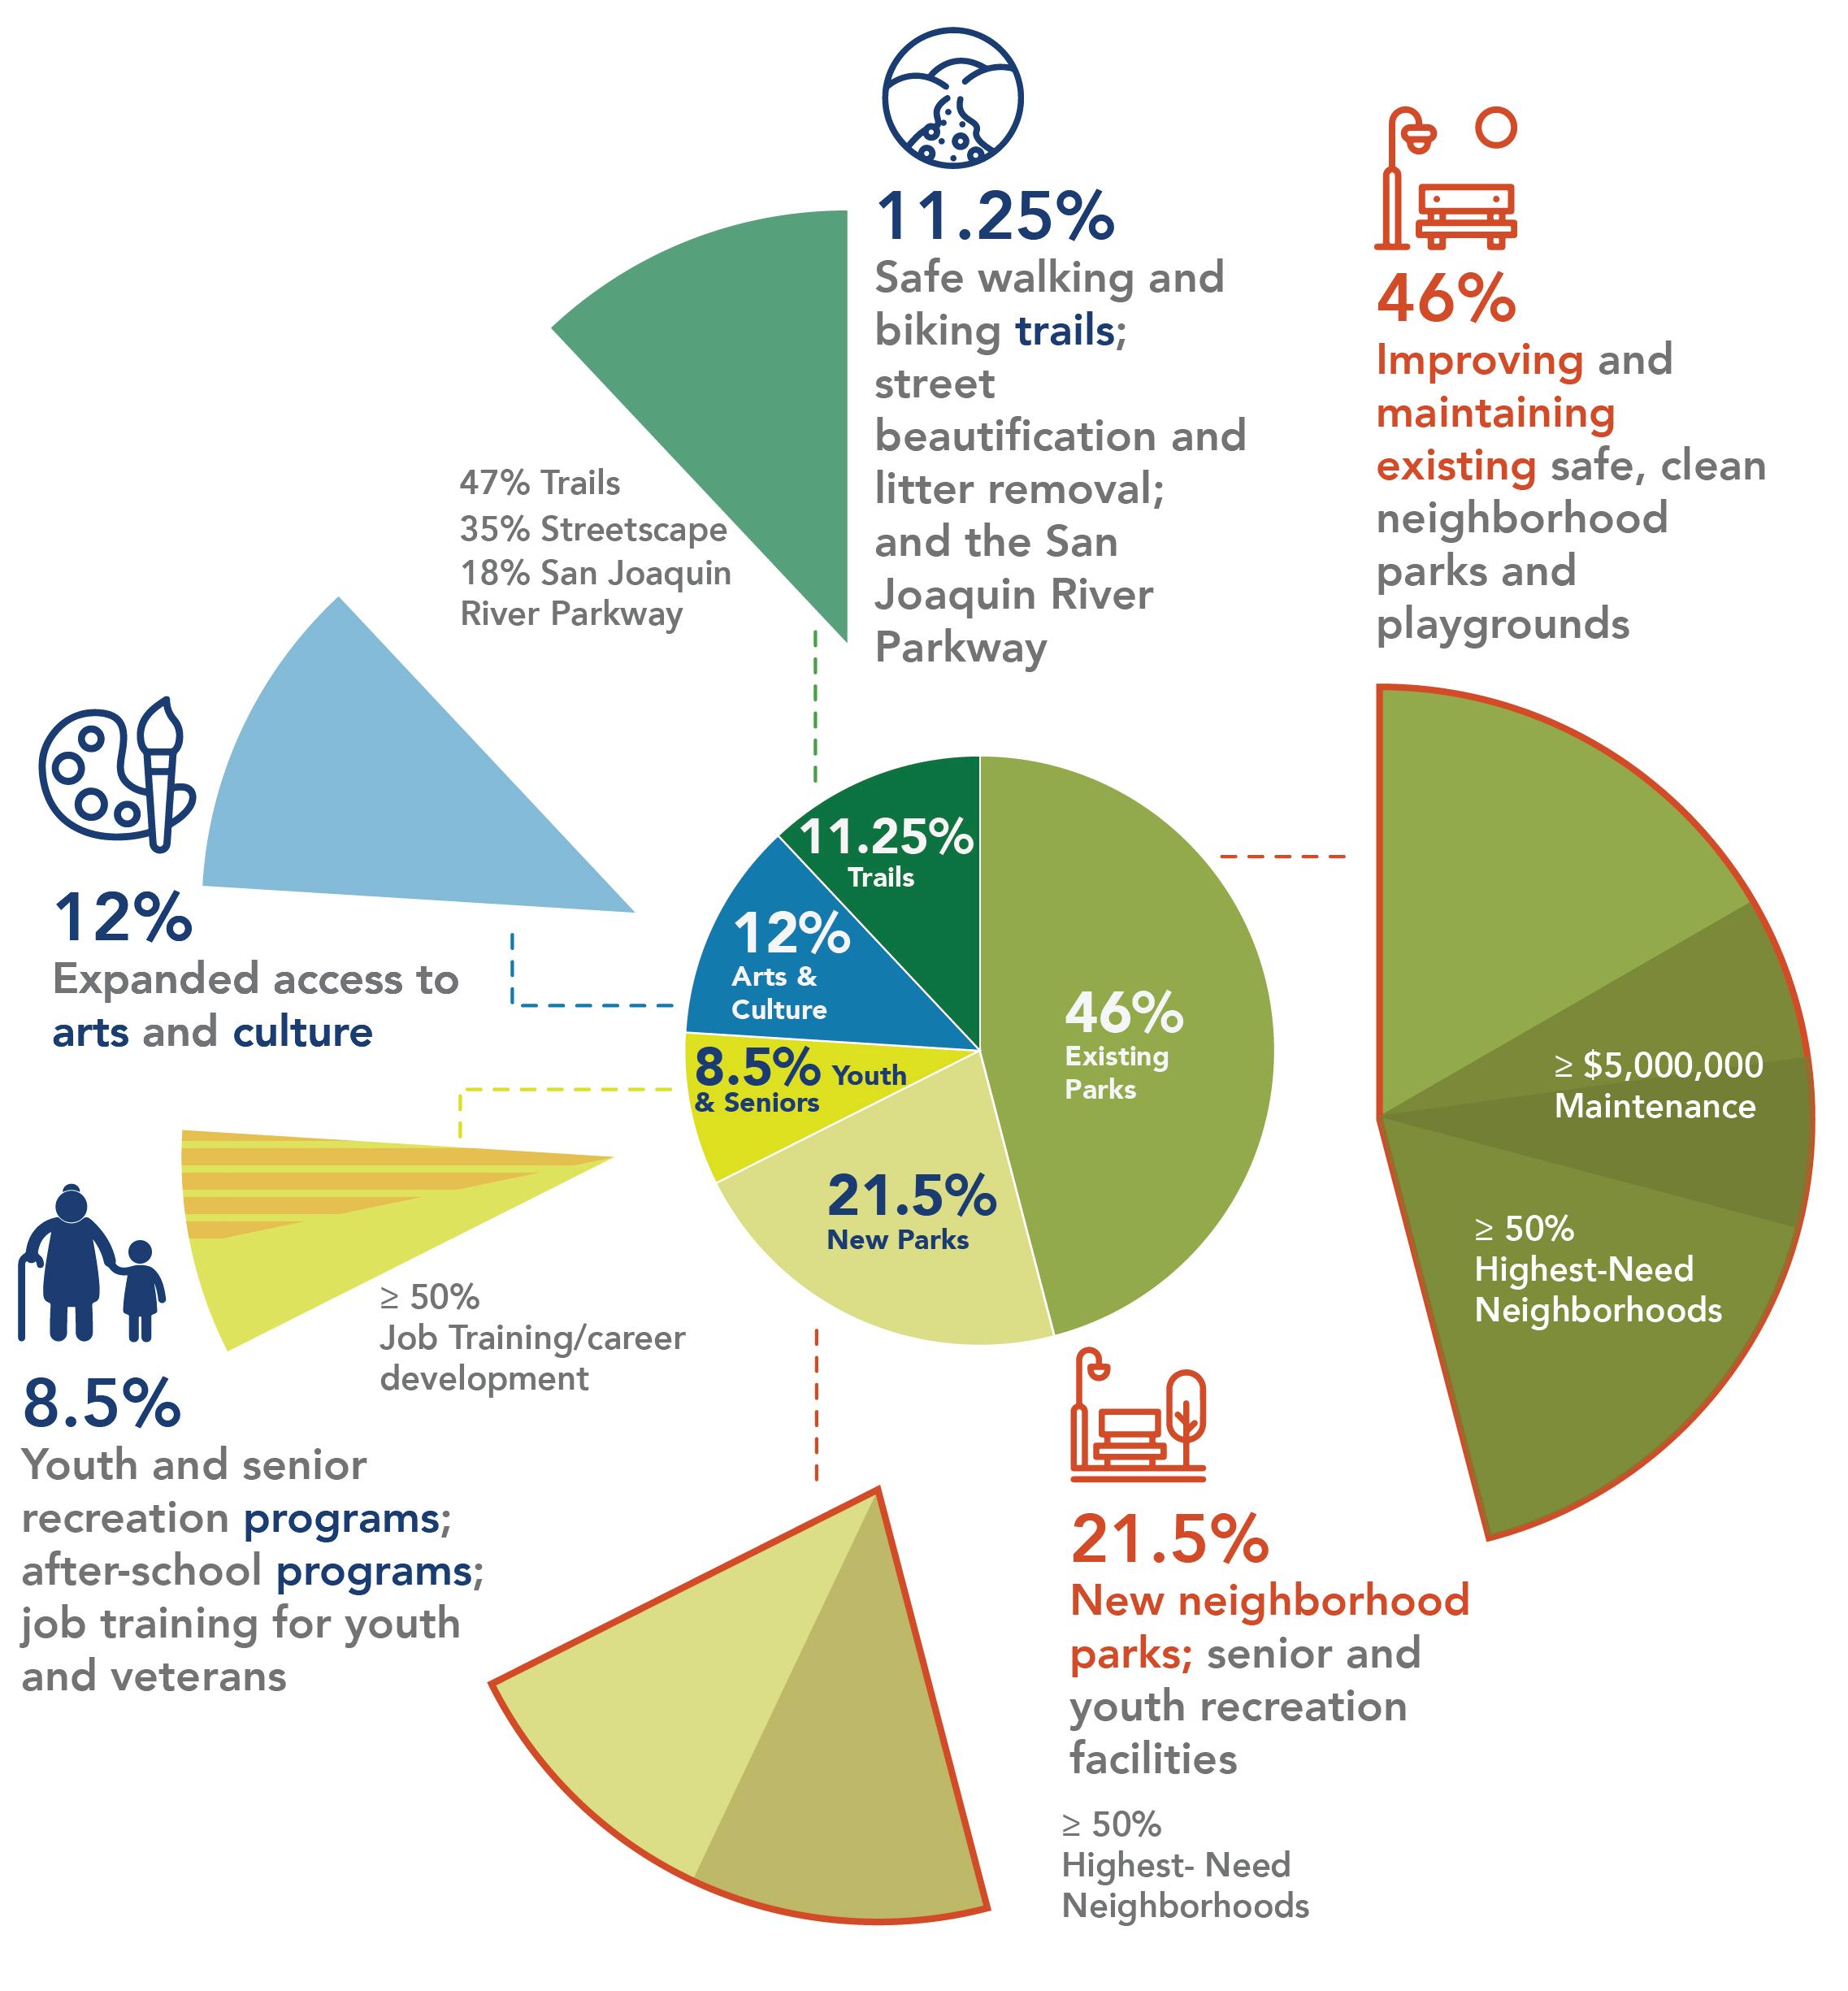
The 2018 Fresno Parks Master Plan recognized the significant need for investment in existing parks while also serving a growing city. The Fresno Clean and Safe Neighborhood Parks Tax Ordinance, commonly known as Measure P, was approved by a majority of voters in 2018. Effective January 2021, Measure P provides a guaranteed, local funding source for City parks for 30 years through a 3/8-cent sales tax in the City of Fresno. Measure P proceeds are used to update and improve Fresno’s current parks, trails and related facilities, make parks cleaner and safer, invest in programs, expand access to arts and culture, and create parks in neighborhoods that lack access to them. Measure P allocates funding in five categories:
1. Improving and Maintaining Safe, Clean Neighborhood Parks and Playgrounds (46% of Measure P funding)
2. New Neighborhood Parks; Senior and Youth Recreation Facilities (21.5%)
3. Youth and Senior Recreation Programs; Afterschool Programs; and Job Training for Youth and Veterans (8.5%)
4. Expanded Access to Arts and Culture (12%)
5. Safe Walking and Biking Trails; Street Beautification and Litter Removal; and the San Joaquin River Parkway (11.25%)
Measure P invests in City of Fresno parks and benefits the entire community by improving safety, making essential repairs to bring parks and recreation centers up to current health and safety standards, investing in new parks, improving trails and street beautification, and maintaining and improving programs for youth and seniors.
Measure P was placed on the November 2018 ballot after receiving more than 35,000 signatures of support and was voted into law thereafter. The Ordinance provides a guaranteed, local funding source for parks through a 3/8-cent sales tax in the City of Fresno. The Ordinance also establishes the Parks, Recreation, and Arts Commission, (referred to interchangeably as PRAC or the Commission), and defines the Commission’s role in implementing Measure P.
* Remaining .75% for planning, program, and implementation costs
Measure P funds are distributed into five expenditure categories: Existing parks, new parks, youth and senior programming, expanded access to arts and culture, and trails and street beautification. *
1
Expenditure Category #1: Fortysix (46%) percent of the funds are allocated to improving and maintaining safe, clean neighborhood parks and playgrounds at existing parks. This includes park rehabilitation and other capital improvements, facility upgrades to improve efficiency and safety, playgrounds and picnic areas, new restrooms and restroom improvements, park access for individuals with disabilities, improved maintenance and operations of existing parks, a park ranger program, sports facilities and swimming pools, and city-owned arts, cultural, and recreational facilities. Of the funds available for existing parks, no less than $5,000,000 shall be designated for maintenance and operations. Additionally, no less than half (50%) of the funds for existing parks must be made available for highest-need neighborhoods.
2
Expenditure Category #2: Twentyone-point five (21.5%) percent of the funds are allocated to new neighborhood parks, senior and youth recreation facilities. This includes new neighborhood parks, pocket parks, and community gardens, public restrooms in new parks, new senior and community centers associated with the park
system, new regional parks located in the City of Fresno, playgrounds and picnic areas in new parks, and new public sport facilities and swimming pools. No less than half (50%) of the funds for new parks must be made available for highest-need neighborhoods.
Expenditure Category #3: Eightpoint five (8.5%) percent of the funds are allocated to youth and senior recreation programs, after school programs and job training for youth and veterans. This includes projects and programming that promotes physical activity, recreation and accessibility to recreational facilities, sports, arts and active programs, community and senior recreation center programs, swimming and wateroriented programs, junior lifeguard, science and education, summer day camps and other youth-oriented activities. No less than half (50%) of these funds shall be made available to programs that provide job training, career development, or both, to youth, young adults and veterans including education and/or certification for jobs within the conservation, science, arts, green technology and parks and recreation fields. Programs funded shall prioritize service for at-risk youth and seniors.
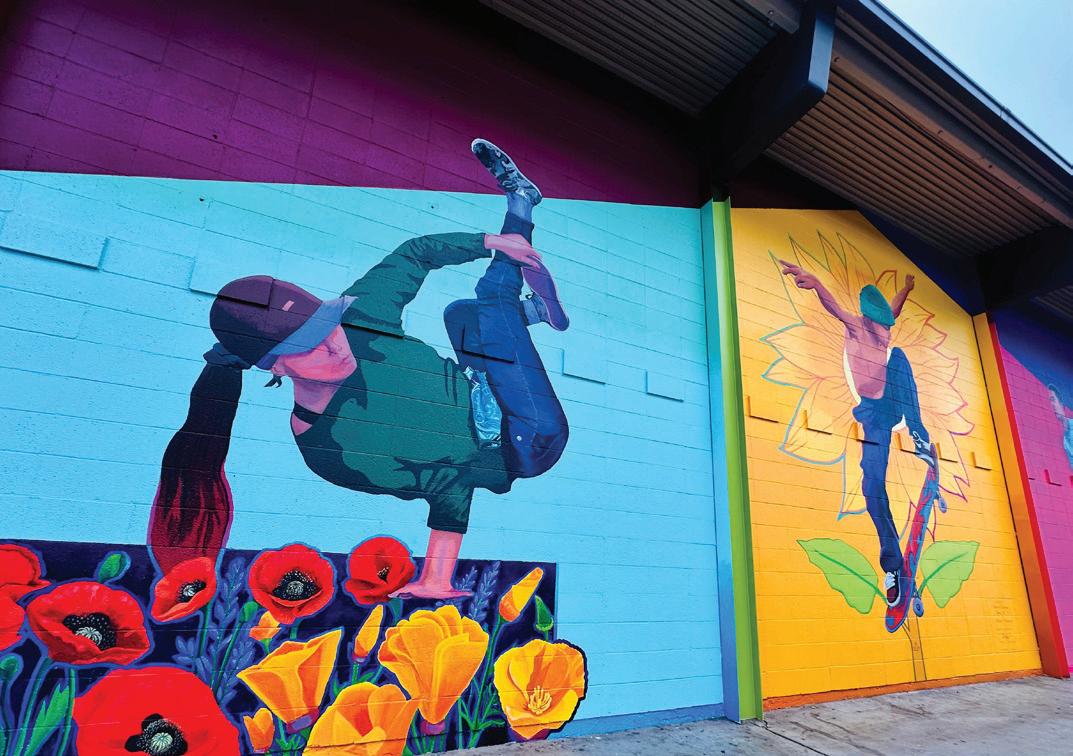
Expenditure Category #4: Twelve (12%) percent of the funds are made available for expanded access to arts and culture. These funds are administered in partnership with the Fresno Arts Council using multiple solicitations that allow for a diverse set of programs, with different program sizes and reach, including core operating and project-support grants. Operational support funding distributed shall support organizations that reflect the cultural, geographic and demographic diversity of the City of Fresno and reflect the proportion of each grantee’s overall operations that serve residents within, or visitors to, the City of Fresno’s sphere of influence. Grants shall prioritize organizations and programs that support and expand diverse public or youth engagement and equity.
Expenditure Category #5: Elevenpoint twenty-five (11.25%) percent of the funds are made available for safe walking and biking trails, street beautification, litter removal, and the San Joaquin River Parkway. Of these funds, forty-seven (47%) percent are made available for projects that include trail development, including bike, pedestrian and equestrian trails and urban greening and tree planting. No more than
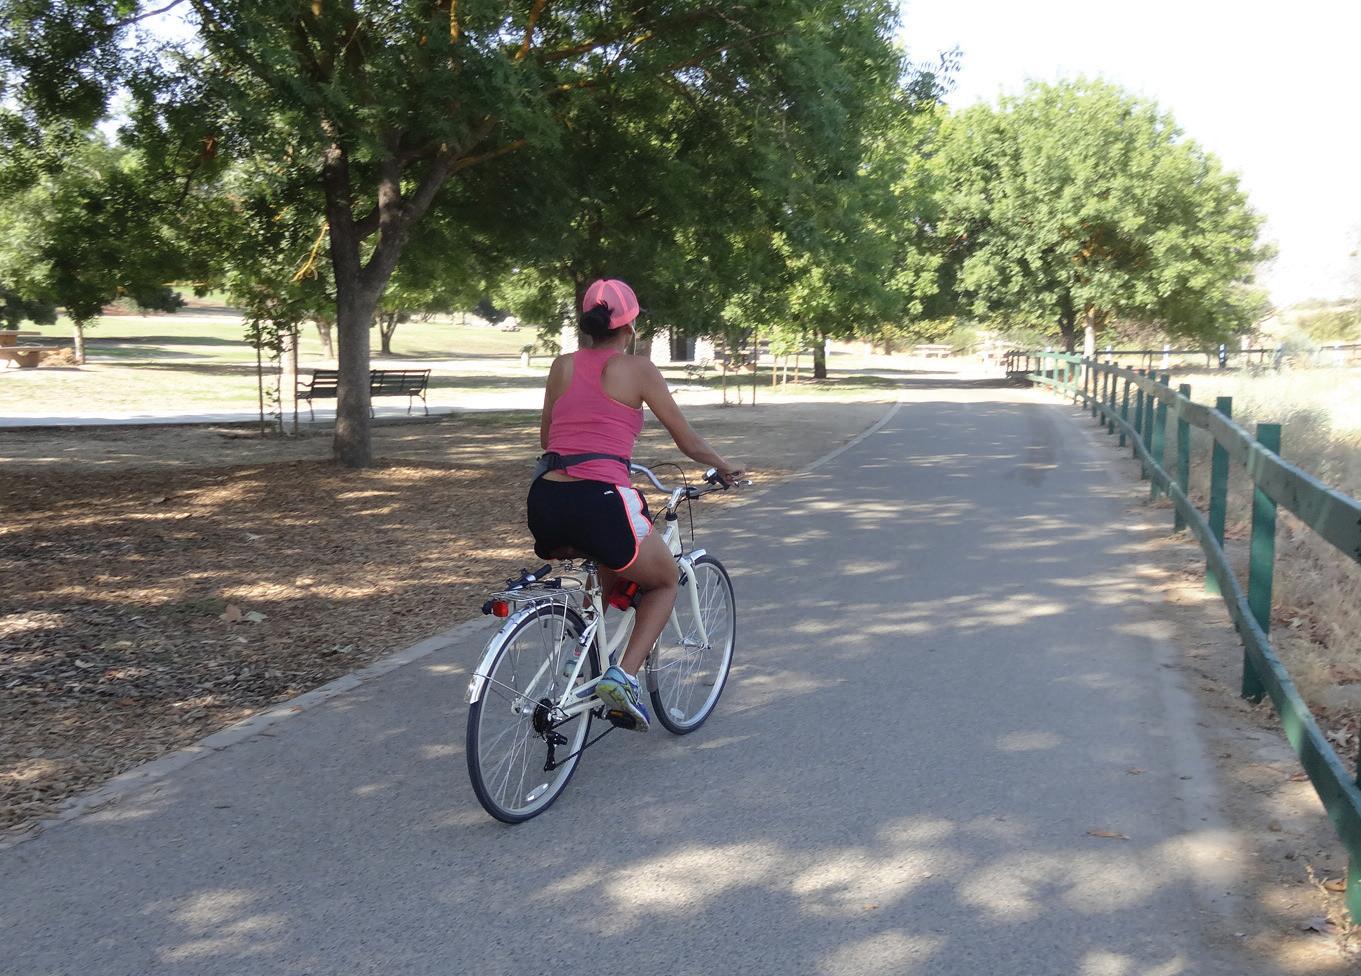
twenty percent (20%) of the funds are made available for operations and maintenance of trails. No less than twenty-five (25%) percent of the funds are prioritized for Class I and Class IV pedestrian and bicycle pathways along the priority network as defined in the Active Transportation plan. Eighteen percent (18%) of funds in expenditure category 5 are made available for operations and projects consistent with the San Joaquin River Parkway Master Plan. Lastly, thirty-five (35%) percent of funds shall be made available for development, improvement, restoration, maintenance, or rehabilitation along major roads and streets in the City of Fresno.
* In order to implement Measure P, an additional zero point seventy-five (0.75%) percent of the total funds are made available on an annual basis to invest in program implementation, planning and plan updates, program and project innovation, and audit and oversight support to ensure the investments made by the citizens of Fresno create a world class set of facilities and programs. No more than 2% from each of the expenditure categories may be used for the administrative costs associated with the delivery of projects and programs.
For both existing and new parks, Measure P requires that no less than 50 percent of funds in expenditure categories one and two must be allocated to “highest-need neighborhoods” in the City of Fresno. The Measure P Ordinance provides guidance on how these neighborhoods should be defined by the City, in conjunction with the Parks, Recreation and Arts Commission (PRAC). The Ordinance outlines a set of 11 Equity Factors that must be considered in defining the highest-need neighborhoods, which include factors such as park condition and access, health data, demographics, and neighborhood safety data. All of these factors must be considered in establishing a weighted index informed by a public process. The highest-need neighborhoods definition must be updated every three years.
In 2024, the City led two public surveys and multiple pop-up events, giving the community an opportunity to provide input on (1) which Equity Factors are most important when considering park investments in highest-need neighborhoods and (2) what proportion of Fresno neighborhoods should be considered “highest-need.” Following an analysis of the available data, including PRAC and public input, PRAC proposed a recommended definition to the Fresno City Council.
Following the results of the community survey and adoption by City Council, the following factors are weighted more important (2x average):
(A) Existing conditions of parks and facilities based on needs assessment data in the Plan;
(B) The proportion of the population that lives within walking distance (1/2 mile) to a park;
(D) Population density;
(E) Neighborhood youth and senior population;
(F) Neighborhood safety;
(G) Neighborhoods of concentrated poverty;
(J) Years of potential life lost;
(K) Neighborhood composite mortality rate;
The following factors are weighted Important (average):
(C) Park acreage per 1,000 residents;
(H) Pollution burden, as defined by CalEnviroScreen 3.0, or subsequent updates;
(I) Pre-term birth rates;
The top 50 percent of Fresno census tracts, based on this weighting, shall be considered highest-need for the purposes of allocating funds under Measure P.
DEFINING HIGHEST- NEED NEIGHBORHOODS
The Measure P ordinance states that starting on January 1, 2022, the City, in conjunction with the Commission, shall adopt a new definition of highest-needs neighborhoods, after conducting a public process, to be updated every three years. The City and Commission shall create a weighted index. The definition will be based on a set of 11 criteria, which are referred to as Equity Factors. For the purposes of developing the weighted index, census tracts are used to define neighborhoods. In the following pages, each map shows how its Equity Factor relates to the City of Fresno at the scale of census tracts.
Existing conditions of parks and facilities based on needs assessment data in the Plan.
The proportion of the population that lives within walking distance (1/2 mile) to a park.
Park acreage per 1,000 residents.
Population density.
Neighborhood youth and senior population.
Neighborhood safety.
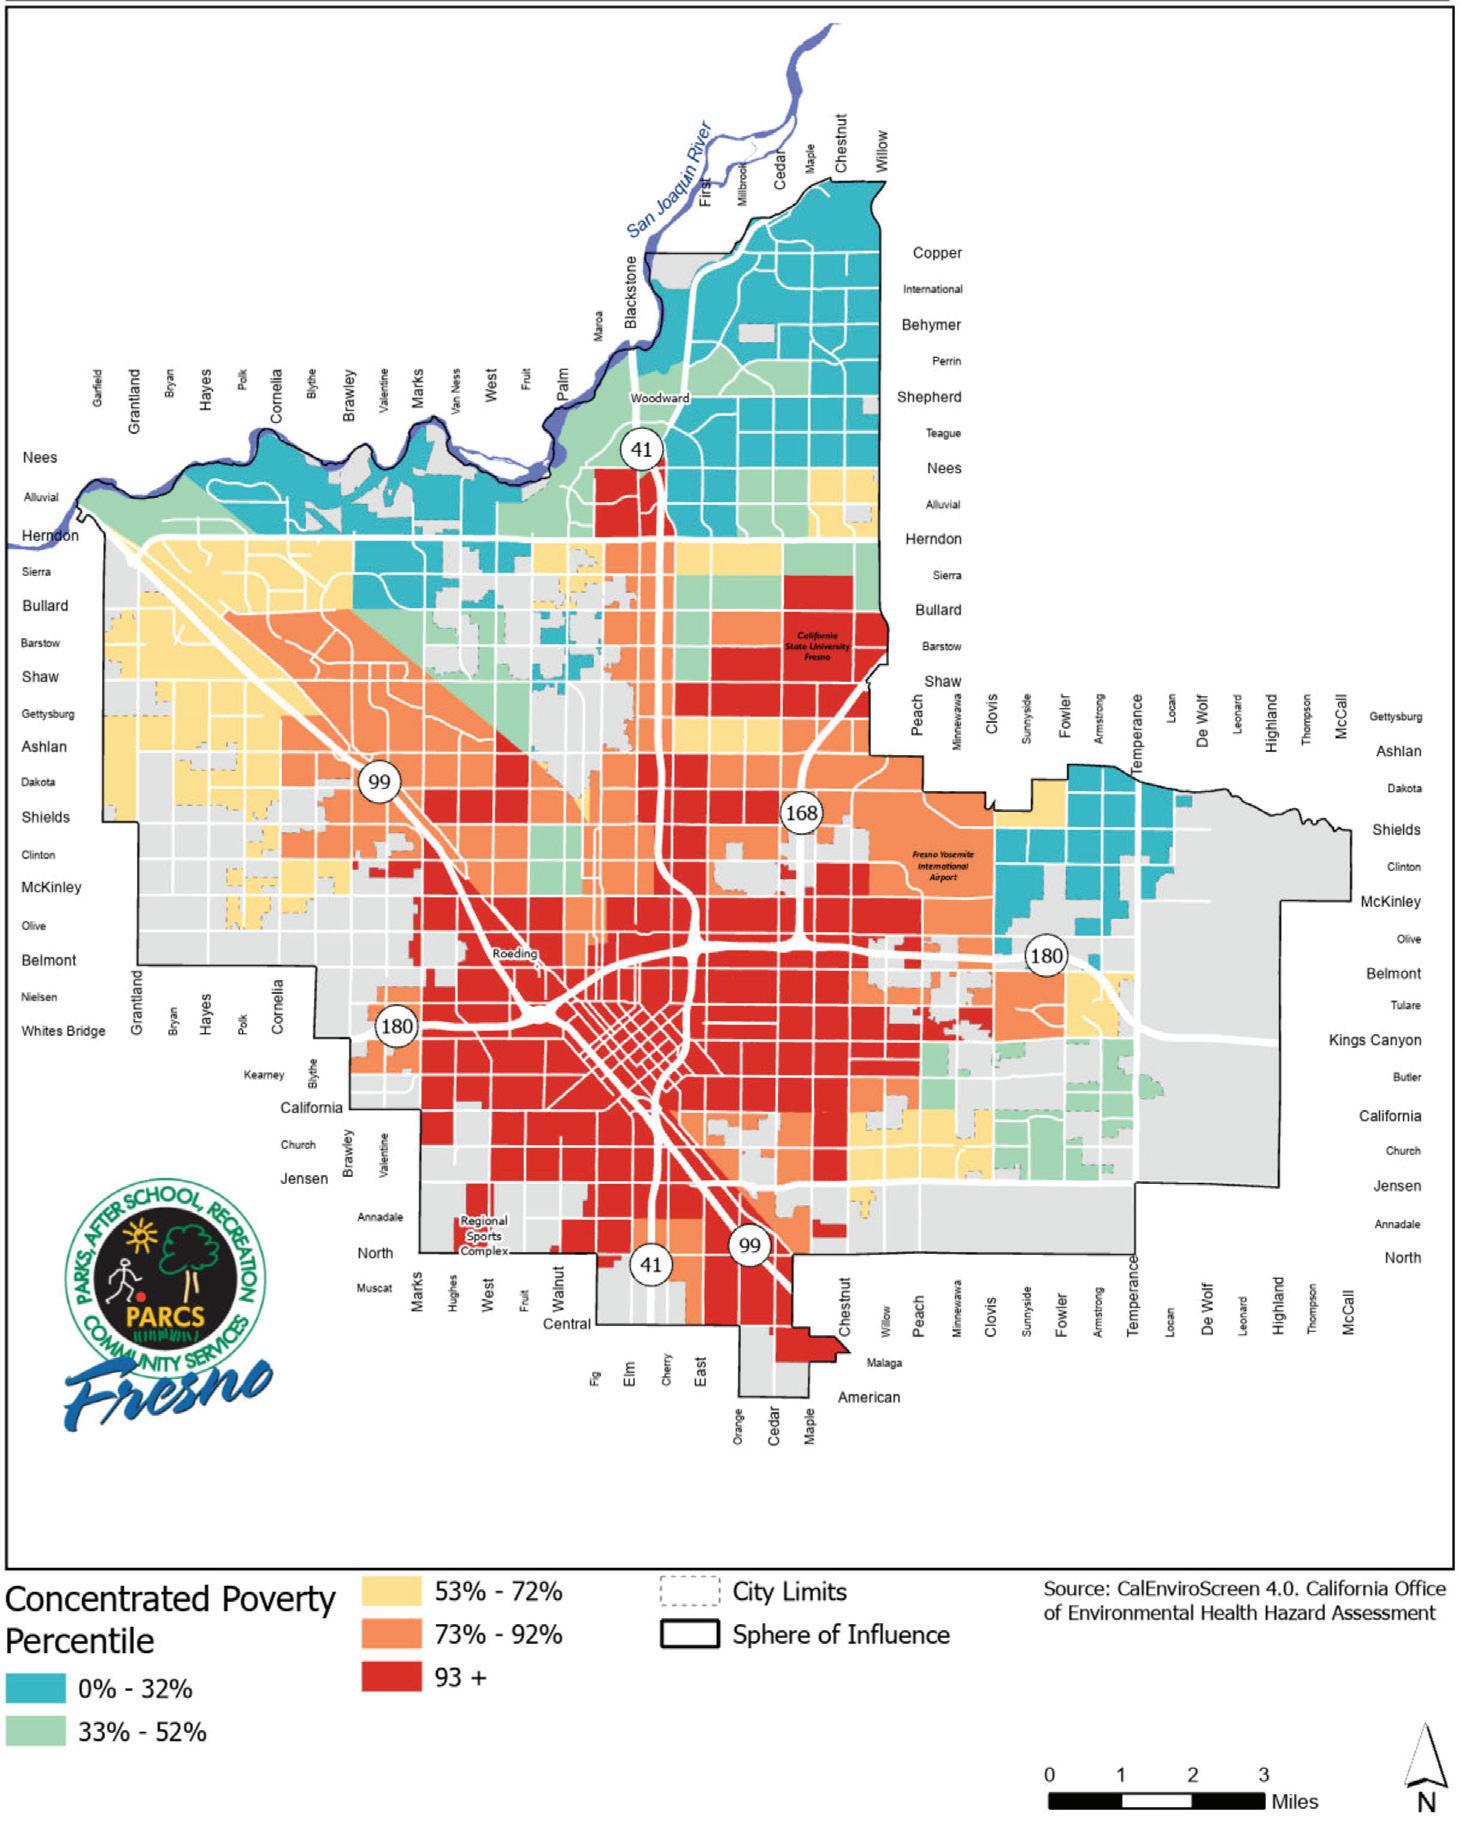
Neighborhoods of concentrated poverty.
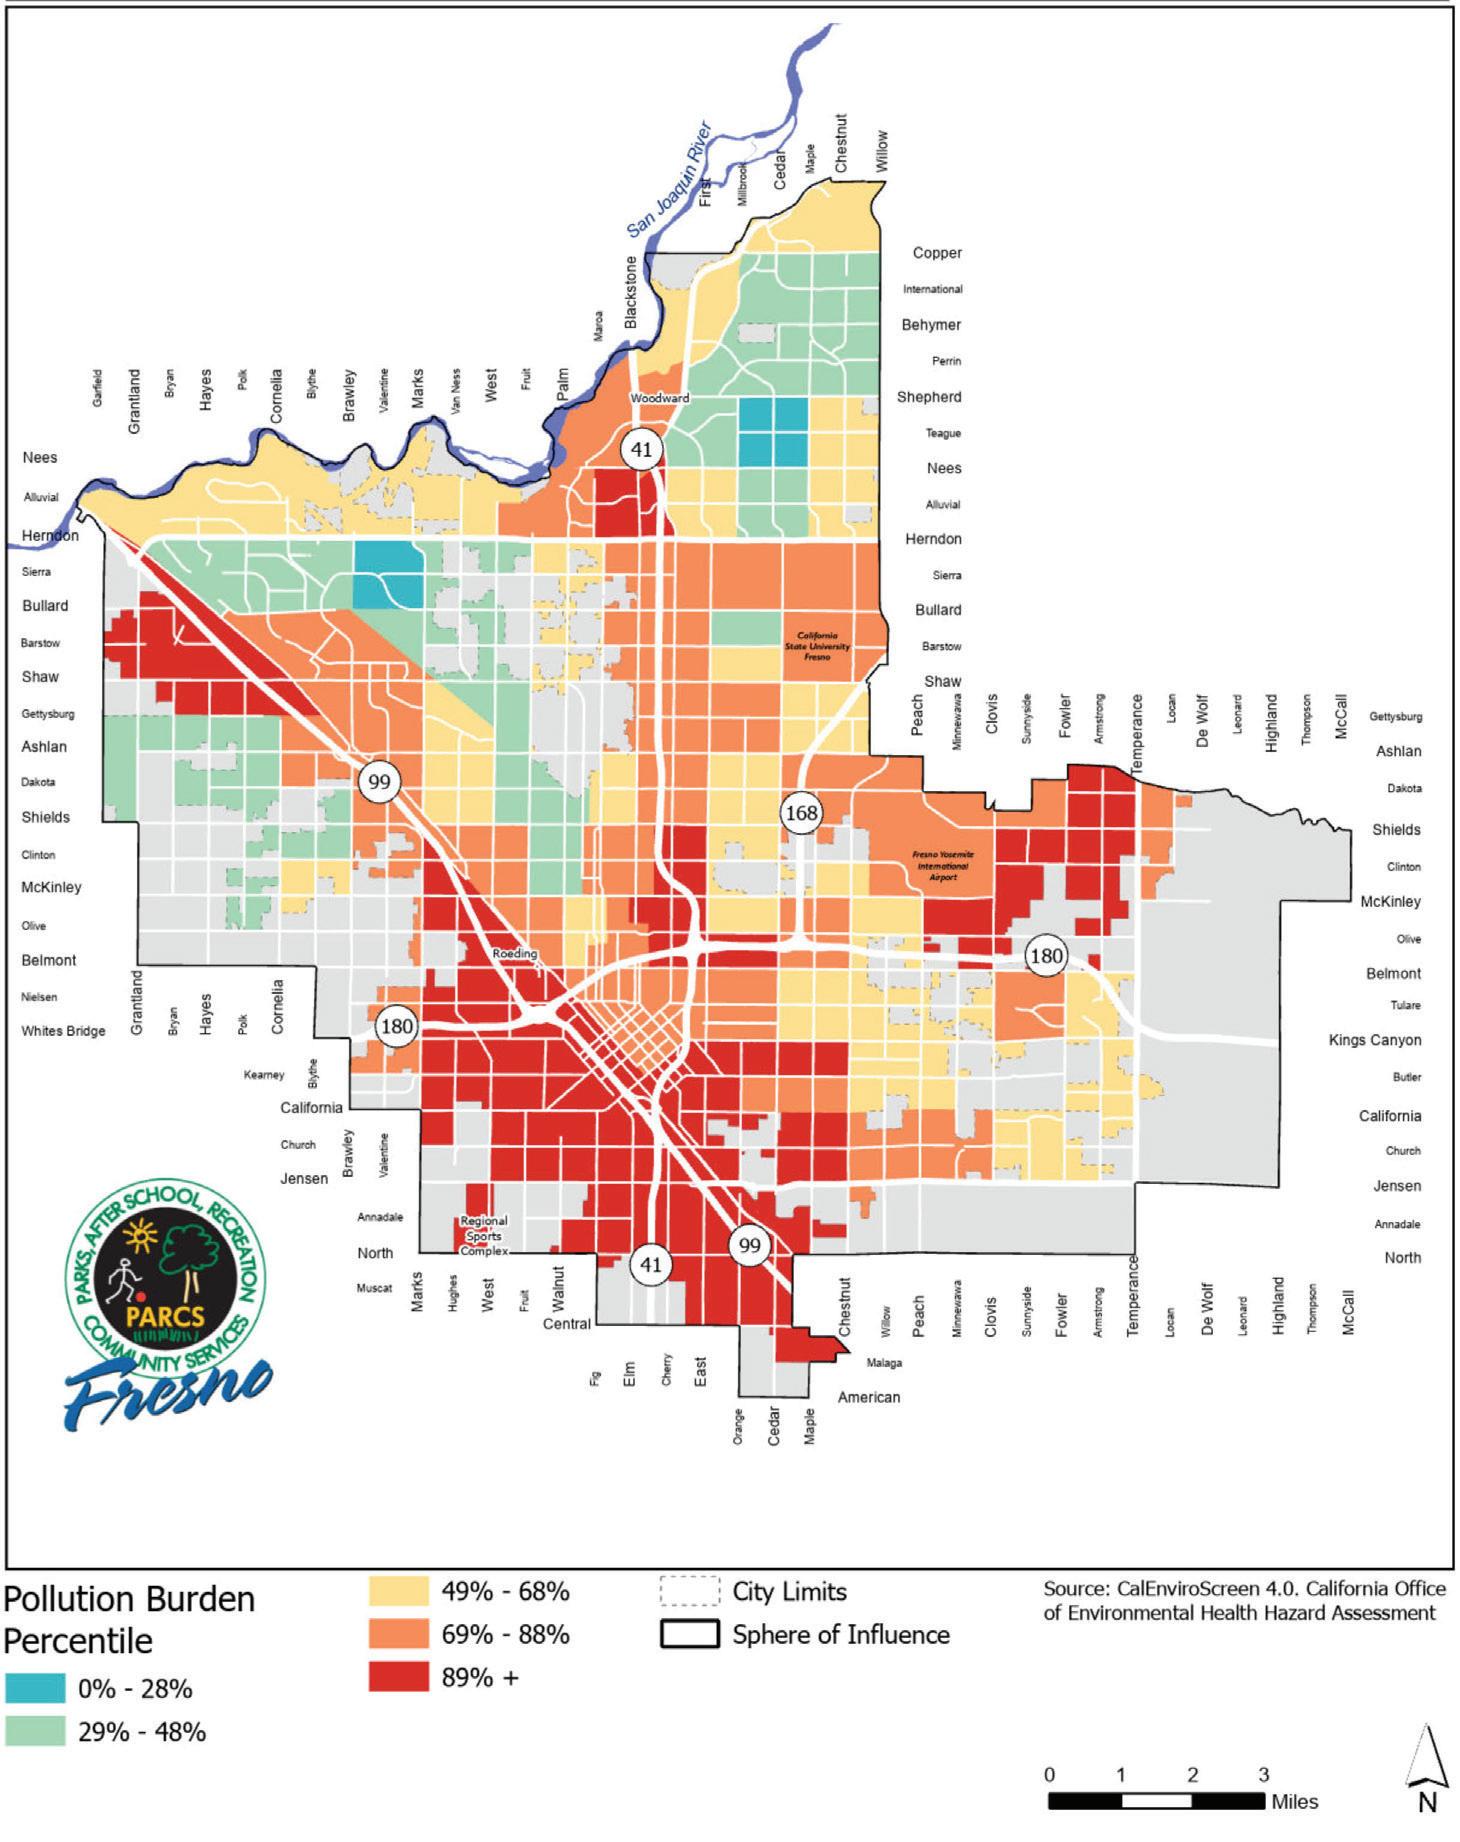
Pollution burden, as defined by CalEnviroScreens 3.0, or subsequent updates.
Pre-term birth rates.
Years of potential life lost.
Neighborhood composite mortality rate.
HIGHEST- NEED NEIGHBORHOODS
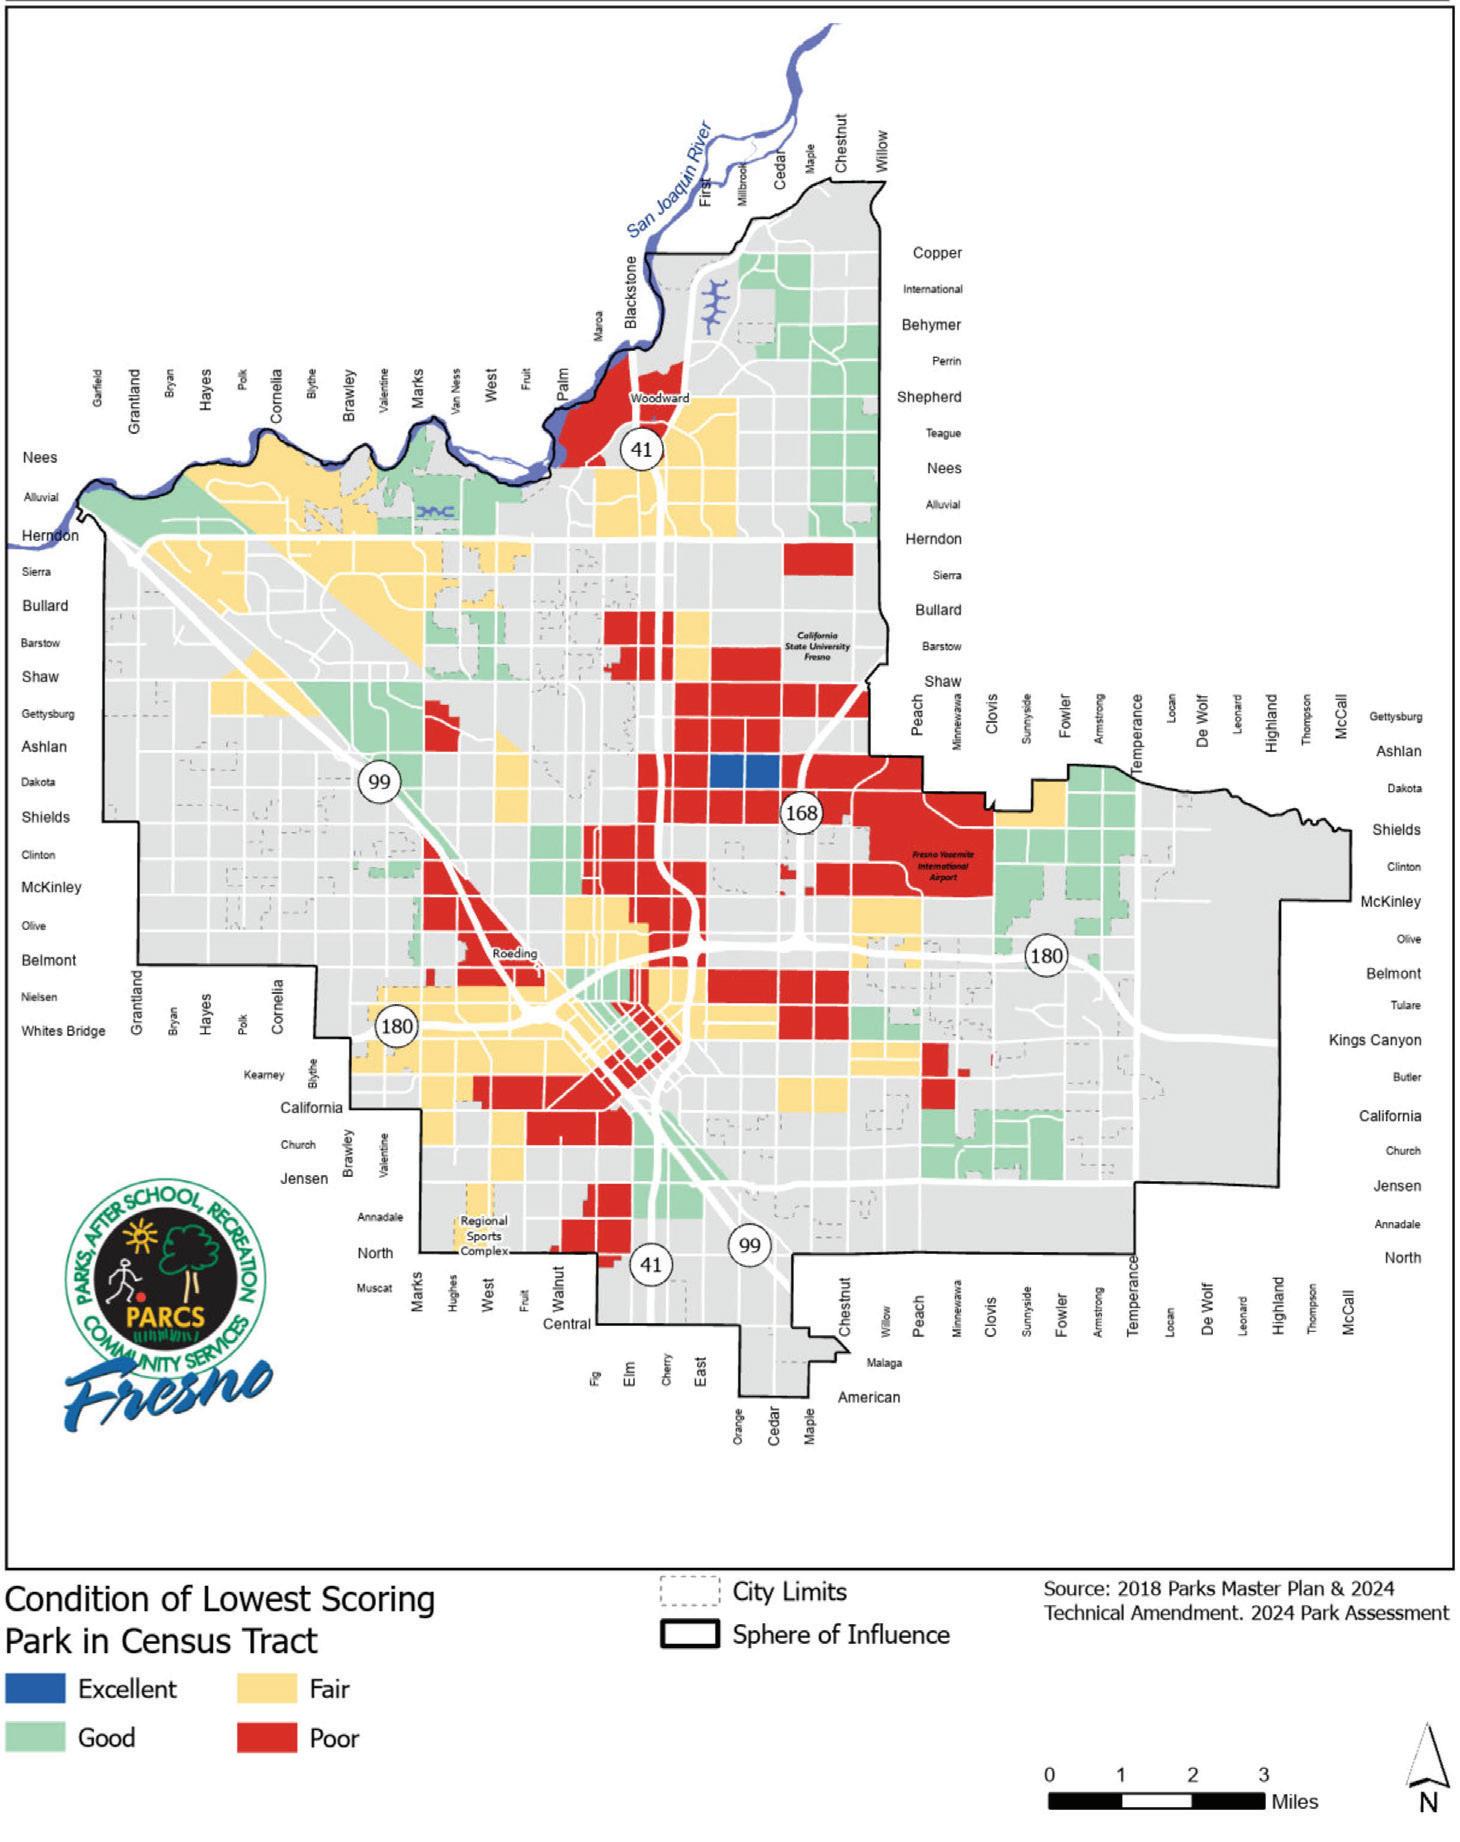
CONDITIONS OF PARKS AND FACILITIES BASED ON NEEDS ASSESSMENT DATA IN THE MASTER PLAN
Parks in Fresno are not all in the same condition.
The red areas on this map highlight neighborhoods where one or more parks are in poor condition.
SOURCE:
Fresno Parks Master Plan, 2018 (with the 2024 Technical Amendment), and 2024 Park Assessment DEFINITION
Census Tracts containing at least one park identified as being in “Poor” condition
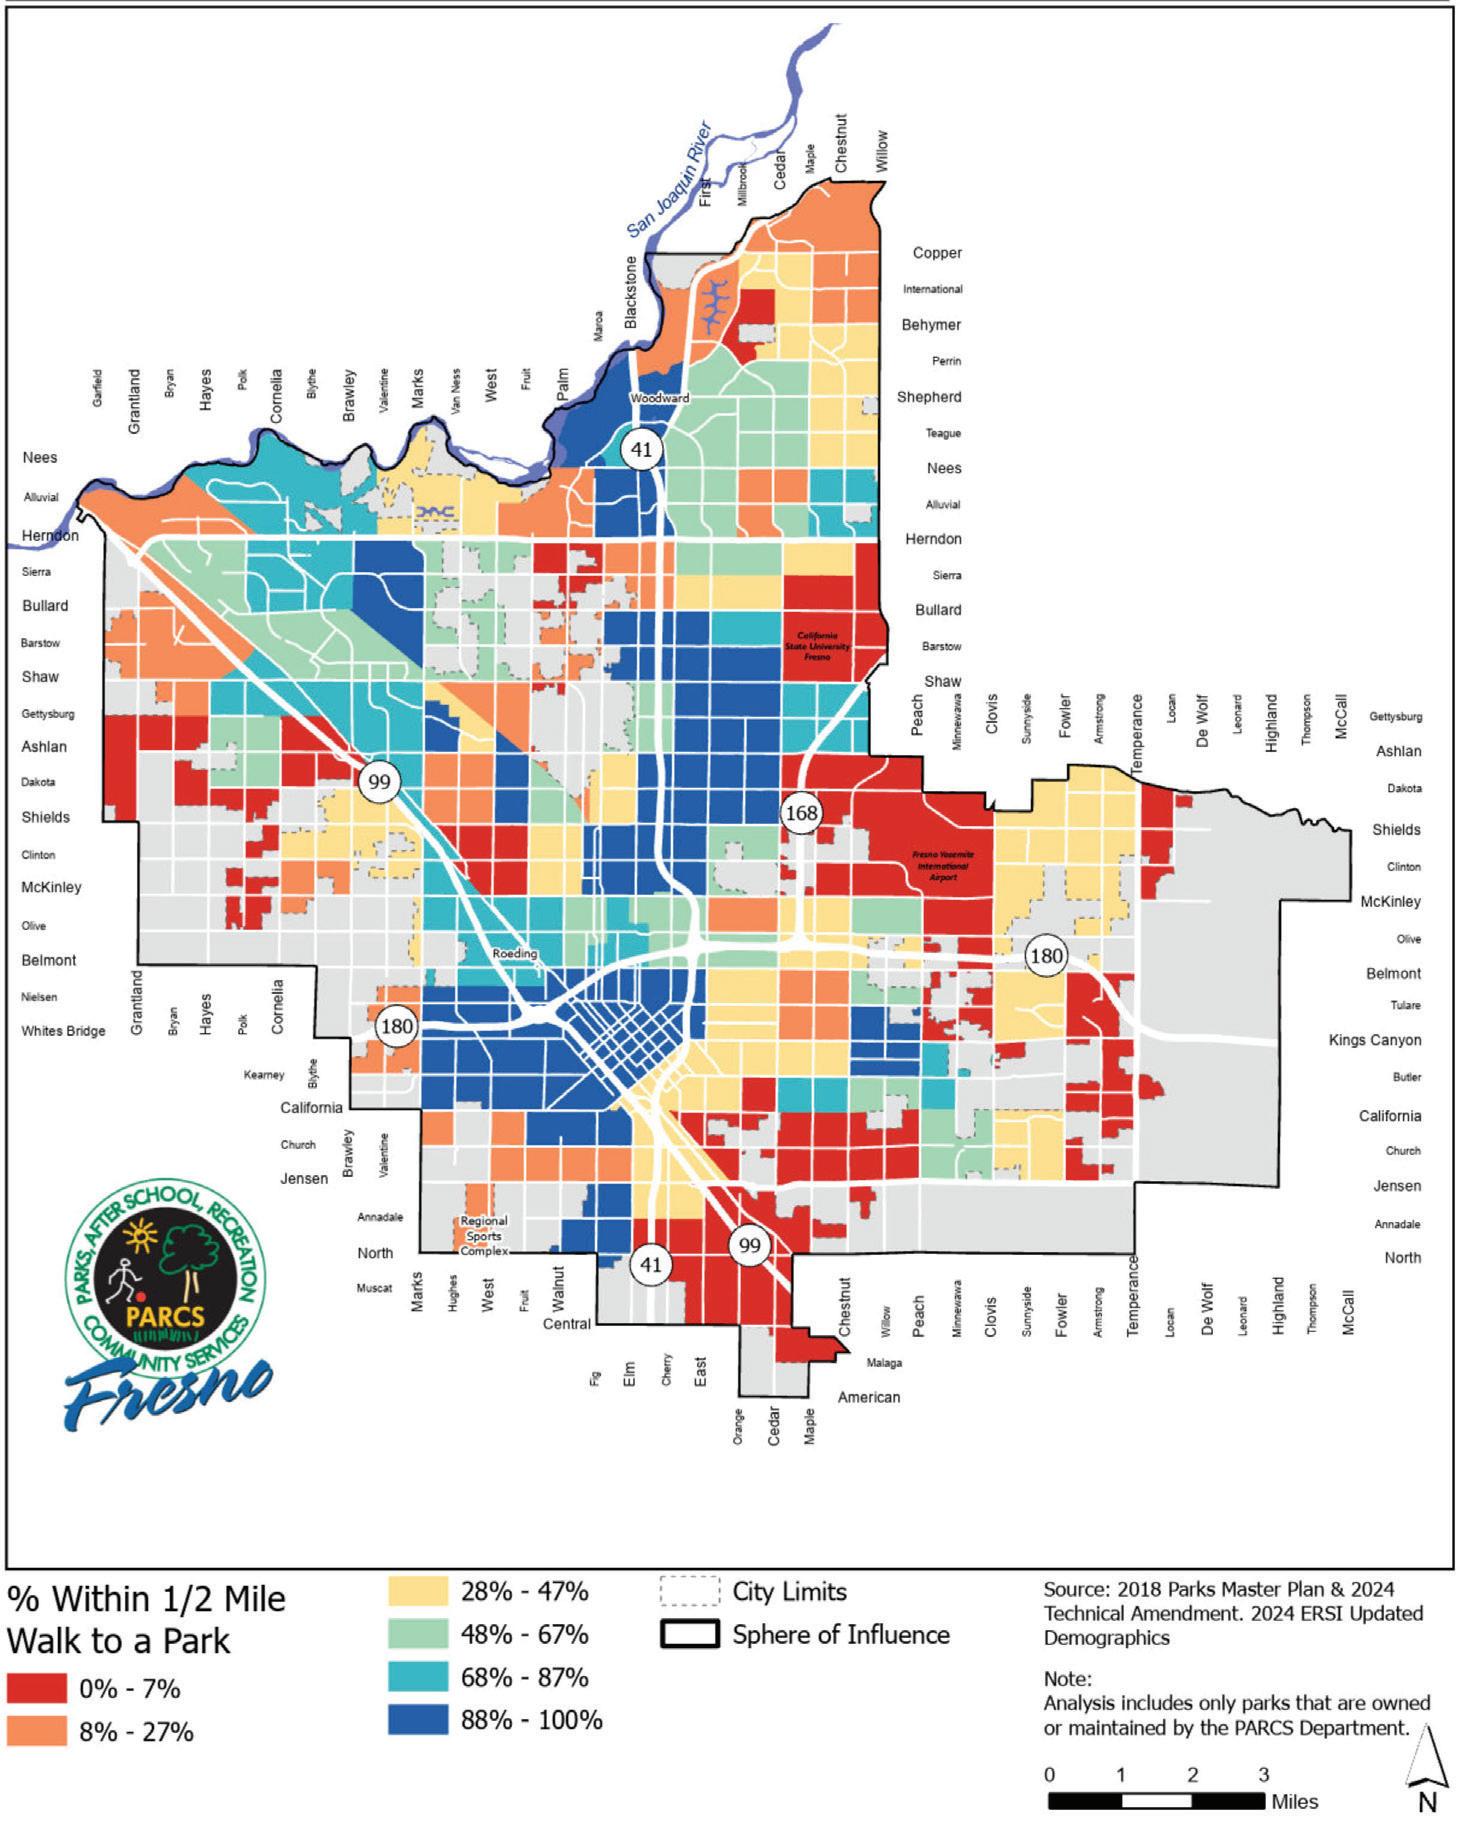
Not all Fresno community members have easy access to nearby parks.
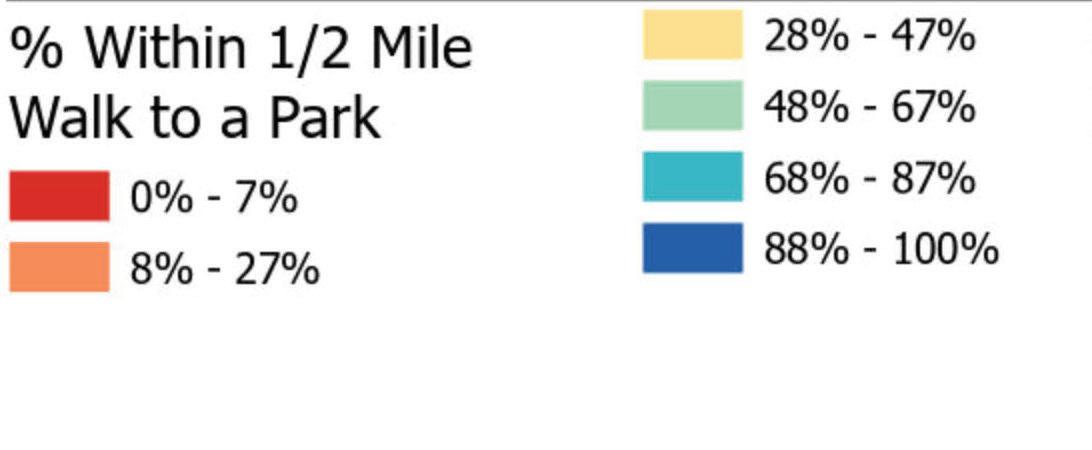
Red, orange and yellow on this map highlight neighborhoods where less than 48% of people live within a ½ mile walk to a park. This threshold is the average for all Fresno census tracts.
Analysis includes parks that are owned or maintained by the PARCS Department.
POPULATION THAT CAN WALK TO A PARK
SOURCE: Fresno Parks Master Plan, 2018 (with the 2024 Technical Amendment)
DEFINITION
Census tracts where less than 48% of people live within a 1/2 mile walking distance to a park.
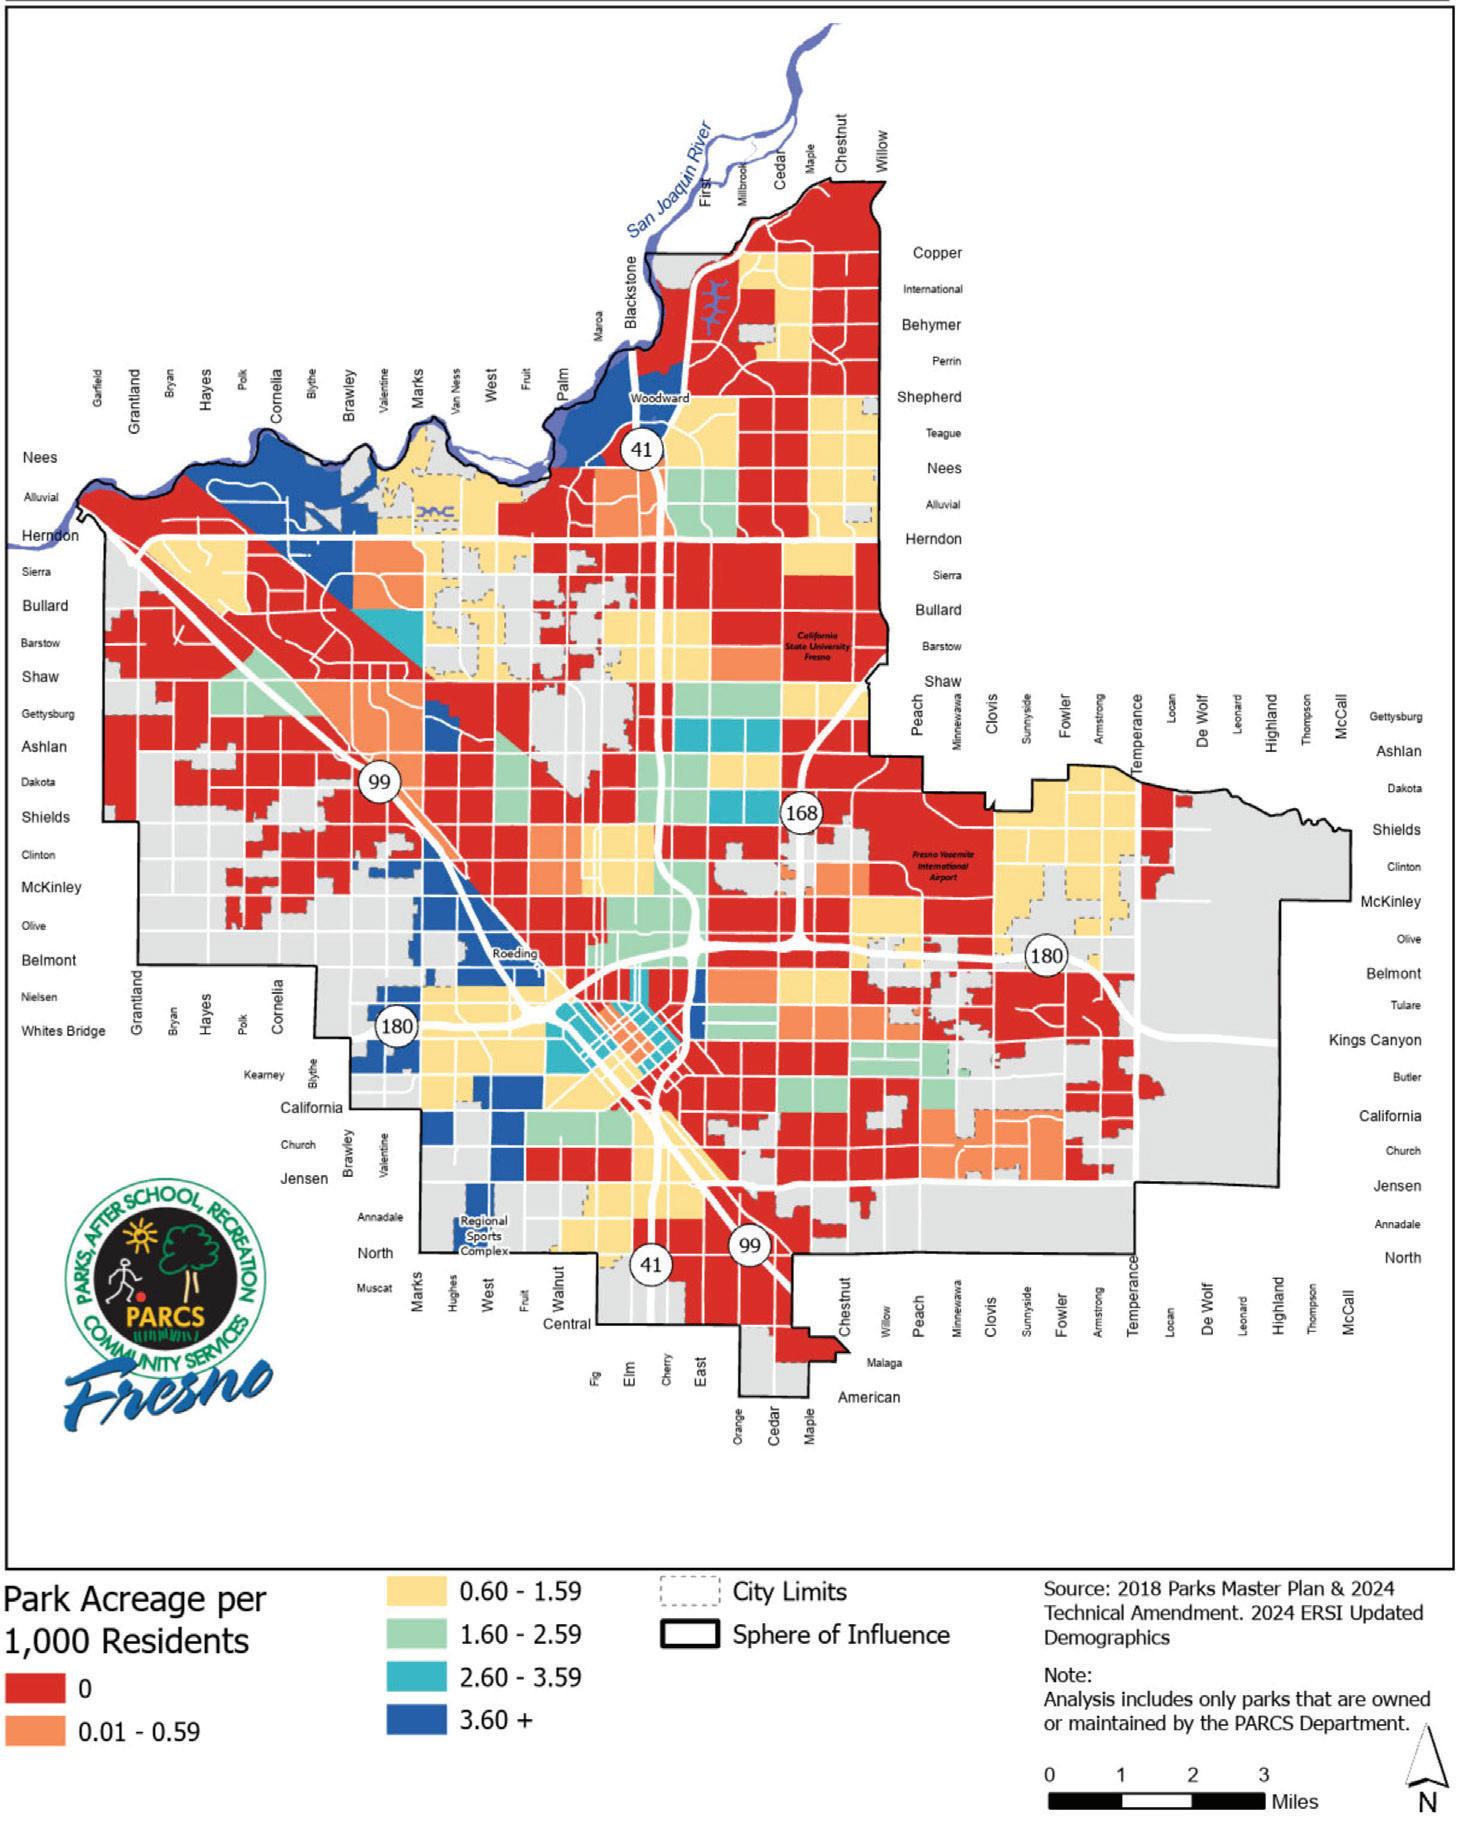
1,000
Parks in Fresno are not evenly distributed throughout the city.
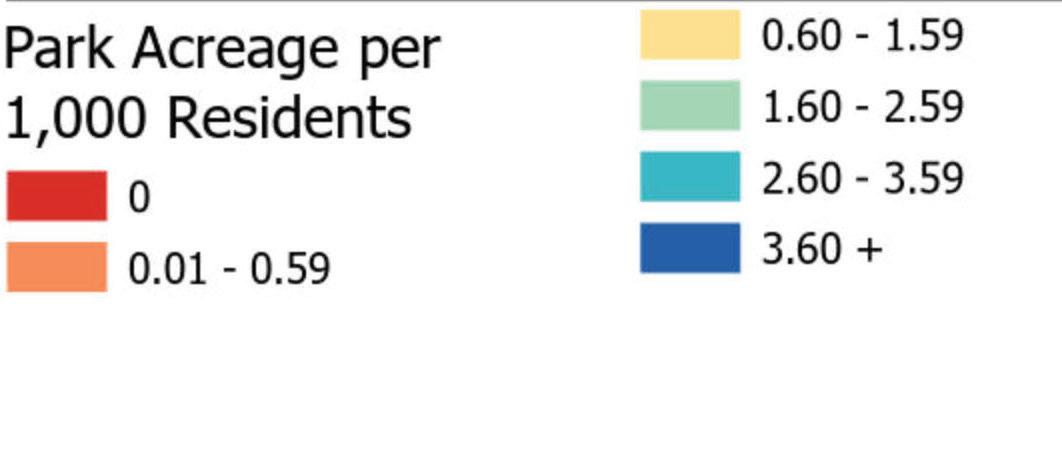
Red, orange and yellow areas on this map show neighborhoods where there are less than 1.6 acres of parkland per 1,000 residents. This threshold is the average for all Fresno census tracts.
Analysis includes parks that are owned or maintained by the PARCS Department.
SOURCE: Fresno Parks Master Plan, 2018 (with the 2024 Technical Amendment)
DEFINITION
Census tracts where there are less than 1.6 acres per 1000 people.
DEFINING HIGHEST-NEED NEIGHBORHOODS
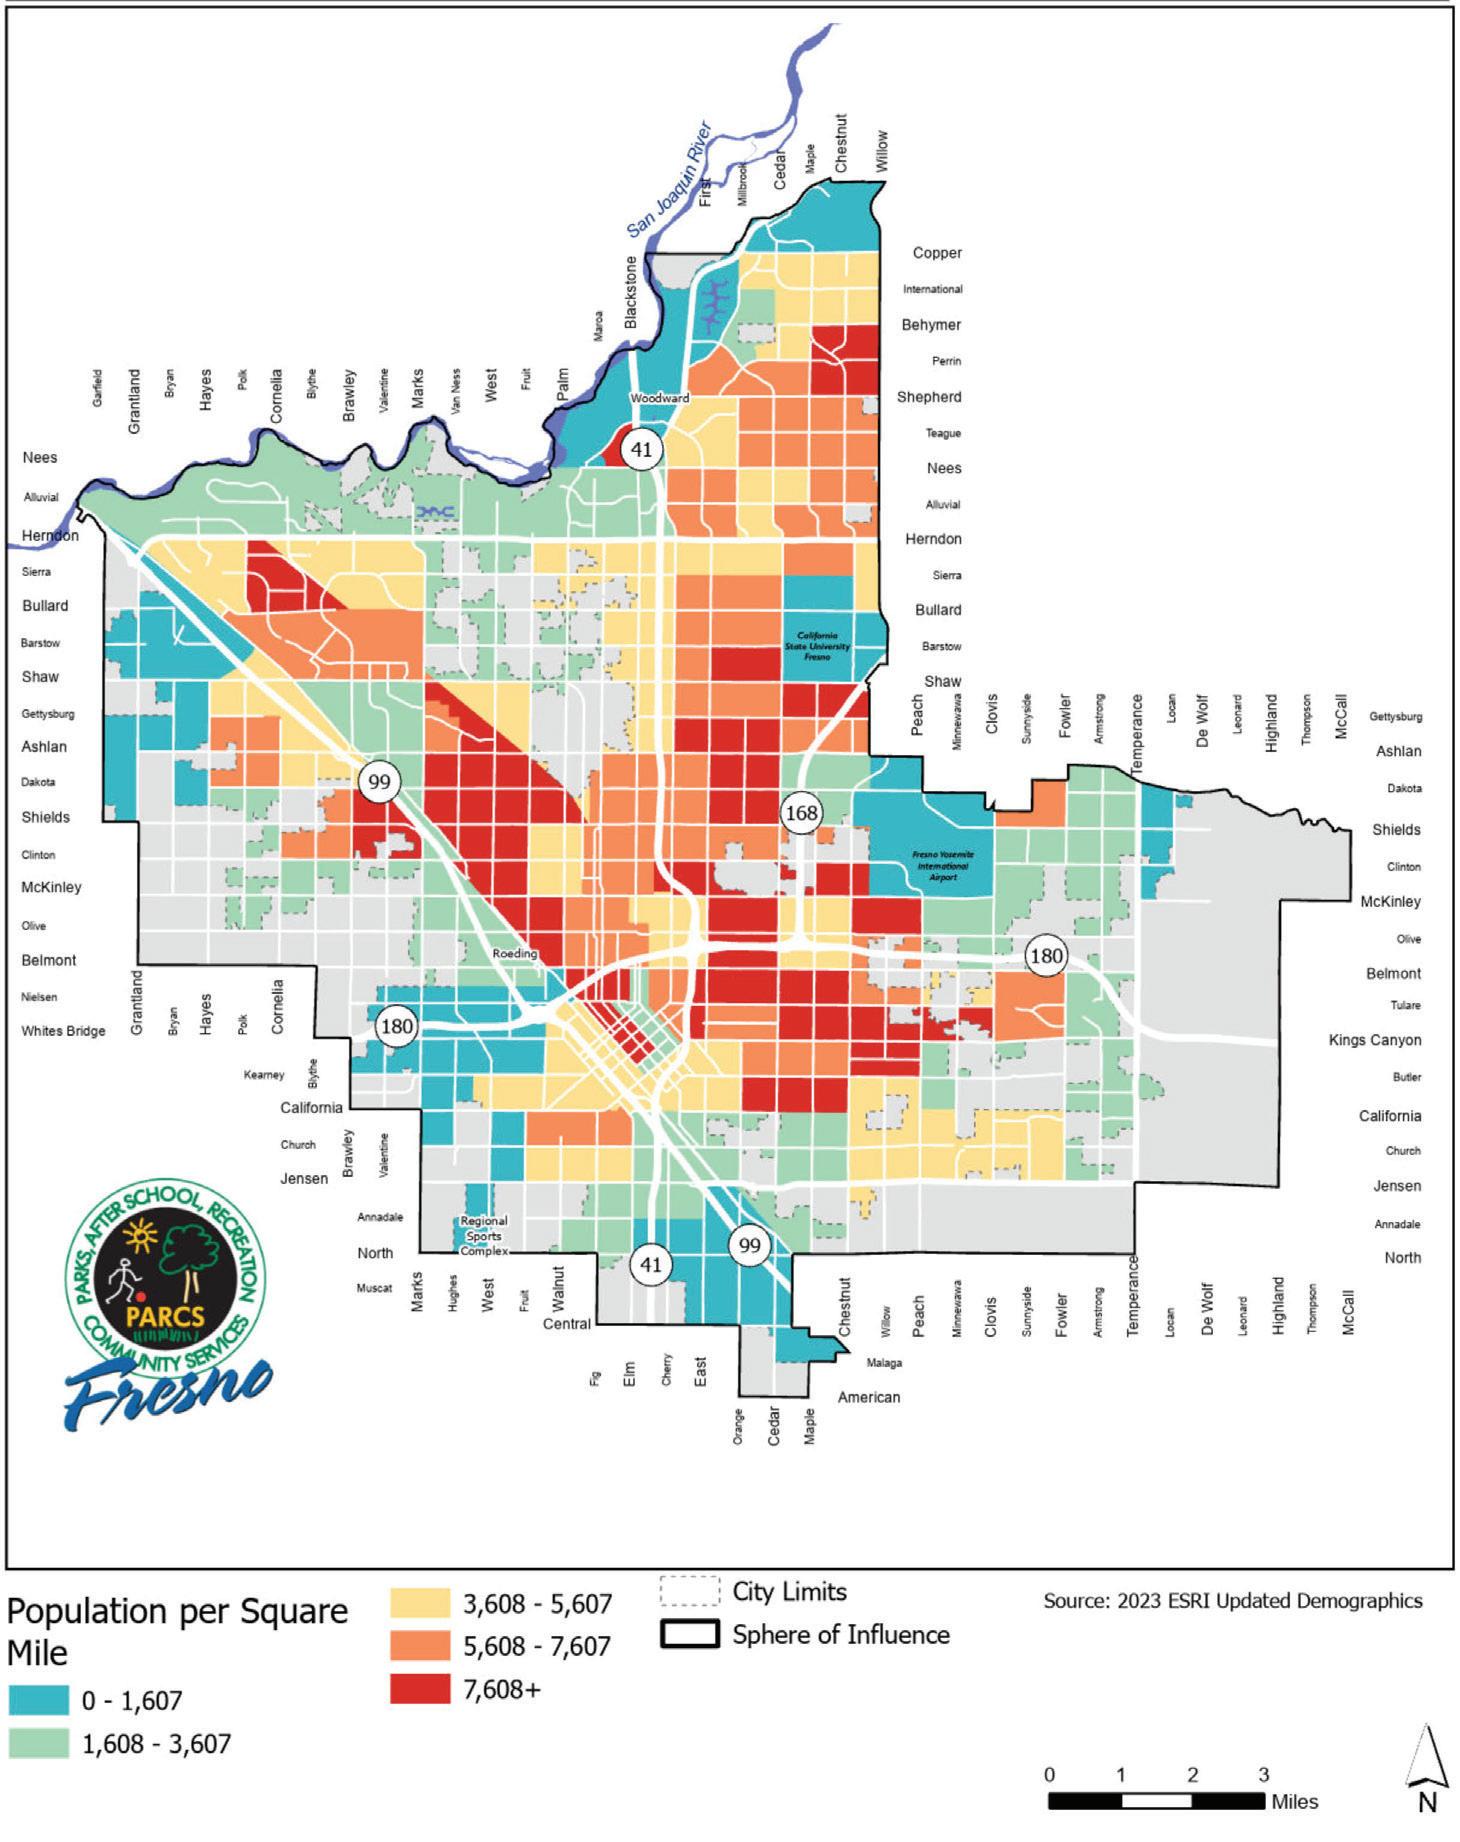
Denser residential areas of a city often have less access to private outdoor space. Public park access is even more critical here.
The red and orange on this map show neighborhoods where the population density is greater than the average in the city.
SOURCE: 2020 Census
DEFINITION
Census tracts with a population density of more than 5,607 people per square mile.
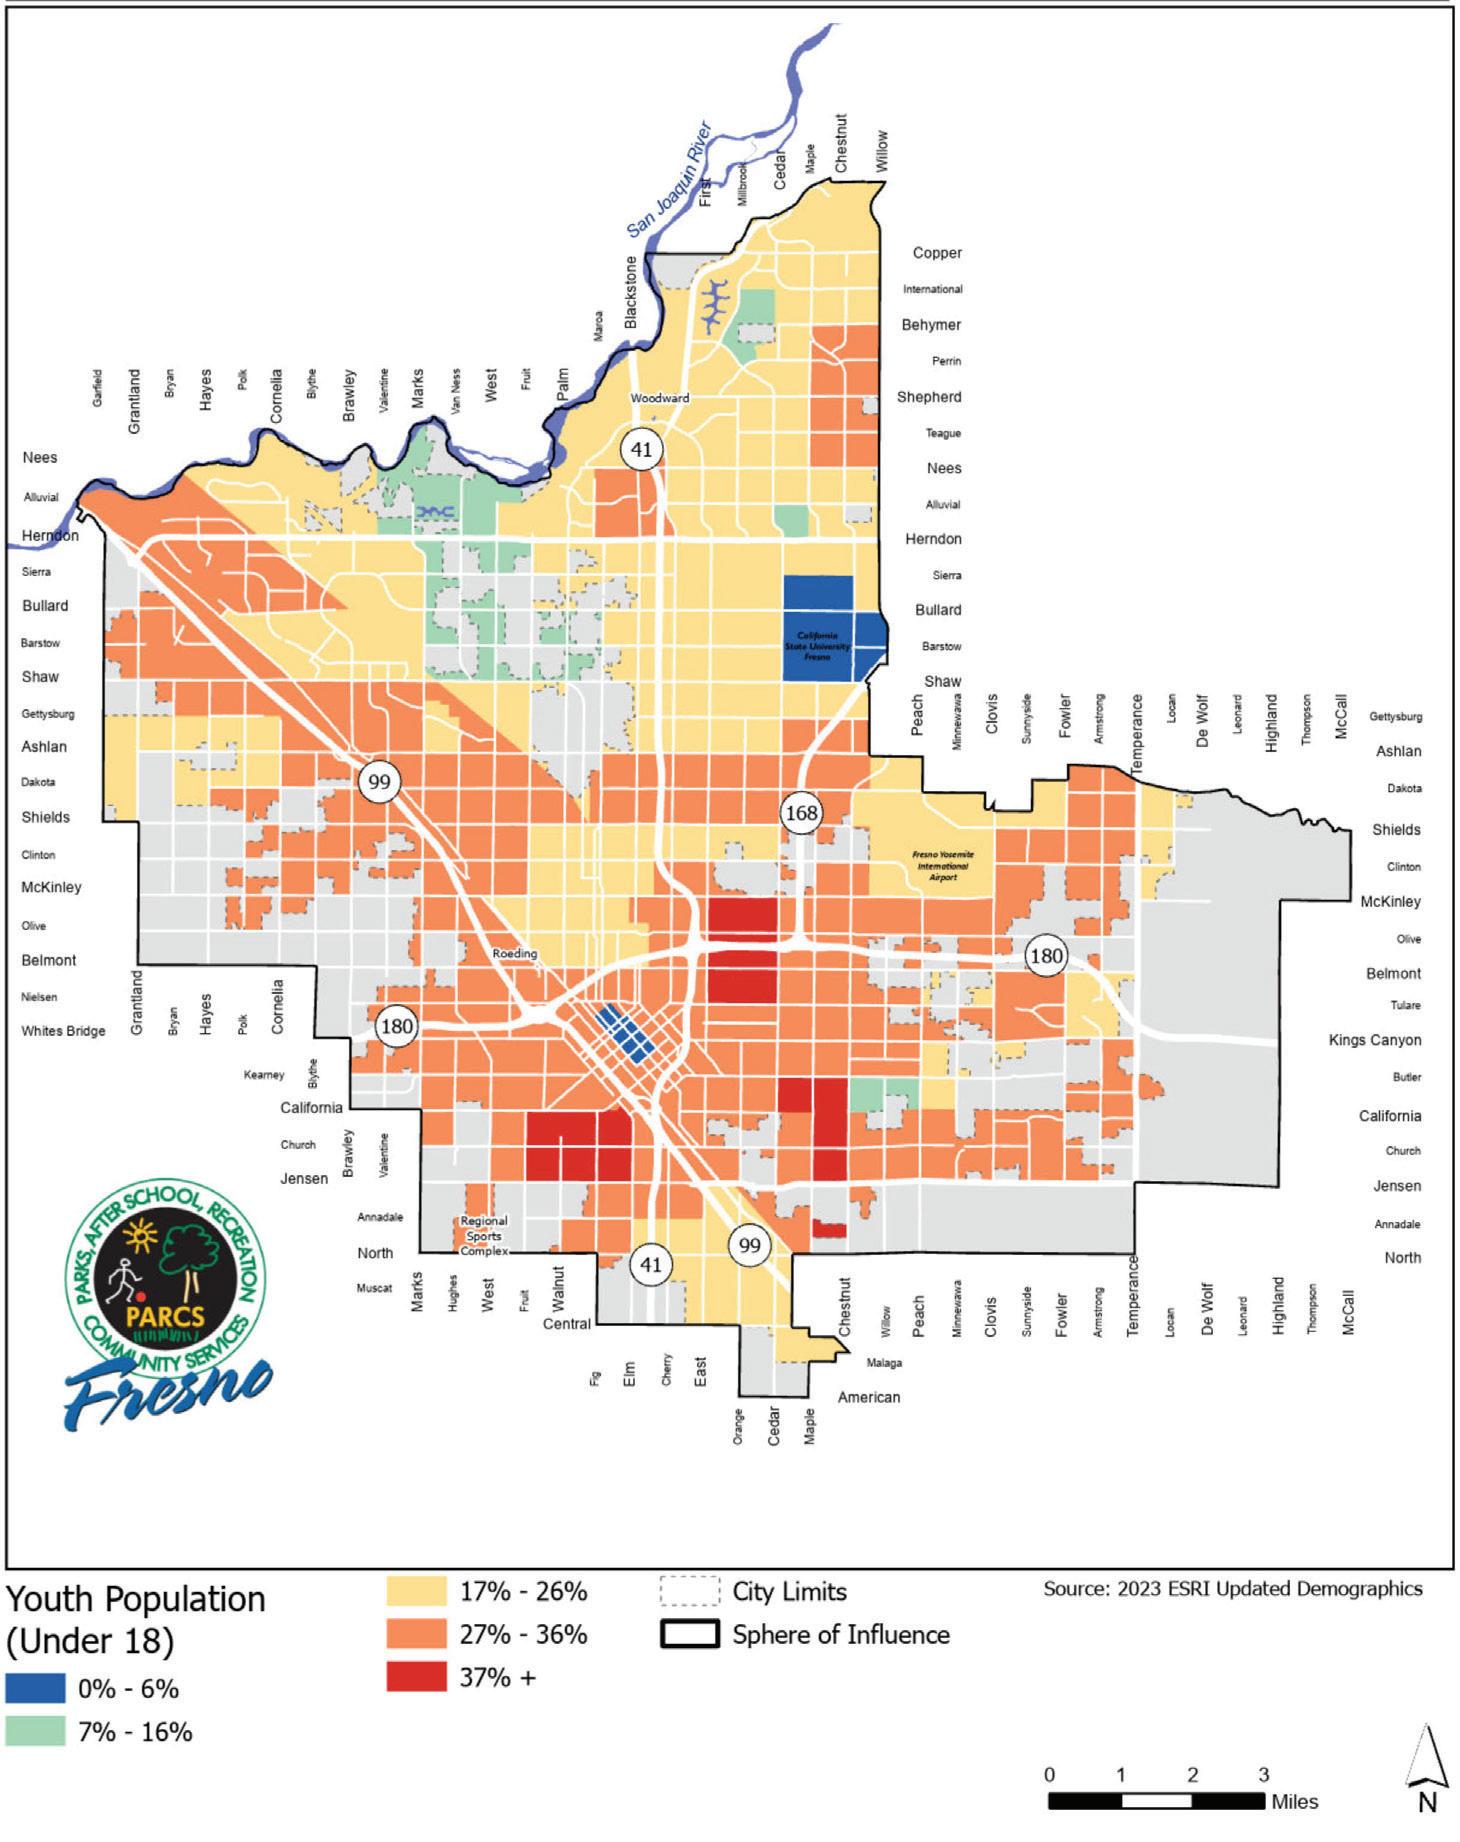
Access to green space is important to the mental well-being, overall health and cognitive development of children.
Orange and red areas on this map show neighborhoods where there are more children under 18, compared to the citywide average.
SOURCE:
2020 Census
DEFINITION
Census Tracts where the percent of the population of residents under 18 years of age is greater than 26%.
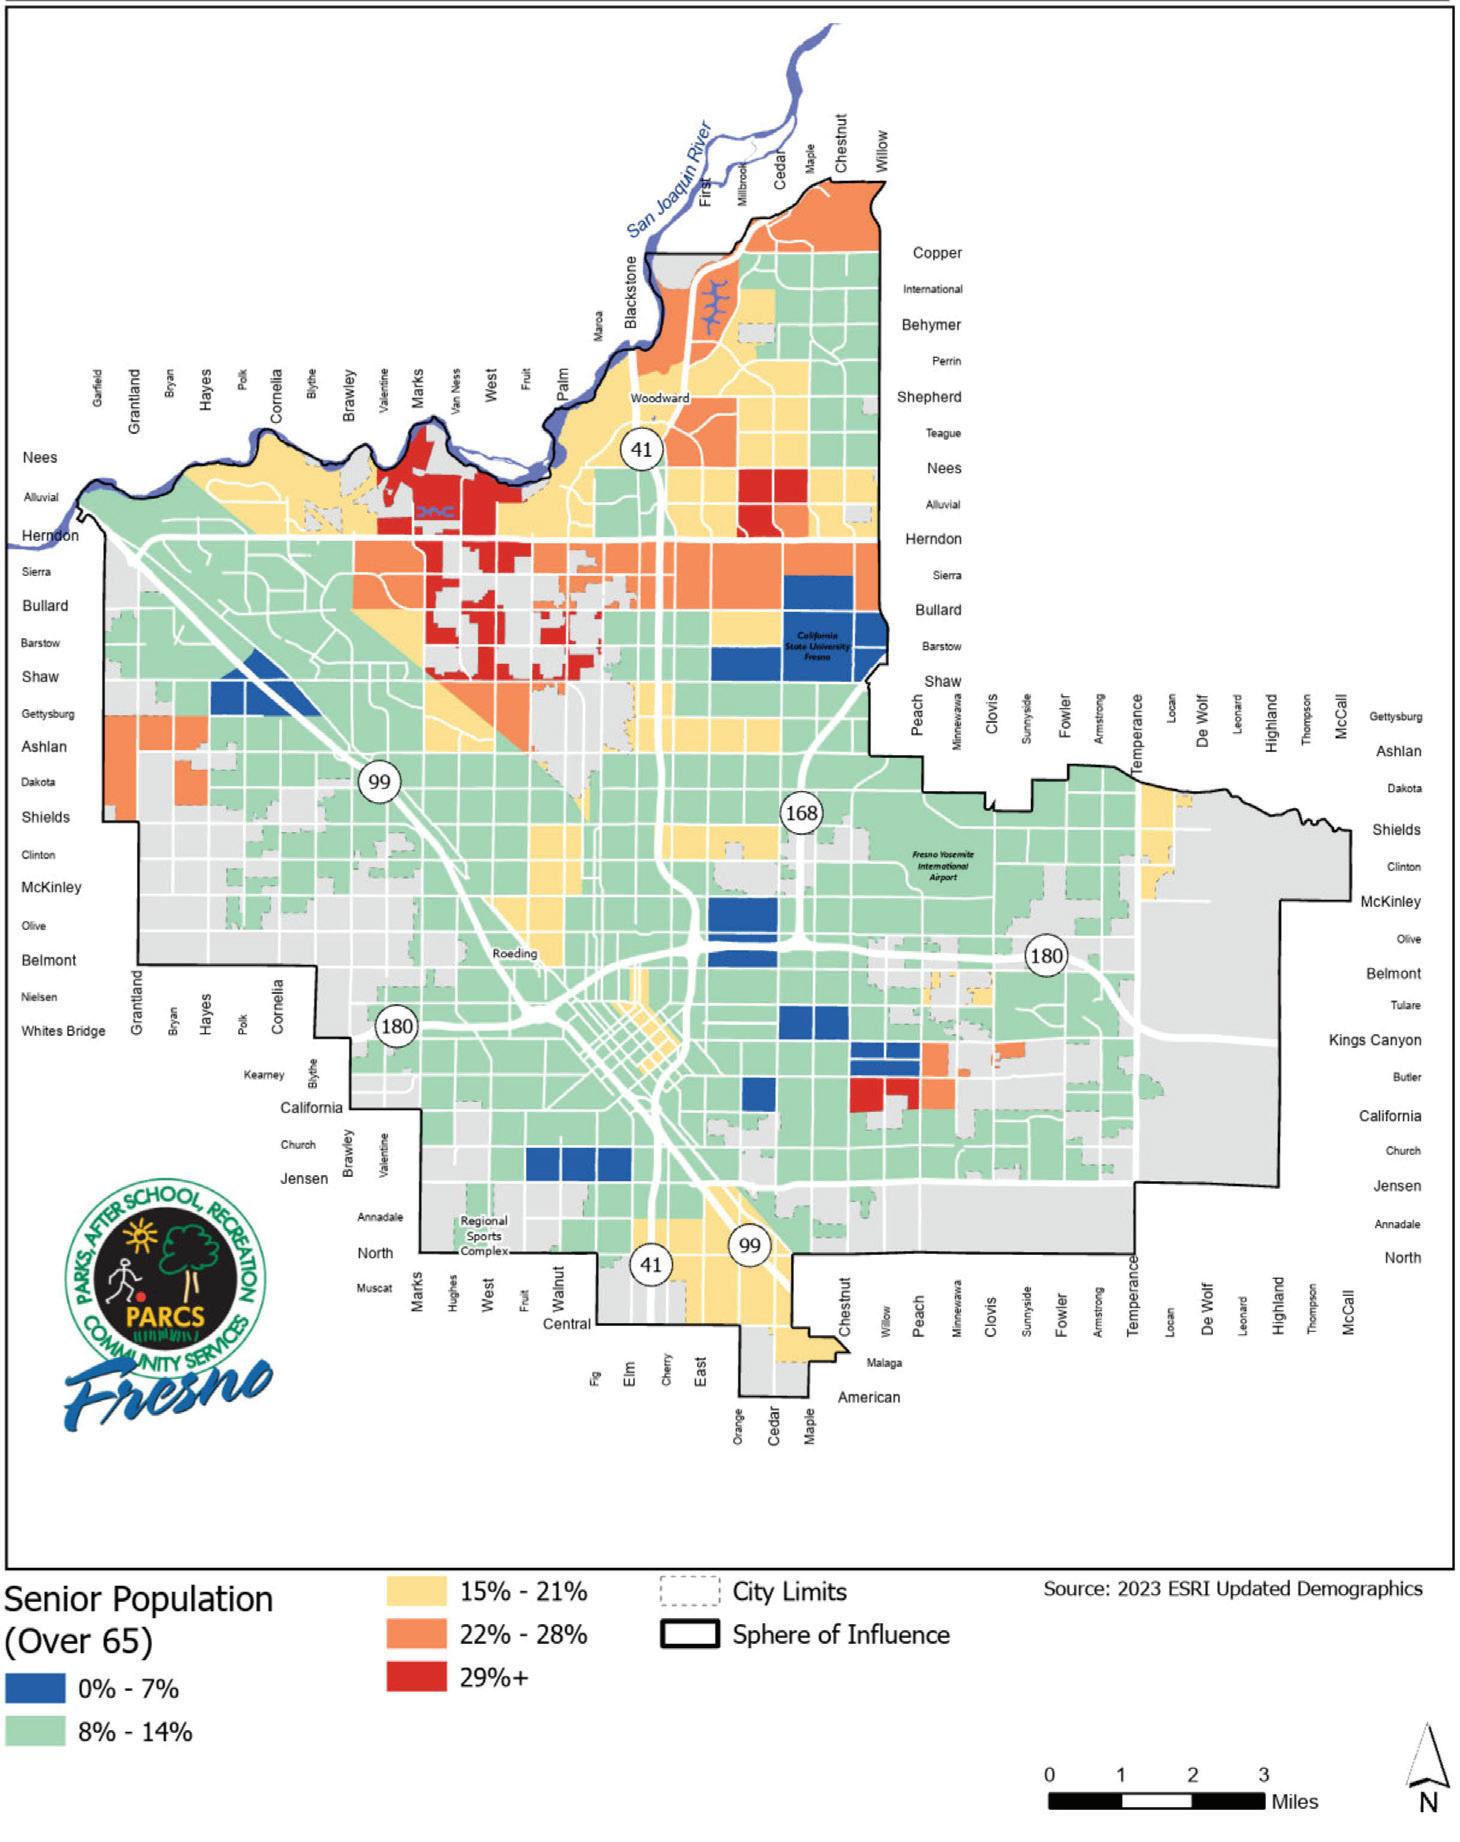
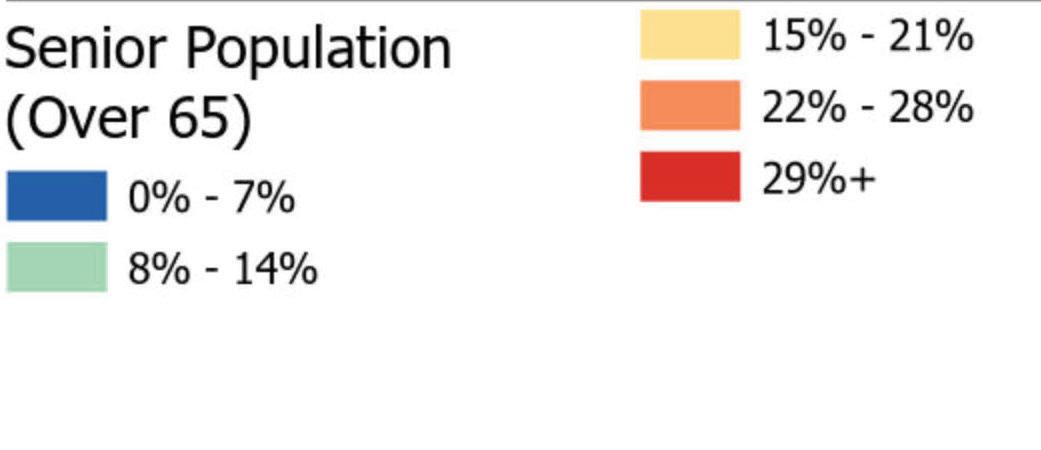
Access to green space is important to the mental well-being and overall health for seniors as they age in place.
Yellow, orange and red areas on this map show neighborhoods where there are more adults age 65 or older, compared to the citywide average.
SOURCE:
2020 Census
DEFINITION
Census tracts where the percent of the population of residents over 65 is greater than 14%.
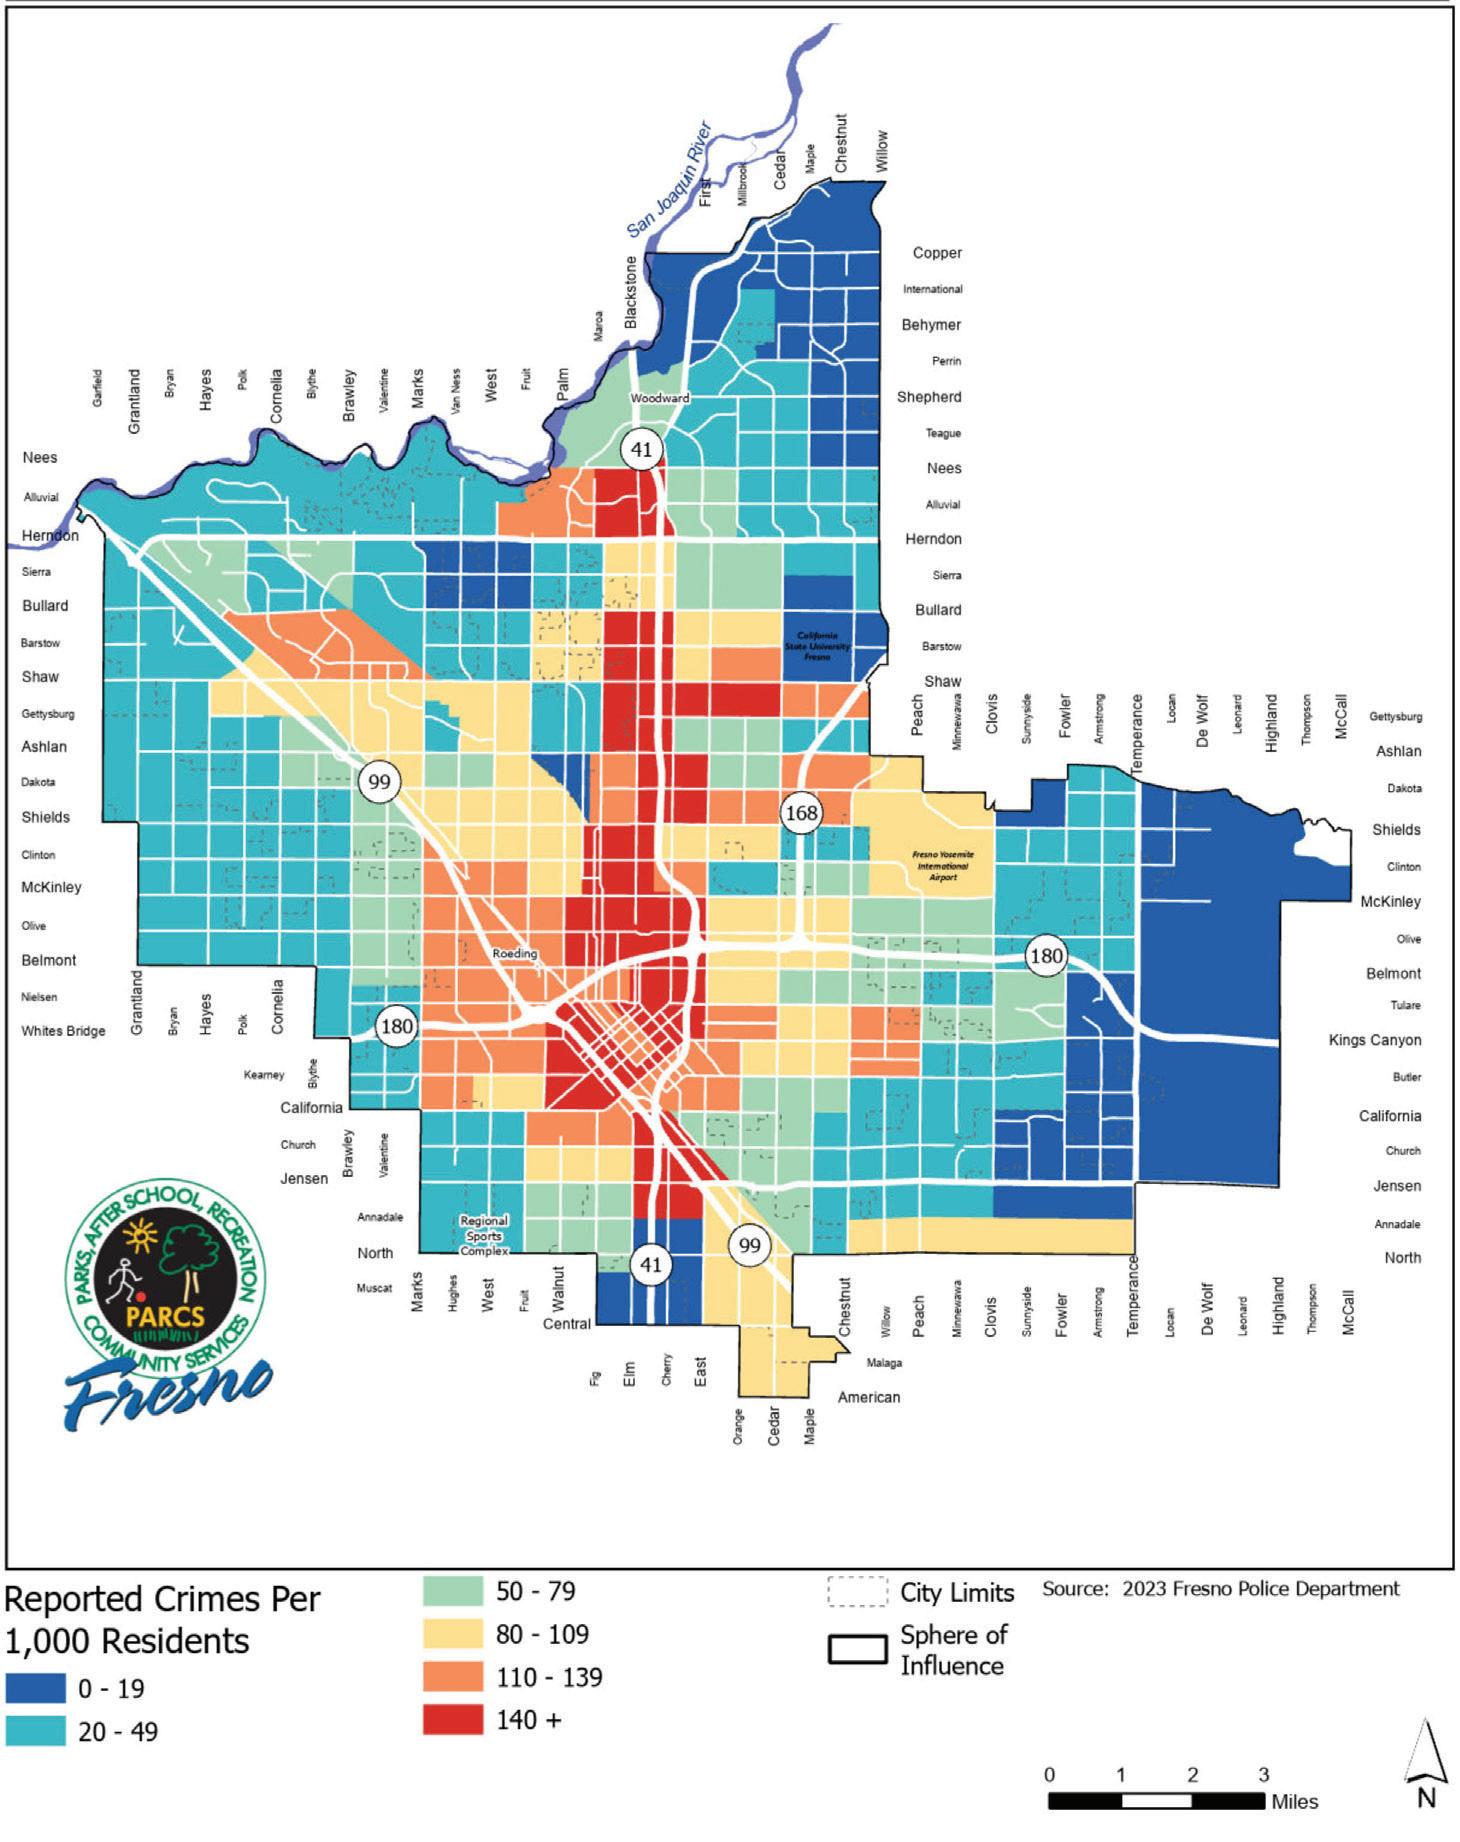
Parks provide a place for people to get together and can make communities more cohesive.
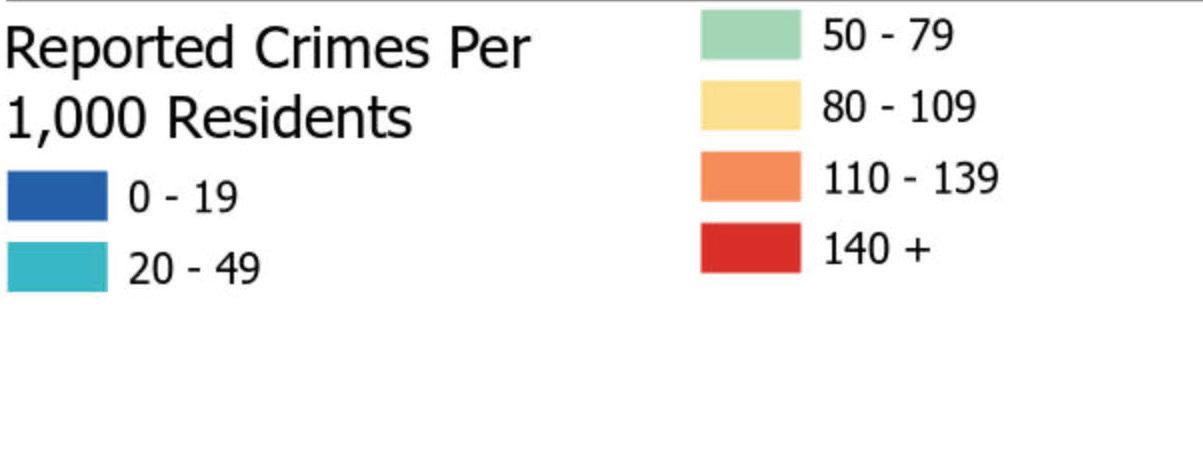
Red, orange and yellow on this map show areas in Fresno where there were a higher number of crimes per 1,000 people, compared to the citywide average.
SOURCE: Fresno Police Department
DEFINITION
Census Tracts where the number of reported crimes is greater than 79 per 1000 people.
DEFINING HIGHEST-NEED NEIGHBORHOODS
People with lower economic independence rely on public parks to fulfill their public health needs.
Red and orange on this map show neighborhoods with a higher percentage of concentrated poverty, compared to the citywide average.
SOURCE:
CalEnviroScreen 4.0
DEFINITION
Census Tracts with a poverty percentile greater than 72%.
In the State of California tool used in this analysis (CalEnviroScreen 4.0) poverty is defined as percent of the population living below two times the federal poverty level.
Urban green spaces have a natural ability to filter pollution from the air and reduce local air and ground temperature.
Red and orange on this map show areas of Fresno that have a higher Pollution Burden, compared to the citywide average.
SOURCE:
CalEnviroScreen 4.0
DEFINITION
Census Tracts where the Pollution Burden percentile is greater than 68%.
In the State of California tool used in this analysis (CalEnviroScreen 4.0), pollution burden represents the potential exposures to pollutants and the adverse environmental conditions caused by pollution.
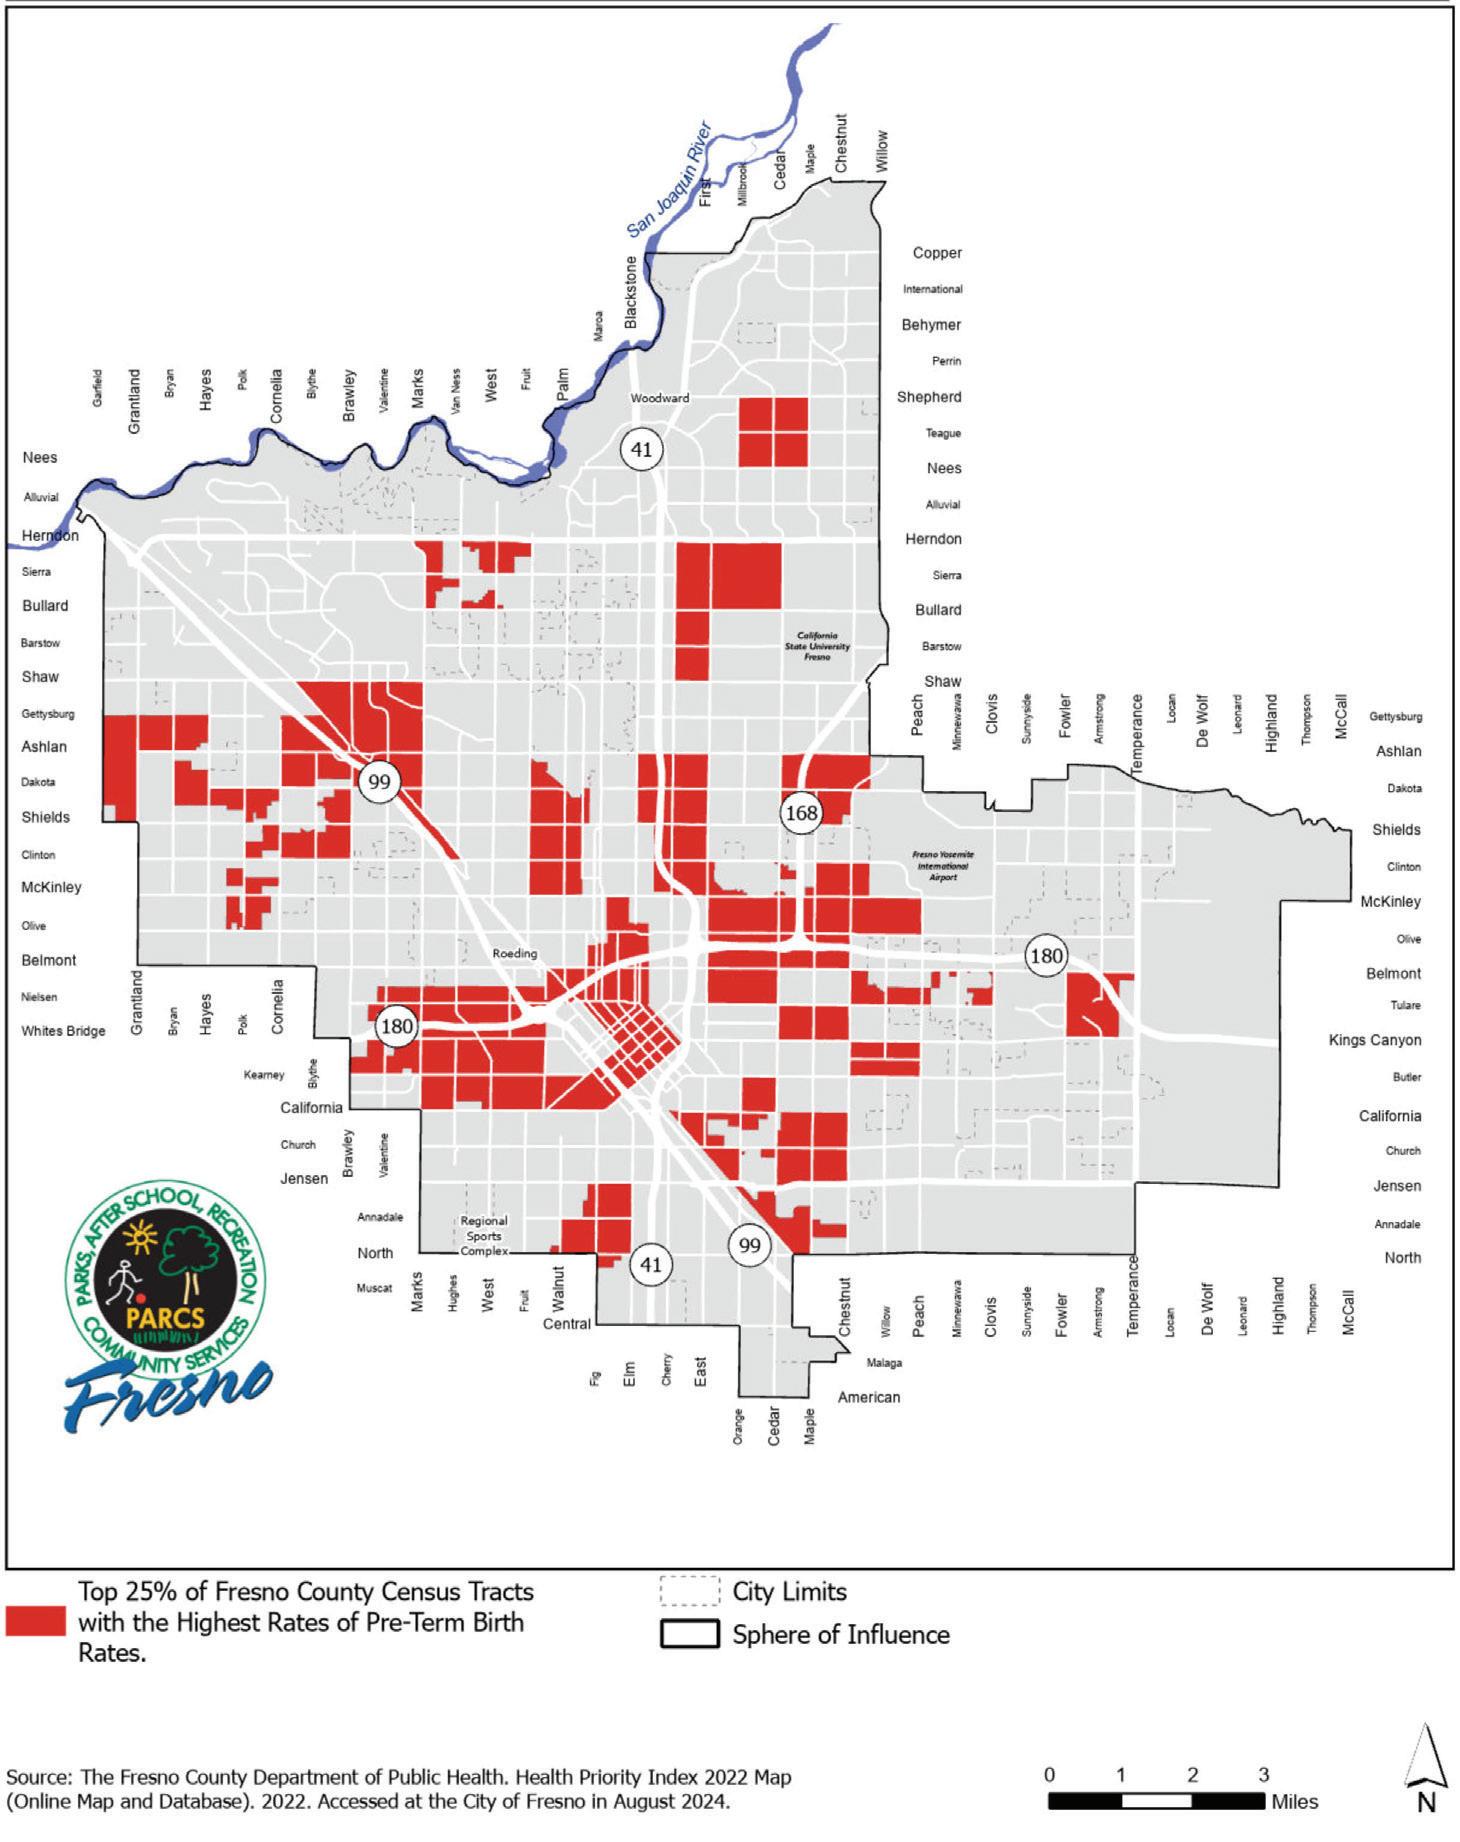
Creating access to spaces where people can engage in physical activity and connect with the outdoors can help improve overall health.
Red on this map shows areas of Fresno where the rate of pre-term births is in the top 25% of Fresno County census tracts.
SOURCE: Fresno County Department of Public Health
DEFINITION
Census Tracts identified as being in the highest percentile for pre-term births.
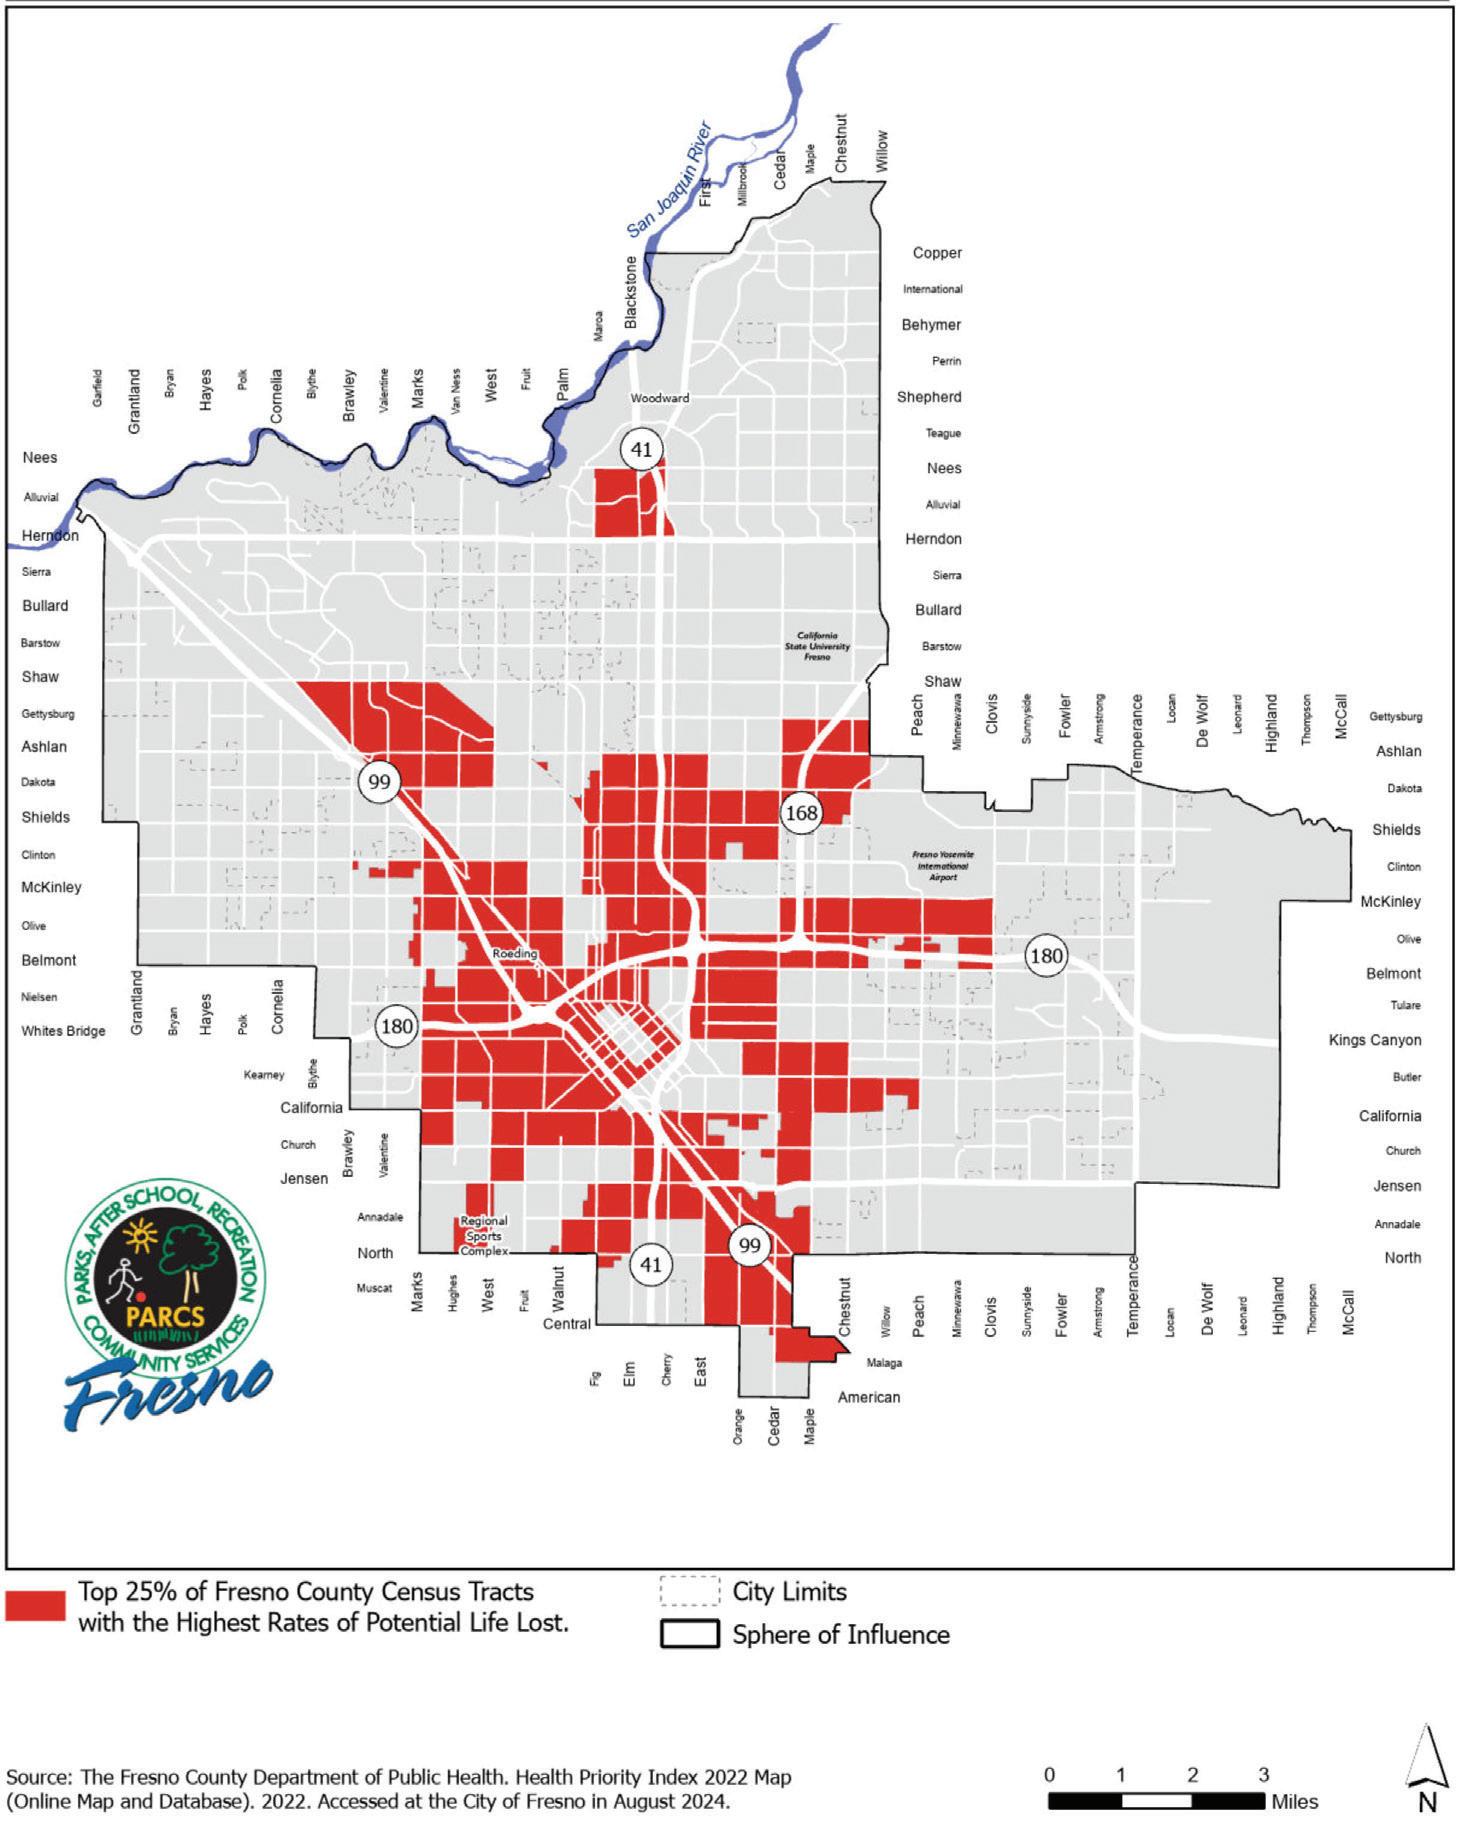
Creating access to places where people can engage in physical activity and connect with the outdoors can help improve overall health.
Red on this map shows areas of Fresno where the rate of premature mortality, or people dying before the age of 65, is in the top 25% of census tracts in Fresno County.
SOURCE: Fresno County Department of Public Health
DEFINITION
Census Tracts identified as being in the highest percentile for years of potential life lost.
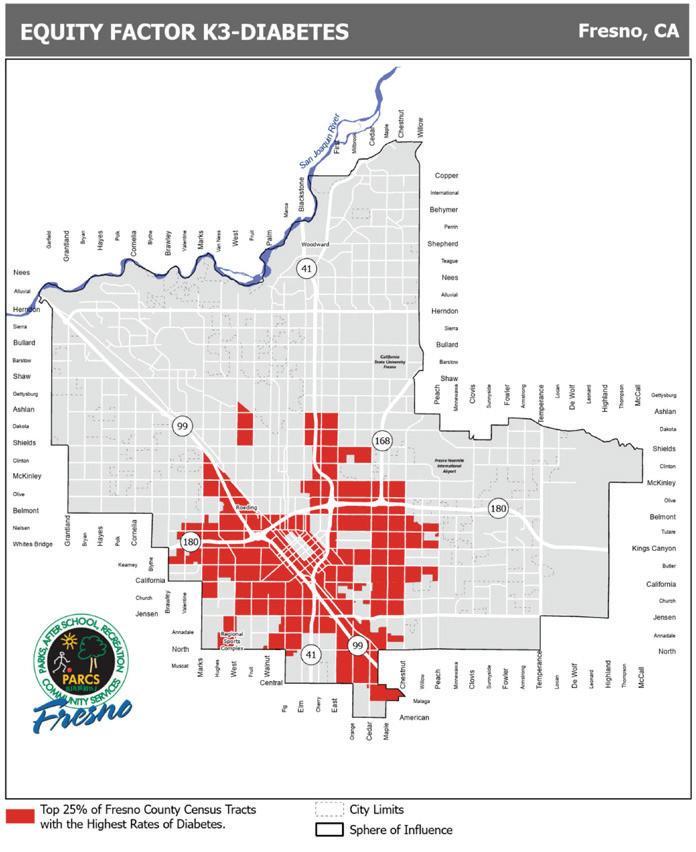
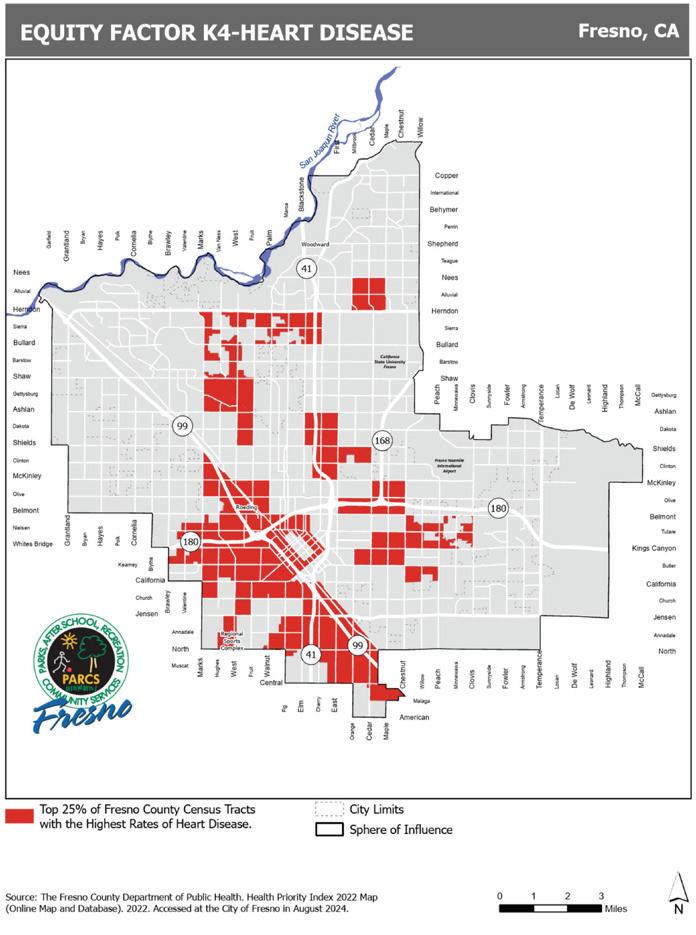
NEIGHBORHOOD COMPOSITE MORTALITY RATE
Creating access to places where people can engage in physical activity and connect with the outdoors can help improve overall health.
Red on these maps show areas of the City in the top 25% of Fresno County census tracts for cancer, asthma, heart disease, and diabetes (clockwise from top left).
COMPOSITE MORTALITY RATE
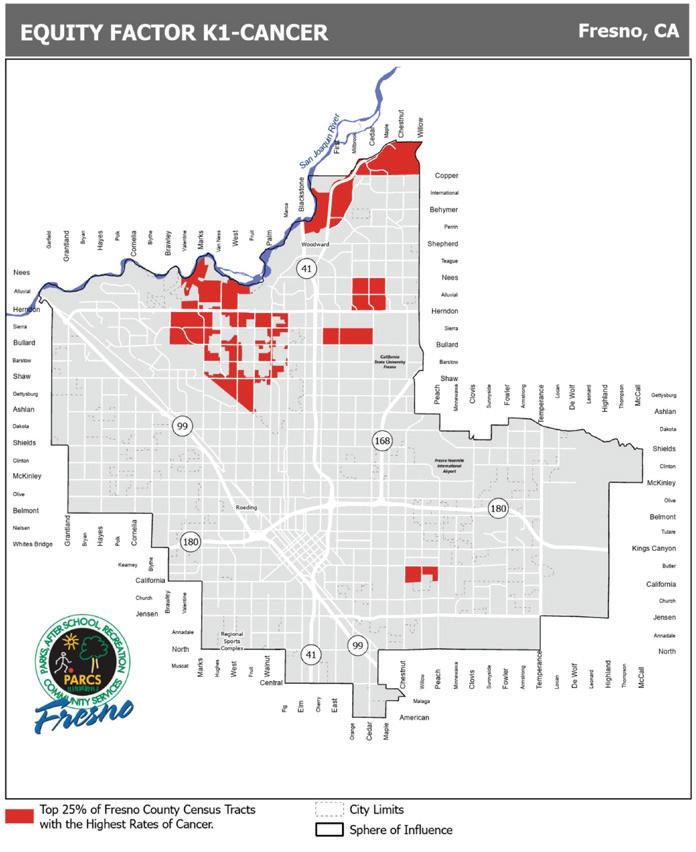
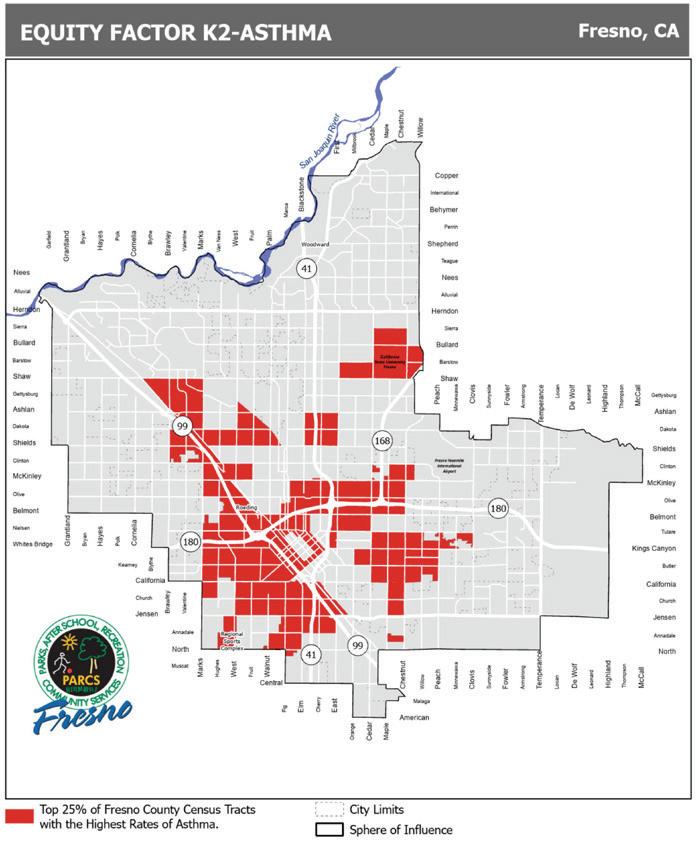
SOURCE: Fresno County Department of Public Health
DEFINITION
Census Tracts identified as being in the highest percentile for cancer, adult asthma, diabetes or coronary heart disease.
The Measure P Ordinance calls for the City, in conjunction with the Parks, Recreation and Arts Commission, to update the definition of highest-need neighborhoods every three years. Defining highest-need neighborhoods requires the following process:
1. Update the GIS mapping for each Equity Factor to reflect current data.
2. Engage with the community to determine the relative importance of each Equity Factor.
3. Create a weighted index incorporating the data from all Equity Factors weighed by their relative importance to Fresno residents at the scale of each census tract (neighborhood) in Fresno. Display the weighted index in a map format.
4. Engage the community to determine what percentage of census tracts (neighborhoods) should be considered highest-need neighborhoods.
5. Determine the threshold, in terms of the scoring system above, at which neighborhoods qualify as highest-need neighborhoods.
The following pages outline the process that took place in 2024 to determine the highest-need neighborhoods for the purposes of allocating funds under Measure P, for the years 2025 - 2027.
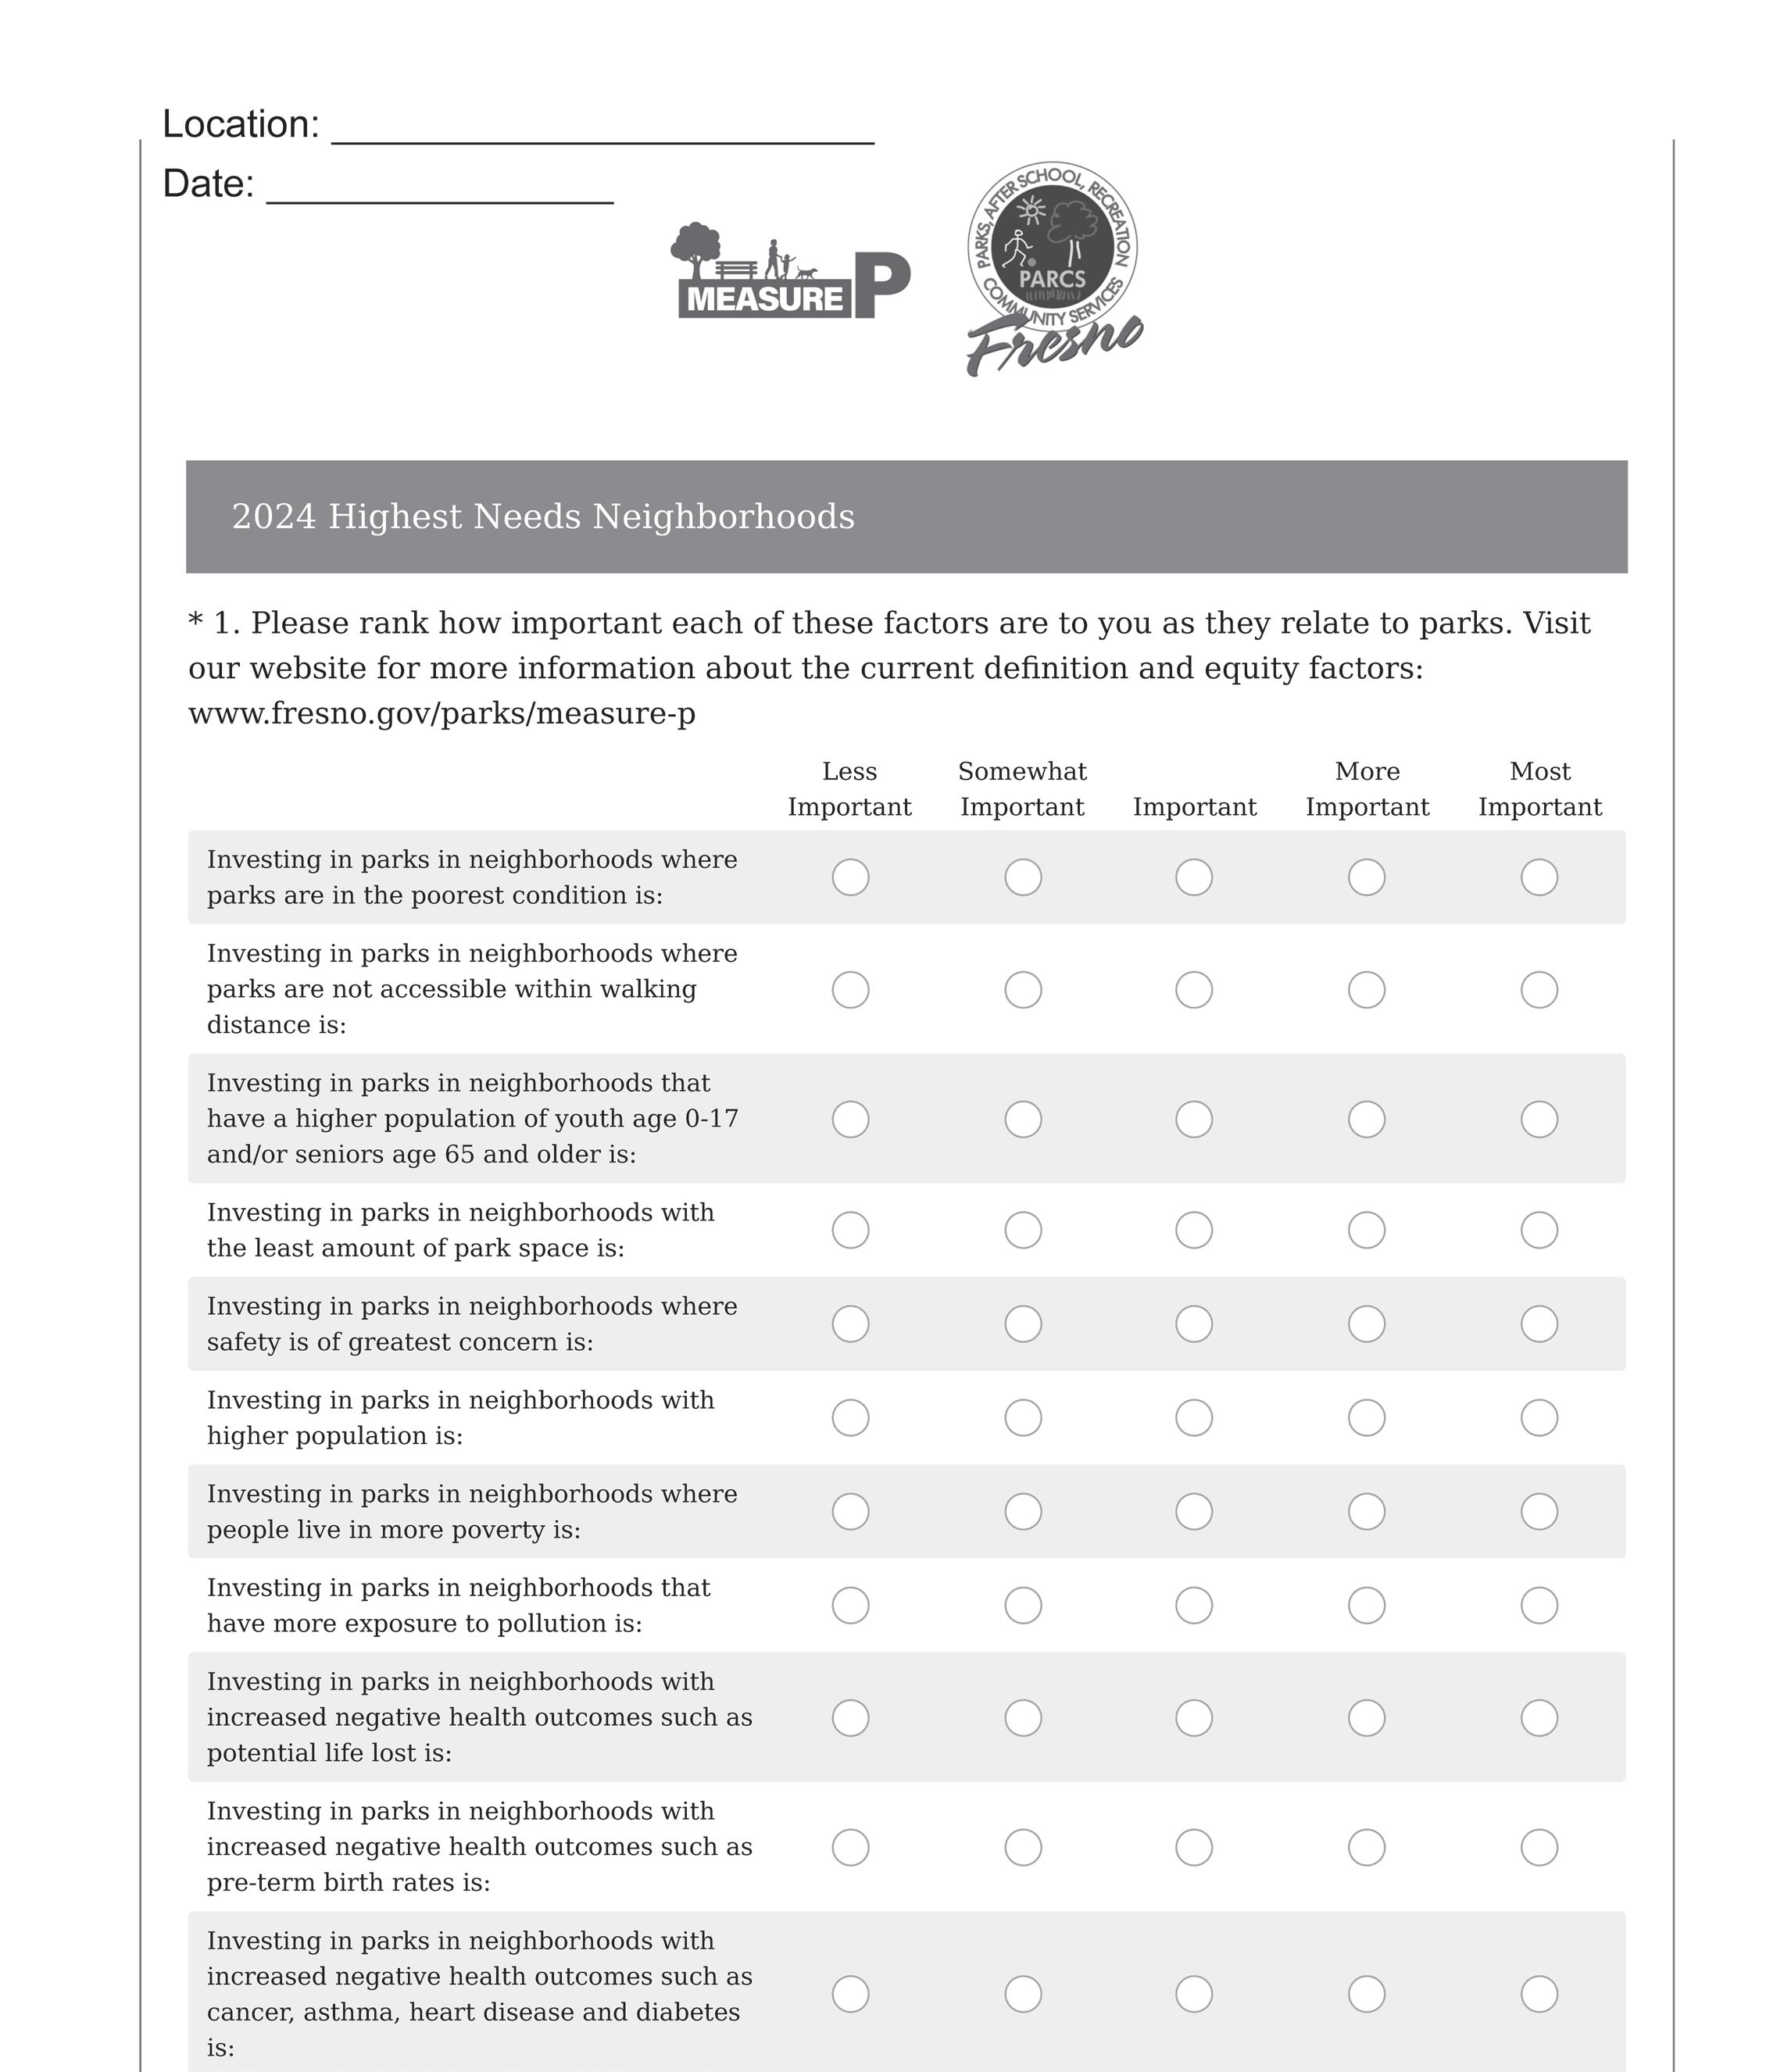
Along with technical support from the Consultant Team and feedback from the PRAC Subcommittee, the City released an online and in person survey that asked the public the level of importance of each Equity Factor. There was one question for each Equity Factor which asked the public if that factor was less important, somewhat important, important, more important or most important (see exhibit #1).
To get the word out on the survey, City staff attended 13 community events, sent over 65,000 emails, posted 10 social media updates and 20 stories, and promoted the survey at all PARCS community centers. Staff also collaborated with other City of Fresno departments and PRAC partners. The survey was featured in two local news reports.
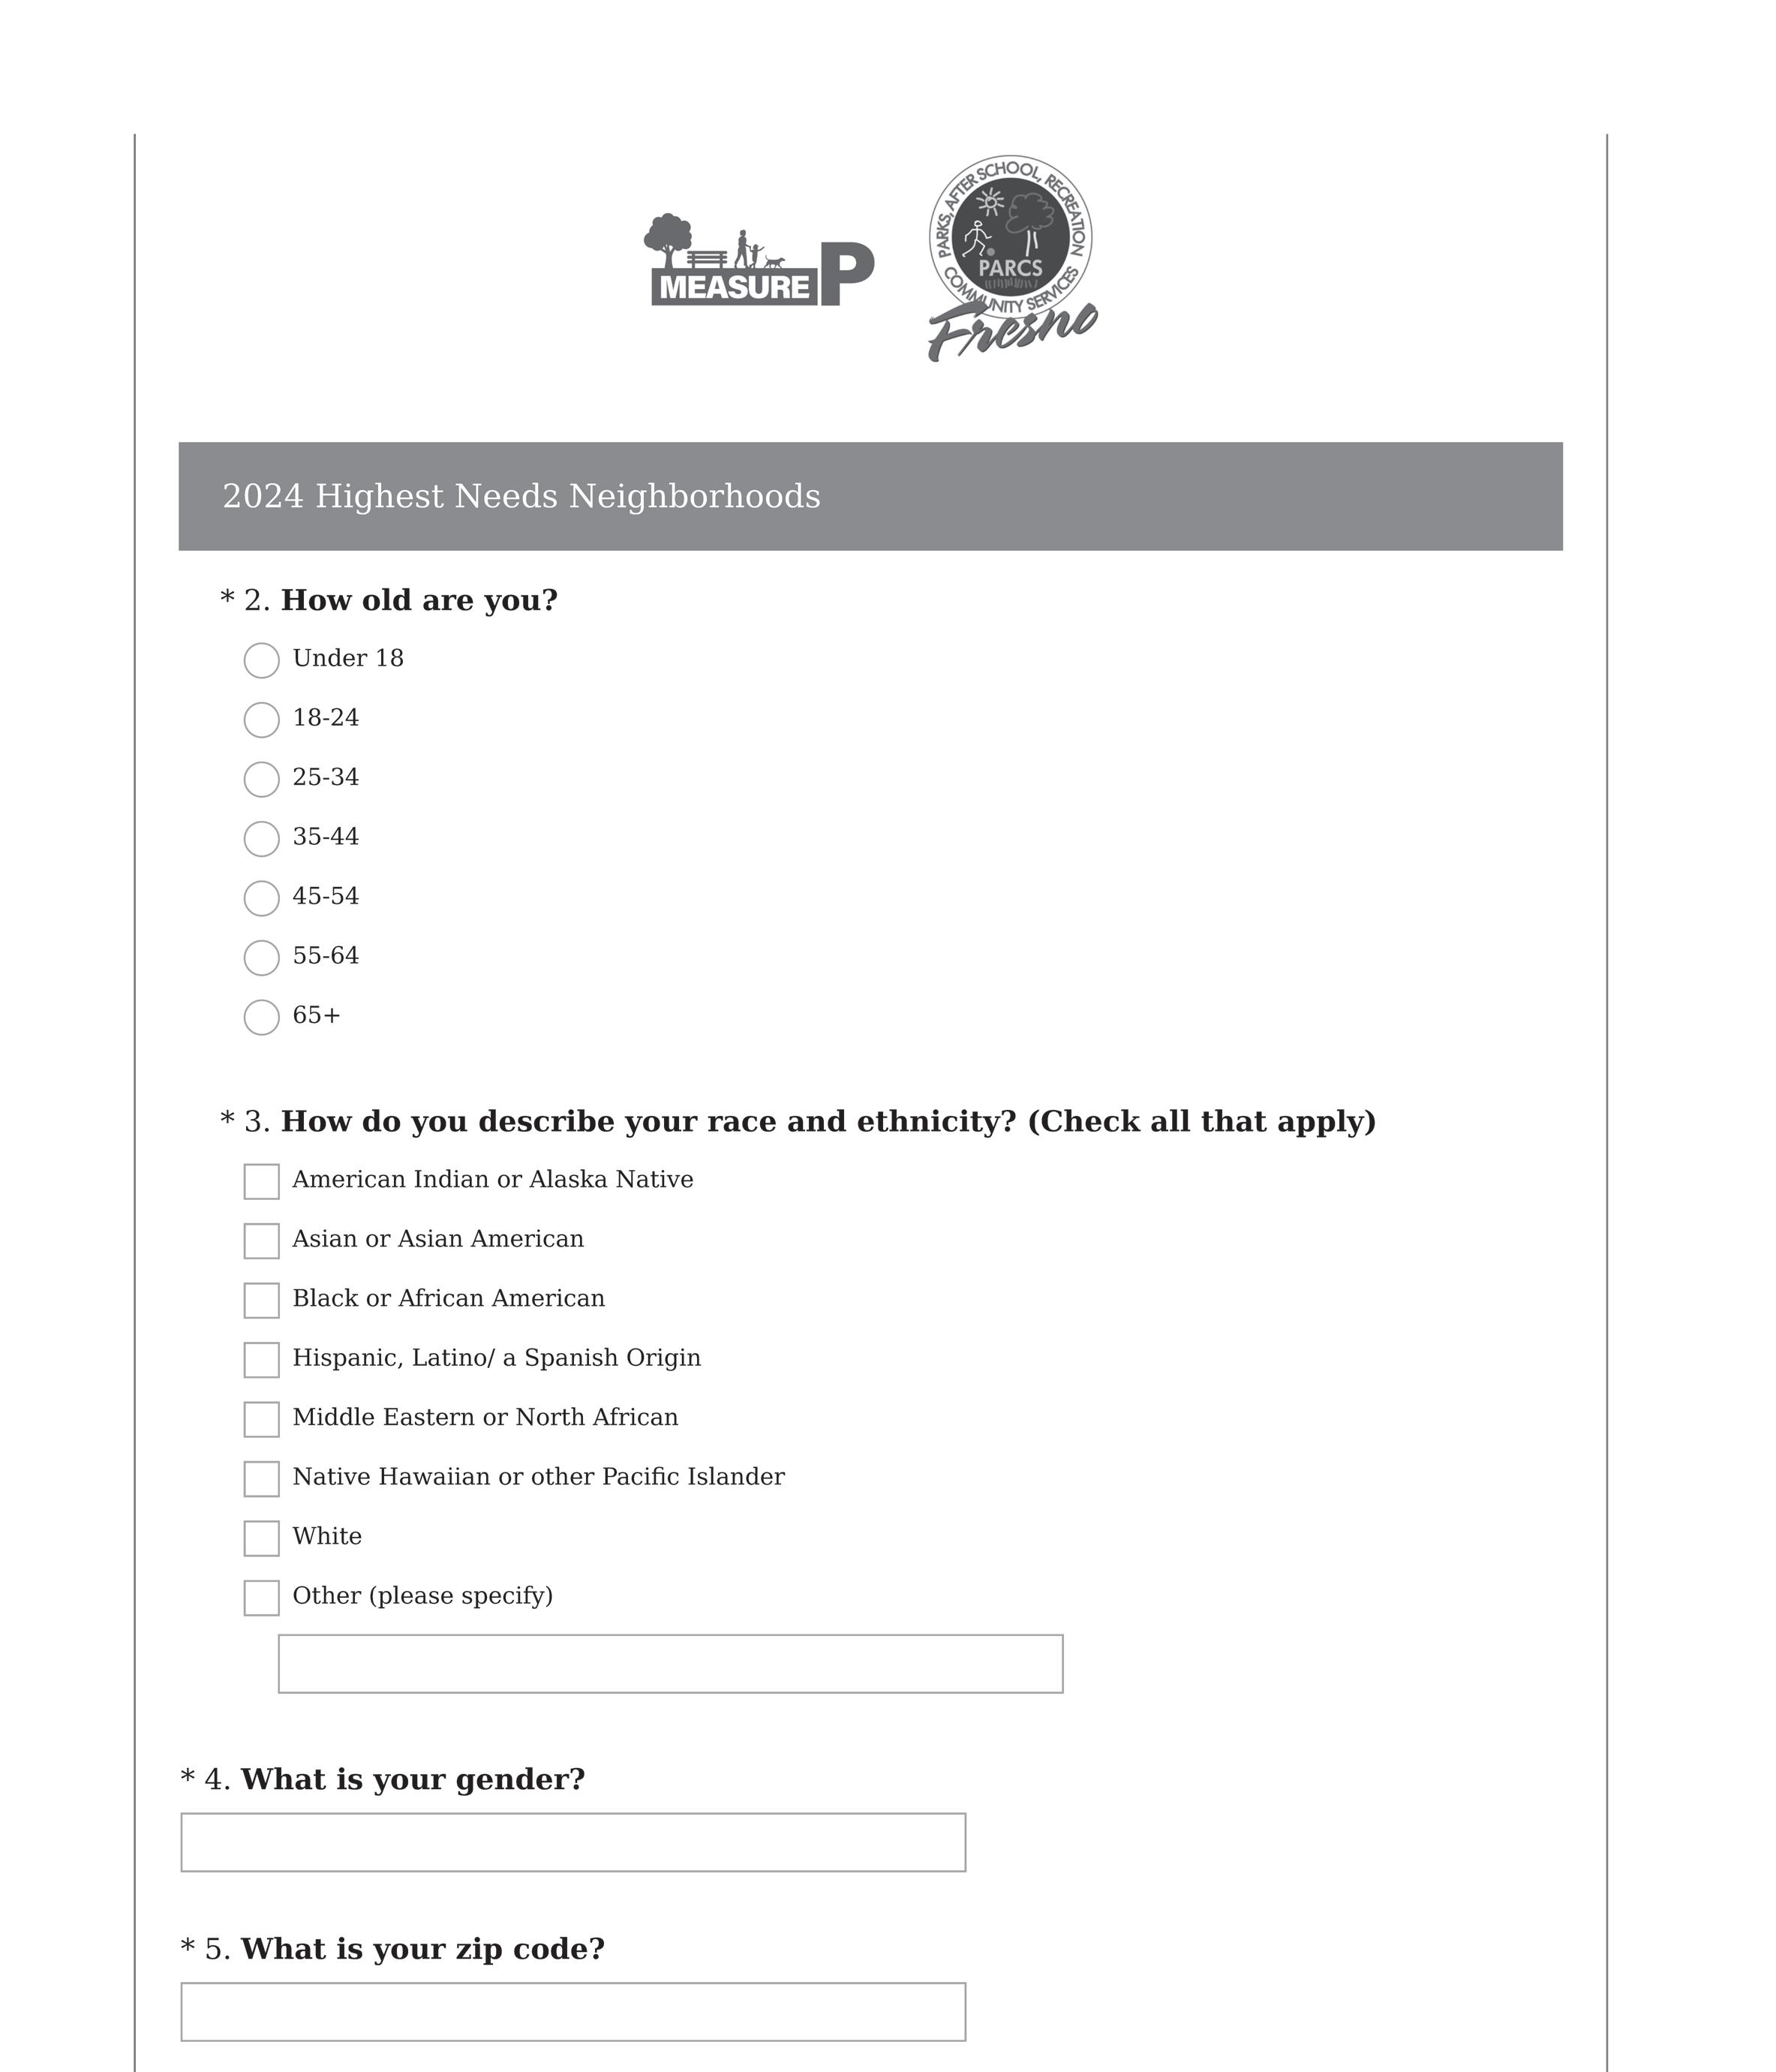
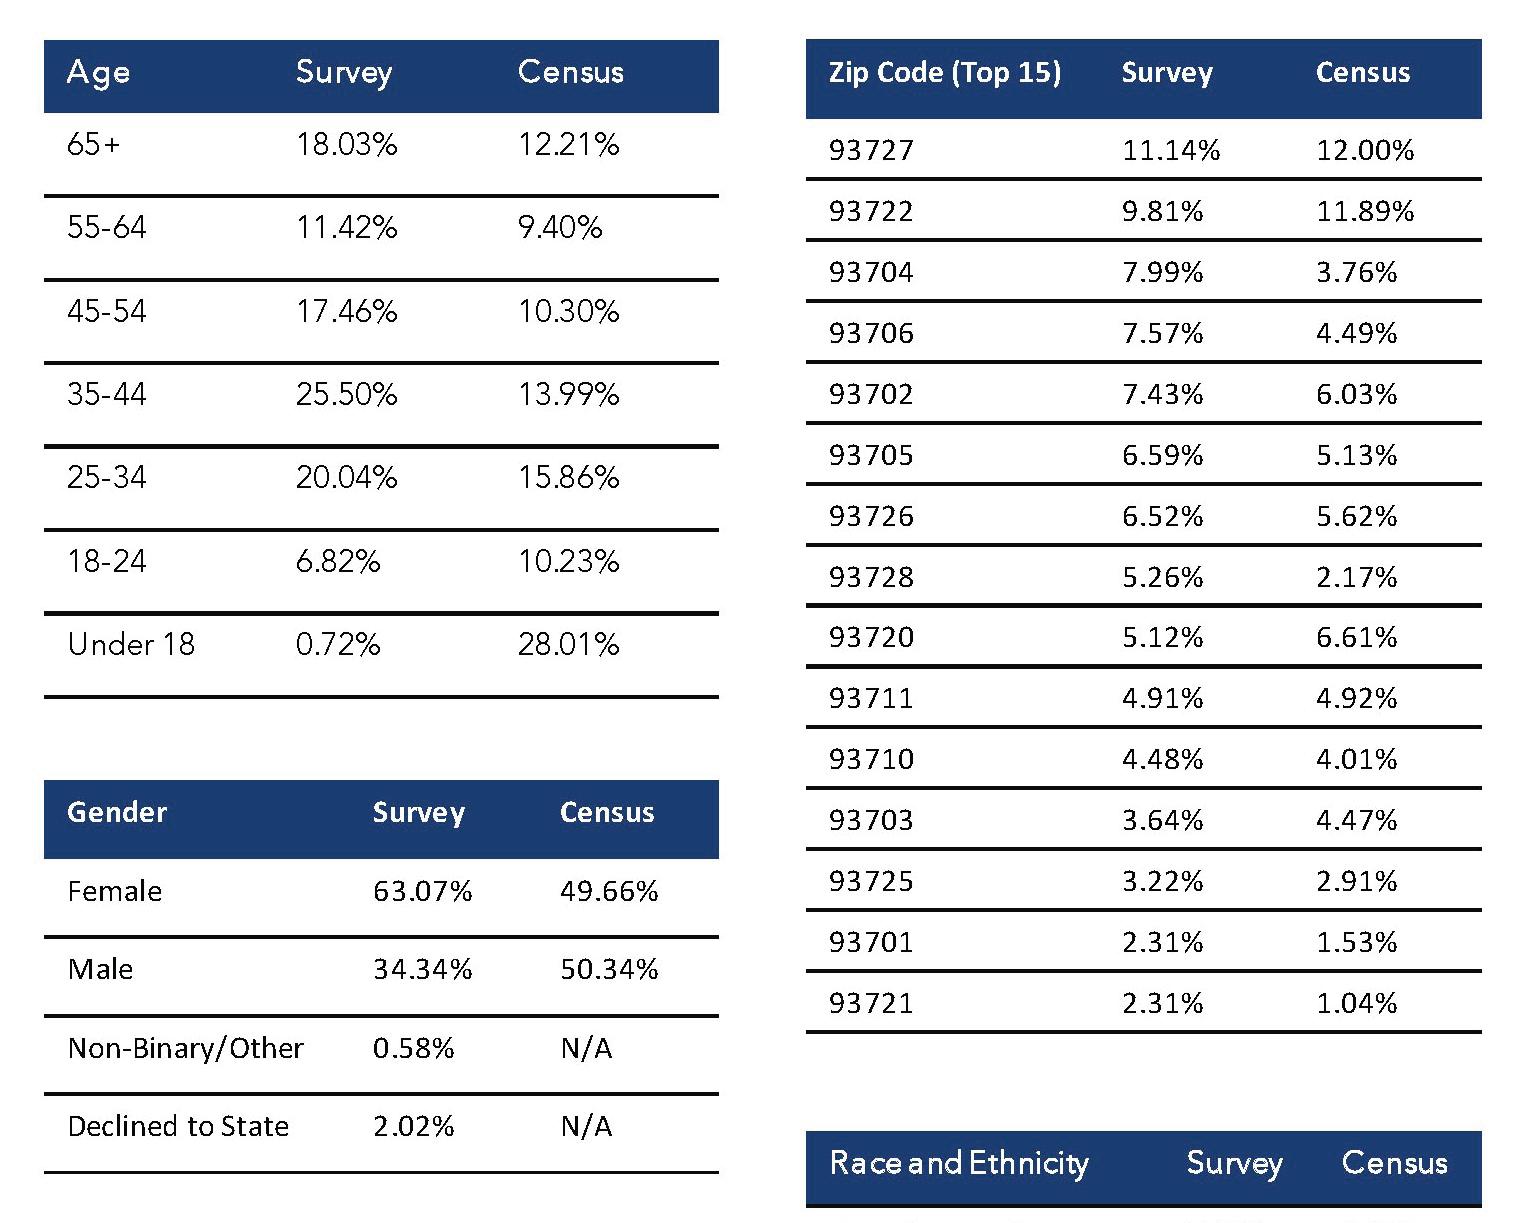
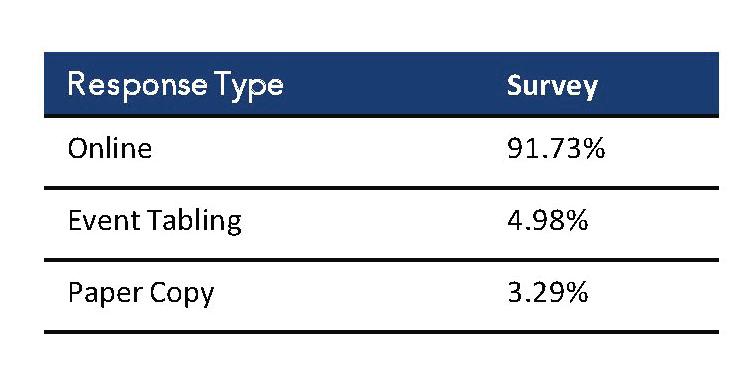
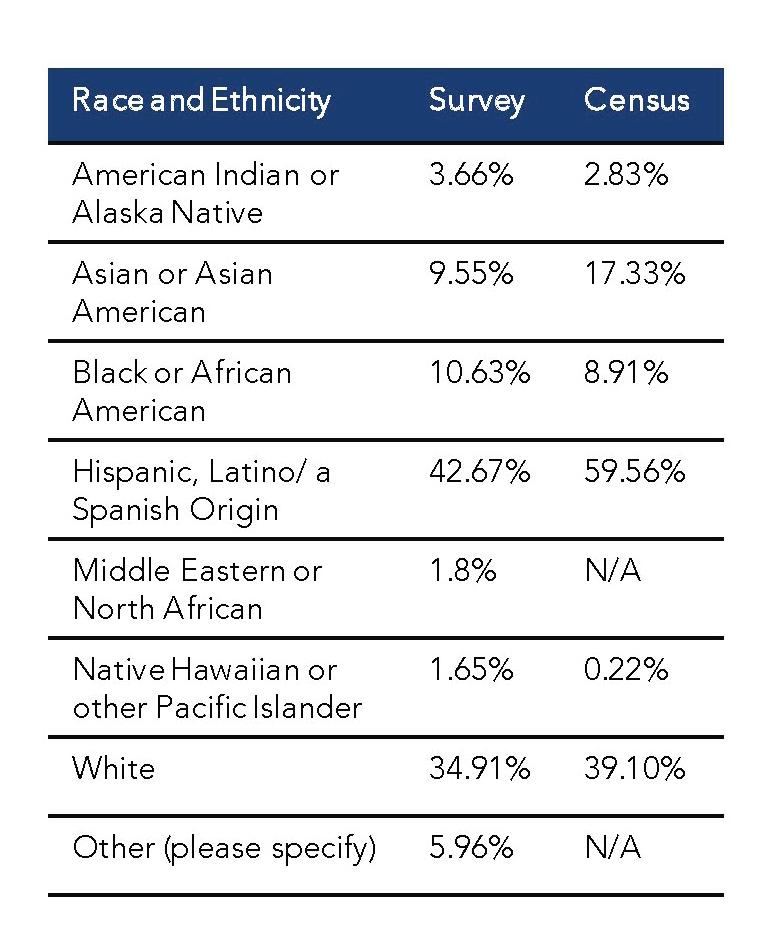
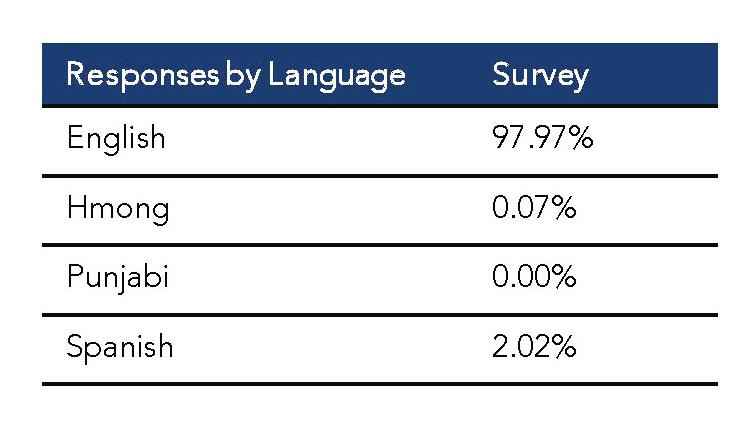
Phase one of outreach efforts resulted in 1,427 survey responses, with an overview of age, gender, zip code, race and ethnicity and response type below:
The survey gave the community an opportunity to rate each Equity Factor with a level of importance. Once the survey was complete, the Consultant Team analyzed the results by looking at the spread of responses for each Equity Factor, finding the median or midpoint of the responses, with half of the responses falling below the midpoint, and half falling above. The midpoint was used to determine the weighting that would be applied to each Equity Factor in the weighted index. The graph below shows that the median point of each Equity Factor fell within either the “important” or “more important” category.
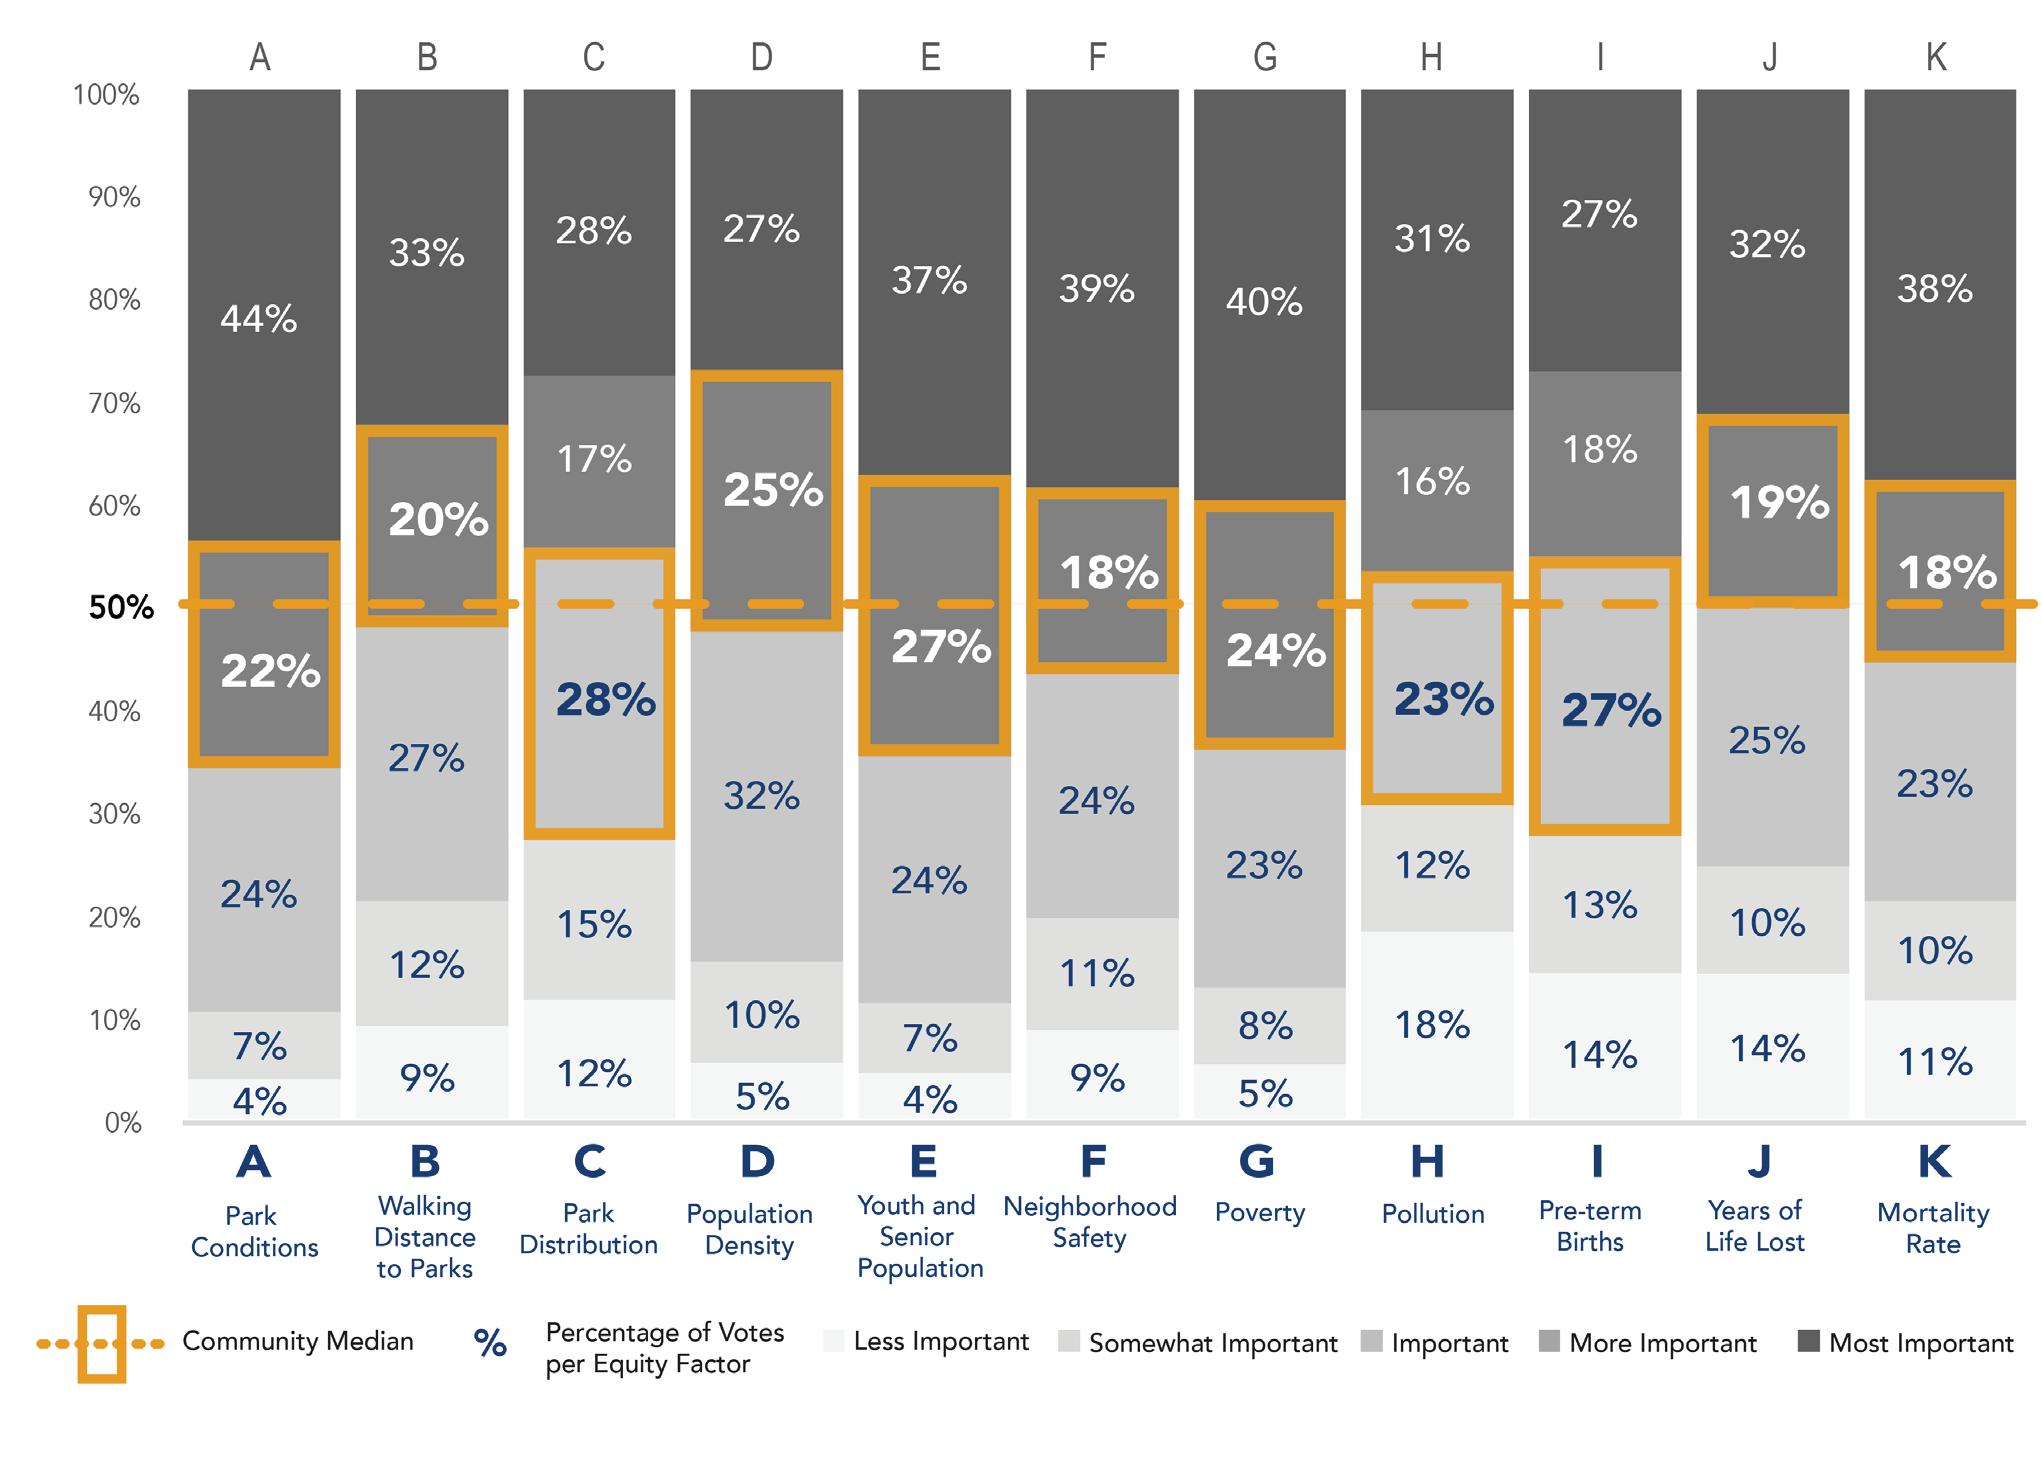
MOST IMPORTANT MORE IMPORTANT IMPORTANT SOMEWHAT IMPORTANT LESS IMPORTANT
Equity Factors where the median was “more important” were weighted twice as much as the Equity Factors whose median was “important.”
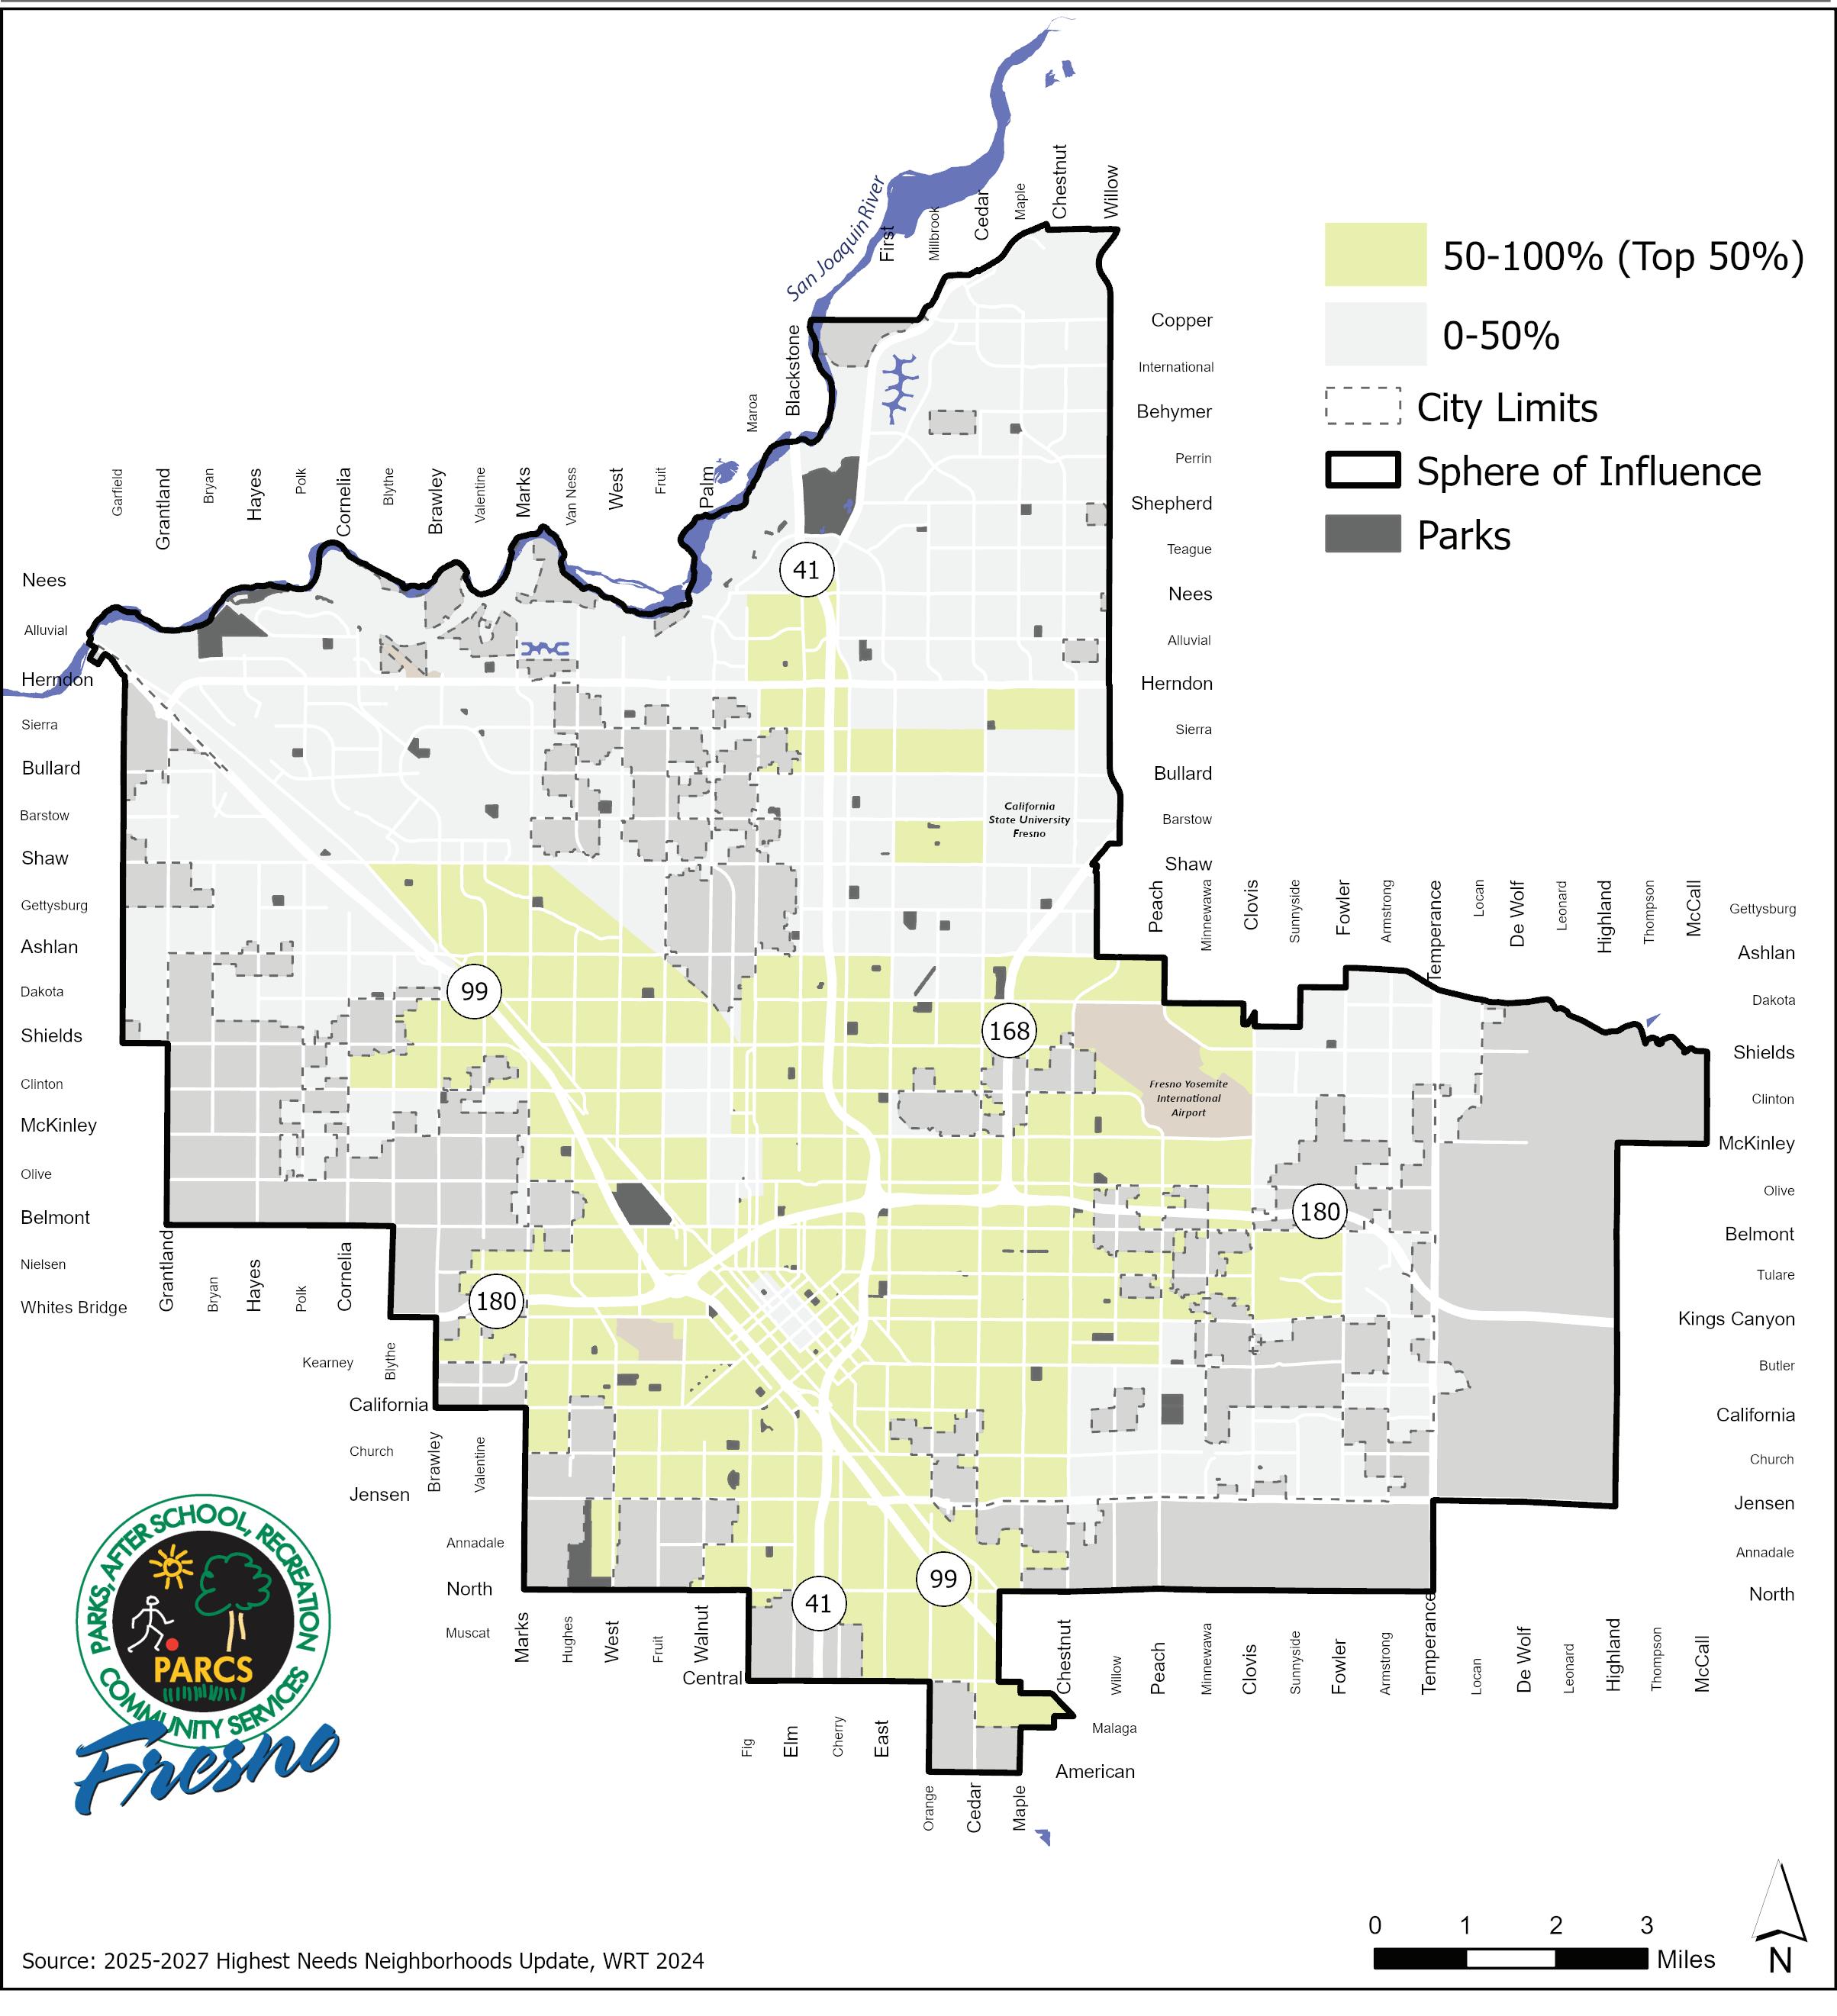
Once the weighting of each Equity Factor was determined, the Consultant Team combined all the Equity Factor maps into one composite map that layers all the factors, giving the “more important” factors more importance on the map.
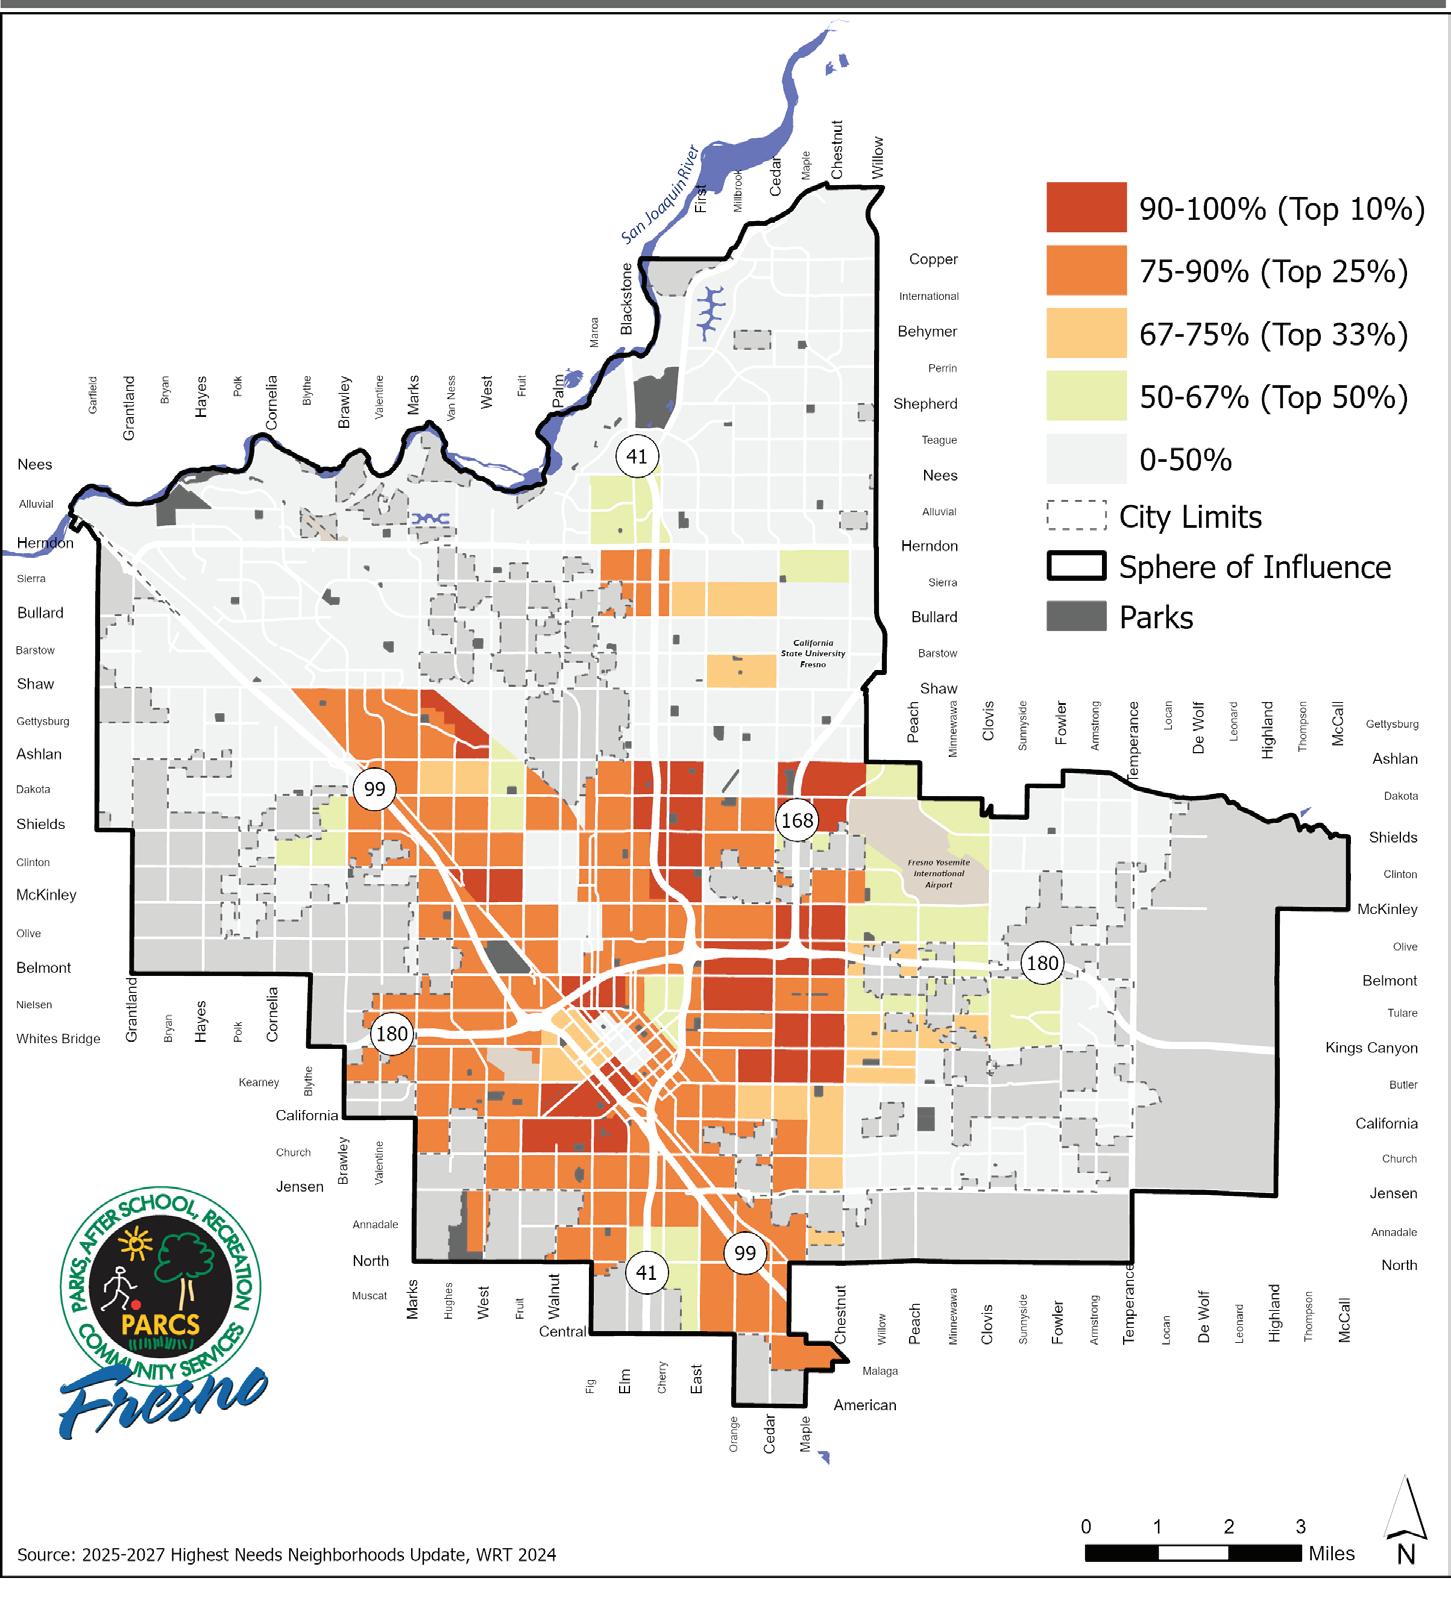
The map illustrates which census tracts in Fresno may qualify as highest-need neighborhoods based on community priorities. Darker orange and red areas on the map indicate census tracts that meet more of the Equity Factor criteria by having higher rates of health burden, and lower rates of park access.
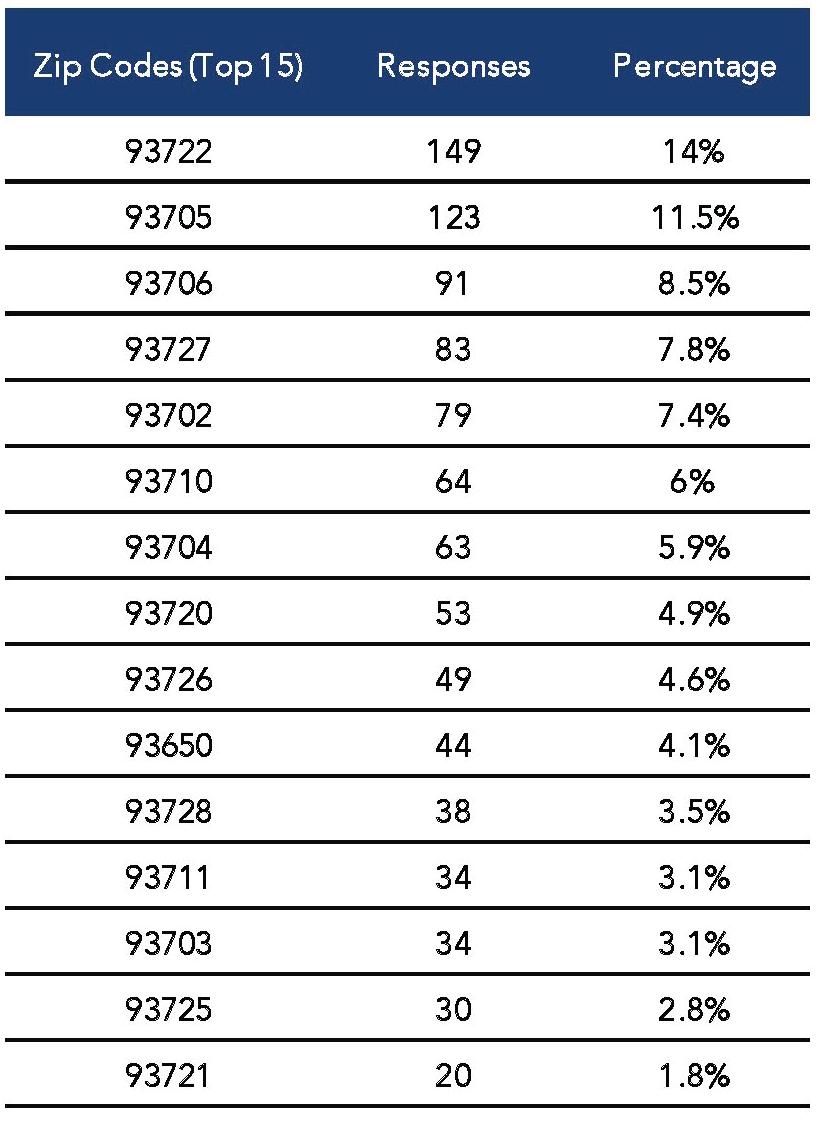
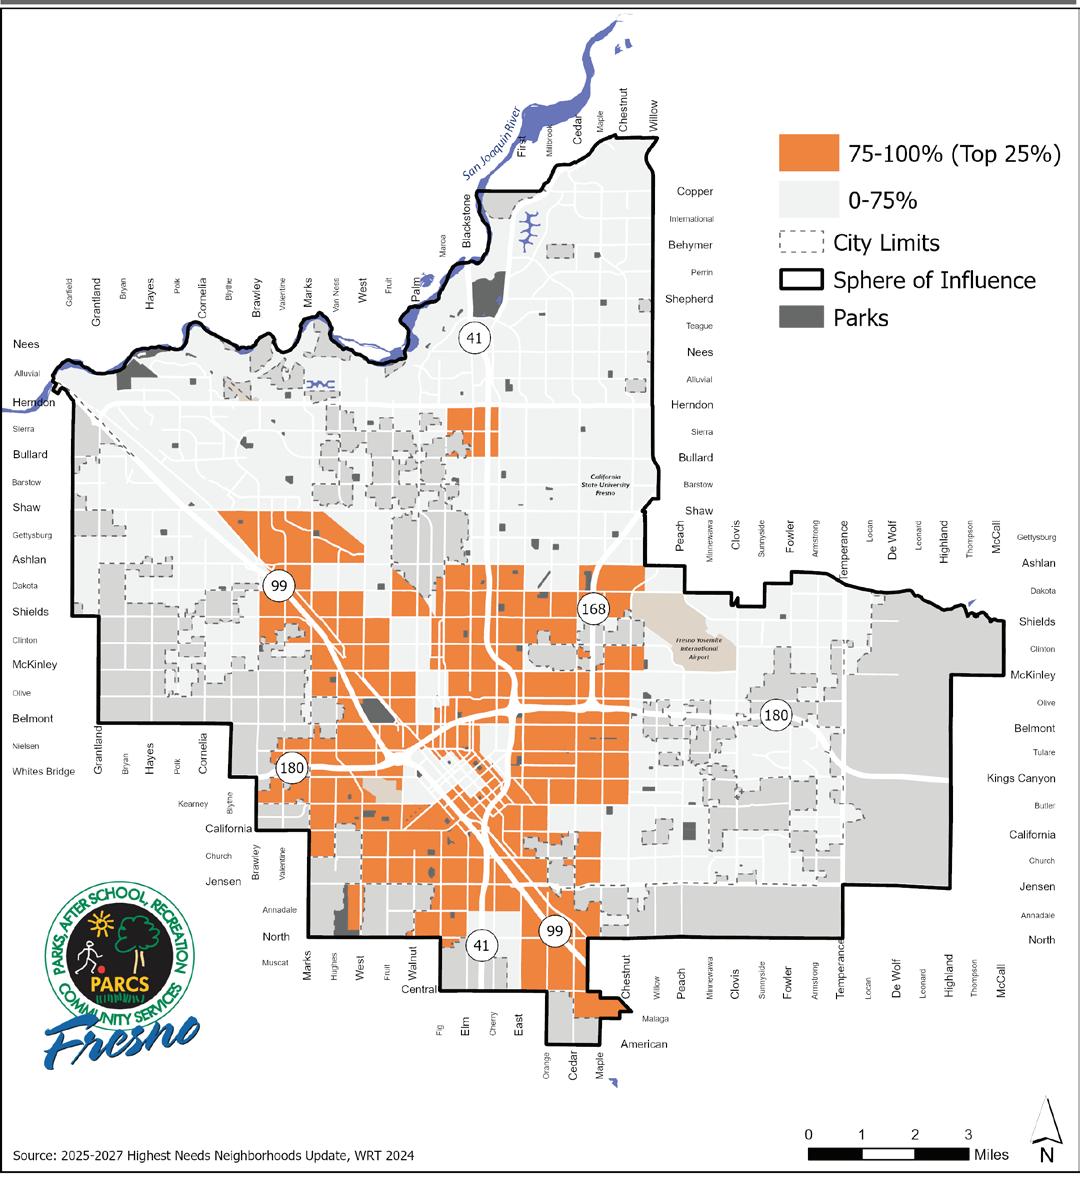
After the weighted index was completed, the Consulting Team developed four threshold maps which illustrated census tracts that would be considered highest-need neighborhoods at 10%, 25%, 33% and 50% thresholds. The next step for the city was to ask the public what percentage of census tracts should be considered highest-need neighborhoods. The city conducted a survey and public comment period where the community was asked to weigh in. The city engaged with community members in person and through electronic/digital channels. Promotional efforts included providing information on the website, training staff and posting interactive public comment displays at all 20 PARCS community centers, and engagement efforts at community events, activities, and programs. Over 120,000 emails were sent, and 5 social media posts and 16 stories were published reaching over 7,000 impressions. In total there were 1,063 responses to the public comment period reflecting citywide participation in selecting the percentage of neighborhoods that should be considered highest-need. The 15 most frequent zip codes from respondents can be seen in the table below:
SURVEY 2 RESPONSE BY ZIP CODE
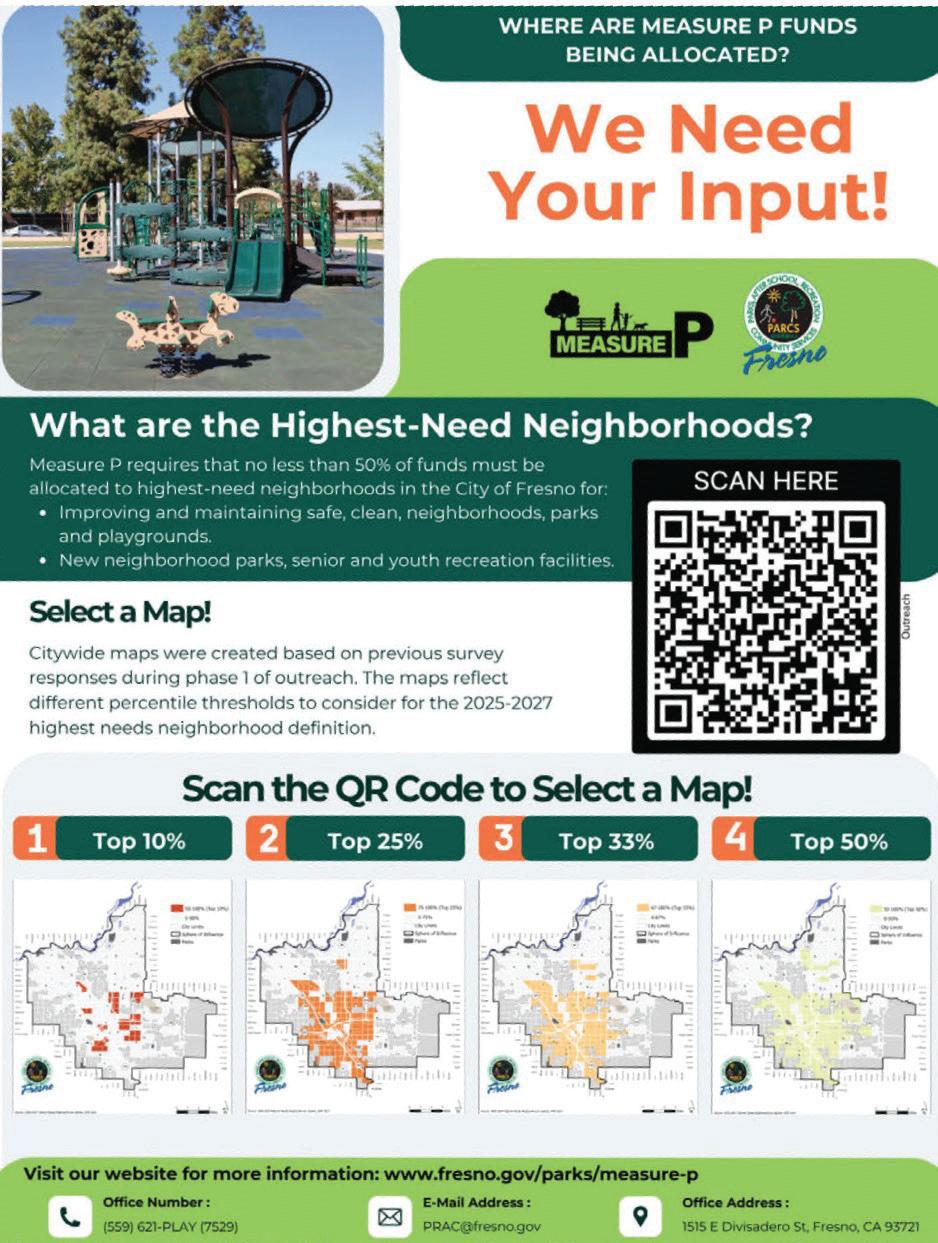
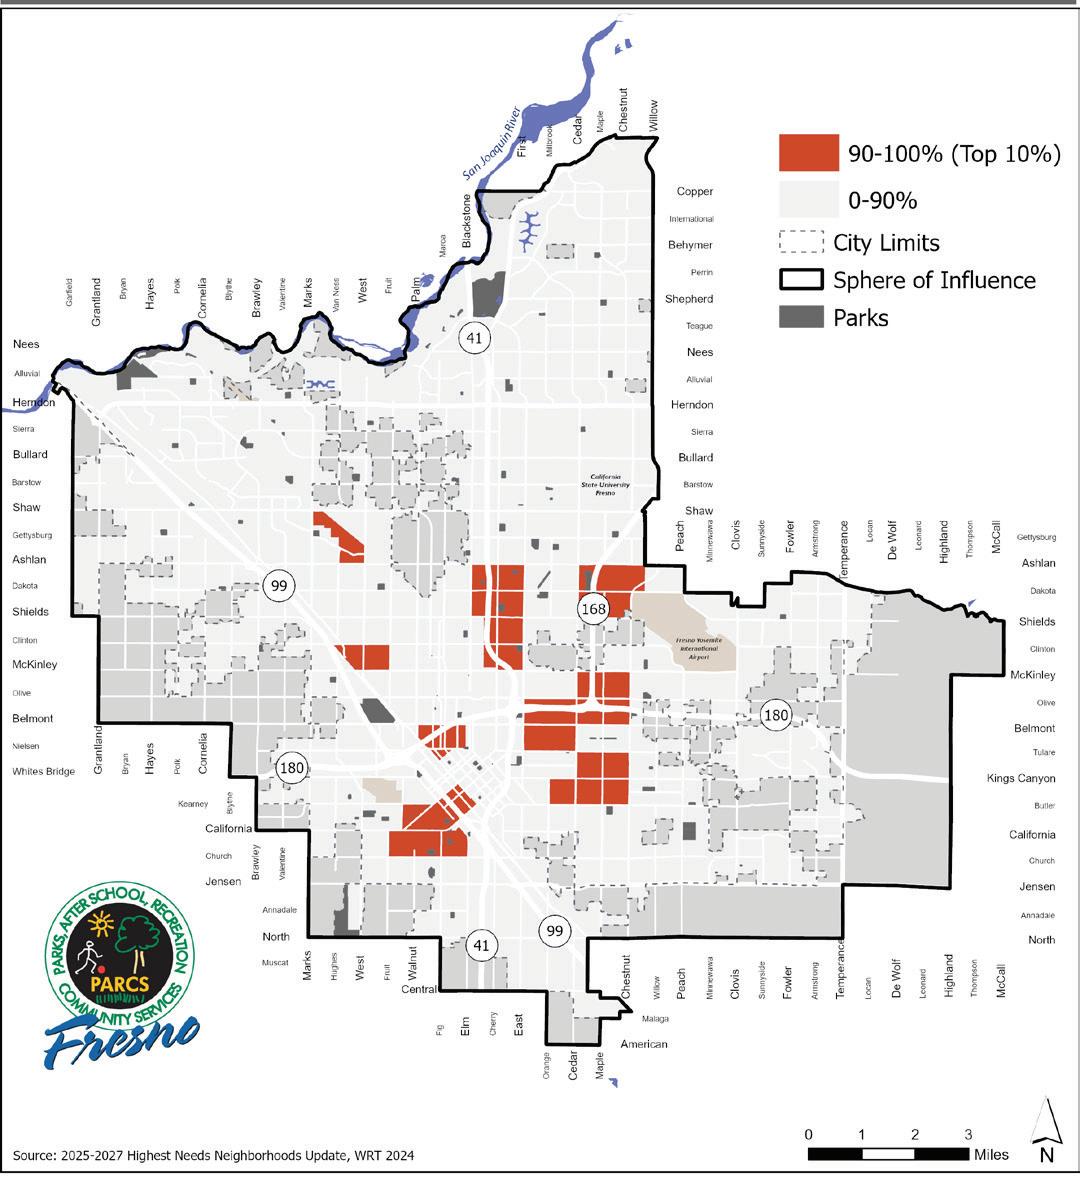
TOP 10%
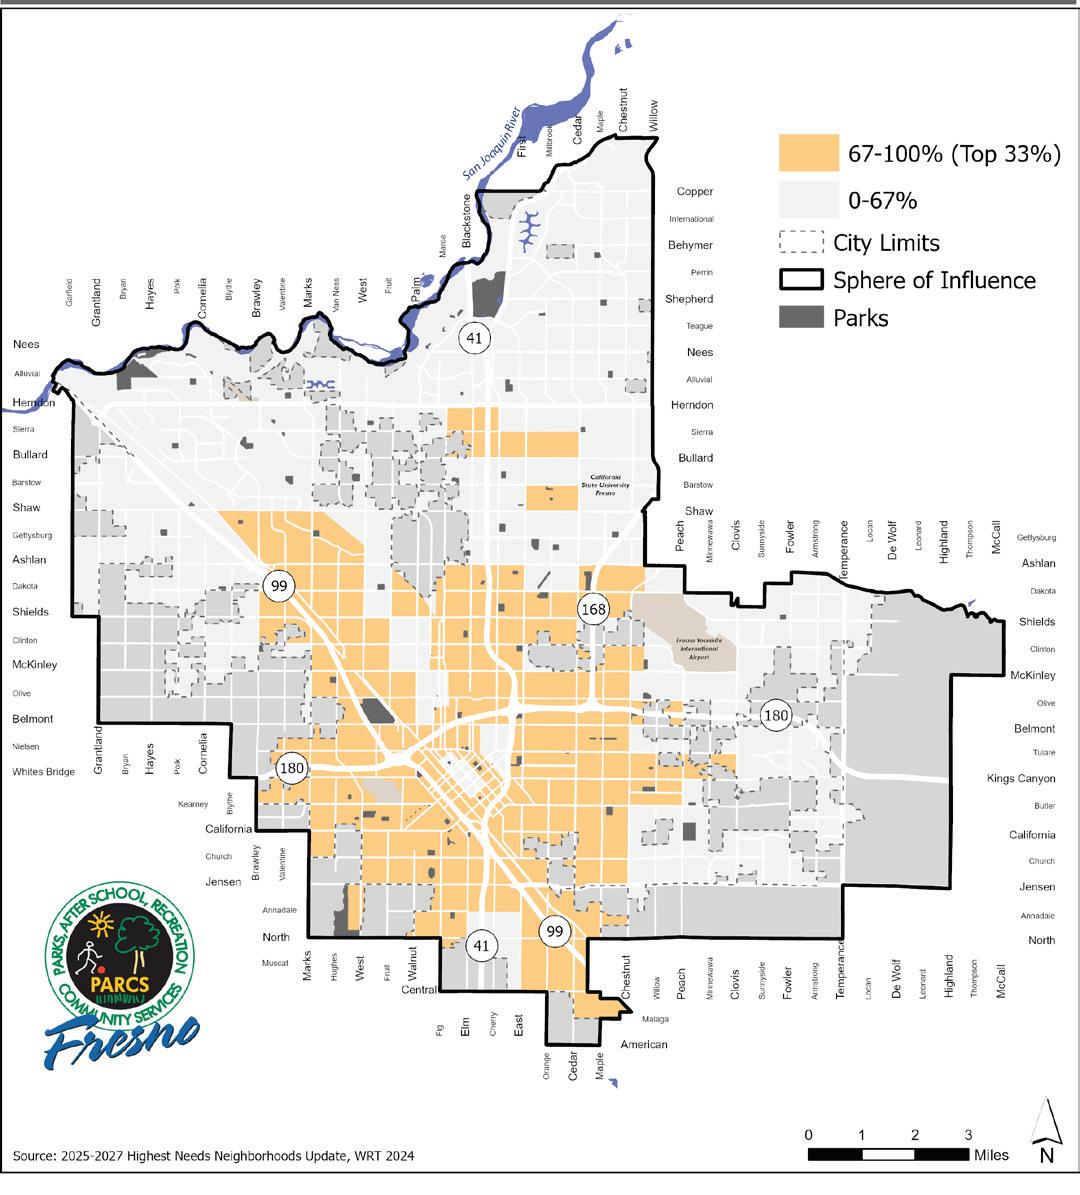
TOP 33%
TOP 25%
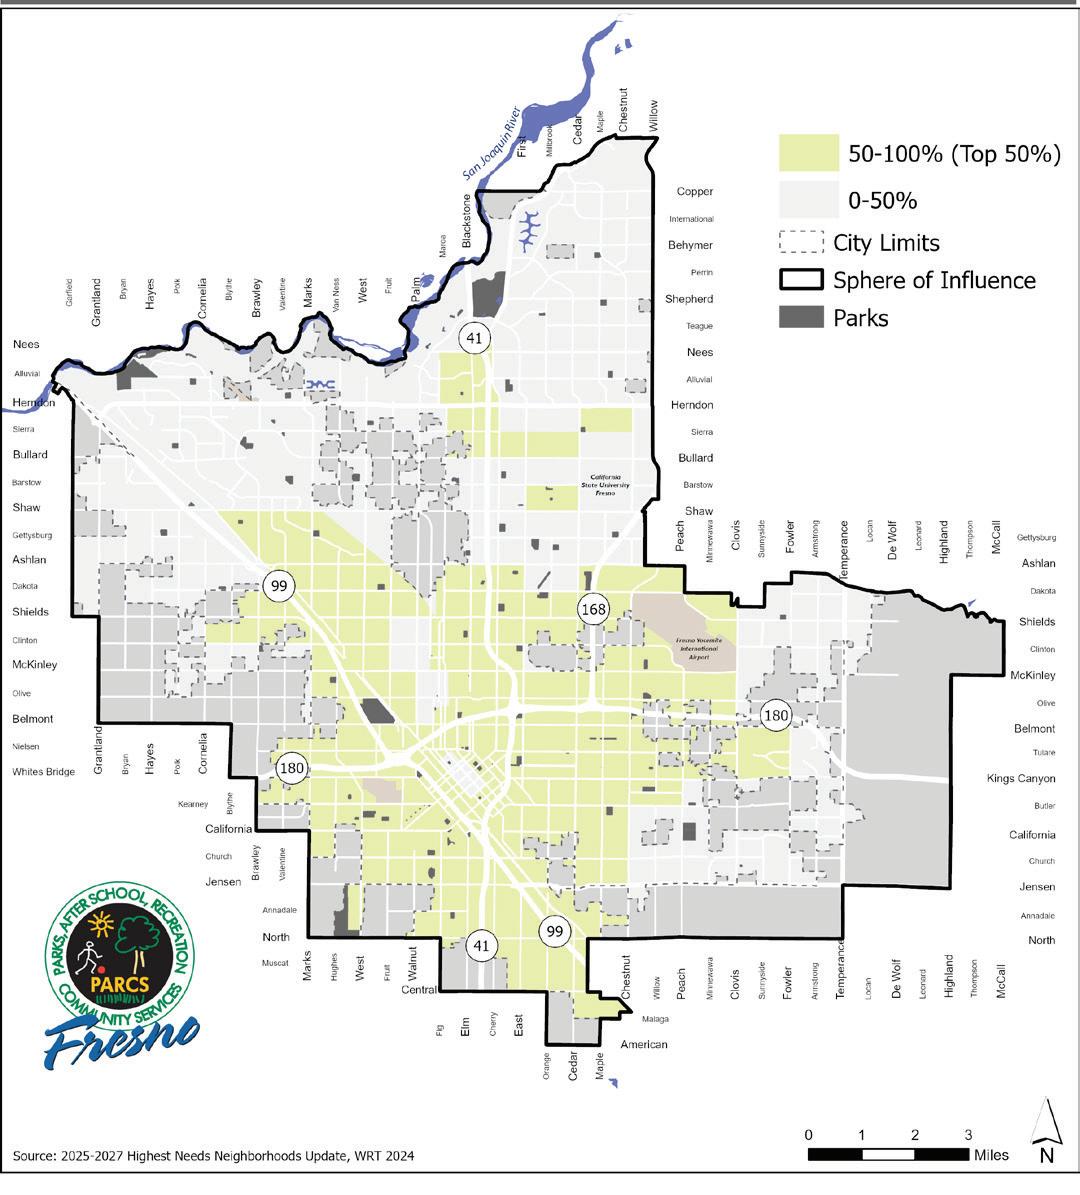
TOP 50%
The results of the public comment period in the chart below, show that the top 50% of census tracts received the highest number of votes from the community.
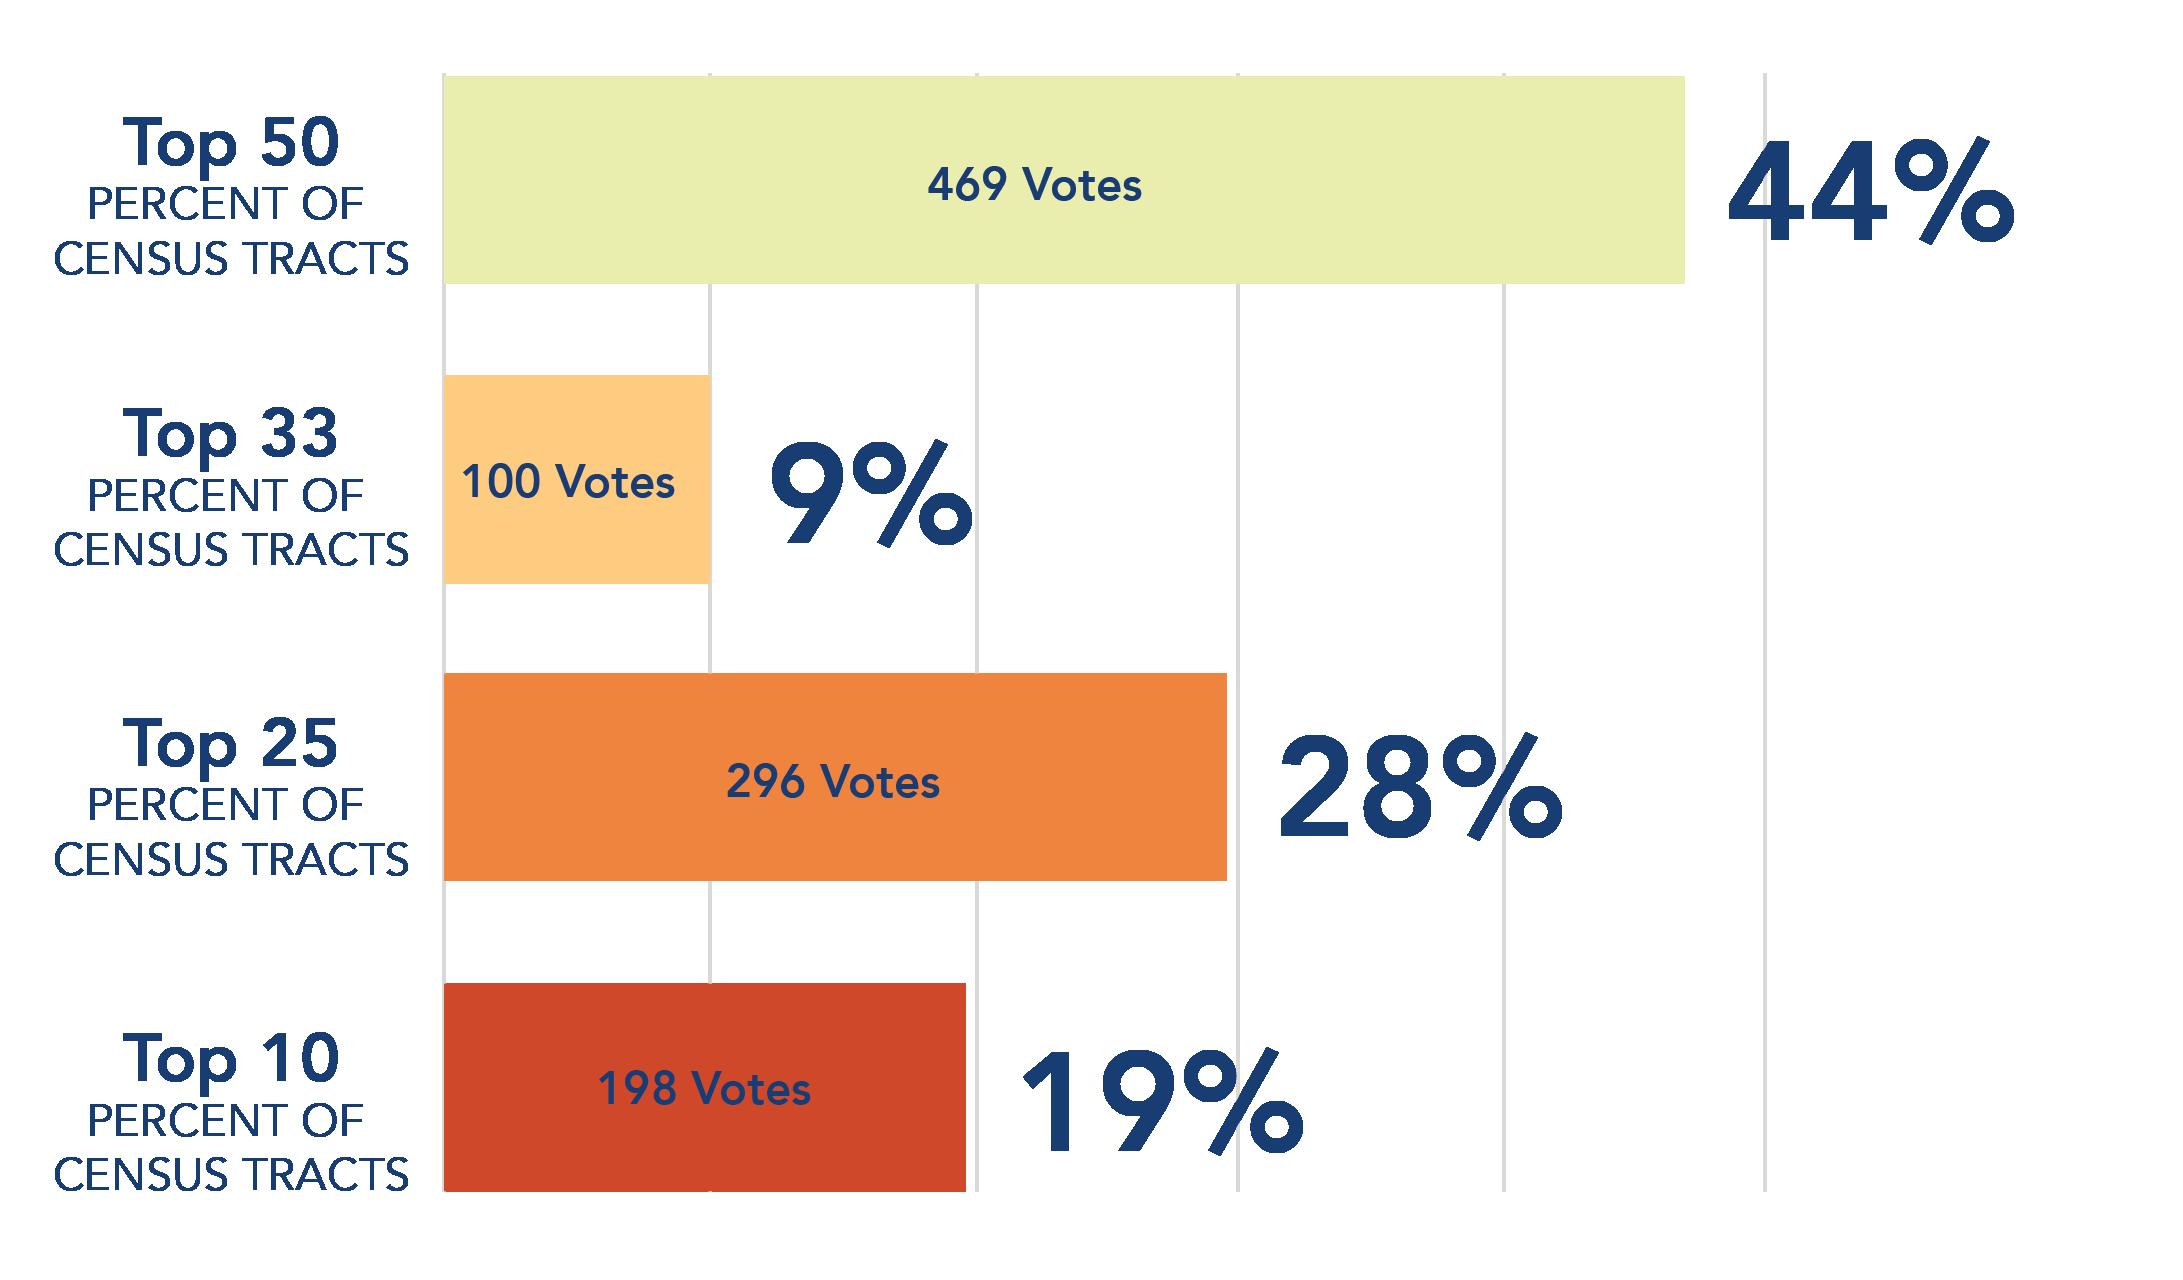
Following these results, the PRAC voted to recommend that the City Council adopt 50% as the definition of highest-need neighborhoods.
The Fresno City Council voted on November 21, 2024 to adopt the Commission’s recommended weighting of Equity Factors and percentile threshold to establish the highest-need neighborhood definition for 2025-2027.
The definition of highest-need neighborhoods adopted by City Council is as follows:
The following factors are weighted more important (2x average):
(A) Existing conditions of parks and facilities based on needs assessment data in the Plan;
(B) The proportion of the population that lives within walking distance (1/2 mile) to a park;
(D) Population density;
(E) Neighborhood youth and senior population;
(F) Neighborhood safety;
(G) Neighborhoods of concentrated poverty;
(J) Years of potential life lost;
(K) Neighborhood composite mortality rate;
The following factors are weighted Important (average):
(C) Park acreage per 1,000 residents;
(H) Pollution burden, as defined by CalEnviroScreen 3.0, or subsequent updates;
(I) Pre-term birth rates;
The top 50 percent of Fresno census tracts, based on this weighting, shall be considered highest-need for the purposes of allocating funds under Measure P.
DEFINING HIGHEST- NEED NEIGHBORHOODS
64 PARKS AND FACILITIES INCLUDED:
Almy*
Basin XX (Hughes & Floradora)*
Bigby Villa*
Broadway Parque
California Tupman*
Carozza (Basin G)
Chandler
Dakota & Barton
Dickey Playground*
Dickey Youth Development Center*
Eaton Plaza*
Einstein
Eleventh & Tulare
El Capitan Dog Park (Basin AH1)
El Dorado
Fink White
Frank H. Ball*
Fulton 665
George R. Marcus Jr. (Basin FF)
Granite
Granny’s
Hinton*
Holmes*
Huntington Blvd. Greenbelt
Kearney*
Lafayette
Len Ross Center
Les Kimber
Lions Park
Manchester (Basin BB)
Maple & Balch*
Maple & University
Martin Ray Reilly
Mary Ella Brown*
Maxie L. Parks*
McKenzie Blvd. Greenbelt
Merced & Modoc
Merced & Pickford
Merced & Plumas
Merced & Stephens
Merced & Trinity
Meux Home Museum
Mosqueda
Nielsen*
Ninth & Tulare*
Paul “Cap” Caprioglio Center
Pilibos
Pinedale
*Included in 2021 - 2024 Highest-Need Neighborhoods
Quigley Radio
Reedy
Regional Sports Complex
Roeding*
Romain*
Rotary East
San Pablo
Sunset*
Ted C. Wills
The Link @ Blackstone*
Trolley
University
Veteran’s Memorial Auditorium
Water Tower
Willow & Balch