


BETHLEHEM, PA
CITY OF BETHLEHEM DEPARTMENT OF COMMUNITY & ECONOMIC DEVELOPMENT

This plan was made possible thanks to the following residents, stakeholders, and City officials.
Joseph Anthes
Craig Atwood
Karen Beck Pooley
Lisa Boscola
Jackie Cook
Mayor Robert J. Donchez
Mike Faccinetto
Neville Gardner
Dr. Bryon Grigsby
Mark Hartney
Darlene Heller
Tracy Hirner
Alan Jennings
Alicia Karner
Wm. Alexander Karras
Sherri Kershner
Allyson Lehr
Colleen Marsh
Jeanne McNeill
Carole Reese
Councilman J. William Reynolds
David Roth
Dr. Joseph Roy
Steve Samuelson
Tracy Samuelson
Anna Smith
Tina Smith
Cindy Lynn Toledo
Arlene Vargas
Cover







The Northside is a compact, walkable neighborhood with vibrant assets and institutional anchors. With a mix of targeted investment, neighborhood leadership development, and supportive services, the Northside will be poised for a bright future as one of Bethlehem’s most attractive and affordable neighborhoods for families and residents of all ages.
The vision for the Northside was built out of an understanding of its inherent strengths, realistic ideas of what can be achieved, and the hopes of residents who call the Northside home.
The Northside 2027 Neighborhood Plan is a vision for the future that encapsulates resident priorities and is feasible for the City and partners to implement.
The plan is organized into topics that address the major themes and issues most important to Northside residents. Each topic includes a small number of overarching goals, each of which are detailed with a set of strategies that will help the City
make progress to achieve that goal. Strategies that were identified by residents as priorities are noted with the icon seen to the right.
All of these goals and strategies work together to achieve a vision of a revitalized and reinvested neighborhood.
PLAN TOPICS
SUPPORT THE HOUSING MARKET
COMMUNITY PRIORITIES will be called out with this icon.
BUILDING
» create a sense of place
» foster economic vitality
» support the housing market
» serve the neighborhood
VISION STATEMENT :
Northside Bethlehem is a walkable, affordable, family-friendly neighborhood where community members are united to foster a culture of support and where families put down roots, grow, and thrive.
» broadcast the neighborhood’s strengths to families
» create a sense of neighborliness
» enhance safety and beauty
» build on existing assets
» have residents deeply involved in plan formation
» build leadership capacity among residents
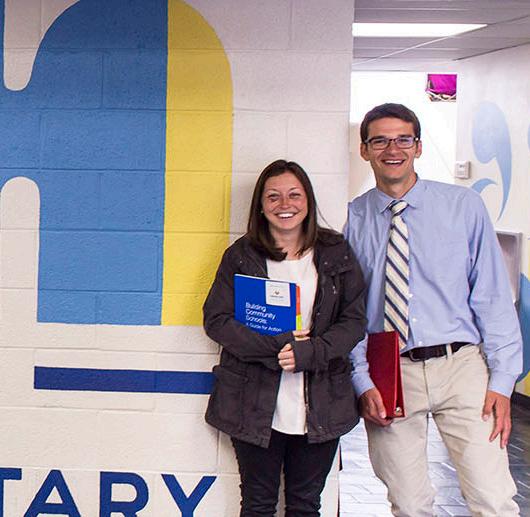
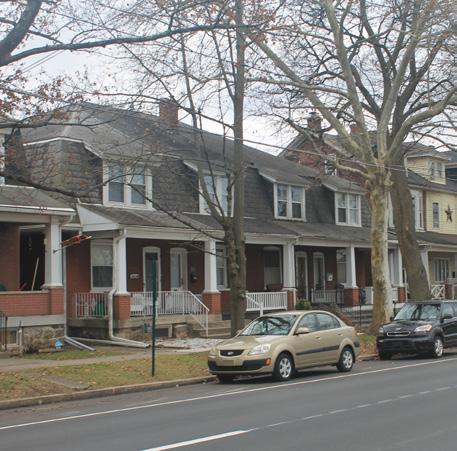
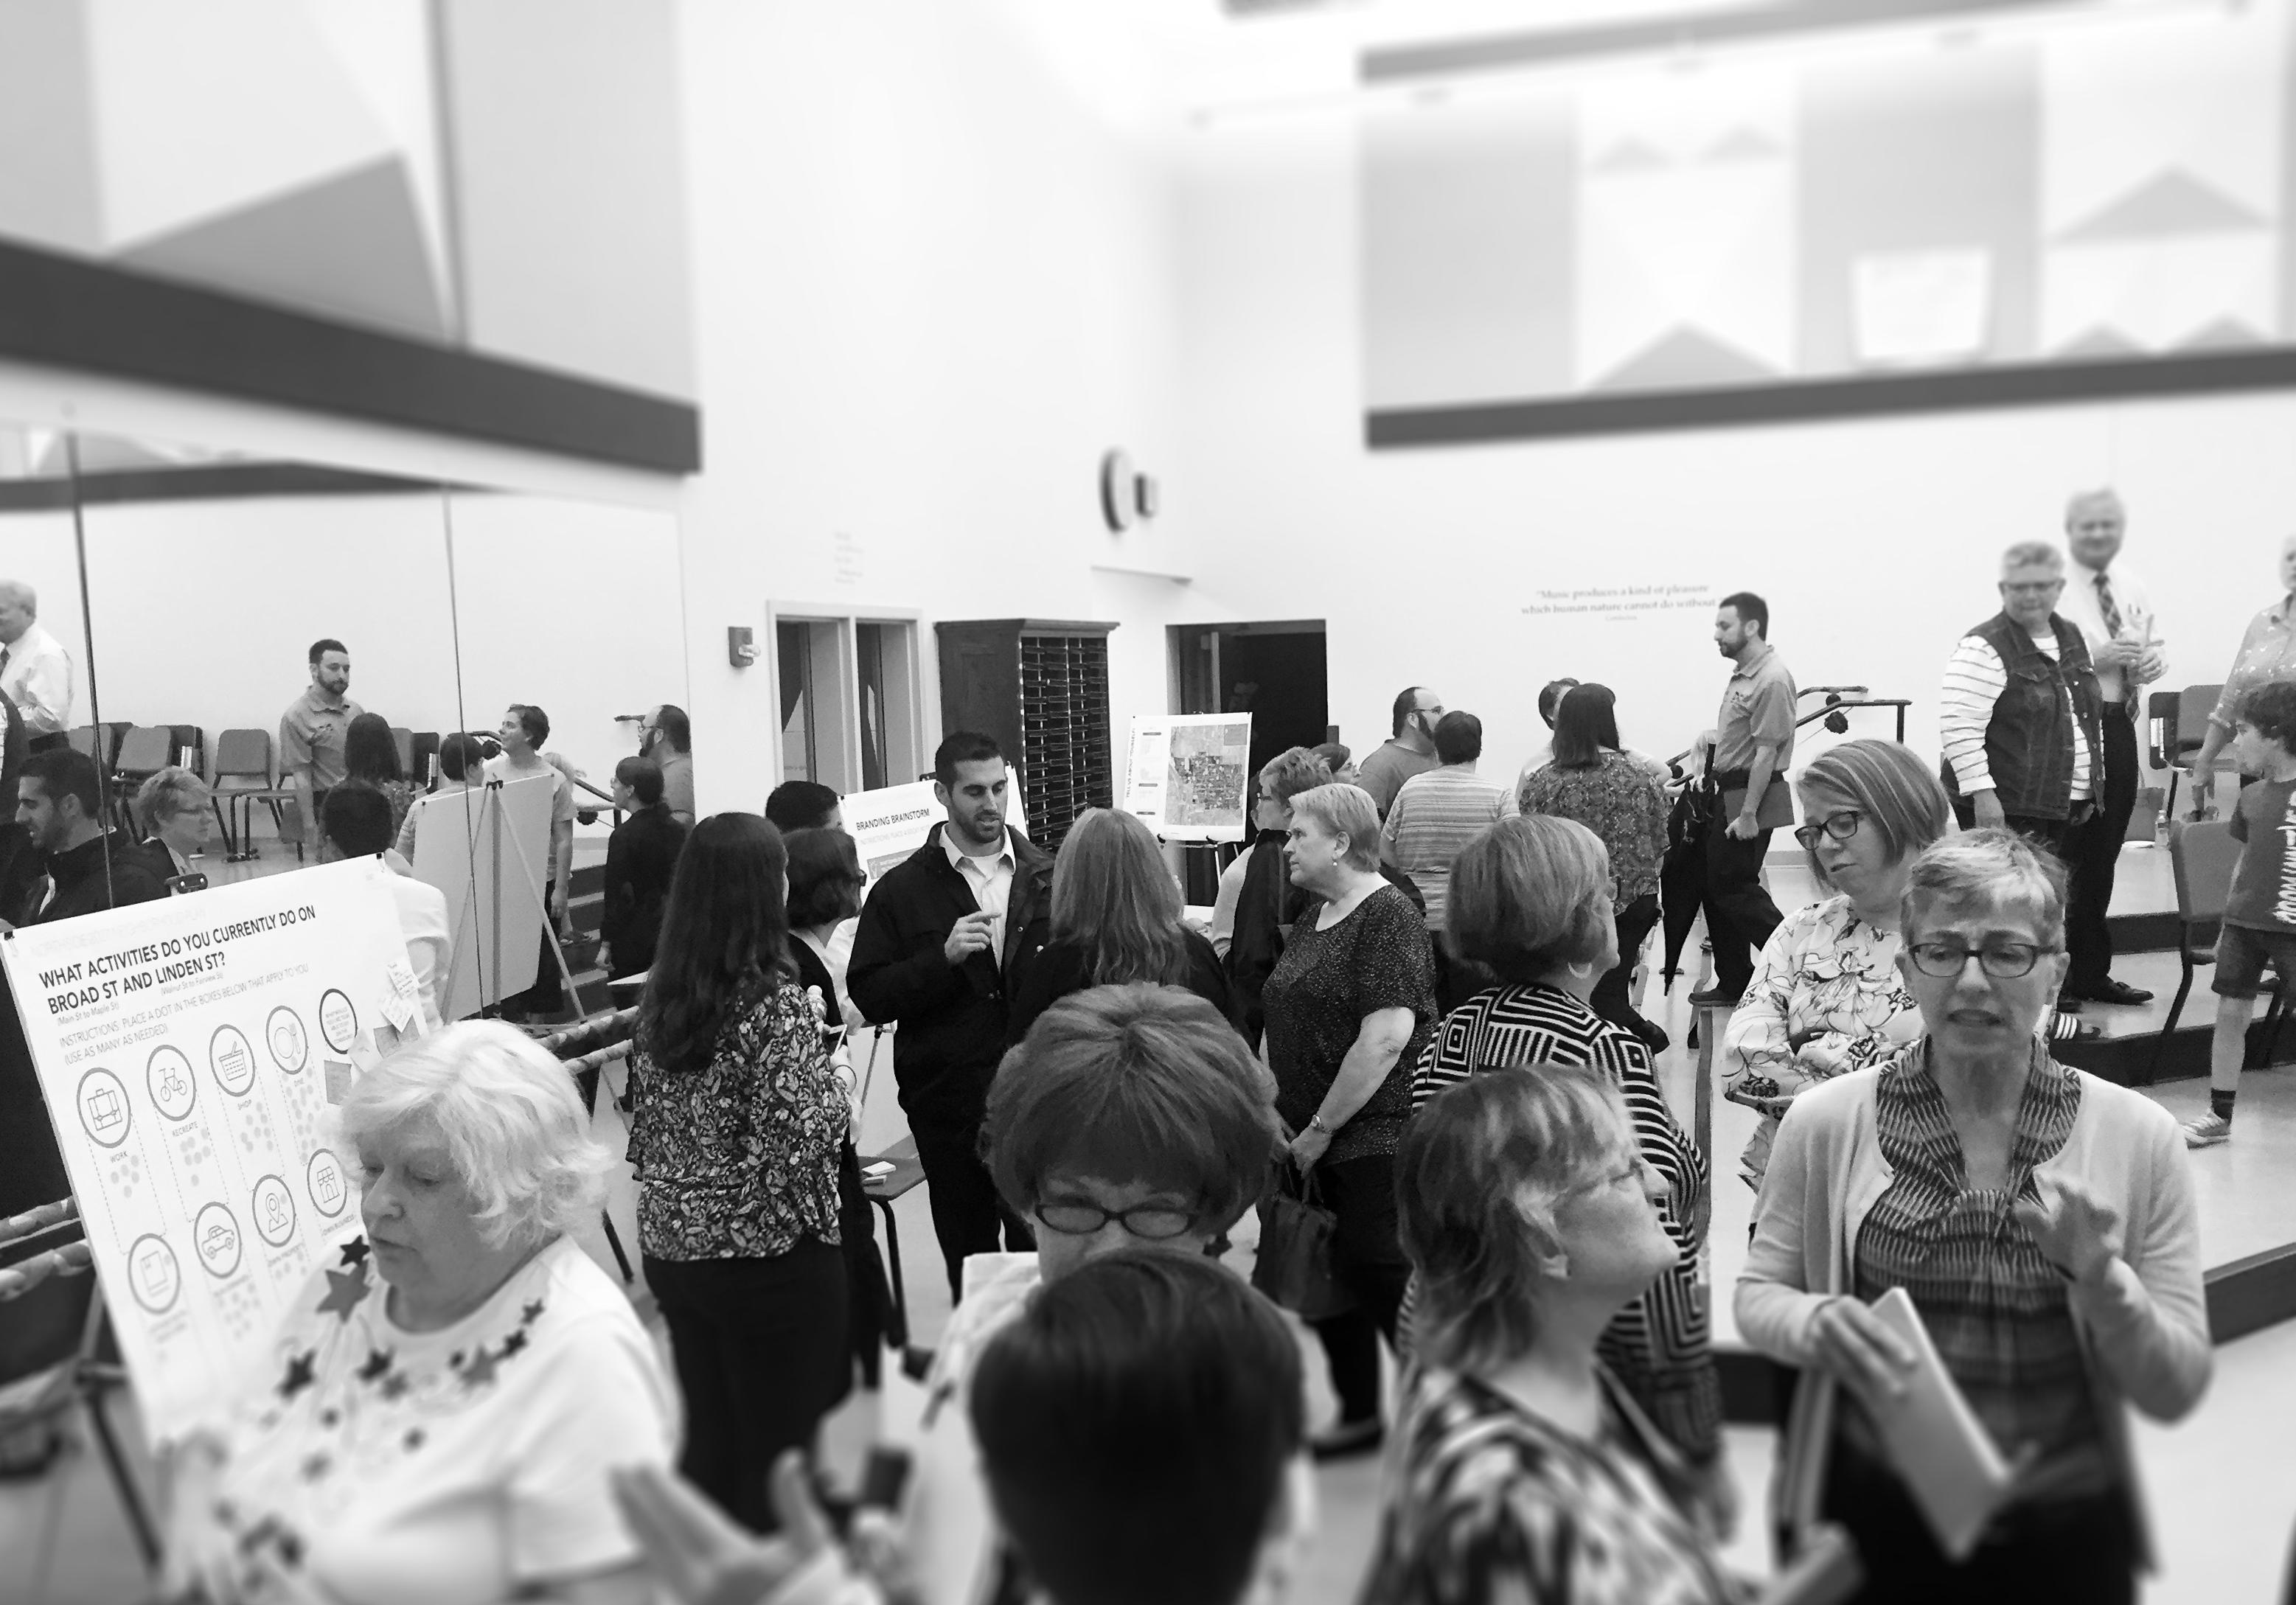
The process for the Northside 2027 Neighborhood Plan started with a kick-off meeting with the Steering Committee to hear their vision for the neighborhood and learn about ongoing or upcoming initiatives, investments, and programs that could be built upon and leveraged with this plan.
The first phase of planning included extensive data gathering and analysis, from sources such as mapping data, census data, and Reinvestment Fund’s recently completed Market Value Analysis (MVA) and blight study. This plan was an opportunity for the City of Bethlehem to harness the insights of those studies in a neighborhood planning context. For more information on the MVA, see page 14. The first and second community meetings were held during the Analysis phase, in order to ensure residents had extensive opportunities to be heard and to shape the direction of the plan.
After the second community meeting, at which a small number of Working Groups met and held in-depth discussions about priority topics, a draft plan began to take shape. The draft plan’s vision, goals, and initial strategies were driven by resident input captured at meetings as well as through a neighborhood needs survey conducted by the City over the course of several months. Nationwide best
practices were also incorporated in order to ensure a well-rounded and feasible plan framework given the neighborhood’s existing conditions, challenges, and opportunities.
The third community meeting was an opportunity for residents to review the draft plan and give input on what strategies they felt should be prioritized. This information is embedded in the final plan and implementation framework.
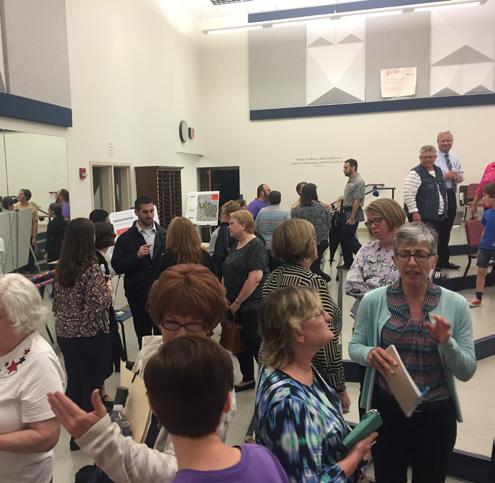
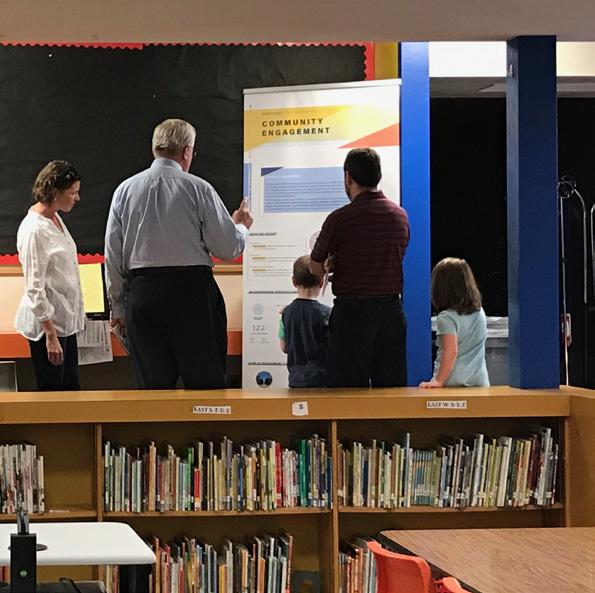
A fourth community open house was held to unveil the final plan and celebrate all the work that residents and stakeholders put into the process.
With so many dedicated stakeholders and partners already involved in the neighborhood, the City is poised to be able to begin implementing this plan quickly. The Steering Committee will be critical to overseeing the plan’s implementation, with meaningful input and oversight by local residents.
This plan will serve as a tool to guide policy and funding priorities in the Northside neighborhood.
WILLIAM PENN ELEMENTARY
ENHANCE
MONOCACY
MONOCACY
Trail Access
LEGEND
Key opportunity nodes
Key opportunity nodes
Housing adjacency areas
Housing adjacency areas
Retail/Restaurants
Retail/Restaurants
Professional Services
Professional Services
Neighborhood Serving Commercial
Neighborhood Serving Commercial
Priority safe intersections
Priority safe intersections
Priority safe streets
Monocacy Way Trail
Monocacy Way Trail
Plan Boundary
Priority safe streets Plan Boundary LEGEND
Parks and Open Space
Parks and Open Space
Waterways
Waterways





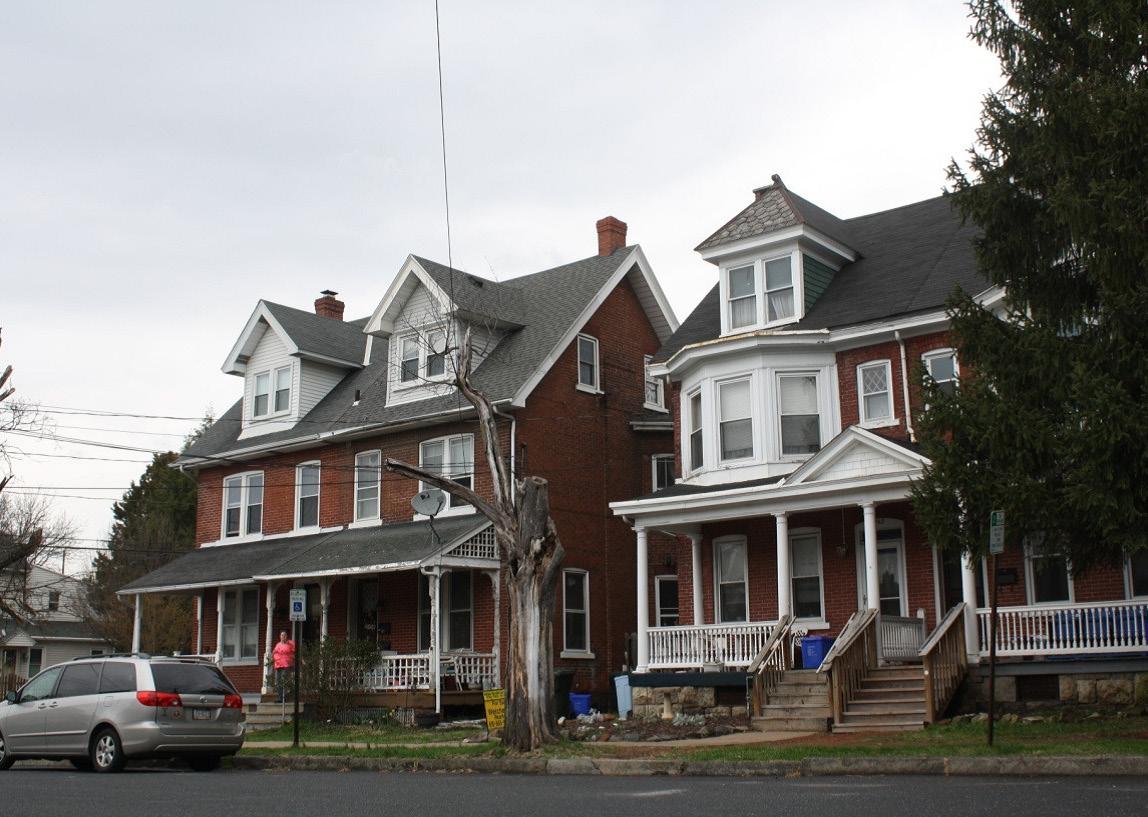
The Northside neighborhood of Bethlehem is a community of just over 5,500 residents (2012-2016 ACS estimate) located directly north of the city’s historic downtown district. A mere .4 square miles in area, it is a characteristically urban neighborhood in that it is conveniently located and walkable with short, dense blocks. It is physically separated from neighborhoods to its west by Monocacy Creek, which runs southward towards the Lehigh River, and the four-lane roadway that runs adjacent and parallel to the creek. Adding to the sense of physical separation is a dramatic grade change caused by the creek and a lack of continuous street grid where the neighborhood meets the creek. The Northside is home to a number of assets including two elementary community schools, Liberty High School, Friendship Park, and nearby Moravian College.
The Northside has historically been a stable residential community, but it has shown signs of potential weakening and decline in recent years. Taking precedence from the successful revitalization of the SouthSide neighborhood on the other side of the Lehigh River, the City of Bethlehem chose to embark on a community-driven planning process to identify
necessary actions and investments to bring positive momentum to the Northside. The plan coincided with the designation of the Northside neighborhood as a Local Economic Revitalization Tax Assistance (LERTA) property tax abatement district. Under the Pennsylvania State LERTA program, property owners continue paying their assessed property taxes but are given tax breaks on improvements that increase the property’s assessed value. The taxes on the improvements are phased in at 10 percent a year over 10 years, when the full tax bill is reached. While LERTA is typically utilized in commercial and industrial zones, the use of this tool in the Northside neighborhood is meant to assess its value to improve primarily residential areas.
The Northside is considered a “middle neighborhood,” which are relatively stable neighborhoods without extreme poverty or wealth and are reasonably affordable and relatively safe. Because these neighborhoods are not often facing significant challenges of rapid development pressures or decline, they are often not the priority or focus for public investment dollars. Additionally, most residents’ incomes are above typical thresholds for assistance and therefore don’t qualify for programs that are geared towards lower income residents. There is a recognized need for more resources for residents to improve their homes and blocks, as well as a need for City-led investments in the public realm.

They are relatively stable, affordable, safe neighborhoods without extreme poverty or wealth. Additionally, most residents’ incomes are above typical thresholds for assistance and therefore don’t qualify for programs that are geared towards lower income residents. There is a growing recognition nationwide of the importance of supporting and nurturing these neighborhoods and making sure they don’t fall into disrepair.
JEFFERSON ELEMENTARY LEIGH
THOMAS
MVA Market Types
Educational Assets
A
Parks/Recreation
Educational Assets
B
MVA Market Types
Places of Worship
Parks/Recreation
Historical Sites
Places of Worship
Plan Boundary
Historical Sites
Plan Boundary
C D E F G
Commercial Corridors
Historic District
LANTA Bus Routes
Non-residential land use
College or university land use
Non-residential land use
Historic District
Parks and Open Space Commercial Corridors
College or university land use
Parks and Open Space
Plan Boundary/LERTA District
LANTA Bus Routes Academic Institutions
Plan Boundary/LERTA District
Academic Institutions
Waterways
Parks and Open Space
Parks and Open Space
Waterways
Waterways
Waterways
Figure 2. The Northside neighborhood is full of strong and easily accessible assets, including K-12 public schools, Moravian College, and a number of open space and recreational assets. It is also directly adjacent to the city’s historic downtown.
In 2017 the City of Bethlehem partnered with the Reinvestment Fund (RF) to conduct a Market Value Analysis (MVA) and Blight Betterment Initiative to analyze the city’s housing market. RF’s Market Value Analysis process is a tool to assist residents and policymakers identify and understand the elements of their local real estate markets. It is an objective, data-driven tool built on local administrative data and validated with local experts. RF has conducted MVAs in cities across the country, with the goal of enabling public officials and private actors to more precisely target intervention strategies in weak markets and support sustainable growth in stronger markets.
The MVA process entails acquiring local administrative data, manually inspecting and validating data layers through in-person visits, using statistical cluster analysis to identify areas with common attributes and validating those findings with local experts to ensure accuracy. Market types are defined down to the Census block group level.
RF identified seven unique market types in the City of Bethlehem, labeled A through G (see table on page 16).
As a city, the MVA found that Bethlehem is characterized by established neighborhoods with generally well-maintained, single-family housing stock that largely dates to the first half of the 20th century. The city is notably affordable compared to other east coast housing markets. At the same time, weaker markets did not suffer from the sort of pervasive vacancy, depressed sale prices, and severely dilapidated properties that exist in many other cities. However, an increase in investor-owners and cash purchases in these weaker markets is in keeping with broader regional and national trends and may present ongoing challenges.
In the Northside neighborhood alone, five of the seven market types can be found. This means there is ample opportunity to harness the MVA’s insights and leverage the strengths of certain areas of the neighborhood to improve and stabilize nearby weaker or transitional areas. There are many signs of strength in the Northside’s housing markets, but residents are focused on concerns around physical conditions and crowding, often as they relate to poor management and maintenance by absentee owners.
A Market Value Analysis is a tool to analyze the citywide housing market that utilizes layers of data to create sub-markets with similar conditions.
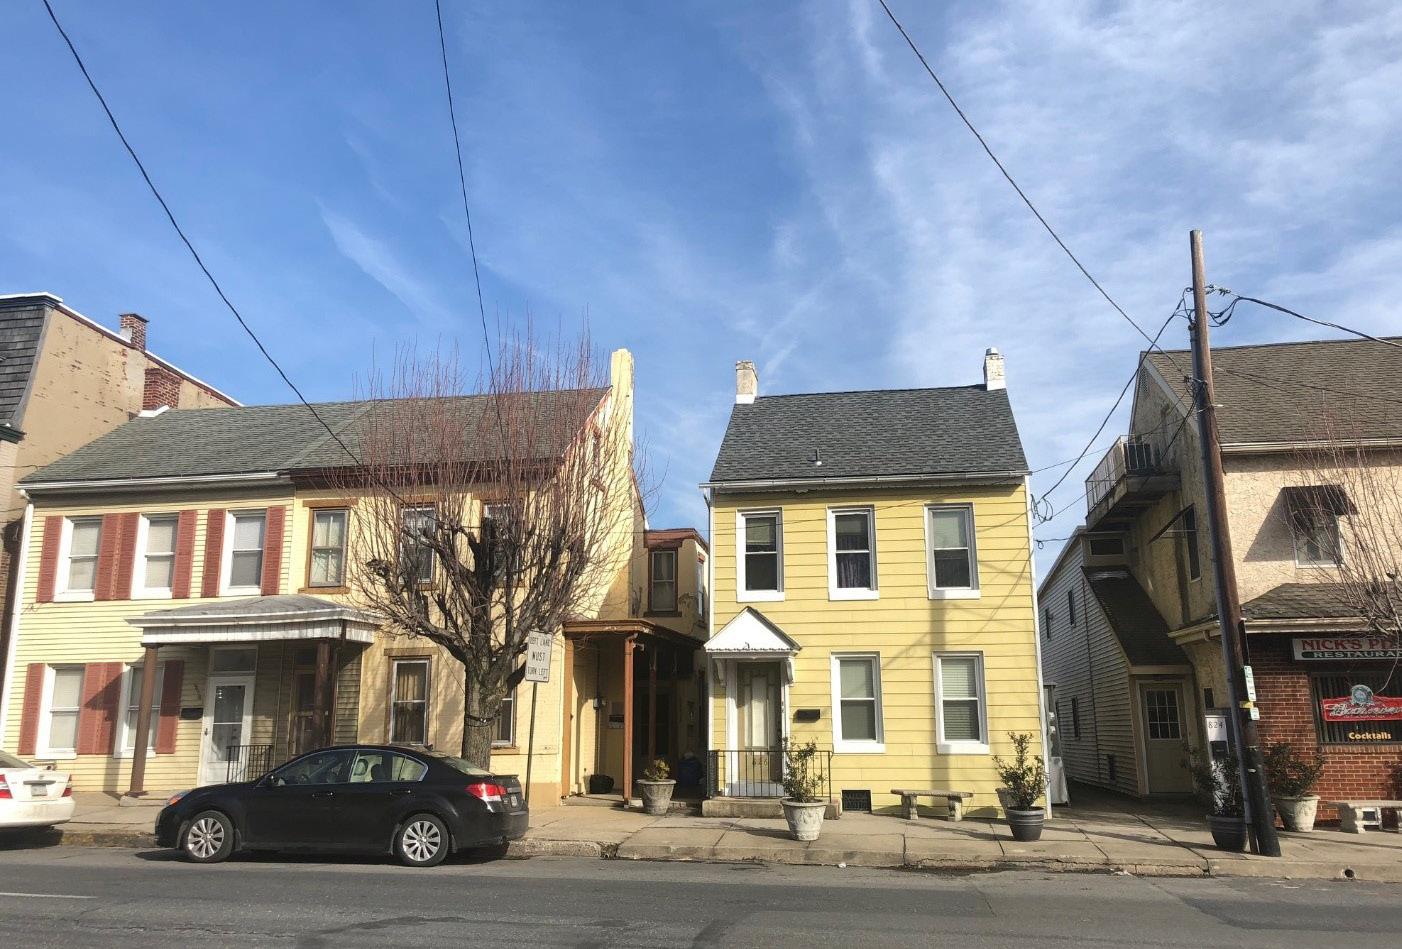


The housing strategies contained in the Northside 2027 Neighborhood Plan were created with the input and expertise of RF and build directly off of the in-depth analysis of the MVA and Blight Betterment Initiative processes. The result is a data-driven, community-approved roadmap for strategic action and investment in order to strengthen the neighborhood as an affordable and attractive place to call home.
A
» Highest sales price
» Low owner occupancy
» High sales price
B
» High owner occupancy
» Lowest housing density
C
D
» Sales price slightly higher than citywide median
» Low owner occupancy
» Sales price aligns with citywide median
» Moderate owner occupancy
» Low housing density
E
F
G
» Sales price slightly lower than median
» Moderate owner occupancy
» Low sales price, lowest owner occupancy
» Highest housing density
» Concentration of subsidized rentals
» Lowest sales price
» Low owner occupancy
» Highest variance in sales price
» Elevated levels of investment activities
» Low levels of distress
» Low levels of investment activities
» Low levels of distress
» Concentration of new construction
» Low levels of distress
» Lower levels of investment activities
» High levels of violations
» High levels of investment purchases
» High levels of financial distress
» Highest levels of investment purchases
» High levels of financial distress
» High level of investment purchases
» High levels of financial distress and violations
Educational Assets
MVA Market Types
A
Parks/Recreation
Places of Worship
Historical Sites
Commercial Corridors
LANTA Bus Routes
Non-residential land use
Historic District Plan Boundary
College or university land use
Parks and Open Space
Plan Boundary/LERTA District
Academic Institutions
Parks and Open Space
Waterways
Waterways
Figure 4. The Market Value Analysis shows 5 of 7 market types identified for the City of Bethlehem within the Northside neighborhood.


The City of Bethlehem has a long and rich history, playing particularly crucial roles in the Colonial era and the Industrial Revolution. The Northside neighborhood was developed in the early 1900s a primarily residential neighborhood with designated commercial corridors. The neighborhood has long been a stable, solidly working and middle-class community. Its relative affordability has recently attracted new immigrant communities to settle in the area.
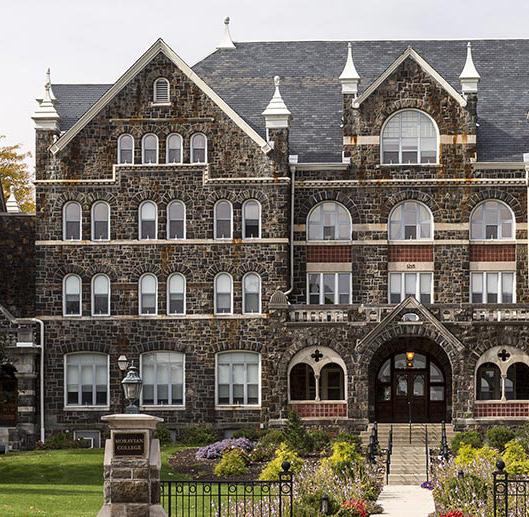
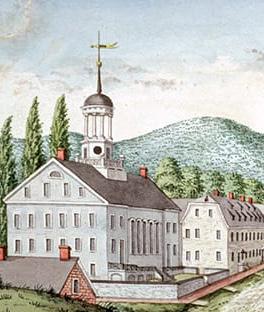
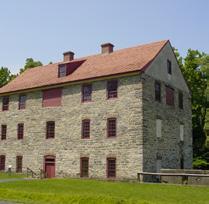
The neighborhood is directly adjacent to the Historic Moravian Bethlehem National Historic landmark District. In the mid-1700s, Moravian settlers established an industrial area utilizing mill technology made possible by the flowing Monocacy Creek and Lehigh River. Many of these structures are still preserved today. Also established around the same time was the Central Moravian Church, founded alongside Monocacy Creek in 1742. The Moravian missionary settlers also established men’s and women’s seminaries, the northern campus of which is now the Moravian College Campus along the northern boundary of the Northside neighborhood.
The neighborhood got one of its original public spaces with the founding of “Tank Park” in 1872, which was so named due to its role as the site of
20th Century with the establishment of Bethlehem Steel in 1899 along the southern bank of the Lehigh River. It quickly became one of the country’s dominant industrial companies and a national symbol of technological prowess. A century later, with global shifts in industrial activity and the decline of the steel industry in the U.S., Bethlehem Steel declared bankruptcy in 2001 and was dissolved in 2003. These events had major impacts on the Northside neighborhood, which provided convenient and affordable housing close to the plant. Further, in order to facilitate intense traffic flows to and from the steel plant during shift changes, Linden and Center
a water tower until the 1960s. It was subsequently renamed Friendship Park and will be undergoing renovations in 2019.
The industrial character of Bethlehem carried forward into the Industrial Revolution at the turn of the
Streets were changed from two-way to one-way traffic—flowing south and north respectively—and they remain this way today, despite no longer needing to accommodate such unique traffic patterns.
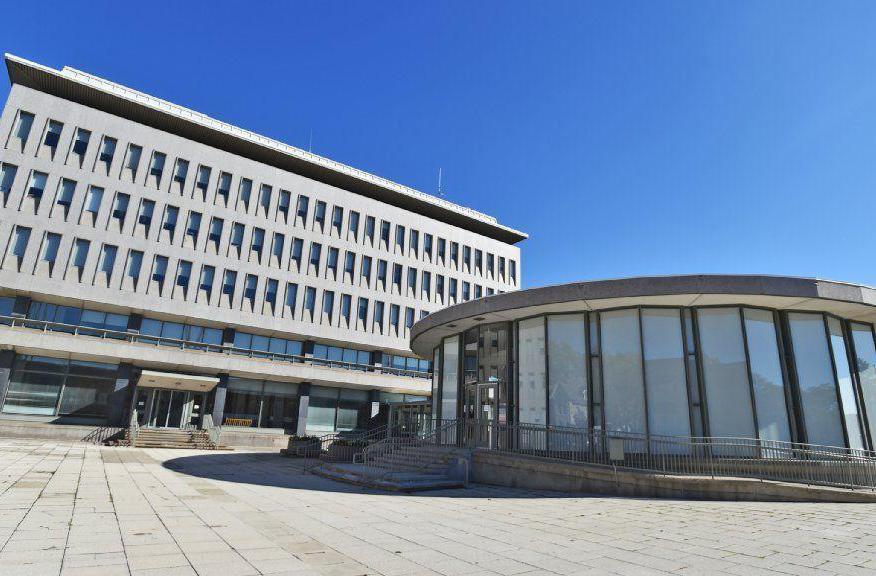
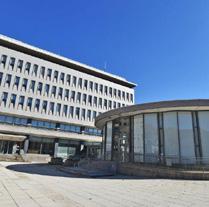
City Hall and Bethlehem Area Public Library, joined by Payrow Plaza, were built just south of the neighborhood in 1967. The plaza complex boasts views across the river to southern Bethlehem and is considered the civic heart of the city.


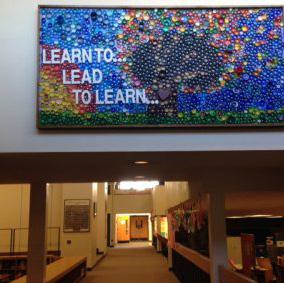
A number of local neighborhood schools were founded during the 20th Century. Liberty High


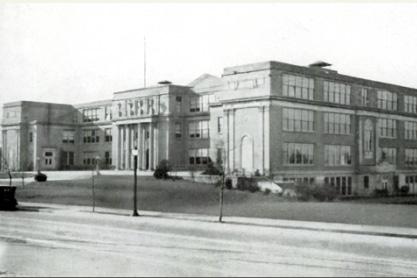

vative “open plan” school buildings and still serve as neighborhood schools that students walk to from surrounding areas.
Today, the Northside neighborhood remains an urban, convenient, and walkable place, but it is struggling with a lack of investment and a lack of a discernible neighborhood identity. The recent lack of investment and attention has led to concerns about declining housing stock and overall neighborhood quality.


School, along the neighborhood’s northern edge, was opened in 1922 and was the City’s sole high school until 1967 when Freedom High School was established in northeast Bethlehem Township. William Penn Elementary and Thomas Jefferson Elementary were established in the 1970s as inno-


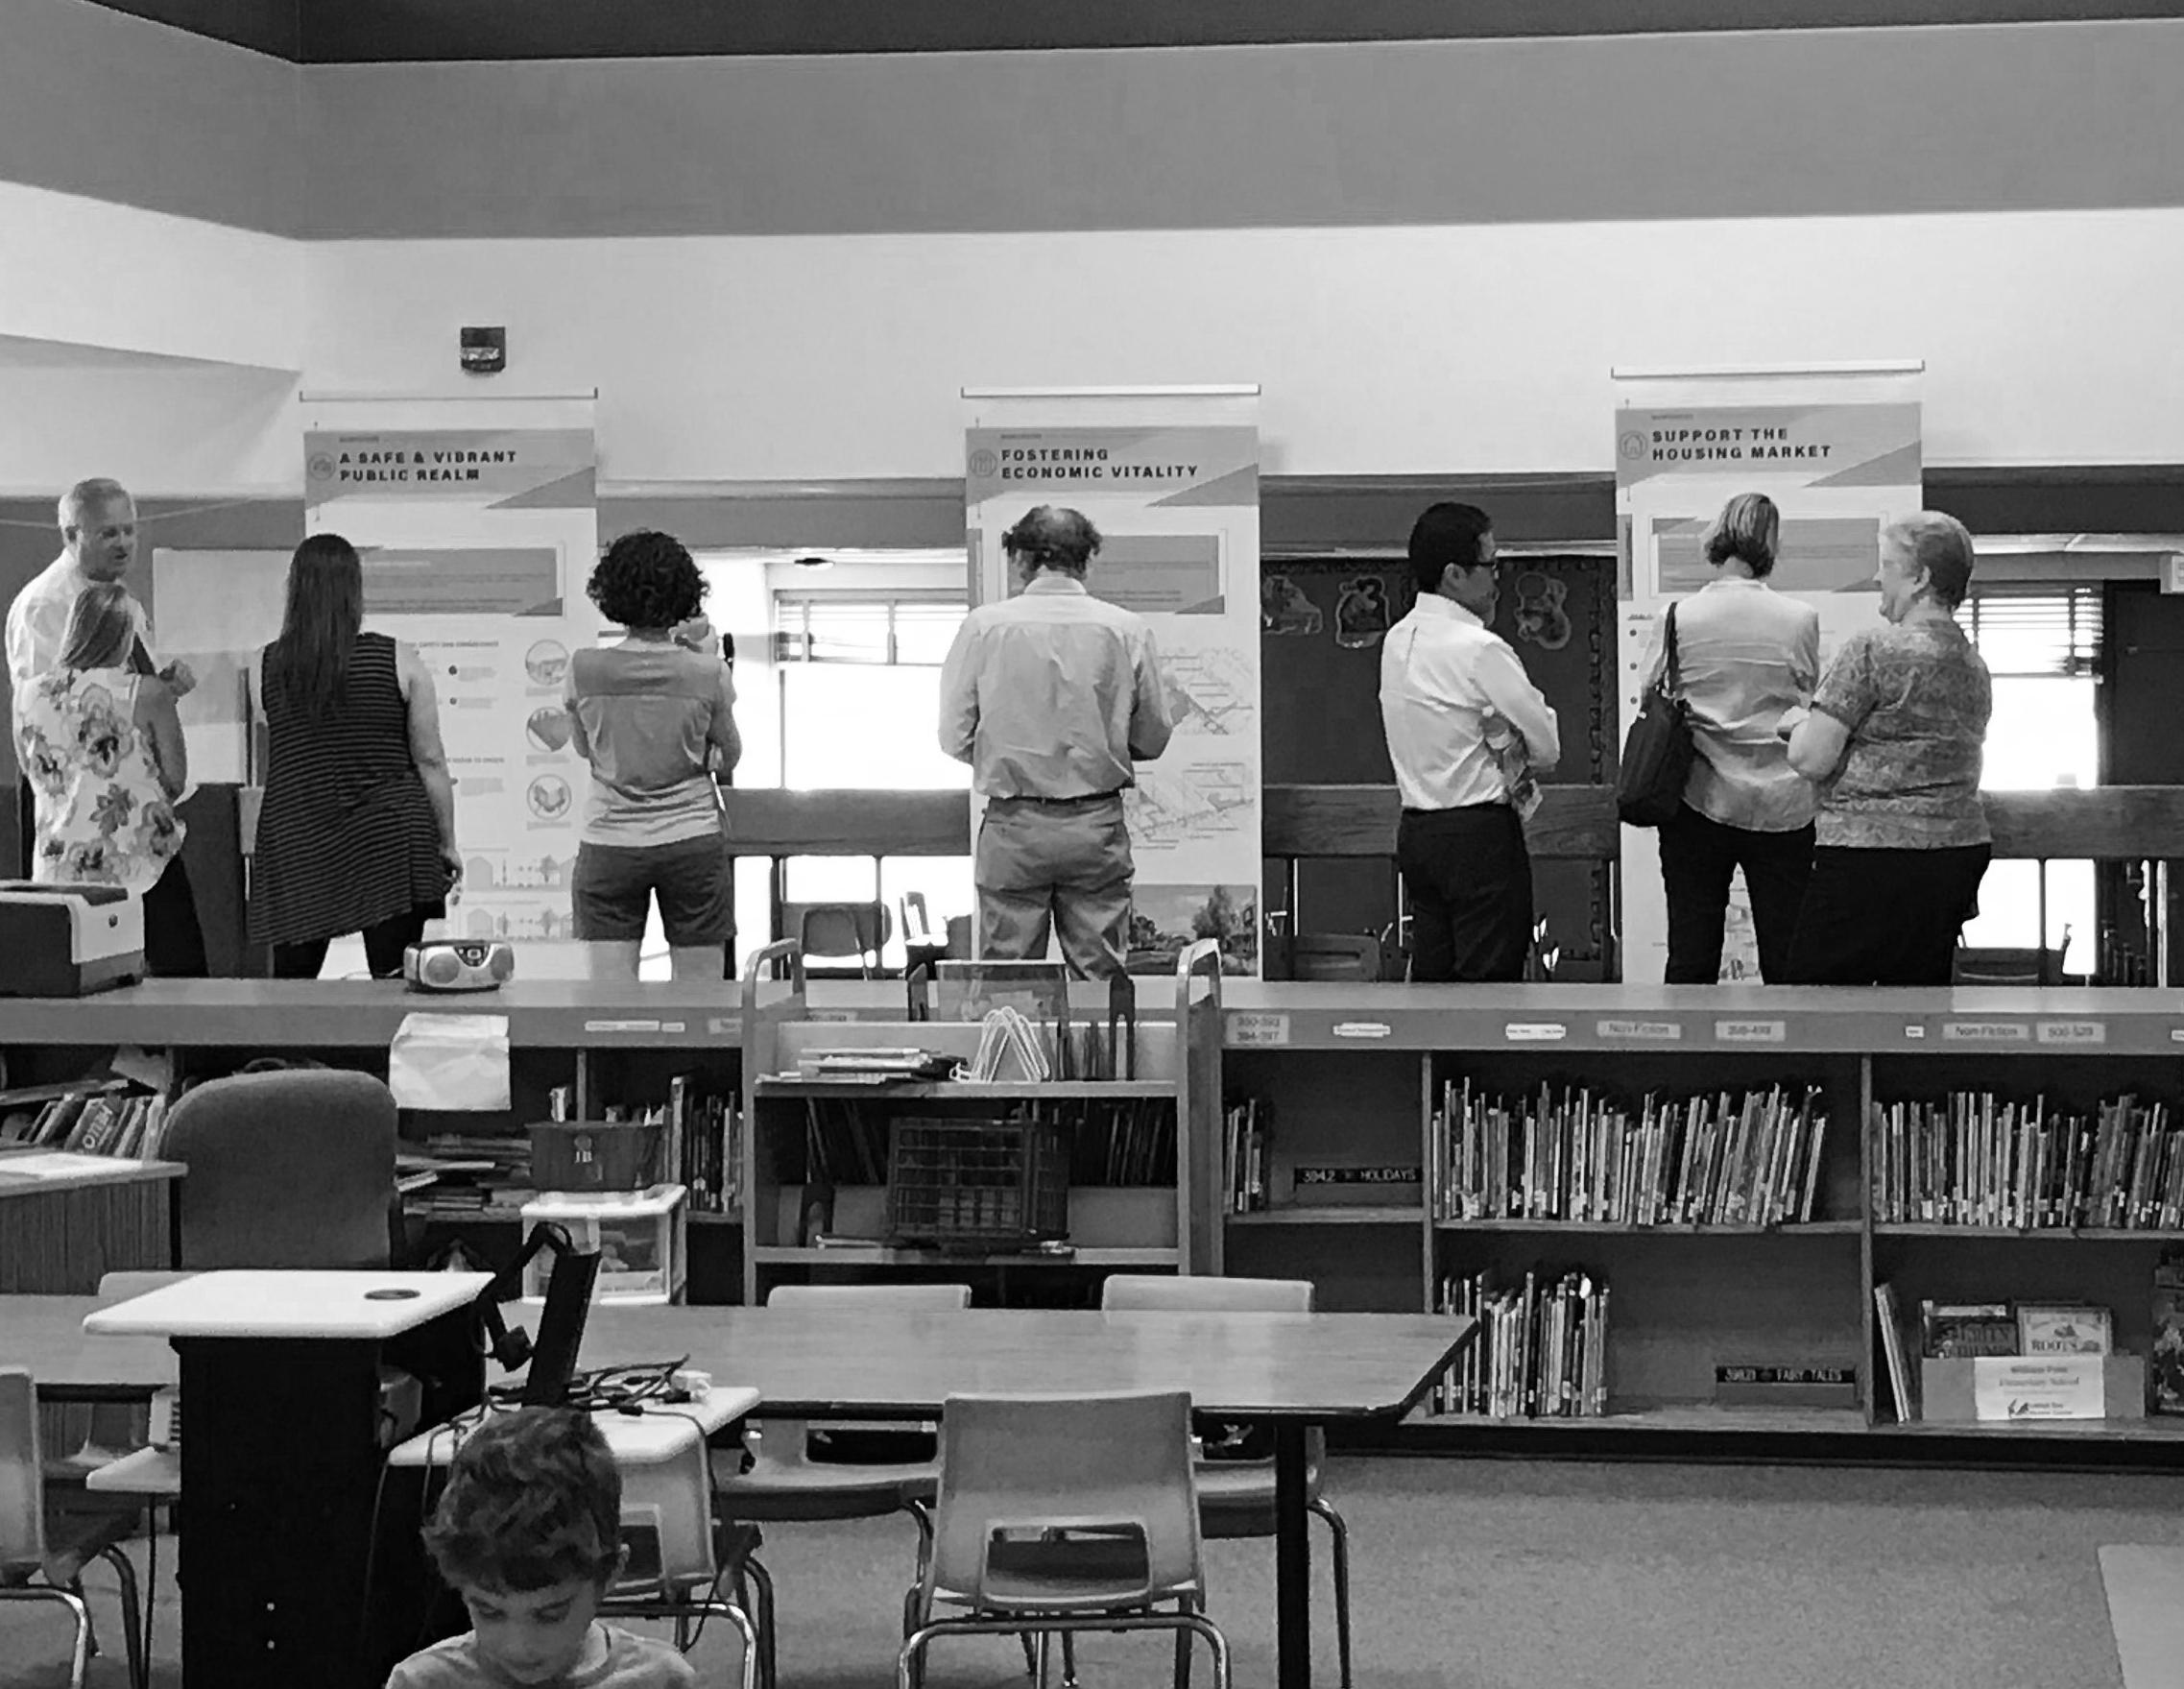
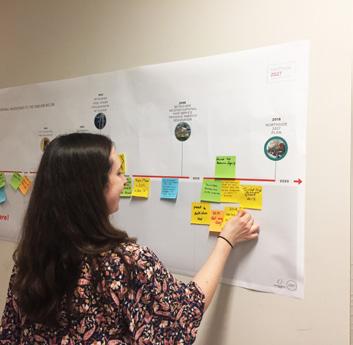
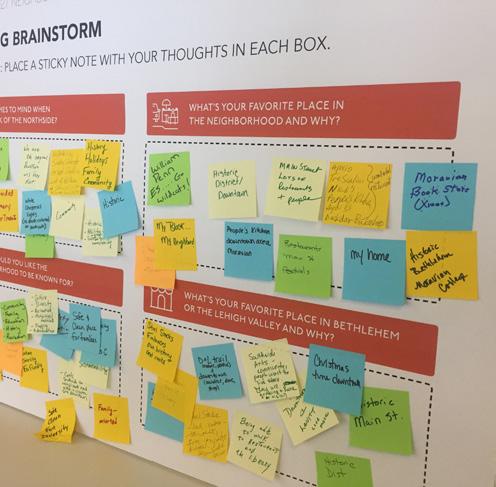
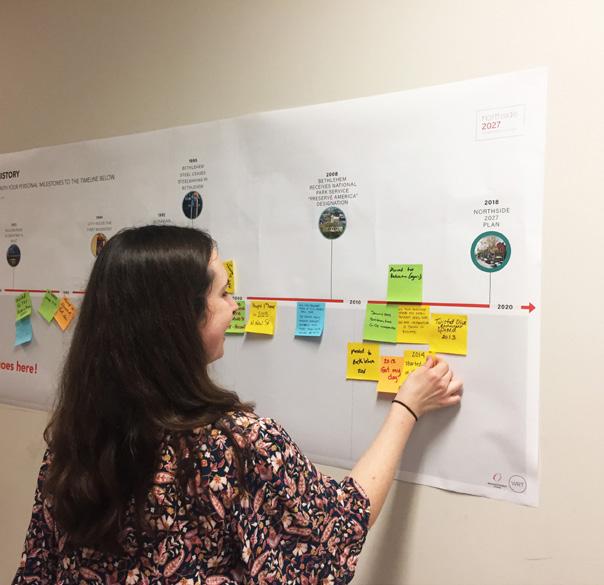
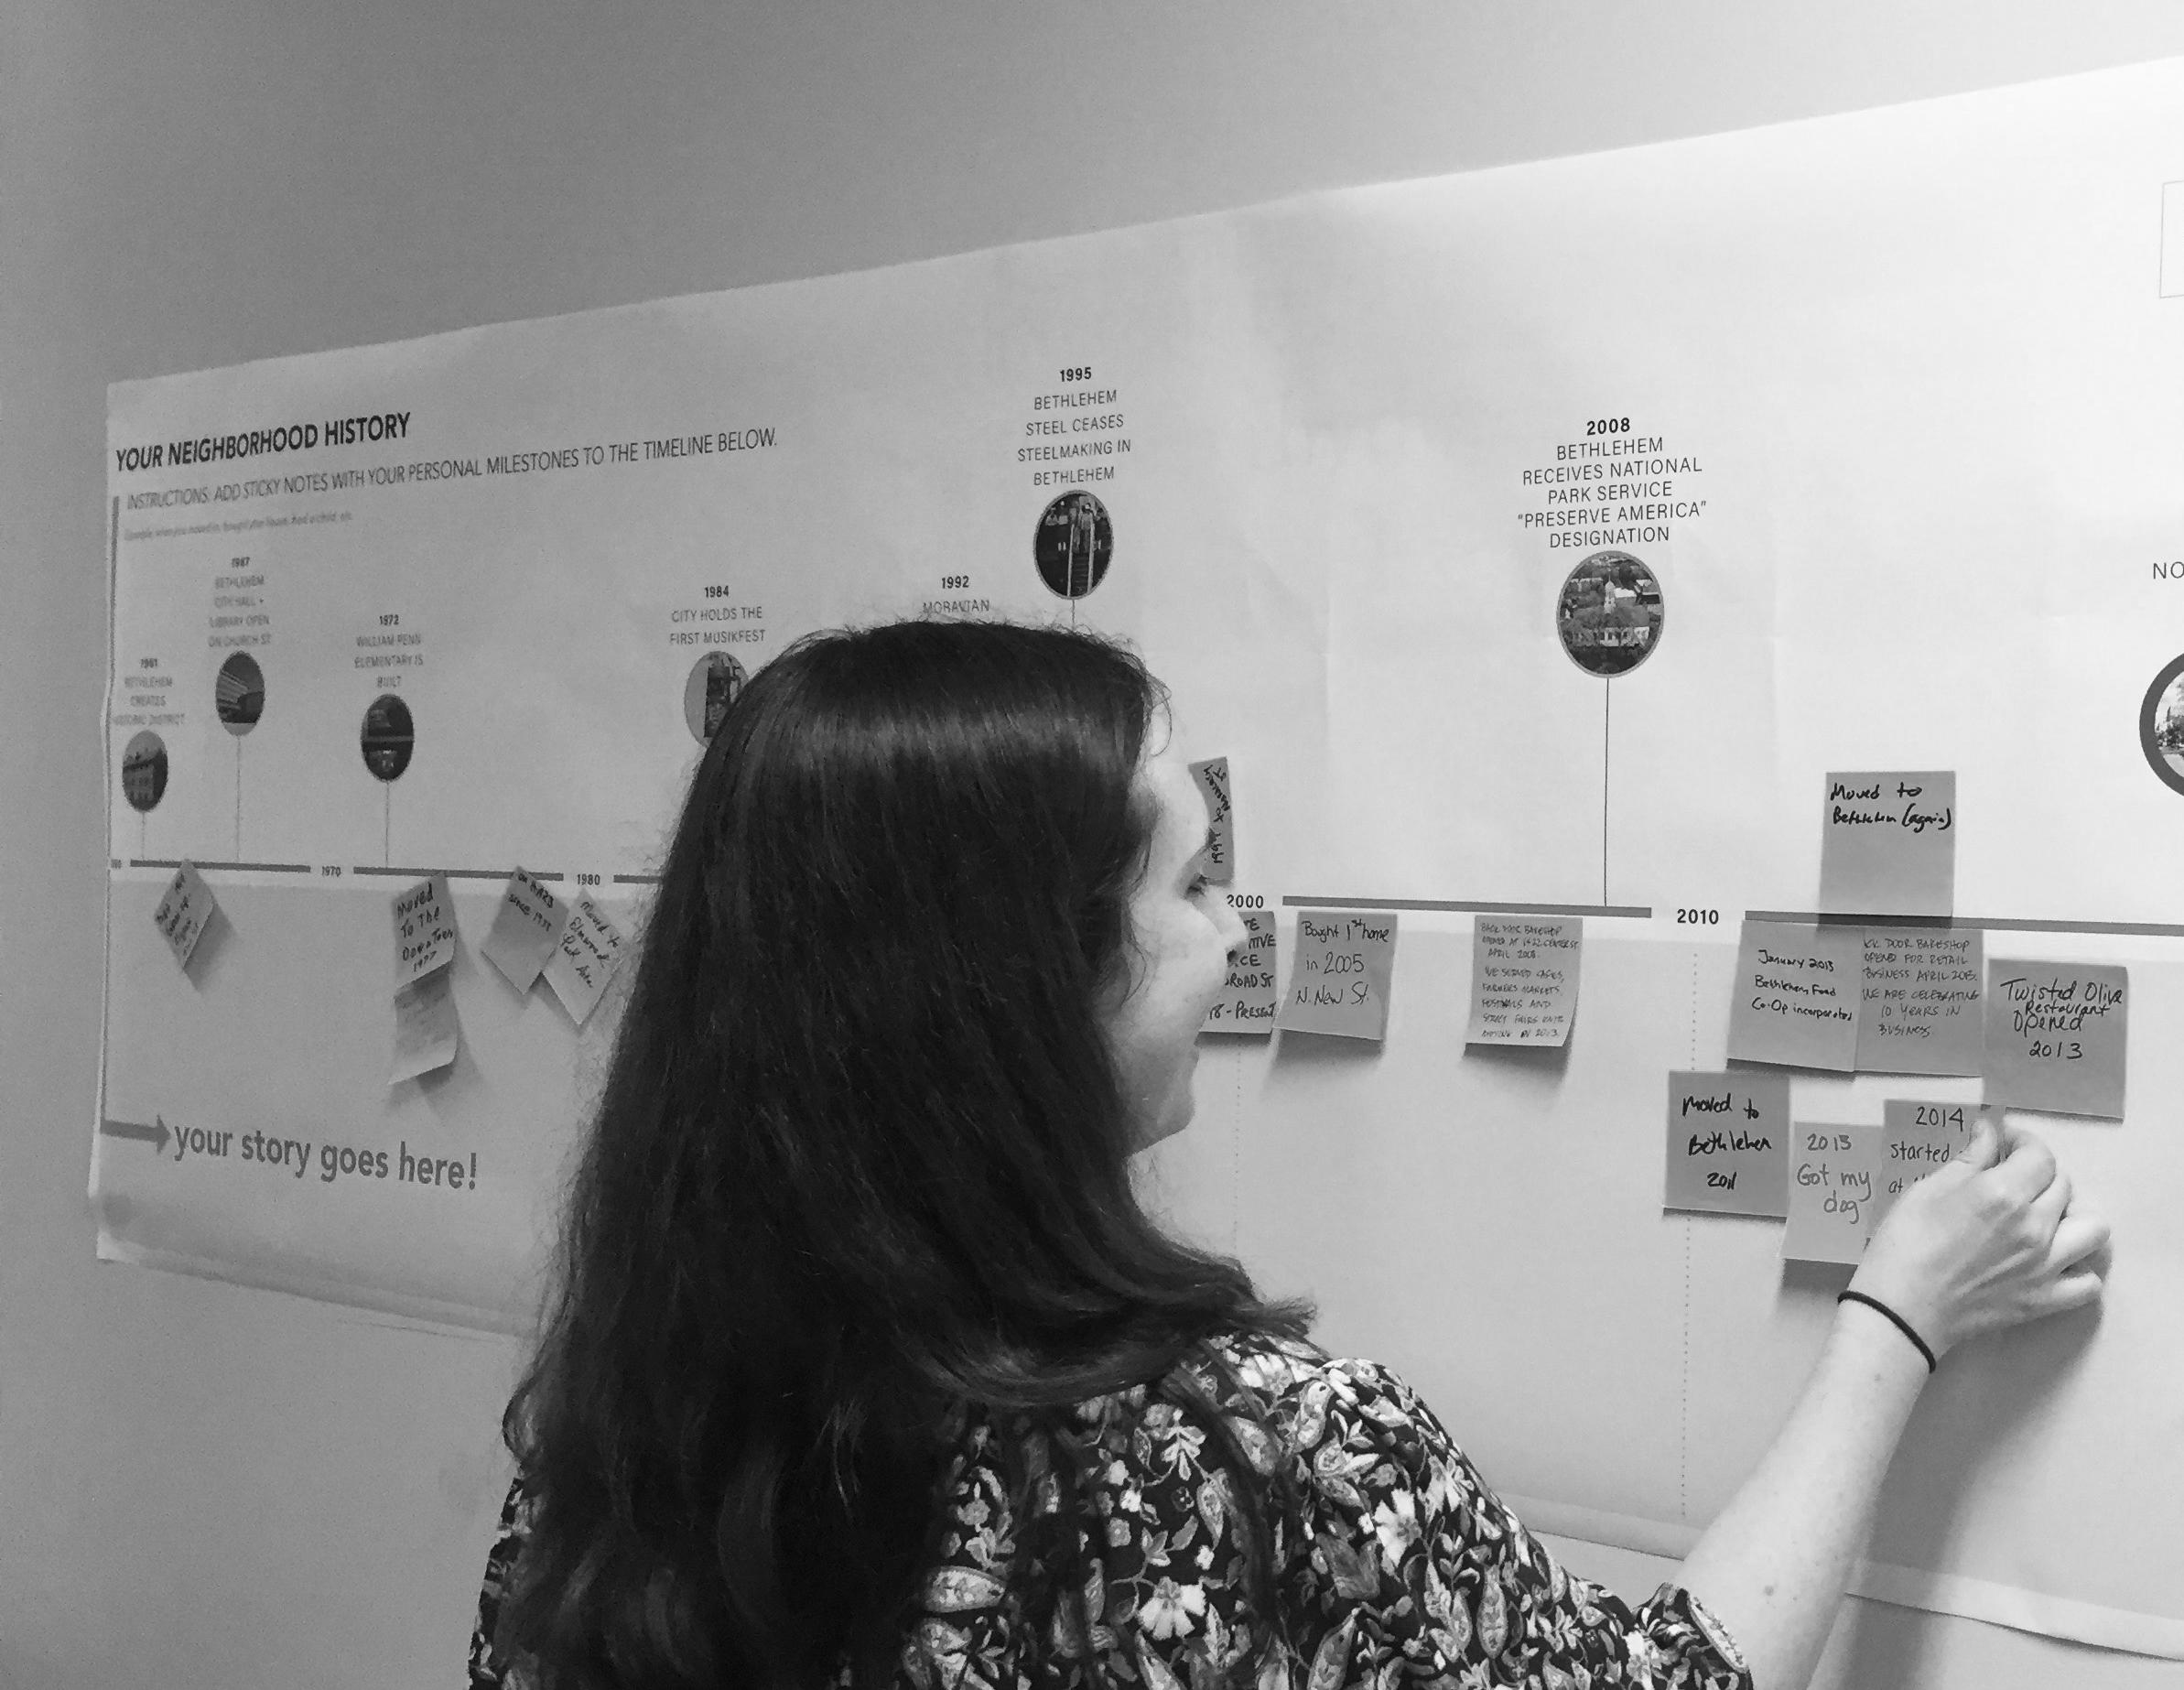
The history of the Northside is more than the major events you read about in the newspaper. It is also the story of the lives of its residents. At the first community meeting, attendees were encouraged to place their own milestones on a timeline, shown below.
1961
1964 born and raised on Iron Street for 21 yrs
1955 graduated from liberty high school
1966 Iris Linares
1972 Born at St. Lukes
1972 worked in neighborhood for 25 years 1977 moved downtown 1977 bought house on E. Union Boulevard
1978 began on historical architectural review board
your story goes here!
1979 attended William Penn
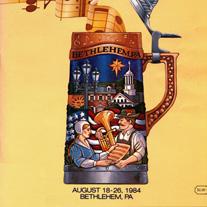
1984 CITY HOLDS THE FIRST MUSIKFEST
1980 moved to Elmwood Park Avenue
1984 moved to W. North Street
1985 born in Northside
1987 lived on Ettwein Street (until 1994)
1987 democratic committee chair (until 1989)
1986 bought starter house on E. Ettwein St
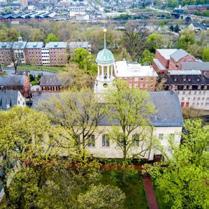
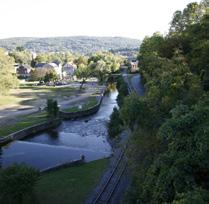
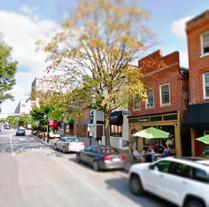
The Northside neighborhood’s major demographic metrics of age, race and ethnicity, and income are largely similar to the demographics of the city of Bethlehem as a whole, making this neighborhood an appropriate “laboratory” for strategies that may help improve other parts of the city as well. The Northside and the city both have a substantial and growing Hispanic population at 28% of all residents, which is significantly larger than the Lehigh Valley region (15%). The Northside also has a slightly higher share of low-income residents—those making less than $49,000 a year—and a slightly elevated unemployment rate compared to citywide.
The Northside neighborhood has recently seen an influx of lower income individuals and families who may need additional supportive services in order to thrive. The percentage of children participating in the school free lunch program has dramatically increased in recent years, which is one proxy for the number of families struggling to make ends meet. There has also been an increase in transiency, with individuals and families quickly moving in and out of the neighborhood, often due to various hardships including difficulty keeping up with rent payments.
Moving forward, the city and community must engage this contingent in order to address many of the neighborhood’s quality of life issues.
of Bethlehem’s population lives in the Northside. 8.3%
The Northside is a dense urban neighborhood, making it very easily walkable.
Sources:
26%
51% of Northside residents identify as Hispanic.
HIGH MEDIAN
in relation to low median home value is resulting in absentee landlords and conversion of single-family to multi-family housing.
68% of Northside residents identify as living in family households.
55% of Northside owner-occupied homes are valued between $100k and $200k.
residents have incomes below
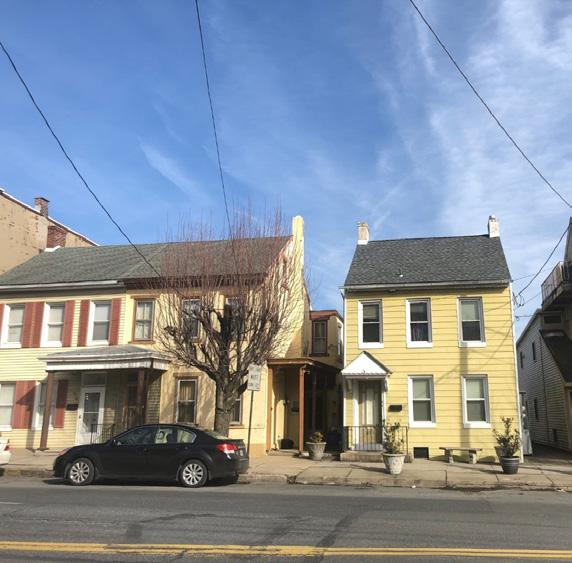
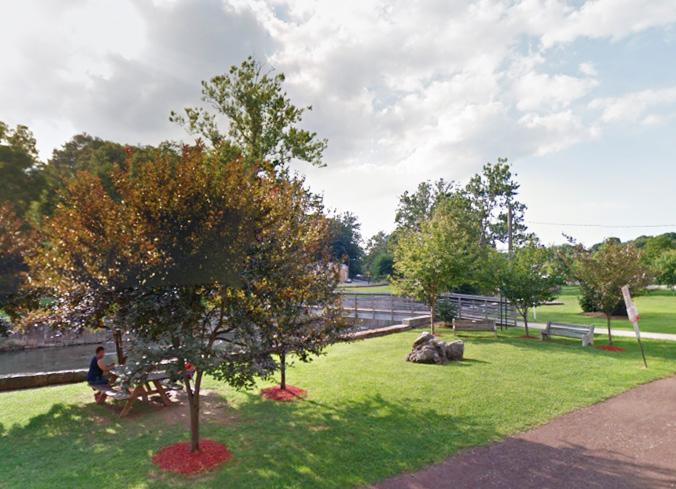
The Northside is a primarily residential neighborhood, with a wide variety of housing types, including detached single family, twin, attached single family, attached multifamily (many of which are converted single family homes), and a few larger apartment buildings. Commercial activity is concentrated along Broad Street, Linden Street, and Union Boulevard and mostly consists of small storefront businesses. Some larger office buildings are located along Broad Street adjacent to the historic downtown area. Major institutional uses include local public schools, places of worship, and Moravian College. Open space assets include Friendship Park and Johnston Park, which is part of the linear open space that runs along Monocacy Creek and the Monocacy Way Trail. The neighborhood includes minimal pockets of warehousing/distribution activity and no manufacturing or industrial uses.
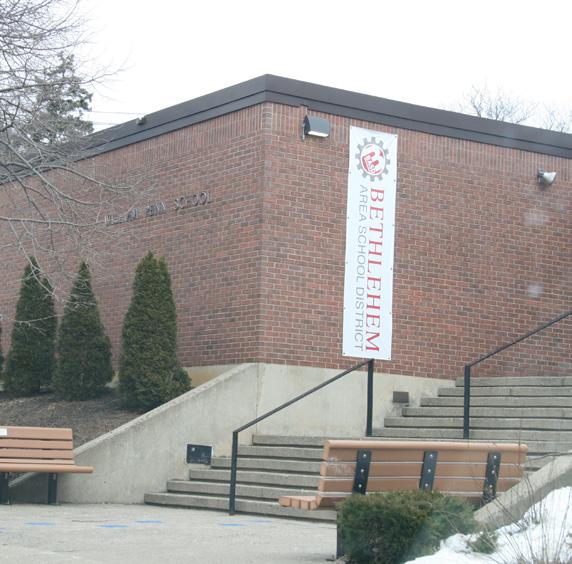
The Northside is fortunate to have a number of K-12 and higher education assets throughout the neighborhood that serve not just students but aim to connect and provide services for all residents. William Penn Elementary follows the “community school” model, wherein the school operates as a community
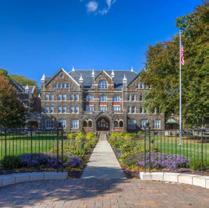
hub with open doors (for a list of resources offered see page 62). Thomas Jefferson Elementary has expressed interest in becoming a community school as well. Liberty High School, one of the city’s two public high schools, sits directly north of the neighborhood, drawing crowds to its sports fields regularly. Finally, Moravian College also sits at the northern border of the neighborhood; its efforts to reach out and embed its students and faculty in the community include mentoring programs, volunteering at local schools, and summer camps open to local children. Another nearby institutional anchor is the City Hall and Public Library complex a few blocks south of the neighborhood boundary, where residents can easily access City services and resources.
Friendship Park, one of the major green spaces in the neighborhood, was created in the mid-1800s around a water tank supplying water to nearby neighborhoods. Over the years the park served as a cow pasture, a marketplace, and recreational space for residents of the City. Movies were even projected onto the side of the water tank. In 1965, the water tank was demolished and in the 1970s the park was renovated and renamed Friendship Park. In recent years, much of the open space has been covered in asphalt and the play equipment has fallen into disrepair. Exciting investments were announced by the City of Bethlehem in 2018, to be undertaken
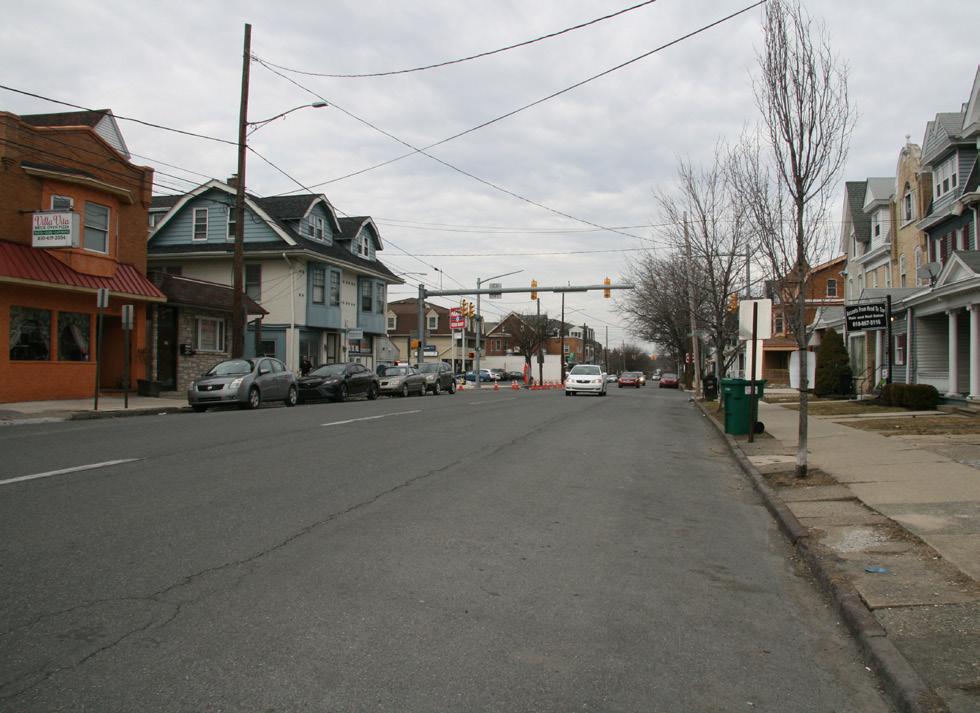
The neighborhood is primarily made up of single family and multi family homes (both detached and attached), with traditional smallscale commercial corridors.
WILLIAM
THOMAS JEFFERSON ELEMENTARY
LEGEND
MVA Market Types B
Residential
Parks & Other Outdoor Recreation
Public & Quasi Public
MVA Market Types
Educational Assets
Offices
Parks/Recreation
Retail/Commercial
Transportation, Communications & Utilities
Places of Worship
Non-residential land use
Manufacturing/Industrial
Historical Sites
College or university land use
Agricultural & Vacant
Plan Boundary
Unknown
Commercial Corridors
Plan Boundary/LERTA District
LANTA Bus Routes
Parks and Open Space
Non-residential land use
Historic District
Waterways C D E F G
College or university land use
Plan Boundary
Parks and Open Space
Parks and Open Space
Academic Institutions
Waterways
Plan Boundary/LERTA District
Parks and Open Space
Waterways
Waterways
throughout 2019. These include new play equipment, new plantings, volunteer-driven clean up efforts, and investments in streetscapes and houses that border the park. These revitalizations are a clear sign of the upward trajectory of the Northside.
The major concerns of Northside residents include the decline in housing stock quality, preservation of affordability, and the conversion of single-family homes into multi-family apartments managed by absentee landlords. Residents have expressed a desire to build a culture of neighborliness and support in helping each other maintain and improve homes. Because there are relatively low levels of vacant land, abandoned buildings, or seriously blighted houses, the overarching goal of this plan’s housing strategies is to preserve and improve the quality of existing housing stock.
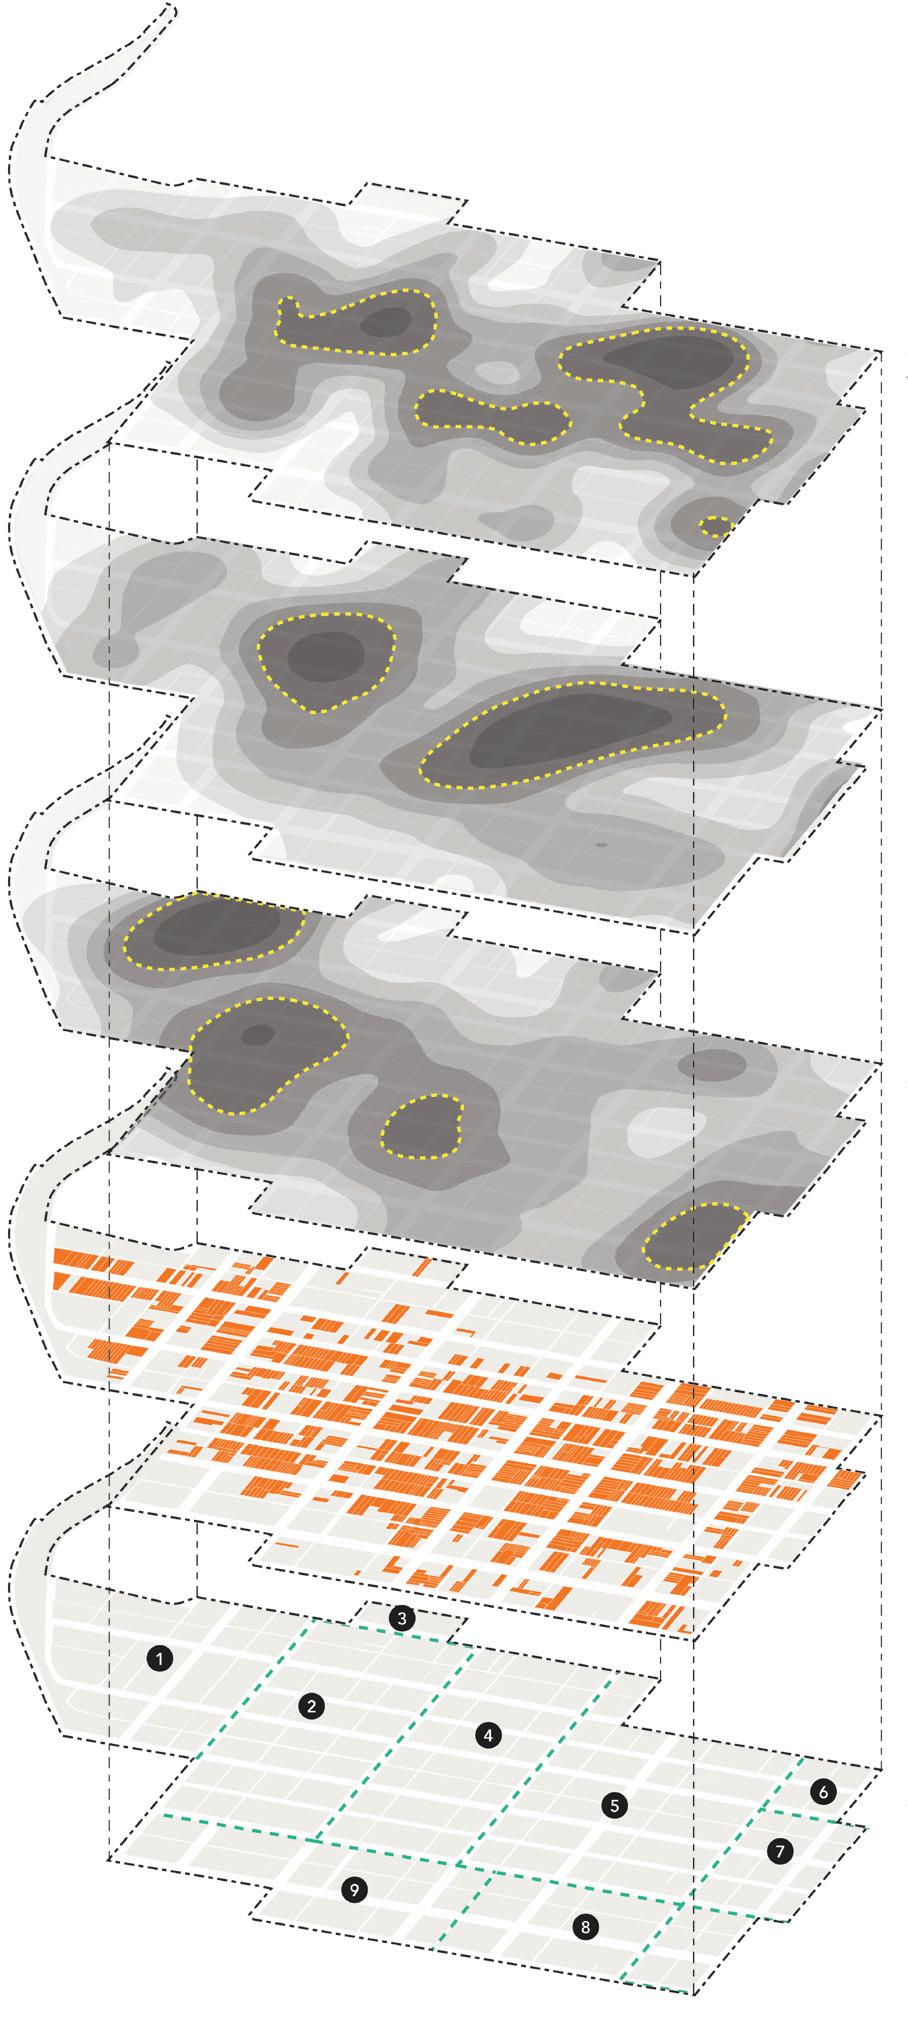
Utilizing the insights of the MVA, the Northside neighborhood’s housing market has been studied at the Census Block Group level. Block groups are labeled as sub-markets 1 through 9 in the map to the right. This detailed and nuanced analysis will enable the City to take targeted actions in different sub-markets of the neighborhood in order to strategically and efficiently strengthen the neighborhood.
Several Northside sub-markets (see map to the right) have high shares of renters, not only the stressed areas (sub-markets 1 and 2) but also sub-market 9, one of the strongest real estate markets in the city, where 85% of households rent. In addition, some of the properties with multiple code violations were owner-occupied, underscoring the need for a variety of strategies addressing renters, their landlords, homeowners, and the public realm more generally.
Data analysis supports the perception of high absentee rental property ownership, with elevated investor activity (as a percent of sales) found across all MVA types compared to similar markets in other parts of the city. This was particularly notable in sub-markets 1, 4, and 7 where investor activity accounted for 31%-41% of all home sales compared to 22% of sales citywide. Although median sale prices in the Northside’s middle and stressed sub-markets were lower than the city average ($81,750-$114,000 compared to $187,000) those areas reported relatively high rents ($1,100 vs. $993 citywide), indicating high rental demand and the profitability of rental property investment.
While the neighborhood’s housing stock is in need of investment, much of it is still in good shape, with very little serious blight or abandoned properties. Many residents report being willing to upgrade their
homes and properties but financially unable to do so. There is also a strong desire to help each other improve the neighborhood through formal volunteer repair and maintenance programs. There is great potential for improving the existing housing stock given the right tools and capacity.
Economic activity within in the neighborhood is generally limited to the two major commercial corridors—Broad and Linden Streets—and to a lesser extent on Union Boulevard. The neighborhood is conveniently located to nearby job centers, including local colleges and universities and business parks in surrounding suburban areas.
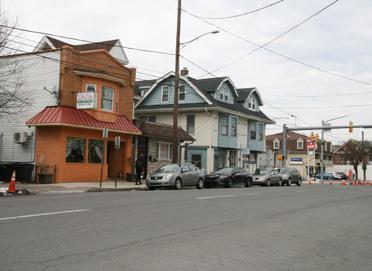
One of the city’s most vibrant commercial corridors, Main Street, leads upward from the historic downtown towards the Northside and intersects West Broad Street. However, the vibrancy and momentum of the Main/Broad corridor significantly drops off east of Center Street. Further east in the neighborhood, Broad intersects with Linden Street. The three sections of commercial activity exhibit distinct qualities. Broad Street west of Center is best described as a restaurant corridor serving both residents and tourists; Broad Street east of Center includes primarily professional offices and services, and finally Linden
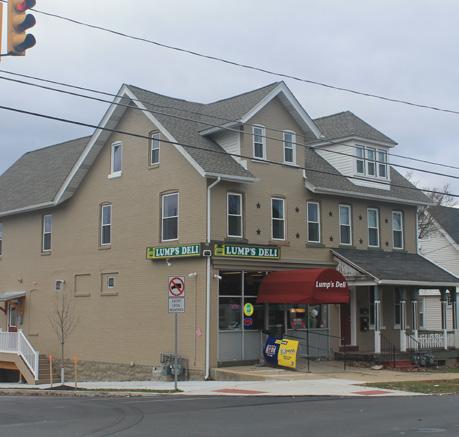
Street includes more resident-serving commercial activity such as dog groomers, barbers, and laundromats, in addition to a small number of eateries.
While the Northside’s commercial corridors are functioning, there is room for improvement both physically and functionally. Many storefronts are in need of maintenance or improvement; the City currently has a façade improvement program to assist business owners with the cost of upgrades, but it has not had any participants since it began in 2018. Additionally, while the Main/Broad intersection includes amenities like benches, period lighting, and small plantings, the rest of the corridors are largely lacking these elements. Parts of the corridors, particularly Linden Street, also lack continuous street tree coverage.
The commercial vacancy rate is low, but there are some vacant storefronts available for new businesses. Though most of the commercial spaces are in small storefront format, there are some larger office buildings and a few auto-oriented shopping centers with parking in front, particularly on Linden Street, as well as a large municipal surface lot fronting Broad Street.
The major redevelopment opportunity in the Northside is the former Boyd Theater building,
located on a key block of Broad Street between New and Guetter Streets. The building has sat vacant for a number of years, and residents are hopeful about mixed-use redevelopment plans currently in progress. While most of the retail and restaurant section of Broad Street has a pleasant tree-lined median, this particular block is missing its median, creating a gap in the cohesive feel of this corridor. Additionally, the building directly across from the Boyd site—3 West Broad Street—was designed in a previous era and does not create an inviting street frontage for pedestrians. This block represents a major opportunity for streetscape improvements.
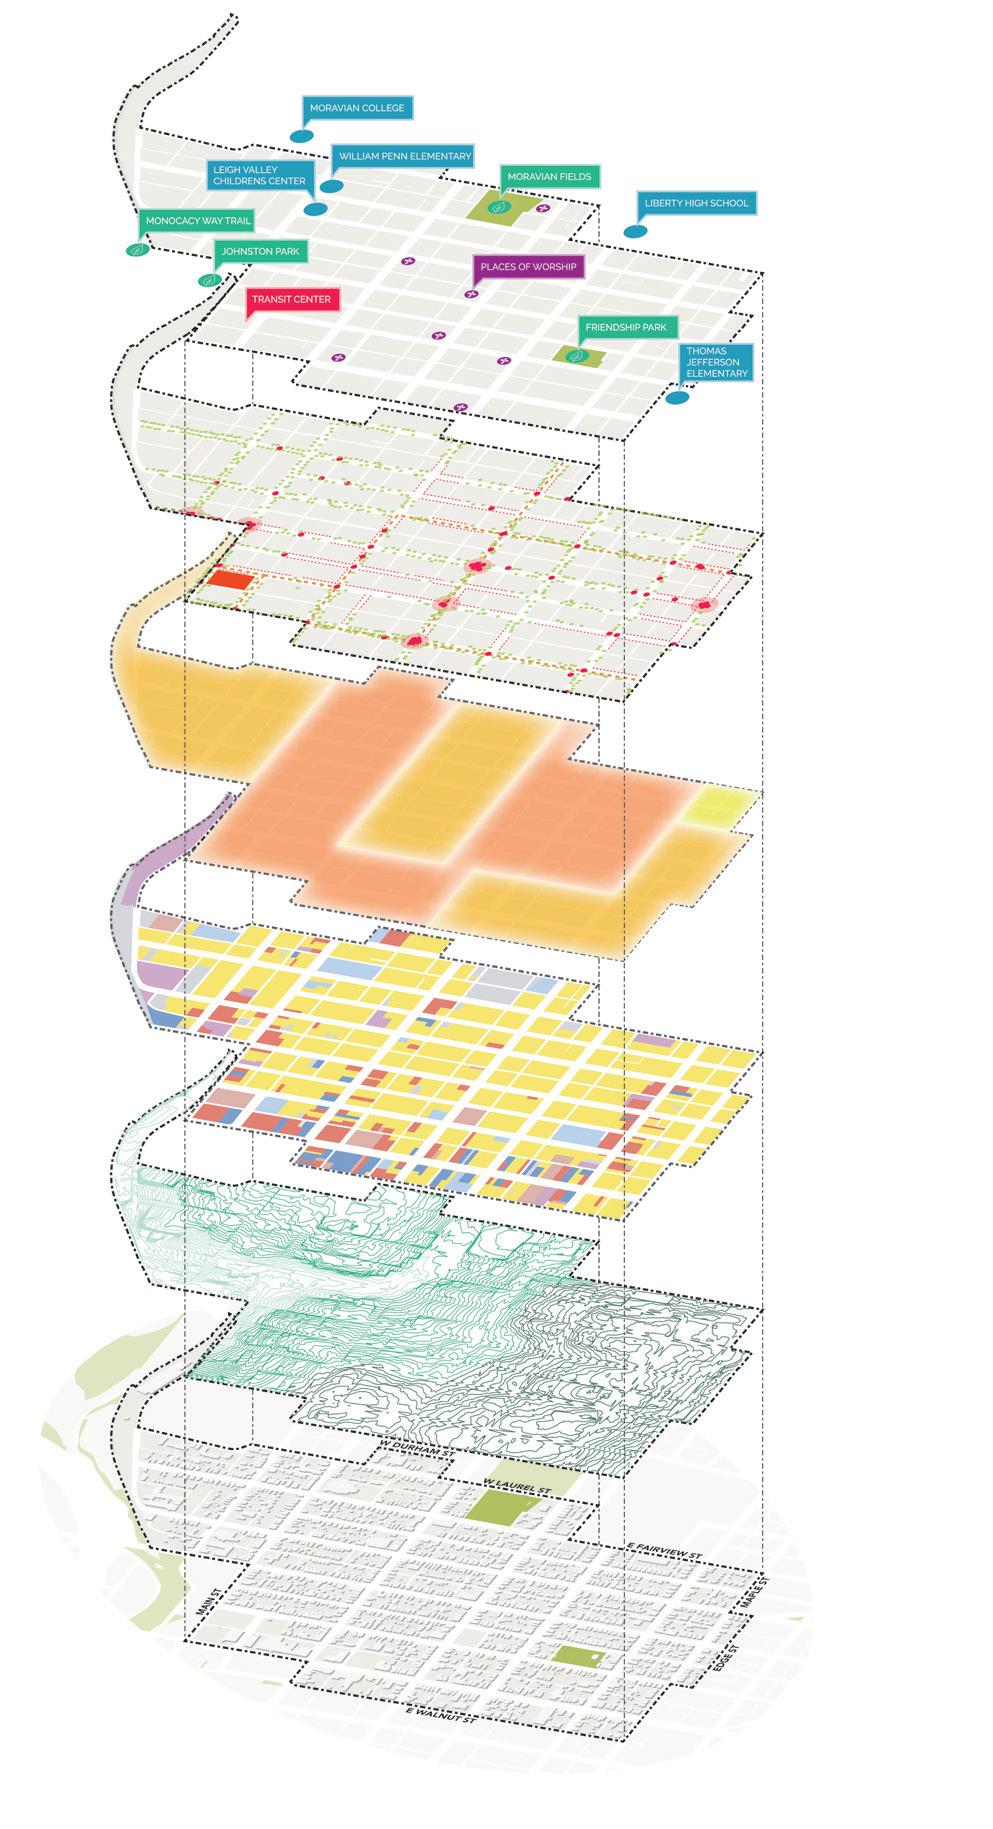
Although the Northside is a walkable neighborhood with short, regular blocks and numerous assets within a short distance, several factors contribute to a lack of pedestrian safety.
1. Inadequate crossings: Most major streets in the neighborhood are fairly wide, with two lanes of traffic and a parking lane in each direction. Many of the crosswalk markings are missing, faded or not heeded by coming cars at key intersections. Residents expressed particular concern for the many schoolchildren who must contend with these unsafe conditions on their daily walks to and from school.
2. High vehicle speeds: Several streets that pass through the Northside have been designed to generate fast-moving traffic that creates hazards. For example, the lack of regular stop signs or street lights on Main Street for blocks at a time enables cars to travel at high speeds, making it dangerous for people to cross on foot.
3. One way streets: As mentioned, Linden and Center Streets were converted into one-way arterial streets in order to better handle the crush of traffic at key times of day during shift changes at the steel plant. Though that function is no longer necessary, the one-way configuration encourages faster speeds and prevents them from feeling like walkable neighborhood streets.
4. Alleyways: The street grid in the Northside includes not only major two-way streets but an additional layer of interspersed single-lane alley streets. Although these alleys have homes fronting them and often see regular car traffic, a lack of awareness of the fact that regular traffic rules still apply can sometimes create confusion for both drivers and pedestrians.
The neighborhood is served by multiple bus lines that run throughout the city. The LANTA regional bus terminal is also located within the neighborhood

LEGEND
Street Trees
Gaps in Street Tree Coverage
Bus Routes
One-Way Streets
Crashes (Ped, Bike, and Vehicle)
2001-2017
Crash “Hotspots”
Plan Boundary
Parks and Open Space
Waterways
and Union. An analysis of street tree locations shows an uneven distribution throughout the neighborhood.
at Guetter and North Streets, granting residents access to destinations throughout the Lehigh Valley.
Despite the Northside being a very walkable neighborhood, its streets still see a significant amount of car traffic. While many streets have on-street parking, residents have expressed concern over the availability of parking, especially on streets close to Moravian College.
Bicycle infrastructure in the Northside is currently fairly minimal, aside from the Monocacy Way Trail that runs along the western edge of the neighborhood. While the trail is a valuable asset and connects to other trail systems, there is only one access point from the neighborhood, at Union Boulevard, and it is not well-marked. Some streets in the neighborhood have “sharrows” indicating that cars should share the road with cyclists, but there are no dedicated bike lanes in the Northside.
Although the neighborhood is generally well-covered by street trees and street lighting, there are a number of gaps in both commercial and residential zones. Additionally, a lack of signage celebrating the Northside and directing pedestrians to nearby assets and amenities impede the quality and function of streetscapes.
The major constraints this neighborhood faces are primarily rooted in a lack of organizational capacity and a sense of being rooted in the community among residents. Issues that stem from this reality include a lack of a neighborhood organization to act as a vehicle for communicating resident concerns and ideas; increasing transiency; absentee landlords with declining property conditions; and declining quality of life in terms of the neighborhood’s physical upkeep.
The neighborhood is physically constrained to the west, due to the creek and highway separating it from neighborhoods on the other side. Other physical constraints include the one-way and fast moving roadways that currently impede pedestrian connectivity and safety, but these represent issues that can be overcome with targeted interventions.
Despite the lack of organizational capacity in the Northside, there is certainly motivation and desire on the part of residents to build up this kind of
framework to create positive change in the future. This pent-up desire for more community cohesion and grassroots activity represents a major opportunity to get the neighborhood involved in its own transformation. With the creation of a neighborhood organization, residents will be empowered to channel their ideas productively and work with the city on the implementation of this plan.
Physical opportunity sites that represent an upswing in momentum and attention in the Northside include the ongoing revitalization of Friendship Park, the planned redevelopment of the former Boyd Theater site, and the expansion of local elementary schools into Community School anchors.
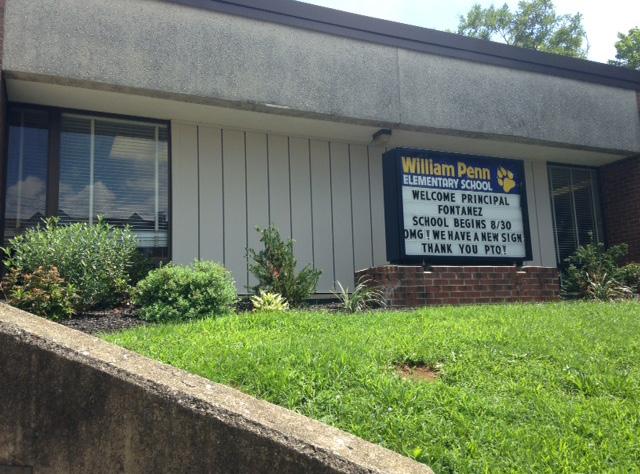
Friendship Park, which is currently underutilized and has been largely covered in asphalt paving for the past many years, will receive $100,000 of investment in the form of new play equipment, landscaping, and visitor amenities.
The Boyd Theater site, once a beloved theater and cultural anchor in the neighborhood, has sat vacant since 2011 and has fallen into disrepair. Its prominent location along Broad Street makes it a valuable catalyst for rejuvenation of the area’s commercial corridors. A multi-story mixed-use development is planned, including residential and ground-floor
retail, which will bring new amenities and services to the corridor as well as an influx of new housing options close to Downtown.
William Penn Elementary, which has been operating on a Community School model for the past 5 years, and Thomas Jefferson Elementary, which is planned to transition to a Community School model in the future, are crucial assets that serve the surrounding community in a multitude of ways beyond educating students. Already offering services such as food and clothing donation pantries, housing and employment counseling for adults, behavioral and family counseling, and more, the schools can be further utilized to offer resources that residents need in order to thrive in the Northside.
These ongoing efforts represent promising opportunities as strong assets that can be further leveraged as the neighborhood continues to improve.
At the outset of the planning process, the City hoped to tackle a broad range of issues:
» Supporting the housing market
» Creating a sense of place
» Improving local commercial areas
» Ensuring the right mix of services to help residents thrive
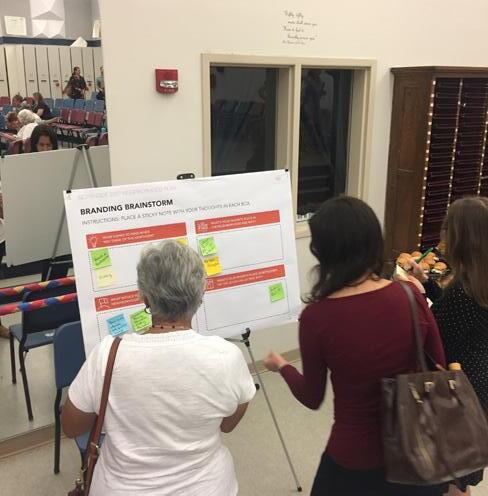
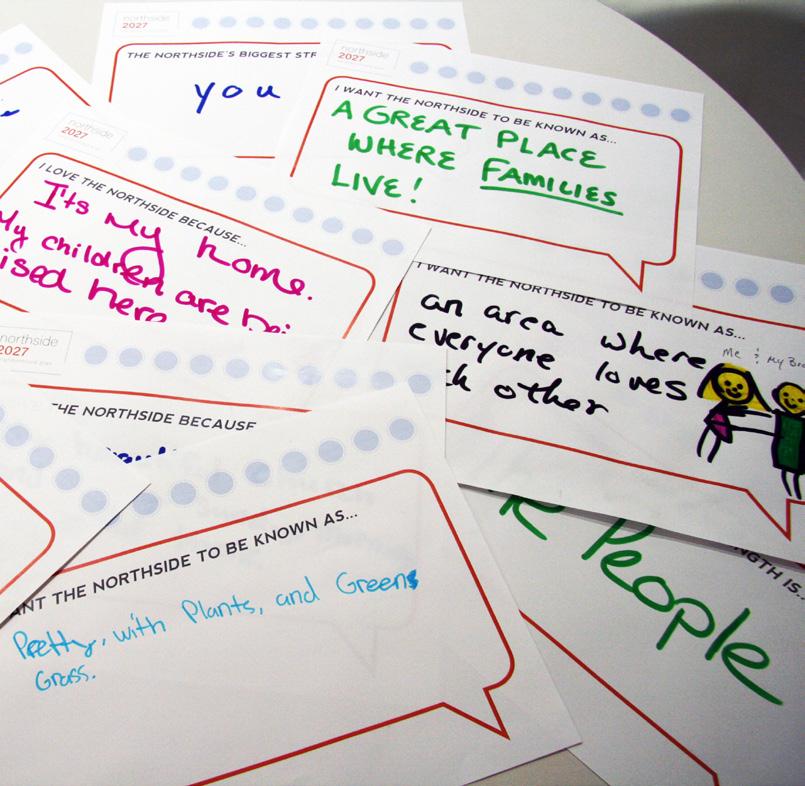
Open-ended feedback at the first community meeting generally aligned with these guiding principles, and from there the plan framework was developed.
Additional concerns brought up by community members included the area’s lack of an identity, pe-
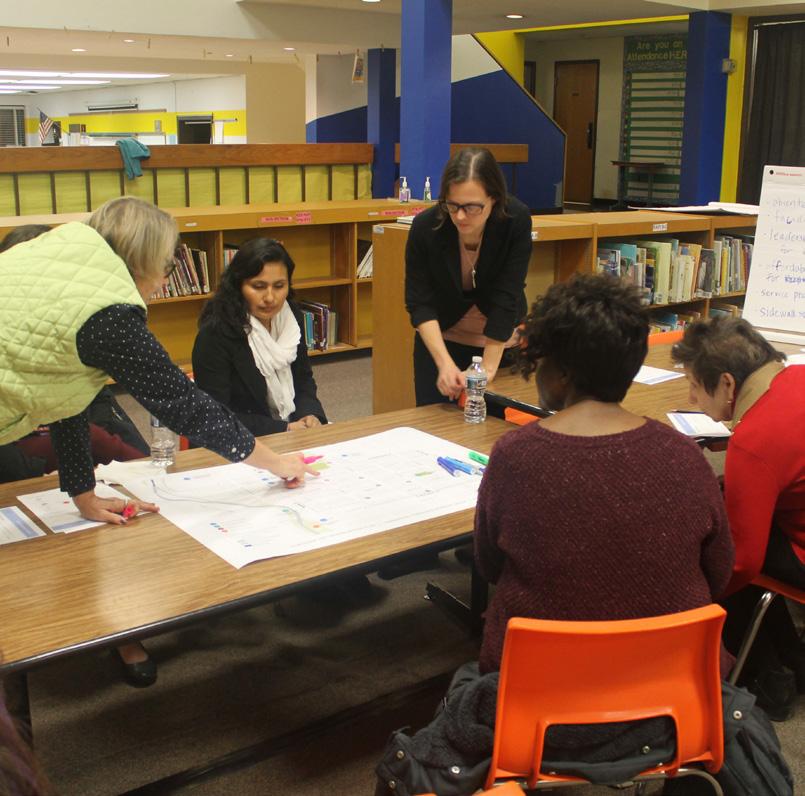
destrian safety issues, a lack of convenient grocery options, and a lack of neighborhood cohesion.
Working groups were formed to dive deeper into these issues and start to come up with potential strategies, partnerships, and existing resources. Three groups—mobility, commercial activity, and housing—met during the second community meeting and again a few weeks later to solidify and refine their ideas.
» The mobility working group helped identify key streets in need of traffic calming and key intersections that need more visible pedestrian infrastructure.
» The commercial activity group focused on how to solidify the different core functions that each corridor serves.
» The housing group helped clarify that while some perceive a lack of interest in home main-

tenance, many residents are willing but unable to afford the upkeep required. They then came up with ideas for a one-stop resource for homeowners and innovative ways to build community cohesion by encouraging neighbors to help one another improve their homes.
RESIDENT HISTORY TIMELINE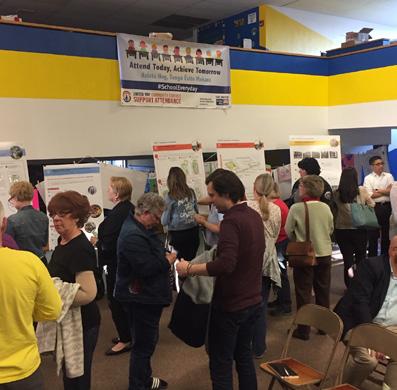
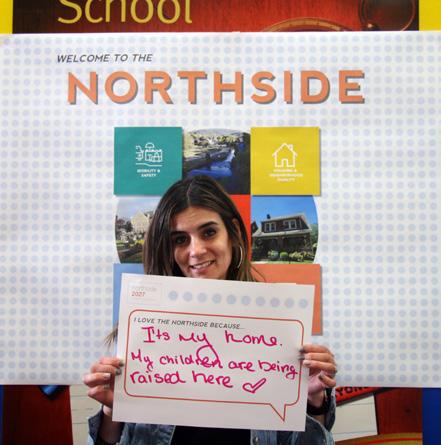
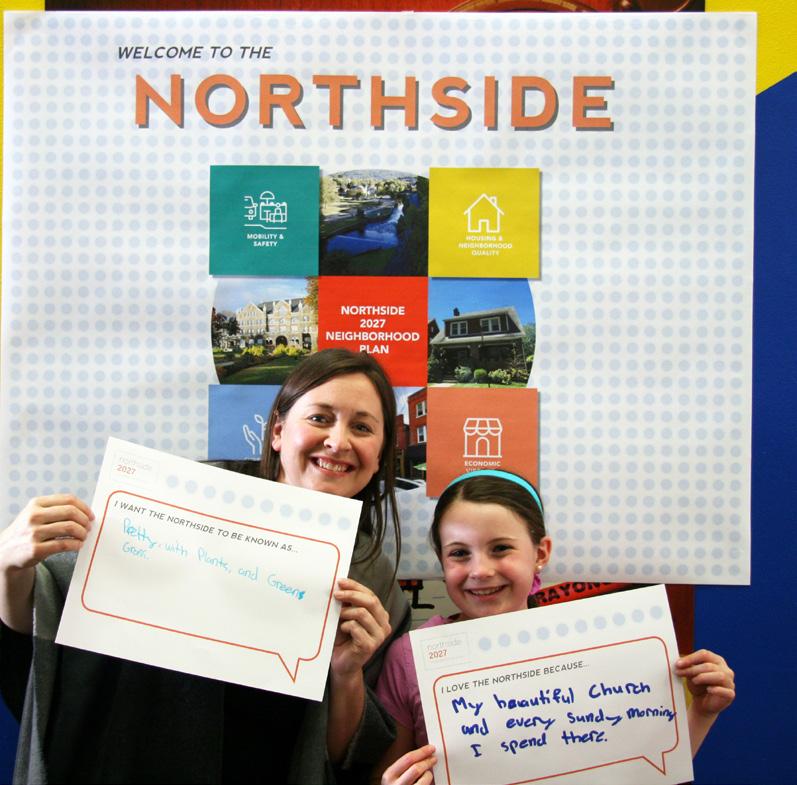
During this time, the City administered a survey to gain input into what types of services would be most helpful to people in terms of economic development, housing, and youth and education. In total, 122 survey responses were recorded. The most popular suggested programs and investments were affordable childcare, high quality extracurricular programs, home repair grants, and better access to mental health resources. These priorities were then included in the plan framework.
Additional engagement activities included interviews with neighborhood residents and two walking tours—one of the residential streets and one of the commercial corridors. Led by local advocates and business owners, these tours helped ground-truth the major concerns and opportunities already being discussed.
Residents then selected their priorities among a set of draft strategies presented at the third community meeting. These priorities are called out both in the plan and in the implementation framework. Community priority was also taken into consideration when defining timeframes for the implementation of each strategy.
dependent on private actors and market forces. Additionally, the housing section’s strategies were not included in order to enable the City to rely on the extensive research and data analysis behind the strategies to guide implementation.
For more information about the input gathered through community engagement, see Appendix A.
NOTE: Community priority was only measured for strategies over which the City and related partners have at least some control; certain strategies that are primarily driven by other parties were not included for residents to prioritize. For example, the redevelopment of the Boyd Theater, while strongly supported by the City and local residents, is largely




During the community engagement process it quickly became clear that mobility is a chief concern among residents. The Northside has an advantage in that it is laid out as a dense and walkable urban neighborhood; however, fast speeds on major roads and other shifts toward auto-oriented lifestyles have made it less safe for residents to get around on foot or on a bicycle. This is especially challenging for the many school children who walk to and from school each day. Relatedly, the declining quality of the neighborhood’s streetscapes and public realm make it a less welcoming and attractive place to walk around.
The Northside also has a number of parks and green spaces within it or in close proximity which are currently underutilized. New investments in Friendship Park will go a long way to re-establishing it as a functional and beautiful public space, and the aim of this plan is to build off of that momentum to further highlight it within the community.
The following goals and strategies aim to enhance multimodal safety to truly return the neighborhood into a safe, walkable area, while improving the aesthetic quality of streets and public spaces.
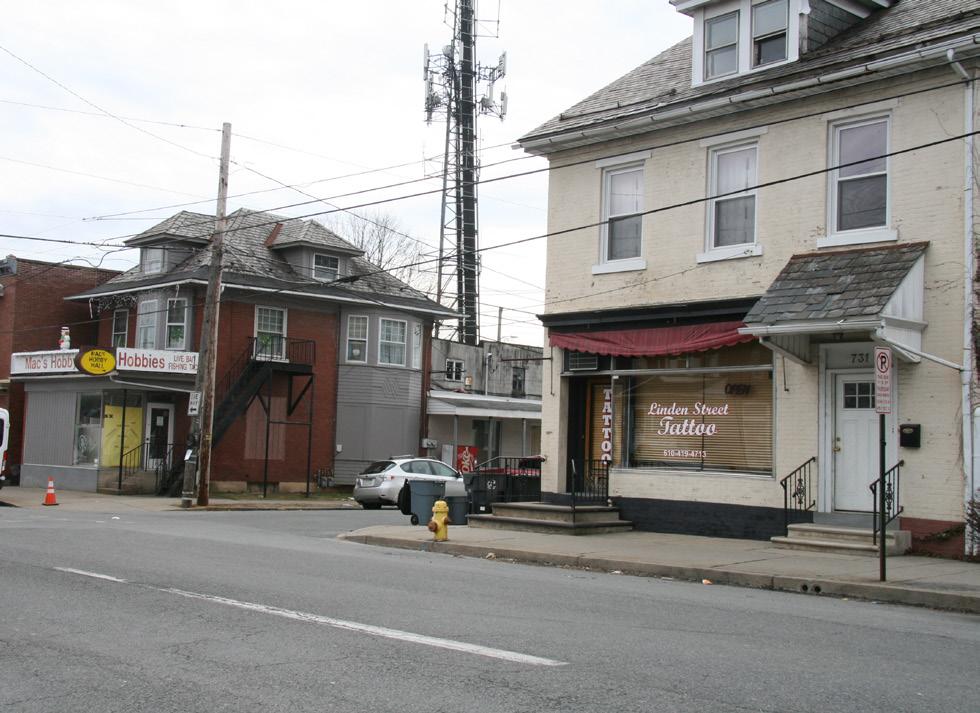
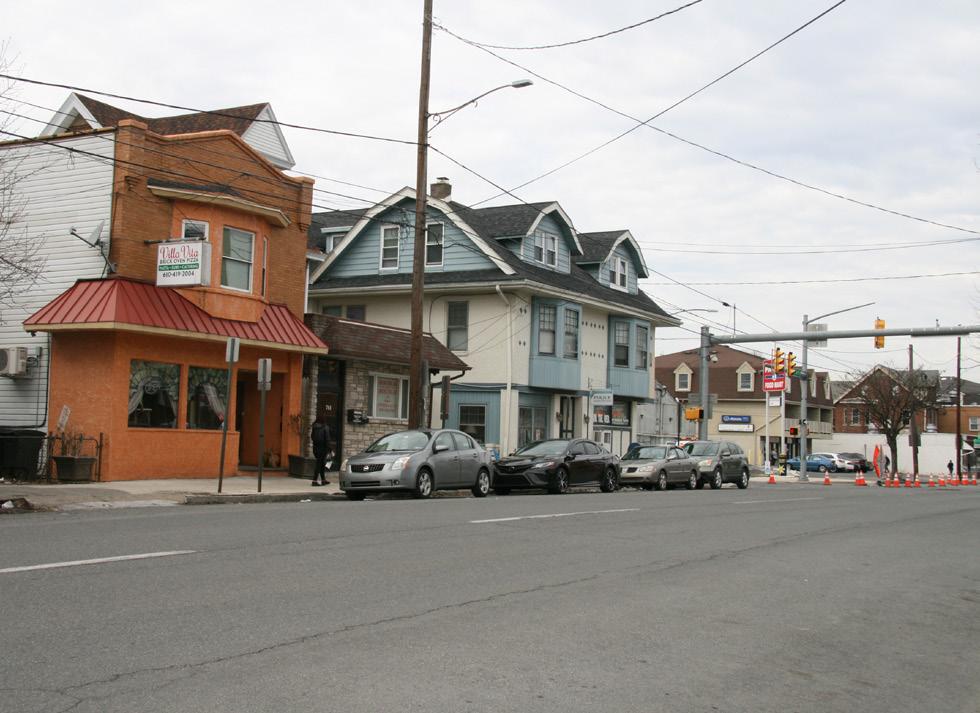
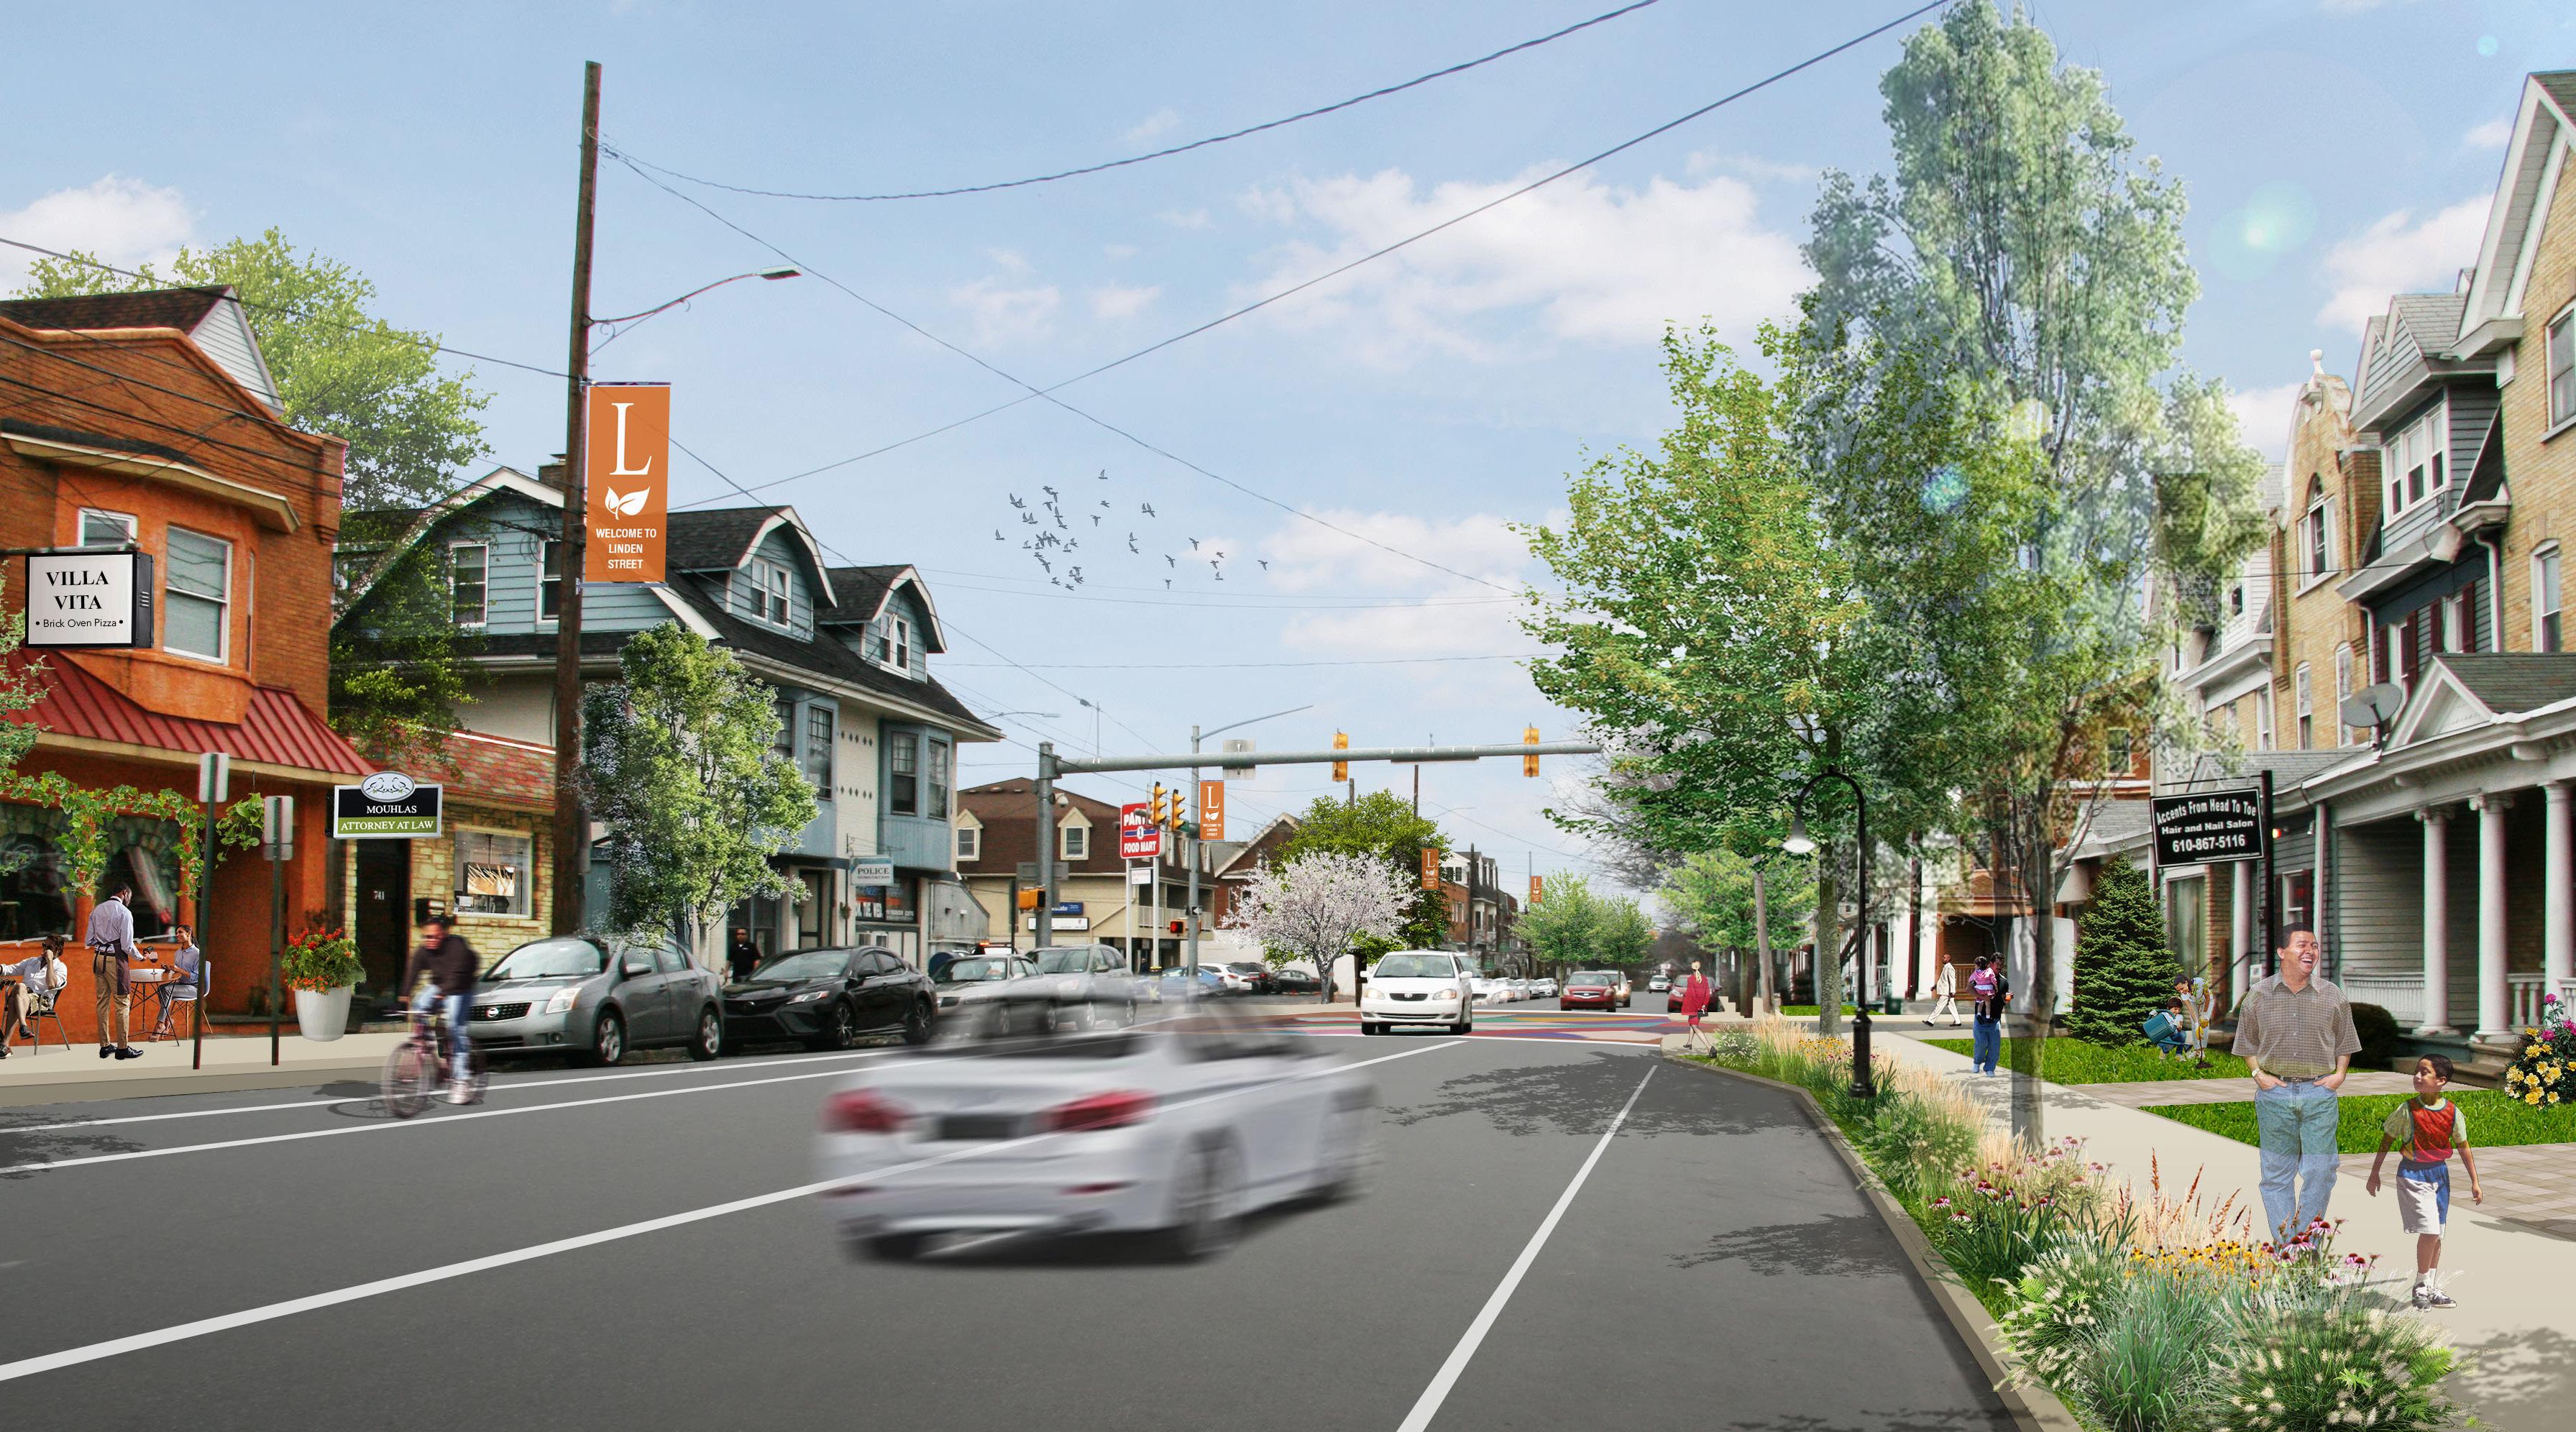
1. Return Linden Street to two-way traffic and consider road diets or other interventions to make it more amenable to all modes of transportation.
The one-way traffic on Linden and Center Streets is a vestige of the steel plant era, when regular shift changes necessitated an efficient way to get workers to and from the plant at key times of day. Now that the unique traffic pattern no longer exists, these streets should be returned to two-way traffic in order to transform them away from high-speed arterials back into pedestrian-friendly neighborhood streets. Linden Street is the best candidate for near-term conversion; Center Street was recently improved with new paving, so it may be a longer term candidate for conversion in the future.
2. Implement traffic calming elements on priority streets.
In addition to the one-way traffic of Linden and Center contributing to unsafe conditions for vehicles and pedestrians, other streets are de-

» Main
» New
» Center
» Broad
» Linden
These streets have been identified as priorities for early intervention based on recent crash data as well as qualitative input from the experiences of neighborhood residents.
Center St
Center St
Linden St
LINDEN STREET: EXISTING
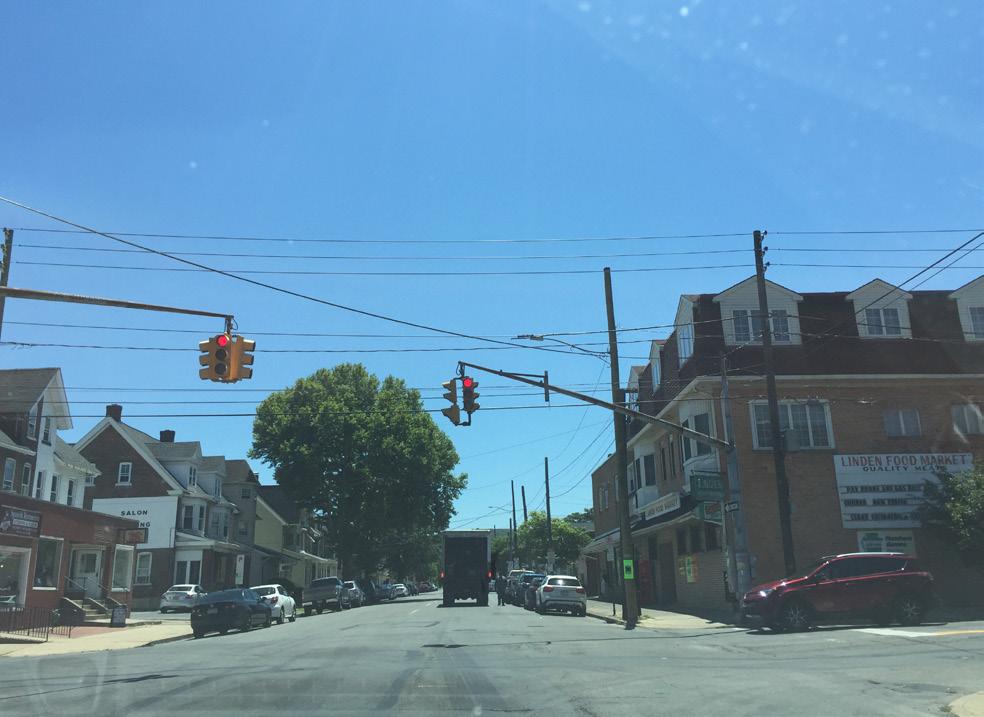
Linden St
Linden St
LINDEN STREET: POTENTIAL IMPROVEMENTS
GREEN INFRA. BUMP-OUTS MEDIAN
BANNERS/SIGNAGE
TWO-WAY TRAFFIC BIKE LANES
signed to generate fast-moving traffic that creates hazards. Addressing these issues through traffic calming strategies like curb bump-outs, raised intersections, and others will reduce safety issues for all modes of transportation.
3. Invest in high quality, highly visible pedestrian safety elements at key intersections.
Many residents expressed concern over poorly-marked but highly frequented street crossings at key intersections, particularly along routes that many children take to get to local schools. Further study is needed to determine what interventions are appropriate at each intersection.
4. Enhance the safety and visibility of Monocacy Trail entrances and expand the network of bike lanes throughout the neighborhood.
The Monocacy Way Trail is an important recreational resource and regional connector for the Northside neighborhood, but access to it is minimal. The trail entrance on Union Boulevard coincides with a highway entrance ramp and is not prominently marked. Enhancing the safety of the entrance for walkers and bikers, and adding trailhead and wayfinding signage, will give the trail a more prominent presence.
5. Continue the pedestrian and bicycle safety public awareness campaign to educate the public about the rights and responsibilities of all modes of travel.
While physical improvements to the safety of the neighborhood’s streetscapes is crucial, it must be complemented with awareness about multimodal safety. The Citizen’s Traffic Advisory Committee is currently developing a citywide public education campaign. These efforts will help support the transformation of the Northside into a more walkable place to live, work, and play.
6. Seek services for a detailed engineering study of traffic and safety impacts of plan strategies.
Since many of these recommendations will entail street and intersection redesign, a more detailed engineering study of affected areas is warranted.
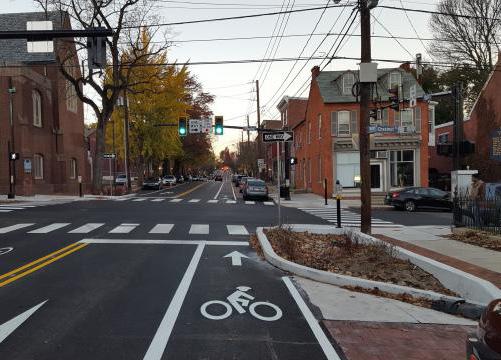
Lancaster, PA
In March 2016, the City of Lancaster commenced the conversion of Mulberry Street into a twoway street. For 40 years, Mulberry Street was a heavily trafficked one-way street and the conversion was proposed to slow down traffic and make the street safer for pedestrians and bicyclists. Work included tree trimming, curb, sidewalk, and ADA curb ramps, stormwater improvements such as rain gardens and porous brick pavers, traffic signal work, traffic markings, and road reconstruction and/or resurfacing.
The project was completed in 2017 and cost $2.7 million. Sources included $750,000 in city funds, plus $675,000 from federal sources and $575,000 from the State of Pennsylvania.
MORAVIAN FIELDS
MORAVIAN COLLEGE
MORAVIAN COLLEGE LIBERTY HIGH SCHOOL
WILLIAM PENN ELEMENTARY
WILLIAM PENN ELEMENTARY
MONOCACY WAY TRAIL
MONOCACY WAY TRAIL
LEGEND
LEGEND
Legend Trail Access
JOHNSTON PARK
JOHNSTON PARK
BOYD SITE
BOYD SITE
LIBERTY HIGH SCHOOL FRIENDSHIP PARK
Legend
Priority safe intersections
Priority safe intersections
Priority safe streets
Priority safe streets
Monocacy Way Trail
Monocacy Way Trail
Street Tree Focus Areas
Plan Boundary
Plan Boundary
Bus Routes Parks and Open Space
Street Tree Focus Areas
Bus Routes Parks and Open Space
Waterways
Waterways
Figure 10. A network of safe intersections will improve walkability. Investments in street trees along identified blocks will enhance the public realm and provide shade and sound buffering.
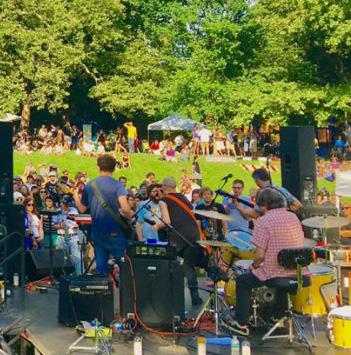
1. Hold regular events and festivals at key public spaces including City Hall Plaza, Friendship Park, and Johnston Park.
The Northside has a number of valuable public spaces within or very close to its boundaries, but they are relatively underutilized. Residents see an immense opportunity to activate these spaces regularly with events, family-oriented activities, and celebrations to both provide opportunities to bring residents together for common activities and to signal that these spaces are available for use on regular days as well. Activating these existing public spaces will enable neighbors to interact as well as bring new visitors to the Northside.
2. Continue to add street trees and street lights on key blocks to create a continuous tree canopy and adequate pedestrian lighting throughout the neighborhood.
Continuous street tree coverage will enhance the aesthetic appeal of the neighborhood, while also providing shade, air quality, and noise
A continuous canopy of street trees not only enhances the visual appeal of a neighborhood, it provides shade, minimizes urban heat island effect, and improves air quality.
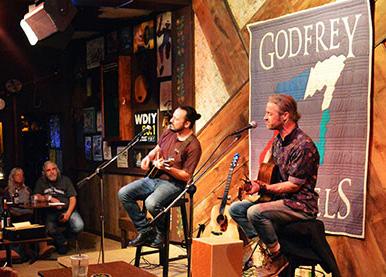
On the First Friday of every month, Bethlehem’s SouthSide Arts District comes to life, celebrating arts, culture and music. Attendees visit local art galleries, clothing boutiques, salons and shops, all while enjoying food and drink samples and specials from establishments like Molly’s Irish Grille & Sports Pub and Southside 313 Bar & Grille. The events also feature a concert series showcasing local musicians throughout the evening within the shops and restaurants of Third and Fourth Streets. The monthly event, which has grown in recent years, brings local residents together over art and culture while also pulling new potential shoppers to the area.
The Community Action Development Corporation of Bethlehem and the City of Bethlehem are collaborating on the revitalization of Friendship Park. Recently, the City was awarded $30,000 in funding from the Keystone Communities program for the first phase of improvements.
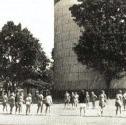
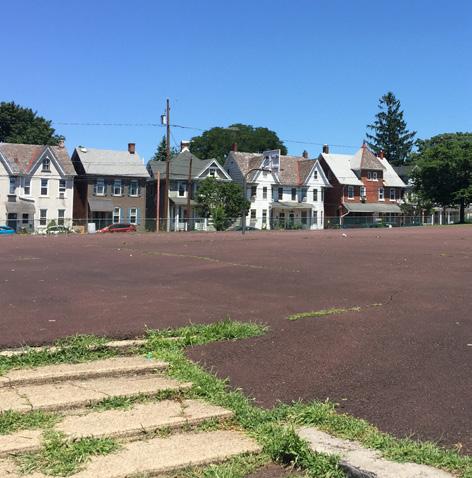
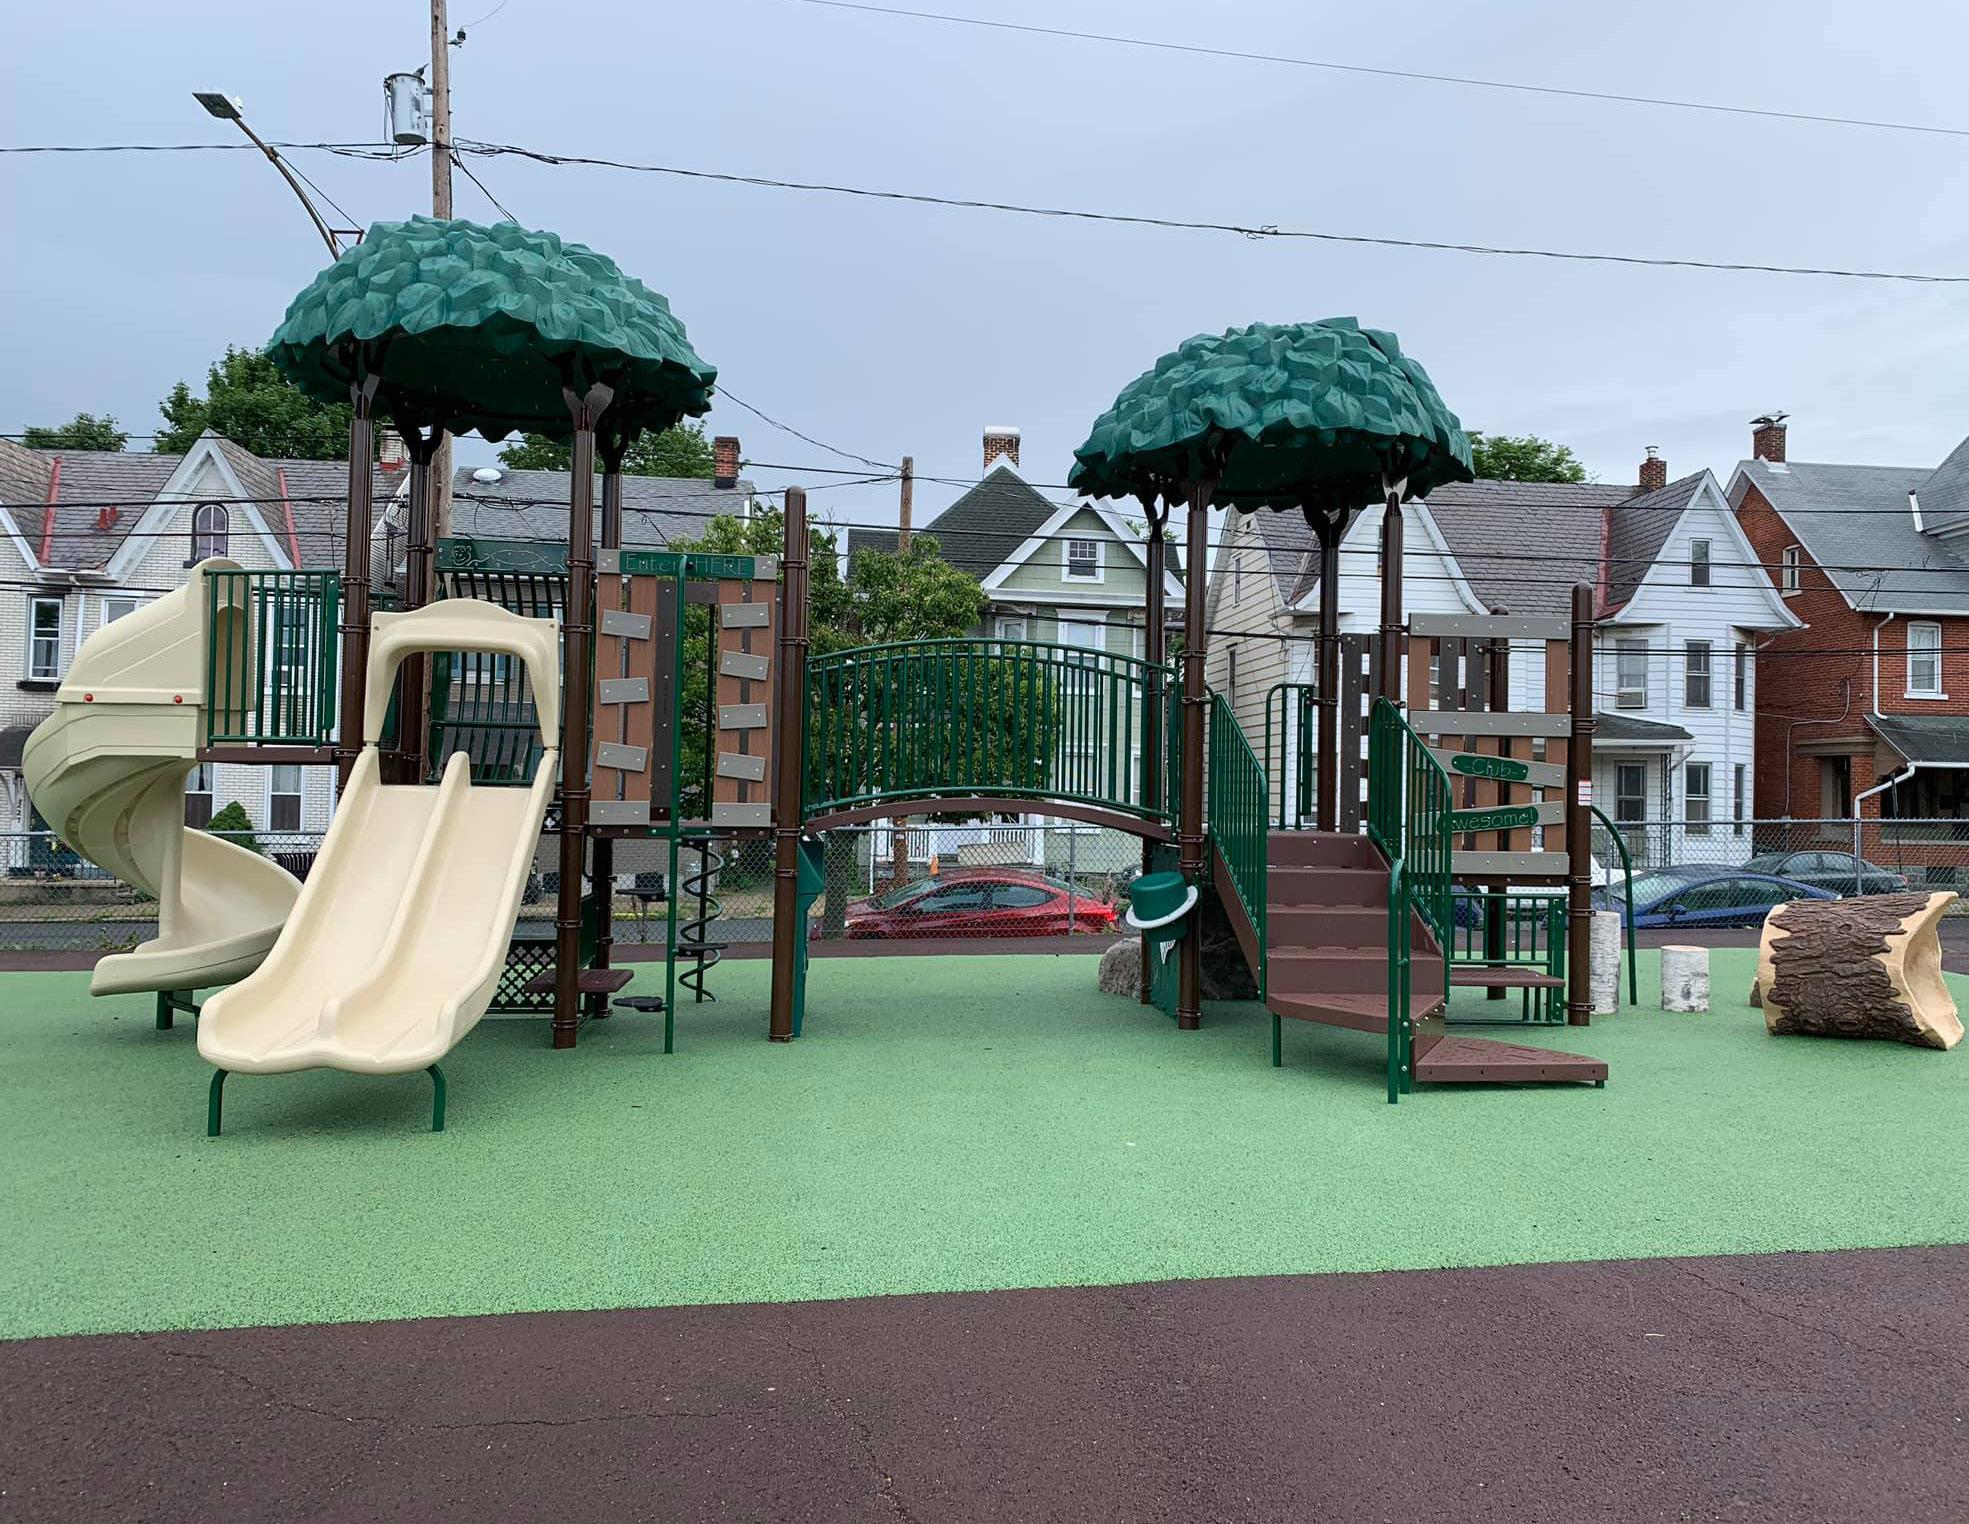
The park began its history in 1872 as “Tank Park,” the site of an early water tower designed to supply water to nearby neighborhoods. Over the years the park served as a cow pasture, a marketplace, and recreational space for residents of the City. In 1965, the water tank was demolished and in the 1970s the park was renovated and renamed Friendship Park. Today, much of the park is covered in asphalt and it is underused by the community. The Friendship Park Revitalization Project will include repairs and restoration work in the park and to its structures and fences, updating the playground equipment (completed summer 2019), and providing landscaping. FRIENDSHIP
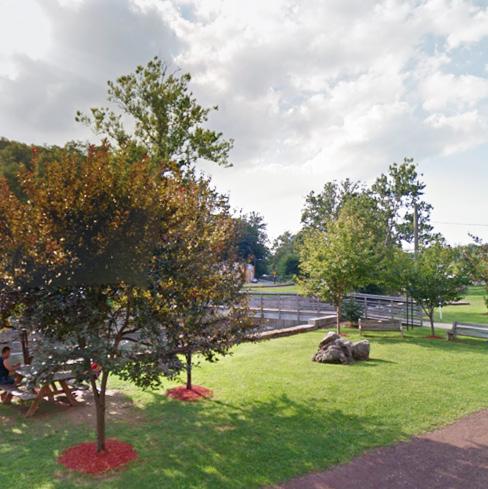
buffering benefits to residents and pedestrians. Consistent street lights will increase the sense of safety as residents and visitors move through the neighborhood.
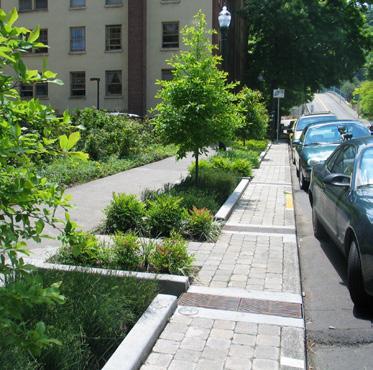
3. Add green elements that may include small gardens and swales to manage stormwater and beautify the neighborhood.
Green stormwater infrastructure (GSI) is increasingly viewed as a best practice when it comes to managing stormwater. It has a low impact on its surroundings by virtue of it being primarily vegetated landscapes, and it also brings with it social and economic benefits. GSI investments are often less costly than traditional gray stormwater infrastructure—which often must be developed at a large scale—and they provide additional neighborhood greening, which improves the overall aesthetics of a place. Distributed GSI throughout a neighborhood will better help mitigate the impacts of storms and flooding as they become more frequent and severe with climate change.
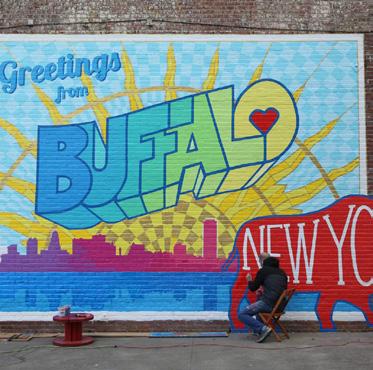
4. Add murals or other public art elements in coordination with neighborhood branding effort.
Murals are an effective way to activate otherwise plain walls and corridors with vibrant art
that reflects the spirit of a community. Public art installations—both temporary and permanent— are also an opportunity to involve local artists to create community-driven projects.
5. Improve visibility and a sense of welcoming at the entrance to Johnston Park along Union Boulevard.
Although Johnston Park is a public open space resource, it is tucked behind private property and lacks prominent signage along the major access point at Union Boulevard. An enhanced gateway to the park will help clarify its purpose as public space and draw more visitors to the banks of Monocacy Creek.
Upgrades to the Northside’s streets, sidewalks, and public spaces will enhance the look of the neighborhood and make it safer and more enjoyable to walk around.
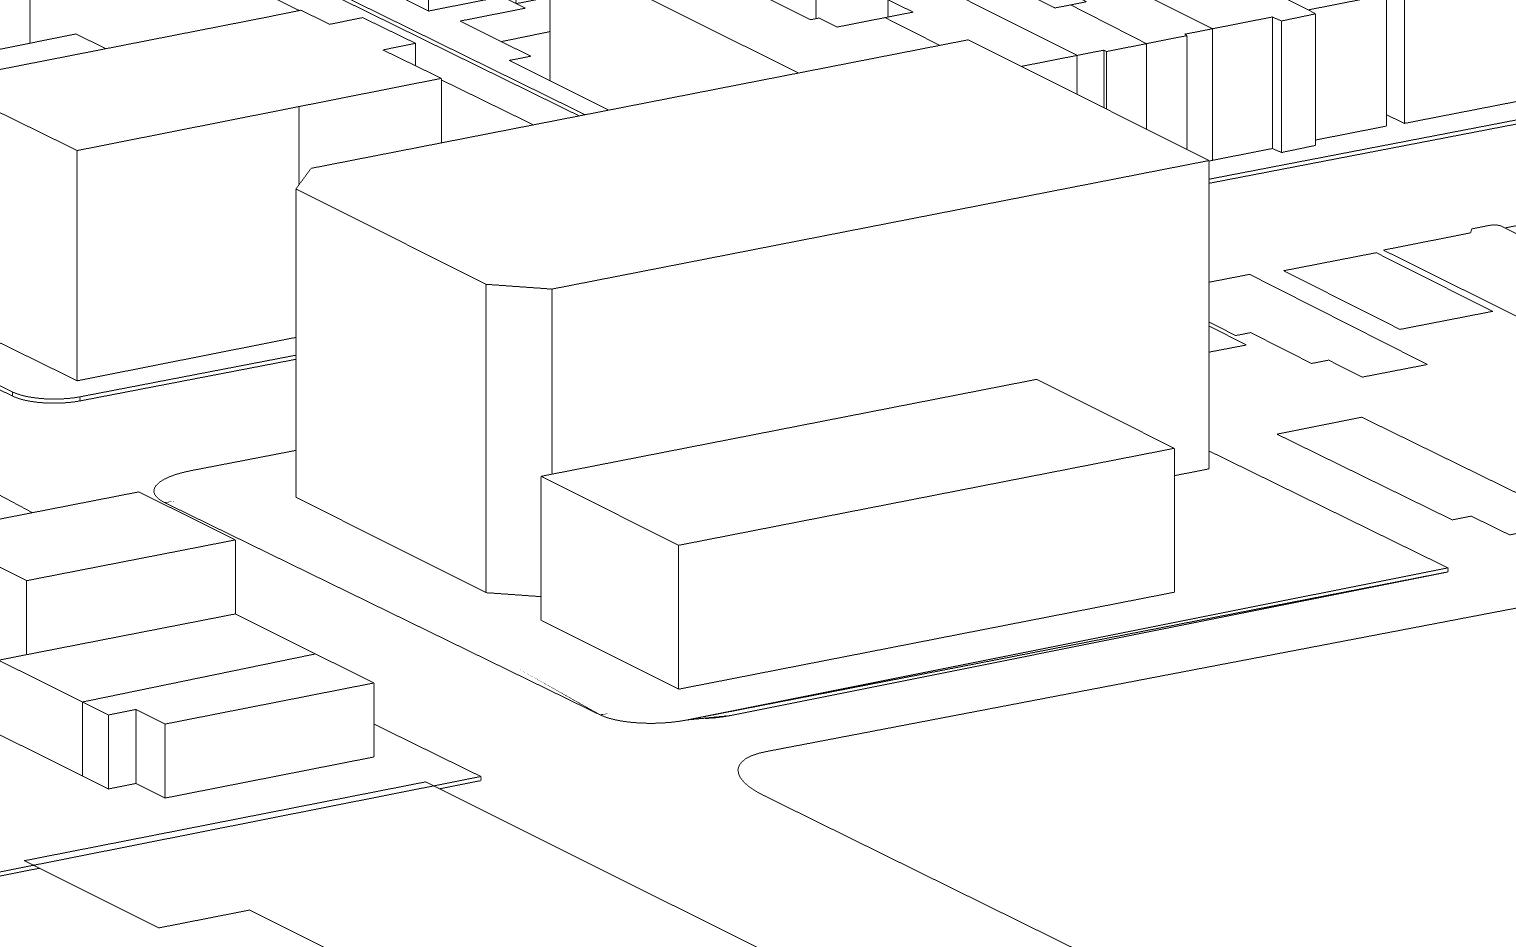



2 The Northside neighborhood benefits from close proximity to Bethlehem’s historic downtown and the buzz of tourists and residents alike enjoying Main Street’s diverse array of shops and restaurants. The energy continues on East Broad Street, but slowly dies off as the corridor continues further east towards Linden Street. One major factor for this die-off is the block of Broad Street (between Guetter and New Streets) that is missing the tree-lined median that other nearby blocks have. It was taken out in order for the block to become a pedestrian plaza in 1974, but was not replaced when the block re-opened to cars in 2002. Also causing stagnation on this block is the former site of the Boyd Theater, which has sat empty since 2011.
Residents have expressed a desire to enliven Broad and Linden as destinations that serve distinct purposes for locals and visitors. There is also a need for greater communication and collaboration between existing businesses.
This topic aims to revitalize the neighborhood’s commercial corridors (Linden and Broad Streets) and attract new businesses through physical and programmatic interventions.
1. Redevelop the Boyd Theater site with a mix of residential and commercial uses.
The much-loved Boyd Theater, in business since 1921, had to be closed in 2011 after sustaining damage in a storm and falling into disrepair. The owner is anxious to start the redevelopment process, turning this vacant spot into a mixeduse destination that has the potential to catalyze further investment in the Northside’s commercial corridors.
2. Explore the potential of working with building owners to implement a redesign of the exterior of 3 W Broad St (Pentamation Building) to create an active facade.
This building’s frontage along Broad Street is a vestige of a prior age of design thinking that did not prioritize the pedestrian experience, with blank walls and sunken store entrances. Working with the property owner to update the building to create more active street frontage will help revitalize this block of Broad Street.
3. Add a tree-lined median to Broad St between Guetter and New Streets to fill a gap in the median along the tourist and dining destination section of the corridor.
As a vestige of this block’s previous iteration as a pedestrianized plaza, the tree-lined median is missing despite it occurring on the surrounding blocks of Broad Street. Restoring the median will give Broad the feeling of a cohesive boulevard, as it was intended.
4. Add additional pedestrian amenities, such as benches, and greening elements, such as planter boxes, to enliven the corridor and continue the aesthetic momentum from Main Street.
Adding gracious amenities to the neighborhood’s commercial corridors will establish them as places to be, places to gather, and places where interesting things happen, rather than streets to merely pass through. Several business owners have taken it upon themselves to add seating and planters outside their doors.
RECOMMENDED IMPROVEMENTS TO BROAD STREET
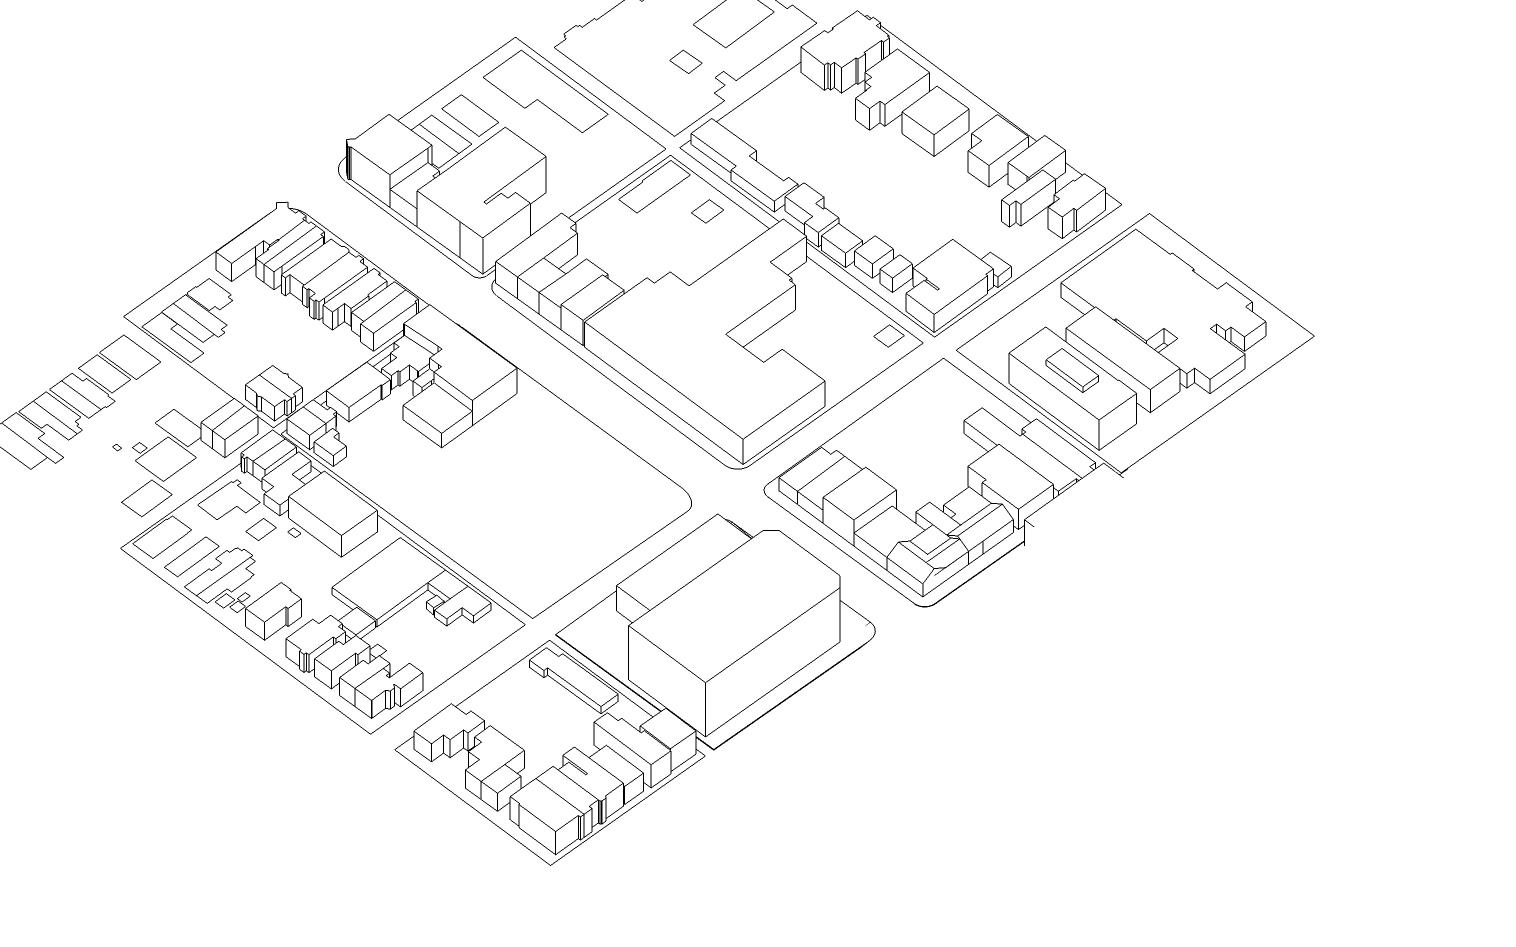
STREETSCAPE IMPROVEMENTS
TREE-LINED MEDIAN

BOYD SITE REDEVELOPMENT
IMPROVED BUILDING FACADE
SIGNAGE/WAYFINDING
BUMP-OUTS/SAFE CROSSINGS


1. Add additional pedestrian amenities, such as benches, and greening elements, such as planter boxes, to enliven the corridor and signify its role as a destination in the neighborhood.
Linden Street currently has minimal amenities in terms of benches, trash cans, or aesthetic improvements. Adding these elements, in addition to signage and consistent street trees, will greatly improve the quality of the corridor and help it become a destination.
2. Consider branding Linden Street through physical and programmatic interventions.
The Linden Street commercial corridor is anchored by a number of businesses catering to the surrounding community as well as restaurants serving cuisine from various cultures. Formalizing this organic co-location of shops into a branded corridor would elevate Linden Street’s prominence as a destination and create opportunities for placemaking and special events tied to this new designation.
In 2017, Providence’s Mayor and other community leaders announced a $4.3 million investment into their Broad Street Corridor in an effort to re-brand it as the city’s Latino cultural corridor. The project involves a partnership between the city, Department of Public Works, Department of Art, Culture + Tourism, and Rhode Island Latino Arts for expanded art, cultural, and tourism investments. They include bike and pedestrian safety improvements, creative placemaking, and cultural tourism initiatives. $1.3 million is dedicated to a creative placemaking partnership that includes public arts programming with local students. Goals include celebrating cultural heritage, improving quality of life, fostering thriving businesses, and incorporating better maintenance of the physical environment of the neighborhood.
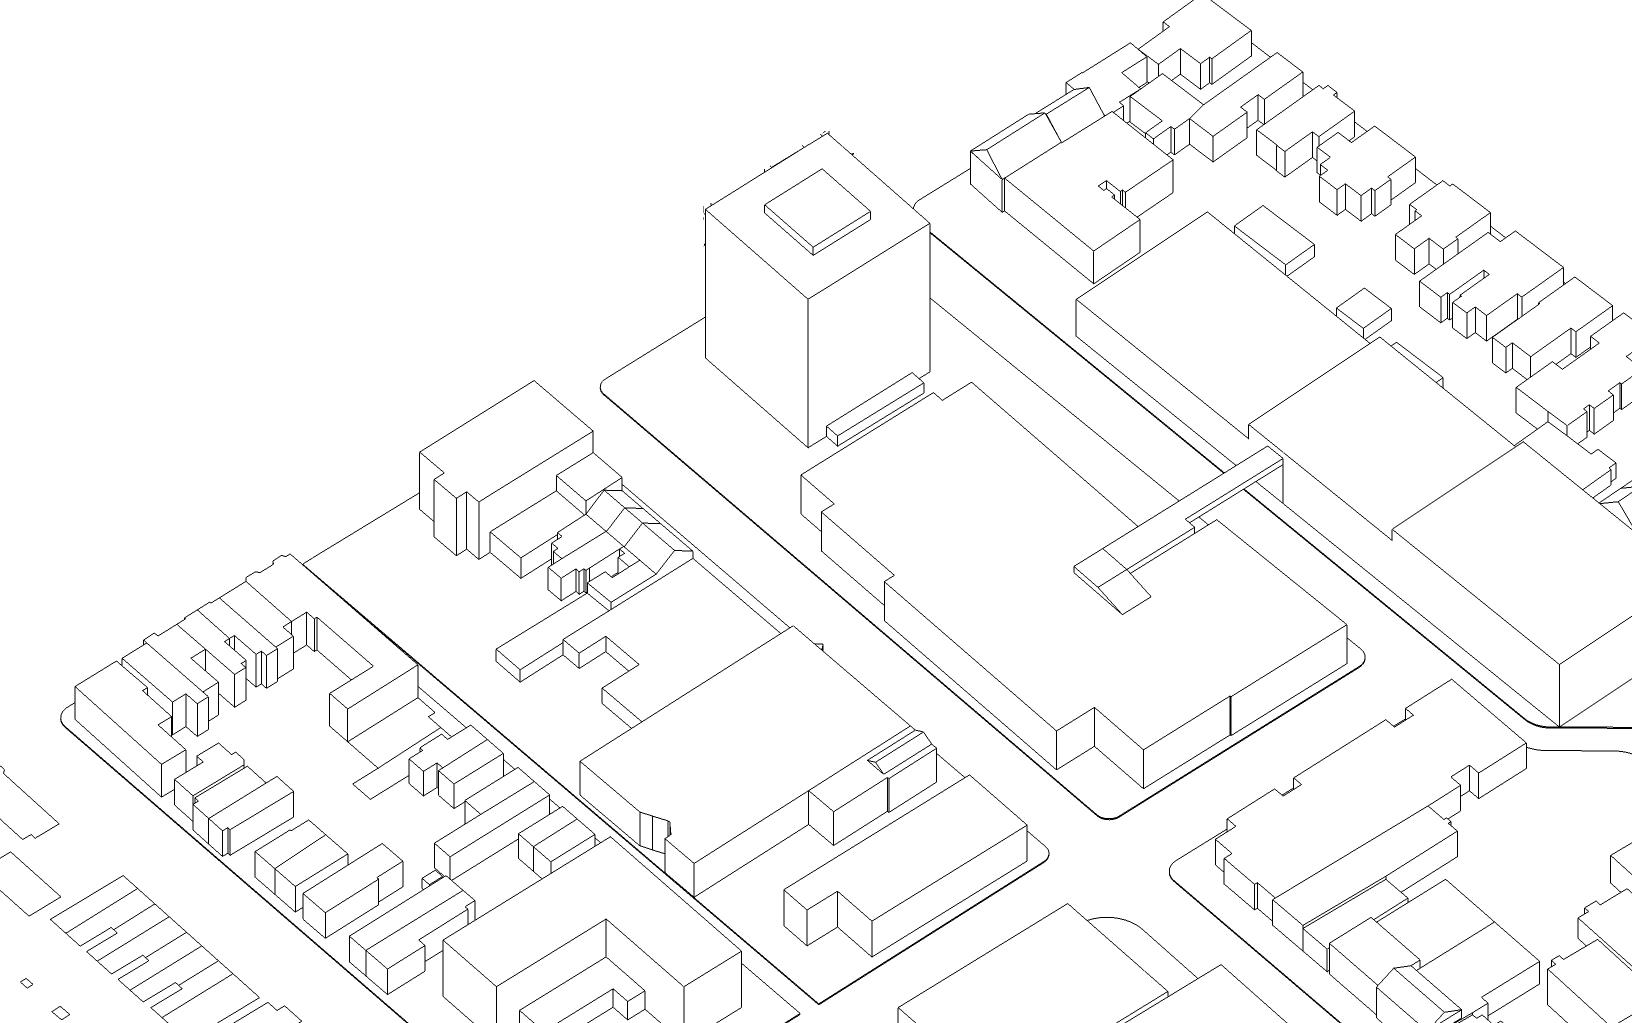
RECOMMENDED IMPROVEMENTS TO LINDEN STREET
ENHANCED LINDEN-TO-PARK CONNECTIONS
REVITALIZED FRIENDSHIP PARK
FRIENDSHIP PARK
POTENTIAL MURAL SITES


SIGNAGE/WAYFINDING
BUMP-OUTS/SAFE CROSSINGS
CONTINUOUS STREET TREES

IMPROVED BUILDING FACADES

LINDEN ST

PARKING LOT EDGE IMPROVEMENTS
STREETSCAPE IMPROVEMENTS
TWO-WAY TRAFFIC
3. Explore opportunities for special events along the corridor to showcase businesses and restaurants.
Street festivals, with a section of a corridor temporarily closed to vehicular traffic and converted into a linear pedestrian plaza, are a powerful placemaking tool. Semi-regular community events, such as street festivals focused around a cultural holiday or food, will bring additional attention and foot traffic to Linden Street, and may introduce residents and visitors to shops and restaurants that they will come back to in the future.
4. Reinforce the proximity of Linden Street and Friendship Park through streetscape improvements and coordination between the park and nearby businesses.
Friendship Park is mere steps away from Linden Street, yet when one is in either place there is no clear sense that you are near the other. Tying these two assets together through design— such as specially paved sidewalks, public art, signage—and programming—such as picnics catered by Linden businesses—will help create a stronger neighborhood hub in this area.
Block parties, cultural or music festivals, and street fairs are fun ways to attract residents and visitors to the neighborhood’s commercial corridors, while also helping to establish an identity for the area.
1. Work with business owners and property owners in order to increase awareness of helpful programs and create a collaborative atmosphere on issues like code enforcement.
Fortunately, the neighborhood’s commercial corridors have very high occupancy rates, with only a few scattered empty storefronts. But business owners have expressed that attracting patrons can be a challenge and that they would benefit from increased attention and support from City agencies and related partners. Particularly helpful to this endeavor will be the City’s Business Attraction & Retention staff, who are dedicated to assisting business owners with the resources they need to thrive in Bethlehem.
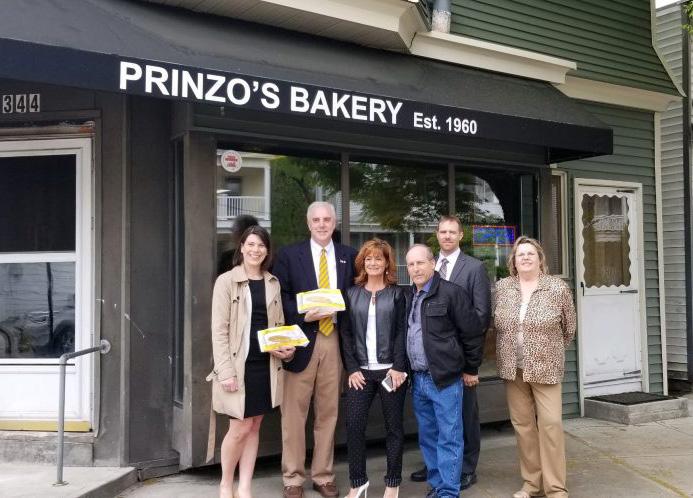
2. Expand and strengthen commercial façade improvement and upkeep incentive programs.
The City’s existing facade improvement program for commercial buildings has had very few participants since it began in 2018. The program matches a business owner’s own funds up to
Residents have expressed a desire for more varied dining and shopping options along the local commercial streets. The Northside could be an attractive place for a new business to set up shop.
The City of Albany Small Business Facade Improvement Program was first launched in 2016 and is now in its third round of funding. Each round, up to $100,000 is disbursed to applicants as a 50% matching grant of up to $10,000 per store owner. Administered by Capitalize Albany Corporation, the program is made possible with funding from the Albany Community Development Agency and the City of Albany Capital Resource Corporation. Grant administrators also assist grant recipients with identifying available finance options for their part of the total cost of the improvements.
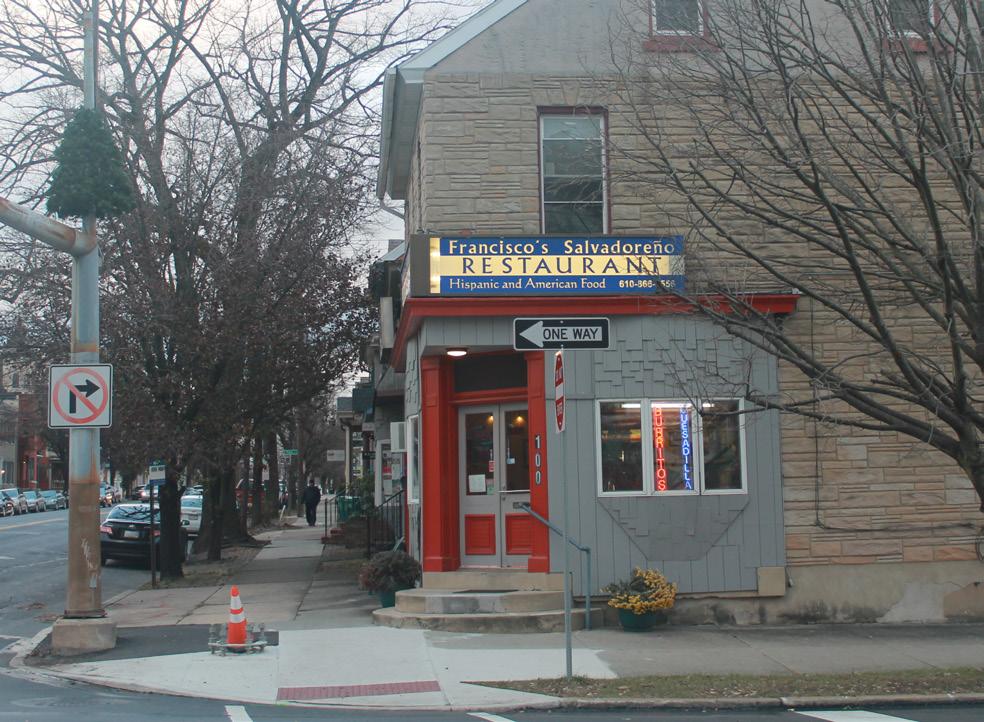
$5,000 per property. Business owners are also required to solicit three written quotes estimating the cost of the planned upgrades. While these elements of the program are set by grant requirements, there are additional ways the City could encourage more participation. These include seeking out additional funding resources to increase the maximum award to each business, creating a fund to assist business owners who may struggle to match the grant with their own funds, and strategically linking interested businesses with local contracting firms to more easily receive quotes for needed improvements.
3. Create a Northside business association to enhance coordination between businesses.
Northside businesses have expressed interest in having a more formalized organization to achieve common goals and market the area to potential patrons. Lessons can be learned from other business associations throughout Bethlehem, which have had success with initiatives such as music and food events, branded communication materials, corporate sponsorships, and physical improvements to their focus areas.
4. Encourage the placement of fresh food amenities in or conveniently close to the neighborhood.
One of the chief concerns of Northside residents is the lack of day-to-day convenience amenities located within reasonable walking distance of where they live. Most residents must drive to get groceries, despite being such a well-connected neighborhood close to downtown. Bringing a grocery store to the Northside will make it an even more attractive place for families to live.
Residents feel strongly about preventing the neighborhood from reaching a tipping point of declining quality of both housing and neighborhood aesthetics. They stressed the need for targeted interventions in specific areas within the neighborhood, more support for struggling renters and homeowners, and building a culture of neighborliness wherein people pitch in to help each other maintain and improve their homes. Because there are relatively low levels of vacant land, abandoned buildings, or seriously blighted houses, the overarching goal of this plan’s housing strategies is to preserve and improve the quality of existing housing stock rather than an emphasis on brand new development.
With a complex set of issues and opportunities facing the City of Bethlehem’s housing market, utilizing the Market Value Analysis as a basis for this plan was key to creating a set of targeted strategies to address both quality of life and market stabilization. This topic outlines a data-driven plan to support both renters and homeowners by improving existing housing stock, preserving affordability, and addressing quality of life issues. Most strategies will be initially focused in specific sub-areas of the neighborhood where they will have the most impact, with the possibility of expansion to the entire neighborhood and other parts of the city in the long term (see maps on page 56).
1. Create a paper and online directory of resources available to both homeowners and renters.
At community meetings, some Northside homeowners mentioned feeling overwhelmed by the prospect of seeking repairs – how to prioritize, how to finance, how to find a reliable contractor, and so on. Other residents noted that the elderly and other less mobile residents might have difficulty performing basic maintenance. There was broad interest in a resource guide, to be made available in hard copy and online, that would provide basic information and contact information for a range of service providers ranging from volunteers who can shovel snow in the winter to contractors and city loan programs
2. Expand and promote grant, loan, and tax incentives for home and property repairs, maintenance, and energy efficiency for homeowners.
Focusing repair activity in the weak market blocks just outside the strongest market area (sub-area 9) could yield high return on invest-
ment in the form of increased assessed values and tax revenue as proximity to strength unlocks nascent value.
3. Create a landlord repair loan fund to incentivize property owners to improve quality of rental housing.
As the rate of rental properties increases due to market forces and the needs of nearby college students, there is a growing concern about the quality of rental housing stock. Initially focusing this resource in sub-areas 1 and 2, in particular in the blocks between Main, Spruce, New, and North Streets, will improve quality where it’s most needed and catalyze improvements in surrounding areas.
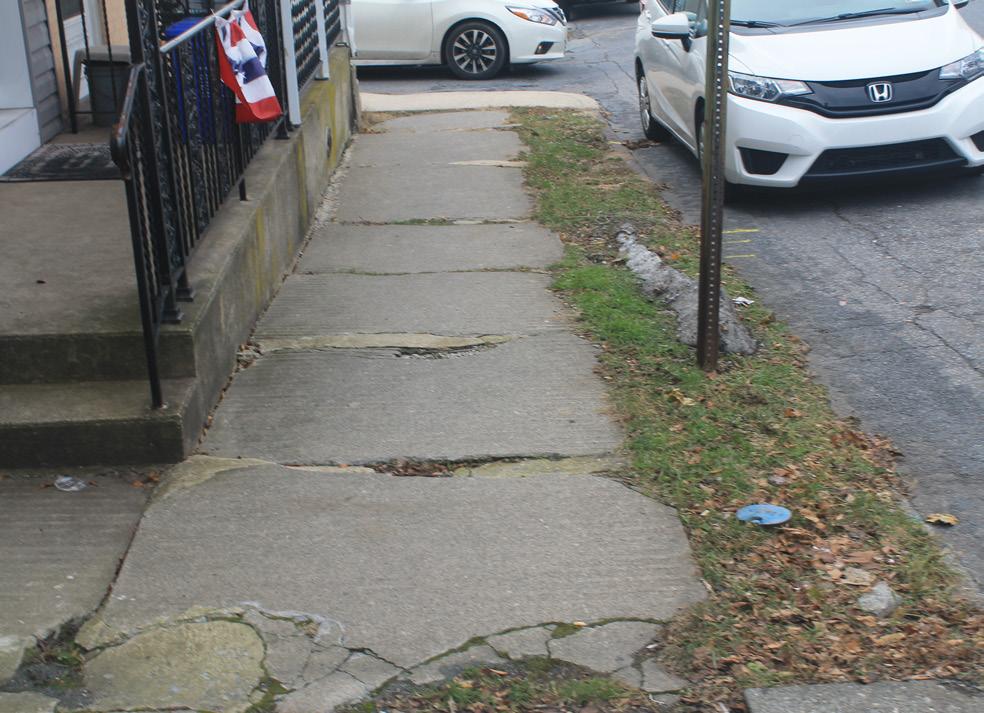
4. Expand and promote “carrot and stick” measures to encourage property owners to improve damaged sidewalks.
Sidewalk conditions throughout the neighborhood are of particular concern to residents. In
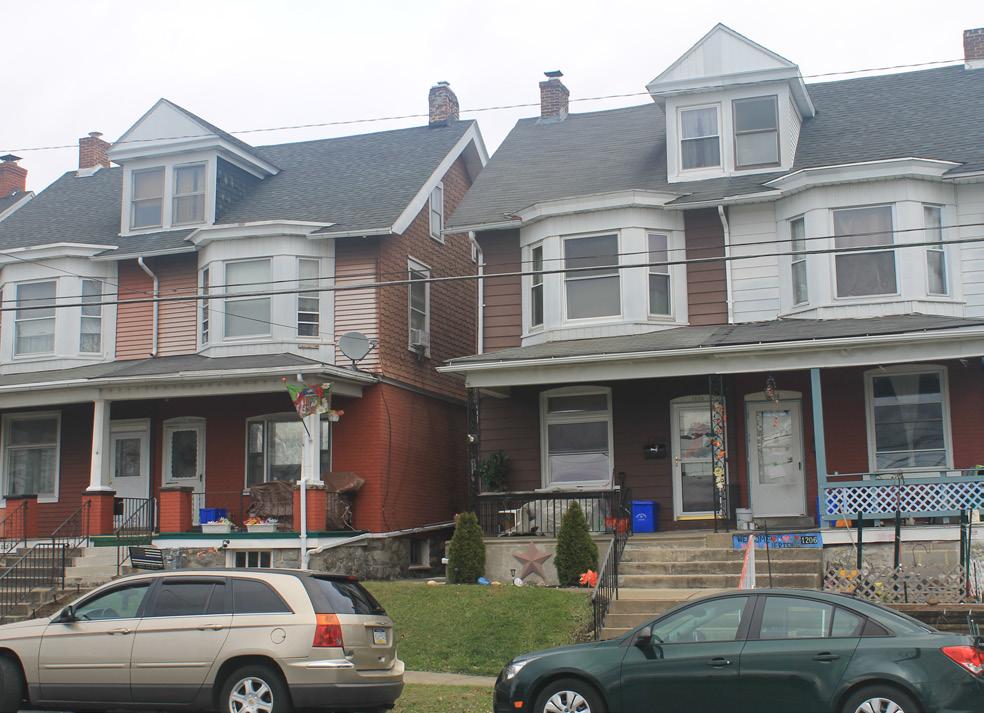
Many homeowners and renters in the Northside might struggle to afford necessary upkeep to their property but do not qualify for existing programs aimed at lower-income residents.

the service of creating a walkable neighborhood, it is crucial that the sidewalks be well-kept. Sidewalk maintenance is the responsibility of the individual property owner, therefore, the City will strategically employ the incentive and enforcement measures at its disposal to encourage the timely repair of broken or damaged sidewalks.
5. Expand foreclosure prevention activities to help residents stay in their homes.
As property values increase, some homeowners have and will continue to struggle to stay in their homes. Foreclosure prevention measures are best in areas with high homeownership and strong to moderate market conditions, in order to prevent those markets from weakening. Existing foreclosure prevention measures include a foreclosure diversion and mitigation program offered by Community Action Financial Services in South Bethlehem. This program, which is offered to area homeowners at no cost to them, has been extremely successful in other parts of the city.
6. Expand resources to help home buyers with selecting, purchasing, and financing a home.
Affordable homeownership opportunities are part of the Northside’s biggest strengths and
major attraction for first-time home buyers hoping to set down roots in a community. Ensuring the home buying process—before, during, and after—is clear and straightforward will help further stabilize the neighborhood. Credit counseling and down payment assistance grants are particularly impactful in areas with low to moderate vacancy to stabilize homeownership rates.
7. Support responsible landlords by providing technical assistance and helping them acquire distressed properties in the neighborhood.
As absentee landlords become a growing concern for residents, the City can step in to encourage those who are doing a good job. Assisting mission-driven individuals and organizations to acquire properties and providing repair subsidies that come with rental restrictions can help preserve existing affordable options in the Northside.
MVA MARKET TYPES
The majority of the housing strategies recommended in this plan will be most effective if initially deployed in specific sub-areas of the neighborhood, with the potential to expand at the City’s discretion. The Northside has been divided into 9 sub-areas based on Census block groups. These sub-areas share similar characteristics and will each be strengthened by a unique combination of strategies.
HOMEBUYER ASSISTANCE
HOMEOWNER REPAIR AND REHAB
TARGETED CODE ENFORCEMENT
TARGETED LANDLORD REPAIR LOANS
HOME REPAIR TAX INCENTIVES
RESPONSIBLE LANDLORD ASSISTANCE
FORECLOSURE PREVENTION
1. Enhance code enforcement in key sub-areas to promote good stewardship of homes by absentee landlords.
Residents have expressed concern over the lack of oversight of problematic properties, and their concerns are backed up by the data, which shows concentrations of investor-owned properties in certain parts of the neighborhood. The City should provide targeted support to these areas through heightened code enforcement, which can lead to conversations with property owners on what they may need to be able to keep up their properties.
2. Enhance City enforcement of quality of life ticketing through a 6 to 12 month pilot program in key sub-areas.
This is a relatively low-cost way to address code violations as part of a data-driven, strategic code enforcement process. The goal is to eliminate unsightly conditions on the exteriors of properties – such as high weeds and grass, trash,
and abandoned vehicles, appliances, or furniture – that violate specific requirements of the City’s property maintenance code. When code inspectors find a property violation, they issue a courtesy notice to the property owner in the form of a ticket or door hanger notice, along with a deadline for corrective action.
3. Identify and prioritize opportunity sites for rehabilitation or demolition of blighted properties in the neighborhood.
The City should prioritize the revitalization of certified blighted properties located throughout the neighborhood. These could be targets for rehab (particularly for properties where existing strength in nearby areas increases the likelihood of redevelopment success) or demolition if re-use is unlikely or safety is a major concern. Cleared sites can be transformed to side yards, vacant lots for sale/redevelopment, or open spaces for recreational use.
4. Work with trash haulers to coordinate services and implement zone hauling.
The constant presence of trash and recycling on sidewalks and dozens of trash trucks circulating through the neighborhood each day is a detriment to quality of life and the attractiveness of the Northside to potential residents. There was a strong consensus among residents that they are interested in implementing zone hauling, as has been done in other parts of Bethlehem, to reduce the number of trash trucks out on the streets on a given day.
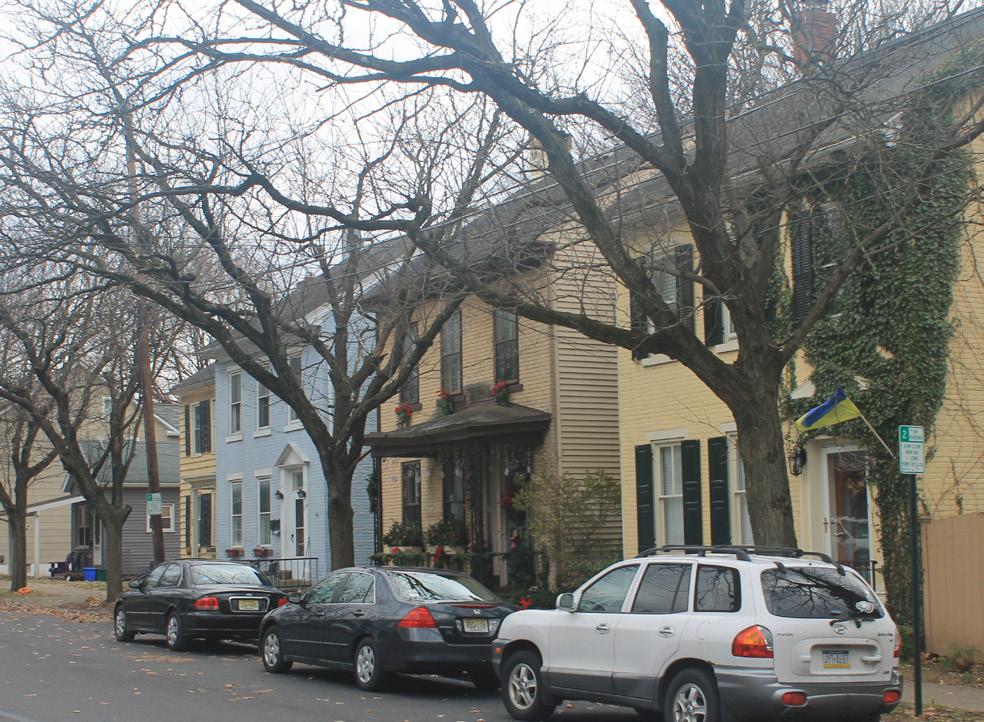
Northside residents love their neighborhood but recognize that more attention needs to be paid to basic things like sidewalk quality and cleanliness to make living here more enjoyable and desirable.
VOLUNTEER HOME REPAIR EFFORTS
CONTINUOUS STREET TREES
HOUSING INVESTMENTS
WELL-MAINTAINED FRONT YARDS
FACADE IMPROVEMENTS
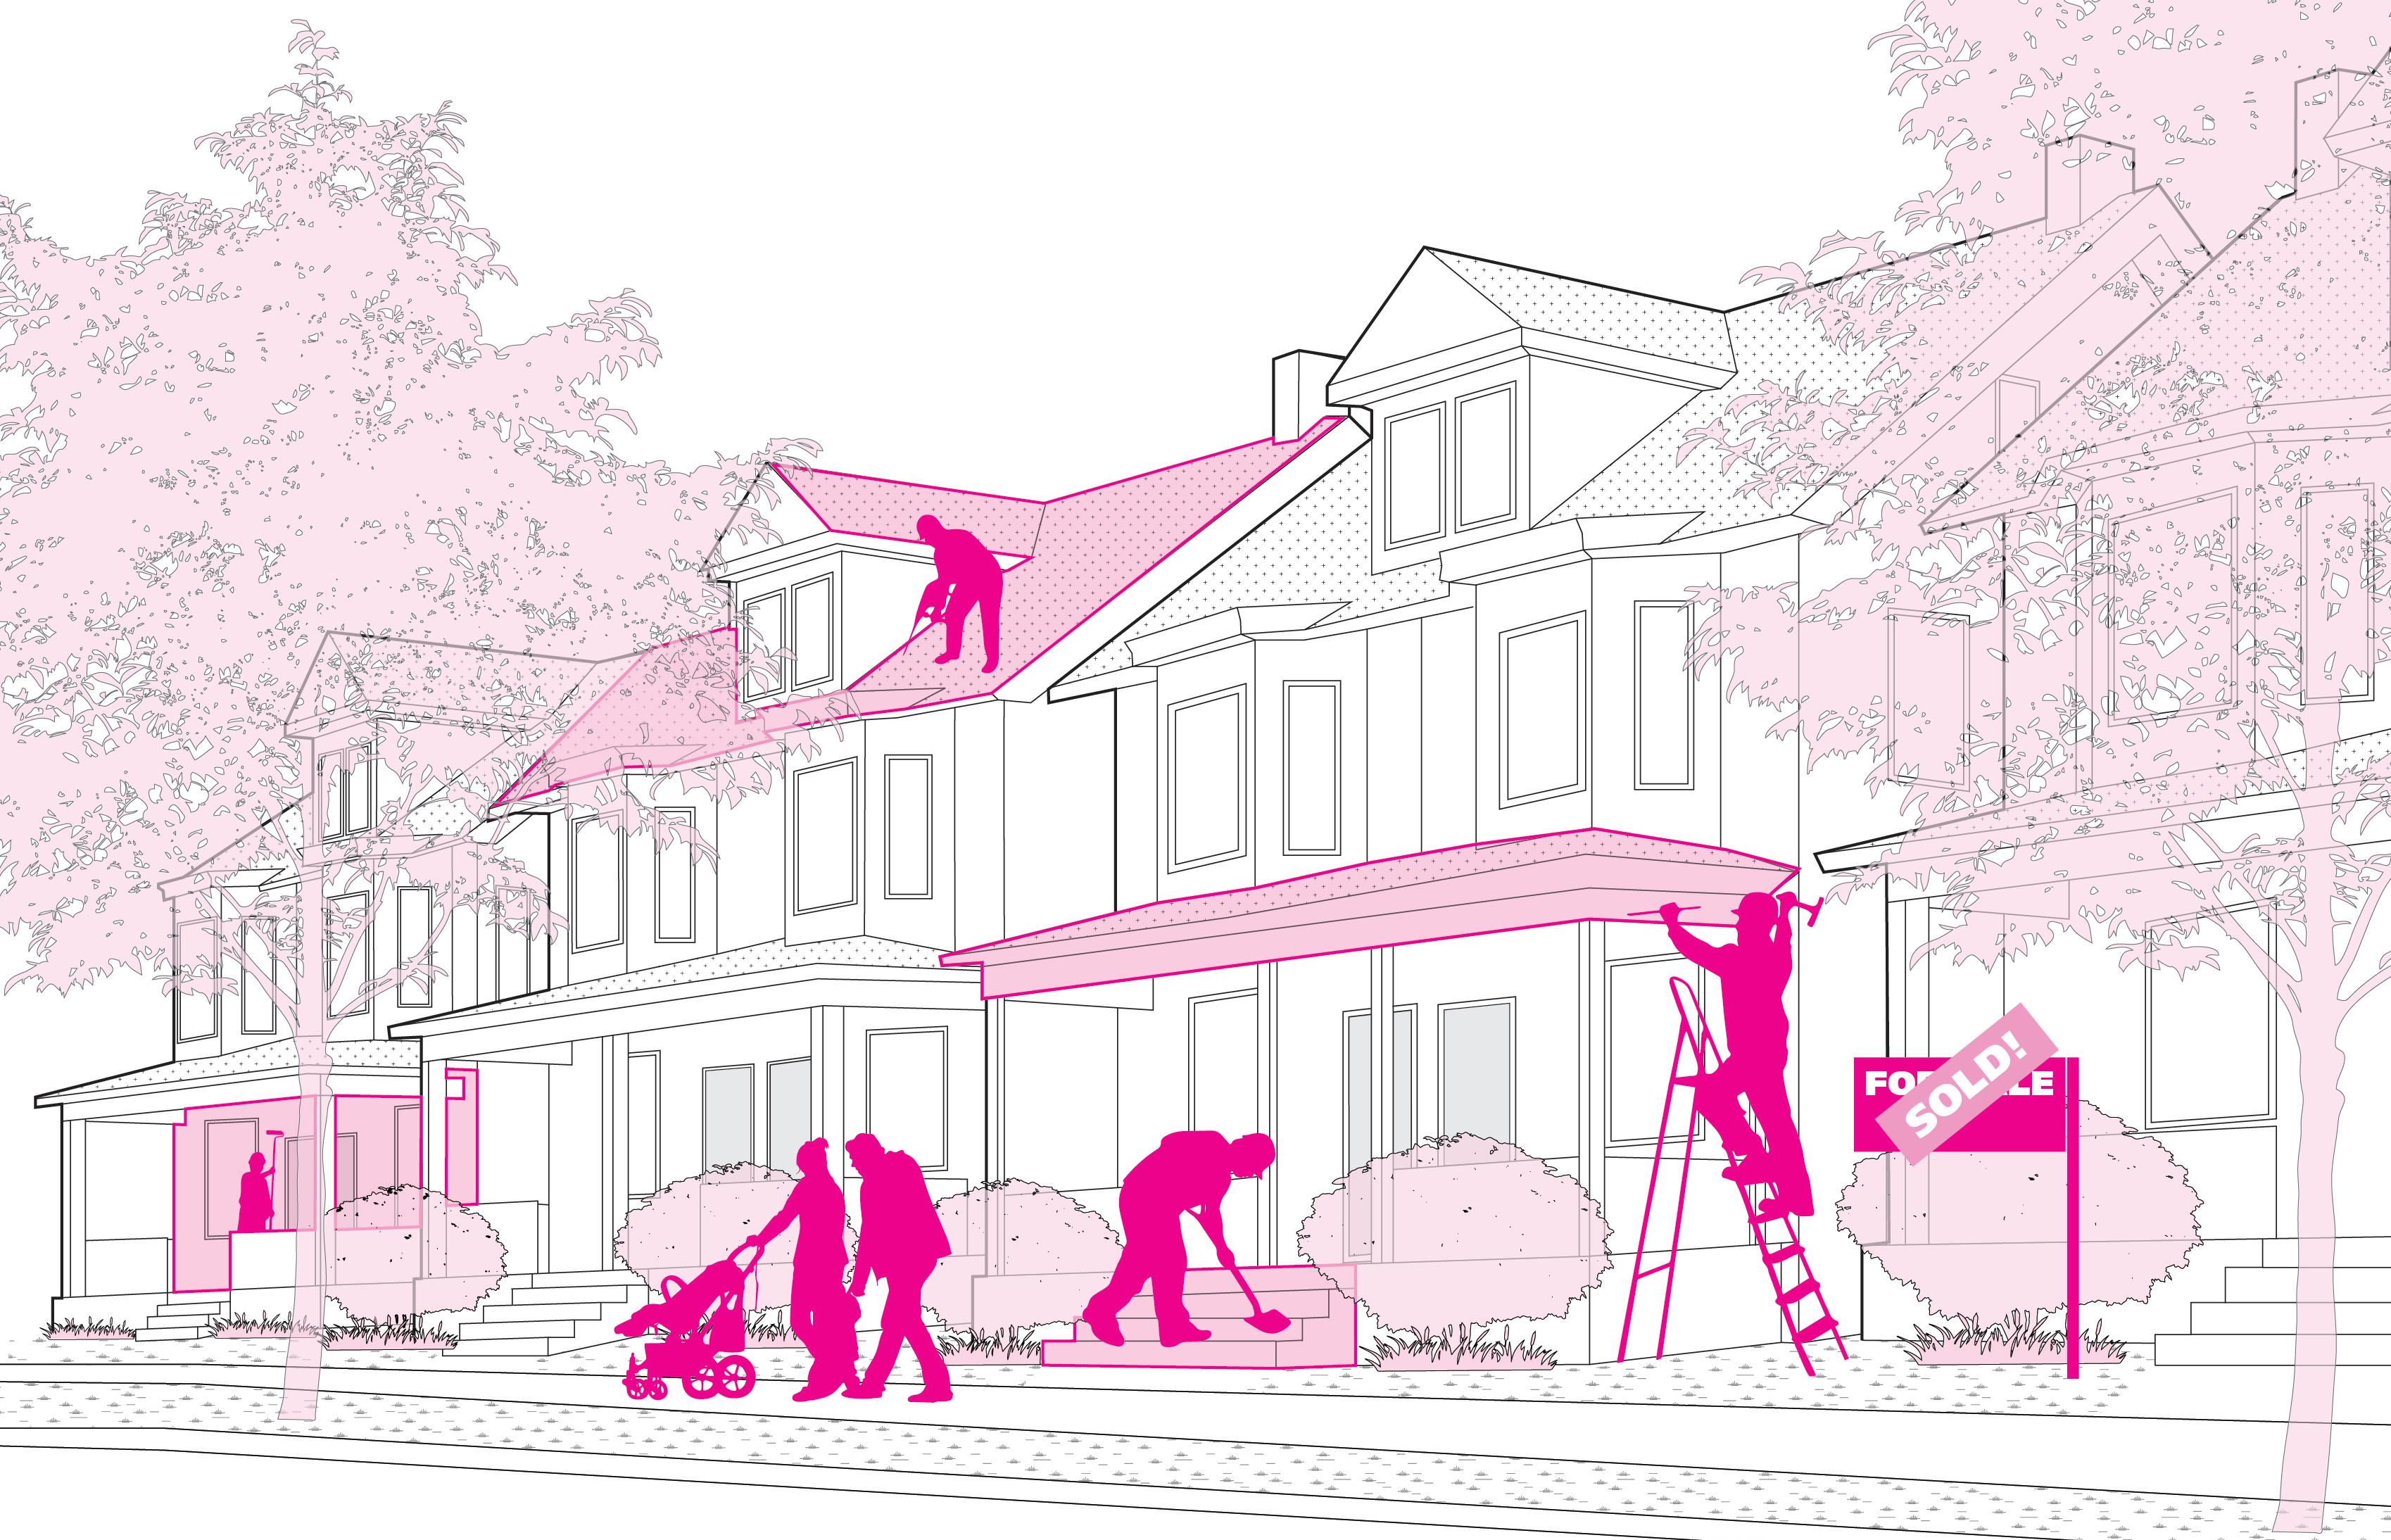
HOMEOWNERSHIP OPPORTUNITIES
As a “middle neighborhood,” the Northside is sometimes overlooked when it comes to supportive services. Northside residents expressed the need for more access to services such as child care and mental health resources in recognition that their neighbors sometimes need support in order to improve their lives. They also felt it will make the Northside a more convenient place to settle down, with more amenities and services within close proximity.
A number of key resources already exist in the neighborhood, such as William Penn Elementary, which functions as a community school with a suite of services available to all residents (see page 62). Additionally, nearby institutions such as Moravian College have been actively engaging and supporting residents, particularly children, through mentoring and other partnerships. These key anchors are willing and able to expand their work in the neighborhood to create a culture of support.
This set of strategies aims to enable the City and its partners to expand the availability and awareness of services that can help residents thrive and create a culture of support, neighborliness, and volunteerism.
1. Expand high quality early education options in the neighborhood.
Bethlehem Area School District offers pre-K in a number of elementary schools throughout the city, but it is currently not offered at the Northside’s local schools. Exploring the options for expanded early education programs with BASD as well as private providers will help create another amenity that young families look for in a neighborhood.
2. Expand availability of high quality before and after school programs in coordination with partner organizations.
Respondents to the neighborhood services survey ranked this need as one of their top priorities. By building off of local resources such as William Penn and Thomas Jefferson Elementary Schools and the YMCA, and exploring collaboration with additional partners in the region, enriching before and after school programs can be expanded to serve a larger segment of the neighborhood’s school children.
3. Expand programs to enrich youth and help them prepare their post-high school plans.
Northside residents are concerned with the support and future career exposure available to the neighborhood’s youth, especially as the area seeks to become more well known as a great place for families to stay long-term. Expanding upon existing partnerships, such as that between Liberty High School and Moravian College, as well as building new partnerships with organizations from around the region will ensure Northside youth are poised for a bright future.
4. Expand availability of affordable childcare options during work hours.
Access to childcare is often cited as a challenge for working families; in the Northside, it was the top choice for employment needs in the neighborhood services survey. Expanding child care resources in the neighborhood—particularly beyond the typical 9-5 work day schedule—will help families thrive and will attract new families to put down roots.
The City of Bethlehem offers access to mental health resources and services to residents and surrounding communities through mental health facilities and mobile health clinics. The mental health facilities are associated with local hospital systems such as St. Luke’s Hospital and Lehigh Valley Hospital- Muhlenberg. In addition, mobile health clinic initiatives by Highmark Health Care (“Healthcare on the Go”) and Evangelical Community Hospital (Mobile Health of Evangelical”) serve the Lehigh Valley by increasing patient access in areas with low patient-to-doctor catchment areas.

5. Expand access to mental health resources and services.
While the city of Bethlehem has a number of mental health providers (see callout), residents have expressed a need for better access and support. Working with existing providers and mobile health clinics to expand or adjust their outreach and availability will ensure better coverage of the Northside population.
6. Expand community resources to help families experiencing homelessness.
As transiency has increased in the Northside, so has the risk of families and individuals becoming homeless. While there are many reasons for homelessness, a common one in this area is an inability to keep up with rent or mortgage payments. Existing programs include rental assistance offered by Salvation Army, Lehigh Valley Conference of Churches, and Catholic Charities. In addition, Community Action Financial Services assists homeowners in communicating with their lenders in the case of missed or late payments. To improve quality of life for vulnerable citizens the City should expand its strategic support for residents and families at risk of losing their home or who have already done so.
7. Explore implementation of public Wi-Fi anchored by neighborhood assets.
Public Wi-Fi throughout the neighborhood can be a useful amenity for residents as well as an economic development tool. Providing internet access at key neighborhood hubs, such as the school buildings, will further cement the Northside’s vision as a great and convenient place for residents to live, work, and play.
Enabling residents to easily find convenient, affordable childcare options that fit with their work schedule will make the Northside a more attractive place for families.
ELEMENTARY
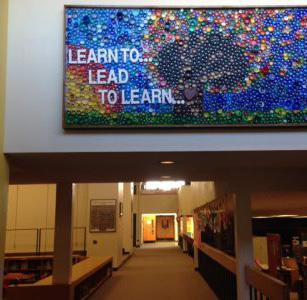
William Penn is a community school, which means it offers a variety of resources to the neighborhood in addition to being a school during daytime hours. Be sure you know about all they have to offer and spread the word to neighbors who could benefit from these services.
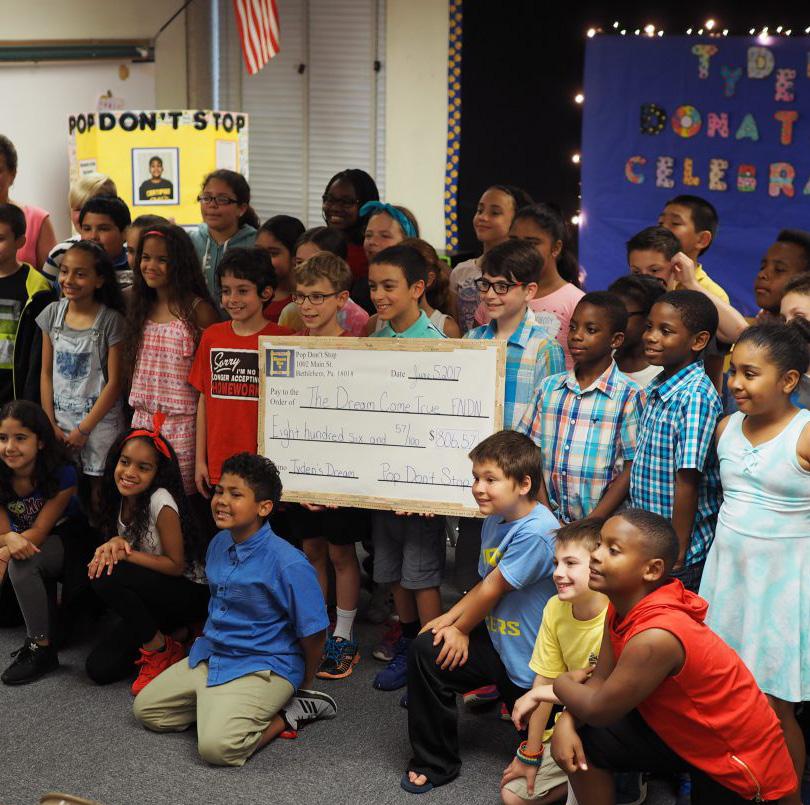
RAISING FUNDS AND AWARENESS
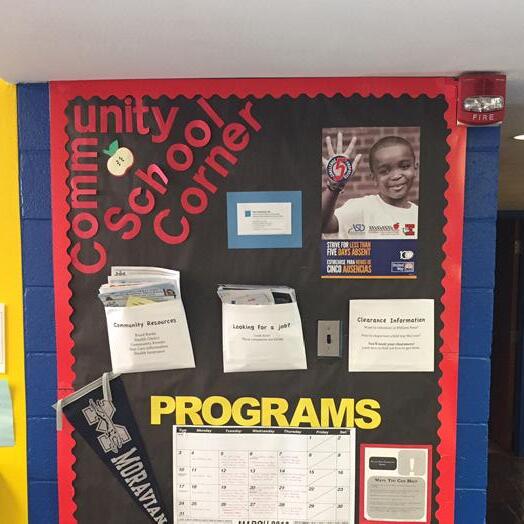
FAMILY SERVICES
Via Valley Youth House and Pinebrook Family Services
Family Support Services
Job search, resume writing, housing/homelessness prevention, legal services
St. Luke’s Vision Van
Vision care vouchers
Clothing Closet
Free clothing open to anyone in need
Toiletries & School Supplies Pantry
Open to anyone in need
Food Pantry
Open to anyone in need
Backpack Buddies
Backpacks with food sent home on Fridays
HEALTH/WELLNESS/FOOD ENRICHMENT
Mentoring Program
Mentoring with Moravian College students and retired teachers
Summer Programs
Academic, sports, and creative programming to engage students and prevent the “summer slide”
Partial list: homework help, yoga, cooking, gardening, run club, technology, strengthening families, art, sports, reading
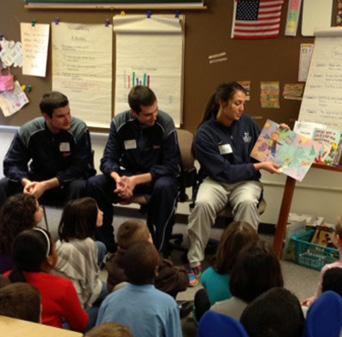
One of the Northside neighborhood’s major assets is a strong existing network of volunteering and partnerships between local anchors. One example of this is Moravian College’s commitment to volunteering and mentorship programs in local schools, including William Penn Elementary and Liberty High School.
The school-based mentoring program places Moravian students with individual mentees at William Penn Elementary, with weekly meetings for the entirety of the academic year.
These partnerships form the foundation of the enhanced sense of neighborliness and community cohesion that Northside residents hope to build.
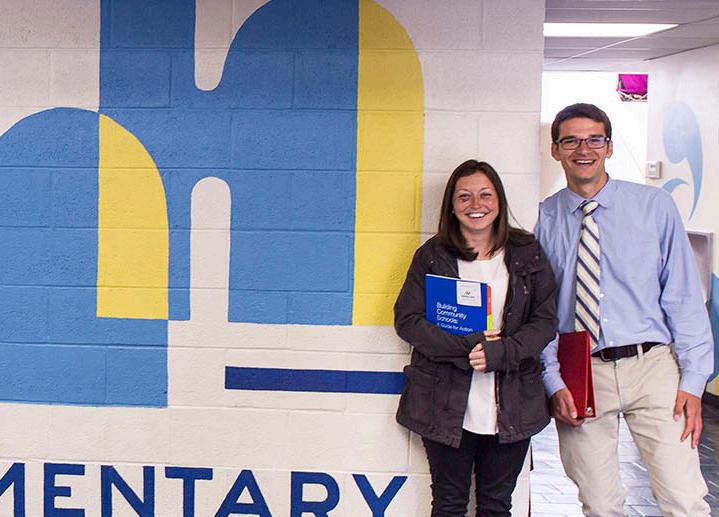
1. Create a volunteer-based Northside neighborhood organization to organize residents around issues and assist the city in implementing the plan.
One of the biggest priorities expressed by Northside residents is to create a greater level of community cohesion, activity, and neighborliness. In addition to providing an opportunity for neighbors to meet each other, a neighborhood organization can become a vehicle for residents to become involved in the implementation of the strategies in this plan.
2. Establish a volunteer block captain or block watch program to be a channel for resident concerns, organize community events, and represent the neighborhood at citywide meetings.
Block captains are used in many communities to elevate their neighbor’s concerns and ideas and improve quality of life on a hyper-local level. Creating a block captain program also has the power to become part of a neighborhood’s identity over time.
3. Explore the creation of a “neighborhood improvement district” or a housekeeping and house repair co-op model to enable residents to help each other improve and maintain their homes, and consider creating a competitive block challenge mini-grant program.
Many residents may want to keep up their properties, but are either financially unable or feel overwhelmed by the task. This program, which could be run in partnership with local housing organizations and hardware stores, would also help build a culture of neighborliness and support in the Northside.
4. Expand ongoing volunteer programs involving local grade-school and college students.
Many of the existing volunteer opportunities involve mentoring and academic support. Additional volunteer opportunities could create broader involvement beyond students and contribute to a culture of neighbors helping each other enrich and improve their lives.
One consistent and overarching theme echoed by residents and stakeholders throughout the planning process was the need for an identity for the Northside neighborhood. It stems from a frustration that despite all it has going for it, the Northside neighborhood is relatively undervalued as an excellent place to live. Residents are proud of where they live and want the neighborhood’s reputation to match that pride.
A neighborhood brand identity is valuable for multiple reasons. It can spur new development and economic activity as people seek interesting places to invest in; it can attract new residents when they become aware of all that a neighborhood has to offer; and most importantly, it can generate enthusiasm and a sense of shared community among those who work, live, and play in the neighborhood.
While the comprehensive development of a neighborhood brand identity is best undertaken through its own separate process, the building blocks have been identified in this plan. It is recommended that the City take steps to engage a dedicated branding consultant and then implement the new brand through physical and digital methods.
HOPES FOR THE FUTURE SOURCES OF PRIDE
SAFE & WALKABLE
The SouthSide Arts District (SSAD) is a downtown revitalization program that works to improve economic conditions for businesses and institutions located in the core business district of south Bethlehem, PA. Following the National Trust for Historic Preservation’s “Main Street Four Point Approach”®, SSAD staff and volunteers are focused on the four points of Organization, Promotion, Design, and Economic Vitality.
Initial activities and successes include the installation of 48 sidewalk planters; the establishment of quarterly merchant socials; the creation of a SSAD website (www. southsideartsdistrict.com) and social media platforms; and the reinvigoration of regular events such as First Fridays and Spring on the SouthSide.

1. Seek services from a dedicated branding agency to create a neighborhood brand based on foundations created in this plan.
2. Communicate the new brand via physical improvements (banners, signage, public art, etc.) and virtual methods (website, social media, e-newsletter, etc.)
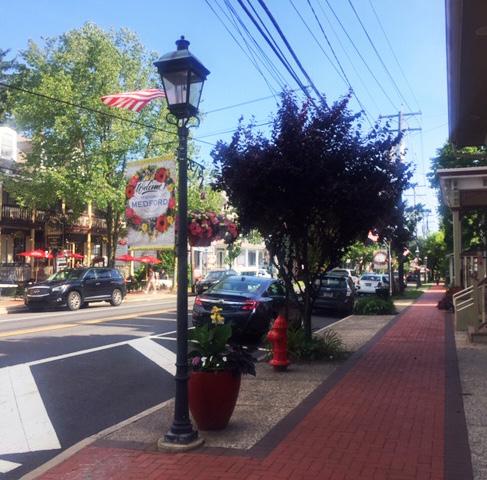
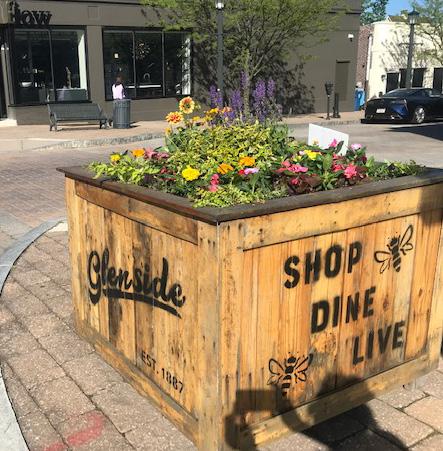
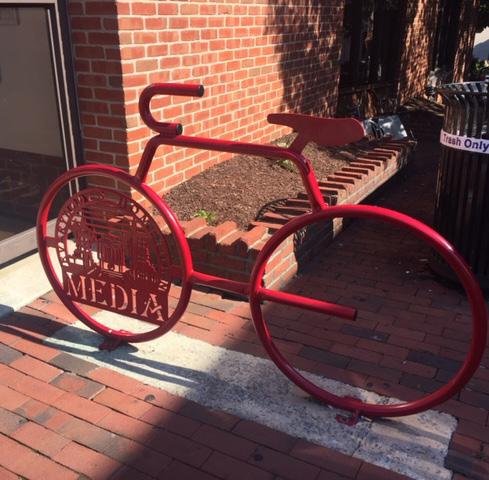


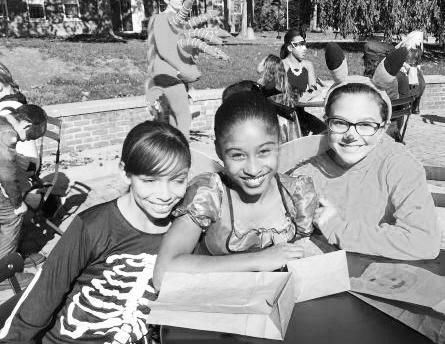 Celebrating Halloween at William Penn Elementary School. Bethlehem Area School District


The City of Bethlehem will work closely with local, regional, and state organizations and agencies to implement this plan. During the planning process, a number of interested and invested stakeholders have already come to the table to make the plan a reality. Together, these partners will collaborate on new and expanded programs, leverage public and private funds, and involve the community in the work of improving the Northside neighborhood. Most importantly, this plan represents the vision of Northside residents, and many have become involved in improving the neighborhood and will continue to do so into implementation.
The matrix on the following pages outlines each strategy in terms of potential partners and funding sources, expected time frame, and estimated cost range. Cost ranges are expressed in orders of magnitude, on a scale from one (least costly) to four (most costly) dollar signs. Timeframes are described as short (0-2 years), medium (2-5 years), long (5-10 years), or ongoing (will be done continuously throughout the next 10 years).
Timeframes
Short: 0-2 years
Medium: 2-5 years
Long: 5-10 years
Cost Range Estimates
$ Under $10K
$$ $10K to $99K
$$$ $100K to $499K
$$$$ Over $500K
Residents learn about and discuss the final plan, June 2019.
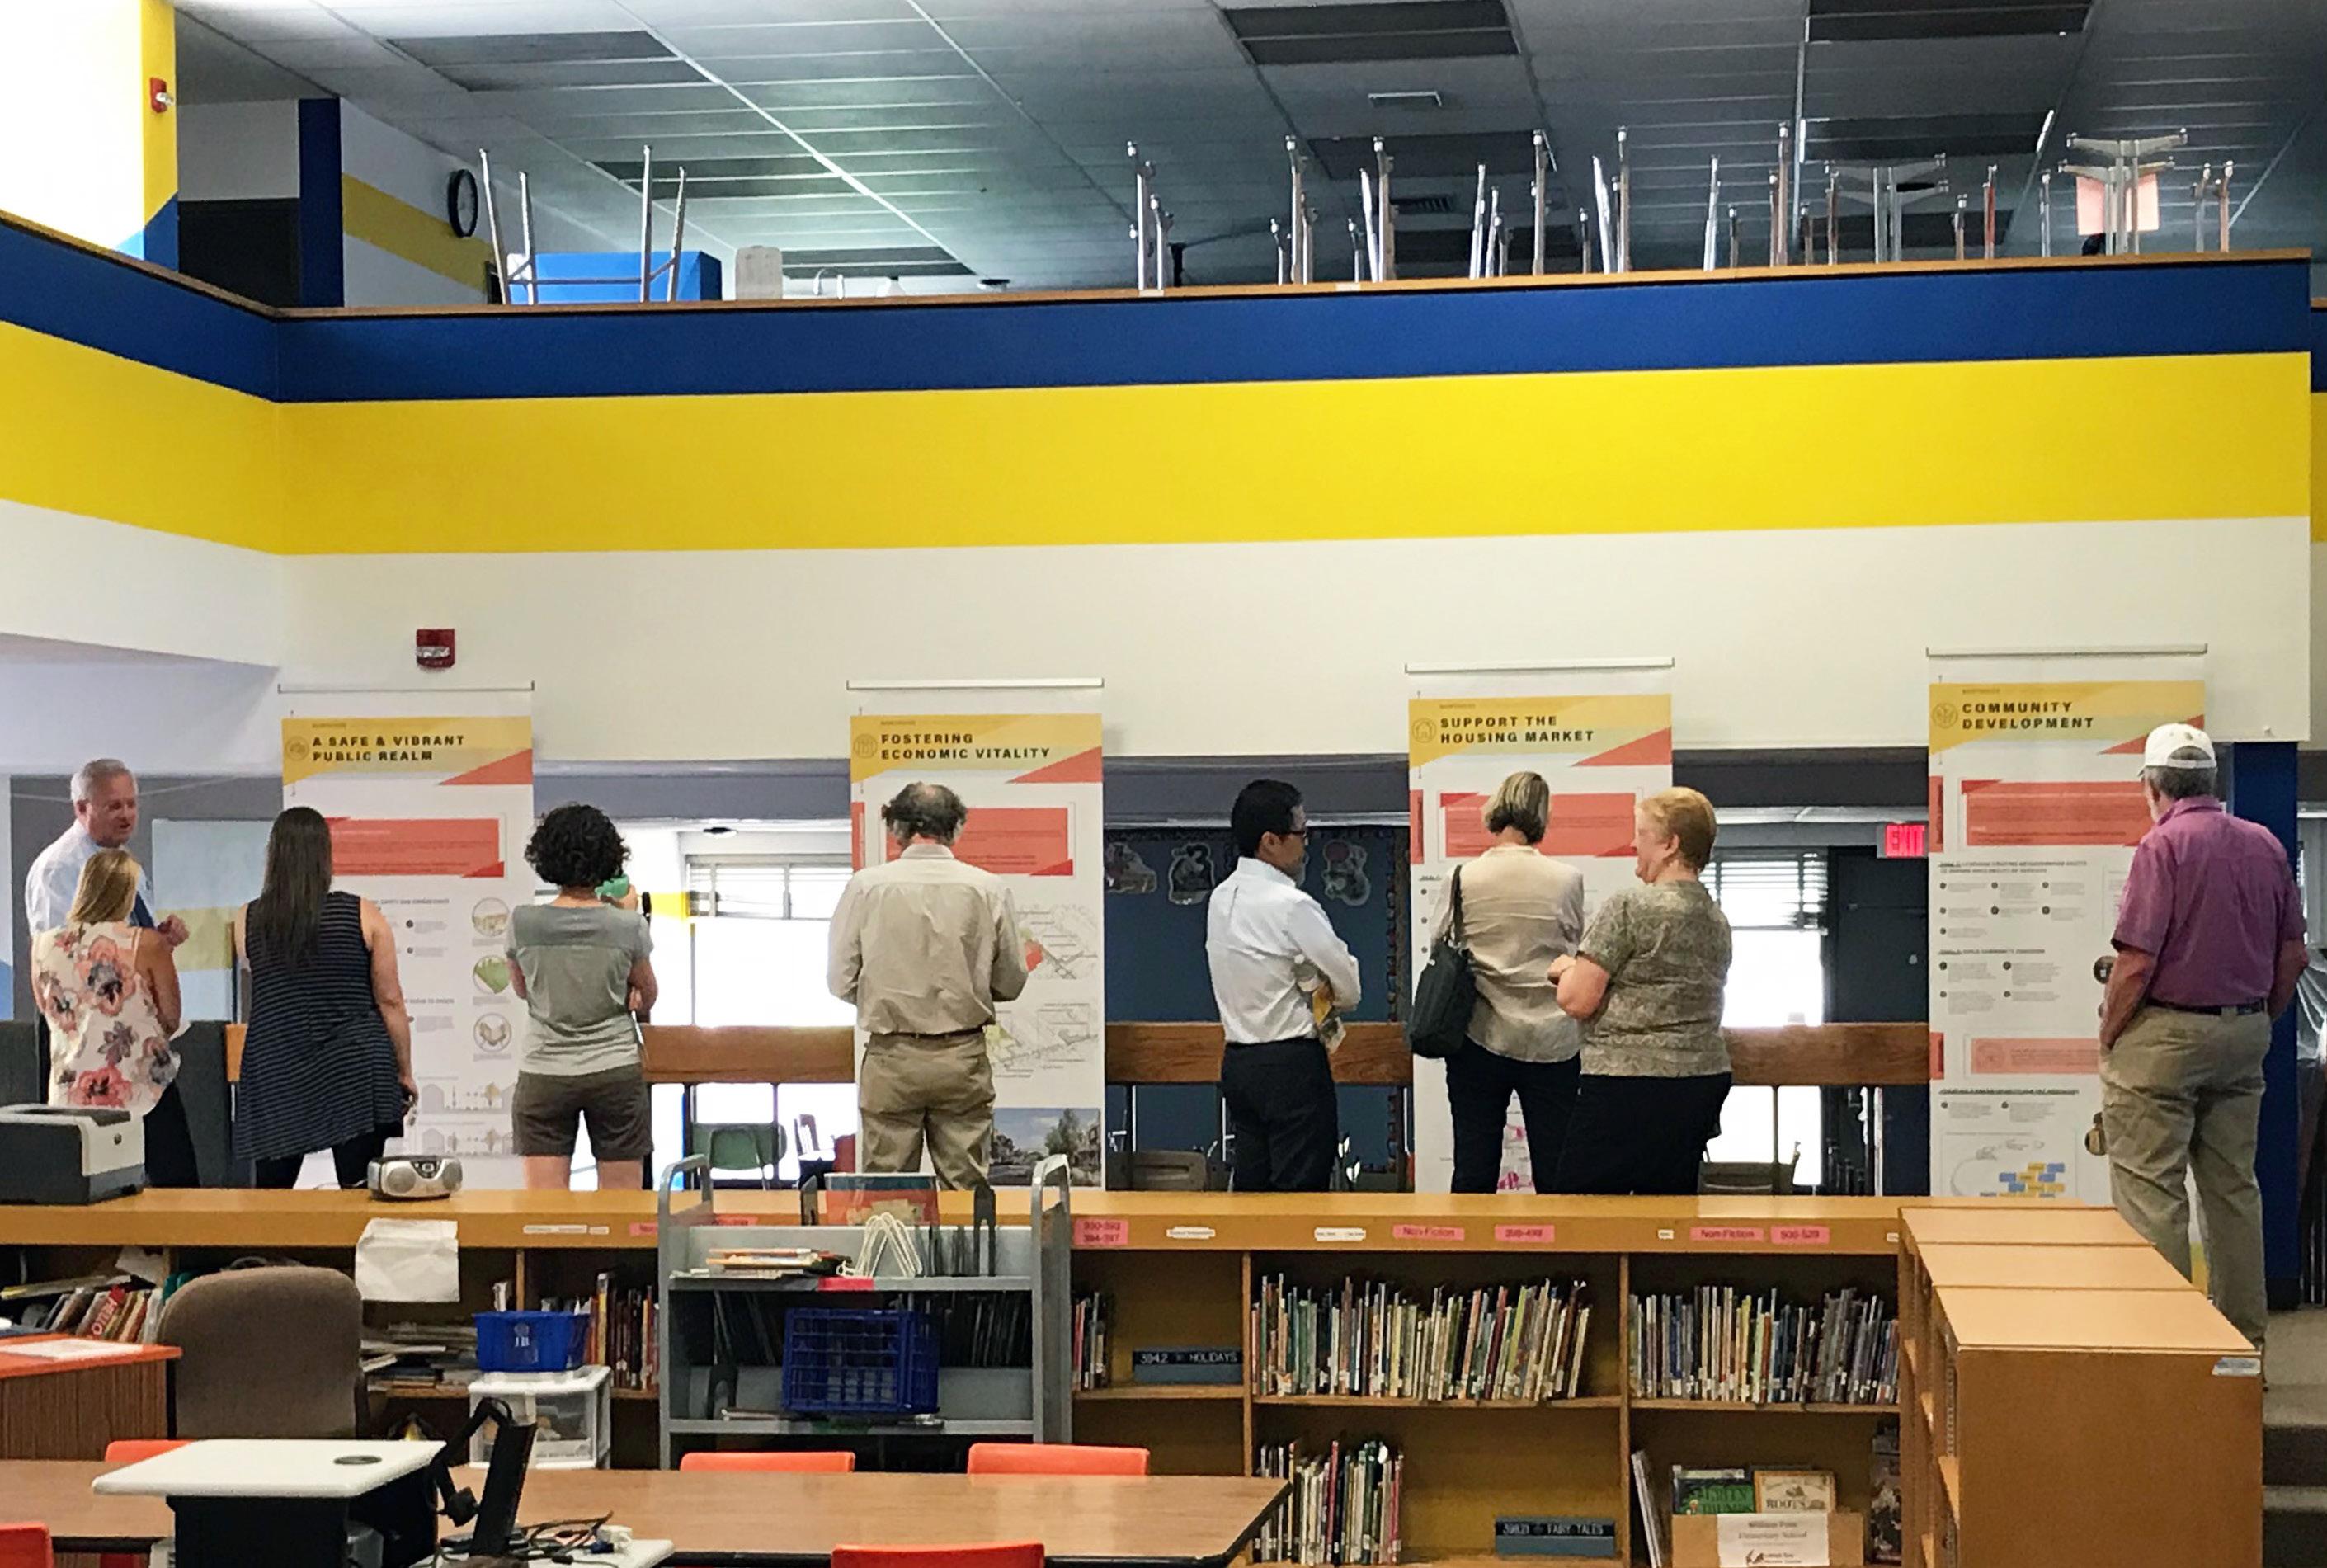


GOAL 1: IMPROVE SAFETY AND MOBILITY FOR ALL MODES OF TRANSPORTATION BY PROVIDING HIGH QUALITY STREETSCAPES AND NEIGHBORHOOD AMENITIES.
1. Return Linden Street to two-way traffic and consider road diets or other interventions to make it more amenable to all modes of transportation.
PennDOT, Bethlehem Department of Public Works, Citizen’s Traffic Advisory Committee long $$$$ high
2. Implement traffic calming on priority streets.
PennDOT, Bethlehem Department of Public Works, Citizen’s Traffic Advisory Committee medium $$$ high
3. Invest in high quality, highly visible pedestrian safety elements at key intersections.
PennDOT, Bethlehem Department of Public Works, Citizen’s Traffic Advisory Committee short $$ high
4. Enhance the safety and visibility of Monocacy Way Trail entrances and expand the network of bike lanes throughout the neighborhood.
PennDOT, Coalition for Appropriate Transportation, Citizen’s Traffic Advisory Committee, Department of Conservation and Natural Resources medium $$$$ high
5. Continue the pedestrian and bicycle safety public awareness campaign to educate the public about the rights and responsibilities of all modes of travel.
Citizen’s Traffic Advisory Committee, Lehigh Valley Planning Commission short $ medium
6. Seek services for a detailed engineering study of traffic and safety impacts of plan strategies. Bethlehem Department of Public Works short $$$ high
Strategy Potential Partners/Funding Resources Time Frame Cost Range Est. Priority
1. Hold regular events and festivals at key public spaces including City Hall Plaza, Friendship Park, and Johnston Park.
Local cultural and arts organizations medium $$ medium
2. Continue to add street trees and street lights on key blocks to create a continuous tree canopy and adequate pedestrian lighting throughout the neighborhood.
Bethlehem Department of Public Works short $$$ high
3. Add green elements that may include small gardens and swales to manage stormwater and beautify the neighborhood.
Bethlehem Department of Public Works long $$ low
4. Add murals or other public art elements in coordination with neighborhood branding effort. Local cultural and arts organizations medium $$$$ high
5. Improve visibility and a sense of welcoming at the entrance to Johnston Park along Union Boulevard. Adjacent property owners; ongoing citywide wayfinding initiative, Bethlehem Department of Public Works medium $$ medium
Strategy Potential Partners/Funding Resources Time Frame Cost Range Est. Priority
1. Redevelop the Boyd Theater site with a mix of residential and commercial uses.
Boyd Theater site developer team medium n/a high
2. Explore the potential of working with building owners to implement a redesign of the exterior of 3 W Broad St (Pentamation Building) to create an active facade.
Bethlehem Department of Community and Economic Development medium n/a medium
3. Add a tree-lined median to Broad St between Guetter and New Streets to fill a gap in the median along the tourist and dining destination section of the corridor.
PennDOT, Bethlehem Department of Public Works long $$$$ medium
4. Add additional pedestrian amenities, such as benches, and greening elements, such as planter boxes, to enliven the corridor and continue the aesthetic momentum from Main Street.
Bethlehem Department of Community and Economic Development, Bethlehem Department of Public Works, Bethlehem Chamber of Commerce medium $$$ medium
Strategy Potential Partners/Funding Resources Time Frame Cost Range Est. Priority
1. Add additional pedestrian amenities, such as benches, and greening elements, such as planter boxes, to enliven the corridor and signify its role as a destination in the neighborhood.
Bethlehem Department of Community and Economic Development, Bethlehem Department of Public Works short $$$ high
2. Consider branding Linden Street through physical and programmatic interventions. Local businesses and cultural organizations, Bethlehem Department of Community and Economic Development long $$ low
Strategy Potential Partners/Funding Resources Time Frame Cost Range Est. Priority
3. Explore opportunities for special events along the corridor to showcase businesses and restaurants. Local businesses and cultural organizations, Bethlehem Chamber of Commerce, Downtown Business Association medium $ medium
4. Reinforce the proximity of Linden Street and Friendship Park through streetscape improvements and coordination between the park and nearby businesses.
PennDOT; Bethlehem Department of Public Works medium $$ medium
Strategy Potential Partners/Funding Resources Time Frame Cost Range Est. Priority
1. Work with business owners and property owners in order to increase awareness of helpful programs and create a collaborative atmosphere on issues like code enforcement.
Bethlehem Department of Community and Economic Development, Bethlehem Chamber of Commerce, Downtown Business Association medium n/a high
2. Expand and strengthen commercial façade improvement and upkeep incentive programs. Local contracting firms short $$$ high
3. Create a Northside business association to enhance coordination between businesses. Bethlehem Department of Community and Economic Development, Bethlehem Chamber of Commerce short $ medium
4. Encourage the placement of fresh food amenities in or conveniently close to the neighborhood. Local community organizations, CDBG funds, Bethlehem Co-Op medium n/a high
1. Create a paper and online directory of resources available to both homeowners and renters Community Action Development Corporation of Bethlehem, Community Action Committee of Lehigh Valley short $ high
2. Expand and promote grant, loan, and tax incentives for home and property repairs, maintenance, and energy efficiency for homeowners
Community Action Development Corporation of Bethlehem, Community Action Committee of Lehigh Valley; CDBG funds short $$$ high
3. Create a landlord repair loan fund to incentivize property owners to improve quality of rental housing Community Action Development Corporation of Bethlehem, Community Action Committee of Lehigh Valley; CDBG funds medium $$ medium
4. Expand and promote “carrot and stick” measures to encourage property owners to improve damaged sidewalks
Bethlehem Department of Public Works, City of Bethlehem Code Enforcement Office short $ high
5. Expand foreclosure prevention activities to help residents stay in their homes Community Action Committee of Lehigh Valley long $ medium
6. Expand resources to help home buyers with selecting, purchasing, and financing a home Local real estate community medium $$ medium
7. Support responsible landlords by providing technical assistance and helping them acquire distressed properties in the neighborhood
Bethlehem Department of Community and Economic Development, Bethlehem Redevelopment Authority long $ low
Strategy Potential Partners/Funding Resources Time Frame Cost Range Est. Priority
1. Enhance code enforcement in key sub-areas to promote good stewardship of homes by absentee landlords
City of Bethlehem Code Enforcement Office short $$ high
2. Enhance City enforcement of quality of life ticketing through a 6 to 12 month pilot program in key sub-areas
City of Bethlehem Code Enforcement Office short $$ high
3. Identify and prioritize opportunity sites for rehabilitation or demolition of blighted properties in the neighborhood
Bethlehem Redevelopment Authority, Bethlehem Department of Community and Economic Development medium $ low
4. Work with trash haulers to coordinate services and implement zone hauling
City of Bethlehem long $ medium
1. Expand high quality early education options in the neighborhood
Bethlehem Area School District long $$$ medium
2. Expand availability of high quality before and after school programs in coordination with partner organizations
Bethlehem Area School District, YMCA and YWCA medium $$$ high
3. Expand programs to enrich youth and help them prepare their post-high school plans
Bethlehem Area School District, Community Action Committee of Lehigh Valley, Moravian College medium $$ medium
4. Expand availability of affordable childcare options during work hours
Local childcare providers medium $$$ high
5. Expand access to mental health resources and services
Northampton County Human Services short $$ high
6. Expand community resources to help families experiencing homelessness
Northampton County Human Services, local and regional social service organizations short $$ high
7. Explore implementation of public wifi anchored by neighborhood assets
Bethlehem Area School District short $$ low
Strategy Potential Partners/Funding Resources Time Frame Cost Range Est. Priority
1. Create a volunteer-based Northside neighborhood organization to organize residents around issues and assist the city in implementing the plan
Community Action Committee of Lehigh Valley, Northside 2027 Steering Committee short $$ high
2. Establish a volunteer block captain or block watch program to be a channel for resident concerns, organize community events, and represent the neighborhood at citywide meetings
Community Action Committee of Lehigh Valley, Northside 2027 Steering Committee short $ high
3. Explore the creation of a “neighborhood improvement district” or a housekeeping and house repair co-op model to enable residents to help each other improve and maintain their homes, and consider creating a competitive block challenge mini-grant program
Habitat for Humanity, local hardware stores medium $$ medium
4. Expand ongoing volunteer programs involving local grade-school and college students
Moravian College, Bethlehem Area School District short $ medium Strategy Potential Partners/Funding Resources
1. Seek services from a dedicated branding agency to create a neighborhood brand based on foundations created in this plan
Community Action Committee of the Lehigh Valley, Northside 2027 neighborhood partners short $$ high
2. Communicate the new brand via physical improvements (banners, signage, public art) and virtual methods (website, social media presence, newsletters)
Community Action Committee of the Lehigh Valley, Northside 2027 neighborhood partners, Bethlehem Department of Public Works medium $$$ medium


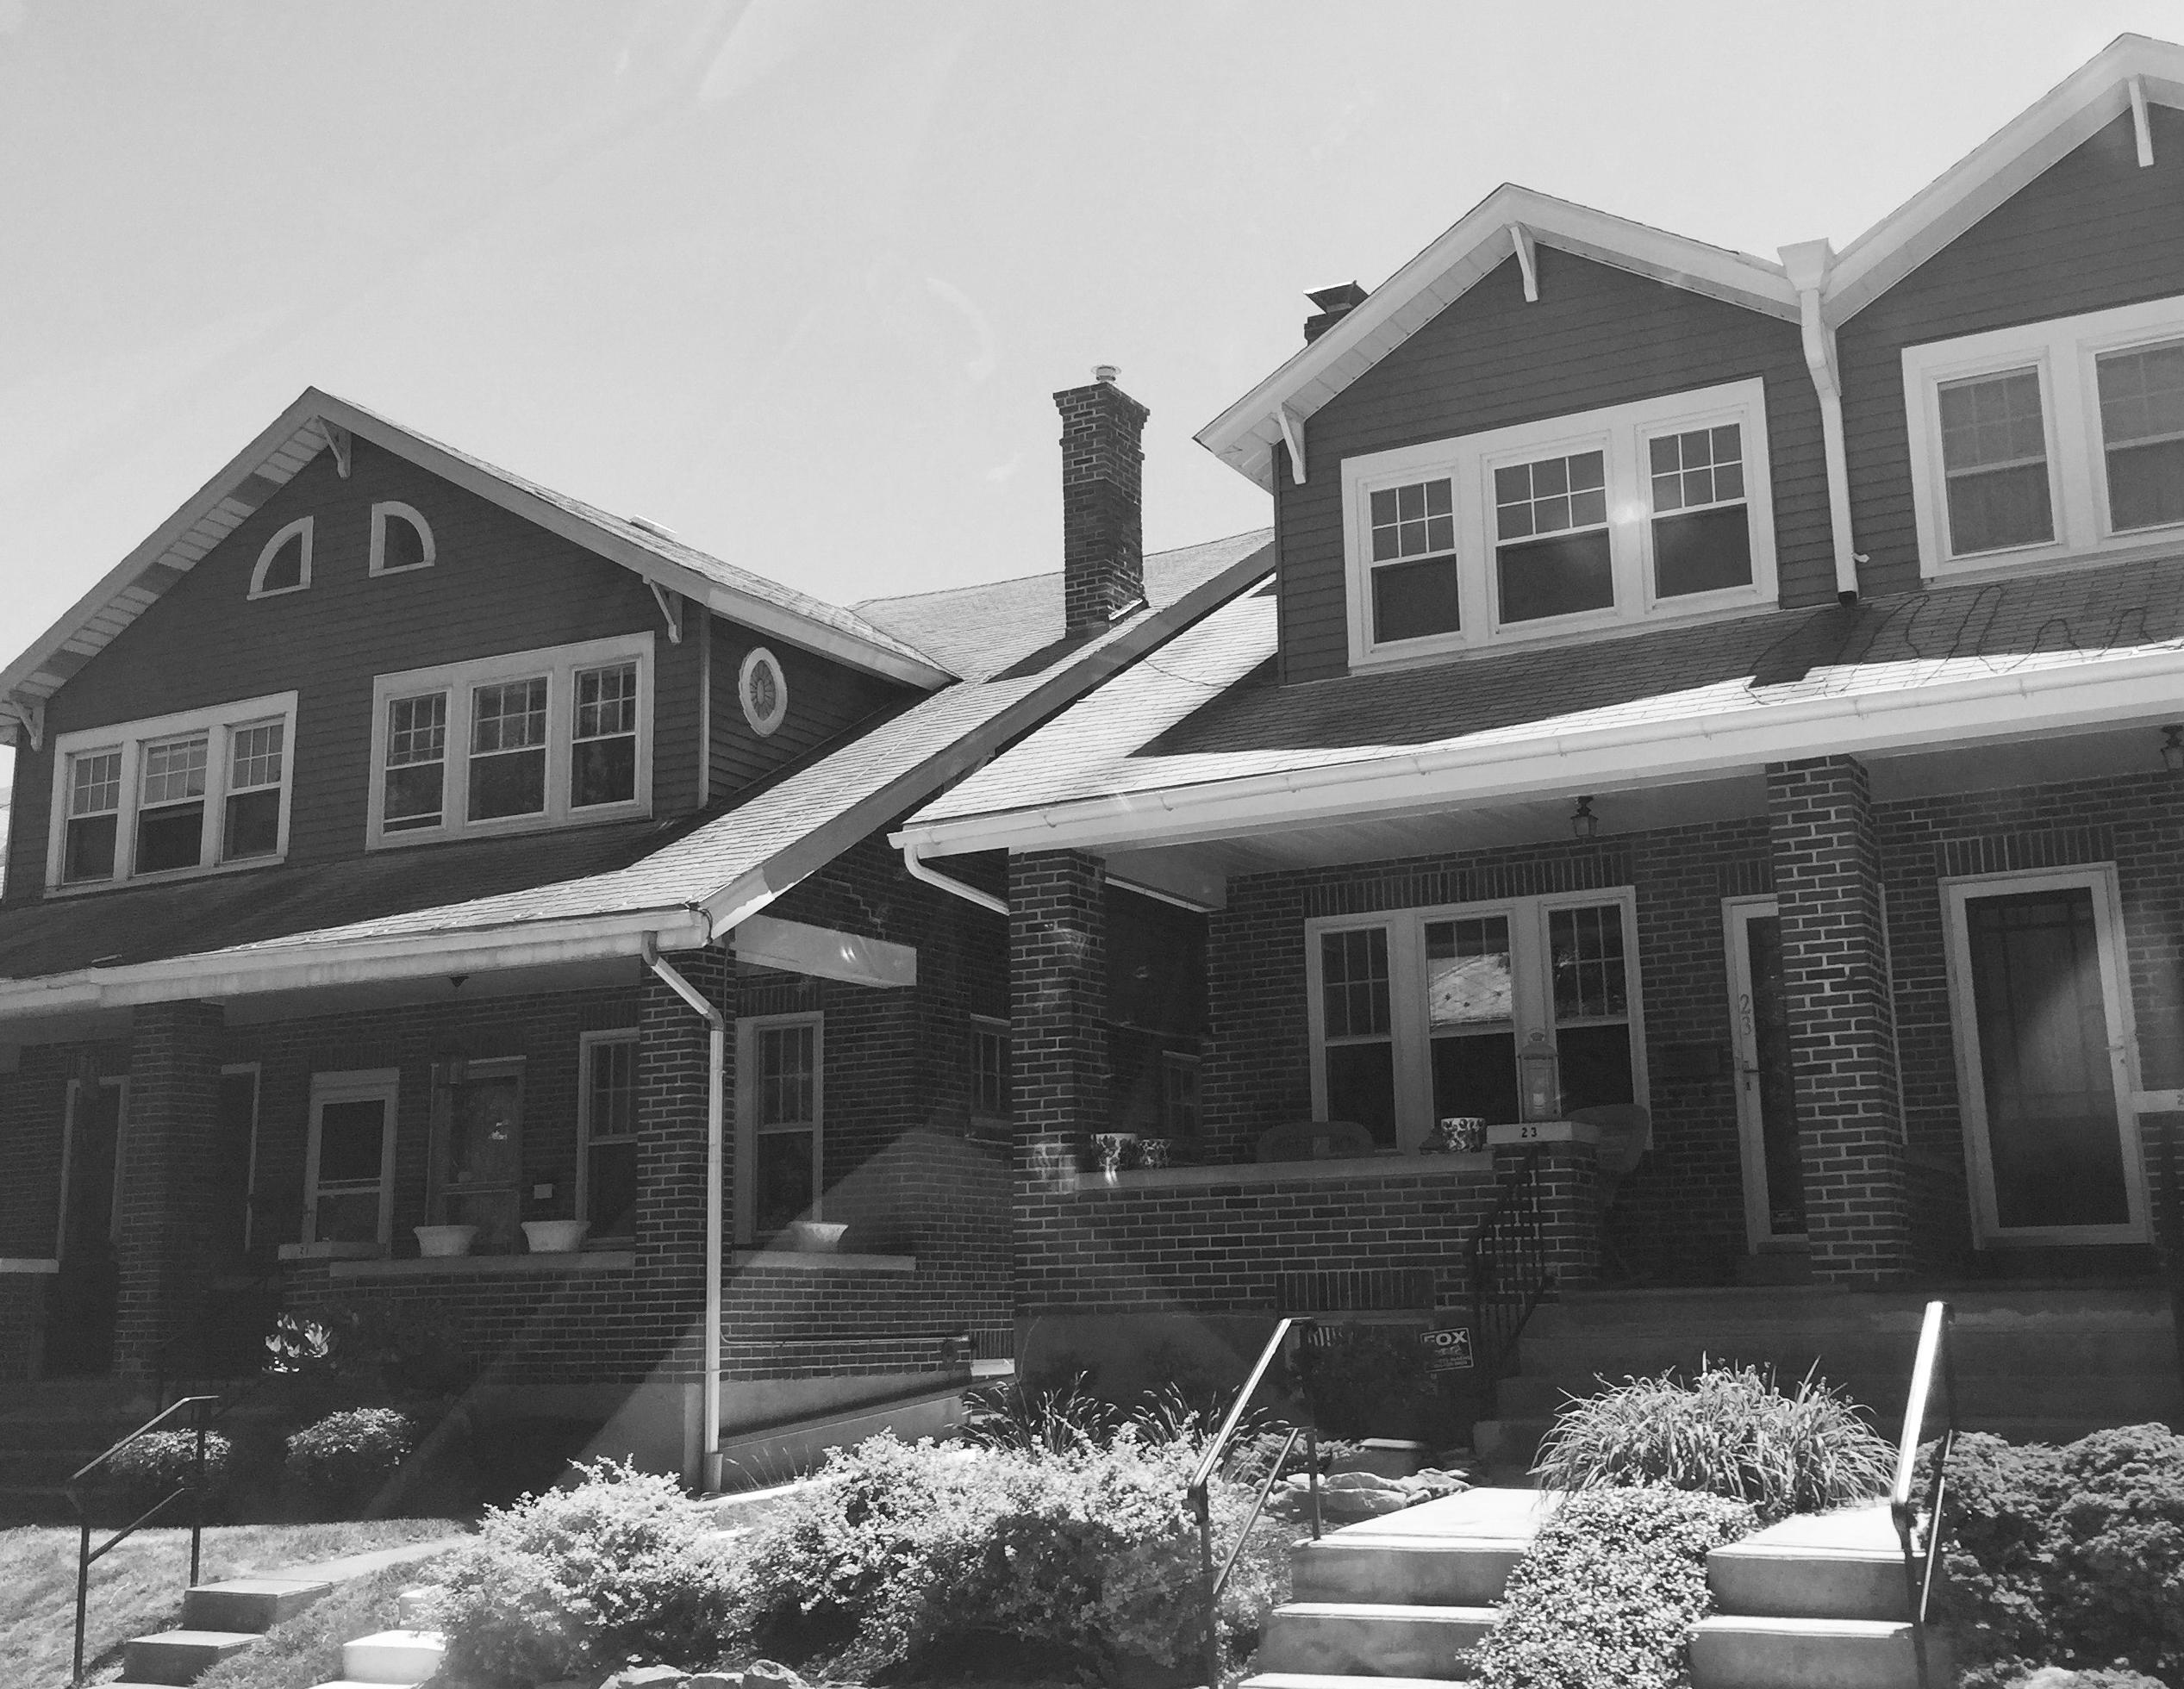


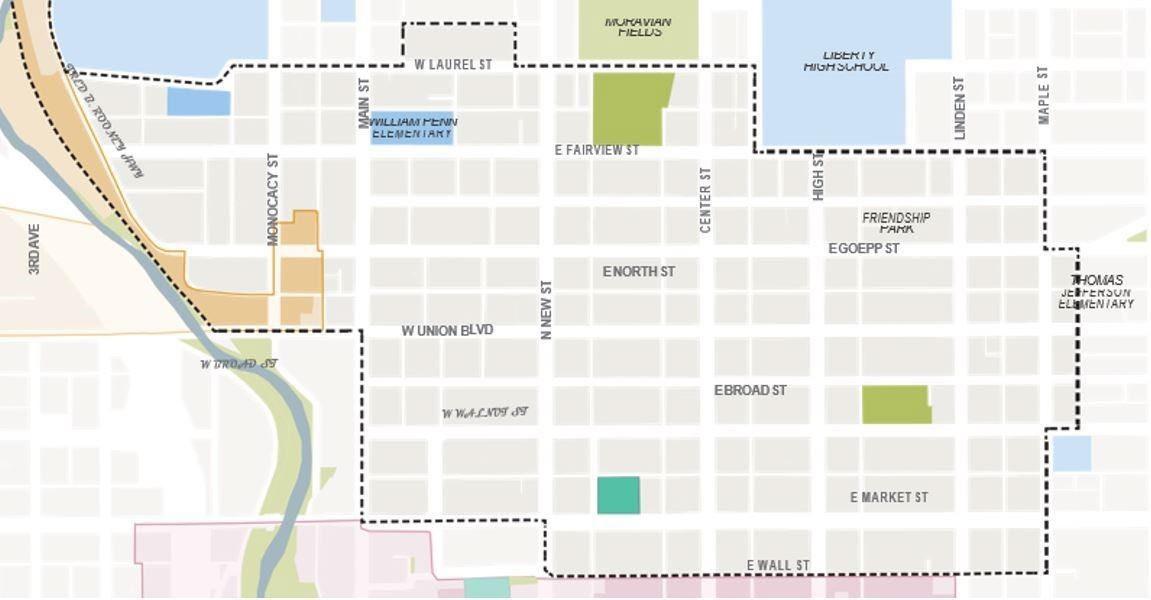
The goal of the Northside 2027 plan is to improve the Northside Bethlehem community by learning about the changes that residents want to see in the area. This survey is voluntary and will only take a few minutes to complete. The results of this survey will help the City better understand the community’s needs from your point of view.
Please do not put your name on the survey. This survey continues on to the back of the page
Where do you live in the City of Bethlehem?
Do you rent or own your property?
❏ Rent
❏ Own
❏ Other
Please check off the three (3) most important things that you think are needed in the community from the categories below. Please review all options carefully before making your decision.
EDUCATION – Please check the three most important needs in this category.
❏ More parents/guardians involved in students’ education
❏ Preschool activities to prepare children for elementary school
❏ More activities to prepare students for post-high school plans
❏ More local certificate/degree programs (ex: technical school programs)
❏ Affordable transportation options to and from school
❏ High quality before- or after-school student programs
❏ More information about available education resources in the community
❏ Other (please specify): ___________________________
HOUSING – Please check the three most important needs in this category.
❏ More monthly rental assistance programs
❏ More accessible security/utility deposit programs
❏ More counseling resources for homeowners
❏ Grants to make home ownership, home rehab/repair, and energy reduction affordable
❏ More housing based on what you earn
❏ More community resources for homeless families
❏ Other (please specify): ____________________
EMPLOYMENT – Please check the three most important needs in this category.
❏ More jobs with better pay and benefits
❏ More training programs for jobs in the area
❏ Affordable transportation to and from jobs
❏ Affordable childcare during work hours
❏ Increasing employment resources for the community
❏ Resources for individuals preparing to enter the workforce
❏ Other (please specify): ______________________________
HEALTH – Please check the three most important needs in this category.
❏ More community focus on preventative healthcare
❏ Dental, vision, and hearing payment assistance for visits
❏ Increasing the community’s knowledge of available health resources
❏ Nutritional programs for children
❏ More knowledge of available food resources
❏ More mental health resources and services
❏ More assistance and resources for victims of trauma
❏ Other (please specify): _____________________
General Support Services – Please check the three most important needs in this category.
❏ Child Support
❏ Help with legal issues
❏ Youth Services (ex: after school programs, mentoring programs)
❏ Meal Programs (ex: food pantries, reduced meal prices)
❏ Life Skills Programs and Services (ex: financial planning programs)
❏ Drug/Alcohol Abuse Resources
❏ Emotional Abuse Services
❏ Sexual Abuse Services
❏ Physical Abuse Services
❏ Transportation Services
❏ Language Translation Services
❏ Other (please specify):
Top 3 needs in EMPLOYMENT:
Affordable childcare during work hours
More jobs with better pay and benefits
Resources for to help people prepare to enter the workforce
122
Top 3 needs in Education: survey respondents
87 35
residents non-residents
High quality before- or after-school student programs
More activities to prepare students for posthigh school plans
More parents/guardians involved in students’ education
Top 3 needs in Housing:
Grants to make home ownership, home rehab/repair, and energy reduction affordable
Resources to help homeowners with selecting, purchasing, and financing a home
More community resources for homeless families (TIED WITH #2)
Top 3 needs in Health:
More mental health resources and services
More community focus on preventative healthcare
Nutritional programs for children
Top 3 needs in General Support Services:
1
3 Youth Services (e.g. after school programs, mentoring)
2
Life Skills Programs and Services (ex: financial planning programs)
Meal Programs (ex: food pantries, reduced meal prices)
An initial community meeting was held to introduce the planning process and gather initial feedback. Attendees listened to a short introductory presentation and were then invited to add dots and sticky note comments at a number of interactive stations. Topics for input included social service needs, commercial corridor activity, initial thoughts on a neighborhood brand, and an opportunity for open-ended comments or suggestions.
Major takeaways included the fact that residents’ major concerns included housing quality and multimodal safety, which were then translated into major topics of the plan. Specific input included the desire for infill development to revitalize the commercial corridors, particularly the former Boyd Theater site, and the need for more amenities throughout the neighborhood in general.
Residents helped create an initial vision for a Northside brand identity, suggesting ideas such as “safe,” “clean,” “family friendly,” “diverse,” “historic,” and “convenient.”
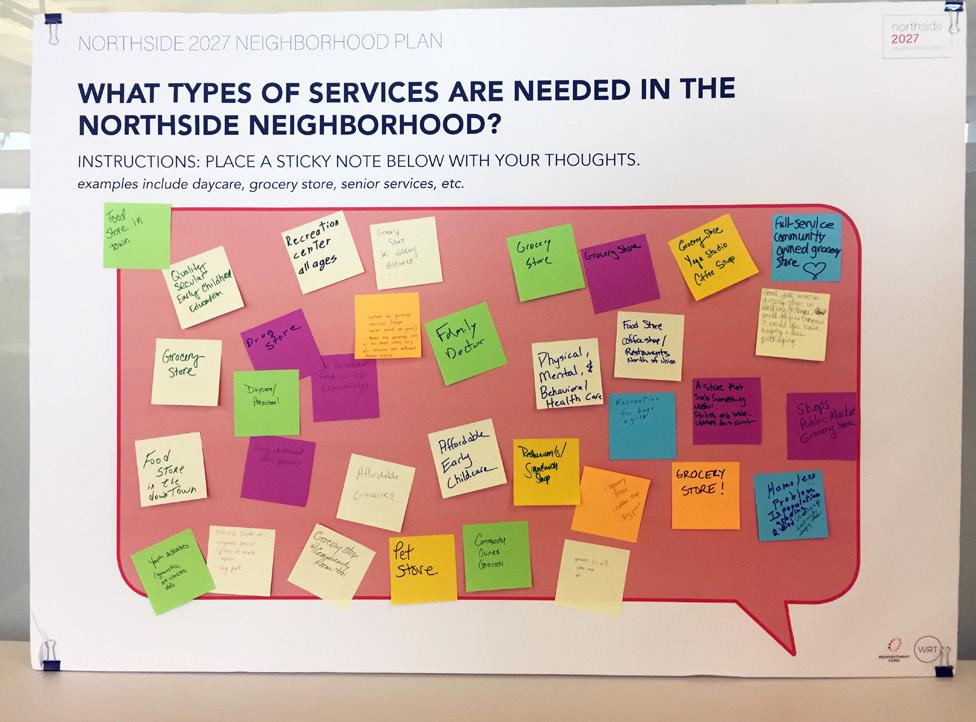

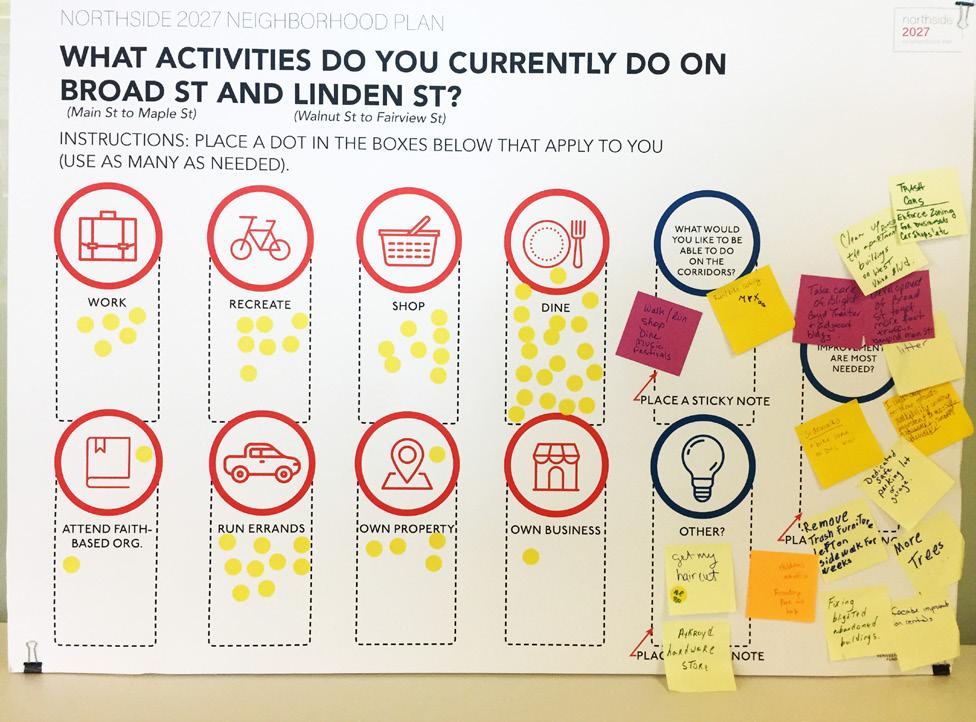
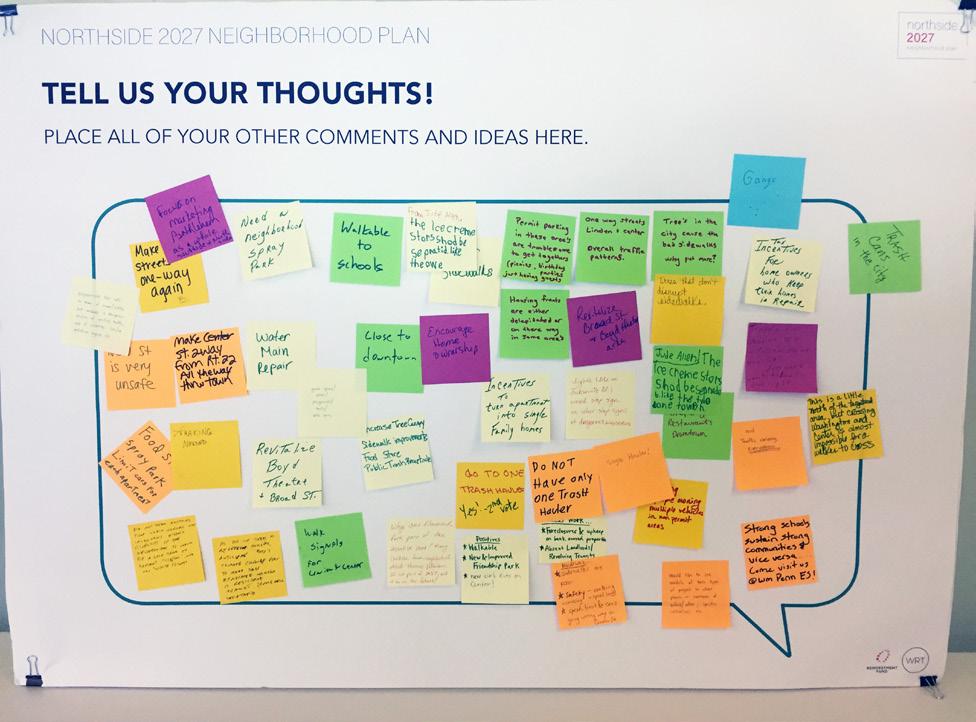 WRT
WRT
THOMAS
Figure 20. Meeting attendees were asked to add dots to a map noting where they live in the neighborhood, and if applicable, where they work, own a business, or go to school.
At the second community meeting, participants broke into three Working Groups after a brief presentation. Following the priorities identified from feedback at the first meeting, the groups tackled three key issues: housing, commercial corridors, and mobility. Groups used existing conditions data and maps to inform their conversations about key priorities and issues. The groups met a second time in January 2019 to refine and add to their initial ideas. The outcomes of these discussions were added to the plan’s goals and strategies.
The priorities for housing were to improve the cleanliness, curb appeal, and overall quality of life in the neighborhood, as well as to build community cohesion through working together to achieve those goals. Other issues included affordability and strengthening the housing market.
Major ideas and topics included:
» The need to use “carrot and stick” approaches to get landlords and property owners to upkeep their properties and sidewalks
» The conversion of single-family into multi-family units
» Residents would benefit from a directory of resources and services as well as a way to engage with neighbors to help each other fix up properties and/or communal issues on their block
» Suggestions included a “neighborhood improvement district,” housekeeping co-ops, neighborhood ambassadors
» Block captains or some other organizing force for residents may also be helpful
The group clarified that the two major commercial corridors being studied—Broad and Linden—serve three distinct functions: a more retail and dining-focused extension of Main Street on Broad between Main and Center; a professional services corridor from Center to Linden; and then a neighborhood-serving service corridor (with some eateries as well) along Linden.
» Concentrated interventions between Main and Center (pulling foot traffic from Main, re-skinning building, branding, public realm improvements) is advisable versus spreading out investments over a longer stretch
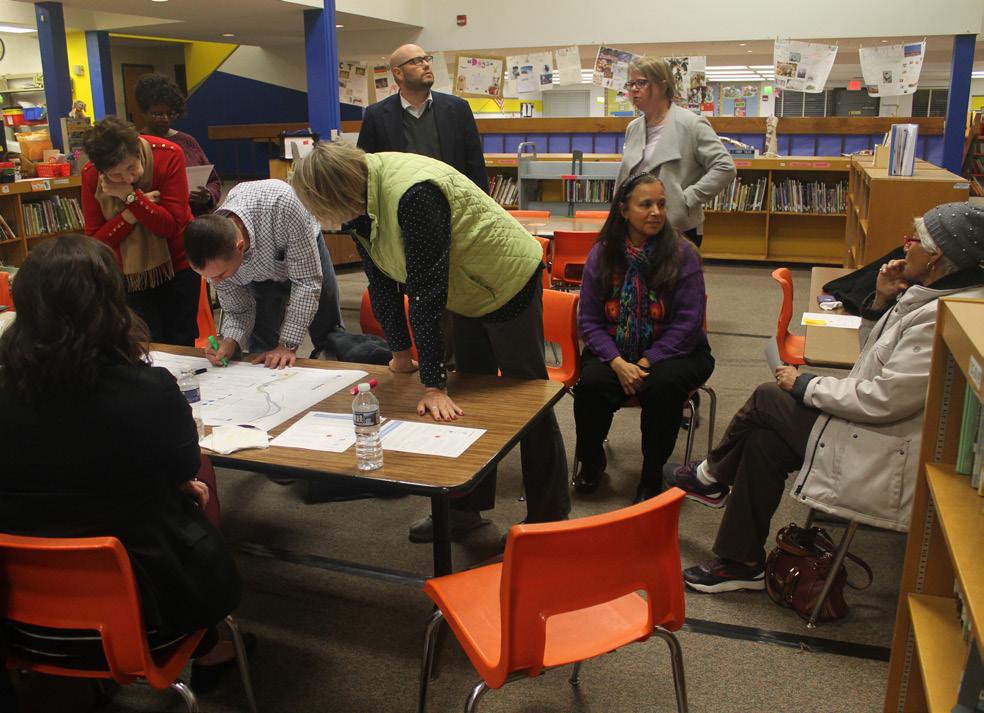
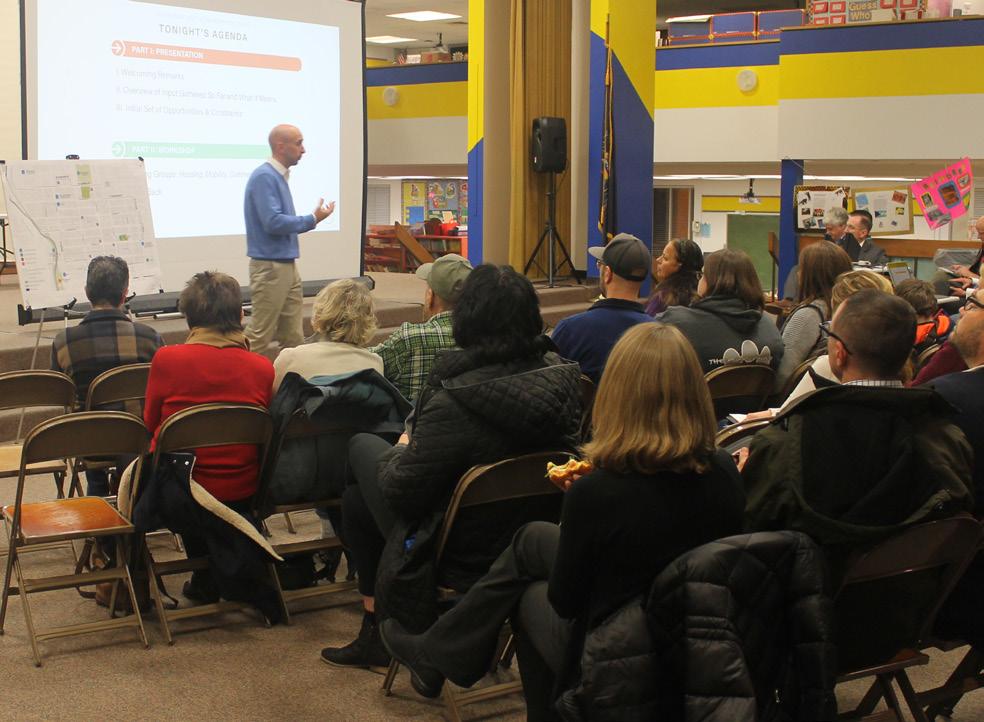
» East of Center is well-functioning as a professional services corridor
» Redevelop the Boyd Theater site
» Add median to block between Guetter and New Linden Ave
» Make street two-way and invest in traffic calming and other streetscape improvements
» With so many Latino businesses on the corridor, there is a potential to brand it or heighten its profile as a cultural hub through physical and programmatic interventions
The overwhelming priority for community members in the realm of mobility is safety for all modes of travel—driving, walking, and bicycling. There are many hotspots where these modes come in conflict, and there are a range of interventions that could improve safety for everyone, from quick and relatively inexpensive changes to much more extensive investments in road re-design and safety infrastructure. In general a lot of residents walk to their daily destinations, including school children.
» The need to identify and prioritize key intersections for safety improvements/investments that are realistic given City resources
» Access to Monocacy Trail is limited and unsafe, and a general lack of bicycling infrastructure in the neighborhood inhibits would-be bikers
» One-way arterials should be converted to twoway neighborhood serving streets, and some major streets would benefit from traffic calming interventions to slow vehicle speeds
Residents learned about the draft plan’s initial goals and strategies at the third community meeting and were given an opportunity to weigh in on which strategies they felt should be prioritized. This was achieved through an “investment” game, wherein each participant was given a set number of play dollar bills to invest in the strategies they felt most strongly about.
Community priority was only measured for strategies over which the City and related partners have at least some control; certain strategies that are primarily driven by other parties were not included for residents to prioritize. These are noted with “n/a” in the tables on the following pages. Additionally, the housing section’s strategies were not included in order to enable the City to rely on the extensive research and data analysis behind the strategies to guide implementation.
Strategies up for prioritization generally received a maximum of 15 dollar bills, with an outlier receiving 27. Strategies that received 9 or more dollar bills were deemed as community priorities. They are highlighted in blue in the following tables.
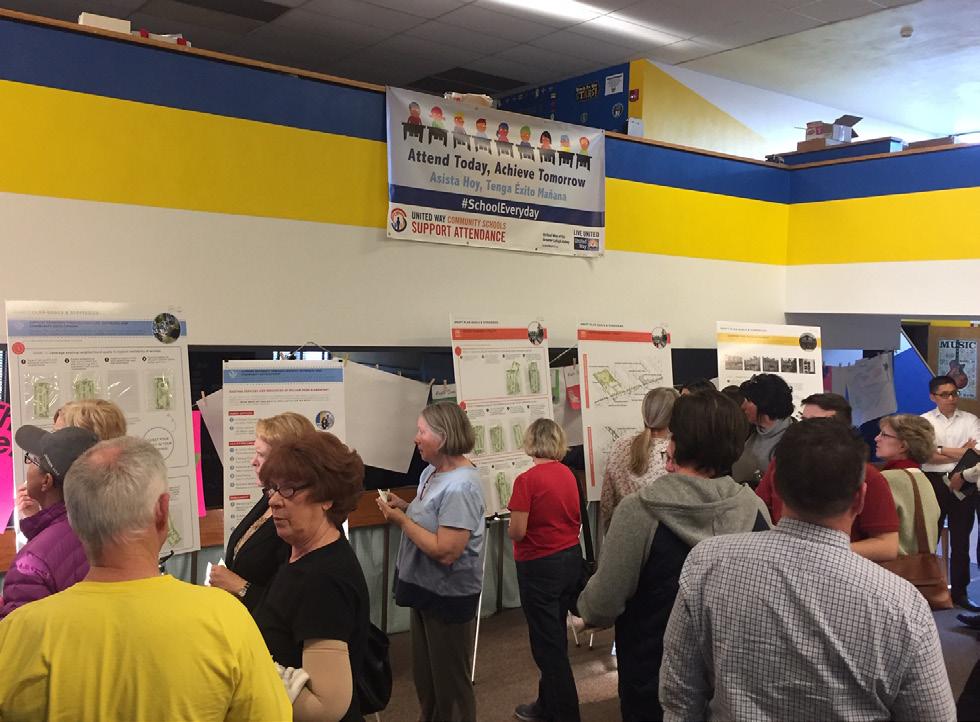
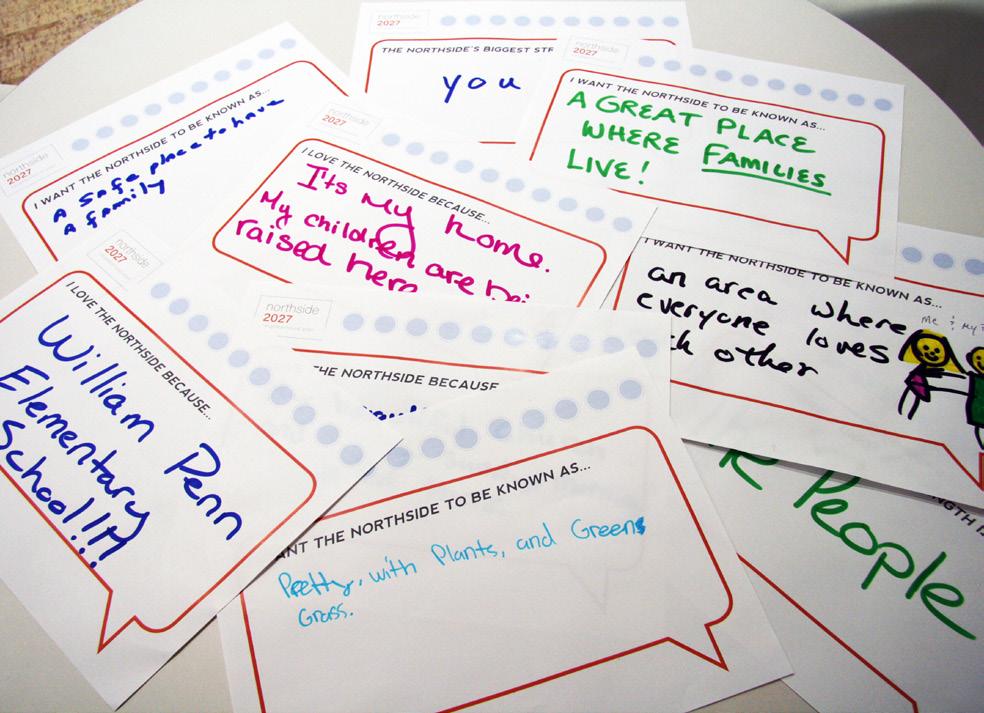
5
Strategy Investment
1 Redevelop the Boyd Theater site with a mix of residential and commercial uses n/a
2 Explore the potential of working with building owners to implement a redesign of the exterior of 3 W Broad St (Pentamation Building) n/a
3 Add a tree-lined median to Broad St between Guetter and New Streets 5
4 Add additional pedestrian amenities, such as benches, and greening elements, such as planter boxes 8
2 Consider branding Linden as a cultural corridor through physical and programmatic interventions
3 Explore opportunities for special events along the corridor to showcase businesses and restaurants 3
4 Reinforce the proximity of Linden Street and Friendship Park through streetscape improvements and coordination between the park and nearby businesses
1 Strengthen collaboration between business owners, business property landlords, residents, and the City Department of Community and Economic Development
2 Expand and strengthen commercial façade improvement and upkeep incentive programs 27
3 Create a Northside business association to enhance coordination between businesses
4 Encourage the placement of fresh food amenities in or conveniently close to the neighborhood n/a
For the final community meeting, residents and stakeholders attended an informal open house to read about the final plan. Many attendees, who had been participating since the beginning of the process, remarked that many of their concerns and ideas were reflected in the plan’s goals and strategies.
Also present were a number of local organizations and government offices that offer a range of resources and programs in the area. These included the Bethlehem Food Co-Op, the Coalition for Appropriate Transportation, The City of Bethlehem Health Department, and the Office of State Representative Steve Samuelson.

Residents learn about and discuss the final plan, June 2019.


Bethlehem Citywide Housing Market Context
Reinvestment Fund completed a Market Value Analysis (MVA) for Bethlehem as part of the 2018 Bethlehem Blight Betterment Initiative (B3 Initiative) to address blight, conducted with partners May 8 Consulting and Atria Planning. The MVA is an objective, data-driven instrument built on administrative data and validated by local experts. To create the MVA, Reinvestment Fund analyzed the following data: property sales prices, mortgage foreclosure filings, owner occupancy rates, vacancy levels (of both buildings and land), code violations, and construction permits. Staff conducted multiple rounds of street-level validation, i.e. driving the city to ensure the accuracy of the data, to verify the accuracy of the underlying data, and the accuracy of the MVA results.
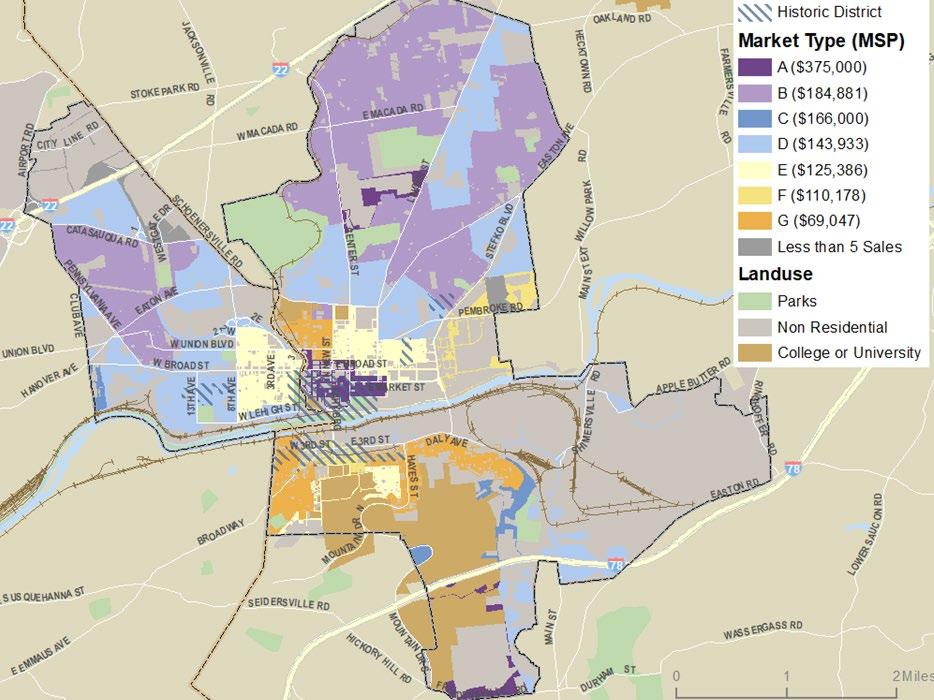
The MVA identified seven distinct market types In Bethlehem. As a city, the MVA found that Bethlehem is characterized by established neighborhoods with generally well-maintained, single-family housing stock that largely dates to the first half of the 20th century. There has been little new construction activity, even in the strongest markets. The city is notably affordable compared to other east coast housing markets; outside of the strongest (“A”) markets, Bethlehem households with incomes near the area median could find an affordable a home almost anywhere. At the same time, weaker markets did
not suffer from the sort of pervasive vacancy, depressed sale prices, and severely dilapidated properties that exist in many other cities using the MVA. However, an increase in investor-owners and cash purchases in these weaker markets is in keeping with broader regional and national trends and may present ongoing challenges.
Table 1: Average Block Group Characteristics in Bethlehem by Market Type, 2018
Housing Value and Sales-Related Characteristics
Housing Characteristics Investments Distress
The Northside 2027 planning area is remarkably diverse in terms of markets; it has five of the seven MVA market types within its boundaries. Descriptions of these 5 market types (A, B, D, E, G) follow.
Bethlehem’s “A” markets are the strongest, characterized by high sales prices, low levels of distress, and a notable presence of renters Like many MVA cities, Bethlehem has two strong market types largely differentiated by homeownership rates in this case “A” has a low rate, and “B” has a high rate. The median sales price ($375,000) is nearly 2.5 times the city average, while the owner occupancy rate (26%) was well below average (55%). “A” markets have a large share of multifamily and condominium sales
The “B” market category has high sales prices, low levels of distress, and the highest homeownership rates in Bethlehem. The median sales price ($184,481) is 21% greater than the city average. “B” markets largely comprise single-family, owner-occupied homes in relatively low-density neighborhoods with few condominium and multifamily sales.
The “D” markets have a median sale price ($143,933) slightly below the city average and roughly equal numbers of owner and renter households Distress and the incidence of code violations are also “middle” – about the city average. Like “B” markets, “D” markets are relatively low density and are predominately made up of single-family homes.
“E” markets have a slightly lower median sales price and greater signs of both distress and investor purchases than “D” markets. The median sales price ($125,386) is about 20% below average, and about 13% of the sales transactions were for multifamily properties, the highest level across the market types. Investors accounted for roughly 30% of home sales, a substantially higher presence than in “D” markets. About one in five properties were cited for multiple violations. “E” markets are at risk of sliding into stressed markets.
The “G” markets are the most stressed in Bethlehem. They are concentrated in the Southside but also found in the 2027 Neighborhood, just north of Broad Street. “G” markets are primarily renters (64%) but only 17% of rental units in these markets are subsidized, much less than in “F” markets which are not found in the Northside. The median home sale price ($69,047) is the lowest in the city, about half the city average, though the Northside’s “G” markets had higher values than those on the Southside Investors make up nearly half of all residential sales. Over a quarter of properties have multiple code violations and the average share of properties that are blighted or distressed is above the city average.
There are many signs of strength in the Northside’s housing markets, but 2027 housing discussions focused on concerns around physical conditions and crowding, often as they relate to poor management and maintenance by absentee owners. Analysis of the data confirms some common perceptions, while painting a more nuanced portrait of neighborhood market dynamics than may be apparent at first glance.
Several Northside sub-markets have high shares of renters, not only the stressed areas (Markets 1 and 2, see Figure 2) but also Market 9, one of the strongest real estate markets in the city, where 85% of households rent. In addition, some of the properties with multiple code violations were owner-occupied, underscoring the need for a variety of strategies addressing renters, their landlords, homeowners, and the public realm more generally
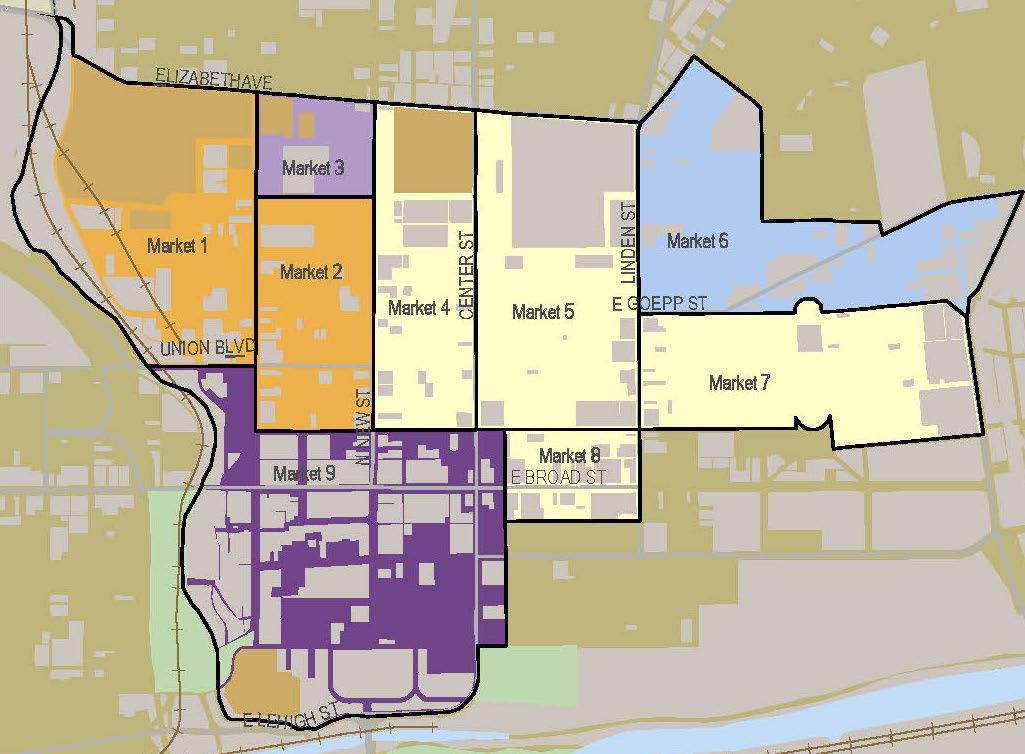
Data analysis supports the perception of high absentee rental property ownership, with elevated investor activity (as a percent of sales) found across all MVA types compared to similar markets in other parts of the city (See Figure 3). This was particularly notable in Markets 1, 4, and 7 where investor activity accounted for 31%-41% and of all home sales compared to 22% of sales citywide. While a higher
than average share of housing units in the weakest markets (1 and 2) were rentals, only 4% of rental units had subsidy in Market 1 compared to 10% citywide and a slightly elevated 15% in Market 2. Market 4, which was 73% renter households with less than 2% subsidized. This indicates that, as in many markets where we work, the most problematic units are often not associated with the Housing Choice Voucher program; that program can actually hold units to a higher quality standard and subject them to regular inspection. Although median sale prices in the Northside’s middle and stressed markets were lower than the city average ($81,750-$114,000 compared to $187,000) those areas reported relatively high rents ($1,100 vs. $993 citywide), indicating high rental demand and the profitability of rental property investment
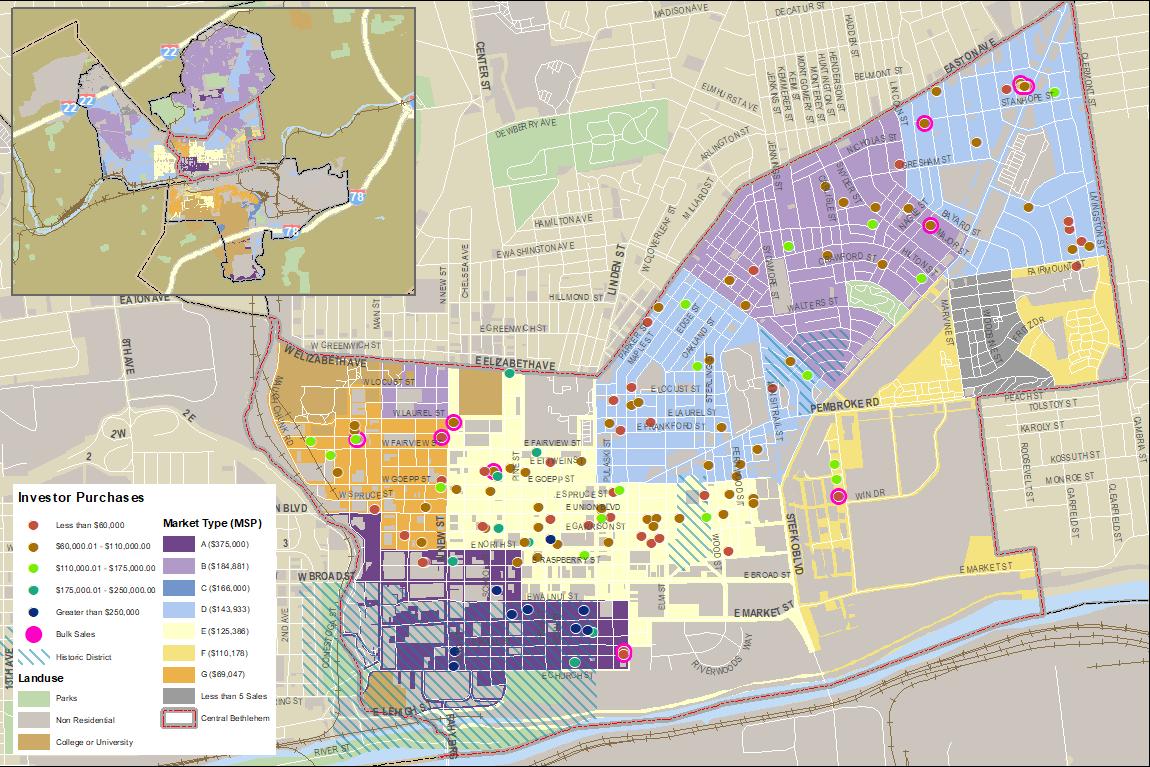
G This block group is one of two “G” markets on the Northside. It stands out for having a high share of investor activity; a number of investor-owned properties appear to cater to Moravian College students. Renters make up more than half of households but use of rental subsidy (Housing Choice Vouchers or place-based units) is low. A larger than average share of 2-4 family properties, enhances perceptions of high density though it is less dense than about half the Northside markets. Code enforcement is essential with so many investor-owners.
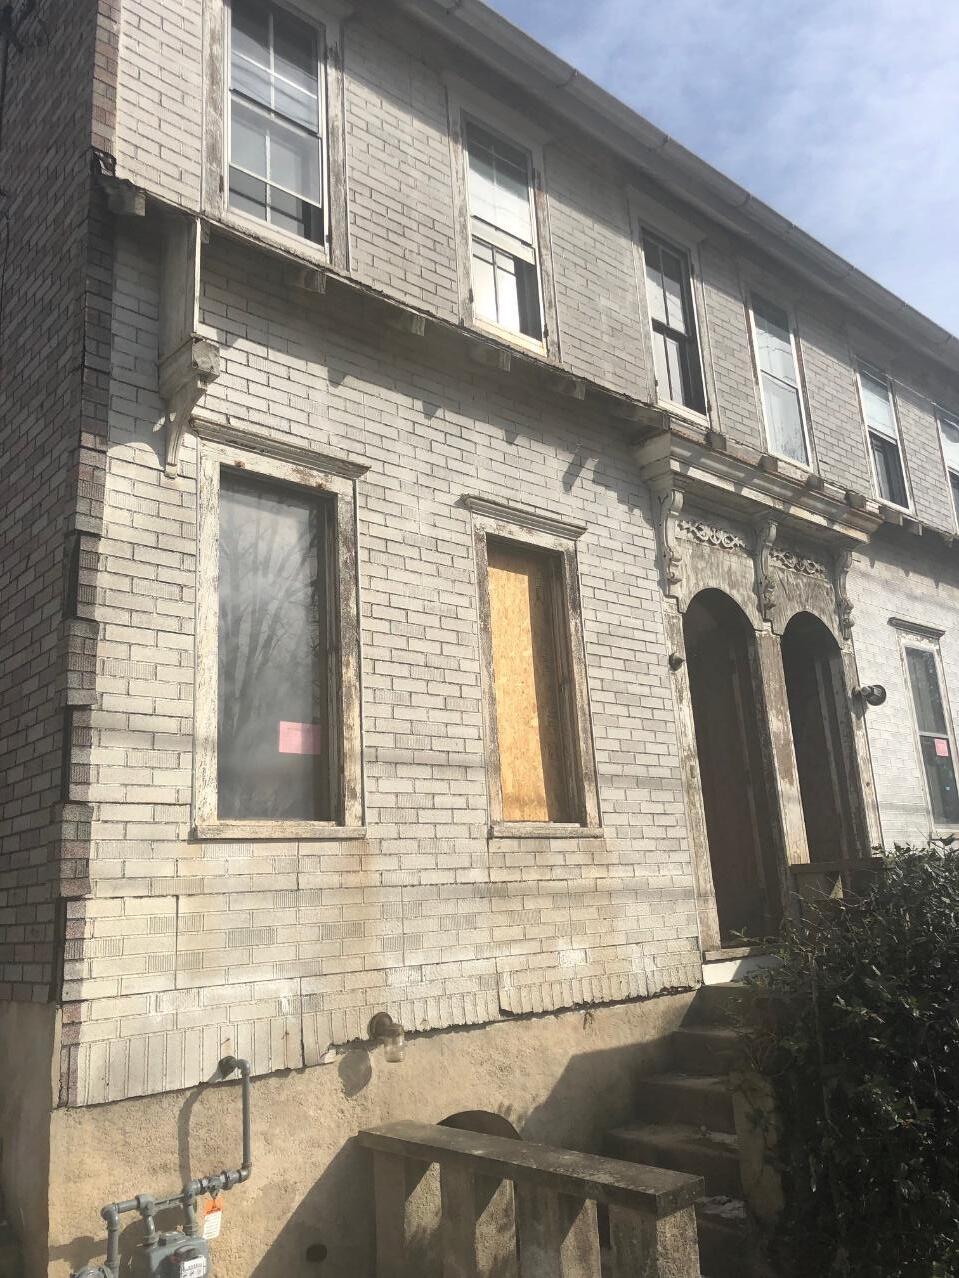
Bethlehem MVA (2017)
Median Sales Price, 2015-2017q2 $82,250
Variance of Sales Price 2015-2017q2 0.48
Percent of Two-to-Four Family Sales, 2015-2017q2 6.25%
Percent of Condo Sales, 2015-2017q2 0%
Percent of Households Owner Occupied, 2015 42.58%
Percent of Rental Units with Subsidies 15.21%
Residential Density, 2017 18.57
Percent of Investor Purchases, 2015-2017q2 18.75%
Percent of Properties with Multiple Permits, 2015-2017 6.09%
Percent of Properties with New Construction Permits, 2011-2017 0%
G This is the Northside’s weakest submarket, with the highest incidence of multiple code violations and certified blight. Still, this “G” block group had a higher median sales price ($82,250) than otherwise similar “G” markets on the Southside, where the median was as low as $50,000. This likely indicates that property owners are able to capture relatively high rents, reflecting proximity to stronger markets and general demand for rentals Community members expressed concern around unregulated subdivision of units and crowding in this area
Percent of Properties Distressed, 2015-2017q2 8.41%
Percent of Properties with Multiple Violations, 2015-2017 23.61%
Percent of Properties Blighted, 2015-2017q2 2.32%
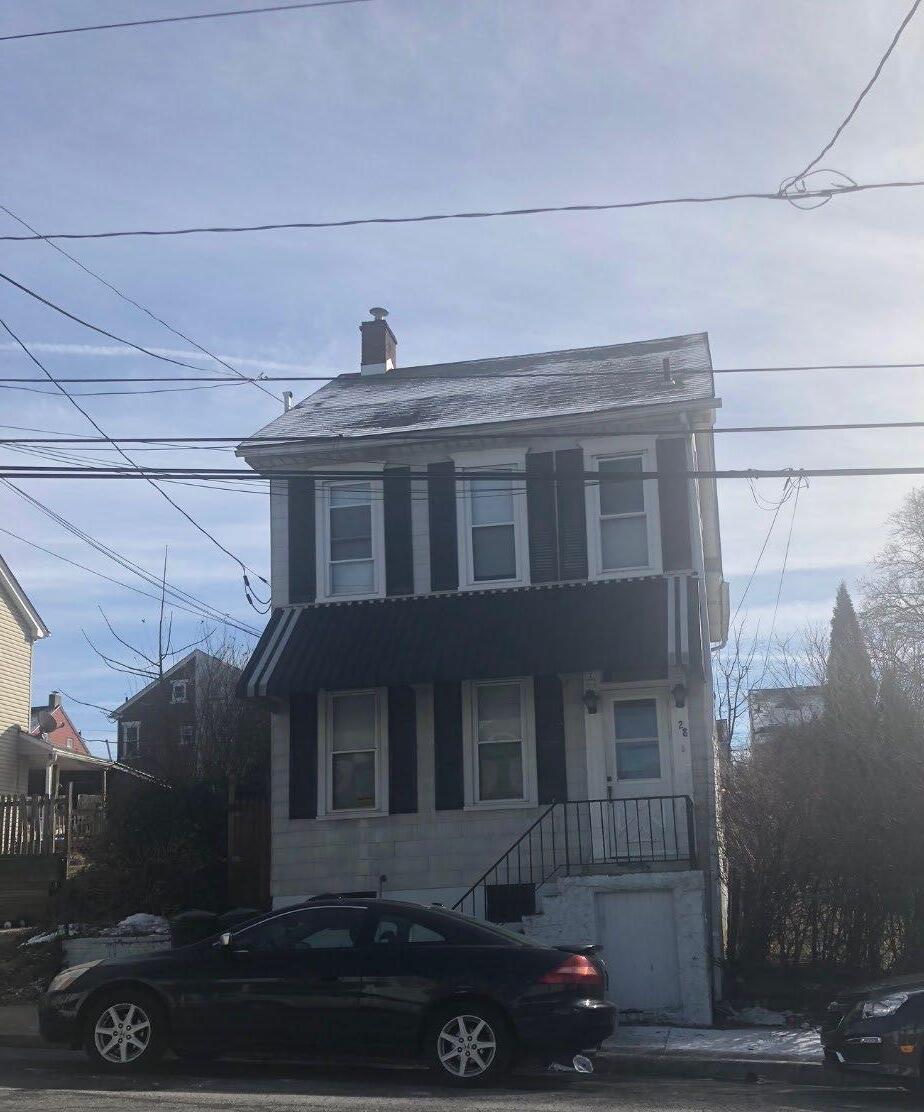
Bethlehem MVA (2017) B The strength of this area led Reinvestment Fund to split this Census block group in the Market Value Analysis (the other half became Market 2). The character of this market was also notably lower density than the southern part of the block group, with essentially no multifamily buildings, very low rates of distress and violations, and no blighted properties. Building permit activity indicates robust investment.
Bethlehem MVA (2017)
E This middle market has a median sales price below the average for the “E” category but is relatively stronger than other similar markets in terms of permitting activity, blight and distress. There area is about two-thirds renters, with very little use of subsidy. Investor ownership and properties with multiple violations are about average for the “E” category, which puts them above the city average. Community members expressed concern about this area’s trajectory at public meetings
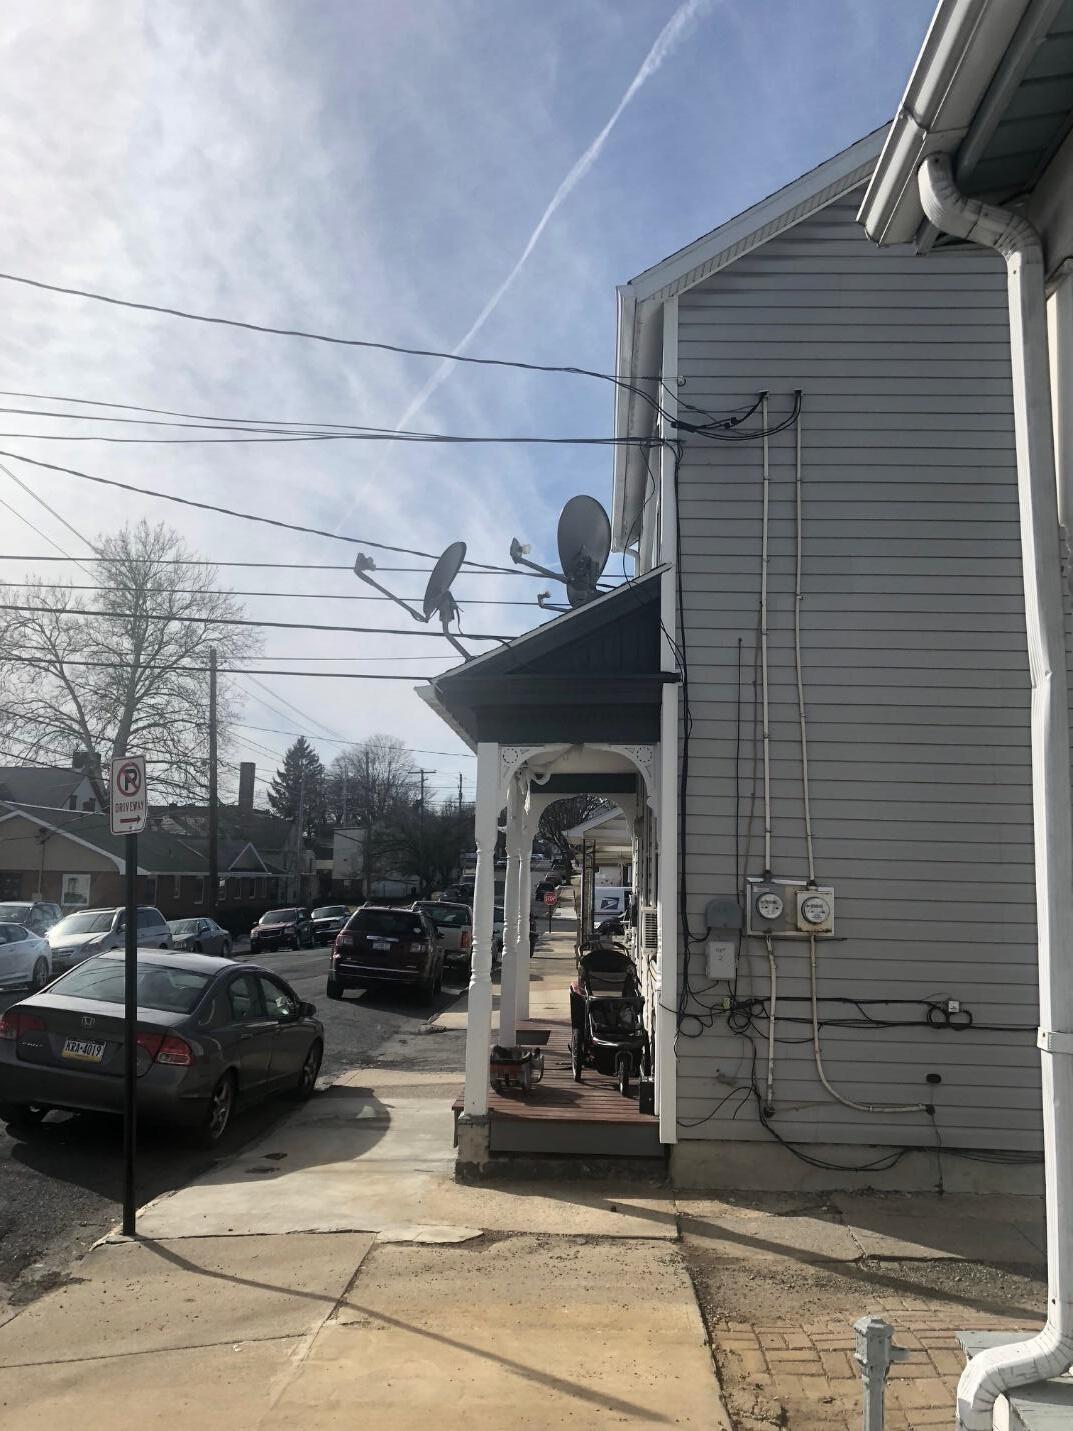
Bethlehem MVA (2017)
E This area is similar to Market 4 but with slightly higher sales prices, more homeownership and less investor activity There is wide mix of housing types from single family detached to multi-family. Friendship Park is a promising asset for this area as the city supports its revitalization.
D Only a small part of this market falls with the Northside 2027 Neighborhood, though a number of residents of this area attended public meetings despite living outside the planning boundaries – this was clear from the row of stickers place at the edge of map. This market is substantially more suburban in feel, with larger single-family homes set back from the street with lawns. This area is steady but does have an elevated number of properties with multiple violations.
Market 7 Value
Median Sales Price, 2015-2017q2 $115,000
Variance of Sales Price 2015-2017q2 0.38
Percent of Two-to-Four Family Sales, 2015-2017q2 7.35%
Percent of Condo Sales, 2015-2017q2 0%
Percent of Households Owner Occupied, 2015 62.81%
Bethlehem MVA (2017) E As with Market 7, only a small piece of this area falls with the plan boundaries. This “E” market has high homeownership (almost 63%). Among renters, subsidy use was high. Within the 2027 area, much of the housing stock is large semi-detached (twin) homes in relatively good condition.
Percent of Rental Units with Subsidies 23.95%
Residential Density, 2017 19.41
Percent of Investor Purchases, 2015-2017q2 30.88%
Percent of Properties with Multiple Permits, 2015-2017 3.07%
Percent of Properties with New Construction Permits, 2011-2017 0%
Percent of Properties Distressed, 2015-2017q2 5.75%
Percent of Properties with Multiple Violations, 2015-2017 32.31%
Percent of Properties Blighted, 2015-2017q2 0.19%
Market 8 Value
Median Sales Price, 2015-2017q2 $126,000
Variance of Sales Price 2015-2017q2 0.3
Percent of Two-to-Four Family Sales, 2015-2017q2 18.18%
Percent of Condo Sales, 2015-2017q2 0%
Percent of Households Owner Occupied, 2015 28.24%
Percent of Rental Units with Subsidies 13.11%
Bethlehem MVA (2017) E This area is similar to Market 5. Reinvestment Fund split the Census block group containing this and the stronger market directly to the south, which bears more similarity to historic district. Market 5 is a steady market with modest homes, including smaller houses fronting the “alley” streets like Raspberry and Pine Streets.
Residential Density, 2017 21.27
Percent of Investor Purchases, 2015-2017q2 18.18%
Percent of Properties with Multiple Permits, 2015-2017 3.03%
Percent of Properties with New Construction Permits, 2011-2017 0%
Percent of Properties Distressed, 2015-2017q2 4.04%
Percent of Properties with Multiple Violations, 2015-2017 42.86%
Percent of Properties Blighted, 2015-2017q2 1.01%
A This is the strongest market in the study area and one of the highest value markets in the city. This is a classic downtown market: high density, an overwhelming share of renters, and a notable share of homeowners in condo units. There was an absence of new construction but a healthy amount of permitting indicated investment in maintaining and upgrading the market’s unique historic stock.
Where different market types converge, limited dollars can be used for strategically for greater impact.
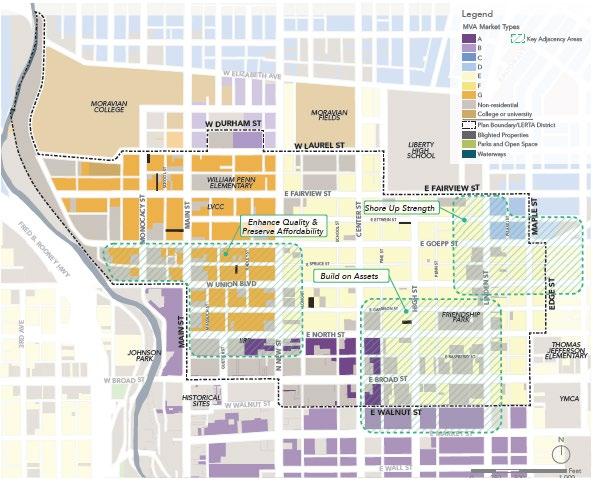
Enhance Quality and Preserve Affordability: Focusing repair activity in the weak market blocks just outside the “A” market (North to Goepp St., Mauch Chunk to Long), could yield high return on investment in the form of increased assessed values and tax revenue as proximity to strength unlocks nascent value. There is also opportunity to create long term affordability at a relatively low cost through strategies like acquisition/rehab loan funds for landlords who agree to keep rents affordable and firsttime homeownership programs that stabilize the area and provide owners with long term equity gains
Build on Assets: Intentional investment around existing assets at the intersection of the Northside’s purple and yellow markets (the blocks around Broad and High Streets) can preserve value in the middle market areas and prevent any potential future decline as a result of proximity to weaker markets The momentum around revitalizing Friendship Park should be extended to working with owners to maintain residential properties to ensure they are in sound shape and convert underutilized commercial space to residential (with encouragement from LERTA) to increase vitality and take the pressure off investorheavy rental markets to the west by increasing supply.
Shore up Strength: Where blue and yellow markets meet, programs to stabilize homeownership through refinancing and foreclosure prevention enhance long term value while serving diverse households looking for different types of homes, from smaller attached homes to more suburban

From the fall of 2017 through the spring of 2018, the City of Bethlehem undertook an eight-month planning process to develop a Blight Remediation and Mitigation Plan, which became the Bethlehem Blight Betterment Initiative (B3). The purpose of the process and plan was to establish a regulatory and legal framework for restoring properties that are blighted or showing signs of deterioration, and to build commitment from the City's partners to tackle blight and invest in struggling neighborhoods by working together through community-driven projects.
Although the city’s largest concentration of certified blighted properties was around Lehigh University on the Southside, there was also a significant cluster of blight just outside the Northside historic district. Given the demonstrated interest investors have shown in the Northside’s housing stock and the high rents commanded there, some lighter touch blight remediation tools, described below, may be more effective than in deeply troubled markets in other cities or even Bethlehem’s Southside, where more significant public sector redevelopment dollars may be required.
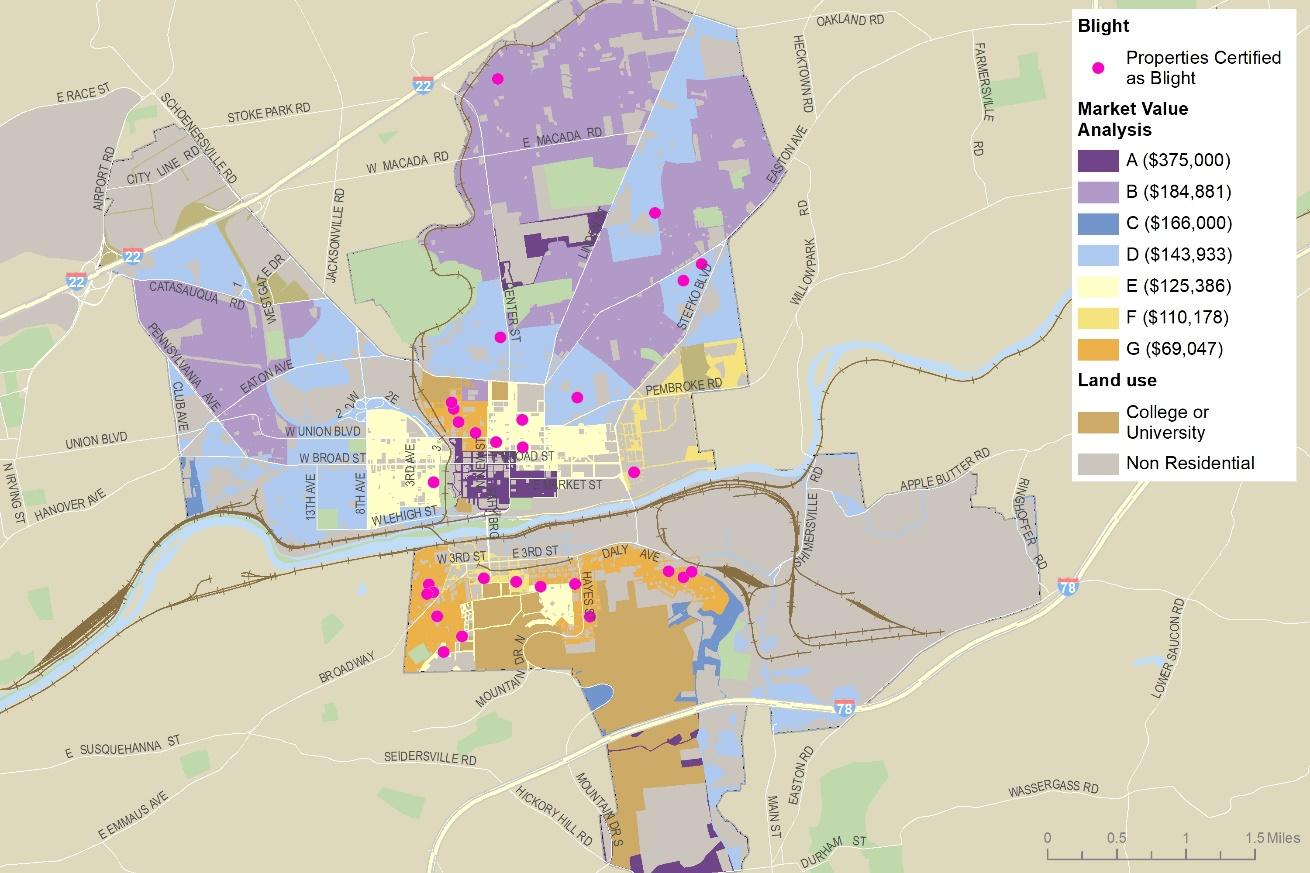
Relevant B3 strategies
Use MVA clusters to prioritize activities for blighted properties. The Bethlehem Redevelopment Authority had officially designated 29 properties as blighted at the time of B3, in addition to other blighted properties. The City should prioritize the revitalization of certified blighted properties located within the Northside’s most stressed areas (Markets 1 and 2) and the more central yellow areas (Markets 4, 5, 8). These could be targets for rehab (particularly for properties where existing strength in nearby areas increases the likelihood of redevelopment success) or demolition if re-use is unlikely or safety is a major concern. Cleared sites can be transformed to side yards, vacant lots for sale/redevelopment, or open spaces for recreational use.
Quality-of-Life Ticketing Pilot. This is a relatively low-cost way to address code violations as part of a data-driven, strategic code enforcement process. The goal is to eliminate unsightly conditions on the exteriors of properties – such as high weeds and grass, trash, and abandoned vehicles, appliances, or furniture – that violate specific requirements of the City's property maintenance code. When code inspectors find a property violation, they issue a courtesy notice to the property owner in the form of a ticket or door hanger notice, along with a deadline for corrective action. Quality-of-life violations are treated like parking tickets fines and actions to correct the violations are due immediately. When the owner refuses to fix the condition or pay the fine, however, a citation is issued and the matter lands in court. Pennsylvania cities including Reading, Wilkes-Barre, and Hazleton have adopted quality-of-life ticketing in residential neighborhoods and along commercial corridors. A quality-of-life ticketing program could be piloted in the Northside’s middle markets (D and E) for a 6- to 12-month period to test
the approach in areas that are not the most difficult to serve, while providing an opportunity to assess implementation
The Local Economic Revitalization Tax Assistance (LERTA) program is a state tax abatement tool designed to incentivize property investment and redevelopment of difficult properties. The City of Bethlehem created an expanded Northside LERTA district in 2017. Within the district, property owners receive a 10% abatement on assessable improvements each year for ten years. This applies to commercial, industrial, and business properties
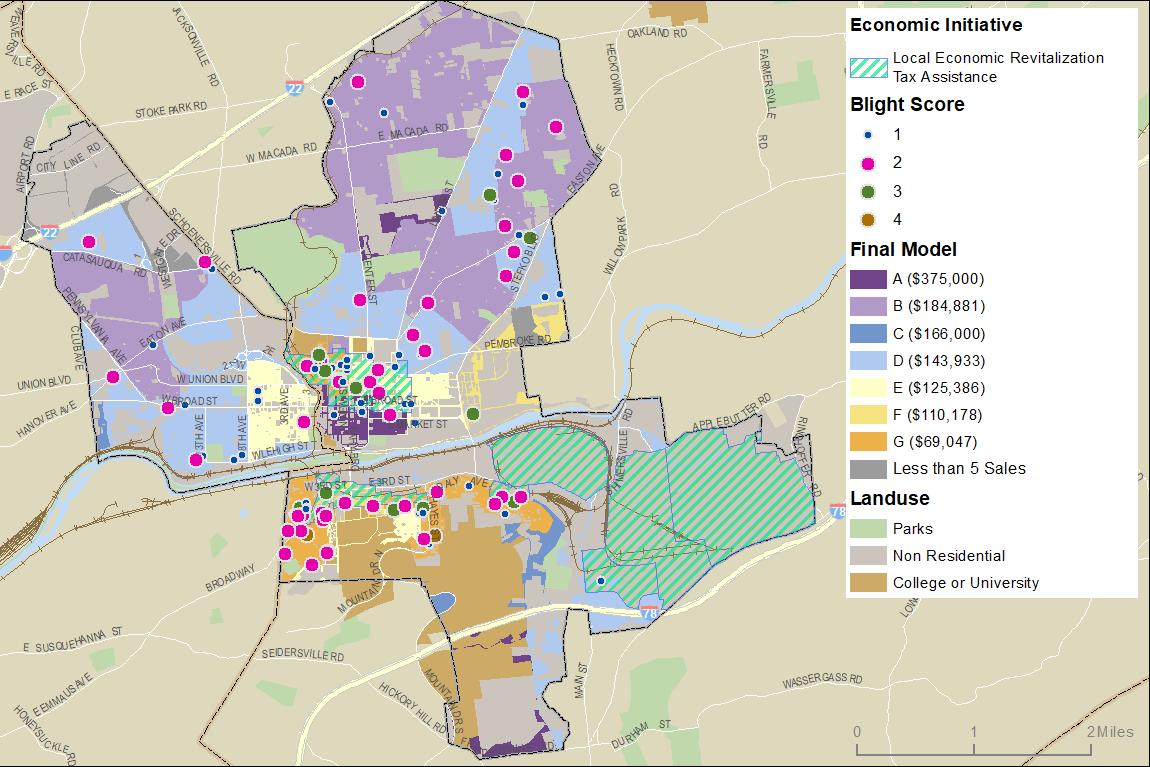
The LERTA district should be used to encourage responsible developers to meet the high demand for rental units with better quality options that have a positive impact on neighboring homes and quality of life. This can be accomplished both through rehab of existing stock, including the conversion of blighted or underused commercial space, and also through filling in a major housing gap on the Northside: new construction. This could be of particular relevance on Broad Street moving east from the core commercial district. For example, LERTA designation supported the Phoenixville Village Apartments in Chester County, a $35 million, mixed-use development of 275 housing units and 20,000 square feet of retail space. A similar project, even one more modest inside, could draw energy further down this major corridor, and help relieve pressure on adjacent markets. LERTA can also be used to bolster first-time homeownership efforts by reducing monthly payments for the first ten years of a mortgage; this could help long-term residents purchase, rehab, and live in properties that otherwise might go to investors.
RESOURCE DIRECTORY
online, that would provide basic information and contact information for a range of service providers from volunteers who can shovel snow in the winter to contractors and city loan programs.
Repair Grants to Reduce Unsafe Conditions and Abandonment. Grants for home repairs may be necessary. A study of the Philadelphia Basic Systems Repair Program (BSRP), which provides low-income residents with grants for critical repairs, found its investments reduced the rate of housing abandonment in highly distressed areas of the city. BSRP provides free repairs to correct electrical, plumbing, heating, structural and roofing emergencies to income-qualified owner-occupied homes in Philadelphia. There is a separate Heater Hotline which provides free emergency heater repairs for eligible households.
Targeted Refinance Loans to Revitalize Fragile Blocks. In Baltimore, financing products that allowed higher loan-to-value ratios were needed in targeted redevelopment areas where homes had low appraised values and significant repair needs. The Healthy Neighborhoods program operates a revolving loan pool that allows homeowners to refinance their homes in order to undertake repairs and improvements. The loans are structured to provide up to 110% of the after-rehabilitation appraised value. Loans have no income requirements, but only residents of targeted neighborhoods are eligible. ii
Assisting mission-driven organizations to acquire properties and providing repair subsidies that come with rental restrictions can help preserve existing affordable options.
Leveraging private capital for preservation. Social impact investors in the Twin Cities are working with The Greater Minnesota Housing Fund to raise $25M to preserve existing low-cost housing in the Minneapolis area. Called the Naturally Occurring Affordable Housing Fund, it targets multi-family properties and provides low-cost financing for qualified nonprofits to purchase properties in order to maintain their affordability.
Many landlords manage a small number of properties and may lack the capacity to provide adequate maintenance. Providing resources to these landlords can improve housing quality.
Professional Development for Landlords The DeSales Community Housing Corporation in St Louis created the Management Assistance Program (MAP) to support the small-scale landlords of properties near the CDC’s own rental stock. MAP provides these owners with free management services and training to maintain the quality of housing throughout the neighborhood.
In Philadelphia, the Department of Licenses and Inspections has engaged in a novel and geographically targeted enforcement effort utilizing a 2010 Pennsylvania law (PA Act 90) combined with the city’s property and maintenance code. The strategy led to a 32% increase in residential real estate sale price near enforcement activities, compared to 2% in similar areas, and a reduction in tax delinquency in targeted areas versus an increase in similar areas.
At community meetings, some Northside homeowners mentioned feeling overwhelmed by the prospect of seeking repairs – how to prioritize, how to finance, how to find a reliable contractor, and so on. Other residents noted that the elderly and other less mobile residents might have difficulty performing basic maintenance. There was broad interest in a resource guide, to be made available in hard copy and 16
Incenting Deconversion of Small multifamily buildings to Single Family
These programs work best in weak/low-demand housing markets for two reasons: a) Incentive value needs to exceed rental income – it can quickly become too expensive for a local program to make an impact when rental properties are profitable, as they are on the Northside; and b) in high-demand markets, the loss of unit volume due to deconversion can just exacerbate crowding in remaining multifamily properties.
Allentown, PA targeted vacant/blighted or tax delinquent multifamily properties for purchase, conversion and sale as single family – sometimes with a nonprofit CDC partner. Ithaca, NY used bond funds to subsidize a local nonprofit to purchase and reconvert poor quality multifamily rentals back to single-family form and sell them to owner-occupants. The city also conducted outreach to property owners in danger of tax or mortgage foreclosure to buy them out quickly and turn the property around. The redevelopment authority of Rutland, VT took a geographically targeted approach in an area of high property vacancy/abandonment by combining demolition of dangerous/unsalvageable with

The matrix below matches
Strategy A/B D E G Other Considerations
Resource Directory X X X X
Homeowner Repair and Rehabilitation Grants X X X
Distribute copies in all submarkets through community partners (schools, churches, organizations). Give website clear caretaker “home” to ensure it stays up to date
Ideal in appreciating areas with low-income owners, or in weak areas directly adjacent to strong ones; city staff or neighborhood organizations who can conduct outreach are advantageous
Homebuyer Assistance X X Credit counseling and down payment assistance grants in areas with low to moderate vacancy to stabilize homeownership rates.
Home Repair
Tax Incentives X X X
Maximize LERTA designation and existing tax incentives through active outreach to owners, developers, and local mortgage brokers
Landlord Repair Loan Fund X X A low-interest loan program for façade and basic systems repair can address aesthetic and structural issues and prevent blight and reduce tensions between owners and renters.
Partner with Responsible Landlords X X
Targeted code Enforcement X X
Foreclosure Prevention X X
Targeted deconversion X X
Assist responsible landlords (private and nonprofit) in acquiring additional properties and provide technical assistance to less experienced property owner/managers
Focus on low-quality rental areas. Additional resources may be required for success if landlords lack resources (see repair fund)
Best for areas with high homeownership rates and moderate foreclosures or growing foreclosure concerns. Use to prevent strong/middle areas from weakening
Identify single family properties converted to multifamily that are blighted or tax delinquent for use of limited conversion resources
17
18
Strategy A/ B D E G Priority Market/ Location
Resource Directory X X X X 1 Neighborhood-wide distribution
Homeowner Repair and Rehabilitation Grants X X X 1
Markets 5, 6, 7, 8, particular focus around assets like Friendship Park, elementary schools, and market borders (e.g., Linden and Goepp).
Homebuyer Assistance X X 2 Markets 4 and 5
Home Repair
Tax Incentives X X X 2
Focus outreach within LERTA designation where orange/yellow markets (1, 2, 4, 5, 8) meet purple (9) – North Street is a candidate.
Landlord Repair Loan Fund X X 1 Markets 1 and 2, particularly southern portions (e.g. Spruce and Garrison Streets from Main to New Street.)
Partner with Responsible Landlords X X 3
Targeted code
Focus on weakest and most at-risk of decline: Markets 2 and 4. More visible and larger buildings on main thoroughfares e.g., New and Union Blvd.) present opportunities for greater impact.
Enforcement X X 1 Markets 1, 2, 4, 8
Foreclosure Prevention X X 2 Markets 6 and 9
Targeted deconversion X X 3
Driven by availability of tax delinquent / blighted properties. Market 2 to address community concerns, Market 8 to restore character of historic homes.
The City administers a program that assists low-income homeowners to make needed repairs to their homes. An estimated 25 to 30 homes are repaired annually through this program.
The City provides CDBG and HOME financing to developers for the construction of affordable rental housing. In the City’s 5-Year Consolidated Plan, the City designates the downtown and Central Business District area as neighborhoods that can benefit from this program while supporting rental construction anywhere in the city. Developers rehabilitate mixed-use buildings with commercial space on the ground floor and conversion of the second and third floors into affordable rental housing. Currently, the program is funded to develop approximately five rental units per year.
The City provides low-interest financing to businesses for restoring storefronts and building façades in designated commercial corridors.
Property owners can receive a 10% tax abatement for ten years on new or substantially rehabilitated commercial, industrial, or residential properties located in the designated LERTA district.
The City is a sub-grantee of $1.2 million allocated from U.S. Department of Housing and Urban Development (HUD), through the Commonwealth of Pennsylvania and Northampton County. Through this grant program, the City offers grants to residents living with lead-based paint hazards and “unhealthy” homes. Grant priority is given to homes where a child under age six lives and/or spends significant amount of time. The residents (not owner) must income qualify, and on average will be eligible for between $12,000 - $15,000 in lead hazard remediation and home repairs.
Community Action Committee of the Lehigh Valley/Development Corporation of Bethlehem CACLV/CADCB has focused on Southside for its housing-related programs, but is a strong source of local expertise around façade improvement, long-term affordability strategies (e.g., land trusts)and financial counseling and services that support stable homeownership for first time and moderate income buyers.
Gordon Whitman. “Blight Free Philadelphia: A Public-Private Strategy to Create and Enhance Neighborhood Value.” (2001) Research for Democracy
ii “First Mortgage Loan to Purchase/Rehab and Refinance/Rehab.” (2015) Healthy Neighborhoods.
