

AAAA Dashboard Q3 2022

Page 1

DASHBOARD Q3 2022

The voice of the independent aftermarket in

Australia 1. State of the Market 2. Vehicle Trends over Time 3. EV Sales & Growth Welcome to the Q3 2022 Edition of the Aftermarket Dashboard, a quarterly information service for members of the AAAA. This industry publication captures useful statistical and related data, as indicators of the unfolding trends and health of the automotive aftermarket industry, and has been designed to provide regular insight on our industry. We value your suggestions for improvement or feedback regarding content. Data sourced from VFACTS New Car Sales Data and the ABS Motor Vehicle Census Australian Automotive Aftermarket Association Dashboard. Presented by ACA Research. Copyright © 2022. 4. Industry Headlines

1. State ofthe Market

Australian Automotive Aftermarket Association Dashboard. Presented by ACA Research. Copyright © 2022.

Australian Economic Indicators

Consumer Confidence Business Confidence

Prices

Consumer confidence has fallen again off the back of further interest rate rises and inflationary pressure in critical household categories such as groceries and utilities.

suggestions are that we are moving towards the end of this cycle locally, major economies around the world appear to be facing significant pressure; allied with ongoing uncertainty around the war in the Ukraine this will continue to impact consumer confidence into 2023.

confidence has also fallen through Q3, dropping into negative territory (under 100) as businesses continue to face cost pressure and inconsistent supply. In particular, any businesses involved in the distribution or supply of imported products will continue to struggle given weaker exchange rates and high shipping costs.

Alongside this, ongoing issues around the availability of labour are likely to persist, particularly in sectors like automotive that require significant investment of time and money into staff training and development.

Petrol prices fell in Q3, averaging 7c a litre less across the country than in the previous quarter. We can however foreshadow a significant rise in Q4 given the end of the 6-month reduction in fuel excise on the 28th September. This allied with reduced global production forecasts mean that fuel prices will rise, placing further pressure on already stretched household budgets. It will also eat away at business profitability, which is particularly concerning for low margin sectors like road freight transport.

83.3 (7.8) 4 Australian Automotive Aftermarket Association Dashboard. Presented by ACA Research. Copyright © 2022.
Fuel
$1.82 (7c) Westpac Melbourne Institute (Q3’ 22, vs. Q2’ 22) Roy Morgan (Q3’ 22, vs. Q2’ 22) 97.2 (6) AiP - Ave weekly price (Q3’ 22, vs. Q2’ 22) Business
While

New

Sales

Vehicle
by Quarter 257,028 202,476 248,672 0 100,000 200,000 300,000 400,000 Q1 Q2 Q3 Q4 Q1 Q2 Q3 Q4 Q1 Q2 Q3 Q4 Q1 Q2 Q3 Despite varying levels of vehicle availability by brand continuing through the quarter, overall sales numbers were above the comparable quarters over the past three years. This puts Australia well on track to exceed one million new vehicle sales in 2022, with the final total likely to end up closer to 1.1m sales through the calendar year. Ongoing vehicle supply shortages (which are likely to continue through 2023) appear to have fundamentally reshaped vehicle purchasing patterns, smoothing the historic EOFY bump, and instead redistributing sales across the year based on vehicle availability. 273,272 2022 sales volume in Q3 2019 2020 5Australian Automotive Aftermarket Association Dashboard. Presented by ACA Research. Copyright © 2022. 10% Year on Year 2021 2022

New Vehicle Sales by State

State level results vary significantly, but we do need to consider where each of them was in Q3 2021, with the states that had less COVID-related restrictions in place (e.g. Western Australia) facing less significant reductions in vehicle sales. As a result, some of the data we’re seeing in this quarter is really a correction to the norm, as against a strong improvement.

Ultimately, the distribution of new vehicle sales across the country is largely reflective of population proportions as consumers and businesses nationwide return to more normal vehicle ownership and replacement cycles.

State Q3 Volume % Chng (YoY) Q3 Share

New South Wales 85,965 19% 31%

Victoria 72,496 10% 27% Queensland 60,913 4% 22%

Western Australia 25,487 -8% 9% South Australia 17,356 0% 6% Tasmania 4,568 6% 2% Australian Capital Territory 4,083 21% 1% Northern Territory 2,404 -9% 1%

TOTAL 273,272 9%

Australian Automotive Aftermarket Association Dashboard. Presented by ACA Research. Copyright © 2022.

6

New Vehicle Sales By Marque

New vehicle sales by brand remained somewhat turbulent through this

more by

availability

remains firmly anchored to the top of the list, selling more than 55,000 vehicles through the quarter.

With that said,

Mazda also had a strong quarter, displacing its

competitors to take 2nd

3rd,

1,000

Kia also managed to hold

separate the two

as they combined for more than 40,000 sales in the quarter.

down,

as

continues

push a strong EV line-up (as part of

quarter, with sales performance dictated
vehicle
than market demand.
Toyota
Korean
spot with almost 24,000 vehicles sold.
off Hyundai for
although less than
vehicles
brands,
Further
Tesla is a strong entrant to the top 10 off the back of high volumes of Model 3 and Model Y sales, with MG also well entrenched on the list
it
to
its broader strategy). Australian Automotive Aftermarket Association Dashboard. Presented by ACA Research. Copyright © 2022. Q3 vs Q2 Rank Make Q2 Volume % Chng YoY Q2 Share 1 Toyota 55,033 5% 20% 2 2 Mazda 23,962 4% 9% 3 1 Kia 20,781 26% 8% 4 1 Hyundai 19,936 22% 7% 5 Mitsubishi 18,775 22% 7% 6 Ford 16,913 3% 6% 7 36 Tesla 9,370 N/A* 3% 8 2 MG 9,353 0% 3% 9 Subaru 8,949 3% 3% 101 Volkswagen 8,588 -33% 3% TOTAL 273,272 9% 55,033 vehicles sold Toyota 7

2. Vehicle Trends Over Time

Australian Automotive Aftermarket Association Dashboard. Presented by ACA Research. Copyright © 2022.

Manufacturing Location (Top

Given Toyota’s position in market (as well as other brands such as Mazda and Mitsubishi), it’s no surprise that Japan is consistently the top country of origin for

sold in Australia. Thailand and Korea then take 2nd and 3rd

off the back of well established

operations in each country.

down the list, we can see a shifting dynamic, with more Chinese-made

entering the country, as the number of German, American and British made vehicles declines.

is likely to continue this growth in coming years, with brands like BYD planning aggressive expansion in Australia.

9Australian Automotive Aftermarket Association Dashboard. Presented by ACA Research. Copyright © 2022. 0 50,000 100,000 150,000 200,000 250,000 300,000 350,000 400,000 2015 2017 2019 2021
8)
vehicles
slot
auto manufacturing
Further
vehicles
China
Country 2015 2021 2021 Share Change vs. ‘15 Japan 335,288 350,934 33% 5% Thailand 249,804 230,506 22% 8% Korea 140,172 145,025 14% 3% Australia 97,443 0 0% 100% Germany 87,894 43,143 4% -51% USA 58,104 34,958 3% -40% England 32,084 18,165 2% 43% China 2,320 76,262 7% 3187% Other

Annual Sales by Buyer Type

We have also seen some shifting trends in buyer type over recent years. Private and fleet buyers clearly have different needs when it comes to maintaining their vehicles, so this trend is important to understand.

Prior to the pandemic, we saw declining levels of private vehicle purchasing, with a greater proportion going to fleet buyers (whether business, govt, or rental fleets). That trend ended in 2020, with almost two thirds of vehicles sold to private purchasers. Meanwhile, businesses pulled back sharply on spending, with 2020 sales back below 2015’s results.

Despite the end of the pandemic, challenging economic conditions in 2022 suggest that it could take a while for business spending to return to the more buoyant level, suggesting that consumers will make up the bulk of new vehicle buyers for a certain time yet.

10Australian Automotive Aftermarket Association Dashboard. Presented by ACA Research. Copyright © 2022.
Share 15’ 16’ 17’ 18’ 19’ 20’ 21’ Private 54% 50% 48% 46% 47% 60% 54% Business 37% 41% 42% 43% 43% 42% 38% Gov’t 4% 4% 3% 3% 4% 6% 3% Rental 5% 5% 6% 7% 7% 4% 6% 0 100,000 200,000 300,000 400,000 500,000 600,000 700,000 2015 2017 2019 2021 Private Business Government Rental

Private

Type Breakdown

Digging deeper into vehicle purchasing, and we can see some trends in the types of vehicle they purchase as both groups move away from passenger vehicles. In both cases, the proportion of passenger vehicles purchased in 2021 is around half (or less) of what it was in 2015.

While the overall pattern is similar, we can however see that the destination is quite different. Since 2019 more than half the privately purchased vehicles have been SUVs, with this segment now making up almost two thirds of sales. Surprisingly, despite the greater presence of utes on Australian roads, they still make up a similar share of total sales to private buyers.

In contrast, business buyers are more evenly split with around two in five vehicles purchased being SUVs, and a similar proportion being utes.

vs. Business Buyer
Australian Automotive Aftermarket Association Dashboard. Presented by ACA Research. Copyright © 2022. 11 PRIVATE 47% 45% 42% 38% 34% 28% 24% 41% 38% 34% 29% 26% 21% 18% 41% 43% 45% 49% 53% 59% 61% 33% 34% 36% 40% 41% 44% 42% 12% 12% 13% 13% 13% 13% 15% 26% 28% 30% 31% 33% 35% 40% LCV SUV PASSENGER 15’ 16’ 17’ 18’ 19’ 20’ 21’ BUSINESS 15’ 16’ 17’ 18’ 19’ 20’ 21’

3. EVSales & Growth

Australian Automotive Aftermarket Association Dashboard. Presented by ACA Research. Copyright © 2022.

EV

Vehicle

a

that is to a

of

13Australian Automotive Aftermarket Association Dashboard. Presented by ACA Research. Copyright © 2022.
New
Sales Q3 EV sales are clearly dominated by Tesla, with the brand delivering more than three quarters of all electric vehicles in this quarter. While
certain extent a result of reporting based on vehicles are delivered as against sold (and
number
ships arriving in the current period), both the Model 3 and Y are clearly generating significant levels of demand. Coming months should see BYD start sharing sales data, which will also be added into this reporting. Vehicle Type Fuel Type Q3 Volume % Chng YoY Q3 Share Passenger Petrol 39,072 -23% 14.3% Diesel 3,145 41% 1.2% Hybrid 6,298 -4% 2.3% Electric 4,864 213% 1.8% PHEV 130 -5% 0% Hydrogen 1 57% 0% SUV Petrol 94,399 13% 34.5% Diesel 27,833 5% 10.2% Hybrid 11,961 2% 4.4% Electric 7,212 97% 2.6% PHEV 1,513 155% 0.6% Hydrogen 0 0% 0% Light Commercial Petrol 6,782 20% 2.5% Diesel 57,991 14% 21.2% Electric 15 -21% 0% Total 273,272 9% Q3 Rank Model Q3 Volume Q3 Share 1 Tesla Model Y 5,376 44% 2 Tesla Model 3 3,994 33% 3 Hyundai Ioniq 5 237 2% 4 Hyundai Ioniq 226 2% 5 Polestar 2 217 2% Q3 Total EV Sales 12,091

EV Car Parc and Projections

Registered Electric Vehicles

Electric

share of the

has grown

tenfold over the past 8 years, climbing from 2,976

in

to 20,310

can see though that

in

by more than 50% in the last year,

still only represent 0.1% of the total

are still a minor consideration in absolute terms, but this increase gives a good indication as to the current trajectory for electric vehicles, particularly as a wider

models are introduced into the market.

of more

14Australian Automotive Aftermarket Association Dashboard. Presented by ACA Research. Copyright © 2022.5,000 10,000 15,000 20,000 25,000 2013 2015 2017 2019 2021 0.02% 0.02% 0.02% 0.03% 0.04% 0.05% 0.04% 0.07% 0.11%
vehicles’
car parc
almost
vehicles
2013
vehicles
2021. We
whilst electric vehicle registrations grew
they
car parc. They
range
affordable
Fuel Type 2020 2021 2021 Share YoY Change Petrol 13,453,001 13,477,850 73.4% 0.2% Diesel 4,288,791 4,525,713 24.6% 5.5% Hybrid 145,725 132,248 0.7% 9.2% LPG/Other Gases 98,015 89,538 0.5% -8.6% Electric 12,842 20,310 0.1% 58.2% Other/Unknown 87,891 124,475 0.7% 41.6% Total 18,086,265 18,370,134 - 1.6%
EV Growth & Percentage of Total Car Parc (Source: ABS)

Industry Headlines

4.
Australian Automotive Aftermarket Association Dashboard. Presented by ACA Research. Copyright © 2022.

Industry Headlines

Capricorn state of the nation report

The State of the Nation report is Capricorn's landmark survey, taking a peek under the bonnet to understand the current state, issues and emerging challenges facing automotive industries in Australia and New Zealand More than 1,900 Capricorn Members across the two countries responded to the 2022 survey, providing a credible and useful snapshot of the industry across all business types from mechanical workshops to panel & paint, the commercial sector and more.

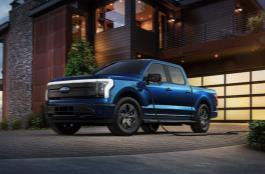
Electric utes are finally being shipped to Australia. They’re about to boom in popularity, report predicts

Despite the sentiment of electric utes being quite low amongst Australians, the first models are now being shipped. By 2030, electric utes and vans will make up over half of light commercial vehicle sales in Australia, according to modelling published today by the management consultancy Boston Consulting Group.
ZF’s Busconnect and Aftermarket news hits the expo

ZF is well known for its OE bus products and aftermarket offerings. At this year’s Australasian Bus & Coach Expo, the Oceania team will turn its focus to ZF’s latest telematics solutions for bus and coaches, Bus Connect. ZF Oceania Managing Director Mark Lowe stated, “Our main objective at this year’s Expo is to build awareness of our vast products and services that we can provide to the market locally.”

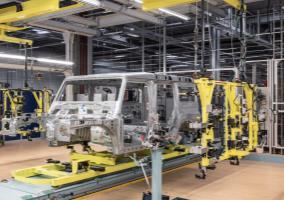
Ineos Grenadier production delayed until December

Ineos Grenadier production has begun but the firm has admitted that customer deliveries aren’t likely to ramp up until later this year as a result of parts and development delays. In a symbolic moment, the first Grenadier started going down the production line at the firm’s former Mercedes factory in Hambach yesterday (Monday). Insiders confirmed that this first car is likely to be kept by Ineos chairman Sir Jim for personal use.

The government is planning to grow Australia's electric vehicle market. How will it do it?

Australians will have greater choice of electric vehicles (EVs) as part of the federal government's push to encourage more people to take up the low emissions cars. High prices, limited stock and long waitlists have excluded most from the market, but a new national plan will help change that, Climate Change Minister Chris Bowen said.

Car Care Products Australia will remain in business selling its non-paint protection film products.

XPEL Inc., a global provider of protective films and coatings, has announced its acquisition of the paint protection film business of Car Care Products Australia, a distributor of automotive protective films serving Australia. Car Care Products Australia will remain in business selling its non paint protection film products.

16
Australian Automotive Aftermarket Association Dashboard. Presented by ACA Research. Copyright © 2022.

ACA Research

Australian Automotive Aftermarket Association Dashboard. Presented by ACA Research. Copyright © 2022. With over 20 years of automotive experience, ACA Research has developed a detailed understanding of the automotive sector, Using this market knowledge, we design and deliver research that helps our clients understand and overcome their business issues, empowering them to move forward with confidence. For more information, please contact: Ben Selwyn Matthew Beatty Director Account Executive ACA Research ACA Research 0411 132 166 0467 243 525 bselwyn@acaresearch.com.au mbeatty@acaresearch.com.au Level 6, 54 Miller St North Sydney NSW 2060 Australia +61 (2) 9927 3333 The Australian Automotive Aftermarket Association, is the national industry association representing manufacturers, distributors, wholesalers, importers and retailers of automotive parts and accessories, tools and equipment, as well as providers of vehicle service, repair and modification services in Australia. For more information, please contact: Lesley Yates Director of Government Relations and Advocacy Australian Automotive Aftermarket Association (AAAA) Convenor: Automotive Products Manufacturers & Exporters Council (APMEC) 7-8 Bastow Place Mulgrave VIC 3170 Australia +61 (3) 9545 3333 | 0402 005 476 lyates@aaaa.com.au About AAAA About

Turn static files into dynamic content formats.

Create a flipbook
Issuu converts static files into: digital portfolios, online yearbooks, online catalogs, digital photo albums and more. Sign up and create your flipbook.