ADAPTIVE FLOATING SETTLEMENTS
MArch. candidates: Panit Limpiti Hung-Wen Tseng
Emergent Technologies and Design Graduate School 2014-2016
Architectural Association School of Architecture
A research and design project that investigates on integrating different strategies to address wave energy reduction and develop organizational logics of floating settlements.
4
ACKNOWLEDGEMENT
With deepest gratitude to all who supported us and provided the means to be part of Emergent Technologies and Design program. To our families, friends, colleagues for their continuous encouragement, and source of competitive inspiration. To our tutors who patiently helped us develop this dissertation through their guidance, constructive criticism and encouragement. To our MSc teammates, Yutao and Patrick, for developing the fundamental concept for this project. To Liu Yong who helped us during the site study in China. And many thanks to Yi-Ning who help us to revise the text in documentation.
5
Panit Limpiti & Hung-Wen Tseng
6 1.0 Domain 2.0 Methods Introduction Abstract CONTENTS 1.4 Research Proposal 1.3 Case Study 2.1.2 Arrangement methods 2.1.1 Process overview 2.2.1 Tools and techniques 2.1 Process 2.2 Tools and Techniques 24 44 68 60 75 1.1 Initial research and proposal conclusion 1.2 Contextual Research 1.2.1 Aquaculture data 1.4.1 Design ambition 1.3.2 Malbory harbor 1.3.1 Fabrication process 1.1.1 Overview 1.2.3 Social provision 1.2.4 Coastal migration issue in China 1.2.5 Conclusion 1.3.3 Conclusion 1.1.3 Parameters and experiments synthesis 1.1.4 Wave reduction unit 1.1.5 Performance of wave reduction unit 1.1.6 Wave reduction unit context adaptation 1.1.7 Adaptive scenarios 1.1.8 Optimized settlements 1.1.9 Conclusion 1.2.2 Life necessities data 1.4.2 Targets 1.1.2 Principles and parameters synthesis 1.0.1 The problems of aquaculture settlements 1.0.2 Conclusion 1.0 Domain overview 14 13 77 85
7 3.0 Research Development 4.0 Design Development 5.0 Evaluation and Further Developments Bibliography Appendix 3.1 Network Experiments 3.2 Programs and morphologies 3.3 Assembly process 4.1 Permanent living settlement 4.2 A day of fisherman 3.1.2 Topological experiment 3.1.1 Network strategy 3.2.2 Programs categories and relationships 3.3.1 Assembly process scenarios 3.1.4 Node characteristics 3.1.3 Network analysis 3.2.3 Programs on nodes 3.2.4 Programs distribution strategy 3.3.2 Towards aquaculture dominant settlement 3.3.3 Settlement transformation method 3.3.4 Towards permanent living settlement 3.2.5 Node morphology evaluation 3.2.6 Node buoyancy strategy 3.3.5 Conclusion 4.1.1 Transportation network 4.1.1 Sub-node 4.1.2 Edge node 4.1.3 Central node 163 175 183 91 103 147 3.2.7 Node buoyancy capacity and bathymetry 3.2.8 Density strategy 3.2.9 Conclusion 3.1.5 Conclusion 3.2.1 Programs morphologies overview 5.1 Comparison of settlement scenarios 5.2 Conclusion 89 5.3 Further Developments 165
8
ABSTRACT
Adaptive Floating Settlement is a research and design project that investigates on integrating different strategies and design process to address wave energy reduction and develop organisational logics of floating settlements. The research was contextualised within a design proposal for a novel floating settlement situated in Lianjiang County in Fujian, China.
In this context, research was conducted concerning the aquaculture activities and environmental conditions of the site. The acquired data, along with information regarding the compound effects brought about by coastal migration, climate change, and increasing demand for food. The aim is to find potential solutions for floating settlements to be more adaptive and resilient to rapid changes in the environment and the needs of the society. Wave reduction techniques were then studies in order to inform the overall process and act as one of the principle design drivers for this project. For the purposes of meeting the project ambitions, design strategies were divided into two main axes which are wave reduction infrastructure and settlement organisational logic explorations. The context specific proposal was then developed through a series of experiments that led to the creation of a set of digital tools which facilitated the attempt for an integrated design approach.
9
Following the result of the MSc phrase that has experimented throughout the design of wave reduction unit to the settlement organisational logic, the MArch phase focused on a more indepth study of the settlement organisational strategy which includes the program morphology/density and the strategy of settlement assembly process. It not only dug into a more site-specific contextual research but also considered the situations in reality that influence the performance of the settlement. It is a project that investigated a possibility of a floating city to create a habitable area at sea and allow people to live on it permanently.
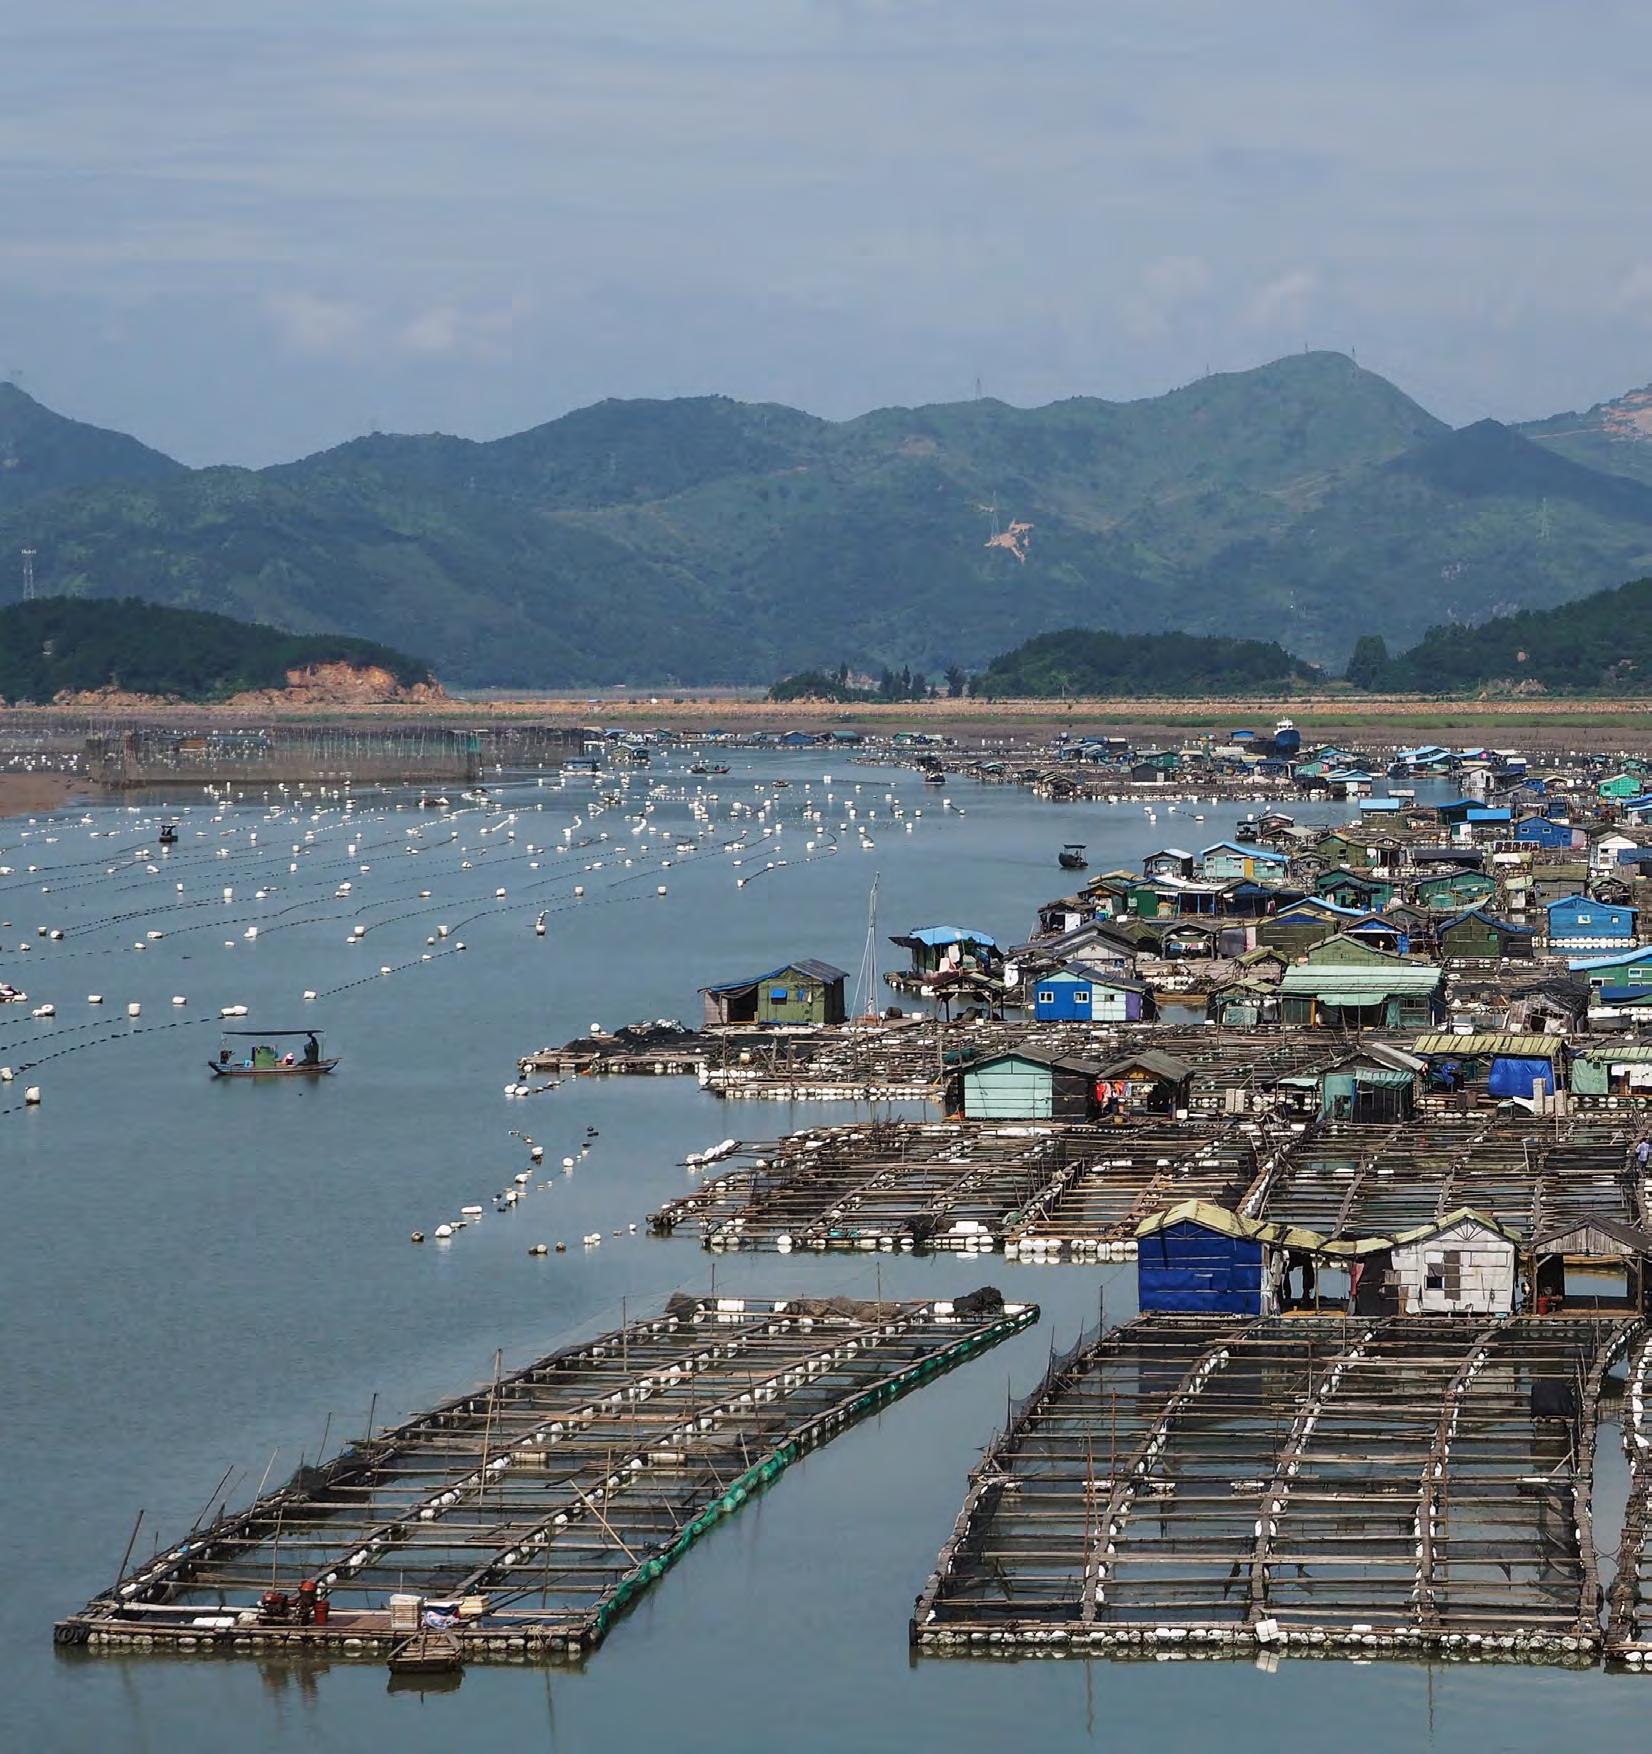
The research project is contextualised in Lianjiang County, Fujian, China, where existing aquaculture industry with floating settlement thrives, but also facing vulnerabilities from frequent storms - bringing destructive waves that damage properties and lives; and ‘informal’ or self-organised settlement - lack of an integrated system to address it.
Therefore, the research and design project has two main ambitions. First, develop and provide infrastructures that help minimize the impact of high waves, creating safe zones to
INTRODUCTION
allow settlements and livelihood activities to thrive. Second, to develop organisation logics for floating settlements based on the needs of aquaculture activities. Built on the MSc knowledge, the wave reduction system becomes a design driver for this project. Therefore, the aim of the MArch phase focuses on the second ambition, the settlement organisation logic, to address issues of floating settlement such as the relationship between clusters, program distribution strategy, and the making of the settlement.
Considering different levels of strategy in response to different system scales, the design sought to answer the questions:
1. What programs are considered to help define or influence the settlement organisation logics for floating villages?
2. What is the assembly process of the floating settlement in related to the context?
3. How does the adaptive mechanism of floating settlement function to adapt different issues in various aspects?
11
Floating fish raft settlement in the site
Photo by Research Team
Left FIG. Site Image
12
1.0 Domain
Chapter 1 l Domain
1.0 Domain Overview
1.0 Domain Overview
Population with in 100 km from coastline
China 13,869,604
All clobal cause
Less than 30% 30 to 70%
100 km from coastline
More than 70%
coastal cities with more than 1 million ppl
Less than 30% 30 to 70%
More than 70%
Climate change
Population with in 100 km from coastline
coastal cities with more than 1 million ppl
Most altered shoreline
None

Climate change
Climate change
Less than 30% 30 to 70%
Global marine fishing
Altered shoreline
More than 70%
Marine catch fishing
coastal cities with more than 1 million ppl
26°- 36° Celsius Country with highest per capita fish catch
Tropical cyclone
Altered shoreline
Global marine fishing
Global marine fishing
Climate change
Marine catch fishing
High cyclone frequency
Medium cyclone frequency
Most altered shoreline
26°- 36° Celsius Country with highest per capita fish catch
Tropical cyclone
Tropical cyclone
Altered shoreline
cyclone
Global marine fishing
frequency
High cyclone frequency
Medium cyclone frequency
Marine catch fishing
cyclone frequency
Low cyclone frequency
26°- 36° Celsius Country with highest per capita fish catch
Tropical cyclone
High cyclone frequency
Medium cyclone frequency
cyclone frequency
Integrated Challenges
As an overview of the project, this dissertation identifies three challenges faced around the world especially in developing countries and low-lying coastal communities. These are Coastal Population Growth, Climate Change, and Marine Ecology Imbalance. These three challenges are tightly integrated with factors or issues that have cause and effect implications to one another.
Coastal Population Growth
Many people are continuously migrating towards the coast and these settlements are fast becoming urban. The lure of economic and technological development, job opportunities, and access to resources contributes to the rapid urbanization of the coastal areas. According to Creel, L. (2003), already 14 of the world’s 17 largest cities are located at coastal areas and approximately 3 billion people or half of the world’s population already lives within 200km of a coastline, and it may likely to double by 2025. A growing population includes social, economic and nutritional requirements (Porter et.al, 2014), and continued coastal development poses a threat in degrading coastlines and natural ecosystems that help provide for the requirements.
Climate Change
Coastal areas are very vulnerable regions particularly those in the tropical and sub-tropical regions (Fig.1.1-1). Adding to human-induced changes and degradation of the coastal areas, the compound effects of climate change such as the accelerated sea level and sea temperature rise bring about more frequent extreme weather events such as stronger storms and hurricanes, also increasing the risk of storm surges and inundation at coastal areas. These extreme events destroy properties; endanger life, livelihood and even damage coastal ecosystems such as coral reefs, and mangrove forests that should serve as protection and provider of economic benefits for the coastal population. With rapid changes occurring in the environment, the adaptive capacity of human settlements and natural ecosystems needs to be strengthened.
16 Adaptive Floating Settlement
FIG. 1.0.1 Global Issues Overview
None Less than 30% 30 to 70% More than 70% Most altered shoreline Altered shoreline coastal cities more than 1 million Marine catch fishing 26°- 36° Celsius Country with highest fish catch Population with in 100 km from coastline High cyclone frequency Climate change Global marine fishing Tropical cyclone Medium cyclone Low cyclone frequency China 13,869,604 tonnes India 3,402,,405 tonnes USA 5,107,559 tonnes Peru 4,807,923 Global overview of coastal population, climate change effects and marine fishing output. Map adapted and redrawn from various sources. None Less than 30% 30 to 70% More than 70% Most altered shoreline Altered shoreline coastal cities with more than 1 million ppl Marine catch fishing 26°- 36° Celsius Country with highest per capita fish catch Population with in 100 km from coastline High cyclone
Low
China 13,869,604 tonnes None
tonnes
Low
China 13,869,604 tonnes None
Low
frequency China 13,869,604 tonnes
Coastal population Climate change Marine biology imbalance
Coastal population Climate change
Marine
Coastal population Climate change Marine biology imbalance
biology imbalance
By 2050, 91% of the world’s coastlines will be affected by development. Average population density in coastal areas is 80 persons/sq.kmdouble the world’s average population density.
Coastal development Coastal Protection
Resources Coastal development Coastal Protection
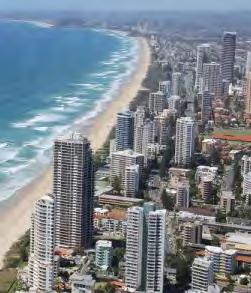
By 2050, 91% of the world’s coastlines will be affected by development. Average population density in coastal areas is 80 persons/sq.kmdouble the world’s average population density.
Coastal settlements
21 of the world’s 33 mega-cities are located in coastal areas, with most of them in developing countries. Poor planning results in the loss of key ecosystems such as wetlands, mangroves and coral reefs.
Exploited
Exploited Resources
Coastal Population Growth Climate Change
By 2050, 91% of the world’s coastlines will be affected by development. Average population density in coastal areas is 80 persons/sq.kmdouble the world’s average population density.
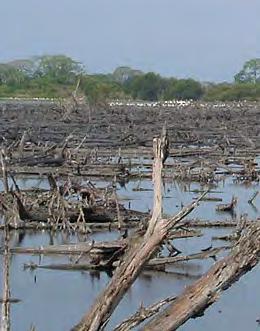
50% of world’s wetlands disappeared in the 20th Century (50% of mangroves, and 60% of coral reefs are degraded), these wetlands are critical in providing coastal protection from storm surges
50% of world’s wetlands disappeared in the 20th Century (50% of mangroves, and 60% of coral reefs are degraded), these wetlands are critical in providing coastal protection from storm surges
Coastal settlement Sea level Change 70% 63% 20% 50% 91% 52%
21 of the world’s 33 mega-cities are located in coastal areas, with most of them in developing countries. Poor planning results in the loss of key ecosystems such as wetlands, mangroves and coral reefs.
21 of the world’s 33 mega-cities are located in coastal areas, with most of them in developing countries. Poor planning results in the loss of key ecosystems such as wetlands, mangroves and coral reefs that affect marine resources coastal communities rely on for livelihood.
Coastal
By 2050, 91% of the world’s coastlines will be affected by development. Average population density in coastal areas is 80 persons/sq.kmdouble the world’s average population density.
About 70% of the coastlines worldwide are projected to experience sea level change within 20% of the global mean sea level change at the end of 21st century.
52% of the world’s fisheries are fully exploited and have no ability to produce greater harvests.
52% of the world’s fisheries are fully exploited and have no ability to produce greater harvests.
Coastal settlement Sea level Change 70% 63% 20% 50% 91% 52%
Marine Ecology Imbalance
The Integrated effects in numbers.
Illegal fishing
Illegal fishing
fishing
About 70% of the coastlines worldwide are projected to experience sea level change within 20% of the global mean sea level change at the end of 21st century.
About 70% of the coastlines worldwide are projected to experience sea level change within 20% of the global mean sea level change at the end of 21st century.
About 70% of the coastlines worldwide are projected to experience sea level change within 20% of the global mean sea level change at the end of 21st century.
Illegal fishing accounts for an estimated 20% of the world’s catch and as much as 50% in some fisheries
Illegal fishing accounts for an estimated 20% of the world’s catch and as much as 50% in some fisheries
Illegal fishing accounts for an estimated 20% of the world’s catch and as much as 50% in some fisheries.
Coastal population Climate change
Coastal population Climate change Marine biology imbalance
By 2050, 91% of the world’s coastlines will be affected by development. Average population density in coastal areas is 80 persons/sq.kmdouble the world’s average population density.
50% of world’s wetlands disappeared in the 20th Century (50% of mangroves, and 60% of coral reefs are degraded), these wetlands are critical in providing coastal protection from storm surges
50% of world’s wetlands disappeared in the 20th Century (50% of mangroves, and 60% of coral reefs are degraded), these wetlands are critical in providing coastal protection from storm surges
52% of the world’s fisheries are fully exploited and have no ability to produce greater harvests. Resources Coastal development Coastal Protection 70% 63% 20%
70% 63% 20% 50% 91% 52%
52% of the world’s fisheries are fully exploited and have no ability to produce greater harvests.
52% of the world’s fisheries are fully exploited and have no ability to produce greater harvests.
17 The Domain
FIG.1.0.2 Global Issues
Coastal
Coastal
70% 63% 20% 50% 91% 52%
Exploited Resources
development
Protection
Illegal fishing
Resources Coastal development Coastal Protection
Exploited
Coastal settlement Sea level Change 70% 63% 20% 50% 91% 52%
50% of world’s wetlands disappeared in the 20th Century (50% of mangroves, and 60% of coral reefs are degraded), these wetlands are critical in providing coastal protection from storm surges population Climate change Marine biology imbalance
Exploited 50% 91% 52%
By 2050, 91% of the world’s coastlines will be affected by development. Average population density in coastal areas is 80 persons/sq.kmdouble the world’s average population density.
Marine biology imbalance
Resources Coastal development Coastal
52% of the world’s fisheries are fully exploited and have no ability to produce greater harvests.
Exploited
Protection
50% of world’s wetlands disappeared in the 20th Century (50% of mangroves, and 60% of coral reefs are degraded), these wetlands are critical in providing coastal protection from storm surges
21 of the world’s 33 mega-cities are located in coastal areas, with most of them in developing countries. Poor planning results in the loss of key ecosystems such as wetlands, mangroves and coral reefs.
Illegal fishing accounts for an estimated 20% of the world’s catch and as much as 50% in some fisheries
52% of the world’s fisheries are fully exploited and have no ability to produce greater harvests.
By 2050, 91% of the world’s coastlines will be affected by development. Average population density in coastal areas is 80 persons/sq.km - double the world’s average population density.
Due to climate change and human induced degradation, 50% of world’s wetlands disappeared in the 20th Century (50% of mangroves, and 60% of coral reefs are degraded), these wetlands are critical in providing coastal protection from storm surges, and habitats to nurture marine life.
Coastal development Sea level rise Coastal protection
Illegal
Exploited resources
Domain Overview
Existence of Floating Villages
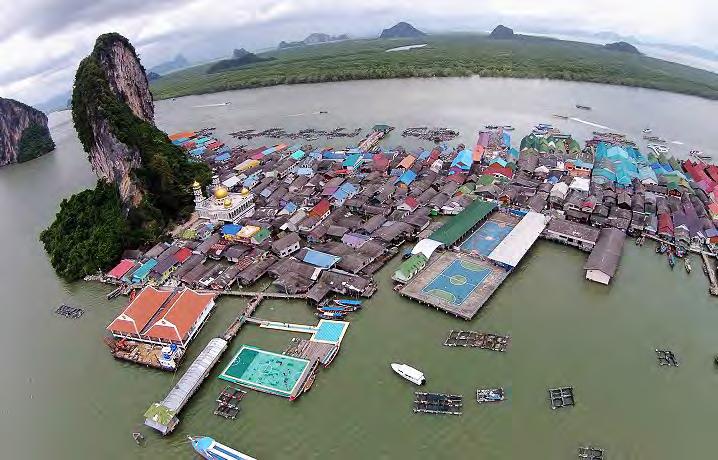
Floating villages are located at lakes, bays and estuaries and even off-shore areas in many regions of East Asia and South East Asia. Many of these communities have already been existing for hundreds or even thousands of years, and are often developed based on the village location and livelihood source which more often but not limited to fishing related activities.
Most of these communities are self-organized or informally growing without following a clear logic for arrangement and provision of facilities and infrastructure, in contrast to planned urban cities at the coasts which have a better structure, governing policy, and infrastructure provision. But they continue to function as a community. These villages either aggregate or grow from land, extending to the sea, with built infrastructure on stilts. Others are purely detached, with families living in boat houses, and even community buildings such as churches, schools, and even football pitches on floats. Interaction among villagers happen from boat to boat, or on common floating platforms. However, these
communities are often poor, and lack the proper facilities and services such as electricity, proximity to healthcare, fresh and clean drinking water, and proper sanitary services especially those who are located at the seas. While observing satellite images of these villages, it can be assumed that the location of these communities are also influenced by the geographical features of their environment. It also shows the extent of the scale of these communities.
Existing Floating villages can be considered to have the have least intervention to their environments compared to other urban coastal developments. But even recent increase in population becomes unsustainable and affects the environment where they are situated.
What can be learned from the existence of these floating communities? Can these community models be considered as a potential solution to address the impacts of coastal population growth, climate change and marine ecology imbalance? Or are they rather contributors to these impacts?
18 Adaptive Floating Settlement
1.0
FIG. 1.0.3 Floatinf Settlement
Koh Panyi Floating Village, Thailand
Photo by Richard Barrow http://www.thailandfromabove. com/koh-panyi-floating-village/
A Model for Adaptive Settlements?
It can be argued that these communities are generally well adapted to their environment and its seasonal changes, for example the floating village in Tonle Sap Lake, Cambodia is well adapted to flooding. But in the research of Nuorteva, P. et.al (2010), they find that the village’s adaptive capacity have limits and are more at risk to major and sudden changes in the environment such as extreme weather events, affecting the resources the environment provides as well. Also, they point out that fishing villages often are considered to have to lowest capacity to cope with sudden or abnormal changes in the environment.
Nuorteva, P. et.al (2010) notes that adaptation strategies in these type of communities are often at the scale of an individual household (local), rather than at a regional or global scale such as village or community. Pender, J. (2008) suggests that priority should be towards using or modifying traditional coping mechanisms, and should be done in a local community level, rather than outsider-led interventions, which are often highly technical and expensive and untried in specific contextual conditions.Adaptation measures must
allow the balance between local community’s self-organized methods and the more macro and long term policy responses. The adaptive capacity of floating villages depend largely on the livelihood sources (Nuorteva, P. et.al, 2010), and one of the good starting points for adaptation is the diversification of livelihood strategies. Such as the case in the floating villages in Ha Long Bay, Vietnam, where communities have included tourism to complement their fishing and aquaculture activities. Looking into four cases, majority of the livelihood is still based on fishing activities and aquaculture, and their communities are developed around this activity.
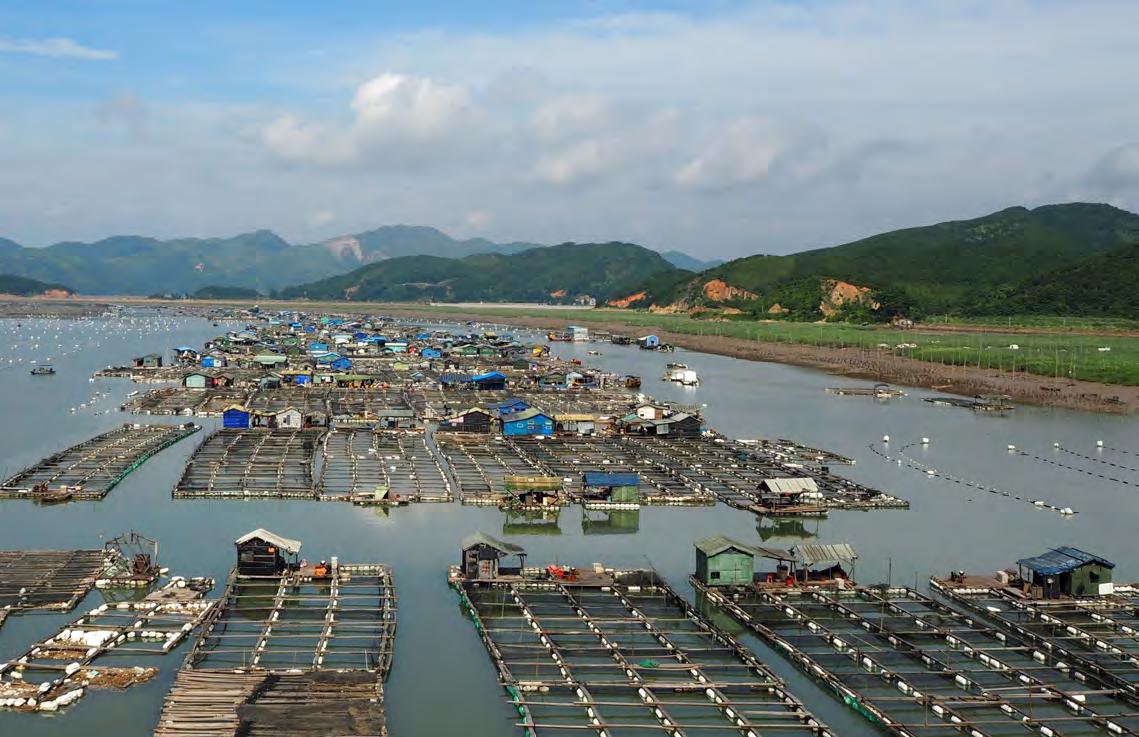
The chosen site is Fujian coastal area since it is one of the main seafood production in China. According to World Bank 2013 social assessment report, in 2011 Fujian’s aquatic output was 6,037,800 tons, including 5,262,035 tons of marine products, accounting for 87.15% which is the second highest production area among all provinces in China. The floating settlements at the site highly affected by the typhoon annually causing lost of locals lives and living necessities ,especially housing and fishing boats.
19 The Domain
FIG.1.0.4 Site Image
Aerial Photo of a Floating Fishing Village in Fujian, China
Photo by Dissertation Team
The Problems of Aqauculture Settlements 1..0.1
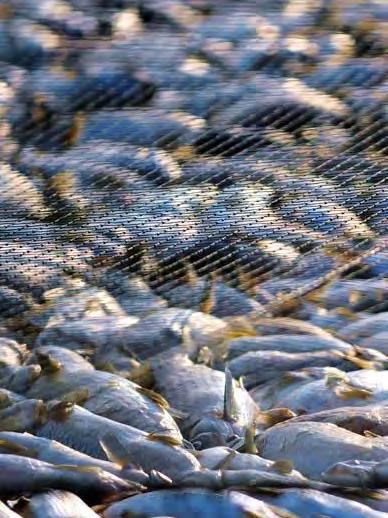
Impacts of typhoon
As reported in the Food and Agriculture Organization of the United Nations (FAO) 2012 State of World Fisheries and Aquaculture, it states that communities that have fisheries as their livelihood activities are more vulnerable to disasters. This is because of the location of the community, livelihood activities, and higher level of exposure to natural hazards, shocks and climate change impacts. Daw et.al (2009) confirm that fisheries are always affected by variable climate, and effects of climate change are experienced through the increase in frequency of extreme events such as hurricanes, flooding and upwelling failure in oceans.
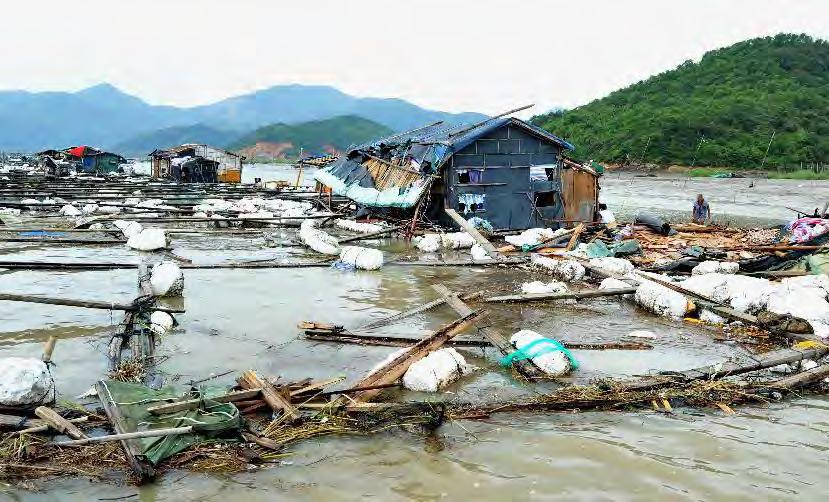
Porter et.al (2014) states that climate change affects four dimensions of food security including the availability of seafood, stability of supply, access to seafood and utilization of aquatic products. They also suggest that communities will have to adapt through changes in fishing and aquaculture practices and operations, especially in areas where significant ecological changes are significant. Natural disasters that affect the aquaculture industry particularly those at the sea, include storms and typhoons that bring about inundation, storm surges and tsunamis. These destroy important assets such as boats, cages, gears, post harvest and processing
facilities, nurseries, and worst case, loss of life (FAO, 2010, 2012). It is important to note that damages by natural disasters have long term socio-economic impacts within and beyond the industry such as livelihood capacity and food availability, thus affected communities relying on aquaculture must be able to cope with these sudden changes.
Adaptation and Resilience
In addressing these issues, there is not one solution to address all problems, and adaptation measures are context specific. According to Daw et.al, (2009), resilience is defined as a concept that takes into account the a community’s vulnerability - absorbing disturbance to the normal conditions, and their adaptive capacity - the ability to retain basic functions and self-organize and build capacity for learning and to prepare for future impacts. From the circular FAO c.1088, they have identified a number of adaptation activities that can be applied in most fisheries and aquaculture contexts such as: investing in safer harbors and landings; Promote disaster risk management - general preparedness and protective infrastructure particularly on soft options such as buffer zones; and Spatial planning - marine and terrestrial zoning for siting of aquaculture facilities.
20 Adaptive Floating Settlement
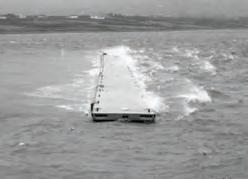
FIG. 1.0.1.1 Impact of Typhoon Fish cage and house destroyed after Typhoon Souldelor swept through China’s Fujian Coast. Image Source: www.news.xinhuanet.com
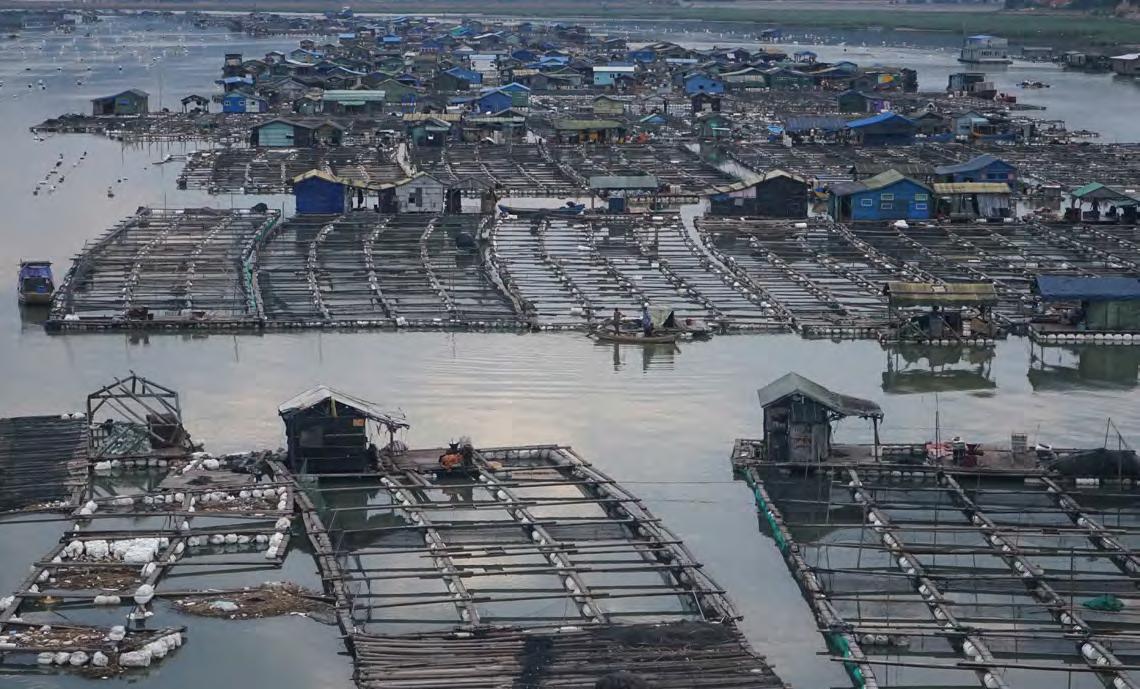
Unorganized Settlement
The unorganized settlement is emerging significantly in the site due to the soaring quantities of rafts. It does not only stagnate the water flow but also pollute the environment by the waste of culture species and human excreta. Recently this issue has emerged because the mass of rafts that emit all wastes into the sea. The systematic ways of organizing the settlement in community base could reduce the exceeding density causing pollution.
The unorganized system of the settlement not only cause negative affect to environment, it also has an effect on the social and economical related issues. According to the information gathered, the social provision of the aquaculture settlement is insufficient. Since the significant of staying 24 hours on the raft is crucial for aquaculture process in all weather conditions, health related amenities should be properly provided.
The fundamental resources such as water and food are mainly from land .Each household individually commutes to land to get the life necessities resources affecting the fuel consumption. The lack of clean freshwater resources affect health and hygienic standard for local people. Freshwater resources are also highly significant for every process of aquaculture to clean the product and to produce ice.
The existing fisheries product supply chain and resources distribution system operates in the individual basis which are not highly benefit the local settlements economically and socially. The Oligopoly system operates by a few merchants or buyers affects the locals with no opportunities to negotiate the product price. Since the fisheries product spoils in short period of time, with no facilities; ice and cold storage, missing opportunities to sale products causes severe affect to locals’ income.
21 The Domain
FIG.1.0.1.2 Unorganized Settlement
Random placement of fish raft and species: Mass of fish rafts lead to an unappropriated culture environment and generate multiple effects for this area.
The in-depth studies and site analysis informs the essential problems of the site resulting in proposal ambition of this dissertation. The ambition is to reduce the vulnerability and increase adaptive capacity of floating villages (existing and new) by introducing infrastructure and function programming for settlement organization.
The M.Sc initial research and proposal investigated the integrating different strategies for floating settlements. The research established the opportunities provided by introducing a wave reduction system as an infrastructure providing safety area for aquaculture raft aggregation. The social issue as the drivers for settlement scenarios has been studied as the foundation for the further studies on settlement organizational logic in M. Arch phase.
22 Adaptive Floating Settlement
Conclusion
Conclusion
1.0.2

23 The Domain
Diagram illustrate the issues happen at the site, and the consequence affects for the fish raft.
INTEGRATED STRATEGIES Wave Reduction System Settlement Organizational Logic RISKS CAUSES Infrastructure Program + Life Habitat Aquaculture Fishing boat Problems Evacuation plan Solutions Anchor points - Anchor points - Aggregation - Wave breaker 1 2 3 4 Unorganized Settlement planning Insufficient boat berthing 54% lacking places Lost and Damage E ect of Typhoon to oating settlement Life Habitat Aquaculture Fishing boat Local people’s heirachy of importance
FIG.1.0.2.1 Site Issues
Problem and solution
Chapter 1 l Domain
1.1 Initial Research and Proposal Conclusion
MSc phase was successful in integrating different strategies to achieve the infrastructure arrangement – especially the wave reduction system, and couple with different design considerations for settlement organization. It is possible to develop organisation logic for existing and potentially new floating settlement based on these strategies. Also, given the different context scenarios and variable social and economic conditions, the organisation logic for the settlements can adapt to changes by re-arrangement, aggregation, or growth. These adaptive results are achieved by overlaying a hierarchy of criteria and design inputs into multiple algorithms. The values of each layer are evaluated to identify their relationships and further develop the appropriate selection for settlement growth and aggregation within the abstracted site context.
The development process started with extracting principles and parameters that of the hydrodynamic at coast, biological systems, and man-made structures. With data that informed by the conclusion of researches and experiments, the design team developed the design of the local scale wave reduction


unit. On the global level, the wave reduction units aggregate and form a bigger settlement that plays the major role in dampening the wave height from offshore at the chosen site. The aggregated settlements not only response to the impact of the wave but also adapt to other changes in the wider socio-economic condition, including the growth of the human community and population pressure. The settlement scenarios can cope with rapid changes and transform to optimized result.
Regarding the infrastructure system, most of the design ambitions are achieved. Anchor points are placed around the floating platforms. The study of the network has explored the connection between floating platform and existing ports or villages for resource distribution. However, the strategic dominant nodes within the network have not yet been investigated. Moreover, take the needs of aquaculture system into consideration – the needs of sufficient water flows and support for migration and settlement rearrangement, the contour of the underwater unit is the primary thing to
26 Adaptive Floating Settlement MSc phase design process FIG. 1.1.1.1 MSc overview 1.1.1 Overview
Overview +W +D Wave Direction Principles and Parameters Wave Reduction Unit Wave Reduction Unit Pattern Arrangement Settlement Scenarios Aquaculture settlementLiving settlement
investigate in the next stage. It is recommended to explore applicable areas that could encourage eco-tourism or marine ecology revitalisation to achieve a self-sustained aquaculture settlement base on the chosen site and its socio-economic context.
For the strategic development of this project, the social logics, particularly the livelihood component, are considered. The aquaculture activities that inherit the most traditional settlements are organised to ensure the people there are able to keep or improve their livelihood. By integrating tourism as an alternative or supplemental medium, there’s a chance to increase safety area in the network and further boost the livelihood of the community. It is suggested to dig deeper into the relationship and interaction between the supply chain for the livelihood and the newly introduced tourism in the next stage.
Regarding methodology of this research, due to limitations in available software and facilities, the attempt is rather
to simplify the logic of simulations. Only the parametric relationship of waves and geometry was considered in the calculation. During the testing of the wave height reduction, wave conditions are simulated, and the wave equations are applied to the algorithm. Since the data is connected with the algorithm and within one digital and computational interface, this method facilitated the integration of strategies and helped produce a real-time update of results when parameters or variables changed.
The critical reflection of the MSc phase opens up the direction of the MArch phase. It not only identifies the lacking parts in the MSc project but also condense this project towards a convincible level in reality. In the next pages, the MArch team evaluated each chapter that has done in the MSc phrase and synthesises the ideas that could be used for the development of the MArch project.
27 The Domain
FIG.1.1.1.2 MSc final results
Aquaculture Permanent Living Aquaculture Settlement Species Imbalance Aquaculture Dominant Citizen Dominant Early stage Transformation Industries/ Activities trend Aquaculture based settlements Permanent Living settlements Accepting Tourism Fishermen : Citizen Zoning area Population Density Wave reduction pattern 1 Wave reduction pattern 2 A : B : C Fish raft type A +B + C : D Fish raft type: Semi-Tourism
MSc phase final proposal with six settlement scenarios from aquaculture settlement to permanent living settlement.
Hydrodynamic at Coast
The design strategy was to study various systems, abstract its principles, and though scientific and computational experimentation, develop and apply the principles to new or improved existing system at different system scales. It is important to first understand how the physics of wave and other hydrodynamic phenomena in coastal environment work in order to effectively design an adaptive infrastructure system for wave energy/height reduction and re-direction.
The research bases on two main extractions of the performance of sea wave – the wave parameter and wave refraction. The parameters of sea wave are related to wave height, length, and period. Once the wave length was given, the depth of the wave structure can be determined, which is often ½ of the wave length (in deep water). The longer the wave length, the deeper the wave structure or motions felt at the bottom at the sea. Waves are also affected by bathymetry. As the depth of the water decreases, the interaction between the wave and seabed become significant, often resulting in alteration of wave properties, such as a decrease in wave
velocity, wavelength, and increase in wave height. The priority of this project is to minimize wave height.
One of the characters of sea wave is the wave refraction that causes by friction with land and seabed when waves from deep water flow through shallow water or encounter any obstacle. The wave converges again after it passes through the obstacle. Since the wave height is the main reason of casualty and loss, it is seen as the primary problem need to be addressed in the design strategy.
The chosen site locates between intermediate and shallow water, the depth of the seabed is between -10m and -30m, which is the best environment for aquaculture activities. The information from the studies of wave helps to identify the wave properties and the hydrological equations that could be considered in the computational algorithm of design strategy.
28 Adaptive Floating Settlement
The diagram shows how wave interact with the bathymetry.
FIG. 1.1.2.1 Wave Refraction
1.1.2
Principles and Parameters Comparison Chart of Diffrent Mooring System Breakwater Studies, Geometries and Wave cases Mooring System Plan View Catenary Chain Unit-Unit connection Anchor - Chain Connection Floating Breakwater Unit Anchor Buoy E. Pena et. al (2011) Comparison of elastomeric vs. chains E. Pena et. al (2011) Comparison of elastomeric vs. chains Incident wave heights of 0.6-1.2m only only period of 2.254.7s The Adaptive Interface an attempt to integrate function, adaptive ‘breakwater design’ depending on the +W +d Headland J.R., 1995. Floating breakwaters. In Tsinker G.P. Marine Structures Engineering: specialised applications. Chapman & Hall ed., 367-411 Wave Front Islet deep water shallow water refraction wave direction 1 2 Reconfiguration Fish food produce raft Program Floating System Wave Refraction
Principles and Paramters Synthesis
29 The Domain
The diagram shows the synthesis of wave parameters with the tidal condition at the site.
Target Low Tide Normal Sea Level High Tide Storm Surge Sea Bed (m) 5 0 -50 Wave Structure (L) (L) 1/2 (L) (H) (D) Wave Direction Crest Period Wavelength = Wave breaks Wave structure (H) Waveheight = (D) (D) = Wave structure = Crest Intermediate Shallow Deepwater (L) > 1/7 (H) / Time required for wave crest at point A to reach point B Wave Parameters
FIG.1.1.2.2 Wave Parameter
1.1.3 Parameters and Experiments Synthesis
Man-Made Structures
DENSITY: No. of Units, Pattern over given area
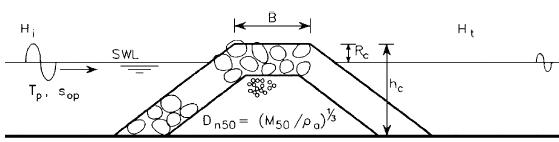
The width of the breakwater is fundamental and significant parameter. The ratio of its width to the wavelength of incoming waves
Biology and Man-Made System
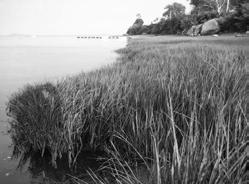
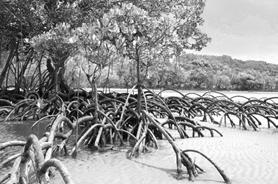
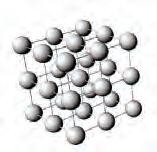
Apart from the sea wave parameters, the design team also looked into the wave attenuation system including the coastal biological systems – coral reefs, mangroves forests and sea grass and the man-made structure – the floating breakwaters systems and the bottom-founded artificial reef systems.
It is learned that unit morphology becomes the focus of the system on a local scale. Density and porosity properties of the units contribute to generate friction, create turbulence, and micro-currents. On a regional scale, on the other
Bottom founded system. The most critical limitation of artificial reefs is its unit size in relation to water depth
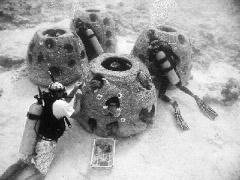
hand, the aggregation of units becomes significant in reducing wave. With a given wave length and wave period, the effectiveness of wave attenuation is influenced by the dimension of the formed structure and its overall roughness.
As for the man-made system, the wave attenuation is affected by the dimension of the structure in proportion to the incoming wave length and wave period. Particularly in the breakwater structure, the width of the structure takes the leading role in wave reduction. Another important
POROSITY: Amount of Surface Area contact with water over volume
GROWTH & AGGREGATION Morphology based on flows (hydrodynamics)
30 Adaptive Floating Settlement
Diagram illustrating the research process of man-made coastal structure.
FIG. 1.1.3.1 Man-Made Structure
Principles and Parameters Comparison Chart of Diffrent Mooring System Breakwater Studies, Geometries and Wave cases Mooring System Plan View Catenary Chain Unit-Unit connection Anchor - Chain Connection Floating Breakwater Unit Anchor Buoy E. Pena et. al (2011) Comparison of elastomeric vs. chains E. Pena et. al (2011) Comparison of elastomeric vs. chains Incident wave heights of 0.6-1.2m only only period of 2.254.7s The Adaptive Interface an attempt to integrate function, adaptive ‘breakwater design’ depending on the +W +d Headland J.R., 1995. Floating breakwaters. In Tsinker G.P. Marine Structures Engineering: specialised applications. Chapman & Hall ed., 367-411
board net 32m-100m 10m Artificial Reef Flow Patterns ncident Waves Shoreline Y Wr Lr Artificia Reef Flow Patterns Inc dent Waves Shoreline Y Wr Lr Study Abstraction
Reconfiguration
Experiment Conclusion Floating Breakwater
Artificial Reefs +W +d Width and Depth Multiple Units Offshore Wave Direction Onshore B Hi Ht F h d SWL Low Tide SWL High Tide SWL B Crest Width F freeboard SWL Still water Level h height of structure d depth at toe of Ht Transmitted wave Hi Incident wave Breakwater Parameters to Consider
Parameter Relationship
Floating System
DENSITY:
No. of Units, Pattern Spacing over given area
Coastal Biological Systems
POROSITY:
Amount of Surface Area in contact with water over a given volume
GROWTH & AGGREGATION
Morphology based on response to flows (hydrodynamics)
Density, Porosity properties contribute to generate friction, create turbulence, and micro-currents

It is a compound effect for the capability to attenuate the wave height
principle is the ratio of submergence both in biological and man-made system. This figure affects how much the system obstructs the wave column and thus reducing wave.
However, the conditions of waves are inherently non-linear due to its nature, numerous factors are continuously affecting the characteristics and behavior of waves. Therefore, the wave reduction system must be adaptive or designed for the most extreme condition in the given context. In sum, the conclusion of the experiments, both
Submergence and the depth of these system in relation to the wave structure
from the learning from the precedents and from what were done by the design team, achieves decision of the making of wave reduction unit.
31 The Domain
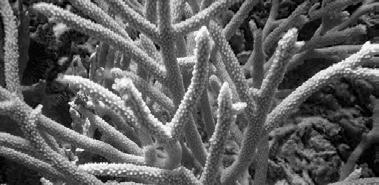
Diagram illustrating the research process of coastal biological systems.
FIG. 1.1.3.2 Biological Systems
Porosity Object -1 Aggregation -1
Mangrove Forest
1 2 3456 78910 0 2 4 6 8 12 14 10 D(m) V (m/2) 1 2 3456 78910 0 2 4 6 8 12 14 10 D(m) area of influence V (m/2) R1 r
Corals, Coral Reef Salt Marsh
structure of structure wave height ve height Submergence Velocity Reduction Friction, Turbulence, Surface Pressure Friction, Turbulence, Surface Pressure Width/
No.of Rows Length Density Velocity Reduction Friction, Turbulence, Surface Pressure Friction, Turbulence, Surface Pressure Spacing
AGGREGATION on response to Wave Energy Reduction through density and generating turbulence W L D
Area in over a given
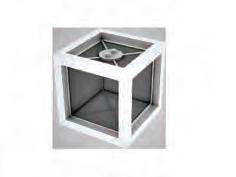
The concept of wave reduction unit combin the idea of floating system and bottom found structure.
Wave Reduction Unit
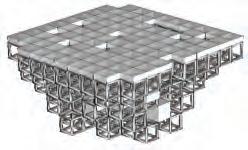
The concept of wave reduction unit is based on modular assembly that considers mainly on the ease of construction, assembly, and transport of units in the design of a system. The unit, sized 3mx3mx3m cubic module, can be aggregated and assembled to form a larger morphology. Three main factors were take into account in the design of the unit: First, the capability to manipulate the material density; Second, the rigidity of material to absorb the forces of waves. Third, it needs to float on the sea.
The wave reduction unit is the combination of the principles of floating system and the bottom found system. It is the result of the study of the characters of sea wave and the data extraction researches. The floating system reduces the force from horizontal direction by its identified horizontal dimension that is determined by the length of incoming wave. The bottom found system plays an important role to obstruct
the vertical wave structure and thus can reduce the wave height. In the MSc phase, the design team introduced cellar automata logic into the form generation. By choosing the number of neighbors to ‘survive’ or ‘discard’ surplus cell, the units on the lower level are decreased.
However, the design team did not consider the bathymetry data that comes from the condition of the context, nor the stability of the platform in the various sea wave conditions, and the position of the floating buoy inside the module.
Regarding the methodology to generate the form of the unit, the idea enforces the 3m cubic blocks to have a relationship with each other, but the functionality of it is the target for MArch phase to achieve.
32 Adaptive Floating Settlement
FIG. 1.1.4.1 Concept Diagram
1.1.4
Wave Reduction Unit Freeboard The depth (d) of the floating structure can be designed to adapt to the location to where it will be positioned, by aggregating the structure units downward. Deep-water waves have longer wavelength, thus a deeper wave base. In principle, a structure with larger depth is more effective to obstruct most part if not the whole wave structure. Deep Water Waves Intermediate to Shallow Water Waves Wave Base Depth of Wave Structure = L/2 Sea Bed Sea Bed Wavelength (L) Submerged Area (d) Wavelength (L) Wave Base Water Depth Depth of Wave Structure = L/2 Sea Bed Wavelength (L) Submerged Area (d) Wave Base = L/2 Multiple -Units Single -Unit Reconfiguration Fish food produce raft Program Floating System Bottom Found Wave Reduction Unit Wunit = L wave Wave Reduction Unit Motions Roll Heave Low Tide Normal Sea Level High Tide / Extreme Surge
Wave Reduction Unit
The depth (d) of the floating structure can be designed to adapt to the location to where it will be positioned, by aggregating the structure units downward.
Deep-water waves have longer wavelength, thus a deeper wave base. In principle, a structure with larger depth is more effective to obstruct most part if not the whole wave structure.

Above
Below
33 The Domain
Defining the relationship of the wave parameter and wave reducion unit.
Diagram illustrates the parameter of the wave reduction unit with the wave structure.
FIG.1.1.4.2 Relationship of Wave Reduction Unit and Wave Parameter
FIG.1.1.4.3 Parameter Diagram
Wave Base Water Depth Depth of Wave Structure = L/2 Sea Bed Wavelength (L) Submerged Area (d) Relationship with Wave Parameter 60m 60m FDrag Wave Direction iteration=480 (m) 5 0 30 Anchor
1.1.5
Performance of Wave Reduction Unit
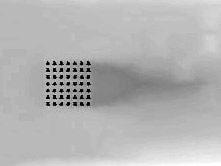
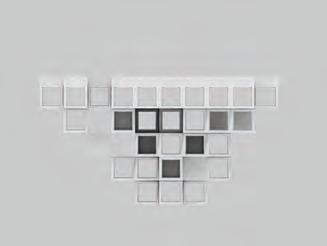
Three form finding cirteria used for computational algorithm to get the optimized generation.
The design team introduced three criteria to facilitate the evaluation of generated form: total volume, total surface, and structure deformation. Forms were generated and evaluated by the Genetic Algorithm, based on the value weight applied to each fitness criteria. The ‘best’ morphologies depend on the environmental conditions at the sea area – the particular zone that it will be applied.
After the initial experiments for developing the wave reduction unit, it is found that a scale of 30m by 30m wave reduction platform that aggregated by individual units has higher efficiency and can effectively copes with the characters of wave, larger wave height and shorter wave length, and other given conditions on the defined site.
Furthermore, the strategy of unit clustering and mooring, the motions of unit, and the buoyancy and stability of floating platform are also taking into account in the design of the wave reduction platform. On the top level, the load of people and material affects the balance of the weight upon the
platform. In the middle, the 3m cubic module units, function as the wave reduction unit by acquiring different density; and the buoy units serve to maintain the stability of the platform. The detailed discussion about the mechanism of the buoy will be shown in chapter 3.2.6. At the bottom part is the mooring system. The characteristics of mooring system have a direct relationship with the performance of wave transmission and the structural design of breakwater. Catenary systems is used in the wave reduction platform, with chains suspended from the breakwater and connected to the sea floor, allowing more range of motion.
Similar to a ship, floating breakwaters are subjected to various motions that significantly affect the stability of the system. The prevalent motions of a breakwater are heave – the vertical movement; swat — forward and backward movement of the breakwater that equivalent to the direction of the wave; and roll – the rotation along the length of the breakwater.
34 Adaptive Floating Settlement
FIG. 1.1.5.1 Evaluation Cirteria
Wave Reduction Unit Freeboard The depth (d) of the floating structure can be designed to adapt to the location to where it will be positioned, by aggregating the structure units downward. Deep-water waves have longer wavelength, thus a deeper wave base. In principle, a structure with larger depth is more effective to obstruct most part if not the whole wave structure. Deep Water Waves Intermediate to Shallow Water Waves Wave Base Depth of Wave Structure = L/2 Sea Bed Sea Bed Wavelength (L) Submerged Area (d) Wavelength (L) Wave Base Water Depth Depth of Wave Structure = L/2 Sea Bed Wavelength (L) Submerged Area (d) Wave Base = L/2 Multiple -Units Single -Unit Reconfiguration Fish food produce raft Program Form Finding Cirteria F F F F Total Volume Total Surface Area Structure Deformation
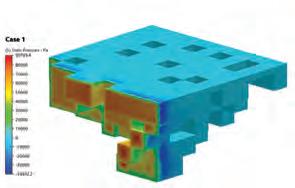
Performances
Diagram illustrates the different level performance within the wave reduction unit.
The complexity of the wave performance significantly affect the platform.
35 The Domain
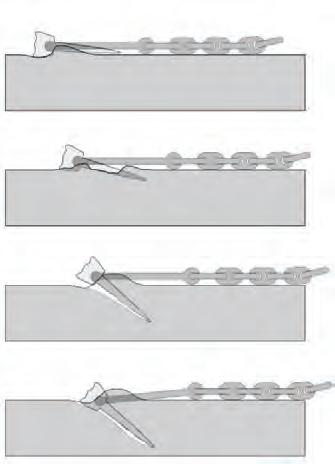
FIG. 1.1.5.2 Unit Performances
Unit Performances Motions on the Platfrom Wave Reduction Unit > stainless steel pavement > obstruct wave > create friction Load Water Level Reserve Buoyancy Built Structure Materials People AnchorSteel Chains FDrag Buried Fluke Sea Floor Anchor Anchor 6m 5m 15-35m Storm Surge on Low Tidal Range Range of Depth Extreme Storm Surge FDrag FDrag Heave Roll Sway Above Below
FIG. 1.1.5.3 Motions on the Platform
Wave Reduction Unit Context Adaptation
Context-Specific selection strategy to apply the wave reduction morphology.
Context Adaptation
Draw from the wave reduction experiments, the performance of each wave reduction unit and its capability to aggregate to form a platform are the fundamental strategies to arrange the infrastructure pattern. The pattern will be optimized to achieve the highest safety area coverage that could accommodate aquaculture, human community, and other floating settlement at sea.
From the many wave reduction platform morphologies produced, not only one type of design is selected and used in the whole context. By identifying the specific requirements of environmental context and the corresponding performance characteristics, the most appropriate and efficient morphology would be chosen based on its given context.
More
36 Adaptive Floating Settlement
FIG. 1.1.6.1 The Morphology of Wave Reduction Unit
1.1.6
Wave Reduction Unit Pattern Arrangement Density Structure Depth / Height Location Distance (d) Width (w) Wave Direction Units in given area and spacing d Differentiation - Size and Pattern Distance (d) Width (w) Wave Direction w w Smaller Units Larger Units Anchor Sea Bed LCL Transmitted Wave Height Incident Wave Height H h d H FB
Reconfiguration
Volume and Overall Surface Area
Fish food produce raft Program Larger
mass, weight , more surface area for water friction
Deformation,
Rigid, less volume Wave Reduction Units Wave Reduction Platforms Vo. Vo. Sur. Def. Vo. Sur. Def. Sur. 2997 2880 0.051 Total Volume (m3) : Surface Area (m2) : Average Deformation (m) : G14.34 3186 3168 0.034 G40.32 Total Volume Surface Area Average Deformation 3807 4050 0.050 Total Volume (m3) : Surface Area (m2) : Average Deformation (m) : G40.52 Pro:1. high surf.area 1. high rigidity Pro:1. min. surf.area 2. min. mass Pro:1. max. 2. less-rigid Vo. Sur. Def. Vo. Sur. Def. Vo. Sur. Def. Vo. Sur. Def. 2997 2880 0.051 Total Volume (m3) : Surface Area (m2) : Average Deformation (m) : G14.34 3186 3168 0.034 Total Volume (m3) : Surface Area (m2) : Average Deformation (m) Pro: 1. fittness idividual 2. most-rigid G40.32 6075 5400 0.104 Total Volume (m3) : Surface Area (m2) : Average Deformation (m) : G1.11 3807 4050 0.050 G40.52 Pro:1. high surf.area 1. high rigidity Pro:1. min. surf.area 2. min. mass Pro:1. max. surf.area 2. less-rigid Vo. Sur. Def. Vo. Sur. Def. Vo. Sur. Def. Vo. Sur. Def. 2997 2880 0.051 G14.34 3186 3168 0.034 Total Volume (m3) Surface Area (m2) Average Deformation (m) : Pro: 1. fittness idividual 2. most-rigid G40.32 6075 5400 0.104 Total Volume (m3) : Surface Area (m2) : Average Deformation (m) G1.11 3807 4050 0.050 Total Volume (m3) : Surface Area (m2) : Average Deformation (m) : G40.52 Pro:1. high surf.area 1. high rigidity Pro:1. min. surf.area 2. min. mass Pro:1. max. surf.area 2. less-rigid Vo. Sur. Def. Vo. Sur. Def. Vo. Sur. Def. Vo. Sur. Def. 2997 2880 0.051 Total Volume (m3) : Surface Area (m2) : Average Deformation (m) : G14.34 3186 3168 0.034 Total Volume (m3) : Surface Area (m2) : Average Deformation (m) : Pro: 1. fittness idividual 2. most-rigid G40.32 6075 5400 0.104 Total Volume (m3) : Surface Area (m2) : Average Deformation (m) : Total Volume (m3) : Surface Area (m2) : Average Deformation (m) : Total Volume (m3) : Surface Area (m2) : Average Deformation (m) : Total Volume (m3) : Surface Area (m2) : Average Deformation (m) : G1.11 3807 4050 0.050 Total Volume (m3) : Surface Area (m2) : Average Deformation (m) : G40.52 Pro:1. high surf.area 1. high rigidity Pro:1. min. surf.area 2. min. mass Pro:1. max. surf.area 2. less-rigid Multiple -Units Multiple -Units Multiple -Units Stability Fb CG c Wobject Object Stable Object Unstable Def. 6075 5400 0.104 Average Deformation (m) : 1. max. surf.area
Less
More
Platfrom Properties
Larger Platfrom Width
Perform better in longer wavelength conditions, also with bigger mass and weight
Larger Platform Depth
High efficiency to obstruct the wave structure
Less Rigid Allows for wave dampening action
Deeper
Platfrom Properties
Shorter Platfrom Width
Perform better in shorter wavelength conditions
Average Platform Depth
Concerning platfrom stability, and the depth of water
More Rigid Allows for majority of people living on the platfrom
37 The Domain Vo. Sur. Total Volume (m3) : Surface Area (m2) : Average Deformation (m) G1.11 Pro:1. max. surf.area 2. less-rigid
Figures and image Descriptions the infrastructure pattern by applying wave reduction units.
N oneZ 1 oneZ 2 oneZ 3 oneZ 4 oneZ 5 Near Shore 900m 2100m Off-Shore Wave Direction Shallower Water 10m-15m Wave Height 2m-4m - Settlement Capacity Shorter Wave Length 20m-30m Near-Shore Stability of System CG Fb Fb CG CG c c Wobject Wobject Wobject Water Level Water Level Reserve Buoyancy Freeboard 2m Volume x Mass Density = Allowable Load Live Load < Allowable Load Built Structure Supplies and Materials People Depth of Unit 14m Draft = 12m Weight of Object Object’s Center of Gravity Centroid of volume of displaced fluid / Center of buoancy Buoancy Force Volume of fluid displaced Object Stable Object Unstable CG Wobject Water Level Fb c Volume of fluid displaced CG Wobject Water Level Overturning moment Restoring moment Fb c Volume of fluid displaced Water Level Loading / Unloading Cargo Built-structures CG CG Air Chamber / Float 6075 5400 0.104 Zone 1 (Highest Risk) Zone 5 (Lowest Risk) Zone 2 Zone 3 Zone 4 Direction of Wave Approach Offshore Longer Wave Legnth 120m-160m
FIG.1.1.6.2 Zoning Strategy
Water
Height
- Destructive
>30m Wave
6m
Zone 1 Zone 2 Zone 3 Zone 4 Zone 5 offshore near-shore (not to scale)
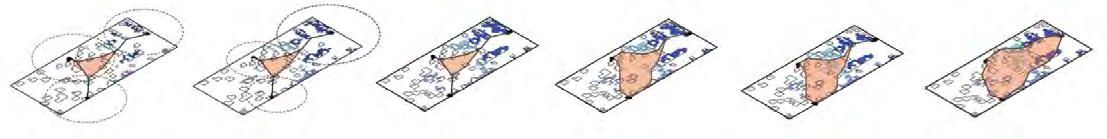
Adaptive Scenarios 1.1.7


The six adaptive scenarios
At the final stage of the MSc phase, a resilient floating settlement is achieved. This optimized settlement can adapt to complex socio-environmental changes – the extreme weather, ecological changes, economic changes, and political changes.
In order to evaluate this adaptive strategy, six scenarios were set-up, with which each of them describes specific adaptive features that correspond to different types of context variation. With the integration of short term and long term transformation, the set of scenarios also illustrates the procedure of how an aquaculture dominant settlement transforms into a tourism dominant settlement.
Different adaptive parameters are applied at various time scales of the transformation. The long-term parameter for these six scenarios is the zoning ratio between Local and Tourism, which is the result of platforms arrangement and its wave reduction pattern. The medium and shortterm parameters are the density of the population and

infrastructure and the public platform ratios for separated species. These parameters are adaptable that can adjust to different situations. In response to the long-term coastal migration issue in China, which demands more living area and causes higher population pressure along the coastal region, the ratio between semi-tourism and the aquaculture rafts is considered.
As shown in six scenarios, it suggests the potential to create an adaptive community that not only responses to the wave condition but also adapts to other contextual changes. By the integration of computational techniques, there are more chances to explore and develop these complex topics in depth. However, regarding the rapidly change scenario, this adaptive system has its limitation on addressing the real site variation when facing a rapidly changed scenario. Therefore, in order to approach the reality, the economic and industrial trend of the site and the population growth in China are also considered in these six hypothesis scenarios.
38 Adaptive Floating Settlement
Aquaculture Settlement Species Imbalance Aquaculture Dominant dominant Early stage transformation Accepting Tourism Local : Tourism Zoning A : B : C Settlement type A : B :C Public Platform ratio Density Wave reduction pattern 1 Start to convert to half tourist morphologies since the density is the same Small zone for tourist Wave reduction pattern 2 Wave reduction pattern 3 1 specie higher but public platform the same amount Changing public platform to suits the cultivation Semi-tourist Settlement ratio Local : Semi-Tourism A + B + C : D Aquaculture Tourism 1 2 3 4 5 6 Aquaculture Settlement Species Imbalance Aquaculture Dominant Tourism dominant Early stage transformation Industries/ Activities trend Aquaculture based settlements Tourism based settlements Accepting Tourism Year ( Scenario ) Local : Tourism Zoning A : B : C Settlement type A : B :C Public Platform ratio Density Wave reduction pattern 1 Start to convert to half tourist morphologies since the density is the same Small zone for tourist Wave reduction pattern 2 Wave reduction pattern 3 1 specie higher but public platform the same amount Changing public platform to suits the cultivation Semi-tourist Settlement ratio Local : Semi-Tourism A + B + C : D 6 settlement scenarios convert to tourist morphologies density is the same A B : C Settlement type A B :C Public Platform ratio Density Start to convert to half tourist morphologies since the density is the same Small zone for tourist 1 specie higher but public platform the same amount Changing public platform to suits the cultivation Semi-tourist Settlement ratio Semi-Tourism B + C D The six settlement scenarios demonstrate the adaptability of the floating settlement.
FIG. 1.1.7.1 Adaptive Scenarios
3.
6.
Zoning area (% of the whole site) Local (%) Tourist (%)
Public Platform Ratio
A:B:C
Settlement Ratio
A:B:C
Density
Number of households
Locals Vocational Interest
Tourism : Aquaculture
Settlement Average Wave height(m) Settlement MaximumWave height(m)
The
proposed the possibility for the floating settlement to adapt different deman.
Zoning area (% of the whole site)
Local (%)
Tourist (%)
Public Platform Ratio
A:B:C
Settlement Ratio
A:B:C:D
D = Semi-tourist settlement
Density
Number of households
Locals Vocational Interest
Tourism : Aquaculture
Settlement Average Wave height(m)
MaximumWave height(m)
39 The Domain
Aquaculture dominant scenario
Species A 50% Center Market Species B 20% Species C 30% Legend Main market Fish Type 1 Fish Type 2 Fish Type 3 Fish Type 4 : 2.3 : 77.7 : 1:1:1 : 1:1:1 ( 200,200,200) : 600 : 1:5 : 2.35 : 3.93
Permanent living scenario
: 35.20 : 44.80 : 1:1:1 : 3.5:1: 3.5 :10.5 (28,8,27,837) : 900 : 1:1 : 2.21 : 3.22
settlements
Settlement
Aquaculture with tourist
final results of MSc phase
FIG. 1.1.7.2 Optimized Scenarios
1.1.8 Optimized Settlements
Scenario 3 : Aquaculture Dominant settlements
Zoning area (% of the whole site)
Local (%)
Tourist (%)
Public Platform Ratio
A:B:C
Settlement Ratio
A:B:C
Density
Number of households
Locals Vocational Interest
Tourism : Aquaculture
Settlement Average Wave height(m)
Settlement MaximumWave height(m)
Aquaculture dominant scenario is able to mainly function for the aquaculture activities.
The third scenario shows that the public platforms adapt to the changes in the number of the fish rafts. However, the settlements and fish rafts reach an environmental threshold. Increased growth of the settlement leads to aggregation in the high-risk zone, thus facing the risk of high waves. At the same time, high density of the aquaculture activities generates impacts on the surrounding environments. Therefore, a new strategy is needed to provide a solution to the increasing density, especially the number of fish rafts.
40 Adaptive Floating Settlement
FIG.1.1.8.1 Aquaculture Scenario
: 2.3 : 77.7 : 1:1:1 : 1:1:1 ( 200,200,200) : 600 : 1:5 : 2.35 : 3.93
Species A 50% Center Market Species B 20% Species C 30% Legend Main market Fish Type 1 Fish Type 2 Fish Type 3 Fish Type 4
Scenario 6 : Permanent Living settlements
Zoning area (% of the whole site)
Local (%)
Tourist (%)
Public Platform Ratio
A:B:C
Settlement Ratio
A:B:C:D
D = Semi-tourist settlement
Density
Number of households
Locals Vocational Interest
Tourism : Aquaculture
Settlement Average Wave height(m)
Settlement MaximumWave height(m)
The last scenario shows the rearrangement of the platforms caused by the growing demands of tourism and industrial transformation. More local residents give up their fish raft and start to work in the tourism industry. The number of families now reaches to nine hundred. However, families still grow within the safe area with proper wave impact. It is enforced by the new type of economy in China and its corresponding settlement scenario.
41 The Domain
Figure and images illustrates the information of the permanent living settlement with the maximum density of 900 household within the community.
FIG.1.1.8.2 Permanent Living Scenario
:
:
: 1:1:1 : 3.5:1:
:10.5 (28,8,27,837) :
: 1:1 : 2.21 : 3.22
35.20
44.80
3.5
900
Aquaculture with tourist settlements
Conclusion
Conclusion
MSc phase has established a viability of the large-scale aquaculture floating settlement that aims to reduce the vulnerability and increase the adaptive capacity of the settlement. The project succeeded in developing wave reduction infrastructure and further applying to the settlement organisational logic. The wave reduction system acts as the defense infrastructure that provides the low-risk area for aquaculture fish rafts. Meanwhile, the strategies of pattern arrangement make the platforms function as a global system for amenities and social provisions to serve the community’s growing demand. The final result was six settlement scenarios that reflect the demand of society and the economic changes. The adaptive floating settlement has developed from a wave reduction unit design on a local scale to a global settlement application.
Based on the knowledge and methods that MSc phase has established. The argument of MArch phase has two principal directions. First, on a global scale, the question arises from
where is the beginning of the aquaculture settlement? How does the settlement construct? Second, on a regional scale, the adaptive hypothesis in global scale has established, but the local issues, for example, the transport method for fish harvest, the fresh water supply network, and the relationship of the fish raft and public platform are not yet being considered. Therefore, the MArch phase narrows down the design direction to answer the questions of the process of the settlement establishment and the contextual requirements of the site.
In the following chapters, the design team focuses on the contextual researches including the aquaculture necessity, living demands on the sea, and the surrounding social structure. Followed by the program morphology library that can apply on the top of the platform on the regional scale, then move on to the settlement assembly process on the global scale.
42 Adaptive Floating Settlement 1.1.9
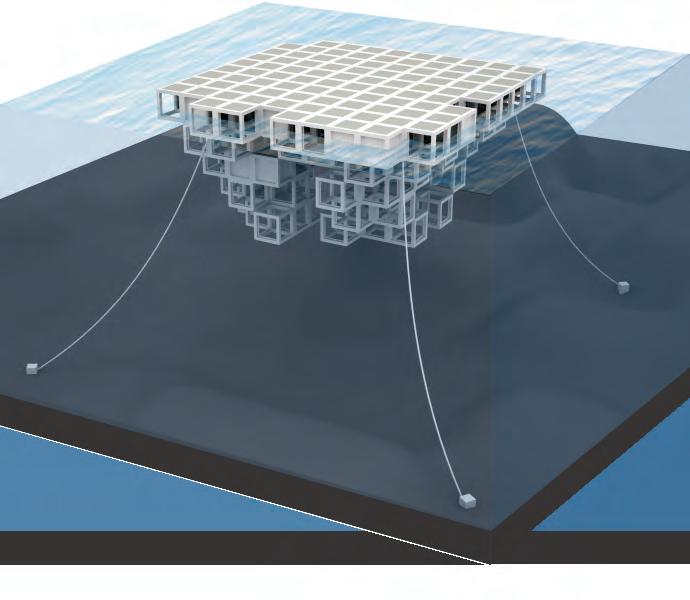
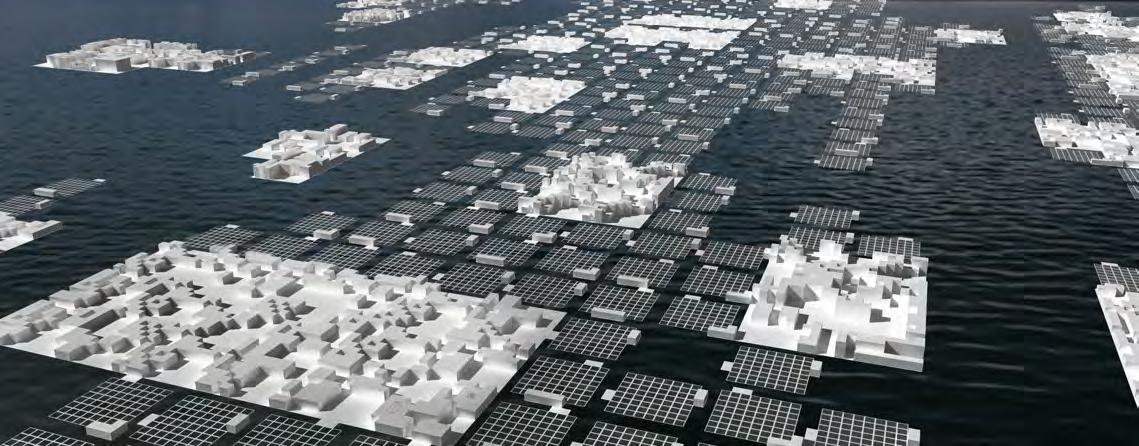
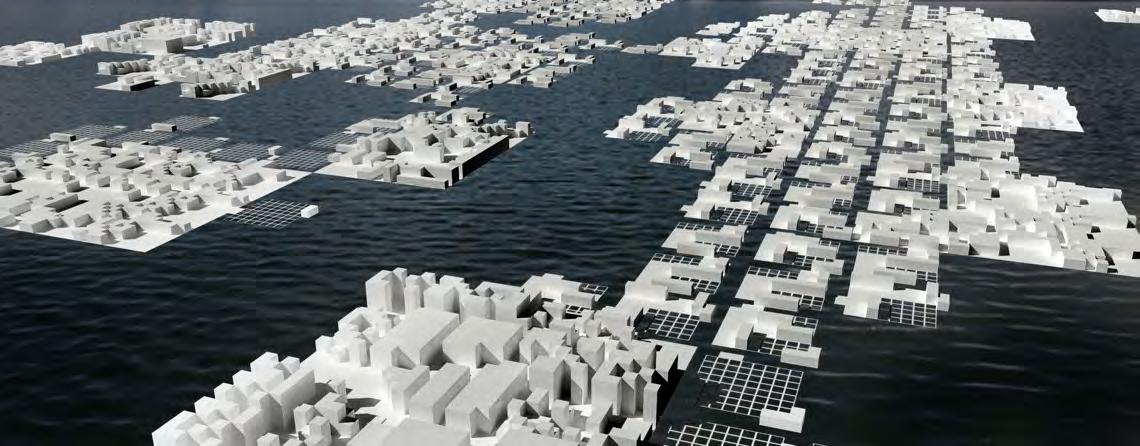
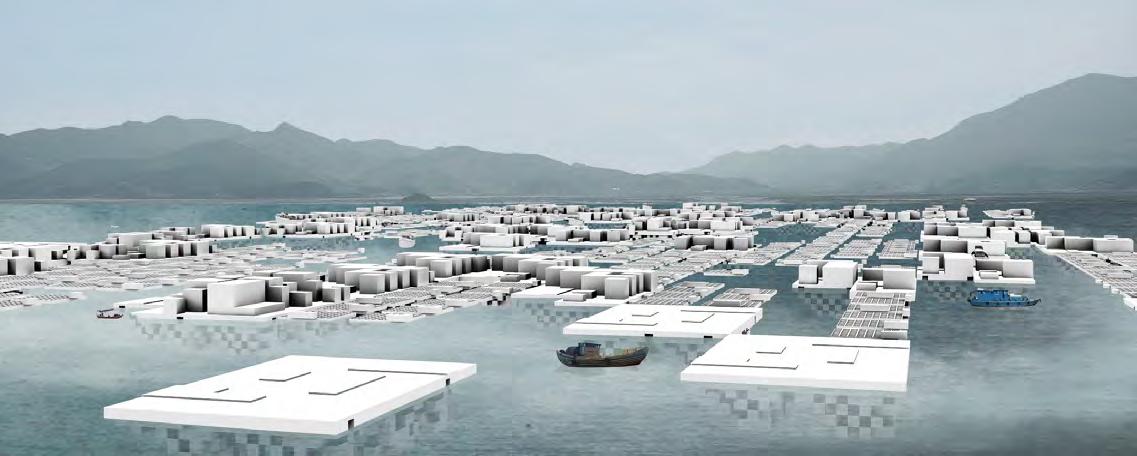
Image illustrates the relationship between the settlement and the context of site.
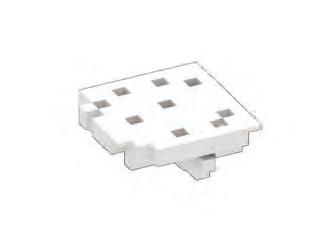
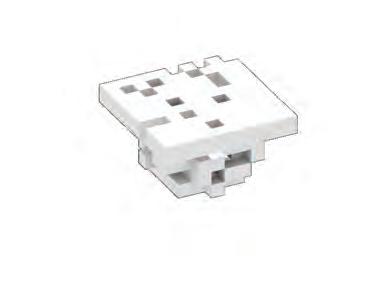
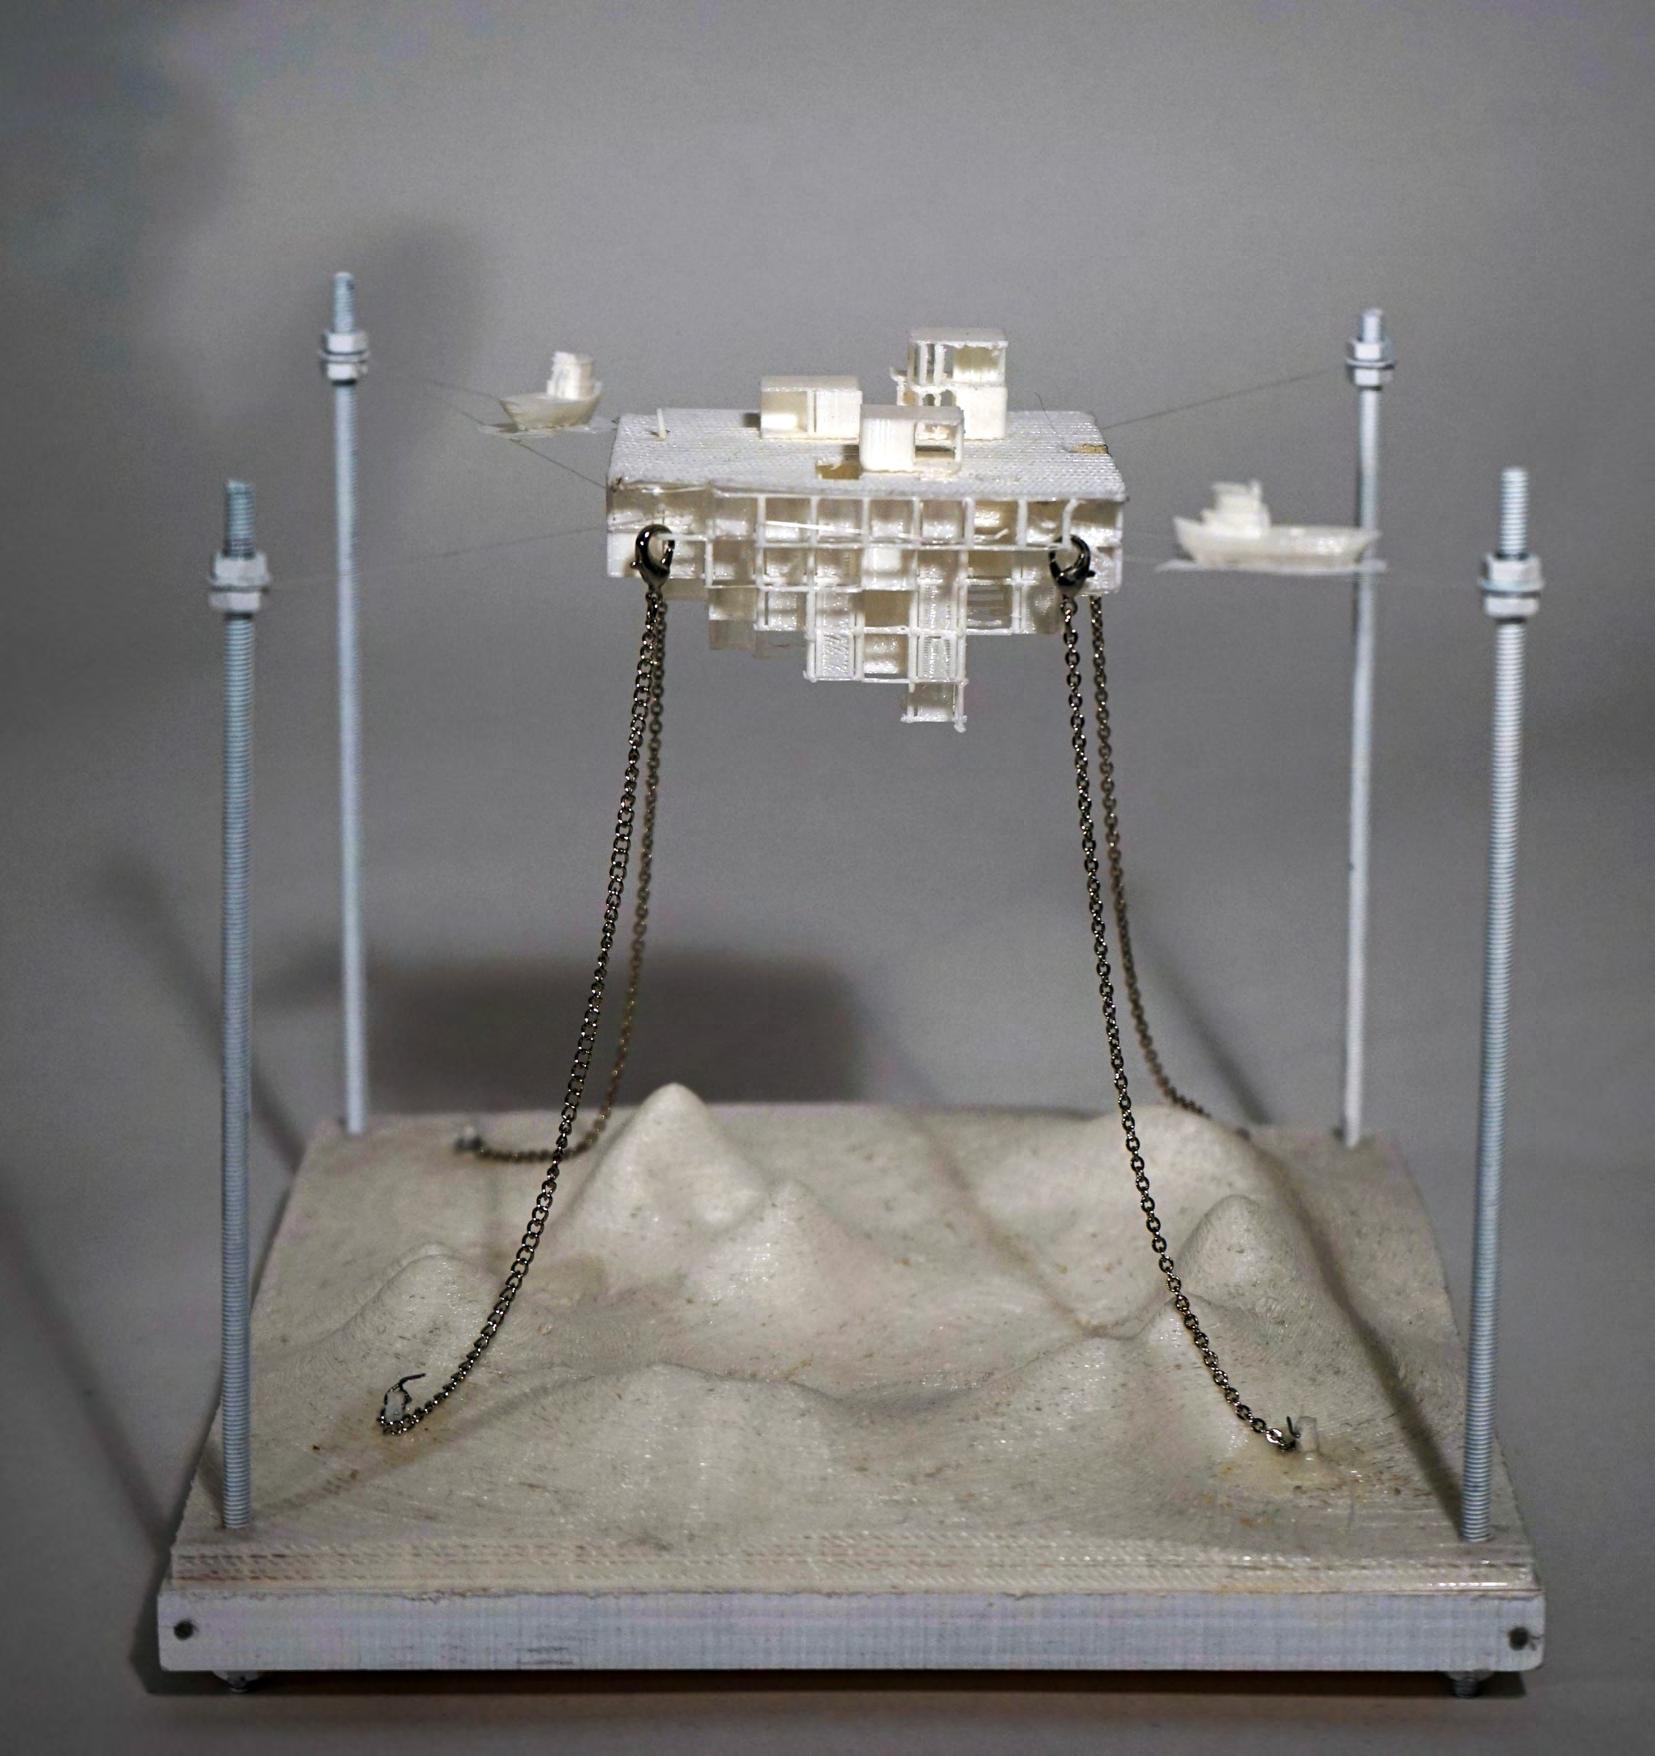
Above Right FIG.1.1.9.1
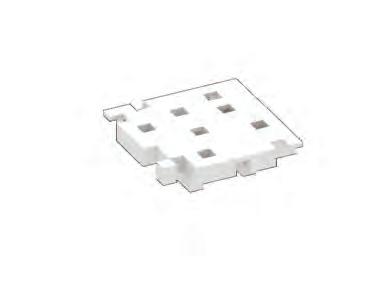
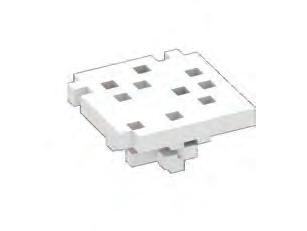
FIG.1.1.9.2
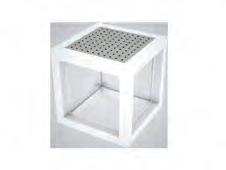
The physical model of wave reduction unit. It print by 3D printer.
View from offshore
Physical Model
 Chapter 1 l Domain
1.2 Contextual Research
Aquaculture Data 1.2.1
Aquaculture
Aquaculture Data
Aquaculture
To understand the relationship of aquaculture activities at the site is the primary task of the contextual research. The complexity of the aquaculture activities has led to specific conditions that only happen in the relevant site. The investigation was based on a holistic picture of the relationship between different aquaculture activities, including the culture species, logistics supply method, transportation, and the daily consumption, etc. It is a fundamental research that helps the design team to gain a clear idea of the current situation in a quantitative way in order to make further design decisions for the project.
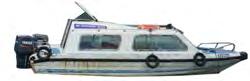
example, cargo boat is mainly used to transport heavy goods like fish fodder and fish harvest, it runs in specific seasons and with a set schedule. In the harvest season, the cargo boats are frequently used to transport massive goods and fish harvest. For the fisherman, the fish boats in the size of 7m and 5.5m are the most common and essential vessels for the individual fish farm. Fish boat is used to carry fish food and materials that serve the daily needs. Therefore, as found in the empirical study, each fish raft owns at least one boat in the culture system. Among all the boats on site, the fastest boat is the speed boat, which mainly used in transiting people rather than carrying goods. Apart from the different usages of boat, the maximum weight that each boat can take has been catalogued as one of the relevant information for the system design. Boats loaded beyond their capacity would be easier to swamp or capsize and much harder to control (Boat Pennsylvania Course).
46 Adaptive Floating Settlement
The flow chart demonstrates the relationship of aquaculture activities
FIG. 1.2.1.1 Aquaculture Activities
Activity
Activities Relationships Fishing Raft >Abalone raft
croaker fish raft >Sea cucumber raft Consumption >Fish food >Water >Transit >Electricity Logistics >Storage >Pack >Ice production >Repair Transportation >Cargo boat
boat
boat
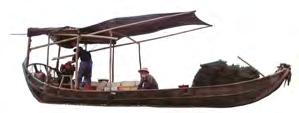
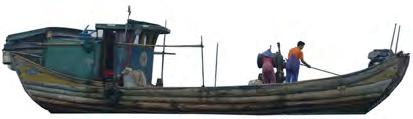
Three main issues were investigated, the transportation network, the logistics supply method, and the daily consumption of human and species. Firstly, the transportation network, boat is the main way to connect fish rafts to land ports. Boats come with a variety in function and size according to specific usages. For transport
>Yellow
>Fish
>Transit
>Land
size: 12 x 5m
max.p : 43
max.load: 3200kg
max.velocity: 16 knot
Typology Types:
Cargo boat

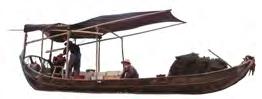
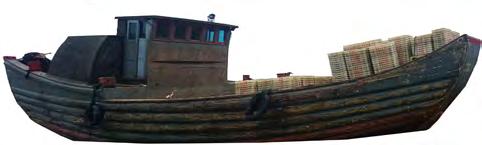
Fish boat
Transit boat
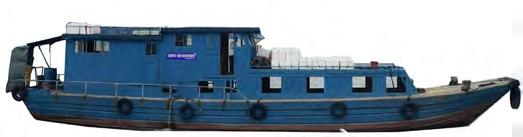
Typology Characteristcis
Maximum capacities people (num) load (kg) distance (km) knot (km/hur)
size:13 x 4.2m
max.p: 39
max.load: 2900kg
max.velocity: 16 knot
Units 1 knot = 1854m/hur
size: 7 x 3m
max.p: 15
max.load: 1200kg
max.velocity: 10 knot
size: 5.5 x 2.5m
max.p: 10
max.load: 800kg
max.velocity: 8 knot
size: 5.5 x 2.5m
max.p: 10
max.load: 700kg
max.velocity: 30 knot
Cargo boat_a Ca
Cargo boat_b Cb
Fish boat_a Fa
Fish boat_b Fb
Transit boat Ta
47 The Domain
Figures and images shows the current use boat with maximum load an velocity.
FIG.1.2.1.2 Transportation
1.2.1 Aquaculture Data
Program Culture species
Fish raft - 64 cages
1 cage
Workforce
yellow croaker fish Max. 8 people
Transportation
Cargo boat_a
Cargo boat_b
Fish boat_a

Fish boat_b
Transit boat
(1.5 years)
1 raft
415 kg
26,590 kg
Fish Harvest
According to the empirical research, the main harvest season happens twice a year - in January/February before the Chinese new year and in June right before the typhoon season, and both last for about a month. It is the most laborious period for fishermen due to the increased workloads and the whole culture area becomes very busy.
The most important issue for the design team is the large quantity of fish in each culture cage. By calculating the weight of each cage (size 3m*3m*5m), the overall weight of harvest of each fish raft can be predicted. The result, along with the weight load of the cargo boat, indicates the number of time a cargo boat needs to transport all the fish harvest from a single fish raft to the land port.

Cargo boat_a Ca
13,295 kg x 2 two harvest in a year
5 times collect all fish per harvest
JAN FEB MAR APR MAY JUN JUL AUG SEP OCT NOV DEC Harvest Harvest
48 Adaptive Floating Settlement
Figure and images define the amount of harvest every year and the weight each time need to carry.
FIG. 1.2.1.3 Fish Raft Harvest
frozen fish
4 penny /kg
dry fodder
1pence /kg
10 kg / per
40 kg / per cage
30 kg / per bag
20 bags / month
2560 kg / day
transport from land
13 m need volume
Fish Food
Feeding is part of the daily routine of a fisherman. As a daily necessity, on a fish raft, fish food needs to be transported from land port to fish raft every day to avoid turning stale. Each fish raft has part of its area used for preparing fish food and storing dry fish fodder. For a 64 cages fish raft, the demand for fish food is significant. Based on empirical data, the overall weight of daily fish food can reach 2560 kilograms, with which a common fish boat needs to run 3 times to prepare it from the land port. The regular feeding usually involves two working people, one of them mix the frozen fish food and the other feed the fish in each cage one by one, and takes around 5 hours. In reality, the feeding schedule changes according to the season. Fishermen feed twice a day in winter and once a day in summer due to culturing strategy and market demand.
3 times / day
land to fish raft
Program Storage
Fish food produce raft
fodder contanier
fodder bag
Workforce
Max. 5 people
Transportation
Fish boat_a
Fish boat_b
 Fish boat_b
Fb (0.6*0.4*0.2cm) 3 49 The Domain
Figure and image shows the demand of fish food every day, and the volume space to storage
FIG.1.2.1.4 Fish Food Mix Area
1.2.1 Aquaculture Data

Packing Area
Before the fish harvest gets to the market, all the goods need to be sent to the packing area on the fish raft. The working process includes many steps: clean, wash, classify, pack, and put ice to keep goods fresh. It involves many fishermen to work together in the packing area. Apparently, this is one of the places that all the transportations need to suspend for a while to unload and load, and with many people work on it. As a working area, this place is hugely different with the area on land. Currently, the design team found that local people use platforms without any usage or function as packing area. Limited space and working area turn out to be an issue for people who work on the platform.
Unload Clean Wash Classify Weight Package Put ice Load Package platform 40kg / per container 25 kg / per box (0.6*0.4*0.2cm) (process) 2.4 m /p working area 2000 kg / day production per day harvest pack box
35 people Program Storage Workforce Transportation Fish
Transit
Cargo
2
Max.
boat_b
boat Fish boat_a
boat_a Cargo boat_b
Cargo boat_b Cb
50 Adaptive Floating Settlement
Fish boat_a Fa
Figure and image illustrate the working process in the packing area before the harvest sell to the market
FIG. 1.2.1.5 Packing Area
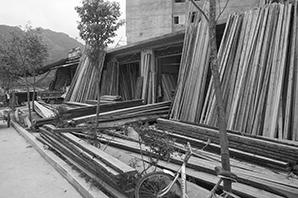
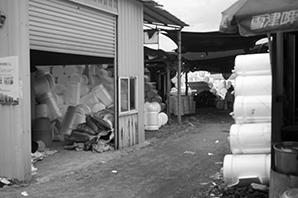
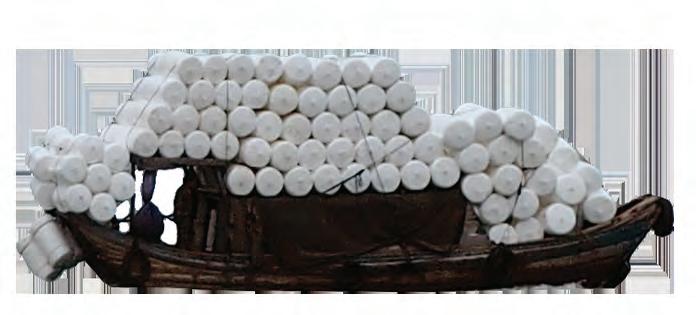
Repair Chain
As the empirical research shows, the surrounding villages play an important role to support the functioning of the aquaculture settlement. Mainly, business on land including the buoy factory, wood board factory, net shop, fish fodder store, and material factory, etc., has formed a support chain for the aquaculture industry. All the services and periodic transportations are set to keep the operation of fish rafts. Over time, the fish raft and the land port together form an interdependent economic system. However, the lack of repair center at sea is still a major difficulty for fishermen in considering the long distance to ship material or workforce in between fish raft and land port to make repairment and regular maintainance.
Repair chain
Program Supply chain
Buoy factory
Net factory
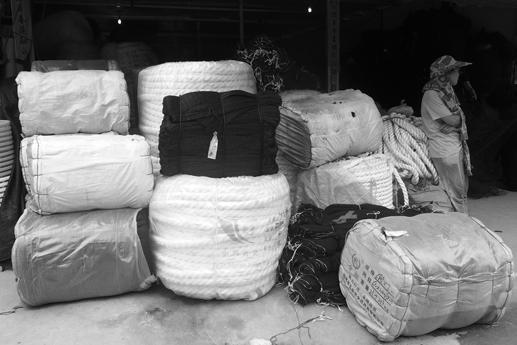
Wood board factory
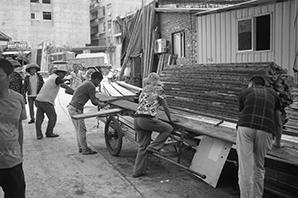
Material shop
Workforce
Hardware store surrounding villages
Transportation Cargo boat_a Cargo boat_b
 Buoy factory
Wood board factory
Buoy factory
Wood board factory
Buoy Transport periodic schedule
Net factory Material factory
Cargo boat_a Ca
51 The Domain
Images show the various aquaculture factories surround the floating settlement and the method to transport goods and material.
FIG.1.2.1.6 Repair Chain
1.2.2 Life Necessaries
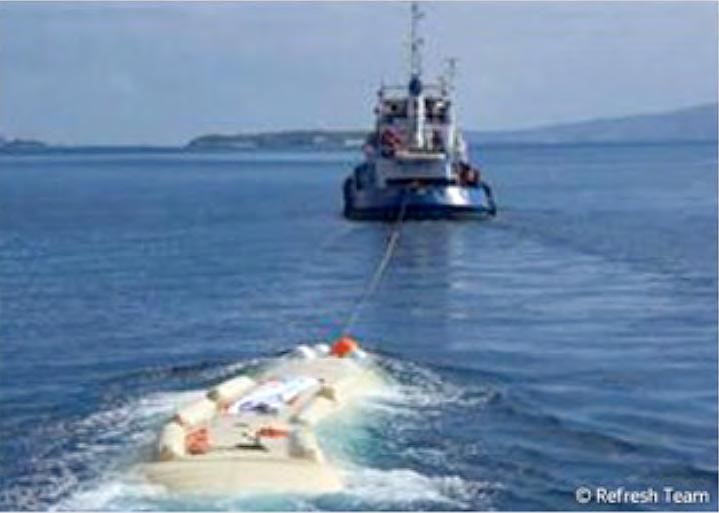
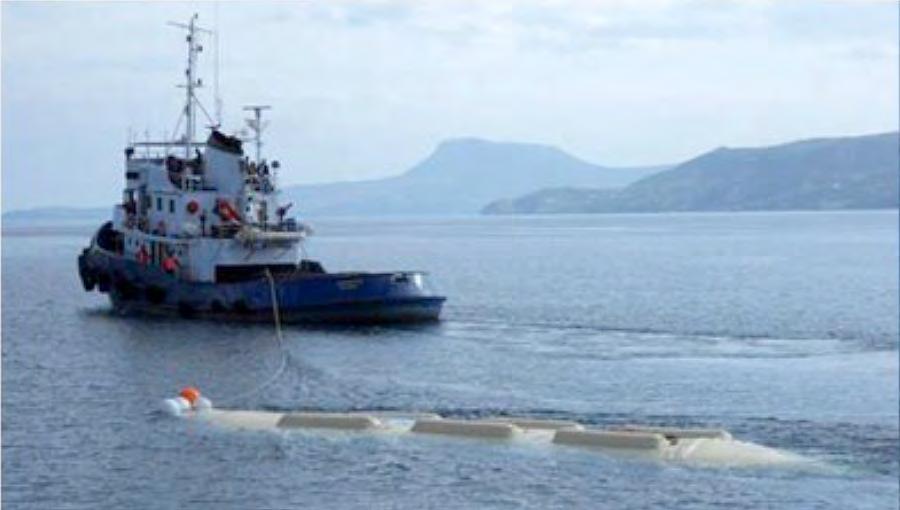
Water Resource
The freshwater resources at the site currently is from the land. The locals individually carry freshwater from nearby ports every few days to survive and work on their aquaculture rafts. Some of the fisherman get the water from land to the raft by dragging the water tank by boat consuming fuel energy and time. The limited freshwater resource affect the health and hygienic of the locals and also the hygienic of the fish product.
The factors contributing to the demand for freshwater are the aquaculture process and the daily usage of the locals. The significant amount of freshwater are needed during the 14-21 days of cultivation period to continuously produce ice, clean the fish products before packaging process and cleaning of the operation work space. Apart from the high cultivation season, every process of aquaculture activities require freshwater but in much smaller amount.
To illustrate the freshwater demand in detail for 1 aquaculture raft; 60 fish cages , the total amount of Yellow croaker fish products are 12.4638 tonnes. The sufficient amount of ice is 20% of product which are 2.492 tonnes. 1.5 times of water is required to produce 1 unit of ice, therefore, the water needed for 1 fish raft are 3.739 tonnes; 3.739 m3.Rainfall precipitation rate at the site is 1,347 mm. meaning that the system can collect water amount of 0.0037 m3/m2 per day in average. The area provided for the rainwater collection are 70,875 m2 which is 262.2375 m3 per day.
According to the World Health Organization (WHO), between 50 and 100 litre of water per person per day are needed to ensure that most basic needs are met and few health concerns arise.(The Human right to water and sanitation, United Nations 2010).
52 Adaptive Floating Settlement
FIG. 1.2.2.1 Transport Water
The images illustrating how the fisherman get the freshwater resources from land to the aquaculture rafts .
1 rafts = 12.4638 tonnes
20% of product = 2.49 tonnes of ice
150% of ice = 3.739 tonnes of water
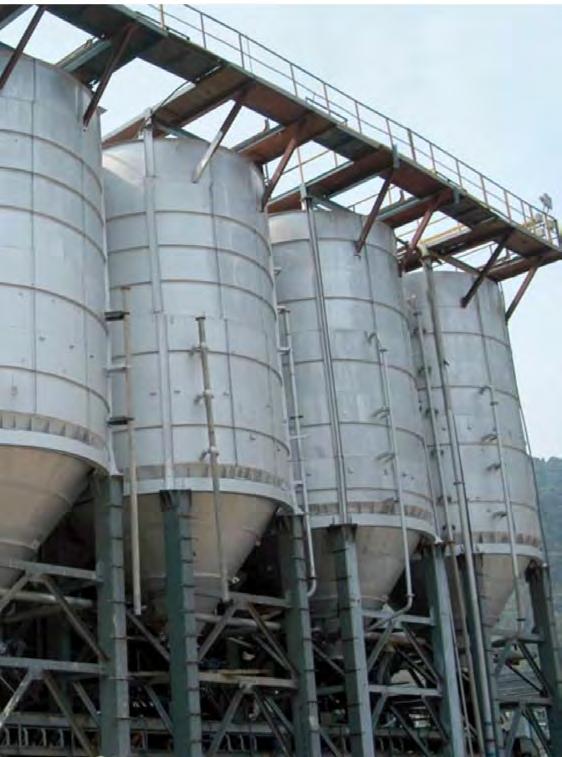
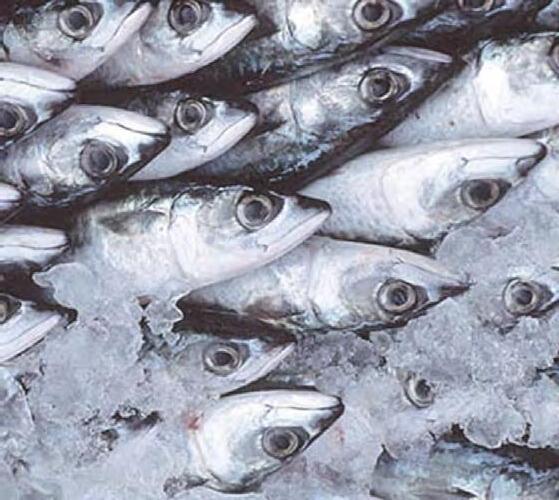
Product Preservation
Ice produced from drinking water quality is the only suitable option to preserve fisheries product. Salt water can not be used to cool the fish product since it alters the taste of the product to be salty. Ice properties are that it is economical, easy to find and it has high rapid cooling capacity since it has direct contact with the fish. The best way to preserve product’s shelf life is to cool the product immediately after cultivation then store in the cold storage.
To illustrate the freshwater demand in detail for 1 aquaculture raft; 60 fish cages , the total amount of Yellow croaker fish products are 12.4638 tonnes. The sufficient amount of ice is 20% of product which are 2.492 tonnes. 1.5 times of water is required to produce 1 unit of ice, therefore, the water needed for 1 fish raft are 3.739 tonnes; 3.739 m3.Rainfall precipitation rate at the site is 1,347 mm. meaning that the system can collect water amount of 0.0037 m3/m2 per day in average. The area provided for the rainwater collection are 70,875 m2 which is 262.2375 m3 per day.
Many types of ice; tube ice, ice block and flake ice are used for different purpose. The flake ice plant has more potential to use on the floating public platform since it has the least requirement area, it saves power to defrost and it is best at the rapid cooling for fish due to the small size of the ice. The water is feeded up to the top part of the ice plant then the produced ice is stored in the silo ready to use for product preparation for market sale or to pack for the cargo transport.
53 The Domain
Images illustrate the ice plant and its quality to preserve the fishery product.
FIG.1.2.2.2 Ice plant
Typology Types:
Storage
Rainfall Water
Water storage
Program Transportation Cargo boat_a Cargo boat_b
Social provision conditions
Social Provision
Sha’ao Bay, locates on the edge of the coast of Fuzhou city, is one of the bays in Lianjiang County that provides a suitable area for marine culture. For more than 50 years, Sha’ao Bay has developed into an important aquaculture site in China’s coastal areas. As the data shows, 80 percent of the local people are fishermen or work in related industries. Currently, there are around 600 fish rafts and nearly 2,000 people reside inside the semi-close bay. On the land area, three villages surround this bay, with almost 10,000 permanent population.
Due to the periphery location of Sha’ao Bay, the social provision system here is not yet been well developed. According to data from the local authority, the majority of social provisions including the main hospital, education facilities, and cultural centers, etc., are provided in Anhai village, where the government of Lianjiang County locates. Anhai village also serves as the central junction to connect the Fuzhou City
and Sha’ao bay. The three villages that surround Sha’ao Bay become the secondary areas in which aquaculture related business thrives. Making a comparison of these three villages, the location of the village influences the social structure and the number of population. The Qida village, sits close to the open sea, benefits from the convenience of transportation, natural resource, and offshore fish catching. Therefore, the number of population in Qida village is more than the other two, but the social provisions does not relate to the number of residences.
Overall, the design team found that the site is still in a developing stage regarding the social and economic conditions, but the aquaculture sector has proved to be the primary activity in the area and thus becomes the supporter of tens of thousands of lives there. The more robust the aquaculture activity is, the more benefit the surrounding area could get.
Train station:12km Fuzhou city: 50km B Qida village Sha’ao village Chicai village Anhai village 0100500m -10m -30m wave direction port site village road 54 Adaptive Floating Settlement 1.2.3
A C D
Diagram illustrate the relationship between villages and the chosen site boundary condition.
FIG. 1.2.3.1 Site Context
A C D B Qida village
Sha’ao village Chicai village Anhai village
Patch size(km²): 0.35
Population(p): 5528
Density((p/km²): 15,794
Patch size(km²): 0.3
Population(p): 2300
Density((p/km²): 7,666
Patch size(km²): 0.21
Population(p): 1500
Density((p/km²): 7,143
Patch size(km²): 0.26
Population(p): 3200
Density((p/km²): 12,307
Place of worship: x3
Sport grounds: x0
Culture: local libaray x1, cultural center x0
Security: police station x1
fire station x0
Parks: x1
Education: nursery x2 primary x1 secondary x0
Health: hospital x0 clinic x2
pharmacy x2
Port: x1
Bus station: x0
Post agency: x1
Wholesale fish market: x1
Place of worship: x2
Sport grounds: x0
Culture: local libaray x1, cultural center x0
Security: police station x1
fire station x0
Parks: x0
Education: nursery x0
primary x0
secondary x0
Health: hospital x0 clinic x1
pharmacy x1
Port: x1
Bus station: x0
Post agency: x1
Place of worship: x3
Sport grounds: x0
Culture: local libaray x1, cultural center x0
Security: police station x1
fire station x0
Parks: x0
Education: nursery x0
primary x1
secondary x0
Health: hospital x0 clinic x1 pharmacy x1
Port: x1
Bus station: x0
Post agency: x1
Place of worship: x4
Sport grounds: x1
Culture: libaray x1, cultural center x1
Security: police station x1
fire station x1
Parks: x1
Education: nursery x3
primary x1
secondary x1
Health: hospital x1 clinic x1
pharmacy x1
Port: x0
Bus station: x1
Post office: x1
Medium provision of social facilities
High density
Low provision of social facilities
Low density
Low provision of social facilities
Low density
Good provision of social facilities
Medium density
Central junction
55 The Domain
Diagram illustrate the information of social provision at each village in regards to location of the village.
FIG.1.2.3.2 Data of Social Provision
1.2.4 Population Growth Trend

Reconfiguration
Program
Fish food produce raft
Wave Parameters
Coastal Migration Situation in China
Lianjiang County Population Structure
Migration situation in China
Another issue that has happened significantly at the site is migration. From the time Chinese government started the Chinese economic reform in the 80’s, the economic growth in coastal cities in China has become a pull force for people in inner land. People began to move to the city from the rural area and the majority of people move to the city on the east coast of China. For the past 30 years, the number of people migrates into coastal cities soaring from 6 million in 1982 to 220 million in 2015. This phenomenon not only reconstructs the distribution of the population in China but also create many super cities along the east coastal line. The increasing pressure for coastal cities to accommodate more and more people is inevitably transforming the spatial and social landscape of these cities.
Fujian province is one of the cities that expands quickly in population due to its vigorous industrial sector. Since 1982, the provincial capital, Fuzhou city, has crowded in 3 million people. As a result, the aquaculture industry has changed dramatically that both the scale of the culturing area and the number of people who work in aquaculture sector multiplied. On the other hand, the increasing demand for seafood in
+1500 fishermen / per year
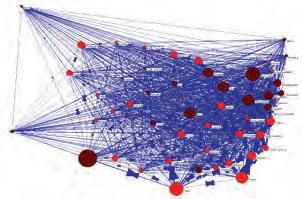
Population : Fishermen / 10 : 3.75
China is also a crucial factor that boosts the aquaculture business. Currently, the aquaculture area in Fuzhou city is 6 times bigger than 15 years ago, and it is predicted to expand 10 times bigger in the next 10 years.
As the demographic statistics illustrates, until 2020, the number of the population in Lianjiang County will increase to 700,000. Each year there will be around 1500 more new fishermen, and the total number of people who works in aquaculture business will arrive at 27,000 in 2020. In sum, around 38% of the total population in Lianjiang County will be involved in aquaculture related industry, it is a significant growth compare to 24% in 1982.
The migration trend along with consumption needs have significantly influenced the population and economic structure in Lianjiang County in the last thirty years, especially the number of fishermen and the scale of the aquaculture industry. There is an imperative need to consider the correspondent issues like the lack of living area and insufficient social provisions under this rapid change.
56 Adaptive Floating Settlement
Diagram shows the coastal migration trend in China, and the population growth in the Lianjiang county where is the site location.
FIG. 1.2.4.1 Population Migration
Above
FIG.1.2.4.2 Population Growth Trend
Figure descripes the amount of people migrate to coastal area in China.


Below
FIG.1.2.4.2 Population Growth Trend
Figure descripes the amount of people growth in the chsen site. It has significantly change duting last 10 years.
2020 people migration to coastal cities in China Fuzhou city Lianjiang county Aquaculture area (sea) Fuzhou city Fujian province 2010 1982 220 290 (million) (year) 25.9 41 4.9 4.9 7.3 8 0.5 0.7 2020 Lianjiang county fishermen fish raft 38% fishing sectors 5200ha 900ha 6670ha 2015 1982 (million) (year) 0.5 0.06 0.12 0.25 0.27 0.7 0.66 57 The Domain
Conclusion
The contextual research assists the design team in having a thorough picture of the site and the existing conditions, both on the aquaculture activities and the socio-economic trend. The acquired aquaculture data is used to identify the design strategy more precisely based on the situation of the relevant site. The study on primary issues including transportation network, the logistics supply method, and the daily consumption of human and species provides empirical information that to be considered as principles in later design phase.
The design of a transportation network with roads in different hierarchies in the settlement is calculated based on the types of boats that operate on-site. Both the social and spatial needs come from aquaculture activities and residential livelihood helps to define
what programmes to be introduced into the system. Life necessaries are also taking into account that the clean water supply system is the foundation to form a self-sustaining floating settlement at sea. Lastly, the occurring social trend in China has pulled more and more people to migrate to coastal cities. The rising population pressure along with higher demand for places to live will be the design contexts that have to be integrated into the design proposal.
58 Adaptive Floating Settlement
FIG. 1.2.5.1 Fish Raft Image A fisherman walk on the fish raft after feeding fish.
Photo by the design team
1.2.5
Conclusion Right
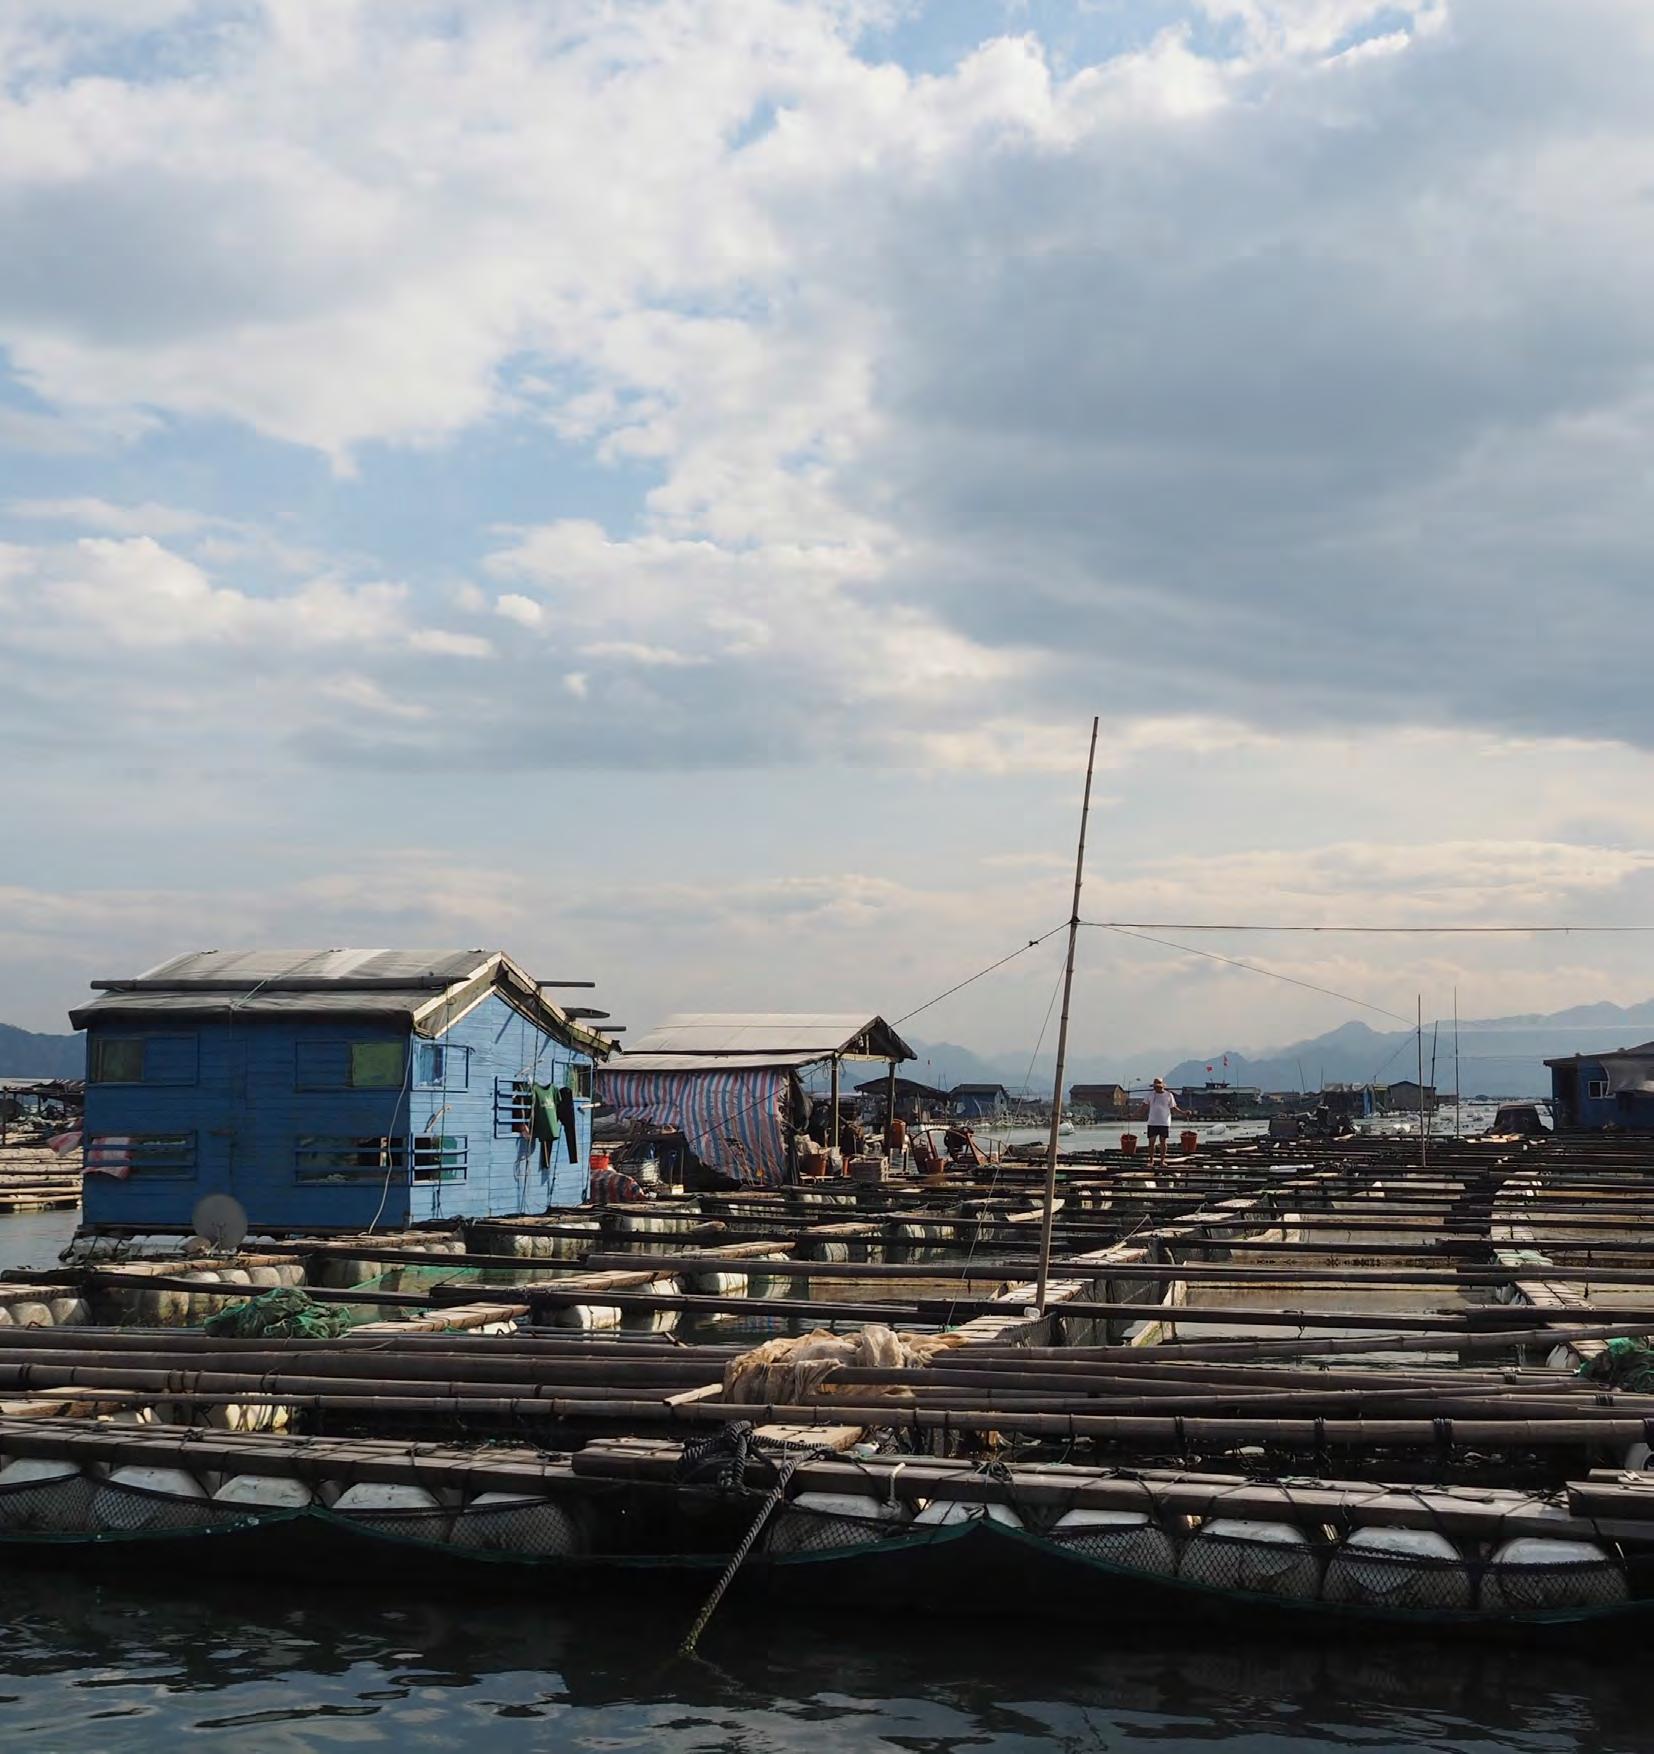
59 The Domain
Chapter 1 l Domain
1.3 Case Study
Fabrication Process
Fabrication process
Case Study
This section looks into two case studies: the fabrication process of the wave reduction platform and the configuration strategies of Mulberry Harbour. The study on fabrication process informs the sequence of establishing the overall floating settlement - from the 3m cubic module to clusters. The Mulberry Harbour operated during the WWll, on the other hand, points out the strategy to create a safe area for activities on the sea. Respectively, these two studies provide the design team a framework for units manipulation and configuration that could build on and further develop the sitespecific design principles.
Fabrication Process
The discussion of the fabrication process starts from manufacturing the module concrete block. A 3m cubic module unit is the basic unit to construct platforms that accommodate most of the public activities. Each platform has a unique wave reduction structure underneath. To build
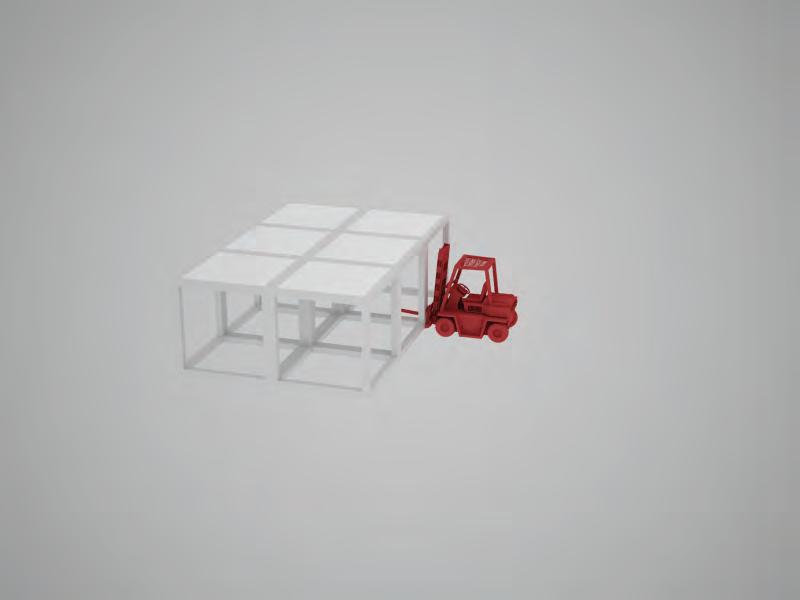
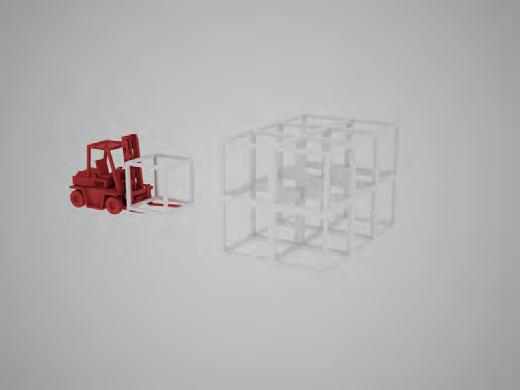
a wave reduction platform, it takes 5 steps starting from manufacture the concrete modules in a factory on land, transport the modules to port, assemble the modules into platforms, drag the platform to its position at sea, and anchor the platform to the seabed. Following are the detailed analysis of each step based on empirical information from the site.
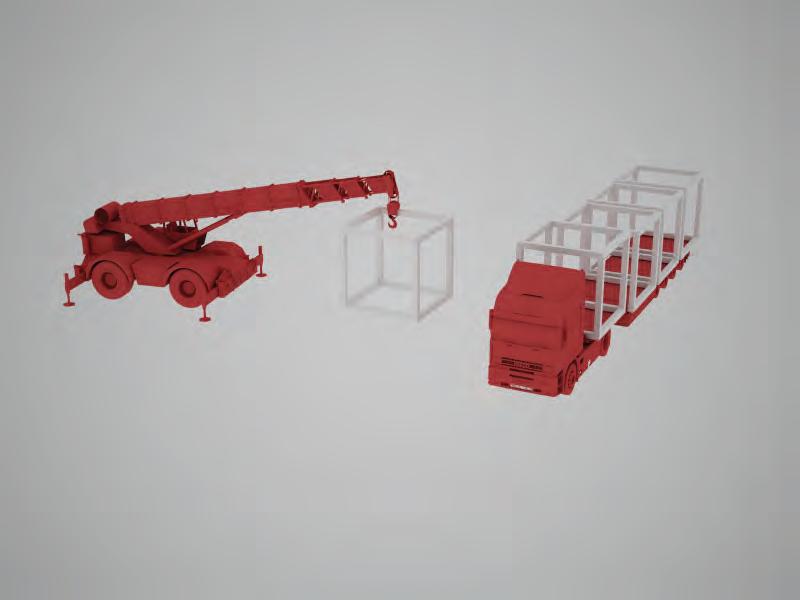
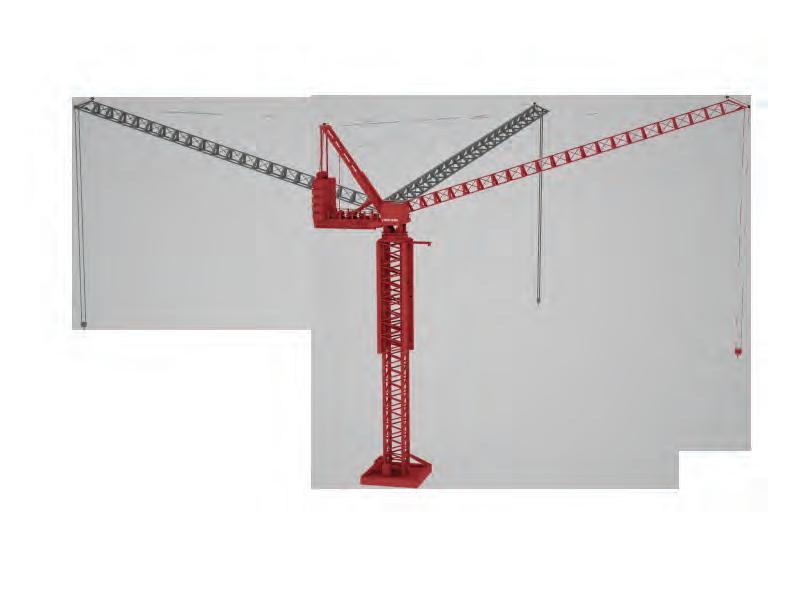
Manufacture:
The closest concrete production factory would be 20km away from the site due to the fact that the site is located on the edge of the city. There is a difficulty to complete an entire platform in the concrete factory and ship it to the port. Therefore, the pre-fabrication process is essential for this project. The module will be built in advance and ship to the harbour to assemble. As the study on man-made breakwater structure shows, the modular artificial reef system uses similar pre-fabricated manufacturing methods. The abilities to plan and deploy are emphasised when building this kind of massive module structure.
62 Adaptive Floating Settlement
1.3.1
Diagram illustrates the fabrication process on land.
>>
>> 3m x
>>
>>
>>
>>
>>
>>
>>crane
FIG. 1.3.1.1 Fabrication Process Manufacture 1 2 3 Transport Assembly
concrete blocks
3m x 3m
forklift
crane
transport by lorry
max. 4 units once
assemble iclose to port
forklift
Transport:
Transportation network become a crucial factor due to the site’s rural location. The viable way to deliver the concrete units is by train and lorry. As found in the contextual research, a train station 3km far from the site will be the primary transportation centre to ship a large number of the structure units from the factory at once. Lorries with higher mobility will bring the concrete units from the train station to different ports to assemble.
Assemble nearby the port:
Due to the volume of each platform (30m by 30m with various depths), the assembly process takes place nearby the sea. The fabrication involves many heavy equipment and workforces, thus require places that have the capacity to support the construction process. The suitable locations in surrounding villages become one of the criteria that the design team considered when identifying where is the first place to start and assemble the settlement.
Drag to position:
The completed platform itself does not have its own power system to move around at sea. Motor boats are needed to drag the platform from the port to the planned location. The process is the same when moving fish rafts to their position.
Anchor:

Once the platform arrives its position, it is anchoring to the seabed to avoid further movement. Based on different conditions and needs, platforms might connect to each other to form a stronger wave reduction structure or a bigger platform for public activities.
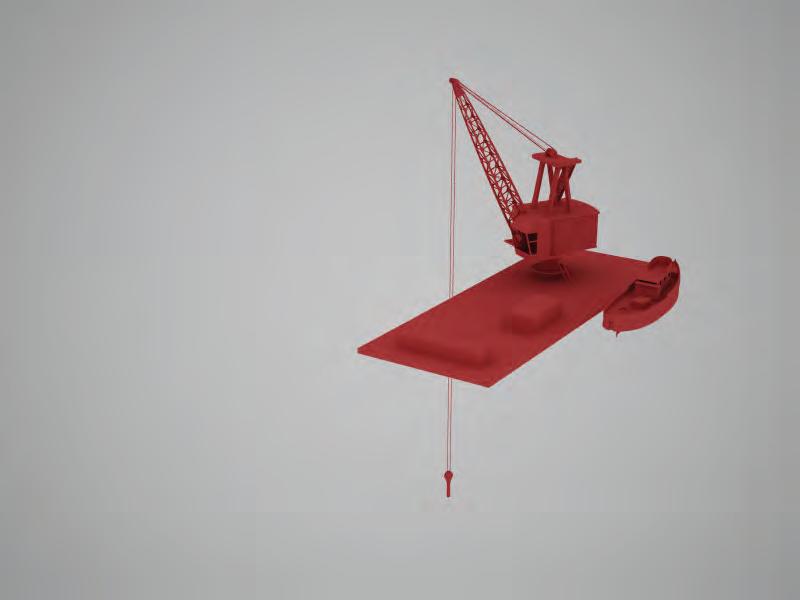
Since the depth of each wave reduction platform is determined by both the location and the corresponding water depth, the anchoring points within the entire settlement need to be decided before assembling the platforms.
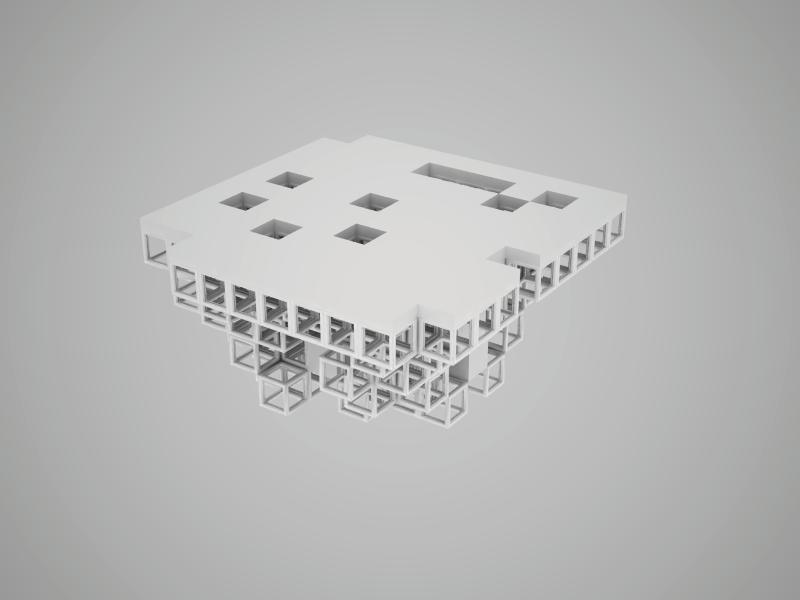
63 The Domain
Diagram illustrates the fabrication process at sea area
FIG.1.3.1.2 Fabrication Process
4
5 Drag to position >> move by motor boat >> 30m x 30m platform >> depth depends
Anchor >> anchor the public platform >> pile driving barge
Mulberry Harbour
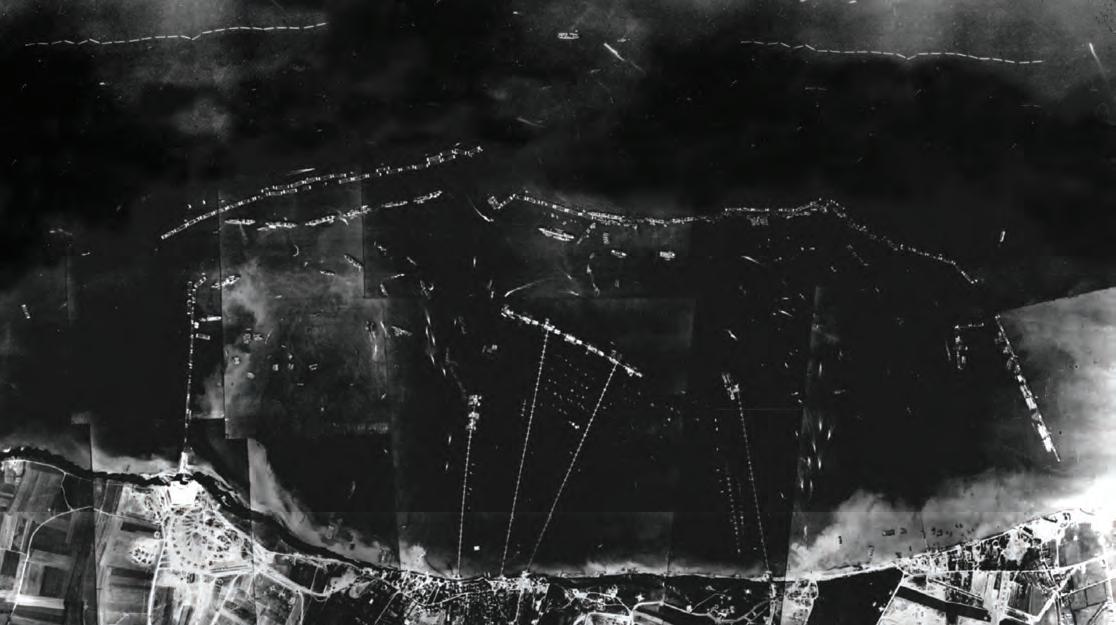
Mulberry Harbours
To study the precedent man-made settlement at sea and the correspondent wave reduction strategy, Mulberry Harbours was chosen as a valuable example considering the scale and complexity of it. Mulberry harbours were two artificial harbours built during World War II. The purpose of the harbours was to facilitate and speed up the unloading process of cargo onto beaches so that Allied troops were supplied efficiently.
Each of the two artificial harbours would have a capacity of 7,000 tons of vehicles and supplies per day. The supply chain was made up of about 10 km of flexible steel roadways that floated on steel or concrete pontoons to connect the pier to the beaches. To ensure the stability and safety of the floating pier, the artificial harbours would need to provide sheltered conditions.
Each harbour was about 1.6 km long and stood about 9 m above sea level at low tide and 3 m at high tide. Two layers of breakwater with different functions and structures were strategically designed to lower the impact of wave and the potential severe weather caused by storms. At the far end of the harbour rested the first defensive line (water depth 24 m) to reduce the wave height and wave energy. Two lines of 24 bombardons units, each a large 61 m by 7.6 m cross-shaped floating breakwaters fabricated in steel, anchored to the seabed and attached to one another with hemp ropes, creating
a 1.6 km breakwater. The second defensive line (water depth 13 m), consisted of reinforced concrete caissons (Phoenixes) and block ships (Gooseberries) close together, was the main structure to cut down the waves.
Inside the resultant protective cordons, there would be pierheads (Spud pierhead) connected to the shore by floating steel roadways (Whale) and pontoons (Beetles) - to allow goods and equipment to be transported by lorries. The stable floating piers were where all the logistic and supporting activities took place, its distance from the beaches provided a sufficient water depth (6.7 meters) for the docking vessels. Each of the Spud pierhead equipped with four steel legs that anchored to the seabed, but still allowed it to float up and down freely with the tide.
With strict conditions for on-site construction, most of the concrete elements were manufactured on the River Thames then towed across the English Channel and assemble off the coast of Normandy. The two artificial harbour completed in just 6 months under the rigid wartime conditions. The complexity and vastness of the operation and the sheer necessity to move soldiers, supplies, equipment, etc., have made Mulberry Harbours a valuable case for the design team to learn from.
64 Adaptive Floating Settlement
1.3.2
FIG. 1.3.2.1 Master Plan
The master plan of Mulberry harbour demonstrates the strategy of arrangement with five different infrastructure.
1 (-24m) (-13m) 2 3 4 5 6 1
Phoenixes Gooseberries Spud pierhead 2 3 4 Whale Beetles 5 6
Mulberry harbour
Bombardons
>> anchored floating wave attenuation device
>> each 60m long, 8m high.
>> at a depth of 20 to 24m
>> the outermost barrier
>> concrete caisson
>> 60m long, 17m wide, 18m high.
>> 6044 tonnes
>> maximum depth 10m
>> merchant vessels (block ships)
>> defending the wave height
>> position with “Phoenixes”
>> provide sufficient water depth for the docking vessels
>> linked to the beach by floating roadways
>> allow the discharged goods and equipment
>> 61m long, 18.2m wide, model depth 3m
>> equipped with 4 steel legs, anchored to the sea bed.
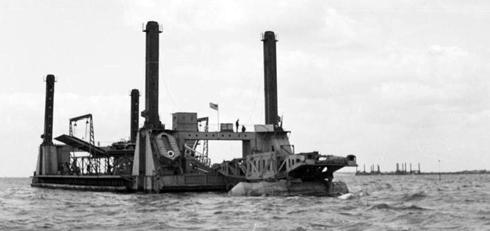
>> each leg is 27.43m long, 40tons
>> a system of pulleys, ensure smooth vertical movement.
>> floating steel roadway
>> 24.38m long
>> carry loads up to 25 tons
>> accommodating 7.62m tidal range
>> with telescoping decks to accommodate lateral movement
>> concerte and steel floats or pontoons
>> support the roadways “Whale”
>> capable of taking the weight of 56 tons + 25 tons
Images show the performance of each infrastructure in the Mulberry harbour.
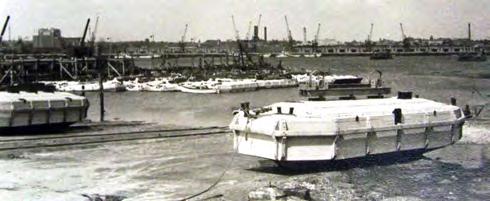
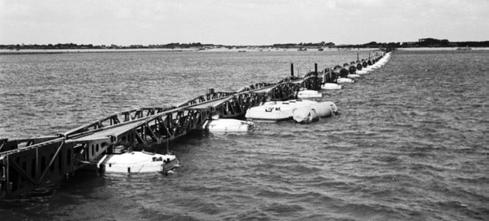
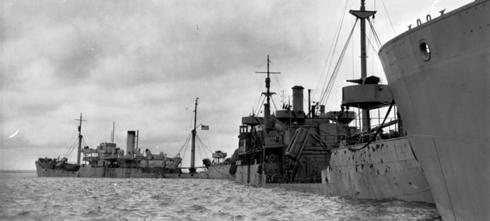
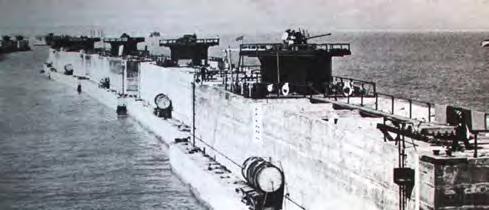
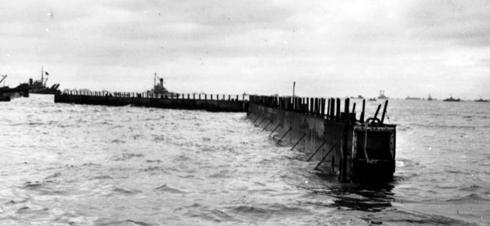
65 The Domain
FIG.1.3.2.2 Infrastructures
2 3 4
1 Bombardons Phoenixes Gooseberries Spud pierhead
Whale Beetles 5 6
Conclusion
Conclusion
On the construction level, the study on fabrication process provides a clear idea of the manufacture sequence. From a single concrete unit to the entire floating settlement, sitespecific conditions and empirical information were taken into account to develop a viable method. On the system level, on the other hand, the case of Mulberry Harbour presents a holistic strategy to build an artificial shelter at sea with a high capacity of supply chain and mobility. Within the context of the chosen site, the strategies and logics conducted in these two cases were taken as an applicable guideline for the design and construction of the floating settlement. In the next chapter, a detailed design approach for determining the assembly process of the floating settlement will be introduced.
66 Adaptive Floating Settlement
FIG. 1.3.3.1 Bird View Image Image shows the boat ships within the harbour after the wave reduction system has applied to the location.
Left
1.3.3
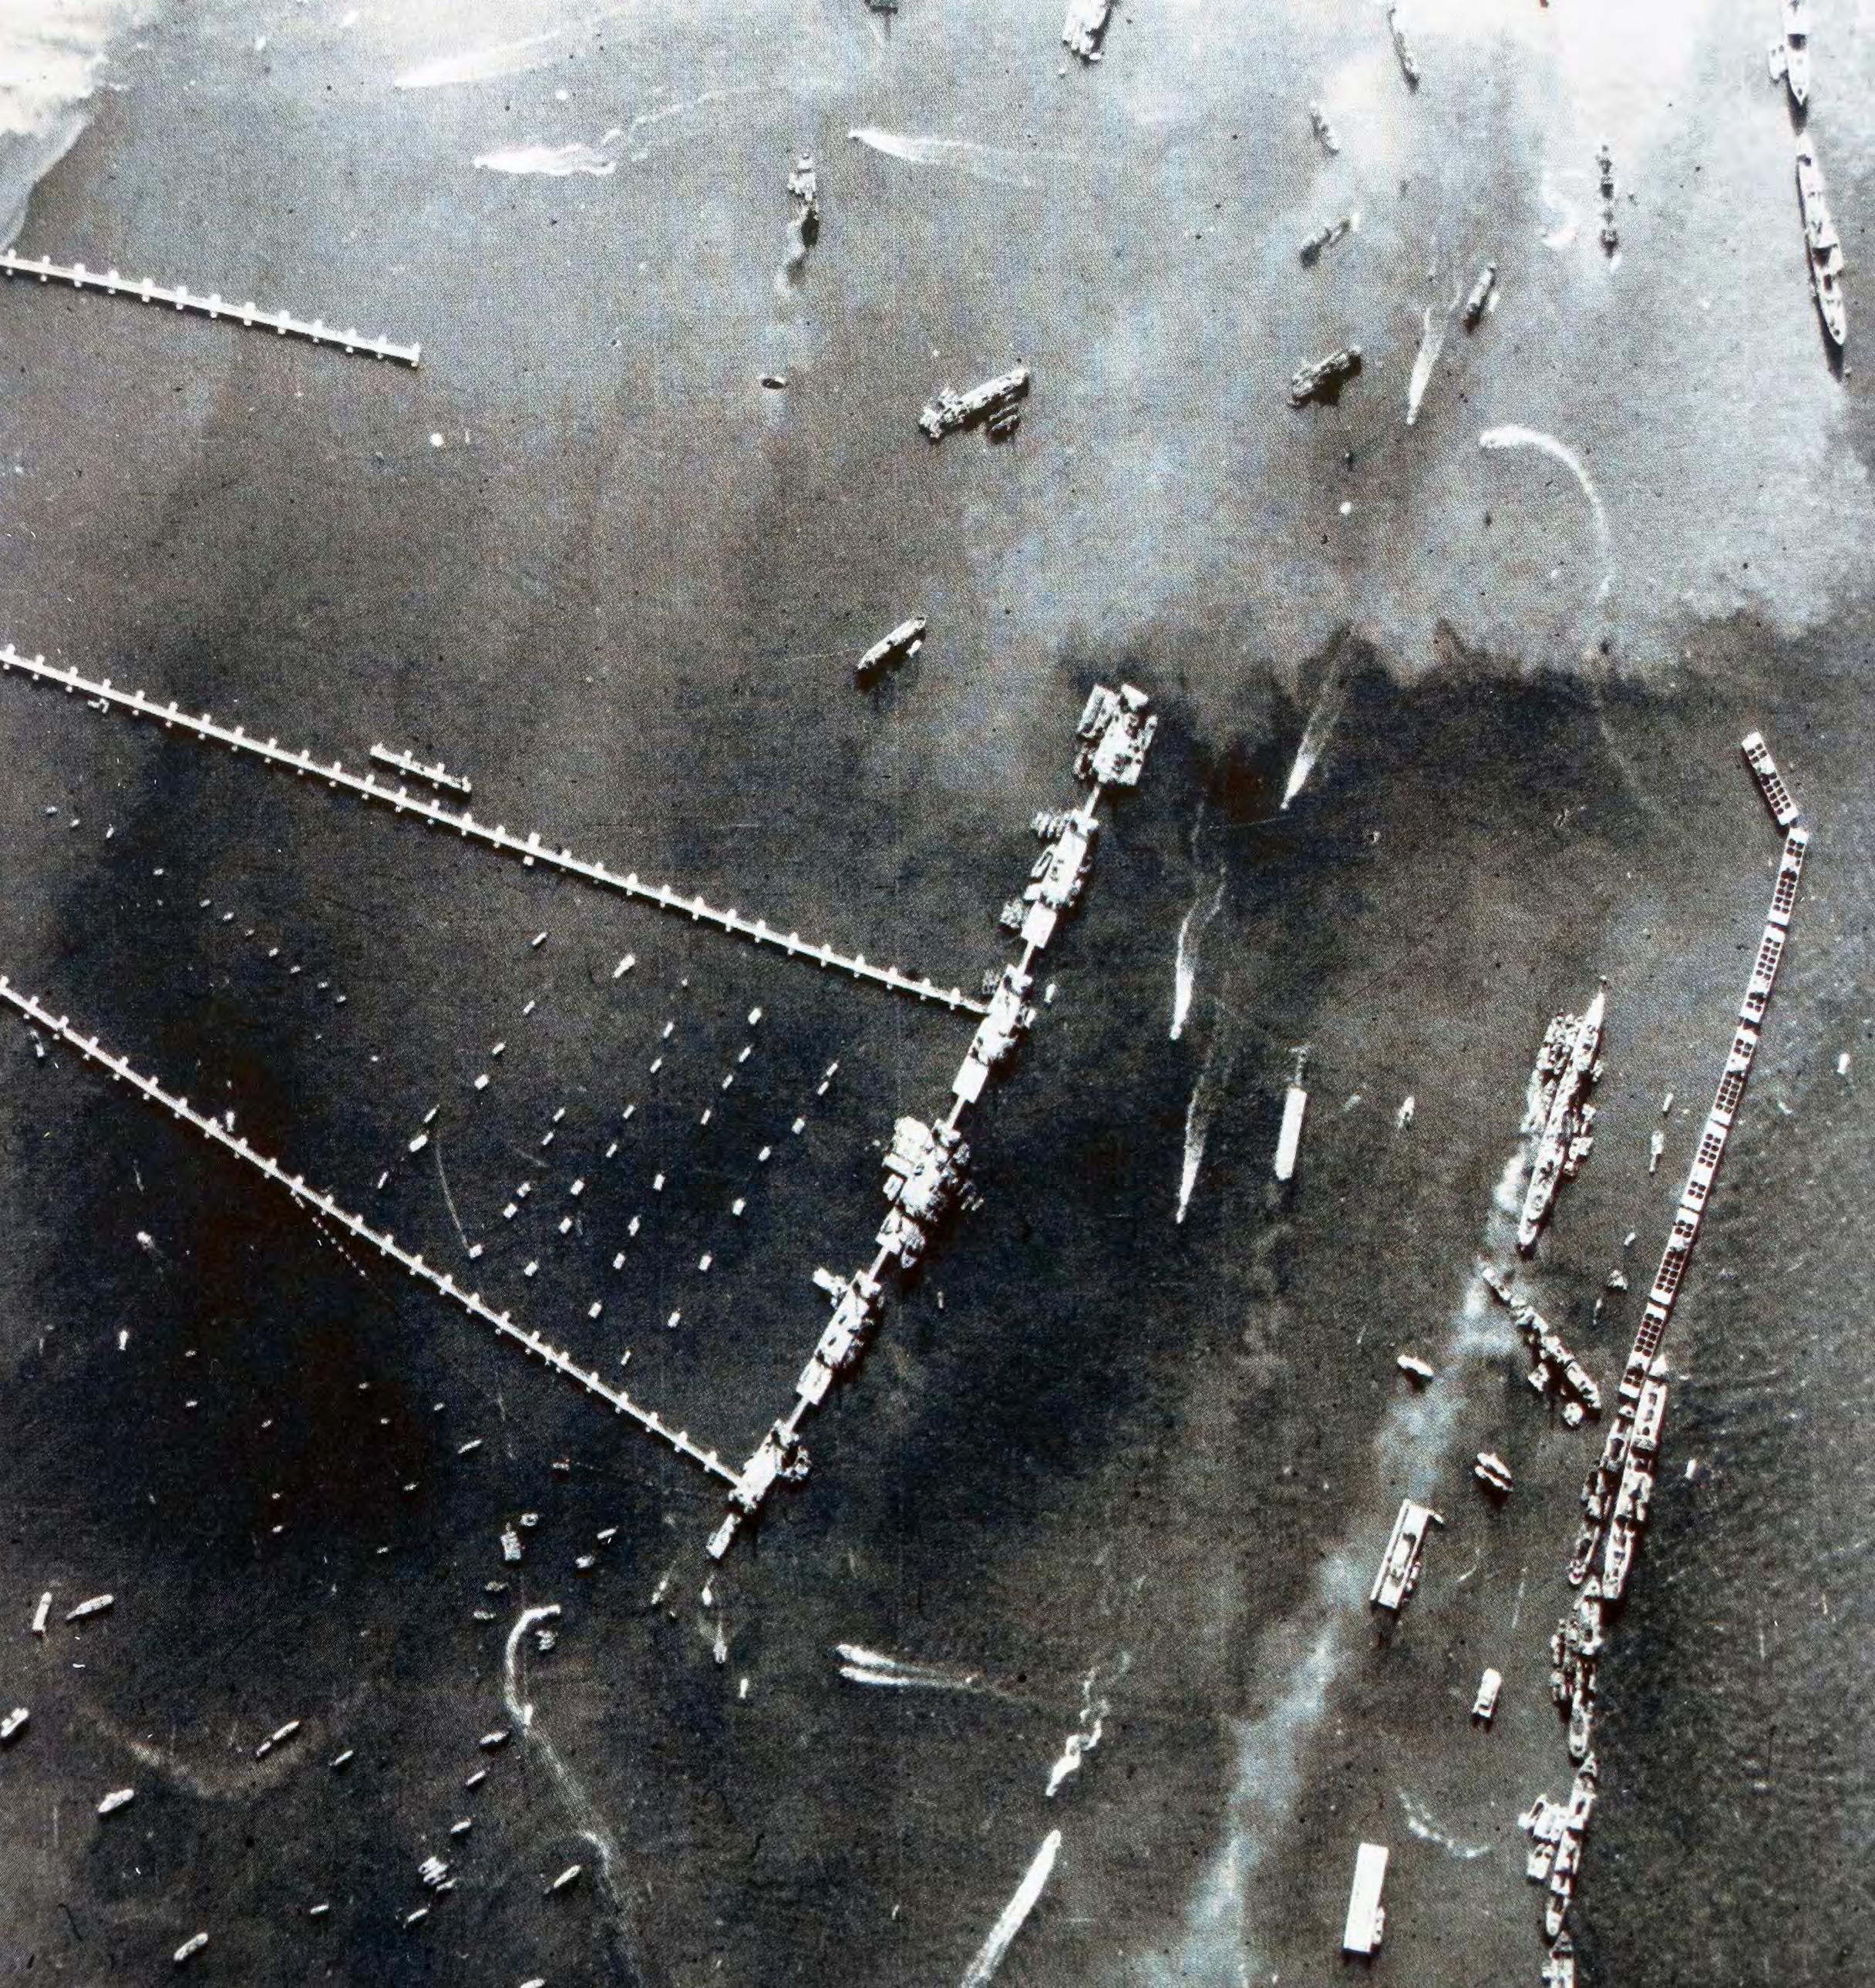 Chapter 1 l Domain
Research
1.4
Proposal
1.4.1 Design Ambition
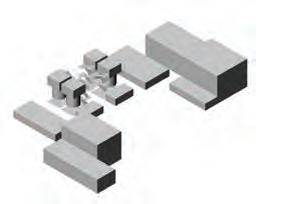

Design Ambitions
For the purposes of this project, a holistic design ambition was developed based on the critical reflection of MSc phrase and the contextual research of the site with the precedents investigation. The aim is to link the result of MSc phrase about the wave reduction infrastructure arrangement and the MArch ambitions about the settlement organization logic. This dissertation will investigate on floating settlement organization logic and integrating program morphology which is suitable for aquaculture activity and living on the sea. The design process will start from the identification of the relationship between clusters and the list of program which is necessary for the floating settlement. Meanwhile, the program morphology will catalog as a library base on the study of the relationship, also take into account the stability of the floating platform. The overall results will integrate into the strategy of the assembly process which strategically arrange the develop of the settlement. Following the idea
from MSc of settlement transformation which reflects the demand from society and the change of economic. The platform reconfiguration has become a part of the process that takes into account for the settlement arrangement. The target of the project is to achieve a permanent living floating settlement with 20,000 populations, which is ten times bigger than the current situation, and provide 40 square meter living area per person. Apart from the city on the land, the challenge to develop a settlement at the sea area is the major task throughout the whole project. For the design team, the idea of living on the sea is not a new thing, but to establish a city on the sea is the most innovative concept.
70 Adaptive Floating Settlement
The flow chart illustrate the design ambitions from the MSc phrase to MArch phase.
FIG. 1.4.1.1 Design Ambition
+W +D Life Habitat Aquaculture Fishing boat Infrastructure MSc MArch Principles and Parameters Wave Reduction Unit Organization Logic Cluster Platform Relationship Program Library 600m 5min CN EN PL SN SN SN SN LN LN LN LN LN LN LN LN LN SN SN
Permanent Living Floating Settlement
Target:
Population: 20,000
Density: 11,000 per/sqkm


Living Area: 40 sqm/per
Green Area: 12 sqm/per
Design Questions

Considering different levels of system scales, the design sought to answer the questions:
1. What programs are to be considered to help define or influence the settlement organisation logics for floating villages?
2. What is the assembly process of the floating settlement in related to the contextualization?
3. How does the adaptive mechanism of floating settlement function to adapt different issue from any aspect?
4. What is the expansion limitation for a floating aquaculture settlement?
71 The Domain
A Wave Direction Wave Reduction Unit Pattern Arrangement Settlement Scenarios AQ PE Assembly Process S.1 S.4 S.6 Wave Direction
1.4.2
Design Targets Target
Fish food produce raft Program
Lianjiang County Site
0.3 % occupation
> +350 pe/per year
> +120 fishermen /per year
Design Targets
To compliment the knowledge from MSc phrase and contextual researches, a set of design target were set up to fulfill the demand for the chosen site. It occupies 0.3 percentage area of the Lianjiang county which can be predicted has 350 people increase number every year including 120 fishermen. The design team was focused on gathering existing on-site data and using this information as a foundation for the development of an integrated settlement management strategy. Information on population density, green area, culture, commercial data and provisions was collected and studied to help determine the population requirements of the site. The information was compared with data of other districts and existing rules and regulations to
help set target population values for the design proposal. Currently, the site contains approximately 2000 residents who are mostly working on aquaculture business. It was estimated to increase to 10,000 people by 2020 by the population growth data. The new proposal will be targeted at providing accommodation for double the predicted amount. The final proposal will cater for 100,000 populations who live in the surrounding villages, 11,000 per square kilometer population density, 40 square meters living area per person, and 25 percentages commercial area.
72 Adaptive Floating Settlement
Diagram illustrate the occupation ratio of the chsoen site. It caculates the approximate population growth every year.
FIG. 1.4.2.1 Ratio of the Site
73 The Domain
Gathered data of various provisions
Population (sqm/person) (live on the sea) (sqm/person) (sqm/person) (sqm/1000persons) (sqm/person) Living Area Office Area Culture Provision Green Area 13 9 Target Target Archive Library 3045 Multi-use 109 4 Average 0.1 Health 0.17 Education 0 0 0 0 0 0 6 2,000 10,000 20,000 Target Shaao Bay 2020 UK Target HK 4043 Target Paris WHO 9 11 12 Population Density (per/sqkm) 0 5,000 LondonLianjiang 5528 11,000 Target
FIG.1.4.2.2 Target Data
2.0 Methods
Chapter 2 l Methods
Process
2.1
2.1.1 Process Overview
Domain Methods
(Research Stages)
Research Proposal
(Research Process)
Data Analysis
Precdents
Contextual Researches
MSc Critical Reflection
Abstraction
Parameters
Targets setting
Boundary Conditions
Research Development
Process Overview
Throughout the research phase, site-specific data and resources were evaluated in an attempt to set programmatic ambitions, identify design issues, and define the organisational logic of the overall floating settlement. The previous study led to the definition of a set of design methods that summarised the attempt for an integrated approach in the context of designing a floating aquaculture patch in an area at high risk of severe weather conditions. Various digital tools were explored and tested to facilitate the development of the experiments and to further refine the design strategies. The techniques such as conducting case studies, literature review, and scripting algorithms help the design team understand the limits of the research. The computational methods including the use of software and scripting algorithms enhance the project to a more comprehensive solution. The flow chart illustrates the design process and the overview of the tools that were involved. In the following chapter, a more detail discussion will show the methods that being used in the project.
Inputs
Experiments
Design Strategies
78 Adaptive Floating Settlement
Figure illustrates the process of this project. Strating from the research towads the Design Scenarios.
FIG.2.1.1.1 Design Prcosee
Design Development Design Scenarios
Computational Tools
Generative Tools
Evaluative Tools
feedback loop
Output Solutions
Feedback
79 Methods
Design Result
Arrangement Methods
Wave Equations and Relationships
The principle of sea wave movement (vertical and oscillating) is mainly the periodical up and down movement in which wave energy transfer through. The target of developing the methods is to simulate how different arrangement of wave reduction platform can provide the corresponding wave energy reduction. The design team has developed two main methods that are wave collision check and the platform location data extract. The platform data that obtains from the method will put into the loop in order to get the optimized scenario of wave reduction pattern arrangement.
To achieve acceptable simulation resolutions, the design team takes a group of published physical wave reduction experiments as a reference, and its result has been implemented in the simulation. With a similar scale of wave height, length, and floating platform size, different
combinations of platform produce different results of wave risk pattern. Once the proper evaluation strategy set up, the better fit platform arrangement could be achieved with the help of the computational algorithm.
First is the method of wave equation and relationship combination. It is an algorithm for testing different methods and applying wave reduction principles and equations. It is possible to conduct wave reduction simulations in the same interface where design strategies are to be developed. Meanwhile, it is important to note that this wave reduction experiment testing of methods and patterns are conducted simultaneously with the development of the morphology design for the wave reduction unit.
80 Adaptive Floating Settlement
2.1.2
Deep Wave Collision Check Depth Check True Apply Shallow False iteration i(i < site depth) New wave height and wave position Coefficient Calcuation Second Axis Refraction Wave Streaming
Figure illustrates the process of the computational algoritm function in relation to the wave equation and site context.
FIG.2.1.2.1 Algorithm Process
Variables:
>> Wave Reduction System Pattern
>> System Unit Clustering
Boundary Conditions/Inputs:
>> Highest Wave Height(Max): 6m
>> Starting Wavelenght: 56m
Objectives:
>> Identify high-risk and low risk areas
>> Identify level of safety zones 1-5
>> Pattern arrangement of wave reduction platforms
4
Wave Height Reduction
Map showing wave height reduction based on pattern
High
Low
WAVE CASE:
Wave period start from: 6s
Wave length start from: 56.2m
Wave height start from: 6m
Density
Wave length range(21.22m to 56.2m)
Allowable Aggregation
Wave height range(0.12m to 6.0m)
5
Ratio of Family UnitsFishing Cages - Open Spaces
*consider pollution
Diagram and Data show the process of arrangement including enivronemntal information and zoing strategy.
81
Methods
Variation Position Analysis Step Wave Reduction Platform Step 1 Scenario 1 Step 3 Collision Step 12 Reduction Zone 1 Zone 2 Zone 3 Zone 4 Zone 5 Near Shore 900m 2100m Off-Shore Wave Direction Wave Height 6.0m 0.0m
FIG.2.1.2.2 Wave Reduction Pattern Arrangement Method
2.1.2 Arrangement Methods
Platform Location Data
Secondly, the method of platform data extraction identifies the vertical information of the platform. It is the second process of the design algorithm to define the structural depth of the wave reduction structure in relate to the bathymetry condition. The design team can get the platform GPS data, the sea depth, and the specific sea wave parameter. It has been coordinated with the method of wave equations and relationship parameter as the second step to identify the platform information.
The hypothesis of this idea is to use the global positioning system to get the location information. Since there is no visual instruction can help the construction process on the sea, the location data of each platform becomes essential. On the other hand, the study of the sea wave performance has proved that the circumstance of waves is greatly affected by seabed. The aim is to identify the depth of the sea at each location where about to anchor the wave reduction platform. With the acquired data, the depth of the structure can be decided - which plays a significant role in interrupting the structure of wave and thus reducing wave height.
82 Adaptive Floating Settlement
119 51’ E 119 52’ E -10m -30m 119 53’ E 26 23’ N 26 22’ N
Diagram illustrates the method of platform data extraction by using GPS system which has applied into the computational algoritm .
FIG.2.1.2.3 Location Information
Platform data
119 52’_24E 26 21’_30N >>GPS:
>>Wave Height: 2.1m
>>Sea Depth: 15.07m
>>Structure Depth: 6m
119 52’_55E 26 21’_40N >>GPS:
>>Wave Height: 4.2m
>>Sea Depth: 22.13m
>>Structure Depth: 9m
Topography Strategy
Topography was an important aspect of the design approach as it was interrelated with all of the design intentions that the fundamental concept was zoning the platform patch. Relevant zones were defined by the level of risk and the elevation and position in regards to the bathymetry data of the chosen site. Through this information, the settlement assembly process will coordinate the data extraction and the data of wave parameter to implement the construction process.
Methods 83
sea bed 0m -30m sea level
1
(offshore) (Near shore) Zone
Zone 2 Zone 3 Zone 4 Zone 5
Diagram shows the section of the platfrom and the specific information of each platfrom.
FIG.2.1.2.4 Bathymetry Data
Chapter 2 l Methods
2.2 Tools and Techniques
2.2.1 Tool and Techniques
GA and CA methods are mainly used in looking for the optimized design results.
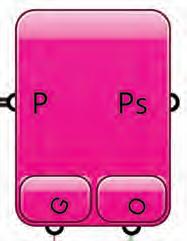
Multi-Objective Optimization (GA)
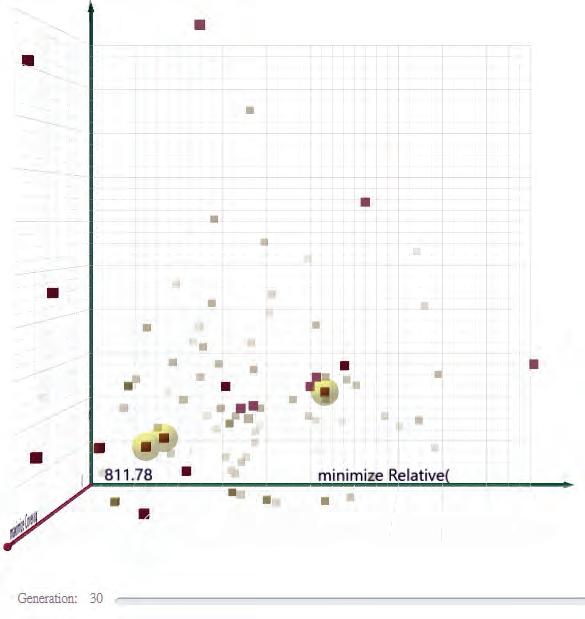
The design team used genetic algorithm in two parts of this project. One was for generating the morphology of wave reduction platform; the other was looking for the optimized settlement. For a nontrivial multi-objective optimization process, it is inappropriate to provide a single solution that optimizes all the objectives at the same time. In this project, a non-dominated solution should be provided as the optimalresults. All Pareto optimal solutions are considered equally ‘good’ for the multi-objective optimization. The selection of the result crossovers the mutation procedure of genetic algorithm. Every generation of optimal-results inherits the proper genome from the previous generation.
Cellular Automata
Cellular automata logic is a computational model that use discrete method to solve mathematics, physics, complexity science, biology, and micro-structure modeling (Wolfram,1983). Based on its properties, it helps to solve lots of bottom-up procedure. According to a set of rules based on the state of neighboring cells, the rule is applied iteratively to achieve the target. There are nine cells in a principle grid that has been introduced to the range of effected area. The number of surrounding cells will decide the conditions of the center cell. There are three results: dead, survival, and rebirth.
CA has been used together with genetic algorithm in the wave reduction unit design in the MSc phase to generate platform structure. In the MArch phase, the method has been applied to the organisation strategy for the arrangement of fish rafts.
86 Adaptive Floating Settlement
FIG.2.2.1.1 Tools and Techniques
Grasshopper Plug-in: Octopous
rebirth survival dead effect area 01237 4568 7 neighbors neighbors neighbors
C#: Cellular Automata
Python in Grasshopper: CFD Grasshopper Plug-in: Karamba
CFD and Wave Analysis
The implementation of CFD techniques in this dissertation can be defined in three stages: At the first stage, CFD analysis involves using CFD tools such as Autodesk Simulation CDF, Flow 3D to get the result. The second stage was the application of the principle and logic of CFD method. Code in Python and write with LBM (Lattice Boltzmann Method) for testing CFD process in particle scale. The last stage, the CFD principles are abstracted, and the algorithm written in a specific way that can be used on a larger scale. Algorithm is written in Python, and then optimized and written in C#.
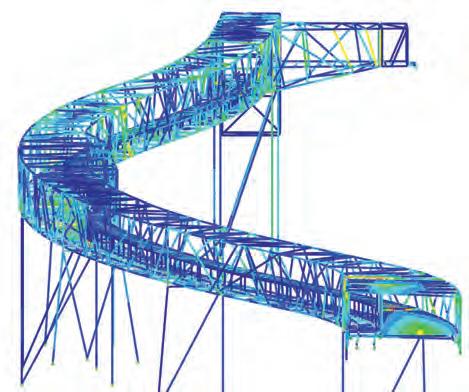
FEA Structure Analysis
FEA analysis has been widely used in structure evaluation software. There are an enormous amount of software providing structure analysis at different levels of resolution. FEA software such as Karamba plug-in has already provided sufficient results for the research and design. The advantage of using Karamba is the real-time evaluation results. Currently, it is supported by JAVA, Python, C# environment and the Grasshopper scripting in Rhino 3D software.
The structure performance of the wave reduction platform was evaluated by Karamba. By integrating it with the morphology generating logic, the design team was able to use it with GA to find the optimized morphology.
CFD and FEA methods coordinated with the algorithm that approach the result towards optimized.
87 Methods
FIG.2.2.1.2 Tools and Techniques
3.0 Research Development
Chapter 3 l Research Development
90 Adaptive Floating Settlements
3.1 Network Experiments
91 Research Development
3.1.1
Network Strategy
Network strategy
For the purpose of this project, the network strategy is driven by the aquaculture data and the context of the site to minimize the effects of high wave and maximize the aquaculture activity. The approach concerning the network across the site is closely related to the aquaculture activity and the contextual information in a floating aquaculture settlement scenario.
New nodes are located in characterized areas provided by the demand of aquaculture activity and transportation time of boat. It can be summarized into safe, collection and evacuation points. Their distributions associate with the time needed for the fishing boat to reach the node with regards to the distance from the land. Calculations takes into consideration of the type of frequent use boat with different velocity and function. In conclusion, nodes are positioned in a way that there is a sufficient functional distribution covering the entire site.
92 Adaptive Floating Settlements
93 Research Development
A 2.8km 8min 10min 5min C 4.2km D 2.2km B 15m 6m Road width Distance Type 0100500m -10m -30m wave direction port site Radius: 1700m 1 knot = 1.8km/hur
The diagram illustrating the surrounding villages including the important nodes for aquaculture logistics.
D B A C
Cargo boat_a Ca Fish boat_a Fa Transit boat Ta max.v:
16
knot max.v: 10 knot max.v: 30 knot
FIG.3.1.1.1 Network Diagram
Topological Experiment 3.1.2
Evaluation Method
central node
Topological node
A series of experiment was conducted to identify the strategic spots – the nodes, to initiate and develop the network of the settlement. The characters and relations of nodes can be clearly illustrated to identify the strategic spots in the settlement. Those concentration nodes play the major roles to distribute aquaculture logistic resources and material, thus become the transportation junction within the settlement.
The topological experiment focuses on criteria including the centrality, accessibility and the coverage area ratio. The experiment shows the optimized topological node is a fivenode arrangement that can reach 99% plot coverage, and the entire district of node (radius 600m) can be reached by boat in 5mins from each node. It also shows the even distribution of central nodes with the overlap rate, 1.1, which means most of points inside the settlement has similar distance to access two closest central nodes around itself. Meanwhile, the criteria of accessibility sets a maximum 10mins by boat transport time from land villages to topological nodes.
Evaluation criteria and objectives:
1.Lessen relative distance: Controlling the distance between three central nodes to make sure each of them evenly distribute at the settlement.
2.Maximum coverage rate: Increasing the number of points within the affected area of central node. With a minimum travel time and maximum plot coverage.
3.Maximum the distance between central node and edge node: Avoiding a too close pattern between central node and edge node.
94 Adaptive Floating Settlements
FIG. 3.1.2.1 Evalution Criteria The diagram shows the evaluation criteria and objectives for the optimization of nodes number and locations.
B_Node_5-2
1. Lessen relative distances
2. Max. coverage area Max. [ce] & [ed] area edge node sub node
0.5
Node_4
coverage: 93.6%
overlap rate: 0.47 radius:593m
coverage: 98.3% overlap rate: 0.52 radius: 591m
coverage: 99% overlap rate: 0.55 radius: 593m
Node_4
Radius: 1700m
Node_5
Evloutionary setting
Mut.Probability: 0.1
Rate: 0.5
Crossoverr Rate: 0.8
Population Size: 10
Generations: 30
1700m criteria
Max.coverage Min.relative distance distance(avg.)
Node_6
coverage: 95.7%
overlap rate: 0.96 radius: 598m
coverage: 97.9% overlap rate: 0.83 radius: 585m
coverage:99% overlap rate:1.1 radius: 597m
Node_5
Evloutionary setting
Elitism: 0.5
Mut.Probability: 0.1
Mutation Rate: 0.5
Crossoverr Rate: 0.8
Population Size: 10
Generations: 30
Fitness criteria
Max.coverage Min.relative distance Shortest distance(avg.)
FIG.3.1.2.2 Evalution Results
The network experiments results in 4,5 and 6 number of nodes
coverage: 93.7% overlap rate: 1.44 radius: 556m
coverage: 98.2% overlap rate: 1.26 radius: 556m
coverage: 99.2% overlap rate: 1.16 radius: 543m
Node_6
95 Research Development
A C
a b c A B C
2
Test
Network Analysis
Main Nodes
A
Result:
B
Village Village Village
One of the ambition of the settlement organizational logic is to evenly distribute the resources both for aquaculture logistic and for daily life necessity.
The network strategy then aiming to find the import nodes in which covering as much the area of the site as possible, ensuring that all fish rafts can easily reach the resources distributed though these strategic nodes from land. The optimized result shows the number of 5 nodes with the coverage are of 99%. Due to the empirical research and data gathering, the relationship of aquaculture settlement and to land is crucial. The nodes closest to the surrounding villages then being the most important ones for aquaculture logistics.
C
Target: Coverage 99%
Radius: 597m ( 5min by boat )
Nodes: 3 Edge nodes,5 Central nodes
Optimized main nodes location
Result: Highest Above Number
96 Adaptive Floating Settlements
3.1.3
7 600m 5min 1. Lessen relative distances 3. Max. [ce] & [ed] area 2. Max. coverage
FIG. 3.1.3.1 Optimized Nodes The diagram shows the chosen result of network optimization
Highest connective node: 2
Above 6 points connection: 8
Number of cluster: 5
Nodes centrality
FIG. 3.1.3.2 Diagram of Depth Value
Zoning Network Diagram
The network analysis method is by the degree of centrality. The highest centrality meaning that the node is easily access by not only the rafts but also the surrounding nodes. This analysis method determines the hierarchy of the nodes and their relationships to one another.
Result:
Nodes centrality
Target: Coverage 99%
Radius: 597m ( 5min by boat )
Nodes: 3 Edge nodes,5 Central nodes
Result:
Highest connective node: 2
Above 6 points connection: 8 Number of cluster: 5
Optimized main nodes location Nodes centrality
All 5 optimized nodes have high connection points to other nodes accounting for 6,7 and 9. The diagram illustrating the relationship between node types through their connection with the most important nodes for provisions initiating three node types of Edge nodes, Central nodes and Subnode. The Subnode has variation due to their connections to other nodes.
The diagram shows the value of depth to reach the central node. Zoning network diagram indicating the connection between the three major nodes, central node, sub node, and edge node.
FIG. 3.1.3.3 Zoning Network
97 Research Development
7 9 6 6 9 6 7 7 Number of connections (node) 35 22 2 0 0 3 3 0 2 1 2 3 4 5 6 7 8 9 600m 5min (site boundary) C E PL S1 S1 S1 S2 S2 S2 S3 S3 S3 [ed] area
Network analysis Village Sub Node_1 Port on land PL S1 Sub Node_2 S2 Sub Node_3 S3 Result: Highest connective node: 2 Above 6 points connection: 8 Number of cluster: 5 7 9 6 6 9 6 7 7 Number of connections (node) 35 22 2 0 0 3 3 0 2 1 2 3 4 5 6 7 8 9 600m 5min (site boundary) C E PL S1 S2 S1 S1 S1 S2 S2 S2 S2 S2 S3 S3 S3 S3 S3 distances 3. Max. [ce] & [ed]
Network analysis B Village Sub Node_1 Edge Node Port on land C E PL S1 Sub Node_2 S2 Sub Node_3 S3 7 9 6 6 9 6 7 7 Number of connections (node) 35 22 2 0 0 3 3 0 2 1 2 3 4 5 6 7 8 9 600m 5min (site boundary) C E PL S1 S2 S1 S1 S1 S2 S2 S2 S2 S2 S3 S3 S3 S3 S3
area 2. Max. coverage
area 2. Max. coverage
1. Lessen relative distances 3. Max. [ce] & [ed]
Network analysis A B C Village Village Village Sub Node_1 Edge Node Port on land C E PL S1 Sub Node_2 S2 Sub Node_3 S3
7 9 6 6 9 6 7 7 Number of connections (node) 35 22 2 0 0 3 3 0 2 1 2 3 4 5 6 7 8 9
Network analysis Village
Result:
Legend
Left Right
Node Characteristics
Node characteristics derives from the research and the experiments. These nodes then become the strategic spots for the organized aquaculture settlement network. Similar to the ecosystem, each distinct node types function differently but relate and support one another. The optimized network includes three types of nodes. First, three ‘edge nodes’ with the highest accessibility that are the closest to the land villages. Second, five concentrated ‘central nodes’ with the highest centrality ratio within the settlement. Third, the ‘subnodes’ with the highest proximity to the central nodes. These nodes characteristics are the guidelines for the distribution of programs.
98 Adaptive Floating Settlements
Node Characteristics 3.1.4
Edge Node
1. shortest distance to the land
2. goods distribution center
3. the main connection port with the port on land (the major port in the settlement)
4. majority product store in here
5. aquactic product working area
Centraized Node
1. max. plot coverage location
2. shortest distance from fish raft
3. life necessities supply center
4. public activities
5. commericial activities
6. provide sufficient amenity
7. residential area
Sub Node
1. secondary public node
2. local people center
3. local market
4. aqauculture related program
5. energy, water collect center
Edge node
Centralized node
Sub node
fish raft
Main route
Regional route
Local route
99 Research Development
FIG. 3.1.4.1 Type of Nodes Defiining the characteristic of node including edge node, central node, and sub node.
A series of experiment was conducted to identify the strategic spots – the nodes, to initiate and develop the network of the settlement. The characters and relations of nodes can be clearly illustrated to identify the strategic spots in the settlement. Those concentration nodes will play the major role to distribute aquaculture logistic and material, thus become the transportation junction within the settlement. The topological experiment focuses on criteria including the centrality, accessibility and the coverage area ratio. The experiment shows the optimized topological node is a fivenode arrangement that can reach 99% plot coverage, and the entire district of node (radius 600m) can be reached by boat in 5mins from each node. Meanwhile, the criteria of accessibility sets a maximum 10mins by boat transport time from land villages to topological nodes. The network includes three types of node. First, three ‘edge nodes’ with the highest accessibility that are the closest to the land villages. Second, five concentrated ‘central nodes’ with the highest centrality ratio within the settlement. Third, the ‘sub-nodes’ with the highest proximity to the central nodes.
100 Adaptive Floating Settlements
Conclusion Conclusion 3.1.5
101 Research Development
102 Adaptive Floating Settlements
3.2 Programs and Morphologies
Programs and Morphologies overview
Program categories and relationships
Contextualized research
( Aquaculture and Livelihood)
Target scenarios
Nodes and programs
Morphology optimization Program distribution
Node distribution rules
Distribution strategy
Density strategy
Rearranging wave reduction pattern
Increasing public platform density
Increasing fish raft density
Living on the sea
Apart from the first priority to protect the aquaculture settlement from the wave impacts, the unorganized system of the settlement is the main problem for the living quality of local fisherman.
The ambition for the settlement organizational logic is to provide social welfare provision responding to the rising demand from coastal migration while supporting and improving the efficiency of aquaculture industry.
The functional relationships proposal will be explained and illustrated in the Programs on Nodes and Program distribution strategy chapters ,while the strategy dealing with the prospected population rise will be explained and demonstrated in Density strategy chapter.
Evaluation criteria
Optimized results
Buoyancy strategy
Node buoyancy strategy
Node buoyancy and limitation
The program and morphology design proposal not only take into consideration of functional aspects, but also concerns the environmental impact on living comfort and safety. The experiments and morphology results will be illustrated in the Morphology optimization part.
Floating platform programs include the functional morphology and the wave reduction morphology. The part above water determines the required amount and location of the buoyancy units locating at the submerged part. The buoyancy strategy will be illustrated in Node buoyancy strategy and limitation sections.
104 Adaptive Floating Settlements
The flow chart illustrates the ambition of the program strategy
FIG.3.2.1.1 Program Ambitions
3.2.1
Programs relationships
program
Morphology
Morphology
The set of diagrams illustrating the sub topic of Programs and Morpholgies section
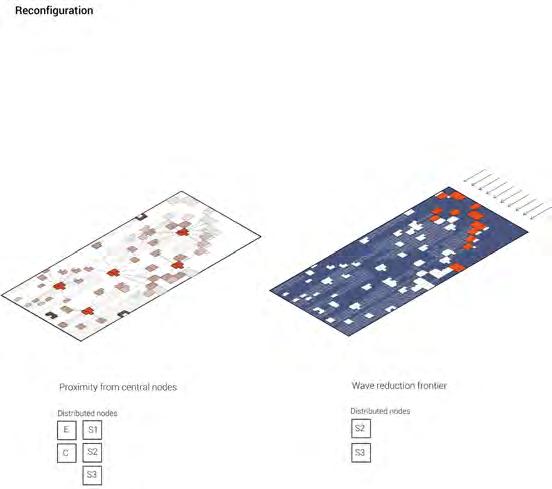
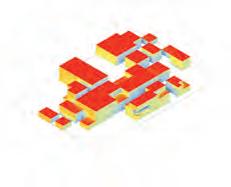
105 Research Development
FIG.3.2.1.2 Task of Program Desing
optimization
distribution
buildingradiation (kWh) Minimize predominant wind exposure area (m2) Maximize building area (m2) Wind direction Proximity to central nodes Wave reduction frontier zone
distribution rules
Minimize
Morphology
evaluation criteria and objectives
strategy Buoyancy strategy Water Level Wobject CG Water Level Fb Program Morphologies Clustered Floating Wave Reduction Platform Floating public platform C Buoyancy Stability buoyancy unit CG, C Increasing fish raft density No. of resident: 4 persons No. of resident: 15 persons
Density
Programs categories and relationships
Programs categories
Aquaculture Logistic Amenities Water and green area
1. Port
2. Fishery market
3. Fish product storage
4. Packaging area
5. Ice plant
6. Water purification tank
7. Fish food storage
8. Preparation area
9. Material storage
Programs categories
Edge node
Centralized node Sub node
1. Plaza ( Communal market, recreation )
2. Main amenities ( Health center, school, culture )
4. Support amenities ( Retail, office , recreation )
5. Residential area
1. Rainwater harvest collector
2. Water purification
3. Vegetation
Programs categories
Aquaculture Logistic Amenities Water and green area
1. Port
2. Fishery market
The existing informal and individual based organizational system of the settlement mainly concerns the economical aspect of aquaculture industry ;quantity of the aquaculture products. Even though more than thousands of people living in the settlement permanently for more than hundred years, there are no evidence of development for better standard of living. The guideline for organizational logic , thus, aims to improve either economical aspects of the aquaculture industry and the living condition of the locals by purposing the set of programs and their relationships with main network nodes.
4. Packaging area
For the aquaculture logistics category, the proposed programs support the industry to achieve high quantity and quality of fisheries products. Two sub groups of the programs are related to preservation of fisheries product quality ; fish product storage and packaging area and Ice plant , the function supporting fisherman working efficiency; fish food cold storage and raft material storage .
1. Plaza ( Communal market, recreation )
2. Main amenities ( Health center, school, culture )
1. Rainwater harvest collector
2. Water purification
3. Vegetation
5. Ice plant
6. Water purification tank
7.
Based on empirical research and other data gathering, three main categories of programs are needed to support the settlement:.aquaculture logistics, amenities, and water collection and vegetation.
4. Support amenities ( Retail, office , recreation )
8. Preparation area
9. Material storage
Like most of the aquaculture floating settlement, the social provision at the site is insufficient. Since most of the fishermen live on the fish raft permanently, amenities related to health, education, and culture should be properly provided. The residential area is introduced in respond to the rapid growth of population in the coastal villages. Rainwater collection and vegetation area category provide fundamental resources for both aquaculture activities and the floating community; fresh water , food.
5. Residential area Edge
106 Adaptive Floating Settlements
FIG. 3.2.2.1 Program Category Diagram illustrating programs categories and how they are distributed through nodes.
3.2.2
3. Fish product storage
Fish food storage
Sub node
node Centralized node
Aquaculture Logistic Amenities Water and green area
Programs on nodes 3.2.3
Site existing conditon
Existing and the proposed resources and fisheries product distribution logic
Coastal port
Aquaculture logistic
E
Amenities
Water collection/vegetation
C S
Existing condition
Fisheries products distribution to land
Resource distribution from land
Proposal strategy
Fisheries products distribution to land
Resource distribution from land
Fisheries product supply chain and resources distribution
The existing fisheries product supply chain and resources distribution operate in the individual basis. The Oligopoly system operates by a few merchants or buyers limiting the fisherman’s opportunities to negotiate the product price. Due to the highly competitive market ,only few fish farm owners are able to arrange the meeting with fish buyers on the coastal port. In consequences, the rest of the owners lack the access to market.
Missing opportunities to sale products causes severe effect to fisherman’s income.Since the fishery product spoils in short period of time, facilities to preserve the goods such as ice production and cold storage are important.
The proposal of locating public nodes as the main hub for aquaculture logistic and main market allows the public contact of fish merchants to local fisherman. On site fish auction benefits both buyers and fisherman .The fisherman
Aquaculture raft
Edge node E
Central node C
Sub node ( S1,S2,S3) S
has the market opportunity ,while the buyers have more product alternatives. It also encourages the farm owners to improve the product quality.Apart from the main market node, the local markets on Central node also opens up the opportunities to sale products to outsiders.
The existing supply of both aquaculture related resources and living necessities are on the coastal port. Commuting to and from land daily consumes time and fuel energy. Proposing main market node could reduces the individual commuting cost since the goods can be stored at the hub where the local could reach within 5 minutes.
108 Adaptive Floating Settlements
FIG. 3.2.3.1 Existing Condition
Programs categories
Aquaculture Logistic Amenities
The edge node, aquaculture logistic node topologically locates closest to the surrounding villages. Thus, the supply of resources and materials by cargo could reach the node without obstruction by the aquaculture rafts.
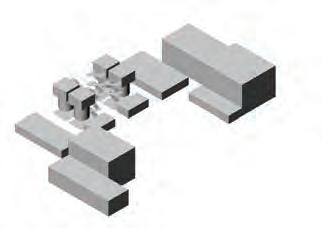
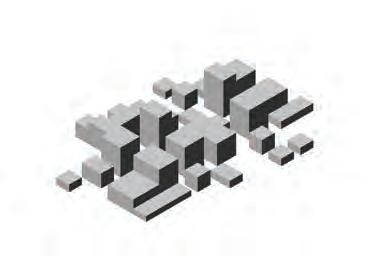
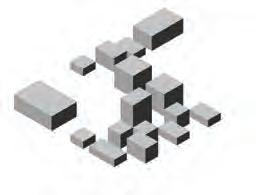
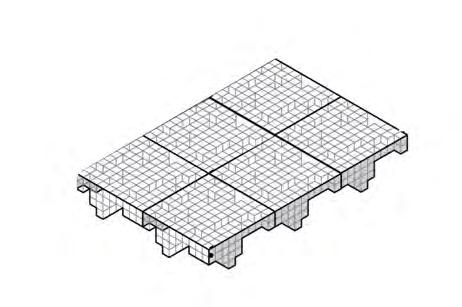
The central node , amenities dominant node is highly centralized by all public platform and rafts. It provides main social provisions and parts of aquaculture logistics programs.
Fresh water tank
Rainwater collector Recreation
Retail
Water and green area
Aquaculture Logistic Amenities
Water and green area
Aquaculture Logistic Amenities
Water and green area
The subnodes locate in between the edge nodes and central nodes introducing freshwater collection area , vegetation area and variable residential density due to the specific location.
109 Research Development
Diagrams illustrating nodes types and the distribution of programs categories.
Edge node
FIG.3.2.3.2 Program on the Node
E Central node C Sub node ( S1,S2,S3) S
Plaza
Green area
Programs on nodes 3.2.3
Edge node
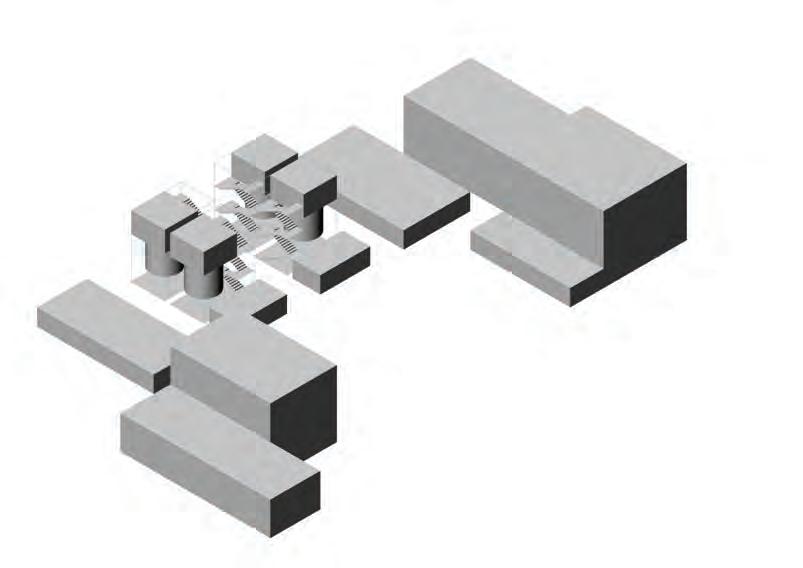
The edge node functiona as the main gates to the settlement which provides aquaculture logistic programs. Programs provided at this node aims to maintain the quality of products; ice plant, cold storage and to produce or store resources needed for aquaculture process; ice, water, fish food and building material.
The main port located in the middle to link all programs together since all function needs clearance loading area by having quay adjacents to them. The plazas on all edges of the node provides high accessible public space for daily and seasonal activities; Kelp drying space or raft reparation after the monsoon season.Ice plants location are in between the fish food preparation area and the fish product packaging area thus they provide the ice flakes for fish products storage and fish food storage right after they are unloaded from cargo.
The process after unloaded the newly cultivated product is to clean the product at the fish product packaging area.The freshwater supply is from storage tank underneath the ice
Port
Water storage + Purification tank
Ice plant
Product preparation area
Product cold storage
Fishery Market
Fish food Preparation area
Fish food storage
Raft Building Material storage
Raft & Boat Reparation area
plant.Cleaning the product reduces the spoilage risk from bacteria on dead fish then process through to the fisheries product cold storage ,then main market plaza waiting for the buyers.
Fish product packaging area in long narrow structures allows the maximum number of vessels to simultaneously unload on the market plaza with the minimum handling of fish along the quay for market display.
Apart from the product preservation issue, the main resource needed for daily fish farming process is the Fish food. After loading the fish food raw ingredients into the food preparation area, the fish food is processed ,then ready to sell. The excessive amount will be stored in the fish food cold storage for the future trade.
110 Adaptive Floating Settlements
Diagrams illustrating programs on Edge node.
FIG. 3.2.3.3 Edge Node
Water
Ice
Fish food programs relationship
Fish product
Diagrams illustrating programs relationships on Edge node
Water
Ice
Fish food
Fish product programs relationship
111 Research Development
FIG.3.2.3.4 Program Relationship
Programs on nodes 3.2.3
Central node
In response to the site problems of lacking the social provision ,the amenities node aims to provide living necessities including main amenities; health center, school and culture related programs, support amenities; retail. Due to the rapid increase of regional density, residential area is considered as part of the necessary amenity.
The five central nodes are equally distributed throughout the site where they are densely surrounded by other public platforms and fish rafts. The strategic location allows the main amenities to be equally reach by all locals and outsiders.
All plazas are located on all sides of the public platform aiming for the local to conveniently access all main amenities when necessary; health center , school and cultural related functions by entering one of the plazas.
Fish food preparation area
Fish food storage
Raft building material storage
Social provision (School Hospital)
Residential
Retail
Purified water storage
The residential area situated in the center of the central node for more privacy while still easily reach to the amenities through plaza.
Central node is the main hub where the local meets with the outsiders or tourist,therefore, it opens the economic opportunities for the locals to trade fisheries goods or services during low cultivation period.
Since the central nodes are equally distributed throughout the site, daily aquaculture logistic programs; fish food preparation and storage area are provided for the fish rafts further away from the edge nodes. The central node is also the water purification hub providing fresh water for daily use of the locals living around on and around the central public platform.
112 Adaptive Floating Settlements
Diagrams illustrating programs on Central node.
FIG. 3.2.3.5 Central Node
Aquaculture programs relationship
Water
Fish food
Raft building material
Amenities programs relationship
Diagrams illustrating programs relationships on Central node
113 Research Development
FIG.3.2.3.6 Program Relationship
Programs on nodes 3.2.3
Subnode 1
Water storage Green & Vegetation Support amenities
Subnode 1, 2 and 3
Subnodes are topologically located in between the Edge nodes and the Central nodes. Subnode functions as the fresh water and vegetation area provider while providing supporting amenities for Edge and Central nodes. Since Sub-nodes are 70% of all nodes, the variation of programs characteristics depend on the demand of the surrounding nodes and raft density.
When the Subnode is needed to support the high density, it is called Subnode1 (S1).The percentage of rainwater collection and green area is the least of all types of Sub-node since the majority of the area are dedicated to the residential and supporting amenities; office , retail.
On the opposite,the low density driven Subnode; Sub-node 3(S3) located further away from the high density zone , closer to the Edge nodes or at the wave reduction frontier zone, the entire public platform is dedicated to the rainwater harvest and vegetation.
Plaza
Raft building material storage
Recreation
Water storage ( Rain , Purified )
Rainwater collector
Vegetation area
Green area
Retail Residential
This strategic location of S3 closes to the Edge nodes benefit the aquaculture logistics since water is required at every stage of fisheries process, both on board the vessels (for rinsing and hose- down), and ashore in the port (for rinsing, ice production and hose-down of work areas and hygiene). Especially for the ice production that consumes water the highest of all activities; 20% more than the amount of ice needed to immediately use to preserve fish product quality. Low density Subnode; S3 is suitable for locating at the wave reduction since the wave height condition during severe weather; 3-5 meters is not safe for the local to live.
Since the medium density Subnode(S2) has the similar proportion of water collection and residential area, it is suitable for daily aquaculture logistic programs;raft building material to locate. The plaza on Subnode 2 then being the hub for raft reparation and building material trading.
114 Adaptive Floating Settlements
Diagrams illustrating programs on Subnode.
FIG. 3.2.3.7 Sub Node
Water storage Green & Vegetation Support amenities
Water storage Green & Vegetation Support amenities
115 Research Development
FIG.3.2.3.8 Program Relationship Diagrams illustrating types of Subnode and the distributed programs
Subnode 3
Subnode 2
Programs on nodes 3.2.3
Rainwater Water for vegetation
Water store and distribution system ( Rainwater harvest Green area) ( Prototype SN2 )
The two common sets of programs on all Subnode types are the Main plazas and the Water and vegetation area .
Plaza Main amenity_Office (SN1)
Aquaculture_Material storage,Fish food (SN2)
Support amenity_ Water and vegetation (SN3)
Recreation (SN1,SN2)
Support amenity_ Water and vegetation (SN3)
Water storage ( Rain , Purified )
Rainwater collector
Vegetation area
Green area
The main plazas locations are further away from one another for easier access from surrounding fish rafts. The building function and open space on the main plaza differentiate due to the Subnode types. For Subnode1, office building and residential are located here. For Subnode2, it is raft building storage while for Subnode 3, is the open air recreation area. The open space is for the informal activities such as local market or Kelp drying.
Retail Residential
Since precipitation rate at the site is 1347mm;0.0037 m3/m2 daily . The rainwater harvest is one of the best solution for water supply in remote area. The rainwater harvest system composes of water collection area and the water purification tank.
The water collection areas are at the edge of the platforms and further away from one another for the convenience of the local to access to rainwater. The unpurified water supports the daily hygienic use while the purified water provides drinking water for locals and ice making for aquaculture logistics.
It is not common to have vegetation area on the floating village. However, it benefits the locals in various ways ,both socially and economically. It gives the opportunity for local food productions which could be the alternative source of income for the locals during the low cultivation season. Vegetation also has the potential to be the natural water filter for fresh water.
116 Adaptive Floating Settlements
Aquaculture (SN2) or Main amenity (SN1) and Recreation amenity
Diagrams illustrating the distribution of main programs on subnode
FIG. 3.2.3.9 Sub Node
Sub node
Aquaculture (SN2) or Main amenity (SN1) and Recreation amenity
Rainwater Water for vegetation
Water store and distribution system ( Rainwater harvest , Green area) ( Prototype SN2 )
Plaza
Main amenity_Office (SN1)
Aquaculture_Material storage,Fish food (SN2)
Support amenity_ Water and vegetation (SN3)
Recreation (SN1,SN2)
Support amenity_ Water and vegetation (SN3)
Water storage ( Rain , Purified )
Rainwater collector
Vegetation area
Green area
Retail
Residential
Variable density relationship to green area and program
117 Research Development
Subnode 1
Subnode 2
Subnode 3
FIG.3.2.3.10 Program Relationship Diagrams illustrating Subnode and the distributed programs
3.2.4 Program distribution strategy
Program distribution strategy
When optimizing the location and number of important nodes , the factors contributed are the safety and the accessibility to amenities by the locals. All Central nodes location encounter wave height under 2 meters during extreme weather. Their locations are reachable by boat in 5 minutes ensuring that all locals have easily access to the main social welfare provision. These nodes being analyzed of their Centrality through network analysis ensuring that they are the first hierarchy and the most important ones. With all reasons, the proximity to Central node is the essential and fundamental rule for programs distribution through node types.
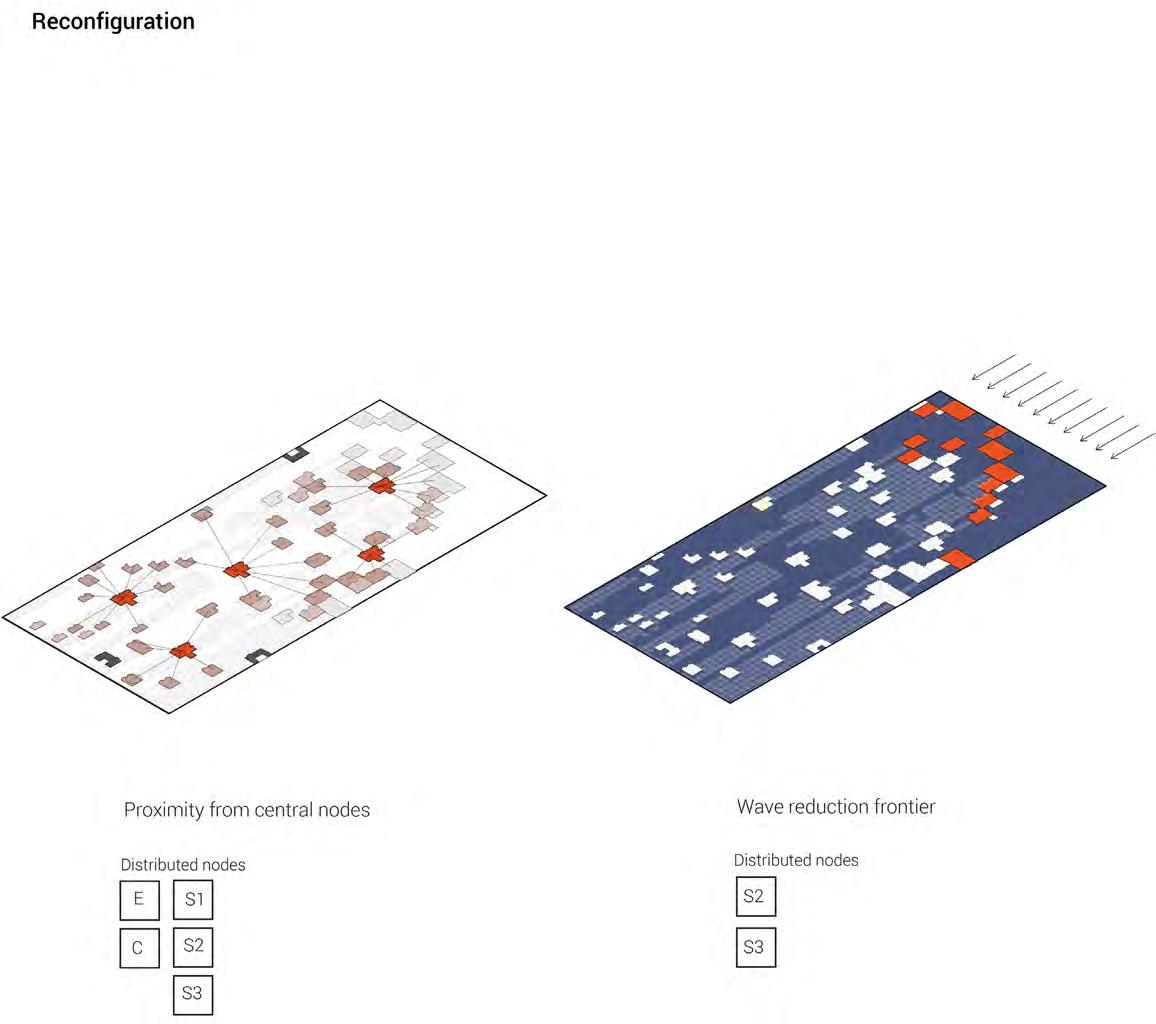
The proximity rule determines the high to low density nodes leading to the distribution of programs in relationship to the variable density. For instance, the high density nodes closest to the Central node,Subnode1 has high ratio of residential area , therefore, the service and commercial programs are located on the nodes due to the prospect demand.
The wave reduction frontier encounters the highest wave height of 4-6 meters during the sever weather condition. All public platforms located on the periphery are considered not safe for living. Only Subnode 3 with no residential area could be distributed there. With low density properties, continuous spatial quality is suitable for water collecting and vegetation.
The inner part of the zone where wave height reduces to 3 meters are allowed to locate the medium living density node or Subnode2. The wave reduction frontier rule also applied on the morphology of the Subnode2 which the position of the residential part needs to be the inner part of the node.
These two distribution rules are applied not only to the public platform and the programs on nodes, but also for the fish rafts aggregation density and their locations.
118 Adaptive Floating Settlements
Diagrams illustrating programs distribution strategies.
FIG. 3.2.4.1 Program Distribution
Support
Program distribution through nodes
All programs are distributed through node distribution determined by the rule of proximity to central node and the low density distribution on wave reduction frontier zone.
The diagram clarified the percentage of programs on node types and their relationships to one another. The example of the interrelated relationship between programs in different categories is the freshwater from Water collection category is transported to the purification tank for the ice production on Edge node. The amenities programs hierarchy is distributed in relation to the variable density of the residential area. Aquaculture logistic programs are distributed to all node types in differentiated proportion since it is highly significant for the whole settlement.
119 Research Development
Diagrams illustrating proportion of programs on node types.
17 Aquaculture logistic 0 Fish product storage/ Ice plant 0 E _ 100% E _ 50% C_ 50% 50 0 E_ 25% C_ 15% 25 S2 _ 60% 40 Amenities Main amenities (Health center, School, Culture related) 0 0 C _ 100% S1 _ 100% 100 0 S3_ 100% Water collection and Vegetation Rainwater harvest area and Vegetation Water purification tank 0 0 S3_ 80% E _ 37.5% 0 C_ 7% S1_ 71% 7 S2 _ 22% 78 100 100 100 100 100 100 S2 _ 16% 75 S2 _ 42.5 % 37.5 0 C _ 50% S1_ 50% 50 100 100 100 S1_ 9% 75 Fish food storage Raft building material storage Support amenities 3 (Recreation, M&E ) Support amenities 1 ( Service, Office ) Residential area E Edge node C Central node S1 Subnode 1 S2 Subnode 2 S3 Subnode 3 Legend Support amenities 2 ( Retail ) E Edge node Central node Subnode 1 Subnode 2 Subnode 3 C S1 S2 S3 0 S3_ 100%
collection and Vegetation Rainwater harvest area and Vegetation Water purification tank 0 0 S3_ 80% E _ 37.5% 100 S2 _ 16% 75 S2 _ 42.5 % 37.5 100 100 S1_ 9% 75
Water
amenities 3 (Recreation, M&E ) E Edge node C Central node S1 Subnode 1 S2 Subnode 2 S3 Subnode 3 Legend ( Retail ) E Edge node Central node Subnode 1 Subnode 2 Subnode 3 C S1 S2 S3
FIG.3.2.4.2 Program Information
3.2.4 Program distribution strategy
Node distribution
The set of diagrams demonstrates the first settlement cluster closer to the village A to illustrate the distribution strategy showing the application of two main rules of Proximity to Central node and the Low density distribution on wave reduction frontier zone.
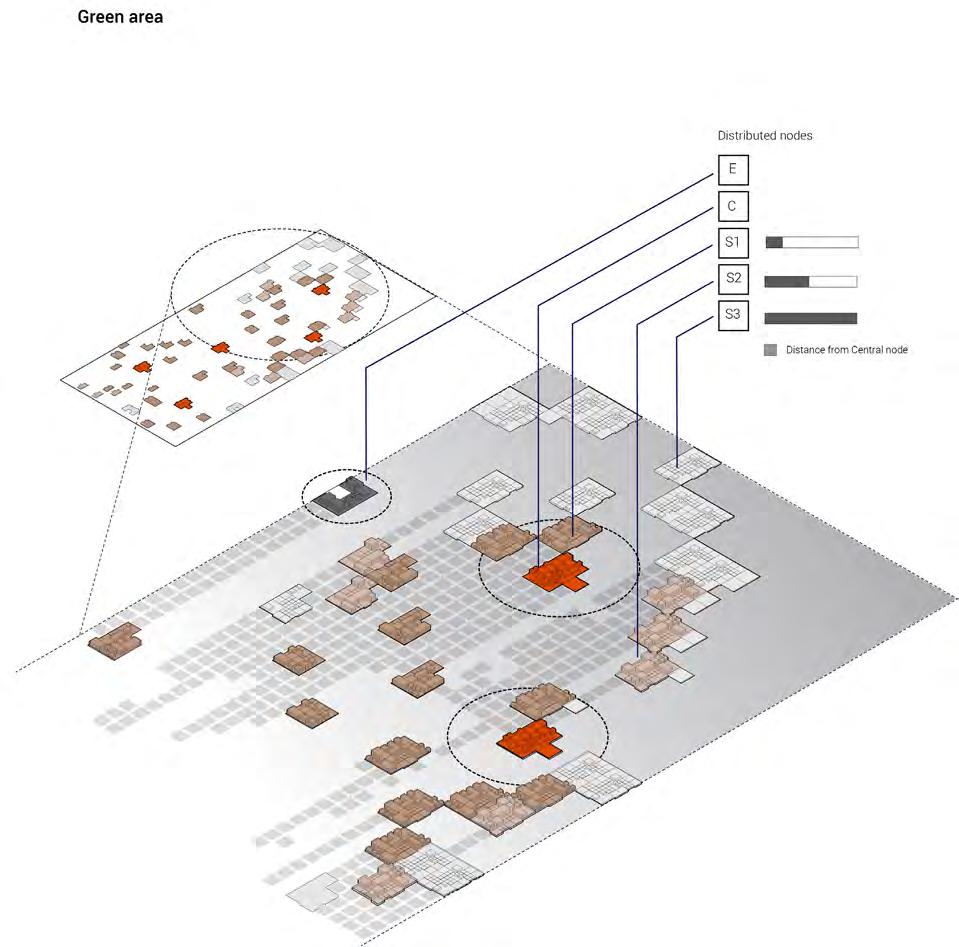
The Edge node is located closest to the village A where its wave height is below 2.5 meters since the Subnode 3 on the wave reduction frontier disputed the wave energy before reaching this important node. Its topological location allows the cargo from coastal villages to reach without disturbing the aquaculture settlements.
The location for Central nodes has been optimized to be the safe area; wave height under 3 meters during the storm season. The Central nodes provide main amenities to the
high density fish rafts and Subnodes. The closest proximity from the Central nodes are the high residential density node; Subnode 1, then medium density;S2.
Even though the nodes located closest to the central nodes should be the high density nodes, the wave reduction frontier zone are not suitable for living since the wave height is 3-6 meters during storm. Some of the nodes that should be the high density then being replaced by the medium residential density node; S2.
The distribution of low residential density; Subnode 3 are mainly at the wave reduction frontier zone where the wave height condition is not suitable for living. They also located closer to the Edge node to supply water for aquaculture while having the lowest proximity to the Central nodes.
120 Adaptive Floating Settlements
FIG. 3.2.4.3 Node Distribution Diagrams illustrating node distribution strategy applying distribution rules
Aquaculture logistic and process
While the majority of Aquaculture logistic programs are on the Edge node, some Aquaculture daily use facilities are spreadly distributed on specific nodes for the local fisherman convenience.
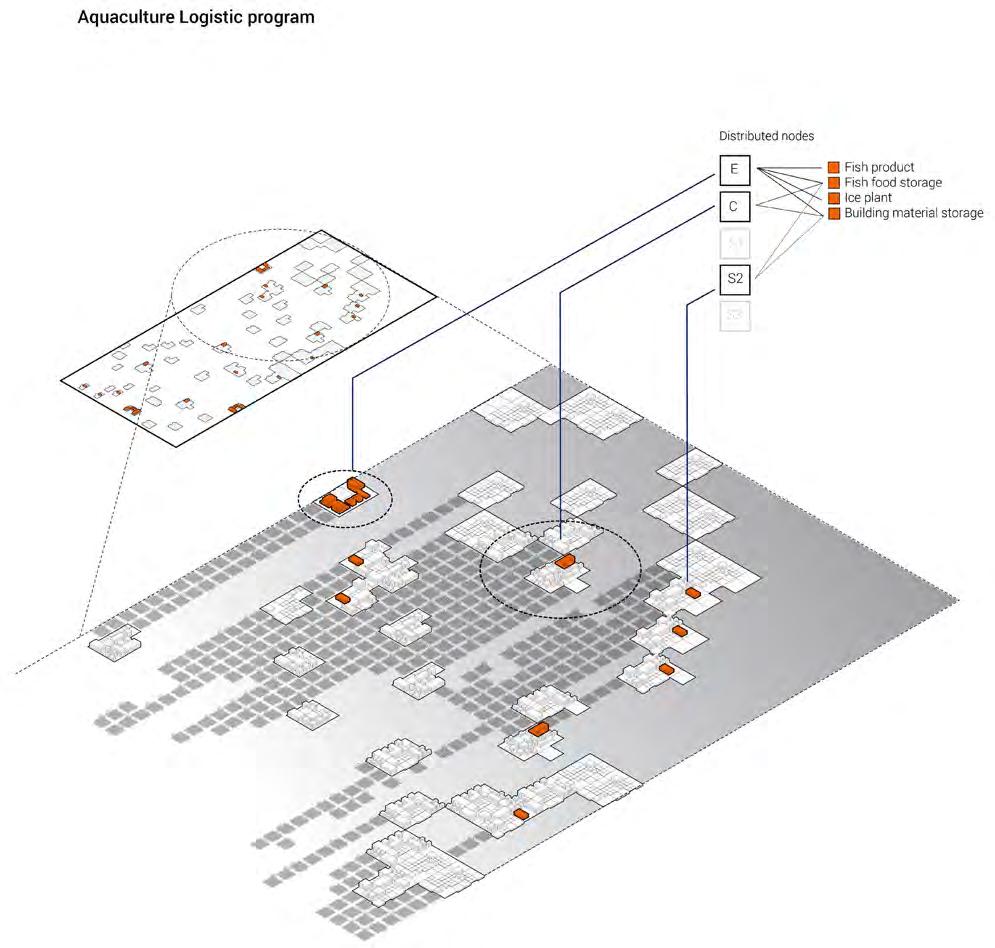
Aquaculture related programs serving the cultivation period essentially the product quality preservation; fisheries product cold storage, Ice plant , Water purification tank. These facilities are located only on the Edge node. The main reasons are for the convenience of the aquaculture industrial process with less disturbance of the settlement livelihood and also the convenience of cargo transportation not being obstruct by the aquaculture fishing rafts. The activities related to the collaboration of the fish merchant and the local fisherman; whole sale auction are allowed only on the edge node.
The other categories of program serving daily activities such as Fish food cold storage , fish food preparation area and material storage are located on Edge node , Central node and Subnode 2; medium density. Since fish feeding is one of the most important daily routine to operate the aquaculture raft, the distribution of fish food storage programs and preparation area are located on the Central node ensuring that such facilities are reachable by the local fisherman.
Building material storage program is located not only on the Edge node, but also on the Subnode2.The later location in the medium density fish raft area is suitable and convenince to repair the fishing boat or aquaculture raft since the activity needs wide and open spaces to operate.
121 Research Development
FIG.3.2.4.4 Aquaculture Logistic Aquaculture logistic and process spreadly distributed on the site.
3.2.4 Program distribution strategy
Residential and amenities distribution
Based on the prospect population due to coastal migration in 2020, the settlement needs to support 17,000 people living on the 1.89 sq.km site area; 8465.6084 person/ sq.km. density. Distribution of residential then being the high portion of usable area on all public platforms.
Following the rules of proximity to the central node, residential programs are distributed on the Central node, Subnode 1 and Subnode 2. All residential area are located on the public platforms in the safe area ,facing the wave height less than 2.5 meters. The safe area is also occupied by the majority of the aquaculture rafts forming the high to medium density aquaculture residential zone. The mixed zone for living area of fisherman and the residents living on the platform enhances the opportunity for fisherman to reach directly to consumers.
The living space density varies due to the public platform distance from Main amenities at Central node. It occupies the Subnode 1 the most then Subnode 2 and on the Central node respectively.
Sharing the same proximity rules, the main amenities distribution then serving both local fisherman and the new residents in the safe zone. Apart from the main amenities on the Central node; health care, eduction and cultural related programs, the other amenities are distributed on the Subnode 1,2 and 3.The proposed zoning for commercial, office and service programs are on the Subnode1 to serve the demand of high density living zone while the supporting programs; recreation area located in the Subnode3, mainly on the Wave reduction frontier zone.
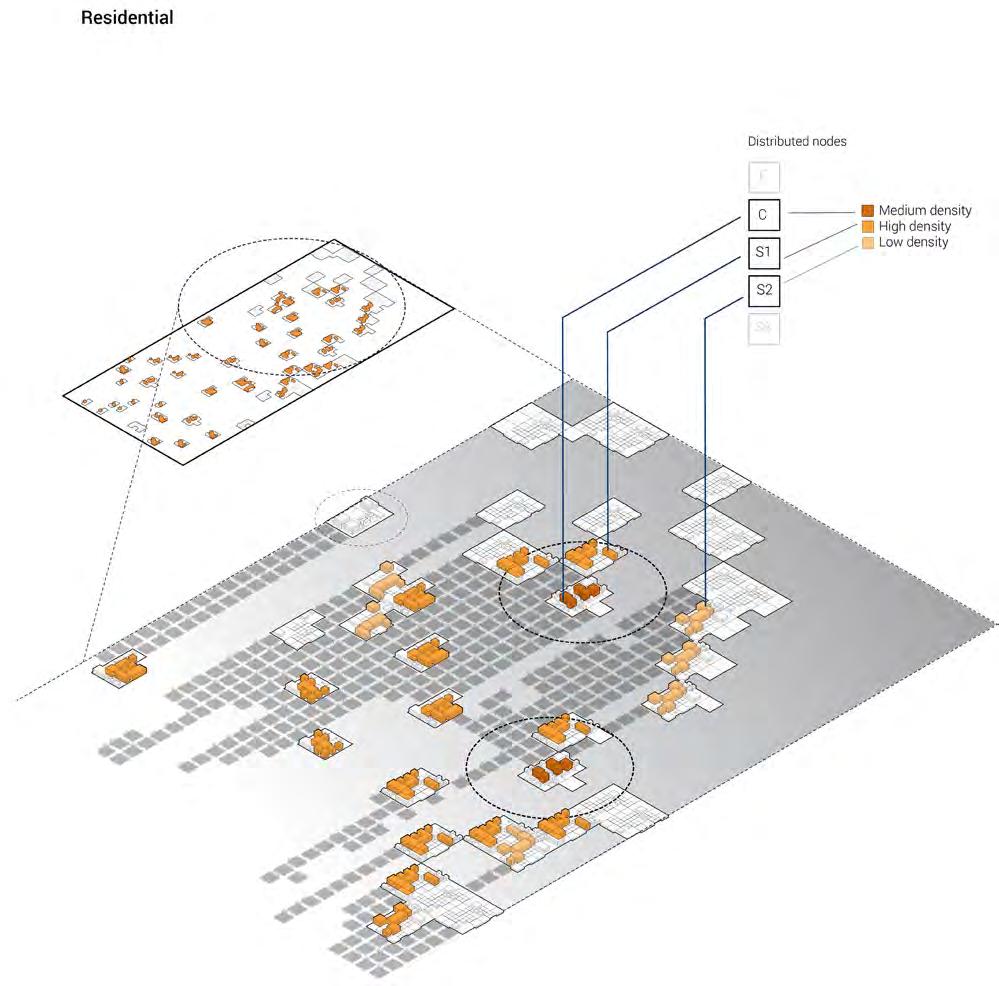
122 Adaptive Floating Settlements
FIG. 3.2.4.5 Residential Area Diagrams illustrating residential area distribution strategy with variable densities.
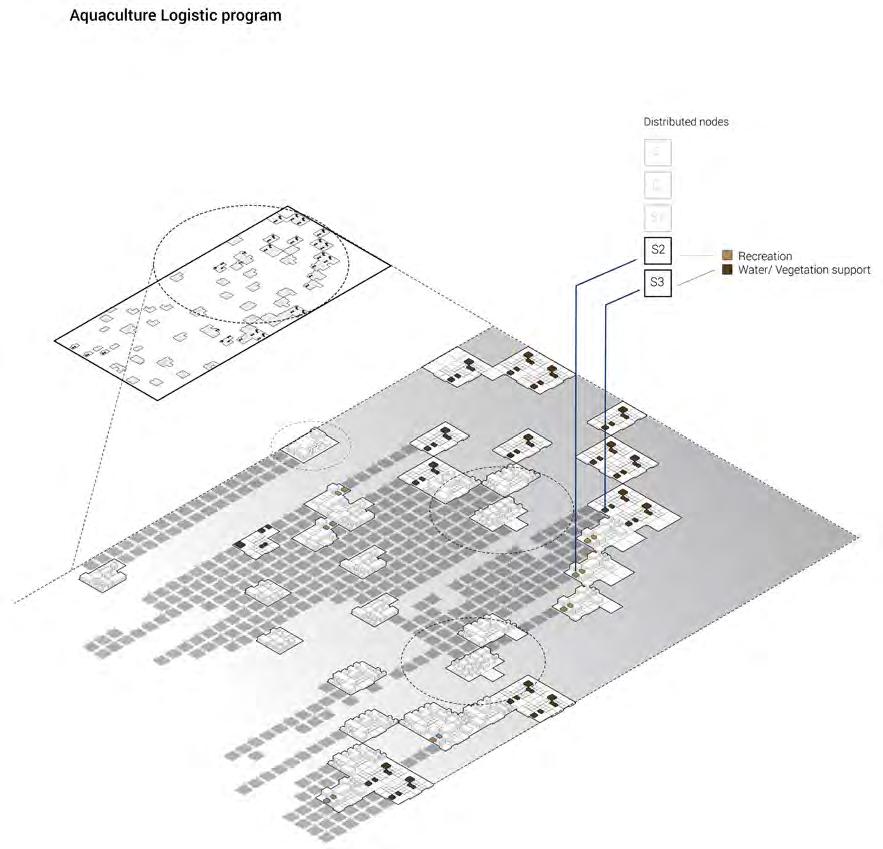
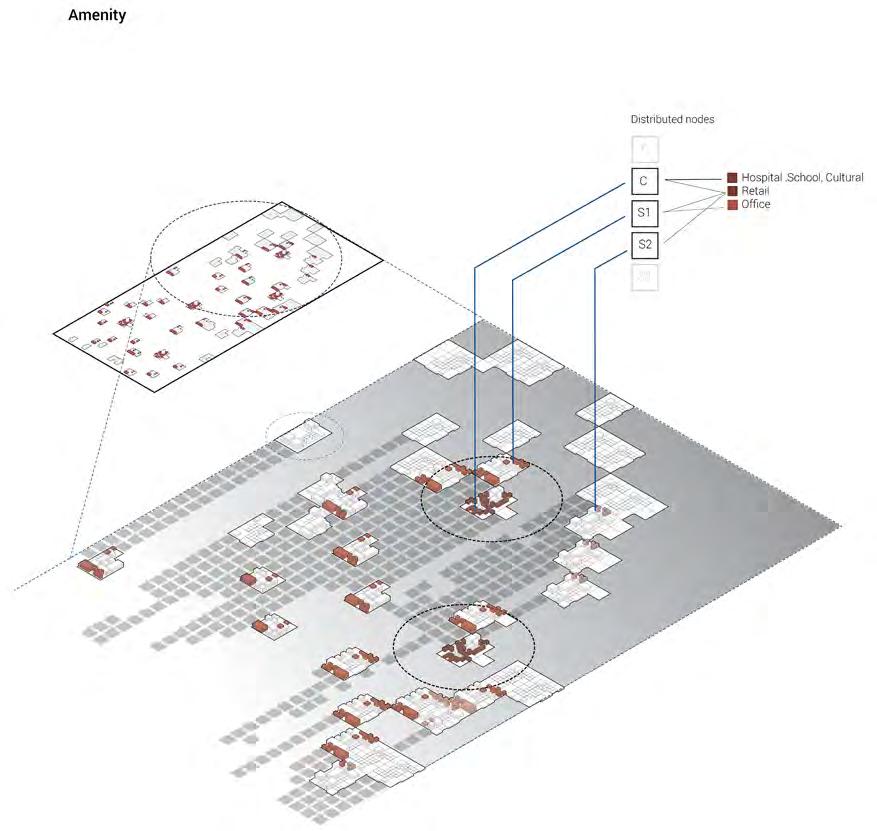
123 Research Development
FIG.3.2.4.6 Amenity Distribution Diagrams illustrating the main amenities and support amenities distribution according to residential area and fish rafts variable densities.
3.2.4 Program distribution strategy
Water harvest
The factors contributing to the demand for freshwater are the aquaculture process and the daily usage of the locals. The significant amount of freshwater are needed during the 14-21 days of cultivation period to continuously produce ice, clean the fish products before packaging process and cleaning of the operation work space. Apart from the high cultivation season, every process of aquaculture activities require freshwater but in much smaller amount.
To illustrate the freshwater demand in detail for 1 aquaculture raft; 60 fish cages , the total amount of Yellow croaker fish products are 12.4638 tonnes. The sufficient amount of ice is 20% of product which are 2.492 tonnes. 1.5 times of water is required to produce 1 unit of ice, therefore, the water needed for 1 fish raft are 3.739 tonnes; 3.739 m3. For the aquaculture dominant settlement scenario, the number of fish rafts in cluster A is 250. Thus, the total amount of water needed at cultivation time are 937 m3. The minimum amount of water harvest is 66.92 m3 per day.
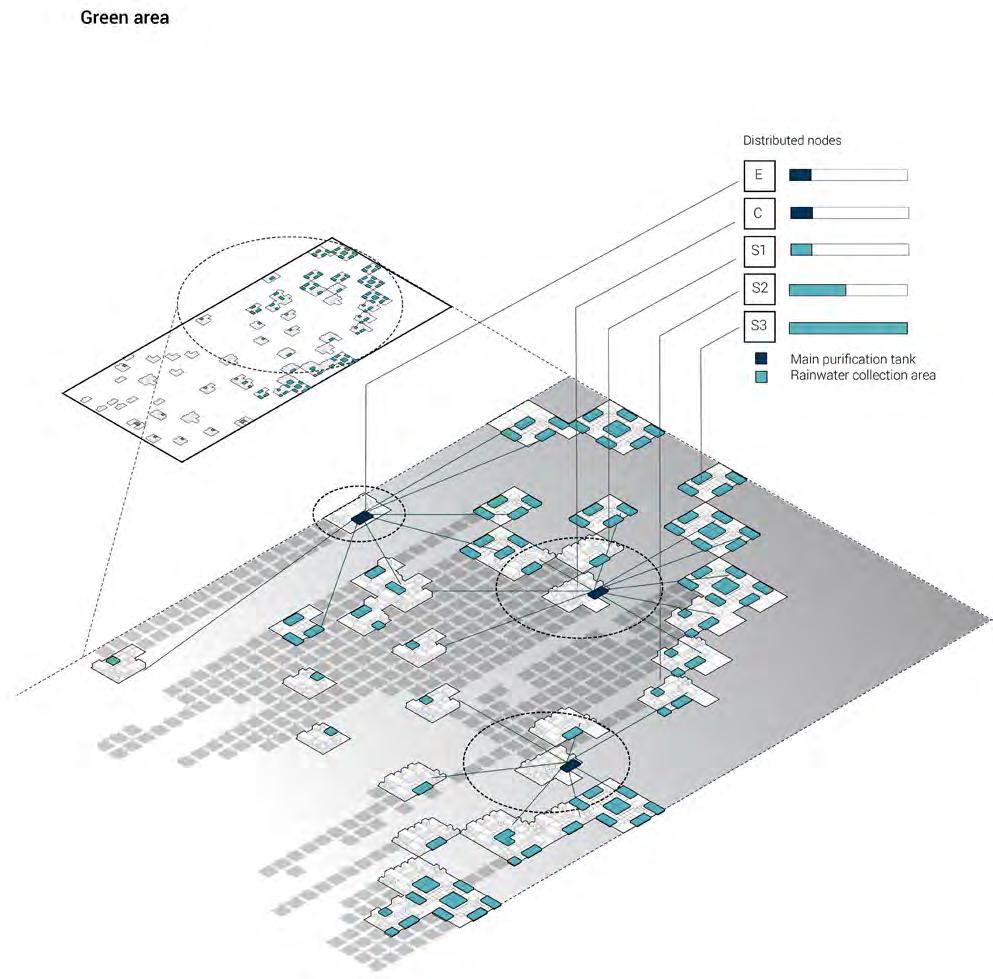
Rainfall precipitation rate at the site is 1,347 mm. meaning that the system can collect water amount of 0.0037 m3/ m2 per day in average. The area provided for the rainwater collection are 70,875 m2 which is 262.2375 m3 per day.
For the entire site, during the cultivation period, the water usage per person for 16,894 population is 36.624 litre per person per day while the water supply for usage out of cultivation period is 48.985 litre per person per day. According to the World Health Organization (WHO), between 50 and 100 litre of water per person per day are needed to ensure that most basic needs are met and few health concerns arise. (The Human right to water and sanitation, United Nations 2010).The rainwater collection located on the Subnode3 and mostly on the wave reduction frontier. The purified water are needed for the ice production at Edge node while the Central node purified the drinking water for local fisherman and the residents living on the public platform.
124 Adaptive Floating Settlements
Diagrams illustrating rainwater harvest collection area distribution strategy and its relationship to water purification tank.
FIG. 3.2.4.7 Water Collection
Vegetation area
The distribution of vegetation areas shares the same logic with rainwater collection area in which most of them are distributed on wave reduction frontier and the nodes furthest from the central nodes.
These vegetation benefits alternative food production apart from the local resource of seafood. The potential downside of consuming too much seafood is the consumption of methylmercury. The mercury is potentially toxic to the developing nervous system of the fetus and infant. Other undesirable effects in adults are much less certain. Having alternative choice of local food could enhance the selfsustained urban system for the floating settlement with less dependence on land.
Since the vegetation area also act as the rainwater collection area, the alternative edible water plants; Watercress, Water spinach, Wasabi , Water chestnut , Taro ,Wild rice are practical on a large scale natural hydroponic cultivation with various nutrition benefit.
The first cluster, Cluster A provides the total vegetation area of 42,750 m2; 8.016 sq.m. per person. Although it is far less than the available arable land (square meters per person) of China which accounting for 800 square meter per person(World bank, 2011-2015), the proposed vegetation area are mainly for the locals consumption. Water plants not only absorb carbon dioxide and release oxygen into the water purifying and maintaining the quality of collected water.
75% of all vegetation area is distributed on the wave reduction frontier. The cluster of Vegetation and Freshwater collection on the wave reduction frontier forms the continuous recreation hub. The rest of the vegetation area are spreadly distributed in the medium to high density zone for convenient access for all residents.
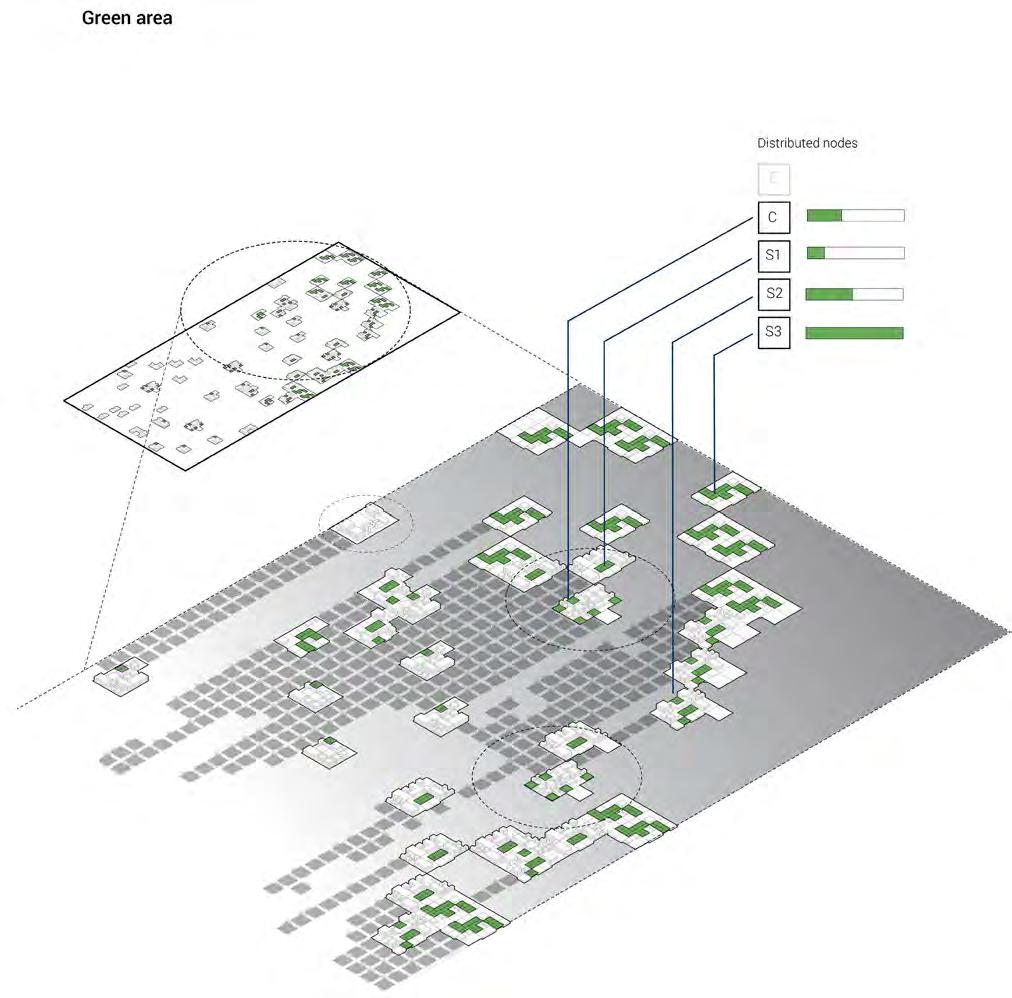
125 Research Development
Diagram illustrating vegetation area distribution strategy.
FIG. 3.2.4.8 Vegetation Area
3.2.4 Program distribution strategy
Programs distributions through nodes showing different program types in Aquaculture dominant scenario.
Program distribution conclusion
An aquaculture village, similar to the ecosystem where each program is relevant and essential to another. Understanding the relationship of the programs is the key to inform the design and development of an efficient organization for the aquaculture community. Taking consideration of the prospect coastal population rise , the proposal settlement organization essentially concerns of both the efficiency of the aquaculture industry and how people lives as the permanent living.
The distribution strategy has been established as the guidelines for the location of nodes concerning safety, efficiency and accessibility. It is the integration of nodes relationship , its hierarchy and the variable density.
The resource distribution either from land or offshore is the key to determine the distribution for aquaculture industry. Programs related to daily aquaculture activities are distributed for high accessibility from the rafts while the specific logistic and process programs are on the Edge nodes, closest to the coastal villages.
In response to the high density demand, the sufficient social provision and its accessibility are the keys .The most important nodes are the main driver for the settlement with highest density surrounding the main amenities.
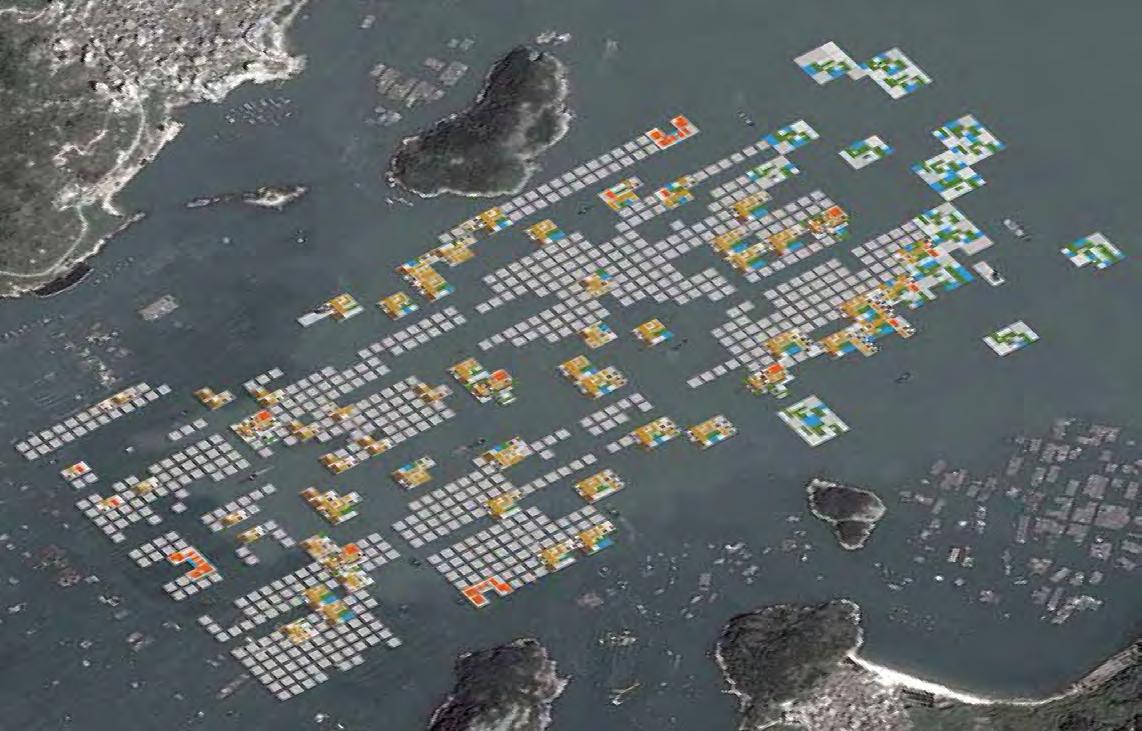
126 Adaptive Floating Settlements
FIG. 3.2.4.9 Program Distribution
127 Research Development
Node morphology evaluation
Morphology evaluation
The establishment of program categories and their relationships rationalizes the functional aspects of public platform nodes. However, it does not take into consideration of the environmental aspects and urban density input. Therefore,the purpose of the morphologies evaluation is to generate the optimized individuals with the multiple objectives criteria to achieve the properties of environmental living comfort while providing the required building usable area through genetic algorithm evaluation method.

All public platforms morphology structure derived from the program relationships with the maximum of stories floor heights and 30% minimum open space area. Main plaza and sub plaza are the shared spatial structure of all public nodes. These plaza location, especially the main plaza act as the local node with spatial and functional relationship with all other programs either by their proximity to the programs or their positions related to one another.
The relocation of the public plazas, variable number of building storeys and the addition and subtraction of building mass enhance the high possibility to generate distinct individual options as the evaluation results.
Three main evaluation objectives are to maximize the residential building area, minimize the direct exposed area from average annual wind direction and to minimize the building solar radiation. These criteria derived from the contextual analysis both environmentally and socially. The input parameter are the site weather data of Fujian ,Fuzhou, China for solar analysis and annual wind rose data.
The hypothesis of the evaluation is the emerging of the individuals with the highest building heights obstructing the annual wind direction, less building envelope facing South with mass subtraction on the top floor reducing the direct solar radiation on the building envelope.
128 Adaptive Floating Settlements
Diagram illustrating optimized morphology generating process
3.2.5
relationship
criteria Optimized morphologies
Programs
Evaluation
FIG. 3.2.5.1 Evaluation Process
Maximize building area (m2)
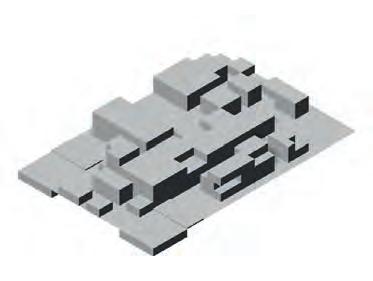
Number of individuals : 60
Number of generations : 50
Mutation probability : 0.1
Crossover rate : 0.5
Maximizing building area.
Morphology evaluation criteria and objectives
Wind direction
Minimize buildingradiation (kWh) Minimize predominant wind exposure area (m2)
Due to rapid rise of coastal population at the site,the input parameters are the functional area requirements from the projected coastal population rise in the year 2020.
With the target living area of 30 square meters per person, the highest required area of all other public programs resulting that the residential has the highest ratio of total requirements which highly influences the morphologies evaluation.
The proposal ambition aims to analyze the urban settlement of two scenarios; Aquaculture dominant settlement with the total population of 7,000 people and the permanent living settlement with the population of 20,000 people. The later target then being set as the target to generate morphology.

Minimize building solar radiation
The severe weather condition offshore not only affects the safety and living comfort, but also the durability of the structure. Minimizing direct wind exposed area lessens the total surface pressure on building, resulting in optimizing the maintenance cost of the structure and its envelope from deterioration caused by strong wind.
Minimize direct wind exposed area.
Located in the Tropical climate zone, the relative position of the sun is a major factor in the heat gain of buildings.In general, heat gain on building envelope highly affects living comfort, but for the purposed aquaculture settlement, it decreases the efficiency for fisheries product quality preservation of specific building function; ice plant, fishery product cold storage , fish food product and preparation area.
129 Research Development
Diagrams illustrating morphology evaluation criteria and objectives.
FIG. 3.2.5.2 Evaluation Process
3.2.5 Node morphology evaluation
Minimizing building solar radiation
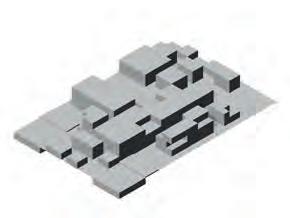
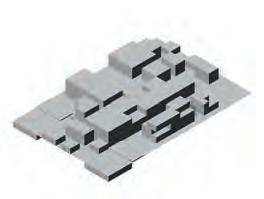
The diagram illustrates the high density node; Subnode1 to demonstrate the evaluation criteria and morphologies results of three generations; Generation 1,15 and 35. The annual Sun path diagram shows the Northern Hemisphere sun path characteristic with the range of altitude angle from 25 to 76 degree towards the South facade direction. South facade receives solar radiation the longest throughout the day while the West facade gains the radiation with higher intensity.
The morphologies variation in Generation1 converges from the scattered building mass to more clustered in the center in Generation35.Comparing Individual G1.8 and G35.5, changing plazas position from scattered to East and West ends of the platforms lessons the gap among the buildings, higher the building area for 630 square meters while lower the building solar radiation for 23,157.9778 kWh. Individual G35.5 and G35.18 shares similarities, the subtraction of building mass of G35.18 reduces the the area while increses the solar radiation value since it increases the building envelope facing South direction.
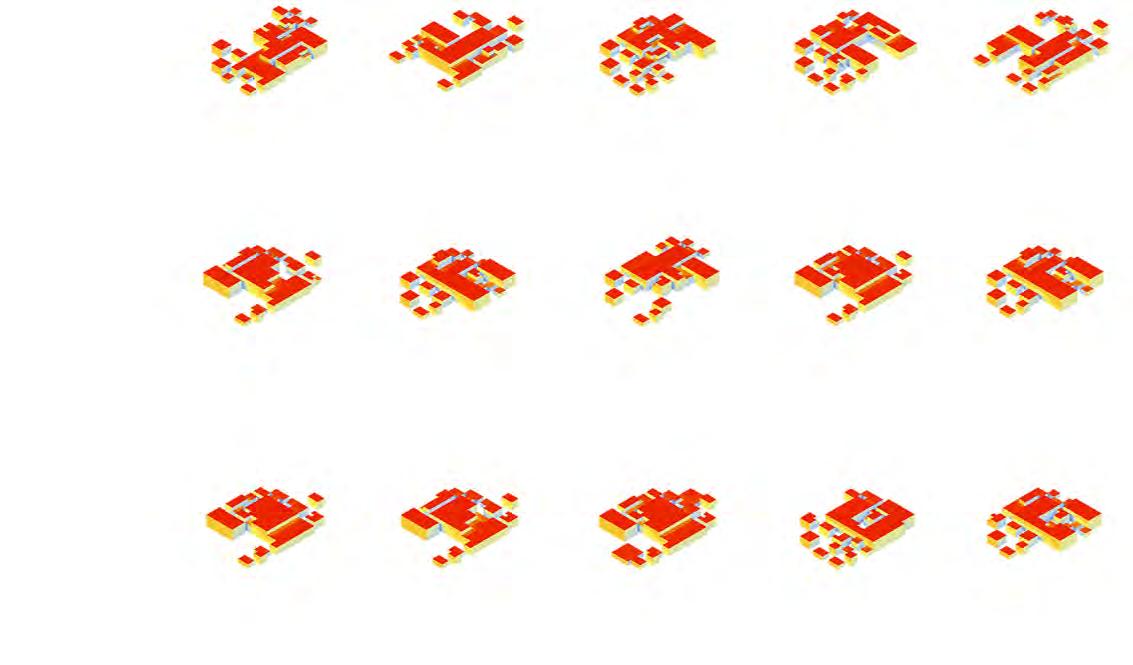
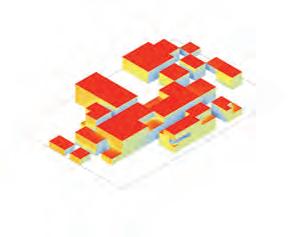
130 Adaptive Floating Settlements
Diagrams illustrating optimized morphology with solar radiation results.
N E W S E W N A. B. Min. solar radiation ( Kwh ) Min. wind exposed area ( m2 ) Max. building area ( m2 ) Min. solar radiation ( Kwh ) Min. wind exposed area ( m2 ) Max. building area ( m2 ) Min. solar radiation ( Kwh ) Min. wind exposed area ( m2 ) Max. building area ( m2 ) Max. Min.
FIG. 3.2.5.3 Solar Radiation Criterion
Minimizing predominant wind exposed area
The diagram shows the average annual wind direction and Subnode 1 together with the morphologies results of Generation1,15 and 35 .The predominant wind direction is 15 degree from South direction towards the East with 7 degree from the perpendicular line with Facade A to the South. The highest wind velocity is 15 meters per second.
The predominant wind exposed area varied in the first Generation, however the value of Generation 15 and 35 does not significantly varied. Location of plazas and south facade mass plays important roles affecting the results value.
Comparing individual G1.5 and G 35 .18, the first individual’s plaza located on the south side allowing the building in the center exposed to predominant wind direction , therefore the predominant wind exposed area much higher than the later one by 117 square meters. Individual G.35.37 has lower value while having more building area compare to G35.30 due to the bigger mass on the south facade blocking the wind for the north facade building.
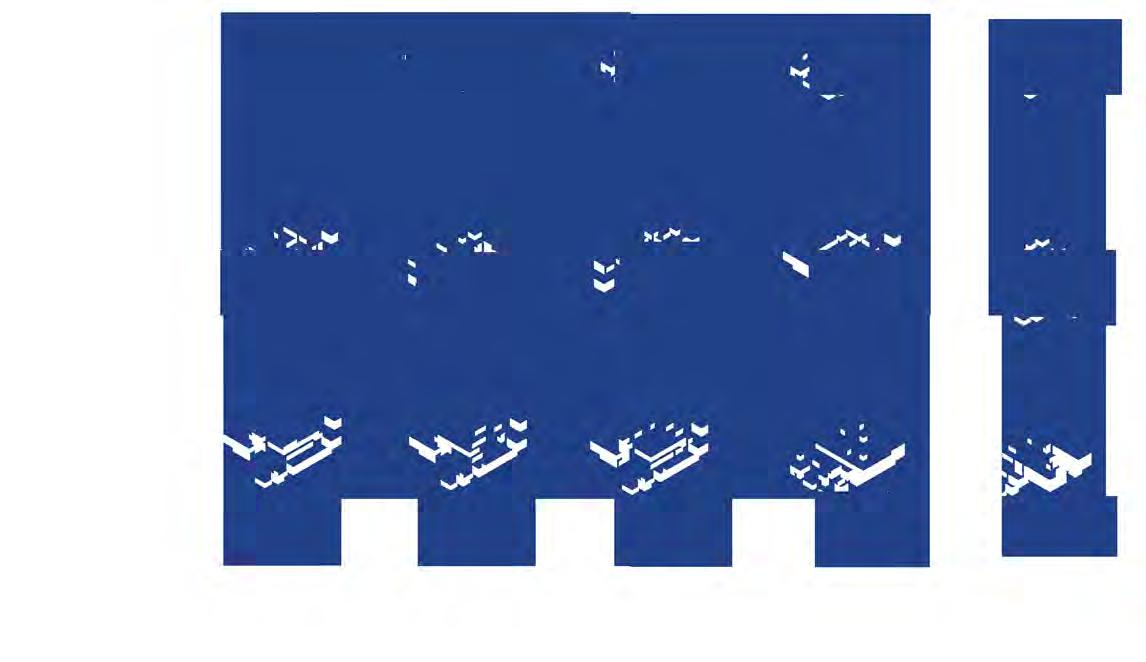

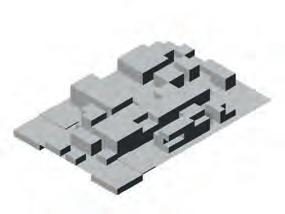
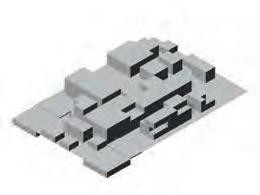
131 Research Development
Diagrams illustrating optimized morphology with predominant wind exposed area results.
N S E W S 15 7 A. B. G1. 2 3787.8787 507855.0425 765 G1. 6 3798 536562.8583 828
FIG. 3.2.5.4 Wind Criterion
3.2.5 Node morphology evaluation
Morphology evaluation conclusion
The morphology evaluation successfully integrates the functional, social and environmental aspects to generate the optimized morphologies as the guidelines of all nodes to distribute to aquaculture dominant and permanent living scenarios through genetic algorithm with multiple criteria objectives. The algorithm structure and optimization settings enhance the possibility to process the variation of results to apply for the distribution strategy resulting in the dynamic spatial configuration when aggregated together.
Although the criteria and the objectives concerned all significant aspects, the result morphologies trend does not highly contradict one another. For instance, south and west facades are affected by both building solar radiation and predominant wind exposed area since the site situated on the Northern hemisphere where the south and west facades are affected by the heat gain the most while the predominant wind direction affects the south and west side.
The evidence of some action on the body plan is noticeable . The location of plaza does play important roles to obstruct or allow the wind and sun to reach building mass when it locates on the south side of the platform.
The algorithm structure should take consideration of the possible spatial quality such as the building width limitation since the optimized building mass tends to cluster in the middle of the node lessen the building periphery area to allow sunlight into the building.
The evaluated result could be used as the guidelines for the building envelope design ; opening and material choice for the occupation of the space by the locals. Proper location of the opening could reduce the damage of the structure by not obstructing the strong wind.
132 Adaptive Floating Settlements
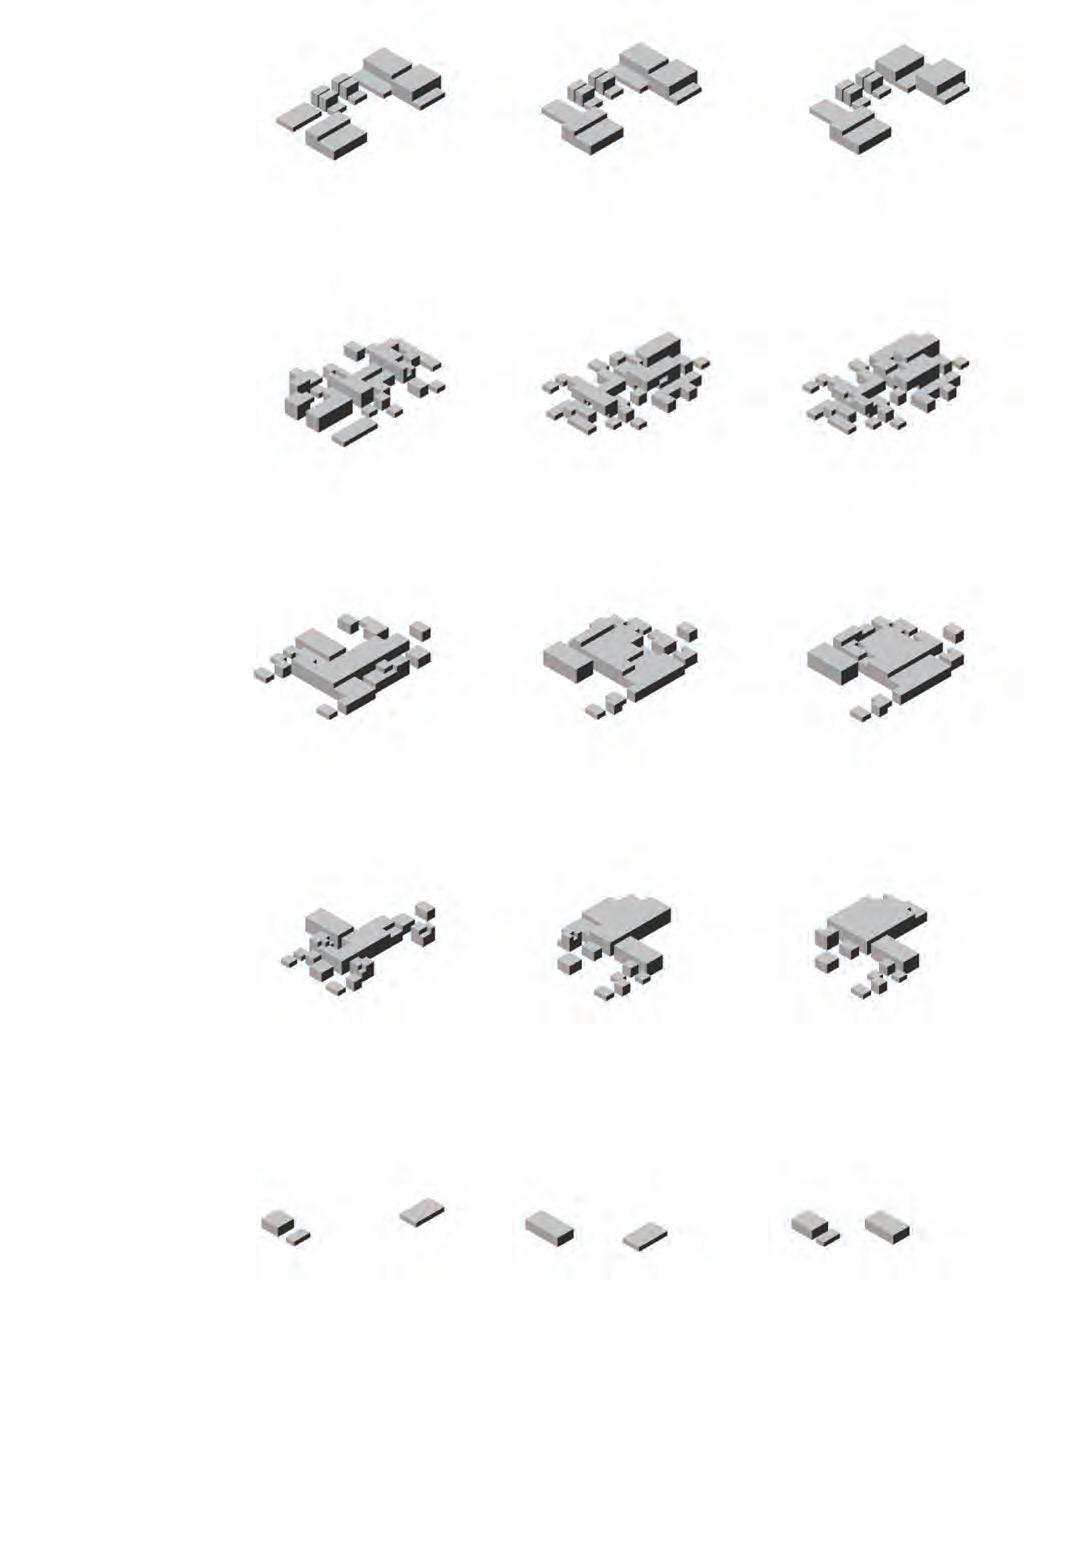
133 Research Development G1. 8 3726 513926.0535 711 G1. 5 3676.470 503088.2641 819 G15. 49 4365 493535.5870 738 G15. 28 4014 497699.5587 711 G15. 18 4048 493129.3331 729 G35.5 4356 490768.0757 738 G35. 18 4149.377 498237 702 G35. 14 3933 486719.9306 747 Min. solar radiation ( Kwh ) Min. wind exposed area ( m2 ) Max. building area ( m2 ) Min. solar radiation ( Kwh ) Min. wind exposed area ( m2 ) Max. building area ( m2 ) Min. solar radiation ( Kwh ) Min. wind exposed area ( m2 ) Max. building area ( m2 ) G1. 2 3787.8787 507855.0425 765 G35.5 4356 490768.0757 738 G35. 18 4149.377 498237 702 G35. 14 3933 486719.9306 747 G35.5 4356 490768.0757 738 G35. 18 4149.377 498237 702 G35. 14 3933 486719.9306 747 Min. solar radiation ( Kwh ) Min. wind exposed area ( m2 ) Max. building area ( m2 ) Min. solar radiation ( Kwh ) Min. wind exposed area ( m2 ) Max. building area ( m2 ) Edge node Central node Subnode 1 Subnode 2 Subnode 3 Diagrams illustrating optimized morphology results of all public platform node types.
FIG. 3.2.5.5 Program Morphologies
Node buoyancy strategy 3.2.6


The axonometric of floating public platform morphology and buoyancy and stability principal


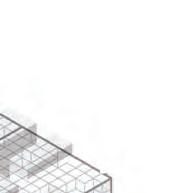


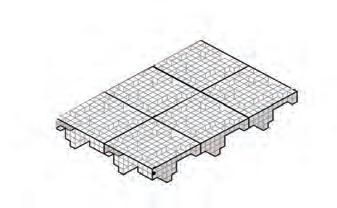

Public platform morphology and floating strategy


In order to design the public platform morphology which composes of programs morphology on top and the cluster of wave reduction supporting the program part enabling it to float and stable, the floating principal ; buoyancy and stability of floating structure has been integrated as part of the morphology design.
When designing each public platform morphology, the calculation of structural load and live load informs the buoyancy and stability strategy to support the programs part on top. This takes into consideration of loading and unloading of the cargo.

For the buoyancy strategy, the calculated weight determines the number of buoyancy needed to support the public platform to float. Since the public platform morphology composes of 2 to 6 public platform units; 30m x 30m units, the calculations are conducted unit by unit. While the structural load are basically calculated from the number of units forming the optimized morphology, the live load of the structure takes
consideration of the minimum uniformly distributed live load of each specific programs. For instance, the residential area live load is accounted for 1.92 kN/m2 while the retail is 4.79 kN/m2.Thus, the type of usage for each morphology informs the allowable capacity to carry weight of wave reduction platform.
While the buoyancy strategy determines the number of buoyancy needed for the morphology to float, the stability strategy determines the location of the buoyancy units aiming to have the total buoyancy center closest to the center of mass to enhance stability of the whole structure.
Either of the strategies are applied to the manufacturing of wave reduction platform prior to carry any weight and also are used as the guidelines to changing the amount of buoyancy units or their relocation when the program morphology changes in different scenarios.
134 Adaptive Floating Settlements
Water Level Wobject CG Water Level Fb Program Morphologies Clustered Floating Wave Reduction Platform Floating public platform C Buoyancy Stability buoyancy unit CG, C Fb c W Buayancy force Water level Object floats Volume of fluid displaced W Object F b CG c W Object Fb CG c Water level Volume of fluid displaced Volume of fluid displaced Water level Volume of fluid displaced Water level W Object Fb CG c CG c Object sinks Object stable Object unstable Weight of object Object Object’s Center of gravity CG Centroid of volume of dispalced fluid / Center of buoyancy
FIG. 3.2.6.1 Buoyancy and Stability
Clustered Floating Wave Reduction Platform


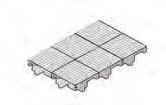
DIagrams illustrating upward and downward forces acting on the public platform,
Factors related to buoyancy and stability of the floating structure.
The numbers and location of buoyancy units supporting different live load.
135 Research Development
Fb F Wave reduction structural load Structural load Building morphology Live load Supplies and Materials People Bouyancy H($%#-%0;0I&6.6$0# CG CG Built-structure Loading / Unloading Cargo Water level Buoyancy unit Fb F Wave reduction structural load Structural load Building morphology Live load Supplies and Materials People Bouyancy H($%#-%0;0I&6.6$0# CG CG Built-structure Loading / Unloading Cargo Water level Buoyancy unit Water Level Wobject CG Water Level Fb
Floating public platform C Buoyancy Stability buoyancy unit C
FIG. 3.2.6.2 Forces on the platform
Wave reduction platform and buoyancy units
The wave reduction platform performance is to disturb the vertical motion of water particle by contacting with maximum surface area. It also allows water to pass through for the desirable water movement for aquaculture activity. Thus, the buoyancy units are to be located at the top layers closer to the water surface leaving the bottom part for water to pass through.
When manufacturing the wave reduction system, the chosen optimized platform has to initially capable of carry its own weight to float before supporting other programs on top. The wave reduction platform needs 16% of all unit numbers to be the floating buoys to support itself to float.
The principal of buoyancy and stability are applied to the buoyancy unit placing strategy which takes consideration of floating structure principal, flexibility of supporting demand and the maintenance.
The criteria are to minimize distance between center of gravity and the center of buoyancy, maximizing the number of buoyancy units on the second layer and the maximize the average distances from each buoyancy units.
Minimizing distance between center of gravity to the center of buoyancy is basically for the stability. Locating as many of the buoyancy units on the second layer leaving the top layer for the flexibility of adding or removing the buoyancy for different programs and scenarios. For instance, the changing of building functions or higher demand for usable area which leads to the need of more or less buoyancy units. Maximizing the average distances from each buoyancy units are aiming to spreadly distribute the buoyancy unit location thus they are Accessible from the top and sides of the wave reduction system platform.
136 Adaptive Floating Settlements
FB CG Layer 1 16-17% of buoyancy units needed to float the wave reduction structure Layer 2 FB CG Minimize distance between central of gravity and center of buoyancy Layer Layer Maximized number of buoyancy units on second layer Maximize the total distances among bouyancy units
3.2.6
Node buoyancy strategy
The distribution strategy of buoyancy units
FIG. 3.2.6.3 Buoyancy Units
20-25% Buoyancy units to total cluster of wave reduction
Minimize distance between central of gravity and center of buoyancy
Minimize distance between central of gravity and center of buoyancy
Maximized number of buoyancy units on the first layer
The rules to distribute the buoyancy units supporting the programs morphology is the guidelines for the manufacturing process for the predetermined public platform and for the users for adding or removing the buoyancy units to suite with the different demands.
After calculating all buoyancy supporting the programs on top, the total maximum buoyancy units needed are 25% of all 3mx3m unit numbers allowing water to pass through thus the overall buoyancy units application does not highly effects the performance of the wave reduction platform.
The public platform has 1 to 2 different usable functions ,therefore, the calculation of center of gravity is based on the whole programs morphology.
Maximize the total distances between bouyancy units and the closest building floor centers.
Maximized number of buoyancy units on the first layer
The criteria of locating the buoyancy supporting the programs morphology are to minimize distance between center of gravity and the center of buoyancy, maximizing the number of buoyancy units on the first ayer and minimizing the average distances of the closest units to the center of building footprints.
Minimizing distance between center of gravity to the center of buoyancy is basically for the stability while locating the units on the first layer is clearly convenience for the users. Minimizing the average distances of the closest units to the center of building footprints criteria allows the available units of the first layer for the future building on the free area of the floating public platform.
Maximize the total distances between bouyancy units and the closest building floor centers.
137 Research Development
FB CG Residential Retail
FB Layer 1 CG Layer 2
FB Layer 1 CG Layer 2
FB CG Residential Retail
FB Layer 1 CG Layer 2
FB Layer 1 CG Layer 2
20-25% Buoyancy units to total cluster of wave reduction
The distribution strategy of buoyancy units
FIG. 3.2.6.4 Buoyancy Units
Buoyancy and bathymetry
The planning of wave reduction system location relies greatly on bathymetry since it relates to the behavior of ocean surface. When the wave moves closer to shorelines, the wave height increases while the wave length decreases. Thus,The most effective way to reduce wave energy is by locating the wave reduction system before the increase of wave height occurs when it passes through shallow water.
The wave types according to water depth are classified as Deep-water wave, Intermediate water wave and Shallowwater wave. The orbital motion of water particles extends to a depth of one half of the wave length. Deep-water waves are waves passing through water with depth greater than half of its wavelength(D > L/2).For the Shallow-water wave, water depth is less than 20 times of wavelength( D<L/20) while the Intermediate-water wave occurs when water depth is in between ( L/20 < D <L/2). Wave height increases in great amount after entering the shallow water due to the stretch of particle orbital circles as a result of friction at seabed.
During typhoon when the wind velocity accelerates to the maximum, the wavelength also increases exponentially ( paper _ y = 8.4859x2). Since the maximum typhoon wind speed at the site is 126 km/hr๖( 35 m/s), X% of wave reduction platforms reduces the energy of the Intermediate-water wave when it passes through 21 meters water depth.
The Intermediate-water and shallow water wave water molecule orbital motion reaches from the surface to the seabed. In local scale, each wave reduction platforms performance target is to interrupt 50% of the total particle motion depth from the surface which has higher intensity than when the motion reach deeper water. This interruption dissipates the wave passing through the platform reducing the formation of higher wave height. The target of wave energy reduction efficiency together with the urban requirements determines the platform morphologies since both information indicates buoyancy capacity of the platforms.
138 Adaptive Floating Settlements y = 8.4859 X 2 0 50 100 150 200 250 1 2 3 4 5 0 50 100 150 200 250 Wave length (m) Wind speed (km/hr) 19 37 56 74 92 110 128 8.5 33.8 76.5 136 212 305.5 415 Wind speed (km/hr) Wavelength (m) Maximum depth = 30 m Minimum depth = 10 m Wave type indicator by water depth D = L/2 , D = 415/2 = 207.5 m D = L/20 D = 415/20 = 20.75 m
Node buoyancy capacity and bathymetry 3.2.7
Figure illustrates the relationship between buoyancy and bathymetry
FIG. 3.2.7.1 Bouyancy and Bathymetry
139 Research Development Intermediate Water Waves Deep Water Waves Wave reduction platforms location 40% 60% L H D D D L H L/20 D L/20 60%
60% of Depth
of Orbital motion
Figure illustrates the relationship between buoyancy and bathymetry
FIG. 3.2.7.2 Bouyancy and Bathymetry
3
Layers G 20.06
One of the criteria to choose and apply the wave reduction morphology to which location is its performance to withstand the wave energy. Another criteria is the bathymetry.
The system aims to disturb 60% of the vertical movement of the water particles which is the depth of the structure reaches 60% of the water depth. The system target then determines the floating capacity of the wave reduction platform due to the bathymetry.
Since the wave reduction unit not only performs as the infrastructure of wave dissipater, but also supporting the public platform nodes in which the floating capacity is crucial. While wave reduction morphology depth is due to the bathymetry, the node and programs distributions are due to the urban strategy.
One of the urban strategy rule is the proximity to the central nodes which are equally distributed throughout the area. Thus, some of the high density public platform has only 2 layers of wave reduction unit with the lowest capacity to carry weight.
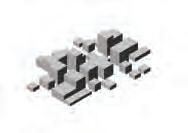
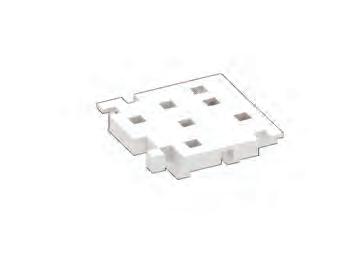
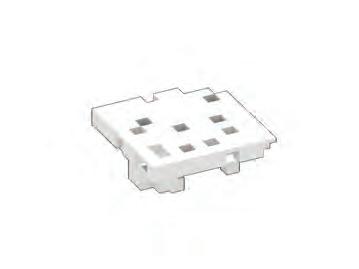
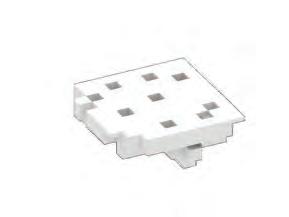
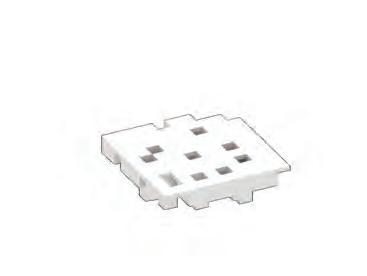
140 Adaptive Floating Settlements
R1 R1
Surface
Average Deformation(m)
Total volume (m3) = 3186 Surface Area(m2) = 3168 Average Deformation(m)
(m3)
Surface
Average Deformation(m)
Surface
Average Deformation(m)
G 14.1 R2 G 14.5 R3 Fb F Wave reduction structural load Structural loade Building morphology Live load Supplies and Materials People Bouyancy Node floating capacity and limitation 2 Layers 3 Layers 4 Layers 5 Layers
This limitation of floating capacity due to bathymetry influences the programs types on the public platform with low capacity. For instance, Subnode1 located close to shoreline has less residential area percentage to the subnode1 which is located where the water depth is deeper. The result of this strategy is that the overall density of the settlement tends to cluster in the middle of the site. 3.2.7
G 40.3 Total volume (m3) = 2997
Area(m2) = 2880
= 0.051
= 0.034 Total volume
= 3888
Area(m2) = 3798
= 0.053 Total volume (m3) = 3486
Area(m2) = 3582
= 0.044
Node buoyancy capacity and bathymetry
Figure illustrates the relationship between wave reduction unit and zoning.
FIG. 3.2.7.3 Wave Reduction Unit Morphology with Zoning Strategy
Bathymetry and wave reduction system performance
Wave reduction platforms of cluster A reduces the Intermediate-Water Wave at the Bethymetry Depth > 20.75 before it reaches the shallow water where the wave height is high.
DIfferentiated wave reduction system depth in relation with the bathymetry
Public platform nodes with differentiated floating capacity wave reduction units.
Edge node 5,3,2 layers
Central node 4,3,2 layers
Subnode 1 5,4,3,2 layers
Subnode 2 5,4,3,2 layers
Subnode 3 5,4,3 layers
S1
n. Number of wave reduction unit layers
Water surface level
Diagram illustrates the relationship between wave reduction unit and bathymetry.
141 Research Development
-10 m -30 m 2 2 5 5 5 5 5 5 5 5 5 5 5 5 5 4 4 4 4 4 4 4 4 4 4 4 4 4 4 4 4 4 4 3 3 3 3 3 3 3 3 3 3 3 3 3 3 3 3 3 2 2 2 2 2 2 2 2 2 2 2 2
FIG. 3.2.7.4 Bathymetry and the Depth of Wave Reduction Unit
Density strategy 3.2.8
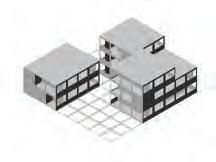
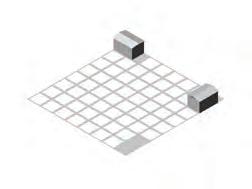
illustrating the density strategy on global, regional and local scale to cope with the high density demand.
Rearranging wave reduction pattern
Increasing public platform density
Increasing fish raft density
Density strategy
The dissertation design ambition not only focuses on the final outcome of the permanent living settlement scenario, it investigates the transformation process from aquaculture dominant settlement to permanent living scenarios. The strategy dealing with the higher density demand are in all scales ; global, regional and local.
The aquaculture dominant settlement wave reduction pattern is optimized for the least number of platforms providing the safe area for 7,000 people. Such amounts of public platforms allows water flow for the dense aggregation of fish raft.
The strategy for the global scale is by adding more public platforms and rearranging their locations to achieve bigger zoning for permanent living with wave height under 2 meters providing residential and amenities for 16,893 people.
The regional scale density change strategy is to increase public platform density to occupy more residential area and amenities. Optimized morphology with highest building area are chosen as the building mass guidelines.
In the local scale, new type of fish rafts are introduced with 56% and 80% transformation of aquacutlture cages to residential area. This new types are located within the safest area of the settlement ,clustering in the middle following the program distribution strategy in which the higher density is located closer to the Central nodes.

The new type of fish raft morphology has been optimized by the same criteria with the public platform nodes concerning the living comfort of the residents.
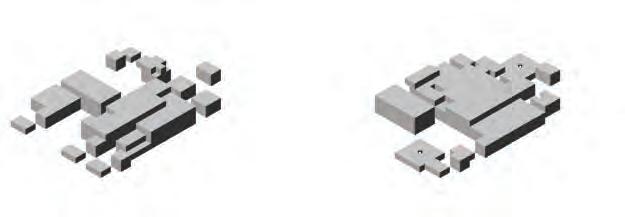
142 Adaptive Floating Settlements
Diagrams
Aquaculture dominant settlement Permanent Living settlement Population : 7000 people Population : 16,893 people
20% Wave height < 2 m
50% Wave height < 2 m
Residential area : 4210 m2
Residential area : 2105 m2
No. of resident: 4 persons
No. of resident: 15 persons
FIG. 3.2.8.1 Density Strategy
The images show the result of density strategies by comparing the aquaculture dominant settlement and the permanent living scenarios. Permanent living settlement.
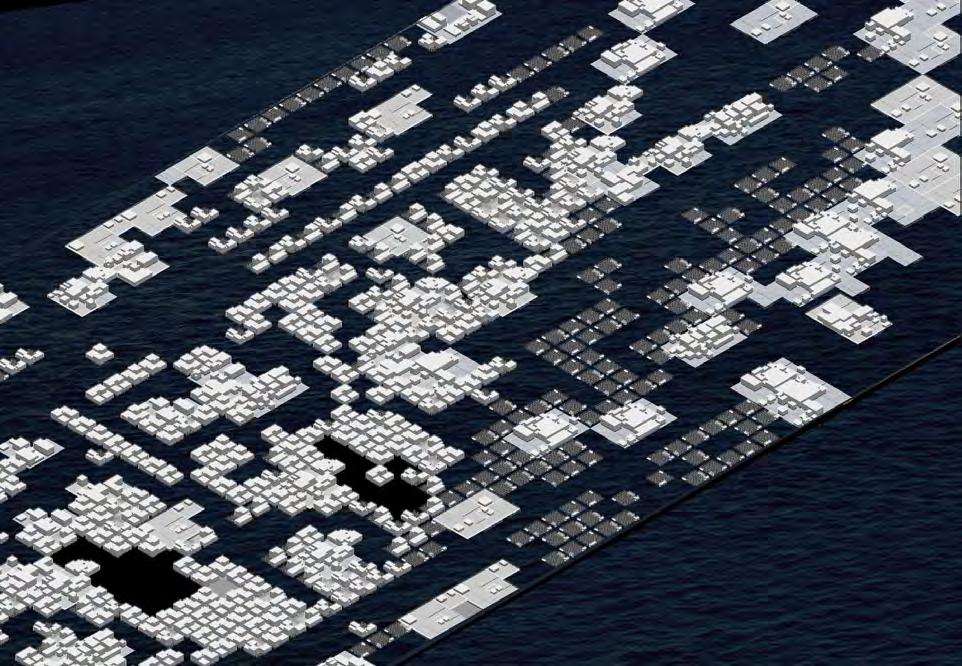
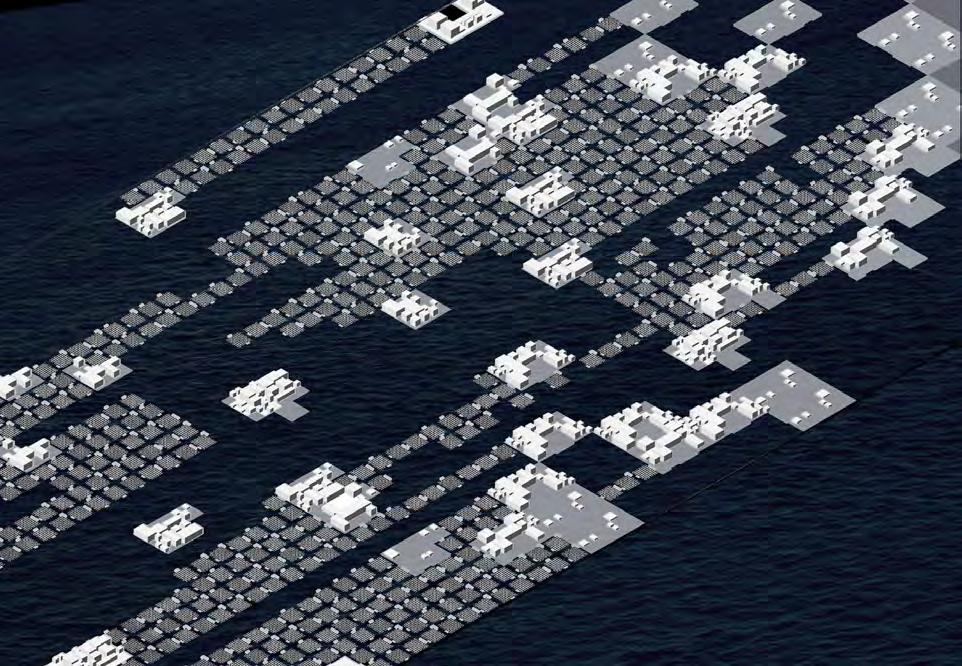
143 Research Development
Aquaculture Dominant Settlement
Permanent Living Settlement
FIG. 3.2.8.2 Density Comparison
Program and morphology conclusion
The research proposal for programs and morphologies deals with the problems of the unorganized settlement system.The settlement organizational logic provides social welfare provision responding to the rising demand from coastal migration while supporting and improving the efficiency of aquaculture industry. It includes the strategy dealing with the prospected population rise.
The proposal takes into consideration of functional and the envrionmental impact on living comfort and safety through the morphology evaluation and optimization.It also integrates the top part and the submerged part of the floating public node concerning the physical comfort of living on the floating platforms.
144 Adaptive Floating Settlements
Conclusion 3.2.9
145 Research Development
Chapter 3 l Research Development
3.3 Assembly Process
3.3.1
Assembly Process Scenario Reconfiguration
Assembly sequences
The strategy of the settlement assembly process builds on coordinating all the research and information to identify the growth of the settlement in sequence. The goal is to achieve floating settlement with a self-sustaining system and efficient network associated with the surrounding villages. The proposal of the settlement includes 10 steps, each of them has been set in a specific scenario that influenced by the context of site, the demand from society, and the coastal migration issue in China. Benefiting from the advantage of the floating settlement, its adaptability and mobility mechanism has helped the hypothesis of the settlement scenarios become possible.
To achieve the target settlement, the assembly process has 10 steps. Starting from the initial point within the chosen site, where the effectiveness of wave reduction is the primary objective, the frontier defensive line formed firstly. In six steps, the settlement achieves the aquaculture dominant
scenario, reaching a population of 7000 people. Afterward, with the concern over the increasing demand from society and the expanding population at the site, the aquaculture dominant community will then transform into a settlement that targeting to serve as a permanent living environment. The permanent living scenario aims to accommodate 20,000 people, which is 10 times bigger than the existing floating settlement at the site. The strategy to decide each step also takes into consideration the safety condition under destructive waves and the contextual data. The overall permanent living settlement
10
148 Adaptive Floating Settlement
Figure illustrates the assemlby scenarios from the initial point towards the permanent living settlement.
FIG. 3.3.1.1 Assembly Scenario
is projected to fully
in
years.
develop
Aquaculture Permanent Living Aquaculture Settlement Species Imbalance Aquaculture Dominant Citizen dominant Early stage Transformation Industries/ Activities trend Aquaculture based settlements Permanent Living settlements Accepting Tourism Fishermen : Citizen Zoning Area Settlement Scenarios Density Assembly Sequence The beginning of the settlement The initial point The frontier protective system The first cluster The second cluster Tourist area Settlement transformation Reconfigure platform sequence 1 Additional wave reduction platform introduce new program morphology Wave reduction pattern 1 Wave reduction pattern 2 Aquaculture dominant settlement Permanent living settlement
Diagram shows the target of each step. Within 10 steps and around 15 years the proposal can be achieved.
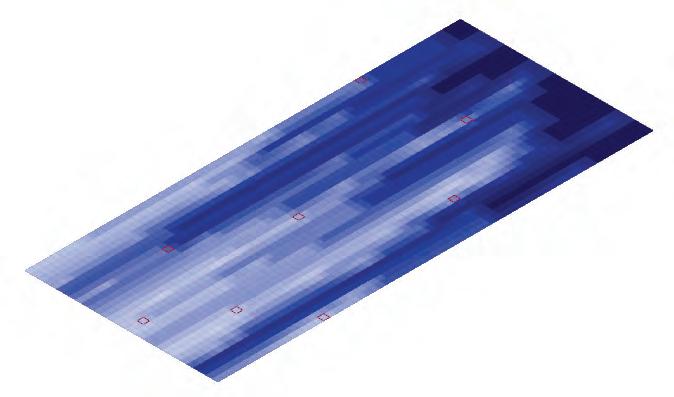
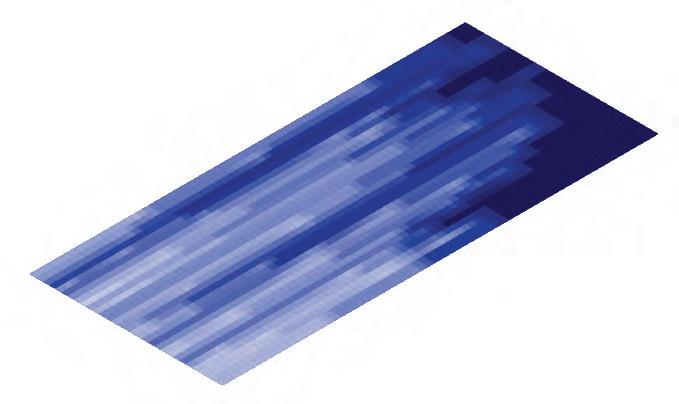
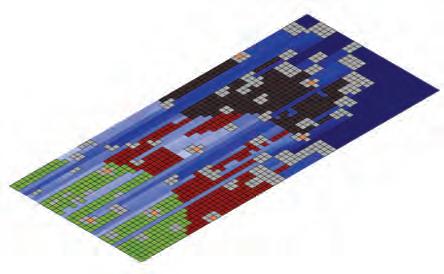
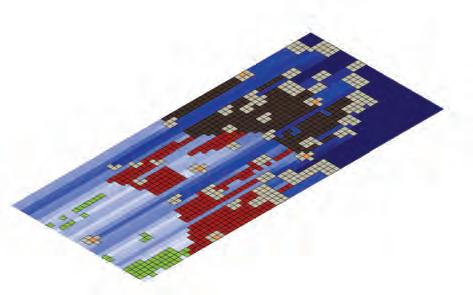
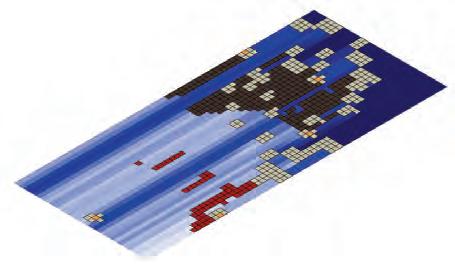
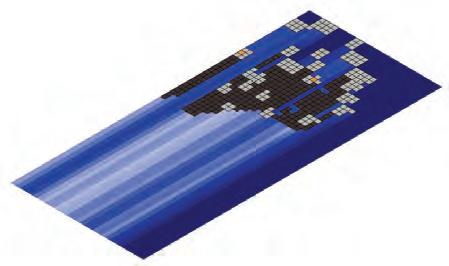
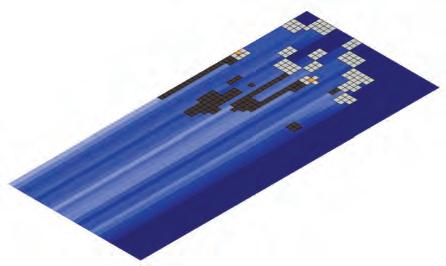
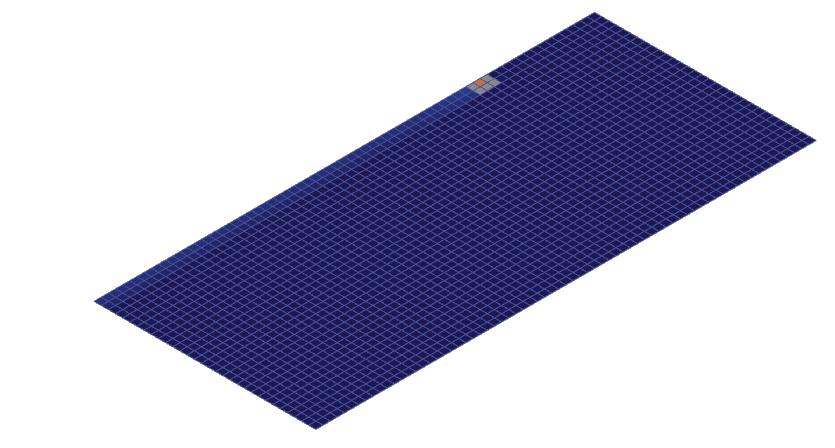
149 Research Development
0.54 0.54 1.08 0.54 0.63 A 450m 0.18 0.36 0.18 0.45 1.35 0.72 0.54 0.45 0.45 0.36 0.45 0.81 0.36 0.36 0.45 0.45 0.36 0.54 0.9 1.08 2.16 0.54 0.36 0.27 0.27 0.27 0.45 0.45 0.9 0.54 0.54 0.54 1.08 0.45 0.54 0.72 0.54 0.18 0.18 0.27 0.18 0.18 0.36 0.27 0.72 0.360.27 0.36 0.27 0.27 0.27 0.27 1.35 0.63 Direction of Wave Initial Area Frontier Platform First Cluster Complete Froniter Settlement Transformation Reconfiguration Living Area Tourist Area Aquaculture Dominant Settlement Permanent Living Settlement 1 2 3 4 5 6 7 8 9 10 Assembly Sequence wave reduction platform fish raft reconfigured platfrom
FIG.3.3.1.2 Assembly Process
Towards Aquaculture Dominant Settlement 3.3.2
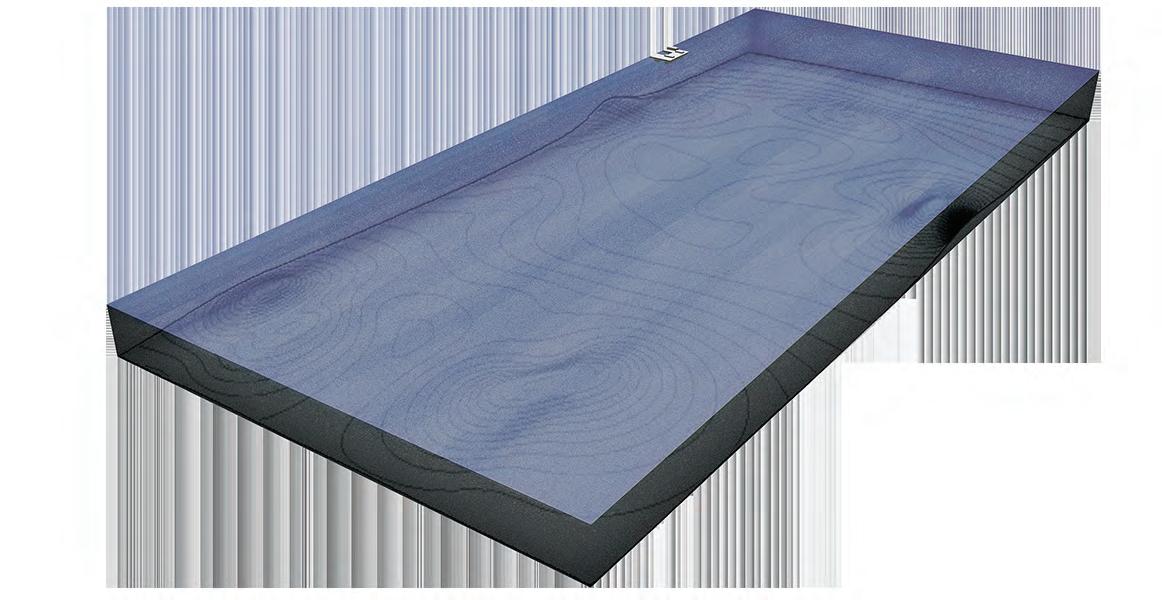
Initial point
The early stages of the assembly processes focus on the development of wave reduction platform, especially the frontier defensive platforms. Follow this strategy, the settlement starts from offshore of the bay where is identified to build the first wave reduction platform. The beginning area of the settlement will be a node that closes to the village Aas the first platform to link with the land, and functions as a transportation junction. In this step, there is no fish raft or any habitable place for people can be built on the site. The target is to build an edge node to transit and support the following construction process. As the construction of frontier wave reduction line will start from the initial point, this identified point is far from the shore to provide a maximum safety area for the site.
150 Adaptive Floating Settlement
Direction of Wave Settlement Information >> Culture Area: >> Platform number: >> Fish raft number: >> Population: >> Public platform area: 0% 5 0 0 0.54 ha A Population Schedule 0 0 0.4 10 20,000 A 1
Images show the initial point of the settlement.
FIG. 3.3.2.1 Step 1
Frontier platform
Regarding with safety issue of the site, the offshore frontier platform becomes a construction priority. Linking with the first edge node in the boundary of the settlement, the frontier platform was placed to lessen the wave height before the destructive wave flow through the bay. The optimized platform arrangement to dampen the wave height is to build the first 60 percent of wave reduction platform in the front 450 meters. Once the frontier platform completed, it helps to create 52 percent of fish culture area with the wave height less than 3 meters height. Following the development of culture area, it allows the first 100 fish rafts to be built as well as 1,000 people to live on the sea.
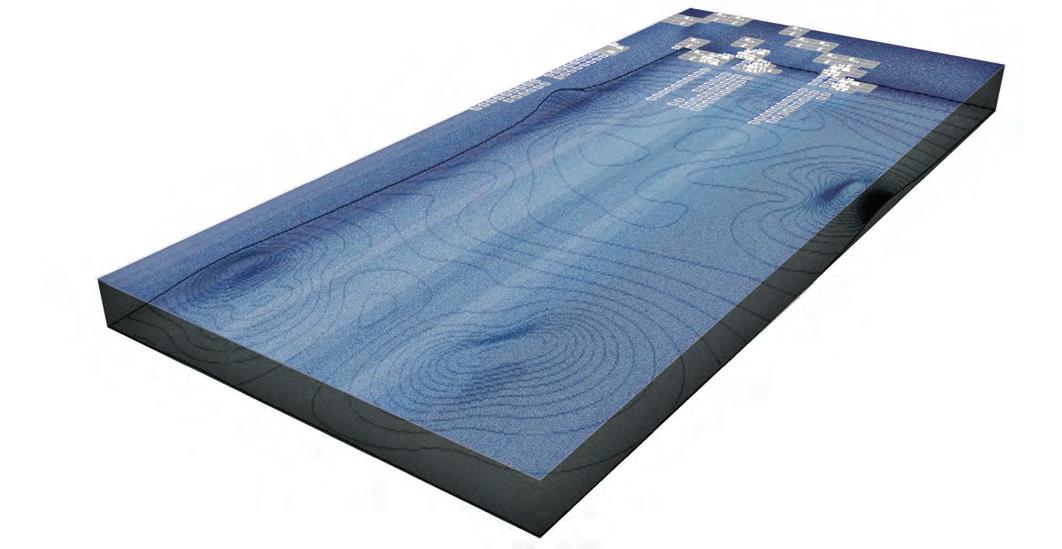
151 Research Development
Settlement Information Population Schedule 0 01 10 20,000 >> Culture Area: >> Platform number: >> Fish raft number: >> Population: >> Public platform area: 52% 112 100 1000 10.1ha 450m 1,000 52% 2
Images show the assembly process of frontier platfrom.
FIG.3.3.2.2 Step 2
Towards Aquaculture Dominant Settlement
Settlement Information
>> Culture Area:
>> Platform number:
>> Fish raft number:
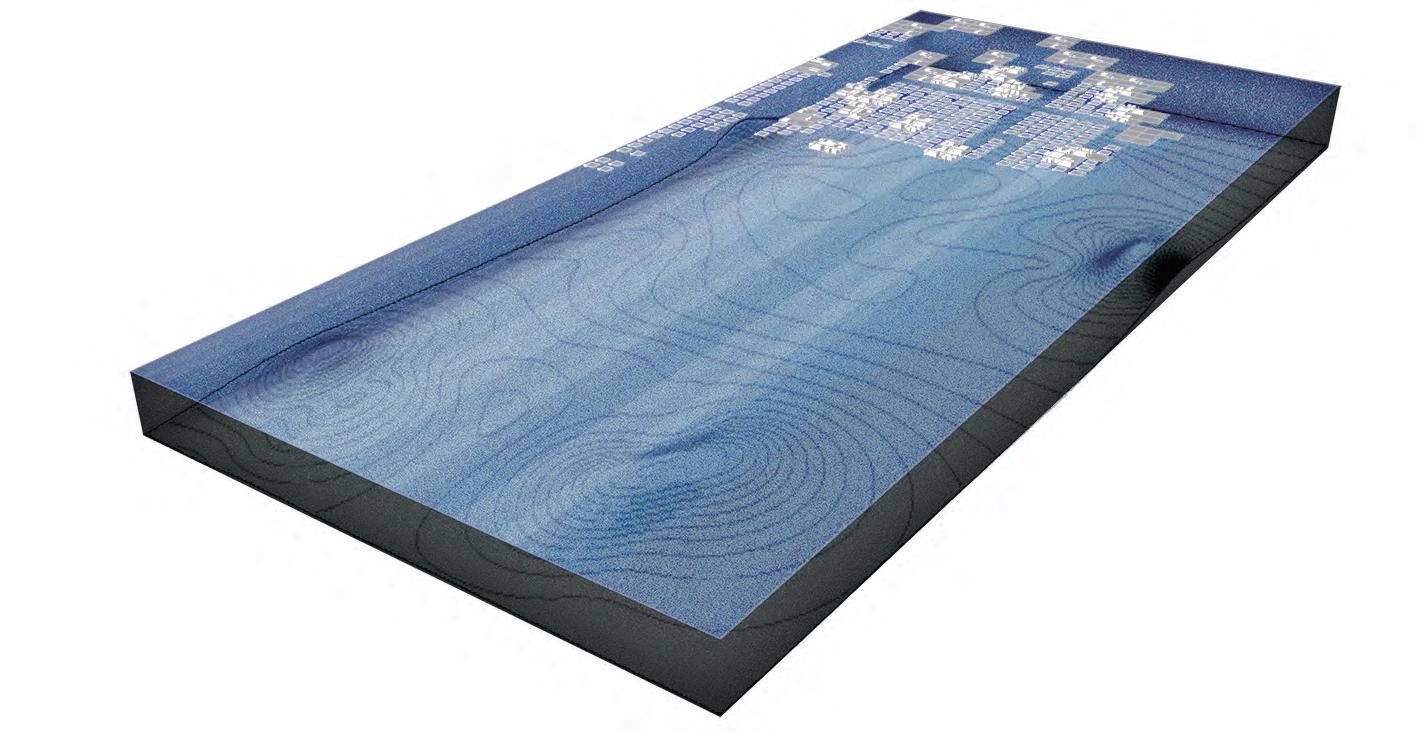
>> Population:
First floating cluster
The first fish raft cluster will finish until 80 percentage of offshore wave reduction platform is built. Under the achievement of the safety area, the first floating cluster can be constructed. Taking into account the topological experiment, contextual research, and program morphology, the fist cluster will include one edge node, one central node, and 160 sub nodes. It can provide a 14.4-hectare public area for the locals and fishermen. Benefit from the growing culture area, the first aquaculture cluster can hold 220 fish rafts. The number of the population also increases to 1,800 people.
152 Adaptive Floating Settlement
Images show the first floating cluster be established within 2 to 3 years
3.3.2
FIG. 3.3.2.3 Step 3
Population Schedule 0 0 10 20,000 3 2 2,000 62% 160 220 1800 14.4ha
>> Public platform area:
Images show the process achieve the overall of the frontier platfrom.
Complete frontier platform
To be able to assemble the rest of frontier platform, the assembly process have to be supported by the network of the first fish cluster. The distance of offshore platform in related to the first cluster determines the order to construct. The culture area in the site achieves 78 percent after completing the frontier wave reduction platform. The result facilitates a significant increase in population and the number of fish raft - 350 fish rafts anchored within the safe area, and 3,500 population live on the sea, which is almost two times bigger than the previous stage.
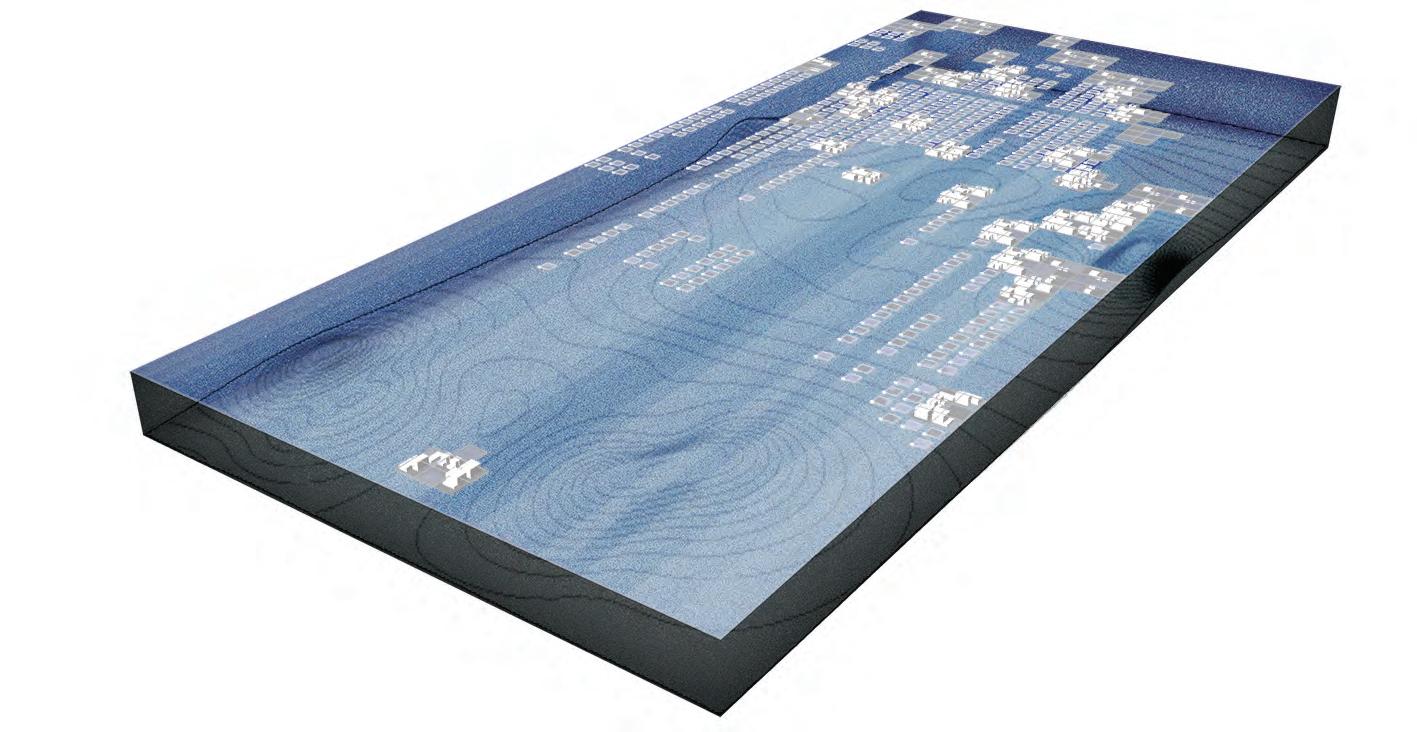
153 Research Development
FIG.3.3.2.4 Step 4
3 3,500 78% 248 350 3500 22.3 ha Settlement Information Population Schedule 0 0 10 20,000 >> Culture Area: >> Platform number: >> Fish raft number: >> Population: >> Public platform area: 4
3.3.2 Towards Aquaculture Dominant Settlement

>>
>>
>>
Tourist area
Tourist area will introduce to aquaculture dominant settlement to increase the diversity of activities within the settlement. It also takes into account the potential of sightseeing possibility for the floating settlement. The strategy to decide the location of tourist zone is considering the level of potential disruption or interruption on aquaculture activities and the accessibility for tourists. Therefore, the first tourist area is introduced in the center of the settlement where with easy access by the main road network without passing thorough the secondary or thirdly road within the fish rafts. Apart from the tourist zoning strategy, the number of population has increased to 5,000 people including around 2,500 fishermen. Until this stage, the maximum culture area reaches to 79 percent and contains 560 fish rafts.
154 Adaptive Floating Settlement
Images show the tourist area within the settlement.
FIG. 3.3.2.5 Step 5
79% 291 560 5000 26.2 ha 4 5,000 Settlement Information
Culture Area:
>>
number:
>> Platform
Fish raft number:
Population:
Public platform area: Population Schedule 0 0 10 20,000 5
Aquaculture dominant settlement
In 5 to 6 years, the aquaculture dominant settlement with 7,000 residents is predicted to achieve. The settlement includes 5 clusters with five central nodes and three edge nodes. In this scenario, the aquaculture activities are leading the settlement with 750 fish rafts in which analyzed to be the maximum number for culturing fish at the chosen site. The settlement and fish farm reach the environmental threshold at this stage. Any development beyond the threshold not only affects the strategy for settlement aggregation, but also make the user need to alter the pattern of the settlement. The situation could be severe, for example, the increase of the fish rafts will aggregate in a high risk zone and face strict conditions with high waves. And the growing number of immigrants that move to the coastal cities and involve in the aquaculture business is demanding more living and culturing space.

155 Research Development
Images show the aquacultrue dominant settlement be established with 7000 population.
FIG.3.3.2.6 Step 6
Settlement Information Population Schedule 0 0 10 20,000 >> Culture Area: >> Platform number: >> Fish raft number: >> Population: >> Public platform area: 6 5 7,000 78% 343 750 7000 30.9 ha
3.3.3
Settlement Transformation Method
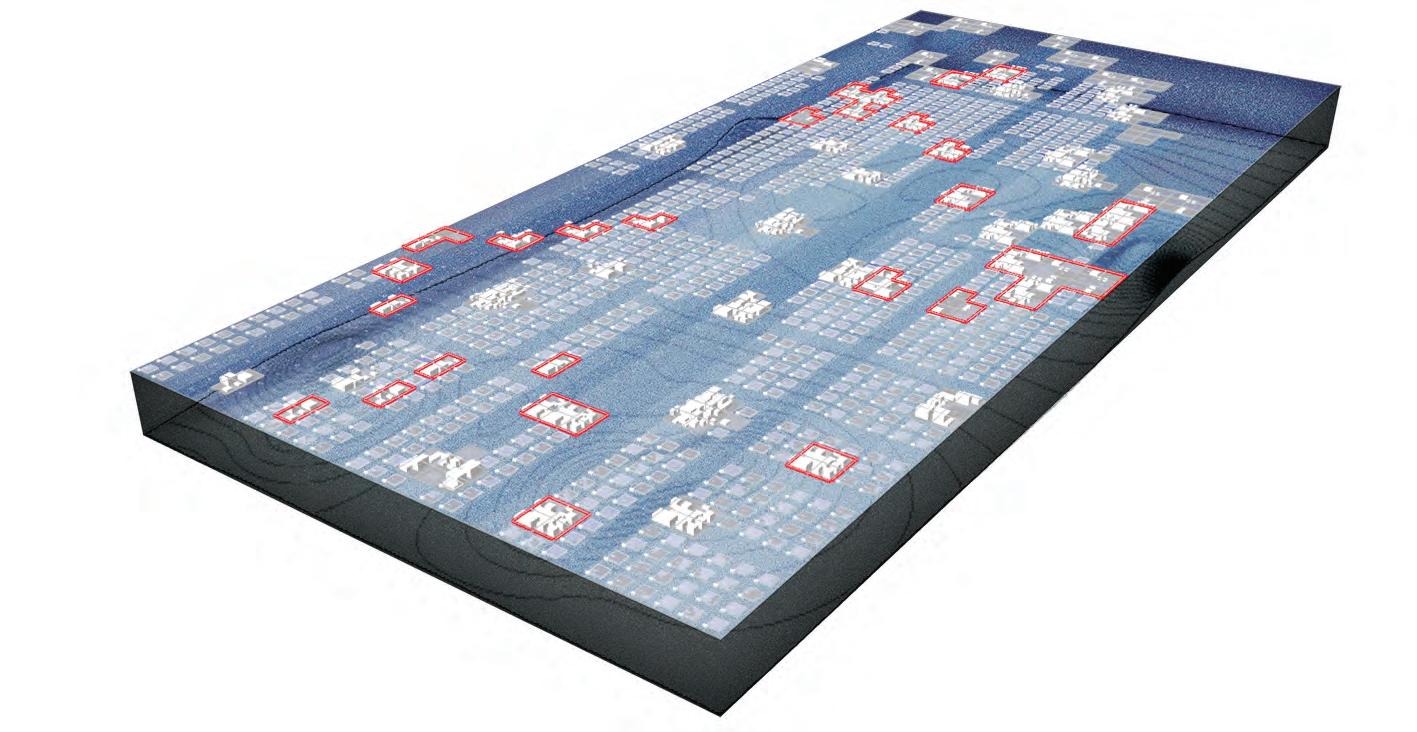
Settlement transformation
The settlement transformation is the solution that respond to the change of demand from many aspects, such as the demand for aquatic production and the changing socioeconomic structure. To address the problems and issues that happen in the aquaculture dominant settlement - insufficient safe area and the high risk of over-development, the strategy is to alter the settlement to reach a pattern with more safe areas. The first step is to identify the platform that need to be reconfigured. As the image shows, the platforms with red boundary will move to form the next pattern.
156 Adaptive Floating Settlement
Images show the starting of the settlement transformation process.
FIG. 3.3.3.1 Step 7
6 9,000 >> Reconfigured Area: >> Reconfigured platform: >> Fish raft number: >> Population: >> Public platform area: 12.15 ha 135 750 9000 34.38 ha Settlement Information Population Schedule 0 0 10 20,000 7
Images show the process of reconfiguration by identifing the existing platfrom and new location of settlement.
Reconfiguration
Regarding the demands of population pressure, safety risk, and the environmental threshold, the platforms transform into a different scenario to adapt the criteria of the permanent living settlement requirements. The platforms identified in the previous stage moves to their new location under certain principles. Due to the force of the incoming wave and the volume of each platform, the design team also considered the method to transport the platform at the sea. A range of limitation on moving the platform is critical, including the depth of structure underneath the platform and the different situation caused by the location of the platforms. The total area of the reconfigured platform is 12.15 hectares with 3.8 hectares of new platform added into the settlement.
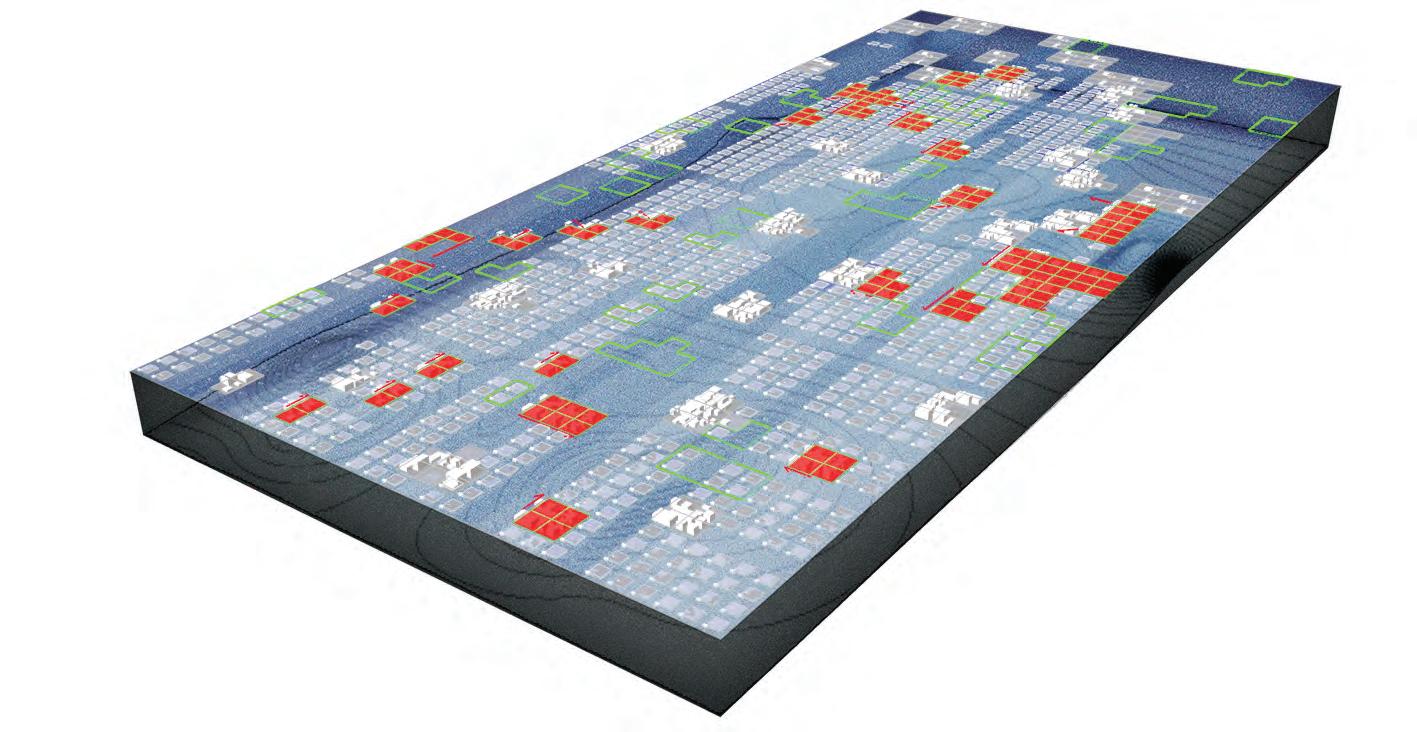
157 Research Development
FIG.3.3.3.2 Step 8
>> Reconfigured Area: >> Reconfigured platform: >> Fish raft number: >> Population: >> Public platform area: 12.15 ha 135 750 11000 34.38 ha 7 13,000 0.18 0.36 0.18 0.45 1.35 0.72 0.54 0.45 0.45 0.36 0.45 0.81 0.36 0.36 0.45 0.45 0.36 0.54 0.9 1.08 2.16 0.54 0.36 0.27 0.27 0.27 0.45 0.45 0.9 0.54 0.54 0.54 1.08 0.45 0.54 0.72 0.54 0.18 0.18 0.27 0.18 0.18 0.36 0.27 0.72 0.360.27 0.36 0.27 0.27 0.27 0.27 1.35 0.63 Settlement Information Population Schedule 0 0 10 20,000 8
3.3.4
Towards Permanent Living Settlement
Images show the result of settlement transformation towards a more habitable living settlement.
Living area
The new pattern of settlement increases the area for living, with the definition of the area that having wave height less than 2 meters. With this wave height, the stability of the platform increase significantly, but it is not suitable for culturing fish that needs a certain amount of water flow to pass through the net. Under this approach, the number of people that the settlement can afford raise to 13,000. However, in order to provide more habitable area, the number of fish raft decreases to 600. The adaptive performance of the settlement shows the adjustability of the strategies in different circumstances. The last transformation process is to assemble the offshore platform. This process needs supports from the land port to drag new platforms to the location at the offshore where is the high-risk area.
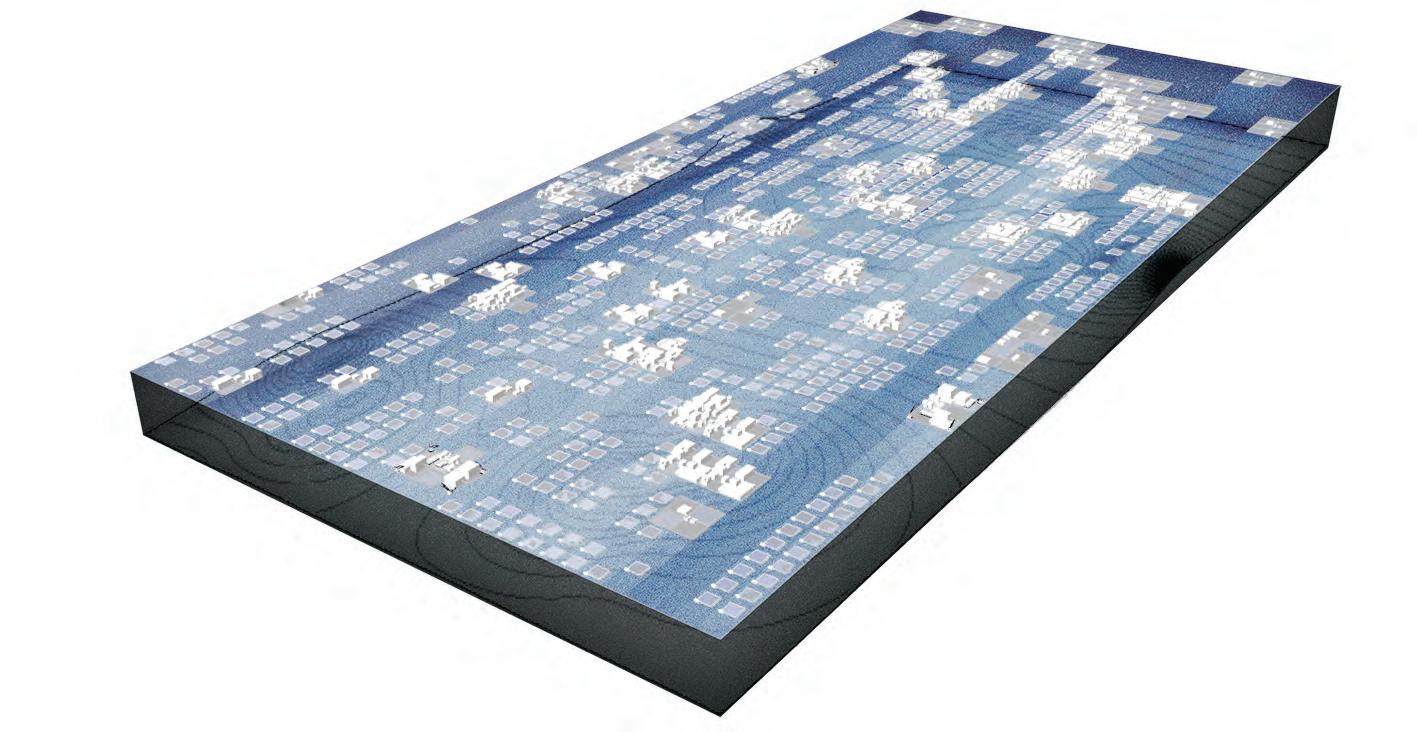
158 Adaptive Floating Settlement
FIG. 3.3.4.1 Step 9
>> Fish raft number: >> Population: >> Public platform area: >> Average wave height: 600 13000 34.48ha 2m 13,000 8 0.54 0.54 1.08 0.54 0.63 0.72 Settlement Information Population Schedule 0 0 10 20,000 9
Images show the final result of permanent living settlement with around 17,000 population.
Permanent living settlement
At the final stages, a permanent living floating settlement is achieved with the average wave height in total less than 2 meters. And the overall population live on the settlement increases to nearly 17,000. In order to reach a floating settlement with a high density population, a new program morphology is introduced in this process. Half of the culturing area is transformed into residential area for the purpose to get more space for people to live. The final permanent living settlement will be a self-sustaining system with efficient road network connecting to surrounding villages. The new building morphology increases the population density to 8,938 people per square kilometer, which is similar to a medium scale city on land. These figures are considered to be sufficient in regards to the initial goals.
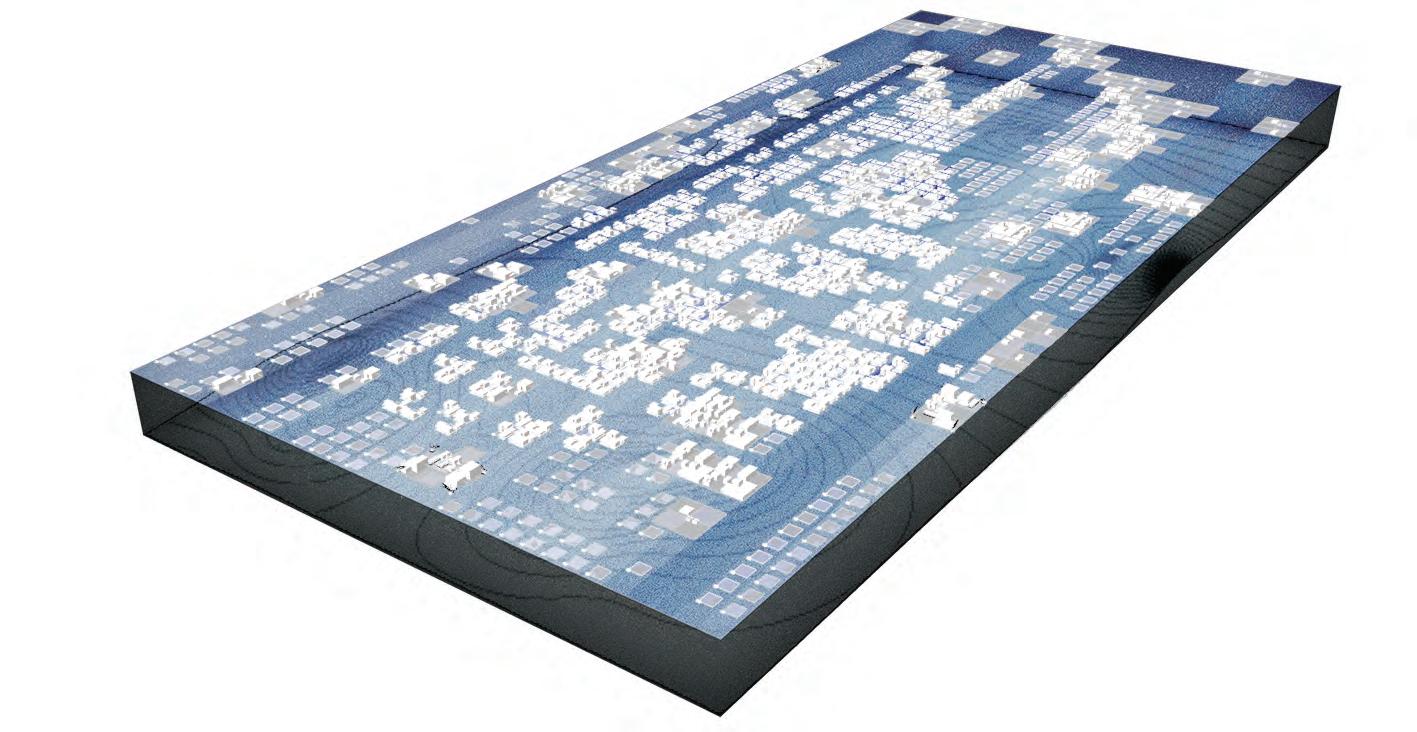
159 Research Development
FIG.3.3.4.2 Step 10
>> Fish raft number: >> 50/50 fish raft number: >> Population: >> Public platform area: >> Average wave height: 275 325 16894 34.38 ha 2m 16,894 <2m wave height Settlement Information Population Schedule 0 0 10 20,000 10
3.3.5
Conclusion
Conclusion
Through research and resource analysis, this project was aimed at meeting programmatic, socio-economical, and design ambitions. The assembly process is developed under an experimental context where evolutionary computation techniques and multi-parameter analysis merge with design intentions to realize a new hypothesis of floating settlement. At the final stage, the permanent living settlement, the proposal could cater for 17,000 residential population and a population density of 8,900 per square kilometer. Furthermore, the platform cluster is composed of approximately 50% residential area, 25% aquaculture spaces, 15% social provision and commercial area, and 10% green area and water collection area. It has achieved the target the design team set in the research proposal.
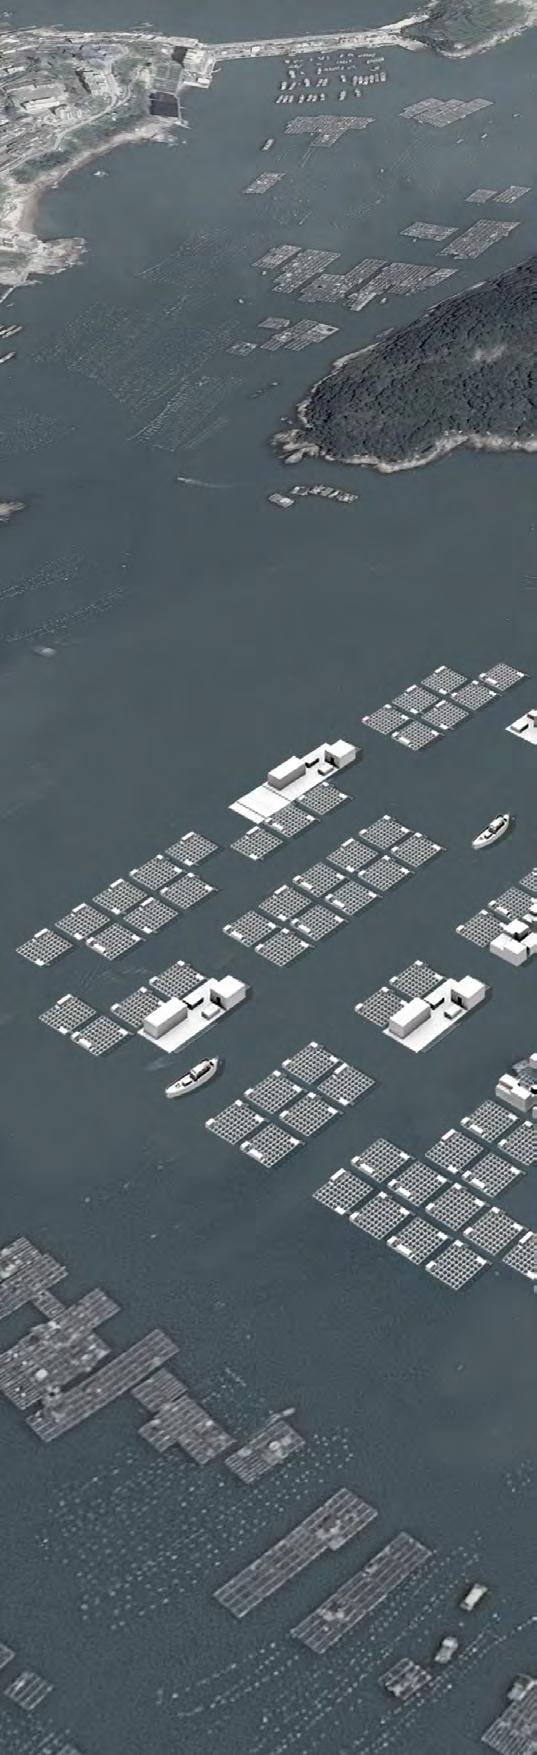
160 Adaptive Floating Settlement
The perspective image of the permanent living floating settlement.
FIG. 3.3.5.1 Overall Settlement
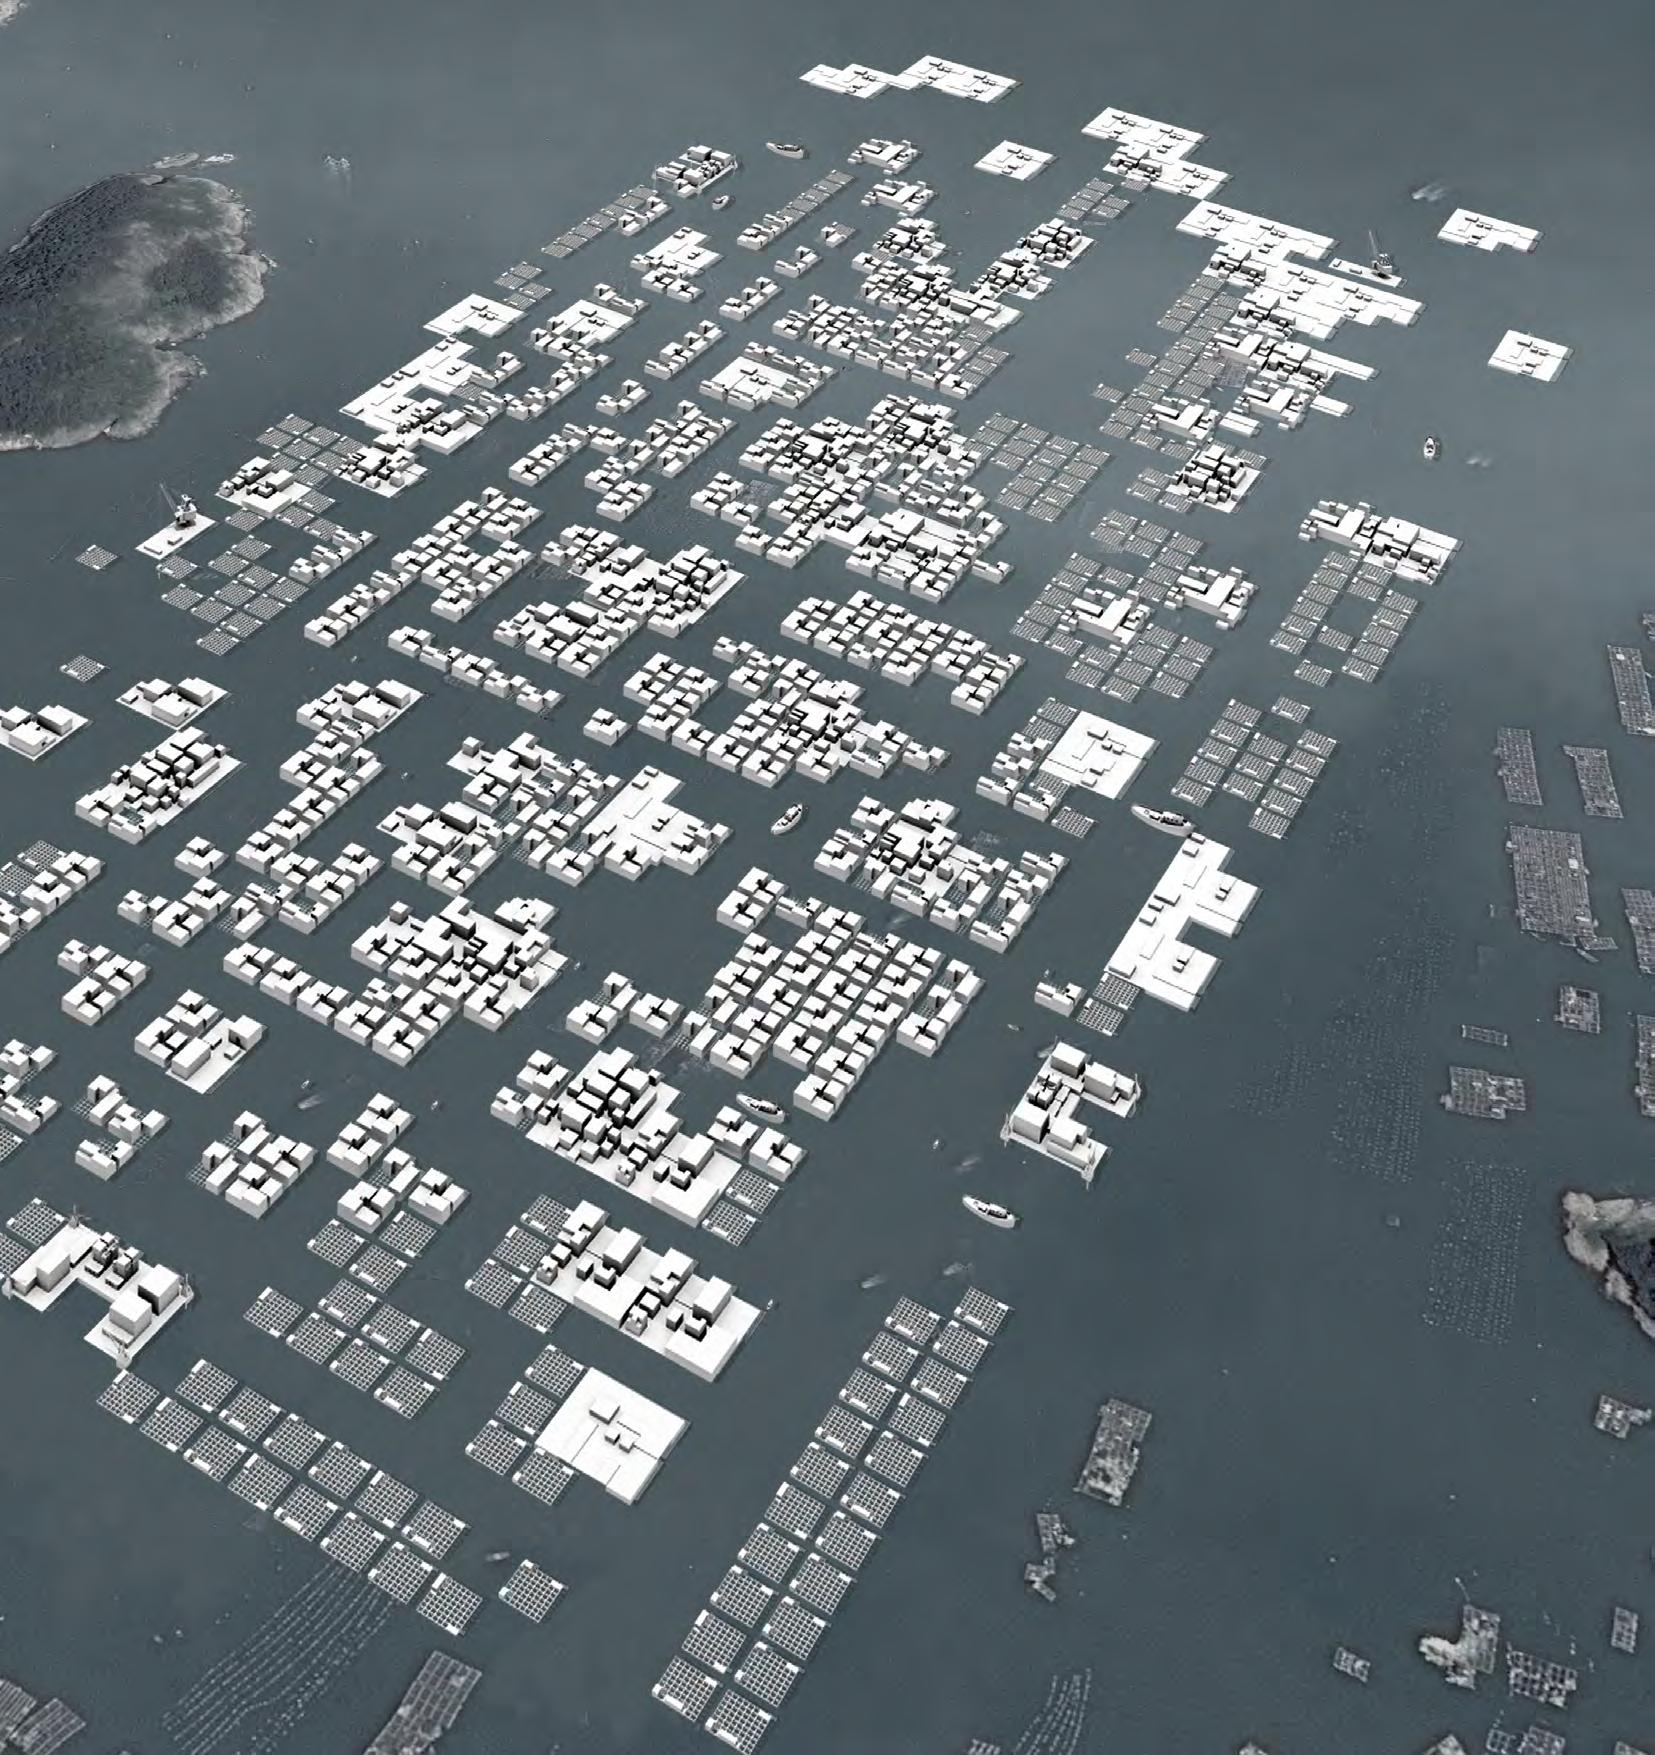
4.0 Design Development
Chapter 4 l Design Development
4.1 Permanent Living Settlement
4.1.1
Transportation Network

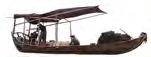
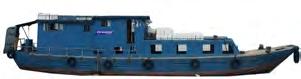
Route Hierarchy
The transportation network was designed to contain a hierarchy of ‘roads’ that connect all the area of the settlement. The design strategy was based on the studying of the type of boats on-site to provide easy access for the peripheral nodes to the center. The road network facilitates daily movement and heavy aquaculture activities within the settlement. The proposed road network contains 3 classes of roads with different abilities to link to major nodes. The primary roads were classified as being the main supply roads to connect the central nodes to the boundary of the settlement. It is 40 meters wide and mainly used by cargo boats and transit
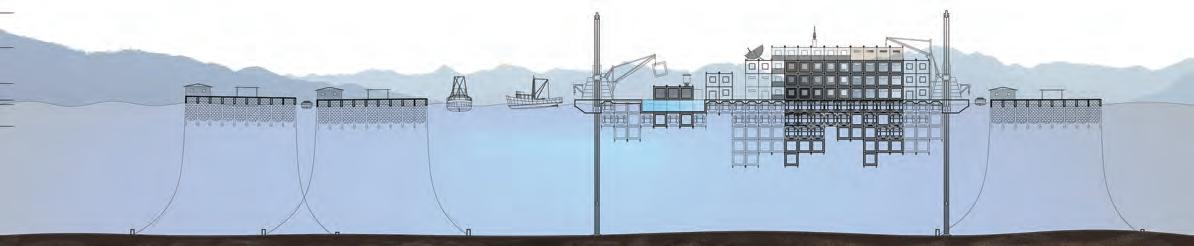
speed boats. The secondary roads function as a direct link between all the nodes on the site. The width of the secondary road will be between 40 to 10 meters, and it can contain most of the ships at the site. The thirdly roads are sitting between the fish rafts. It will be 5 meters wide and mainly for the use of fishermen. The resulting road network could be considered successful in creating a connected transport system that links all the nodes to the primary route and allowed the settlement to function well under any type of requirements.
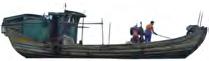
166 Adaptive Floating Settlement
The road network shows the hierarchical road network at the site.
Images illustrate the section of the road with primary road, seconday road, and thirdly road.
Above Left Below
Image illustrates the current boat at the site. The more detail describtion is in Chapter 1.2.1.
FIG. 4.1.1.2 Road Network
FIG. 4.1.1.3 Road Hierachy
FIG. 4.1.1.1 Catalog of boat
Route Hierachy Catalog of boat Central node Edge node -30 40 90 305 12 0 -5 5 -30 (m) 12 0 -5 5 30 30 305 5 Cargo boat_a Ca Cargo boat_b Cb Fish boat_a Fa Fish boat_b Fb Transit boat Ta
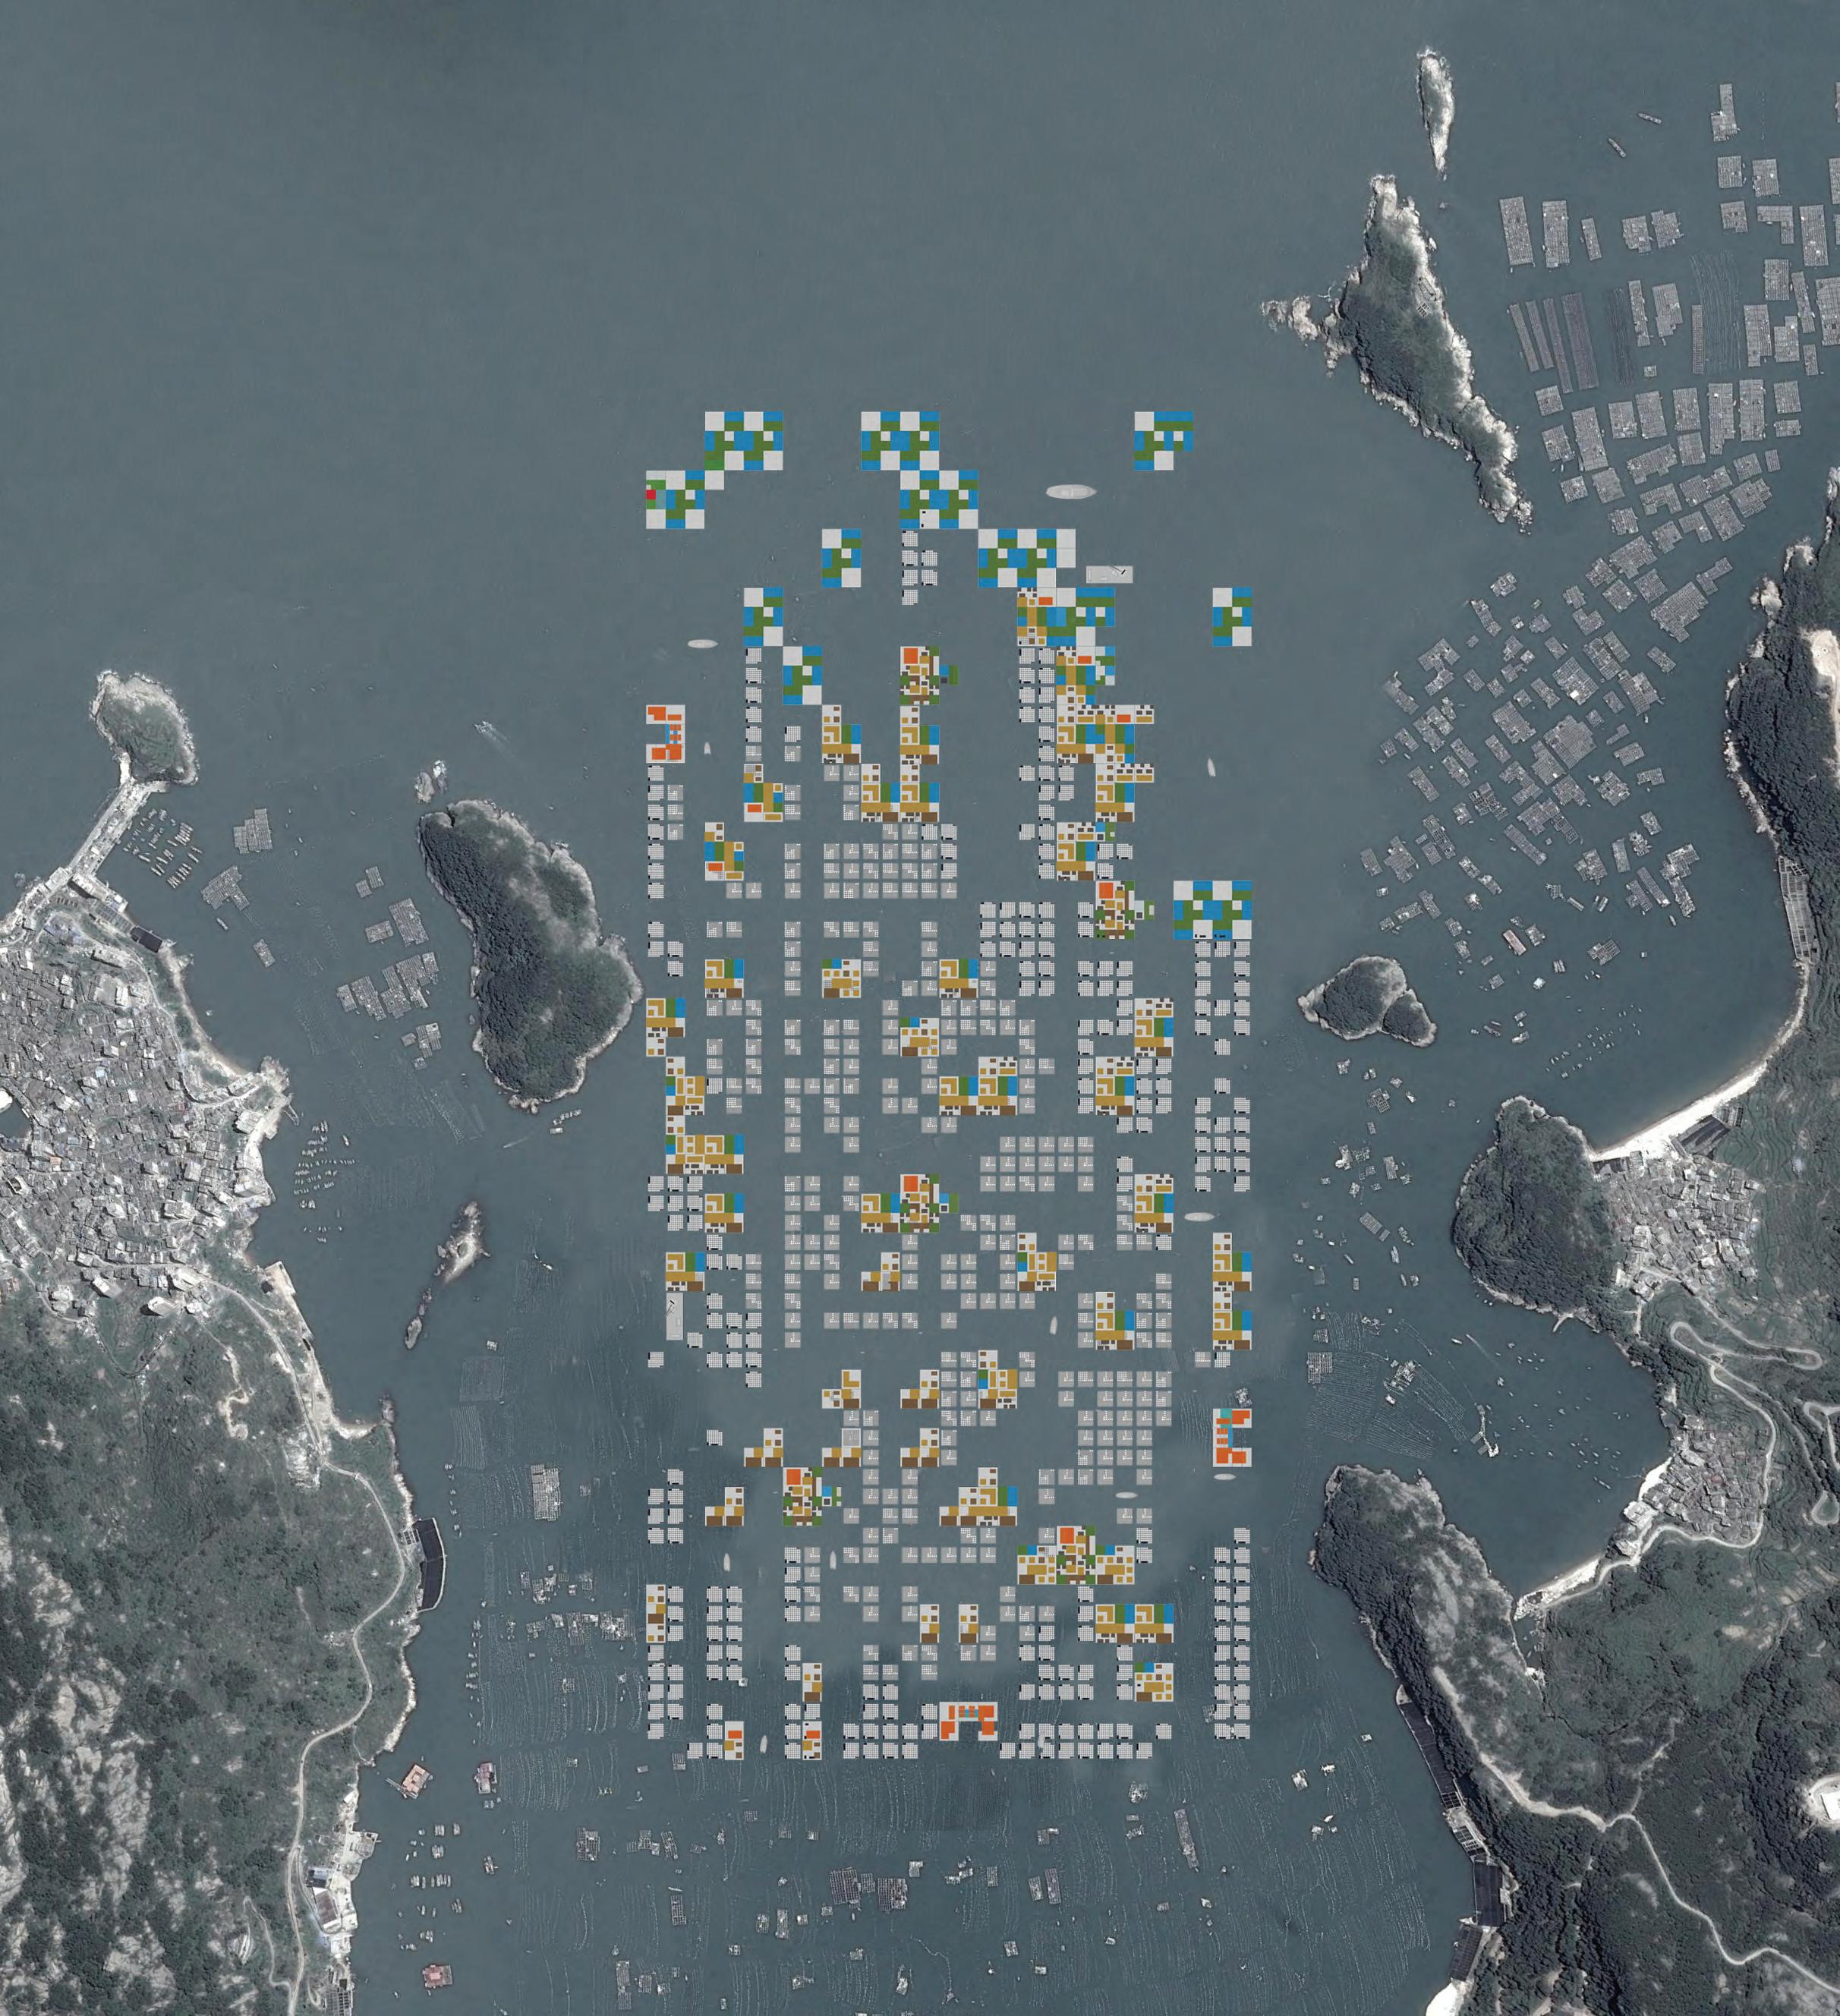
Ca Cb Fa Fb Ta
Edge Node 4.1.2
The edge node is mainly used for aquaculture logistics and acts as the principal ports where aquaculture activities take place. The edge node has the highest accessibility within the floating settlement that it sits close to the land ports, thus becomes the major ports to output the harvests and get goods and supplies from land.
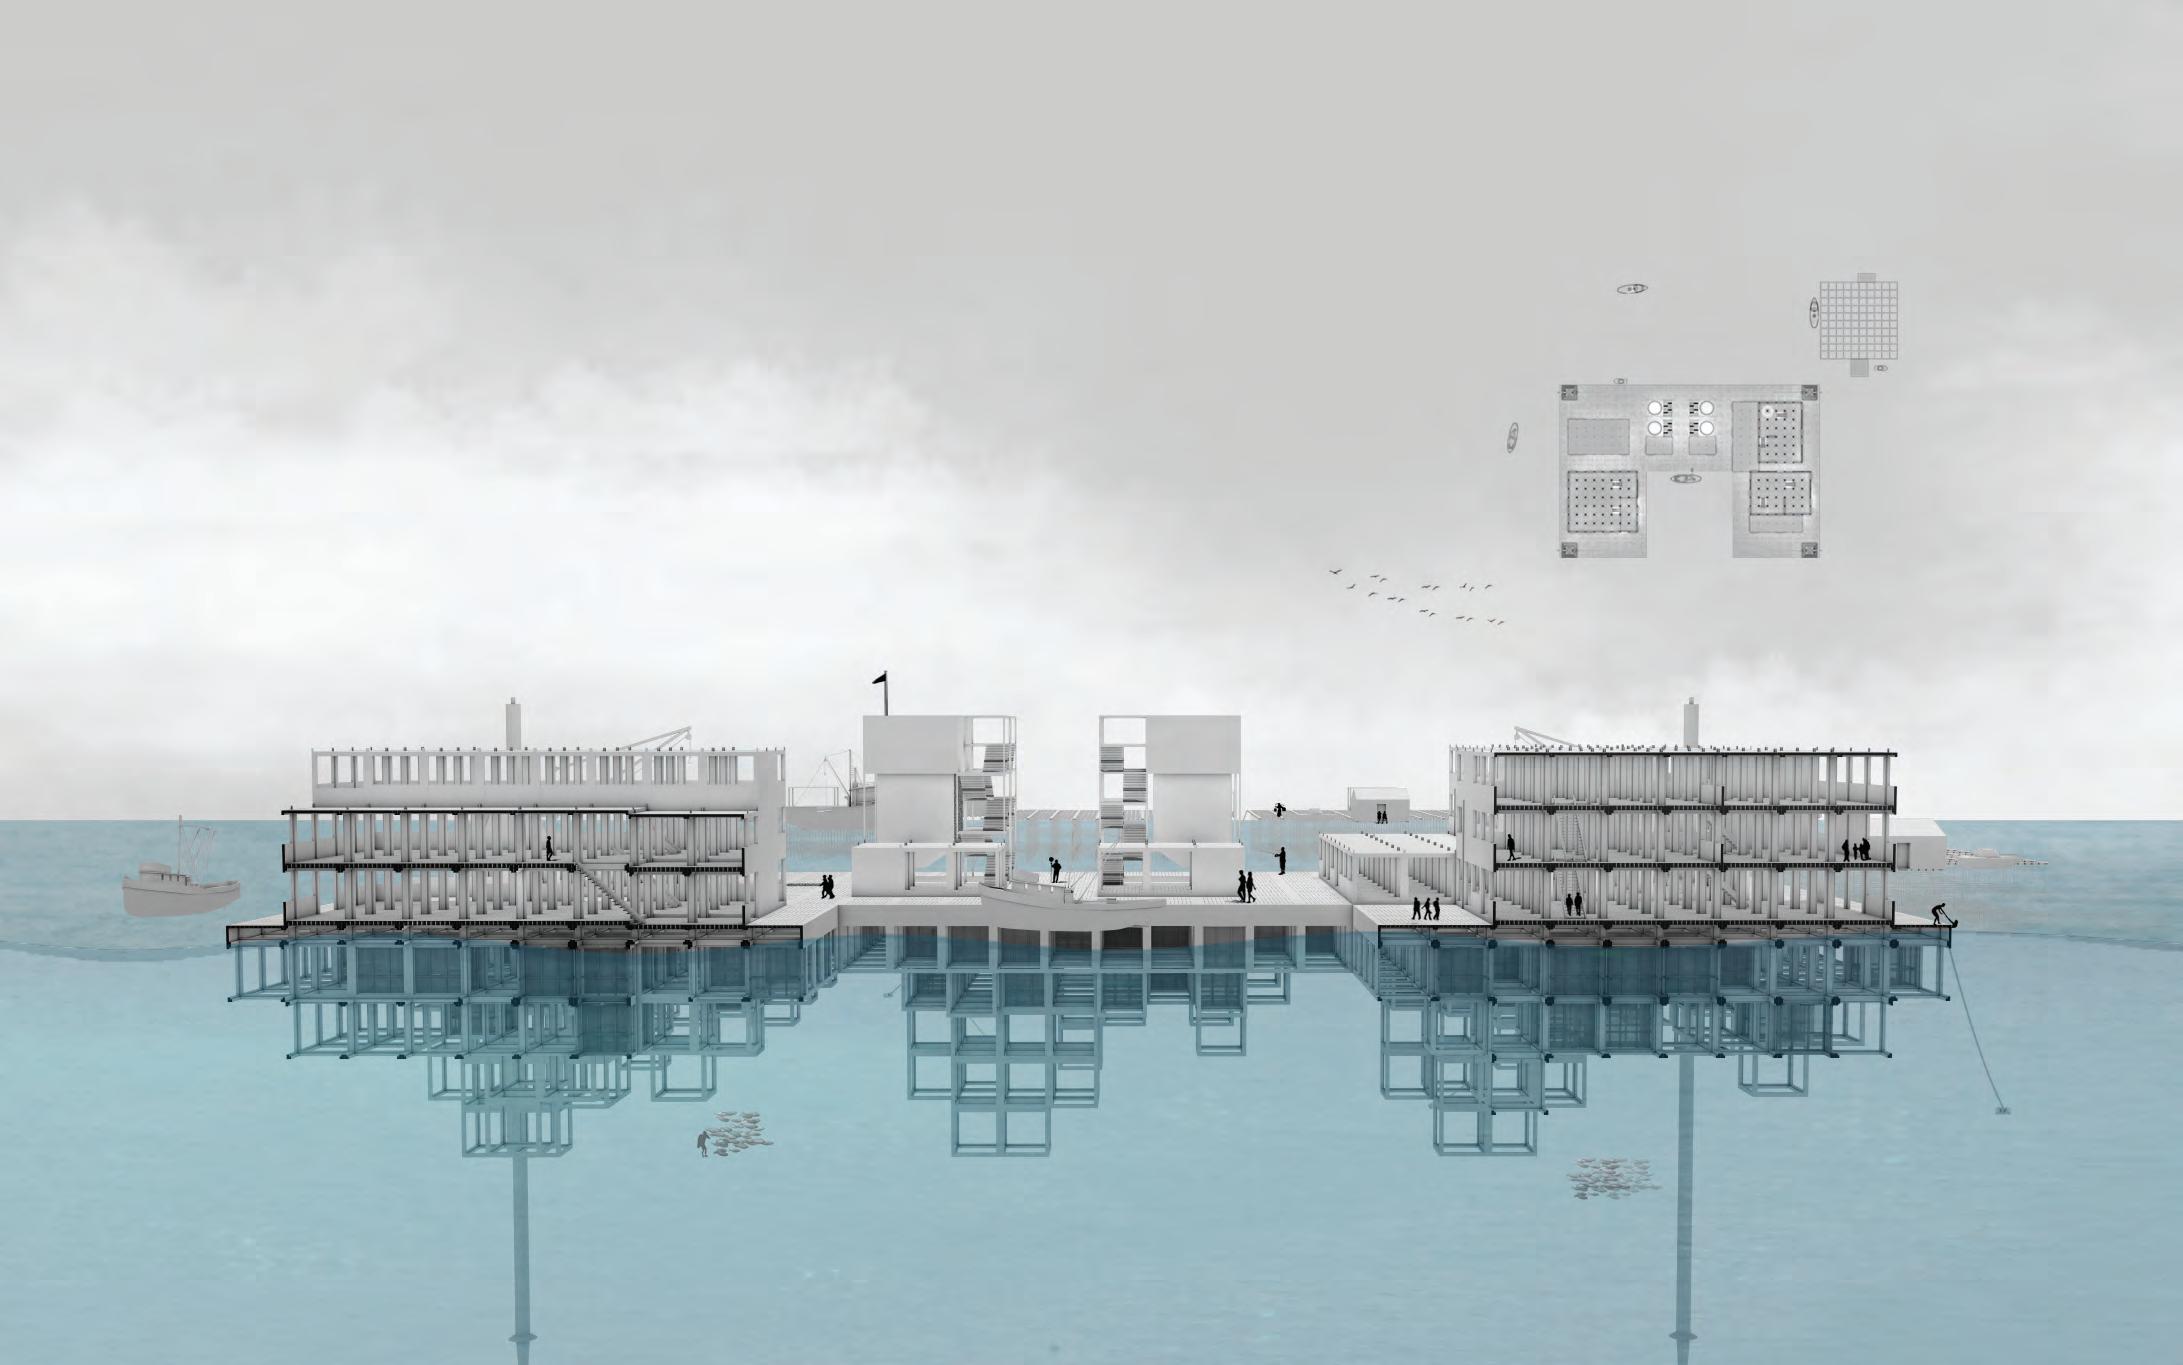
12 0 -5 -30 (m)
Fish food storage
Fish boat size: 12 x 5m
ice plant
Purification tank
fresh water Preparation area Fishery market Water storage S2
Central Node 4.1.3
The central node is the centre that has the highest centrality ratio within each cluster. It provides daily necessities to the locals and serves as a public centre for the residents. The average length of the central node is about 90 meters. The highest building on the central node is 12 meters high.

12 0 -5 -30 (m)
Fish food preparation area Retail fish food storage fish raft material Water storage
S1 30 sqm/person max: 50m depth max: 6 people Pier head Fish raft Working area Residential
Sub Node 4.1.4
90% of the floating platforms are sub nodes, it is the biggest class in the entire settlement. This type of node is mainly used by local people for living and local activities, with 12 meters high residential buildings and amenities built on it.
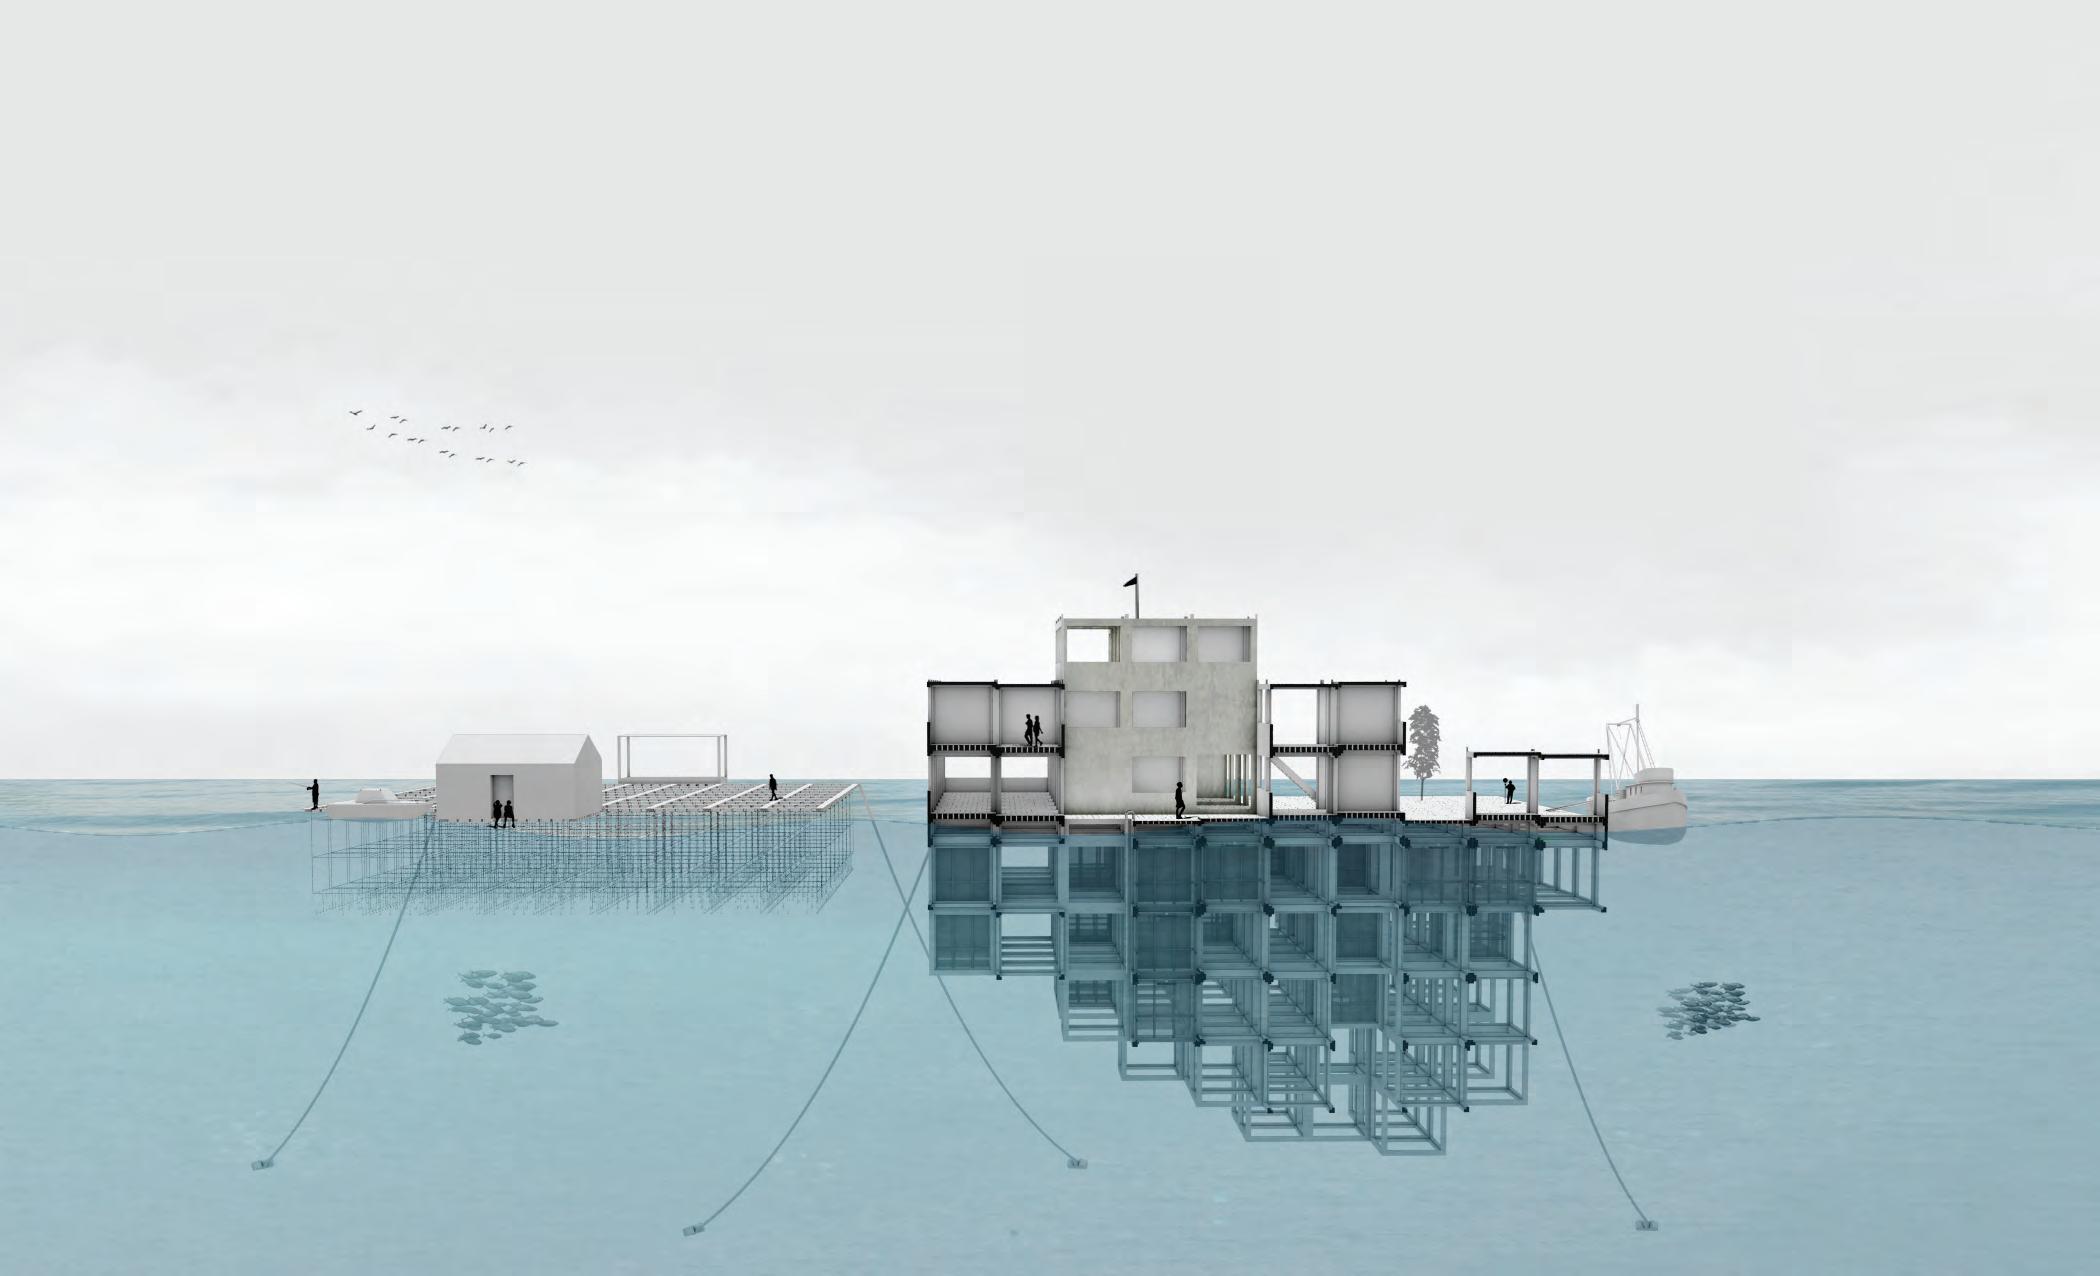
12 0 -5 5 -15 (m)
Retail
Fish raft
Residential Plaza S3
Chapter 4 l Design Development
4.2 A Day of Fisherman
4.2.1 Fish rafts and residential area on Subnode
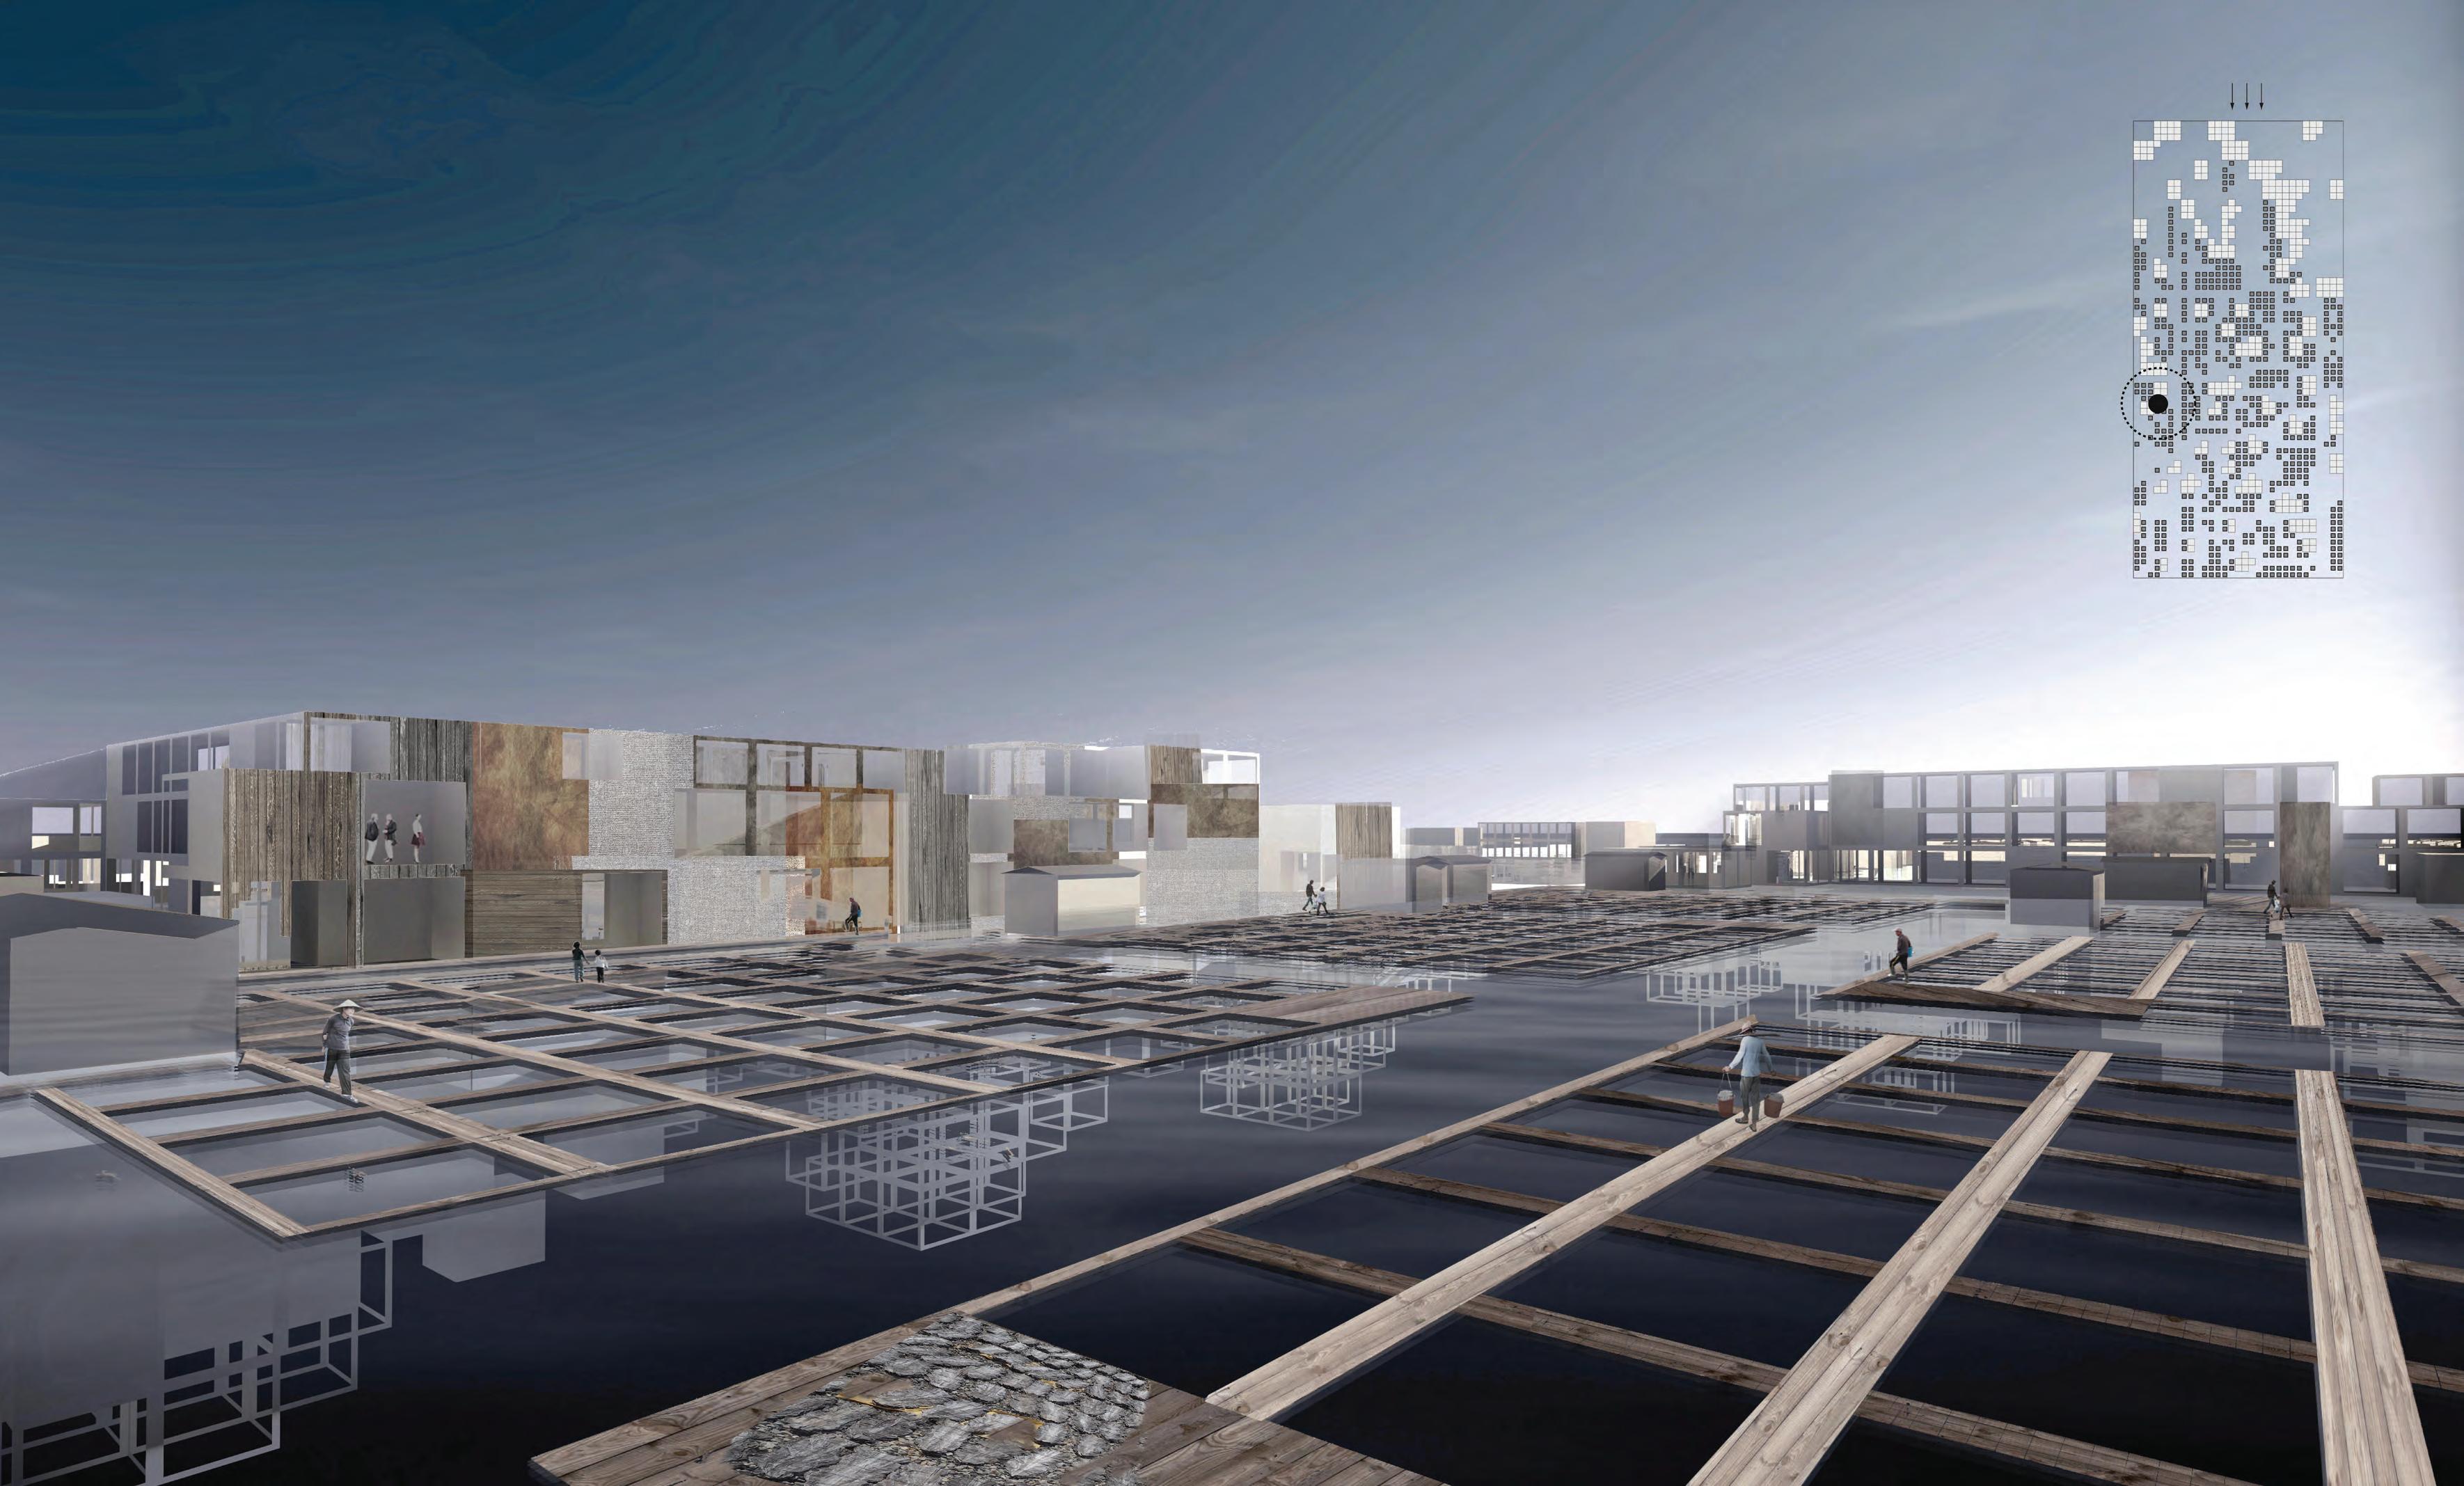
4.2.2 Main market at Edge node
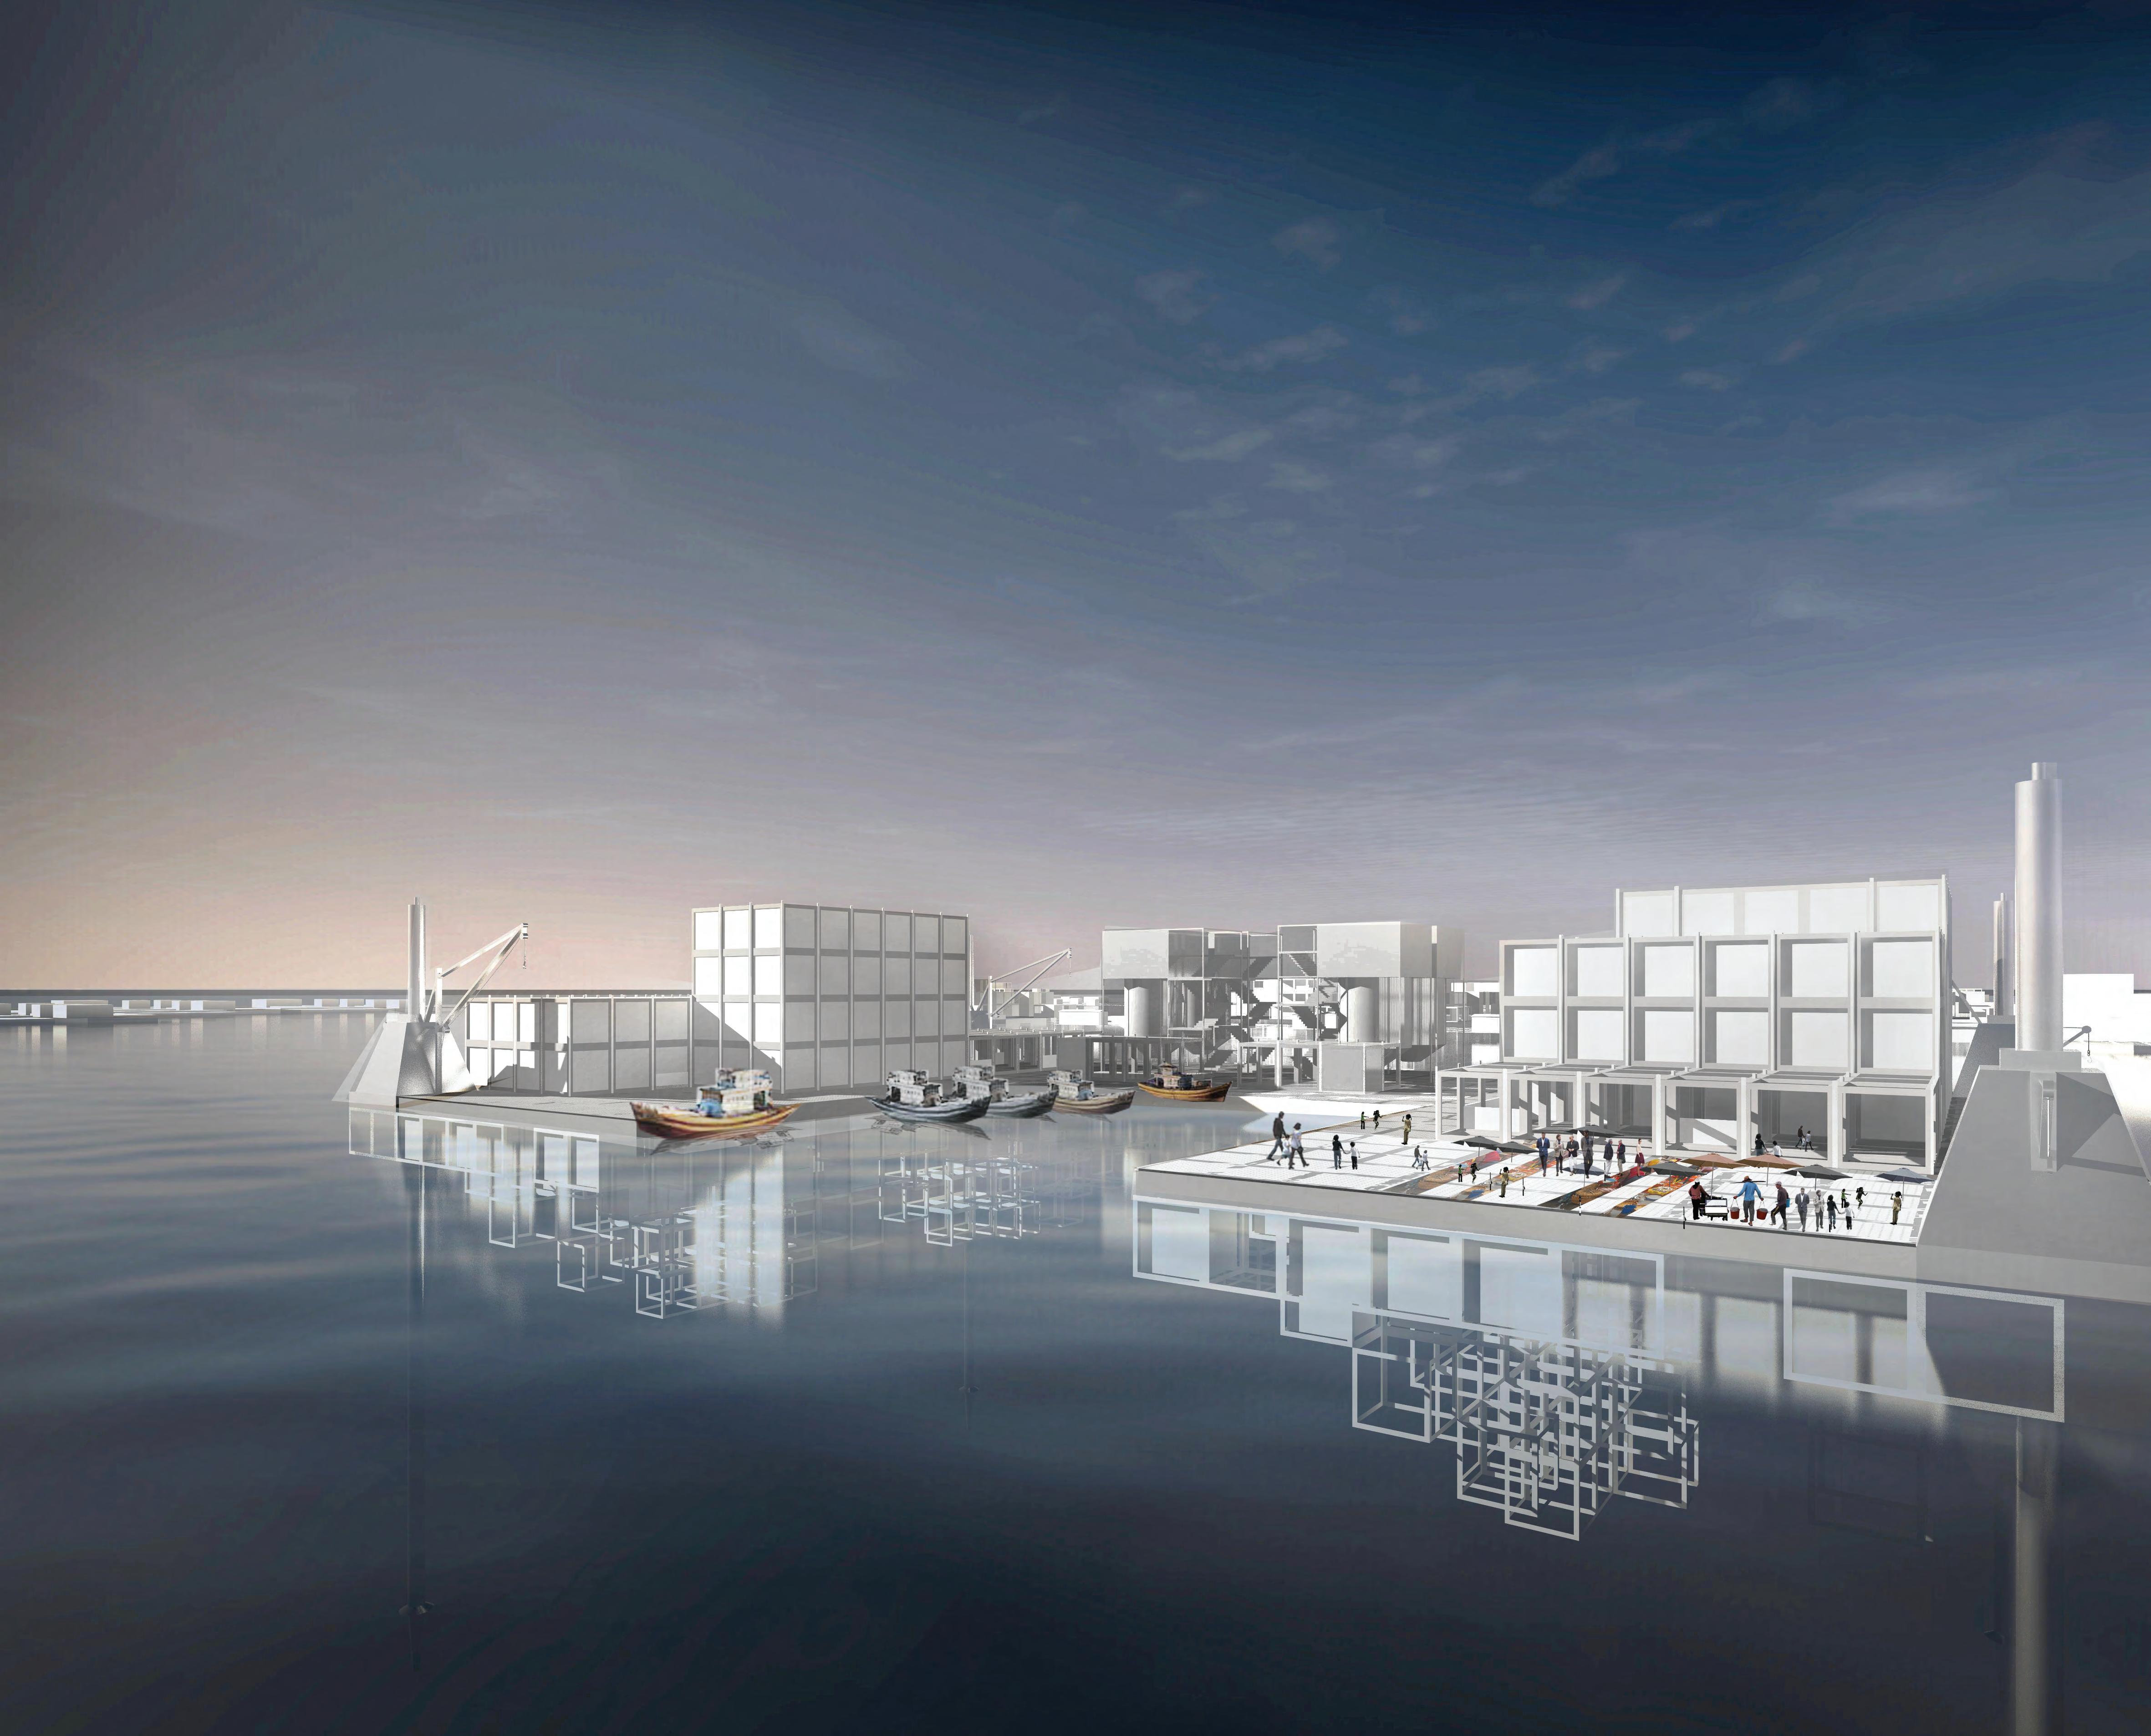
4.2.3 Main amenities and recreation area on Central node
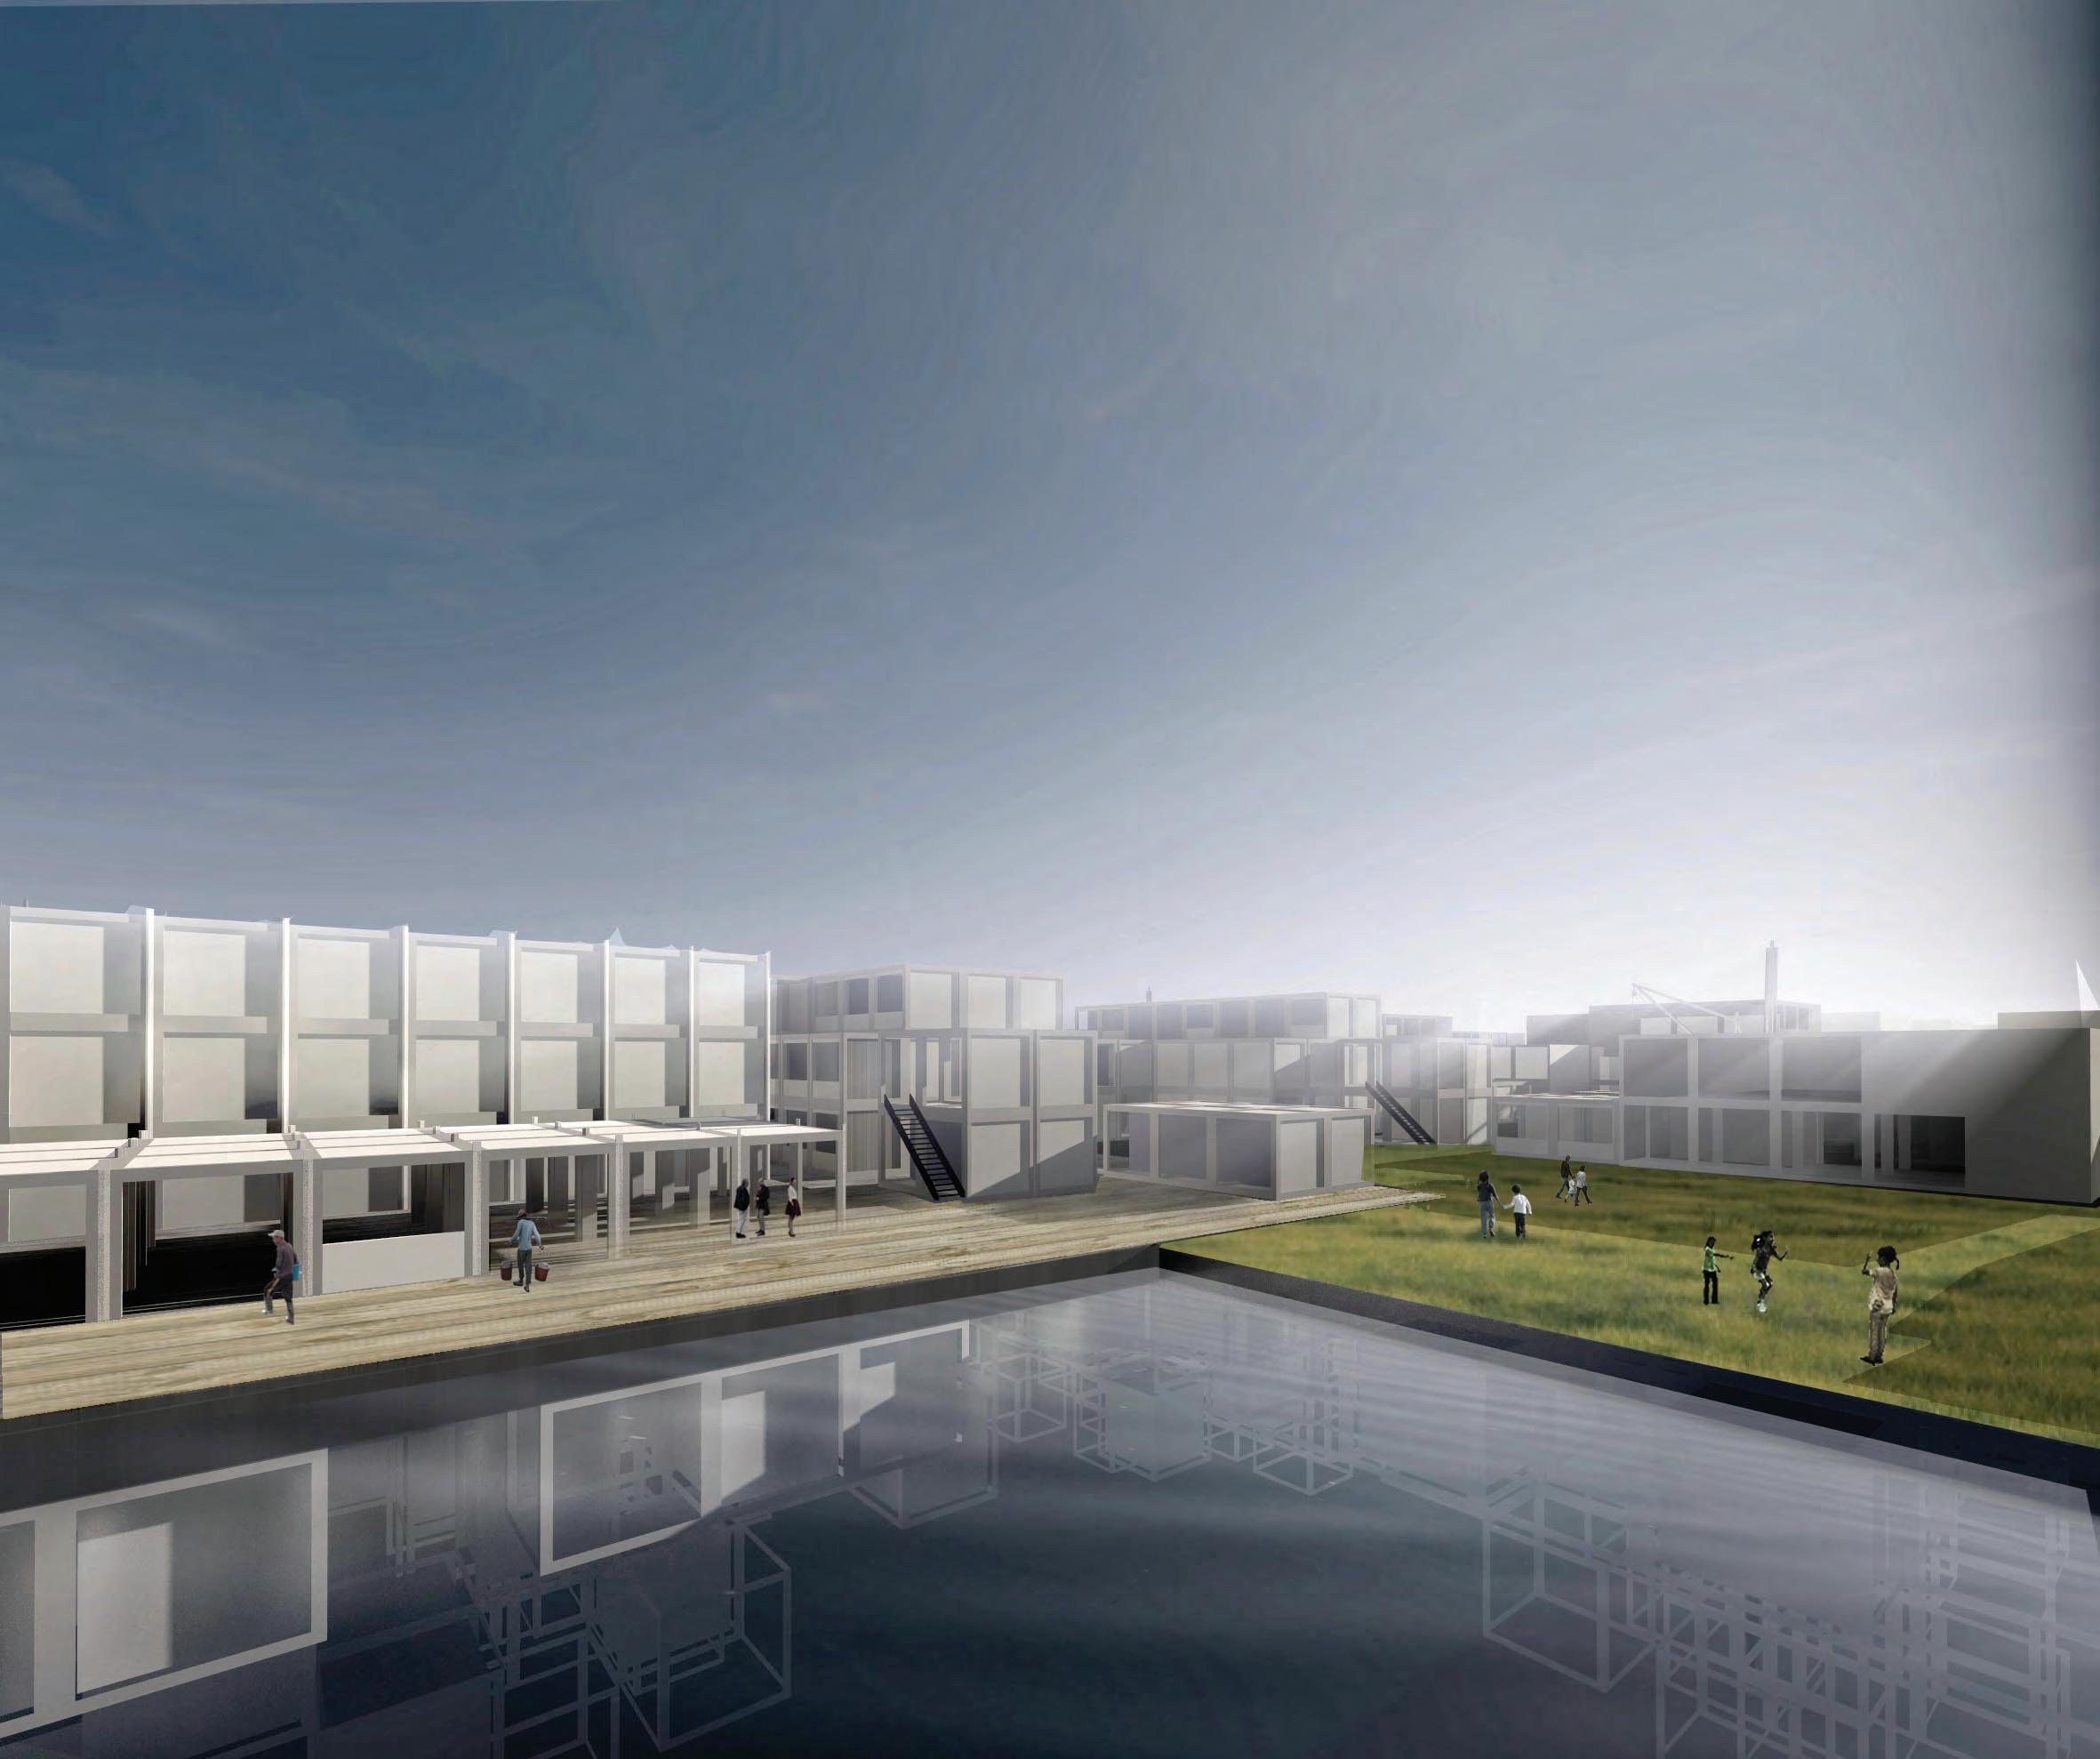
182 Adaptive Floating Settlements
5.0 Evaluation and Further Development
Comparison of Settlement Scenarios 5.1
Aquaculture dominant settlement
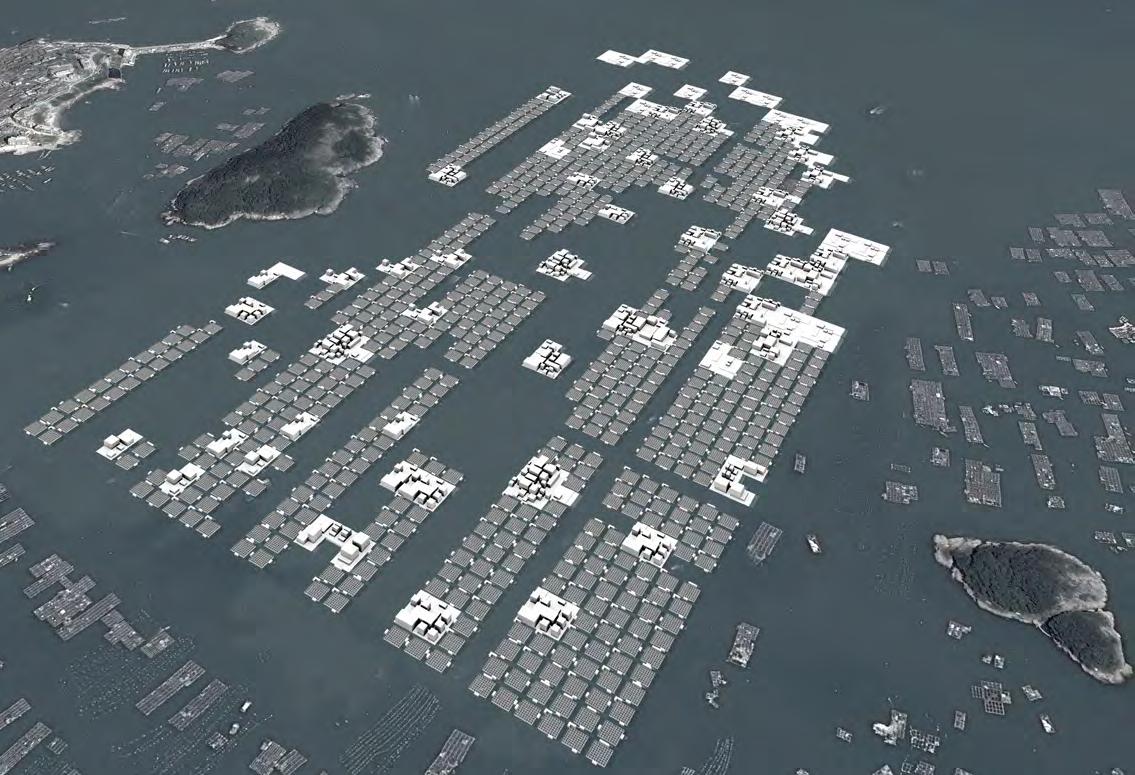
The Aquaculture dominant scenarios is the aquaculture activities based settlement with the total population of 7,000 people, 3,000 fisherman and 4,000 persons mainly supporting the aquaculture industries. The area for tourist or outsiders zone located in the middle where the wave height is below 2 meters. The total production is 9347.85 tonnes per cultivation
For social provisions, the amenities provides more areas than the target standards. Freshwater provision per person per day is 83.712 litre during cultivation, higher than the other scenarios since the aquaculture activities needs more percentage of water usage.
The less density of this scenarios allows water flows through the aggregation of fish rafts benefits the fisheries production. The wide gap between the cluster of rafts reduces the risk of infections.
However, this scenario reaches the environmental threshold meaning that it could not occupy more density of fish rafts aggregation.
All public platforms are highly accessible for all fishrafts location benefiting the resources distributions for aquaculture logistics since the relocation of resources is more convenient.
Tourist areas are be introduced to supply a supplement for aquaculture dominant settlement and provide diversity of livelihood – key to adaptive resilience. It only occupy 6% of the site area.
184 Adaptive Floating Settlements Aquaculture dominant settlements Aerial view.
FIG. 5.1.1 Aquaculture Domianant Settlement
Permanent living settlement
The Permanent living scenarios provides residential and amenities for 16,984 people including 1,748 fisherman and 15,236 outsiders. The rearrangement of the platform provides 40% of the site area with wave height below 2 meters suitable for the permanent living, producing 5446.68 tonnes per cultivation. The reduction of cultivation area is replaced by other professions supporting the community. More contact with outsiders also gives opportunities for alternative income for locals. Although the settlement transformed to the permanent living , aquaculture is still being the activities while the settlement accommodates higher density. The community could still produces food for the locals.
In order to get achieve a high density population floating settlement, a new program morphology be introduced. It is a platform that uses half of the fish raft to transform into residential area.
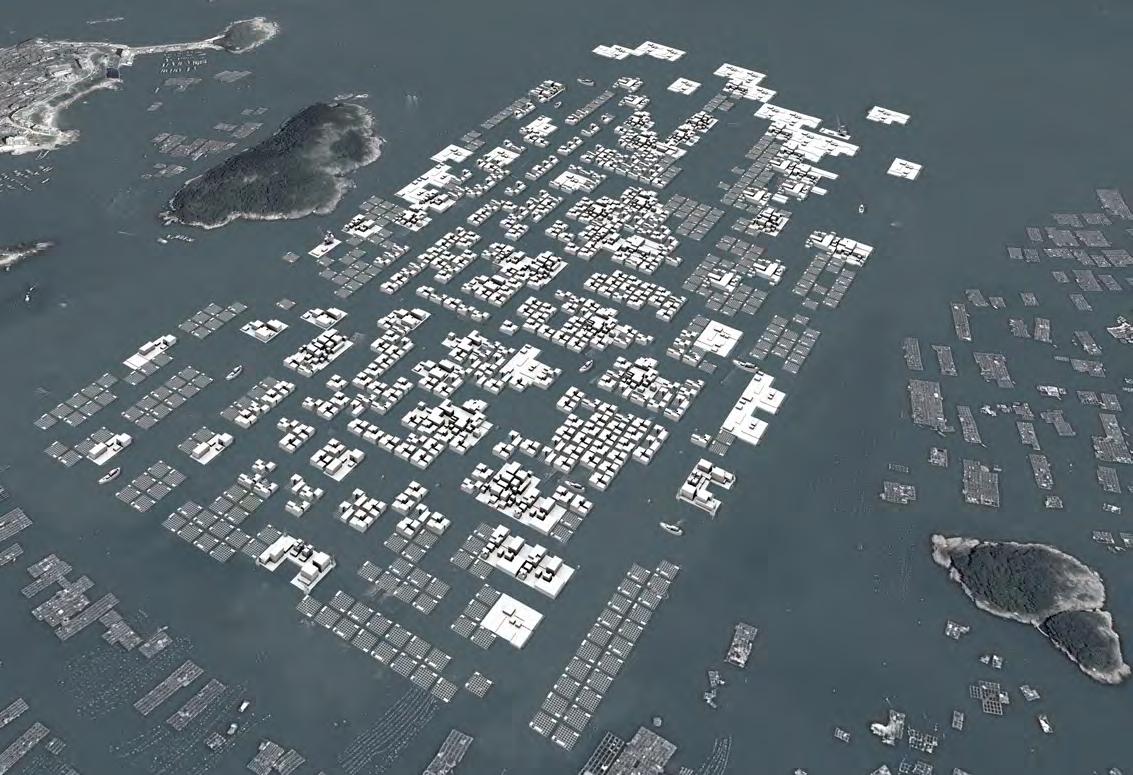
New type of fish rafts aggregated in the area where wave height is under 2 meters, closer to the center and central nodes. The residents on the new rafts could easily reach the provided amenities. The fish rafts aggregated outside of the zone but still under 2.5 meter wave height which is safe and still access to water flows.
For social provisions, the amenities provides the areas reach the target standards. Freshwater provision per person per day is 36.624 litre during cultivation, 48.985 litre per day out of cultivation period.
185
FIG. 5.1.2 Permanent Living Settlement
Permanent living settlements Aerial view.
5.2 Conclusion and limitation
The dissertation is successful in developing the in-depth integration of the wave reduction system application and the floating settlement organization in various scales.
An emergent and adaptive organizational logic for coastal floating settlement was influenced by the wider societal trend and growth of the site concerning the prospect development and social and economic demands.
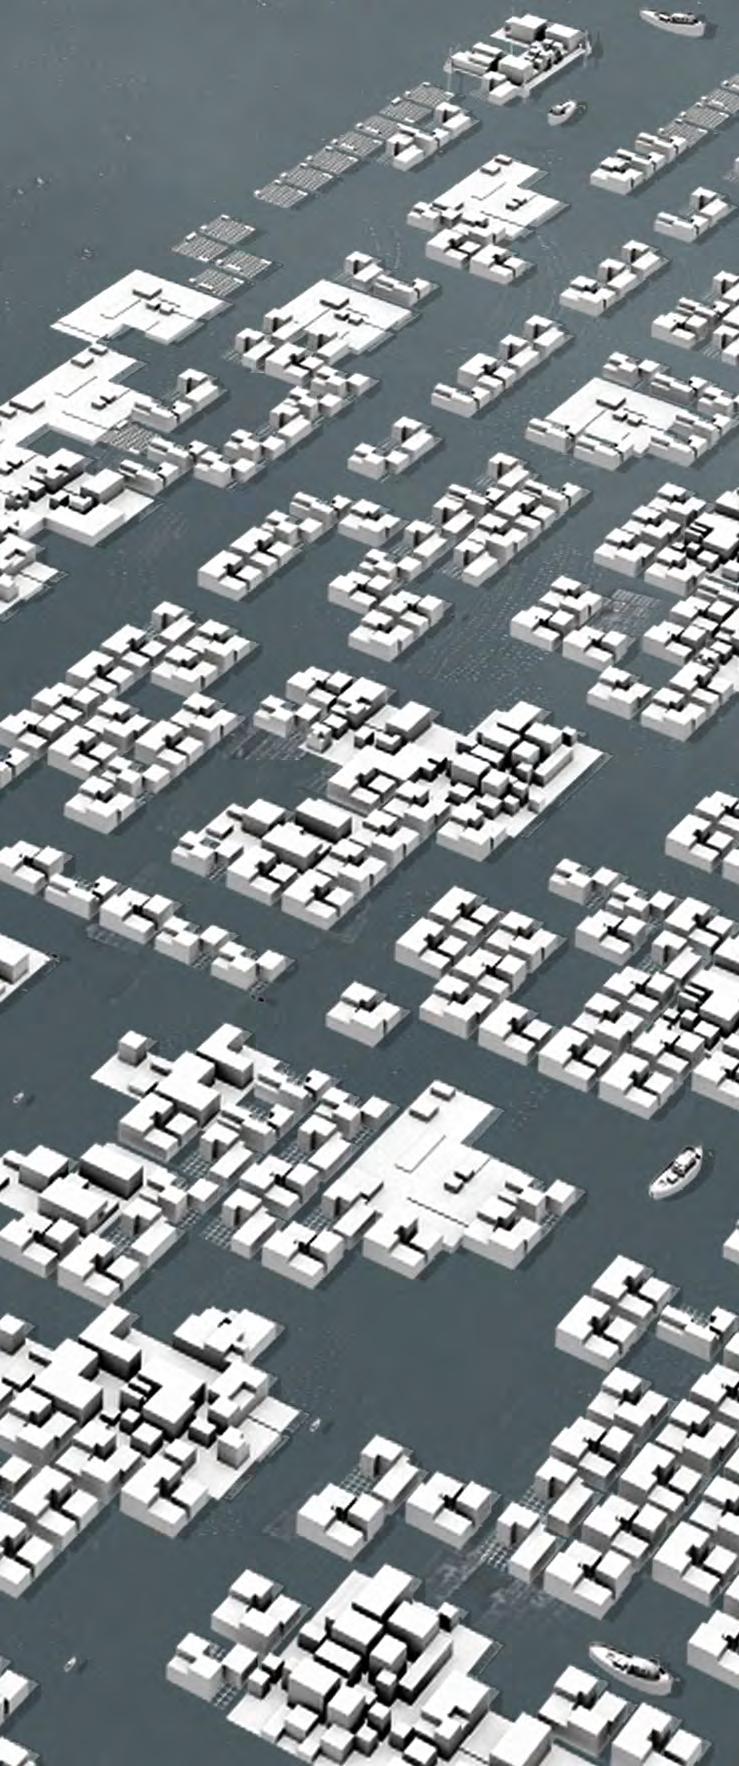
The possibility of relocating infrastructure - wave reduction pattern provides potentials to adapt to societal change than the coastal settlement on land. This potential is being emphasized through the demonstration of the aquaculture based transformation to permanent living floating settlement, proving the concept of adaptive resilient. It has been done through rearranging and aggregating of the floating public platforms to change the safe-aggregated area to accommodate higher density.
The optimized network successfully provide potential for the evenly distributed social provisions serving the specific demands of the settlement. Through contextual studies, the set of programs necessary for better aquaculture industries’ efficiency and living condition has been established and distributed through nodes. The hierarchy of nodes together with the interrelated relationship between programs on the nodes forms the efficient Aquaculture resources distribution while at the same time serves the living functions.
Social and economical related aspects has been explored and investigated, however the environmental affect of the outcome should be evaluated. The indicator for the certain density that the fish rafts should stop the aggregation could not be clearly identify since it depends on the in depth water condition research and on-site experiments.
The indicator that identifies the water condition is the amount of water movement. Since the high tide and low tide differences are 5 meters, the amount of water flows is potentially be sufficient to reduce the pollution from fish raft aggregation. Due to the field study and interview, 400 meters distance from land should not be densely aggregated since it will block the water flows. The design proposal applied this rules when indicating the site boundary.
186 Adaptive Floating Settlements
5.2 Further development
Area for improvements
- Renewable energy generation
Renewable energy generation has high potential to be developed for the settlement to be self-sufficient. Wave energy is could be integrated to the wave reduction platform The self-produce energy could reduce the dependency on land and also reduce the limitation of settlements’ expansion.
- Cultivation of different species
The Polyculture concept could solve the problems concerning the water pollution issue causing from the fish farming. The further studies of how the cultivation of different species within the system could environmentally affect the settlement. More specific requirements and environmental condition could be the input for the pattern of the wave reduction system. For example, the requirements of the water velocity.
- Manufacturing detail study
The more in-depth research on manufacturing the wave reduction system unit could potentially inform the design in more detail. It could inform the efficiency of how the local could, in reality rearrange the 3x3 units which forms up the wave reduction platform. The design is already in modular systems for the unit to be able to use for different functions . More detail study could make the architectural design of the top and submerged part more integrated. The further study on manufacturing technique could also inform the building time frame for global strategy which helps estimating more specific period for the settlement to aggregate.
- Support and maintenance of the infrastructure
More research on the financial support and maintenance strategy of the system could informs more detail of the adaptive floating settlement models. As an example, the design team considers the policy of land reclamation in China, and the significant income of the fishermen (large income lures more people to engage in aquaculture and living at the coasts). For the early stages of the settlement, the government will finance the most of the construction until the aquaculture dominant settlement is well developed. It is predicted that the fishermen can gradually afford the expenses used in the settlement expansion. The financing system between government and local community can reach a 50/50 partnership when the site is fully developed.
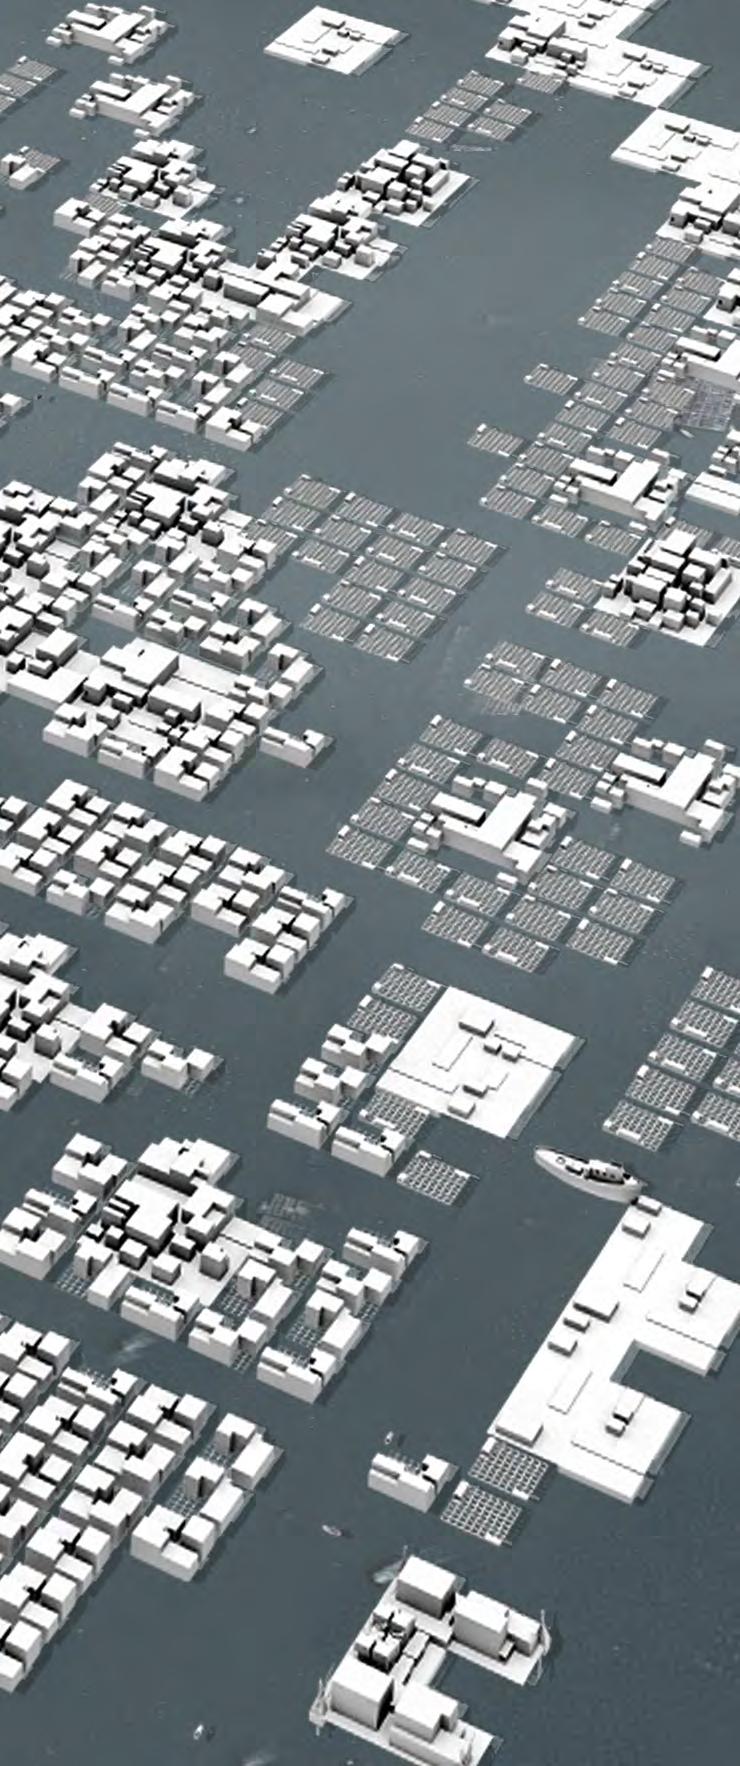
187
188 Adaptive Floating Settlements
Bibliography
Cited references and Background readings
BOOKS
• Abbas Hamrang (2014) Materials Science and Engineering. Volume I: Physical Process, Methods, and Model,CRC Press
• Gerwick, C. (2002). Construction of marine and offshore structures. CRC Press.
• Headland J.R., (1995). Floating breakwaters. In Tsinker G.P. Marine Structures Engineering: specialized applications. Chapman & Hall ed., 367-411
• Massel, S. R. (1999). Fluid mechanics for marine ecologists. Springer.
• Neumann, Gerhard, and Pierson, Willard J. Jr., (1966), Principles of Physical Oceanography: Englewood Cliffs, N.J., Prentice-Hall, Inc.
• Tsinker G.P., (1995). Marine Structures Engineering: specialized applications. Chapman & Hall
• Weinstock, M. (2010) The Architecture of Emergence: The Evolution of Form in Nature and Civilization, Wiley
• JOURNALS AND REPORTS
• Cobb, F. (2008). Structural Engineer’s Pocket Book: British Standards Edition. Elsevier.
• Creel, L. (2003). Ripple effects: Population and coastal regions (pp. 1-7). Washington, DC: Population Reference Bureau.
• Daw, T.; Adger, W.N.; Brown, K.; Badjeck, M.-C. 2009. Climate change and capture fisheries: potential impacts, adaptation and mitigation. In K. Cochrane, C. De Young, D. Soto and T. Bahri (eds). Climate change implications for fisheries and aquaculture: overview of current scientific knowledge. FAO Fisheries and Aquaculture Technical Paper. No. 530. Rome, FAO. pp.107-150.
• Energy and Climate Outlook 2014, Massachusetts Institute of Technology http://globalchange.mit.edu/research/ publications/other/special/2014Outlook Accessed May 25, 2015, 1:37am
• FAO Fisheries and Aquaculture Circular No. 1088 CLIMATE CHANGE ADAPTATION IN FISHERIES AND AQUACULTURE
• FAO, F. (2012). The state of world fisheries and aquaculture.
• Global Environment Outlook 4: Summary for Decision Makers
• Harman, B. P., Heyenga, S., Taylor, B. M., & Fletcher, C. S. (2013). Global lessons for adapting coastal communities to protect against storm surge inundation. Journal of Coastal Research.
• Hishamunda, N.; Bueno, P.B.; Ridler, N.; Yap, W.G. Analysis of aquaculture development in Southeast Asia: a policy perspective. FAO Fisheries and Aquaculture Technical Paper. No. 509. Rome, FAO. 2009. 69p.
• IPCC, 2014: Climate Change 2014: Impacts, Adaptation, and Vulnerability. Part A: Global and Sectoral Aspects. Contribution of Working Group II to the Fifth Assessment Report of the Intergovernmental Panel on Climate Change [Field, C.B., V.R. Barros, D.J. Dokken, K.J. Mach, M.D. Mastrandrea, T.E. Bilir, M. Chatterjee, K.L. Ebi, Y.O. Estrada, R.C. Genova, B. Girma,
E.S. Kissel, A.N. Levy, S. MacCracken, P.R. Mastrandrea, and L.L.White (eds.)]. Cambridge University Press, Cambridge, United Kingdom and New York, NY, USA, 1132
• Msangi, S., Kobayashi, M., Batka, M., Vannuccini, S., Dey, M. M., & Anderson, J. L. (2013). Fish to 2030: Prospects for Fisheries and Aquaculture. World Bank Report, (83177-GLB).
• Noble, I.R., S. Huq, Y.A. Anokhin, J. Carmin, D. Goudou, F.P. Lansigan, B. Osman-Elasha, and A. Villamizar, 2014: Adaptation needs and options. In: Climate Change 2014: Impacts, Adaptation, and Vulnerability. Part A: Global and Sectoral Aspects. Contribution of Working Group II to the Fifth Assessment Report of the Intergovernmental Panel on Climate Change [Field, C.B., V.R. Barros, D.J. Dokken, K.J. Mach, M.D. Mastrandrea, T.E. Bilir, M. Chatterjee, K.L. Ebi, Y.O. Estrada, R.C. Genova, B. Girma, E.S. Kissel, A.N. Levy, S. MacCracken, P.R. Mastrandrea, and L.L.White (eds.)]. Cambridge University Press, Cambridge, United Kingdom and New York, NY, USA, pp. 833868.
• Nuorteva, P., Keskinen, M., & Varis, O. (2010). Water, livelihoods and climate change adaptation in the Tonle Sap Lake area, Cambodia: learning from the past to understand the future. Journal of Water and Climate Change Vol, 1(1), 87-101.
• Pender, J. (2008). Community-led adaptation in Bangladesh. Forced Migration Review, 31, 54-55.
• Porter, J.R., L. Xie, A.J. Challinor, K. Cochrane, S.M. Howden, M.M. Iqbal, D.B. Lobell, and M.I. Travasso, 2014: Food security and food production systems. In: Climate Change 2014: Impacts, Adaptation, and Vulnerability. Part A: Global and Sectoral Aspects. Contribution of Working Group II to the Fifth Assessment Report of the Intergovernmental Panel on Climate Change [Field, C.B., V.R. Barros, D.J. Dokken, K.J. Mach, M.D. Mastrandrea, T.E. Bilir, M. Chatterjee, K.L. Ebi, Y.O. Estrada, R.C. Genova, B. Girma, E.S. Kissel, A.N. Levy, S. MacCracken, P.R. Mastrandrea, and L.L.White (eds.)]. Cambridge University Press, Cambridge, United Kingdom and New York, NY, USA, pp. 485533.
• Ross, L. G., Telfer, T. C., Falconer, L., Soto, D., & Aguilar-Majarrez, J. (2013). Site selection and carrying capacities for inland and coastal aquaculture. FAO.
• Weisstein, E. W. (2002). Cellular automaton
Coastal Biological Systems
• Barbier, E. B., Koch, E. W., Silliman, B. R., Hacker, S. D., Wolanski, E., Primavera, J., ... & Reed, D. J. (2008). Coastal ecosystembased management with nonlinear ecological functions and values. science, 319(5861), 321-323.
• Broadhead, J., & Leslie, R. (2007). Coastal protection in the aftermath of the Indian Ocean tsunami: What role for forests and trees?. Rap publication, 07.
• Chindapol, N., Kaandorp, J. A., Cronemberger, C., Mass, T., & Genin, A. (2013). Modelling growth and form of the scleractinian
190 Adaptive Floating Settlements
coral Pocillopora verrucosa and the influence of hydrodynamics. PLOS Comput. Biol, 9(1), 1-15.
• Ferrario, F., Beck, M. W., Storlazzi, C. D., Micheli, F., Shepard, C. C., & Airoldi, L. (2014). The effectiveness of coral reefs for coastal hazard risk reduction and adaptation. Nature communications, 5.
• Koch, E. W., Barbier, E. B., Silliman, B. R., Reed, D. J., Perillo, G. M., Hacker, S. D., & Wolanski, E. (2009). Non-linearity in ecosystem services: temporal and spatial variability in coastal protection. Frontiers in Ecology and the Environment, 7(1), 29-37.
• Koehl, M. A. R. (1984). How do benthic organisms withstand moving water?. American Zoologist, 24(1), 57-70.
• Latief, H. and Hadi, S. (2007). Chapter 1 – Protection from Tsunamis in Broadhead, J., & Leslie, R. (2007). Coastal protection in the aftermath of the Indian Ocean tsunami: What role for forests and trees?. Rap publication, 07.
Man-made Coastal Structures
• Armono, H. D. (2004). Artificial reefs as shoreline protection structures. InPaper ofr Seminar of Teori dan Aplikasi Teknologi Kelautan IV, Surabaya.
• Arnouil, D. S. (2008). Shoreline Response for a Reef Ball TM Submerged Breakwater System Offshore of Grand Cayman Island (Doctoral dissertation, Florida Institute of Technology).
• Brock, R. E., & Norris, J. E. (1989). An analysis of the efficacy of four artificial reef designs in tropical waters. Bulletin of Marine Science, 44(2), 934-941.
• Cheng, L. H., Fen, C. Y., Li, Y. H., & Jiang, W. Y. (2013). Experimental study on a new type floating breakwater.
• d’Angremond, K., Van Der Meer, J. W., & De Jong, R. J. (1996). Wave transmission at low-crested structures. Coastal Engineering Proceedings,1(25).
• Dong, G. H., Zheng, Y. N., Li, Y. C., Teng, B., Guan, C. T., & Lin, D. F. (2008). Experiments on wave transmission coefficients of floating breakwaters. Ocean Engineering, 35(8), 931-938.
• Elchahal, G., Younes, R., & Lafon, P. (2009). Parametrical and Motion Analysis of a Moored Rectangular Floating Breakwater. Journal of Offshore Mechanics and Arctic Engineering, 131(3), 031303.
• Harris, L. E. (2003, June). Artificial reef structures for shoreline stabilization and habitat enhancement. In Proceedings of the 3rd International Surfing Reef Symposium (pp. 176-178).
• Harris, L. E. (2009). Artificial reefs for ecosystem restoration and coastal erosion protection with aquaculture and recreational amenities. Reef Journal,1(1), 235-246.
• Pena, E., Ferreras, J., & Sanchez-Tembleque, F. (2011). Experimental study on wave transmission coefficient, mooring lines and module connector forces with different designs of floating breakwaters. Ocean engineering, 38(10), 1150-1160.
• Ruol, P., Martinelli, L., & Pezzutto, P. (2012). Formula to predict transmission for π-Type floating breakwaters. Journal of Waterway, Port, Coastal, and Ocean Engineering, 139(1), 1-8.
• Seabrook, S. R., & Hall, K. R. (1998). Wave transmission at submerged rubblemound breakwaters. Coastal Engineering Proceedings, 1(26).
• Sollitt, C. K., & Cross, R. H. (1972). Wave transmission through permeable breakwaters. Coastal Engineering Proceedings, 1(13).
WEB REFERENCES
• https://www.ipcc.ch/ [Accessed August 15, 2015]
• Chapter 7 – Breakwaters http://news.mongabay.com/2014/12/ reefs-reduce-97-percent-of-wave-energy-could-be-better-thanartificial-barriers/ [Accessed, May 13, 2015]
• http://oceanservice.noaa.gov/[Accessed, June 2, 2015]
• What is Aquaculture? (http://www.nmfs.noaa.gov/aquaculture/ what_is_aquaculture.html), [accessed August 19, 2015, 11:05am]
• World inventory of fisheries. Impact of aquaculture on environment. Issues Fact Sheets. Text by Uwe Barg. In: FAO Fisheries and Aquaculture Department [online]. Rome. Updated 27 May 2005. [Cited 25 August 2015]. © FAO 2005-2015. http:// www.fao.org/fishery/topic/14894/en
• www.fao.org/docrep/013/i1883e/i1883e07.pdf
• www.unep.org/geo/geo4/media/GEO4-20SDM_launch.pdf [Accessed May 15, 2015, 5:25pm]
• http://natures-water.com/education_information/edible_ plants/
• http://data.worldbank.org/indicator/AG.LND.ARBL.ZS
• http://www.un.org/waterforlifedecade/pdf/human_right_to_ water_and_sanitation_media_brief.pdf
• http://www.fao.org/docrep/013/i1883e/i1883e.pdf
• http://www.fao.org/docrep/003/p3407e/p3407e13.htm
191 Bibliography
192 Adaptive Floating Settlements
193 Appendix
Diagram
Fujian,China
Fujian Province
Land Area: 124,000 km2
Sea Area: 136,000 km2
(the longest coastline of China)
The
is
High way
Rail way
Primary road
Primary road Site
194 Adaptive Floating Settlements
Appendix
shows the relationship between land area and sea area. It has the longest coastline of China with thriving aquaculture activity
Above Below
chosen site
on the edge of the Lianjian County. Diagram illustrates the certain transportation way.
FIG. 1. Data of Fujian Province
FIG. 2 Transportation Condition at the Lianjiang County
05 15km
Ankai Kengyuan Guanban Huangqi
195 Above Below
Diagram illustrates the amount of fishermen in Fujian and the significant output of the aquacultrure products.
Figure demonstrates the four main culture species at the site and with a specific culture schedule.
FIG. 3. Data of Fishery Output in Fujian Province
Fujian Aquaculture products Fishing products 532 260 100 Fishermen Overall population/ fishermen fishery output 2008 2015 600 63 50 26 73 (population in thousands) (%/y) Yellow croaker fish (1.5 years) (0.6 years) (3 years) (1 years) Abalone Typhoon Season Sea Cucumber Kelp JAN FEB MAR APR MAY JUN JUL AUG SEP OCT NOV DEC
FIG. 4 Culture Species at the site
Main public node types morphologies results
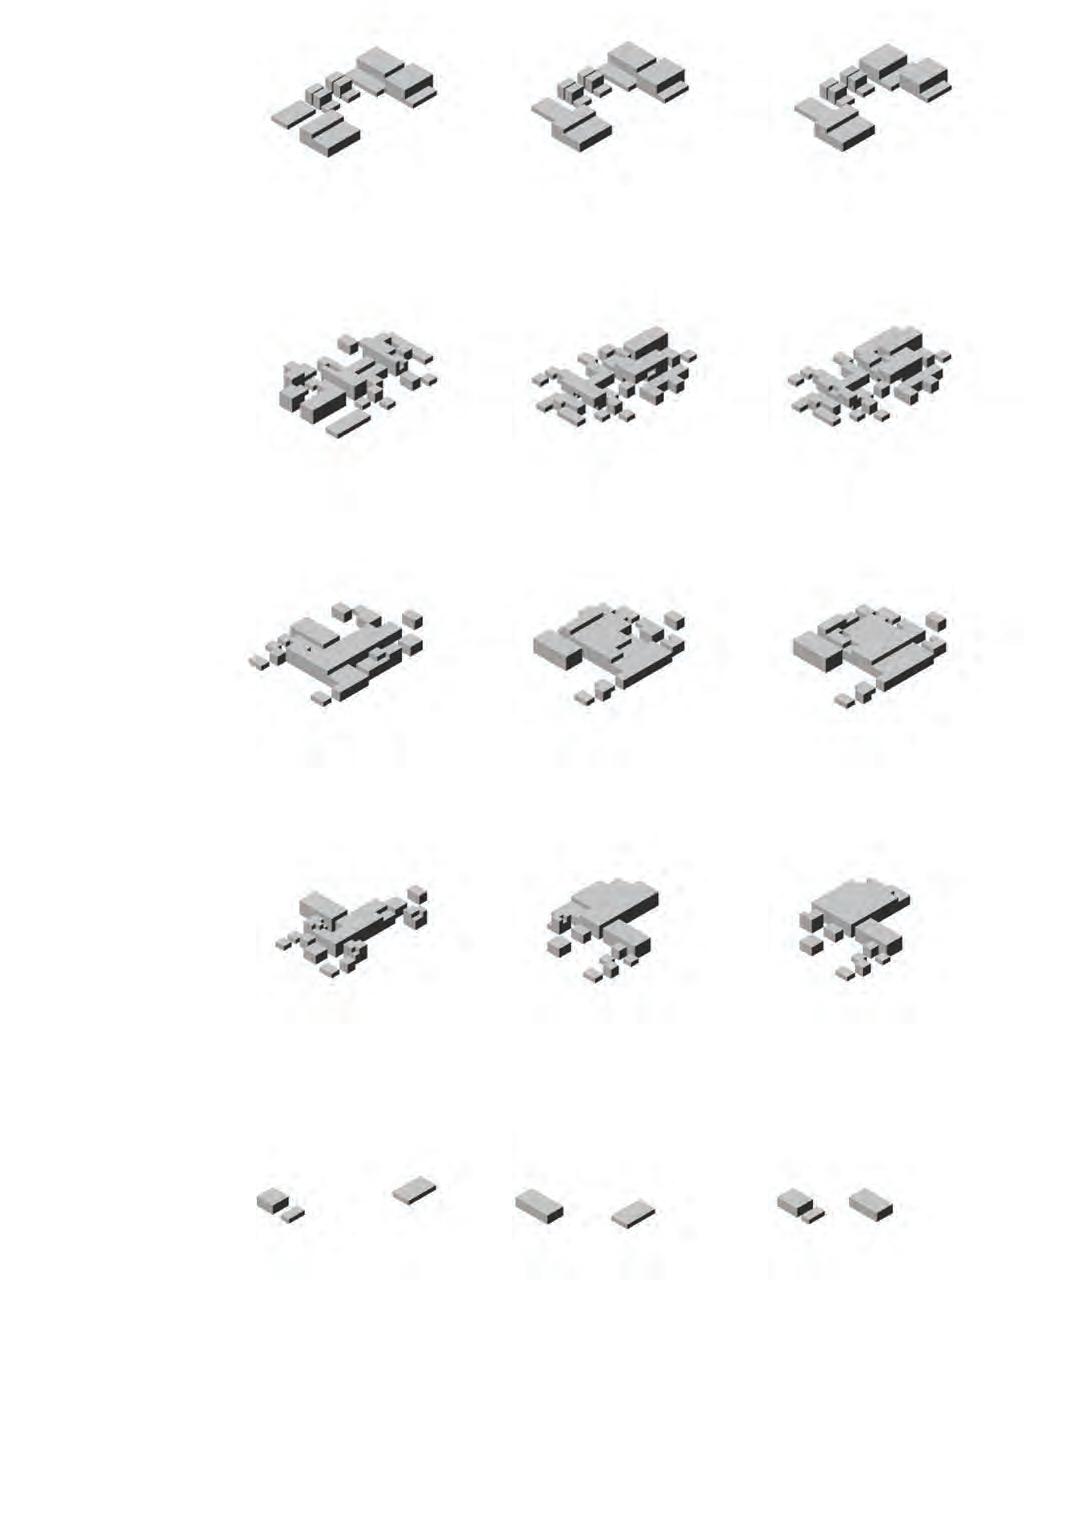
196 Adaptive Floating Settlements Appendix G1. 8 3726 513926.0535 711 G1. 5 3676.470 503088.2641 819 G15. 49 4365 493535.5870 738 G15. 28 4014 497699.5587 711 G15. 18 4048 493129.3331 729 G35.5 4356 490768.0757 738 G35. 18 4149.377 498237 702 G35. 14 3933 486719.9306 747 Min. solar radiation ( Kwh ) Min. wind exposed area ( m2 ) Max. building area ( m2 ) Min. solar radiation ( Kwh ) Min. wind exposed area ( m2 ) Max. building area ( m2 ) Min. solar radiation ( Kwh ) Min. wind exposed area ( m2 ) Max. building area ( m2 ) G1. 2 3787.8787 507855.0425 765 G35.5 4356 490768.0757 738 G35. 18 4149.377 498237 702 G35. 14 3933 486719.9306 747 G35.5 4356 490768.0757 738 G35. 18 4149.377 498237 702 G35. 14 3933 486719.9306 747 Min. solar radiation ( Kwh ) Min. wind exposed area ( m2 ) Max. building area ( m2 ) Min. solar radiation ( Kwh ) Min. wind exposed area ( m2 ) Max. building area ( m2 )
The diagrams illustrate optimized morphology results of all main node types.
FIG. 5 Optimized nodes morphology
Morphologies evaluation criteria
The diagrams illustrating the optimized results emphasizing on Building solar radiation objectives. Morphologies tend to cluster in the middle of the platform with plazas on East and West.

results
The diagrams illustrating the optimized results emphasizing on Predominant wind exposed area objectives. Morphologies tend to reduces the building envelopes facing south and west.
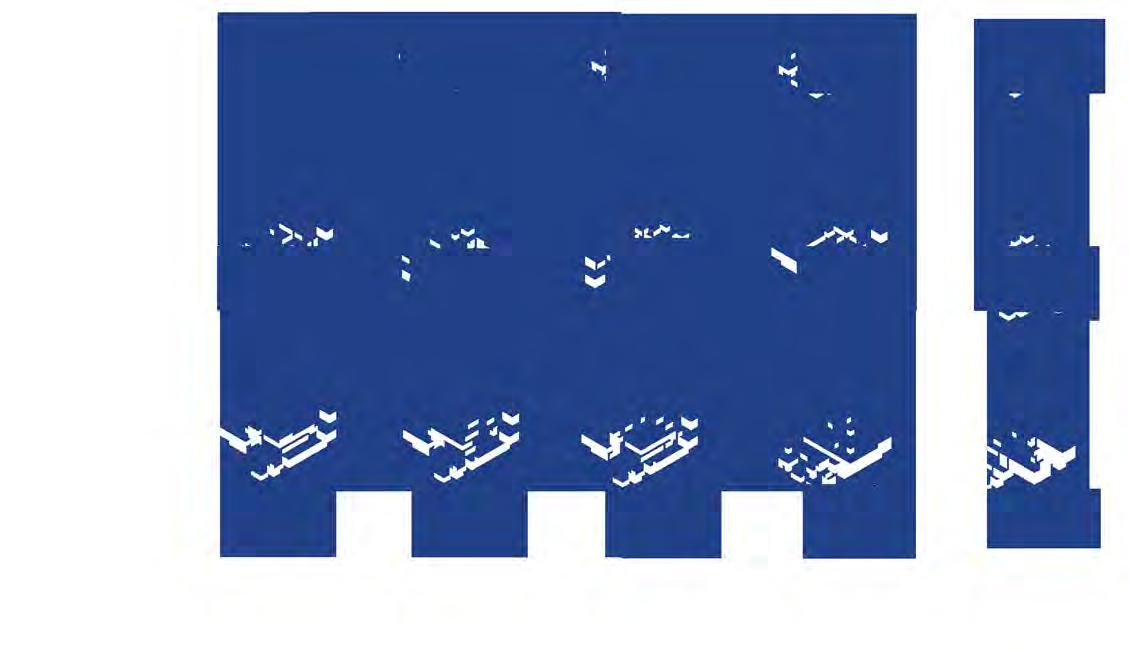
197 Min. solar radiation ( Kwh ) Min. wind exposed area ( m2 ) Max. building area ( m2 ) Min. solar radiation ( Kwh ) Min. wind exposed area ( m2 ) Max. building area ( m2 ) Min. solar radiation ( Kwh ) Min. wind exposed area ( m2 ) Max. building area ( m2 ) G1. 2 3787.8787 507855.0425 765 G1. 6 3798 536562.8583 828
Above
FIG. 6 Min. Building solar radiation optimized morphology results
Below
FIG. 7 Min. Predominant wind exposed area optimized morphology
FIG. 8 Wave reduction platform optimized morphologies
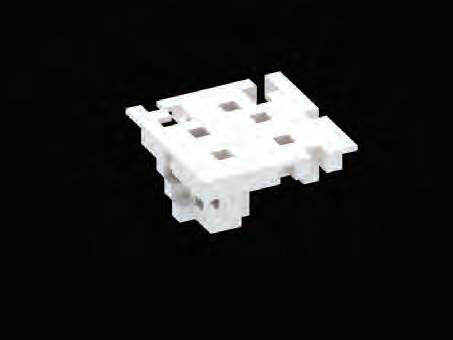
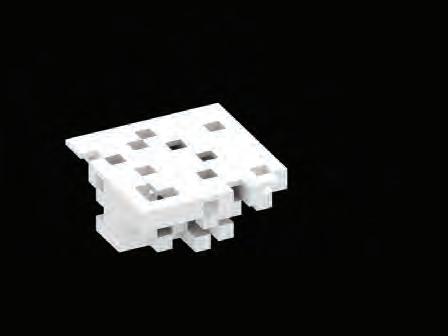
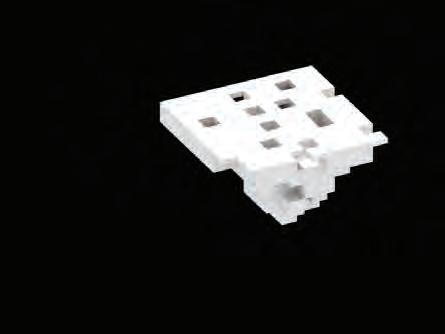
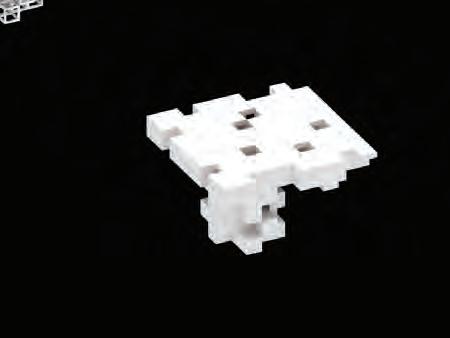
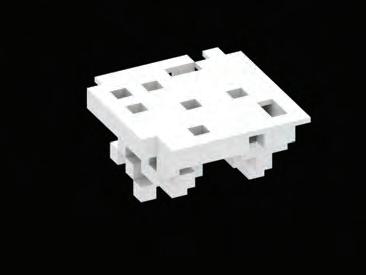
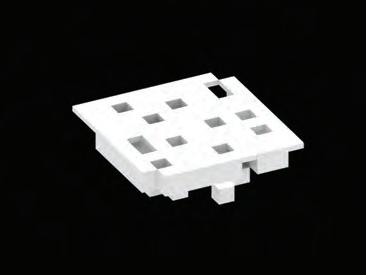
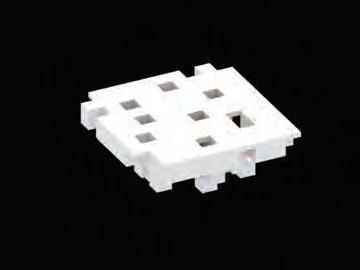
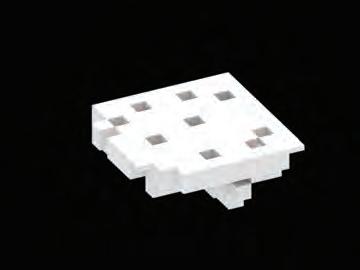
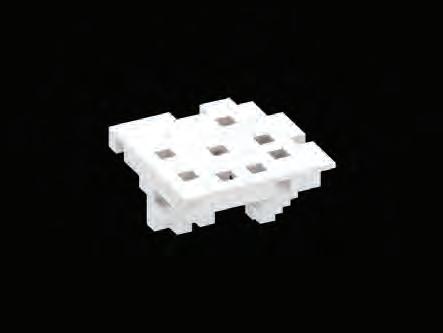
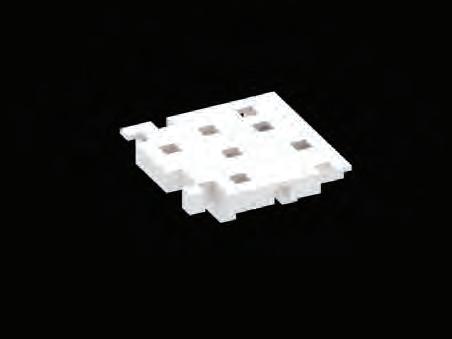
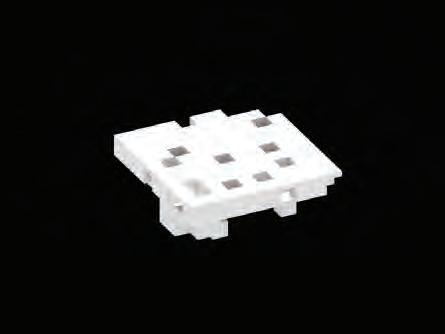
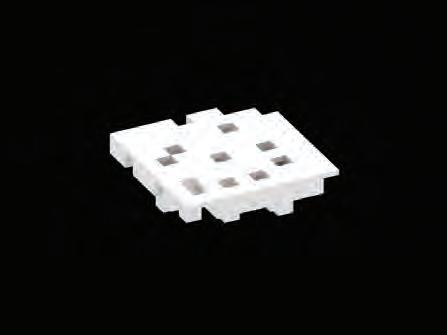
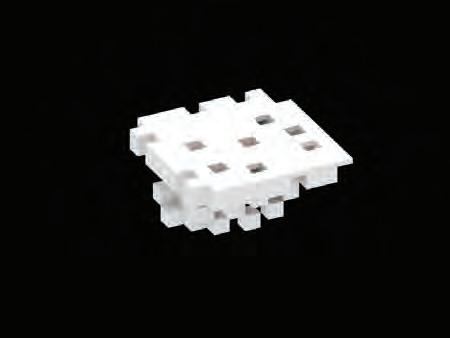
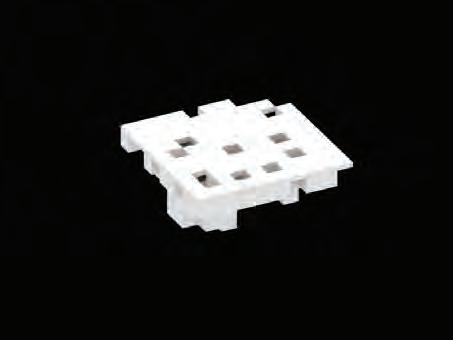
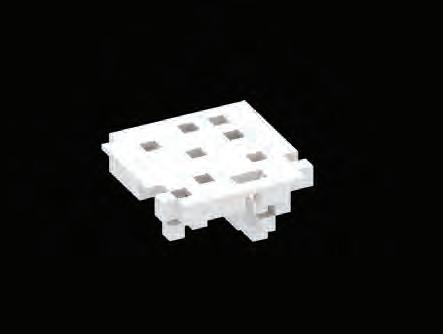
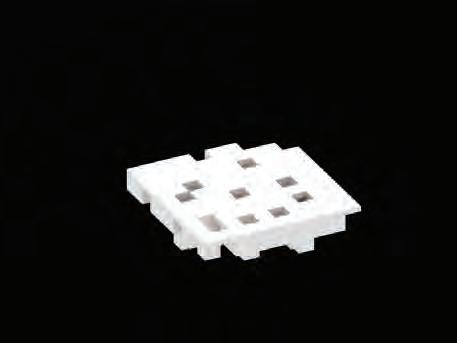
Morhology results of G1,G14,G20 and G40 and the chosen morphologies with differentiated depth.
Chosen morphologies with differentiated depth
198 Adaptive Floating Settlements
Surface Area (m2) : Average Deformation (m) : 3708 0.076 4374 0.079 4752 0.093 3744 0.102 Surface Area (m2) : Average Deformation (m) : Total Volume (m3) : Surface Area (m2) : Average Deformation (m) : Surface Area (m2) : Average Deformation (m) : 3483 3582 0.044 3888 3798 0.053 2997 2880 0.051 3834 3798 0.054 3483 3582 0.044 3726 3618 0.048 3888 3798 0.053 3780 3744 0.054 3186 3168 0.034 3348 3474 0.041 3591 3510 0.044 3861 3744 0.045 Total Volume (m3) : Surface Area (m2) : Average Deformation (m) : Total Volume (m3) : Surface Area (m2) : Average Deformation (m) : Total Volume (m3) : Surface Area (m2) : Average Deformation (m) : Total Volume (m3) : Surface Area (m2) : Average Deformation (m) : Total Volume (m3) : Surface Area (m2) : Average Deformation (m) : Total Volume (m3) : Surface Area (m2) : Average Deformation (m) : Total Volume (m3) : Surface Area (m2) : Average Deformation (m) : Total Volume (m3) : Surface Area (m2) : Average Deformation (m) : Total Volume (m3) : Surface Area (m2) : Average Deformation (m) : Total Volume (m3) : Surface Area (m2) : Average Deformation (m) : Total Volume (m3) : Surface Area (m2) : Average Deformation (m) : Total Volume (m3) : Surface Area (m2) : Average Deformation (m) : G14.2 G14.1 G14.5 G14.6 G20.6 G20.1 G20.4 G20.2 G40.3 G40.4 G40.1 G40.5 G14 G20 G40
layers
layers
Appendix
5
4 layers 3
2 layers
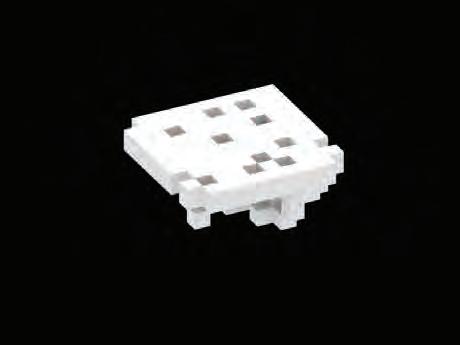
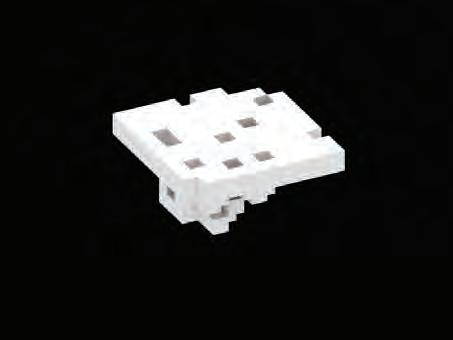
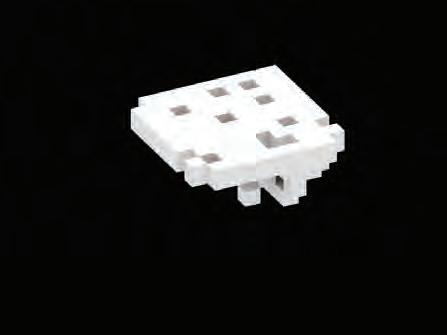
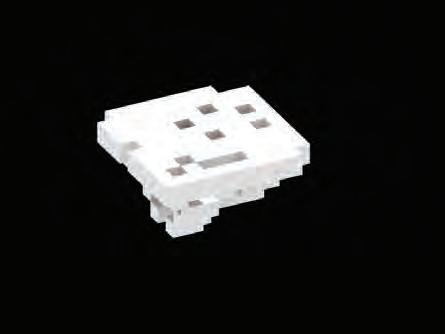
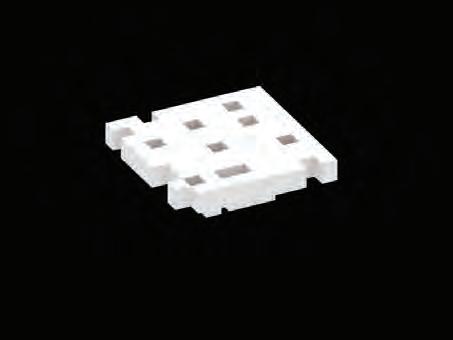
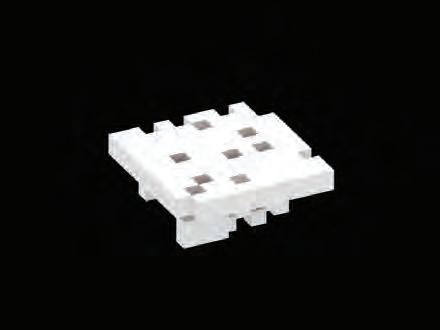
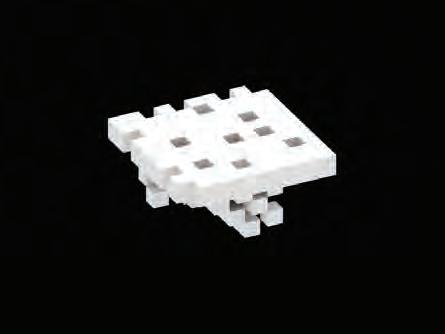
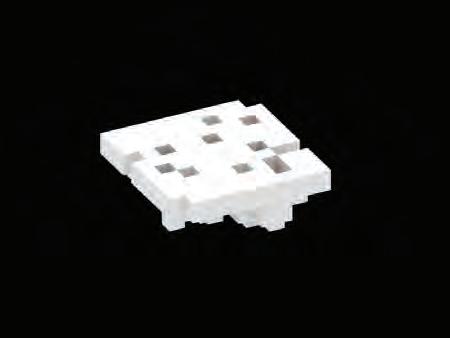
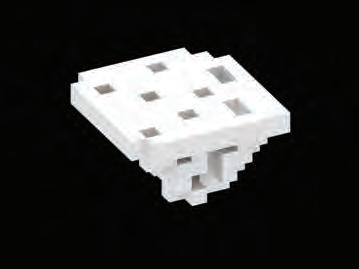

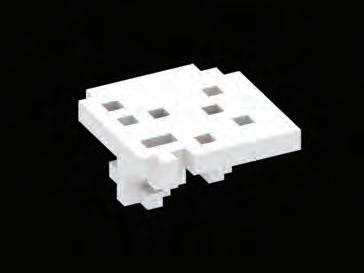
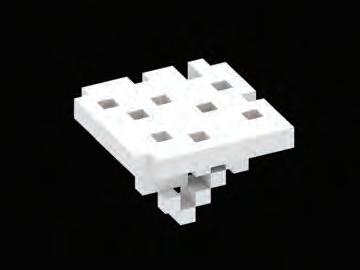
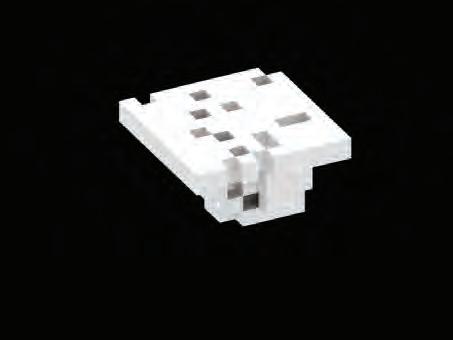
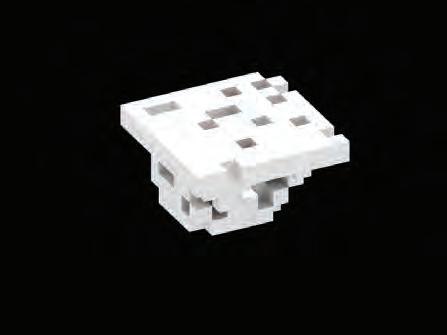
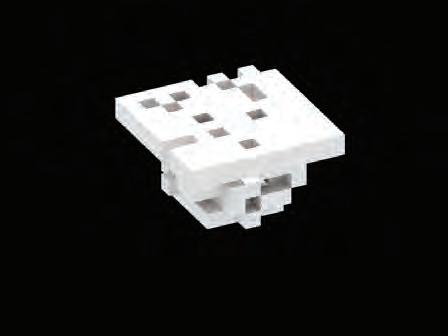
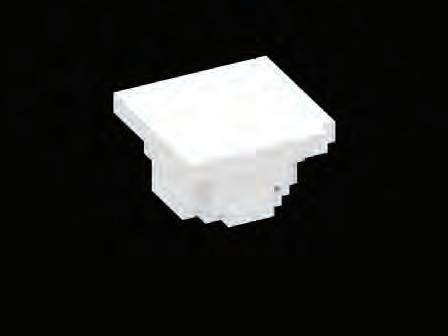
199 0.095 0.101 0.104 0.11 Average Deformation (m) : Surface Area (m2) : Average Deformation (m) : Average Deformation (m) : Average Deformation (m) : 3375 3384 0.055 3699 3870 0.057 3672 3906 0.059 4104 3978 0.062 4077 3942 0.056 4185 4032 0.057 4239 4050 0.059 4536 4518 0.063 4077 3798 0.044 3807 4050 0.050 4239 3978 0.046 3375 3636 0.050 Total Volume (m3) : Surface Area (m2) : Average Deformation (m) : Total Volume (m3) : Surface Area (m2) : Average Deformation (m) : Total Volume (m3) : Surface Area (m2) : Average Deformation (m) : Total Volume (m3) : Surface Area (m2) : Average Deformation (m) : Total Volume (m3) : Surface Area (m2) : Average Deformation (m) : Total Volume (m3) : Surface Area (m2) : Average Deformation (m) : Total Volume (m3) : Surface Area (m2) : Average Deformation (m) : Total Volume (m3) : Surface Area (m2) : Average Deformation (m) : Total Volume (m3) : Surface Area (m2) : Average Deformation (m) : Total Volume (m3) : Surface Area (m2) : Average Deformation (m) : Total Volume (m3) : Surface Area (m2) : Average Deformation (m) : Total Volume (m3) : Surface Area (m2) : Average Deformation (m) : G14.4 G14.3 G14.14 G14.32 G20.5 G20.3 G20.21 G20.11 G40.6 G40.6 G40.23 G40.12
200 Adaptive Floating Settlements Appendix
The table illustrating all programs area and volume on both scenarios
Fish food storage (m3) 12,675 12,675 preparation area (m2) 125 125 Materia storage (m3) 25,800 27,300 Fish product storage ( m3) 19,500 19,500 Packaging area ( m2) 900 700 Residential area (m2) 122,915 144,254 Health (m2) 1,692 2,150 Education (m2) 2,579 2,873 Culture (m2) 1,510 1,842 Water collection per day (litre) 765,000 826,410 Vegetation area (m2) 40,500 42,750 Aquaculture logistic Aquaculture dominant settlementPermanent living settlement Amenities Water collection and vegetation Fish food storage (m3) 12,675 12,675 preparation area (m2) 125 125 Materia storage (m3) 25,800 27,300 Fish product storage ( m3) 19,500 19,500 Packaging area ( m2) 900 700 Residential area (m2) 122,915 144,254 Health (m2) 1,692 2,150 Education (m2) 2,579 2,873 Culture (m2) 1,510 1,842 Water collection per day (litre) 765,000 826,410 Vegetation area (m2) 40,500 42,750 Aquaculture logistic Aquaculture dominant settlement Permanent living settlement Amenities Water collection and vegetation
FIG. 9 Programs data of Aquaculture dominant and Permanent living settlement
201
A Map of Individual Contributions
202 Adaptive Floating Settlements
Project Proposal 50% 50% 50% 50% 50% 50% 50% 50% 70% 30% 30% 70% 50% 50% Panit Limpiti Hung-Wen Tseng Research & Context
and Developing of Methods and Tools
and Experiments
Process
Documentation
Testing
Analysis
Program Morphology Development Assembly
Development
203
ARCHITECTURAL ASSOCIATION SCHOOL OF ARCHITECTURE GRADUATE SCHOOL PROGRAMMES

Emergent Technologies and Design 2014-2016
MArch Dissertation 2015 - Adaptive Floating Settlements
Tutors: Michael Weinstock, George Jeronimidis, Evan Greenberg, Mehran Gharleghi, Manja van de Worp
Declaration:
‘We certify that this piece of work is entirely our own and that any quotation or paraphrase from published or unpublished work of others is duly acknowledged.’
Submitted: February 5, 2016
204 Adaptive Floating Settlements
Panit Limpiti (M.Arch)
Hung-Wen Tseng (M.Arch)
