
M.Sc. Dissertation 2023-24


M.Sc. Dissertation 2023-24

FOUNDING DIRECTOR:
Dr. Michael Weinstock
COURSE DIRECTORS:
Dr. Elif Erdine
Dr. Milad Showkatbaksh
STUDIO TUTORS:
Paris Nikitidis
Felipe Oeyen
Dr. Alvaro Velasco Perez
Lorenzo Santelli
Fun Yuen
We extend our deepest gratitude to Course Director Dr. Elif Erdine, Dr. Milad Showkatbakhsh, and Founding Director Dr. Michael Weinstock for their insightful and intellectually stimulating discussions. The tangential ideas arising from these conversations often led to equally, if not more, thoughtprovoking metaphorical reflections, encompassing a broader scope than the primary subject matter. We also wish to thank Alessio Erioli [Co-de-iT] for assisting us in envisioning alternative possibilities, and express our sincere appreciation to our studio tutors and colleagues for their steadfast belief in the core principles of this dissertation.
GRADUATE SCHOOL PROGRAMMES
PROGRAMME:
EMERGENT TECHNOLOGIES AND DESIGN
YEAR:
2023-2024
COURSE TITLE:
M.Sc. Dissertation
DISSERTATION TITLE:
GAP IN THE CLOUD
STUDENT NAMES:
Burak Aydin [M.Arch.]
Mehmet Efe Meraki [M.Arch.]
Prakhar Patle [M.Sc.]
Rushil Patel [M.Arch.]
DECLARATION:
“I certify that this piece of work is entirely my/our and that my quotation or paraphrase from the published or unpublished work of other is duly acknowledged.”
SIGNATURE OF STUDENT:
DATE:
20th September 2024


This thesis explores the interdependent relationship between data—its generation, storage, and consumption—and the utilization of space and energy within the urban fabric, focusing on London’s context as one of the global data hubs. Based on past studies, current observations and future projections, there is a growing need to reconsider data centre typologies, which will eventually need to be re-integrated into the urban fabric where the information is produced and processed. By challenging traditionally isolated yet highly embedded typologies, the study unfolds a context-specific functional hybridization, cultivation for food production, to provoke a mutual integration with the public through the developed material system combined with the space-making strategy.
Functional and spatial hybridization is enabled by reusing the excess heat generated from computational activity and retaining them using phasechange materials (PCM). The heat retention performance of the system is further enhanced by developing a PCM in-filled Triply Periodic Minimal Surface panel system and passively regulating the temperature, ensuring thermal comfort for the enveloped agricultural function. This creates a mutual energy loop within the closed system, reducing dependency on external resources.
As mission-critical facilities, data centres require a highly modulated functional distribution, yet this does not translate to its space-making practices especially in the urban fabrics where the boundaries are pre-set. Addressing this challenge, spatial experiments utilized a shape-grammar approach with an automated interpreter, developed to optimize the functional and spatial distribution of the designated space-making units informed by the site conditions.
These parallel set of experiments ensured a dynamic set of spectra to enhance the building performance and spatial qualities for adaptability and responsiveness to the ever-changing demands of data, space and energy. The re-positioning of data centres in the urban fabric, through a re-imagined typology aims to transform today’s unwieldy and isolated facilities to tomorrow’s integral components of the urban ecosystems.
Keywords:
Data x Space x Energy, Phase-Change Material, Triply Periodic Minimal Surface, Shape-Grammar, Adaptability, Urban Ecosystem.
Rooting back to earliest cave paintings humankind has always had an urge to reposit information it received and generated and tangibly transfer to future receivers. This information has been embedded through various modes that have continuously evolved throughout history.
Following the invention of writing and spanning the era of transition from tablets to books, libraries served as common repository hubs to organize information. For over millennia, paper and the printing press remained the main sources of information storage systems.
The discoveries of the transistor and integrated microchip in the 1950s hinted at the upcoming of the digital age. In the late 90s, the transition occurred when digital storage surpassed paper in cost-effectiveness for storing information.
1This advancement enabled a global shift towards new ways to compute, store, and transfer information faster than ever. To manage the increasing resource and information traffic, new typologies emerged in our built environments such as data centres.
Additionally, the unprecedented power of information processing enabled us to decode humanity itself, leading to the discovery of DNA as arguably the most efficient medium of information storage.2 DNA: The Ultimate DataStorage Solution | Scientific American
Portraying the evolution of information processing, storage, and transfer systems, it is apparent that humankind will continue to pursue its mission to process, store, and transfer information to the future generations.
Tracing back to the fundamentals, the initial observation of this study portrays that since antiquity, three fundamental concepts are common through the evolution of informatics systems:
- Data,
- Space,
- Energy
All of which are necessary to reposit a unit of information, no matter what the medium is.
The complex relationship between these factors raises several questions:
- Is there a hierarchy between them?
- How are they interdependent on each other?


The concepts of information and data are often used interchangeably in colloquial language, but it is critical to differentiate them to reveal their multi-layered structure. 3
Although an ever-continuing semantic discourse is present to dissect indetail, the general framework of how information is derived and expanded, is portrayed by what is known as the “DIKW (data-information-knowledgewisdom)” pyramid which its precise origin is uncertain as Wallace stated.4
Involving processes such as distilling, abstracting, processing, organizing, and interpreting, multiple layers of organization and meaning are added to the each step of the pyramid. Although variations appeared over time, “data” always set the base for all. It is recognized as the raw material derived from abstracting the environment around using numbers, characters, bits, and symbols.
Data can be stored in multiple analogues and encoded digital forms as binary digits. In this manner, it can be interpreted as a building block. Similar to bricks, data are commodities that gain value when they are used and/or stored. Interrelating and structuring multiple data, we produce “information”. The patterns of information generate what is called knowledge. And with the ability to judge and execute in context, wisdom is reached.

data abstracted element linked data organized information applied knowledge information knowledge wisdom
Data - Brick analogy and its continuous development diagram (illustrated by the authors).
[Fig. 03] Various classifications of data (illustrated by the authors).
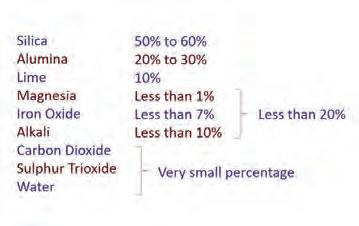
Classifying data is a rather complex problem from multiple extents. Initially, the data that are captured as their own are considered “raw data”, meaning they have not been “processed” by any means. We are exposed to both raw and processed data through multiple means.
“Metadata” is data about data; the “private” and “open data” discourses address the accessibility questions for multiple stakeholders. “Structured data” resembles the way we store information in physical libraries with books. On the other hand, “semi-structured data” is a combination of structured and unstructured. This is not necessarily always a negative feature, but because of factors like the internet and expanding social media, around eighty percent (80%) of data flowing are labeled as semi-structured.5
Though all these labels are rather relative, data can be subjective and objective. In this manner, according to Kitchin, data can be attributed as “socio-technical assemblages”.6


"socio-technical assemblage" collected & translated data about the data
meta data
[Fig. 04] Various classifications of data (illustrated by the authors).

private data

structured data

semi-structured data
public data
available to access, use & share unstructured data

flowing without a context : text, AV, logs + more
To convey the scale of the unfolding data landscape, let’s imagine a unit of data: a byte, as a water droplet. In this manner, a gigabyte would be equal to an amount of rainwater tank.7
It is estimated that the data we’ll generate next year will be equal to 175 zettabytes, parallelly the volumetric amount of 175 Gulfs of California, and it is projected that the magnitude is only going to tremendously increase.

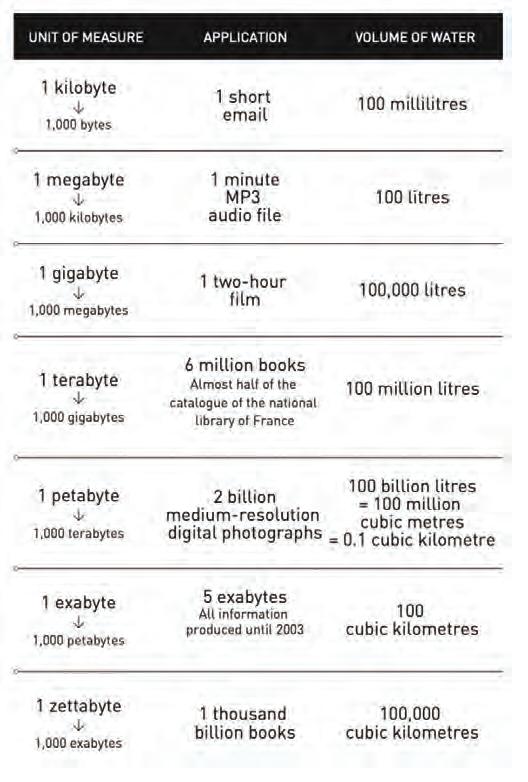

data generated, + future projections (as zettabyte) = 1e 9 TB
[Fig. 06] Yearly distribution of data generated, projections and analogous relationship (retrieved from the book :The


[Fig. 07] Data processing apparatuses comparison, the first and the most up-to-date computer (images retrieved from https://penntoday.upenn.edu/news/worlds-first-general-purpose-computer-turns-75/ (left) and https://japan-forward.com/a-look-at-the-magic-behind-fugaku-the-worlds-leading-supercomputer/ (right).
Similar to “information”, which is embodied in objects, knowledge, and knowhow are embodied in persons and networks of humans. Humankind is limited in its capacity to acquire and reposit knowledge and expertise, which raises the need for the accumulation of information in the form of data.8
The processes to analyse, process, and store data heavily involve apparatuses that are entwined and embedded within the ever-growing infrastructures.
“In a dark, tepid room lies an array of blinking cuboid machines speaking in code. They compute, store, and transmit immortalized memory bytes - information of today’s mortal lives. In this dark, tepid room lie physical matter supporting virtual terrains, whose boundaries unremittingly expand, transcending the perimeters of the space.” – Tang Jialei (Harvard GSD)
Digital information storage, like writing on paper, occupies physical space. It’s not the information itself that requires space, but the physical medium on which it’s stored. The more compact the writing, the more information can fit on the page, provided it remains legible. Similarly, on hard disks, information is stored magnetically, with tiny sections of the disk magnetized to represent binary data (1s and 0s).9
The evolution of data processors from their inception to the present day encapsulates a remarkable journey of technological advancement and miniaturization. This narrative begins in the 1940s with the advent of ENIAC (Electronic Numerical Integrator and Computer), the first electronic generalpurpose computer. ENIAC, a large weighing approximately 30 tons and occupying 1,800 square feet, signified the dawn of the computing era. Despite its enormous size, it could perform only 5,000 operations per second, a minuscule fraction compared to contemporary standards.


09] Hardware miniaturization.

10] Data production timeline.
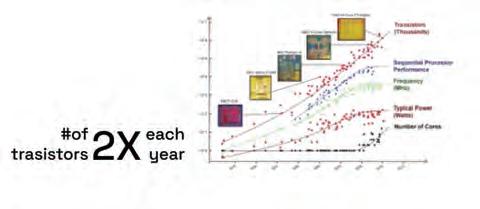
The past decades saw a relentless drive towards “miniaturization”, as per Moore’s Law. In the 1960s, Gordon Moore hypothesizes that the number of transistors on a microchip would double roughly every two years, leading to exponential increases in computing power.10 This prediction has largely held, propelling us into an era where billions of transistors can be integrated onto chips smaller than a fingernail. For example, the Intel 4004, introduced in 1971, was the world’s first microprocessor, containing 2,300 transistors and executing around 92,000 operations per second. In contrast, modern processors consist of 16 billion transistors and perform trillions of operations per second. This comparison illustrates the drastic advancements in processing power and efficiency over the past few decades. Despite the tremendous progress achieved through miniaturization, the pursuit of more powerful and efficient processors persists.
“Cartesian enclosure , a controlled space, shaped by technological rationales, coalescing in unassuming architectures organized according to borders that neglect the surrounding environment. Supporting Western man’s exceptionality, these architectures follow economic efficacy rationales and extractives logics, often at the expense of ethical and ecological awareness.”Marina Otero Verzier.11
A data centre is a specialized facility designed to house an array of networked computer servers that store, process, and transmit data. These centres are equipped with redundant power supply systems, advanced cooling systems, and robust security measures to ensure continuous operation and data protection. At their core, data centres comprise servers, storage systems, networking infrastructure, and environmental controls, all functioning cohesively to support various applications and services. As we move to the Information Age, we’re now dealing with much more than just communication.
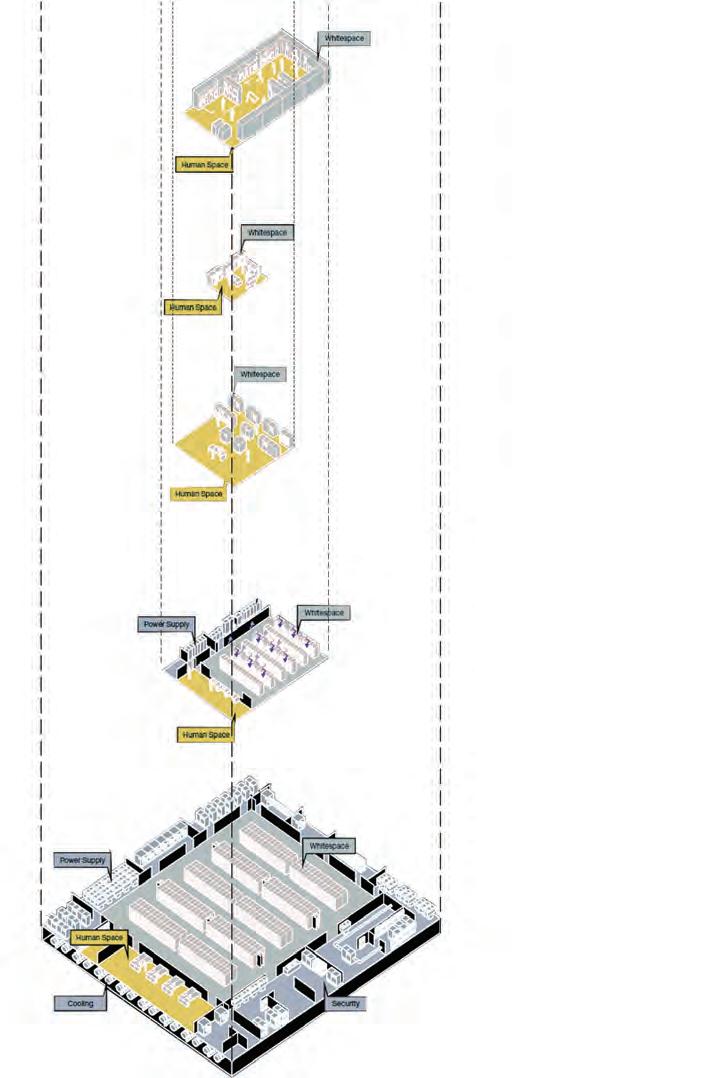
Programmatically, a data centre is divided into four main sections: computing, power distribution and storage, climate control, and physical security.12 There may also be additional areas like small office spaces.
Data centres are vital components of the modern infrastructure supporting our interconnected physical and digital worlds. They vary widely in location and size, from urban to rural settings and from single servers to massive warehouse facilities. They require significant energy and utility support, such as electricity and water, to operate. A large-scale data centre can cover 1.3 million square feet and use as much power as a medium-sized town. Like earlier infrastructure, data centres are essential and resource intensive. They are part of a global information technology communication network that includes sub sea internet cables, landing points, inland internet cables, and internet exchange points. Given the deep integration of internet technology in our economy, society, and culture, the construction of data centres is crucial.
Raw Information/Input


Processed Information/Output
[Fig. 11] Components of a data centre.
Supercomputer
E.N.I.A.C.
1946
Single Server
200-digits
167 m²
8 people
Mainframe
IBM 1401
1971
Single Server
18000 Character
30 m²
8 people
IBM SP1/SP2
Supercomputer
Client- Server
1970-1990s
Multiple Server
64MB to 2 GB
125 m²
4 people
Virtualized
Dell poweredge 800
1990-2010s
800 servers
2GB-1PB
450 m²
3 people
The evolution of data centres reflects a significant shift in the relationship between humans and computers, driven largely by advancements in information and communications technology (ICT). From the 1960s to the 1990s, early data centres were symbolized as relatively simple setups, featuring a limited number of servers and basic infrastructure. During this period, there was minimal whitespace (areas designated for equipment) and restricted space for human maintenance.
Cloud Switch SuperNAP
2010- Today
6000 Servers
1PB-15EB
325,000+ m²
1 person
As we move into the 2000s and 2010s, data centres experienced substantial growth and increased complexity. This era saw a rise in server capacity and the introduction of specialized systems for cooling and power supply. The need for expanded whitespace became evident, as did the necessity for dedicated areas for human operation and maintenance, reflecting the growing sophistication of these facilities.13 By the 2010s, data centres had evolved into large-scale operations with highly advanced infrastructure. It’s noticeable that through their evolution, data centres have minimized the need for human input by prioritizing and expanding whitespace.
With the interdependence of data and space, how does the equation adapt when energy is brought into context? A space hinting a relationship with data tends to also expect to be continuously fed with a source of energy. “This energy experiences conversion to and from different states. How does this energy conversion have a relationship with the distribution and consumption of the same?”
For a unit data–bit-, energy requirements outweigh space as the digital means became the consensus for reaching and sharing information across public and private domains. Although the means to store data become more efficient, the demand to process data is exponentially accelerating, resulting in the energy demands continuously being questioned.
Data centres require well-defined metrics to accurately measure performance and address inefficiencies. Power Usage Effectiveness (PUE) is a key ratio comparing the total energy consumed by the data centre facility to the energy used by the IT equipment. PUE is crucial for evaluating and enhancing the energy efficiency of data centres. By comprehending and optimizing PUE, data centre operators can minimize environmental impact and improve overall performance.
Total Facility Energy: This value encompasses all the energy utilized by the entire data centre, including:
IT Equipment: Servers, storage, network switches, and other computing hardware.
Mechanical Systems: Air conditioners, chillers, compressors, pumps, and other mechanical infrastructure.
Electrical Systems: UPS systems, power distribution units (PDUs), transformers, lighting and miscellaneous
IT Equipment Energy: This value refers to the energy directly consumed by the IT equipment for data processing, storage, and networking.


[Fig. 13] PUE values and their corresponding efficiency values. (retrieved from https://submer.com/blog/howto-calculate-the-pue-of-a-datacenter/).
The major demand for data centres began in the early 2000s, driven by the dotcom bubble, internet expansion, e-commerce, and social media. The internet’s growth increased the need for data storage and processing, while e-commerce platforms like Amazon generated vast amounts of data requiring expansive infrastructure. Social media platforms such as Facebook contributed to a surge in data creation and sharing. By the mid-2000s, these factors firmly established the need for more data centres. In the early 2010s, cloud computing services from AWS and Microsoft Azure and the rise of big data analytics further heightened the demand for advanced data centre infrastructure.
In the early 2000s, global data centre energy consumption more than doubled, primarily driven by the increasing electricity demands of the rapidly increasing number of installed servers.14 Concurrently, minor improvements in average PUE globally led to a similar sharp increase in electricity usage by data centre infrastructure systems.15 However, by 2010, the growth in server electricity consumption is slowed due to improved server power efficiency and higher levels of server virtualization, which also curbed the increase in the number of installed servers.16

[Fig. 14] Electricity use distribution of data centres throughout the years (retrieved from Geng, Hwaiyu. “Data Center Handbook: plan, design, build, and operations of a smart data center,” 2021).

[Fig. 15] Data centre energy efficiency throughout the years (retrieved from the report: Uptime Institute. Uptime Institute Global Data Centre Survey; 2018).
Energy Consumption and Efficiency
By 2018, IT devices, primarily servers and storage, dominated data centre energy consumption due to the rising demand for computational and storage services. However, energy consumption for data centre infrastructure systems significantly decreased from 2010 to 2018, owing to improvements in global average PUE values1718. Consequently, global data centre energy use increased by only 6% between 2010 and 2018, despite significant increases in data centre
IP traffic, computeinstances, and storage capacity19. Uptime’s data shows that industry PUE has remained at a high average ranging from 1.55 to 1.59 since around 2020. Despite ongoing industry modernization, this overall PUE figure has remained almost static, in part because many older and less efficient legacy facilities have a moderating effect on the average. In 2023, the industry average PUE stood at 1.582021.

[Fig. 16] Global Electricity Demand from Data Centres, AI, and Cryptocurrencies, 2019-2026 (retrieved from International Energy Agency (IEA). Electricity 2024 - Analysis and forecast to 2026 “Electricity 2024 - Analysis and Forecast to 2026,” 2024).
The International Energy Agency (IEA) estimates that data centres, cryptocurrencies, and artificial intelligence (AI) consumed approximately 460 TWh of electricity globally in 2022, representing nearly 2% of the world’s total electricity demand.
Looking ahead, the energy demand of data centres is expected to grow significantly due to rapid technological advancements and the evolution of digital services. The IEA projects that by 2026, global electricity consumption by data centres, cryptocurrencies, and AI could range between 620 and 1,050 TWh, with a baseline estimate of around 800 TWh. This increase—ranging from an additional 160 to 590 TWh compared
to 2022 levels—is comparable to the electricity consumption of countries like Sweden or Germany22.
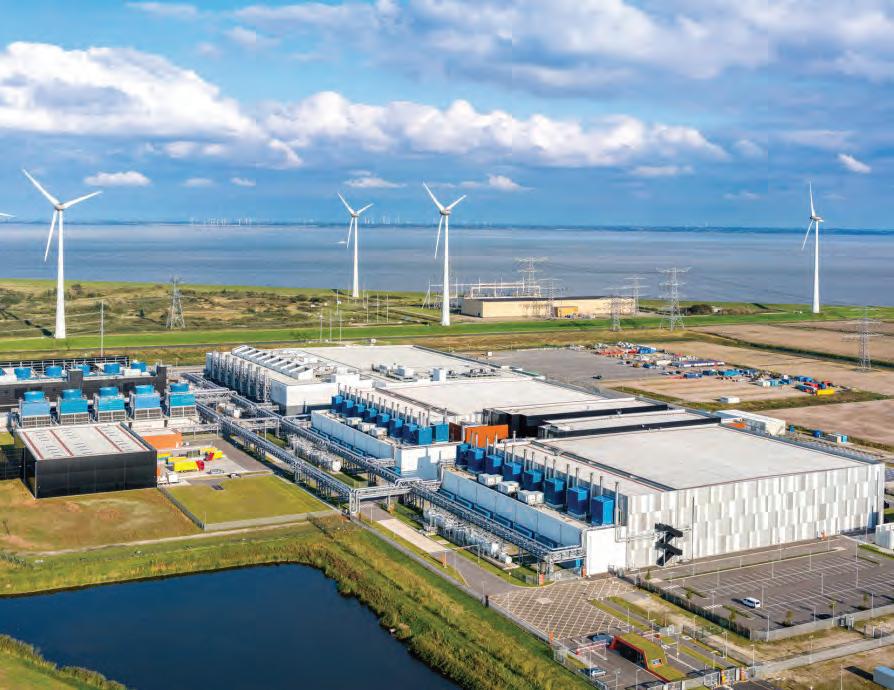
Improvements in reducing Power Usage Effectiveness (PUE) and enhancing energy efficiency in data centres are increasingly becoming a significant focus. Hyperscale colocation campuses and many large new colocation facilities are being designed with PUE values significantly below the industry average of 1.4. For instance, Scala Data Centres is constructing its Tamboré Campus in São Paolo, Brazil, aiming for 450 MW with a PUE of 1.4. Cloud hyperscale data centres of companies like Google, Amazon Web Services, and Microsoft already report PUE values of 1.2 or lower at some sites23.
Energy Resources
The electric power sector is the largest source of energy-related carbon dioxide (CO2) emissions globally and is still highly dependent upon fossil fuels in many countries2425. As demand for data centre services rises in the future, the impacts of data centres on climate change will likely continue. Some data centres are pursuing renewable electricity as part of climate commitments, alongside longstanding energy efficiency initiatives to manage ongoing power requirements.
When considering renewable power sources, data centres generally face three key challenges26:
1.) Limited local access to renewable energy-supported grid.
2.) Insufficient land and rooftop on-site generation of renewable energy.
3.) Intermittent power reliability to avoid power interruptions.
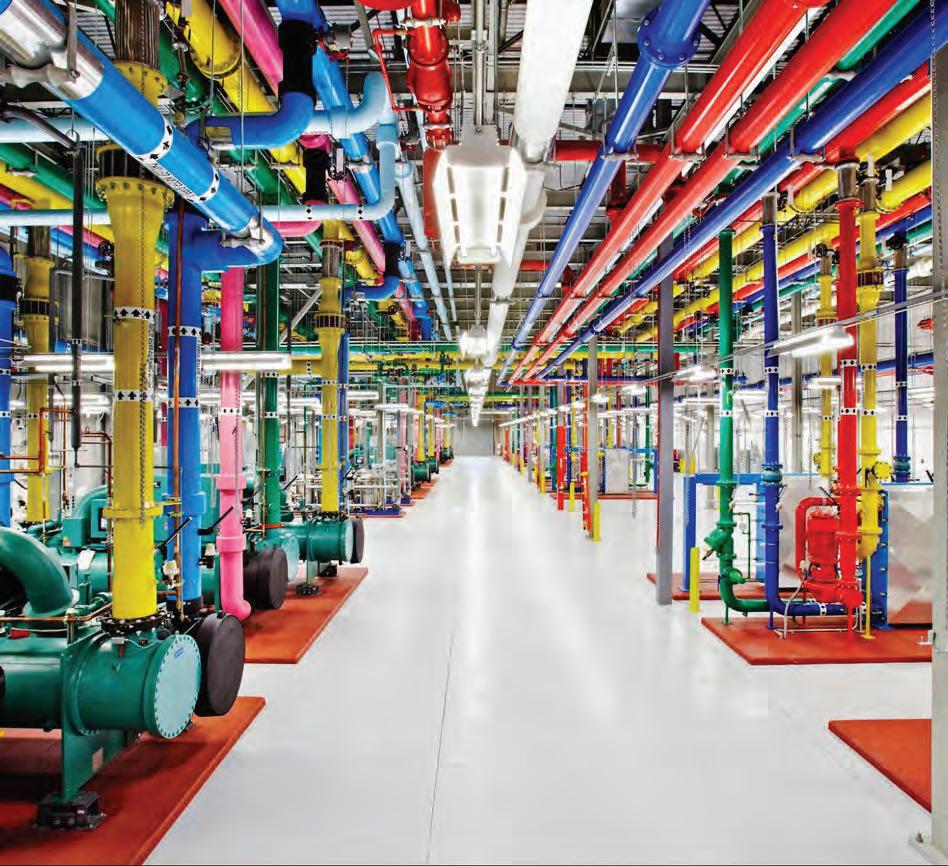
Beyond energy, water is also an essential resource facing challenges. Data centres frequently struggle with water usage, especially in regions with limited water sources. Additionally, innovative data centre designs are exploring water as a cooling system rather than heat, driven by technological advancements like AI.
For example, training GPT-3 in Microsoft’s state-of-the-art U.S. data centres can directly evaporate 700,000 litres of clean freshwater. More critically, the global AI demand may be accountable for 4.2 – 6.6 billion cubic meters of water withdrawal in 2027, which is more than the total annual water withdrawal of 4–6 Denmark or half of the United Kingdom. This is very concerning, as freshwater scarcity has become one of the most pressing challenges shared by all of us in the wake of the rapidly growing population, depleting water resources, and aging water infrastructures.
In summary, the data centre industry is at a crucial crossroads involving energy, environmental, and resource management. Historically, rising energy demands driven by technological advancements and growth of AI and supercomputing have led to increased consumption, despite efforts to improve PUE. Data centres also face significant challenges related to CO2 emissions and water usage. Addressing these environmental concerns through innovative cooling solutions, and achieving better PUE metrics, is essential for advancing sustainable data centre operations.

19] Intersections of data, space and energy.
The trilogy of these individual case domains and their intersections hinted us about the hidden potentials of such wide domain. Through the literature and studies we questioned data centre building practices along with the potential value this typology can have in various contexts.

20] Inferences from the intersection of data, space and energy.
Apart from the primary domains of data, space and energy, new domains of contextual adaptation, waste energy utilization and spatial hybridization were three interrelated tangents that we extracted from the study of their intersections.

[Fig. 21] Global data centre distribution (retrieved from https://espace-mondialatlas.sciencespo.fr/en/topic-contrasts-and-inequalities/map-1C20-EN-locationof-data-centers-january-2018andnbsp.html)
Although data centres are globally distributed, they are predominantly clustered in North America —particularly in the USA—and Europe —with the highest concentration found in the United Kingdom.
In Europe, most data centres are in northern countries such as the Netherlands, Germany, and France, but the UK stands out with the greatest density. Also, it might be worthwhile considering volume or other measures of data
exchange traffic. The largest exchanges outside the United States include Frankfurt, Amsterdam, London, Moscow, and Tokyo.
Currently, the UK operates approximately 350+ data centres, with the mentioned 120+ situated in London. The demand for data process and storage are surging due to the AI boom, leading to significant growth and development of data centres.

[Fig. 22] Data centre hubs in northern Europe (retrieved and redrawn from https:// www.datacentermap.com/united-kingdom/)

[Fig. 23] The continuous journey of Data (redrawn from thesis DataHub: Designing Data Centers for People and Cities, Harvard GSD)
The data journey begins with connected devices such as smartphones and smart cars. Initially, this data are sent to edge data centres These facilities are smaller and decentralized.27 Located close to end-users, they are positioned in the urban fabric to minimize latency and improve data processing speed.
Their location prioritises closeness to the end-users; so, introducing a new factor beyond the miniaturisation of such kinds. From there, the data progresses to large hyperscale data centres having vast amounts of data processing and storage capabilities.
The increasing use of the "smart" devices, that demand rapid access to data and its processing, is driving research into new solutions for managing latency. Edge Computing has emerged as a promising approach to meet the latency demands of the next generation 5G networks by positioning storage and computing resources closer to end-users.

The location of data centres in urban areas like London is influenced by multiple factors, with facilities often being either retrofitted buildings or newly constructed, purpose-built structures depending on the availability of building stock. However, expansion and scaling requirements of AI and Supercomputing within London's urban context pose challenges due to limited plot sizes and existing building stocks.
Despite the challenges posed, London’s existing infrastructure and its central role in the global data network provide a strong foundation for the need for
expansion in an urban context and therefore, a re-imagined approach towards the data-processing typologies in our everyday surroundings.
Accordingly, questions regarding the current concerns related with the existing typologies and examples were gathered to the related bases to further define the "problem space" for the research:


edge remote


[Fig. 26] Challenging the idea of absolute Modularity (retrieved from https://www.wired.com/2013/02/ microsofts-data-center/)


Juxtaposing the two fundamental spectra of features, a two-dimensional chart was proposed to plot and better dissect the related case studies.
Considering the insights retrieved from the “data-space-energy” intersection, it is possible to better understand the prominent qualities of data-centre typologies by mapping the features through multiple spectra under four group under four quadrants:
1) Monolithic | Cloud
2) Monolithic | Edge
3) Modular | Cloud
4) Modular | Edge

27] Juxtaposed spectra, the base to plot the case studies (generated by the authors)

[Fig. 28] Case studies extracted from around the world.
Although Data Centre Plans and Layouts are kept classified due to their mission-critical nature and strategic importance, we’ve gathered multiple DC examples from around the world.

[Fig. 29] Linkedin Oregon DC (retrieved from https://www.linkedin.com/blog/engineering/ developer-experience-productivity/lessons-learned-from-linkedins-data-center-journey)

[Fig. 30] Naver DC Project in South Korea (retrieved from https://www.datacenterdynamics.com/ en/news/naver-plans-cloud-ring-second-korean-data-center/)

For this quadrant, two examples were compared and contrasted after a general desk research of traditional data-centres,
1.) an existing 8 MW capacity facility in the United States28. 2.) a conceptual project for Naver DC in South Korea29.
Both facilities share common, fundamental function clusters and similar hierarchical structures, essential for their operation. These clusters include electrical and mechanical support areas, loading and shipping docks, conditioned storage, Points of Presence (POPs), and office spaces.
Although the design and construction methodologies are monolithic, the clustered units have a repeating pattern in order to function as mini data centres within the governing monolithic envelope.
The architectonic elements provide only a sheltering purpose for these missioncritical facilities.. The main target is to achieve easily maintainable and high capacity computing in remote settings, ensuring uninterrupted service.

[Fig. 31] Data Centre Project in Denver, colorcoded plan, (retrieved from https://www. ckarchitect.com/denver-data-center-den01/ o93ie2kwvzkqbcdnjrwfmzikepo55j)

[Fig. 32] Data Centre Project in Northern Virginia, color-coded plan, (retrieved from https://www. ckarchitect.com/northern-virginia-data-centernv01-1)

[Fig. 33] Data Centre project in Norway, colorcoded plan, (retrieved from https://www. datacenterdynamics.com/en/news/keysourceand-namsos-datasenter-planning-norwegian-edgefacility/)
Initial layout surveys show that data centres, as mission-critical facilities, require a fundamental set of spatial and functional relationships. These functional distributions often repeat across different contexts, raising questions about the influence of contextual and environmental conditions on the design process

[Fig. 34] Surveyed Plan of the case-study (retrieved from https://www.ckarchitect.com/8mw-datacenter-1)

[Fig. 35] The extracted access and functional distribution diagram (generated by the authors)
The survey on the 8 MW capacity example portrays the mini-data centre structure. This specific example consist of 4 similar cells and 1 smaller cell to provide the required redundant computation capacity. In this manner, 8 MW is equal to the combination of 4 equal cells, providing 2 MW each, with repeating IT, Mechanical and Electrical Components. Additionally the internal and external access control elements like mantraps and the linear layout were observed.

[Fig. 36] Naver DC project in South Korea, plan layout (retrieved from https://www.datacenterdynamics.com/ en/news/naver-plans-cloud-ring-second-korean-data-center/)
The conceptual approach of a 'cloud-ring' primarily manifests in the facility’s plan organization. Circulation spaces are designed to enable maintenance robots to navigate through the data halls, with human involvement deliberately minimized to reduce unplanned interference and optimize facility management. However, the introduction of social functions within the ring seems contradictory to this intent. While the ring is highly isolated from human factors, the inclusion of such spaces raises questions about their practical role and necessity within a system engineered to prioritize automation over human interaction.

[Fig. 37] The extracted access and functional distribution diagram (generated by the authors)

Despite their advanced designs, both case studies reveal significant limitations in terms of flexibility and scalability. The US data centre’s interconnected cells, each connected to 2MW Power Distribution Units (PODs) , restrict the upgrade-ability of individual components due to their tight integration without a common spine. This rigid structure makes it difficult to adapt to new technologies or scale operations efficiently, posing long-term operational challenges. Similarly, the Naver DC plan in South Korea, though innovative with its integration of smart farming systems and water clusters for heat utilization and cooling, fails to address scalability comprehensively.
We question the current approach to space-making in these monolithic data centres, highlighting missed opportunities for innovative design practices that could unlock hidden potentials. Both facilities prioritize functional clustering and architectural shelter, but they fall short in exploring flexible and scalable (both up and down) configurations.

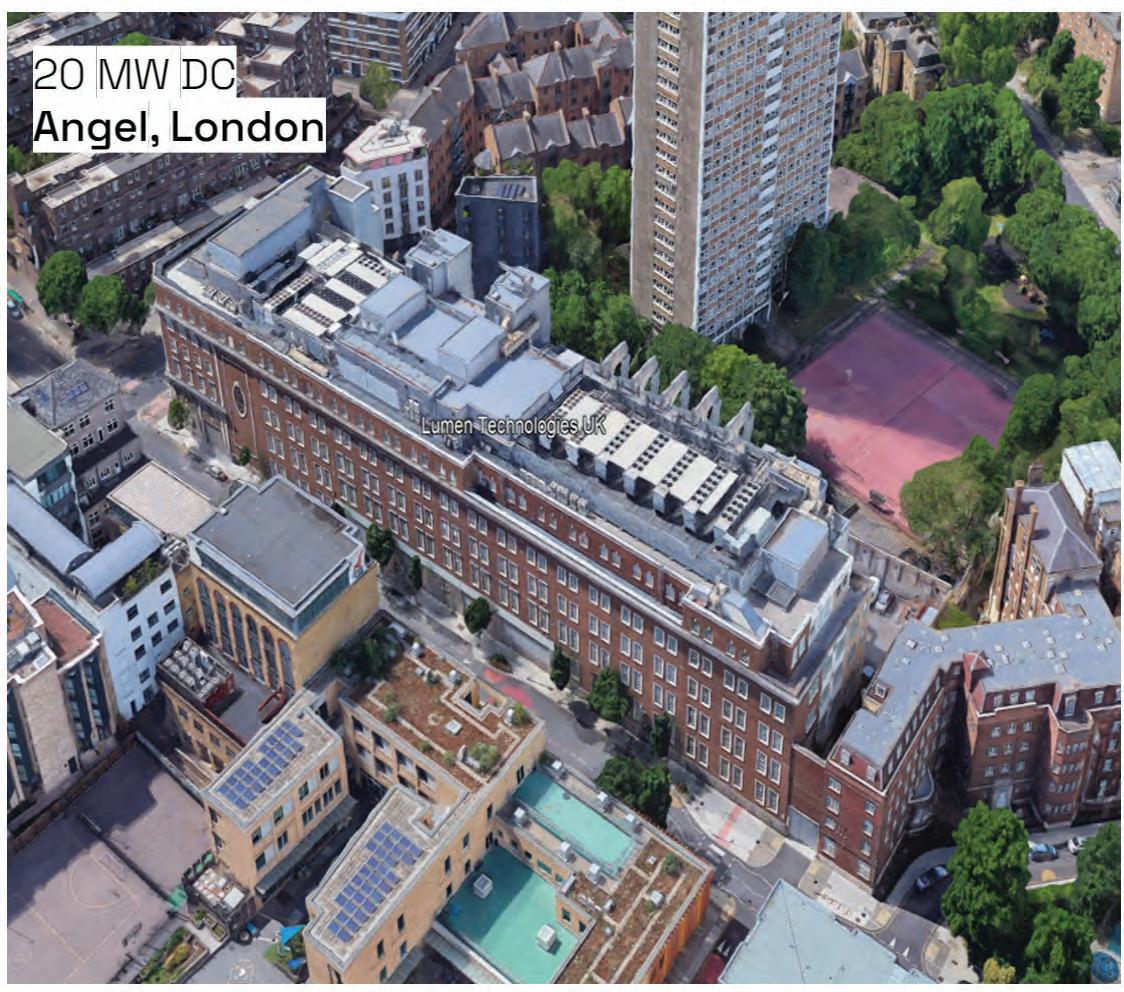
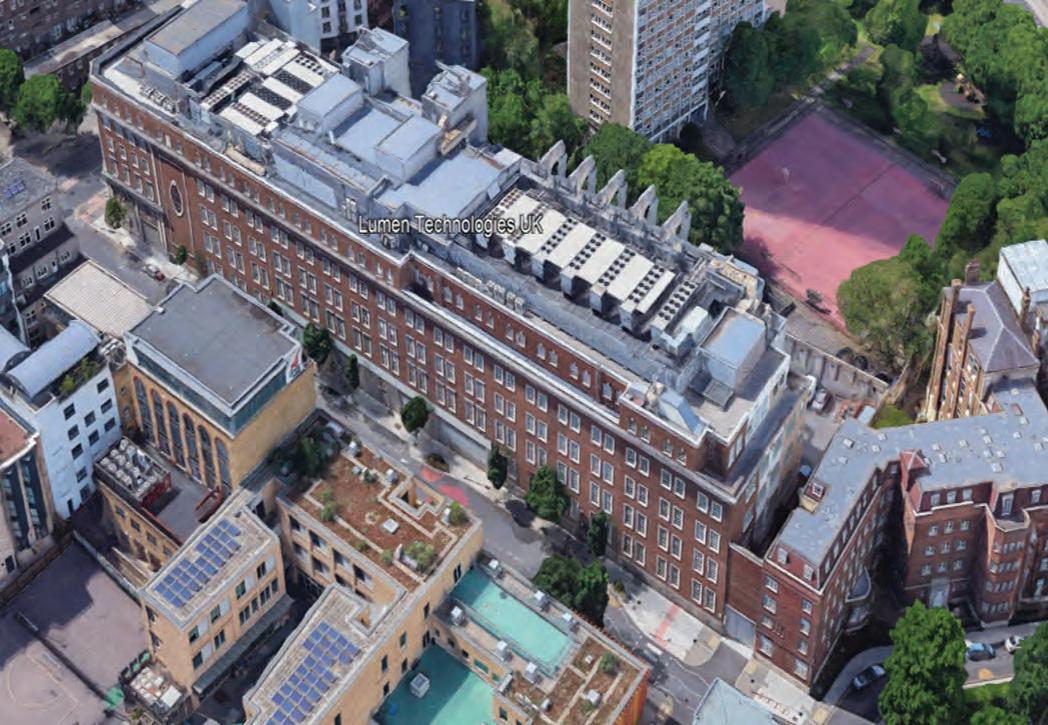
To better understand, where some data centres are embedded in London, a building like many other in Angel has been noticed. Although the façade resembles a housing block with its window articulation, in fact it is a camouflaged data centre. The street facing façade versus the backdoor and the roof portrays the Frankenstein situation.
It is extracted that “monolithic - edge” data centres are embedded in urban fabrics. Deployed on the existing grid that we share, these typologies are hidden in our everyday surroundings. Despite being in cities, like their cloud data centre counterparts, these types do not consider any contextual input regarding their surroundings. Due to the lack of buildable area in dense urban fabrics, the construction method has shifted towards retrofitting existing buildings to accommodate the infrastructural necessities of these data centres. Many examples suffer from space constraints that are strictly pre-defined by the buildings they occupy. This not only results in expansion issues but also leads to “over-scaling.” In these typologies, the complex web of components and spatial relations makes scaling down as difficult as scaling up. Overall, as long-lasting monolithic data centre construction practices appeared in the cities, retrofitting existing buildings in isolation from their surroundings results in neither flexible nor responsive data centres.
[Fig. 39] Level3 DC in Angel,London (generated by the authors via Google Earth Imagery)
Due to the lack of build-able area in dense urban fabrics, the construction activities have long ago shifted towards retrofitting existing buildings to accommodate the infrastructural necessities of these data centres. The pre-set conditions of the envelope makes it harder to fit-in as with the best-practice, cost and energy efficient way possible.

from https://www.ckarchitect.com/ digital-capital-partners-dcp03-2)

https://www.ckarchitect.com/ digital-capital-partners-dcp03-2)

On the other hand, whether purpose-built or retrofitted, many examples suffer from spatial constraints that are strictly pre-defined by the buildings they are "fitted".
This not only results in expansion issues but also leads to “over-scaling.”

In these typologies, the complex web of components and spatial relations makes scaling down as difficult as scaling up. Overall, as long-lasting monolithic data centre construction practices appeared in the cities, retrofitting existing buildings in isolation from their surroundings results in neither flexible nor responsive data centres.

[Fig. 44] a Microsoft Cloud Computing Facility in Virginia (retrieved from https://baxtel.com/data-center/microsoft-azure/photos)

[Fig. 45] a Microsoft Cloud Computing Facility example (retrieved from https://www.cnet.com/culture/microsoft-boxing-up-its-azure-cloud/ )

In the modular-cloud data centres, studies highlight the use of prefabricated modular systems that can be easily plugged in or out to the existing structure to adjust capacity, thereby accommodating demand fluctuations.
A case study of Microsoft’s data centre illustrates this approach. The facility resembles a warehouse, with certain fixed functions and spaces that remain unaffected by changes in computational demand. Within this warehouse, various IT container boxes are arranged, with their spatial configurations constantly adjusted to accommodate more containers and provide the flexibility needed to scale up or down based on demand. Additionally, these warehouses are connected to external power supply modules with cooling functions, which help meet the increased power requirements of the IT units.


[Fig. 46] An additive-modular example project (retrieved from https://www.ckarchitect.com/ containerized-data-center1)
This example highlights the importance of sustaining the critical functional relationships between the IT, Heat Exchanger, and Power Delivery units. Rather than a functional zoning within a shelter, the approach avoids establishing rigid boundaries. This allows for greater flexibility, making it comparatively more adaptable to evolving needs and technologies. Still for an effective edge-counterpart, no contextual input for the overall scheme is observed.

[Fig. 47] A sheltered modular example, surveyed and extracted (retrieved from https:// www.se.com/uk/en/work/solutions/for-business/data-centers-and-networks/modular/)


[Fig. 48] Additional modular examples, surveyed and extracted (retrieved from https://koreajoongangdaily.joins.com/2020/07/23/business/tech/Naver-cloudIT/20200723183308292.html)
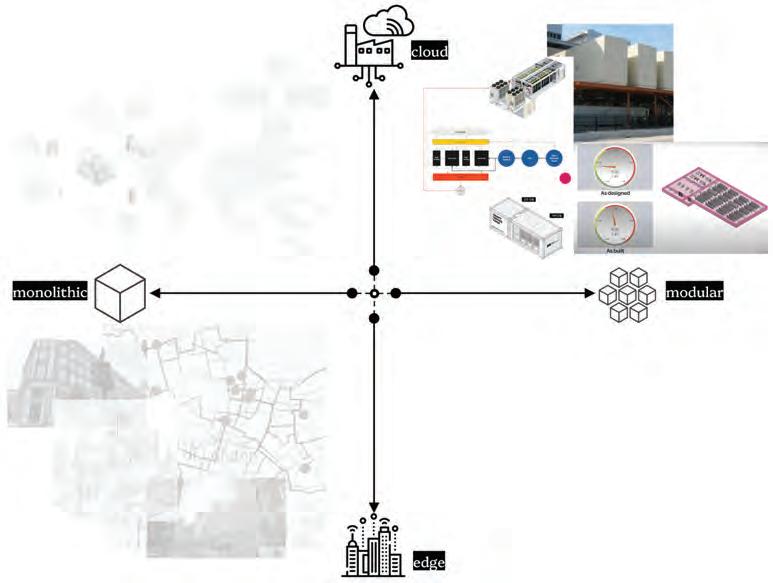
These highly engineered modules perform as expected, significantly enhancing data centre performance and are, therefore, considered a promising solution. However, despite their ease of initial scalability, the system lacks a central framework that would allow for the re-purposing of its spatial organization. This limitation restricts functional interplay and the integration of hybrid functions. The absence of a unifying structure presents challenges for future scaling, both mechanically and architecturally, particularly in addressing unpredictable future demands or 'unknown projectiles.


As the fourth quadrant on the chart, there are no “modular-edge” data centre examples that integrate modularity as an opportunity to both scale up and down in the dense urban fabric of cities. Taking pre-fabrication as a core principle to ensure expected performance values, data centre modules, generally containers, are typically deployed temporarily for specific time frames. In this manner, the idea of stacking containers as they are bringing challenges during the construction process since it is much harder to replace entire prefabricated volumes rather than their parts. Within the boundaries of this quadrant, pursuing adaptability for edge computing through a modular approach holds potential, though the core concept of the “module” must be revisited.
In addition, a third spectrum is proposed with initial insights regarding the lack of public interaction to better define our domain of interest. To frame and juxtapose the third dimension, is introduced:
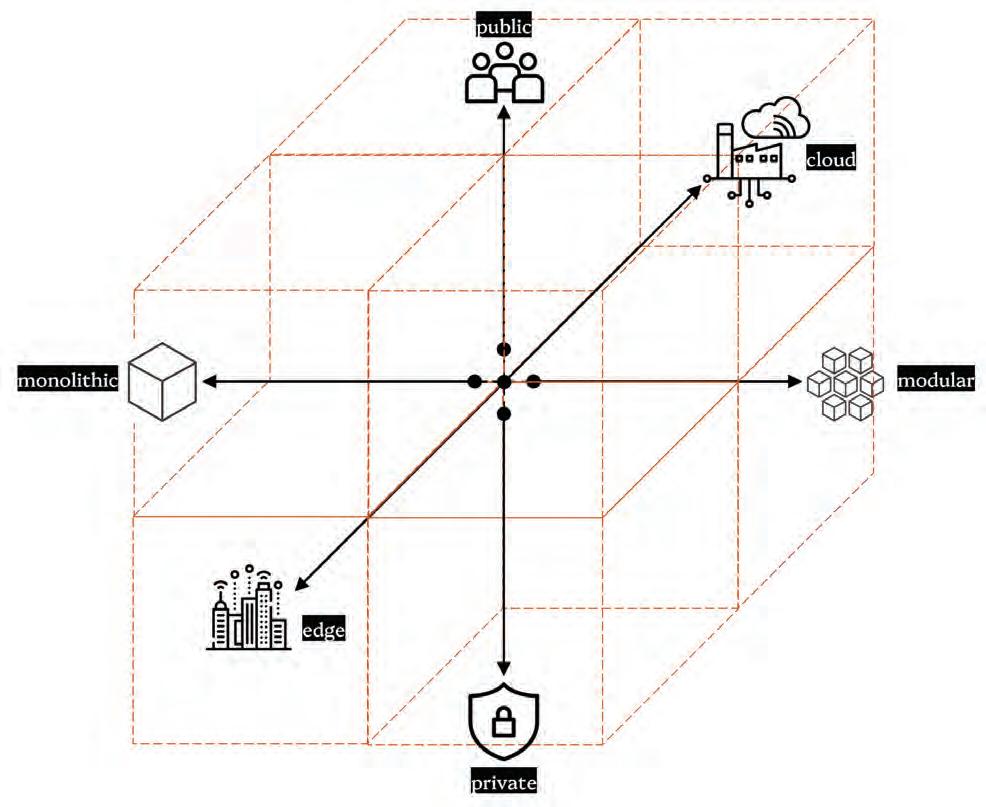


Combining this with the first two dimensions, the resulting three-dimensional chart helps to frame the research question and its area of focus.


[Fig. 51] DC distribution in Greater London, redrawn from "Using data centres for combined heating and cooling: an investigation for London"31
Plotting the data centres, it has been realized that the most data processes and edge computing happen in Central London, near the City of London.
In London, data centres contribute significantly for the consumption of city’s electricity. Majority of energy consumed by data centres is converted into heat, currently cooling technologies including air and liquid is used to cool these data centres which often released into atmosphere, representing a potential waste of energy. Effective heat recovery and potential hybridization of a program that citizens can engage with, can significantly reduce the carbon footprint of data centres ensuring a contribution for the public's good.30

[Fig. 52] Area of allotments (m2 per person) in Greater London (redrawn from the article : Urban agriculture: Declining opportunity and increasing demand 32)

In London, looking at the allotment distribution for cultivation per person, areas with high population density and office buildings are not capable of providing sufficient allotment areas.
Although these zones have high data processing and significant food consumption, they have low food production capabilities.
This observation hinted a potential hybrid function for edge computing typologies, tailored for the public need.

[Fig. 53] Image courtesy of Solomon R. Guggenheim Museum (retrieved from ,https://metalocus.es/sites/default/files/ metalocus_countryside_koolhaas_guggenheim_01.jpg)
In the past, agriculture was considered as alien to the city as fields at the boundaries. However, the contemporary city and agriculture are conceived as a whole. We are seeing more and more city and farm coming together to the point that you could argue the possibility of thinking agricultural production within the urban space.
[Fig. 54] Juxtaposed Maps (generated by the authors utilizing prior two figures)

Both data centres and farms require backup power systems to maintain operations during primary power failures. Data centres need effective airflow management and temperature control to ensure servers function efficiently, while farms need these systems to keep plants healthy. Security measures are crucial for both, with cannabis facilities potentially requiring security levels comparable to data centres.33
Historically, early indoor farms utilized data centre equipment due to the lack of specialized farming equipment. Net Zero Agriculture’s systems, inspired by IT rack designs, are used in shipping containers. Companies like ABB, Air2O, and Schneider, which specialize in UPS and HVAC systems, serve both sectors.

Integrating urban farms with data centres can transform these typically secluded, inaccessible spaces into visible and functional parts of the community, effectively breaking the notion of data centres as "hidden entities." By allocating space for community gardens, residents can engage directly with the facility, growing their own produce and fostering a connection to the site.34
These allocations serve as social hubs, promoting interaction and collaboration. Additionally, regularly scheduled farmers' markets within the integrated facility can showcase and sell produce grown on-site, drawing visitors and creating a lively, market-like atmosphere. This visibility and community engagement make the data centre an active, integral part of the urban environment.
Research Question
How can we generate a scalable data centre typology in the urban fabric of London, by defining a public interface via utilizing the excess heat for cultivation purposes
In London data centres contribute significantly for the consumption of city’s electricity. London’s data centres, including major facilities in Dockland and slough?, are part of the UK’s broader data centre infrastructure. Which in total consumes approximately 12TWh35 of electricity annually. Majority of energy consumed by data centres is converted into heat, currently cooling technologies including air and liquid is used to cool these data centres which often released into atmosphere, representing a potential waste of energy.
Heat exchangers and heat pumps are commonly used technologies for capturing and repurposing waste heat from data centres. These systems can transfer heat from the data centre to a secondary use, such as heating buildings or greenhouses Effective heat recovery can significantly reduce the carbon footprint of data centres.
Both data centres and farms require backup power systems to maintain operations during primary power failures. Data centres need effective airflow management and temperature control to ensure servers function efficiently, while farms need these systems to keep plants healthy. Security measures are crucial for both, with cannabis facilities potentially requiring security levels comparable to data centres. Historically, early indoor farms utilized data centre equipment due to the lack of specialized farming equipment. Net Zero Agriculture’s systems, inspired by IT rack designs, are used in shipping containers. Companies like ABB, Air2O, and Schneider, which specialize in UPS and HVAC systems, serve both sectors36.
Integrating urban farms with data centres can transform these typically secluded, inaccessible spaces into visible and functional parts of the community, effectively breaking the notion of data centres as “hidden entities.” By allocating space for community gardens, residents can engage directly with the facility, growing their own produce and fostering a connection to the site. These gardens serve as social hubs, promoting interaction and collaboration37 . Additionally, regularly scheduled farmers’ markets within the integrated facility can showcase and sell produce grown on-site, drawing visitors and creating a lively, market-like atmosphere. This visibility and community engagement make the data centre an active, integral part of the urban environment.

The site selection method in this study uses data sampling by overlaying multiple maps to identify optimal locations for a data-processing typology that hybridizes a cultivation function. In this way, relevant maps are collected from various sources and evaluated based on their legend information.
A grid of sampling points across Central London is generated, and the input data from each map are extracted and juxtaposed. Each sampling point is attributed with the corresponding extracted values. Various maps, serving as source criteria, are weighted according to their relevance to the designated goals, adding up to a total value for each sample point. These goals aim to ensure the chosen locations enhance operational efficiency, community integration, and environmental benefits. These points are then used as center points for potential sites to be identified around them.

Computational Fluid Dynamics (CFD) analysis combines data models to predict the performance of the input in terms of its response to fluid flow and heat transfer. It examines several fluid flow properties, including temperature, pressure, velocity, and density.38
This methodology is implemented in different scales to support different stages of the design development. The implementation scale varies from the urban context level of London to the local assembly level of the proposed material system.
When neeeded, Fast Fluid Dynamics (FFD) methodologies were also utilized to efficiently predict, compare and contrast the performance of the inputted geometry utilizing less computing power.

Heat transfer mechanisms refer to the ways in which thermal energy moves within a medium, as well as from one medium to another, following the principles of thermodynamics. This research primarily utilizes the second law of thermodynamics, which states that during thermal contact, energy exchange between mediums continues until thermal equilibrium is achieved.39
Computational workflows incorporating specialized equations are used for a quick and accurate understanding of these mechanisms, enabling a performance-driven design process.
The design criteria for the proposed material system heavily depended on the characteristics of thermal energy within. Design optimizations to facilitate this movement were implemented based on the outcomes of this analytical study.

This exploration included additive manufacturing of complex geometries such as minimal surfaces, triply periodic minimal surface-based (TPMS) lattice structures, and their compositions. TPMS exhibit these properties in a periodic manner across three dimensions, posing considerable fabrication challenges with conventional methods.40 Lattice structures, made up of repeating unit cells, offer a combination of lightweight properties and high strength.
The intricacy of these geometries makes additive manufacturing essential, as it eliminates the need for numerous unique formworks or jigs, increasing stability and performance while reducing fabrication time and material waste.

To facilitate hybridized cultivation, this study explored the potential integration of phase-changing materials (PCMs). The selection of suitable PCMs within specific temperature ranges involved a series of material experiments, guided by the heat characteristics obtained from relevant datasheets.
Additionally, the latent heat capacity, cycle stability, and volumetric changes during phase transitions of the selected materials are examined through material experiments using multiple data channels, including continuous logging thermometers and thermal imaging methods.

Evolutionary multi-objective optimization involves multi-criteria decisionmaking. Using principles of genetic evolution and an evolutionary multiobjective optimization engine, multiple solutions are generated, tested, and evaluated based on their performance against the specified objectives.41
The workflow for the design development phase required an evolutionary multi-objective optimization process to generate, compare, and contrast global assembly options in relation to the established and weighted objectives.
To achieve this, Wallacei, an evolutionary engine plug-in for Grasshopper 3D, was utilized. It also allows users to select, reconstruct, and output any phenotype from the population after the simulation is complete.

This method explored the simultaneous mapping of environmental conditions for the volumetric analysis of the selected site and its impact on early-stage design. The methodology is based on deconstructing the urban site into a volumetric grid of points. For each of these points, various physical properties, such as solar radiation, airflow, and visibility, are computed. Subsequently, interactive visualization techniques allow for the observation of the site at a volumetric, directional, and dynamic level, revealing information that is typically invisible.42
The research uses this analysis to identify potential areas for the deployment of built structures by examining the field within the volume and assessing the site's future potential for growth. This analysis is then layered with multiple objectives, providing a potential deployment field defined by a weighting system.

To assess the topological conditions created by the assembly of components, Space Syntax and graph theory methodologies have been utilized at the assembly scale. The shortest walk refers to the distance cost between two line segments, weighted by three key factors: metric (least length), topological (fewest turns), and geometrical (least angle change).43
In this context, a further analysis of the clustering and access conditions was conducted using the "ShortestWalk" plugin44 within the Grasshopper environment of Rhino3D. This analysis aims to ensure overall accessibility to the main units by examining the relationships between the space-making units.


As “mission-critical” typologies, one key inference from data centre case studies was its interdependent sub-cluster requirements to enhance performance efficiency and regulate accessibility within the facilities. Within its typological context, a shape grammar approach is proposed to define a set of mutual rules while generating an adaptable configuration of these “localscaled” units, which will gather the sub-clusters at the “regional scale” and ultimately assemble them at the “global scale”.
Shape grammars, being non-deterministic, provide users with various choices of rules and application methods at each iteration.45 This enables multiple potential outcomes as the it proceeds. The growing set of relationships and complex interdependency create a laborious process which is prone to errors if carried out manually. Regardingly, a shape grammar interpreter that will automate the process is required.
In this context, the “Assembler” plug-in46 is utilised within the Grasshopper environment under Rhino3D. The plug-in aim is defined as “distributing granular decision in an open-ended process,” automating the task of determining “Which rule to apply” or, as stated, “Where do I add the next object?”.

[Fig. 64] De-constructing a data centre (generated by the authors)

Based on the conducted case studies, the fundamental components that comprise the computational capabilities of a data centre were identified through their respective system details. These details are crucial in defining the spatial and functional requirements of the units, as well as the envelopes around and between them. The following components were studied:
- I.T.E. or I.T. : Information Technology Equipment
- Heat Exchange Configurations
- Auxiliary Service Units


[Fig. 65] Traditional Air Cooled DC Diagrams (retrieved and edited from https://journal.uptimeinstitute.com/alook-at-data-center-cooling-technologies/ )
Traditional Information Technology (IT) systems aimed to remove the excess heat from the computers by circulating a treated (filtered, temperature ensured) air around the room.
The electricity consumed by the computing hardware dissipates as heat due to resistances in the circuits. The resultant heat must be dissipated to ensure the required thermal conditions for the information technology equipment (ITE) to operate properly.
Focusing on the core IT stacks in data centres, a wide range of cooling technologies are utilised, employing either air, water, or engineered fluids . In the context of this research, an overview of multiple solutions was conducted to determine the most convenient option that offers both required flexibility in scaling and the highest possible heat-reuse capacity.


As the power density of the chips increased overtime, air became a less viable medium for projected demands
In the scope of the research, various liquid cooling solutions were dissected in the features regarding their scalability, additional spatial and infrastructural requirements, and the heat removal procedure.
Although many modifications multiply the cooling solutions, the selected ones distinctly differentiate from each other and set the base for their typologies. Starting from the widespread air-cooling solutions to the latest immersion cooling options, multiple solutions were compared based on aspects such as scalability and modularity, spatial and infrastructural requirements, characteristics of the dissipated heat, and integrated required systems.
Immersion cooling is a type of liquid cooling by submerging the server units in a cooling fluid present in specially designated tanks. On the other hand, water-cooled server racks resemble conventional rack-mount servers, but they are networked with water blocks and fluid-circulating tubing to aid in heat dissipation. Due to the maximum use of liquid around the generated heat, the thermal conductivity advantage is highly retrieved.

[Fig. 66] Heat Load per ITE solution chart (retrieved from https://www.akcp.com/blog/a-look-at-data-centercooling-technologies/)

[Fig. 67] Immersion Cooling Principle Diagram (retrieved from, https://www.asperitas.com/what-isimmersion-cooling#how-it-works)
Immersion-Cooling solutions in data centres provide PUE (Power Usage Effectiveness) values in a range of 1.02 to 1.04, portraying that they use up to 50% less energy than their traditional air-cooled counterparts while handling the same computational load. 47
Additionally, immersion-cooling solutions provide 5 times more powerdensity per rack, than the traditional air cooled solutions, therefore they fit more computational capacity into a smaller volume, much more efficiently.48


[Fig. 68] Immersion Cooling Principle Diagram (retrieved from, https://www.asperitas.com/what-is-immersioncooling#how-it-works)
Within the scope of this research, the single-phase immersion cooling solution has been identified as the most feasible option due to its flexibility through modularity and its effective heat transfer capabilities to the submerged fluid. By circulating the heated fluid through a heat exchanger, the resulting heat is efficiently transferred and can be directed to where it is needed through additional material interventions.
A heat exchanger is a mechanical device designed to efficiently transfer thermal energy between two or more medium at different temperatures without mixing them. It operates based on the principles of conduction and convection, enabling the transfer of heat through solid walls and fluid motion.
In data centres, heat exchangers are vital for maintaining the optimal operating temperatures of ITE Spaces, enhancing energy efficiency, and contributing to ensured thermal management practices.

[Fig. 69] Working principle of an Liquid-to-Air heat exchanger (retrieved from https://www.altexinc.com/ case-studies/air-cooler-recirculation-winterization/).
The input and output parameters of the heat exchanger are determined by the operational requirements of both the ITE and the Cultivation Spaces.
Considering the utilization of Immersion Tank ITE Spaces, where highperformance computing, AI, and supercomputers generate substantial energy consumption, liquid cooling systems have demonstrated superior efficiency in managing the thermal loads of high-density data racks.
In the Cultivation Units, water supply is critical as it provides nutrient delivery, specific oxygen, and pH levels necessary for plant growth. This necessitates a separate closed system for water supply and circulation. However, the air supplied to the plants must be maintained within a specific temperature range to optimize growth. This can be achieved by using external air, which is then cooled down to the required temperature through a heat exchanger utilizing hot liquid from the ITE Spaces.
Liquid-to-air heat exchangers are considered best practice among liquid-based systems. Dry coolers, a type of air-to-liquid heat exchanger, transfer heat from the liquid to the surrounding air. In this system, warm liquid flows through a network of coils or tubes, while large fans blow ambient air over these coils. As the air absorbs heat from the liquid, the liquid is cooled before returning to the system. Typically, dry coolers dissipate heat directly into the air, but this heat can also be repurposed, such as for heating cultivation spaces.

[Fig. 70] Immersion cooling infrastructure example without heat reuse (retrieved from https://pictures.2cr. si/Images_site_web_Odoo/Partners/Submer/2CRSi_ Submer_Immersion%20cooling%20EN_April_2023.pdf).
- Comparison
In standard practice, dry coolers release heat directly into the air without being reused for other purposes, resulting in a significant amount of energy being lost to the environment. Given the scale of energy consumption involved, this process leads to considerable heat waste, which is simply dispersed into the atmosphere.

However, this heat can be repurposed in various ways. Instead of releasing it into the atmosphere, the heat can be redirected to programs such as cultivation spaces, where crops and vegetation require specific temperatures to thrive. By using this excess heat to support agricultural processes, the system becomes more energy-efficient and sustainable. Proposed


[Fig. 72] Required temperatures for the IT and cultivation spaces (generated by the authors).
For the development of the overall system, the inlet and outlet temperatures of the fluids in the dry cooling heat exchangers will be crucial. Since the project involves ITE Spaces, which consist of immersion cooling tanks, and Cultivation Units designed to accommodate crops and vegetation, accurately determining these temperatures is essential for advancing the design and conducting detailed physical experiments.
Immersion Cooling Inlet-Outlet Temperatures:
-Inlet Temperature: around 40°C
-Outlet Temperature: 50°C (10°C higher than the inlet temperature)
Farming Unit Inlet-Outlet Temperatures:
-Inlet Temperature: Typically, between 18°C and 24°C
-Outlet Temperature: It should stay within 2°C of the inlet temperature to ensure a stable growing environment.
The immersion cooling units need to lower the liquid temperature from 50°C to 40°C, while the cultivation space must stay between 18°C and 24°C. Using a dry cooling heat exchanger, this temperature regulation can be effectively achieved.
q = Heat (cal or J)
m = Mass (g)
c = Spesific heat (J/g ° K)
ΔT = Change in temperature
The temperature range required for the Cultivation Space is certain but depends on the stability of heat generated in the IT Space. Fluctuation in the total number of active servers and their usage capacity in the IT Space can affect the total heat produced, potentially supplying less heat to the Cultivation Area than needed.
Data centre activity fluctuates throughout the day, with usage peaking during working hours. Thus, the data centre’s capacity must be designed to meet peak demand during these times. At night, data production and consumption decline as the number of users decreases, leading to only partial use of the available capacity. This usage difference can reach up to 40%. As the heat from the IT Space fluctuates, it impacts the heat supplied to the Cultivation Area, potentially affecting plant growth. Therefore, it is crucial to regulate and maintain consistent heat levels in the Cultivation Area.


Thermal energy storage methods can be divided into two classes: sensible heat storage, in which the material's temperature changes with the amount of energy accumulated, and latent heat storage, which implicates the storage or release of energy during its phase change.49
As Al-Yasiri and Szabó discuss, typical thermal energy storage uses physical materials such as "brick" and "concrete." However, relying on materials with high thermal mass for sensible thermal energy storage has a drawback: the low energy density.50
On the other hand, PCM stores thermal energy in the form of "latent" heat. As the material encounters a phase change at an approximately steady temperature, it can effectively maintain the thermal energy.51
[Fig. 73] Intervention point diagram (PCM Phase Change Energy x Temperature diagram retrieved and edited from https://thermtest.com/phase-change-material-pcm)
In this manner, it is projected that incorporating PCM into an enveloping element can ultimately enhance the thermal comfort of the related space. The charging and discharging (heat gain & loss) cycles can be repeated numerous times. Therefore, PCM can be effectively categorized as a thermal storage medium.
Although it is not common in the construction industry, the introduction of PCMs is preferred over other methodologies for several rationales, including their elevated heat of fusion, all-around availability, non-toxicity, cost-effectiveness, and comparatively minimal environmental impact while installing and maintaining. Additionally, PCMs are highly engineerable and available according to the desired temperature ranges.

[Fig. 74] PCM selection chart (the base graph retrieved from https://thermalds.com/phase-change-materials/)

75] Filtered PCM options (generated by the authors)
PCM's performance stands predominantly determined by its material property metrics, such as density, thermal conductivity, latent heat of fusion, phase change temperature, .etc. Further influential aspects often regarded are cycling stability, toxicity and flammability, re-cyclability, and cost-effectiveness.52
PCMs are mainly categorized into "organic", "inorganic", and "eutectic" according to their respective properties. Each class has a distinct range of thermochemical characteristics and operating temperatures, making some more suitable for specific applications than others.
The surveyed graph portrays the ranges of melting temperatures of various PCM kinds. Utilizing the chart, "hydrated salts", "paraffins" and "fatty acids" were determined to coincide the melting temperature range related with the heat exchanger input/output values.
In this manner, salt hydrates, an inorganic material, were preferred due to their ease of maintenance, wide range of customization options, low-volume change in-between phases, and non-flammable nature.

Within the "salt hydrates" class, Calcium Chloride Hexahydrate (CaCl2.6H2O) was selected as the PCM material due to its typical availability, and overall fit to the expected criteria.

Selected PCM phase change temperature graph (retrieved from the article Thermophysical parameters and enthalpy-temperature curve of phase change material(...) 53

There are two mainstream encapsulation techniques for PCMs. Micro-capsules are characterized as capsules with a diameter of less than 1 cm, while macroencapsulation refers to a broader range of applications, typically with a diameter of more than 1 cm.54
Respectively, macro-encapsulation of PCMs help the system
1) prevent significant phase separations; 2) quicken the pace of heat transmission; 3) give the PCM infill a self-supporting structure.
In complement to the intrinsic properties of PCMs, the capacity of energy economizing also relies heavily on the design of the structure, as well as the thickness and location of the respective enveloping PCM layer regarding the surrounding space within the envelope.55
Several studies indicate that the PCM layer should be positioned near by the heat source.56 For cooling performance to occur, the building element must have the PCM layer applied outside. On the other hand, it ought to be situated nearer the interior for heating performance purposes.57
In this manner, a PCM layer that is expected to harness the excess heat from the heat exchangers is envisioned as a porous panel system that will allow circulating the hot air around the PCM infill.

[Fig. 79] TPMS surface ability to subdivide a volume into two equal parts (retrieved from https://blog.fastwayengineering. com/3d-printed-gyroid-heat-exchanger-cfd)
The encapsulation method and its material need to meet particular criteria to be compatible with the building materials concerning the PCM it encapsulates:58
1) a shell formation around the PCM;
2) preventing the leakage of PCM when its molten;
3) should perform expected when encountering mechanical and thermal loads.
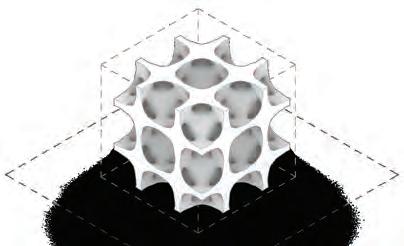
Examining the described parameters, an additive manufacturing potential for a macro-encapsulating shell is realized. The porosity attribute and the surface characteristics directed the focus to experiment with Triply Periodic Minimal Surfaces with the attributes described in the figure above.
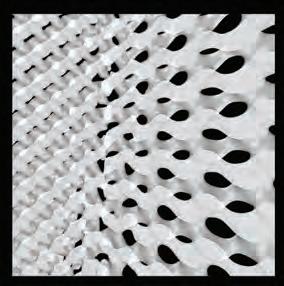
Triply Periodic Minimal Surfaces (TPMS) provide effective and passive ways to improve heat transfer performance.59 Their configurations, which include Schwarz-P, Diamond, Neovius, and Gyroid offer a high surface-area-to-volume ratio and comparatively complex geometries. Because of these characteristics, TPMS is suitable for high-temperature and high-pressure settings. In addition to their thermo-hydraulic characteristics, TPMS outperform conventional systems in heat transfer efficiency and pressure drop reduction.
Utilizing these surface definitions, various shell geometries have been tested to efficiently subdivide the volume into PCM infill and void spaces for hot air circulation. The resultant shells are attributed as TPMS-Based Porous Cellular Structures.
3


[Fig. 80] Selected TPMS types (generated by authors)

sin(x)*sin(y)*sin(z) + sin(x)*cos(y)*cos(z) + cos(x)*sin(y)*cos(z) + cos(x)*cos(y)*sin(z)
3*(cos(x)+cos(y)+cos(z)) + 4*cos(x)*cos(y)*cos(z) Gyroid Schwarz-P Diamond Neovius
sin(x) cos(y) + sin(y) cos(z) + sin(z) cos(x)


cos(x)+cos(y)+cos(z)


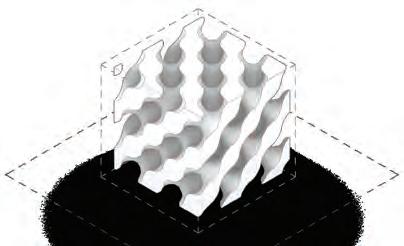


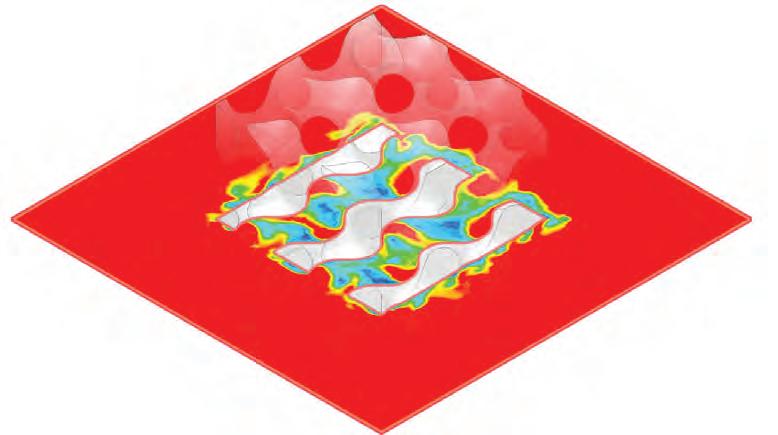
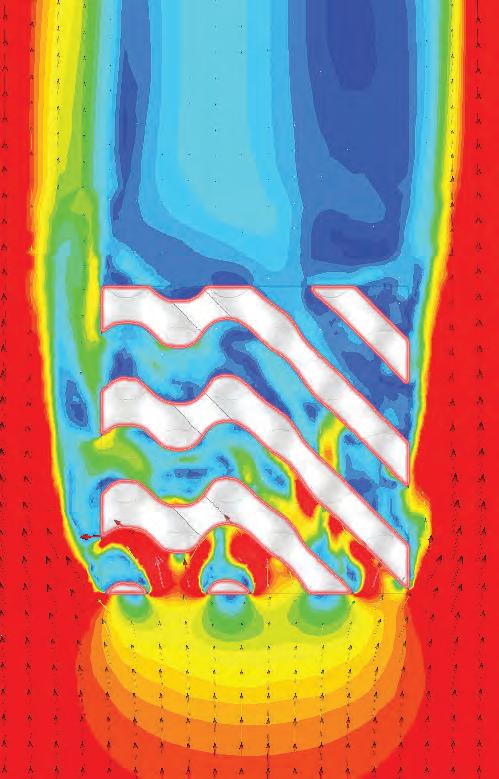
A series of computational fluid dynamics experiments were conducted to analyse and observe how different surface types respond to the output air characteristics from the heat exchanger. The hot air values were extracted from data sheets of the respective heat exchanger modules.
It was observed that while diamond and gyroid configurations perform better to re-direct the hot air, the pockets generated within the other two supplies potential heat traps.




[Fig. 84] Blended TPMS based cellular structure (generated by authors)
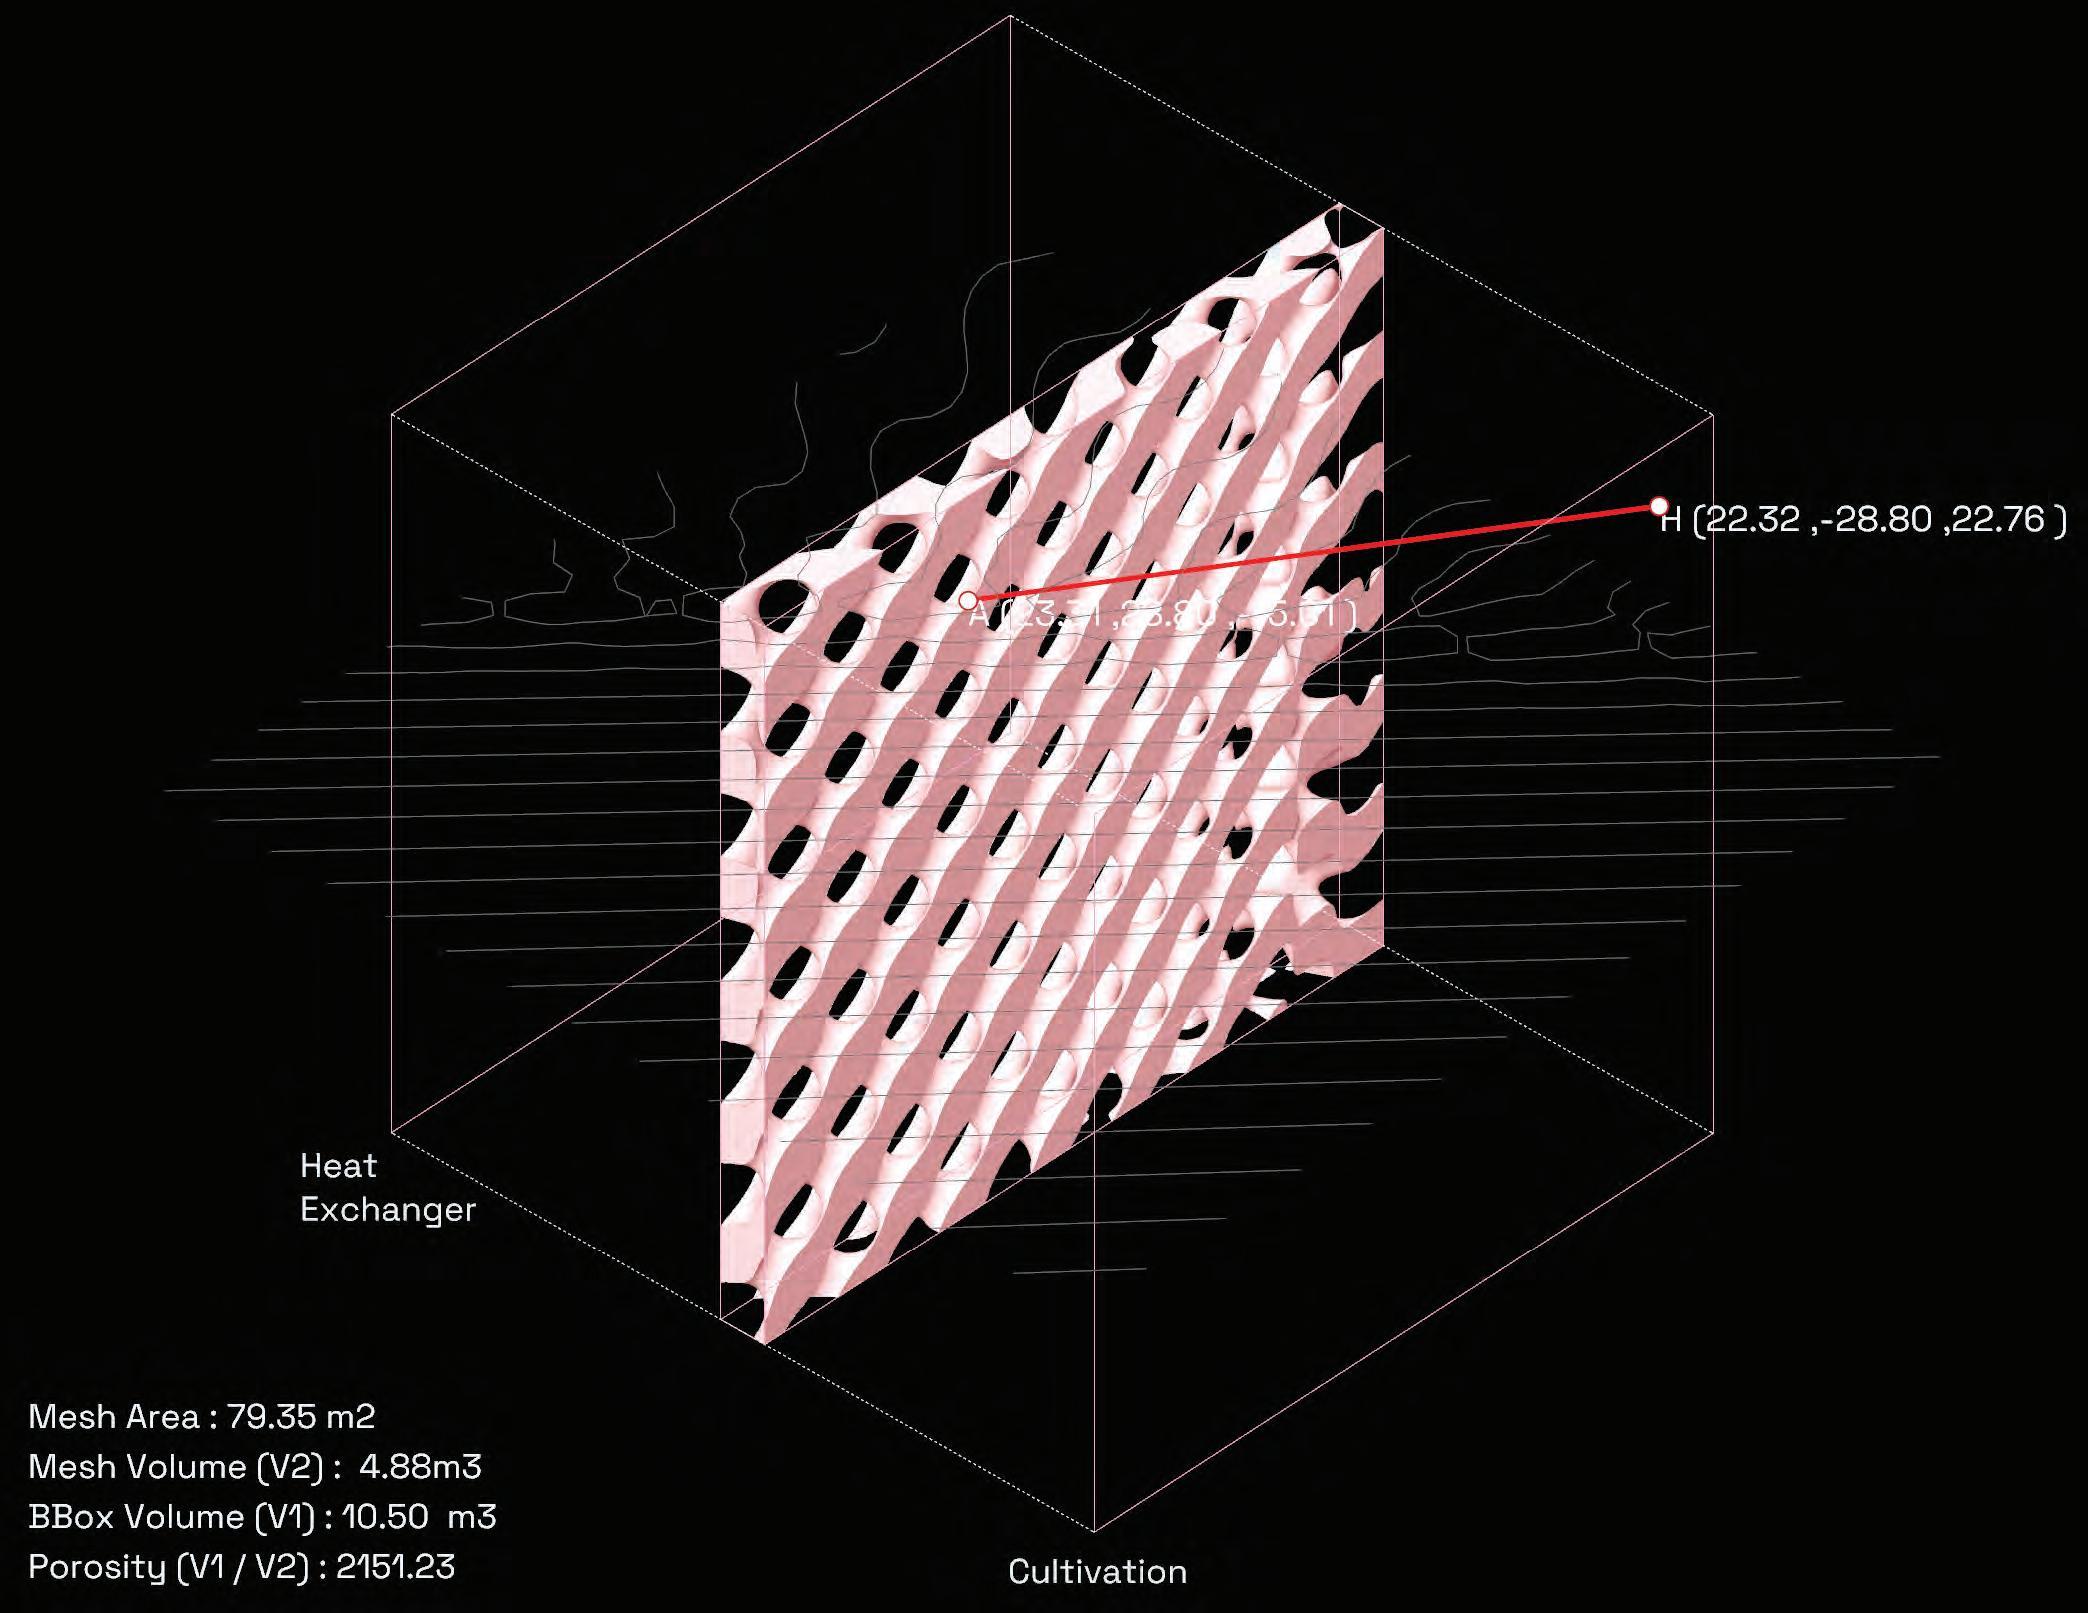
The achieved mathematical model, and generative shell generation pipeline allow multiple mathematical modifications of Blending multiple types and grading opportunities to be able to combine multiple advantages.




How can the proposed material system can be further customized in response to the space it inhabits ?

Gathering the capabilities, within the material system development; it was questioned how can the morphology of the shell can be customized in relation to the space it inhabits.
Regardingly combining a matrix of space x energy inputs with related equations, an adaptive panel configurator pipeline utilizing the blending and grading capabilities was achieved.





The experimental setup was employed as a proof of concept for investigating the impact of Phase Change Materials (PCM) on temperature changes within spaces. This experiment was conducted in two stages to generate comparable data.
The setup is comprised of several components: the ITE Tank, Heat Exchanger, Fan, TPMS Regulator Volume, and Cultivation Space. These names reflect our conceptualization of architectural spaces. To avoid ambiguity, the Cultivation Space can be referred to as Void Space, and the IT Tank can be designated as the Water Tank. In this configuration, hot water circulates between the Heat Exchanger and the Water Tank. As the Heat Exchanger’s temperature increases due to the circulating hot water, a fan transfers the heated air from the Heat Exchanger to the bottom surface of the TPMS Regulator Volume, from where it is circulated into the Void Space.


The only independent variable in this experiment is the TPMS Regulator Volume, which is responsible for transferring heat from the Heat Exchanger to the Void Space. The temperatures measured during the experiment, excluding that of the Water Tank (Sensor 01), include those of the Fan (Sensor 02), TPMS Regulator Volume (Sensor 03), and Void Space (Sensor 04). Sensors 02, 03 and 04 are considered dependent variables. Control variables include fan speed, water velocity, the upper threshold of water temperature, as well as the conditions of the heater, pipes, cables, and the surrounding environment.
In the first stage of the experiment, a gyroid-type TPMS with a void subvolume was used. In the second stage, a gyroid-type TPMS with a sub-volume filled with PCM (Calcium Chloride Hexahydrate) was utilized. The phase change temperature of Calcium Chloride Hexahydrate is 30°C.

The primary objective of this experiment was to assess the role of the TPMS gyroid surface in regulating the transfer of hot air from the heat exchanger to the Void Space (also referred to as the Cultivation Space). The focus of the study was on comparing the time required for the Void Space, when equipped with an empty gyroid surface versus a PCM-filled gyroid surface, to heat up and cool down. This comparison aimed to evaluate the impact of the PCM material on thermal regulation within the space.


In the experiment, multiple recording devices were employed for real-time data collection. Temperature variations were continuously monitored using thermal cameras positioned at two distinct locations, while key areas of the experimental setup were measured using four temperature sensors connected to a digital thermometer. Sensor data was recorded at 5-second intervals, creating tabular datasets for analysis. These values were subsequently plotted on a two-axis graph for further examination. Additionally, timelapse photography captured the physical changes every 15 seconds, ensuring comprehensive documentation of the experiment.


[Fig. 99] Experiment result plotted on a graph.
The target temperature range for the cultivation area was set between 25 and 28.5 degrees Celsius. The temperatures in the experiment were slightly higher than the required 18-24°C range for the Cultivation Space. This is because the Phase Change Material (PCM) used, Calcium Chloride Hexahydrate, has a phase change temperature of 30°C. As it was the PCM with the lowest phase change temperature available on the market, the experiment’s temperature was consequently higher. However, achieving the desired 18-24°C range is possible with PCMs that have lower phase change temperatures, which commercially can be available. Additionally, the experiment served as a proof of concept rather than a direct application.
When comparing the temperatures during the heating experiments, it was observed that the setup with the PCM-containing surface took longer to heat
up the Void Space compared to the setup without PCM. This indicates that the PCM material effectively absorbs heat during the process, slowing down the Void Space temperature increase which balances the fluctuation.
In the cooling experiments, the data collected indicates that the PCM continued to retain the heat it had absorbed. This retention of heat by the PCM contributed to regulating the temperature change in the Void Space.
The presence of PCM thus demonstrates its effectiveness in maintaining more stable temperature conditions within the Void Space.

[Fig. 100] Generating Archimedian solids.
In addressing the emerging space-filling (packing) problem, the process of truncation is considered crucial. Beyond the use of Platonic solids (regular polyhedra), Archimedean solids (semi-regular polyhedra) are generated by symmetrically slicing away the corners.
Through truncation, where the corners or edges are cut off, more faces are created, providing additional potential connection points. However, a balance must be maintained as the increase in connections needs to be carefully weighed against optimizing volume efficiency to achieve the most effective packing option ensuring the spatial necessities.


Fig.1 Sectioningstacked cubesperpendicularlytoany edgeproducestheregular(44). Sectioningperpendicularlytoa spacediagonalproducesthe regular(3 )andthequasiregular (3.6.3.6),iftheplanecontains theedges’midpoints
Fig.2 Sectioningstacked hexagonalprisms perpendicularlytothesixfold symmetryaxisproducesthe regular(63


The Bisymmetric Hendecahedron, Sphenoid Hendecahedron and Gyrobifastigium fulfilled the purpose of space-filling, but from the perspective of an architecturally feasible space, they comprised quite a few acute angles between their consecutive faces which resulted in a volume with a lot of ‘corner-like’ spaces. On the other hand the Rhombic Dodecahedron, Elongated Dodecahedron and Truncated Octahedron comprised of only right/ obtuse angles between their consecutive faces thereby serving as a better option for space-filling in the context of architectural space making.
Fig.3 Sectioningstacksof rhombicdodecahedraproduces theregular(44),iftheplaneis perpendiculartoafourfold symmetryaxis

Total Faces : 12
Quadrilateral Faces : 12
Polygonal Faces : 0
Fig.4 Sectioningstacksof elongateddodecahedraproduces theregular(44),iftheplaneis perpendiculartoafourfold symmetryaxis

Fig.5 Sectioningstacksof truncatedoctahedraproducesthe regular(44),iftheplaneis perpendiculartoafourfold symmetryaxisandcontainsa longdiagonalofthehexagonal faces
Fig.4 Sectioningstacksof elongateddodecahedraproduces theregular(44),iftheplaneis perpendiculartoafourfold symmetryaxis
The truncated octahedron, in comparison to the other two dodecahedrons, comprised more polygonal faces, all with the same proportions. This not only increased its potential of creating spatial variations within the same volume but also allowed more permutations and combinations for orienting one face to another face (either polygon to polygon or quadrilateral to quadrilateral).
Fig.6 Therearenoregularfacedtessellationsproducibleby sectioningstacksofBilinski’s rhombicdodecahedra.The tessellationofirregular hexagonscontainsmidpointsof someedges
Fig.5 Sectioningstacksof truncatedoctahedraproducesthe regular(44),iftheplaneis perpendiculartoafourfold symmetryaxisandcontainsa longdiagonalofthehexagonal faces
Total Faces : 12
Quadrilateral Faces : 8
Polygonal Faces : 4
Fig.6 Therearenoregularfacedtessellationsproducibleby sectioningstacksofBilinski’s rhombicdodecahedra.The tessellationofirregular hexagonscontainsmidpointsof someedges
This process of 'assembling' helped expand the spatial quality of the volume, which again depended on the face selected and its orientation in relation to the second face selected.

Total Faces 14
Quadrilateral Faces 6
Polygonal Faces 8


[Fig. 104] Single-surface exploration within the truncated octahedron.


After picking the truncated octahedron as the space-filling object, different vertices were joined and experimented to generate different surfaces thereby transitioning to space-making objects.


[Fig. 103] Multi-surface exploration within the truncated octahedron.
The number of surfaces generated within the truncated octahedron was increased to increase the definition of the space created. Different combinations of different surfaces was explored to generate architecturally feasible spaces. A pool of these space-making objects when 'assembled' using their space-filling bounding box (truncated octahedron), would allow for architectural expansion of the space. This also depended on which faces were used for 'assembling' and the spatial characteristics of the space-making object.


From the given pool, four space were picked. Two enabled 'closed' spaces while the other two enabled 'open' spaces. This 'closed' and 'open' nature, on 'assembling' was foreseen to create private and public spaces respectively.


Truncated octahedrons when more than one in number, have potential to 'assemble' amongst themselves when the plane of the same type of face were aligned on top one another (hexagonal face to hexagonal face and square face to square face).
For example, consider two space-making objects from the selected set of four, 'kindA' and 'kindB'. Step I is to select which planes will be allowed to 'assemble' (one hexagonal face from each object). Step II is to establish which is the 'sender' object and which is the 'receiver' object ('kindA' and 'kindB' respectively). Step III and Step IV is the outcome of this process of 'assembly'.
| rHi = rA < sN | SHi % iW
(receiver name) | (connecting plane index) = (rotation angle of receiver connecting plane) (sender name) | (connecting plane index) (weight of the rule)
[Fig. 107] How to 'assemble'? How to describe an 'assembly'?


[Fig. 105] Selected space-making objects with their respective connecting planes.


[Fig. 106] Selected space-making objects with their respective connecting planes and circulation paths.
The spatial quality of the output depends on the geometry of the space-filling object, the geometry of the space-making object, the selection of the planes and the selection of the sender and receiver.
Each of these outputs is considered as a 'rule'. There could be as many as rules as required hence each of these 'rules' had to have a specific nomenclature to allow easy evaluation.
With this methodology of assembling the space-making objects, each of the four objects were assessed and planes (faces of the space-filling object) which facilitated "space-making" during this process of assembling were selected.
For example, in the space-making object 'kindA', the connecting planes are labelled based on the type of space they create. This is why it has two connecting planes labelled as type 3 or type 6 or type 9 or type 10 but only one connecting plane labelled as type 1.
3.7.5 - Circulation Paths
In order to evaluate the space in the entire 'assemblage' of space-making objects, each of these objects have been incorporated a 'circulation path'. When two or more space-making objects are assembled, these circulation paths also assemble simultaneously which emphasizes the nature of 'connectivity' of these space-making objects. The circulation paths had been articulated as per how the space had been presumed to be navigated once the process of assembly was concluded.


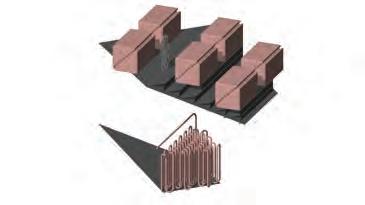


Furthermore, we conceptualized defined assembly objects that integrate multiple functional qualities within single space-making elements. These objects demonstrate a variety of adaptive options, allowing them to adjust effectively to changes in spatial organization. By designing these object types with consideration for various possible scenarios and functional allocations, the component created versatile components that show great promise. They are ready for assemblage within larger organizational structures, enhancing the adaptability and functionality of the overall system.
By visualising these possible scenarios, the rule for aligning the connecting planes had been derived. This not only provided more control in the assembling process but also helped omit unnecessary assemblies or assemblies which had limited potential in terms of space-making.
For example, connecting plane type 1 was allowed to align itself with a connecting plane type 1 only while connecting plane type 3 could align itself with connecting plane type 2 and type 3.
[Fig. 109] All heuristics with the defined set of space-making objects - Isometric View.

0. kindA|0=0<kindA|0%1
1. kindA|0=0<kindB|0%1
2. kindA|1=0<kindA|1%1
3. kindA|1=0<kindA|2%1
4. kindA|1=0<kindB|1%1
5. kindA|1=0<kindB|2%1
6. kindA|2=0<kindA|1%1
7. kindA|2=0<kindA|2%1
8. kindA|2=0<kindB|1%1
9. kindA|2=0<kindB|2%1
10. kindA|3=0<kindC|0%1
11. kindA|3=0<kindC|1%1
12. kindA|4=0<kindC|0%1
13. kindA|4=0<kindC|1%1
14. kindA|5=0<kindA|3%1
15. kindA|5=0<kindA|4%1
16. kindA|5=0<kindC|2%1
17. kindA|5=0<kindC|3%1
18. kindA|6=0<kindA|3%1
19. kindA|6=0<kindA|4%1
20. kindA|6=0<kindC|2%1
21. kindA|6=0<kindC|3%1
22. kindB|0=0<kindA|0%1
23. kindB|0=0<kindB|0%1
24. kindB|1=0<kindA|1%1
25. kindB|1=0<kindA|2%1
26. kindB|1=0<kindB|1%1
27. kindB|1=0<kindB|2%1
28. kindB|2=0<kindA|1%1
29. kindB|2=0<kindA|2%1
30. kindB|2=0<kindB|1%1
31. kindB|2=0<kindB|2%1
32. kindB|3=0<kindB|3%1
33. kindB|3=0<kindB|4%1
34. kindB|4=0<kindB|3%1
35. kindB|4=0<kindB|4%1
36. kindB|5=0<kindB|5%1
37. kindB|5=0<kindB|6%1
38. kindB|6=0<kindB|5%1
39. kindB|6=0<kindB|6%1
40. kindB|7=0<kindB|7%1
41. kindB|7=0<kindB|8%1
42. kindB|7=0<kindD|0%1
43. kindB|8=0<kindB|7%1
44. kindB|8=0<kindB|8%1
45. kindB|8=0<kindD|0%1
46. kindC|0=0<kindA|3%1
47. kindC|0=0<kindA|4%1
48. kindC|0=0<kindC|2%1
49. kindC|0=0<kindC|3%1
50. kindC|1=0<kindA|3%1
51. kindC|1=0<kindA|4%1
52. kindC|1=0<kindC|2%1
53. kindC|1=0<kindC|3%1
54. kindC|2=0<kindA|5%1
55. kindC|2=0<kindA|6%1
56. kindC|2=0<kindB|7%1
57. kindC|2=0<kindB|8%1
58. kindC|2=0<kindD|0%1
59. kindC|3=0<kindA|5%1
60. kindC|3=0<kindA|6%1
61. kindC|3=0<kindB|7%1
62. kindC|3=0<kindB|8%1
63. kindC|3=0<kindD|0%1
64. kindD|0=0<kindB|7%1
65. kindD|0=0<kindB|8%1
66. kindD|0=0<kindD|0%1
67. kindD|1=0<kindA|7%1
68. kindD|1=0<kindA|8%1


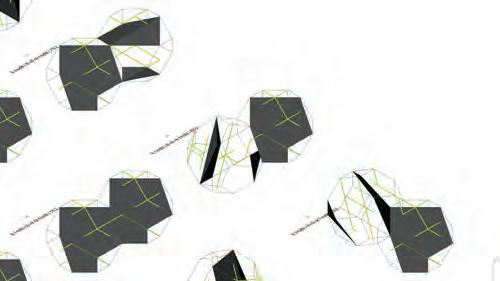


Certain rules when analysed lacked the ability to combine and expand the spatial characteristics of the space-making objects. There had been a distinct separation of spaces which had also been observed in the connectivity of the circulation paths of the respective space-making objects.
To avoid compartmentalisation and discontinuity of spaces in the overall assemblage these dysfunctional set of rules were omitted and not considered for the assemblage simulation.
[Fig. 111] All heuristics with the defined set of space-making objects with rules that have been omitted - Top View.

0. kindA|0=0<kindA|0%1
1. kindA|0=0<kindB|0%1
2. kindA|1=0<kindA|1%1
3. kindA|1=0<kindA|2%1
4. kindA|1=0<kindB|1%1
5. kindA|1=0<kindB|2%1
6. kindA|2=0<kindA|1%1
7. kindA|2=0<kindA|2%1
8. kindA|2=0<kindB|1%1
9. kindA|2=0<kindB|2%1
10. kindA|3=0<kindC|0%1
11. kindA|3=0<kindC|1%1
12. kindA|4=0<kindC|0%1
13. kindA|4=0<kindC|1%1
14. kindA|5=0<kindA|3%1
15. kindA|5=0<kindA|4%1
16. kindA|5=0<kindC|2%1
17. kindA|5=0<kindC|3%1
18. kindA|6=0<kindA|3%1
19. kindA|6=0<kindA|4%1
20. kindA|6=0<kindC|2%1
21. kindA|6=0<kindC|3%1
22. kindB|0=0<kindA|0%1
23. kindB|0=0<kindB|0%1
24. kindB|1=0<kindA|1%1
25. kindB|1=0<kindA|2%1
26. kindB|1=0<kindB|1%1
27. kindB|1=0<kindB|2%1
28. kindB|2=0<kindA|1%1
29. kindB|2=0<kindA|2%1
30. kindB|2=0<kindB|1%1
31. kindB|2=0<kindB|2%1
32. kindB|3=0<kindB|3%1
33. kindB|3=0<kindB|4%1
34. kindB|4=0<kindB|3%1
35. kindB|4=0<kindB|4%1
36. kindB|5=0<kindB|5%1
37. kindB|5=0<kindB|6%1
38. kindB|6=0<kindB|5%1
39. kindB|6=0<kindB|6%1
40. kindB|7=0<kindB|7%1
41. kindB|7=0<kindB|8%1
42. kindB|7=0<kindD|0%1
43. kindB|8=0<kindB|7%1
44. kindB|8=0<kindB|8%1
45. kindB|8=0<kindD|0%1
46. kindC|0=0<kindA|3%1
47. kindC|0=0<kindA|4%1
48. kindC|0=0<kindC|2%1
49. kindC|0=0<kindC|3%1
50. kindC|1=0<kindA|3%1
51. kindC|1=0<kindA|4%1
52. kindC|1=0<kindC|2%1
53. kindC|1=0<kindC|3%1
54. kindC|2=0<kindA|5%1
55. kindC|2=0<kindA|6%1
56. kindC|2=0<kindB|7%1
57. kindC|2=0<kindB|8%1
58. kindC|2=0<kindD|0%1
59. kindC|3=0<kindA|5%1
60. kindC|3=0<kindA|6%1
61. kindC|3=0<kindB|7%1
62. kindC|3=0<kindB|8%1
63. kindC|3=0<kindD|0%1
64. kindD|0=0<kindB|7%1
65. kindD|0=0<kindB|8%1
66. kindD|0=0<kindD|0%1
67. kindD|1=0<kindA|7%1
68. kindD|1=0<kindA|8%1
[Fig. 112] All nominated heuristics with the defined set of space-making objects - Top View.

0. kindA|0=0<kindA|0%1
1. kindA|0=0<kindB|0%1
2. kindA|1=0<kindB|1%1
3. kindA|1=0<kindB|2%1
4. kindA|2=0<kindB|1%1
5. kindA|2=0<kindB|2%1
6. kindA|3=0<kindC|0%1
7. kindA|3=0<kindC|1%1
8. kindA|4=0<kindC|0%1
9. kindA|4=0<kindC|1%1
10. kindA|5=0<kindA|3%1
11. kindA|5=0<kindA|4%1
12. kindA|5=0<kindC|2%1
13. kindA|5=0<kindC|3%1
14. kindA|6=0<kindA|3%1
15. kindA|6=0<kindA|4%1
16. kindA|6=0<kindC|2%1
17. kindA|6=0<kindC|3%1
18. kindB|0=0<kindA|0%1
19. kindB|1=0<kindA|1%1
20. kindB|1=0<kindA|2%1
21. kindB|2=0<kindA|1%1
22. kindB|2=0<kindA|2%1
23. kindB|3=0<kindB|4%1
24. kindB|4=0<kindB|3%1
25. kindB|5=0<kindB|6%1
26. kindB|6=0<kindB|5%1
27. kindB|7=0<kindD|0%1
28. kindB|8=0<kindD|0%1
29. kindC|0=0<kindA|3%1
30. kindC|0=0<kindA|4%1
31. kindC|0=0<kindC|2%1
32. kindC|0=0<kindC|3%1
33. kindC|1=0<kindA|4%1
34. kindC|1=0<kindC|2%1
35. kindC|1=0<kindC|3%1
36. kindC|2=0<kindA|5%1
37. kindC|2=0<kindA|6%1
38. kindC|2=0<kindD|0%1
39. kindC|3=0<kindA|5%1
40. kindC|3=0<kindA|6%1
41. kindC|3=0<kindD|0%1
42. kindD|0=0<kindB|7%1
43. kindD|0=0<kindB|8%1
44. kindD|1=0<kindA|7%1
45. kindD|1=0<kindA|8%1
Following the development of spatial objects and the definition of their sender-receiver relationships, we conducted multiple experiments using assembling simulations. The primary objective was to explore how these spatial objects organize themselves under different conditions and to test the efficacy of the sender-receiver logic in guiding the assembly process. Initial observations indicated a wide range of organizational patterns, prompting a deeper investigation into the role of environmental directionality in achieving controlled spatial configurations.
In the absence of directionality, the assembling simulations yielded a wide variety of organizational patterns. Each iteration produced different configurations, influenced by the starting positions and orientations of the spatial objects. While these random organizations confirmed that the sender-receiver relationship logic functions correctly, they also revealed a lack of consistent guiding factors, resulting in uncontrolled and unpredictable assemblies. This observation highlighted the need for an additional mechanism to direct the assembly process toward more meaningful and purposeful spatial organizations.

Iteration 00

Iteration 04

Iteration 09

Iteration 14
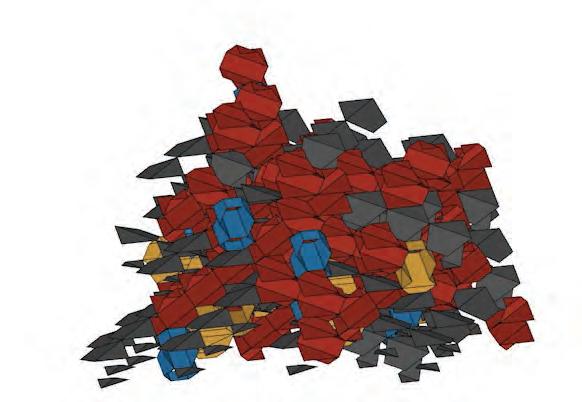
Iteration 19
[Fig. 113] Iterations of the assembly experiment.

Iteration 24


In this experiment, a horizontal field was generated within a confined environment, defined by vectors oriented along the horizontal axis. The assembling process was conducted under these conditions to assess how the spatial objects would respond to a unidirectional field.
The assembled objects predominantly exhibited horizontal growth, aligning with the directionality of the field vectors. Although some vertical growth occurred, it was primarily due to the inherent connections between different assembly objects. This vertical expansion was more evident when adjusting the growth parameters, such as increasing or decreasing the number of objects and observing their development over multiple steps.
Building upon the first case, the second experiment introduced a dualdirectional field encompassing both horizontal and vertical vectors. The initial spatial object was placed within this environment to observe how the assembly process adapts to multiple directional influences. Building upon the first case, the second experiment introduced a dual-directional field encompassing both horizontal and vertical vectors. The initial spatial object was placed within this environment to observe how the assembly process adapts to multiple directional influences
Initially, the assembly growth followed a singular direction corresponding to the immediate field vectors. As the assembly expanded and crossed into regions influenced by the second directional field, it began to exhibit growth patterns aligned with the new direction. This behaviour illustrates the assembly’s capacity to adapt to varying environmental cues, modifying its organizational structure in response to changes in field directionality. The experiment demonstrated that by designing fields with specific directional properties, we could effectively control and predict the assembly’s spatial organization.
The conducted experiments affirm the critical importance of directional fields in controlling the assembly process of spatial objects. The integration of environmental directionality transforms random and uncontrolled organizations into purposeful and adaptable spatial configurations. This approach not only validates the sender-receiver relationship logic but also extends its applicability by introducing an additional layer of control through environmental cues.
The necessity of directional fields raises pertinent questions regarding their development and the criteria used to define them.
The modular design of this project, combined with the “kit of parts” strategy, offers significant flexibility, scalability, and efficiency, making it ideal for integrating a data centre with agricultural spaces. Modularity is crucial in both modern agricultural facilities and contemporary data centres. In data centres, it allows for easier capacity adjustments, while in agricultural areas, modularity accommodates seasonal variations in crop volumes and harvest times.
Additionally, the use of prefabricated modular elements reduces construction time and minimizes traffic disruptions and environmental impact, particularly in a dense urban context like London. This approach also facilitates future expansion or downsizing. The “kit of parts” strategy enhances adaptability by enabling standardized components to be easily assembled, disassembled, or replaced, ensuring that the building can evolve over time to meet changing needs while maintaining a consistent architectural language.
[Fig. 116] Modularity
The distribution of programs within the building was designed according to a specific hierarchy. This hierarchy was developed by first identifying the essential programmes needed in their simplest form and then determining more niche, specialized functions.
For instance, circulation areas, which facilitate movement and communication between different programmes, and the core structure, which serves both functional and structural roles, were prioritized. Once the locations of these primary elements were set, the placement of heat exchangers—critical for connecting the IT and Cultivation areas—was determined, ensuring they had access to airflow. The IT and Cultivation spaces were then positioned in direct contact with the heat exchangers. Finally, the locations of other technical and service areas were determined with the aim of establishing a cohesive hierarchy among all the programmes.
The project seeks to integrate the data centre with agricultural spaces, merging a traditionally private, high-security, industrial typology with communityfocused agricultural activities. These activities create opportunities for a mixed-use program that encourages public participation.
In London, where urban farms serve as community hubs, the project fosters engagement through a program shaped by local input. This integration establishes a connection between technology and nature that supports local food production and community involvement. Architecturally, the design blurs the boundaries between private infrastructure and public space, aiming to position the project as a model for urban resilience and social inclusion.

In this study, site selection uses data sampling by overlaying multiple spatial maps. This approach is essential for identifying optimal locations for a data centre that integrates urban farming and supports public engagement. It enables a comprehensive analysis of various spatial factors, ensuring that the chosen site meets operational needs while promoting sustainable urban development and community integration.
Setup- By overlaying maps such as Population Density, Network Connectivity, Industry Density, Data Centre Locations, and Urban Farm Locations at an urban scale, areas meeting multiple criteria can be assessed simultaneously.


Displays broadband service coverage across London, highlighting data-intensive locations.
These regions are ideal for establishing data centres, as high network bandwidth ensures reliable data transmission and supports the increasing demand for cloud services and connectivity. These locations are particularly suited for facilities handling real-time applications and large-scale data processing.
Maps areas with high concentrations of computer programming and consultancy professionals.
Locating data centres near these hubs provides a technical advantage, as these professionals typically require large-scale, low-latency infrastructure to support software development, testing, and deployment. The demand for scalable and efficient computing resources makes these areas strategic for data storage and processing facilities.
Shows regions where financial services professionals are concentrated, excluding insurance and pension funding.
Data centres near these financial hubs must prioritize low-latency operations to support real-time transactions, analytics, and algorithmic trading. These locations also demand heightened security and compliance, making them critical for financial data processing and secure data storage.

Highlights concentrations of individuals working in the information services sector, implying data-intensive activity in these areas.
Data centres in such regions can benefit from proximity to a high number of information service professionals, who require continuous access to cloud platforms and storage solutions. The density of digital activity in these areas also increases demand for fast, local data processing and storage solutions.

Indicates areas where professionals in scientific research and development are concentrated.
Data centres situated in close proximity to these regions can support the vast computing power required for research activities, such as simulations, data modelling, and AI-driven experiments. These locations are also ideal for handling highthroughput data from research institutions, ensuring smooth operations for data-heavy workflows.

Identifies areas with high population density, indicating higher data consumption.
As like Population Density Map, Age could point out the location of younger people who Highlights locations with a younger demographic, who typically consume more data compared to older populations.

These areas will be weighted according to their relevance to the project’s goals and aggregated to produce a composite score for each location. This approach ensures that the selected sites maximize operational efficiency, community integration, and environmental benefits, ultimately supporting the design of a sustainable and community-oriented data centre in London. This layered approach, combined with a weighting system, helps pinpoint optimal locations for development.
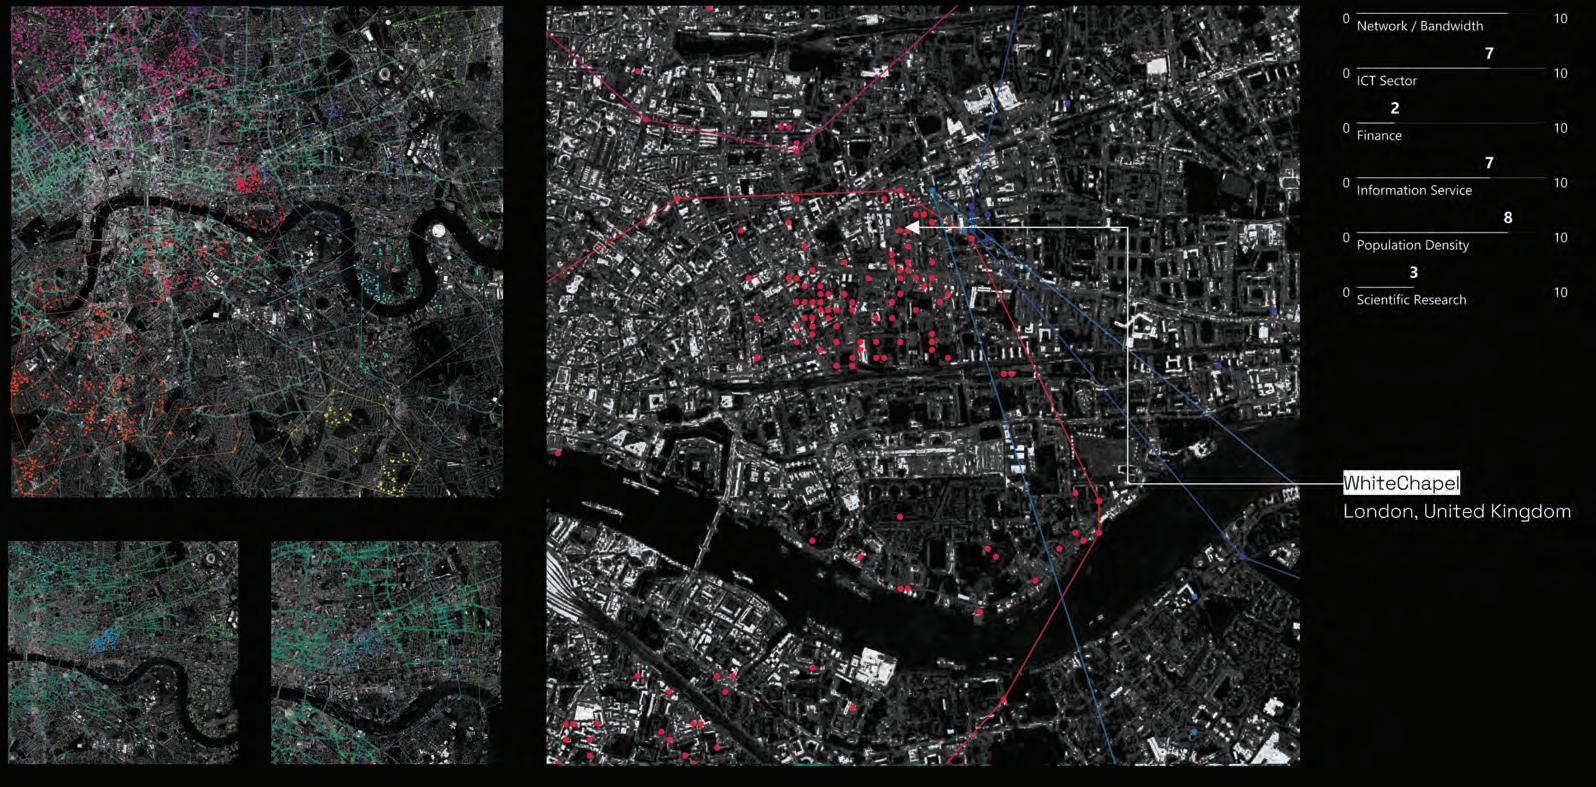
[Fig.
Whitechapel has been chosen as the ideal location for the data centre experiment after a thorough analysis of multiple factors, each weighted based on its importance. The selection process involved overlaying maps of population density, network bandwidth, and key sectors such as information services, ICT, finance, and scientific research. By weighting these factors, it became clear that Whitechapel offers a perfect balance of data-intensive activity, fast broadband coverage, and proximity to tech and finance professionals. The area’s high population density suggests a demand for greater data consumption, while its strong broadband network ensures reliable, low-latency connectivity. Furthermore, Whitechapel’s closeness to the ICT and information services sectors provides access to a skilled workforce, essential for maintaining and expanding data infrastructure. The finance and scientific research hubs nearby also demand advanced, secure data processing and storage.


The site boundary has undergone voxelization, where it has been divided into individual voxels, each measuring 4x4 meters. This segmentation is based on a uniform unit area, allowing for detailed spatial analysis. These voxels can subsequently be used in the process of field finding, enabling a more precise examination of spatial relationships and environmental influences across the site. This method enhances the ability to generate a refined and context-aware directional field within the spatial assemblage.
The concept of a field in architecture describes a space of propagation and effects—a continuum where the focus is on relationships and interactions rather than discrete objects. As Sanford Kwinter60 noted in 1986, “It contains no matter or material points, rather functions, vectors, and speeds.” In the context of architectural assemblage, fields are conceived as systems that encode distributed environmental information, influencing the assembly process as it unfolds. They can guide the assemblage to follow the intensity of certain environmental signals—such as light gradients, acoustic properties, or thermal conditions—using scalar values. They may also prefer specific component orientations—such as aligning openings towards prevailing winds or views—via vector values. Additionally, fields can determine which subset of assembly rules to apply in certain regions of space by assigning weight values, thereby shaping the architectural outcome in response to contextual factors.

[Fig. 122] Voxelization of the site.


The voxelized cells process has been further parametrized based on orientation and plane changes, allowing for better flexibility in adapting to optimization criteria. This parametrization enables the assembly to adjust more effectively, improving its performance and responsiveness to varying environmental and structural conditions.


The voxelized cells process has been further parametrized based on orientation and plane changes, allowing for greater flexibility in adapting to optimization criteria. This enhanced parametrization enables the assembly to adjust more effectively, improving its performance and responsiveness to varying environmental and structural conditions.


Criteria 1: Maximizing Wing Flow

The site is analysed for wind flow using Computational Fluid Dynamics (CFD) across multiple levels to generate 3-dimensional vectors. The analysis shows that wind flow is restricted at lower levels due to the presence of neighbouring buildings, while higher altitudes experience significant wind flow. This observation indicates that the spatial organization must be informed by CFD analysis to optimize the design. Allowing wind to flow through the site is essential for improving the ventilation of heat exchangers and regulating the temperature within cultivation units. Integrating CFD insights into the spatial design can enhance airflow and thermal management.
Criteria 2: Minimizing Heat Gain
The objective is designed to optimize the field by identifying directions that minimize heat gain for each unit within the global formation. Simultaneously, it serves as a filter to vector directions where potential aggregation of cultivation units can be most effectively deployed. To enhance this process, a solar analysis was conducted on the site to determine the Universal Thermal Climate Index (UTCI) values. These values were then used to guide the optimization, adjusting the orientation of faces to minimize heat gain based on solar exposure. This approach ensures that the spatial organization is both energy-efficient and strategically aligned with the site’s environmental conditions, supporting the optimal deployment of cultivation units while reducing overall heat accumulation.


Criteria 3: Maximising Visibility
Incorporating Volumetric Visibility Analysis (VVA) into our study arises from its significant impact on enhancing spatial organization and architectural qualities within urban environments. Traditional spatial analysis methods often overlook the intricate ways in which visibility influences both the functionality and the perceptual experience of architectural spaces. By quantifying relative visibility, VVA provides a framework for understanding and optimizing how spaces are organized and experienced by users.
However, in complex urban sites, assessing visibility requires a more nuanced approach. Our study measures visibility in three ways, focusing on vectors and vector planes that influence spatial organization. By quantifying visibility as a fraction of vector planes representing directional fields in space, we can analyse how these vectors interact with the site’s geometry and how they can be manipulated to enhance spatial configurations.
4: Maximum Site Capacity
This criterion is established to optimize the site’s maximum potential for global assembly by quantifying and enhancing its capacity to accommodate assembly processes. The maximum potential is measured by assessing spatial parameters such as available volume, connectivity, and accessibility, which collectively determine how effectively the site can support assembly directions based on field logic. The generation of a field that identifies optimal assembling directions serves as a guide for assembling or disassembling components, ensuring efficient spatial configurations.
Adaptive spatial organization refers to the site’s ability to modify its spatial configurations dynamically to meet changing functional requirements or environmental conditions. It involves the strategic arrangement and reconfiguration of spatial units to optimize performance and usability. The changing demands pertain to future scenarios where user needs, technological advancements, or environmental factors necessitate alterations in the spatial setup. By incorporating flexibility into the assembly capacity, the site can efficiently respond to these evolving demands while maintaining optimal performance in its assembly processes.


A simulation of 25 generations, each consisting of 50 individuals, was conducted, resulting in a total pool of 1,250 generations. Each individual was evaluated based on four fitness values. Utilizing multi-objective algorithms, 111 Pareto front solutions were identified for further consideration.
A parallel coordinate plot analysis revealed that as generations progressed, fitness values for FC2 (minimizing heat gain) and FC4 (maximizing capacity) improved. However, FC1 (maximizing wind flow) and FC3 (maximizing visibility) exhibited variability, which is expected when expanding the pool of potential solutions. Despite these variations, the average of all fitness values remained relatively consistent when mapped within the same domain. Based on the selection strategy, the top 12 solutions were chosen for the next phase of the process as potential field data, ensuring a balance between optimizing wind flow, visibility, heat gain, and capacity.


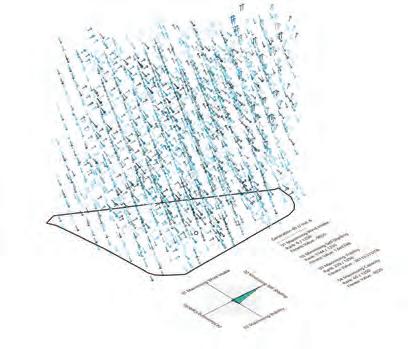


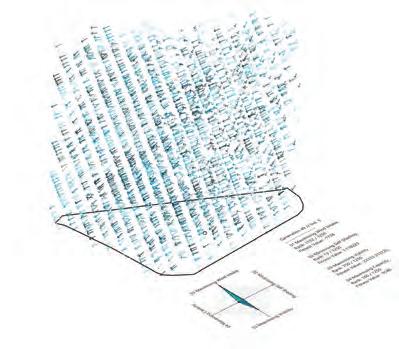


[Fig. 130] Graded Field Post Optimization

[Fig. 131] Optimal and Suboptimal Zones
After optimising the field based on various criteria, a post-processing phase refines the design by defining constraints and voids informed by contextual information and conventional architectural strategies. The field is divided into two key components: vector and scalar data. Vector data stores the directionality of spatial organization, guiding the orientation and alignment of elements within the site. Meanwhile, scalar data contains weighting information, offering additional flexibility in controlling the global assemblage.
Post-processing is primarily influenced by the optimized orientation of windward faces. Based on the angle of incidence, voxels are graded according to their performance values. As illustrated in the diagram, the blue faces represent higher-performing voxels, whereas the red faces indicate lowerperforming, or suboptimal, voxels within the volume.

132] Translating the wind data from the planes into volumes of space.
Consequently, the divided voxels have been transformed into a directional field. Following post-processing, the poorly performing voxels "identified based on performance grading" have been allocated for service areas and the central circulation system, optimizing spatial organization by reserving suboptimal zones for necessary infrastructural elements.

[Fig. 133] Selection of suboptimal zones based on the wind data.
By further rationalizing the suboptimal zones, we establish a core based on centrality and connectivity within the volumetric site. This core enhances spatial organization by reallocating lower-performing areas to optimize the site’s layout. This critical step enables the initiation of the assembly process.
4.4.1

[Fig. 134] Suboptimal zone to be ignored for assemblage simulation.
The suboptimal zone has been established and is ignored for the assemblage simulation. Since it is the area experiencing less wind flow, it is reserved for the function of an architectural core.

[Fig. 135] Initiating the assemblage simulation.
With the core and the field set up, the assemblage simulation is initiated with an object count of 600 units for the given site and conditions. This count is dependant on the site conditions and the requirements and changes with the change in context.


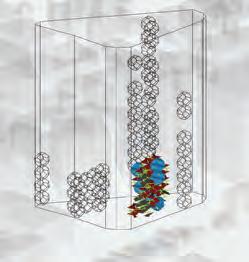

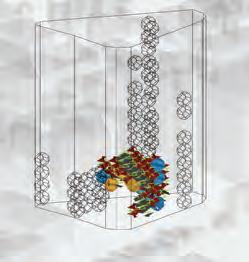
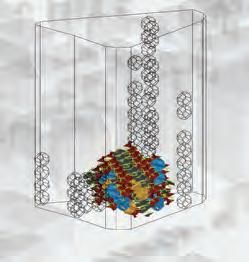


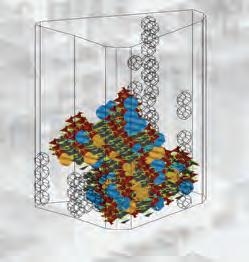
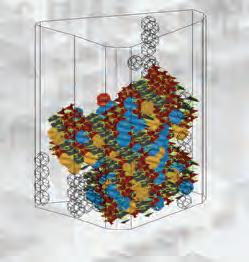

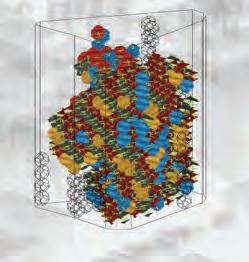
The simulation involves assembling the previously defined space-making objects (kindA, kindB, kindC, kindD) in the manner of their space-filling object (truncated octahedron) with the filtered set of rules (46 rules allowed) and which are further guided by the scalar and vector values of the environmental conditions (field).

137] Generated assemblage.
The simulation generates an assemblage of a space-making objects which are 'connected' to one another.

[Fig. 138] Evaluating the circulation paths.
The 'connected' space-making objects are evaluated using the network of circulation paths which were also 'connected' during the assemblage simulation.

[Fig. 139] Standardising the space-making objects.
For further analysis, the existence of the different kinds of space-making objects have been ignored and the entire assemblage was examined as one.
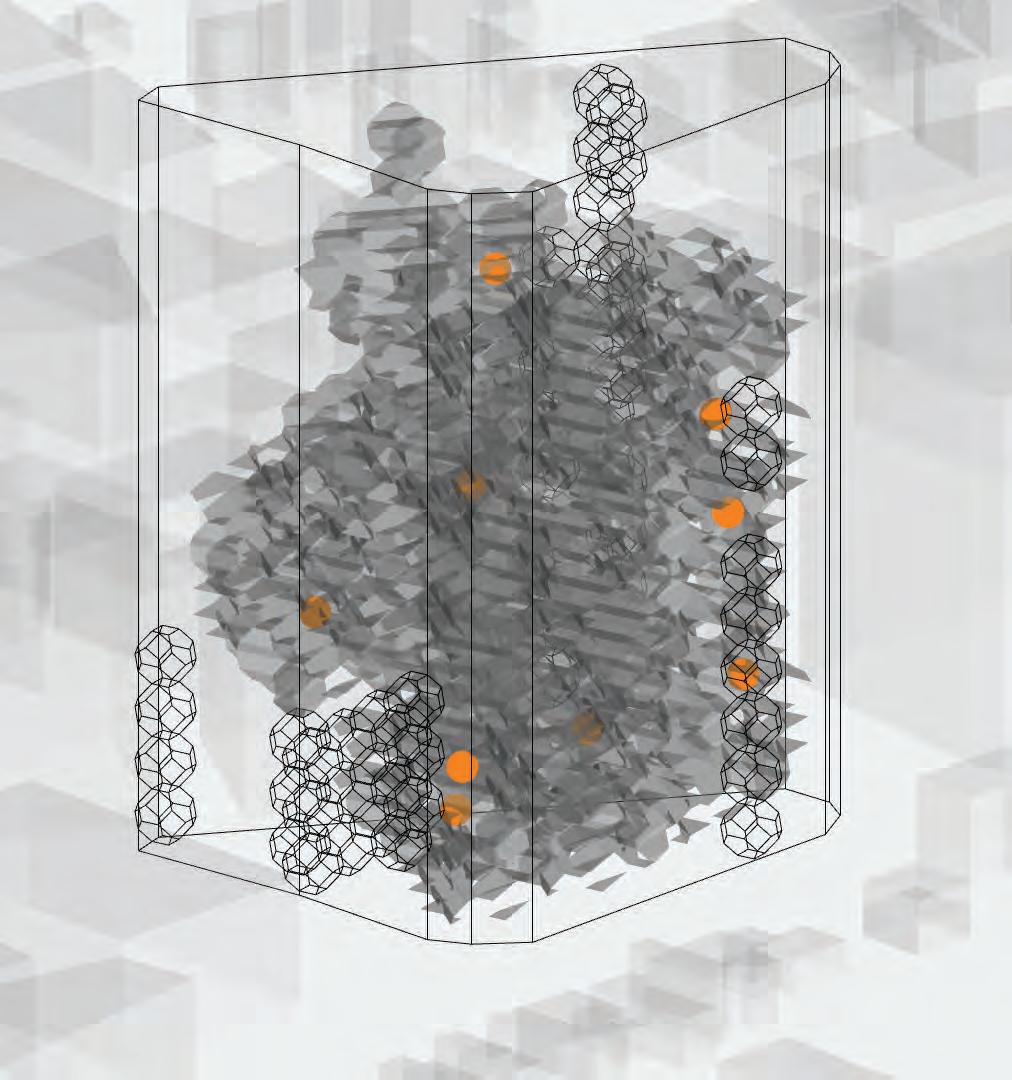
[Fig. 140] Generation of node points.
A parameter for clustering by distance had been introduced for the assemblage and it is interpreted to be catering as a node for the given proximity.


Each cluster has a given number of nearby space-making objects depending on the input distance parameter and location of the node point.
Each of the clusters is foreseen to comprise all components of a data centre, thereby functioning as a 'mini' data centre in the assemblage.


The nodes are interpreted as primary nodes, and connecting them would yield a transition space architecturally.
Also, the assemblage generates more than one network system because depending on the rule and orientation of connection of the space-making objects, the circulation paths do not always connect to one another implying that the space generated are two separate spaces.


Because of the discontinuity of the network system, the largest network of the system had been considered for analysis to enable maximum connectivity within the system.
Dijkstra's shortest path algorithm had been utilized to calculate the optimum circulation route for the required set of paths.

algorithm
A preliminary circulation route had been generated connecting the nodes of each of the assemblage clusters.

The space-making objects existing along this shortest path is interpreted and further detailed as the circulation space of the assemblage comprising of corridor spaces, atriums, congregation spaces, etc.

For the remaining components of a data centre, a set of proportions had been established for the allocated volume for the remaining functions. These were variable parameters which were dependant on the requirement of the programmes for the given context and the spatial efficiency of the individual programmes proposed.

For the current site conditions and demand, the programmatic ratios in the assemblage were as follows:
HEX - 4 parts
Cultivation - 8 parts
IT - 8 parts
Power - 2 parts
Service - 3 parts
These programmes were also classified as a hierarchy and their allotment was conducted in the corresponding order.


Starting with the HEX, the closest set of space making objects were allocated to allow the intake of maximum dry air from the context.

The heat exchangers had been assigned.


With the HEX in place, the cultivation units were next in hierarchy which were in the closest proximity to the HEX as well as above them to passively assist in the flow of hot air.

The cultivation spaces had been assigned.


The ITE spaces had been allotted around the centre of the cluster after establishing the HEX and cultivation spaces.


The centroid of each assemblage cluster was calculated and as per the required ratio of ITE spaces, the nearest space-making objects were reserved for ITE.

The ITE spaces had been assigned.


Similar to the allotment of ITE spaces, the power supply spaces were next in hierarchy. The required ratio of power supply spaces were allotted by calculating the nearest space-making objects to the average location of all the ITE spaces.


The unassigned space-making objects were interpreted as other extra/ auxiliary/ service spaces in the day to day functioning of a data centre.


The post processing of this computational workflow concluded with each space-making object being allocated a data centre program. But these were all dependant on a set of input variable parameters. For example, changing the seed for cluster formation would yield a completely different node configuration which would in turn impact the entire programmatic allocation.

[Fig. 160] Architectural feasibility of the assemblage.
To assess if a given outcome of the programmatic division workflow is the ideal solution for the given site, each assemblage was analysed based on certain performance values.


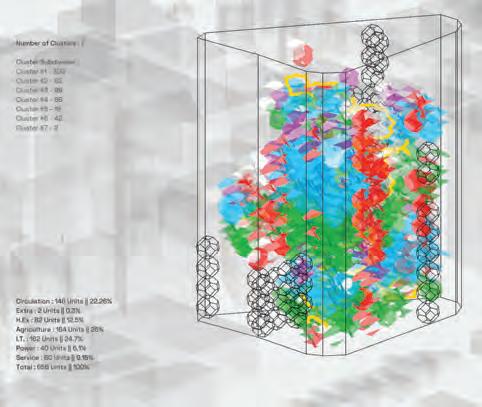

A multi-objective evolutionary algorithm was implemented to generate the ideal solution for the given context conditions. 800 iterations were generated and assessed for the same.

To analyse the performance of a given assemblage solution, a total of 6 fitness criteria were utilized for optimization.
One fitness criteria had been assigned so as to maintain a proportion of 12.5% of circulation spaces in the entire assemblage. This fitness criteria allowed for optimum amount of connectivity within the architectural programs of the assemblage.
To avoid losing out on the generation of circulation spaces caused due to 'null' values in the Dijkstra's shortest path algorithm, a fitness criteria was introduced to avoid these 'null' values.
Along a similar line, a good performing individual would comprise of 27.5% of ITE spaces. This was again specified not only to cater to the contextual computational demand but also to generate suitable amount of heat for the cultivation spaces.
To have an even distribution of the cluster sizes meant that the 'mini' data centres were similar in size thereby indicating an balance in the distribution of programs in the assemblage.


[Fig.
The last two fitness criteria were focused to help create a more architecturally feasible space for the cultivation and HEX programmes. One was intended to encourage the use of 'open' space-making objects for the cultivation spaces thereby enhancing its public characteristics while the other solely promoted the allocation of HEX on the outer regions of the assemblage where the wind flows were maximum.


[desired outcome]

Putting two solutions next to one another for a comparative analysis apart from their individual performances in the given fitness criteria, the solution on the left comprised more ITE space but less cultivation spaces in context to the overall assemblage. Also, it is divided into 4 clusters while the solution on the right is divided into 7 clusters which makes it more architecturally manageable in its day to day working. Moreover, the aspect of modularity-adding or removing volumes-is more suited for the solution on the right merely due to the size of the individual clusters.
As per the performance of the two solutions in given fitness criteria, the solution on the right is a better performing solution. It surpasses the solution on the left in all 6 fitness criteria thereby proving to be an ideal solution for the given set of contextual parameters.


A comprehensive computational fluid dynamics (CFD) analysis was conducted on multiple sections across different regions of the building to simulate airflow patterns and understand air accumulation within these spaces. The simulations created scenarios where airflow interacts with various structural elements, focusing particularly on regions equipped with Phase Change Material (PCM) panels integrated into Triply Periodic Minimal Surface (TPMS) structures.
The analysis revealed that zones containing PCM panels allowed more air to be trapped inside the rooms compared to zones without PCM panels. This observation suggests that the presence of PCM panels enhances air retention within the spaces. Additionally, the results validate that the organization of

the assembly objects aligns with wind flow patterns, effectively facilitating airflow through the structure as intended.
Based on the material study of PCM-filled TPMS surfaces, these structures have the potential to prolong heat retention for more than five hours. The geometry of the TPMS surfaces increases the surface area, enhancing the thermal storage capacity of the PCM. The movement of air through the PCM panels within the building supports the hypothesis that these panels can radiate heat effectively for the purpose of cultivation, as initially speculated. This capability helps regulate the temperature within the cultivation areas and repurposes excess heat from IT equipment and heat exchangers.


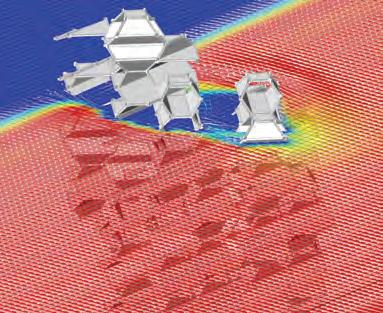
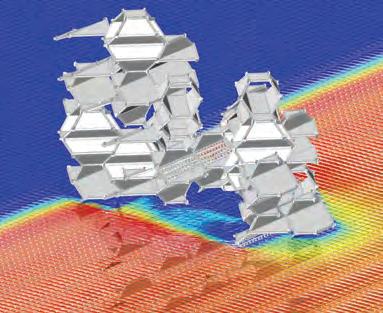


This research explores the intricate interdependence between data generation, storage, consumption, and the utilization of space and energy within the urban fabric, with a focus on London’s role as a global data hub. By reimagining traditional data center typologies, the integration of these data processing facilities into the urban landscape is speculated, prompting the question, “Can the data I produce feed me?” This approach paves the way for a mutual integration of these embedded spaces with the public, through the development of a material system combined with a space-making strategy.
The point of intervention to enable this hybridization is the reuse of excess heat generated from computational activities. By employing phase-change materials (PCM) as infills within Triply Periodic Minimal Surface (TPMS) based cellular panel systems, we have enhanced heat retention performance, passively regulating temperature to ensure thermal comfort for enveloped agricultural functions. Although the physical experiments achieved temperatures between 25°C and 28°C—slightly above the optimal range of 18°C to 23°C for cultivation—this outcome highlights the potential of PCM-infused TPMS structures in creating a mutual energy loop within a closed system, thereby reducing dependency on external resources. Additionally, through blending, grading, and applying various TPMS configurations based on mathematical models, digital simulations hinted at the development of a panel configurator that responds to the very space it serves. Both digital and physical experiments demonstrated promise in addressing the constructability challenges inherent in complex geometries.
In parallel, the spatial experiments employed a shape-grammar approach informed by mission-critical functions, using an automated interpreter to optimize the functional and spatial distribution of designated space-making units based on site conditions. The set rules and subsequent interpretation resulted in promising spatial qualities, characterized by a high degree of variation in solid-void configurations.
In essence, this thesis contributes to transforming today’s unwieldy and isolated data centers into integral components of urban ecosystems. By reimagining data centers as multifunctional facilities that synergistically interact with their environment and the public, this research aligns with the ever-evolving demands of data, space, and energy.
Developing a TPMS-based PCM-infilled panel system has proven to be a suitable approach, as demonstrated by the proof-of-concept material experiment with prototyped versions for continuous, passive, and responsive thermal regulation. However, limitations in PCM material supply and the complexity of mathematical modeling regarding the fluctuating thermal performance during phase transitions impacted the ability to test real case scenarios to pursue the ideal temperature ranges for cultivation. This underscores the need for further material research and heat transfer modeling to ensure that PCMs maintain the thermal efficiency they promise. Additionally, the panel structure and the established pipeline provide a blueprint for optimization investigations, including structural performance on multiple scales. Employing advanced fabrication technologies, such as robotic printing, could enhance precision and constructability, enabling the realization of complex TPMS geometries. Although the achieved material proposal addresses a high customization aspect, both in terms of the infill and morphology, the selection process must have been informed by the imagined cultivation activity and its required performance.
Furthermore, the rationalization of spatial organization within the proposed typology requires validation across multiple scenarios. While the shape-grammar approach offers a method for optimizing spatial distribution by focusing on the combination of functional and circulatory needs, rigorous testing under varying environmental and operational conditions is essential to ensure adaptability and effectiveness. One key aspect worth further exploration is “scalability” in both upward and downward directions. To respond to ever-changing demands, the pipeline developed here holds significant potential to enable functional and spatial interplay both within its components and in external relations. This potential, however, needs to be further addressed in the narrative by testing its temporal quality across a wider range of possible scenarios.
The contextual integration of the reimagined data center into the urban landscape is equally critical. Given London’s dense urban fabric, understanding how these facilities interact with their surroundings is crucial. This includes assessing ecological impacts, potential energy sharing with neighboring structures, and the social implications for the community. Addressing these considerations also speaks to critiques of Cartesian enclosures that prioritize efficiency and control over ecological integration and ethical considerations. Beyond intrinsic testing and optimization, the environmental changes brought about by the proposal must also be explored.
In conclusion, this exploration underscores the need to rethink data center typologies in response to the growing demands for data, space, and energy within urban environments. By embracing functional and spatial hybridization,
and leveraging the interplay between these fundamental concepts, we can transform data centers into dynamic, sustainable components of the urban ecosystem. This reimagined typology aspires to meet the socio-technical needs of the near future while adding value to the social and environmental fabric of our cities.


1. Vopson, Melvin M. “The World’s Data Explained: How Much We’re Producing and Where It’s All Stored.” The Conversation, May 4, 2021. http:// theconversation.com/the-worlds-data-explained-how-much-were-producing-and-where-its-all-stored-159964.
2. Settlemyer, Latchesar Ionkov, Bradley. “DNA: The Ultimate Data-Storage Solution.” Scientific American. Accessed September 19, 2024. https://www. scientificamerican.com/article/dna-the-ultimate-data-storage-solution/.
3. Kitchin, Rob. The Data Revolution: Big Data, Open Data, Data Infrastructures & Their Consequences. London: SAGE Publications Ltd, 2014. https://doi. org/10.4135/9781473909472.
4. Wallace, Danny P. (2007). Knowledge Management: Historical and Cross-Disciplinary Themes. Libraries Unlimited. pp. 1–14. ISBN 978-1-59158-502-2.
5. AltexSoft. “Structured vs Unstructured Data: What Is the Difference?” Accessed 2024. https://www.altexsoft.com/blog/structured-unstructured-data/.
6. Kitchin, Rob. The Data Revolution, 2014.
7. Pitron, Guillaume, The Dark Cloud: How the Digital World Is Costing the Earth, Melbourne, Australia: Scribe, 2023, 290 pp.
8. Hidalgo, César A. Why Information Grows: The Evolution of Order, from Atoms to Economies. New York: Basic Books, 2015.
9. DarkAlman. “Digital Information ….” Reddit Comment. R/Explainlikeimfive, September 20, 2019. www.reddit.com/r/explainlikeimfive/comments/ d6wnwt/eli5_why_does_virtual_data_take_up_physical_space/f0vxo8c/.
10. Mills, Christian. “Christian Mills - Notes on Chip War: The Fight for the World’s Most Critical Technology.” Christian Mills, August 28, 2024. https:// christianjmills.com/posts/chip-war-book-notes/index.html.
11. Marina Otero Verzier, ‘Cartesian Enclosures’, New Geographies 12, ‘Commons’, edited by Mojdeh Mahdavi and Liang Wang (March 2022), 39–57.
12. Rathore, Pushpendra Kumar Singh, Shailendra Kumar Shukla, and Naveen Kumar Gupta. “Yearly Analysis of Peak Temperature, Thermal Amplitude, Time Lag and Decrement Factor of a Building Envelope in Tropical Climate.” Journal of Building Engineering 31 (September 1, 2020): 101459. https://doi. org/10.1016/j.jobe.2020.101459.
13. Cournet (ed), Paul, and Negar Sanaan Bensi (ed). Datapolis: Exploring the Footprint of Data on Our Planet and Beyond. TU Delft OPEN Books. TU Delft OPEN Books, 2024. https://doi.org/10.59490/mg.91.
14 Nuoa Lei, Eric R. Masanet. “Global Data Center Energy Demand and Strategies to Conserve Energy.” in Data Center Handbook: plan, design, build, and operations of a smart data center. John Wiley & Sons, Inc., Hoboken, NJ: Wiley, 2015; online ed., 2020.
15. Koomey J. Growth in data center electricity use 2005 to 2010. A report by Analytical Press, completed at the request of The New York Times, vol. 9, p. 161; 2011.
16. Masanet ER, Shehabi A, Lei N, Smith S, Koomey J. Recalibrating global data center energy use estimates. Science 2020;367(6481):984–986.
17. International Energy Agency (IEA). Digitalization and Energy. Paris: IEA; 2017.
18. Uptime Institute. Uptime Institute Global Data Center Survey; 2018.
19. Masanet ER, Shehabi A, Lei N, Smith S, Koomey J. Recalibrating global data center energy use estimates. Science 2020;367(6481):984–986.
20. Daniel Bizo, Uptime Institute Intelligence. “Global PUEs — Are They Going Anywhere?” Uptime Institute Blog (blog), December 4, 2023. https://journal. uptimeinstitute.com/global-pues-are-they-going-anywhere/.
21. Jacqueline Davis, Uptime Institute. “Large Data Centers Are Mostly More Efficient, Analysis Confirms.” Uptime Institute Blog (blog), February 7, 2024. https://journal.uptimeinstitute.com/large-data-centers-are-mostly-more-efficient-analysis-confirms/.
22. International Energy Agency (IEA). Electricity 2024 - Analysis and forecast to 2026 “Electricity 2024 - Analysis and Forecast to 2026,” 2024.
23. Jacqueline Davis, Uptime Institute. “Large Data Centers Are Mostly More Efficient, Analysis Confirms.” Uptime Institute Blog (blog), February 7, 2024. https://journal.uptimeinstitute.com/large-data-centers-are-mostly-more-efficient-analysis-confirms/.
24. IEA. CO2 emissions from fuel combustion 2019. IEA Webstore. Available at https://webstore.iea.org/co2- emissions-from-fuel-combustion-2019.
25. IEA. Key World Energy Statistics 2019. IEA Webstore. Available at https://webstore.iea.org/key-world-energystatistics- 2019. Accessed on February 13, 2020.
26. Li, Pengfei. Yang, Jianyi. Islam, Mohammad A. Ren, Shaolei. “Making AI Less “Thirsty”: Uncovering and Addressing the Secret Water Footprint of AI Models,” 2022.
27. Yeung, Tiffany. “What’s the Difference Between Edge Computing and Cloud Computing?” NVIDIA Blog, January 5, 2022. https://blogs.nvidia.com/blog/ difference-between-cloud-and-edge-computing/.
28. C+K architecture, Inc. “8MW Data Center.” Accessed 2024. https://www.ckarchitect.com/8mw-data-center-1.
29. “BEHIVE Architects - Cloud Ring | Naver Data Center.” Accessed September 19, 2024. https://www.behive-design.com/en/works/Cloud%20Ring%20 %7C%20Naver%20Data%20Center%20.
30. “Data Center Heat Recovery and Reuse | Danfoss.” Accessed 2024. https://www.danfoss.com/en/markets/buildings-commercial/shared/data-centers/ heat-reuse/.
31. Fletcher, Ellen Iona, and C. Matilda Collins. “Urban Agriculture: Declining Opportunity and Increasing Demand—How Observations from London, U.K., Can Inform Effective Response, Strategy and Policy on a Wide Scale.” Urban Forestry & Urban Greening 55 (November 1, 2020): 126823. https://doi. org/10.1016/j.ufug.2020.126823.
32. Davies, Gareth, Graeme Maidment, and Robert Tozer. “Using Data Centres for Combined Heating and Cooling: An Investigation for London.” Applied Thermal Engineering 94 (October 1, 2015). https://doi.org/10.1016/j.applthermaleng.2015.09.111.
33. Swinhoe, Dan, Have your. “Server Farms Serving Farms: Data Centers and Indoor Farming,” July 20, 2021. https://www.datacenterdynamics.com/en/
analysis/server-farms-serving-farms-data-centers-and-indoor-farming/.
34. Ilieva, Rositsa, Nevin Cohen, Maggie Israel, Kathrin Specht, Runrid Fox-Kämper, Agnes Fargue-Lelievre, Lidia Ponizy, et al. “The Socio-Cultural Benefits of Urban Agriculture: A Review of the Literature.” Land 11 (April 23, 2022): 622. https://doi.org/10.3390/land11050622.
35. “Data Center Heat Recovery and Reuse | Danfoss.” Accessed September 19, 2024. https://www.danfoss.com/en/markets/buildings-commercial/shared/ data-centers/heat-reuse/.
36. Dan Swinhoe Have your. “5C Data Centers Plans 20MW Facility in Phoenix, Arizona,” September 19, 2024. https://www.datacenterdynamics.com/en/ news/5c-data-centers-plans-20mw-facility-in-phoenix-arizona/.
37. The Socio-Cultural Benefits of Urban Agriculture: A Review of the Literature: Rositsa T. Ilieva, Nevin Cohen, Maggie Israel, Kathrin Specht,
38. “What Is Computational Fluid Dynamics (CFD)? | Ansys.” Accessed 2024. https://www.ansys.com/en-gb/simulation-topics/what-is-computational-fluiddynamics.
39.Levenspiel, Octave. *The Three Mechanisms of Heat Transfer: Conduction, Convection, and Radiation*. In *Engineering Flow and Heat Exchange*, 147-162. The Plenum Chemical Engineering Series. Boston: Springer, 1984. https://doi.org/10.1007/978-1-4615-6907-7_9.
40. Lihao Tian, Bingteng Sun, Xin Yan, Andrei Sharf, Changhe Tu, Lin Lu, Continuous transitions of triply periodic minimal surfaces, Additive Manufacturing, Volume 84, 2024, 104105, ISSN 2214-8604, https://doi.org/10.1016/j.addma.2024.104105.
41. wallacei. “Wallacei | About.” Accessed 2024. https://www.wallacei.com/about.
42. Leidi, Michele, and Arno Schlüter. “Exploring Urban Space: Volumetric Site Analysis for Conceptual Design in the Urban Context.” International Journal of Architectural Computing 11, no. 2 (June 2013): 157–82. https://doi.org/10.1260/1478-0771.11.2.157.
43. “The Space Syntax Approach - Space Syntax,” June 7, 2018. https://spacesyntax.com/the-space-syntax-approach/.
44. Food4Rhino. “Shortest Walk.” Text, December 21, 2010. https://www.food4rhino.com/en/app/shortest-walk.
45. “Introduction.” Accessed 2024. https://www.mit.edu/~tknight/IJDC/page_introduction.html
46. “Co-de-iT/Assembler.” C#. 2021. Reprint, Co-de-iT, February 23, 2024. https://github.com/Co-de-iT/Assembler.
47. Matsuoka M, Matsuda K, Kubo H (2017) "Liquid immersion cooling technology with natural convection in data-center". In 6th International Conference on Cloud Networking (CloudNet), IEEE
48. Kheirabadi A, Groulx D (2016) "Cooling of server electronics: a design review of existing technology". Applied Thermal Engineering :105
49. Hasnain, S.M. “Review on Sustainable Thermal Energy Storage Technologies, Part I: Heat Storage Materials and Techniques.” Energy Conversion and Management 39, no. 11 (August 1998): 1127–38. https://doi.org/10.1016/S0196-8904(98)00025-
50. Al-Yasiri, Qudama, and Márta Szabó. “Incorporation of Phase Change Materials into Building Envelope for Thermal Comfort and Energy Saving: A
Comprehensive Analysis.” Journal of Building Engineering 36 (April 1, 2021): 102122. https://doi.org/10.1016/j.jobe.2020.102122.
51 Atef Elhamy, Amr, and Mai Mokhtar. “Phase Change Materials Integrated Into the Building Envelope to Improve Energy Efficiency and Thermal Comfort.” Future Cities and Environment 10 (April 30, 2024). https://doi.org/10.5334/fce.258.
52. Memon, Shazim Ali. “Phase Change Materials Integrated in Building Walls: A State of the Art Review.” Renewable and Sustainable Energy Reviews 31 (March 1, 2014): 870–906. https://doi.org/10.1016/j.rser.2013.12.042.
53. Sutjahja, Inge & Silalahi, A. & Kurnia, D. & Wonorahardjo, Surjamanto. (2018). Thermophysical parameters and enthalpy-temperature curve of phase change material with supercooling from T-history data. UPB Scientific Bulletin, Series B: Chemistry and Materials Science. 80. 57-70.
54. Palacios, A., M. E. Navarro-Rivero, B. Zou, Z. Jiang, M. T. Harrison, and Y. Ding. “A Perspective on Phase Change Material Encapsulation: Guidance for Encapsulation Design Methodology from Low to High-Temperature Thermal Energy Storage Applications.” Journal of Energy Storage 72 (November 30, 2023): 108597. https://doi.org/10.1016/j.est.2023.108597.
55 Mukhamet, Tileuzhan, Sultan Kobeyev, Abid Nadeem, and Shazim Ali Memon. “Ranking PCMs for Building Façade Applications Using Multi-Criteria Decision-Making Tools Combined with Energy Simulations.” Energy 215 (January 15, 2021): 119102. https://doi.org/10.1016/j.energy.2020.119102.
56. Yu, Jinghua, Qingchen Yang, Hong Ye, Junchao Huang, Yunxi Liu, and Junwei Tao. “The Optimum Phase Transition Temperature for Building Roof with Outer Layer PCM in Different Climate Regions of China.” Energy Procedia, Innovative Solutions for Energy Transitions, 158 (February 1, 2019): 3045–51. https://doi.org/10.1016/j.egypro.2019.01.989.
57. Vukadinović, Ana, Jasmina Radosavljević, and Amelija Đorđević. “Energy Performance Impact of Using Phase-Change Materials in Thermal Storage Walls of Detached Residential Buildings with a Sunspace.” Solar Energy 206 (August 1, 2020): 228–44. https://doi.org/10.1016/j.solener.2020.06.008.W
58. Sawadogo, Mohamed, Marie Duquesne, Rafik Belarbi, Ameur El Amine Hamami, and Alexandre Godin. “Review on the Integration of Phase Change Materials in Building Envelopes for Passive Latent Heat Storage.” Applied Sciences 11, no. 19 (January 2021): 9305. https://doi.org/10.3390/app11199305.
59. Celaya Granados MX. Study of Triply Periodic Minimal Surfaces for Heat Transfer Applications [Internet] [Dissertation]. 2023. (MATVET Energiteknik)
60. MIT Press. “Architectures of Time.” Accessed September 19, 2024. https://mitpress.mit.edu/9780262611817/architectures-of-time/.
[Fig. 01] Data - Information - Knowledge - Wisdom (DIKW) Pyramid (illustrated by the authors).
[Fig. 02] Data - Brick analogy and its continuous development diagram (illustrated by the authors).
[Fig. 03] Various classifications of data (illustrated by the authors).
[Fig. 04] Various classifications of data (illustrated by the authors).
[Fig. 05] The analogy between data amounts and bodies of water. (retrieved from the book :The Dark Cloud: How the Digital World Is Costing the Earth).
[Fig. 06] Yearly distribution of data generated, projections and analogous relationship (retrieved from the book :The Dark Cloud: How the Digital World Is Costing the Earth).
[Fig. 07] Data processing apparatuses comparison, the first and the most up-to-date computer (images retrieved from https://penntoday.upenn.edu/ news/worlds-first-general-purpose-computer-turns-75/ (left) and https:// japan-forward.com/a-look-at-the-magic-behind-fugaku-the-worlds-leadingsupercomputer/ (right).
[Fig. 08] Physicality of data.
[Fig. 09] Hardware miniaturization.
[Fig. 10] Data production timeline.
[Fig. 11] Components of a data centre.
[Fig. 12] Redrawn from the book "Datapolis".
[Fig. 13] PUE values and their corresponding efficiency values. (retrieved from https://submer.com/blog/how-to-calculate-the-pue-of-a-datacenter/).
[Fig. 14] Electricity use distribution of data centres throughout the years (retrieved from Geng, Hwaiyu. “Data Center Handbook: plan, design, build, and operations of a smart data center,” 2021).
[Fig. 15] Data centre energy efficiency throughout the years (retrieved from the report: Uptime Institute. Uptime Institute Global Data Centre Survey; 2018).
[Fig. 16] Global Electricity Demand from Data Centres, AI, and Cryptocurrencies, 2019-2026 (retrieved from International Energy Agency (IEA). Electricity 2024 - Analysis and forecast to 2026 “Electricity 2024 -
Analysis and Forecast to 2026,” 2024).
[Fig. 17] A data centre with renewable energy supply.
[Fig. 18] Infrastructure of a Google data centre.
[Fig. 19] Intersections of data, space and energy.
[Fig. 20] Inferences from the intersection of data, space and energy.
[Fig. 21] Global data centre distribution (retrieved from https://espacemondial-atlas.sciencespo.fr/en/topic-contrasts-and-inequalities/map-1C20EN-location-of-data-centers-january-2018andnbsp.html)
[Fig. 22] Data centre hubs in northern Europe (retrieved and redrawn from https://www.datacentermap.com/united-kingdom/)
[Fig. 23] The continuous journey of Data (redrawn from thesis DataHub: Designing Data Centers for People and Cities, Harvard GSD)
[Fig. 24] Data centre examples in London - Edge & Cloud (generated by the authors)
[Fig. 25] Retrofitted DC Example in London : "Level3" (generated by the authors - Google Earth Imagery)
[Fig. 26] Challenging the idea of absolute Modularity (retrieved from https:// www.wired.com/2013/02/microsofts-data-center/)
[Fig. 27] Juxtaposed spectra, the base to plot the case studies (generated by the authors)
[Fig. 28] Case studies extracted from around the world.
[Fig. 29] Linkedin Oregon DC (retrieved from https://www.linkedin.com/ blog/engineering/developer-experience-productivity/lessons-learned-fromlinkedins-data-center-journey)
[Fig. 30] Naver DC Project in South Korea (retrieved from https://www. datacenterdynamics.com/en/news/naver-plans-cloud-ring-second-koreandata-center/)
[Fig. 31] Data Centre Project in Denver, color-coded plan, (retrieved from https://www.ckarchitect.com/denver-data-center-den01/ o93ie2kwvzkqbcdnjrwfmzikepo55j)
[Fig. 32] Data Centre Project in Northern Virginia, color-coded plan, (retrieved from https://www.ckarchitect.com/northern-virginia-datacenter-nv01-1)
[Fig. 33] Data Centre project in Norway, color-coded plan, (retrieved from https://www.datacenterdynamics.com/en/news/keysource-and-namsosdatasenter-planning-norwegian-edge-facility/)
[Fig. 34] Surveyed Plan of the case-study (retrieved from https://www. ckarchitect.com/8mw-data-center-1)
[Fig. 35] The extracted access and functional distribution diagram (generated by the authors)
[Fig. 36] Naver DC project in South Korea, plan layout (retrieved from https://www.datacenterdynamics.com/en/news/naver-plans-cloud-ringsecond-korean-data-center/)
[Fig. 37] The extracted access and functional distribution diagram (generated by the authors)
[Fig. 38] The first set of case studies, plotted (generated by the authors)
[Fig. 39] Level3 DC in Angel,London (generated by the authors via Google Earth Imagery)
[Fig. 40] Retrofitted DC project (retrieved from https://www.ckarchitect. com/digital-capital-partners-dcp03-2)
[Fig. 41] Retrofitted DC project (retrieved from https://www.ckarchitect. com/digital-capital-partners-dcp03-2)
[Fig. 42] Retrofitted v Purpose-built DC examples selection from London (generated by the authors with Google Earth Imagery)
[Fig. 43] Second step, plotted (generated by the authors)
[Fig. 44] a Microsoft Cloud Computing Facility in Virginia (retrieved from https://baxtel.com/data-center/microsoft-azure/photos)
[Fig. 45] a Microsoft Cloud Computing Facility example (retrieved from https://www.cnet.com/culture/microsoft-boxing-up-its-azure-cloud/ )
[Fig. 46] An additive-modular example project (retrieved from https://www. ckarchitect.com/containerized-data-center1)
[Fig. 47] A sheltered modular example, surveyed and extracted (retrieved from https://www.se.com/uk/en/work/solutions/for-business/data-centersand-networks/modular/)
[Fig. 48] Additional modular examples, surveyed and extracted (retrieved from https://koreajoongangdaily.joins.com/2020/07/23/business/tech/ Naver-cloud-IT/20200723183308292.html)
[Fig. 49] Third quadrant mapped (generated by the authors)
[Fig. 50] Introduced third dimension (generated by the authors)
[Fig. 51] DC distribution in Greater London, redrawn from "Using data centres for combined heating and cooling: an investigation for London"
[Fig. 52] Area of allotments (m2 per person) in Greater London (redrawn from the article : Urban agriculture: Declining opportunity and increasing demand )
[Fig. 53] Image courtesy of Solomon R. Guggenheim Museum (retrieved from ,https://metalocus.es/sites/default/files/metalocus_countryside_ koolhaas_guggenheim_01.jpg)
[Fig. 54] Juxtaposed Maps (generated by the authors utilizing prior two figures)
[Fig. 55] Data sampling.(generated by the authors)
[Fig. 56] Computational Fluid Dynamics Example (generated by the authors)
[Fig. 57] Solar exposure analysis (generated by the authors)
[Fig. 58] Fabricated set of TPMS-Based Lattice Structures (photograph by the authors)
[Fig. 59] Material Test: Phase Changing Materials. (photograph by the authors)
[Fig. 60] Evolutionary Multi Objective Optimization Process (generated by the authors)
[Fig. 61] Volumetric Site Analysis.Process Diagram (generated by the authors)
[Fig. 62] Network Analysis – Shortest Path.Analysis (generated by the authors)
[Fig. 63] Space-making units and possible combinations (generated by the authors)
[Fig. 64] De-constructing a data centre (generated by the authors)
[Fig. 65] Traditional Air Cooled DC Diagrams (retrieved and edited from https://journal.uptimeinstitute.com/a-look-at-data-center-coolingtechnologies/ )
[Fig. 66] Heat Load per ITE solution chart (retrieved from https://www. akcp.com/blog/a-look-at-data-center-cooling-technologies/)
[Fig. 67] Immersion Cooling Principle Diagram (retrieved from, https://www. asperitas.com/what-is-immersion-cooling#how-it-works)
[Fig. 68] Immersion Cooling Principle Diagram (retrieved from, https://
www.asperitas.com/what-is-immersion-cooling#how-it-works)
[Fig. 69] Working principle of an Liquid-to-Air heat exchanger (retrieved from https://www.altexinc.com/case-studies/air-cooler-recirculationwinterization/).
[Fig. 70] Immersion cooling infrastructure example without heat reuse (retrieved from https://pictures.2cr.si/Images_site_web_Odoo/Partners/ Submer/2CRSi_Submer_Immersion%20cooling%20EN_April_2023.pdf).
[Fig. 71] Current versus the proposed use of dry cooler heat exchangers. (generated by the authors)
[Fig. 72] Required temperatures for the IT and cultivation spaces (generated by the authors).
[Fig. 73] Intervention point diagram (PCM Phase Change Energy x Temperature diagram retrieved and edited from https://thermtest.com/ phase-change-material-pcm)
[Fig. 74] PCM selection chart (the base graph retrieved from https:// thermalds.com/phase-change-materials/)
[Fig. 75] Filtered PCM options (generated by the authors)
[Fig. 77] Selected PCM through its multiple phases (photograph by authors)
[Fig. 76] Selected PCM phase change temperature graph (retrieved from the article Thermophysical parameters and enthalpy-temperature curve of phase change material(...)
[Fig. 78] Typical encapsulation layer diagram (generated by the authors)
[Fig. 79] TPMS surface ability to subdivide a volume into two equal parts (retrieved from https://blog.fastwayengineering.com/3d-printed-gyroidheat-exchanger-cfd)
[Fig. 80] Selected TPMS types (generated by authors)
[Fig. 81] TPMS-based shell generation and respective Boolean operations illustrating solid-void conditions (generated by the authors)
[Fig. 82] Outputs of the CFD Simulation (generated by authors)
[Fig. 83] Outputs of the CFD Simulation (generated by authors)
[Fig. 84] Blended TPMS based cellular structure (generated by authors)
[Fig. 85] Outputs of the CFD Simulation (generated by authors)
[Fig. 86] Graded TPMS based cellular structure (generated by authors)
[Fig. 87] Multiple TPMS based cellular structure examples (generated by authors)
[Fig. 88] Customized TPMS based cellular panel (generated by authors)
[Fig. 89] Customized TPMS based cellular panel (generated by authors)
[Fig. 90] Customized TPMS based cellular panel (generated by authors)
[Fig. 91] Customized TPMS based cellular panel (generated by authors)
[Fig. 92] Space Subdivisions in Experiment Setup.
[Fig. 93] Physical Experiment Setup
[Fig. 94] Thermometer sensor placement in experiment setup.
[Fig. 95] Used materials in experiment setup.
[Fig. 96] Temperature measurement setup.
[Fig. 97] Temperature change in the experiment.
[Fig. 98] Experiment Setup.
[Fig. 99] Experiment result plotted on a graph.
[Fig. 100] Generating Archimedian solids.
[Fig. 101] Different types of space-filling polyhedra.
[Fig. 104] Single-surface exploration within the truncated octahedron.
[Fig. 103] Multi-surface exploration within the truncated octahedron.
[Fig. 102] Different types of space-making objects.
[Fig. 107] How to 'assemble'? How to describe an 'assembly'?
[Fig. 105] Selected space-making objects with their respective connecting planes.
[Fig. 106] Selected space-making objects with their respective connecting planes and circulation paths.
[Fig. 108] Assembly objects with functional qualities.
[Fig. 109] All heuristics with the defined set of space-making objectsIsometric View.
[Fig. 110] Heuristics with the defined set of space-making objects which have been omitted - Isometric View.
[Fig. 111] All heuristics with the defined set of space-making objects with rules that have been omitted - Top View.
[Fig. 112] All nominated heuristics with the defined set of space-making objects - Top View.
[Fig. 113] Iterations of the assembly experiment.
[Fig. 115] Horizontal field directionality.
[Fig. 114] Horizontal and vertical field directionality.
[Fig. 116] Modularity
[Fig. 117] Programmatic distribution.
[Fig. 118] Public interface.
[Fig. 119] Density maps of the respective programmes.
[Fig. 120] Clustering of regions in London.
[Fig. 121] Site Selection from one of the cluster.
[Fig. 122] Voxelization of the site.
[Fig. 123] Planar analysis of the voxels.
[Fig. 124] Visualisation of wind direction and magnitude on the voxel planes.
[Fig. 125] Visualisation of incident radiation on the voxel planes.
[Fig. 126] Visualisation of visibility percentage on the voxel planes.
[Fig. 127] Visualisation of spatial volume to be used for assemblage simulation on the site.
[Fig. 128] Optimization of the field.
[Fig. 129] Pool of individuals extracted.
[Fig. 130] Graded Field Post Optimization
[Fig. 131] Optimal and Suboptimal Zones
[Fig. 132] Translating the wind data from the planes into volumes of space.
[Fig. 133] Selection of suboptimal zones based on the wind data.
[Fig. 134] Suboptimal zone to be ignored for assemblage simulation.
[Fig. 135] Initiating the assemblage simulation.
[Fig. 136] Assemblage simulation.
[Fig. 137] Generated assemblage.
[Fig. 138] Evaluating the circulation paths.
[Fig. 139] Standardising the space-making objects.
[Fig. 140] Generation of node points.
[Fig. 141] Node and it proximity.
[Fig. 142] Clusters as mini data centres.
[Fig. 143] Primary nodes.
[Fig. 144] Primary nodes and the generated sets of network.
[Fig. 145] Largest network system of the assemblage.
[Fig. 146] Shortest path within the assemblage.
[Fig. 147] Required path for shortest path algorithm
[Fig. 148] Space-making objects along the shortest path.
[Fig. 149] Circulation spaces within the assemblage.
[Fig. 150] Allotment of heat exchanger spaces.
[Fig. 151] Heat exchangers.
[Fig. 152] Allotment of cultivation spaces.
[Fig. 153] Cultivation spaces.
[Fig. 154] Allotment of ITE spaces
[Fig. 155] Nearest space-making objects to the cluster centroid.
[Fig. 156] ITE spaces.
[Fig. 157] Allotment of power supply spaces.
[Fig. 158] Allotment of extra/ auxiliary spaces.
[Fig. 159] All programmatic functions distributed in the assemblage.
[Fig. 160] Architectural feasibility of the assemblage.
[Fig. 161] Iterations of assemblage.
[Fig. 162] Optimization of assemblage programmatic divisions.
[Fig. 163] Comparison of the outcomes of the optimization process..
[Fig. 164] Perspective Section.
[Fig. 165] Perspective Section.
[Fig. 166] Perspective Section.
[Fig. 167] Perspective Section.
[Fig. 168] Post analysis for air movement.
Burak Aydin (M. Arch) || Mehmet Efe Meraki (M. Arch) || Prakhar Patle (M. Sc) || Rushil Patel (M. Arch)
This thesis explores the interdependent relationship between data—its generation, storage, and consumption—and the utilization of space and energy within the urban fabric, focusing on London’s context as one of the global data hubs. Based on past studies, current observations and future projections, there is a growing need to reconsider data centre typologies, which will eventually need to be re-integrated into the urban fabric where the information is produced and processed. By challenging traditionally isolated yet highly embedded typologies, the study unfolds a contextspecific functional hybridization, cultivation for food production, to provoke a mutual integration with the public through the developed material system combined with the space-making strategy.
Functional and spatial hybridization is enabled by reusing the excess heat generated from computational activity and retaining them using phase-change materials (PCM).
The heat retention performance of the system is further enhanced by developing a PCM infilled Triply Periodic Minimal Surface panel system and passively regulating the temperature, ensuring thermal comfort for the enveloped agricultural function.
This creates a mutual energy loop within the closed system, reducing dependency on external resources.
As mission-critical facilities, data centres require a highly modulated functional distribution, yet this does not translate to its space-making practices especially in the urban fabrics where the boundaries are pre-set. Addressing this challenge, spatial experiments utilized a shape-grammar approach with an automated interpreter, developed to optimize the functional and spatial distribution of the designated space-making units informed by the site conditions.
These parallel set of experiments ensured a dynamic set of spectra to enhance the building performance and spatial qualities for adaptability and responsiveness to the ever-changing demands of data, space and energy.
The re-positioning of data centres in the urban fabric, through a re-imagined typology aims to transform today’s unwieldy and isolated facilities to tomorrow’s integral components of the urban ecosystems. [EmTech]
EMERGENT TECHNOLOGIES AND DESIGN | GRADUATE PROGRAMME
