Revitalizing Sensitive Urban Fabrics with Adaptive Interventions for Urban Densification
ARCHITECTURAL ASSOCIATION SCHOOL OF ARCHITECTURE
GRADUATE SCHOOL PROGRAMMES
PROGRAMME: EMERGENT TECHNOLOGIES AND DESIGN
YEAR: 2023-2024
COURSE TITLE: MArch. Dissertation
DISSERTATION TITLE: Revitalising Sensitive Urban Fabrics with Adaptive Inserts for Urban Densification
STUDENT NAMES: Abhijeet Manjunath
Sonali Rane
Rutuja Rode
DECLARATION:
“I certify that this piece of work is entirely our and that my quotation or paraphrase from the published or unpublished work of other is duly acknowledged.”
The team would like to express their deepest gratitude to Dr. Michael Weinstock, Dr. Elif Erdine and Dr. Milad Showkatbakhsh, for their guidance and invaluable insights which have been instrumental in shaping the direction of this work. We would also like to extend our sincere thanks to the faculty members Paris Nikitidis, Felipe Oeyen , Dr. Alvaro Velasco Perez, Lorenzo Santelli and Fun Yuen for their constant support, constructive feedback, and for providing the necessary resources to help us refine and develop our ideas.
The team would also like to express gratitude towards Dr. Harsimran Kaur, Assistant Proffessor of the Department of Architecture, Planning and Design IIT (BHU) and to the locals of Varanasi, whose generosity and willingness to share their knowledge and experiences provided us with invaluable insights into the local lives, traditions, and culture of the city. Their contributions were crucial in helping us better understand the unique context of Varanasi and its relationship to our research.
Lastly, we would like to acknowledge our peers, family, and friends for their encouragement and support throughout this journey. This work would not have been possible without the contributions and understanding of all those involved.
Abstract
This dissertation investigates the urban densification of Varanasi, India’s religious capital and one of the world’s oldest continuously inhabited cities. A cultural epicenter, Varanasi attracts a diverse array of visitors from across the country, resulting in an incremental seasonal influx of population. This influx results in heavy footfall and mass congestion in the intricate fabric of the old city.
While tourists are drawn by its rich heritage, pilgrims frequent the city’s sacred sites. The city’s habitable spaces reflect a stark contrast in typologies, particularly in the juxtaposition of rest houses and death homes - facilities for those who believe to seek salvation. These nodal halt points are woven together by streets filled with markets. The essence of the city’s character is embodied in the pedestrian experience of these markets housing various scales and activities. Being on the tentative list of the UNESCO World Heritage sites, the Government of India has proposed redevelopment plans to capitalise on this economic opportunity. However, in the pursuit of rapid urbanisation, these plans offer permanent solutions for transient needs which are overwriting the cultural identity of the city. Questioning the conventional approach of mass demolition, the study explores the city’s elastic quality by incorporating an iterative analysis of the existing networks, their density and environment to identify specific areas of opportunities.
The research proposes preserving Varanasi’s street experience through generative, adaptable architectural interventions employing a “kit-of-parts” system to mitigate the pressures of demographic surges. Addressing the congestion caused by permanent encroachments of temporary activities, the study focuses on reconfiguring market spaces at varying scales to accommodate changing spatial needs, promote inclusivity, and integrate dynamic mechanisms with a view to minimise the carbon footprint. This results in a market space capable of accommodating needs that evolve through changing seasonal population influx.
The proposal aims at blurring the urban boundaries between the visitors and the locals by introducing multiple gradients of built and open, creating an elasticity through the rest houses and market interventions that encourage interaction preserving the core cultural values of Varanasi.
Created by AirPano, accessed September 18, 2024, https:// www.airpano.com/gallery.php?gallery=86&photo=1805.
Glossary
chabutra : a raised platform
chajja : horizontal projection
dharamshala : rest house for pilgrims
Ganga (n) : Holy river of India
ghat : segment of river frontage
gully : narrow street
jaali : perforated screen
kund : small reservoir where water is collected
mohalla : area encompassed by secondary roads
mukti-bhawan : accommodation facility for those seeking salvation
paan : betel leaves
Panchkroshi Yatra : a Hindu pilgrimage in Varanasi, covering 80 km over five days to visit sacred sites.
richshaw: three-wheeled vehicle either motorized or one where a person pedals a bicycle attached to a small passenger compartment
ANN : Artificial Neural Network
NNA : Numeric Network Analysis
CFD : Computational Fluid Dynamics
FEA : Finite Element Analysis
MOEA : Multi-Objective Evolutionary Algorithm
Created by BBC, accessed September 18, 2024, https://ychef.files.bbci.co.uk/1600x900/ p0f2wq4l.webp.
Introduction
Varanasi, one of the world’s oldest continuously inhabited cities and regarded as India’s spiritual capital, faces unique urban challenges as it grapples with the forces of modernisation and urban densification. The city’s intricate urban fabric, rich in cultural and spiritual significance, experiences significant population surges, primarily due to its status as a major pilgrimage destination, drawing visitors from all over India and beyond.
Acknowledging its cultural and historical importance, Varanasi has been placed on the tentative list of UNESCO World Heritage sites. In response, the Government of India has proposed redevelopment plans aimed at leveraging the economic potential of this title. However, these plans often focus on rapid urbanisation, emphasising conventional solutions that involve largescale demolition, without addressing transient needs and also compromising the city’s cultural identity. The current redevelopment strategies tend to overlook the complexity of Varanasi’s urban fabric, offering rigid, permanent solutions that lack the adaptability needed to accommodate the city’s fluctuating population. The introduction of large concrete plazas, designed in alignment with global trends, ignores the human scale essential to this pedestrian-centric city, known for its dynamic and constantly shifting spatial experiences. Moreover, these strategies fail to address the local climatic conditions of Varanasi, a hot and humid region, rendering newly created spaces uncomfortable and impractical for the local context.
This research focuses on the journey of a visitor or pilgrim, with key halt points being the Dharamshalas (Rest Houses) and the Death Home, a unique typology in Varanasi, connected by vibrant and ever-changing experiential streetscapes, that comprise of Markets of various scales.
The concept of ‘elasticity’ is explored on two levels—functional and physical. While the MSc phase concentrated on functional elasticity through interventions in Dharamshalas and Death Homes, the M.Arch phase shifts focus to physical elasticity, primarily through interventions in the Market. Challenging the conventional approach of mass demolition, this research conducts an iterative analysis of the city’s existing networks, density, and environmental conditions, identifying areas where targeted interventions can have the most significant impact. The proposal suggests the creation of generative, adaptable architectural inserts using a “kit of parts” system, designed to alleviate the pressures of demographic surges on Varanasi’s urban fabric while preserving the city’s cultural essence. This research leverages advanced computational tools for experimentation and analysis, coupled with in-depth material research based on locally sourced, sustainable materials. The experiments conclude with a feedback loop system, reintegrating proposals into the urban environment, influencing its development and opening avenues for future interventions.
By proposing adaptable, context-sensitive interventions that respond to Varanasi’s unique cultural, climatic, and spatial needs, this study aims to create a more flexible, sustainable urban environment that balances architectural interventions catering the ever changing needs while preserving the cultural identity of Varanasi.
Domain
Sacredscape of Varanasi
Known as the ‘Religious Capital of India’, the city of Varanasi is located at 25.3176° N and 82.9739° E, on the alluvial banks of the river Ganges. The city is situated in the southeastern part of Uttar Pradesh, a state in the Northern region of India. Alternatively known as “Benaras” or “Kashi”, the city of Varanasi derives its name from its geographical presence in between the two tributaries - “Varuna” and “Assi” which meet the Ganges in the north and south respectfully.1
Varanasi is known as one of the oldest and continuously inhabited cities, dating back to its formation in 1200BC, making itself comparable in terms of age to cities like Jerusalem, Beirut and Athens. Mark Twain encapsulated the historic essence of Varanasi’s culture and religion by stating, “Benaras is older than history, older than tradition, older even than legend, and looks twice as old as all of them put together.”2 Along the crescent-moon shaped riverbank of the Ganges, Varanasi houses 84 ghats serving various religious activities. These spots are of high cultural significance. In a metaphorical sense, the ghats which are in a stepped formation of an amphitheater, are believed to be the platforms, the water the altar and the sun the God.
Fig. 1: Kashi Vishwanath Temple Corridor. Created by Varanasi Videos, accessed September 18, 2024, https:// varanasivideos.com/reasons-to-visit-varanasi/
1. R. P. Singh and P. S. Rana, “Varanasi: Sustainable Development Goals, Smart City Vision and Inclusive Heritage Development,” 2017, 219.
2. Mark Twain, Following the Equator: A Journey around the World (Hartford, CT: The American Publishing Company, 1897), 156.
Demolition
Original Fabric
Fig. 2: Kashi Vishwanath Temple Corridor.
Created by Google Earth Pro
Wound in the Fabric : Redevelopment
Fig. 3: Existing Fabric around Kashi Vishwanath Temple before Redevelopment showing two-way streets and permeability
Created by Author
The religious city of Varanasi consists of Hindu temples, mosques, churches and several other sacred structures. Out of these the recently completed Kashi Vishwanath Corridor Project (KVCP) has gained a lot of prominence due to its impact on the democratic nation. The project focused on the redevelopment of the Kashi Vishwanath temple, the most important shrine in Varanasi constructed by Ahilyabai Holkar in the year 1777CE. With the intention of reducing the congestion caused by the steep incremental tourist footfall in the city, the project focused on extending the temple premises with facilities of accommodation and a smooth access to Ganga in the densely packed fabric of Varanasi while retaining the cultural
Fig. 4: Existing Fabric around Kashi Vishwanath Temple before Redevelopment showing multi-functional streets
Created by Author
identity of the city.3
The UNESCO World Heritage Listing has laid out certain criteria that need to be met in order to qualify for the title. There have been several attempts to have the Riverfront and Old City Areas listed under the WHL, but these attempts have gone in vain due to socio-political complexities.4
Varanasi is under the pressure of new political plans in its race to be a part of the UNESCO World Heritage Sites. In the hurry for development, the existing interventions under the Smart City Mission of the Government of India, focus on increasing supply of housing and accommodation through insensitive face lifting and urban agglomeration.
1. Rana, P.B. Singh, and Pravin S. Rana. “The Kashi Vishvanatha, Varanasi City, India: Construction, Destruction, and Resurrection to Heritagisation.” ACLA Asian Cultural Landscape Association (Korea-India-Italy), & Banaras Hindu University. DOI: 10.53136/97912599480762, 2. R. P. Singh and P. S. Rana, “Varanasi: Heritage Zones and Its Designation in UNESCO’s World Heritage Properties,” 2017, 213.
An example of this would be the re-modelling of buildings along the ghats in a modern way with no consciousness of the cultural identity or the environmental concerns. The construction of large temple complexes, such as the Kashi Vishwanath Corridor, due to political support, serves as a significant case study.5
The original fabric exhibited a dense but comparable grain with a two-way directional street pattern. The streets, although of widths ranging from 1.1 to 2.4m exhibited a multi-functional array of functions like religious stores, apparel/ silk stores, eateries, cultural antiques among others. This multi-layered experience unique to the streets of Varanasi defined the culture of the religious capital. The permeability in the fabric demonstrated an element of surprise and a gradience of activities to any user traversing through the streets.
1. R. P. Singh and P. S. Rana, “The Riverfrontscapes of Varanasi, India: Architectural Symbolism, Transformation, and Heritagisation,” 2023, 262. Religious stores
Fig. 5: KVCP after Redevelopment showing streets terminated to create gated entrances
Fig. 6: KVCP after Redevelopment showing single functions
Created by Author
Created by Author
The KVCP, an extension of the temple complex was created as a 50 ft wide avenue across a stretch of 400m. The project involved the demolition of about 200 homes and 275 shops to construct completely indoor permanent functions of food courts, cultural centers and tourist accommodation facilities. The previously permeable streets were terminated along the periphery of the corridor to create gated entrances into the religious campus and singular and permanent assignment of functions to the shops predominantly serving religious purposes. Tall boundary walls deliberately separate the temple complex from the urban context resulting in edge conditions leading to dead spaces being used as two-wheeler parking. 6
The impact of KVCP can be further analysed in adherence to the Space Syntax theory by Bill Hillier which establishes a unique approach to understanding the relationship between spatial patterns and human behaviors. This theory can be further analysed by understanding convex and linear spaces. Linear spaces are elongated continuous spaces such as streets, corridors and pathways where movement is primarily directional. Convex spaces on the other hand are spaces where any point within a space can be connected to any other point without crossing its boundary making them spaces for social interactions and pause points. The redesign of the temple complex has prioritized large out of scale open spaces over smaller intimate ones traditional to the city and relatable to the human scale compromising its spatial integration with the urban context. 7
2.
Created by Live Free Hostels, accessed September 18, 2024, https://livefreehostels.com/wp-content/uploads/2024/04/11. png.
Photograph of a view of the KVCP
1. Coute and P. Daniel, City of Plush Felt, Resting by the River, Benaras: An Architectural Voyage (1989).
Bill Hillier, Space is the Machine (London: Space Syntax, 2007), 24-25.
by Author
Created by Author
With the temperature ranging from 32 to 43 degrees through the summer and increased humidity levels between 55 to 100%, the city is categorised as a hot and humid biome. Additionally, the average wind velocity is only 4m/s. In such climatic extremities, the scale of open spaces within the corridor creates a void in the fabric due to reduced thermal comfort leading to extremely hot and humid open spaces. Realizing this discomfort, temporary arrangements of extending a fabric across metal cables were done.
Fig. 7: Temperature Chart of Varanasi created using Ladybug tools
Fig. 8: Wind Rose Diagram of Varanasi created using Ladybug tools
Created
This questions the purpose of the redevelopment project rendering it to be a mere ‘beautification or a facelifting’ strategy to boost the economy of the country and clear the city of Varanasi from the waitlist of the UNESCO world heritage sites. Cultural sustainability is explained by the UNESCO Agenda 21 through Morley’s triangle through an equilibrium between man, nature and economy. The KVCP ironically disturbs this equilibrium due to the high weightage to the economy over man and nature leading to the loss of cultural identity. 8
Fig. 9: Morley’s Triangle and Cultural Sustainability
Created by Author
Aerial view of the KVCP. (Ganguly, n.d.). Retrieved January 1, 2025, from https://www.pexels.com/photo/aerial-shot-of-pradeshindia-building-landmarks-14627655/
IS THIS THE IDENTITY OF VARANASI?
Wound in the Fabric : Redevelopment
Uttar Pradesh is the highest populated state of the country and as per the Census of 2011, the population of Varanasi complete agglomeration had crossed 1.5 Million. Being the 5th largest city of the state, people from the neighboring rural areas have been migrating to the urbanized parts in search of livelihood opportunities. 9
The city receives an influx of millions of international and domestic visitors, the latter mostly comprising of pilgrims. This floating population consists of 5% of international tourists whereas the remaining 95% are domestic pilgrims and tourists.
As reported in the Times of India “In 2023, the highest number of 9,722,206 tourists arrived in Kashi in August, followed by 7,262,891 in July. The number of tourists entering Kashi was 4,429,590 in January, 4,267,858 in April, 4,134,807 in February, 3,781,060 in March, 3,225,476 in May, 3,696,346 in June, 3,897,844 in September, 4,255,674 in October and 4,826,776 in November.” There exists a symbiotic relationship between the floating and the existing population that has organically created a socio-economic urban structure in Varanasi. 10
International
Domestic
10: Domestic vs. International population
Created by Author
1. Bikramaditya Kumar Choudhary, Anwesha Aditi, and Swasti Vardhan Mishra, “Varanasi—The Making of a Smart Heritage City,” 2024, 4.
2. Bansal, Sunny, Vidhu Bansal, and Joy Sen. 2017. “Redefining and Exploring the Smart City Concept in Indian Perspective: Case Study of Varanasi.”
Fig.
It is said that “By seeing Banaras, one can see as much of life as the whole India can show”.11 Pilgrims come from all over the country to perform the Panchkrosh Yatra - a spiritual journey that begins and ends in the old city of Varanasi. Numerous forts and heritage sites reflect Varanasi’s history of being ruled by various dynasties for thousands of years. Besides being culturally diverse, Varanasi is home to several major universities like the Banaras Hindu University (BHU-IIT) and the Sampoornanand Sanskrit University. The city also boasts traditional arts and crafts, including classical music and dance, handloom weaving, and more. This blend of religion, education, arts, and heritage enhances Varanasi’s attractiveness as a tourist city. With this being said, Varanasi has experienced significant population growth, increasing sevenfold from 207,650 in 1931 to 1,435,113 in 2011. With its high value as a pilgrimage and touristic spot, the city sees an estimated daily inflow of more than 25,000 pilgrims and tourists, while migration of people for opportunities in the city from neighbouring areas of Uttar Pradesh and Bihar further boosts its population. 12
1. Singh, Rana P.B. 2015. “Banaras, the Cultural Capital of India: Visioning Cultural Heritage and Planning”, 100
2. Akhilendra Nath Tiwari, “Prospects and Constraints in Development of Varanasi as Smart City, India,” 2016, 75.
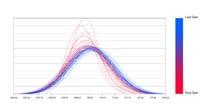
Fig. 11: Seasonal population recorded in 2023
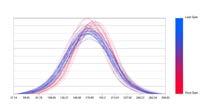
Fig. 12: Annual population recorded in 2023
Created by Author
Created by Author
Points of Halt
Rest Houses
The floating population influx in Varanasi is a critical issue due to the religious and cultural significance of the city. While the heritage attracts the tourists and pilgrims, the prevalent stigma of attaining salvation upon embracing death in the holy land of Kashi is of interest to a few. This gives rise to a complex need for infrastructure where the habitable spaces itself exhibit a stark contrast between rest houses like dharamshalas (pilgrim accommodation free of cost) and death homes (homes for people who have come to seek death).
Rest Houses : Dharamshala
Varanasi being a city with an extremely high number of religious nodes, the three major building components that become an essential part of the Pilgrim’s journey are the Temples (in case of Hindu Pilgrims), the Kund which is a water body with stepped access and the ‘dharamshala’ which are the Rest Houses built for them as halt points at night. Typically, the pilgrims who come to perform religious activities, often travel on foot or make use of small vehicles like the rickshaw. These rituals are performed by visiting each religious node in a pre-determined sequence to form a pilgrimage circuit like the Panchkrosh Yatra. Therefore, these rest houses are more likely to be found in clusters in close proximity to the religious nodes and, sometimes, the Kunds. The continuous placements of dharamshalas generates the overall architectural character of the city.13
Fig. 13: Photograph showing Dharamshalas and Guest Houses near the Dashashwamedh Ghat. The transition of the street to the ground floor shops, missing visual access to entry points of the building and the sharing of walls on two sides can be observed from the above image.
Created by Author
Fig. 14: Typical Dharmshala Clusters in proximity to the Religious Nodes.
Created by Author
1. Rana P. B. Singh and Santosh Kumar, “The Sacred Nodes of Pañchakroshī Yatra Route, Varanasi (India): Spatial Perspectives and Prospects for the Future,” 2022.
With the growing needs of the floating population, the shops and vendors that occupy the peripheries and sometimes even the premises have made it difficult to identify the access points of the Dharamshalas. The dense urban infrastructure has caused the Dharamshalas to be present in continuously packed build forms where the structure may have 1 or 2 sides open with the central courtyard being the only source of light and ventilation. Dharamshalas have been observed to be dilapidating and require immediate conservation. They need to be approved with seasonal multifunctionality and their alternative contribution as storage or communal spaces during off-season times.14
Fig. 15: Typical Dharmshala in proximity to the Religious Nodes.
Created by Lalit Akash Verma and Farheen Bano, “(Socio-Environmental Sustainability of Traditional Courtyard Houses of Lucknow and Varanasi),” 2023.
Dharamshala Body Plan
Dharamshalas are typically low rise, single or double storied structures that consist of a large courtyard surrounded by a colonnaded hallway that leads into the sleeping spaces. The entry points of Dharamshalas are porticoed foyers that act as the buffer space between the building and the streets. The roofs are usually terraces and the the structures have shaded exterior Verandahs that prevent the structure from heat gain. The outer walls of the Dharamshalas are usually stuccoed in cream or beige colour tones with geometrical ornamental plastering coloured in bright red, blue, orange or pink. These outer walls have
1. Mukundan, “Changing Sacredscapes, 226-227.”
2. Singh and Kumar, “The Sacred Nodes of Pañchakroshī Yatra Route.”
small ventilation holes or windows. The dharamshalas are present along with local shops and hawkers that occupy the periphery of these built masses that support the ecosystem of the pilgrimage. These rest houses are an integral part of the cultural identity of Varanasi where people find space to sleep, cook, participate in community interaction, chant and perform religious activities. In the off-season times, the locals use the courtyard spaces in these Dharamshalas to either store wood or to host marriage ceremonies or other communal activities. These courtyards are socioenvironmental contributors to the built space. 15
Created by Author
Courtyards
Courtyards are an essential part of traditional Indian architecture and are found in most structures and Dharamshalas in Varanasi. Observed in plan, they are social gathering and interaction spaces; but sectionally, they are passive components that regulate the thermal comfort inside the building. As discussed earlier, in dense urban fabrics such as Varanasi, where structures are so tightly packed like row houses with common shared walls, the form of the courtyards usually follow the overall shape of the plot.16
Courtyards function as central spaces for a myriad of social activities. The courtyards within Dharamshalas contain multiple raised platforms where the pilgrims cook their food. Apart from cooking, these spaces are used for
1. Lalit Akash Verma and Farheen Bano, “(Socio-Environmental Sustainability of Traditional Courtyard Houses of Lucknow and Varanasi),” 2023. 2. Yatin Pandya, Courtyard Houses of India (Ahmedabad: Mapin Publishing, 2016).
religious activities, celebration, sun soaking during winters and also as spaces to place vertical circulation elements. Owing to visually accessibility in the entire structure, the courtyards have multi-level spatial interaction with all the other spaces. In the context of Varanasi, while courtyards in a Dharamshala are celebratory spaces, courtyards within a death home have a contrasting use case. Courtyards are used as gathering spaces for grieving and performing the pre-rituals before the remains of the deceased person are taken out to the ghats from the death home. 17
Fig. 16: Courtyards as the only source of natural light and ventilation in tight urban fabrics
As mentioned by Bill Hillers in his theory of Space Syntax , courtyards are the ‘convex’ spaces that are the gathering points for people while the verandahs or colonnaded hallways around the courtyard are ‘linear’ spaces that are the transition spaces.18 Very typically in a Dharamshala, the entrance foyer that is a composition of a Chabutara and a Verandah lead directly into the courtyard of the building. This courtyard then transitions into shaded hallways or the inner Verandahs that then further lead into the kitchen, the private resting spaces, toilets and storages. This creates a hierarchy of visual accessibility and conceals the private spaces from being directly exposed to the street. Volumetrically, the courtyard is connected to all the floors
of the building, therefore in some cases the presence of vertical circulation elements like a staircase in the courtyard could be relevant. In this case, the courtyard also becomes the vertical circulation core of the building.
A courtyard is a system by itself that is integrated with other sub-systems of the structure such as verandahs, windows and doors. Courtyards are highly essential in hot climatic regions as they help mitigate solar gain by letting out the trapped hot air out through stack effect. Courtyards protect the surrounding walls and floor surfaces from the direct sun and thereby reduces the overall incident radiation in the semi-private and private spaces.
Besides being the source of natural light, courtyards play an important role in the ventilation of the building. The cool air from the shaded streets which have heavier air pressure fields, enters the building through its doors and windows and flows towards the courtyard. It picks up heat through metabolic energy transfer and becomes lighter to escape the from the courtyard via the upper aperture. The small windows on higher sides of the structures on the peripheral walls act as inlets that increase the wind velocity of the incoming air thereby creating the Venturi effect. This further aids in cooling off the breeze and forcing out the hot air through Bernoulli’s principle. The scale and proportion of the courtyards based upon the environmental parameters of natural lighting, heat reduction and enhancing ventilation affects the sociability of the space.19
The volumes of the courtyards i.e., its length to width to height ratio decides the length of shadows that are achieved. Narrow courtyards tend to have more casted shadow and sometimes it is more effective to have multiple smaller courtyards than one wide courtyard. Besides this shadow management, courtyards are the sources of diffused natural lighting inside the building. As discussed previously, courtyards at times could be the only source of natural light in situations where the structures are sharing peripheral walls.
1. Yatin Pandya, Courtyard Houses of India (Ahmedabad: Mapin Publishing, 2016).
Fig. 17: Gradience of public to private is observed within the varied spaces as seen adhering to convex spaces leading to congregation and axial spaces as walking areas. Created by Author
Chabutaras are the extended plinths or the raised platforms adjoining the entrance of the structures. These are semi-public spaces that belong to the structure but are directly connected with the street. Chabutaras are in the shaded part of the structures and are points of social interaction. They create a buffer between the public streets and private indoors of the built.20
Chabutara is characteristic to Varanasi where the streets inside the old city are narrow lanes where these spaces create a spatial dialogue between the built and the unbuilt and even between two opposite built spaces. It has
1. Verma and Bano, “(Socio-Environmental Sustainability of Traditional Courtyard Houses).”
been observed that these kind of extensions are not just social spaces for Dharamshalas or other permanent dwelling units, but are also an extension of the market spaces where small scale shops and vendors exist, using the Chabutara as an integral part of their functional ecosystem.
Fig. 18: Chabutaras as extensions of the buildings for socialising or as extensions of small scale shops and eateries.
Created by Author
Chabutaras
Fig. 19: The terminology of ‘Semi-Public’ translates into ‘Semi-Private’ when the gradience is observed in adjacency with another unit.
Created by Author
Created by Author
The organisation of the diverse spaces from entrance to courtyard and from courtyard to private resting spaces, creates a gradience based on the mapped activities. This spatial index or gradience map is a visual scale to measure the ‘public-ness’ or the ‘private-ness’ of the sub-spaces within the larger composition. Referring to the plan of a typical Dharamshala, it can be observed that the central courtyard becomes the public space, the shaded hallway or verandah around the courtyard are semi-private while the resting spaces and storage rooms are the private space. Similarly, the outer verandah and entrance foyer are semi publicsemipublic spaces with the chabutara that breaks out into the public street. This gradience changes when the scale of the context is enlarged. In the context which includes two adjacent private buildings with a public street that connects them, the terminology of ‘semi-public’ then transcends into ‘semi-private’.
Fig. 20: Gradience of Public to Private Spaces
Rest Houses : Death Home
The city of Varanasi, known for its stark contrasts, features a unique type of rest house known as ‘mukti bhawan’ or death homes. Rooted in the religious belief that dying in Varanasi grants ‘moksha’ or salvation—liberation from the cycle of rebirth—these houses attract visitors nearing death from around the globe. Based on the deep roots of this belief in Hindu tradition and the sacred geography of Varanasi, ‘Kashi Labh Mukti-Bhawan’ is one such facility since 1908.
Located at the end of a narrow lane lined with shabby electronic stores branching out from one of the city’s busiest vehicular intersections, the death home faces significant accessibility issues, particularly for inhabitants on stretcher beds. The gated entrance opens into a front yard, leading to a small temple and office area. 21
1. Moni Basu, “CNN,” April 2014, https://edition.cnn.com/interactive/2014/04/world/india-hotel-death/index.html.
Fig. 21: Location of Kashi Labh Mukti Bhawan
Fig. 22: Entrance to Kashi Labh Mukti Bhawan
Created by Google Earth Pro
Created by Google Earth Pro
26: Back entry to carry corpses
All above figures created by CNN, accessed September 18, 2024, https://edition.cnn.com/interactive/2014/04/world/india-hotel-death/index.html
Fig. 23: Courtyard used for drying clothes
Fig. 24: Courtyard used for sun soaking
Fig. 25: Minimun facility in the death home
Fig.
Originally designed as a traditional Indian courtyard house, the building comprises of 12 rooms with shared toilet facilities across two floors, arranged around a central courtyard. To date, it has recorded approximately 15,000 deaths. The courtyard, primarily serving as the source of natural light, functions as a convex space where patients can walk or soak up the sun, and it also serves as a communal area for family members or to dry clothes. Upon the occurrence of death, the courtyard is occasionally utilized for small religious rituals.
Lodging at Kashi Labh Mukti-Bhawan is free of charge, with visitors only paying for electricity, and stays are limited to a maximum duration of 15 days. Patients are admitted along with family members who assist with daily needs. The facility provides only basic bedroom spaces, each furnished with a bed, a built-in shelf, and minimal cooking facilities. Due to inadequate daylight and ventilation in the rooms, it is common to see family members sitting at the door thresholds facing the light from the courtyard. During peak demand, beds are reportedly laid out in the courtyard. 22
Although the facility serves a sensitive and profound purpose, it faces issues of privacy. Tourists are allowed to walk into the building, treating it almost as a spectacle, which undermines the dignity and privacy of those spending their final days there.
Fig. 27: Lack of Daylight
Fig. 28: Tourists allowed in the private spaces
1. Verma and Bano, “(Socio-Environmental Sustainability of Traditional Courtyard Houses).”
Contrasting Realities : Dharamshala vs Death Home
Diaglogue with the context
Although the primitive spatial organisation of a Dharamshala and of a Death Home are very similar, their functional roles vary because of the contrasting typologies. Rest Houses or the Dharamshalas within the urban fabric have an enhanced spatial dialogue with the public streets. The chabutaras and exterior verandahs boost social interaction and also establish a clear visual connection. Thus it can be said that these structures have a sense of ‘public - outwardness’. On the contrary, death homes are visually concealed from the public life of a street to enable the users of the home to reside in privacy. It may be of high value to the users to attain visual access to the outdoors from the indoors of the space, thus creating a ‘privateoutwardness’. These homes are required to be easily accessible from the road while creating a buffer that secludes it from immediate attention.
Courtyard
As highlighted before, courtyards within a Dharamshala are celebratory spaces that are social gathering points for hosting religious and social activities. Conversely, courtyards within a death home are mainly for the well-being of the users who would seldom use the courtyard as a break-out space after spending most of the day within the four walls of the resting space. The courtyard is also a space for grieving before the mortal remains of the departed are carried out of the death home. This significant social aspect related to the courtyard could be a feedback for understanding the scalability and volume
Created by Author
Created by Author
Fig. 29: Relation with the Street in terms of Visual Accessibility
Fig. 30: Comparison of the functions inside the Courtyard
Created by Author
Created by Author
of the courtyard. The wider courtyards that create visual accessibility throughout the building could suit the social index of a Dharamshala whereas the narrow courtyards that are more effectively helping in the environmental objectives and are limiting visual access are more relevant to a death home.
It is noteworthy that there is a contrast in the functional use gradient map between Dharamshalas and Death Homes, especially concerning spaces used during the day and at night. While the courtyards are filled up with bustling social activities during the day, the resting spaces get occupied by the user at night within the Dharamshala. Typically the user, in this case the pilgrim or the tourist, takes up the resting spaces for 3-4 nights. On the other hand, the resting spaces within a Death Home are used throughout the day. The courtyards are seldom used as there is no communal activity happening as such except for a priest or a devotee who would voluntarily visit the courtyard of a death home to chant mantras or bhajans (spiritual songs), in the evenings. The allowance laid out for any family occupying a room within the death home along with their elderly family member is typically 15 days. It could be of value to say that resting spaces within a Dharamshala are more temporal whereas the ones within a Death Home are more permanent.
Fig. 31: Scale & Proportion of the Courtyard and its effect on “Social-ability”
Fig. 32: Gradience of Courtyard indicating its usage at night vs day, contrasting for dharamshala and death home
Interdependent Spaces
As described by Louis Kahn , spaces are categorized as “Servant” or “Served Spaces” that describe the relationship and dependencies of spaces in order. In case of a Dharamshala, the courtyard and the ancillary spaces like toilet and kitchen become the servant whereas the resting spaces become the served spaces.23 However, it can be said that this categorisation changes with change
1. Michael Merrill, Louis Kahn on the Thoughtful Making of Spaces (Zurich: Lars Muller Publishers, 2010), 320 pages, ISBN 978-3037782200.
in scale. When the dharamshala is considered along with its adjacent road, then the the entire building is the served space and the road is the servant. Interestingly, when observed at an urban scale with a cluster of dharamshalas in close proximity with the religious node, the dharamshalas are again the servant spaces and the fabric is the served space.
Photographed by Author. Image showing public gathering occurance along the Ghats of the river Gang
Unique Tapestry
Fig. 33: Growth of the City
Created by https://timesofindia.indiatimes.com/travel/destinations/5-must-visit-spiritual-destinations-in-uttar-pradesh-for-your-travel-itinerary/ photostory/116687999.cms
The urban fabric of Varanasi is a unique tapestry of juxtaposed identities shaped by transitioning monarchies over thousands of years. What began as a dense forest transformed into dense spatial structures, repeatedly invaded and rebuilt, expanding the city’s footprint. Until the 11th century, Varanasi, then called ‘Kashi,’ transitioned through multiple Hindu dynasties, followed by Muslim powers like the Turkish-Afghan and Mughal Sultanates. Eventually, the Marathas shaped much of the traditional old city visible today. As Coute notes, “From the beginning of the 11th century to the decline of the Mughal Empire, new conquerors alternated between construction and destruction. In the 13th and 14th centuries, there was Turkish-Afghan domination; Shah Jahan’s last destruction was in the early 17th century, after which Raja Man Singh erected buildings including a college and residence. The Man Mandir Ghat next to Dashashwamedh Ghat was built during that period. In 1657-1707, Mughal emperor Aurangzeb ordered mosques constructed in every city, renaming Varanasi as Muhammadabad—a Muslim city.”24
Predominantly a Hindu city, contemporary Varanasi also has a significant Muslim population, creating a unique cultural mosaic. The city is home to an estimated 3,300 Hindu shrines, 12 churches, and 1,388 Muslim shrines and mosques—more than any other city globally. Sarnath, a major Buddhist pilgrimage site, and 15 Sikh Gurudwaras add to this diversity. The city also contains major universities and schools, earning it the title ‘City of Culture and Learning.’25
Varanasi struggles to supply urban infrastructure for its growing population. Between 1991-2011, the city’s area increased by 112%.26 Development under India’s Smart City Mission largely focuses on increasing housing and urban agglomeration, often through insensitive facelifts. The replacement of kachcha houses with pakka houses has led to structural instabilities. Rapid, uncontrolled development for the floating population has resulted in slums, urban sprawl, congestion, and pollution—land, air, and water. This highlights opportunities for ephemeral interventions to ease seasonal population strain while retaining cultural identity and making the city resilient.
“Banaras is an archetype of all India,” Rana P. B. Singh argues, noting its complexity and contrasts, which can be difficult to comprehend from outside the Indian tradition. Along the same urban fabric of the Ghats, the Ganga Aarti attracts millions for its divine visuals, while nearby cremations occur. Varanasi celebrates life and birth yet holds that death here enables salvation. The city poetically embraces the coexistence of life and death, symbolising physical temporality and spiritual permanence. Projects like the KVCP overlook Varanasi’s inherent complexity, relying on fixed, permanent solutions that fail to address its fluctuating population. Instead, the city’s sensitive fabric presents opportunities for adaptable development that respects its cultural heritage while meeting the demands of transient and permanent populations.
1. Coute and Pierre Daniel, City of Plush Felt, Resting by the River, Benaras: An Architectural Voyage (1989).
2. Singh and Rana, “Varanasi: Heritage Zones and Its Designation.”
3. Rana P. B. Singh, “Banaras, the Cultural Capital of India: Visioning Cultural Heritage and Planning,” 2015.
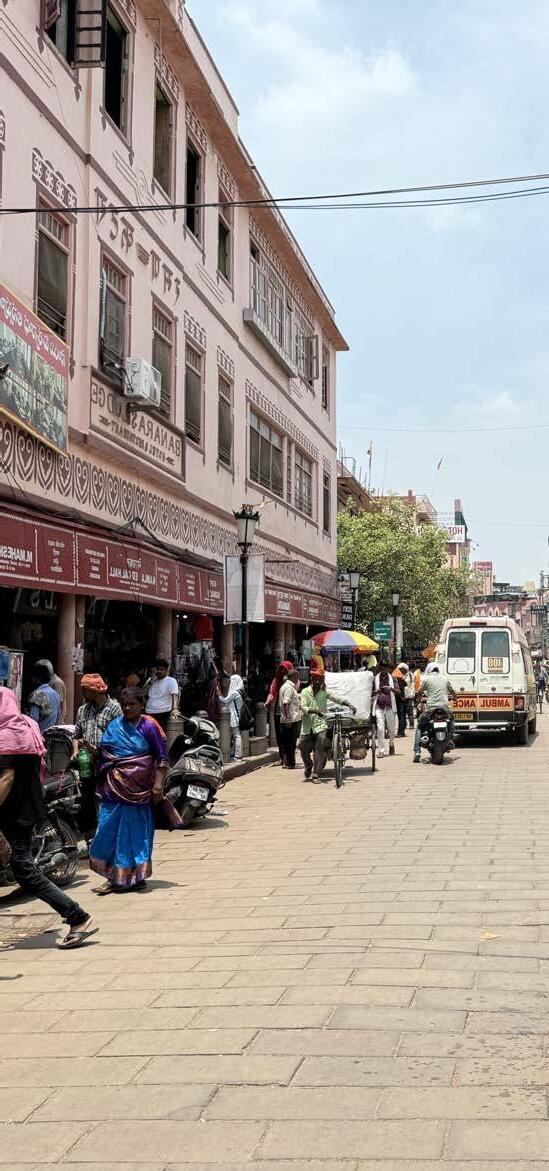
Street Experience
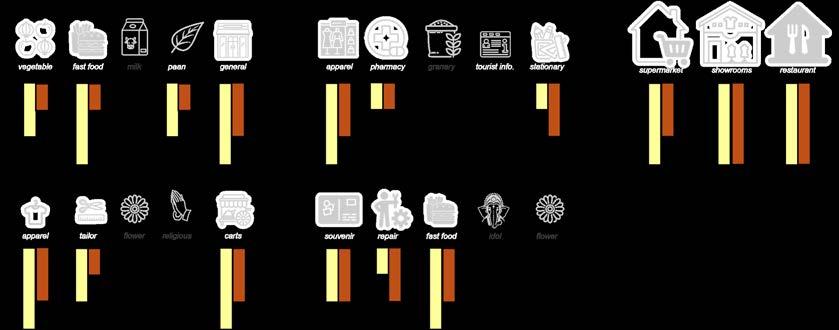
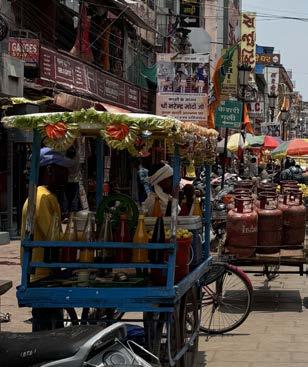
The journey of a pilgrim or a tourist begins from their points of entry into or halt within city and completes at their points of destinations. This journey is best experienced on foot through the streets of Varanasi, that contain a vibrant array of markets. This can be attributed to the multifunctional nature of shops and markets of varying scales, as well as the static or mobile characteristics that define them. Few streets are known for a range of similar functions, an example being the Kachauri galli famous for its sequence of eateries, inviting a large amount of tourist footfall. Observations made during the site visit revealed intriguing interactions between the static and mobile aspects of shops and their users. Larger establishments were predominantly static,
offering sit-down facilities for users. In contrast, medium and small-scale units, often on wheels, displayed a dynamic nature; they could be either stationary or mobile, with users frequently engaging in mobile interactions. Therefore, the streets become the markets of the city in a constant state of change proudly reflecting the culture of the city through the different functional typologies like eateries, silk shops, apparel stores, antique stores, religious stores, local spices, grains, flower shops among others. The city is characterised by a sensory experience rich in diverse textures and fragrances from religious products and flowers, the tastes and aromas of local cuisine, the vibrant sights of colorful silk drapes, and the sounds of religious activities.
Fig. 34: Markets at various state and scale
An intriguing relationship exists between functions and their proximity to dwellings and religious nodes like temples and ghats. These elements define their position on a temporality gradient, with some units being permanent and others appearing or disappearing based on the time of day, seasons, or festivals. In the traditional city, shops are situated on ground floors, while local residences occupy the upper floors, fostering a dynamic dialogue with the streets.
Jane Jacobs, in The Death and Life of Great American cities (1961), observes, “On successful city streets, people must appear at different times.” She highlights the importance of a good mix of functionalities across the urban fabric, which ensures ‘eyes are always on the streets.’ This
1.
constant human presence enhances safety and vibrancy, reducing crime and promoting lively public spaces. 27The long belt of 84 ghats along the Ganges remains active yearround with religious, cultural, and tourist activities, even during off-season times. Surrounding areas near these ghats and religious nodes feature mixed-use functions, including small and medium-scale shops selling religious items, sarees, textiles, books, and electronics. Restaurants and hawkers of various scales also operate on the ground floors of low-rise residential buildings. The narrow lanes of the old city, lined with small-scale commercial establishments, exemplify Jacobs’ theories about vibrant urban spaces.
Fig. 35: Location of Kashi Labh Mukti Bhawan Created by Google Earth Pro
Jane Jacobs, The Death and Life of Great American Cities (New York: Random House, 1961), 35. “On successful city streets, people must appear at different times.”
Varied Scales
Photographed by Author. The images depict the variety of scales of shops that co-exist within a single urban fabric.
Fig. 36: Type 1: Pop up shops by the street and pedestrian side walks
Fig. 37: Type 2: Covered pop up shops against dead facades
Fig. 38: Type 3: Temporal pop up extensions outside permanent shops or establishments
Fig. 39: Type 4: Mulitple hawkers with shared seating spaces that behave as pop ups
functionality
As previously mentioned, the vibrant character of the city is attributed to the diverse range of shops that line its streets. The images shown above, captured by the author during the site visit, illustrate the variety of shops present in Varanasi. It is evident that multiple scales of commerce coexist alongside each other. Pop-up shops cater to their customers along sidewalks, either shaded or exposed to the scorching sun. Hawkers and eateries operate outside permanent establishments or by the roadside, while florists, saree sellers, and fruit and vegetable vendors populate the streets, creating a dynamic interplay of scales within the city’s fabric.
In addition to these smaller-scale operations, medium- and large-scale shops and showrooms are also present. These establishments often exhibit spillovers beyond their physical boundaries, either as an extension of their primary functionality or as a secondary ‘child’ functionality that supports their business. This observation further points towards the city’s inherent need for a mixeduse, all-scale-inclusive urban design strategy. Such an approach would better address the organic requirements of mobility, expandability, and temporality, which are frequently overlooked by conventional redevelopment methodologies.
Fig. 40: Type 5: Permanent spill overs of existing shops and establishments
Fig. 41: Type 6: Hawkers and vendors that have become permanent in nature
Fig. 42: Type 7: Hawkers on wheels that require 360° consumer accessibility
Fig. 43: Type 8: ‘Child ‘ functionality spill over from ‘Parent’
Photographed by Author. The images depict the variety of scales of shops that co-exist within a single urban fabric.
Issues
The organic necessities of the urban fabric are further overlooked by a lack of effective planning strategies, causing congestion along the streets. Imagery from Google Earth Pro highlights the spillover of shops onto the streets, encroaching on the road space. Two-wheelers and bicycles are often parked outside shops as customers visit, further
constricting the streets. Small-scale vendors stack their commodities along the roads, making pedestrian walkways nearly invisible. In some cases, vendors sit in front of shops with different functionalities, obstructing their frontage. These issues stem from a failure to address the spatial and functional needs of all urban users.
Created by Google Earth Pro
Fig. 44: Spill overs of functionalities, lacking clear identity of shop
Fig. 45: Temporary parking of two wheelers and cycles outside shops by visitors
Fig. 46: Temporary parking, spill overs, lack of clear pedestrian walking areas
Fig. 47: Shop owners stacking commodities along the road making the side walk invisible
by Author
Building on this, it becomes evident that a certain level of disorganisation and chaos has taken root within the city fabric. This disorder has only intensified with the increasing influx of population. Varanasi faces significant challenges, including severe traffic congestion, insufficient parking spaces, the absence of dedicated pedestrian zones, excessive noise pollution, and an overall uncomfortable
environment for those attempting to engage with the street experience. These issues are intensified during peak hours, when the pedestrian and vehicular traffic often results in jampacked streets. This was a critical observation during the site visit, as the conditions created a sense of disorientation and fatigue among the city’s inhabitants and visitors alike.
Edgar Schein’s model of organisational culture provides a fascinating way to understand the architectural and cultural identity of Varanasi. The model breaks down culture into three levels: artefacts and symbols, values, and underlying assumptions. These layers give us a deeper appreciation of the city’s rich heritage and its unique architectural character.
Artefacts&Symbols
This level captures the tangible aspects of Varanasi, like its narrow lanes, bustling markets, ghats, and ancient temples. These elements aren’t just physical structures but vibrant
symbols of the city’s identity The street-side food stalls, silk shops, and antique vendors paint a picture of a city alive with history and culture. Architecturally, the densely packed urban fabric and the layered organisation of markets reflect a deep connection between everyday life and spiritual traditions.
Values
Beneath these physical manifestations lie the values of inclusivity, spirituality, and adaptability. The presence of informal markets integrated seamlessly into the urban landscape serves as a dialogue between the locals and the
Fig. 50: Schein’s Model of Organisational culture
Schein’s Model of Organizational Culture
visitors. However, due to the tight urban fabric, the city lacks open public spaces that could serve as gathering points for religious rituals, cultural celebrations, or simply communal interaction.
Assumptions
In a city where contrasting realities like life and death are celebrated, the city refelects assumptions about life, spirituality, and space. The organic way the city has evolved shows an understanding that adaptability is key to survival. The prominence of the ghats underscores the profound connection between the people and the Ganges, which serves as both a spiritual anchor and a source of livelihood.
Discussion
Varanasi, often referred to as the ‘Religious Capital of India,’ presents a fascinating case study in the interplay of history, culture, and urban evolution.
The contemporary urban landscape of Varanasi faces significant challenges, particularly evident in projects such as the Kashi Vishwanath Corridor. While these projects aim to reduce congestion and improve accessibility, they often result in considerable socio-cultural disruptions. The demolition of homes and shops for the KVCP has raised concerns about the preservation of Varanasi’s cultural heritage. Utilising Space Syntax theory to analyse these changes, it became clear that the redesign prioritises large, open spaces at the expense of intimate, human-scaled environments, thereby impacting the city’s traditional spatial integration and thermal comfort. Furthermore, the use of modern construction materials that disregard the cultural context poses a threat to the unique identity of Varanasi’s built environment.
The demographic surge in Varanasi, fueled by religious tourism and migration, calls for adaptive infrastructure solutions that respect the city’s cultural identity. The influx of millions of visitors annually necessitates urban strategies that can accommodate such fluctuations without compromising the essence of Varanasi.
The project aims to highlight the potential for Varanasi to balance its permanent and temporary architectural elements, ensuring development strategies that honor its cultural identity while meeting contemporary demands. It also aims at creating spaces that resonate with the organic necessities that allow expandability and create inclusivity. This balance is crucial for fostering a resilient and culturally vibrant urban environment in Varanasi.
Research Questions
“How can the organic dense fabric of Varanasi adapt to the influx of incremental floating population?”
“How can the dense, static fabric of Varanasi adapt to accommodate the ever-evolving, organic needs of its elements in response to the growing population influx?”
“How much change is significant towards this ancient sacred landscape with the emerging technologies to cater to current and future necessities?”
“How can the abundant repository of natural materials and /or bio-waste due to cultural activities be exploited as potential building material systems in such sacred landscapes?”
“Where does the urban fabric of Varanasi position itself on the spectrum of temporality and permanence? What is the degree of ‘permanence’ required in this ever-changing urban fabric of such socio-cultural landscapes?”
Photographed by Author. Image showing stepped landscape alongside the Ghats
Bibliography
Addy, Arunima. “Modernity in the Shadows of an Ancient Past: Architecture and Religious Nationalism in Banaras (1905-2019).” 2020.
Introduction and Interface Overview for NNA V2. 2020. https://axuplatform.medium.com/numeric-network-analysisv2-basic-febcf8f84f2#:~:text=Numeric%20Network%20 Analysis%20(NNA)%20offers,centrality%20concepts%20 with%20spatial%20networks.
Bansal, Sunny, Vidhu Bansal, and Joy Sen. “Redefining and Exploring the Smart City Concept in Indian Perspective: Case Study of Varanasi.” 2017.
Bansal, Vidhu, and Joy Sen. “Reclaiming the Lost Identity: A Methodology for Generating Smart Urban Design Solutions in Traditional Cities—Case of Varanasi.” 2018.
Choudhary, Bikramaditya Kumar, and Anwesha Aditi. “Varanasi—The Making of a Smart Heritage City.” 2024.
Choudhary, Bikramaditya Kumar, Anwesha Aditi, and Swasti Vardhan Mishra. “Varanasi—The Making of a Smart Heritage City.” 2024.
Coute, Pierre Daniel. City of Plush Felt, Resting by the River, Benaras: An Architectural Voyage. 1989.
Crist, Graham, and John Doyle. Super Tight. Melbourne: AADR - Art Architecture Design Research, 2020.
Das, Debadhyut, and Sushil Kumar Sharma. “An Assessment of the Impact of Tourism Development at Varanasi: Perspectives of Local Tourism Businesses.” n.d.
Das, Debadyuti, Ashutosh Sarkar, and Pratap Mohapatra.
“Attractiveness of Varanasi as a Tourist Destination: Perspective of Foreign Tourists.” 2007.
Division, Government of India Ministry of Tourism Market Research. India Tourism Statistics 2021. 2021.
Rewal, Arun Kumar. “Continuity and Settlement Structure: A
Study of Traditional and Colonial Spatial Patterns in Benares, India.” 1988.
Sadler, Simon. Architecture without Architecture. United States of America, 2005.
Sharma, Poonam, and Swati Rajput. Sustainable Smart Cities in India: Challenges and Future Perspectives. The Urban Book Series, 2017.
Shinde, Karan, and Rana P. B. Singh. “Still on UNESCO’s ‘Tentative List of World Heritage’? Heritage, Tourism, and Stunted Growth in Sarnath (Varanasi), India.” 2023.
Sian, Gurmeet Singh. “Caste/d Space: A Reinterpretation of the Movement and Architecture of Dashashwamedh Ghat, Varanasi, India.” 2008.
Singh, Ayushi. “Culture, Spaceforms & People - Varanasi City.” 2019.
Singh, Rana P. B. “Banaras, the Cultural Capital of India: Visioning Cultural Heritage and Planning.” 2015.
Sacredscapes and Pilgrimage Systems. n.d.
“Urbanisation in Varanasi and Interfacing Historic Urban Landscapes: A Special Lecture.” 2018.
Singh, Rana P. B., and Pravin Singh Rana. “Panchakroshi Yatra Route: The Territory and Temples.” 2024. https://culturalheritageofvaranasi.com/about_
Singh, Rana P. B., and Pravin Singh Rana. “The Kashi Vishvanatha, Varanasi City, India: Construction, Destruction, and Resurrection to Heritagisation.” 2022.
Singh, Rana P. B., and Pravin Singh Rana. “The Riverfrontscapes of Varanasi, India: Architectural Symbolism, Transformation, and Heritagisation.” 2023.
Singh, Rana P. B., and Pravin Singh Rana. “Varanasi: Heritage Zones and Its Designation in UNESCO’s World Heritage Properties.” 2017.
Singh, Rana P. B., and Pravin Singh Rana. “Varanasi: Sustainable Development Goals, Smart City Vision and Inclusive Heritage Development.” 2017.
Singh, Rana P. B., and Santosh Kumar. “The Sacred Nodes of Panchakroshi Yatra Route, Varanasi (India): Spatial Perspectives and Prospects for the Future.” 2022.
Slutzky, Robert. Transparency: Literal and Phenomenal. 1968.
Soccali, Giuditta. “Heritage and the City: Practices of Care Resisting Urban Dispossession in Varanasi, U.P., India.” 2021.
Steward, Julian. “Indigenous Architecture in the Amazon Basin: The Canelos Quichua.” Journal of Anthropological
Research. 1963.
Tiwari, Akhilendra Nath. “Prospects and Constraints in Development of Varanasi as Smart City, India.” 2016.
TOI. Times of India. December 20, 2023. Accessed May 12, 2024. https://timesofindia.indiatimes.com/city/varanasi/ more-than-13-crore-tourists-visited-varanasi-in-past-twoyears-says-govt/articleshow/106140454.cms.
Twain, Mark. Following the Equator: A Journey Around the World. The American Publishing Company, 1897.
Research Methodology
Overview
M.Sc phase (rest houses, death home)
M.Arch phase (markets)
Fig. 51: Methodology : Overall Workflow for Halt points (M.Sc phase) and experiential markets (M.Arch phase)
The growing population influx in Varanasi has significantly strained the city’s infrastructure, testing its ability to accommodate an increasing floating population. Large-scale redevelopment projects, such as the Kashi Vishwanath Corridor, have disrupted the city’s heritage and urban fabric, with demolition and reconstruction often disregarding critical factors such as scale, proportion, environmental comfort, and cultural identity. This dissertation adopts a data-driven methodology to inform site selection, intervention strategies, and spatial planning. It integrates local materials, multi-objective optimisation, and predictive modelling using machine learning to anticipate future growth and its implications.
The research was conducted in two phases: the M.Sc phase (first six months) focused on halt points— rest houses and death homes—while the M.Arch phase (next three months) explored experiential markets.
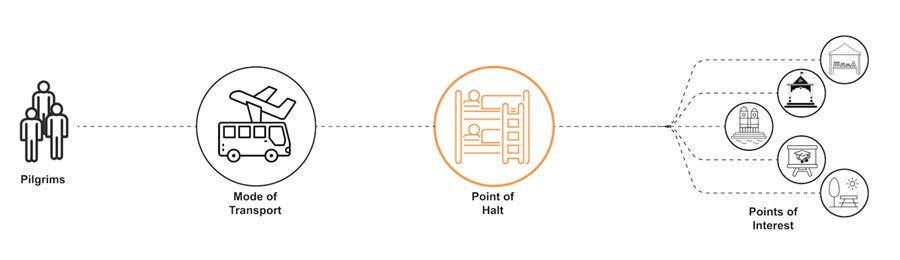
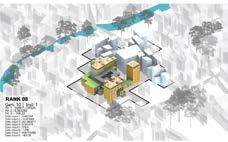
The workflow for halt points involved three stages: site selection, morphology development (Stages I and II), and iterative prototyping. Site selection incorporated network analysis using Numerical Network Analysis metrics such as betweenness and closeness centrality, reach, and gravity to understand topological relationships. Solar exposure, visibility, and wind flow analyses further refined a ranked list of potential sites, with the top-ranking site selected for intervention.
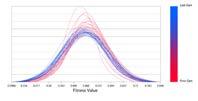
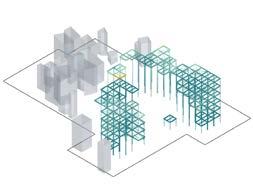
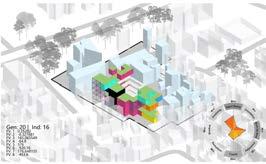
Morphology Stage I focused on spatial placement and form generation using Multi-Objective Evolutionary Algorithms (MOEA) with Wallacei, adhering to fitness objectives such as adjacency, open spaces,
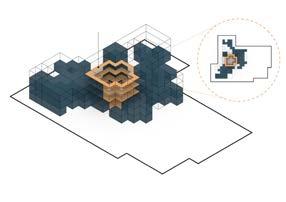
and FAR regulations. Stage II refined the built form through voxel-based modelling, material assignments, and façade detailing. Environmental optimisation and structural analysis were conducted using tools such as Karamba and Ladybug, while post-analysis evaluated daylight, radiation, and sociability. Insights from machine learning informed subsequent site development.
The M.Arch phase applied this datadriven approach to market spaces. Site selection involved network analysis and pedestrian simulations, complemented by on-site mapping of market scales, operational timings, footfall, and visitor wait times.
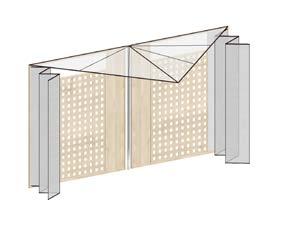
Morphological experiments in this phase employed MOEA algorithms to optimise spatial organisation, targeting a 20% increase in shops and accommodating small-scale commodities. The design prioritised visibility, shaded open spaces, and spatial efficiency. A custom kit-of-parts system, including panels and architectural elements, detailed the market intervention. Post-analysis evaluated lux levels and sociability of the proposed design.
In this way, the research proposes adaptive interventions to enhance the traveller’s journey, encompassing halt points such as rest houses and death homes, as well as experiential market spaces.
Material Experimentation & Prototyping
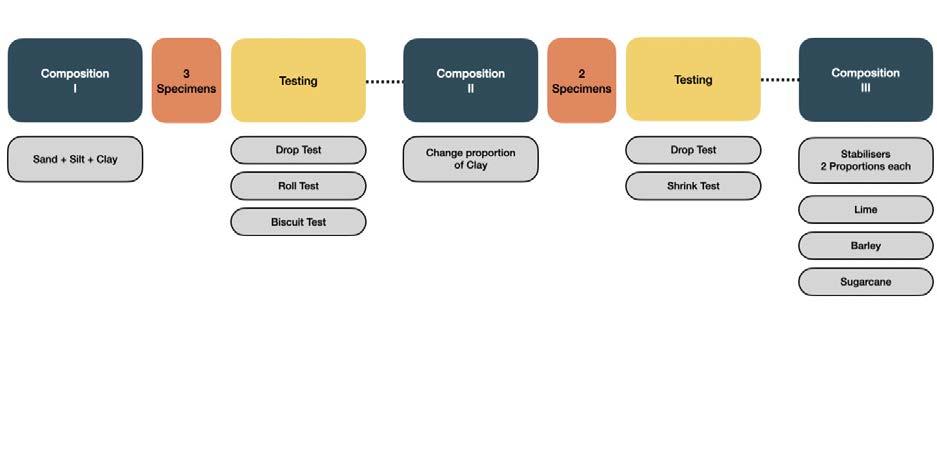
52: Methodology : Material Test
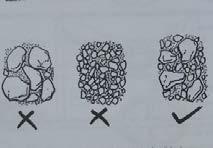
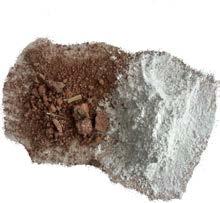
The above diagram illustrates the steps involved in material testing for the creation of loam, composed of sand, silt, and clay, with the addition of stabilisers to achieve a lightweight, sustainable solution. The various compositions were tested, and the final admixture was used to produce a panel via ramming, scaled to 1:3 for the model.
Fig.
The material experiments were conducted in parallel with the computational analyses described earlier. Materials were sourced online due to their ready availability. The initial phase focused on determining the optimal proportions of sand, silt, and clay to create the base loam. Following various tests, adjustments in clay proportions were made to refine the specimen. Subsequent experiments involved adding stabilisers—lime, barley, and sugarcane—in two different proportions, resulting in six distinct specimens. These were tested and the qualified specimens were sent to a professional compression testing facility. The successful specimens were then used to produce 1:3 scale models through ramming, with molds prepared using styrofoam and CNC routing. These panels were tested for heat dissipation and evaluated for their integration within a timber framework. The compression testing results were incorporated into Finite Element Analysis for designing the Kit of Parts system, which was then integrated into the computational workflow.
Markets (M.Arch Phase)
Site Selection
Fig. 53: Methodology : Site Selection
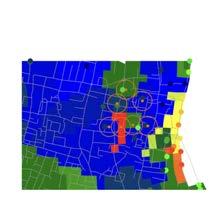
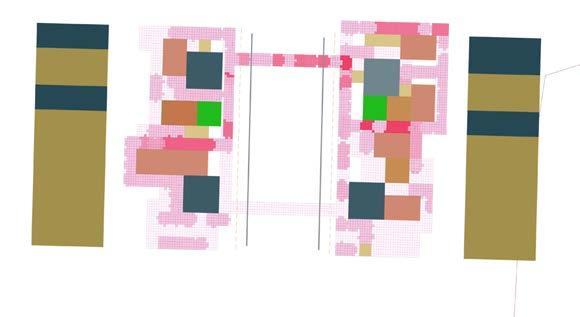
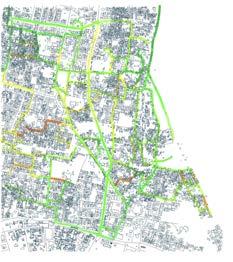
As Zone II of Varanasi is classified under redevelopment, it was taken into consideration for the reasearch. Points of ‘origin’ and ‘destination’ were designated based on the intended users of the intervention. The prediction locations of rest houses and death homes were added to the points of origin for the markets. A quantitative network analysis, encompassing nodal metrics like Betweenness Centrality and Closeness Centrality, as well as network edge metrics such as Reach and Gravity analysis, was then performed using the Numerical Network Analysis plugin within Grasshopper was employed.
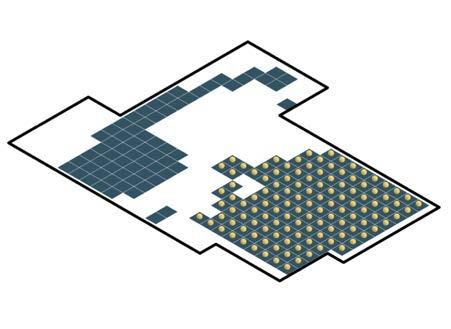
The land parcels within the site were shortlisted according to a set domain of values and ranked based on their overlap.
Subsequently, the data of shops was mapped on the above land parcels analysing their scale, attractiveness and wait times documented by the team during the site visit. These factors were considered to conduct a pedestrian simulation using H.I.V.E. to determine zones of high sociability. Out of the three resulting zone one was selected as a case scenario for the research.
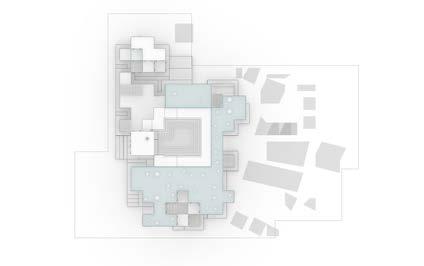
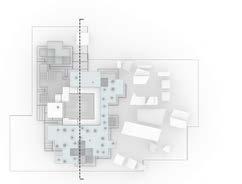
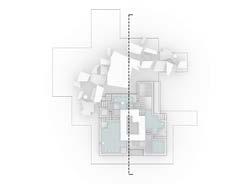
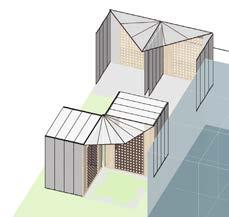
Morphology
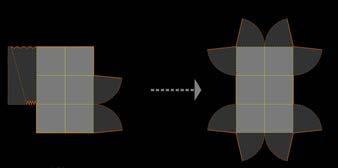
54: Methodology : Experiment I
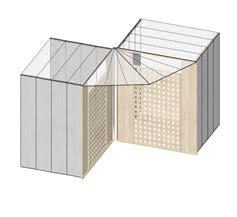
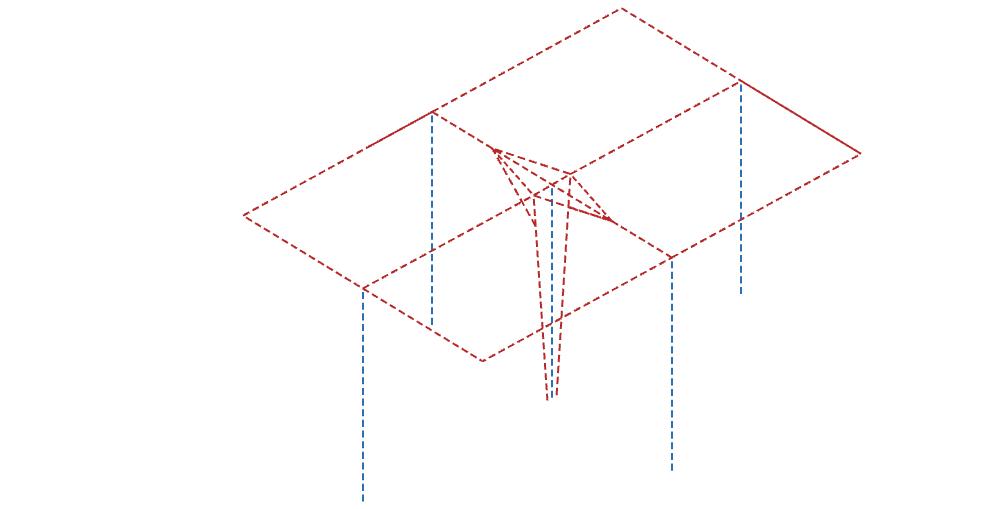
Fig. 55: Methodology : Detection and assignment of Kit-of-Parts
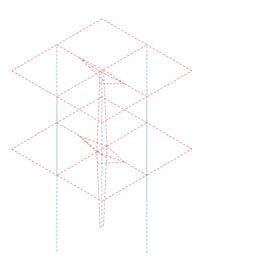
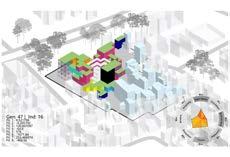
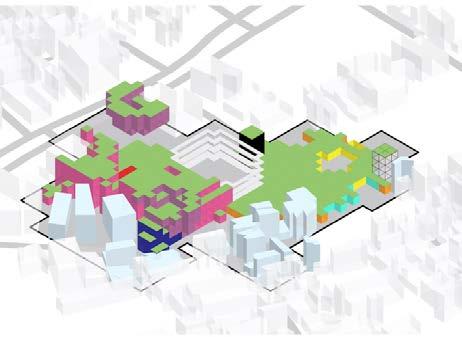
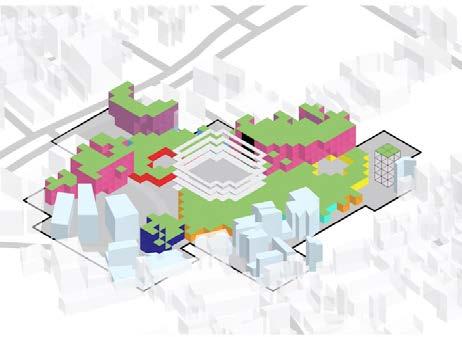
The workflow of the morphology involved a multilayered process with constant analysis of data at every stage. The first stage consisted of a multi-objective optimization (MOEA) predominantly evaluating the phenotypes based on visibility, shaded open spaces and area requirements.
The phenotype performing well in all the criterion was chosen for the assignment of the various kit-of-parts and a structural optimization to determine the appropriate sizes of structural members.
A post-analysis of the final phenotype was conducted using Pedestrian Simulation (Hive), Computational Fluid Dynamics (CFD), and Daylight Analysis to assess its performance in terms of sociability, wind flow, and natural light distribution, respectively.
Fig.
56: A view from the Ganges
Created by Jackson Groves https://www.journeyera.com/things-to-do-in-varanasi/
Fig.
Research Development
Area of Intervention
Street Experience Street Experience
Street Experience Street Experience Markets Markets Markets Markets
Fig. 57: Journey of a Pilgrim or Tourist in Varanasi
Created by Author
The floating population, predominantly comprising pilgrims and tourists, typically resides in hotels, hostels, and dharamshalas, as well as in death homes for those seeking salvation. Hotels and hostels are either devoid of the culture of the city or try to incorporate it merely through ornamentation. In contrast, dharamshalas possess cultural significance both in typology and social interaction; however, their current condition does not meet contemporary needs. A similar situation exists with death homes.
The city’s streets exhibit a distinctly public character, yet the transition between public, semi-public, semi-private, and private functions is often abrupt and
disjointed. The project aims to create an intervention in the form of resthouses that facilitates a smooth transition between these functions. This intervention seeks to seamlessly integrate into the urban fabric while providing public amenities not only for the floating population but also for residents. Therefore, the cultural identity and traditions of the city is reflected in these interventions by creating a play between the open and built such that they promote interaction between the locals and pilgrims and become opportunities where the tradition and local culture of the city can be experienced.
Fig. 58: Dilapidated existing Dharamshala with poor lighting, ventilation, and sanitation.
Photographed by Author
Fig. 59: Existing death home exhibiting comparable conditions, fostering a sombre atmosphere and negatively impacting spatial psychology.
Photograph from The National News (https://www.thenationalnews.com/weekend/2022/09/30/inside-indias-death-hotel-where-believers-come-not-forhospitality-but-for-salvation/), accessed August 1, 2024
Fig. 60: Classifying Spaces on the Public to Private Gradient
Created by Author
Classifying the Typologies
The study examines dharamshalas and death homes, focusing on spatial transitions from public to private realms, day-to-night activities, and the temporal nature of street functions. In the context of Varanasi’s urban density, open spaces were prioritised for their contribution to the city’s cultural identity. Various types of open spaces were identified, including kunds (sunken water courts) surrounded by steps, yoga and meditation courts reflecting India’s wellness traditions, and sunken courts repurposed as open amphitheatres. Previous research underscored the importance of front yards or entrance courts as buffer zones between streets and interior spaces, recognising these as public open spaces.
For built interventions, the proposal included a library housing historical, cultural, and religious resources, along with multi-purpose halls for festivals, weddings, and community events, catering to both locals and visitors. Additional recreational facilities, such as Ayurvedic spas and communal kitchens, were suggested to highlight the city’s traditions. Supporting amenities included a reception and information centre, an indoor temple, a priest’s room, and an infirmary—essential elements for a death home.
Resting spaces were further categorised based on privacy levels, offering single, double, and dormitory accommodations, with provisions for attached washrooms. The intervention also sought to address the city’s deficit of public toilets. This holistic approach integrates public, semipublic, semi-private, and private functions, enriching the urban fabric while providing necessary amenities for both local residents and the floating population.
To formalise these spatial classifications, three distinct typologies were developed for rest houses: publicprivate (RH-01), public-semi-private (RH-02), semi-privateprivate (RH-03), and a fully private typology for the death home (RH-04). Each typology caters to diverse visitor preferences while preserving cultural relevance. The RH-01 typology combines private accommodation with opportunities for interaction in shared public spaces. RH02 fosters communal interaction even within sleeping areas by incorporating dormitories. RH-03 offers a more secluded experience. Meanwhile, the sensitive nature of RH-04 designates it as the most private typology, catering exclusively to its specific purpose.
Fig. 61: Rest House Sub-division based on Public to Private Gradient
Created by Author
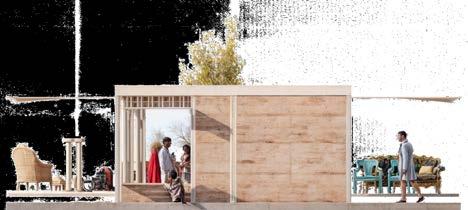
While the population data fluctuates in millions across the year, spaces accommodating this footfall are completely permanent, lacking flexibility. The project aims at learning from the past such that the intervention holds an ephemeral, adaptable and sustainable quality with potential of expansion if need be. By employing a dynamic kit-of-parts approach, functional elasticity is created within spaces while preserving cultural values of Varanasi. This approach ensures that these resthouses do not become redundant locked spaces during off-peak seasons when demand is low. With the application of expandability in architectural form, physical elasticity is created wihtin the market spaces that are able to cater to the organic and ever changing needs. This spatial expansion enables inclusivity and an efficiency in terms of area utilisation.
Fig. 62: Design ideaology; The design ideology aims at learning from the past, to design in the present and predict for the future
Created by Google Earth Pro & Author
Created by Author
Fig. 63: Peak Population influx in Varanasi. Fluctuating population necessitates adaptable solutions
Decoding the Fabric
Old City
Central City
Peripheral City
64: Development Control Plan, Varanasi
Created by Statutory Planning Authority
The old city of Varanasi is flanked across the banks of river Ganga, considered sacred by the Hindus. The city can be divided into three settlement typologies – Old city, Central city and Peripheral City.
The old city covers areas around the ghats and exhibits dense development along the banks of the river along its length in a linear form. Despite undergoing transformations over time, it retains its cultural ethos within a labyrinth of narrow streets, which host temples, shrines, rest houses, eateries, and restaurants. This area also faces the challenge of accommodating the increasing floating population.
The Central city consists of the areas adjacent to the old city with availability of facilities and services along with cultural attractions contributing to significant development pressure.
The Peripheral city consisting of municipal wards have a stark difference in their development pattern with planned urbanization. However, the creation of concrete structure leads to a loss of cultural identity in the quest for rapid development.1
1. Limited, CRISIL Risk and Infrastructure Solutions, City Development Plan for Varanasi, 2041 (Final City Development Plan) (2015).
Fig.
Created by Statutory Planning Authority
The old city of Varanasi is flanked across the banks of river Ganga, considered sacred by the Hindus. The city can be divided into three settlement typologies –Old city, Central city and Peripheral City.
The old city covers areas around the ghats and exhibits dense development along the banks of the river along its length in a linear form. Despite undergoing transformations over time, it retains its cultural ethos within a labyrinth of narrow streets, which host temples, shrines, rest houses, eateries, and restaurants. This area also faces the challenge of accommodating the increasing floating population.
The Central city consists of the areas adjacent to the old city with availability of facilities and services along with cultural attractions contributing to significant development pressure.
The Peripheral city consisting of municipal wards have a stark difference in their development pattern with planned urbanization. However, the creation of concrete structure leads to a loss of cultural identity in the quest for rapid development.2
Fig. 65: Development Control Plan, Varanasi
2. Arun Kumar Rewal, “Continuity and Settlement Structure: A Study of Traditional and Colonial Spatial Patterns in Benares, India,” 1988.
67: Hierarchy of Road Networks : Secondary Roads. The map illustrates the secondary road network branching out of the primary roads.
Created by Author
Fig. 69: Hierarchy of Road Networks : Tertiary Roads. The map illustrates the mohallas encompassed by secondary roads.
Fig. 66: Urban Fabric of Varanasi
Fig.
Fig. 68: Hierarchy of Road Networks : Primary Roads
Photographed by Author
by Author
Photographed by Author
Photographed
Source: AFP/Air Pano.
Fig. 70: Urban Fabric of Varanasi
Fig. 71: Hierarchy of Road Networks : Primary Roads
Fig. 72: Hierarchy of Road Networks : Secondary Roads
Fig. 73: Hierarchy of Road Networks : Tertiary Roads
The fabric exhibits a hierarchy of road networks such that the secondary roads encompass the mohallas while the tertiary roads create colonies. Usually, a functional continuity is seen between the colonies. Although they vary in size, the variance in their proportions is not extreme. However, each colony has its own identity due to the social group or specific trade like schools, temples or rest houses that it accommodates.
Created by Author
The orientation of the colonies is of a simultaneous inward and outward nature. In terms of physicality, the external face exhibits a closed character with openness in the internal space. The internal focus accommodates a specific characteristic of significance like gardens, courtyards or civic institutions providing the block its identity. The facades of the block form a continuous edge along the extent of its perimeter with multi-functional shops creating experiential streets full of life and culture. The division of the bays is such that maximum numbers attain street frontage. Adjoining blocks exhibit coherence due to the functional continuity.3
3. Arun Kumar Rewal, “Continuity and Settlement Structure: A Study of Traditional and Colonial Spatial Patterns in Benares, India,” 1988.
Fig. 74: Dual orientation of the colonies
The image above illustrates the zone that includes a section of the old city along the Ganges River. This zone features the Kashi Vishwanath Corridor project, which was completed in 2019.
Fig. 75: Zone 1 : Kashi Vishwanath Corridor Project
Site Selection
The proposed Development Plan 2031 for Varanasi clearly identifies five key zones designated for development under the Government’s Varanasi Smart City initiative. This development aims to enhance the cultural and heritage significance of these areas, while simultaneously improving infrastructure and fostering economic growth.
These five zones include:
1. River Front Ghats and Temple Area
2. Durga Temple, Sankat Mochan Area
3. Kamachcha Bhelpuri Area
4. Lahartara
5. Sarnath
To accommodate the growing population, new buildings are being constructed in these five zones, either by demolishing older structures or building upon them. To preserve the heritage identity of the Riverfront Ghats and temples, a regulation mandates that construction activities must occur at least 200 meters from the river. Consequently, for the proposed interventions - specifically the Rest House (Dharamshala) and the Death Home - Zone 2, which encompasses the Durga Temple-Sankat Mochan area, has been deliberately selected for this research.
Zone 2 contains more than 20 ancient temples that attract innumerable pilgrims every year. The Durga temple has a major historic and religious value and is a go-to spot on every itinerary. The temple is flooded with worshippers, both local and outsiders. The Lolarka Kund which is one of the oldest ponds of the river Ganges has high historic significance due to its mention in the historic text of Mahabharata. These points of interest make Zone 2 highly suited for proposing the Rest House and the Death Home, with an added experiential quality through its Street Markets.4
4. R. P. Singh and P. S. Rana, “Varanasi: Sustainable Development Goals, Smart City Vision and Inclusive Heritage Development,” 2017.
Zone 2 which has been arbitrarily selected as the site for this design development and proposal. This area includes significant tourist and pilgrimage destinations such as the Durga Temple and Durga Kund, the Sankat Mochan Temple, and the Lolarka Kund in Varanasi.
Fig. 76: Zone 2 : Durga Temple, Sankat Mochan Area
Methodology : Site Selection for Rest House & Death Home
The site selection process for the rest house and death home intervention employs the illustrated analytical methods to filter sections of the site, ultimately narrowing down the search and identifying the final location for design interventions.
A multi-step process was employed to select the site for the rest house and death home interventions.
This began with identifying key nodes and establishing topological relationships within the chosen fabric, followed by a network analysis to refine the search. Areas were then ranked based on environmental and visibility parameters to identify potential sites suitable for intervention. The workflow
integrates both 2D and 3D analyses, with 2D analysis applied to planar geometries and 3D analysis used for the three-dimensional model. While network and visibility analyses were conducted in 2D, the environmental study relied on 3D analysis. Refer to Appendix I.
Fig. 77:
Topological Relations
Fig. 78: Topological Relations for the Rest House
The existing rest houses and trasnport hubs were designated as points of ‘origin,’ while the points of ‘destination’ included the ghats, religious nodes, educational campuses, markets, and parks.
Fig. 79: Topological Relations for the Death Home
In contrast to the rest house, the points of ‘destination’ for the death home were limited to the market (for food), religious nodes, and ghats, while the existing death home and transport hubs became the points of ‘origin’.
Existing rest houses and transport hubs were classified as ‘origins’, while ghats, religious nodes, kunds, markets, and parks— i.e., the points of interest for pilgrims or tourists— were defined as ‘destinations’. For the death home, the origins included the existing death home and transport hubs, while the destinations focused on ghats, religious nodes, and food markets. This informed a topological analysis of the network’s performance.
Varanasi’s points of interest are most effectively experienced on foot, offering a dynamic visual journey with key moments that enrich the overall city experience. The M.Sc. phase (refer to Appendix I) focused on nodal points through the interventions of the rest house and death home. While these points of halt serve as the final destinations for pilgrims and visitors, the city’s experience is deeply embedded in its market streets, bustling with commercial activities of varying scales and levels of attractiveness which was covered underthe M.Arch phase. This latter phase of study approached the site selection process by utilising the network relations generated from the creation of ten different rest houses through Artificial Neural Networks in Machine Learning. (Refer Appendix V). These rest houses became the added points of origin, facilitating the site selection for markets.
Methodology : Site Selection for Markets
The site selection process incorporated the proposed rest houses into the existing urban fabric, with these new origins influencing the network’s topological relationships. The site networks were subsequently re-analysed to identify new relationships, which were then examined in relation to shop scale, operating hours, and pedestrian simulations, considering factors such as wait times and the attractiveness of the shops.
The sites selected for the rest houses and death homes were populated based on ranking of locations within the site (Appendix I) with ten additional interventions, designed using Machine Learning (Appendix V). These new additions were integrated into the existing points of origin, influencing the network of the site. The relationships between these new origins, the original ones, and the existing destinations were further analysed using quantitative network analysis methods, such as betweenness and closeness
centralities, along with reach and gravity analysis. Markets are heavily influenced by these parameters, which helped establish a feedback loop. The shortlisted sites were then examined by categorising the shops based on their scale and hours of operation. These were subsequently analysed through pedestrian simulations, considering wait times and attractiveness, to determine the final sites for intervention. These experiments are discussed in detail under Design Development.
Fig. 80:
Gyanvapi Market, Varanasi
All above photographs: Tusk Travel (https://www.tusktravel.com/blog/famous-markets-for-shopping-in-varanasi/), accessed January 4, 2025.
Vishwanath Lane, Varanasi
Gadauliya Chowk Market, Varanasi
Vinayak Plaza, Varanasi
Markets Scale
During the site visit, various shops along the streets of Zone II were mapped, revealing a fascinating juxtaposition of scales and functions that contributed to a distinctive pedestrian experience.
The shops were classified into three categories: small, medium, and large.
The small-scale typology was particularly intriguing, with a mix of temporary and permanent setups. Temporary shops included mobile vendors operating from carts or goods simply displayed on cloths spread on the ground, devoid of any physical infrastructure. These vendors strategically shifted their locations throughout the day to capitalise on spots offering maximum profit. In contrast, the permanent small-scale shops included general stores, milk outlets, and apparel shops, among others.
The medium-scale shops were typically permanent establishments such as fast food outlets, flower shops, stationery stores, and tourist information centres. A unique feature of this scale was the presence of associated child functionalities in some instances. For example, a mediumscale sit-down restaurant was observed to have a temporal fast-food vendor stationed outside, catering to quick pauseand-eat needs. Similar relationships were noted in other cases, such as permanent apparel shops paired with temporal tailors, creating a dynamic parent-child relationship between the two functions.
The large-scale shops were predominantly clothing showrooms, restaurants, and supermarkets, which required substantial space and served as major attractors within the marketplace.
Fig. 81: Scale based classification of markets
Created by author
Wait-time, Attractiveness
The operational patterns of shops across various scales were analysed, revealing distinct variations in their time of activity. While some shops remained operational throughout the day, others followed specific time-based schedules. For instance, as illustrated in the chart alongside, mediumscale flower shops were observed to be active during the morning and afternoon but ceased operations by evening. This pattern was documented for a variety of commodities during the site visit.
An intriguing relationship between the static and mobile states of users and shops was also observed. For instance, at a food cart, both the shop and the user were in a mobile state, whereas in a medium-scale fast-food joint, the shop remained static while the user engaged in a quick pause to eat, maintaining a semi-mobile state. In contrast, sit-down restaurants exhibited a static state for both the shop and the user.
This led the team to map the wait-time—the duration a user spends at a shop—and to compare it across different shop types. Additionally, the likelihood of a user visiting a particular shop was also documented as attractiveness. These mappings were conducted across three time periods—morning, afternoon, and evening—to account for the varying operational hours of shops.
This analysis resulted in a complex multi-dimensional data matrix encompassing shop types, operational times, wait-times, and attractiveness. For example, small-scale paan shops demonstrated high attractiveness during the evening but were characterised by short wait-times
due to their quick takeaway nature. Conversely, repair shops displayed low attractiveness but long wait-times. Interestingly, for shops operating throughout the day, both wait-times and attractiveness levels varied depending on the time period.
This led to the conclusion that the parameters of attractiveness and wait-time are independent of one another, as their correlation varied significantly across different shop types and operational periods.
Fig. 82: Attractiveness of various shops
[morning] [afternoon] [evening]
attractiveness wait-time
83: Scale vs. wait time vs. attractiveness of shops
Fig.
Accessibility
Fig. 84: Small scale shops and their acccessibility
Bill Hillier ’s theory of urban aggregation, which examines the spatial and social principles of spaces using a grid of square cells and nodes as access points governed by a custom-defined rule set, was employed to analyse the markets.5 This approach facilitated an understanding of accessibility variations across different types of shops, with particular focus on small-scale shops, which demonstrated diverse spatial requirements, as depicted in the accompanying diagram.
The findings from this study were instrumental in determining the placement of small-scale shops based on the number of accessible sides available, ensuring optimal spatial and functional organisation within the market.
5. Bill Hillier and Julienne Hanson, The Social Logic of Space (Cambridge: Cambridge University Press, 1984).
Loam Materials
The Ganges River, which traverses the northern region of India, deposits alluvial soil along its banks. Varanasi, one of the world’s oldest continuously inhabited cities located along these banks, extensively utilises these soils, particularly loam, for agricultural and construction purposes. Loam, which is composed of sand, silt, and clay, has historically been significant in construction due to its abundant availability in the region.
Loam is an ideal building material in Varanasi because its readily available, easy to work with and because of its properties like thermal insulation and porous nature. It is biodegradable, has a lower carbon footprint and is also a reusable material. Loam consists of sand, silt, clay and a smaller amount of organic material. Silt- a constituent of loam,
alone is not good for construction because it lacks cohesion but when mixed with other materials, can become a suitable building material.
Silt can easily be found on the riverbanks because of its fine particles that are carried away by river water and are deposited when the flow slows down or during floods. Thus, it becomes a potential material to use in Varanasi.6
To make it suitable for construction, it can be mixed with different agricultural wastes which are easily available in the region. Material like sugarcane residue, wheat and rice husks, barley straws and other suitable agricultural wastes increases the binding properties and increases the strength by acting as reinforcement. Other organic wastes that are produced during religious activities like flowers, petals,
Fig. 85: Ghats of Varanasi
Fig. 86: Rammed Earth panel construction
6. Hassan Fathy, Architecture for the Poor: An Experiment in Rural Egypt (Chicago: University of Chicago Press, 1973).
leaves, ashes and food offerings, can also be composted or fermented and used for construction.
Mud structure has been built since ancient times in India. Various references reflect the sustainability of the material, its adaptability to local climate and the abundance availability. The higher thermal mass of such a structure helps it to remain cool in summers and hot in winters hence reducing the need for active strategies solutions in a building. The material has huge potential to blend with both the traditional and modern techniques if used wisely. The numerous benefits and adaptability to local climate, makes it a feasible and environment friendly alternative to conventional building methods.7
Timber (Glulam)
In the context of Varanasi, the utilization of locally sourced materials like timber and glulam in construction holds significance. Varanasi’s religious ceremonies, particularly the cremation rituals along the Ganges, result in an abundance of timber as a byproduct. This surplus of wood presents an opportunity to repurpose timber for eco-friendly construction projects, contributing to a sustainable, circular economy.
Timber, being a renewable resource, offers low embodied energy compared to materials such as concrete and steel. The availability of this material due to religious activities in Varanasi provides an abundant local supply, which helps reduce transportation costs and associated carbon emissions. By using timber in rammed earth panels, the
7. Martin Gurvich, Mud, Mirror and Thread: Folk Traditions of Rural India (Ahmedabad: Mapin Publishing, 2000).
Fig. 87: Timber uses for cremation
project aligns with the principles of sustainable architecture, as rammed earth itself is known for providing excellent thermal comfort, especially in Varanasi’s hot climate.
Glulam, on the other hand, enhances the structural capabilities of timber by bonding multiple layers of wood, making it a versatile material for load-bearing components in construction. Using glulam in this region has the added advantage of providing strength comparable to steel but with a much smaller carbon footprint. This contributes to the overall goal of reducing the carbon footprint of the project while utilizing abundant, locally sourced materials.
8. Archdaily, “From Tradition to Innovation: How Modern Technologies are Transforming the Potential of Wood,” n.d.
11. IntechOpen, “Engineered Wood Products as a Sustainable Construction Material: A Review,” n.d.
12. Meridian Allen Press, “Cradle-to-Gate Life-Cycle Impact Analysis of Glued-Laminated (Glulam).”
Additionally, timber and glulam structures are known for their aesthetic appeal, which can be harmonized with the traditional architectural styles prevalent in Varanasi, preserving the cultural identity of the region.8,9,10,11,12
In conclusion, employing timber and glulam in construction in Varanasi not only supports local economies and sustainable material sourcing but also reinforces the environmental goals of reducing carbon emissions, all while maintaining the city’s unique cultural and architectural heritage.
Fig. 88: Glulam timber construction
Natural Material
Locally Sourced
Quick Assembly
Reduced Carbon Footprint
Material Sugarcane Bagasse
Residue left after sugar extraction, can be used as an organic additive in construction materials
Wheat and Rice Husks
Processed into ash and used as a partial replacement for cement in concrete
High cellulose content, is suitable for bio-composite materials and can be used in insulation boards, composite panels, and as reinforcement in concrete
High in silica content when burnt, are suitable for ash-based construction materials, including cement replacement, insulation materials, and lightweight concrete
Barley Straws
Fibre reinforcement in adobe bricks and cob construction
Rich in fibres, add tensile strength to building materials and can be used in cob construction and straw bale construction
Harvest Residuals
Other agricultural residues, such as maize stalks and cotton stalks, can be processed and incorporated into building materials
Varying depending on the crop and generally rich in cellulose and lignin, are used in bio-composites, reinforcement in construction materials
Fig. 89: Sugarcane bagasse
Fig. 90: Wheat and rice husks
Fig. 91: Barley straws
Fig. 92: Harvest residuals
Types of Construction
Rammed Earth
Cob Construction
Involves soil preparatio n, formwork erection, and compaction Involves mixing, building, and shaping by hand
Earth construction is sustainable, offers excellent thermal performance, has low embodied energy
It is labourintensive, susceptible to moisture damage and requires regular maintenance
Need for skilled labour and protection from water damage
Cost-effective in terms of materials but involves higher labour and maintenance costs.
Straw Bale Construction
Involves frame construction, stacking bales, and plastering
Rammed earth has been a widely used construction method for centuries across various regions worldwide. This technique involves compacting earth, extracted from the ground, within specially constructed formwork. The formwork
is then moved layer by layer, allowing the building to rise progressively. Historically, rammed earth has been favored for its cost-effectiveness and the local economic benefits it brings due to its reliance on abundant and inexpensive
materials and unskilled labor.
Given the abundant availability of loam in Varanasi, it has been selected as one of the primary materials for exploration. Rammed earth buildings are well-suited to Varanasi’s climate, characterized by hot summers, cool winters, and a monsoon season. The thermal mass of rammed earth helps maintain comfortable indoor temperatures, reducing the need for artificial heating and cooling.
Rammed earth, which operates on the principles of compression through load dissipation across surfaces in a conventional manner, requires integration with modern technologies such as prestressing and the incorporation of timber. This integration aims to enhance the properties of rammed earth, thereby reducing the extensive use of materials and labor. Adopting a “kit of parts” approach, the system of prestressing and prefabricated rammed earth panels off-site, followed by on-site assembly, minimizes labor and errors, thus increasing execution precision. In the context of rammed earth construction, specific experiments are proposed to test the optimal load-bearing strength, thickness, height, and length of each panel.
The construction of rammed earth structures necessitates precise proportions and preparation methods for the materials. These materials typically comprise a mixture of clay, silt, sand, and occasionally gravel.
Methods
Soil testting and analysis:
Given the local availability and material characteristics in London, instead of relying solely on soil, the research began with three different ideal proportions of materials. These proportions were specifically selected to create the optimal rammed earth mixture using the types of materials available locally. The mixtures were carefully tested through various field tests to assess their strength and feasibility for application in new construction techniques.13,14
13. Julian Keable and Rowland Keable, Rammed Earth Structures: A Code of Practice (Watford: BRE Press, 2011).
14. Gernot Minke, Building with Earth: Design and Technology of Sustainable Architecture (Basel: Birkhäuser, 2021).
SILT
CLAY
Fig. 93: Loam base composition
Ball drop test:
Sample - 1
Sand: 70%, Silt: 20%, Clay: 10%
Sample - 2
Sand: 60%, Silt: 25%, Clay: 15%
Sample - 3
Sand: 65%, Silt: 30%, Clay: 5%
Given the local availability and material characteristics in London, instead of relying solely on soil, the research began with three different ideal proportions of materials. These proportions were specifically selected to create the optimal rammed earth mixture using the types of materials available locally. The mixtures were carefully tested through various field tests to assess their strength and feasibility for application in new construction techniques.15
From the drop tests conducted sample 2 with sand (60%), silt (25%) & clay (15%) was selected.
Sample - 1
Sand: 70%, Silt: 20%, Clay: 10%
Sample - 2
Sand: 60%, Silt: 25%, Clay: 15%
Sample - 3
Fig. 94: Loam composition and mixing
Fig. 95: Drop test qualifying criteria
Fig. 96: Drop test results
Sand: 65%, Silt: 30%, Clay: 5%
15. Keable and Keable, Rammed Earth Structures, 35.
Biscuit test: Cigar / roll test:
Sample - 1
Sand: 70%, Silt: 20%, Clay: 10%
Sample - 2
Sand: 60%, Silt: 25%, Clay: 15%
Sample - 3 Sand: 65%, Silt: 30%, Clay: 5%
Process: A thin disc or “biscuit” of the mixture is formed and allowed to dry completely.
Observation: The presence of cracks and the degree of shrinkage provide insights into the mixture’s clay content and the risk of cracking in finished panels.
Conclusion: Mixtures that exhibit minimal cracking and maintain their shape are preferred, indicating balanced clay content suitable for rammed earth construction.
From the biscuit tests conducted sample 2 with sand (60%), silt (25%) & clay (15%) was selected.16
- 1
Sample - 2
Sample - 3
Process: A small amount of moist mixture is rolled into a thin “cigar” shape approximately 3 mm in diameter.
Observation: The ability of the mixture to hold together without breaking indicates its plasticity and clay content.
Conclusion: Mixtures that can be rolled into a cigar without breaking or cracking are considered ideal for rammed earth, possessing sufficient plasticity and cohesiveness.
From the roll tests conducted sample 1 sand (70%), silt (20%) & clay (10%) & 2 sand (60%), silt (25%) & clay (15%) was selected.
Fig. 97: Biscuit test results
Fig. 98: Cigar test results
Sample
Sand: 70%, Silt: 20%, Clay: 10%
Sand: 60%, Silt: 25%, Clay: 15%
Sand: 65%, Silt: 30%, Clay: 5%
16. Keable and Keable, Rammed Earth Structures, 35.
From the above tests conducted sample 2 was selected and further investigated by varying the proportion of clay, creating two more compositions Sample 2A (clay 18%) and Sample 2B (clay 20%). Drop tests were conducted for both samples to determine the best composition.
Drop test sample 2A & 2B:
Addition of Stabilizers:
From the drop tests conducted sample 2A with sand (60%), silt (25%) & clay (18%) was selected and was further investigated by the addition of 3 different stabilizers and the drop tests were conducted again for the samples.
Advantages of stabilization:
• Speeds up building process.
• Improves durability and strength where the soil is poor
• Walls may be thinner
• No need for expensive surface treatment
Sample 2A performing well with the tested composition further went through series of drop tests by the addition of stabilizers such as:
Sample - 2A
(Sand: 65%, Silt: 30%, Clay: 15%) + Clay: 3%
Sample - 2A
(Sand: 65%, Silt: 30%, Clay: 15%) + Clay: 3%
Sample - 2B
(Sand: 65%, Silt: 30%, Clay: 15%) + Clay: 5%
Sample - 2B
(Sand: 65%, Silt: 30%, Clay: 15%) + Clay: 5%
Fig. 99: Propotion of lime and pozzolana mixing
Fig. 100: Good mix of particle size
Fig. 101: Drop test results
• Lime + Pozzolana:
Pozzolanas: These are materials which contain silica or alumina. They are not cementitious themselves, but when mixed with lime or cement will then act like cement. Pozzolanas can be mixed with lime to help speed rection, and lower costs. Dosage with lime or cement between 1:1 and 3:1 (pozzolana : lime).
Lime: Lime when added to the mixure helps in bonding and also aids for reducing the overall thermal insulation of the composition. This increases the cooling effect of the overall surface making it breathable and apt for hot and humid biomes.
• Barley Straw:
Using barley straw as a stabilizer in rammed earth construction that leverages the natural properties of straw to enhance the performance of earth materials. Barley straw adds tensile strength to rammed earth walls, which are primarily compressive. The fibrous nature of straw helps to improve the overall structural integrity. Incorporating barley straw reduces the overall density of the rammed earth mix, making it lighter and potentially easier to work with.17
The inclusion of straw can enhance the thermal insulation properties of rammed earth, making buildings more energyefficient. Barley straw is an agricultural byproduct, making it a sustainable choice. The natural lignin and cellulose in barley straw can act as a binding agent when mixed with clay or other soil components, helping to hold the particles together during the compaction process. Straw can help regulate moisture levels within the wall, reducing the likelihood of cracking as the material dries.
Varying the proportions of barley straw in the mix can yield different results in terms of strength and durability.
17. Keable and Keable, Rammed Earth Structures, 35.
Fig. 102: Stabilizers
LIME + POZZOLANA
BARLEY STRAW
SUGARCANE BAGASSE
Typical proportions might range from 5% to 15% straw by volume.
The following compositions have been selected for further load testing, to derive the compressive strength of each of the compositions to determine the most suitable composition for the panels.
In conclusion to the preceding experimental investigations, it is essential to advance the most effective base proportion characterized by a high clay content, along with the individual stabilizer compositions - namely, barley straw and sugarcane bagasse - toward further load testing. These tests aim to ascertain the compressive strength of the selected formulations, which is a critical parameter in evaluating their structural performance.
The findings from these load tests will significantly contribute to optimizing the formulation of a self-spanning wall panel. Specifically, the objective is to determine the minimum feasible thickness of the panel while maintaining adequate structural integrity and performance under
load. This approach will facilitate the development of efficient and sustainable building solutions by maximizing the use of locally available materials and minimizing material consumption.
Through this rigorous testing and analysis, we aim to establish a comprehensive understanding of the mechanical properties of the selected compositions, ultimately informing the design parameters for future applications in rammed earth construction.
Sample2B
Sample - 2A
Lime+Pozzolana
Sample - 2A
Barley Straw
Sample - 2A
Sugarcane Bagasse
Fig. 106: Finalized samples for compression tests
Sample - 2A
Sand: 60%
Silt: 25%
Clay: 18%
Sample - 2A (Shrink Test)
Sand: 60%
Silt: 25%
Clay: 18%
Sample - 2B
Sand: 60%
Silt: 25%
Clay: 20%
Sample - 2A
Sand: 60%
Silt: 25%
Clay: 18%
Stabilizers
Lime + Pozzolana: 10%
Sample - 2A
Sand: 60%
Silt: 25%
Clay: 18%
Stabilizers
Barley Straw: 20%
Sample - 2A
Sand: 60%
Silt: 25%
Clay: 18%
Stabilizers
Sugarcane Bagasse: 20%
Selected sample post drop, cigar/roll and shrink test
Selected sample without stabilizers for load test
107: Process diagram of methadology of experiments
Selected samples with stabilizers for load test
Fig.
Compression test: Cubes (100x100x100mm)
Based on the compressive strength test report, various specimens, including those stabilized with barley straw and sugarcane bagasse, were analyzed under standard conditions. The tests followed the BS EN 12390-1:2021 guidelines, as indicated on the report. Several mixtures, including those incorporating lime, pozzolana, clay, and fibers like barley straw and sugarcane bagasse, were examined for compressive strength and density. The results demonstrate that both the barley straw and sugarcane bagasse mixtures achieved notably high compressive strengths in comparison to other materials tested.
In particular, the specimens incorporating 20% barley straw (Sample 2A - Barley Straw) exhibited a compressive strength of 2.2 kN/mm² and a dry density of 1980 kg/m³. Similarly, the 20% sugarcane bagasse
(Sample 2A - Sugarcane Bagasse) reached a compressive strength of 2.2 kN/mm² and a dry density of 1830 kg/m³. Both of these values were on par or exceeded many of the other materials tested in terms of performance.
The conclusion drawn from these tests suggests that both barley straw and sugarcane bagasse are viable stabilizers in eco-friendly construction materials. These natural additives significantly contribute to improving compressive strength while maintaining favorable density. Consequently, the next phase of experimentation will focus on the further refinement and testing of these two stabilizers, to assess their potential for thermal insulation.
Sample - 2B
- 2A
Lime + Pozzolana
- 2A
Barley Straw
- 2A
Sugarcane Bagasse
Fig. 108: Compression test results for selected samples
Fig. 109: Samples selected for compression tests
Fabrication: Rammed Earth Panels
Earth panel Wooden batten for groove
Shuttering mold
Fig. 110: Foammould for casting
Fig. 111: Shuttering assembly for Fig. 112: Sundried Earth panels
For the fabrication of the selected compositions that performed well in the compression tests, the panels were scaled down from the actual dimensions of 400x600x120mm to 133x200x40mm to facilitate easier fabrication. This
reduction in scale, approximately one-third of the original size, allowed for more manageable handling and precision. CNC routing was employed to create molds for casting the panels, ensuring high accuracy in dimensions and uniformity
LIME + POZZOLANA
BARLEY STRAW
SUGARCANE BAGASSE
across all fabricated units. Each panel was formed by ramming four layers, each with a height of 50mm, into the mold.
During the ramming of the final layer, a wooden batten was introduced to create a groove, designed to facilitate the sliding of the panel into position during the regional assembly process. The fabrication of each reduced-scale panel required around 20 minutes for construction, followed by a drying process. The panels were subjected to continuous sun drying over three days with regular curing, as this method helped retain the breathability of the material, which is essential for performance in humid environments. Furthermore, sun drying-as opposed to baking-helped reduce the overall carbon footprint, aligning with the sustainable principles of the project. This method ensured the panels could effectively regulate humidity while minimizing environmental impact.
The selected panels were cast and assembled as part of a regional assembly test to assess the system’s ease of construction and to refine the junctions between the panels. Small wooden battens were inserted horizontally between each panel, acting as shock absorbers to help confine and stabilize the overall wall system. These battens played a crucial role in absorbing slight movements and ensuring a secure fit between the panels.
Each panel was designed with grooves at the top, allowing them to slide smoothly along the horizontal battens during installation, facilitating efficient and straightforward assembly. The junctions between adjacent panels were sealed using rubber gaskets, which provided a dual function: creating
an airtight seal and accommodating the expansion and contraction of materials due to fluctuations in humidity. This integration of gaskets not only enhances the weatherproofing of the assembly but also improves the durability and longevity of the structure by allowing for natural material movement without compromising the integrity of the joints.
Window frame
Earth panel
Glulam column
Horizontal battens
Glulam beam
Fig. 113: Regional assembly for the wall panels
Fig. 114: Regional assembly physical model & details
Thermal insulation test: Panels (130x200x40mm) in 1:3 scale
The selected compositions from the compression test were further analyzed for their thermal insulation properties, with the experimental setup being conducted over a constant time interval of 5 minutes for each composition. The experiment, as illustrated in Fig. 48, compared two stabilizers: barley straw and sugarcane bagasse within the rammed earth panels.
In the case of barley straw, the temperature difference between the initial reading and the post-experiment reading at 5 minutes was recorded as 2°C. In contrast, for the sugarcane bagasse composition, the temperature difference over the same period was 3.5°C. This suggests that while both materials provide insulation, sugarcane bagasse exhibited slightly less insulating capability than barley straw over the measured interval.
Heat Conduction
Metal Plate
Mud Panel
Metal Plate
Pan with water
Heat
Fig. 115: Experiment setup for thermal insulation test
Given the modest 1.5°C difference in the final recorded temperatures, both compositions demonstrate viable thermal insulation properties. Therefore, they can be strategically employed in the construction of walls, depending on the intensity of heat exposure in different parts of the building. Barley straw might be preferable in areas where enhanced insulation is critical, while sugarcane bagasse could be used in regions of moderate heat exposure, optimizing material performance throughout the structure.
Both barley straw and sugarcane bagasse were selected for further development due to their effective thermal insulation properties, with barley straw showing slightly better performance.
Fig. 116: Sample result for barley straw
Fig. 117: Sample result for sugercane bagasse
Barley Straw
(initial temperature 25.3 °C)
Barley Straw (final temperature 27.3 °C)
Sugarcane Bagasse (initial temperature 28.7 °C)
Sugarcane Bagasse (final temperature 32.2 °C)
(s:si:c + b) = (60%:25%:18% + 20%)
Bagasse Panel (s:si:c + su) = (60%:25%:18% + 20%)
Barley Straw Panel
Sugarcane
Fig. 118: Selected samples for thermal insulation tests
Fig. 119: Final compositions of both stabilizers
Fig. 120: Regional assembly physical model
Bibliography
ArchDaily. “From Tradition to Innovation: How Modern Technologies Are Transforming the Potential of Wood.”
AxU Platform. “Numeric Network Analysis V2: Basic Concept Introduction and Interface Overview.” Medium. Accessed September 19, 2024. https://axuplatform.medium. com/numeric-network-analysis-v2-basic-febcf8f84f2.
Sharma, R. K. “Sustainable Building Using Agricultural Residues: Case Studies and Research in Punjab.” Journal of Environmental Research, 2018.
Steiner, Hadas A. Beyond Archigram: The Structure of Circulation. New York: Routledge, 2009.
Timber Development UK. “Glued Laminated Timber (Glulam).” n.d.
Rewal, Arun Kumar. “Continuity and Settlement Structure: A Study of Traditional and Colonial Spatial Patterns in Benares, India.” 1988.
Rewal, Arun Kumar.“Continuity and Settlement Structure.”
Singh, R. P., and P. S. Rana. “Varanasi: Sustainable Development Goals, Smart City Vision and Inclusive Heritage Development.” 2017.
Design Development
Site Selection
Sites of Rest Houses
The above figure represents the map of Zone II as the selected site for the Rest House & Death Home proposals (ref. Appendix I). The same zone was considered for the Market proposal.
The sub patches’ were divided to create a grid overlay. This is done by creating a mesh on these sub patches and utilising the centres of these mesh faces for enabling further sub divisions.
Sites of Death Homes
The above figure illustrates the sites or ‘sub patches’ that were achieved through a process of ranking (Appendix I) that were reconsidered at this stage for the Market proposal.
Existing Points of Origin
The existing points of origin used for experiements detailed in Appendix I, were projected onto the sub patches to re- consider for the next quantitative network analysis experiment for Market.
Fig. 121: Map of Zone II
Fig. 122: Grid Overlay
Fig. 123: Ranked Sites for Rest House & Death Home
Fig. 124: Points of Origin
Existing Data Points
Zone II, which was the site chosen for the Rest House and the Death Home intervention, was reconsidered at this stage to propose the street markets within the fabric. A series of experiments were conducted to shortlist the potential sites for the aforementioned proposals, which included quantitative network analysis, building height variance, density quantification, and environmental and visibility parameters. Refer to Appendix I to review the experiment in detail. At each level of analysis, the site was ranked and subdivided to create ‘patches,’ and then ‘subpatches,’ from which the site for the proposals was chosen through a final wind analysis.
For the current experiment of the Market, the sub-patches were reconsidered and overlaid with a mesh to form a grid. The centers of these mesh faces would enable further subdivisions. The points of ‘origin’ that were considered in the former experiment and created through datasets obtained from ArcGIS were integrated into this experiment by projecting them back onto the mesh edges of these sub-patches.
Fig. 125: Addition of Rest Houses to the existing urban fabric based on ranked sub patches
The diagram above illustrates the voxelized built masses of the Rest House interventions, generated through Machine Learning (refer to Appendix VI), and positioned on the ranked sub-patches. These act as added points of origin, thereby creating a feedback loop and altering the conditions of the existing network’s betweenness centrality.
Addition of Data Points
Based on the design achieved for a single Rest House intervention, a Machine Learning algorithm was utilised to generate solutions for the sub-patches of the site, derived from the ranking process (refer to Appendices I & VI). The Rest Houses were then integrated into the urban fabric, and it was observed that this altered the conditions of the city’s network betweenness centrality, thereby creating a feedback loop. These points were subsequently added to the set of ‘origin’ points, which were further used in the quantitative network analysis to identify sites for the market intervention.
The series of diagrams above illustrate the changes in the network’s betweenness centrality following the addition of the Rest House interventions into the fabric, based on the ranked sub-patches.
Fig. 126: Changing Betweeness Centrality
Added Points of Rest Houses through site ranking designed using Machine Learning
Existing Points of Origin
The diagram above illustrates the existing points of origin, along with the newly added Rest Houses, which are incorporated into the list of origin points to form the dataset for the subsequent network analysis experiment for the Market intervention
The points where the rest house interventions are positioned, based on the sub-patch site ranking, are added to the list of original points of origin. This cumulative list serves as the foundation for the subsequent quantitative network analysis experiments for the market intervention. The centers of the mesh faces overlaid on the sub-patches are assessed for proximity to these points of origin. Based on these distances, the sub-patches are further subdivided to facilitate ranking according to the network analysis.
Markets are both shaped by and influence the city’s betweenness and closeness centralities, with their presence further determined by reach and gravity indices. Since markets thrive on pedestrian traffic, they must be located in areas with higher betweenness centrality, which
The selected sub-patches are further subdivided based on the proximity of the mesh face centers to the points of ‘origin.’ These subdivided subpatches are then ranked according to the following network analysis experiments
directly measures the shortest paths to destinations. Similarly, closeness centrality indicates how near points of origin are to destinations, highlighting the preferred locations for markets. Reach analysis provides insights into the cumulative opportunities to access destinations, with higher values favoring market placement. In contrast, the gravity index measures the potential loss of opportunities, making it crucial to consider lower values when positioning markets.
Fig. 127: Existing + Added Points of Origin
Fig. 128: Sub division of sub patches
129: Betweeness Centrality Analysis
The diagram on the left shows the Betweenness Centrality analysis, while the one on the right color-grades the sites based on their betweenness centrality contribution, focusing on the higher selection range of 0.80 to 1.00
130: Reach Analysis
The diagram on the left shows the Reach analysis, while the one on the right color-grades the sites based on their value of reach, focusing on the higher selection range of 0.80 to 1.00
131: Closeness Centrality Analysis
The diagram on the left shows the Closeness Centrality analysis, while the one on the right color-grades the sites based on their closeness centrality contribution, focusing on the higher selection range of 0.80 to 1.00
132: Gravity Index
The diagram on the left shows the Gravity index, while the one on the right color-grades the sites based on their gravity indices, focusing on the lower selection range of 0.10 to 0.30 to mitigate distance decay.
Fig.
Fig.
Fig.
Fig.
The above diagram illustrates the sites from the network analysis, with values from the selected range overlapped to highlight the qualified sites for further selection
The above diagram illustrates the sites with the largest area, providing a broader search space for further experiments
The above diagram illustrates the selected site, which is in closer proximity to the proposed rest house interventions (refer Appendix I) as the case scenario for subsequent experiments
Following the quantitative network analysis experiments, the sites were ranked based on their values for betweenness and closeness centralities, reach, and gravity analysis. The results were overlapped to generate the selection. A higher value range of 0.80 to 1.00 was used to rank sub-patches based on their contribution to the network’s betweenness and closeness centralities, as well as their reach index. A lower value range of 0.10 to 0.30 was applied to the gravity index to mitigate the effects of distance decay. Sites falling within this range were then overlapped to create a ranked list. These sites were further categorised based on physical areas, with the patch closest to the rest house interventions selected for subsequent experiments to refine the search for market intervention sites. The Numerical Network Analysis plugin for Grasshopper within Rhino was used for this analysis.
Fig. 133: Overlapped: Qualified sub patches
Fig. 134: Selection based on area
Fig. 135: Selected site
Pedestrian Simulation
Within the selected land parcel, various scales of shops were categorised into small, medium, and large based on data collected through on-site mapping and Google Maps. The previously established degrees of attractiveness were translated into a topological map, employing pull forces of x, 2x, and 3x to represent low, medium, and high attractiveness, respectively. These values were subsequently remappedas radii of circles, delineating patterns for morning, afternoon, and evening periods.
The three maps were superimposed to identify areas with overlapping zones of attractiveness. A higher degree of attractiveness, indicating a greater likelihood of individuals visiting a shop, corresponded to increased footfall. Therefore, the streets exhibiting significant overlap were selected for further pedestrian simulations to evaluate potential congestion levels.
Pull Force
Fig. 136: Mapping of Various scales of shops
Fig. 137: Mapping Attractiveness
Varying topological relations remapped as radii of circles : larger raii, more the attractiveness
Fig. 138: Translating attractiveness for shops in the morning Fig. 139: Translating attractiveness for shops in the afternoon
Fig. 140: Translating attractiveness for shops in the evening Fig. 141: Overlapped attractiveness for morning, afternoon and evening
Socialbility Index
selected site as a case scenario
Fig. 142: Results of pedestrian simulation
A pedestrian simulation using H.I.V.E. algorithm was conducted along the identified street incorporating four types of agents - yound adult, single adult, parent with child and elderly.
Wait times, as previously discussed, were mapped, and agent types were assigned to each shop. Considering the congestion within the urban context, a social distancing measure of 0.3 metres was assumed for the experiment. Agents were simulated at intervals of 25 metres.
*Please refer to Appendix VII for detailed matrix.
The simulation demonstrated a gradient of sociability along the street identifying zones with high sociability. One such zone was selected as the site as a case scenario for the intervention. The site consisted of a 12m wide road with markets existing on both the sides.
Elasti
City
Fig. 143: List of sites identified for rest houses, markets and death homes
what is elasti | city?
Global scale
Global Scale : As opposed to the conventional redevelopment projects like the KVCP, the research emphasizes on a rigourous data evaluation process to carefully select an area for redevelopment based on multiple parameters like network analysis, environmental parameters and pedestrian simulations. Therefore, at the Global scale elati | city aims to decongest the urban fabric.
Regional Scale : Drawing on Bill Hillier ’s Space Syntax theory, which highlights how a single pause in a crowded linear space can trigger a ripple effect, leading to stagnation in pedestrian movement, the research integrates convex spaces to serve as essential pause points within market environments. In the specific context of Varanasi, smallscale shops, often lacking designated spaces, frequently establish themselves illegally in front of legal shops. This
Fig. 144: elasti | city at global scale
Regional scale
encroachment compromises the frontage of established shops, spills onto the road, and exacerbates crowding. The project seeks to incorporate these small-scale shops by creating a spatial framework that allocates dedicated spaces for their operations. Additionally, recognising the city’s lack of open spaces and the fragmented connectivity of its narrow road network, the project emphasises the creation of public spaces to act as breathable pockets. It also promotes shorter, more direct connections between the market and its surrounding context, fostering greater inclusion of local communities.
Fig. 145: elasti | city at regional scale
Regional scale
The cultural essence of the city is deeply rooted in activities such as festivals, religious gatherings, local music performances, and community cooking, which are predominantly conducted in open spaces. However, the dense urban fabric of the city lacks sufficient breathable spaces to accommodate these activities. Therefore, the provision of elevated open spaces, both at halt points such as rest houses and within market areas, has been prioritised.
This research focuses on developing a system that accounts for functional adaptability and potential expansion to meet the evolving needs of the community in the years to come.
Local Scale : At the local level, the research explores a kit-of-parts system designed to enable a dynamic, adaptable marketplace. This system incorporates various modulations, allowing spaces to reconfigure and adapt to
Fig. 146: elasti | city at regional scale
Kit-of-parts
changing needs over time.
Local scale
Expansion & Contraction
Through its multi-scalar approach, elasti|city is envisioned as a solution that addresses both tangible and intangible challenges, fostering inclusivity and adaptability across global, regional, and local scales.
Fig. 147: elasti | city at local scale
Rest House & Death Home Overview (M.Sc Phase)
The M.Sc phase focussed on the nodal halt points - Rest Houses and Death Homes. A multi-objective optimisation algorithm was used followed by a sequential simulation.
M.O.E.A Optimisation
Simulation I, emphasized on creating a functional adjacency aggregation. A search space was defined through site subdivision into a point grid.The experiment focussed on optimizing the morphology by minimising demolition, maximising self-shading of the form, optimising spatial adjacencies between functional zones like dormitories, reception, and courts, maximising courtyard spaces and Floor Area Ratio (FAR), addressing proximities of zones and maximising shade in open areas.
While rest houses focused on public interaction and larger courtyards, the death home emphasised privacy and daylighting, with entry and emergency courts placed near roads but apart for visual concealment.
The phenotype build process began by defining a search space (75% of the site area) through a point grid system. Controlled demolition created space for new construction, followed by adjustments to establish the net search space with appropriate set-backs for circulation and spatial hierarchy. The resulting grid was extended along the Z-axis to create buildable voxels, adhering to FAR regulations.
The area was split as 70% built-up and 30% open space. 20% and 10% of open areas were defined as courtyards in rest houses and death homes respectively. Verandahs were created for circulation offsetted outward across floors to foster visual or privacy goals in rest housesand inward for privacy in death homes.
Fig. 148: Functional adjacencies achieved for Rest house
Fig. 149: Parallel Coordinate Plot for Rest house M.O.E.A Optimisation
Various functional adjacencies were established as per a defined area program as illustrated alongside.
*For a detailed experiment description, please refer to Appendix II.
Sequential Simulation
The sequential simulation aimed to optimize human comfort by detecting and strategically assigning kit-of-parts (wall and roof panels) based on environmental factors like minimising radiation maximising daylight and maximising evaporative cooling.
Voxels were grouped into single, double, triple, and quadruple units, dictating structural composition and panel assignments. External faces of voxels were detected and assigned panels based on a defined rule set. The kit-ofparts consisted of Rammed Earth Door & Window Panels, Timber Sliding Folding Panels and Pivot Panels. A fabric roof was constructed with tensile fabric featuring a central cut-out for rainwater collection. Jali screens were added along the verandah for privacy and ventilation, and pergolas for shaded terrace spaces. The design prioritized environmental harmony, comfort, and functionality through iterative optimization. A weighed fitness objective selection criteria was used to choose the top ten phenotypes.
*For a detailed experiment description, please refer to Appendix III.
A finite element analysis was conducted on the above to choose the final phenotype. A post analysis involving daylight, radiation and sociability was performed on the chosen phenotype.
*For a detailed experiment description, please refer to Appendix IV.
Fig. 150: Kit-of-Parts of Rest house (panels)
Fig. 151: Sequential simulation Rest house phenotype
Rammed Earth Door and Window Panel
Timber Pivot and Sliding Panel
Kit-of-parts
Plug-In City, conceived by Peter Cook, was a direct critique of traditional, static urban planning and permanent architecture. It envisioned a megastructure, a massive framework into which modular units-dwellings, workspaces, and amenities-could be “plugged in” or removed as needed. This dynamic approach proposed a city that functions like a living organism, constantly evolving in response to the changing needs of its inhabitants. This vision represented a radical departure from conventional urban development, suggesting that architecture could be as adaptable and flexible as rearranging furniture in a room.
In parallel, the Kit of Parts concept extended this logic into the realm of architectural construction. The Kit of Parts treated buildings and urban environments as assemblies of prefabricated, standardized components, allowing for a wide range of configurations. A Catalogue of Components was introduced, detailing an array of prefabricated elements
such as structural frames, wall panels, service pods, and staircases, enabling end-users to actively participate in the design and functionality of their spaces. This participatory process emphasized flexibility and adaptability, empowering users to influence their living and working environments according to their specific needs.1
Building on these principles of modularity, flexibility, and functional adaptability, a kit-of-parts system was devised, creating a catalogue of multi-scalar cells and components. These modular elements were designed to be assembled as part of an overarching aggregation logic, enabling efficient construction and allowing for endless configurations of space, depending on functional requirements and environmental contexts. This approach not only promotes sustainability through the reusability of components but also supports user-centered design, where architectural form and function are continuously adaptable.
Fig. 152: Archigram - Plug-In City
Fig. 153: Kit-of-Parts
1. Steiner, Hadas A. Beyond Archigram: The Structure of Circulation. New York: Routledge, 2009.
Kit-of-parts: Cell Types
The kit-of-parts approach refers to designing a system of modular components that can be assembled in various configurations to create flexible, adaptable, and scalable structures. The method promotes efficiency in construction, allowing for customization and reconfiguration of spaces based on functional or environmental needs. The diagrams, showcase the three distinct cell typologies, each with a varied structural organization yet unified by a coherent modular system.
Each cell type, functions as an independent module or a “kit” that can be integrated with other components to form a larger architectural system. The design of the individual cells emphasizes adaptability, where structural and spatial components like walls, openings, and roofing elements can be reorganized or expanded depending on the required use case.
The sectional diagrams highlight how different spatial organizations are achieved within each modular unit. The vertical and horizontal relationships between the cells exhibit the flexibility of the system, demonstrating how volumes and spaces can adapt based on the configuration of structural elements. Openings and spatial voids are strategically placed to enhance light and airflow, contributing to varied spatial experiences despite the standardized components.
In conclusion, the kit-of-parts approach in this design ensures flexibility, sustainability, and adaptability. It allows for diverse spatial experiences through a modular assembly of components, making the design efficient in both construction and operation. By using repeatable modules, the design maintains a balance between standardization and individuality.
SINGLE CELL (A)
DOUBLE CELL (2A)
QUADRUPLE CELL (4A)
Fig. 154: Isometric views - cell types
Fig. 155: Plans & sections - cell types
Elasti
Kit-of-Parts: Single Cell (3600x3600x3600mm ht.)
Part A: Rammed earth panels
Earth panels:
400(l)x120(thk.) x600mm(ht.)
Part C: Rammed earth panels with openings
Earth panels:
400(l)x120(thk.) x600mm(ht.)
Part B: Sliding folding timber panels
Timber panels:
400(l)x60(thk.) x3600mm(ht.)
Part D: Pivotable timber panels
Timber panels:
400(l)x60(thk.) x3600mm(ht.)
The structure employs a modular design approach, utilizing glulam beams and columns complemented by a tensile fabric roof supported by steel tension rods, providing lightweight protection and flexibility. The incorporation of pre-cast rammed earth panels offers significant thermal mass, contributing to the building’s eco-friendliness and passive climate control. In addition, hollow timber slabs and facade panels with integrated windows create adaptable and well-ventilated spaces.
25mm dia. tension rods
600x400x120mm
120x12mm thk.
100x100mm thk.
Details - exploded isometric showing various elements
C1
C2 Structure
Tensile Fabric roof
MS flats (16x75mm) & rods
100 thk. hollow Timber slab
100 x 300mm Glulam beams
Hollow timber panels with windows glulam slats glulam columns thk. pre-cast rammed earth panels
(25mm dia) for tensile roof
Fig. 156: Kit-of-parts - single cell
Fig. 157:
Kit-of-Parts: Double Cell (3600x7200x3600mm ht.)
2-Part D: Pivotable timber panels
Timber panels:
400(l)x60(thk.) x3600mm(ht.)
Part C: Rammed earth panels with openings
Earth panels: 400(l)x120(thk.) x600mm(ht.)
Part A: Rammed earth panels
Earth panels: 400(l)x120(thk.) x600mm(ht.)
2-Part B: Sliding folding timber panels
Timber panels: 400(l)x60(thk.) x3600mm(ht.)
The overall design prioritizes sustainability through the use of locally sourced materials and a modular system, effectively minimizing the environmental footprint. Each cell consists of a combination of rammed earth and timber panels, which not only enhance structural integrity but also form part of a larger catalog of interchangeable components. This modular system allows for quick assembly, ensuring construction efficiently with flexibility in the placement and arrangement.
25mm dia. tension rods
600x400x50mm thk.
100x100mm thk.
120x12mm thk. timber louvred panels
600x400x120mm
thk. pre-cast rammed earth panels
Hollow timber panels with windows glulam slats glulam columns
C3
C4 Structure
Tensile Fabric roof
MS flats (16x75mm) & rods
100 thk. hollow Timber slab
100 x 300mm Glulam beams
(25mm dia) for tensile roof
Fig. 159: Details - exploded isometric showing various elements
The cells adhere to a consistent modular dimension, allowing them to be easily scaled or multiplied to fit a variety of spatial needs. This approach increases the design’s adaptability and offers the potential for customized spatial configurations, making the construction process both efficient & versatile. Moreover, the modular nature of the cells facilitates the reuse of materials, aligning with the concept of sustainibility by reducing material waste and supporting eco-friendly construction practices.
Fig. 161: Detailsexploded isometric showing various elements
Selected Phenotype : Rest House Plan
Comparitive Analysis
The final phenotypes for the Rest House and Death Home were analyzed with regard to their architectural qualities. Despite sharing a similar body plan, the two phenotypes exhibited distinct contrasts.
Overall aggregation
The overall voxel arrangement in the Rest House showed an east-west orientation with a rectangular aggregation. In case of the death home, the experiment resulted in a squarelike aggregation due to the adjacencies and to enhance privacy.
Building Plinth
The 0.6m building plinth of the Rest House was designed to create steps and pockets that serve as areas for social interaction and provide visual connectivity between the interior and exterior, particularly in public zones. For instance, public spaces such as the yoga room or multipurpose block maintain a visual dialogue with the outside context, fostering curiosity between spaces.
Conversely, the 0.9m high plinth of the Death Home and higher window sill heights (0.8 to 1.2m) was intentionally designed to ensure visual connectivity from the inside to the outside, while limiting visibility from the outside to the inside, thus ensuring privacy and sensitivity to the nature of the space. Multiple ramps were incorporated to ensure universal accessibility.
Central Court
The central court of the rest house (6 voxels) was observed to be larger than the death home (5 voxels). The Fig.
162: Final Selected Phenotype : Rest House
central courtyard, though a common element in both, was intended to accommodate markedly different activities. In the Rest House, the central courtyard was designed to support a range of lively activities, such as community cooking, classical music and dance performances, and social interactions. The verandah surrounding the court steps outward increasing visual connectivity and adds onto the activities of the central court. Smaller courts were designated for yoga, meditation, outdoor reading, and as buffer spaces for private breakouts. In contrast, the Death Home prioritized indoor resting spaces, with the central courtyard serving as a breakout area for sun soaking, death rituals, or religious activities. Buffer courts were provided as open spaces for family members accompanying those seeking salvation. The verandah steps inward maintaining privacy.
Terraces
The terraces in the Rest House are distributed throughout the volume, creating an engaging solid-void arrangement that is outward in orientation, fostering a dialogue with the surrounding context. Terraces such as the yoga court, library court, kund, and multi-purpose court, which are open to the public, enhance the public character of the Rest House, blurring the boundaries between the building and its context.
In contrast, the terraces of the Death Home are inwardfacing to ensure privacy, given the sensitive nature of the function. These terraces primarily serve as buffer courts for the inhabitants, reinforcing a sense of seclusion and introspection.
Fig. 163: Final Selected Phenotype : Death Home
Building Plinth Central Court Visual Connectivity
Fig. 164: Contrasting section showing Resthouse and its activities on the left and Death home on the right
Building Plinth
Central Court
Visual Connectivity
Key Plan : Death Home
The section of the Rest House illustrates the variety of open courts distributed throughout the volume. Different levels of privacy are accommodated, with activities ranging from children’s play areas, entrance courts, cultural events, and social interaction points, to yoga spaces and private buffer courts. The multi-functional block, designed as a quad-cell structure with large column-free spaces, offers flexibility for various indoor activities. During off-peak times, it can serve the local community by hosting functions such
as night schools, recreational classes for children, or cultural events. During peak times, when demand is high, it can be converted into dormitories. Enclosed by timber panels, the multi-functional block has the potential to seamlessly extend into the open terraces, creating a fluid gradient between open, semi-open, and enclosed spaces.
*Please refer to Appendix V for detailed architectural plans.
The multi-objective optimisation experiment was designed to address the spatial organisation and massing of shops across various scales. The primary objectives of the study included optimising the areas, enhancing visibility, and maximising shade within the site.
FO 01 focused on maximizing the available area for shop expansion. This attempted to ensure adaptability, allowing shops to scale up or down in response to fluctuations in population density during peak and off-peak periods.
Furthermore, the areas allocated for gulleys were optimized to create a meandering pathway, contributing to the experiential quality reminiscent of Varanasi’s streets. This configuration also enhanced the visibility of shops from multiple vantage points, a critical factor for market viability.
Visibility was assessed in both compact and fully expanded states to ensure optimal performance under varying spatial configurations.
Given the region’s hot and humid climate, FO 04 aimed to maximise shade in open spaces. The shading conditions were analyzed for both the compacted and expanded configurations. While the expanded state inherently provided self-shading, it was crucial to study the performance during the compacted state to ensure thermal comfort.
Fig. 166: Fitness Objectives for Market Morphology
FO 01 : Maximise Expandable Area
FO 03A : Maximise Visbility
FO 03B : Maximise Visbility
(expanded state)
(compacted state)
FO 02 : Maximise Walkable Gully
FO 04A : Maximise Shaded Open spaces
FO 04B : Maximise Shaded Open spaces
Phenotype Build
36x36m site identified along a 12m wide road
Displacing the segments by 2 to 4m to create concavity
1.8m wide pedestrian path
4m wide divisions
Subdivision of the footprint into a 2x2m grid
Placing 7 large scale shops each of 6x6m on ground and first floor level
Fig. 167: Phenotype build for Market Intervention
The site chosen as a case scenario spanned across a 12m wide road. 35x36m of an area was chosen along both the sides of the road for the experiment as per the results of the pedestrian simulation.
A 1.8m wide pedestrian path was offsetted along the main road. Catering to Bill Hillier ’s theory of linear and convex spaces, intervals of 4m were created and displaced inwards through a gene between 2 and 4m intervals. This introduced concave configurations aimed at enhancing visibility. These shoulder spaces along the road were also designed to function as pause points, essential elements in market environments. The same spatial strategy was extended to the rear side to activate the surrounding context, resulting in a footprint for further spatial planning.
This footprint was subdivided in a 2x2m grid reflecting the dimensions of the smallest shop unit. The existing data set on the site was mapped as :
Small shops : 12 nos.
Medium shops : 04 nos.
Large shops : 05 nos.
For future spatial planning, a 20% increase in market area was anticipated to accommodate potential growth. To meet area and visibility requirements, large shops, each with a compact dimension of 6x6 meters, were positioned first, with their locations determined using a genetic algorithm. Following a strategic placement rule, two of these shops were allocated on the ground floor, while the remaining were situated on the first floor.
Designing the gulleys taking inspiration from the streets of the city
Created by https://www.researchgate.net/figure/aranasi-Panchagangaand-nearby-ghats-Numbers-1-to-8-refer-to-important-shrines-and_ fig4_320099518
The identity of the city is deep-rooted in the narrow gulleys with a plethora of varied experiences ranging from street food, sweet shops, antique shop and silk shops among others. These vibrant streets converge towards the ghats, creating a dynamic cityscape across multiple levels.
To preserve this distinctive character, a shortest-path algorithm was employed to identify gulleys that would serve as circulation pathways. These pathways also act as connectors between the surrounding context and the main road, improving accessibility to the markets for both local residents and visitors alike.
Fig. 168: Phenotype Build of Market intervention (designing gulleys)
Fig. 169: Plan of the ghats of Varanasi
Cull Intersections + Add to List
Pick & Prevent Intersections
The placement of medium-scale shops was determined using a recursive loop logic. These shops were designed with dimensions of 4x4 m or 4x6 m, as observed during the site visit. To identify suitable locations, circles with a radius of 1.5 metres were drawn at each vertex of the grid, and those passing through the centroids of four adjacent grid cells were selected as potential clusters for 4x4 m shops.
To prevent spatial conflicts, each newly selected circle was checked for overlap with previously chosen circles. This process was iterated until six circles, corresponding to the required number of
medium-scale shops, were successfully placed.
Following the placement of six medium shops of 4x4 m, the grid was further evaluated for the availability of two additional cells per shop to accommodate the creation of 4x6-metre units where feasible.
Similarly, the small scale shops of 2x4 m and 2x2 m pop-up shops were located. The remaining grid spaces became the expandable cells either for the adjacent shops to expand or for a new pop-up shops.
Fig. 170: Placement of medium and small scale shops
Fig. 171: Recursive loop logic
Large shops (6x6 m)
Medium shops (4x4 m / 4x6 m)
Small shops (2x4 m / 2x2 m)
Expandable cells
Large shops (6x6 m)
Medium shops (4x4 m / 4x6 m)
Small shops (2x4 m / 2x2 m)
Catering to the dense urban fabric of Varanasi, resulting in a significant lack of open spaces and breathable pockets within its spatial configuration, the spatial organisation of the site was designed such that the terraces of the market structures function as elevated plazas. These terraces were envisioned as flexible spaces accommodating a variety of activities, including religious gatherings, cultural events, children’s play areas, and more.
Therefore, the non-market functions, being mostly residential were strategically positioned adjacent to the market areas as opposed to the existing first floor positioning, with the
ground floor allocated for parking and circulation. This approach addresses the critical shortage of organised parking in Varanasi, which often leads to illegal parking practices, and also enhances the porosity between the market and its surrounding context. A 3.5m pedestrian path was created between the market and non-market zones .
It is important to note that the non-market component has been limited to its zoning within the scope of this research. However, it holds potential for further development as a build-to-suit typology in the future.
Fig. 172: Expandable cells
Fig. 173: Phenotype with market and non-market components within context
Multi-Objective Evolutionary Algorithm
To achieve a design solution that aligns with the established fitness objectives, a multi-objective evolutionary experiment was conducted over 20 generations, each consisting of 10 individuals. The experiment utilised a crossover probability of 0.9, with both the crossover and mutation distribution indices set at 20. This experiment was carried out using the Wallacei plugin for Grasshopper.
In the phenotype build, key design elements, such as the area program, positioning through iterative loops, walking gullies, and expandable areas, were predefined and organised according to individual rule sets. The algorithm generated a search space by combining these rule sets to find solutions that meet the fitness objectives. The simulation ultimately produced 60 Pareto fronts.
Although the Pareto front solutions appear visually similar, each individual demonstrates distinct performance in terms of the fitness objectives. The finite nature of the site and fixed grid constraints drive the algorithm to prioritise the placement of large shops near the road, following a defined rule set. Subsequently, the walking gullies and medium to small-scale shops are organsed. Finally, the open areas and expansion cells are evaluated and comparable in terms of spatial qualities.
This experiment primarily focussed on spatial organisation and adjacencies within the finite site, which explains the visual similarities across the solutions. However, upon closer inspection, it became evident that each individual configuration had unique open spaces and frontage visibility. This experiment laid the groundwork for developing a detection program that identifies the faces selecting the necessary kit of parts for practical applicability, further enhancing the system’s adaptability.
Computational Observations
The algorithm uses the iterative loop procedure for placing medium-scale and small-scale shops, employing the Anemone plugin in Grasshopper. An important observation during this stage was the necessity of consolidating all elements that require this for-loop logic into a single cohesive structure. This step is crucial to prevent potential infinite loops within the Wallacei iteration process.
The above set of diagrams illustrates a few of the Pareto fronts from a total of 60 achieved through the Multi-Objective Evolutionary Algorithm experiment using Wallacei in Grasshopper. While the individuals appear visually similar due to the predefined parameters for areas and positioning, each of them exhibits distinct performance outcomes in terms of fitness objectives.
Fig. 174: Pareto Front Solutions of the Market
The adjacent diagrams show the standard deviation of the fitness objectives for the MOEA experiment, providing analysis of the performance of each generation.
For FO-01, performance improves over time, but with increasing variance. FO-02 initially improves, then declines, with an increase in variance, likely due to the opposing nature of the fitness objectives.
The next two sets of fitness objectives, FO-03A and FO-03B, measure the fitness of the Pareto fronts in their ‘contracted’ and ‘expanded’ states, respectively. In FO-03A, performance improves initially but then worsens, while in FO-03B, performance improves, and the variance in values reduces for both.
For FO-04A, the performance of the generations worsens, but for FO-04B, it improves. Both show high variance initially.
This analysis highlights the contrasting nature of the fitness objectives, ultimately informing a solution that aims to perform effectively under each objective.
Fig. 175: FO-01: Maximise Expandable Area
Fig. 176: FO-03A: Maximise Visibility at State 0
Fig. 177: FO-04A: Maximise Shading at State 0
Fig. 178: FO-03B: Maximise Visibility at State 1
Fig. 179: FO-04B: Maximise Shading at State 1
Fig. 180: FO-02: Maximise Walking Gully
Chosen Phenotype
The Parallel Coordinate Plot illustrates the performance of all generations across the fitness objectives, confirming the contrasting nature of the objectives.
The adjacent diagram shows the selected phenotype, which belongs to the 12th generation and is Individual 2. This selection is based on its ranking as the highest performer across all fitness values. This individual demonstrates strong performance in FO-03B and FO04A, which quantify visibility and shading, respectively.
Visually, this phenotype showcases a spatial organisation that distributes the shops in a way that creates opportunities for open spaces—an essential feature in the proposal for market spaces.
As observed during the site visit, the varying scales, wait times, and attractiveness of shops fluctuated across different times of the day and seasons. In response, the research aimed to develop a dynamic marketplace employing kinetic modulations within a kit-of-parts assembly. These modulations encompassed adjustments to individual architectural elements as well as entire panels, enabling the marketplace to adapt to evolving demands. This approach facilitates a transition from a static built form to a responsive, dynamic market environment.
Detection of Faces
A face-detection rule-set was developed for the systematic assignment of the kit-of-parts. Faces adjacent to the gulleys were designated as access panels, ensuring that shop entrances were aligned with the circulation paths. These included door and window configurations to facilitate entry and visibility.
Subsequently, the faces adjoining expandable cells were identified. Among these, collinear faces were prioritised and assigned as double-expansion faces, while the remaining faces were designated as single-expansion faces. Priority was given to double-expansion faces to maximise the potential for shop expansion, enabling adaptability to variations in population density during peak and off-peak periods.
This modulation of shop faces facilitated not only selfexpansion but also the creation of enclosures for smallscale pop-up shops, establishing a parent-child relationship between commodities and enhancing the flexibility of the market layout.
Faces adjacent to gulleys as ‘access faces’
Faces adjacent to expandable cells as ‘double expandable faces’
Fig. 182: Detection categories for assignment of kit-of-parts
Single faces adjacent to expandable cells as ‘single expandable faces’
Absence of a storefront
Sliding folding door opening the entire shop
Fig. 183: Observations during site-visit
Extended platforms for eating
Foldable chabutara seating
Associated temporary seating
Small scale shop with no physical infrastructure
Shops on wheels
Child function in front of existing shop
Elasti | City
Fig. 184: Ideation of various modulations
Assignment of Kit-of-Parts Access Faces
The access panels consisted of a catalogue of options for the owner of the shop to choose from various doors and window type panels ranging from panels for entry, display, storefronts among others. The need and design of these panels was a result of certain observations during the site visit.
Window Panel : A1
Window Panel A1 consisted of an openable chajja or projection with a depth of 0.6 metres, designed to provide protection against heat and rain. Positioned behind the chajja, a pivotable jali was incorporated to facilitate passive ventilation by allowing hot air to escape. Additionally, a 0.4-metre pivotable panel at a height of 1.05 metres was designed to function as a table surface, serving as a practical feature for fast food outlets, enabling quick dining or facilitating takeaway services.
A radiation analysis conducted verified the reduced solar radiation due to the chajja projection.
Fixed panels upto the sill height level were designed in rammed earth for passive cooling while the elements with modulations were made in glulam.
gully faces
1. Panels in closed state
3. Platforms pivot for display , seating Sliding folding panels for closed to open spaces
2. Chajja and jali pivot for sun shade and ventilation
4. Fully open state
Fig. 185: Window Panel : A1
Fig. 186: Solar Radiation Analysis on Window Panel : A1
Window Panel : A2
Window Panel A2 consisted of openable surfaces 0.5m deep at heights of 0.5 and 0.3m serving as platforms of display or artefacts and goods that could apply as a part to any scale of shop. A sliding folding window created a seamless access to the platforms for quick sale.
Window Panel : A3 & A4
Window panel A3 consisted of a 0.8m wide fixed window acting as a storefront with a 0.2m extruded frame, a typical detail across the city for shading. A seater was designed on the exterior acting as a pause point for the passing crowd.
Window Panel A4 featured 2m wide fixed window acting as a vision panel for shops that required large indoor displays.
Door Panel : A5
Access panel type A5 consisted of an 0.8m wide glass door with an extruded frame for access into the shops.
Door Panel : A6
Access panel type A6 featured a 1.2m wide sliding folding door for a seamless flow of built to open spaces.
Fig. 187: Window Panel : A3 & A4
Expandables
Type E1 : Plinth & Chajja
Style 01: Symmetric
Fig. 188: Toggle A: Hinged expandable system incorporating both roof and plinth
The above diagrams depict the expandable face system, comprising a hinged roof and plinth. This illustrates ‘Toggle A,’ the initial range of motion within the system. The roof opens by rotating along the top edge of the face, which serves as the axis of rotation. Symmetrically divided into two equal halves, the roof is constructed from a combination of Glulam panels and a fabric component, resulting in a lightweight and efficient shading device.
Fig. 189: Toggle B: Hinged expandable system featuring plinth expandability
The above diagrams illustrate the action of ‘Toggle B,’ the second range of motion within the system. This motion involves the outward rotation of symmetrically divided flaps, pivoting along the shared edge between the flap and the plinth.
The above diagram illustrates the fully open state of the expandable typology E1. The symmetrically divided roof leaves rotate along the top edge, serving as the axis, and are constructed with a fabric component. The plinth, featuring symmetrically divided flaps, opens outward to create an expanded base. This configuration enables shops to accommodate spillover functionalities.
The expandable face system is designed by dividing the detected face into two parts: one forming the roof and the other forming the plinth. Both elements rotate as hinged panels, with the top and bottom edges serving as their respective axes of rotation. These panels are further divided vertically into symmetric halves. The roof panels, composed of Glulam panels and a lightweight fabric element, rotate and expand during the first toggle action, referred to as Toggle A, with the top edge of the face acting as the axis of rotation. This provides efficient shading while maintaining structural lightness. Similarly, the plinth panels, also symmetrically divided, hinge and rotate outward along their shared edge during the second toggle action, referred to as Toggle B.Together, these two hinged actions enable the system to fully open, expanding both the roof and plinth to provide additional functionality for the shop. This allows for seasonal or daily adaptability, accommodating spillover activities as needed. When the extra space is not required, the system can remain closed, returning the unbuilt space back into the urban fabric.
Fig. 190: Type E1; Style 01
EQ.
EQ.
Style 02: Asymmetric
Fig. 191: Toggle A: Hinged expandable system incorporating both roof and plinth
The above diagrams depict the expandable face system, comprising a hinged roof and plinth. This illustrates ‘Toggle A,’ the initial range of motion within the system. The roof opens by rotating along the top edge of the face, which serves as the axis of rotation. Asymetrically divided into two equal halves, the roof is constructed from a combination of Glulam panels and a fabric component, resulting in a lightweight and efficient shading device. This asymmetric division results from the structural framework designed for a typical 4m x 6m shop, with the 4m expandable face placed along the 6m
Fig. 192: Toggle B: Hinged expandable system featuring plinth expandability
The above diagrams illustrate the action of ‘Toggle B,’ the second range of motion within the system. This motion involves the outward rotation of symmetrically divided flaps, pivoting along the shared edge between the flap and the plinth.
The above diagram illustrates the fully open state of the expandable typology E2. The asymmetrically divided roof leaves rotate along the top edge, serving as the axis, and are constructed with a fabric component. The plinth, featuring symmetrically divided flaps, opens outward to create an expanded base. This configuration enables shops to accommodate spillover functionalities.
The mechanism of the expandable face system is similar to the E1 Style 01, but with a key difference: the roof is asymmetrically divided. This asymmetry is a result of the structural framework designed for a typical 4m x 6m shop, where the 4m expandable face is placed along the 6m length of the shop. The roof rotates along the top edge of the face, which serves as the axis of rotation. Constructed from a combination of Glulam panels and a fabric component, the roof remains lightweight and efficient in providing shading. This action corresponds to ‘Toggle A,’ the initial range of motion within the system. Following this, the action of ‘Toggle B’ represents the second range of motion within the system. Here, symmetrically divided flaps rotate outward, pivoting along the shared edge between the flap and the plinth. Together, these two hinged actions allow the system to fully open, expanding both the roof and plinth to provide additional functionality for the shop. This adaptability supports seasonal or daily changes, facilitating spillover activities as needed. When extra space is not required, the system can remain closed, therefore returning the unbuilt space to the urban fabric.
Fig. 193: Type E1; Style 02
The above diagrams illustrate a medium-scale shop with dimensions of 4m x 6m, featuring expandable faces on two sides to leverage its corner condition and maximize functionality. To achieve this, the E1 typology has been deployed on both the 4m and 6m length sides. The key distinction lies in the symmetry of the panels, which is dictated by the column framework. While the panels on the 4m side are vertically symmetric, those on the 6m side are asymmetric due to structural requirements. A detailed structural framework design is presented later in this paper to provide further clarity and support for these variations.
Fig. 194: Combination of both Style 01 & Style 02 of Expandable Typology E1: Plinth & Chajja
195: Expandable Type E1 : Style 01 & 02
The above diagram illustrates the corner condition of this 4m x 6m medium-scale shop, designed with expandable features. This configuration enables complete spatial enhancement by freeing up adjacent walls and providing maximum visibility for the shop. Additionally, it facilitates a larger, unobstructed spillover area, making it highly suitable for businesses such as restaurants and eateries, which can extend their dining furniture into the expanded space. Similarly, shops selling clothing, stationery, or other goods can use these extended areas for display purposes, with the flexibility to retract the panels and reclaim the space with ease when needed.
Fig.
Cell Typologies: Type E (6m
Fig. 196: Exploded isometric showing the architectural quality
Fig. 197: Exploded isometric showing the spatial quality
x 6m)
L2 - Large Scale (Antique Shop)
LEGEND:
[19'-8"]
[19'-8"]
Fig. 198: Type E: Layout plans and elevations E1
E1
Cell Typologies: Type D
Fig. 199: Exploded isometric showing the architectural quality
Fig. 200: Exploded isometric showing the spatial quality
(4m x 6m)
E1
E6
M1 - Medium Scale (Restaurant)
LEGEND:
[13'-2"]
[19'-8"]
Fig. 201: Type D: Layout plans and elevations E6
Type E2 : Pivot & Slide
Style 1: Staggered & Centre Division
The above diagram illustrates the sequence of motions involved in the panel mechanism, which undergoes three distinct actions: slide, pivot, and slide again. The first panel pivots in place before sliding outward to its endpoint. The second, third, and fourth panels initially slide and then pivot at the center of the shop face. After pivoting, each panel slides out individually, except for the final panel, which pivots in place like the first one without sliding further. This mechanism efficiently creates a spatial barrier that can be adjusted as needed, enabling flexible and adaptable functionalities on either side of the system, whether uniform or distinct.
Fig. 202: Sliding and Folding Panels of the Face
The above diagram illustrates the expandable Type E2 with Style 01. In this configuration, the panels divide the expandable space into two halves, offering the shop the flexibility to support either two similar or distinct functionalities on either side. Additionally, this setup allows the shop to allocate one half of the expanded space to a pop-up ‘child’ shop, which can complement and enhance the business operations of the ‘parent’ shop. This adaptability makes it highly suited for dynamic retail or commercial environments.
The Type E2 Style 01 system consists of vertical panels, and for this case, the face is divided into eight panels, each approximately 500mm in width (4.00m divided by 8). The number of divisions is a flexible parameter and can be changed as per design. These panels can accommodate a variety of infills, such as jaali, fabric, or glass being a kit-of-part. The sequence of motions involved in the panel mechanism undergoes three distinct actions: slide, pivot, and slide again. The first panel pivots in place before sliding outward to its endpoint. The second, third, and fourth panels initially slide and then pivot at the center of the face. After pivoting, each panel slides out individually, except for the final panel, which pivots in place like the first one without sliding further. This mechanism efficiently creates a spatial barrier that can be adjusted as needed. This mechanism can be manual or even automated using actuators and motorised assemblies. In this configuration, the panels divide the expandable space into two halves, offering the shop the flexibility to support either two similar or distinct functionalities on either side. Additionally, this setup allows the shop to allocate one half of the expanded space to a pop-up ‘child’ shop, which can complement and enhance the business operations of the ‘parent’ shop. This adaptability makes it highly suited for dynamic retail or commercial environments. A simple case example could be of the parent shop being fashion retail while the child shop spaces being given out to tailoring or allied activities. Similarly the parent could be a restaurant while the child could be private dining or a space for a paan shop.
Fig. 203: Type E2; Style 01
Type E2 : Pivot & Slide
Style 2: Space Encapsulation
The above diagram illustrates the sequence of motions involved in the panel mechanism, which undergoes three distinct actions: slide, pivot, and slide again. The last panel pivots in place before sliding outward to its endpoint. The third, second, and first panels initially slide and then pivot at the end of the shop face. After pivoting, each panel slides out individually, except for the final panel, which pivots in place like the first one without sliding further. This mechanism creates an open space that is visually concealed only from the sides. Additionally, it introduces an added layer of motion, where the last two panels pivot and slide again to move toward the opposite edge of the expandable face. This action encapsulates the space, thereby creating a semi-private area for the shop, enhancing its spatial area.
Fig. 204: Space Encapsulation
Fig. 205: Sliding and Folding Panels of the Face
The above diagram illustrates the expandable Type E2 with Style 02. This system allows for two distinct configurations. In the first configuration, the expanded space serves as an extension of the parent shop, visually concealed on the two shorter sides by the panels positioned during the initial stage of the mechanism. In the second configuration, an additional layer of motion is introduced, where the last two panels pivot and slide once more to create a spatial encapsulation. This results in a semiprivate area that exclusively belongs to the parent shop, creating spatial extension.
The entire system is similar to Type E2 Style 01, with the key distinction being that the last panels pivot and slide out first. Additionally, a secondary layer of motion is introduced, where the last two panels pivot and slide once again to create a semi-private space. In both configurations, the expanded state exclusively serves the parent shop’s functionalities, offering varied visibility options. For a complete line of sight, the shop can maintain the first configuration, which is ideal for shops with displays. Conversely, the second configuration, creating a semi-private space, is better suited for cafes and eateries seeking to offer a more intimate setting.
Fig. 206: Type E2; Style 02
Spatial Extension
Semi Private Enclosure
Cell Typologies: Type A
Fig. 207: Exploded isometric showing the architectural quality
Fig. 208: Exploded isometric showing the spatial quality
(4m x 4m & 4m x 6m)
E6
E2
Elasti
City
Fig. 209: Type A: Layout plans and elevations
E3 : Hinged Pivot Panel
Panel Type E5 utilised a hinged pivot mechanism applied to two collinear expansion faces. Panels 2.8 m high, each of 2m wide, were pivoted along a vertical axis, enabling various spatial configurations as illustrated alongside. This design facilitated the expansion of the parent shop or the creation of opportunities for smaller, ancillary functions, fostering a parent-child relationship between the primary and secondary commodities.
A sliding track integrated at the top of the panel supported a reconfigurable fabric roof, providing shade as needed. Additionally, the solid panels were subdivided into sections that could pivot outward to form platforms at varying heights, serving as table surfaces, display stands, or seating areas.
For instance, this panel design allowed a small-scale shop, such as an apparel store, to create a semi-open spillover area for displaying mannequins, clothes hangers, and similar items during periods of high demand. Alternatively, by adjusting the angle of the panel, it could support a plug-in ancillary function, such as a tailor operating during specific hours to meet the requirements of the parent store.
4.
folded back-to-back for two way usability and through and through opening
1. Bifold panel pivoted out to create enclosure
Bifold panel
Fig. 210: E3 : Hinged Pivot Panel and its spatial
2. Platforms at 1.05 and 0.5m for quick eating and seating seat/ display of goods
5. Platforms used both inside and outside
3. Bifold panel folded onto itself for a two-directional usability
Cell Typologies:
B
Fig. 211: Exploded isometric showing the architectural quality
Fig. 212: Exploded isometric showing the spatial quality
Type
(4m x 6m)
E2
E3
Elasti
City
S1 - Small Scale (Clothing Shop)
LEGEND:
S2 - Small Scale (Momo Shop) S3 - Small Scale (Public Toilets)
Fig. 213: Type B: Layout plans and elevations
2. Platforms pivoting outward for child functions or spillover of existing shops
Panels pivoting to create enclosures with sub-platforms Modulation resulting in various spatial configurations
E4 : Pivot + Plinth Panel
Fig. 214: E4 : Pivot + Plinth Panel and its spatial
1. Chajja opening outward for shade and ventilation
3.
resulting in various spatial configurations
resulting in various spatial configurations
Panel Type E4 was designed as a 2.8x2m panel pivoting along a vertical axis to create a semi-open extension for a shop. As previous, this panel featured subdivided platforms at varying heights, adaptable for purposes such as display, dining, or seating, which could be utilised even when the panel was in a closed position.
An adjacent panel incorporated a bifold chajja, extending 1m and pivoting upwards to provide a shaded area, and a 1.6-metre plinth that pivoted downward. This configuration created space to support small-scale sales for the primary shop or accommodate ancillary child functions. When both double-expansion cells are deployed in their expanded states, they collectively form a dynamic outdoor enclosure, offering a flexible space suitable for a variety of activities.
For instance, shops exemplifying apparel stores, demonstrate the creation of an associated open space utilised for displaying smaller items such as scarves, shawls, or discounted products. The expanded plinth functions as a platform for selling accessories alongside the primary apparel offerings. While this represents one specific scenario, the same configuration can seamlessly adapt to alternative uses. For example, in the case of a restaurant, the expandable enclosures could serve as waiting areas. Similarly, they could accommodate paan shops (betel leaf vendors), which are iconic to the city, or even ice cream stalls.
Thus, these modulations effectively take into account the possibility of change of shop functionalities across years, enhancing the flexibility and usability of the marketplace .
Modulation
Modulation
Cell Typologies:
C
Fig. 215: Exploded isometric showing the architectural quality
Fig. 216: Exploded isometric showing the spatial quality
Type
(4m x 6m)
E6
E4
E5
Elasti | City
M2 - Medium Scale (Clothing Shop)
LEGEND: M3 - Medium Scale (Clothing Shop)
[39'-5"]
[19'-8"]
[19'-8"]
[13'-2"]
Fig. 217: Type C: Layout plans and elevations
Single expansion faces
E5 : Pivot Panel
Panel Type E4 was designed as a 2.8x2m single expansion panel pivoting along a vertical axis to create a semi-open extension for a shop.
E6 : Chajja extension
Panel Type E6 featured a 1.8-metre-high rammed earth wall combined with a 1-metre bifold chajja. Unlike other modulations, this panel was not intended for the self-expansion of the parent shop but was specifically designed to provide shade for ancillary child functions or temporary pop-up shops.
In its closed state, when one of the bifold sections is opened, it functions as a ventilation outlet for the parent shop, thereby enhancing airflow.
Fig. 218: Window Panel : A3 & A4
Fig. 219: Door Panel : A5 & A6
Fig. 220: Expansion state 01 Activity increases with increase in expansion
Fig. 221: Expansion state 02
Fig. 222: Expansion state 03
Pop-Ups
Inclusivity through Design
The above photographs, taken by the author, emphasise the pressing need for the urban fabric to incorporate spaces that accommodate the dynamic nature of pop-up shops. These shops thrive on 360° visibility, which is crucial for their functionality. The absence of such considerations often results in congestion and disorganisation within the urban environment, highlighting the importance of designing adaptable and efficient spatial solutions.
There is an understanding that market spaces must be designed to accommodate shops of all sizes, including the smallest, such as hawkers and vendors who operate on foot or wheels. These elements are particularly prevalent in areas with high pedestrian traffic, as these locations best suit their business needs. They require 360° visibility, along with shade, to function effectively. The absence of consideration for these elements in conventional planning often results in these vendors setting up wherever they can, contributing to congestion and disorganisation within the urban fabric. In this proposal, the expandable faces, alongside peripheral green spaces or walkable alleys that provide access, have been specifically allocated for pop-up shops.
Fig. 223: Pop Ups along sidewalks
Fig. 224: Pop Ups on wheels
The south-west corner of the current intervention features expandable cells surrounded by open spaces or walkable gulleys on all sides, providing easy pedestrian access from the street. To maximise the potential of these open spaces, pop-up areas have been introduced to create shaded zones designated for hawkers and vendors, who can occupy them as needed. This approach fosters inclusivity by accommodating small-scale shops and offering them good visibility from the streets. The spatial organisation of the area echoes the souk-like qualities, making the market more pedestrian-friendly and visually engaging. Furthermore, points of expandability adjacent to blank walls have been enhanced with shaded extensions, which are discussed in detail later.
Fig. 225: Toggle A: Hinged and pivoted panels rotating 90° and 180° to create the primary space for pop ups
Fig. 226: Placement of pop ups within the current design proposal
Fig. 227: Toggle B: Sliding and folding sides to create privacy or more spatial distribution for additional pop ups
View
(from the opposite side) View
Type 1 : Quad Cell
Fig. 228: Toggle A: Hinged and pivoted panels rotating 90° to create the primary space for pop ups
Fig. 229: Toggle B: The sliding panels extend to create more space for additional pop-up stalls. The above diagram illustrates the pop-up system, which operates with two distinct mechanisms. In Toggle state A, the hinged panels rotate to create a 90° opening, forming a shaded space of 2m x 2m for the first pop-up shop. In Toggle state B, the sliding folding panels open outward on the other sides, expanding the area to accommodate two additional pop-up spaces of 2m x 2m each. When contracted, the panels function as a jaali, enhancing the landscape of the open space and adding aesthetic value. The total area covered by this structure is 4m x 4m, i.e. 4 grid cells of 2m x 2m each.
View 01
View 02
The above diagram illustrates the open state of the quad-cell popup, which provides space for three different hawkers or vendors to occupy. These spaces are shaded and easily accessible, offering a flexible solution for small-scale businesses. When contracted, the panels function as a jaali, enhancing the aesthetics of the surrounding landscape environment.
It is crucial to design dedicated spaces where hawkers or vendors on foot can operate according to their hours of activity. The Quad Cell Pop Up system facilitates this by providing space for three distinct functionalities. Comprising four 2m x 2m cells, the pop-up covers a total ground area of 4m x 4m, with each of the three spaces measuring 2m x 2m. The system operates in two toggle states: in state A, the hinged panels pivot to create a 90° opening, while in state B, the sliding folding panels extend to form the remaining two spaces, thereby fully expanding the area. The hinged panels are crafted from perforated Glulam, forming a jaali structure. This design allows for a dynamic interplay of visual access and, when contracted, enhances the surrounding environment aesthetically. This system is ideally suited for food and beverage hawkers, such as those selling fast food or ice cream, small-scale vendors like newspaper and balloon sellers, as well as fruit, vegetable, and flower vendors, particularly during peak seasonal periods.
Fig. 230: Quad Cell Pop Up
Change of hawker: Turn by usage - as per time
Elasti
City
Type 2 : Double Cell
Fig. 231: Toggle A: Hinged and pivoted panels rotating 180° to create the primary space for pop ups
The above diagram illustrates hinged panels that rotate 180° to create a shaded space for pop-ups. This system occupies two 2m x 2m grid cells, covering a total area of 4m x 2m. When contracted, the jaali panels enhance the aesthetic value of the environment.
Fig. 232: Toggle B: The sliding and folding panels create either privacy or additional space for more pop-up stalls.
The above diagram illustrates the secondary layer of the mechanism, which features sliding folding panels that extend outward. These panels help visually conceal the space from two sides, creating a semi-private area. Alternatively, they allow two similar pop-ups to occupy the space together as a shared area.
The site selection process for the rest house and death home intervention employs the illustrated analytical methods to filter sections of the site, ultimately narrowing down the search and identifying the final location for design interventions.
The Double Cell Pop-Up system occupies two grid cells of 2m x 2m each, covering a total area of 4m x 2m. It features two hinged panels that pivot and rotate to create a 180° opening, providing shade at Toggle A. When contracted, the jaali panels contribute to the environment’s aesthetic appeal. At Toggle B, a secondary mechanism allows the sliding folding panels to extend, visually concealing the space from two sides and creating a semi-private area. Alternatively, this system enables two similar pop-ups to share the space. The setup offers two 2m x 2m spaces for vendors, making it ideal for single vendors needing longer display areas, such as book or fabric sellers. In some cases, two similar functions, like fruit vendors or eatery hawkers with shared seating, can occupy the space together.
Fig. 234: Double Cell Pop Up
Single Vendor Shared Space
Type 3 : Shaded Extensions
The above diagram illustrates the opening mechanism of the shaded extensions. These extensions consist of two columns with a criss-cross framework, featuring two main beams along one axis and multiple cross members perpendicular to these beams. As the system opens, these members stretch the fabric, which serves as the main shading element. The system is constructed from glulam and fabric, ensuring it remains lightweight and efficient.
The design proposal includes blank rammed earth walls where pop-up shops can be added. To define and provide shade for these shops, the Shaded Extension system is introduced. This system fits within 2m x 2m grid cells and consists of two columns with a criss-cross framework, featuring two main beams along one axis and multiple cross members perpendicular to these beams. As the system opens, these members stretch the fabric, which acts as the primary shading element. Made from glulam and fabric, the system remains lightweight and efficient. It is particularly functional for hawkers operating on foot, selling easily packed commodities such as newspapers, peanuts, or small-scale religious souvenirs.
Fig. 235: Shaded Extensions
Fig. 236: Placement of the shaded extensions within the current design proposal
Elasti
City
Structure Framework (Local Scale)
FE Analysis: 6m x 6m Cell
Following the selection of the Pareto front for the market typology, Finite Element Analysis (FEA) was conducted on the largest cell typology (6m x 6m) for a two-storey structure to determine the appropriate cross-sectional dimensions for all typologies. The structural system consisted of glulam members, highlighted in red, as the primary load-bearing elements, while steel rods, indicated in blue, served as tensioning or prestressing components.
The system was designed based on the principle of inducing compression through tension by prestressing of each column and also the entire cell. Each column comprised two glulam members measuring 7.5 cm x 7.5 cm and a 2 cm diameter steel rod for tensioning. Additionally, the overall cell was prestressed at four points using 2 cm diameter steel rods with couplers to resist lateral forces and moments, ensuring stability against external loads.
Fig. 237: Base framework of the cell typology
Fig. 238: FEA - Framwork without prestressing elements
Fig. 239: FEA - Framework with prestressing elments
Structural framework: Cell typologies
The peripheral beams (7.5 cm x 25 cm), primary beams (7.5 cm x 20 cm), and secondary beams (7.5 cm x 10 cm) were designed using glulam. The column brackets, measuring 7.5 cm x 7.5 cm, were also constructed from glulam. In the Finite Element Analysis (FEA), the supports were modeled as columns in conjunction with steel rods, indicated in blue, serving as tensioning elements.
The structural system was subjected to a total load of 18 kN, which accounted for the live load, dead load, and gravity load. The slab was modeled as a 15 cm thick CrossLaminated Timber (CLT) panel, contributing to the overall rigidity and load distribution of the system.
Two Finite Element Analyses (FEA) were conducted at
the cell level, maintaining consistent member dimensions, support conditions, and load values.
The first analysis considered the structural framework without prestressing or tensioning elements (i.e., without steel rods), resulting in a recorded displacement of 17 cm.
Subsequently, an analysis incorporating the prestressing or tensioning elements was performed, yielding a significantly reduced displacement of 0.44 cm. This substantial reduction in displacement highlights the effectiveness of prestressing in enhancing structural stability. Additionally, the inclusion of tensioning elements enabled the use of smaller crosssectional member sizes, thereby optimizing material consumption and simplifying the assembly process.
Fig. 240: Base Framework - 4m x 4m Cell
Fig. 241: Base Framework - 4m x 6m Cell
Following the Finite Element Analysis (FEA) conducted on the largest cell size, considering a two-storey height, the prestressing system and the determined member dimensions were adopted and applied uniformly across all cell typologies. This approach ensured that the structural system maintained consistency in performance regardless of variations in cell geometry. By standardizing the prestressing mechanism and member sizes, the design achieved greater efficiency in material usage, streamlined the fabrication and assembly processes, and maintained the structural integrity required to withstand both vertical and lateral loads across different configurations.
Fig. 242: Base Framework - 4m x 6m Cell
Fig. 243: Base Framework - 6m x 6m Cell
Structural framework: Specification and sequence
The diagram presents an exploded isometric view of the 6m x 6m cell typology, providing a detailed representation of each structural element along with their corresponding specifications. This visualization highlights the modular nature of the system, demonstrating how the same components and assembly approach can be uniformly applied across all cell variations, ensuring scalability and design consistency.
Furthermore, the diagram illustrates the construction sequence, outlining the step-by-step process from the placement of primary structural elements, such as glulam beams and columns, to the integration of secondary components like tensioning rods and cross-laminated timber (CLT) panels. By clearly conveying the order of assembly, the diagram serves as a valuable guide for ensuring efficient and accurate construction, reducing potential errors, and enhancing overall workflow.
150mm thk.
CLT slab
75mm x 250mm Glulam
Beam
75mm x 200mm Glulam
Beam
75mm x 100mm Glulam
Beam
75mm x 75mm Glulam
Bracket
75mm x 75mm Glulam
Column
20mm dia steel rod as tensioners
150mm thk.
CLT slab
75mm x 250mm Glulam
Beam
75mm x 200mm Glulam
Beam
75mm x 100mm Glulam
Beam
75mm x 75mm Glulam
Bracket
75mm x 75mm Glulam
Column
20mm dia. steel rod as tensioners
6m x 6m Typology for two floors
Fig. 244: Exploded Isometric: structural framework and sequence
FE Analysis: Market Agreggation
The selected Pareto front from the simulation was applied with consistent member cross-sections, support conditions, and load parameters across the structural aggregation. A Finite Element Analysis (FEA) was performed on the entire aggregated system, resulting in an overall displacement of 3.99 cm.
This outcome demonstrates the structural strategy of using multiple individually unstable elements, which, when interconnected through prestressing and precise assembly, form a cohesive and rigid system. The design leverages the interaction between these elements to distribute forces efficiently, ensuring stability not only at the individual module level (local scale) but also across the larger aggregated structure (regional and global scales). By adhering to this principle, the system achieves structural resilience, minimizes material consumption, and enhances adaptability across different spatial configurations.
Fig. 245: FEA: Top view of market aggregation
Fig. 246: FEA: Isometric view of market aggregation
The stepped court and levels, inspired by the kunds and ghats of Varanasi create public open spaces of various scales housing a plethora of activities enhancing the streetscape of the city.
Elasti
City
Post Analysis
Daylight
Autonomy
The lux levels at various points along the renowned Kachauri Gali were measured during the site visit, revealing significant variations that resulted in abrupt glares and discomfort for pedestrians. To address this issue, a daylight autonomy analysis was conducted for the proposed intervention using Honeybee Radiance, with an input daylight autonomy threshold of 10-50 lux, appropriate for street environments.
The analysis demonstrated a notable consistency in the light gradient across the intervention, validating the experiment.
Fig. 247: Lux levels measured at Kachauri gali during site visit
Sociability Analysis
Large shops (6x6 m)
Medium shops (4x4 m / 4x6 m)
Small shops (2x4 m / 2x2 m)
Index
A sociability analysis was conducted using H.I.V.E using the agents yound adult, single adult, parent with child and elderly as agents.
The results exhibited increased sociability in the circulation and expansion faces with the spatial organisation of shops.
Sociability
Fig. 248: Sociability Analysis using H.I.V.E
Fig. 249: Data used for experiment
Kit-of-Parts : Catalogue
Discussion
The urban density of Varanasi, often seen as a barrier to growth, offers an opportunity to create multi-layered adjacencies within both the existing fabric and proposed interventions. This spatial gradation from public to private fosters functional flexibility, enabling spaces to adapt to the transient population. This dissertation adopts a holistic approach to address the infrastructural needs of Varanasi’s floating population, integrating urban-scale site selection with local-scale interventions, which are inherently interconnected.
The research examines the pilgrim and tourist journey in Varanasi, focusing on rest houses and death homes as halt points, and markets as experiential spaces. Rest houses provide communal resting spots, while death homes cater to the unique spiritual context of Varanasi. The interventions aim to blur boundaries between locals and visitors, introducing gradients of built and open spaces to promote porosity, adaptability, and sensitive redevelopment. A modular kit-of-parts system ensures flexibility, supporting evolving functional and spatial needs.
Data Mapping
The site selection strategy narrows down potential intervention zones by mapping user journeys through the city A quantitative network analysis identifies spatial availabilities, further evaluated for building density, height variations, and environmental and visual parameters. A ranking system informed the final site selection This multilayered analysis reveals untapped potential within the existing urban fabric, often overlooked by conventional site
selection methods, such as large-scale demolitions seen in the KVCP example. The process assigns a performance score to each land parcel, enabling informed decisionmaking.
Computational Tools
The morphological experiment addresses placement, massing, and spatial organisation in two stages. Stage I examines overall building form and placement, while Stage II focuses on cataloguing and assigning building elements based on environmental parameters. Multi-objective optimisation, driven by contrasting fitness objectives, generates optimal solutions. Pareto front fitness values are subsequently utilised for machine learning predictions, allowing iterative updates to the urban fabric. The approach establishes a feedback loop between urban and building scales, ensuring interventions are contextually responsive.
This computational framework adheres to local building regulations and facilitates the pro-rata division of buildable areas. In the markets typology, a user-defined kit-of-parts enables adaptable designs, with modifiable panels and modular cells tailored to evolving needs. The system’s flexibility accommodates rapid functional changes without demolition.Finite element analysis ensures structural stability, optimising dimensions for efficient material use.
It is important to acknowledge a limitation of the experiment. During the M.Sc phase while adjacencies are successfully created through proportional allocations, the algorithm lacked the ability to assign spatial functions
simultaneously. This limitation was mitigated during the M.Arch phase through an iterative anemone loop enabling simultaneous placement of medium and smallscale shops. However, a nested loop for programmatic distribution would have improved voxel utilisation and mass compaction.
The multi-objective evolutionary algorithm was conducted for 20 generations with 10 individuals for the market typology The team reflected that due to a defined grid system with a strict adjacency rule set, the phenotypes were observed to show similarities in terms of massing due to the small search space. Therefore, the balance between generation size and individuals remains crucial with a scope of further investigation for optimized breeding.
Evaporative cooling principles were integrated into the design of halt points to suit Varanasi’s humid climate. It was realized that the assignment of rammed earth and timber panels cannot be based solely on the shaded faces; additional micro-climate studies would need to be incorporated. Therefore, the strategy of rammed earth walls was revised for the markets typology (M.Arch phase). To achieve an overall evaporative cooling, common walls were assigned rammed earth along with the bottom 0.6m band of panels that were fixed to add a horizontality in terms of façade design. The modulating panels having a requirement of being lightweight was assigned glulam.
The finite element analysis of the halt points aimed at an unconventional system of column, beams and tension rods reducing the number of columns in the overall aggregation. However, the overall number of parts in the kit of structure
were high in number. The market typology further developed on the structural optimization by adding prestressed members at the centres of peripheral beams to resist lateral forces and moments. This strategy helped reduce the number of parts, material usage and reduce the deflection drastically.
Material Experiments
Local resources, including loam and timber, were explored to develop a deployable kit-of-parts system. Compression and structural tests informed finite element analysis, optimising rammed earth panels and timberbased components. While general environmental tests were conducted, controlled conditions for evaporative cooling and sound insulation would have enhanced the material analysis. The material tests for the panels was conducted on a 1:3 scale model. However a 1:1 scale would enhance the accuracy of the same.
Kit-of-Parts and Architectural Identity
All three interventions employ a kit-of-parts methodology to enable rapid and reconfigurable assembly. However, it is crucial that this approach does not lead to uniform architecture across multiple sites, as Varanasi’s diverse architectural heritage, with each style narrating a unique story, must be preserved. The individual components within the kit-of-parts system can be adapted to maintain this diversity. For instance, jali panels offer opportunities for incorporating varied patterns, while extruded
frames can adopt alternative design approaches.
The dynamic panels integrated into the market typology allow for spatial qualities to evolve over the course of a day and across seasons. By adhering to building regulations and accommodating changing requirements without resorting to demolition, this system introduces an innovative framework for Varanasi. It is interesting to note that as the expandability of the panels are utilised to their full capacity, lesser the number of accessories required for the seller. For example, as the panel modulations are comprised of parts like chajja for shading, plinths for display and platforms for seating, temporary elements like umbrellas and seating stools are automatically eliminated. However, such a paradigm shift may take years to gain acceptance and implementation in the city.
Design strategies include the creation of elevated open spaces for cultural activities, the integration of various spatial scales, the establishment of shorter connections for local residents, and the preservation of the markets’ and halt points’ intrinsic essence.
While the non-market function was limitied only to its zoning as a built to suit massing for the research, it has potential for detailed experiments based on the function. This zoning was done considering it to be a residential building based on existing data so as to achieve an accessible terrace from the markets as an open space for the residents as well as the general public due to the lack of breathable spaces in Varanasi. However, on the application of this workflow on other sites, the placement of the the nonmarket zone can be modified.
These interventions align with Schein’s model of organisational culture, ensuring that the city’s core cultural values are retained while introducing a progressive architectural framework.
Social and Urban Impact
The interventions address the varying functional and social requirements of rest houses, death homes, and markets. Simulations ensure appropriate levels of daylight, radiation, and social interaction, while urban-scale feedback loops enhance site-specific designs. Future machine learning applications could generate designs for additional sites, using previous outputs as inputs to refine sociability and decongestion indices. Convex spatial strategies could be further analysed through advanced crowd simulation algorithms.
Each intervention acts as a catalyst, creating ripple effects across the immediate urban context. Consequently, iterative feedback from each experiment is vital to ensure sustained, contextually sensitive urban transformation.
In this way, within the dense static fabric of the city dynamic architectural solutions create elasticity at multiple scales while maintaining the required privacy levels across dharamshalas, death home and markets through careful design decisions thereby enhancing the journey of the traveller and at the same creating an inclusion of the locals.
Appendix I
Site Selection
Topological Relations
Step 01 Node Identification
A 3D model of Zone 2 was created to incorporate architectural data sourced from ArcGIS and Google Maps. Points of interest for the rest house, such as ghats, religious nodes, kunds, markets, parks, and transport hubs were identified alongside existing rest houses. The existing rest houses and transport hubs were classified as points of ‘origin,’ while the remaining locations were designated as points of ‘destination.’ This established a topological relationship, which was subsequently analysed to assess the network’s performance through a quantitative network analysis.
In contrast, the intervention for the death home requires proximity solely to the ghats, religious nodes, and market for food. Therefore, the selection of the site for the death home involved designating these points as destinations. The existing death home and transport hubs were marked as origins.
Step 02 Network Analysis
Once the topological relationship was established, Zone 2 was analyzed using Betweenness Centrality and Closeness Centrality as part of the nodal analysis, and Reach and Gravity to assess the performance of the edges within the network. The contoured site, represented as a 3D mesh, was projected onto the XY plane. This planar mesh was subdivided into U and V divisions to generate mesh faces. These faces were then re-grouped into smaller patches according to their proximity to the ‘origin’ points. Each patch within the overall mesh was subsequently ranked based on the criteria established for all analyses.
The existing rest houses and trasnport hubs were designated as points of ‘origin,’ while the points of ‘destination’ included the ghats, religious nodes, educational campuses, markets, and parks.
In contrast to the rest house, the points of ‘destination’ for the death home were limited to the market (for food), religious nodes, and ghats, while the existing death home and transport hubs became the points of ‘origin’.
Fig. 250: Topological Relations for the Rest House
Fig. 251: Topological Relations for the Death Home
The above diagram illustrates the urban fabric of Zone 2
Merging the sub-divided faces re-grouped based on proximity to closest origin points to form ‘patches’
Sub-dividing the fabric in U & V direction
Gathering centres of the subdivided faces
The merged faces become patches to be ranked as per the quantitative network analysis for the rest house
Lesser points of origin caused larger patch formation in contrast to the rest house
Using ‘Closest Point’, re-grouping the centres of sub-divided faces based on their proximities to the closest points of ‘origin’ for rest house
Consolidated patches for further quantitative network analysis of the death home
Fig. 252: Zone 2
Fig. 253: Merged Faces: Rest House
Fig. 254: Sub-Division of Site
Fig. 255: Patch Formation: Rest House
Fig. 256: Centre Points
Fig. 257: Merged Faces : Death Home
Fig. 258: Origins & Centres: Rest House
Fig. 259: Patch Formation: Death Home
Tools
The tools available under NNA (Numerical Network Analysis) plugin for Grasshopper in Rhino offers various analysis tools that help in measuring the accessibility and centrality theories of a spatial network. The centrality analysis under the graph theory helps in analysing the the betweenness of a node, that is, how many times it has appeared in many shortest paths to the node. Very similarly, the closeness centrality helps in the measurement of how close this node is to the others. Here, a lower value indicates that the origin node is more closely located to the destination. On the other hand, the reach index determines the total opportunities that are available for each destination. Distance decay that is a cumulative loss of accessibility opportunities are measured using the Gravity Analysis. 1
1. 5AxU Platform, “Numeric Network Analysis V2: Basic Concept Introduction and Interface Overview,” Medium, accessed September 19, 2024, https://axuplatform. medium.com/numeric-network-analysis-v2-basic-febcf8f84f2.
Network Analysis : Rest House
The diagram on the left illustrates the ranking of nodes based on their Betweenness Centrality. The adjacent diagram on the right shows the ranking of patches according to their proximity to these nodes with assigned corresponding node values to the patches. The north-east side of the zone had more nodes with higher values.
The diagram on the left illustrates the ranking of nodes based on their Closeness Centrality. The adjacent diagram on the right shows the ranking of patches according to their proximity to these nodes with assigned corresponding node values to the patches. The south and west side of the zone had more patches with higher values.
The diagram on the left illustrates the reach analysis of the network, with the gradient displaying the variation in opportunity. The patches in the diagram on the right hand side, shaded according to these values, indicated a higher reach index for the majority of the patches and a low value for a few patches.
The diagram on the left illustrates the distance decay through gravity analysis. The corresponding diagram on the right, where the patches were shaded according to these values, indicates a higher gravity index for the central patch, with average values observed in the adjacent patches.
Fig. 260: Betweenness Centrality
Fig. 261: Closeness Centraility
Fig. 262: Reach Analysis
Fig. 263: Gravity Analysis
Network Analysis : Death Home
In contrast to the rest house, the death home had fewer points of origin and destination. The diagram above illustrates the Betweenness Centrality analysis on the left. The diagram on the right shows the patches shaded according to their corresponding Betweenness values, based on their proximity to the nodes.
The diagram on the left presents the Closeness Centrality analysis, while the diagram on the right displays patches shaded according to their corresponding Closeness Centrality values. It was observed that the patches in the northwest and southeast exhibited higher values.
The diagram on the left illustrates the gradient of reach, or opportunity, along the edges of the network. The corresponding values were applied to the patches, which were shaded accordingly, as shown in the diagram on the right. It was observed that patches with higher values were located on the southern side.
Similar to the reach analysis, the diagram on the left displays the gradient of gravity, with corresponding values applied to the patches and shaded accordingly. It was observed that patches with a higher gravity index were located on the eastern side, while those with average or lower values appeared on the western side.
Fig. 264: Betweenness Centrality
Fig. 265: Closeness Centraility
Fig. 266: Reach Analysis
Fig. 267: Gravity Analysis
Computational Observations
It was observed that the NNA plugin that gives out the values for the four types of analyses has longer processing time for a heavy model such as the one that was used for the input. The workflow included preparing custom C# scripts to filter out patches that were analysed for the set domains. This script took in all the values outputted by the NNA component and helped in identifying values between the set domain and then be able to select the relevant patch from the entire list, like the function of sort list. The plugin computes the entire model every time the grasshopper canvas is active and thus the workflow had to involve a data dam that fed into the input of the next step.
Criteria for Selection
For Betweenness and Closeness Centrality, patches with mean values were considered. These values were re-mapped from 0.00 to 1.00, and patches within the range of 0.40 to 0.60 were selected to reflect the mean results. In contrast, for Reach and Gravity analyses, the focus shifted to patches adjacent to or immediately following the highest values. The same re-mapping was applied here, with a range from 0.30 to 0.80 considering the gradience for both the latter analyses that visually seemed to require a wider domain. Patches with average values for Betweenness and Closeness Centrality, along with those near the highest values for Reach and Gravity, were selected and ranked based on their overlap across all four analyses. Patches that fell within the designated ranges for each analysis method were taken ahead to the next phase.
Network Analysis : Death Home
Selected Patches from Network Analysis
The diagrams above show the patches that overlapped within the designated ranges across all four network analyses conducted. The range established for Betweenness and Closeness Centrality was between 0.40 and 0.60, while the range for Reach and Gravity analyses was from 0.30 to 0.80.
Step 03 Density & Height Variance
Before proceeding with density and height variance calculations, the patches resulting from Step 02 were re-divided once again along the U and V directions. The centers of the newly generated mesh faces were used as attractor points to identify the nearest buildings. These buildings were then clustered based on their proximity to these attractor points, and new boundaries were established to group buildings that were closely located. These newly defined boundaries, referred to as ‘sub-patches,’ were subsets of the original patches. The sub-patches were evaluated for total area, and those smaller than 1,000 m² were culled, leaving only larger fragments of the urban fabric for further analysis.
Fig. 268: Selected Patches for Rest House
Fig. 269: Selected Patches for Death Home
Sub-Patches
270: Sub-Patches for Rest House
271: Sub-Patches for Death Home
The diagrams above illustrate the sub-patches created within the selected patches from the network analysis. These sub-patches were generated by recreating a new U and V grid within the selected patches, followed by re-grouping the subdivided faces based on their proximity to building clusters. Sub-patches with an area below 1,000 sq. m were excluded.
Fig.
Fig.
Tightness
Density & Height Variance : Rest House
Fig. 272: Density Analysis
The diagram illustrates clusters of buildings, shaded according to their density values within the sub-patches.
Fig. 273: Height Variance Analysis
The diagram illustrates clusters of buildings, with each cluster shaded according to its height variance values.
The sub-patches that evolved as the outcome of the area filtration, were then further tested for density of buildings (a) and their height variance (b).
a. For measuring the density, a ratio was generated by dividing the total footprint area of all the buildings within the sub-patch by the area of the sub-patch.
Density = Total Area of all Buildings within the sub-patch / Area of the sub-patch
b. The height variance of every sub-patch with its set of buildings was calculated using the formula stated below:
∑(A-H) /N
Where
A = Total heights of all the buildings within the sub-patch.
H = Mean height of all the buildings within the sub-patch
N = Total number of buildings within the subpatch
The two respective values of each sub-patch were then re-mapped on a target value of 0.00 to 1.00 and then the two re-mapped values were added up to assign as one score to every sub-patch. These sub-patches were then ranked from high to low based on their score. Chosen top ranking sub-patches, that is the sub-patches with high density and height variance were then taken into Step 04 as the next input.
Density & Height Variance : Death Home
The diagram illustrates clusters of buildings, shaded according to their density values within the sub-patches.
The diagram illustrates clusters of buildings, with each cluster shaded according to its height variance values.
Fig. 274: Density Analysis
Fig. 275: Height Variance Analysis
Computational Observations
The size of the U and V domain in the re-division of the patches significantly influences the scale and proportionality of the resulting sub-patches. Establishing the limits for this U and V domain was a key design strategy implemented at the beginning of Step 03.
For the death home, this process was repeated using the same parameters to identify the site with higher density ratios and greater height variance.
Climate Visibility Analysis
Step 04 Environmental & Visibility Analysis
Rest House
The diagram illustrates sunlight hours, highlighting the sub-patches with less shade and higher values for sunlight exposure.
The sub-patches generated in Step 03 were further analyzed for sunlight exposure over an annual period using the Ladybug plugin in Grasshopper within Rhino. This analysis produced a heat map displaying a gradient from higher (hotter) to lower (cooler) values, which was subsequently overlaid on the sub-patches. A Grasshopper algorithm evaluated the U and V faces of these sub-patches to identify those receiving higher sunlight hours. Based on this evaluation, the sub-patches were ranked according to
The diagram illustrates the level of visibility within the sub-patches, as analysed using the IsoVist component from the Decoding Spaces plugin for Grasshopper.
their solar exposure levels.
The sub-patches with the lowest rankings were subsequently assessed for visibility using the IsoVist component from the Decoding Spaces plugin for Grasshopper in Rhino. This evaluation focused on compactness mapping, and sub-patches exhibiting higher visibility were selected for the final step of the site selection process.
Fig. 276: Sunlight Hours
Fig. 277: Visibility Analysis
Death Home
Fig. 278: Sunlight Hours
Fig. 279: Visibility Analysis
The diagram illustrates sunlight hours, highlighting the sub-patches with less shade and higher values for sunlight exposure.
In this step, it is evident that the sub-patch performing well in terms of visibility likely had greater distances between buildings, leading to less shade but also lower performance in terms of sunlight hours. However, higher visibility was a more weighted requirement for the Rest House, making it a crucial factor in the site selection.
In contrast, the death home intervention prioritizes visual privacy. Consequently, the criteria in this step were
The diagram illustrates the level of visibility within the sub-patches, as analysed using the IsoVist component from the Decoding Spaces plugin for Grasshopper.
adjusted to favor a lower score in visibility analysis, which resulted in a higher ranking for sunlight hours, meaning more shaded areas.
Step 05 Wind Analysis
Rest House
The above diagram illustrates a Computational Fluid Dynamics simulation conducted on the chosen sub-patches from Step 04
The two sub-patches identified through environmental and visibility analyses were further examined for wind flow using Computational Fluid Dynamics (CFD). According to data from Ladybug’s wind-rose component, the prevailing wind direction was from the West, with an average speed of 4 m/s. The CFD analysis produced a gradient map showing variations in wind speed across the sub-patches. The sub-patch with the smallest variation in wind speed was selected as the final site for intervention.
The diagram illustrates the CFD along with the built masses within the fabric of the sub-patch
This choice highlights the design opportunity to enhance wind flow as one of the objectives in the morphological experiment.
Fig. 280: CFD Simulation for Sub-Patches from Step 04
Fig. 281: CFD with Buildings within the Sub-Patches
Death Home
The above diagram illustrates a Computational Fluid Dynamics simulation conducted on the chosen sub-patches from Step 04
The experiment was repeated under similar conditions for the death home to investigate the potential of the morphology in improving wind flow within the fabric.
Buildings
The diagram illustrates the CFD along with the built masses within the fabric of the sub-patch
Fig. 282: CFD Simulation for Sub-Patches from Step 04
Fig. 283: CFD with
within the Sub-Patches
Appendix II
Design Development
Methodology
Fig. 284: Workflow for morphological experiments
The workflow of the morphology involved a multi-layered process with constant analysis of data at every stage. The first stage consisted of a multi-objective optimization predominantly evaluating the phenotypes based on functional adjacencies, built-up areas and openbuilt relationships. The pareto-front data of this experiment was used as an input to conduct a sequential simulation focussing on the external envelope of the morphology involving a detection and assignment of the various kit-ofparts based on environmental parameters. Subsequently, different weights were assigned to the fitness objectives, and the top ten phenotypes were selected for further analysis. These phenotypes underwent structural optimization to determine the appropriate sizes of structural members and the thickness of earth panels, ultimately identifying the best-performing phenotype. A post-analysis of the final phenotype was conducted using Pedestrian Simulation (Hive), Computational Fluid Dynamics (CFD), and Daylight Analysis to assess its performance in terms of sociability, wind flow, and natural light distribution, respectively.
The results of the above experiment would be used as training inputs in machine learning for future predictions on the ranked sites from the network experiments.
Multi-Objective Evolutionary Algorithm
Fitness Criteria
Rest House
Stage I focusses on the placement of the built within the chosen site. Emphasis has been laid on minimising the demolition of the existing fabric with FO-01. Under this criteria, the demolition is controlled through the gene that allows for a ‘search space’ to get established for the placement of the building allowing a range of 40-60% of demolition only.
With the climate of Varanasi being hot and humid, it is required to create site level shading and self -shading within the structure. FO-02 aims at maximising this shading and is calculated through the method of occlusion of sun vectors by the obstructions like surrounding buildings calculated using a 2D point cloud at the surfaces where shading is to be measured. The sun vectors established through the EPW data analysed through Ladybug in Grasshopper.
With the area program being defined, the fitness objective FO-03 directs the individual programmatic functions like dormitories, reception, core, etc. to be laid out with levels of adjacencies defined within the algorithm. Proportionate number of points which are the centres of all the voxels, are used for assigning the functions based on their percentages. With the method of ‘closest point’, attraction was created between functionalities and courts. Certain functions that are meant to be on the ground floor are assigned to the points of the ground floor. Balance functions are distributed through similar point assignment. This fitness objective maximises the adjacencies by reducing the distances between the habitable spaces and their designated points of attraction.
285: Fitness Objective - 1: Minimise Demolition
The diagram above illustrates the search space that regulates the demolition of existing buildings, ensuring that 40-60% of the structures within the designated area are retained.
286: Fitness Objective - 2: Maximise Site & Self Shade
The points on the surfaces shaded according to the incidence of sun vectors. The colour gradient visually represents the amount of shade achieved across the surfaces.
Each voxel that has been assigned to the specific function from the area program has been shaded as per the colour designated for the specified program.
Fig. 288: Fitness Objective - 4: Maximise Open Courts
The shaded spaces indicate the open courts and terraces that have been formed by open space allocation and as a result of adjacencies.
Fig. 289: Fitness Objective - 5: Maximise Built Up Area
The shaded mass indicates the total permissible built up potential of the phenotype which is calculated by multiplying the FAR with the net search space.
Fig. 290: Fitness Objective - 6: Minimise Circulation Spaces’ Area
The circulation spaces or verandahs are created on all floors around the central courtyard and are offsetted outwards to establish circulation and visual connection respectively.
While the design prioritises a compact structure, it is equally important to maximise multi-level open courtyards within the building. Fitness objective FO-04 focuses on increasing the total courtyard area by calculating the sum of all the courtyard spaces. This is opposed by FO-05, maximises the use of the FAR (Floor Area Ratio), or the allowable built-up area, determined by multiplying the available search space by the FAR. To align with the goal of creating compact structures within the dense urban fabric, circulation spaces are designed to remain tightly packed. FO-05 specifically aims to minimise peripheral circulation spaces or ‘verandahs’ around the courtyards.
‘Repulsion’ is created by taking the sum of distances between the roads and the yoga and library courts, to place them far from one another, choosing the higher result.
‘Attraction’ is created by inverting the sum of distances between the road and the entrance court and the tree cluster and the library. A mass addition of the two is taken forward.
FO-07 controls the proximities of the open courts through attraction and repulsion of these spaces with site features such as the roads and tree clusters. It also emphasies on the centrality of the open air courtyard within the built mass. The mass addition of all these proximities is used to determine the final score within this fitness objective. FO-08 opposes FO-05 by maxisiming area of central courtyard to enhance social interaction.
The centrality of the courtyard is created though the centre most point of the built mass and its distance with the centre of the search space is evaluated.
The diagram illustrates the fitness objective, which aims to maximise the courtyard by expanding its overall area.
Fig. 294: Fitness Objective - 8: Maximise Courtyard Area
Fitness Criteria
Death Home
Fig. 295: Fitness Objective - 7A: Minimise
Proximity Distance
‘Attraction’ between each of the adjacent roads and the entry and the emergency courts respectively.
Fig. 296: Fitness Objective - 7A: Minimise
Proximity Distance
‘Repulsion’ between the general entry and the emergency entry.
Although the building fitness objectives remain largely consistent for the morphology experiment of the death home, the fitness objectives related to proximity and courtyard design differ slightly from those of the rest house. In the rest house, FO-07 prioritised placing the yoga and library courts away from the roads, with the entry court positioned near one of the roads and the library close to a cluster of trees. Conversely, the death home requires the entry court and the emergency court to be located close to
Fig. 297: Fitness Objective - 8: Maximise Daylight in Courtyard
Maximisation of daylight in the courtyard, which is solely for the purpose of enhancing natural daylighting.
the roads, but distanced from each other. This separation is intended to visually conceal the ambulance access from the general public. Furthermore, while FO-08 in the rest house aims to maximise courtyard space to encourage social interaction, the death home demands more privacy, and social interaction is not a priority. Instead, the courtyard’s primary function in the death home is to provide natural light, and thus, FO-08 is focused on optimising daylight rather than promoting interaction.
Phenotype Build
Step 1: Establishing the Search Space
Fig. 298: Locate the search space within the site
This diagram illustrates the site selected for the rest house intervention through CFD analysis, with the building placement located within its boundaries.
Step 1 focused on the placement of the built mass within the site boundary. The lowest-performing site, as evaluated through the final CFD analysis in the site selection process, was selected. The site had an approximate area of 4,590 sq. m. and 75% of this area was considered as the ‘search space.’
Search Space = k
k = 0.75 of site area
k ≈ 3443 sq. m
For this step, the site was subdivided into a 3.6m x 3.6m grid. One random point is placed within the site boundary, the closest surrounding grid faces were chosen to accumulate the total search space, ensuring it matched the value of ‘k.’
The same step was applied to the death home. The total site area for the death home intervention was 4,355 sq.m.
299: Point controlling the search space
The above diagram illustrates the point that directs the selection of the sub-divided grid faces to accumulate the total search space which matches the area of ‘k’
Fig.
Step 2: Controlled Demolition
The above diagram illustrates the gene that guides the demolition within the existing fabric to accommodate the proposed design of the rest house or death home. A control mechanism is applied by setting a retention domain of 40-60% of the buildings, with an objective to minimise the alteration of the existing fabric.
In this step, buildings with footprints within the selected site were considered. From these, the set of buildings whose footprints coincided with the search space were selected for further analysis. A random point was chosen from the centres of the grid faces within the search space, which was then used to identify the buildings closest to this point. A gene was applied to select 40-60% of these buildings, ensuring a controlled amount of demolition to free up space for the proposed intervention.
Fig. 300: Demolition of existing fabric
Step 3: Gross Search Space
Fig. 301: Gross search space established after building demolition
The diagram illustrates the gross search space generated from the demolition process. A 2.4m distance was maintained from the existing buildings, and the search space was re-divided into a 3.6m x 3.6m grid for further analysis.
After removing the buildings designated for demolition, the search space is offset inward by 2.4m. This adjusted search space is then re-divided into a 3.6m x 3.6m grid for further analysis. In some instances, the phenotypes may reveal a fragmented search space, consisting of multiple disconnected areas, which are addressed subsequently. This fragmentation is why the term “gross search space” is used.
Step 4: Net Search Space
All fragments of the gross search space are assessed for their areas, and the largest fragment is selected as the ‘net search space’. This process helps eliminate any fragments that are too small or irregularly shaped, which could obstruct subsequent spatial arrangements.
The diagrams illustrate the selection of the larger, more continuous grid faces that qualify as the net search space.
Fig. 302: Selection of ‘Net Search Space’ from Gross Search Space
Step 5: Side Margins & 2D Point Grid
The points corresponding to the centres of the grid faces located on the outermost edges of the net search space were identified and removed. This process introduced an additional side margin of 3.6 metres, following the previously established 2.4 metres from the existing buildings. Thus, the total side margin amounted to 6.0 metres. This margin ensures adequate space for spatial hierarchies and facilitates vehicular or pedestrian movement if necessary. The remaining points within the net search space, after removing the side margins, formed the ‘2D point grid,’ which is used to assist in subsequent spatial allocations.
The 2D point grid is extended along the Z-axis to generate buildable voxels after assigning fixed spatial requirements such as the courtyard, verandah, core, etc. This 2D grid area is used to calculate the permissible built-up area by multiplying it by the Floor Area Ratio (FAR), which is 1.5 according to Varanasi’s building development regulations. Therefore,Permissible Built-Up Area = 1.5 × (Area of Grid Faces Corresponding to 2D Point Grid). These area parameters have been discussed in depth under step 7 of gross buildable area.
Fig. 303: Elimating the peripheral grid faces as the side margin spaces
The diagram represents the side margin or setback, which was established by selecting and removing the points corresponding to the peripheral grid faces.
Fig. 304: 2D Point Grid
The diagram illustrates the ‘2D point grid’ established after the removal of the side margin or the set back.
Step 6: Courtyard
The above diagram illustrates the domain designated for the formation of the courtyard at the centre of the phenotype. This is achieved by selecting central points from the 2D point grid, guided by a gene that controls the number of points to be chosen. The culled grid faces denote the creation of the open-air central courtyard.
Taking reference from the area parameters explained under step 7, gross buildable area, a domain was created to choose the sub-divided grid faces in a way so that the minimum number of faces selected would be 4 and maximum number would be the number of faces whose total area sums to 20% of the total area allocated to creating open spaces. The balance open area would be used to create the open courts within the building.
In case of the death home, the process was the same with the modifcation that the upper limit of the domain would be 10% of total space allocated to the open areas.
The difference being that in the case of rest houses, the courtyard becomes a space for enhancing interaction while in the death home it emphasises more on being the source of natural daylighting.
Fig. 305: Courtyard Formation
Key Plan
Step 7: Verandah
The grid faces on the periphery of the courtyard become the verandah on the ground floor of width 3.6m on all sides. These are subdivided later in steps for seating.
for the
The diagram illustrates the centre points of the grid faces that are on the periphery of the courtyard. These qualify to become the verandah space on all floors.
The first floor verandah of the rest house is offsetted inwards by 0.6m to get a width of 3.0m. This offset enables visual connection with the ground floor verandah & courtyard.
Fig. 306: Grid Faces chosen
Verandah
Fig. 307: Ground Floor Verandah
Fig. 308: First Floor Verandah
Step 7 focusses on creating the horizontal circulation space on each floor called the ‘verandah’. These are covered corridors that have one of their sides leaning towards the central courtyard. This is created by choosing the grid faces that are on the periphery of the courtyard. The verandah on the ground floor is 3.6m and it received an offset of 0.6m incrementally on every floor of the rest house. This staggered design fosters visual connections between the floors and the central courtyard, enhancing the spatial interaction.
an additional 0.6m to get a width of 1.8m. This creates complete visual connection within the building.
Fig. 309: Second Floor Verandah
Fig. 310: Third Floor Verandah
The second floor verandah of the rest house is further offsetted inwards by an additional 0.6m to get a width of 2.4m. This further enhances visual connection within the building.
The third floor verandah of the rest house is further offsetted inwards by
Step 7: Verandah: Rest House vs Death Home
The diagram illustrates the ground floor verandah which is half of the grid face measuring 1.8m
The diagram illustrates an outward offset of 0.6m resulting in a 2.4m wide verandah on the first floor.
In contrast to the rest house, more privacy is required within the death home. Thus to visually conceal the courtyard and the lower floor verandahs, an outward offset of 0.6m is created on every floor incrementally resulting in the ground, first, second and third floor verandahs measuring 1.8m, 2.4m, 3.0m and 3.6m in width respectively.
The diagram illustrates an outward offset of 0.6m resulting in a 3.0m wide verandah on the second floor.
The diagram illustrates an outward offset of 0.6m resulting in a 3.6m wide verandah on the first floor.
Fig. 311: Ground Floor Verandah
Fig. 312: Second Floor Verandah
Fig. 313: First Floor Verandah
Fig. 314: Third Floor Verandah
Step 8: Fixed Blocks
To achieve vertical connectivity via staircases and lifts, a cluster of four closely packed faces is selected. The algorithm chooses two of these faces from those along the periphery of the verandah. These two faces, along with their adjacent counterparts, form the core. This core remains untouched throughout the experiment and is deducted from the cells allocated for the buildable area.
Similarly, four faces are designated as the multifunctional block, extending into adjacent spaces on all floors respectively to allow for functional flexibility. These voxels are also deducted from the available buildable mass.
315: Fixed Core
The diagram illustrates a cluster of four faces next to the verandah chosen to be arrayed in the Z axis to form the fixed core containing the vertical circulation elements.
Fig. 316: Multi-Functional Block
In order to achieve functional expandability, four faces in a closed pack cluster are arrayed in the Z axis and this space acts as an extension to adjacent spaces.
Fig.
Step 8: Gross Buildable Area
The diagrams illustrate the pro-rata division of the permissible built-up area, separating it into built and open spaces, followed by the proportional subdivision of each category. The spatial requirements and proportions differ between the rest house and death home, as reflected in the percentages allocated to each, highlighting their functional needs.
The total permissible built-up area was calculated by multiplying the sum of the grid faces, represented by the 2D point grid, with a FAR of 1.5. This area was then divided into 70% built and 30% open spaces. As previously discussed, the courtyard is restricted to a maximum of 20% of the open area, with the remaining open courts subdivided according to predetermined percentages. For the built area, deductions are made for the core, multi-functional block, and verandahs, with the remaining space subdivided
proportionally based on the percentages assigned for each requirement. While both interventions start with the same area divisions, the death home allows a maximum of 10% of the open courts for the courtyard, compared to 20% for the rest house. The rest house also features more public courts, whereas the death home creates more buffer courts. This pro-rata division approach is adaptable to various site conditions, creating an area program based on the search space within the site boundary.
Fig. 317: Area Bifurcation: Rest House
Fig. 318: Area Bifurcation: Death Home
The above diagram illustrates the 2D point grid on the ground floor after deducting the courtyard, verandah, core, and multifunctional block, which are then arrayed along the Z-axis for four floors. This 3D point grid is translated into the gross buildable area, represented in the form of voxels.
The above diagram illustrates the gross buildable area derived from the 3D point grid, represented as voxels. Open spaces are first allocated, and the corresponding voxels are deducted from the total mass. The remaining voxels are then utilized to meet the spatial requirements of either the rest house or the death home, depending on the intervention.
Fig. 319: 3D Point Grid
Fig. 320: Gross Buildable Mass as Voxels from 3D point grid
Step 10: Open Courts
A single point is designated to represent each category of open court, and these points are distributed throughout the gross buildable mass. Based on the proportional allocation of open courts from the area program, these points select the nearest adjacent points. The grid faces represented by these selected points are grouped together, ensuring that their combined area meets the required size for each category of open space. These voxels are deducted from the gross buildable mass and the net buildable voxels are considered for the next steps of spatial allocation.
The diagrams illustrate the initial set of points populated within the buildable mass, which facilitate the regrouping of adjacent points to form the various courts. This arrangement allows for the strategic clustering of points to meet the spatial requirements for open courts, ensuring efficient use of the buildable area.
Fig. 321: Points representing the open courts - Rest House
Fig. 322: Points representing the open courts - Death Home
In the case of the rest house, the open courts serve a more public function, including spaces such as the entrance court, courts designated for activities like yoga, a kund, a reading (library) court and the central open court. Additionally, larger buffer courts are created near the dormitories, fostering spaces for social interaction. The placement of these courtyards is driven by fitness objectives related to proximity and adjacencies, which are optimised using the Multi-Objective Evolutionary Algorithm (MOEA) to ensure efficient spatial organisation.
Fig. 323: Adjacent closest points to create the open courts
The diagram above illustrates the clustering of points to meet the spatial requirements for open courts, ensuring efficient use of the buildable area.
In contrast, the death home features two primary courts—the entrance court and the emergency court— which are strategically positioned near the two adjacent roads. These courts are deliberately placed apart from each other to visually conceal the ambulance entry from the general public access. The buffer courts are designed to create smaller, more private spaces near the dormitories, providing breakout areas while maintaining the necessary privacy for the users.
Fig. 324: Open court grid faces - Rest House
The diagram represents the grid faces that have been formed through the clustering of the adjacent points thereby to be deducted from the total buildable mass.
Step 11: Adjacencies
A single point is designated to represent each category of open court, and these points are distributed throughout the gross buildable mass. Based on the proportional allocation of open courts from the area program, these points select the nearest adjacent points. The grid faces represented by these selected points are grouped together, ensuring that their combined area meets the required size for each category of open space. These voxels are deducted from the gross buildable mass and the net buildable voxels are considered for the next steps of spatial allocation.
The diagram illustrates the points that represent the voxels assigned to spaces as per the requirements.
The pie chart shows the breakdown of the net buildable mass after deducting open spaces, highlighting the distribution of space for various functional zones.
The diagram illustrates the shaded voxels that represent the various spatial requirements allocated as per the percentage distribution.
Fig. 325: Adjaceny points
Fig. 326: Pro-rata area sub-division
Fig. 327: Shaded voxels representing the spatial adjacencies
The stage I of the morphology experiment ended with a narrowing of the search space through gene decoding. At this point a parallel investigation began through material experimentation and prototyping to create the kit-of-parts system. This stage took the phenotype as a built mass with voxels into the next stage where it would be further optimised for environmental parameters after being assigned a structure, facade, materials and roof.
Further to the phenotype build, a Multi-Objective Evolutionary Optimisation was conducted using the Wallcei plugin in Grasshopper within Rhino. The process included 20 generations with a generation size of 50. A crossover probability of 0.9 was used, with both crossover and mutation distribution indices set at 20. The optimisation resulted in 230 Pareto front solutions from a population of 1000 individuals. The same process was followed for the experiment of the Death Home.
Pareto Fronts: Rest House
The diagram above illustrates the achieved Pareto front solutions from Stage I of the optimisation. A notable variation in phenotypes is visible, particularly in terms of form and placement within the site. This diversity likely stems from the extensive search space available for the optimisation process.
Fig. 328: Pareto Front Solutions - Plan View
The isometric view of the Pareto front solutions illustrates how the placements within the built fabric aim to minimize demolition while optimizing other fitness objectives. These objectives include enhancing shading and maximizing the built-up area. Notably, the goal of maximizing courtyard space has led to an increase in courtyard sizes across nearly all phenotypes, as well as the creation of multiple open courts.
Fig. 329: Pareto Front Solutions of Rest House - Isometric View
Analysis : Rest House
The Parallel Coordinate Plot for Stage I of the Rest House optimisation highlights a clear contrast in fitness objectives. It is evident that phenotypes excelling in FO-01, FO-03, FO-05, and FO-07 do not perform as well in other objectives. A diverse distribution of values is noted in FO02 and FO-03. Standard Deviation graphs reveal an overall increase in fitness value variation. Specifically, the SD graphs for FO-01 and FO-08 show improvement in performance across generations, while the remaining graphs indicate a slight decline. This variation is attributed to the conflicting fitness objectives and the trade-offs involved in reaching the optimal solution.
Fig. 330: Parallel Co-ordinate Plot - Rest House
Fig. 331: FO-01 Minimise Demolition
Fig. 332: FO-02 Maximise Shade
Fig. 333: FO-03 Maximise Adjacency
Fig. 334: FO-04 Maximise Open Courts
Fig. 335: FO-05 Maximise Built Up Area
Fig. 336: FO-06 Minimise Verandah Areas
Fig. 337: FO-07 Minimise Proximity Distance
Fig. 338: FO-08 Maximise Courtyard
From the diagrams, it is evident that the Pareto fronts are predominantly located towards the east side of the plot, with a significant portion of the existing fabric retained. The individuals display an intriguing interplay between built and open spaces. Notably, Gen33Ind17 and Gen43Ind3 feature detached multi-function blocks, which may be considered impractical. Overall, the phenotypes tend to be more inward-looking, with many private buffer spaces as intentionally required for the death home.
Fig. 339: Pareto Front Solutions of Death Home - Isometric View
Analysis : Death Home
The Parallel Coordinate Plot for Stage I of the Death Home optimization reveals a contrast in the fitness objectives, with noticeable variance in fitness values across all objectives. This trend is confirmed by the SD graphs, which show a flattening trend, indicating an increase in variation. Specifically, the SD graphs for FO-01, FO-03, FO06, FO-07, and FO-08 demonstrate improved performance, while the performance for other objectives shows a decline. Notably, for FO-02 and FO-03, there was initially minimal variation, which has increased over time.
Fig. 340: Parallel Co-ordinate Plot - Death House
Fig. 341: FO-01 Minimise Demolition
Fig. 342: FO-02 Maximise Shade
Fig. 343: FO-03 Maximise Adjacency
Fig. 344: FO-04 Maximise Open Courts
Fig. 345: FO-05 Maximise Built Up Area
Fig. 346: FO-06 Minimise Verandah Areas
Fig. 347: FO-07 Minimise Proximity Distance
Fig. 348: FO-08 Maximise Courtyard
From the diagrams, it is evident that the Pareto fronts are predominantly located towards the east side of the plot, with a significant portion of the existing fabric retained. The individuals display an intriguing interplay between built and open spaces. Notably, Gen33Ind17 and Gen43Ind3 feature detached multi-function blocks, which may be considered impractical. Overall, the phenotypes tend to be more inward-looking, with many private buffer spaces as intentionally required for the death home.
Fig. 349: Pareto Front Solutions of Death Home - Isometric View
Sequential Simulation Appendix III
The sequential simulation focused on the detection and strategic assignment of kit-of-parts, specifically wall and roof panels, based on environmental factors with the primary goal of optimizing human comfort.
Fitness Objectives
FO 01 : Minimise Radiation
This objective was essential to ensure thermal comfort within habitable indoor spaces. It focused on the appropriate placement and sizing of openings as well as the optimal arrangement of voxels to facilitate the accurate detection and placement of rammed earth and timber panels.
FO 02 : Maximise Daylight
The site analysis revealed that natural light deficiency was a persistent issue in the dense urban fabric of Varanasi. Thus, maximizing daylight within indoor spaces became a critical, yet opposing, objective to minimizing radiation. The simulation sought a balanced configuration of openings that would allow for maximum natural light without compromising thermal comfort. This objective was evaluated using occlusion using the sun vectors of Varanasi as the rays and the context buildings and external walls with openings as obstructions to study the occluded rays on the floor plate.
FO 03 : Maximise Evaporative Cooling
The detection and assignment system ensured that 70% of the external walls that were shaded, classified as rammed earth panels to enhance evaporative cooling. Iterations that maximized the number of earth panels were found to be more effective in promoting evaporative cooling.
Phenotype Build
A common experiment set-up was used for the rest-house and death home with variations in the domains of certain genes to cater to each of their unique requirements.
Grouping of cells
The assignment of the kit-of-parts began at the voxel level where the voxels were grouped together into single, double and quadruple types. The boundaries of the functional adjacencies were extracted per floor and within each function a grouping of voxels was initially carried out based on the areas:
Single (3.6 x 3.6 = 12.96 sqm.)
Double (3.6 x 3.6 x 2 = 25.92 sqm.)
Triple (3.6 x 3.6 x 3 = 38.88 sqm.)
Quadruple units (3.6 x 3.6 x 4 = 51.84 sqm.)
Larger units (> 51 sqm.)
Fig. 350: FO 01: Minimise Radiation
Fig. 351: FO 02: Maximise Daylight
Fig. 352: FO 03: Maximise Evaporative Cooling
Panel detection was executed beginning with the identification of all external faces of the voxels.
Spans
Once the external faces were determined, the ones that belonged to the quadruple units and the longer faces of the double units were culled to retain a span of 3.6m resulting in the external faces belonging to single units and shorter faces of double units. This was done to utilize the self-spanning property of the material.
Shaded vz. Exposed
These faces were then subjected to an occlusion analysis using sun vectors derived from the context of Varanasi. This analysis ranked the faces based on the degree of occlusion, and the top 70% employed to group the shaded faces as earth panels, while the remaining faces were designated as timber panels. This assignment was grounded in the principles of evaporative cooling, particularly pertinent to the humid climate of Varanasi. Earth walls in direct sunlight can become too hot leading to rapid evaporation. While evaporation is essential for cooling, too fast an evaporation rate can result in less efficient cooling, as the heat absorbed from the sun might offset the cooling effect. In the shade, evaporation occurs more steadily and efficiently, maintaining a cooler temperature within the indoor air molecules through radiation.
Adjacency to Courts
Within the subset of earth panels, those adjacent to courts were further grouped based on their interaction with courts. Panels situated near courts or open spaces were assigned as earth panels with door openings, while others received earth panels with window openings. For the timber panels, a similar approach was applied, with panels near courts designated as sliding folding timber panels to allow indoor spaces to seamlessly extend into open courts, while the remainder were assigned pivot timber panels.
Function assignment
External Face Detection
Occlusion with Sun Vectors
Detection
Larger Spans
Assignment
Assignment
Type Assignment
Fig. 353: Phenotype Build
Panel Types
Rammed Earth Panel – Door & Window Opening
The base geometry of the wall system’s kit-of-parts was a 3.6x 3.6 meter panel, which served as the basic primitive. This panel was subdivided vertically into nine equally spaced sub-panels. To optimize the interior space for furniture arrangement while considering the smallest functional unit, a gene selected three consecutive sub-panels—excluding the first and last—to form a door opening measuring 1.2 meters in width. This ensured the accommodation of a storage unit behind the door once opened.
Within this 1.2-meter span, a door of 2.4 meters in height was set, with a perforated timber panel positioned above it to facilitate ventilation. The remaining sub-panels were designated as solid rammed earth panels.
For the rest house, three panels were selected with low sill heights (0.4 to 0.8m) and high lintel levels (3.2 to 2.8m). In contrast, for the death home, four panels were selected for with high sill heigths (0.8 to 1.2m ) and low lintel levels (2.8 to 2.4m) resulting in larger openings for daylight but maintaining privacy at all times.
Additionally, a frame was extruded along the periphery of the openings, with its depth (0.2 to 0.5m) and angle (-10° to 10°) of extrusion governed by a gene. This frame functioned as both a shading device and a protective feature against rainfall.
Fig. 354: Door Type Rammed Earth Panel Detection
Fig. 355: Window Type Rammed Earth Panel Detection
Fig. 356: Phenotype build of Door Type Rammed Earth Panel
Fig. 357: Phenotype build Window Type Rammed Earth Panel
Timber Panel – Sliding Folding Type
The 3.6 x 3.6-meter panel was subdivided into nine vertical sections, each functioning as a timber panel equipped with horizontal louvers designed to reduce heat while allowing the entry of light. The first, last and center panels in this arrangement were fixed in place, while the intermediate panels were equipped with a sliding mechanism that enabled them to fold on either side of the panel.
Timber Panel – Pivot Type
The same methodology was employed to create a panel system in which the sub-panels pivoted along a vertical axis. These pivoting panels were designed with a defined angle domain, allowing controlled rotation to regulate light and ventilation.
The horizontal faces of the topmost floor were selected to create the kit-of-parts of the roof. Single, double and quadruple faces were identified to construct the roof. The primary objective of this strategy was to reduce solar radiation within the spaces on the topmost floor and to facilitate rainwater collection.
To achieve this, a tensile fabric roof was designed, featuring a circular cut-out at the center of each surface, the position of which was dictated by a gene.
Utilising Kangaroo Physics as a computational tool, a force was applied to the cut-out along the negative z-axis to create a depression where rainwater could be collected.
The phenotype build was concluded by adding 0.9m high railings with verticle posts at 1.8m intervals, 0.4m wide jali screens for privacy and ventilation along the verandahs and 3.6x3.6m pergolas to create shaded areas on terraces.
Fig. 364: Railings, Jali screens and Pergolas
Fig. 365: Pareto-Front Solutions : Rest House
Sequential Simulation Analysis : Rest House
The sequential simulation was carried out for increased human comfort in terms of solar radiation, natural light and evaporative cooling. The simulation was conducted for 20 generations with 10 individuals each resulting in 200 phenotypes.
Certain observations were made in the pareto-front solutions. Due to the environmental criteria of minimising radiation, most of the pareto-front solutions exhibited longer faces along the north-south orientation. This orientation also supported the evaporative cooling criterion, as it relied on shaded facades for the assignment of rammed earth panels, thereby optimizing cooling efficiency. Furthermore, the existing surrounding buildings naturally provided shade to the east and west facades, which are typically exposed to intense sunlight. In solutions where the central courtyard was not enclosed by mass on all sides, the courtyard was oriented towards the north to reduce solar radiation while still allowing for the entry of natural light.
Fig. 366: Parallel Coordinate Plot : Rest House
Fig. 367: Standard Deviation Graph : Rest House
Sequential Simulation Analysis : Death Home
The sequential simulation was also carried out for the death home to evaluate the phenotypes for increased human comfort in terms of solar radiation, natural light and evaporative cooling. The simulation was conducted for 20 generations with 10 individuals each resulting in 200 phenotypes.
Certain observations were made in the Pareto-front solutions. Most of the solutions displayed a square-like aggregation geometry, typically oriented towards the southern part of the site. In these cases, the central courtyard was smaller, generally consisting of four voxels, and was enclosed by built mass on all sides. Given the sensitive nature of the function, the terraces were predominantly oriented inward to ensure privacy.
Fig. 368: Parallel Coordinate Plot : Death Home
Fig. 369: Standard Deviation Graph : Death Home
01: Minimise Radiation
02: Maximise Daylight
03: Max. Evaporative Cooling
Fig. 370: Weighed Pareto Front Solutions : Death Home
Weighted Selection Strategy
As a strategy for selecting the best performing phenotype, the fitness objectives were given weights with the maximum priority given to FO 03 : Maximise Evaporative Cooling, followed by FO 01: Minimise Solar Radiation followed by FO 02: Maximise Daylight. The top ten ranked phenotypes after weighing the fitness values were chosen for the structural optimization.
In the weighted selection, most of the phenotypes exhibited an east-west orientation, ensuring that these facades remained shaded due to the presence of existing context buildings, thereby reducing solar radiation from southern exposure. The central courtyards showed the selection of at least five or more voxels, designed to increase the amount of daylight penetrating into the habitable spaces. While the terracing followed the adjacency logic established in Simulation 01, it was also observed that the staggered terraces in all the Pareto-front solutions enhanced daylight entry. The terracing predominantly extended outward, fostering a dialogue with the surrounding context, which aligns with the experiment’s overarching intent.
Fig. 371: Weighted Fitness Criteria Selection
Fig. 372: Weighed Pareto Front Solutions : Rest House
Post Analysis Appendix IV
Cell Types : FE Analysis
Kit-of-Parts: Single Cell (3600x3600x3600mm ht.)
Displacement 146mm
Displacement 35mm
The kit-of-parts for the cell typologies was evaluated through Finite Element Analysis (FEA) as part of a postanalysis process, independent of the larger aggregation, to determine the most optimized cross-section sizes for the columns, beams, and tension rods. The analysis aimed to assess the displacement behavior of these structural components when exposed to identical load conditions, allowing for the selection of the most efficient cross-sections for each cell type.
A single cell with overall dimensions of 3600x3600x3600mm was analyzed for three different crosssectional sizes of its columns, beams, and tension rods. The results recorded maximum displacements of 146mm, 35mm, and 26mm for the varying configurations. The cell config-
Displacement 26mm
-uration with the least displacement of 26mm was selected, featuring columns with cross-sections of 100x100mm, beams with dimensions of 100x300mm, and tension rods with a 25mm diameter. These crosssections were optimized for a 30KN load, ensuring minimal deformation and structural integrity under applied forces.
Following this analysis, the selected single-cell configuration was applied to the overall aggregation, ensuring that the most structurally sound and efficient dimensions were implemented across the entire system. This process not only optimized performance but also contributed to the stability and durability of the assembled modular structure.
Fig. 373: FE Analysis - single cell
Kit-of-Parts: Double cell (3600x7200x3600mm ht.)
Displacement 1870mm
Displacement 930mm
A double cell with overall dimensions of 3600x7200x3600mm was analyzed for three different crosssectional sizes of its columns, beams, and tension rods. The results recorded maximum displacements of 1870mm, 930mm, and 580mm for the varying configurations. The cell configuration with the least displacement of 580mm was selected, featuring columns with cross-sections of 100x100mm, beams with dimensions of 100x300mm, and tension rods with a 25mm diameter. These cross-sections were optimized for a 30KN load, ensuring minimal
Displacement 580mm
deformation and structural integrity under applied forces.
Following this analysis, the selected double-cell configuration was applied to the overall aggregation, ensuring that the most structurally sound and efficient dimensions were implemented across the entire system. This process not only optimized performance but also contributed to the stability and durability of the assembled modular structure.
A quadruple cell with overall dimensions of 3600x7200x3600mm was analyzed for three different crosssectional sizes of its columns, beams, and tension rods. The results recorded maximum displacements of 2200mm, 776mm, and 409mm for the varying configurations. The cell configuration with the least displacement of 409mm was selected, featuring columns with cross-sections of 100x100mm, beams with dimensions of 100x300mm, and tension rods with a 50mm diameter. These cross-sections were optimized for a 30KN load, ensuring minimal
Displacement 409mm
deformation and structural integrity under applied forces.
Following this analysis, the selected quadruple-cell configuration was applied to the overall aggregation, ensuring that the most structurally sound and efficient dimensions were implemented across the entire system. This process not only optimized performance but also contributed to the stability and durability of the assembled modular structure.
Fig. 375: FE Analysis - quadruple cell
Aggregation: Phenotypes
Typology: Rest House
Displacement 523mm
Displacement 958mm
Following the analysis of the cell typologies, the selected cells with their respective structural member sizes were applied to the weighed pareto-fronts for both the rest house and death home typologies to determine the configuration with the minimum displacement. Each of the three weighed pareto-front individuals for both typologies underwent Finite Element Analysis (FEA) to assess their structural behavior under varying load conditions.
For the rest house typology, maximum displacements of 523mm, 958mm, and 1550mm were recorded under different load scenarios. The pareto-front individual ranked 3 (gen 2; ind 2), which exhibited the least displacement of 523mm, was selected and analyzed further under a 44KN load.
Displacement 1550mm
Fig. 376: FE Analysis - rest house
Typology: Death Home
Displacement 729mm
Displacement 757mm
Similarly, the analysis was repeated for the death home typology, where displacements of 729mm, 757mm, and 205mm were recorded. The pareto-front individual ranked 5 (gen 9; ind 19), with a displacement of 205mm, was chosen for further analysis under a 29.5KN load.
It was observed that when the cells were aggregated, they exhibited lower displacements compared to their behavior as individual cells. This finding demonstrated that the most optimized individuals for both the rest house and death home typologies achieved a balanced ratio of single, double, and quadruple cells, which contributed to overall stability and structural efficiency in the system.
Displacement 205mm
Fig. 377: FE Analysis - death home
Post Analysis
Daylight Analysis Radiation Analysis
A daylight analysis was conducted on the final phenotypes of the rest-house and death home. Although the fitness criteria utilised occlusion as a system to evaluate daylight, an accurate study was conducted using Honeybee Radiance tools. A 30 degree angle was chosen for the pivot panels as well as the sliding folding panels for the study. A threshold of 150 lux was used for both phenotypes and the daylight autonomy levels indicate the percentage of annual hours that the space receives equal or more daylight than the threshold value.
A solar radiation analysis was conducted using Ladybug tools to evaluate the impact of design decisions on solar exposure. The findings revealed that, with the exception of the open-to-sky terraces, the design effectively reduced solar radiation in the majority of habitable spaces. As in the daylight analysis, the study employed a 30-degree angle for both the pivot panels and the sliding folding panels, further demonstrating the impact of these features on solar mitigation.
Fig. 378: Daylight Analysis
Fig. 379: Radiation Analysis
Rest House
Rest House
Death Home
Death Home
Computational Fluid Dynamics
A Computational Fluid Dynamics (CFD) analysis was performed on the final phenotypes to assess the effects of the intervention on wind flow. The experiment utilized an input velocity of 4 m/s from the west and a temperature of 38°C as initial conditions. The results indicated increased turbulences in the courtyard spaces and increased wind velocity around the intervention and the surrounding context, thereby enhancing overall airflow. The central courtyard
exhibited low wind velocity (1 - 1.5m/s) but experienced increased turbulence, while the elevated terraces showed higher wind speeds (2 - 2.4m/s).
Fig. 380: CFD Analysis of Death Home Morphology
Fig. 381: CFD Analysis of Resthouse Morphology
Social Interaction
The above diagram illustrates the simulation for social interaction conducted on the chosen phenotype for the rest house. The social score achieved was 84%
Using the H.I.V.E plugin for Grasshopper, a social interaction simulation was performed on the selected phenotypes of both interventions, running 1000 iterations in the zombie solver model. The occupancy load was set at 12.5 sq.m per person. The categories of occupants differed between the proposals, affecting their walking speeds and waiting times.
The above diagram illustrates the simulation for social interaction conducted on the chosen phenotype for the death home. The social score achieved was 14%
The network curves used in the simulation were the centerlines of all verandahs, which were connected to points representing the open courts. These courts were designated as halt points with varied waiting times. The social score for the Rest House was 84%, which met expectations, while the score for the Death Home was 14%, aligning with the objective of enhancing privacy.
Rest House Death Home
Fig. 382: Social Interaction Simulation : Rest House
Fig. 383: Social Interaction Simulation : Death House
Appendix V
The above diagram illustrates an isometric cut view of the ground floor of the rest house. The circulation and habitable spaces can be observed along with their interior layouts indicating the feasibility of the space.
Fig. 384: Isometric View : Rest House Ground Floor
The diagram illustrates an isometric cut view of the first floor of the Rest House. In addition to the designated open courts, it is evident that voxels without assigned spatial requirements enable the top slab of the voxel below to function as additional open courts.
Fig. 385: Isometric View : Rest House First Floor
The diagram presents a cut view of the second floor, highlighting the dynamic interaction between built and open spaces. It is evident that open courts are accessible for all the dormitories.
Fig. 386: Isometric View : Rest House Second Floor
The diagram illustrates a cut view of the third floor of the Rest House. This floor accommodates the library, the communal kitchen with seating, and a multi-purpose hall that can be divided into two separate halls.
Fig. 387: Isometric View : Rest House Third Floor
The floor plan indicates the central courtyard surrounded by all the habitable spaces including the entrance lobby and reception, large and small dormitories along with spaces for services and utilities.
The floor plan indicates the first floor mostly occupied by large and small dormitories. Each dormitory houses space for sleeping, toilets and showers along with a private kitchen.
Fig. 388: Rest House : First Floor Plan
Fig. 389: Rest House : Ground Floor Plan
The floor plan indicates the second floor which like the first floor is occupied by large and small dormitories.
The floor plan shows the third floor, which includes the kitchen, library, multi-purpose hall, and small dormitories.
Fig. 390: Rest House : Second Floor Plan
Fig. 391: Rest House : Third Floor Plan
Appendix VI Machine Learning
Future Predictions
The initial site selection process was extensive with multi layered analyses, resulting in a series of land parcels, or ‘patches,’ ranked based on a scoring system. The dissertation focuses on interventions at the selected site for morphology experiments. This research further extends to address the subsequent land parcels from the ranked lists as points of opportunity, utilising machine learning.
The morphological experiment was conducted on the site ranked as ‘1.’ For the machine learning experiment, the sites ranked at positions ‘2’ and ‘3 in the last analysis which was the CFD, were chosen.
392: Part of Zone 2 containing the ranked sites
The diagram illustrates the part of Zone 2 that contains three sites shortlisted after the CFD analysis from site selection process
Fig.
Fig. 393: Ranked land parcels of site through CFD analysis
Computational Fluid Dynamics analysis was the last step of the site selection process. The land parcels of the site were ranked based on performance and are considered as the next in line points of opportunity for intervention through machine learning.
COURTYARD SEARCH SPACE
The Artificial Neural Network (ANN) model, which incorporates three genes or parameters used in the morphology MOEA experiment to achieve the optimized phenotype from previous experiments. The values of these specific genes, determined by the Pareto fronts, are fixed, while the remaining genes are allowed to vary, generating different iterations.
Gene 01: Establishing the Search Space
Gene 02: Controlled Demolition
Gene 03: Centralised Courtyard
Fig. 394: Artificial Neural Network
The fitness values of the 230 pareto fronts generated after first simulation were used as training inputs along with the three fixed genes and the remaining genes were outputs.
The machine learning experiment was conducted using the Machine Learning Tools provided by Proving Grounds under LunchBoxML. The fitness values of the Pareto front solutions were remapped based on their upper and lower limits. The first three genes, which control the building’s search space or start point, the demolition of the existing fabric, and the centralization of the courtyard, along with the fitness values, were set as the training inputs. The remaining genes were used as the training outputs.
The Neural Network model requires a normalisation of the values, thus, it is important that for each step, the values were remapped onto a target domain of 0.00 to 1.00. The trained network then used the three genes as testing inputs to generate solutions for the sites identified as the next-in-line points of opportunity. These gene values are fixed within the domain that is decoded from the pareto front solutions of the MOEA The resulting neural network output values are then remapped back to the actual values to generate the iteration.
Each iteration updated the Zone 2 network by altering its centrality in terms of Betweenness, creating the next points of opportunity and establishing a feedback loop.
Fig. 395: Pareto Front Solutions from Stage I (Appendix II)
396: Machine Learning iterations for Site at Rank ‘2’
The above diagrams illustrate the resulting iterations of machine learning using the Artificial Neural Network method. The three genes pertaining to building placement, demolition and centralisation of courtyard along with the fitness values of the pareto fronts are used as training input while the remaining genes are training outputs.
Fig.
Fig. 397: Machine Learning iterations for Site at Rank ‘3’
The genes that are used as training inputs are fixed up to a value that lies between the narrowed domain that is decoded from the pareto front solutions of the MOEA. These become the values that are used as testing data to get the neural network output.
Rank ‘3’
Appendix VII
Matrix for Pedesitrian Simulation
Fig. 399: Table depicting the data used for the agents for the pedestrian simulation using H.I.V.E
Fig. 398: Table depicting the data used for the pedestrian simulation using H.I.V.E