CONCRETE SURFACES
Concrete Acoustic Surfaces through repetitive slip-form Casting
|
EMERGENT TECHNOLOGIES AND DESIGN 2010| 2011
Architectural Association School of Architecture
|
|
Alkistis-Georgia Karakosta [MSc]
Georgios Papadogeorgakis [MSc]
Nicholas Leguina [MArch]
Sherwood Wang [MArch]
To 2010| 2011 Em Tech students
CONCRETE SURFACES
01.3. Scale 03................................................................................................54 Formwork 03........................................................................................55 Formwork mixing experiments Plastic Fibres................................................................................56 Wood Fibres.................................................................................58 Polystyrene Pellets....................................................................60 Spacers 03.............................................................................................62 Flexible Formwork Casting process.............................................64 Flat Casting process...........................................................................68 Catalogue| Conclusions....................................................................70 01.4 Conclusions 02. ACOUSTICS Fundamentals of sound..............................................................................76 Absorption| Reflection| Refraction 02.2 Local scale..............................................................................................82 Perforation patterns.....................................................................................84 Catalogue...............................................................................................88 Frequency input.............................................................................................92 Catalogue..............................................................................................98 Ratio input.....................................................................................................104 Catalogue............................................................................................108 Conclusions...................................................................................................114
Table of Contents ABSTRACT...........................................................................................................1 00. INTRODUCTION Thesis Statement ..................................................................................3 Method......................................................................................................3 Domain| Precedents| Contemporary Practices..........................4 01. FABRICATION Introduction.......................................................................................................9 01.1. Scale 01..................................................................................................12 Formwork 01........................................................................................13 Spacers....................................................................................................14 Trial 01.1.................................................................................................16 Trial 01.2.................................................................................................18 Trial 01.3.................................................................................................19 Trial 01.4.................................................................................................20 Trial 01.5| Casting method...............................................................22 Trial 01.6| Catsing method...............................................................26 Catalogue| Conclusions....................................................................28 01.2. Scale 02.................................................................................................30 Formwork 02........................................................................................31 Spacers 02.............................................................................................32 Trial 02.1.................................................................................................36 Trial 02.2.................................................................................................37 Trial 02.3.................................................................................................38 Trial 02.4.................................................................................................40 Trial 02.5| Casting method...............................................................42 Trial 02.6| Casting method...............................................................48 Catalogue| Conclusions....................................................................52 02.3 Acoustic test......................................................................................118 Trial 03.1a...........................................................................................120 Trial 03.2a...........................................................................................122 Trial 03.3a...........................................................................................124 Trial 03.4a...........................................................................................126 Trial 03.1b...........................................................................................128 Trial 03.2b...........................................................................................130 Trial 03.73b.........................................................................................132 Trial 03.4b...........................................................................................134 Sound evaluation.............................................................................136 Catalogue............................................................................................138 02.4 Global Scale........................................................................................140 Phase I: frequency............................................................................142 Catalogue...............................................................................149 Phase II: frequency..........................................................................160 Catalogue...............................................................................166 Mapping..............................................................................................172 Conclusions............................................................................176 03. OVERALL CONCLUSIONS ................................................................180 REFERENCES AND APPENDICES............................................................182
ABSTRACT
Conventional methods of jump-form casting restrict variability in forms that can be produced due to the rigidity of the formwork. Jump-form concrete casting will be explored through the use of variable modular formwork in the design of a shell structure. Variations within this method will be investigated through flexible formwork. Increasing variation of castable forms allows for localized specificity in the response to environmental conditions such as light and sound. Methods will include a dialogue between iterative fabrication experiments and geometrical development. Alternative materials for formwork will be explored to inform achievable geometries that are tuned for acoustic phenomena. Through discrete repetitive casting, a continuous surface will be formed.
Keywords: Acoustics, Concrete Casting, Reusable Formwork, Flexible Formwork, Modular Formwork, Jump-Form Casting, Surface Variation, Environmental Response, Ganged-Form Casting
1 Abstract
2 Introduction INTRODUCTION
00. INTRODUCTION
Thesis Statement
Contemporary practices for forming concrete are currently undeveloped in the way that conventional formwork only allows for the production of a single form. This method of casting leads to either a small degree of variation of casted forms or many sets of formwork which demands more material. These critical issues become exaggerated in the design of largescale concrete projects. An investigation into how a variable modular formwork could create differentiated forms using flexible formwork will be taken to address the problems occurring in conventional methods of concrete casting technologies. The research will be applied to the design of a large shell structure specifically tuned to environmental conditions.
Method
Areas of study will take place involving geometrical investigations for variable surfaces that can be attained from a reduced number of formwork. Current technologies for concrete casting will be researched and evaluated in order to develop an improved system for our application. Studies in connection techniques and specified surfaces will be taken with regards to environmental response. Analysis of the design will involve the variability within the system of casting, and the variability to environmental conditions.
3
Introduction| Thesis Statement_ Method


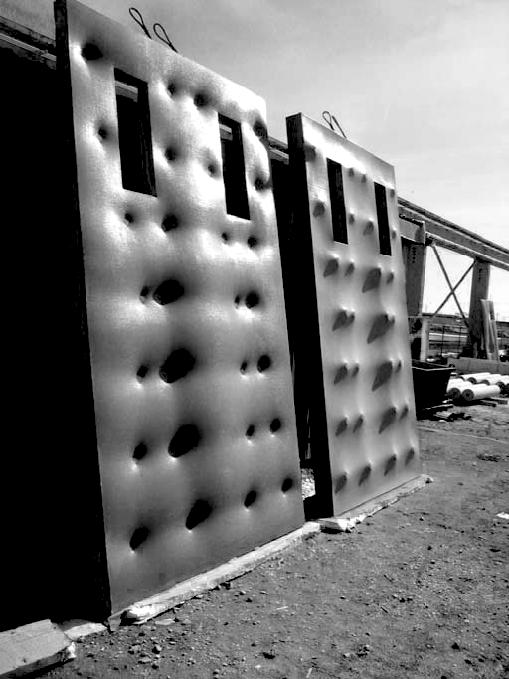
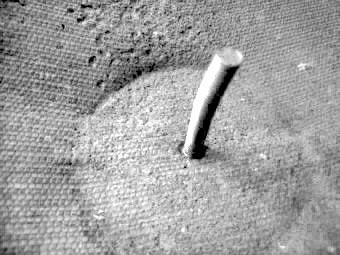
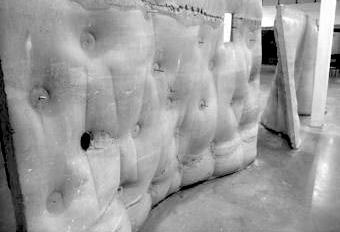
The study of flexible formwork in current technologies are most commonly within the realm of fabrics. The concrete forms created from fabrics such as the work from C.A.S.T. in Canada and Alan Chandler from the University of East London reveal globally curved geometries that are related to the stresses created by the reciprocal relationship between the liquid state of the concrete and the deflection of the fabric under the load of the concrete.
In their work, geotextiles were used for their durability such that the same fabric can be reused in several different moulds (West, 6).
What is created in both the work of C.A.S.T and Alan Chandler is a prefabricated architectural panel. The inherent issues within prefabrication limit the size, shape, and weight of the panel. There is also a reliance on an external system to connect the panels together.
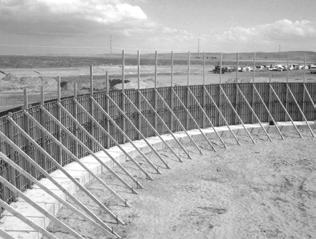
As an alternative, research into different forming techniques of concrete in the architectural scale includes reusable formwork in the area of jumpform casting, where large monolithic sections of concrete are created through incremental casted sections. However, this method in modern practice creates little variation. In the coupling of flexible formwork and jump-form casting techniques it is thought to create a system without the limitations imposed by transportation.
4 Introduction| Domain
01. 02. 03.
Domain
01. Series of images showing the process of casting with geotextiles (West)
02. Image of resultant concrete panel (West)
03. Series of images showing a concrete cast within fabric formwork (Chandler)

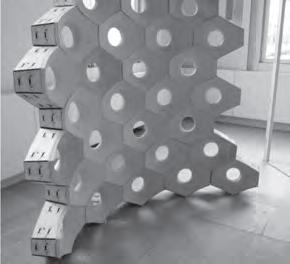
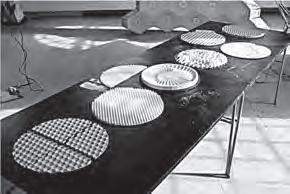
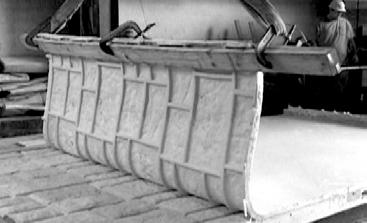
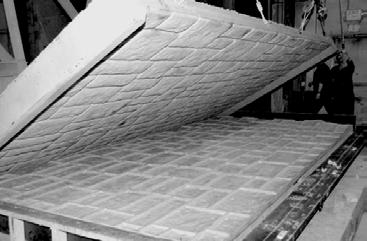
Within the forms created through their fabric formwork research, there are very few openings, resulting in a unporous and continuous panel.
An area unaddressed within their work which is engaged within our research is the ability to create a surface with a variable degree of porosity while also using a flexible reusable formwork.
When dealing with the porosity of a surface, it becomes apparent that the acoustic values of these surfaces are of great interest.
Acoustics in architecture has been explored through many different programmatic environments. The work of Brady Peters attempts at tuning architectural surfaces based on acoustics through a parametric process, where the geometry of the surface is created through a scripted logic.
This logic of local variation within a surface based on acoustics are similarly studied in the paper “Instant Sound Scattering” and the book “Manufacturing Parametric Acoustic Surfaces”. Within this research, the parametricization of
acoustics will be tethered to a developed jumpform casting process.
Alternative materials for flexible formwork, outside of geotextiles is a relatively unexplored realm. At a smaller scale, furniture is being created through the use of rubber molds, where intricate detailing and complex surfaces can be achieved with repetitive casting in a master mold.
The research is aimed at using this material as a flexible reusable formwork that can be used in a large scale with the tuning of the surface for acoustic behaviour.
01. Images showing the ganged-form casting process (www.handsetformwork.com/index. html)
02. Image showing the slip-form concrete process (http://www. wlport-land.com/ ExpSlip.xml)
03.-04. Images of parametric acoustics reserach by Brady Peters
05. Image showing the process of creating a concrete panel using polyurethane rubber (www.smooth-on.com)
5 Introduction| Domain
01. 05. 02. 03. 04.
6
7 FABRICATION

In Situ and Pre-Cast system comparisons
In Situ advantages
• flexible site-based processes and complex forms can be readily achieved (Stacey)
• small-scale to very large-scale structures can be created (Stacey)
• ready-mix industry can provide batching of the mix- sand, aggregates and cement- providing consistent colour and dependable performance characteristics (Stacey)
• large volumes of concrete can be safely pumpled into the formwork
• repetition and reusable formwrok is now common (Stacey)
In Situ disadvantages
• small variation of geometries require more types of formwork
• Quality control is more difficult due to external conditions
Pre-cast advantages
• excellent quality control (Stacey)
• precision moulds-a close control of tolerances (Stacey)
• the integration of details and services (Stacey)
• pre-tensioning (Stacey)
• large components which are simple and rapid to install (Stacey)
Pre-cast disadvantages
• the transportation of heavy components (Stacey)
• the size and shape of components can also be limited by transportation (Stacey)
• the form of precast components needs to be strickable (removability from mould) (Stacey)
• the need for repetition to amortise or limit the impact of the cost of the mould ((Stacey)
01. FABRICATION
Introduction
Concrete design offers flexibility in form generation unlike those of other construction techniques. Due to the process of concrete construction, an almost limitless variation of geometries can be achieved, where issues pertaining to common industrial standards limit the size and shape of forms created with other building systems. In addition, global resources for the ingredients of concrete are widely available, and it offers a relatively inexpensive material to utilize for the creation of architecture (Allen and Iano, 517). Considering the consumption of concrete is second only to that of water, research
regarding the intelligent implementation of concrete is of great importance (Allen and Iano, 517). An interesting and principal facet of concrete forming is it’s reciprocal relationship with an often invisible facet of concrete constructions, the formwork. In order to create concrete forms, the design of the formwork is crucial. From global geometries to surface textures, the formwork transcribes its properties into the form of the concrete cast. This relationship will be examined in the development of a reusable flexible formwork system in response to external environmental phenomena.
Current practices in concrete construction can be generally classified into two broad categories, on site (in situ) and precast concrete (Stacey, 33). The in situ process involves casting the concrete where the concrete will finally lie. With precast concrete, the concrete is cast off-site and delivered to the site to be installed. Each technique offers benefits and disadvantages, which must be considered during the design process, which is shown in the chart above.
9 Fabrication
Backing plate
Spreading Bars No geometric input
No geometric input
Spreading Bars
Backing plate
10 Fabrication Scale 01 Scale 02 Scale 03 Trials 02.1 - 02.3 Formwork Spacers Global Geometry Trials 02.4 Trial 02.5 Trial 02.6 Trials 01.1 - 01.4 Trial 01.5 Trial 01.6 Trials 03.1a & 03.1b Trials 03.2a & 03.2b Trials 03.3a & 03.3b Trials 03.4a & 03.4b
No geometric input
Flat Bulge Flat Bulge Flat Bulge Flat Bulge
The research in this document investigates areas within in situ casting to create a versatile formwork system that could reduce the quantity of wasted formwork while allowing variations in geometry. There are several methods that have been developed to reduce the costs through limiting the amount of waste created by the formwork within in situ techniques. The methods of interest are ganged-form casting, or jump-form casting, and slip-form casting.
In ganged-form casting, a series of reusable panels are erected to create the formwork for each cast, which creates efficiency in the time to create the formwork and reduces the quantity of wasted formwork. Slip-form casting is employed when creating large vertical elements. With this
system, slip-form systems climb the structure as the previously poured concrete cures below them (Allen and Iano, 586). In these systems, the formwork is often reusable, where the formwork and structure is designed in a way where repetitive uses of the same formwork is possible. What is addressed in the research is the creation of a continuous monolithic mass of concrete through repetitive casting of discrete sections.
The limitations of these systems, however are that the geometry is usually predefined with the geometry of each set of formwork. Variations in geometry within a concrete structure are often times limited to the number of different sets of formwork created. These limitations become exaggerated in projects with many geometric
variations, where the result can either be a large quantity of wasted formwork material because of minimal uses or forms that have reduced variations in geometries in order to minimize the quantity of formwork.
The research couples the fabrication process with criteria involving acoustic performance. Global geometry and surface porosity will be addressed to create an optimization criteria for an acoustic shell.
11 Fabrication
01. Exploded perspective of components that make up flexible formwork system.
The initial experiments were made using a system of gridded perforations. A grid of three by three perforations are located in the center which create perforations in the eventual form, with a system of external perforations which provide a method of sealing the edges of the formwork.
In order to create a pressure seal, threaded rods are run through the system of perforations so that the formwork could be clamped together using a washer/nut connection.
The aims of the first experiments were to test the formwork system such that each part of the formwork could be reused in multiple casts.
12 Scale 01
Fabrication| Scale 01
01.
Scale 01

Formwork 01
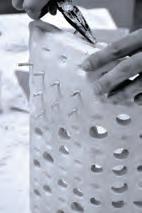
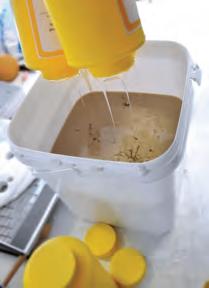
In order to achieve flexibilty in the formwork, a two part polyurethane rubber was chosen, produced by Smooth-On. Specifically, the Vytaflex 30 was used due to its flexibility and durability. A MDF mould was created with the use of a laser cutter. After assembling the mould, it was sealed using polyurethane sealant and sanded to a smooth finish. Before casting the rubber, the mould was sprayed with form release. The perforations within the rubber sheet were created with wooden dowels attached to the mould.
After a sixteen hour curing process, the polyurethane rubber sheet was removed from the mould with relative ease to become a flexible and durable formwork material.

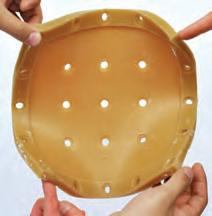
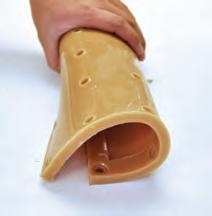
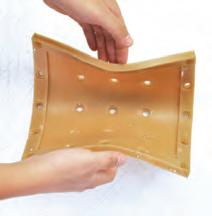
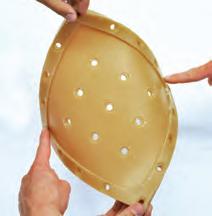
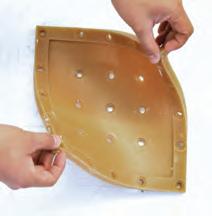
01. Liquid polyurethane is poured into a sealed laser-cut mould, where after curing for 16 hours will be removed.
02. Illustrated in the pictures is the flexibility of the polyurethane rubber, which allows a large degree of curvature for individual casts.
13 01. 02.
A A c1c2 c1 c2 c1 c2 c1 c2 c1c2c1c2 c1 c2 c2 c1 B B c1 c2 c2 c1 FORMWORK_01
Fabrication| Scale 01| Formwork 01
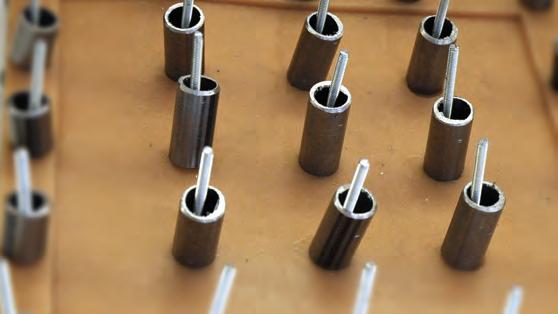
01. Steel spacers with threaded rod clamps
02. Detail of deteriorating edges from initial tests.
03. Digital catalogue of different spacers that were cast.
04. Image showing the silicone spacers’ position within the formwork.


14 A c1 c2 c1 c2 c1 c2 c1 c2 c2 c1 B B c1 c2 c2 c1 FORMWORK_01 03.
01. 02. Fabrication| Scale 01| Spacers
04.


Spacers 01_1| 01_2
Initially, round hollow steel tubes were used as spacers that would define the thickness and porosity of each cast. The steel tubes were cut into differing depths in order to achieve different thicknesses.
After evaluating the difficulties of the initial casting experiments, which are explained in the coming section, a system of casted silicone rubber spacers were eventually created in order to manipulate the geometry of the spacer and also to ease their removal after the cast has cured.
15 A A c1c2 c1 c2 c1 c2 c1 c2 c1c2c1c2 c1 c2 c2 c1 B B c1 c2 c2 c1 FORMWORK_01
01.
02.
Fabrication| Scale 01| Spacers
01. Silicone spacer types that were cast
02. Degree of detail of the silicone spacers that is transfered into the cast
16
A c1 c2 c1 c2 c1 c2 c1 c2 c2 c1 B B c1 c2 c2 c1 FORMWORK_01 Fabrication| Scale 01| Trial 01.1
01.
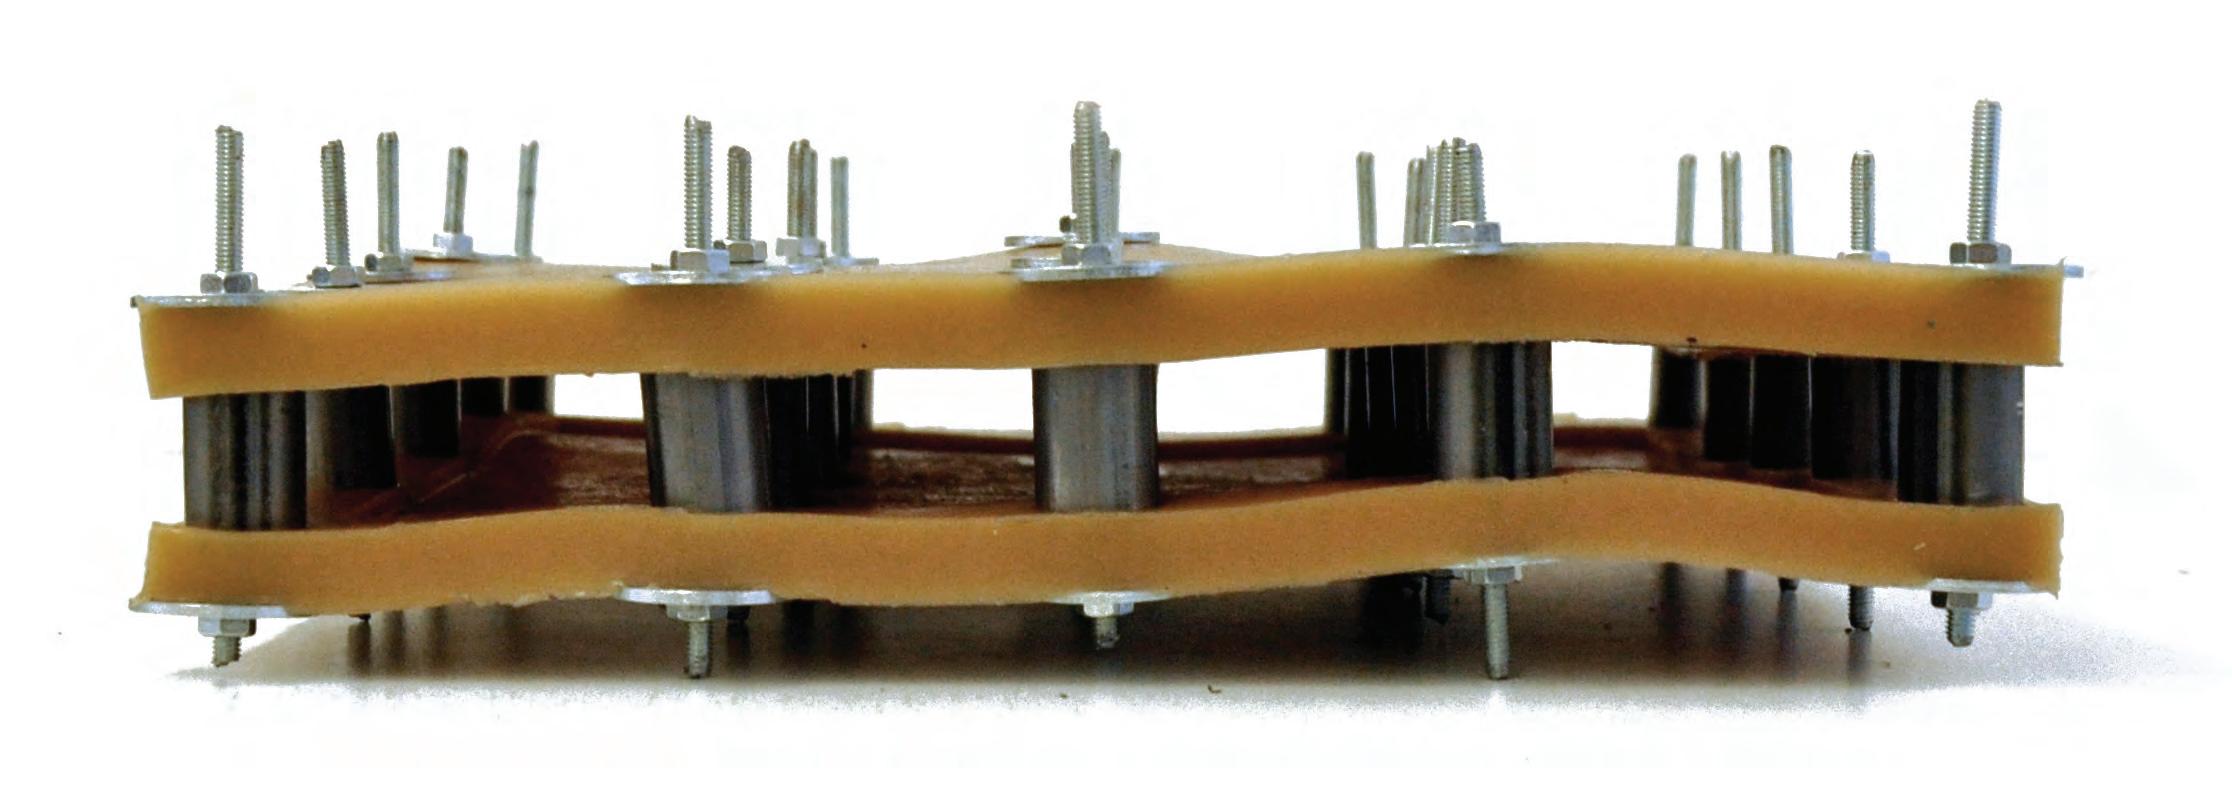
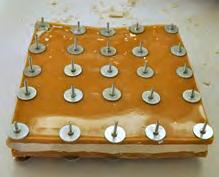
01. Image of assembled formwork showing the layers with steel spacers.
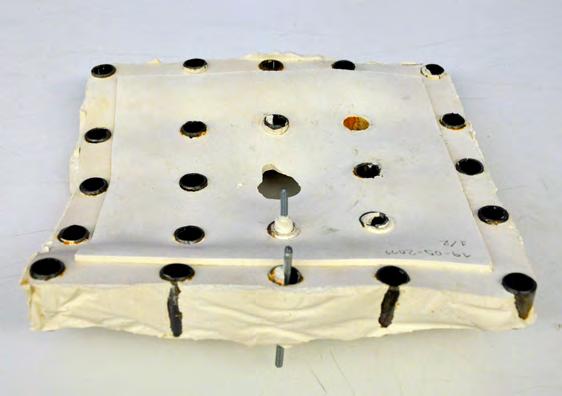
The first two experiments tested casting methods using pottery plaster because of the small scale of the formwork and a similar but much more rapid curing behaviour of the plaster.
The result of trial 01.1 demonstrated the successful creation of a perforated casted mass. There were numerous faults in the first cast that will be addressed in later experiments.
Upon removing the formwork from the cast, there were difficulties in removing the steel spacers. This is due to the rigidity of the steel spacer, which once being surrounded by casted material, did not offer the malleability to remove them.
The steel spacers also did not provide a reliable seal for the two sides of the formwork, where very often, the casting material would fill the interior of the steel spacer.
Another issue was with the edging. The steel spacer edging with an external covering was unreliable in creating a watertight seal. There was significant leaking problems during curing. Upon de-casting the formwork, the edges of the cast suffered much deterioration due to the thinness of material near the perforations.
The perforation at the center of the cast was also unexpectedly irregular. Instead of creating a uniform larger perforation, the perforation was only slightly larger than the steel spacer while also not being a uniform shape, due to irregular pressures around the cast.
17 01. A A c1c2 c1 c2 c1 c2 c1 c2 c1c2c1c2 c1 c2 c2 c1 B B c1 c2 c2 c1 FORMWORK_01 Fabrication| Scale 01| Trial 01.1
Trial 01.1
01. Image of the first test trial, revealing the problems of edgings and steel spacers
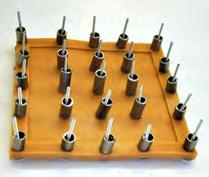
01. Images showing the orientation of the hollow steel spacers.
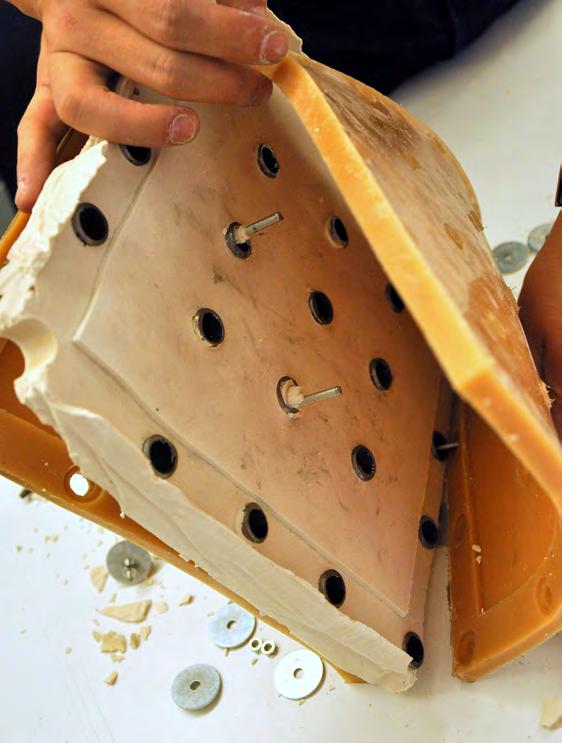
02. Image during the removal of the formwork, where the edges began to deteriorate and the unreliable seal of the steel spacers.
Trial 01.2
Trial 01.2 repeated the process of trial 01.1.
However, instead of pinching the formwork at the center, a steel spacer was inserted to create more depth to resist deterioration and irregularities. Steel washers were used on the exterior of the formwork to create a compression plate so that the steel spacer had a rigid surface to seal against.
The result of this test showed a slight improvement in sealing the steel tube. However, there were still issues with creating a watertight seal. The steel spacers were still difficult to remove after being casted. The edges still suffered much deterioration while being uncast.
18
01.
02.
A c1 c2 c1 c2 c1 c2 c1 c2 c2 c1 B B c1 c2 c2 c1 FORMWORK_01 Fabrication| Scale 01| Trial 01.2
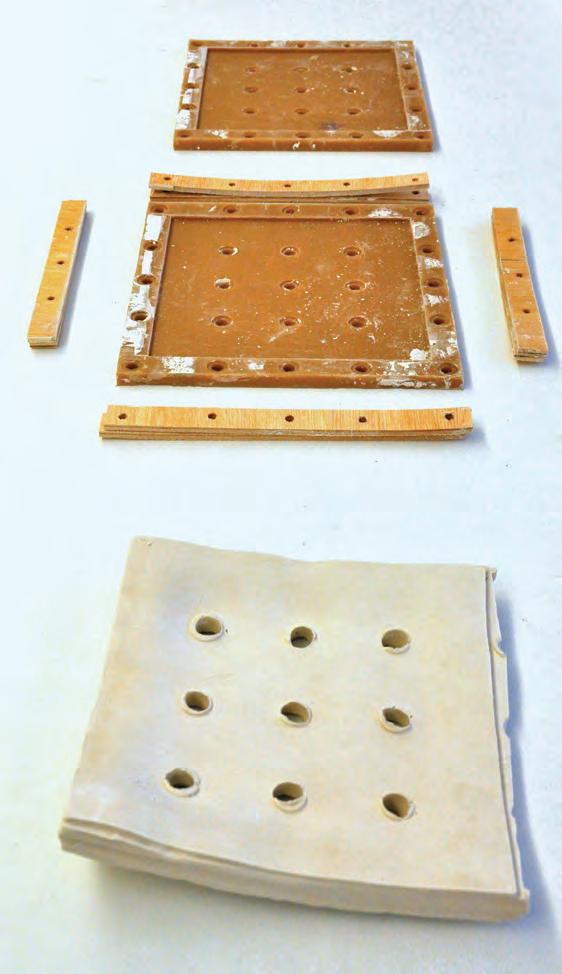
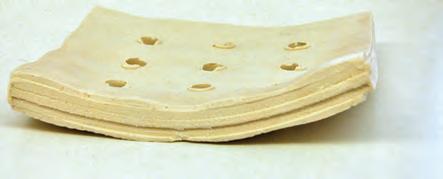
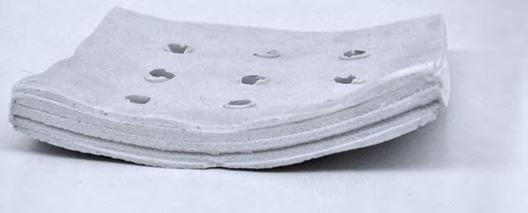
This experiment tested pliable plastic tubes to substitute for the steel spacers. This was done to facilitate the removal of the spacers. The spacer edging was replaced with plywood layers, stacked to the desired thickness of the cast. This eliminates the casted edging that was a result of the previous tests, which would make the overall cast smaller.
The result of trial 01.3 resolved several issues that occurred in previous tests. The pliable plastic tube was much more manageable in the removal process. The sealing of the tubes was also much more effective using the pliable material. However, the perforations suffered much more distortion because when tightening the compression rod, the tube would distort and crush in an unexpected manner. This created irregularities in the perforation surface.
The plywood edging was also much more effective at creating a more durable edge. There was also dramatically less leaking during the casting process. There was some issues with the plywood when trying to induce curvature into the form. The plywood was difficult to bend, especially when multiple layers were introduced.
19
01. 02. A A c1c2 c1 c2 c1 c2 c1 c2 c1c2c1c2 c1 c2 c2 c1 B B c1 c2 c2 c1 FORMWORK_01 Fabrication| Scale 01| Trial 01.3
Trial 01.3
01. Image of the flexible formwork system and layered plywood edging and the resultant cast
02. Image showing the edge of the cast where the layering of the plywood is transferred
01. Digital representation of different global geometries that can be achieved with a backing plate.
02. Digital model of the geometry that was used for the next trial.
20 02. 01. A c1 c2 c1 c2 c1 c2 c1 c2 c2 c1 B B c1 c2 c2 c1 FORMWORK_01 Fabrication| Scale 01| Trial 01.4
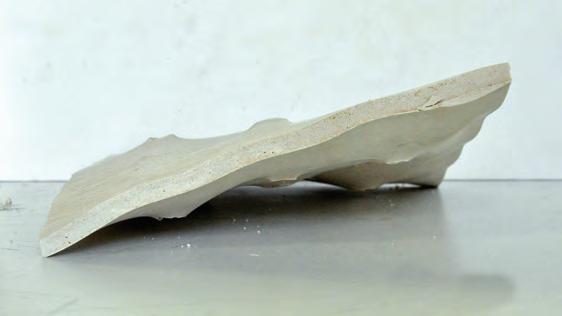
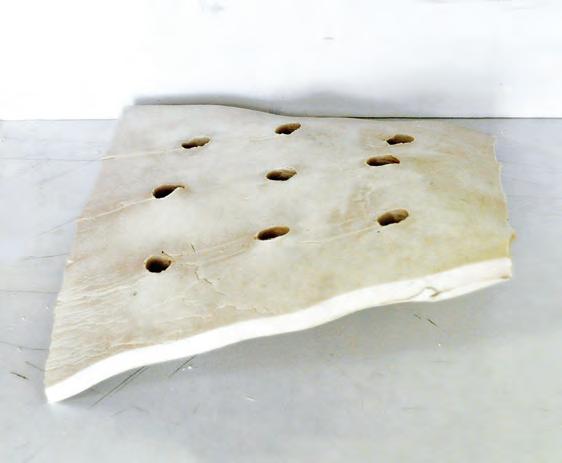
Trial 01.4
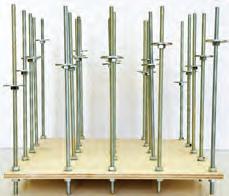
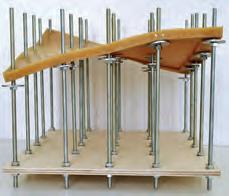
The next series of experiments tested methods of refining a global geometry with each cast. In trial 01.4, a control plate was created. The plate, made of plywood, has the same grid of perforations as the polyurethane sheets. The threaded rods creating the sandwich of the formwork is connected to the control plate. The overall geometry is then created through manipulating the formwork position in relation to the distance of each perforation to the control plate.
This test also introduces a second system of edging. Because of the difficulty in creating curvature using plywood edging, a pliable silicone rubber edging was cast. The silicone edging was much more pliable than the plywood while also being durable enough for repetitive uses. The plastic tubes were reused in this test for spacers.
The result of trial 01.4 proved successful in creating a controlled overall curvature with the discrete manipulation of the position of each perforation. The silicone edging was much more successful in creating a watertight seal while allowing flexibility for curvature. The same issues of irregular perforations as in trial 01.3 were still unaddressed in this test.


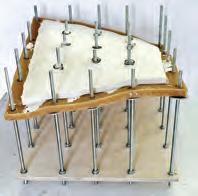


21 01. 02. A A c1c2 c1 c2 c1 c2 c1 c2 c1c2c1c2 c1 c2 c2 c1 B B c1 c2 c2 c1 FORMWORK_01 Fabrication| Scale 01| Trial 01.4
01. Images showing the resultant cast of this trial
02. Series of images describing the process of creating a cast using the backing plate
01. Image showing the spacer pattern within the flexible formwork system
02. Image showing the different types of spacers used within trial 01.5


22 01. 01. A c1 c2 c1 c2 c1 c2 c1 c2 c2 c1 B B c1 c2 c2 c1 FORMWORK_01 Fabrication| Scale 01| Trial 01.5

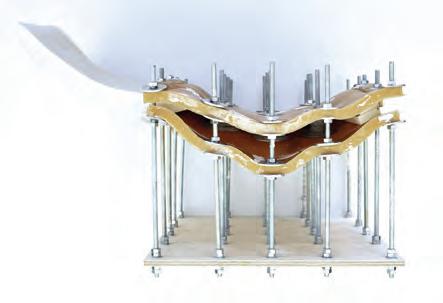
Trial 01.5
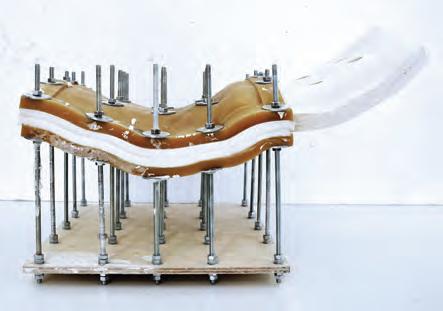
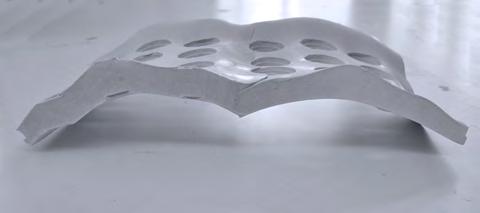
Due to the success of the silicone edging created in trial 01.4, the silicone was used in this trial to cast spacers for the perforations. Since the spacers would be cast, different geometries were created to create a variety of different types of perforations, which will later be informed by acoustic data.
In this experiment, jump-form casting was also tested using the control plate system.
The results of this experiment were the most watertight cast in relation to the previous tests with also a high degree of articulation transferred from the silicone spacers. The silicone spacers were very effective in transferring their geometry into the casted elements. The additional benefit of the silicone spacers is the ability to create a catalogue of perforation geometries that could be tuned for different acoustic behaviors.
The jump-form experiment was also successful in that it was able to create a single form from two repetitive casts. Some issues arose when performing this experiment. The control points in the formwork tended to plateau with the cast around the perforation becoming parallel to the control plate instead of the normal plane of the desired geometry. This was due to the compression rods maintaining a perpendicular angle with the control plate. This affected the continuity of the jump form, where the transition of curvature from one cast to the next would deform.
23 01. 03. 02. A A c1c2 c1 c2 c1 c2 c1 c2 c1c2c1c2 c1 c2 c2 c1 B B c1 c2 c2 c1 FORMWORK_01 Fabrication| Scale 01| Trial 01.5
01. Image showing two jump-formed cast
02. Image of detail transfer from silicone spacers to resultant cast
03. Series of images showing the formwork connection for jumpforming
01. Illustration showing the conceptual process of the jump-form system Fabrication| Scale 01
24 01. A c1 c2 c1 c2 c1 c2 c1 c2 c2 c1 B B c1 c2 c2 c1 FORMWORK_01
25 Fabrication| Scale 01
01. Illustrations of spreading bar system to create a global geometry.
26 01. A c1 c2 c1 c2 c1 c2 c1 c2 c2 c1 B B c1 c2 c2 c1 FORMWORK_01 Fabrication| Scale 01| Trial 01.6
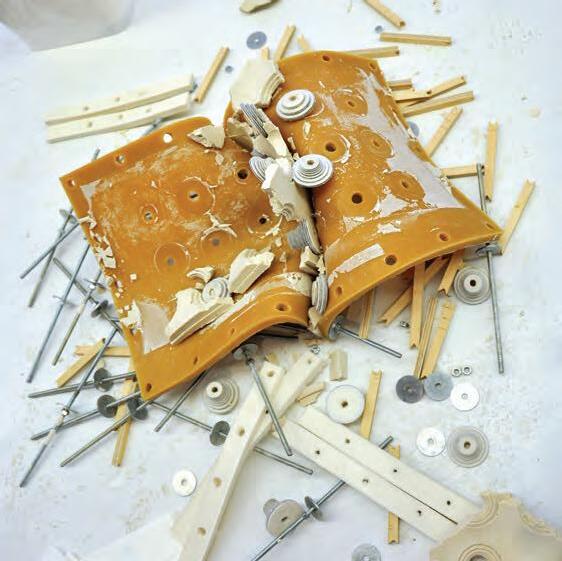
Trial 01.6
In Trial 01.6, the control plate used in previous experiments was replaced with a system of spreading bars. This was done to remedy the deformation resulting in using a planar control plate that was occurring in trial 01.5. The spreading bars were thought to lock each compression rod into position depending on the others around it. In this way, the global curvature is created through incrementally positioning each bar in relationship with the others around it. The spreading bars were cut into 3 different sizes. Depending on the amount of curvature, one bar was chosen. The position of each end of the bar was calculated through a script (Appendix E).
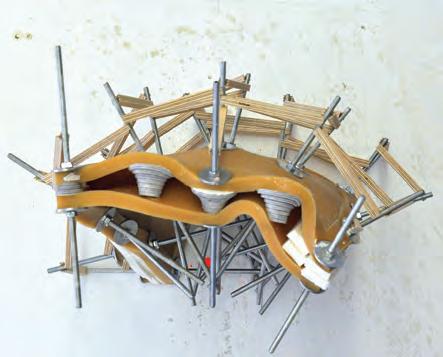
The result of this experiment was successful in allowing for the rotation of the compression rods. However, the time to create the formwork was dramatically increased. There were issues of compromises in accuracy due to the spreading bars dependence on neighbouring positions. Also, there was a lack of stability in the new framework. With so many different elements, it was difficult to create a rigid structure during the cast, which would lead to cracking of the cast during the curing process.

27 01. 02.
A A c1c2 c1 c2 c1 c2 c1 c2 c1c2c1c2 c1 c2 c2 c1 B B c1 c2 c2 c1 FORMWORK_01 Fabrication| Scale 01| Trial 01.6
01. Image showing the failure of this cast due to instability of the formwork during the casting process
02. Series of images showing the spreading bar system using defined lengths of spreading bars

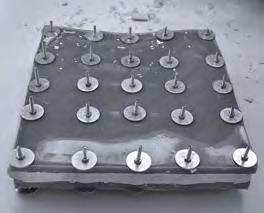
-Steel spacers are difficult to remove
-Steel spacers did not provide a reliable seal
-Deterioration of the edges
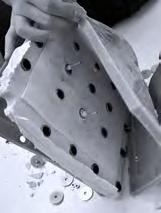
-Steel spacers are difficult to remove
-Steel spacers did not provide a reliable seal
-Deterioration of the edges
-Introduction of of wood edging
-More relaible water seal
-Pliable plastic tube spacer
-Little curvature
28 Scale 01 Formwork 01 Spacers 01_1| 01_2 Jump form Casting method 0| A| B A c1 c2 c1 c2 c1 c2 c1 c2 c2 c1 B B c1 c2 c2 c1 FORMWORK_01
Trial 01.1
Trial 01.2
Fabrication|
01|
Trial 01.3
Scale
Catalogue

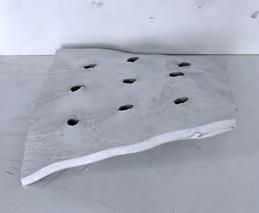


-Introduction of silicone rubber spacer
-Superior water seal
-Introduction of control plate
-More control over geometry
-Attempts to jump-form two casts
-Difficulties in jump-form due to inability to rotate threaded rod
-Deformation at joint
-Introduction of silicone spacers
-Able to create specific geometries
-Introduction of spreading bars
-Threaded rod is able to rotate
-Lack of stability
-Caused formwork to shift while curing, creating cracks leading to ultimate failure during removal of formwork
29
Trial 01.4
Trial 01.5
Fabrication| Scale 01| Catalogue
Trial 01.6
01. Exploded perspective of new formwork with a multiplcation of control and perforation points.
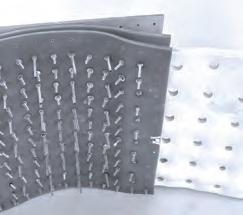
The second set of experiments was created using a grid of thirteen by thirteen rectangular perforations. The same polyurethane rubber was used for the rubber sheets. The aim of this experiment was to test the multiplication of control points in a single cast. Also, with this formwork, testing of different porosities was created by blocking some of the perforations.
In this set of experiments, the results of the previous set of experiments were implemented and further developed.
30
Scale 02 Fabrication| Scale 02
Scale 02
01.
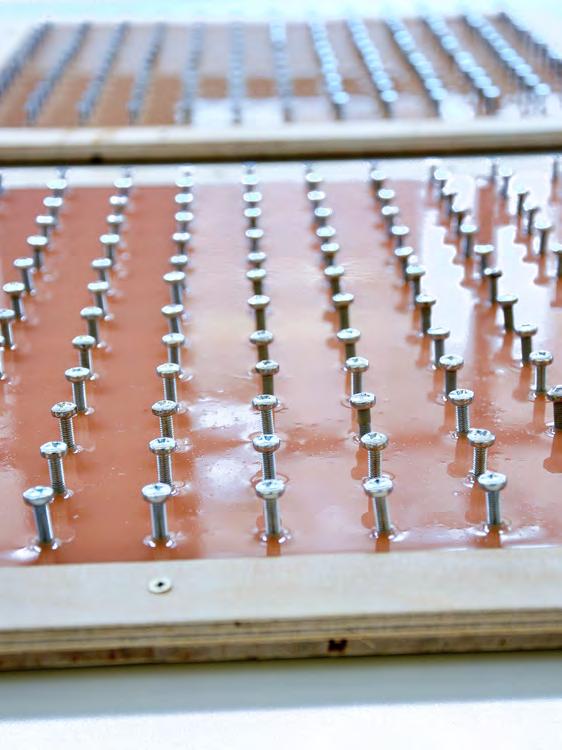
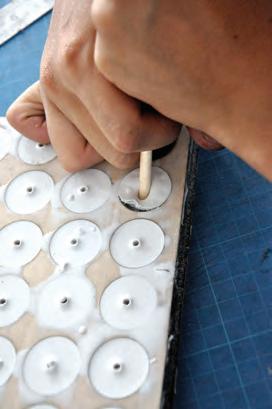
The mould for the second set of experiments was fabricated by creating a grid of thirteen by thirteen 5 mm diameter holes on a sheet of plywood. A plywood edge was attached to create the border of the mould. The mould was sealed using polyurethane spray and sanded to a smooth finish.
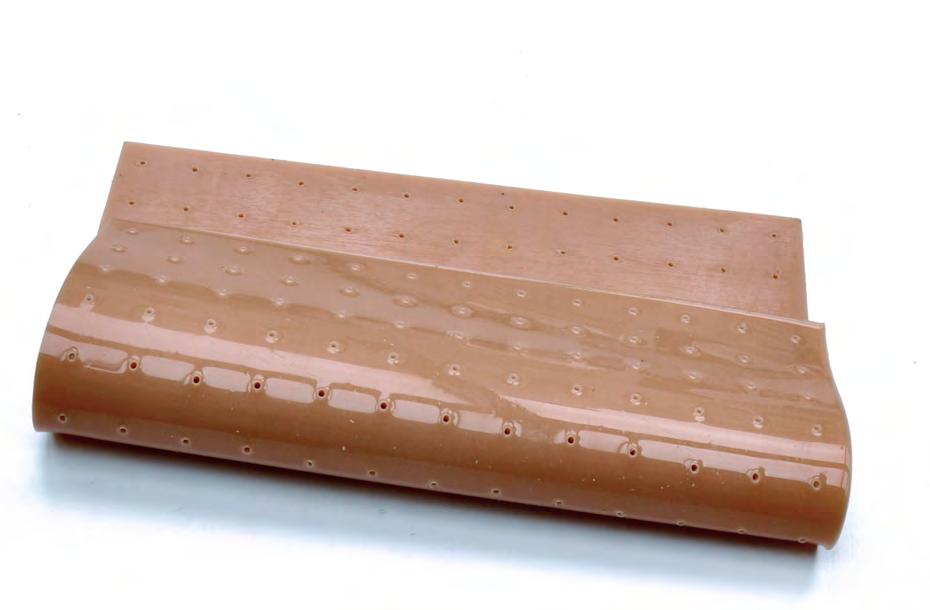
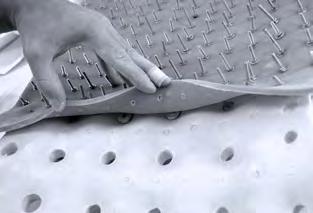
The perforations in the rubber sheet were created using 5 mm machine screws which were later removed after the polyurethane rubber had cured.
31 01.
c2 c2 B FORMWORK_02 Fabrication| Scale 02| Formwork 02
Formwork 02
01. Image of mould for the new formwork, wiht the perforations made by a grid of 5mm machine screws
02. Image of the polyurethane formwork sheet after removing froum mould
02.
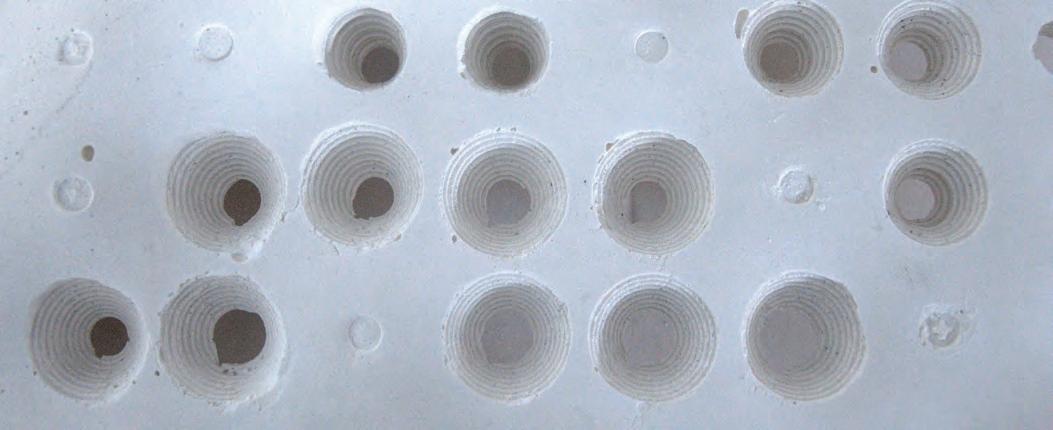
01. Categories of different geometries that can be created into silicone spacers.
02. Illustration showing the layering process of different radii to create a single spacer.
03. Image showing the geometrically varied spacers within the flexible formwork.

32 03. 01. 02. A A c2 c2 B B FORMWORK_02 Fabrication| Scale 02| Spacers
Spacers 02_1| 02_2
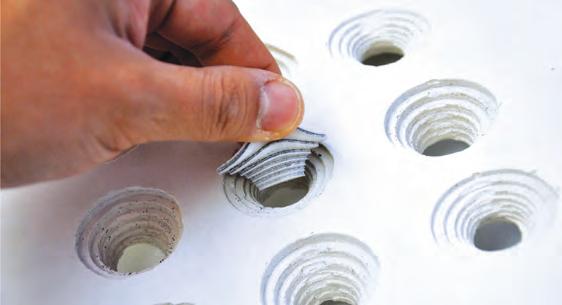
The spacers were developed through a process of layering thin sheets. Different radii circles are stacked in order to achieve varying geometries. 10 differently sized circles were used for the layering which were rearranged, multiplied, or subtracted to create variations in profile, depth, and width of each spacer.
The catalogue of different geometries that would be suitable for casting is shown below. Variations within these categories were also explored in the fabrication of the spacers.
The geometry of the perforations was studied for their acoustic effect in creating patterns in the concrete cast. A catalogue of different geometry types were created that would be viable in creating reusable spacers: cylindrical, conical, and hour-glass shapes (the mirror of the conical about the smaller diamter circle). There were also variations to these types, depending on the curve of the depth profile.
One important consideration when creating the geometry of the spacer is the removal after the casting process. The spacers must have a concave to straight profile so that the removal of the spacer is possible.
Elaboration of the two exterior faces was considered when developing the different spacers. In considering the removal of the spacers, there is the ability to utilize a division plane, where the cast could allow for geometrically different spacers to be coupled. In this way, the perforation geometry of one side of the cast could be differentiated from the opposite side.
33 03. 01. 02. c2 c2 B FORMWORK_02 Fabrication| Scale 02| Spacers
01.Illustration of the effect of a mirrored spacer on the two sides of the cast
02. Illustration showing the division plane that can be utilized in the cast
03. Image showing the resultant surface texture created by the new silicone spacers

34 Fabrication| Scale 02| Spacers

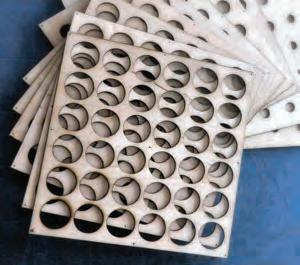
The silicone spacer moulds were created by cutting different radii circles in 1.5 mm plywood panels. The design of the sheets were such that they could be reused and rearranged for different geometries. Also, by creating a grid of circles, it reduces the time and facilitates the ease of creating multiple spacers using one mould. Depending on the desired geometry, the sheets were stacked and connected according to the different circle radii on each sheet.
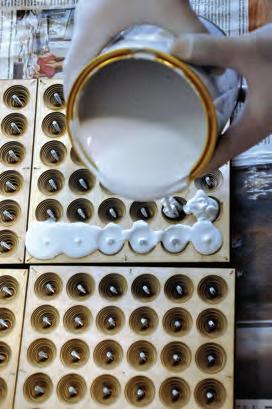
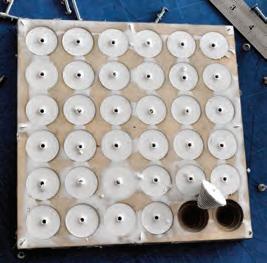
5 mm machine screws was inserted to each perforation of the mould in order to create a hole to allow the threaded rod to pass through. The silicone rubber was mixed with the catalyst and poured into the set of moulds, with the excess scraped away. After allowing to cure for eight hours, the hardened spacers were removed and the moulds were disassembled and reorganized into another geometry where the process is repeated.

35 c2 c2 B FORMWORK_02
Fabrication| Scale 02| Spacers
01. 02.
01. Image showing the different moulds for the silicone spacers
02. Series of images showing hte process of casting the silicone spacers using different sizes of radii that were layered
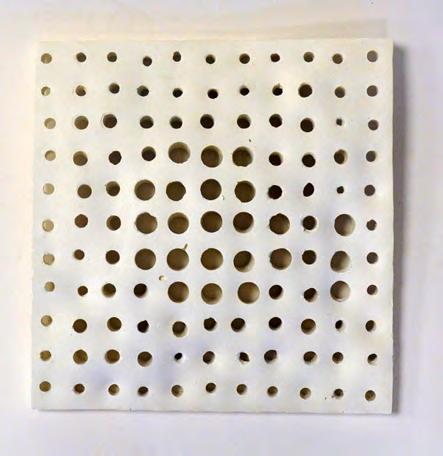
02. Image showing the trial cast using five different cylindrical silicone spacers.
03. Image showing the effects of light on the differing porosity created by the different spacer types.
Trial 02.1
The next series of experiments test different porosities of the cast through either blocking perforations or changing the size of the spacer.
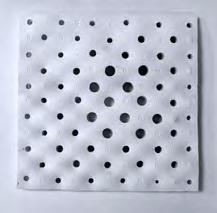
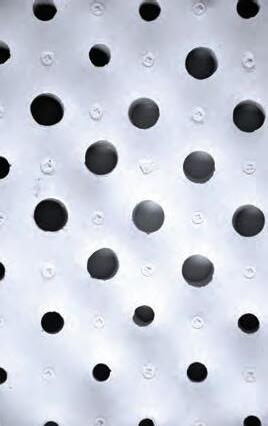
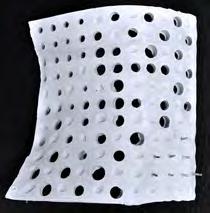
Trial 02.1 used five different radii of cylindrical spacers. The experiment had spacers on all perforations, creating a grid of full porosity. The spacer pattern was created with the largest cylinders placed at the centre of the formwork with a gradual decrease in the radii towards the perimeter. There was no attempt at creating an overall curvature.
The result of the experiment was successful in creating a varying porosity effect. There were minimal leaking problems. The time to assemble the formwork increased due to the multiplication of control points. The silicone rubber spacers were easily removable, and the cast suffered minimal deterioration during the removal of the formwork.

36
A A c2 c2 B B FORMWORK_02
02. 01. Fabrication| Scale 02| Trial 02.1
03.
01. Diagram of different perforation patterns

Trial 02.2
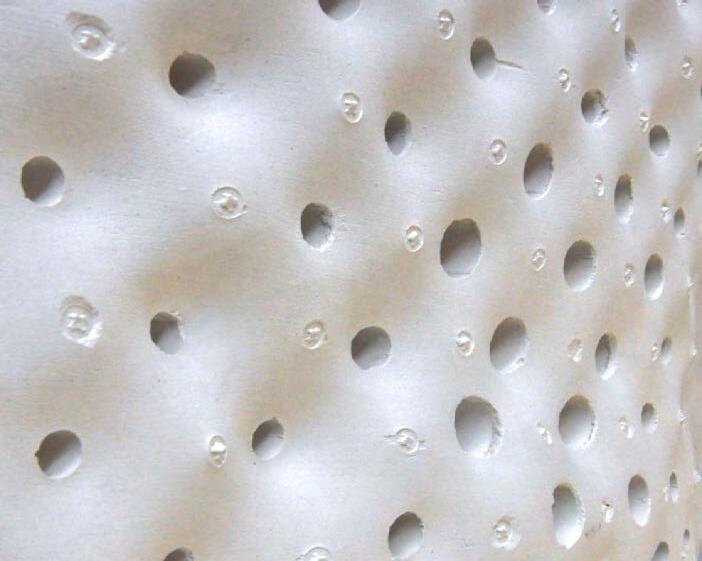
For trial 02.2, the porosity density was reduced in half. Every other control point was blocked in the grid. The same patterning with the larger cylinders in the centre while the smaller cylinders occupying the edges of the cast was repeated in this experiment
The result of the experiment was successful in creating a less porous cast. One observable result of the experiment is where the control point was blocked; there was pattern transference from the blocking mechanism. Another observable result of this experiment was that because the control points were reduced to half, the cast tended to bulge more in between perforations due to the hydrostatic pressure of the liquid during the pour.

02. Surface texture and bulging characteristics
03. Image showing the the overall casting experiment with a reduction in porosity through blocking perforations
37
c2 c2 B FORMWORK_02 01.
Fabrication| Scale 02| Trial 02.2
02. 03.
01. 5mm machine screws that were attached to flexible formwork to block the perforations in order to reduce the porosity
due to perforation blocking
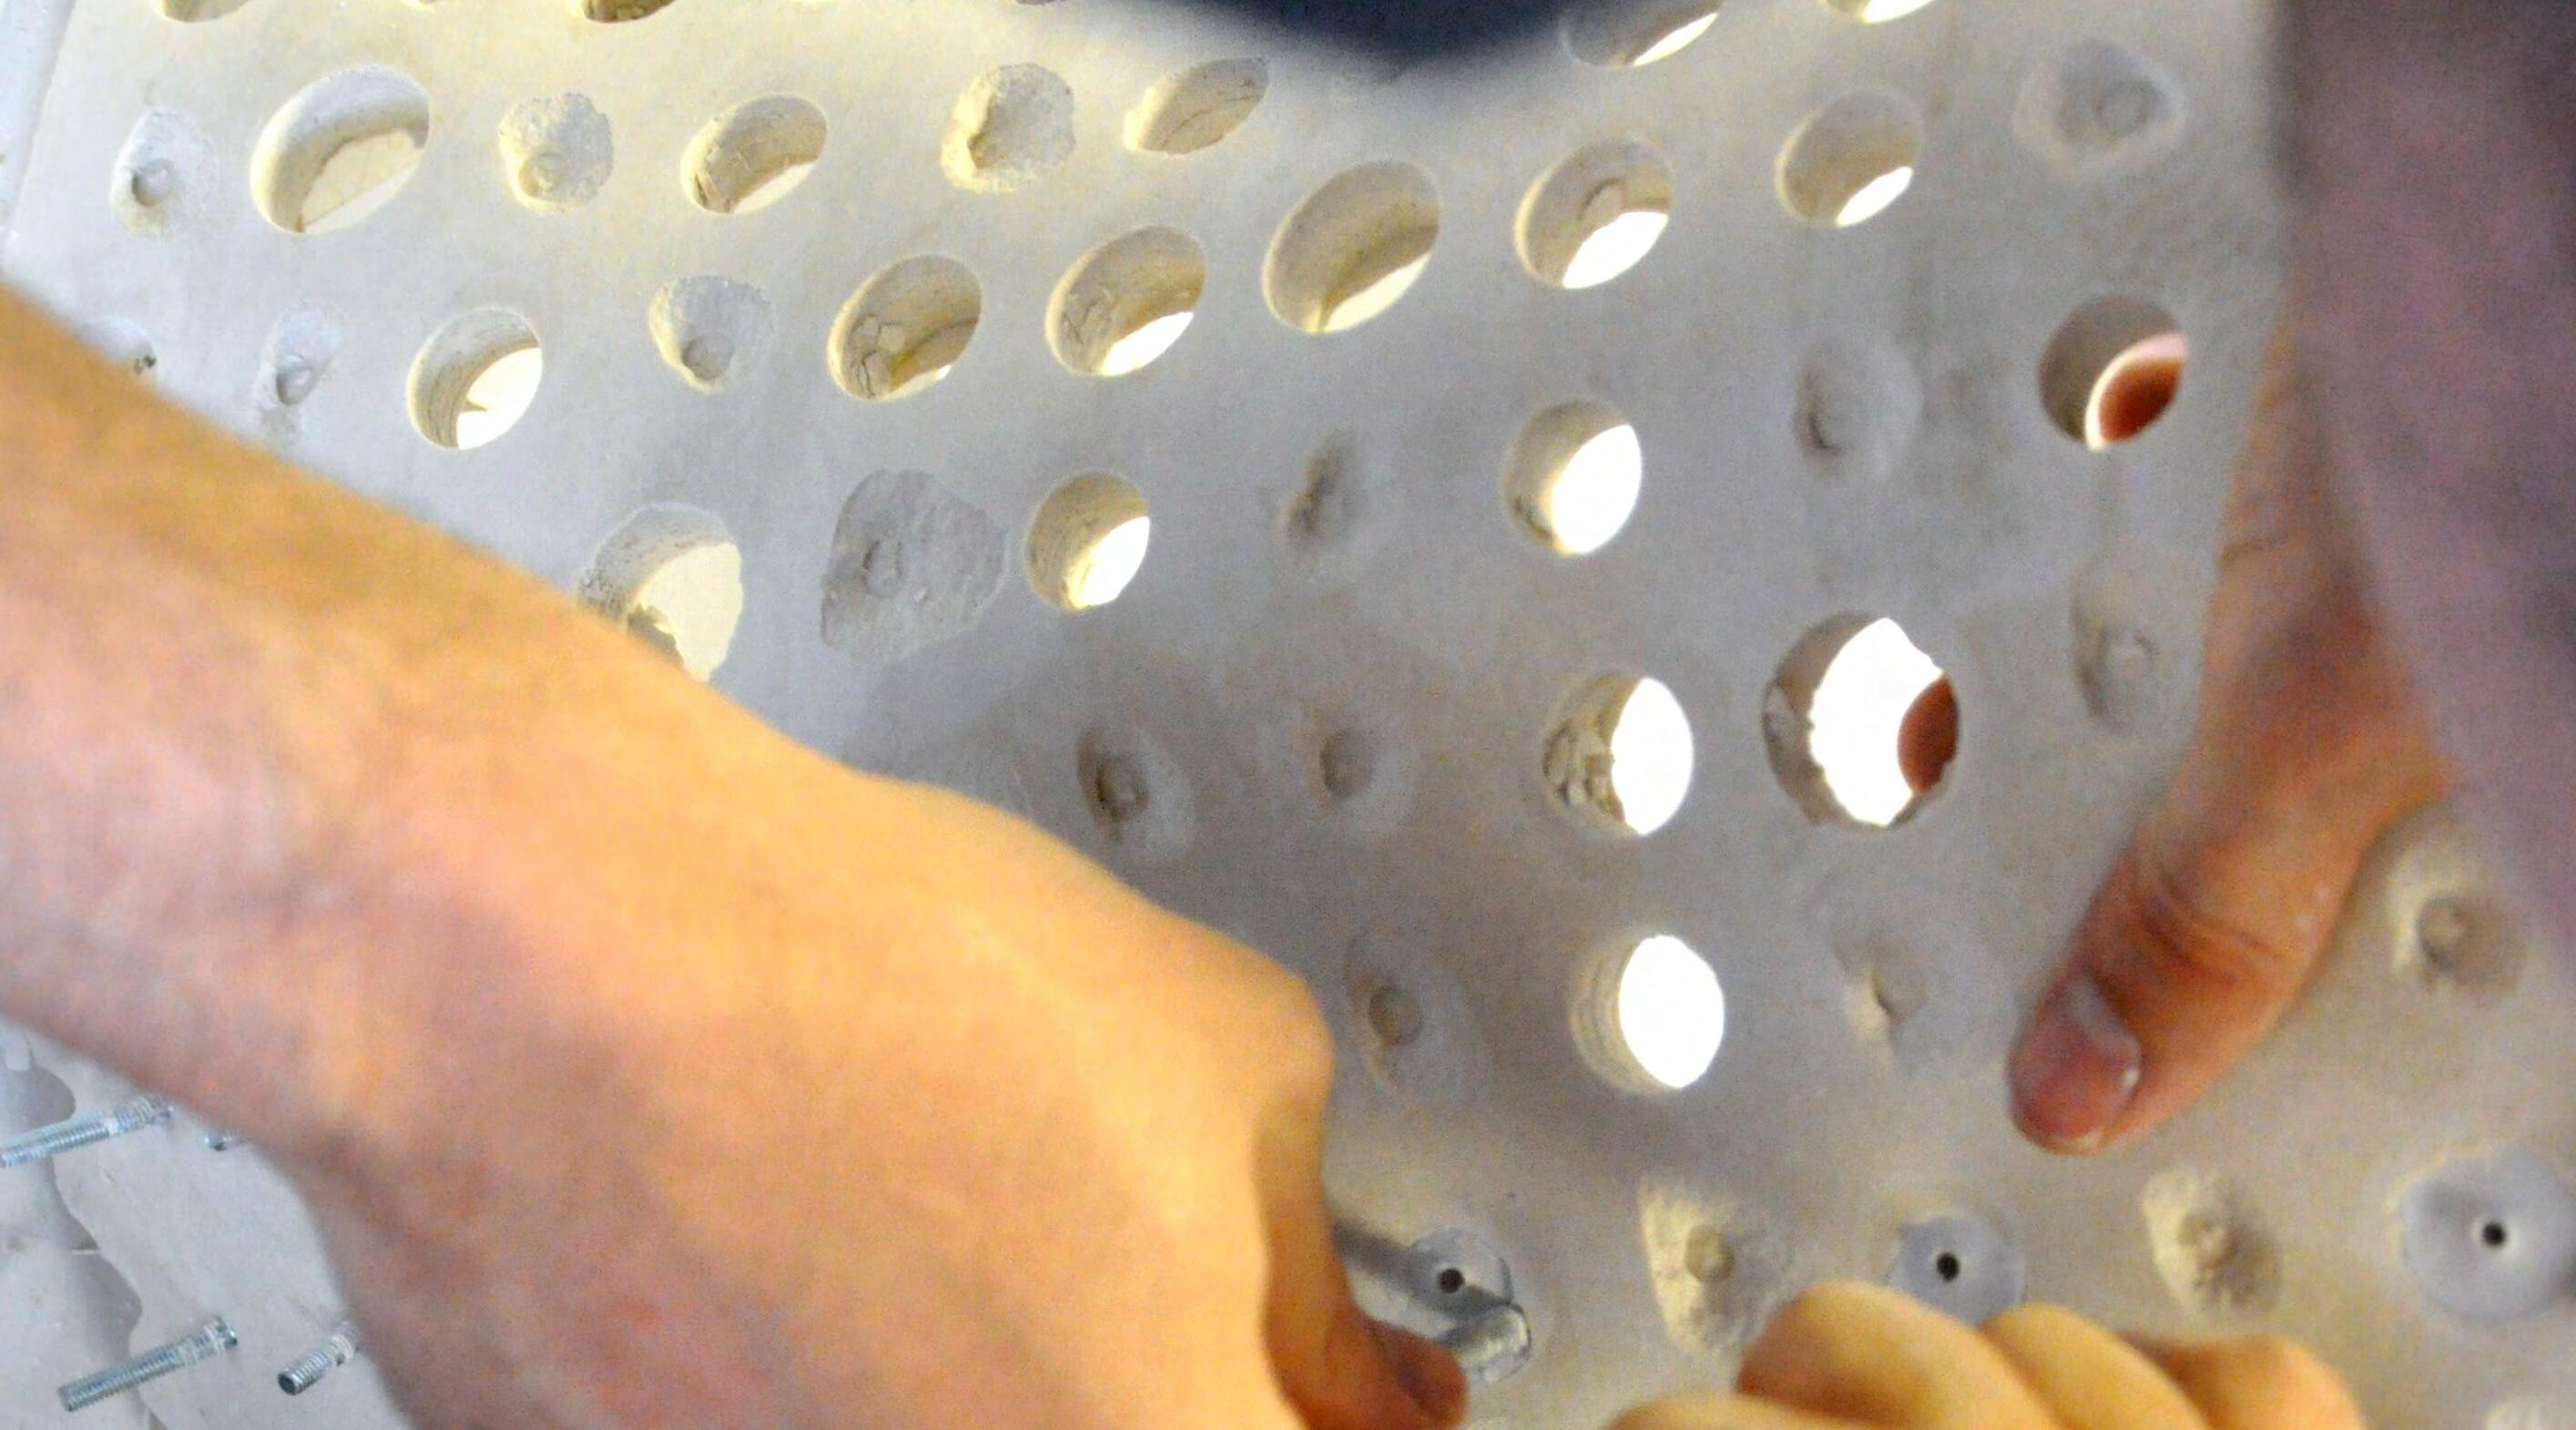
38 Fabrication| Scale 02| Trial 02.3
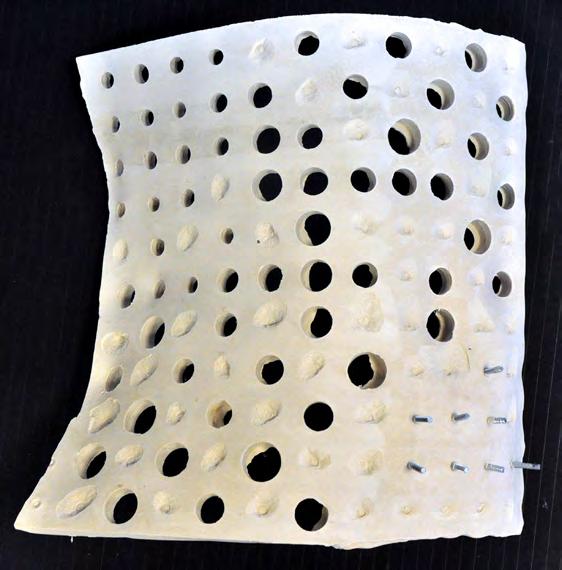
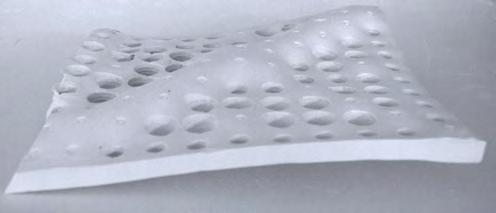
In trial 02.3, the blocking of perforations was based on an asymmetrical pattern. The pattern has a high density of blocked perforations in one corner and gradates to many more perforations in the opposite corner.
The result of this test shows a very large bulge in the area of many blocked perforations. Due to the amount of bulging in the formwork, several of the blocking mechanisms were cast deeply into the surface. When removing the formwork, there was deterioration where the blocking mechanisms were positioned.
An interesting result of the test was that the bulge tended to vein into areas of less blocked control points, always following a path of where there were more blocked perforations.
The ability to manipulate the bulging behaviour will be explored in future experiments.
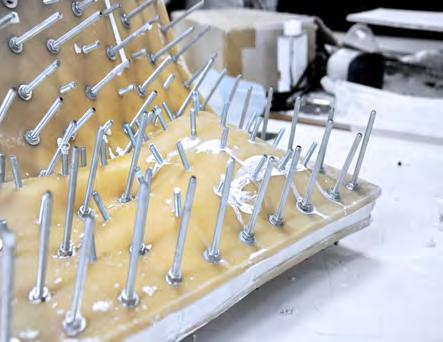
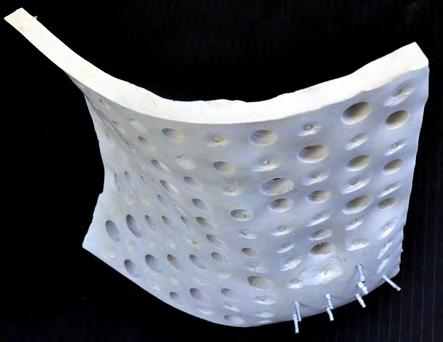
39 c2 c2 B FORMWORK_02
02. 03. Fabrication| Scale 02| Trial 02.3
Trial 02.3 01.
01. Image showing the resultant cast of trial 2.3
02. Image showing formwork bulging due to high density of blocked perforations
03. Image showing the resultant cast with impregnated blocking mechanism
01.Conical spacer geomtries that were used in coming trial.
02. Image of conical spacer geometries used within formwork system.

40 01.
A A c2 c2 B B FORMWORK_02 Fabrication| Scale 02| Trial 02.4
02.
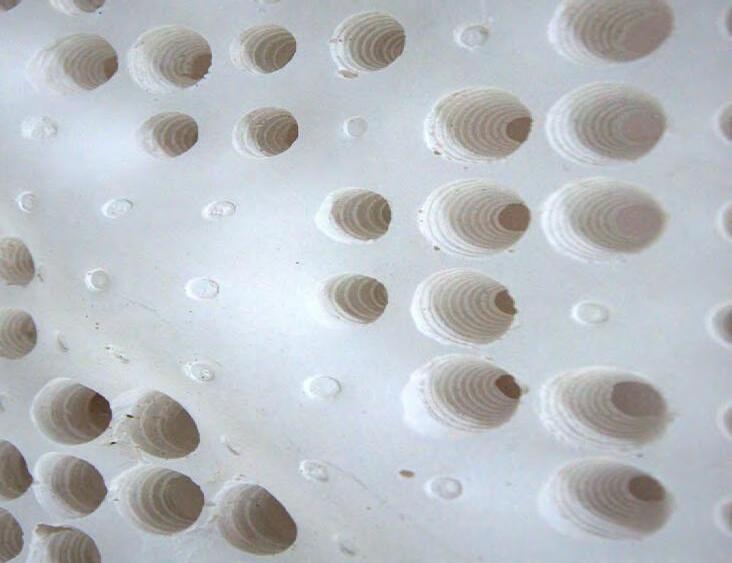
In trial 02.4, the bulging of the formwork due to the blocking pattern of perforations was explored. The pattern of the surface was a diagonal stripe across the surface of the cast where the perforations would be blocked. This test also introduces several different conical geometries that were cast from silicone rubber.
The result of this test shows a significant bulge following the line of blocked control points. Depending on the density of the blocked holes, the size of the bulge would change. This experiment allowed for the ability to control thickness that could potentially be independent of the height of a spacer. In the case of an area where no perforations is desired but also requires a thicker section, the bulging of blocked points could be employed to gain that result.


41 c2 c2 B FORMWORK_02
01. 02. 03. Fabrication| Scale 02| Trial 02.4
Trial 02.4
01. Detail image of surface pattern and bulging of trial 2.4
02. Image of assembled flexible formwork system during casting process
03. Image of resultant cast showing surface pattern and resultant rib of bulge
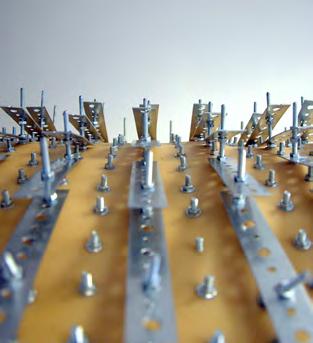
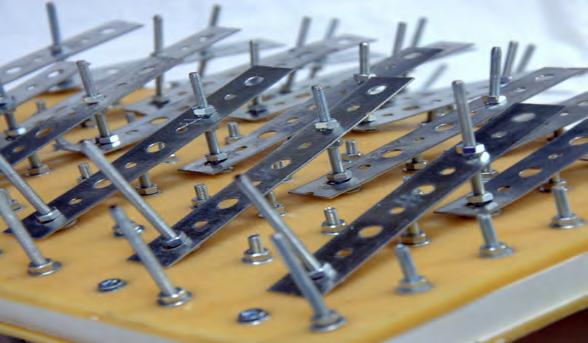
42 02.
A A c2 c2 B B FORMWORK_02 01. Fabrication| Scale 02| Trial 02.5
01.
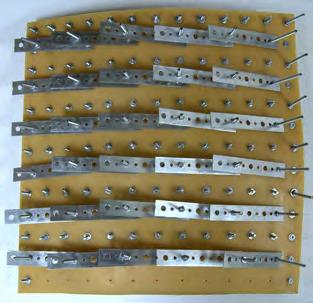
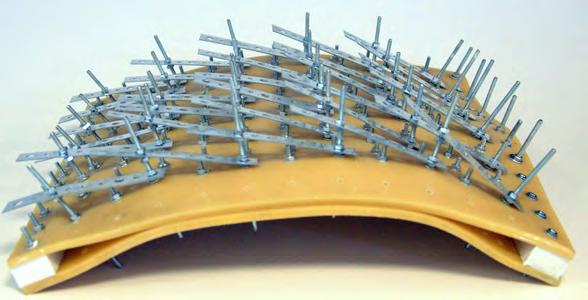
01. Illustration of steel spreading bar system.
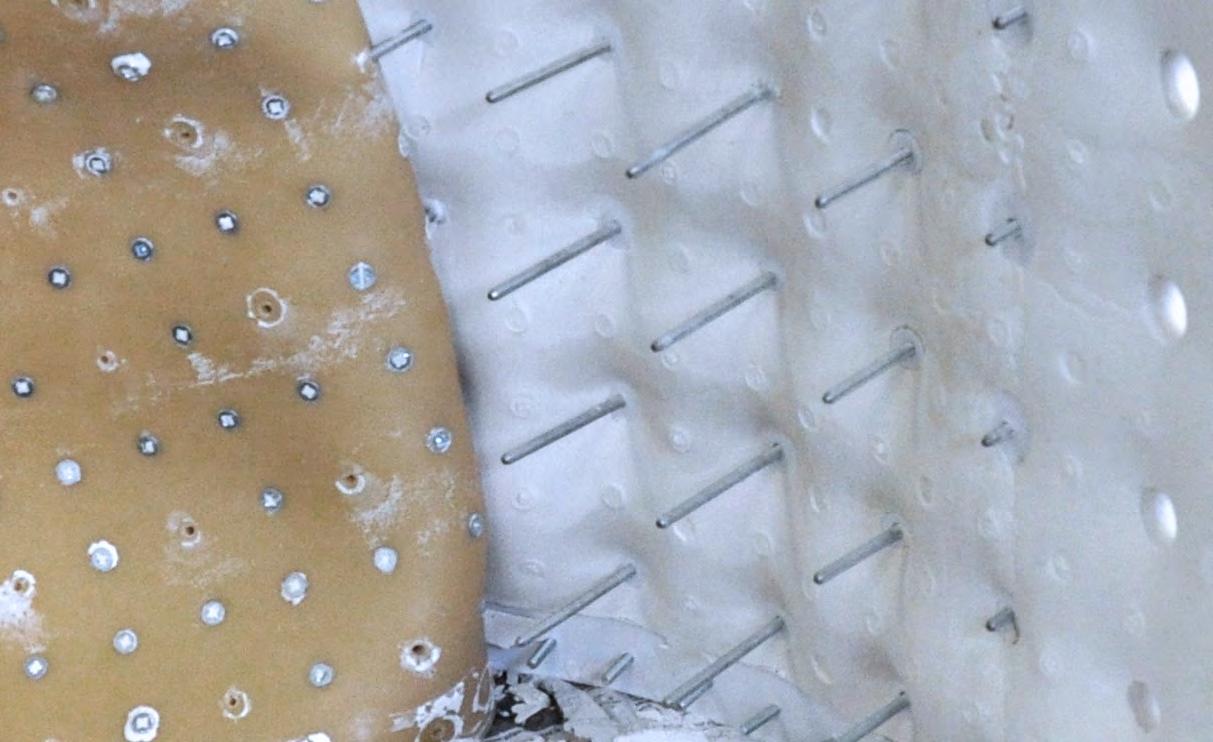
02. Series of images showing the assembled flexible formwork system with steel spreading bars.

Trial 02.5
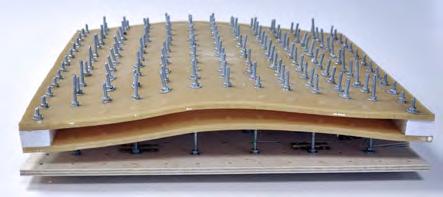
In trial 02.5, an external framing system was introduced to create a global curvature. The framing system involves steel brackets with holes drilled into them. The positioning of the steel brackets were determined by the positions of the neighbouring control points, where the global geometry would be built from the neighbouring relationship of each control point.
The steel brackets were successful in creating a globally curved surface. However, because each spacer needed to be set at either end, there was a dramatic increase in the time to assemble the formwork. However, the threaded rod was able to become perpendicular to the surface which made for a smoother golobal geometry.
43 c2 c2 B FORMWORK_02
01. Fabrication| Scale 02| Trial 02.5
01. Image showing the light pattern through the perforations of the cast
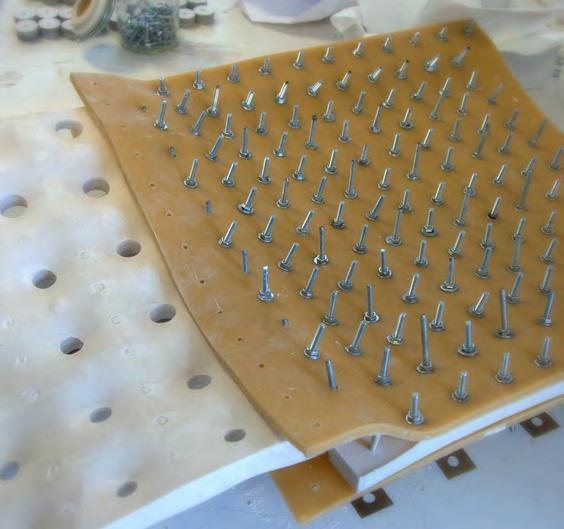

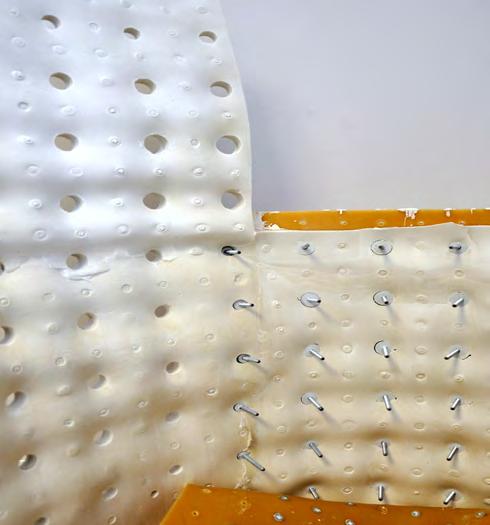
44 A A c2 c2 B B FORMWORK_02 Fabrication| Scale 02| Trial 02.5 01.
01. Series of images showing jump form process with steel spreading bar system.
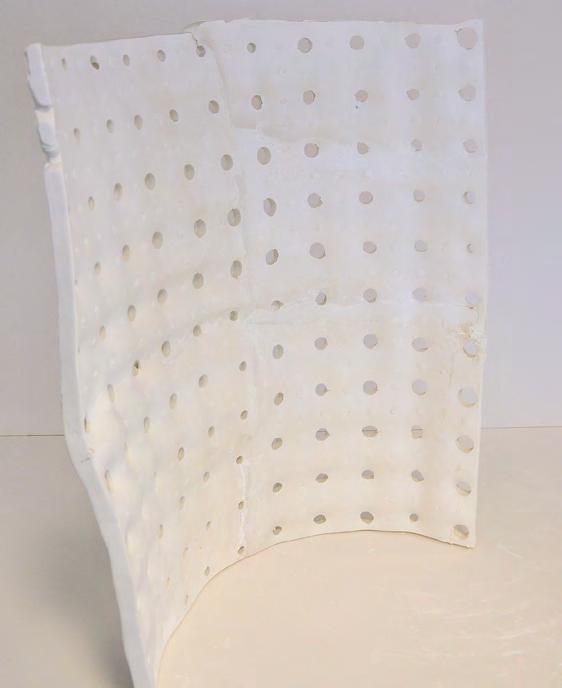
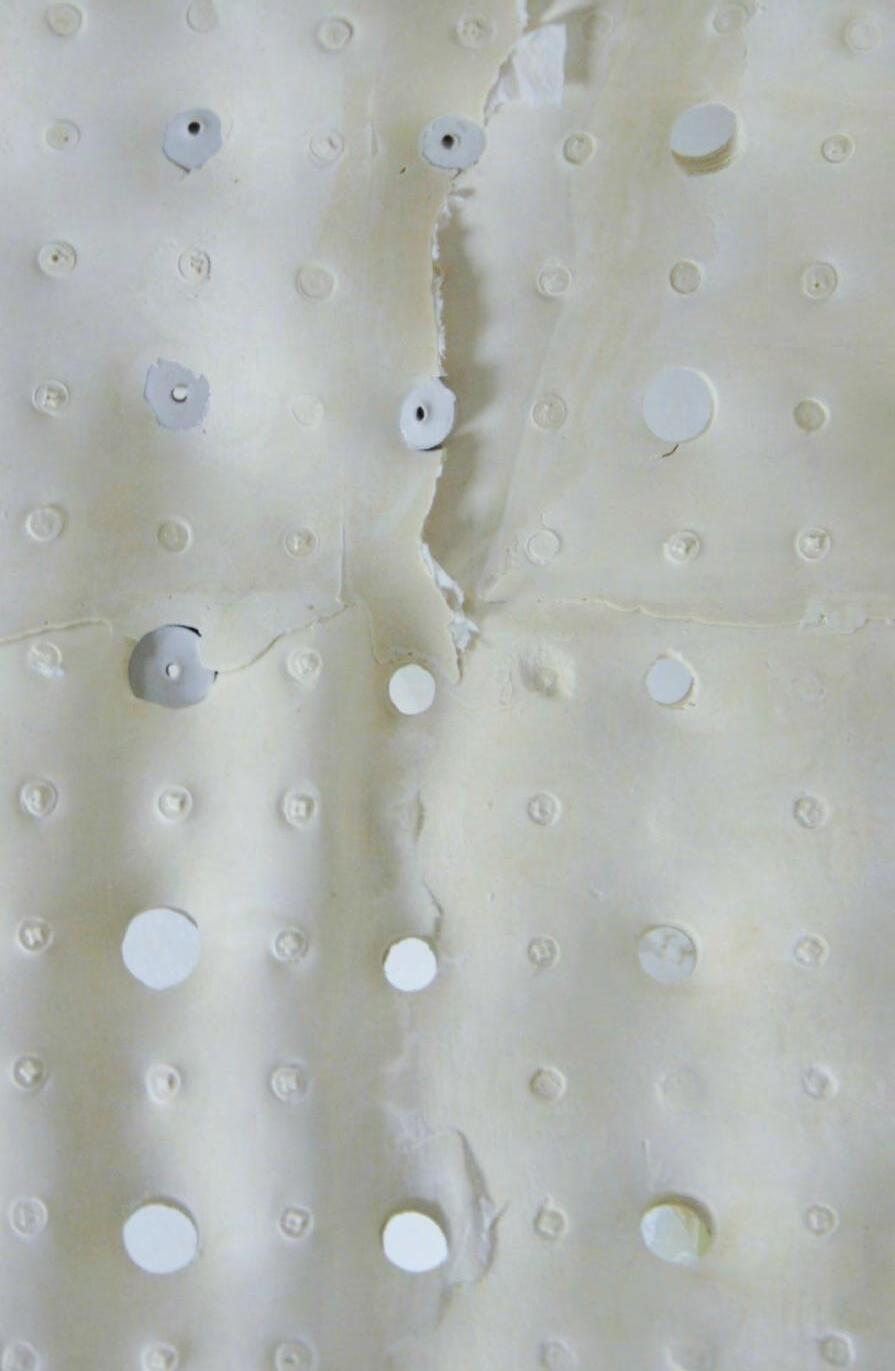
02. An attempt to jump-form several casts together was also performed using this framing system. The result of trial 02.5 was successful in creating a globally curved geometry. There was an increase in the amount of time needed to position each of the brackets depending on its neighbour. The jump form experiment was done with both horizontal jumps and vertical jumps. There was some distortion of the surface at the intersections of different casts, where the formwork would connect to the previous cast.
45 c2 c2 B FORMWORK_02 Fabrication| Scale 02| Trial 02.5
01.
01. Image showing four different casts that were jump-formed to create one continuous mass
02. Detail image showing the intersection of four jump-form casts
46 A A c2 c2 B B FORMWORK_02 Fabrication| Scale 02
01. Diagram of spreading bar system for jumpform casting
01.
47 c2 c2 B FORMWORK_02 Fabrication| Scale 02
48 01. A A c2 c2 B B FORMWORK_02 Fabrication| Scale 02| Trial 02.6
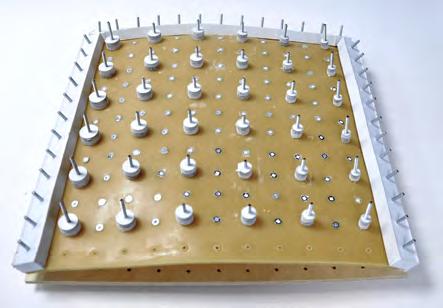
01. Diagram of the flexible formwork system with hinged control plate.
02. Image showing the cast during the removal of the formwork. 02.

Trial 02.6
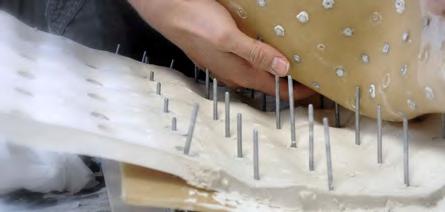
Another attempt at using a control plate was used for trial 02.6. The control plate was made from plywood, with a series of 5 mm perforations that match the flexible formwork. The outer two rows of perforations of the backing plate were cut into separate panels so that the formwork had the ability to rotate at its edges.
This was done to address the deformation of the cast near the edges as observed in trial 01.5. This is also to facilitate the connection to the previous cast during the jump-form process.
The result of this test was successful in the jump-form process. The backing plate takes considerably less time than the individual spreading bars to assemble as in trial 02.5. Because the last two rows were allowed to rotate, the joint of the two casts was much smoother than in previous experiments.

49
02. c2 c2 B FORMWORK_02 Fabrication| Scale 02| Trial 02.6
01.
01. Detail image of jump form connection using the backing plate
02. Series of images showing process of flexible formwork with a rigid backing plate
50 A A c2 c2 B B FORMWORK_02
01. Diagram of curved variable curved surface through flexible formwork with control plate
Fabrication| Scale 02
01.
51 c2 c2 B FORMWORK_02 Fabrication| Scale 02


- successful in creating a varying porosity cast with different sized cylindrical spacers.
- some irregular bulging due to the different heights of the spacers.
- reduced the porosity to half of the Trial 02.2. - a system of blocking porosity was established which resulted in more regular bulging and pattern transfer of the blocking mechanism into the cast - assymetric pattern was created with the blocked perforations.
- bulging due to hydrostatic pressure and the way the cast would vein from pockets of blocked perforations.
52 Scale 02 Formwork 02 Spacers 02_1| 02_2 Jump form Casting method 0| A| C FORMWORK_02 A A c1c2 c2 c1c2c1c2 c2 c2 c1 B B Fabrication| Scale 02| Catalogue
Trial 02.1
Trial 02.2
Trial 02.3
- the blocking pattern was arranged in a linear pattern
- the casting of a thick rib that follows the line of the blocking pattern.
- use of a steel spreading bar system
- the cast achieved a globally curved surface
- assembly of the formwork was much more difficult
- time consuming.

- control plate
- the outer two rows of control points were allowed to rotate for jump form purposes
- the result of the test was a successful jumpform
- simple and efficient to assemble
53 Fabrication| Scale 02| Catalogue
Trial 02.4
Trial 02.5
Trial 02.6
01. Exploded perspective of formwork for one full scale fabrication and acoustic tests.
A series of full-scale experiments were created to test the acoustic performance and fabrication techniques. A grid of two by two perforations was created in the formwork. 12 mm diameter threaded rod with matching nuts was used to clamp the formwork together.
54 Scale 03 Fabrication| Scale 03
Scale 03
01.
Formwork 03
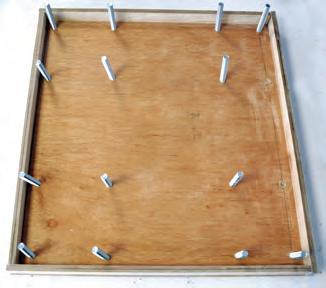
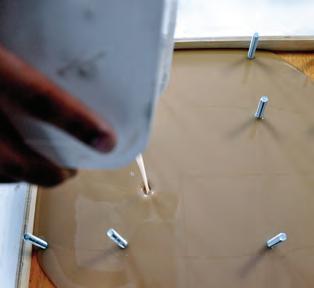
For the full scale fabrication tests, a plywood mould was created. A plywood edge was attached to the plywood sheet. The mould was sealed using polyurethane spray. 14 holes were created in the plywood for the perforations and edging in the rubber sheet. 12 mm bolts were used to create the perforations in the sheet. Vytaflex 20 was used again for the rubber, which was cast to a 1 cm thickness.



55 01. 02.
FORMWORK_03 Fabrication| Scale 03| Formwork 03_1 A c1 c2 c1 A c1 c2 c1
01. Series of images showing the process of fabricating the full scale flexible formwork from casted polyurethane


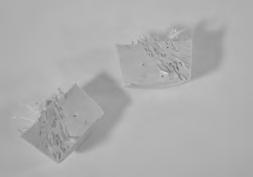
-1 part silicone to 0.25 part plastic fiber -tendency for the fibers to protrude from the top surface
- no significant increase in volume
- 1 part silicone to 0.5 part plastic fiber, by volume
-difficult to mix
-no recognizable increase in volume


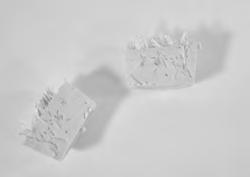
- 1 part silicone to 0.75 part plastic fiber, by volume.
- Difficulty to mix increased - little increase in volume
56 Fabrication| Scale 01| Formwork mixing experiments_ Plastic Fibres
Test 1
Test 2
Test 3
Formwork mixing experiments
Plastic Fibres

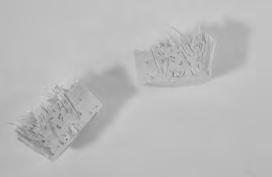
- 1 part silicone to 1 part plastic fiber, by volume - no longer possible to mix the plastic fibers
Silicone Additives
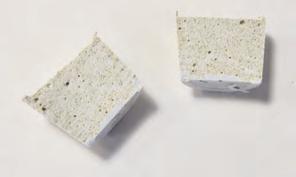
In order to reduce costs of fabricating silicone rubber spacers, different additives are added to the silicone in an attempt to increase the volume of the spacer while using less silicone. Different ratios of additives and silicone were tested. The ratios are 1:0.25, 1:0.5, 1:0.75, 1:1, 1:1.25, 1:1.5.
Three different additves were tested, fibre-glass fibers, wood fibers, and polystyrene pellets. This set of experiments will be incorporated into the fabrication of the full scale spacers in the coming fabrication and acoustic tests with concrete slabs.
57 Fabrication| Scale 01| Formwork mixing experiments_Plastic Fibres
Test 4

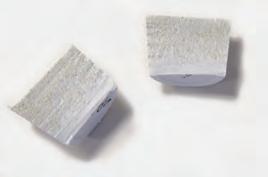

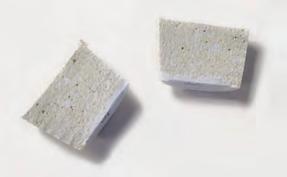
- 1 part silicone to 0.25 part wood fiber, by volume
- equal distribution of wood fiber within the silicone.
- no recognizable increase in volume

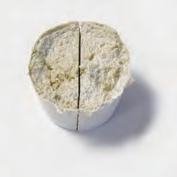
- 1 part silicone to 0.5 part wood fiber, by volume.
- relatively homogenous
- little increase in volume.

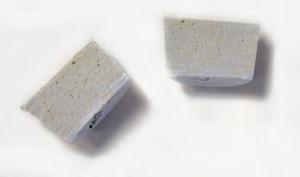
- 1 part silicone to 0.75 part wood fiber, by volume.
- homogenous mix
- more difficult to mix due to the high viscosity of the mix
- colour of the mix also became more tan due to the increase of the wood fiber ratio.
- no recognizable change in volume.
58 Fabrication| Scale 01| Formwork mixing experiments_ Wood Fibres
Test 1
Test 2
Test 3
Formwork mixing experiments
Wood Fibres

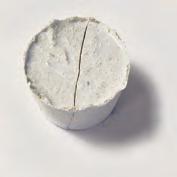


- 1 part silicone to 1 part wood fiber, by volume.
- mix was fairly homogenous.
- difficulty of mixing was also increased due to the high ratio of wood fiber
- no recognizable change in volume.
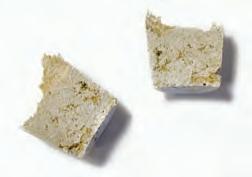
- 1 part silicone to 1.25 part wood fiber, by volume.
- mix was fairly homogenous.
-Difficulty of mixing was also increased due to the high ratio of wood fiber
- no recognizable change in volume.
- 1 part silicone to 1.5 part wood fiber, by volume.
-when de-moulding, there was significant deterioration due to the lower ratio of silicone
59 Fabrication| Scale 01| Formwork mixing experiments_ Wood Fibres
Test 4
Test5
Test 6
Formwork mixing experiments

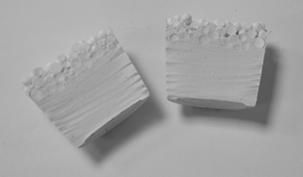
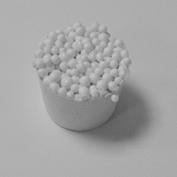

-1 part silicone to 0.25 polystyrene pellet, by volume.
- the polystyrene pellets eventually floated to the surface, creating a heterogeneous mix
- mix became more porous towards the top surface.

-1 part silicone to 0.5 polystyrene pellet, by volume.
- the polystyrene pellets tended to condense near the top surface of the mould.
- no significant change in volume when compared to the 1:0.25 ratio.
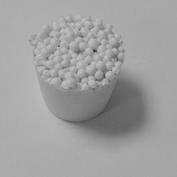

- 1 part silicone to 0.75 polystyrene pellet, by volume
- there was a noticeable increase in volume
- there seemed to be a similar distribution of polystyrene pellets
60 Fabrication| Scale 01| Formwork mixing experiments_Polystyrene Pellets
Test 1
Test 2
Test 3
Polystyrene Pellets


- equal parts silicone to polystyrene pellet, by volume
- density near the surface was similar to the results of the previous tests.
- depth of polystyrene pellets seemed to increase into the mix
- high density of silicone near the bottom of mould.


- 1 part silicone to 1.25 polystyrene pellets, by volume.
- significant increase in the volume compared to previous tests.
- recognizable deterioration of pellets due to lack of silicone to fuse the polystyrene pellets.
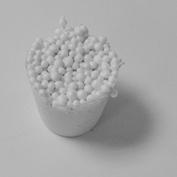

- 1 part silicone to 1.5 polystyrene pellets
- showed similar density distribution of silicone and polystyrene pellets
- similar deterioration of pellets as in sample 5
61 Fabrication| Scale 01| Formwork mixing experiments_ Polystyrene Pellets
Test 4
Test5
Test 6
Spacers
The interesting result of the tests is that the density of the top surface was not dramatically different among the different samples, even though there were dramatic differences in the ratio of the two materials. As suspected, the smaller ratio of polystyrene pellets to silicone yielded the most durable cast, with a higher density of silicone nearer to the top surface of the mould. Even though the samples with a high ratio of polystyrene pellets suffered deterioration at the top of the mould, there was relatively little deterioration of the rest of the cast. The benefit of the high ratio of polystyrene pellets was the
increase in volume. In looking at the section cut into the high density samples, the distribution in the center of the sample was the most optimum for the application. It is our opinion that by restricting the polystyrene from rising the surface through creating a netting a few millimeters below the intended top surface of the form, it will create an appropriate distribution of polystyrene pellets with minimal surface degradation of the casted piece.

62
03_1.1| 03_1.2|03_1.3| 03_1.4
Fabrication| Scale 03| Spacers FORMWORK_03 A c1 c2 c1 A c1 c2 c1
01.
01. Image of the variation of full scale silicone spacers including polystyrene pellet additive.

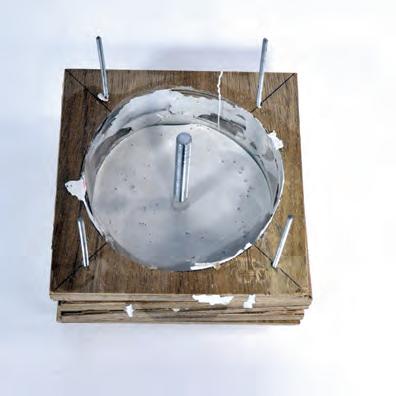

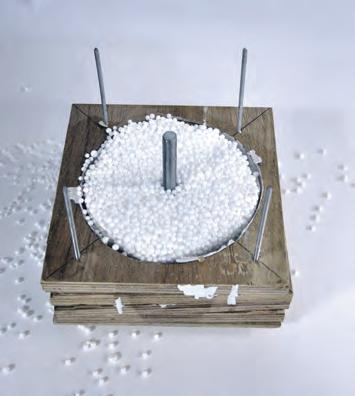
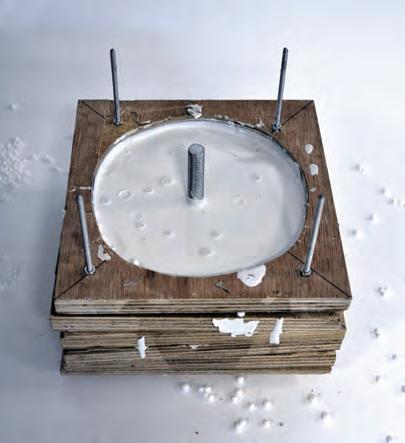
Based on the results of the previous experiments, the full scale spacers were created through layering sheets of plywood. The sheets of plywood were cut into one of four different sized circles.

Four 5 mm holes were created on the corners of the plywood sheets for alignment of the panels and to compress them together. The base of the mould contains a 12 mm hole in the centre for a bolt to create the hole for the threaded rod to pass through.
A small amount of silicone rubber is poured to cover the bottom of the mould. Polystyrene pellets are poured into the mould.
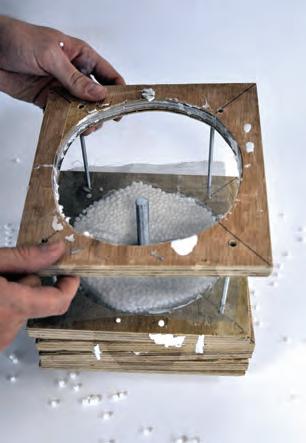

A netting is placed on top. The top layer of plywood is placed and the nuts and washers are installed and tightened. The silicone rubber is poured on top, with frequent refills as the silicone passes through the mesh.
63 01.
02.
Fabrication| Scale 03| Spacers FORMWORK_03 A c1 c2 c1 A c1 c2 c1
01-02. Series of images showing the process of creating full scale silicone spacers
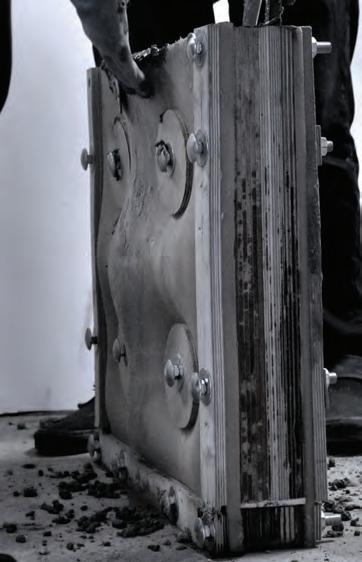
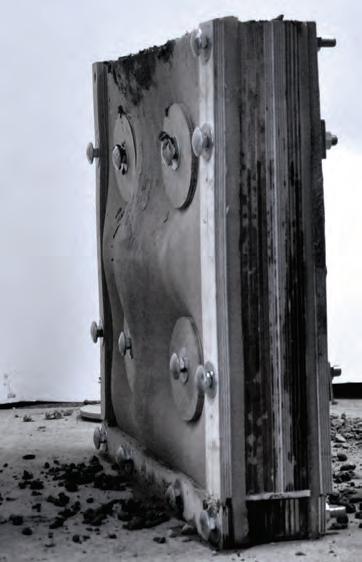
01. Series of images showing process of concrete fabrication. The highlighted image in blue shows the section being discussed.
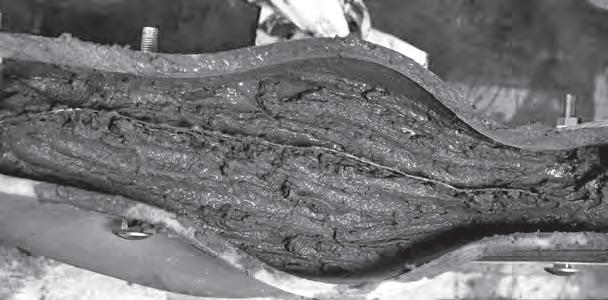
02. Rendered diagram of bulging relationship to size of perforation


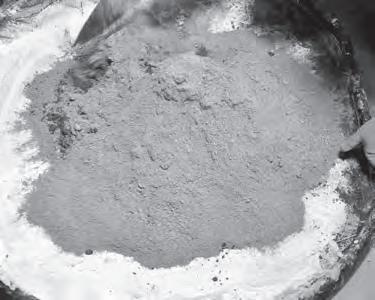
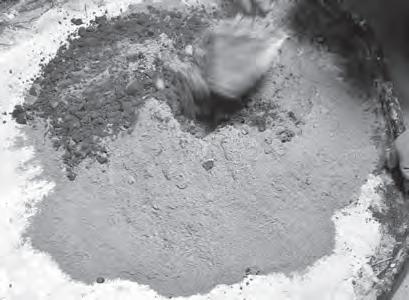
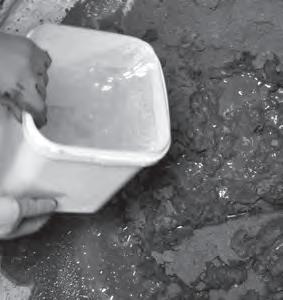
The full scale tests were casted using ready mix concrete. This was done to preserve consistency with a widely available and tested concrete mixture.
The surface of each cast is designed to have four perforations so that the sound tests could test a grouping of different sizes of perforations. A four centimeter stacked plywood edging was fabricated with 14 mm holes that would match the edge perforations in the rubber sheets. Thinner plywood strips were made to attach to the outside of the rubber formwork for added reinforcement for a reliable water seal. The entire formwork system was assembled and tightened through inserting 15 cm long 12mm diameter carriage bolts with matching nuts.
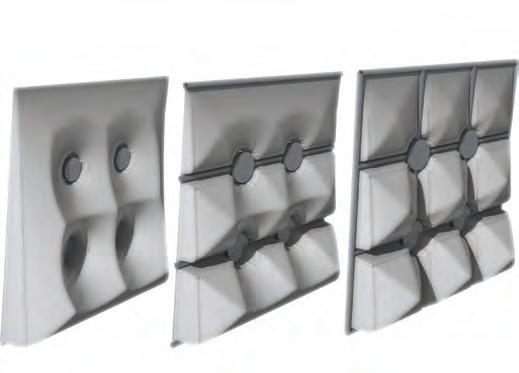
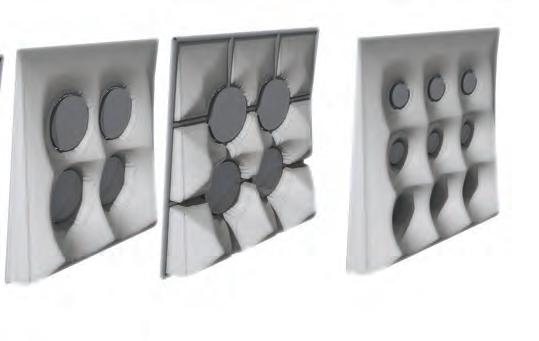
64 Fabrication| Scale 03| Bulge Casting process 01. FORMWORK_03 A c1 c2 c1 A c1 c2 c1
Flexible Formwork Concrete Process
02.

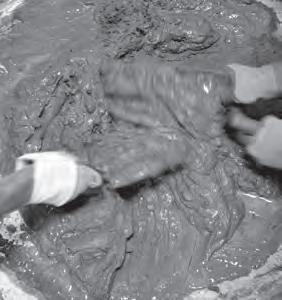
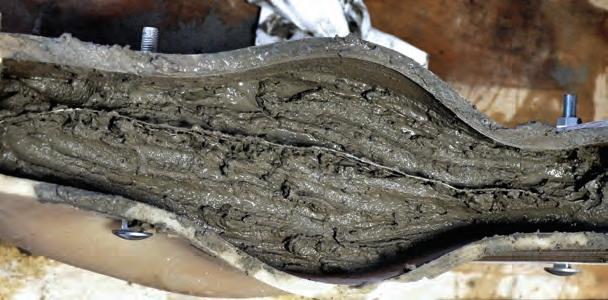
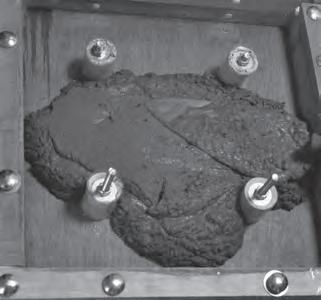

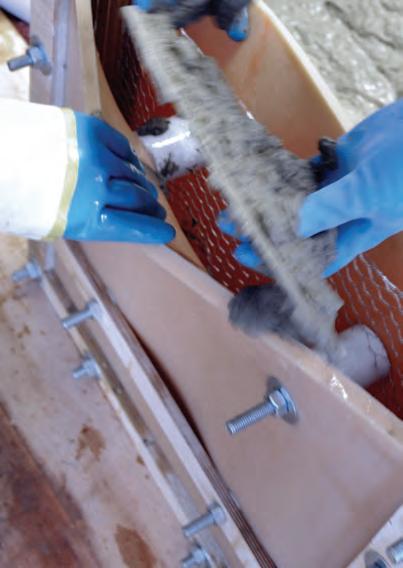

Where the plywood edging connects was brushed with silicone for a tighter weather seal. Because the holes created in the edging were 2mm larger than the bolt, the edging had a tolerance to be positioned within the system.
As the spacers grow in diameter, larger plywood washers are used in order to provide a seal against the entire surface of the spacer.
65 Fabrication| Scale 03| Bulge Casting process
FORMWORK_03 A c1 c2 c1 A c1 c2 c1
01.
01. Series of images showing the filling of concrete and removal of flexible formwork after the concrete cast has cured
01. Time-lapse images showing the bulging behaviour during the casting process.
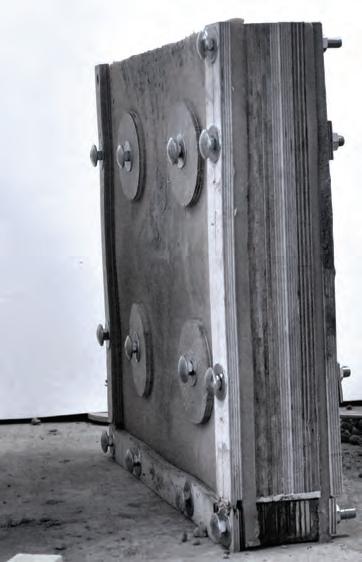
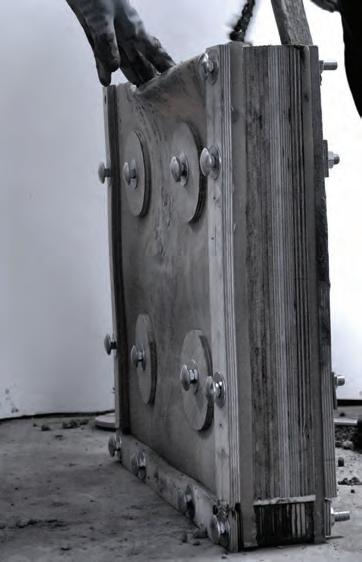
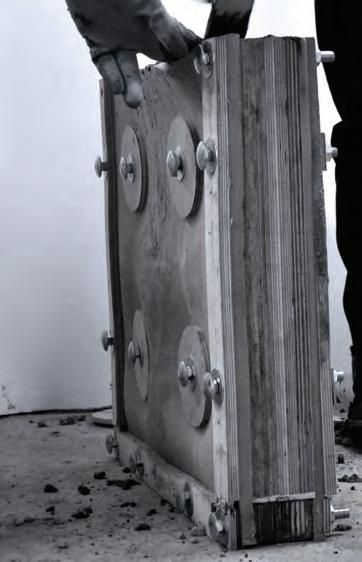

66 Fabrication| Scale 03| Bulge Casting process FORMWORK_03 A c1 c2 c1 A c1 c2 c1
01.

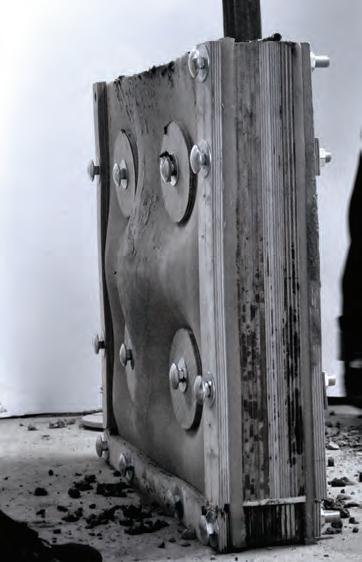
67 Fabrication| Scale 03| Bulge Casting process FORMWORK_03 A c1 c2 c1 A c1 c2 c1
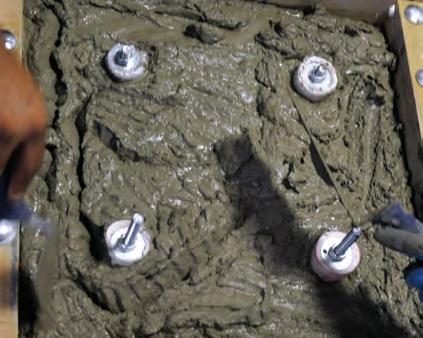
01.Series of images showing process of concrete fabrication. The highlighted image in blue shows the section being discussed.
02. Images showing the casting process.


Flat Concrete Process
Each of the flexible formwork cast also has an accompanying flat concrete slab with the same size of perforations. This was done for the acoustic tests in order to evaluate the differences in acoustic behavior of the bulging surface against a matching flat surface.
Again, a ready mix concrete was used to create the slabs in order to preserve consistency of the acoustic experiments.

68 Fabrication| Scale 03| Flat Casting process
01. FORMWORK_03 A c1 c2 c1 A c1 c2 c1
02.


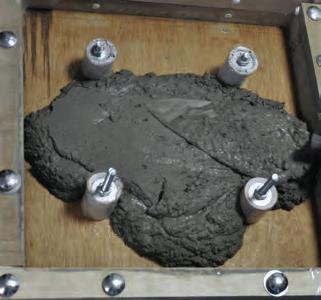
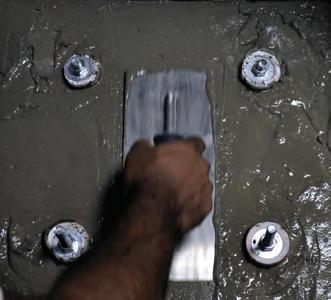
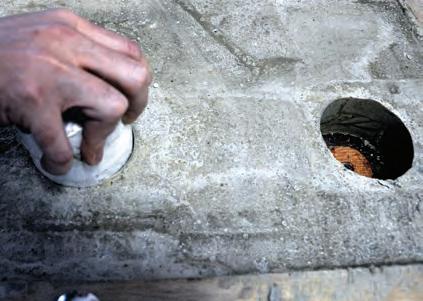

The flat slabs were created using a plywood formwork. A 4cm plywood edge was created and attached to the plywood formwork with carriage bolts.
The silicone spacers previously described is attched to the formwork using carriage bolts. The liquid concrete is poured into the formwork and smoothed flat.
After allowing 24 hours to cure, the silicone spacers were removed along with the plywood edging. The concrete slab can then be removed.
69
Fabrication| Scale 03| Flat Casting process
FORMWORK_03 A c1 c2 c1 A c1 c2 c1
01.
01. Series of images showing the un-casting process
Formwork 03_1| 03_2
Spacers 03_1.1| 03_1.2| 03_1.3| 03_1.4
Casting method Flat| Bulge
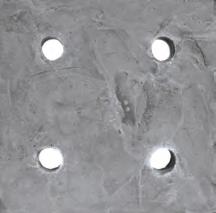

-8 cm perforations
-4cm thickness
-no bulges
-refer to page 117 for acoustic test results
-refer to page 123 for acoustic test results Trial 03.1a
-10 cm perforations
-4cm thickness
-no bulges
-refer to page 119 for acoustic test results
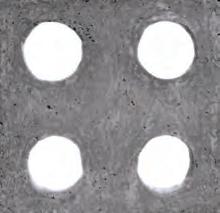
-14 cm perforations
-4cm thickness
-no bulges
-refer to page 121 for acoustic test results

-16 cm perforations
-4cm thickness
-no bulges
Fabrication| Scale 03| Catalogue
70 FORMWORK_03 A c1 c2 c1 A c1 c2 c1
Scale 03
Trial 03.2a Trial 03.3a Trial 03.4a
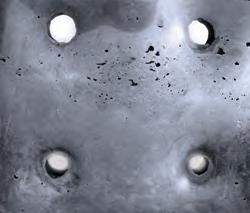
-8 cm perforations
- 4cm to 25cm thickness
-large bulging
-refer to page 125 for acoustic test results
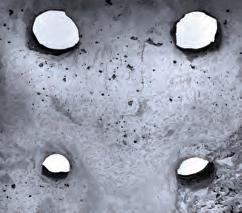
-10mm perforations
- 4cm to 18 cm thickness
-bulging in center
-refer to page 127 for acoustic test results
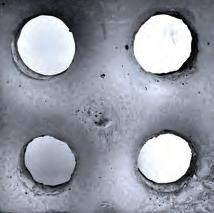
-14mm perforations
- 4cm to 12 cm thickness
-bulging in center
-refer to page 129 for acoustic test results
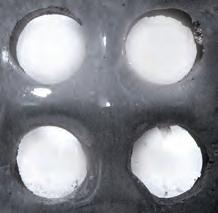
- 16mm perforations
- 4cm to 10 cm thickness
-bulging in center
-refer to page 131 for acoustic test results
71 Fabrication| Scale 03| Catalogue
Trial 03.1b
Trial 03.2b
Trial 03.3b
Trial 03.4b
Conclusions
The fabrication method was entirely based on the concept of a variable formwork that could allow the formation of complex geometries, while on the same time due to its material properties, could provide reusability reducing the cost significantly as opposed to a rigid formwork. As mentioned in Mark West’s “Fabric-Formed Concrete Surfaces1”:
“A new construction method replacing rigid formwork panels with a flexible membrane that deflects under the dead weight of wet concrete, provides numerous advantages and opportunities for architecture, engineering, and construction technology in both advanced and basic building economies. Historically, the calculations for more sophisticated geometries were very
time consuming, or impossible to perform”, while as he informs “the limitations of the slide rule demanded simple geometries.”
Due to the desired acoustic properties, deflective geometries were developed and due to the designed variable formwork, we were able to manipulate the geometrical changes on these concrete surfaces.
The research on current formwork materials revealed that most materials that have being used are either non-reusable or too rigid for our purposes. Wood is more expensive and not as flexible as fabric, but fabric in most cases is not reusable as our rubber-based formwork. The research was focused on creating two panels from a two-part polyurethane rubber as formwork and
silicone rubber spacers in order to achieve the perforation on the concrete surfaces, for their acoustic benefits. Furthermore, we discovered that through simple maintenance, the rubber panels and the silicon spacers can be reused both without losing their elasticity and general integrity.
The silicone spacers were further developed in terms of material efficiency, with the use of polysterene beads, poured inside the silicon rubber while in its fluid state. With the correct ratio of the polysterene beads inside the rubber, we produced a lighter spacer without losing the integrity and flexibility in comparison to the ones made from pure silicone rubber.
Polyurethane rubber is available on custom-made
72
Fabrication| Conclusions
sheets at different thicknesses and widths. The price per meter squared can be relatively higher than the price of fiber, but because of the rubber’s reusability it proves to be a less expensive option for formwork construction.
The flexible formwork tests were performed in three different scales. The first set of formwork revealed several difficulties: sealing of formwork edges, perforation geometry, spacer removal, and control of overall geometry, which were developed into a viable formwork system. The initial tests with the polyurethane rubber was successful in creating a durable and flexible formwork. The multiple reuse of the formwork was tested and verified to work, and was used in the succeeding experiments. Also within the first set of experiments, the removability of
the steel spacers proved that in order to create articulated perforations, it necessitates a flexible spacer. This led to the development of a casted silicone spacer, where it also addresses different geometries that the perforations can have.
The second set of experiments took the successes in the previous set of experiments and elaborated on a smaller scale with many more perforations. In these series of tests, issues of porosity and the multiplication of control points. The ability to control the porosity pattern through blocking perforation points showed interesting results in the bulge pattern of the cast due to the flexibility of the rubber formwork. The final set of experiments were concentrated on the flexible formwork process in full scale.
Different additives to the silicone were tested in order to reduce the cost of the full scale fabrication. With these experiments, acoustic tests were performed within an insulated acoustic chamber. Four differently sized cylindrical spacers were cast in both the flexible formwork and in flat slabs. The results of this experiment shows the different acoustic properties of the differently sized perforations and the comparison between a flat slab and the bulges created by the flexible formwork.
Acoustic tests were performed on the full scale concrete casts, where the different acoustic behaviour of the different geometries were revealed in relation to absorption and reflection values. These results were measured against a control test of an empty chamber.
73
Fabrication| Conclusions
74
75 ACOUSTICS

76
02. ACOUSTICS
01. -Wavelength: the distance from the crest of one wave to the crest of the other
-Frequency: the number of waves that pass a point in each second
-Amplitude: the measurement of the amount of energy in a sound wave
02.

02.1 Fundamentals of Sound
Introduction to wave physics and sound waves
In order to understand the topics of acoustics involved in the research, a general introduction of wave physics is included.
The behaviour of waves in physics can be described by zooming in to the scale of a particle, which is part of the wave we are describing and understand its periodic motion. The direction of the particle’s movement is the same as that of the transmission path of the sound wave called a longitudinal wave. The periodic motion, has the most significant position in the hierarchy of all possible motions of material, it is so strongly connected with the nature and everyday life, human nature and the way machines work, the motion of the planets, but also because period is strongly related to it. As periodic motion of a particle we describe the motion, that is being repeated in the same manner, like the motion of the Moon and the planets, the description of which played significant in the evolution of physics. The periodic motion is in a way fractured in a specific area of a space. That fracture results the interaction of the particle with other particles.
01. Properties of sound waves (http://www.fi.edu/ fellows/fellow2/opr99/ soundvib.html)
02. Sound wave illustration (http://www.fi.edu/ fellows/fellow2/opr99/ soundvib.html)
77
Acoustics|
Fundamentals of Sound
01. Diagram of sound wave characteristics (http://www.fi.edu/ fellows/fellow2/opr99/ soundvib.html)
High-Frequency sound waves
Low-Frequency sound waves
Loud: the greater the intensity (amount of energy) of a sound, the greater the amplitude
Soft
Pleasant sound: regular wave pattern
Noise: irregular/no repeated wave pattern
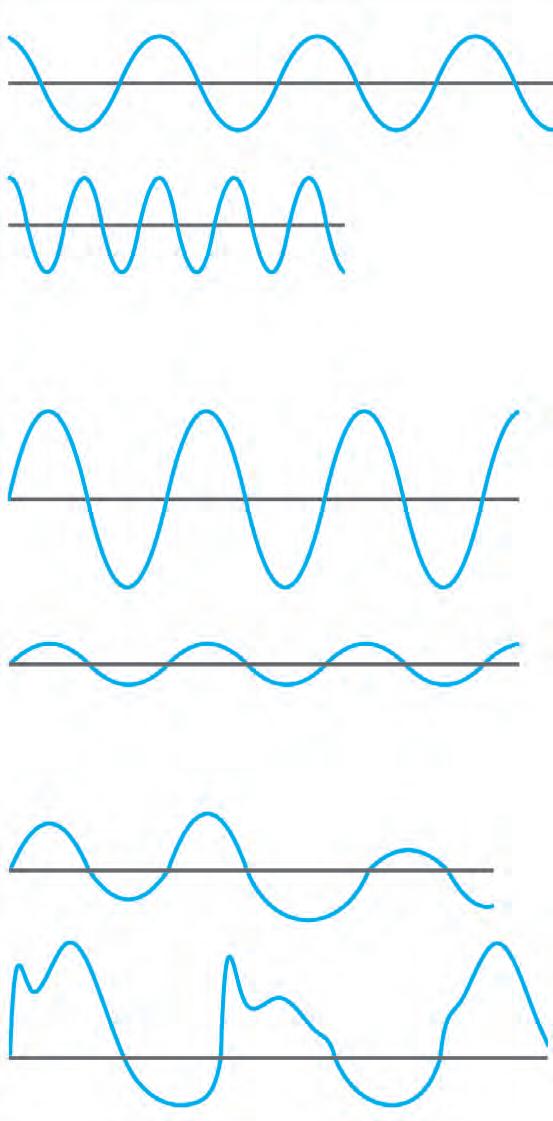
78
of
01.
Acoustics| Fundamentals
Sound
In an initial stage to understand the motion of a particle, so the motion of the wave, it is important to understand thoroughly the harmonic motion of the particle and so firstly define the circular motion of the particle. As period T we define the time of a complete rotation, while the angular displacement of a particle within a single period is 2π and we have the angular frequency as
ω = 2π/Τ = 2πf (1)
The number of the full rotation per second is 1/T and we call that the frequency of the motion of the particle as
f = 1/Τ = ω/2π (2)
If we freeze the time at the value t= 0 when the particle is intersecting with the positive part of the X axis, the angular displacement, at the time frame t, is ωt in rad. The corresponded χ and y coordinates will be
χ = Α cos (ωt) (5)
y = A sin (ωt) (6)
where A is the radius of the circular orbit. The motions (5) and (6) are called harmonic. The corresponded values of the speed and acceleration of the particle come from the differentiation of the displacement to time and so uχ = dχ/dt = ( -Aω) sin (ωt) (7) and αχ = du/dt = (Aω2) cos (ωt) (8) and the corresponded values for the displacement it the Y axis.
When a sound source produces simple harmonic motion the equation of the displacement ξ in X axis is
ξ = A cos (ωt – kχ) (9)
where k = 2π/λ, which is called wavelength constant and λ represents the wavelength. If we consider a certain position of, for instance where χ = 0 in (9) then we have ξ = A cos ωt, which means that it is a sine wave motion.
The sound wave propagates in a spherical shape from a sound source whose dimension is relatively small compared to the wavelength. It is called a spherical wave and the sound source is referred to as a point source. Although an actual sound source has a finite size, it can be considered as a point source, when the source is located from an observer at a sufficiently large distance compared to its size, then the sound source is located very far away, then the wave front approximates to a plane and the sound may be treated as a plane wave. Strictly speaking, a plane wave propagates only in one direction, and in a plane perpendicular to its direction its sound pressure and particle velocity are uniform and have the same phase. (Z. Maekawa, J. H. Rindel, P. Lord, 3)
79 Acoustics| Fundamentals of Sound
01. Sound coefficient of different materials at 125Hz and 250 Hz (M.David Egan, p.118)
02. Effect of adding sound- absorbing treatment on Sound level decay in open fileds (M. David Egan,p.123)
03. Sound absorption coefficient of thick porous material (M. David Egan,p.123)
04. Sound absorption coefficient of thick porous material (M. David Egan,p.123)
01.
Sound Absorbing Materials
Acoustics for architecture depends on the material of the surrounding space. Material characteristics such as hardness, mass, surface, texture all have acoustic consequences. The measurement that shows the material absorption characteristics is called absorption coefficient.
The categories that the material absorbing material are divided are:
-porous material, like glass wool or porous foam, where the absorption is large at high frequencies and small at low frequencies -panel membrane type absoprtion, like thin plywood, where they produce a peak in low frequency range (the peak is higher when a material is used in the back side).
porous materials (with perforated facing)
-resonator absorption, where the absorption can be very large at the resonant frequency
thick
In practice, a combination of all these three types is the most effective. (Z. Maekawa, J. H. Rindel, P. Lord, 100)
with perforated facing High-frequency sound-absoebing efficiency is reduced because solid areas of facing reflect sound waves
4’ thic (low-frequency sound-absorbing efficiency increases with thickness increase)
Thin porous materials (with airspace to increase low-frequency absorption)
porous materials (with perforated
2’ thick fuzz with airspace behind (low frequency sound-absorbing efficiency increases with airpsace depth increase)
thic (low-frequency sound-absorbing efficiency increases with thickness increase)
Concrete rough
Concrete block/painted
Plaster on concrete block
Plywood 3/8-in
Concrete block
Shredded-wood fiberboard, 2-in thick on concrete
wood 1/2-in paneling/ perforated
of adding sound-absorbing treatment
80 02. 03. 04. Acoustics| Fundamentals of Sound 125250500100020004000 0.2 0.4 0.6 0.8 1.0 3 db 10 db 6 db 1’/2’ thick fuzz without airspace behind As more sound-absorbing treatment is used, the reduction of sound level with distance becomes like the reduction outdoors Thin porous materials (with low-frequency Thick porous materials (with perforated facing) effect of adding sound-absorbing treatment 60 70 80 90 100 d1d2=2d1 Sound level (db) Sound absorption coefficient (a) Sound absorption coefficient (a) Distance from source Frequency (Hz) Frequency (Hz) 125250500100020004000 0.2 0.4 0.6 0.8 1.0 4’ thick fuzz with perforated facing High-frequency sound-absoebing efficiency is reduced because solid areas of facing reflect sound waves 4’ thic (low-frequency sound-absorbing efficiency increases with thickness increase) 2’ thick fuzz with airspace (low frequency sound-absorbing efficiency increases depth increase) untreated room (gypsum board walls and ceilings, concrete floor) ceiling treated with absorbing materials ceiling and walls treated 125250500100020004000 0.2 0.4 0.6 0.8 1.0 3 db 10 db 6 db 1’/2’ thick fuzz without airspace behind As more sound-absorbing treatment is used, the reduction of sound level with distance becomes like the reduction outdoors
effect
treatment 60 70 80 90 100 d1d2=2d1 Sound level (db) Sound absorption coefficient (a) Sound absorption coefficient (a) Distance from source Frequency (Hz) Frequency (Hz) 125250500100020004000 0.2 0.4 0.6 0.8 1.0 4’ thick fuzz with perforated facing High-frequency sound-absoebing efficiency is reduced because solid areas of facing reflect sound waves 4’ thic (low-frequency sound-absorbing efficiency increases with thickness increase) 2’ thick
frequency sound-absorbing
depth increase) untreated room (gypsum board walls and ceilings, concrete floor) ceiling treated with absorbing materials ceiling and walls treated 125250500100020004000 0.2 0.4 0.6 0.8 1.0 3 db 10 db 6 db 1’/2’ thick fuzz without airspace behind As more sound-absorbing treatment is used, the reduction of sound level with distance becomes like the reduction outdoors Thin porous materials Thick
facing) effect
60 70 80 90 100 d1d2=2d1 Sound level (db) Sound absorption coefficient (a) Sound absorption coefficient (a) Distance from source Frequency (Hz) Frequency (Hz) 125250500100020004000 0.2 0.4 0.6 0.8 1.0 4’ thick fuzz
perforated
4’
2’ thick fuzz with (low frequency efficiency increases depth increase) untreated room (gypsum board walls and ceilings, concrete floor) ceiling treated with absorbing materials ceiling and walls treated 125250500100020004000 0.2 0.4 0.6 0.8 1.0 3 db 10 db 6 db 1’/2’ thick fuzz without airspace behind As more sound-absorbing treatment is used, the reduction of sound level with distance becomes like the reduction outdoors Thin
Thick porous materials (with perforated facing) effect of adding sound-absorbing treatment 60 70 80 90 100 d1d2=2d1 Sound level (db) Sound absorption coefficient (a) Sound absorption coefficient (a) Distance from source Frequency (Hz) Frequency (Hz) 125250500100020004000 0.2 0.4 0.6 0.8 1.0 4’
Thick
of adding sound-absorbing
fuzz with airspace behind (low
efficiency increases with airpsace
with
facing High-frequency sound-absoebing efficiency is reduced because solid areas of facing reflect sound waves
porous materials (with airspace to increase low-frequency absorption)
fuzz
untreated room (gypsum board walls and ceilings, concrete floor) ceiling treated with absorbing materials ceiling and walls treated
material Sound coefficient 125 Hz 250 Hz Sound-reflecting Sound-absorbing 0.28 0.02 0.01 0.10 0.12 0.36 0.60 0.40 0.22 0.02 0.02 0.05 0.09 0.44 0.75 0.90 Steel
When a sound wave hits a surface, its energy is divided into three parts. If the sound wave before hitting the surface has energy Ei, a part of this energy Er is reflected back while a part Ea is absorbed by the surface. The rest Et is transmitted as shown in the diagram and because of the principle of energy conservation we have
Ei = Er + Ea + Et (10).
The absorption coefficient a is defined as α = (Ei - Er)/ Ei = (Ea + Et) / Ei (11) and the transmission coefficient τ as τ = Et / Ei (12) also referred as transmission loss. The absorption coefficient is highly dependable on the angle of the sound wave incident to the surface. When this angle is zero then the absorption coefficient is called the normal-incident coefficient, while as randomincidence coefficient we define the coefficient at the case of oblique incident. “Although these absorption coefficients and acoustic impedances are defined at the surface of the material, it should be noted that they may also vary according to the thickness of the material and the backing condition.”( Z. Maekawa, J. H. Rindel, P. Lord, 102). These topics are regarded in the research in order to create an acoustic concrete surface.
9084 72
10204080
81 Ei Et Er Ea
d1 d2=2d1
d3=2d2 d4=2d3
0 5 10 15 20 d1d2=2d1 Sound level (db) Distance from source
6 db reduction from doubling the distance from point source noise reduction due to adding absorption little ro no reduction 0 5 10 15 20 d1d2=2d1 Sound level (db) Distance from source
Sound decay in free field
with added absorption
01.
Sound decay in reverberant field
02.
Acoustics| Fundamentals of Sound
Reflection, absorption and transmission loss
01. Absorption energy and transmission loss (Z. Maekawa, J.H. Rindel, P. Lord, p.10)
02. Sound decay in open field related to distance (M. David Egan,p.119)
INPUT GEOMETRY
Perforation pattern
Geometry I
Frequency input
Geometry II
Ratio input
OUTPUT GEOMETRY
82
Local Scale
Local Scale
Acoustics|
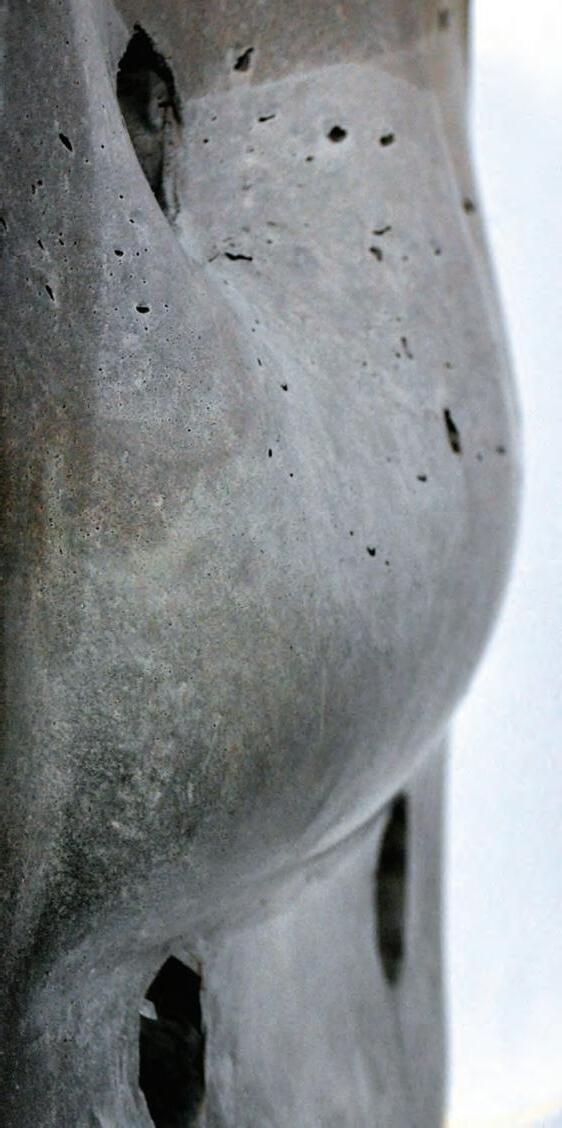
02.2 Local Scale
Introduction
The absorption, reflection and transmission of the wave’s energy, is closely related to the thickness of the material of a surface. As a solid homogenous material, concrete can reflect the sound waves incidents on its surface and when sufficiently dense it can effectively reduce the transmission of the sound that is directly transmitted through it.
The aim in this research is to control the amount of energy absorbed, reflected and transmitted, by using the properties of concrete, and also by introducing a perforation pattern on the surface which will be related to Sound frequency resonanse and amount of energy absorbed.
The formwork pattern, the distance of a Sound Source to the Surface, a frequency range and a Ratio of the hole opening to the closed area of the surface, were the main parameters to manipulate the thickness of the surface and generate a differentiated perforated pattern, responding each time on local values of the previous parameters.
83
Acoustics| Local Scale 01.
01. detail from the Trial 01.1b bulging cast
01.
01.


84 Acoustics| Local Scale| Perforation pattern
Perforation pattern
Perforation details from Formwork_02 Trials
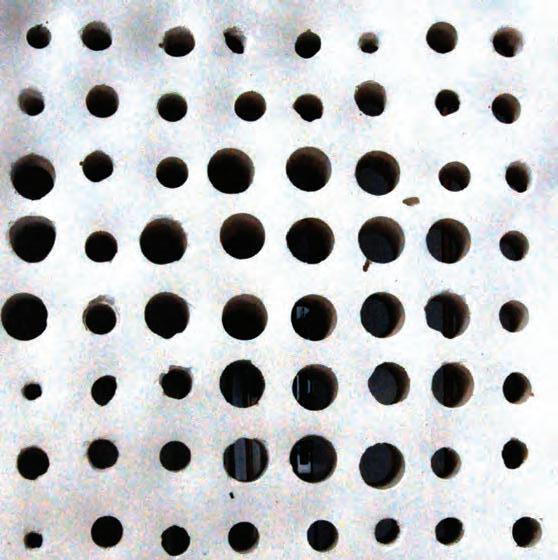
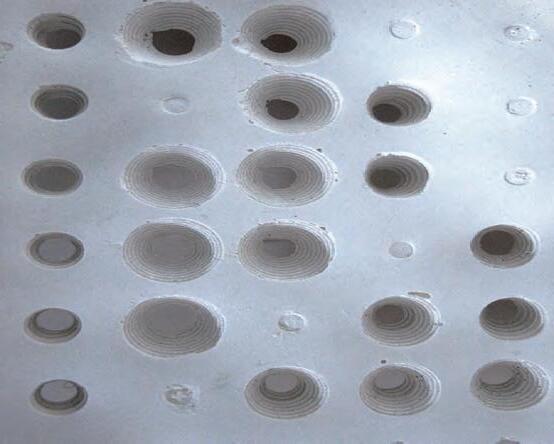
Perforation patterns
The logic of perforation can be explained as follows: “ Air in cavity, whose dimensions are small compared to the wavelength, acts as a spring. When the cavity has a small opening to the outside air in the neck moves as a single mass, the mechanical analogue of which is a mass supported by a spring, thus forming a simple resonator, which is also know as Heimholtz resonator. When sound at the resonant frequency strikes the resonator, the air in the neck vibrates strongly, thus absorbing the sound by viscous loss. Such a single resonator is effective only for a range of frequencies close to the resonant frequency at which is shows a sharp peak. ”(Z. Maekawa, J. H. Rindel, P. Lord, 120).
The idea of perforation is currently applied in panels that are commonly used in front of rigid walls with air separating them from each other.
In the system presented in this research the perforation pattern is integrated into th process of casting concrete. In this way, the geometry is created without the need of additional layers for acoustic perforamnce.
85 Acoustics| Local Scale| Perforation pattern
Formwork pattern A
total number of holes: 289 (17x17)
case_01: 145 (9x9 + 8x8)
case_02: 41 (5x5 + 4x4)
Formwork pattern B
total number of holes: 121 (11x11)
case_01: 61 (6x6 + 5x5)
case_02: 34 (5x5 + 3x3)
Formwork pattern C
total number of holes: 49 (7x7)
case_01:25 (4x4 + 3x3)
case_02: 13 (2x2 + 3x3)
86 Acoustics|
Local Scale| Perforation pattern
case_01
case_02
case_01
case_02
case_01
case_02
Sound decay in reverberant field

Sound decay in free field
The investigation was driven on applying a perforated pattern that is differentiating throughout the concrete surface, in order to be able to control the behaviour of a larger range of frequencies. The differentiation of the cavities and also the amount of surface exposed to sound are controlled parametrically according to the frequency range and the distance of the sound source from the surface. In order to achieve the perforation on concrete curved surfaces from the fabrication point of view,silicone rubber were used, attached to the formwork, as the material should be flexible to maintain the curvature of the desired surface.
The amount of the cavities on the surface depends on the curvature that needs to be achieved and works as a threshold for the maximum value on perforation density. After the surface is treated with the curvature threshold, the distance of the surface from the sound source is taken into account to recalculate the perforation density. The smaller the distance of the sound source from the surface, the more perforation is distributed through the surface. As the cavities act as frequency resonators the further the sound source from the surface the less perforated treatment the surface needs.
Sound decay in reverberant field
The diagrams shown on the following catalogue depict different perforation densities on the formwork, used for the concrete surfaces, and they show how perforation changes as distance from sound source grows or shortens, while also the different patterns of the perforation needed in order to maintain the overall curvature of the surfaces.
87 d1 d2=2d1 d3=2d2 d4=2d3 I= W 4 d 2 10204080 9084 72 noise reduction due to adding absorption little ro no reduction 0 5 10 15 20 d1d2=2d1 Sound level (db) Distance from source
I: sound intensity W: sound power d: distance from source with added absorption 0 5 10 15 20 d1d2=2d1 Sound level (db) Distance from source
6 db reduction from doubling the distance from point source noise reduction due to adding absorption little ro no reduction 0 5 10 15 20 d1d2=2d1 Sound level (db) Distance from source
with added absorption 01. 02. 03. Acoustics|
Local Scale| Perforation pattern
01. Formwork_02 detail with half holes used
02. Sound decay in open field related to distance (M. David Egan,p.119)
03. Sound level decay diagram (M. David Egan,p.123)
• If statement: select every three points
• total number of holes in formwork: 289
• number of holes in the cast: 73
• (case_02)
• If statement: select every other point
• total number of holes in formwork: 289
• number of holes in the cast: 145 (case_01)
• If statement: select every points
• total number of holes in formwork: 289
• number of holes on the cast: 289
• If statement: select every three points
• total number of holes in formwork: 121
• number of holes in the cast: 34 (case_02)
• If statement: select every other point
• total number of holes in formwork: 121
• number of holes in the cast: 61 (case_01)
• If statement: select every points
• total number of holes in formwork: 121
• number of holes on the cast: 121
• If statement: select every three points
• total number of holes in formwork: 49
• number of holes in the cast: 13 (case_02)
• If statement: select every other point
• total number of holes in formwork: 49
• number of holes in the cast: 25 (case_01)
• If statement: select every points
• total number of holes in formwork: 49
• number of holes on the cast: 49
88 Formwork pattern A Distance a Distance b Distance c Formwork pattern B Formwork pattern C da db dc da db dc da db dc
Fabrication| Scale 01| Perforation pattern_ Catalogue
Perforation density pattern on surface according to the distance from the Sound Source to each point
• 10 jump form casts surface
• total number of holes in formwork: 2890
• number of holeson the surface: 1153
• 10 jump form casts surface
• total number of holes in formwork: 1210
• number of holeson the surface: 743
• 10 jump form casts surface
• total number of holes in formwork: 490
• number of holeson the surface: 215
89
FRONT VIEW
FRONT VIEW
FRONT VIEW
Acoustics| Local Scale| Perforation pattern_ Catalogue
90 Acoustics| Local Scale| Perforation pattern
01.
01. Parabolic surface after applying perforation pattern script. Total amount of holes: 381
/Step 1: count the numer of points on every formwork
/Step 2: measure the distance from each point to the Sound Source
/Step 3: (select the points for the perforation):
-If the distance between 0 and a, then add the point to the pattern.
-If the distance is betwen a and b then add every other point of the formwork.
-If the distance is between b and c, then add every two points of the formwork.
-If the distance is bigger then c then add every three points of the formwork.
91 Acoustics| Local Scale| Perforation pattern
pseudocode
perforation density
01. Perforation details from Formwork_02 Trials
F= n*V
2*(L+0.6*d)
n= positive integer (1, 2...) representing the resonance node
L = length of the tube
V = speed of sound in air (approximately 343 m/sec at 20 °C and at sea level)
d = diameter of the resonance tube
The human threshold of feeling, and the lowest pedal notes of a pipe organ
Rhythm frequencies, where the lower and upper bass notes lie
Defines human speech intelligibility, gives a hornlike or tinny quality to sound
Gives presence to speech, where labial and fricative sounds lie
Brilliance, the sounds of bells and the ringing of cymbals
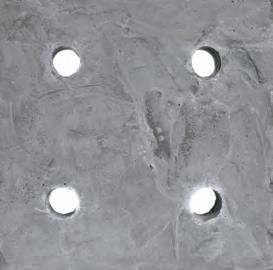
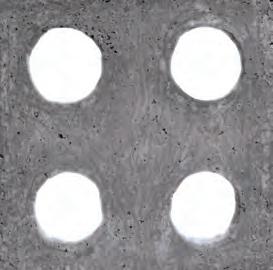

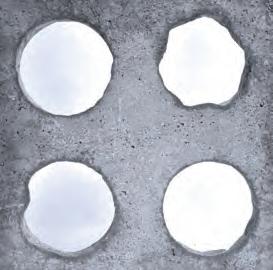
92
L2 d1 d2 d2 d1 d1 d1 L1 L2 d1 d1 Acoustics| Local
input 03. 02. 01. Frequency input
Scale| Frequency
16
32 32 to 512 512
2048 2048
8192
16384 Frequency range
to
to
to 8192
to
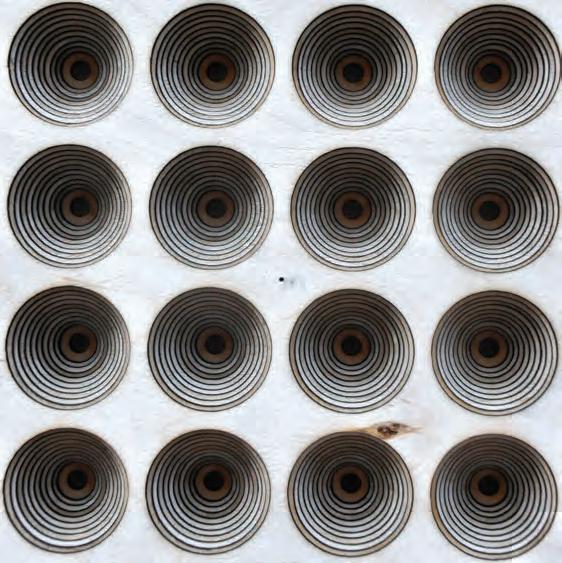
Frequency input
As mentioned in (Z. Maekawa, J. H. Rindel, P. Lord, 120) a single resonator (cavity) is effective only for a limited range of frequency but they are useful in controlling boom, resulting from a specific low frequency due to the natural vibration of the air and is essential that cavities are rigid. Also, in order to increase the absorption the dimension of the resonator must be relatively small in comparison to the frequencies wavelength.
The diagrams shown on the following catalogue show variation in the geometry of the cavities and in the size of the diamteres, depentend on different frequency ranges. The catalogue is also driven from the acoustic tests (shown in th last part of this chapter), in which the absorption, reflection and transmission of the different diameters of cavities were tested, when hit by a range of frequencies.
The thickness of the concrete cavities remain the same throughout the whole experiment process, so the results were only referring to the different diameter of the cavities and the differentiation of their geometry as they change from circular to conical ones.
93 Acoustics| Local Scale| Frequency input
01.
01. formwork for conical spacers, from Scale_02 of Fabrication chapter
• n=1
• V=343 m/sec
• l1=0.15m
• factor: 15
• diameter range: 0.12 to 0.08
• n=1
• V=343 m/sec
• l1=0.15m
• factor: 15
• diameter range: 0.08 to 0.06
• n=1
• V=343 m/sec
• l1=0.30m
• factor: 15
• diameter range: 0.09 to 0.06
• n=1
• V=343 m/sec
• l1=0.30m
• factor: 15
• diameter range: 0.06 to 0.04
94 d1 d2 l2 d1 d2 l2 d1 d2 l2 d1 d2 l1 d1 d2 l2 d1 d2 l1 222 Thickness l2=2*l1 Thickness l1 Frequency range 100 to 250 Frequency range 250 to 500
Fabrication| Scale 01| Frequency input_ Cavity goemetry Catalogue
F= n*V 2*(L+0.6*d)
• n=1
• V=343 m/sec
• l1=0.15m
• factor: 15
• diameter range: 0.06 to 0.35
• n=1
• V=343 m/sec
• l1=0.15m
• factor: 15
• diameter range: 0.03 to 0.02
• n=1
• V=343 m/sec
• l1=0.30m
• factor: 15
• diameter range: 0.04 to 0.02
• n=1
• V=343 m/sec
• l1=0.30m
• factor: 15
• diameter range: 0.02 to 0.01
95 Acoustics| Local Scale| Frequency input_ Cavity geometry Catalogue a1 a2 l2 d1 d2 l1 d1 d2 l2 d1 d2 l1 a1 a2 l2 d1 d2 l2
range 500 to 750 Frequency range 750 to 1000
Frequency
01. Surface after applying perforation density script and frequency range according to distance from the Sound Source to each point
96 Acoustics| Local Scale| Frequency input
SIDE VIEW
01. TOP VIEW FRONT VIEW


In order to achieve the control of a larger range of frequencies except from the definition that controls the density of the perforation according to the distance of the surface from the sound source and the frequency values, different geometry of the cavities were also introduced in the script logic. Having a conical cavity would result to a more interactive cavity that could react to a larger range of frequencies as the diameter of the cavity changes as the cavity goes deeper, so the thickness of the surface grows.
The variation in the geometry of each cavity results from the distance from the Sound Source to each point. Also, the frequency range hit on each point is different, related to the sound decay according to this distance. The further away from the Sound source, the less is the differantiation in the geometry of the holes (resulting in cylindrical tubes of bigger diamater) while the smaller the distance is, the geometry of the hole becomes conical and the diamatere of each hole dicrease to resonate higher frequency ranges.
The following catalogue shows the logic of the process of the second stage of the script. In an initial step the perforation treatment was applied, in terms of perforation density, on the selected surface according to the desired distance of the surface from the point source. In this second stage the definition on the already perforated surface was used, in order to define the different geometry of the cavities that are needed in order to manipulate the selected sound source distance.
Different frequency ranges were inputed in ths script, on a given thickness of a surface and on a given Sound Source point. The perforation density and geometry of the cavities varies according to these two parameters. Additioanly, a diameter threshold was introduced, in order to avoid overlaping of the holes, respecting the frequency range needed to be resonated.
97 Acoustics| Local Scale| Frequency input
01. Parabolic surface after applying perforation density script
02. Parabolic surface after applying perforation density and Frequency range
03. Rubber spacer casts from Scale_02 of Fabrication chapter
04. 02. 03. 01.
04. Detail from perspective view of surface with perforation pattern and frequency input applied
• n=1
• V=343 m/sec
• l1=0.15m
• factor: 15
• min distance from Ss to point: 1.00m
• max distance from Ss to point: 7.00m
• front surface, diameter range: 0.09m to 0.23m
• back surface, diameter range: 0.09m to 0.19m
• number of points: 264
• min difference between front diameter circle and back: 0
• max difference between front diameter circle and back: 0.08m
• n=1
• V=343 m/sec
• l1=0.15m
• factor: 15
• min distance from Ss to point: 1.00m
• max distance from Ss to point: 7.00m
• front surface, diameter range: 0.08m to 0.22m
• back surface, diameter range: 0.08m to 0.18m
• number of points: 423
• min difference between front diameter circle and back: 0
• max difference between front diameter circle and back: 0.08m
98
100
Fabrication| Scale 01| Frequency input_ Frequency - Thickness Catalogue Thickness l2=2*l1 Thickness l1
Frequency range
to 250
Frequency range 250 to 500
• n=1
• V=343 m/sec
• l1=0.15m
• factor: 15
• min distance from Ss to point: 1.00m
• max distance from Ss to point: 7.00m
• front surface, diameter range: 0.07m to 0.020m
• back surface, diameter range: 0.07m to 0.17m
• number of points: 423
• min difference between front diameter circle and back: 0
• max difference between front diameter circle and back: 0.08m
• n=1
• V=343 m/sec
• l1=0.15m
• factor
• min distance from Ss to point: 1.00m
• max distance from Ss to point: 7.00m
• front surface, diameter range: 0.06m to 0.18m
• back surface, diameter range: 0.06m to 0.16m
• number of points: 264
• min difference between front diameter circle and back: 0
• max difference between front diameter circle and back: 0.075m
99
Acoustics| Local Scale| Frequency input_ Frequency - Thickness Catalogue
• n=1
• V=343 m/sec
• l1=0.15m
• factor: 15
• min distance from Ss to point: 1.00m
• max distance from Ss to point: 7.00m
• front surface, diameter range: 0.06m to 0.16m
• back surface, diameter range: 0.06m to 0.12m
• number of points: 264
• min difference between front diameter circle and back: 0
• max difference between front diameter circle and back: 0.08m
• n=1
• V=343 m/sec
• l1=0.15m
• factor: 15
• min distance from Ss to point: 1.00m
• max distance from Ss to point: 7.00m
• front surface, diameter range: 0.05m to 0.015m
• back surface, diameter range: 0.05m to 0.10m
• number of points: 423
• min difference between front diameter circle and back: 0
• max difference between front diameter circle and back: 0.04m
100
500
750 Fabrication| Scale 01| Frequency input_ Frequency- Thickness Catalogue Thickness l2=2*l1 Thickness l1
Frequency range
to
Frequency range 750 to 1000
• n=1
• V=343 m/sec
• l1=0.15m
• factor: 15
• min distance from Ss to point: 1.00m
• max distance from Ss to point: 7.00m
• front surface, diameter range: 0.21m to 0.132m
• back surface, diameter range: 0.21m to 0.08m
• number of points: 423
• min difference between front diameter circle and back: 0
• max difference between front diameter circle and back: 0.03m
• n=1
• V=343 m/sec
• l1=0.15m
• factor
• min distance from Ss to point: 1.00m
• max distance from Ss to point: 7.00m
• front surface, diameter range: 0.018m to 0.09m
• back surface, diameter range: 0.018m to 0.07m
• number of points: 264
• min difference between front diameter circle and back: 0
• max difference between front diameter circle and back: 0.03m
101
Acoustics| Local Scale| Frequency input_ Frequency - Thickness Catalogue
script and frequency script
102 Acoustics| Local Scale| Frequency input
01. Parabolic surface after applying perforation density
01.
/Step 1: give sound frequency range F=n*V/2*(L+0.6*d)
/Step 2: measure the distance from each point to the Sound Source (d)
/Step 3: reduce frequency range according to the distance (d)
-If the distance is bigger then b, then rad1=rad1 (cylindrical tube) Frequency input pseudocode
/Step 4: taking account the frequency reduction andalso the given thickness of the surface, give the radius (rad) for each point (from the Frequency formula. The radius is a range of values, depending the Frequency range)
/Step 5: according to the distance and the radius for each point, give the radius (rad1) of the hole at the back of the surface (to control the geometry of each hole):
-If the distance between 0 and a, then rad1=rad/d*2 conical hole)
-If the distance is between a and b then rad1=rad/d (conical hole)
103 Acoustics| Local Scale| Frequency input
01. offseting a surface by 0.15m
01a.symmetrically
01b. inside
01c. outside
02. offseting a surface by 0.50m
02a.symmetrically
02b. inside
02c. outside
The curvature of the parabola Sherwood
104 Ratio input Acoustics| Local Scale| Ratio input
01a. 02a. 01b. 02b. 01c. 02c. 01. 02.
Ratio input
In order to achieve an additional control on the amount of Sound energy absorbed from the surface, the local thickness of the surface needs to be defined. The reason for that is due to the formula that relates the open area of the surface to the closed area of the surface, including the area of the tubes:
R=open area/closed area
This Ratio represents an additional criteria to the perforation script logic, since it relates it to the the length of each tube.
In order to include this ratio, the type of offseting the surface needs to be decided. In this initial step, three default types of offseting were investigated: the symmetrical offseting, the offseting inside the surface and the offseting outside of the surface. In all these cases, the geometry of the surface changes and also the distance from the Sound Source. The last reason made vital to re-define the offseting of the surface, responding to this distance.
105
Acoustics| Local Scale| Ratio input
01. offseting a surface by 0.15m outside
01.
01. offseting a surface by 0.15m depending on the distance from a Sound Source to the surface.
01a.symmetrically
01b. inside
01c. outside
106 Acoustics| Local Scale| Ratio input
01a. 01b. 01c. 01.
Through the development of the script, a more controllable behavior of the surface towards the distance from the sound source was vital and thus to introduce another parameter that would enable to achieve a better control according to a new threshold. As the density of the perforation and the geometry of the cavities related to the distance from the sound source to the thickness of the cavities is already controled, in this section, an additional idea was embedded to the previous scripts that also defines the reaction of the surface to the distance from the sound source. This time, the manipulation by locally differentiating the thickness of the cavities according to the ratio that relates was achieved.
In order to achieve the thickness differentiation of the cavities the surface is offseted in specific points, which are calculated by embedding the above ratio in our script, thus it is adding thickness to the existing surface. The amount of the offset in the first place was meant to be calculated through structural analysis, but in this case an equal offset of the surface is shown.
On this final stage of the evolution of our definition, the change of the perforation of the surface, the geometry of the cavities and the local differentiation of the thickness of the cavities are related according both to the ratio of diameter of cavities to the surface exposed and the resonation of the desired frequency range.
The Ratio embedded in the logic of the script redefines several parameters. In the previous step, a diameter range for the cavities was calculated according to a range of Sound of frequency on a given surface thickness. The Ratio alters the local thickness of the surface, thus the length of the tubes. This result in re-definition of the diameter range in order to respond also to the Frequency range input.
For the above purpose the Galapagos component was introduced in the script. On a given Frequency range and a Ratio, the Galapagos component gives a range of possible solutions for the size of the cavities related to their length. After several calculations (the number of iterations depends on the values of the Ratio and frequency given each time), the fittest outcome according to our criteria is given. Using the generative algorithm of the Galapagos we were able to create a catalogue of surfaces treated with different perforation patterns and thickness.
In the following catalogue, variations of the manipulation of a parabolic surface is shown, when different frequency range and Ratio is applied. The Sound Source point in all these variations remain the same, thus the offseting of the surface is dependent only on the length of the tubes, resulting from these two inputs.
01. offseting a surface symmetrically, depending on the distance from a Sound Source to the surface. The thickness of the surface changes locally, depending the distance
107 Acoustics| Local Scale| Ratio input 01.
• n=1
• V=343 m/sec
• factor: 15
• distance range from Ss:1.00m-7.00m
• min l:0.25m
• max l:0.56m
• range: 0.10m to 0.23m
• n=1
• V=343 m/sec
• factor: 15
• distance range from Ss:1.00m-7.00m
• min l:0.30m
• max l:0.45m
• range: 0.05m to 0.21m
Frequency range 100 to 250
108 Ratio 2: 0.50 Fabrication| Scale 01| Ratio input_ Frequency/ Ratio surafce Catalogue Ratio : 1.00
Frequency range 250 to 500
• n=1
• V=343 m/sec
• factor: 15
• distance range from Ss:1.00m-7.00m
• min l:0.23m
• max l:0.42m
• range: 0.05m to 0.18m
• n=1
• V=343 m/sec
• factor: 15
• distance range from Ss:1.00m-7.00m
• min l:0.29m
• max l:0.51m
• range: 0.03m to 0.17m
109 Acoustics| Local Scale| Ratio input_ Frequency/ Ratio Surface Catalogue
• n=1
• V=343 m/sec
• factor: 15
• distance range from Ss:1.00m-7.00m
• min l:0.35m
• max l:0.62m
• range: 0.02m to 0.17m
• n=1
• V=343 m/sec
• factor: 15
• distance range from Ss:1.00m-7.00m
• min l:0.27m
• max l:0.52m
• range: 0.02m to 0.14m
Frequency range
110
500
750 Ratio 2: 0.50 Ratio : 1.00
to
Fabrication| Scale 01| Ratio input_ Frequency/ Ratio surafce Catalogue
Frequency range
750 to 1000
• n=1
• V=343 m/sec
• factor: 15
• distance range from Ss:1.00m-7.00m
• min l:0.28m
• max l:0.43m
• range: 0.012m to 0.15m
• n=1
• V=343 m/sec
• factor: 15
• distance range from Ss:1.00m-7.00m
• min l:0.32m
• max l:0.61m
• range: 0.03m to 0.09m
111
Acoustics| Local Scale| Ratio input_ Frequency/ Ratio Surface Catalogue
01. Frequency and ration input give a range of possible solutions that responds to both criteria.
(1c,1d,1e)
112 Acoustics| Local Scale| Ratio input Frequency range input Ratio input Iterations to satisfy R+F
01a. 01b. 01c. 01.
Iterations to satisfy R+F
/Step 1: give frequency range
/Step 2: give Ratio (R)
/Step 3: offset the surface:
/Step 3a: measure the distance of the Sound Source to each point and give length (l) (which is going to be the length of each hollow tube)
/Step 3b: move each point on the normal of the surface at that point, and length l
/Step 4: measure the Ratio (r1) (area of open space/area of closed space)
/Step 5: (Galapagos embedded)
-If R-0.01<r1<R+0.01 then exit sub
-If R-0.01<>r1<>R+0.01 then change the diameter of the holes so that it satisfies both R condition and F range (the diameter of each hole is a range of values depending on the given Frequency range). Give the closest solution (in some cases is a range of possible solutions, sometimes there is no solution that satisfy both conditions)
113 Acoustics| Local Scale| Ratio input
Output
Ratio+ Frequency
pseudocode 01d. 01e.
input
Formwork pattern A
1. Contemporary practices for forming concrete are currently undeveloped in the way that conventional formwork only allows for the production of a single form. This method of
Formwork pattern B
Formwork pattern C
Perforation pattern generated in relation to the distance from the Ss and the formwork types
114
Initial Surface
Acoustics| Local Scale| Conclusions
Variations in the geometry of the perforation cavitieson a surface of a given thickness, in relation to a Frequency range and a Sound Source
Variations in the geometry of the perforation holes and local thickness of the surface, in relation to a frequency range and the Ratio of open area to closed area
Conclusions
From the final definition we were able to control the perforation pattern, the geometry and local thickness of the cavities in order to be able to combine the distance of the sound source and the frequency range, thus controlling the reflection, absorption and transmission of the desired frequency range and the sound wave energy. The outcome of the process is a parametric definition that can define different treatment solutions for any desired surface according to the above parameters and is able to produce different results for a range of frequencies and ratios needed. The perforation density and cavity geometry is also related on the curvature of the surface, that can be easily tested for structural integrity.
It is essential to mention that in some cases, multiple possible solutions were given that satisfy both a frequency range and a Ratio, while in other cases there was no result satisfying both criteria. This means that only a certain combination of the Frequency range and Ratio can be solved by the manipulation of the surface as described above.
Some acoustic experiments were performed in order to test these digital methods. Using the full scale concrete casts, the transmission and reflective values were recorded and analyzed with a frequency range from 1000 to 16000.
115
Acoustics| Local Scale| Conclusions

116 Acoustics

117 Acoustics
ACOUSTIC TESTS
01.Empty chamber control results for reflection
02. Diagram of positioning of elements for reflection tests
03. Diagram of positioning of elements for transmission tests
04. Emtpy chamber control results for transmission
05. Exploded perspective of components of acoustic tests

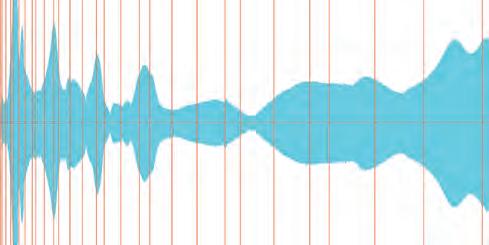
118 Fabrication| Scale 03| Sound test 01. 03. 05. 02. 04.
04.
Acoustic test

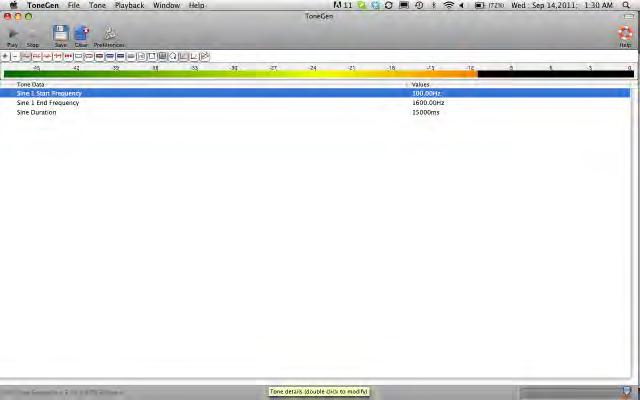
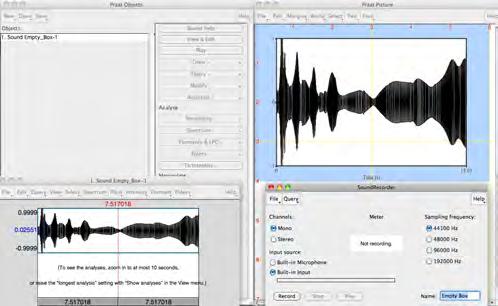
02.
Acoustic test
An acoustic box was made for the full-scale experiments of the concrete casts. The acoustic box was made with a plywood exterior with 4 cm acoustic foam interior lining.
In order to create multiple frequencies, the application, ToneGen was used to create sine wave frequencies which linearly increases the frequency from 100 Hz to 1600 Hz.
The application, Praat, was used to analyze the sound recorded by the microphone. Within this program, a chart measuring the volume recieved by the microphone is created.
Considering the range of frequency is linearly increased, the resulting graph can be reunitized from time (s) to frequency (Hz). Overlayed on this graph is the musical note frequencies within the range of 100 to 1600 Hz, which shows a range of almost four octaves.
03. Screenshot image of Praat, the acoustic recording software used to obtain data
04. Chart of range of notes used in physical experiments
119 Fabrication| Scale 03| Sound test E4 D4 C4 B3 A3 G3 F3 E3 D3 C3 B2 A2 G2 F2 E2 D2 C2 B1 A1 G1 F1 E1 D1 C1 B0 A0 G0 F0 105 117 132 140 157 176 198 209 235 264 279 314 352 395 419 470 527 559 627 704 790 837 940 1050 1110 1250 1400 1580 Musical Note Musical Note Frequency (Hz) Frequency (Hz)
01. Image of acoustic chamber that was fabricated for the testing of the different concrete casts
Screenshot image of ToneGen, the software used to create a range of frequencies
02.
01.
03. 04.
ACOUSTIC TESTS
01. Graph overlay of reflection tests between the empty box (blue) and the cast (grey)
02. Series of images showing the process of casting and resultant form of the concrete slab.
Reflection Graph

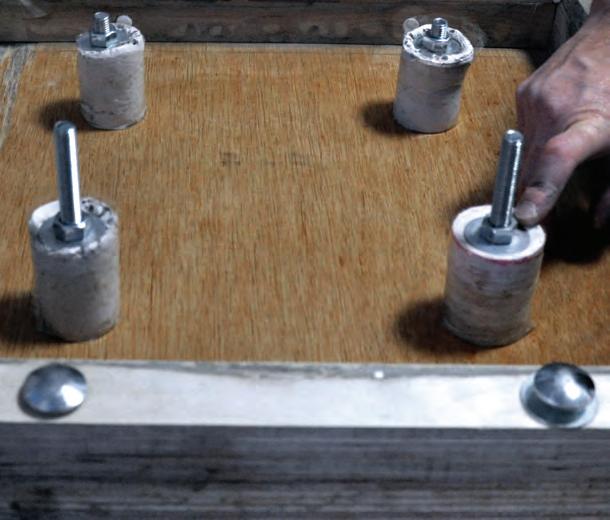


120 Fabrication| Scale 03| Trial 03.1a 02. 01. FORMWORK_03 A c1 c2 c1 A c1 c2 c1 100 Hz 0 +1 -1 1600 Hz Frequency Range Amplitude
Empty Chamber Tile 3.1a


The flat slab with a set of 8 cm diameter perforations was cast and tested in the acoustic chamber.
What was observed from the graph was a dramatic increase in the acoustic reflection in comparison to the empty chamber.
In the transmission test, there was a general decrease in volume transfered from the the oposite end of the acoustic chamber. What was interesting was the dramatic decrease in the mid to higher frequencies as opposed to the lower bass frequencies.
121 Fabrication| Scale 02| Trial 03.1a FORMWORK_03 A c1 c2 c1 A c1 c2 c1 Trial
100 Hz 0 +1 -1 1600 Hz Frequency Range Amplitude
03.1a
01. Graph overlay of transmission tests between the empty chamber (blue) and the cast (grey)
Transmission Graph Empty Chamber Tile 03.1a 02. 01.
02. Image of the surface which the speaker was pointed at
01. Graph overlay of reflection tests between the empty chamber (blue) and the cast (grey)
02. Series of images showing the process of casting and resultant form of the concrete slab.

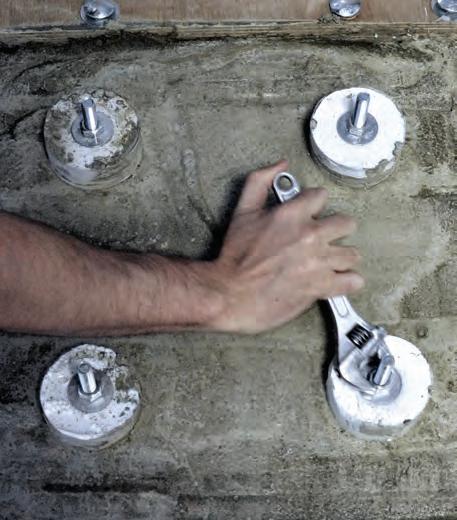


122
Fabrication| Scale 03| Trial 03.2a FORMWORK_03 A c1 c2 c1 A c1 c2 c1
02.
100 Hz 0 +1 1600 Hz Frequency Range Amplitude Empty Chamber Tile 3.2a 01.
Reflection Graph


The flat slab with a set of 10 cm diameter perforations was cast and tested in the acoustic chamber.
The reflection tests were very similar to test 03.1a. There was a larger spike in volume around the lower frequency where we suspect to be the natural frequency of the acoustic chamber.
In the transmission test there was a minor increase in volume in all frequencies. There was a spike of volume in the lower frequency where the volume was recorded to be louder than the empty chamber test.
123
02. 01. Fabrication| Scale 02| Trial 03.2a FORMWORK_03 A c1 c2 c1 A c1 c2 c1
Trial 03.2a
01. Graph overlay of transmission tests between the empty chamber (blue) and the cast (grey)
Transmission Graph 100 Hz 0 +1 -1 1600 Hz Frequency Range Amplitude Empty Chamber Tile 3.2a
02. Image of the surface which the speaker was pointed at
01. Graph overlay of reflection tests between the empty chamber (blue) and the cast (grey)
02. Series of detail images of the concrete cast

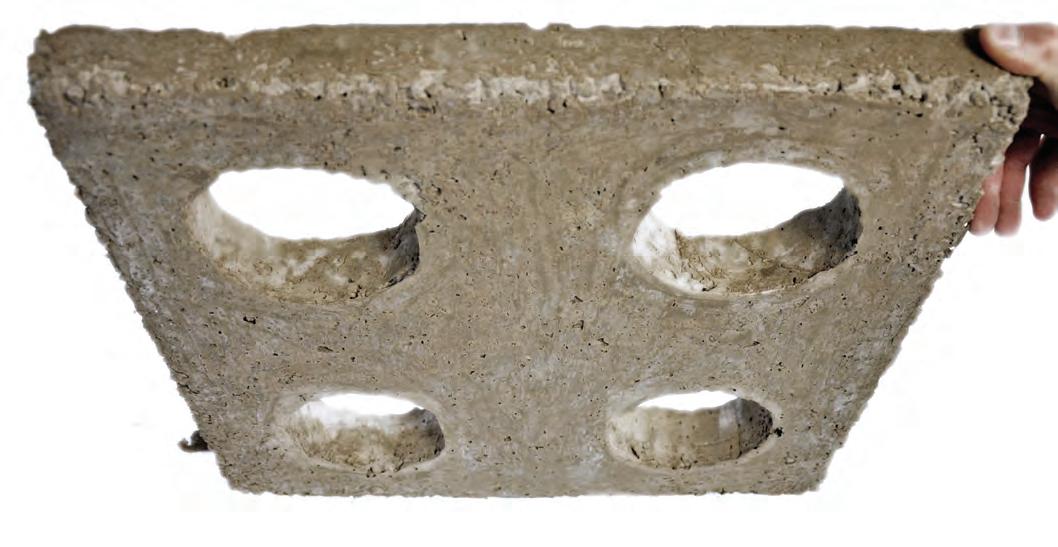

124 1600 Hz Fabrication| Scale 03| Trial 03.3a
FORMWORK_03 A c1 c2 c1 A c1 c2 c1 0
02.
-1 Reflection Graph 100 Hz +1 Frequency Range Amplitude Empty Chamber Tile 3.3a 01.

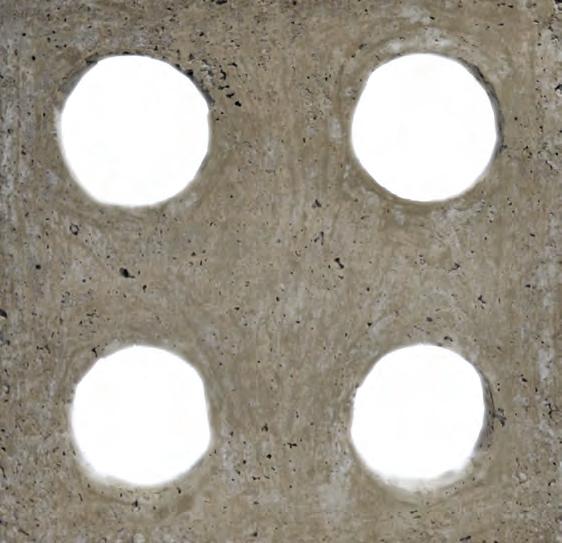
The flat slab with a set of 14 cm diameter perforations was cast and tested in the acoustic chamber.
There was a general decrease in volume recorded in the reflection test.
The transmission test showed a slight overall increase in volume. The spike in volume as observed in the previous test also remains in this test as well.
125
Fabrication| Scale 02| Trial 03.3a 02. 01. FORMWORK_03 A c1 c2 c1 A c1 c2 c1
Trial 03.3a
01. Graph overlay of transmission tests between the empty chamber (blue) and the cast (grey)
100 Hz 0 +1 -1 1600 Hz Frequency Range Amplitude Empty Chamber Tile 3.3a
02. Image of the surface which the speaker was pointed at
Transmission Graph


126 Fabrication| Scale 03| Trial 03.4a
01. Graph overlay of reflection tests between the empty chamber (blue) and the cast (grey)
A c1 c2 c1 A c1 c2 c1 Reflection Graph 100 Hz 0 +1 1600 Hz Frequency Range Amplitude Empty Chamber Tile 3.4a 02. 01.
02. Detail image of the concrete cast

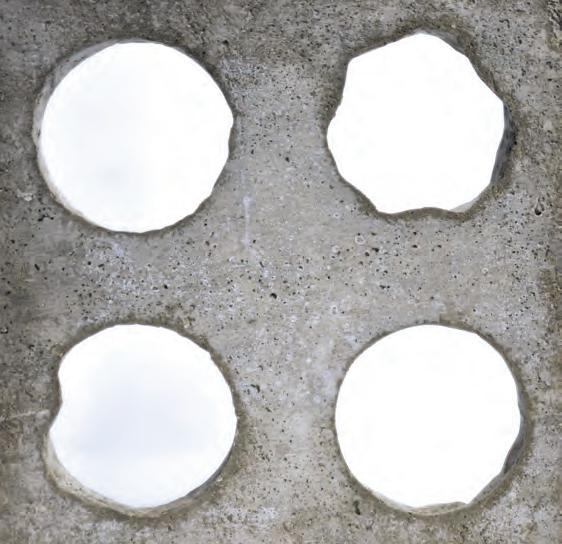
Trial 03.4a
The flat slab with a set of 16 cm diameter perforations was cast and tested in the acoustic chamber.
In the lower to mid frequencies, the reflection volume almost matches that of the empty chamber.
The transmission test shows a more pronounced spike in the lower mid frequencies. The higher frequencies also showed a general increase however still less intense than in the empty chamber.
127 Fabrication| Scale 02| Trial 03.4a
01. Graph overlay of transmission tests between the empty chamber (blue) and the cast (grey)
A c1 c2 c1 A c1 c2 c1
100 Hz 0 +1 -1 1600 Hz Frequency Range Amplitude Empty Chamber Tile 3.4a 02. 01.
02. Image of the surface which the speaker was pointed at
Transmission Graph
01. Graph overlay of reflection tests between the empty chamber (blue) and the cast (grey)
02. Series of images showing the process of casting and resultant form of the concrete slab.
Reflection Graph

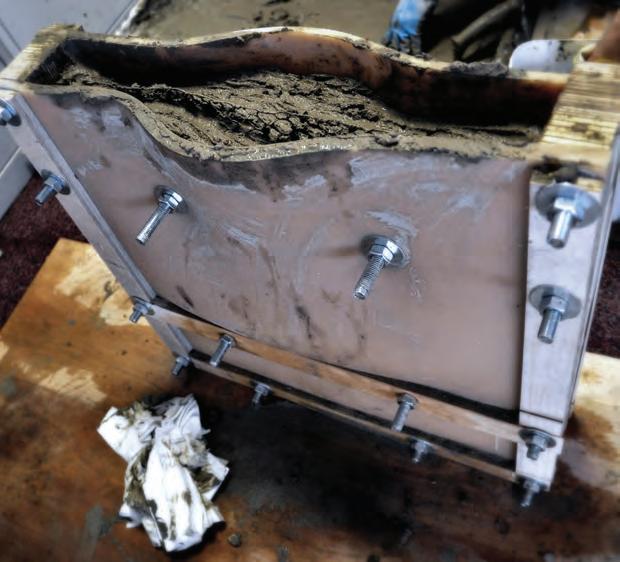

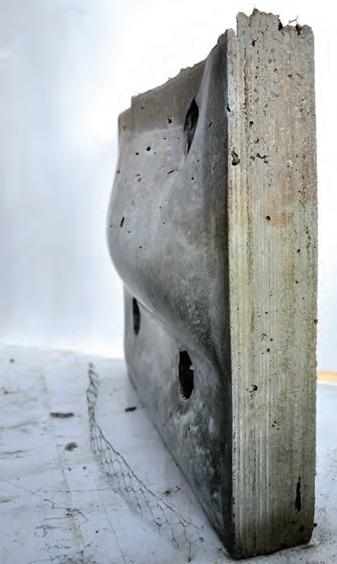
128 Fabrication| Scale 03| Trial 03.1b FORMWORK_03 A c1 c2 c1 A c1 c2 c1
100 Hz 0 +1 1600 Hz Frequency Range Amplitude Empty Chamber Tile 3.1b 02. 01.


Trial 03.1b
The flat slab with a set of 8 cm diameter perforations was cast and tested in the acoustic chamber.
In the reflection tests, there was an overall averaging, where the peaks and depressions seems to move towards a median.
The transmission tests show that the majority of the frequencies are lower volumes except in the lower frequency where there is a large spike. Also in the higher frequency, the volume increases.
129
Fabrication| Scale 02| Trial 03.1b FORMWORK_03 A c1 c2 c1 A c1 c2 c1
01. Graph overlay of transmission tests between the empty chamber (blue) and the cast (grey)
Transmission Graph 100 Hz 0 +1 -1 1600 Hz Frequency Range Amplitude Empty Chamber Tile 3.1b 02. 01.
02. Image of the surface which the speaker was pointed at
01. Graph overlay of reflection tests between the empty chamber (blue) and the cast (grey)
02. Series of detail images of the concrete cast Reflection Graph


130 Fabrication| Scale 03| Trial 03.2b FORMWORK_03 A c1 c2 c1 A c1 c2 c1
100 Hz 0 +1 1600 Hz Frequency Range Amplitude Empty Chamber Tile 3.2b 02. 01.

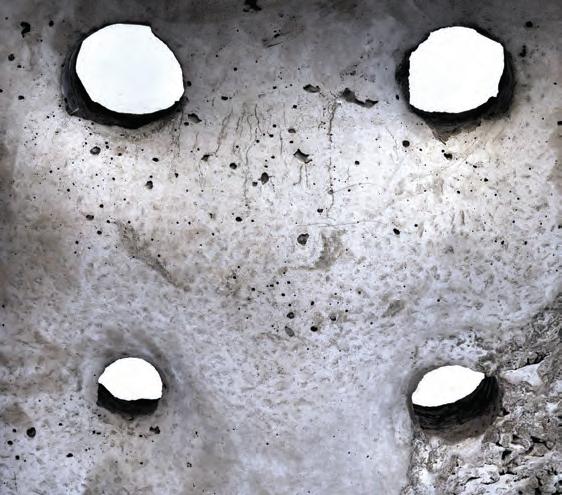
The flat slab with a set of 10 cm diameter perforations was cast and tested in the acoustic chamber.
The reflection tests shows an overall growth of lower frequencies.
In the transmission tests, there was a growth in the middle frequencies with the same spike in the lower frequencies as recorded in the last test.
131 Fabrication| Scale 02| Trial 03.2b
FORMWORK_03 A c1 c2 c1 A c1 c2 c1
Trial 03.2b
01. Graph overlay of transmission tests between the empty chamber (blue) and the cast (grey)
Transmission
100 Hz 0 +1 -1 1600 Hz Frequency Range Amplitude Empty Chamber Tile 3.2b 02. 01.
02. Image of the surface which the speaker was pointed at
Graph
01. Graph overlay of reflection tests between the empty chamber (blue) and the cast (grey)
02. Detail image of the concrete cast Reflection Graph

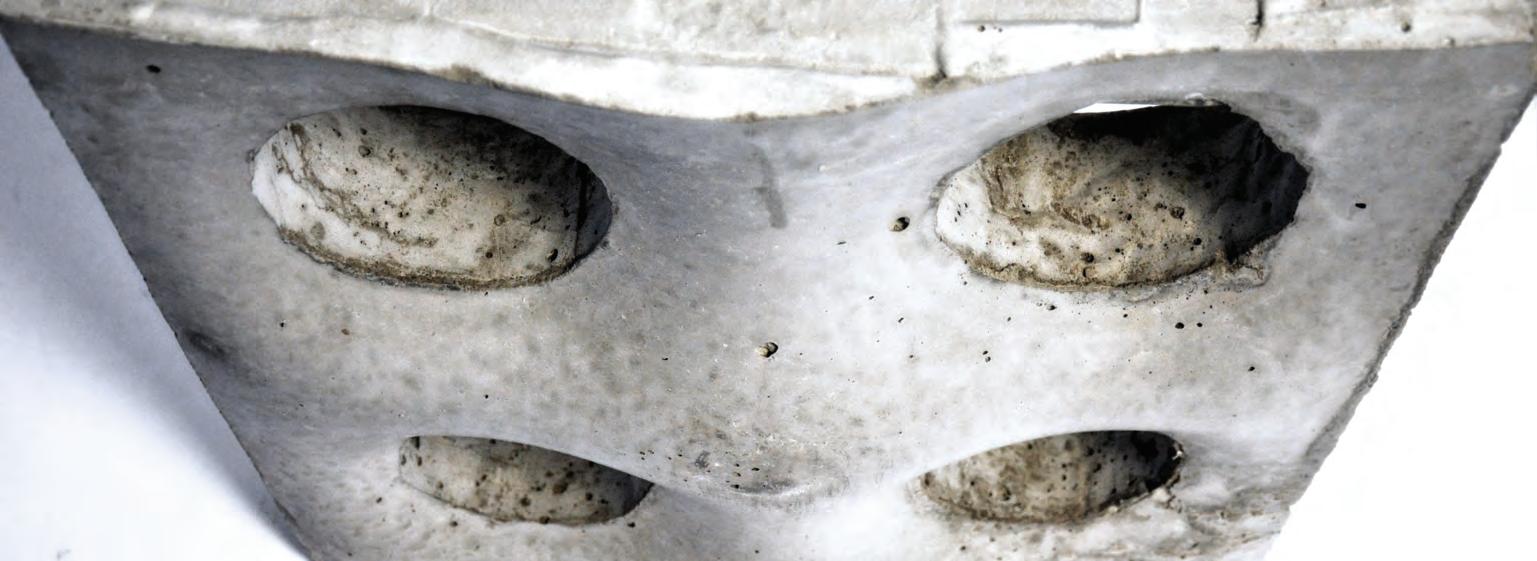
132 Fabrication| Scale 03| Trial 03.3b FORMWORK_03 A c1 c2 c1 A c1 c2 c1
100 Hz 0 +1 1600 Hz Frequency Range Amplitude Empty Chamber Tile 3.3b 02. 01.

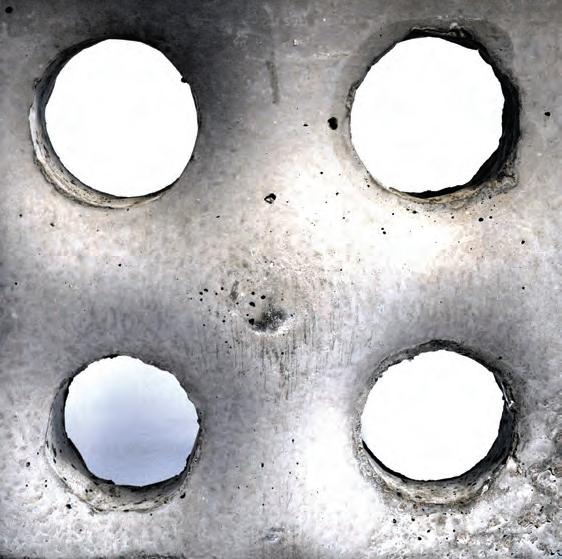
The flat slab with a set of 14 cm diameter perforations was cast and tested in the acoustic chamber.
The reflection test shows a gradual trend to match that of the empty chamber. There was noticible growth in the lower frequencies.
There was also growth in the intensity of the volume in the transmission in this experiment.
133 Fabrication| Scale 02| Trial 03.3b
FORMWORK_03 A c1 c2 c1 A c1 c2 c1
Trial 03.3b
01. Graph overlay of transmission tests between the empty chamber (blue) and the cast (grey)
100 Hz 0 +1 -1 1600 Hz Frequency Range Amplitude Empty Chamber Tile 3.3b 02. 01.
02. Image of the surface which the speaker was pointed at
Transmission Graph
01. Graph overlay of reflection tests between the empty chamber (blue) and the cast (grey)
02. Series of images showing the process of casting
Reflection Graph

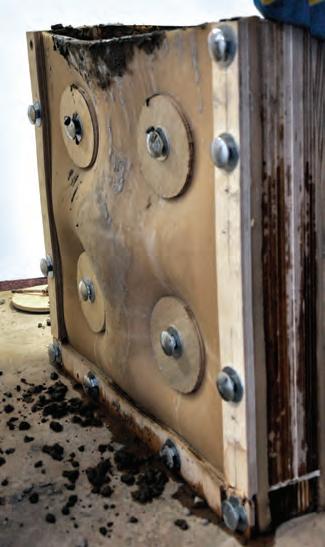

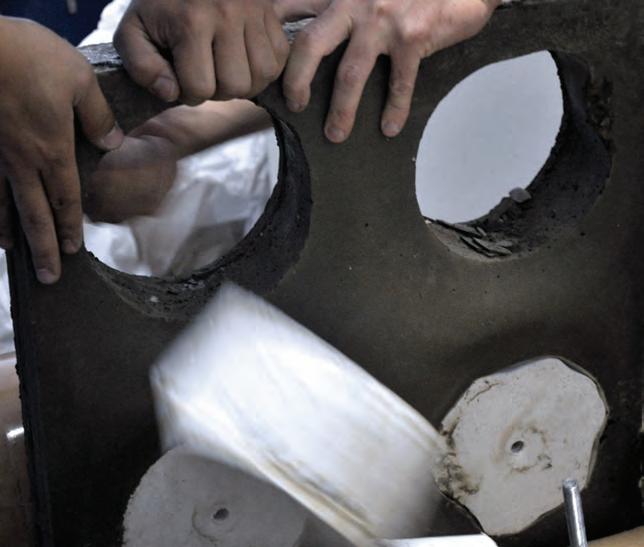
134 Fabrication| Scale 03| Trial 03.4b FORMWORK_03 A c1 c2 c1 A c1 c2 c1
Empty Chamber Tile 3.4b 100 Hz 0 +1 1600 Hz Frequency Range Amplitude 02. 01.


Trial 03.4b
The flat slab with a set of 14 cm diameter perforations was cast and tested in the acoustic chamber.
The reflection test shows a gradual trend to match that of the emtpy chamber. There was noticible growth in the lower frequencies.
There was also growth in the intensity of the volume in the transmission in this experiment.
135 Fabrication| Scale 02| Trial 03.4b FORMWORK_03 A c1 c2 c1 A c1 c2 c1
01. Graph overlay of transmission tests between the empty chamber (blue) and the cast (grey)
Empty Chamber Tile 3.4b 100 Hz 0 +1 -1 1600 Hz Frequency Range Amplitude 02. 01.
02. Image of the surface which the speaker was pointed at
Transmission Graph
When overlaying the reflection graphs of the flat tests, there is a trend of the higher frequencies to be reflected as the size of perforations become smaller. In the lower frequencies, there was no dramatic change of the reflection than an empty box. An analysis of the differences between the flat samples and the bulging will be covered later. It is interesting that there is a grouping pattern of strong frequencies in the low, medium, and high ranges.
Reflection overlays of flat casts
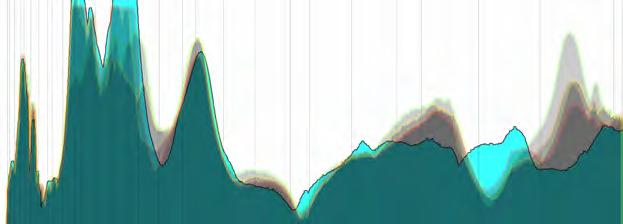
16 cm perforations
14 cm perforations
10 cm perforations
8 cm perforations
Empty chamber
01. Graph overlaying the reflection results of flat casts
02. Graph overlaying the reflection results of flexible formwork casts.
03. Graph overlaying the transmission results of flat casts
04. Graph overlaying the transmission results of flexible formwork casts
When overlaying the reflection graphs of the flexible formwork tests, there seems to be a steady similarity of volume in the mid to high frequency as the size of the perforations become smaller. There was no significant changes in the lower frequencies from the empty chamber.
Reflection overlays of flexible formwork casts
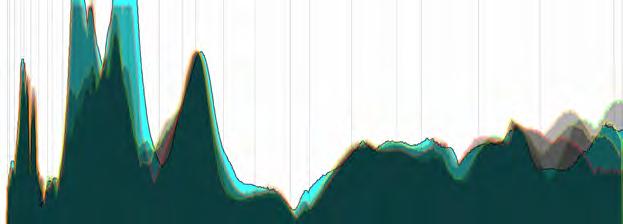
Transmission overlays of flat casts
The overlay of the transmission graphs show a gradual increase in volume as the perforations become larger. The largest differences are in the lower frequencies.
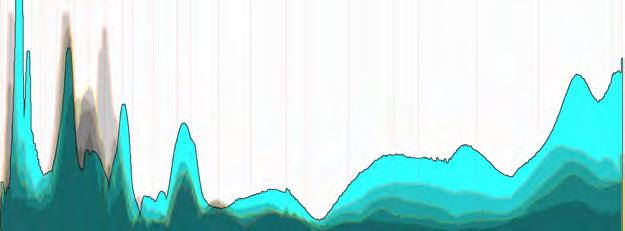
Transmission overlay of flexible formwork casts
The bulging casts as a whole tended to resemble the empty chamber more than the flat casts, though the greatest deviation is in the middle ranges. There is a very tight grouping of unchanged volumes in the lower frequencies except for a few volume peaks observed in the empty box graph. There was a grouping in teh higher frequency that was relatively unchanged though was muted in comparison with the empty box.

136 Fabrication| Scale 03| Sound Evaluation
01. 02. 03. 04.
ACOUSTIC TESTS

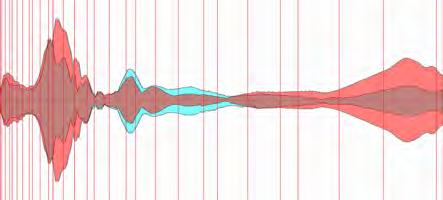


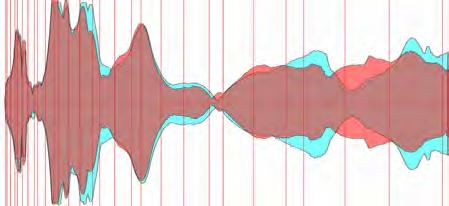


In the reflection graphs overlay for perforation size 8 cm, the differences in volume between the bulging and flat casts was the most dramatic but with the same patterning.
In the transmission test, there was more transference through the bulging cast in the higher and lower frequencies with the middle frequencies remaining relatively equal.
The reflection graphs overlay for perforation size 10 cm shows a similar relationship with the previous perforation sizes. In both types, the base frequencies seemed to equalize to a consistent volume.
In the transmission graphs overlay, the results were very similar for the bass frequencies, but with greater volume in the bulging cast mid to high frequencies.
In the reflection graphs, the same relationship as in the 10cm perforations was observed.
In the absorption graphs, the bulging cast has greater volume in the mid to high frequencies. Also, the frequencies in the bulging cast seem to equalize in volume, with a slight pinch near the lower frequencies but it is suspected that it is the transition point for the speaker.
The comparison between the flat and bulging concrete samples with16 cm perforation reveals a more consistent volume of reflection within the bulging cast as in the flat. The lower frequencies tended to remain unchanged from the flat box.
The transmission test shows slightly more volume in the middle tones of the bugling cast, while the flat cast had louder lower frequency.
01. Graphs overlaying the acoustic results of the difference casting systems with 8 cm perforations.
02. Graphs overlaying the acoustic results of the difference casting systems with 10 cm perforations.
03. Graphs overlaying the acoustic results of the difference casting systems with 14 cm perforations.
04. Graphs overlaying the acoustic results of the difference casting systems with 16 cm perforations.
137 Fabrication| Scale 02| Sound Evaluation
Bulging Cast
8 cm Perforation - Reflection Comparison 10 cm Perforation - Reflection Comparison 14 cm Perforation - Reflection Comparison 16 cm Perforation - Reflection Comparison 8 cm Perforation - Transmission Comparison 10 cm Perforation - Transmission Comparison 14 cm Perforation - Transmission Comparison 16 cm Perforation - Transmission Comparison
Flat Cast
01. 02. 03. 04.
ACOUSTIC TESTS
Scale 03
Formwork 03_1| 03_2
Spacers 03_1.1| 03_1.2| 03_1.3| 03_1.4
Casting method Flat| Bulge


- 8 cm perforations
- Reduced peaks in volume of lower frequencies
- More peaks in volume in higher frequencies
- Drastic reduction in transmission volume in mid to high frequencies

- 10 cm perforations
- No significant changes from Trial 03.1a reflection
- Slight gain in transmission volume from Trial 03.1a
-Noticible gain in volume of lower frequencies

- 14 cm perforations
- No significant changes fromTrial 03.2a reflection
- No significant changes fromTrial 03.2a transmission

- 16 cm perforations
- No significant changes fromTrial 03.3a reflection
- No significant changes fromTrial 03.2a transmission
Fabrication| Scale 03| Catalogue
138 FORMWORK_03 A c1 c2 c1 A c1 c2 c1
Trial 03.1a
Trial
Trial
03.2a Trial 03.3a
03.4a


- 8 cm perforations
- Reduced peaks in volume of lower frequencies for reflection
- Increased volume at high frequencies.
- Drastic reduction in volume of mid frequencies
-increase of volume into the high frequencies

- 10 cm perforations
- No significant difference from Trial 03.1b for reflection
- More consistent volumes at higher frequencies than in Trial 03.1b for reflection
- Segmentation of mid to high frequencies of volume intensity for transmission

- 14 cm perforations
- Increased volume at lower frequencies for reflection
- More consistent volumes at mid to high frequencies for reflection
- Increase in mid to high frequencies than in trial 03.2b for transmission

- 16 cm perforations
- No significant differences compared to empty chamber for lower frequencies for reflection
- Consistent volume for mid to high frequencies for relfection
- No significant changes in transmission than in Trial 03.3b
139 Fabrication| Scale 03| Catalogue
Trial 03.1b
Trial 03.2b
Trial 03.3b
Trial 03.4b
INPUT GEOMETRY
PHASE I
Sound as input parameter Collection of Points
Geometry I
PHASE II
Geometry II
Projections of Points Casting Grid
Number of casts
MAPPING
MAPPED GEOMETRY
140
Global Scale Acoustics| Local Scale
02.4 Global Scale
Introduction
The aim is to generate a digital system that will enable the creation architectural geometries that respond to specific acoustic needs and will be map-able in the 1 to 1 scale. The most common approach for acoustic design is not a holistic on. The design process is broken into different steps with different methods, materials, and scales. In order to implement a good grade of noise control, control the reverberation times, ensure speech intelligibility, control sound absorption and refraction, and many other aspects that one has to take into account when dealing with sound, different systems are used at different times in the design process, at different scales and with different materials.
The design approach will differ greatly from this due to the nature of the fabrication system being developed. The final aim is to generate a homogeneous monolithic surface made of one single material (concrete), this entails that no further improvement of the resulting geometry by the addition of other systems (such as absorption panels), or other materials (such as cloths) can be carried out. This, in essence, means that the digital design process has to include all the acoustic control mechanisms in the resulting surface. This surface will in the end be the result of a design decision made at the beginning of the process that will give a base geometry to input and the deformation and adaptation of such geometry to fit the specific acoustic needs
for which the geometry is being designed. The treatment of the base geometry will be carried out from a global perspective towards a more localised treatment of the geometry treating different aspects of acoustic design on each step.
The result is a system were once a geometry is designed and all the parameters are set, a new resulting geometry that is adapted to those parameters, and can be mapped in one to one scale with our fabrication system, will be outputted.
141
Acoustics| Global Scale| Introduction
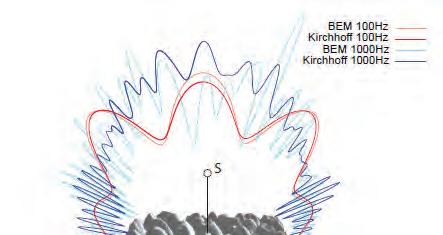
01. Scattering patterns for detailed surface comparing the sound pressure levels, extracted from the” Instant Sound Scattering “ paper by N.Tsingos, C. Dachsbacher, S. Lefebvre, and M. Dellepiane
02.Diffusion coefficient values for the Skyline® patented sound diffusion surface by RPG®.
03. Comparison of true displaced geometry with a proxy flat quadrilateral enhanced with normal-map.
Extracted from “Instant Sound Scattering “
02.
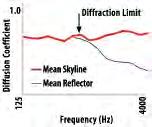

142 03. 01.
Acoustics| Global
Phase I
Scale|
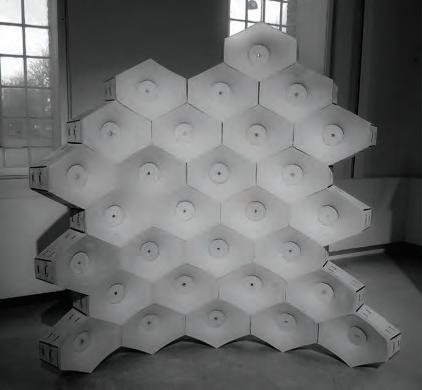

Phase I
Previous Examples
There are many examples of acoustic surfaces, from an almost infinite variety of acoustic panels, to geometrical designs created for an optimal sound distribution. However, this phase of the process is neither one or the other, the design is an input and panels are not going to be added, since what is trying to be attained is to use the fluidity of concrete to obtain a good sound reactive surface.
Investigations into parametricism and acoustics have recently started to gain momentum in the architectural scene but there are not many examples of applications into surface treatment with a global approach, in partly due to the intrinsic complexity of sound reflection.
Two of the most interesting approaches towards acoustics dissipating surfaces are:
The “Instant Sound Scattering” paper from N.Tsingos, C. Dachsbacher, S. Lefebvre, and M. Dellepiane. Where they try to explain the complexity of the sound propagation phenomena and why this entails quite a restricted approach into interactive acoustics. They explore the various ways of modelling sound propagation virtually, and generate a acoustic software that
improves the modelling of acoustics.
The other is the “ Manufacturing Parametric Acoustic Surfaces”. book released for the workshop with the same title organised in IAAC by smart geometries, and which is based on the PhD currently being undertaken by Brady Peters in CITA, who is investigating in the same area trying to make the relation between acoustics and architecture more fluid so acoustic simulation can be integrated in the design process.
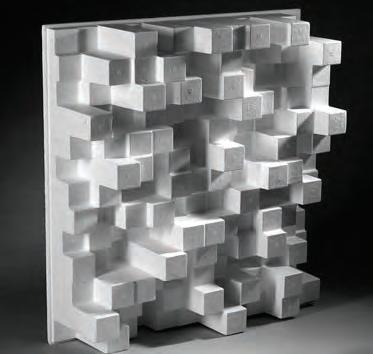
143
01. Sound diffusive wall created for the “Manufacturing Parametric Acoustic Surfaces”. Smart Geometries Workshop
01. 02.
02. Skyline® patented sound diffusion surface by RPG®.
Acoustics| Global Scale| Phase I
Reflection on smooth surface resulting in the generation of coherent presssure wave front
Reflection on an irregular surface resulting in a segmented pressure wave front
Reflection on an extremely irregular surface resulting in a segmented incoherent and self interfering pressure wave front
144
02.
Global Scale| Phase I
Acoustics|
Aim
The aim is to generate a sound responding surface that will deform the input geometry according to what frequencies need to be diffused in order to obtain a “cleaner” sound. The final objective is to generate a surface that can react live to the a given spectrum of frequencies and deform accordingly in order to selectively scatter them and, filter the un-wanted sounds. The idea is that people can play a sample sound and the surface will deform to rid the environment of either such sound, or of any background noise that might be present in the sample generating improving the sound quality.
Object of Study
This phase addreses the relationship between frequecies and the variability of sound reflection behaviour. Modelling the sound reflection phenomena is a very complex process due to the great range of scales one deals with when treating with sound. The range of audible sound frequencies ranges from 20 Hz to about 17000 Hz which in turn means that the wave lengths for such frequencies go from a mere 2cm to a astounding 17m and the scale of such waves affects their reflection patterns.
In ideal conditions reflection will occur following the Laws of reflection
Frequency range
16 to 32
32 to 512
512 to 2048
2048 to 8192
8192 to 16384
The human threshold of feeling, and the lowest pedal notes of a pipe organ
Rhythm frequencies, where the lower and upper bass notes lie
Defines human speech intelligibility, gives a hornlike or tinny quality to sound
Gives presence to speech, where labial and fricative sounds lie
Brilliance, the sounds of bells and the ringing of cymbals
1. The incident ray, the reflected ray and the normal to the reflection surface at the point of the incidence lie in the same plane.
2. The angle which the incident ray makes with the normal is equal to the angle which the reflected ray makes to the same normal.
3. The reflected ray and the incident ray are on the opposite sides of the normal.
However the “perception” of the reflection surface by the wave will vary greatly in accordance with the frequency. For small frequency waves (and hence a large wave length) a small variation in
01. Descriptive table for the range of audible frequencies
145
Acoustics| Global Scale| Phase I
01.
01. Sample spectrogram of frequency plotted against Amplitude of the harmonics of violin sounds
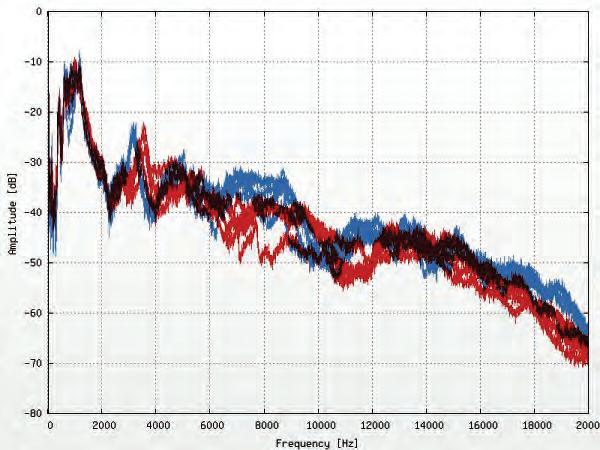
146
01. Acoustics| Global Scale| Phase I
the geometry of the reflective surface has barely no effect since in comparison to the pressure wave front the surface seems smooth and hence the reflection will occur in accordance to the normal of the overall surface and not the specific normal where the sound wave is impacting on the surface. On the other hand, the greater the frequency gets the more the localised geometry of the surface will affect the reflection pattern .
Taking into account that by empirical procedures it has been proved that for a given sound wave
to be reflected on a set surface, such surface must be in accordance to the size of the wave length by a ratio of at least three (meaning for a sound with wavelength of one meter (350HZ) to reflect on a square planar surface, such surface must be at least 3m by 3m). This information can be used to induce a deformation on our input geometry’s surface so as to be able to scatter certain frequencies while leaving others completely unaffected. It is therefore a question of scaling the irregularity of the surface in relation to the size of the wavelength and therefore its frequency.
01. VVVV Frequency/ Intensity spectrogram for a dominant frequency of 900Hz .
02. VVVV Frequency/ Intensity spectrogram for a dominant frequency of 9000Hz.
03.Grasshopper Frequency/Intensity spectrogram for a dominant frequency of 900Hz.
04.Grasshopper Frequency/Intensity spectrogram for a dominant frequency of 9000Hz.
147
Acoustics| Global Scale| Phase I
01. 02. 0 15000Hz 100db 0 15000Hz 100db 0 15000Hz 100db 0 15000Hz 100db 03. 04.
01. Deformation of surface according to an input sound with a sampling of a 15% of the highest frequencies
In this phase a tool that deformed the surface according to a given sound and a set of parameters was created. For the development of such a tool, VB.Net language was used as coding language, and Grasshopper (which is a plug-in for Rhino) as object based software.
For the acoustic digital input VVVV, developed by the vvvv group(joreg, Max Wolf, Sebastian Gregor, Sebastian Oschatzand) was utilized. The communication between both was made possible thanks to the Ghowl plug-in, developed by Luis Fraguada.
The first step was making Grasshopper able to receive sound information and analyse it in accordance to certain parameters, and then
be able to respond effectively to generate a specific deformation on the surface that would scatter the chosen frequencies. In order for that process to take place a common ground to transfer sound to as geometrical information was needed, it seemed logical that for such purpose a spectrogram would be the most appropriate tool. For the process to work, the tool needed to be able to read the sound input live. Therefore the most suited spectrogram was one where the frequency was mapped against amplitude. This type of spectral analysis is able, by applying a fast Fourier transformation, to output all the occurring frequencies in one set unit of time, making it possible to observe live all the frequencies that form the noise that is being analysed. The
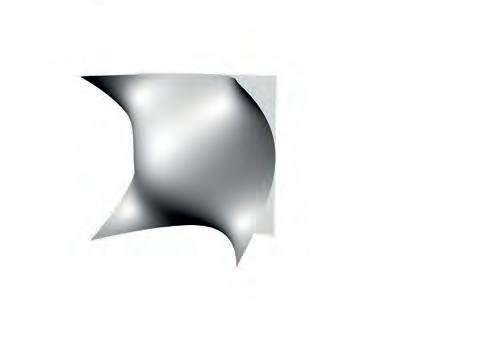
resulting spectrogram for the script was obtained from the VVVV’s sound analysis application, the frequencies can be seen plotted along the X axis and the sound amplitude (intensity of that given frequency) is plotted along the Y axis. It became evident that there is a great deal of background noise taking place on a high frequency level, with the being used current apparatus it couldn’t be determined if it was due to the microphone interference or background noise too faint for human hearing to perceive, in both cases we would still need to filter the sound to avoid these frequencies interfering with the deformation algorithm.
By using Ghowl a transference of the coordinates of the spectrogram into Grasshopper was made
148
01. Acoustics| Global Scale| Phase I 0 15000Hz 100db
Description
possible. These coordinates when then utilized in Grasshopper to redraw the spectrogram in that environment .
The noise is broken down into a total of 255 frequencies from which a sample selection as large as needed can be extracted in order to obtain a weighted average. The amount of frequencies that can be sampled range from 1 to all 25. The sampling criteria can be to either select the ones with higher amplitude (so filtering the lower ones for reading purposes) or selecting the lower ones in case the aim is to generate a geometry that rids the sample sound of all the background noise.
Once the weighted average frequency we want our that the geometry’s surface is to dissipate has been obtained, a grid is drawn on the surface in accordance to such a frequency, having in mind that the relation between the frequency and the wave length is given by,
Frequency = speed/wave length
and that for the grid to have an effect upon the chosen frequency must be at least 3 times bigger a grid with a given size of, 3 x 340.29 (speed of sound in ideal conditions)]/Frequency, is plotted on the surface.
Once a grid whose size is adapted for a given weighted frequency has been plotted on the surface, this surface can then be deformed by moving the points of such grid according to the normal of the given surface and regenerating the surface using the displaced points. The amount of movement implemented on the grid points is dependent on the amount of sound aimed to be dissipated, when the value for the fore-mentioned movement is at its maximum the resultant surface closely resembles an aeonich chamber. On the following pages a catalogue of different deofrmations according to different sound samples for future evaluation is attached.
01. Analysis of sound inputs with 900HZ and 9000Hz main frequencies by sampling of the 20% highest and lowest frequencies
149
Acoustics| Global Scale| Phase I
01. 0 15000Hz 100db 0 15000Hz 100db 0 15000Hz 100db 0 15000Hz 100db
150 Sample Sound Generation of Grid 50% Displacement 100% Displacement Acoustics| Global Scale| Phase I_ Catalogue Sampling of minimum frequency on background noise Sampling of minimun frequency on background noise Lowest Frequencies Highest Frequencies 0 15000Hz 100db 0 15000Hz 100db
151 Generation of Grid 50% Displacement 100% Displacement
Acoustics| Global Scale| Phase I_Catalogue
Sample Sound
Spectrum sample of speech, with a sampling of 10% of the highest intensity frequencies present.
Spectrum sample of speech, with a sampling of 10% of the lowest intensity frequencies present.
152 Acoustics| Global Scale| Phase I_ Catalogue
Lowest
Highest Frequencies 0 15000Hz 100db 0 15000Hz 100db Generation of Grid 50% Displacement 100% Displacement
Frequencies
153 Acoustics| Global Scale| Phase I_Catalogue Generation of Grid 50% Displacement 100% Displacement
Sample Sound
Sample sound of speech with abundance of labial and fricative sounds. Where the 10% highest frequencies sampled. 0
Generation of Grid
Sample sound of speech with abundance of labial and fricative sounds. Where the 10% lowest frequencies sampled.
Displacement
Displacement
154 Lowest Frequencies Highest Frequencies
Acoustics| Global Scale| Phase I_ Catalogue
100%
50%
100db 0 15000Hz 100db
15000Hz
155 Acoustics| Global Scale| Phase I_Catalogue Generation of Grid 50% Displacement 100% Displacement
Sampling of the 10% highest frequencies on a high pitched sound
156
Acoustics| Global Scale| Phase I_ Catalogue Sample
Lowest Frequencies Highest Frequencies 0 15000Hz 100db 0 15000Hz 100db
frequencies
Generation
Grid 50%
100%
Sound
Sampling of the10% highest
on a high pitched sound
of
Displacement
Displacement
157 Acoustics| Global Scale| Phase I_Catalogue Generation of Grid 50% Displacement 100% Displacement
01. Sample surface after deformation according a set sound input
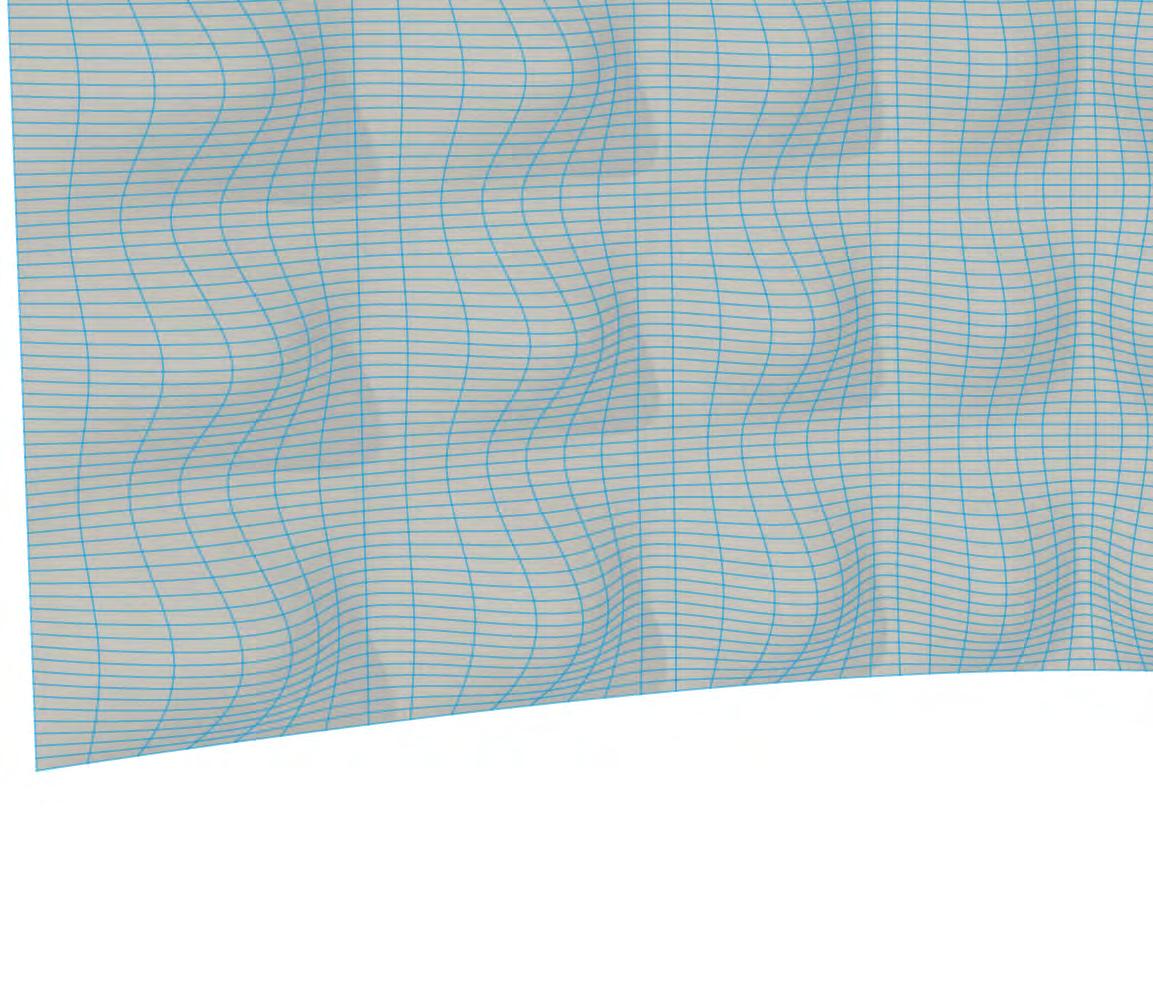
158 Acoustics| Global Scale| Phase II
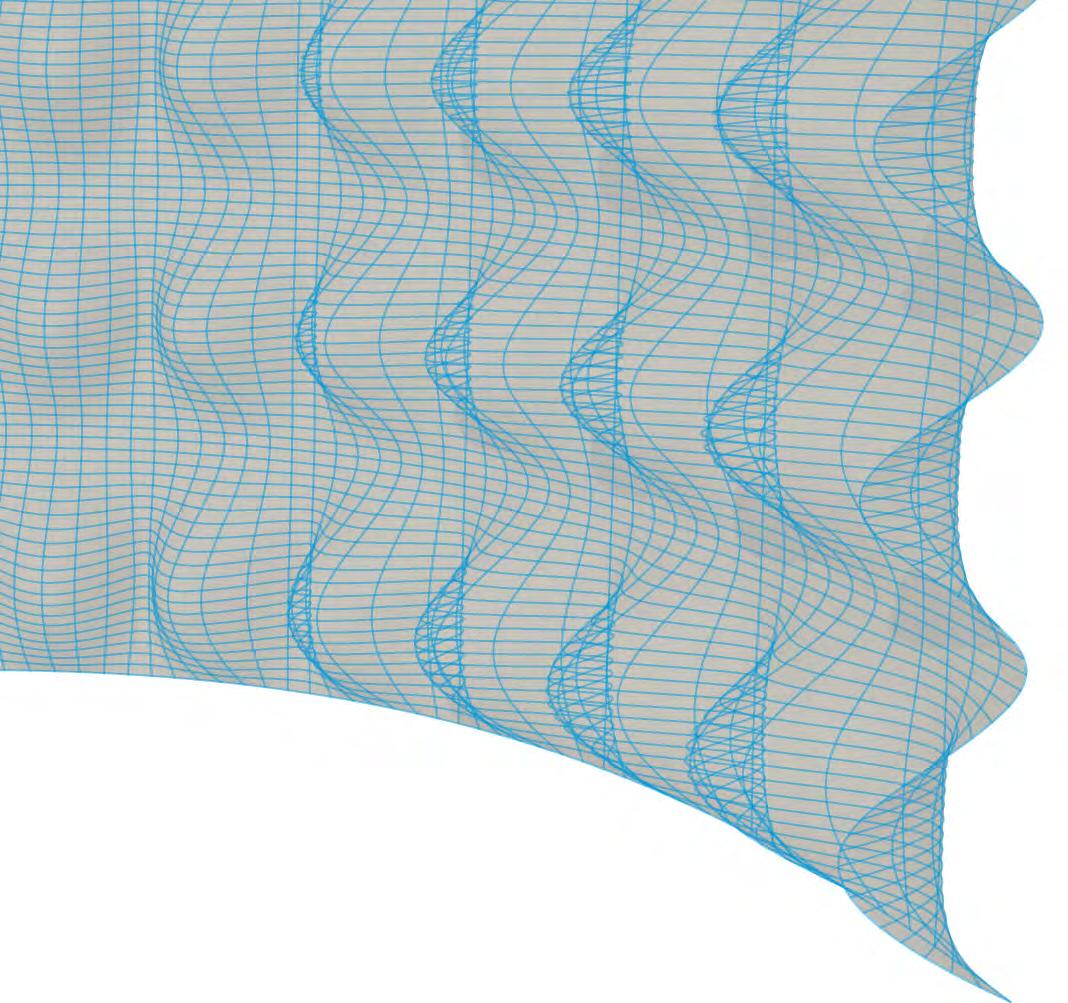
Frequency Based Deformation Pseudo-Code
/Step0:Import z values from VVVV spectrogram through GHowl.
VB.Component:
Inputs: z values, line, number of sample points, true/false toggle, Surface
/Step1:Divide line in as many points as z values there are.
/Step2:Plot z value z above this line making them proportional to the line’s length
/Step3:Draw line between division points and plotted z values .
/Step4:if toggle is true select the n number of sample points that are higher if toggle is false select the n numbers of sample points that are lower do weighted average of sample frequency
/Step5:Generate grid on surface in accordance to 3 x 340.29/frequency
/Step6:Move the points of such grid in accordance to the normal of the surface, and a magnitude from 0 to 1 to control the amount of dissipation required
/Step7:Redefine the surface
159
Acoustics| Global Scale| Phase I
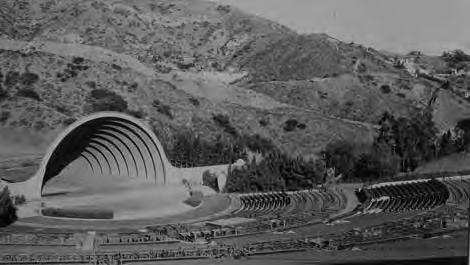

160
01. Hollywood bowl designed by Frank Lloyd Wright, example of acoustic shell with good projection qualities.
02. Reflected sound pressure from a dome segment, extracted from the paper “The reflected sound field by curved surfaces” by M.Vercammen Acoustics|
Global Scale| Phase II
01. 02.

Previous Examples Phase II
It is difficoult to explore previous attempts at acoustic architecture rhough all through human history men have been creating such architectures, from the theatre of Epidaurus to the Sidney opera house; since sound is such a difficult physical phenomena to digitally model, and an extremely subjective one, it is very difficult to be able to come with a unique solution that will work for most cases. Any auditorium is in theory designed for an optimal acoustic response in combination with the architectural needs. This entails that every auditorium is different, and
One of the most pure examples of geometrical approach towards acoustics came from the RAF experiments for the detection of airborne invasions. These are concrete shells created prior to the second world war that collect and amplify sound from miles away enabling the detection of enemy planes before the invention of Radar. It is a purely geometrical exercise into sound collection using concrete so it seems a good starting point for the investigation being carried out.
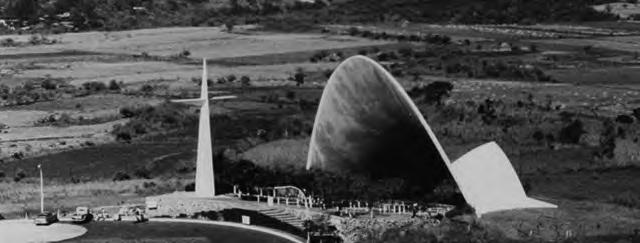
When designing any piece of architecture for acoustical purposes, one needs to know exactly what function it will have since detailing is key to acoustic performance. Like Arup acoustics mentions in their paper “ The Acoustical Design of the New National Opera House of Greece” by Alban Bassuet, “The opera theatre is dimensioned for a volume to achieve a midfrequency reverberation time of 1.60s, needed for romantic and post-romantic operas”. These grade of specificity makes it impossible at this stage of the investigation to design a tool that will generate a geometry that has an optimal acoustical behaviour for a given sound. It was decided, therefore, that in this phase a more general approach would be taken, the objective would be the design of a geometrical tool that would have good acoustic qualities over all. It is in this realm that previous attempts were researched, with such a low grade of specificity for sound architecture and such a geometric approach towards it, the field of research was greatly reduced.
Another set of interesting architectural examples were the band shells since they do not have a very specific approach towards acoustics due to the fact that their function varies greatly. The main concern when designing this type of structure is the sound projection properties, a good example of this sound projective surface is the chapel of Cuernavaca where a hyperbolic parabolic concrete shell increases the amount of sound projection. The Hollywood bowl band shell designed by Frank Lloyd Wright was also an example of good acoustic projection. All these examples have in common that they deal with environmental acoustics, this what makes them be less specific since the grade of control one can exert on sound in an open environment is limited.
In conclusion at this phase the study will be to design a system that generates an outdoor acoustic surface with good sound qualities.
161
01. Acoustic mirrors on the English coast developed for the detection of enemy planes before the invention of radar .
02. Chapel of Cuernavaca by Felix Candela, where a hyperbolic paraboloid is used for structural efficiency and sound projection qualities
Acoustics| Global Scale| Phase II
01.
02.
01. Collection of sound waves on the focal point of smooth parabola.
02.Collection of sound waves on a given area for an irregular parabola
03.Reflection properties of parabola due to the geometrical definition by which it is created
The starting point for this phase is the original geometry once it has been improved for sound scattering purposes. The aim is to deform the given geometry in order to optimize the sound gathering, the sound projection, or both. For this purpose sound collection, and sound projection points and directions will be set according to the specified needs, and in consonance with the design process. Once these points and their respective directions are set the surface will deform in order to maximise sound responsiveness towards this set needs. In conclusion the final objective is to automatically generate acoustic shells within the designed surface in order to obtain a versatile resulting geometry capable of adapting to several required needs that may be coincidental in time but in functional opposition.
Object of Study
Band shells or acoustic shells, are curved, hard surfaces, designed to reflect sound towards an audience this shells are often removable but are always present for a good auditory experience to be attained, such shells are usually made of hard materials in order to maximise sound reflection and hence maximise its projection. The same principle can be applied in order to gather sound on a given area , when the listeners are seating in a concave geometry the sound that reflects on such a geometry will tend to intensify in the focal, point increasing its auditory perception. Based on these principles it was decided that the optimal shape both for the sound gathering and projection was the paraboloid of revolution. Which is a special case of an elliptic paraboloid given by the formula
When a = b the surface obtained is the result of revolving a parabola around its axis. Due to the special geometrical definition of a parabola the parabola has certain reflective properties can be harnessed in order for sound collection and projection optimization:
“Given a point (the focus) and a corresponding line (the directrix) on the plane, the locus of points in that plane that are equidistant from them form a parabola.”
This implies that at the intersection of any line traced between the parabola and its focus, the angle between such line and the normal to the
162
Aim Normal Axis Focus (x,y) Direction Tangent
01. 02. 03.
Acoustics| Global Scale| Phase II
x y a b 2 2 2 2 z =
parabola at that point, will always be the same as the angle between that line and the shortest possible line traced between the intersection point and the directrix. This has the effect as seen on the diagram of making any ray emitted from the focal point reflect perpendicular to the directrix. This is therefore the optimal 2d shape for projecting rays if the emitting source is set on the focus. Not only that but since sound waves coming from a long enough distance can be taken as travelling straight and parallel, the same shape if oriented so that the directrix is perpendicular to the sound waves can be also used as a receiver gathering all the sound waves at the focal point. Since the paraboloid of revolution is an infinite collection of parabolas this effect is not lost and will work in the same way in a three-dimensional space, as can be
seen from the abundance of these shapes in wave collecting equipment. Any satellite dish is but a parabolic collector that gathers all the electromagnetic waves on its focal point where the receiver is placed, as are the headlights of cars that when observed in section are a parabolic projector where the light source is placed on the focal point and its effect is optimised by the same geometrical characteristic.
The only difference between the collector and the projector in the design is that the gathering of sound in one specific point in space is not optimal for an audience since the aim is to always have as evenly distributed sound as possible. This means that the treatment of the surface should differ. In the parabolic collector although the sound waves will tend to concentrate on a point scattering will
be used in order to obtain an even distribution of sound. By the generation of an irregular surface scattering the sound over the collection area will take place, making the distribution even but at the same time increasing the sound intensity due to the collectors geometry . On the parabolic reflector on the other hand the less scattering possible is essential to maximise the effect of the paraboloid as a projection device, therefore a smooth surface will be generated.
163
01. Diagram of sound projection through reflexion on a typical acoustic bandshell 02. Diagram of sound collection on concave surface on the back of an auditorium.
Acoustics| Global Scale| Phase II
01. 02.
01. Creation of virtual coordinate system on target surface.
02. Generation of a paraboloid of revolution referenced to the previous coordinate system
03.Displacement of the paraboloid in order to increase the surface area of intersection with the target surface
Description
In this phase a tool that deformed the surface according to a given set of paraboloids was created. For the development of such a tool VB.Net language was used as coding language, and Grasshopper (plug-in for Rhino) as object based software.
For the generation of each paraboloid a point (the focus) and a vector (the direction of orientation) will be needed . These are decided as part of the design process since they will respond to the architectural need of the given geometry. Once this have been set, lines from said focuses will be drawn with the direction of said vectors towards the surface, the intersection between these lines
and the surface will be the origin of virtual planes whose z axis will be the set vectors. It is on these system of coordinates that the paraboloids will be generated using the parametric form:
x(u,v) = (u/h)cos(v)
y(u,v) = (u/h)sin(v)
z(u,v) = u
where u>=0, v E[0,2pi).
The h and a values will be set taking into account that the focus of a parabola is given by the expression:
-b y = ax + bx + c
for a parabola: whose parametric form is:
x(t) = pt + j ; y(t) = 2pt + k
164
Acoustics| Global Scale| Phase II 01.
02.
( ) -b 1 c 4a 4a 2a 2 2 2 03.
where:
However since the paraboloids (and therefore our parabolas) are perfectly cantered with their direction coinciding with the virtual planes Z axis, and their origin coinciding with the virtual planes origin we can omit the j and K values and therefore omit b and c, resulting in the focus being able to be described by the simple expression:
(0 ,P )
This expression enables the corresponding paraboloid to be drawn on the virtual plane so as to induce its focal point to coincide with the set points. The resulting paraboloids only intersect the surface at their origin, to be able to increase the intersection area between paraboloids and surface, the virtual planes used to generate the paraboloids are moved along their z axis on the negative direction. This is done while changing the values of “a” to keep their focuses coinciding with the set points. The amount of movement that takes place will depend on how much
surface area the final collector/projector part of the surface is needed. Once these transformations have been implemented on the paraboloids the intersected area of the surface is remapped on the paraboloid.
The result is a surface with as many parabolic concave surfaces as needed on the specific points where they will be most appropriate to act as collectors or projectors.
A catalogue of various surfaces generated with this method is attached on the following pages.
165
01. Re-mapping of the intersection area of the target surface on the paraboloid.
02.Increase of amount of intersection area between target surface and paraboloid
Acoustics| Global Scale| Phase II 1 -k k j a = b = c = 4p 2p 4p 2 01. 02. 03.
03. Re-mapping of increased intersection area of target surface on the paraboloid
Generation of projector surface on a target surface with a 100% frequency based displacement where no further frequency based deformation will be implemented
Generation of collector surface on a target surface with a 50% frequency based displacement where a second set of frequency based deformation will take place in order to scatter sound collection.
Generation of projection and collector surface on a target surface with a 30% frequency based displacement where a second set of frequency based deformation will be implemented only on the collector surface.
Target Surface Scattering Deformation
166 Acoustics| Global Scale| Phase II_ Catalogue Sound Projector Sound Collection Projection + Collection
Deformation of Planar Surface
Generation of Paraboloid
Generation of Intersection Area

Remapping of Target Surface
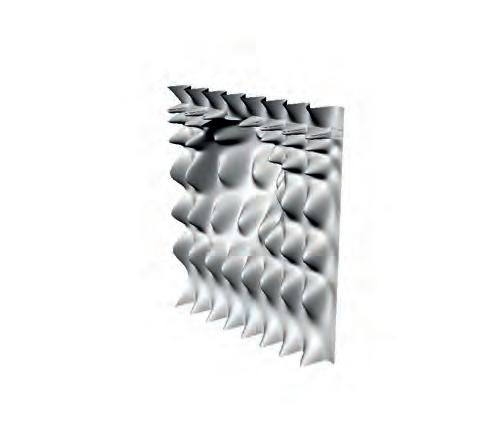
 Acoustics| Global Scale| Phase II_Catalogue
Reiteration of the previous process on a curved surface with a 100% frequency based deformation
After the first re-mapping is implemented with a 30% of the paraboloid being re-mapped ,a second iteration will teake place with a further increase of the re-mapping of 20%


168 Deformation of Extruded Parabola Acoustics|
Phase II_ Catalogue Sound Projector Sound Collection Projection + Collection Target Surface Generation of Paraboloid Generation of Intersection Area
Global Scale|
.
Remapping of Target Surface
Increase of Remapped Surface
169
Global Scale| Phase II_Catalogue
Acoustics|
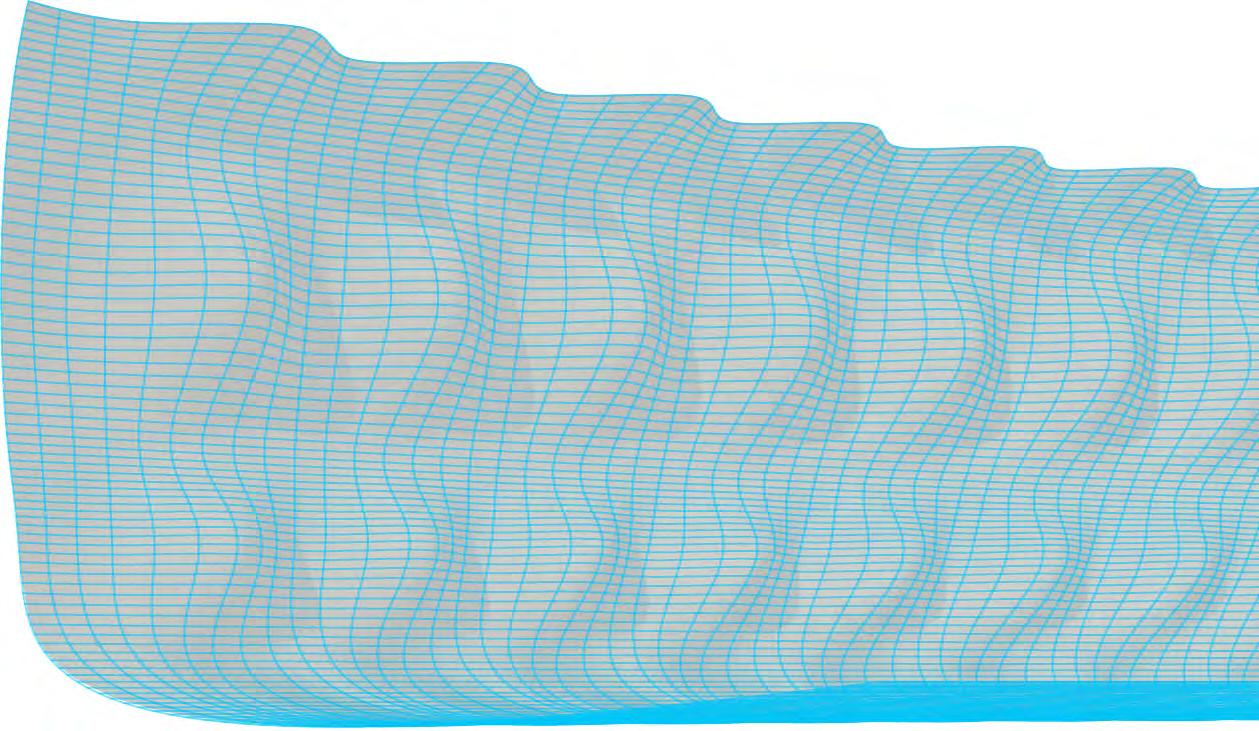
170 01.
deformation according a set sound input Acoustics| Global Scale| Phase II
Sample surface after
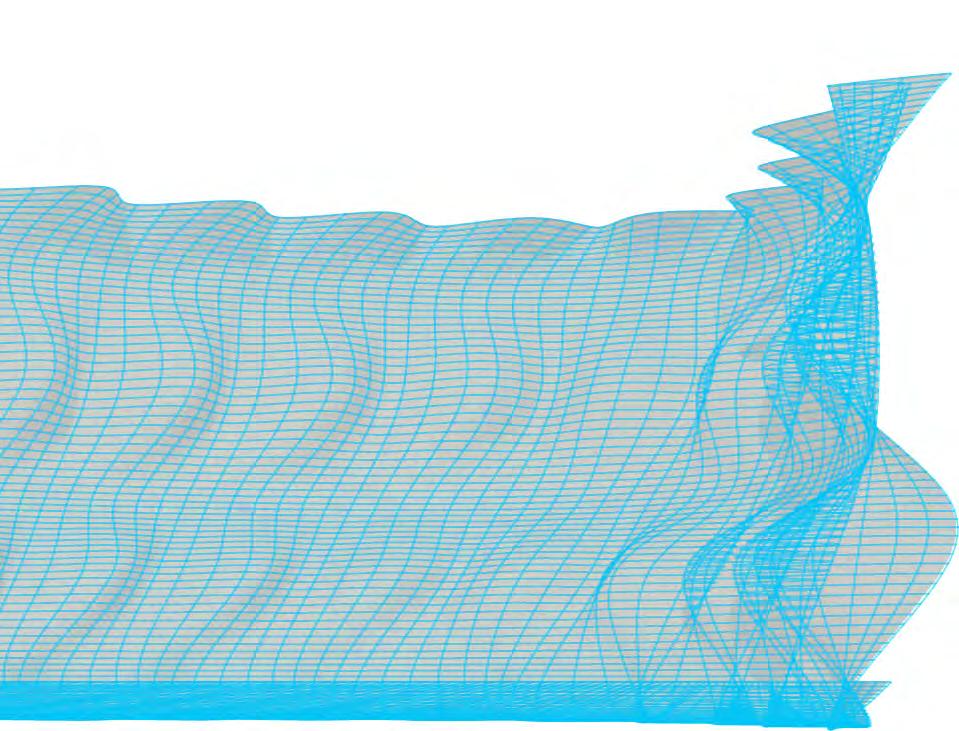
/Step0:Inputs: focal points, direction vectors, surface areas to be remapped, Surface
/Step1:Lines are drawn using the points and the vectors in a negative orientation, and given a length that will ensure intersection with the surface.
The resultant surface is regenerated with these points and outputted as a result. Parabolic Deformation Pseudo-Code
/Step2:The intersection points and vectors are used to generate virtual planes on the surface paraboloids are generated on these virtual coordinates systems
/Step3:The paraboloids are moved along the z axis of these systems while maintaining the focuses on the input points until the minimal intersection area condition is complied.
/Step4:The intersection area of the surface is calculates.
/Step5:This area is divided into evenly distributed points
/Step6:The same number of points are evenly generated on the intersected area of the paraboloid
/Step7:the surface points are re-mapped on the paraboloid
171
Acoustics| Global Scale| Phase I
01. Geometrical diagram for control plate, where the distance of the formwork grid is maintained (L,L) while the distance of the projected grid on the plate is not regular(D,d)
02. Geometrical diagram for control plate, with the height marked(h), and where the distance of the plate grid is maintained (L,L) and therefore the formwork is deformed.
03. Geometrical diagram for control plate, where the edges are allowed rotation in order to make the curvature closer to the desired one.
Mapping
Aim
The objective in this phase of the digital process is to generate a mapping of the surface that enables the recreation of the digital geometry in a one to one scale with the fabrication method proposed. The final aim is to write a script that will generate an evenly distributed grid of points that follows the proportions of the flexible formwork , its perforation density as defined by the local scale results, and is able to output the values needed to inform the desired shape on said formwork. These values will obviously depend on the method of fabrication that is chosen so at this stage we aim to be able to map on the two main methods proposed.
Object of Study
Various casting systems were developed, as previously explained in the fabrication chapter, the readings needed, vary accordingly to what system is in use, the systems can be divided into two main process of fabrication:
Use of Control Plate:
A rigid back plate is used in order to control the anchor points while enforcing rigidity to the surface to avoid undesired deformation. The grid from the flexible formwork is projected onto the control plate on which perpendicular rods are screwed generating tree-dimensional control
grid. It is these axis that will be used to move the anchor points of the surface in order to attain the geometry desired.
This system is extremely stable when it comes to controlling the deformation of the flexible surface under the self weight of the casting fluid, but it is this same rigidity that makes it have various disadvantages. The spacing of the grid is regular, this results in a difference of distances being enforced on the flexible formwork’s grid, which in turn implies generation tension in certain areas and compression forces in other. However this issues can be resolved by using a dense enough grid for this differences in distances to be negligible. The main issue that
172 d D L L h h h h h h L L d D h h h h
Acoustics| Global Scale| Phase II 01. 02. 03.
arose with this systems was that the direction of the control rods is always perpendicular to the backing plate, when as seen the diagrams for an optimal surface generation they should follow the normal of the surface at the anchor points. This resulted in certain co planarity between the area surrounding the anchor points and the control plate being enforced. This was specially negative for our jump form process since all the edges were being forced a certain curvature contrary to the global curvature that the surface should have for a smooth monolithic resulting geometry.
In order to minimize the effect of the rigid control plate on the curvature of the edges the flexibility of the system was increased by the addition of hinges onto the edges of the control plate. With the addition of this degree of freedom on the
edge condition a clear improvement was attained in the jump form process although now the limitation of curvature was given by the formwork because for a specific curvature to be enforced certain edges of the formwork needed to be compressed and that enforced buckling. All the control plate casting systems needed the same output values to be extracted from the digital model, these were the height values of the anchor points on the rods referenced to the backing plates.
Use of spreading bars:
In order to attain a more flexible system that would not enforce undesired curvature on the desired surface, a different approach was implemented, the anchor point grid on the formwork was maintained and the rods kept as control mechanism. The main difference between this approach an the previous one was the attempt to attain as much freedom on the control system, for this purpose the distance between anchor points on the formwork needed to be respected as were the direction of the normal’s on said points. It was decided that to enforce the desired shape the rods would be defined by the surface and then these would be maintained in place by the use of spreading bars.
01. Geometrical diagram for spreading bars, were 2 sets of frames from irregular spreading bars are utilized.
02. Geometrical diagram for spreading bars, were 1 set of frames formed by regularized spreading bars is utilized
03. Geometrical diagram for spreading bars, were 1 set of frames formed by regularized spreading bars enabling triangulation is utilized .
173 h h h h h h h h h h h h h h h
Acoustics| Global Scale| Mapping 01. 02. 03.
01.Formwork grid with an increase in density
02. Increase in number of casts on a flat surface, while increasing the perforation density
The first approach towards this was the use of custom made spreading bars on both sides of the surface to generate a frame system that would hold the surface in place. The main issue encountered with this was the lack of actual control on the surface. This was due to the distance between the anchor points and the point where the spreading bars where fixed was big in relation with the surface, this made the control rods be able to move. Another issue was the need to custom made since each one had a different length, this would defeat the purpose of a reusable formwork in order to reduce the waste.
The second approach was to fix the size of the spreading bars and attach them closer to the anchor points. There was a great improvement but there was still a great deal of movement allowed on the control rods. The lack of triangulation meant that deformations were allowed on the frame.
This system was the most successful on geometrical terms. A great control of the surface was attained thanks to the triangulation that this system entailed, while no un-wanted curvatures or deformations where generated thanks to the system being flexible enough in order to respect both the anchor point grid and the normals of the surface at such points. The main issue with this system was the lack of global stability, an external frame would be needed it order to maintain the formwork in position.
174
Acoustics| Global Scale| Phase II
01. 02.
In this phase a tool that mapped the surface according to the given set of jump form casts was created. For the development of such a tool VB.Net language was used as coding language, and Grasshopper (which is supported by Rhino) as object based software.
The regular mapping of a surface is not an obvious problem, since one would think that using the UV values of the surface one can attain a regular grid of points on the surface. However there are problems with this, even for simple surfaces like an extruded parabola de UV values do not give a regular grid, and though the form work is flexible it cannot attain such a deformability on the anchor point grid. This is a problem that is currently still being dealt with, since several approaches have been undertaken, like the generation of an algorithm that breaks the surface into different surfaces and by and iterative process tries to attain as maximum similarity between surface areas as possible.
The system currently being used is the generation of a regular grid by the displacement and deformation of the main curves. The number of points generated is dependent upon the number of casts deemed necessary, and the number of anchor points per cast, having into account that casts share anchor points on the edges in order for the jump form to process to be implemented correctly. Once the total amount of points is obtained these are re-organised into different data tree branches to match each cast ensuring overlapping on the edges.
After all the points have been reorganised we extract the readings necessary to implement the chosen system.
For the control plate system a planar surface is generated by measuring the normals at the anchor points of the cast and calculating the average of the vectors and forcing the surface normal to coincide with the result. This is done in order to minimize the deformation on the curvature of the desired surface by trying to maximise the similarity between the normal of the plate, and hence the rods, and the normal vectors at the anchor points. Once this is set we create lines from the anchor points to the grid of points on the backing plate, and the length of these lines are extracted to be used as the heights necessary to place the anchor points on the desired point along the rods.
For the spreading bar system all the normal vectors to the surface are extracted at the anchor points. Lines are generated using these vectors and points to represent the rods.
01. 02. Increase in number of casts on a flat surface, while increasing the perforation density .
175
Acoustics| Global Scale| Mapping Description 01.
01.Acoustic comparison of bulged(red) against flat(blue) slab where the diming down of frquencies higher than 800Hz becomes aparent.

Conclusions and Evaluations
The global scale approach was entirely a digital one, due to the fabrication nature of this research the more logical approach was a bottom up one where the fabrication experiments informed the global geometry. The difficulty of applying this system was the fact that the global geometry needed to be designed from an acoustic performance point of view, and that established a hierarchy that made it difficult for a bottom up process to take place organically and freely.
It was decided that the global scale design at this stage of the research process would be a purely geometrical one carried out in the digital realm in order for us to set the bases on which to start building in the intelligence extracted from the fabrication experiments. At the current stage the fabrication process has informed some of the digital tools, however this relation is no as fluent as it may be.
All the tools generated until now are extremely helpful and work as desired, the final aim is to generate a collection of tools that can be used cohesively and therefore will enable a global approach towards acoustic design.
The first phase of the global process was a frequency diffusion tool that deformed the surface as desired. The tool worked properly and deformed the target surface in accordance with the logic exposed previously. The frequency based deformation was carried out having into account the fact that the flexible formwork would deform under hydrostatic pressure. Therefore this tool together with the perforation pattern tool will generate the corresponding grid for the formwork anchor points, to then take advantage of the deformation of the formwork in order to generate the diffusion based irregularity desired.
The main issue with this part of the process is that it bases the diffusion of frequencies on their different behaviour towards reflection in accordance with their different scales. This (as explained) is a very complex process where the only accurate evaluation tool to prove the adequacy of the system is to conduct a series of acoustic tests on a one to one scale. Due to this fact the casted concrete slabs were tested for reflection properties. It became apparent that the bulges had all in common the diffusion of the frequencies of 800Hz onwards, these results are in accordance with the logic of the frequency based deformation tool. The frequencies that dimed down on the reflection tests had a wavelength small enough to be affected by the size of the bulge.
The main restrain that this tool has, as of now, is that the generation of the deformation grid
176
Acoustics| Global Scale| Phase II
01. 100Hz 1600Hz 750Hz 0 -1 1
occurs uniformly the whole surface. The next step in the improvement of this tool would be to generate a more localised deformation grid in accordance to the situation of the area to be deformed and the sound sources.
The second phase of the global scale process worked as desired. The surfaces where deformed in accordance to set paraboloids to act as collectors and projectors. In this case the easiest way to test the logic of the process was by the generation of ray emitting tool to be able to map the sound rays, taking the reductionist approach of modelling as rays. This method although very limited, due to the fact that these models will only be accurate for the high frequency sounds, is a common practice in acoustics in order to be able to trace the sound paths.
For the evaluation of this phase a ray tracing
script was developed, at this stage this script can only enable the visualisation of the sound paths without outputting numerical values. This would be the next step, in order to generate precise data for the measuring of the number of bounces and the energy lost in this process. However the deformed surfaces were inputted in the script and it became obvious, even lacking the numerical values, that the projection and collection surfaces were working as desired. The collectors were increasing the amount of sound on the given area while avoiding a focal concentration by diffracting the beams, while the projector surfaces maintained the parabolic properties, focusing all beams on the focus.
At this point of the investigation the parabolic based deformation tool works as desired, but for further development it seems that the outlook is reductionist. An increase in the amount of
detail embedded in the logic would increase the variability of the resulting surface, and increase the acoustic performance of such surface.
The mapping of the surface was generated in accordance with the fabrication process, and described perfectly the desired casting process in the digital world. The problem arose when trying to map very complex surfaces. In these cases the grids, even when defined in a way that would reduce their deformation to a minimum, still generated deformations in the digital realm, that would be impossible to reproduce in real life. This is at the present time the main concern with the generation of surfaces where it seems logical to take a bottom up approach where the surface to be mapped is designed including the fabrication restraints and therefore is always map able by means of the fabrication methods proposed
177
Acoustics| Global Scale| Mapping
01.
01. Ray tracing tests for evaluation purposes on collector and projector surfaces.
178
179 OVERALL CONCLUSIONS
03. General Conclusions and Future Work
The methods used currently in concrete construction are limited in the way that highly varied geometries are difficult to create. This results in either a large quantity of wasted formwork or a regularizing of geometries such that the variations are reduced to a grouping of a few, depending on resources for the project. This research investigated the possibility of utilizing reusable formwork that could attain high degrees of variation from the same set of formwork. Geometries were created based on acoustic perforations due to the complexities of shape in acoustic architecture.
In addressing acoustic-based architecture, the flexible formwork system imbeds acoustic criteria directly into the casting system. The research addresses the local scale through the control of the density and geometric variations of perforations. The global scale is controlled through two framing options, the control backing plate, or through a framing system of spreading bars.
A system of reusable formwork and components
within were created and tested in multiple scales, with varying degrees of complexities. Polyurethane rubber was used to create a durable, yet pliable system that could adapt to a given geometry. The density of openings through the casted mass was controlled and integrated into the system through a study in the local scale of the perforation types and its groupings.
Global geometries were considered through the flexible formwork system, which was designed to allow the forming of many different geometries. Methods of controlling geometry through the use of a backing plate and spreading bars was investigated and analyzed for their efficiency and geometric precision.
The fabrication experiments showed a high degree of flexibility of the system. Methods of creating perforations were tested ultimately resulting in the casting of silicone spacers that inscribe the geometry into the casted mass. Some issues still unresolved are the creation of foundations, and the profile of the overall
geometries. These issues will be explored in the MAarch phase of the project. Due to the flexibility of the polyurethane, the formwork when filled resulted in bulging. Knowing the bulging behaviour corresponds with the hydrostatic pressure and the young module of the polyurethane we can in further development model this behaviour in the digital realm. Other methods of fabricating the mould for the spacers can also be investigated. Instead of layering sheets, which results in a rough surface, the mould can be created using a 3-axis CNC router.
The jump-form process became much more difficult and time consuming with the multiplication of perforation points. This was due to the manual process of threading each nut. Alternative methods of setting the overall geometry will be investigated. Methods such as CNC controlled hydraulic pistons could be utilized to guide the control points of the formwork to the overall geometry. In this way, the system could be relieved of the issues regarding precision and assembly time.
180 Acoustics| Overall Conclusions
The local scale of acoustics was focused on the surface. A system of perforation was developed where the construction logic of the system is integrally tied to the acoustic performance. The geometry was governed through three methods: by controlling the density of perforation, by variations of geometry from cylindral to conical shapes and by variation of the size of the tubes (circle diameter and tube length). The driving criteria for these methods were the resonant frequency of the tubes and also the ratio of the open space to the overall closed space of the surface. This ratio is related to the transmission sound energy through the concrete surface, which is dependent on the size of the cavities. The combination of these two parameters indicated a logic for generating a perforation system that can respond to a certain frequency range and a given ratio every time. The ultimate result of this system is the local manipulation of the surface , meaning thickness, perforation density and cavities geometry. Through this manipulation, the absorption coefficient and
the resonant frequency of the surface can be controlled.
In order to test this perforation system, four different diameter cylindrical perforations were tested in one to one scale, where concrete casts were created both with an open air flat slab, and also the flexible formwork system. These concrete casts were tested within an acoustic chamber for reflective and transmission. The results of the acoustic tests shows some trends related to the size of the perforation. One of the most interesting results is the changes of dominate frequencies due to the concrete slabs. The conical perforations have not been tested at one to one scale within this research.
A tool for the overall geometry was developed in order to create an overall acoustic surface, based on the formwork system. The jump-form technique of casting was explored through the flexible formwork system. Surface undulations along with incorporating parabolic reflection are
the two ways in which the global surface was adapted.
An attempt to combine both processes, the local perforations and the global surfaces was accomplished. However more research is needed in order to link all the different tools in a more fluent fashion, and to generate a more bottom up process, where the fabrication constraints are embedded on the digital tools from a start.
One critical area that will be explored in the March phase will be the tethering of structural performance such that all three systems are informing the other. In this way, the three processes could satisfy acoustic criteria through defining specified input values. The architectural ambition and design will focus on developing defined input values and the methods of implementation. This process will take place within the MArch phase.
181 Acoustics| Overall Conclusions
180 References and Appendices
CONCRETE SURFACES
REFERENCES
• Maekawa, Z., Rindel, H. J. and Lord, P., 2011. Environmental and Architectural Acoustics. 2nd Edition. Oxon: Spon Press.
• Ingard, U. K., 1988. Fundamentals of waves and oscillations. Cambridge: University Press.
• Egan,D. M., 1988. Architectural Acoustics. New York: McGraw Hill
• Backus, J., 1977. The Acoustical Foundations of Music. 2nd Edition. New York: W. W. Norton.
• Benade, H. A., 1976. Fundamentals of Musical Acoustics. Oxford: University Press.
• Ladefoged, P., 2001. A Course in Phonetics. 4th Edition. Boston: Heinle & Heinle.
• Olson, Harry F., 1972. Modern Sound Reproduction. New York: Van Nostrand Reinhold.
• Tipler, P., 1982. Physics for Scientists and Engineers. 2nd Edition. Richmond: Worth.
• Morse, M. P. and Ingard, U. K., 1968. Theoretical Acoustics. New York: McGraw-Hill.
• Kreyszig, E., 1967. Advanced Engineering Mathematics. 2nd Edition. New Jersey: Wiley
• Hykes, L. D., Hedrick, Wayne R., and Starchman, E. D., 1992. Ultrasound Physics and Instrumentation. Saint Louis: Mosby-Year Book.
• Brady P., 2008. Complex Surfaces: Space and sound defining surfaces in architecture. Denmark: Mette Ramsgaard Thomsen.
• Tsingos, N., Dachsbacher, C., Dellepiane M., 2007. Instant Sound Scattering. In: Jan Kautz and Sumanta Pattanaik. Eurographics Symposium on Rendering. REVES-INRIA, Sophia Antipolis, France.
• Stanley, D., 1950. Your Voice: Applied Science of Vocal Art. United Kingdom: Pitman Publishing.
• Stemple, J. C., Glaze, L. E., GerdemanKlaben, B., 2000. Clinical Voice Pathology: Theory and Management, 3rd Edition., Canada: Singular Publishing Group.
• Rossing, D. T., 1990. The S cience of S ound. 2nd Edition. Boston: Addison-Wesley
• Barger, V. and Olsson, M., 1973. Classical Mechanics: A Modern Perspective. Columbus: McGraw-Hill.
• Halliday, D., Resnick R., and Walker J., 1997. Fundamentals of Physics. 5th Edition. New Jersey: Wiley
• Berg, E. R., and Stork, G. D., 1995. The Physics of Sound. 2nd Edition. Boston: Prentice Hall.
• West, M., 2008. Pre-stressed fabric formworks for precast concrete panels. Manitoba: Centre for Architectural Structures and Technology, University of Manitoba Faculty of Architecture.
• Rupasinghe, R., Nolan E., 2007. Formwork for modern, efficient concrete construction. Bracknell: Ihs Bre Press.
• Goodchild, C. H., Webster M. R., Elliot S. K., 2009. Economic Concrete Frame Elements. The Concrete Centre
• Brooker, O., 2004. Concrete Buildings Scheme Design Manual. The Concrete Centre.
• Goodchild, C. H. and Glass, J., 2004.
Best Practice Guidance for Hybrid Concrete Construction. The Concrete Centre.
• Whittle, R. and Taylor, H., 2009. Design of Hybrid Concrete Buildings. The Concrete Centre.
• Kitching, E., 2008. New Concrete Engineering. London: New Civil Engineer
• Allen, E., Iano, J., 2009. Fundamentals of Building Construction: Materials and Methods. 5th Edition. Hoboken: John Wiley & Sons
181
APPENDICES
Perforation density definition
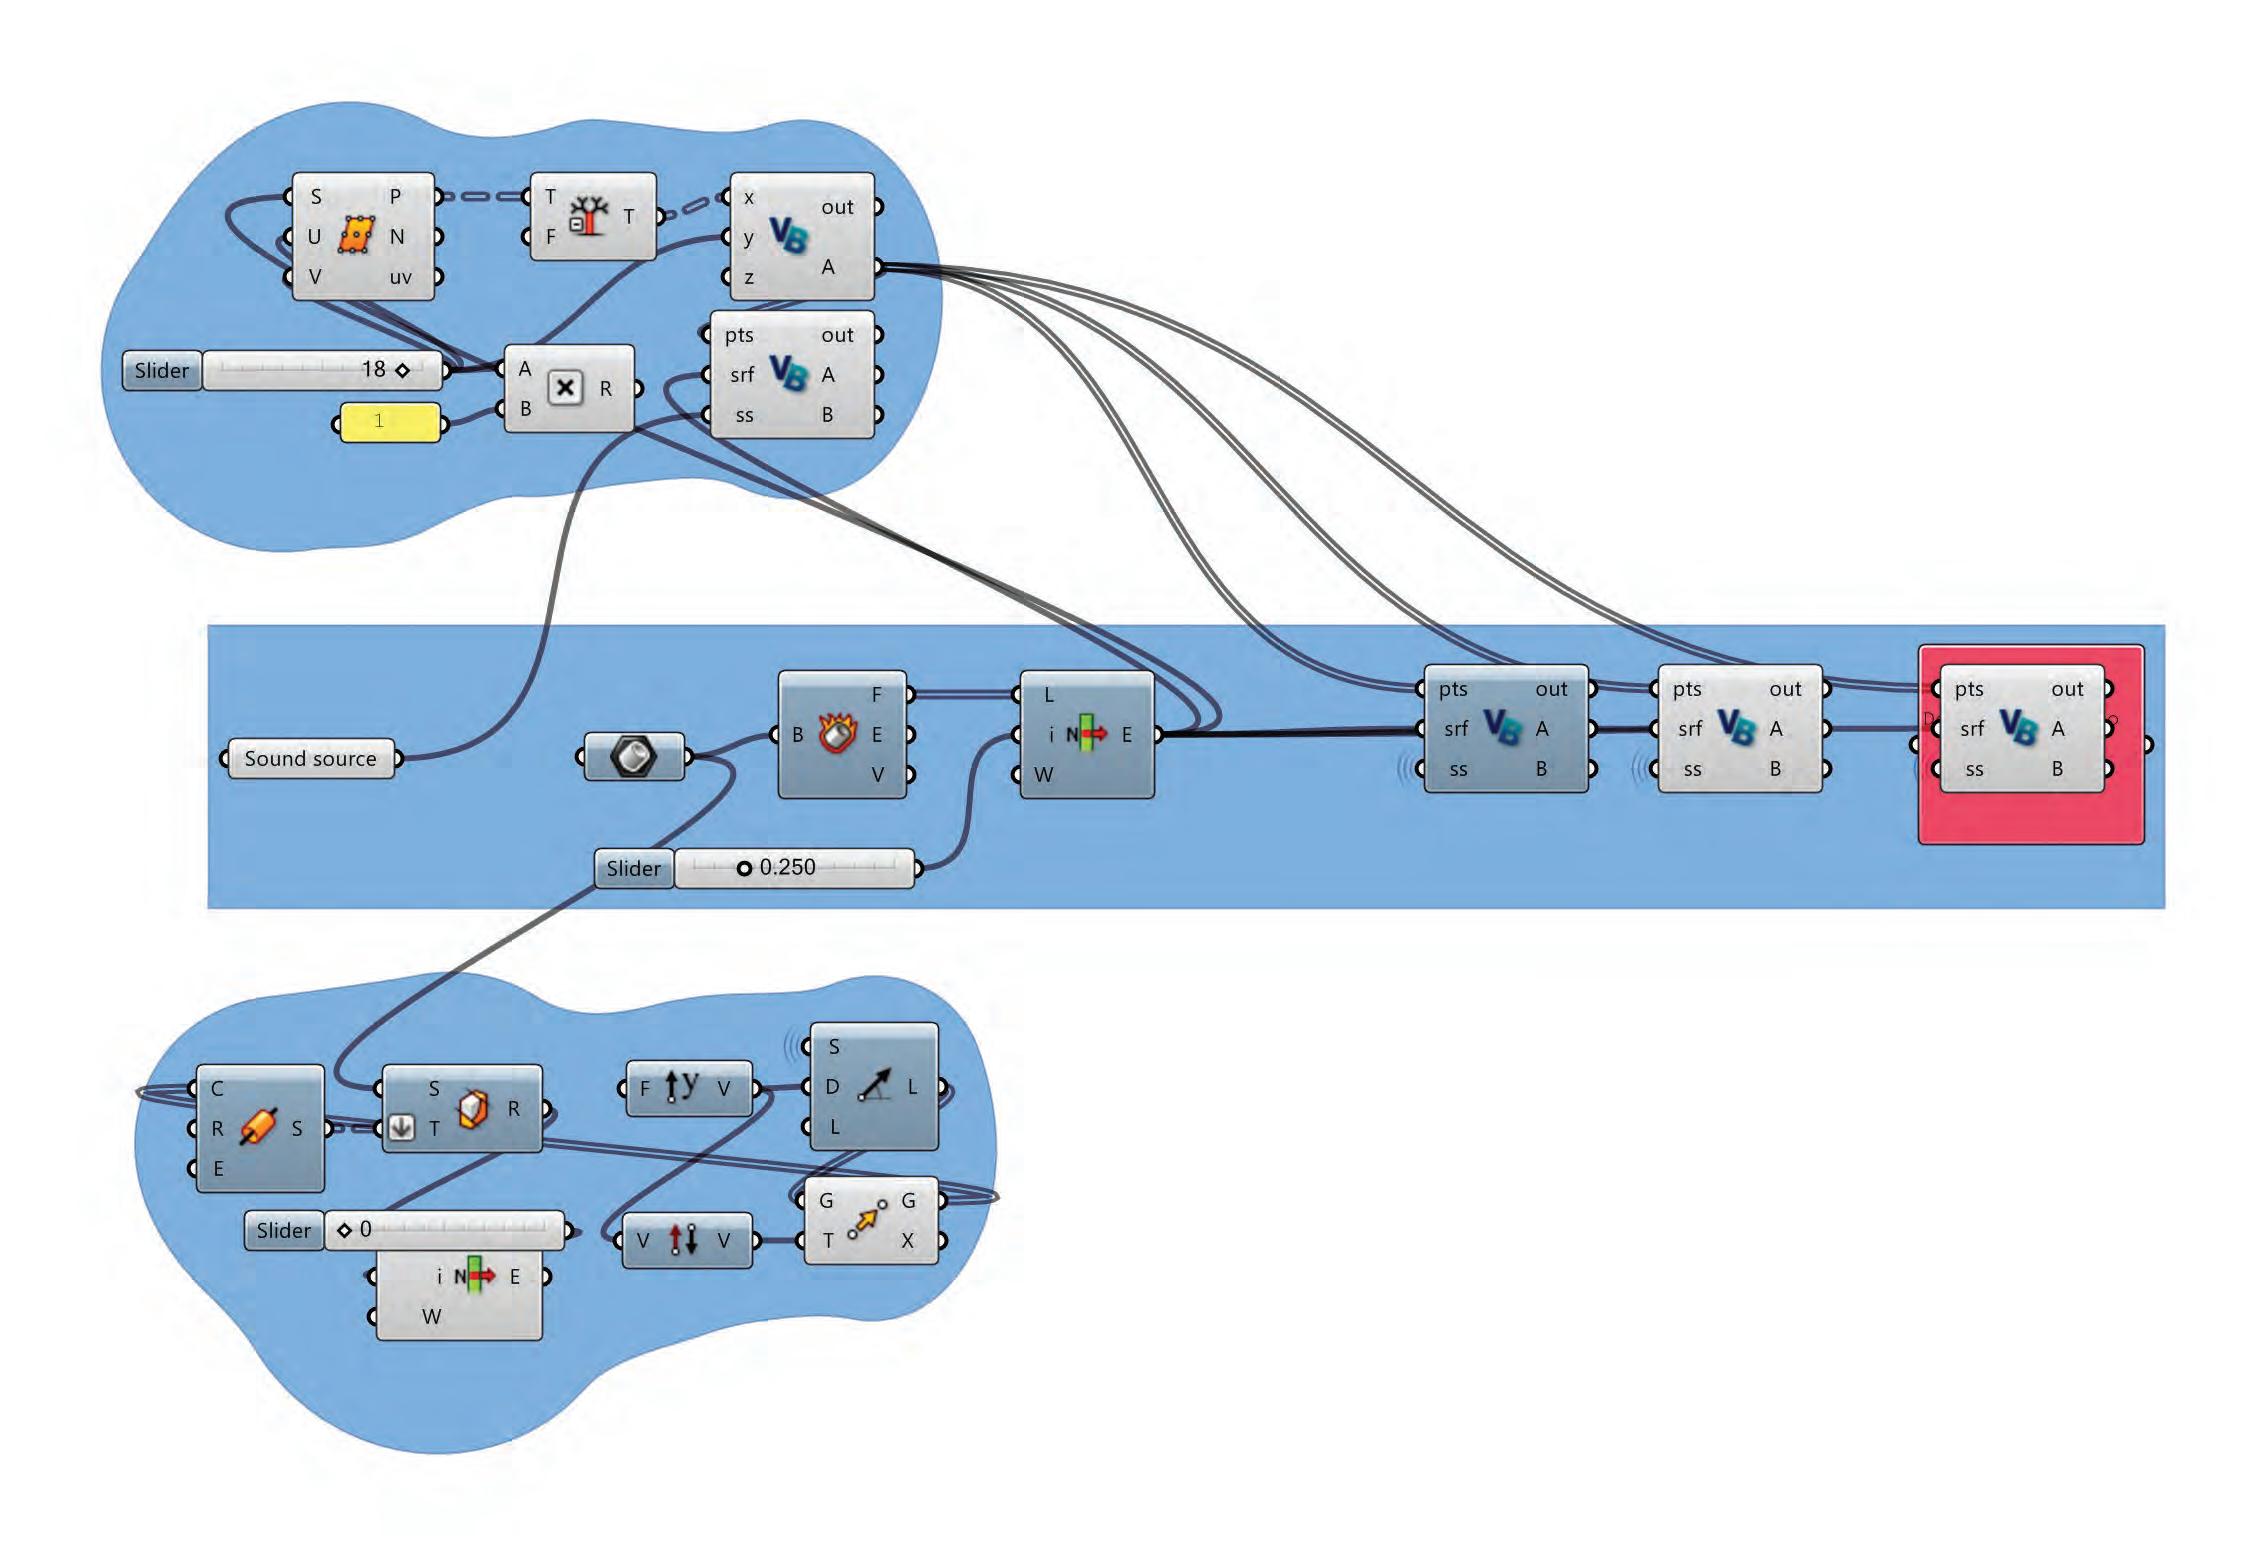
182
CONCRETE SURFACES
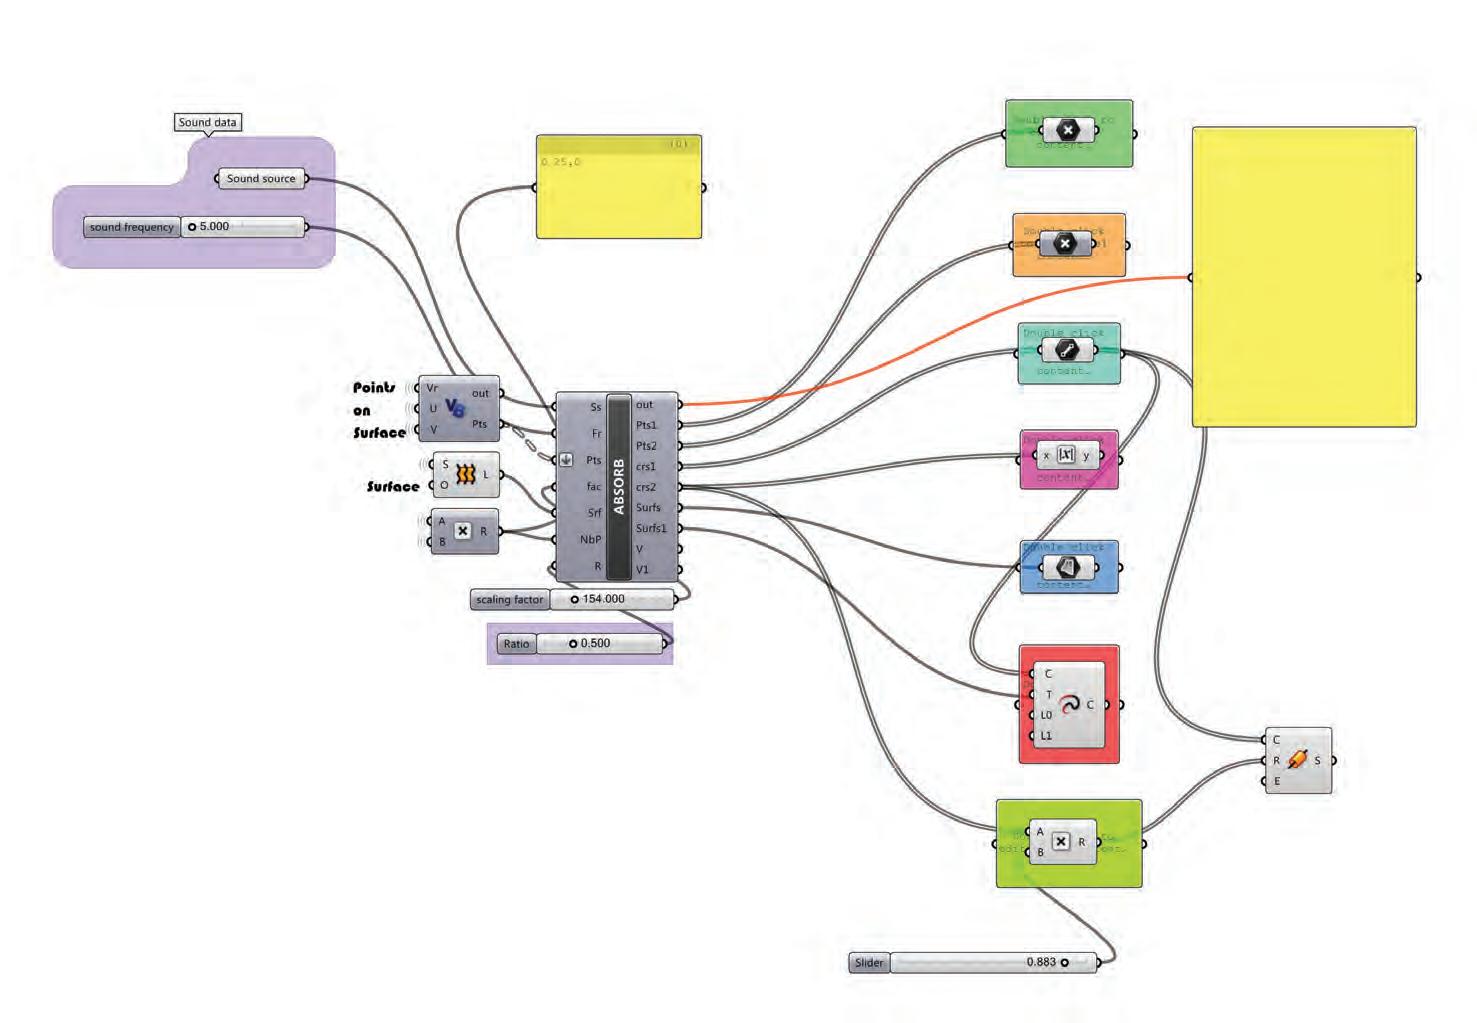
183 APPENDICES
Frequency_ Ratio input definition
Frequency_ paraboloid_ raytacing script

184
APPENDICES
CONCRETE SURFACES
Frequency based deformation of parabolic surface definition
185 APPENDICES
mapping definition

186
APPENDICES
CONCRETE SURFACES

187
Perforation density script
1 Private Sub RunScript(ByVal pts As List(Of Point3d), ByVal srf As Surface, ByVal ss As Object, ByRef A As Object, ByRef B As Object)
2 Dim ptsa1 As New list (Of point3d)
3 Dim tempptlist1 As New list (Of point3d)
4 Dim tempptlist2 As New list (Of point3d)
5
6 For i As int32=0 To pts.count - 1
7 Dim pt As Point3d = pts.item(i)
8 If Ss.DistanceTo(pt) >= 0 AndAlso Ss.DistanceTo(pt) < 27 Then 9 ptsa1.add(pt)
10 End If 11 Next
12 'second list of points: 1.select every other/2.from this list select the farest
13 '1.
14 For j As int32=0 To pts.count - 1 Step 2
15 Dim pt As Point3d = pts.item(j)
16 tempptlist1.add(pt)
17 Next
18 '2.
19 For k As int32=0 To tempptlist1.count - 1
20 Dim pt As Point3d = tempptlist1.item(k)
21 If Ss.DistanceTo(pt) >= 27 AndAlso Ss.DistanceTo(pt) < 32 Then 22 ptsa1.add(pt)
23 End If 24 Next
25 'third list of points: 1.select every two other/2.from this list select the farest
26 '1.
27 For n As int32=0 To pts.count - 1 Step 3
28 Dim pt As Point3d = pts.item(n)
29 tempptlist2.add(pt)
30 Next
31 '2.
32 For m As int32=0 To tempptlist2.count - 1
33 Dim pt As Point3d = tempptlist2.item(m)
34 If Ss.DistanceTo(pt) >= 32 Then
35 ptsa1.add(pt)
36 End If
Next 38 39 40 a = ptsa1
42 End Sub
188
APPENDICES
37
41
CONCRETE SURFACES
'for the right edge
(nbp
k)
'testpt to move all the points/get the new surface and get the surface area 15 16 '_____________________________________________________________________________________
17 'MOVE ALL THE POINTS back and front
18 Dim ptslist1 As New list (Of Point3d)
19 Dim ptslist2 As New list (Of point3d)
20 For j As int32=0 To pts.Count - 1
21 Dim pt As point3d = pts.item( )
22 srf.SetDomain(0, New interval(0, 1))
23 srf.SetDomain(1, New interval(0, 1))
24 Dim ui As New Double
25 Dim vi As New Double
26 srf.ClosestPoint(pt, ui, vi)
27 Dim vec As vector3d = srf.NormalAt(ui, vi)
28 29 vec.Unitize
30 Dim pln As New Plane(pt, vec)
31 Dim ln As New line(ss, pt)
32 Dim trans1 As transform = Transform.Translation(vec * fac / ln.Length * (-0.5))
33 pt.Transform(trans1)
34 ptslist1.add(pt)
35 Dim trans2 As transform = Transform.Translation(vec * fac / ln.Length * (1))
36 pt.Transform(trans2)
37 ptslist2.add(pt)
38 Next
39 '_____________________________________________________________________________________
40
41 '_____________________________________________________________________________________
42 'CREATE ONE NEW SURFACE TO MEASURE THE AREA
43 Dim crvlist As New list (Of curve)
44 For k As int32=0 To nbp
45 Dim tempptlist As New list (Of point3d)
46 For As int32=(nbp * k) + k To (nbp * (k + 1)) + k
47 If i = (nbp * k) + k Then Continue For
48 'for the right edge
49 If i = (nbp * k) + k + 1 Then
50 Dim pt1 As point3d = ptslist1.item( - 1
51 Dim pt2 As New point3d
52 pt2 = pt1
53 Dim pt3 As point3d = ptslist1.item( )
54 Dim vec As New vector3d(pt1 - pt3)
55 Dim trans As transform = Transform.Translation(vec / 2
56 pt2.transform(trans)
57 tempptlist.add(pt2)
58 tempptlist.add(pt1)
59 tempptlist.add(pt3)
60 Else 61 tempptlist.add(ptslist1.item( ))
62 End If
63 'for the left edge
64 If i = (nbp * (k + 1)) + k Then
65 Dim pt1 As point3d = ptslist1.item( )
66 Dim vec As New vector3d(pt1 - ptslist1.item( - 1))
67 Dim trans As transform = Transform.Translation(vec / 2
68 pt1.transform(trans)
69 tempptlist.add(pt1)
70 End If
71 Next
72
73 Dim crv As curve = Curve.CreateControlPointCurve(tempptlist, 3)
74 'for the upper edge
75 If k = 1 Then
76 Dim crv1 As Curve = crvlist.item(0)
crv1.Transform(trans) C:\Users\nico\Desktop\alki2.vb: 1/4
- pt3)
Dim trans As transform = Transform.Translation(vec / 2
pt2.transform(trans)
tempptlist.add(pt2)
tempptlist.add(pt1)
tempptlist.add(pt3)
Else
tempptlist.add(ptslist1.item( ))
End If
'for the left edge
If i = (nbp * (k + 1)) + k Then
Dim pt1 As point3d = ptslist1.item( )
Dim vec As New vector3d(pt1 - ptslist1.item( - 1))
Dim trans As transform = Transform.Translation(vec / 2
pt1.transform(trans)
tempptlist.add(pt1)
End If
Dim crv As curve = Curve.CreateControlPointCurve(tempptlist, 3)
'for the upper edge
If k = 1 Then
Dim crv1 As Curve = crvlist.item(0)
Dim vec As New vector3d(crv1.PointAtStart - crv.PointAtStart)
Dim trans As Transform = Transform.Translation(vec 2) 79 crv1.Transform(trans)
C:\Users\nico\Desktop\alki2.vb: 1/4
Frequency_Ratio
189 APPENDICES
input ratio
ByVal fac As Double, ByVal Srf As Surface, B yVal
Object, ByRef crs1 As Object, ByRef crs2 As Object, ByRef Su
3
Dim
New list
Double) 11 Dim
New list
13
14
1 Private Sub RunScript(ByVal Ss As Point3d, ByVal Fr As Double, ByVal Pts As List(Of Point3d)
NbP As Integer, ByVal R As Double ByRef Pts1 As Object, ByRef Pts2 As
rfs As Object, ByRef Surfs1 As Object, ByRef V As Object, ByRef V1 As Object) 2 'Dim runcount As int32 = 0
Dim llist As New list Of Double) 4 Dim rlist As New list (Of Double) 5 Dim crlist1 As New list (Of Circle) 6 Dim crlist2 As New list (Of Circle) 7 Dim ptsa1 As New list (Of point3d) 8 Dim ptsa2 As New list (Of point3d) 9 Dim cirarealist As New list (Of Double) 10
tubarealist As
(Of
lnlist As
(Of line) 12 Dim vlist As New list (Of Vector3d)
Dim v1list As New list (Of vector3d)
79
40 41 '_____________________________________________________________________________________ 42 'CREATE ONE NEW SURFACE TO MEASURE THE AREA 43 Dim crvlist As New list (Of curve) 44
To nbp 45
46
k 47
48
49
Then 50 Dim
51
52
pt1 53 Dim pt3
54
55
56
57
58
59
60
62
64
65
66
67
69
70
71
72 73
74
75
77
77 Dim vec As New vector3d(crv1.PointAtStart - crv.PointAtStart) 78 Dim trans As Transform = Transform.Translation(vec 2)
For k As int32=0
Dim tempptlist As New list (Of point3d)
For As int32=(nbp * k) + k To (nbp * (k + 1)) +
If i = (nbp * k) + k Then Continue For
If i =
*
+ k + 1
pt1 As point3d = ptslist1.item( - 1
Dim pt2 As New point3d
pt2 =
As point3d = ptslist1.item( )
Dim vec As New vector3d(pt1
61
63
68
Next
76
78
APPENDICES
Frequency based deformation script
Dim llist As New List(Of Line
For
For As int32=0To Sample
dompnt.Add(pyarr( ))
mainDB += darr(
Next
'------------doing weighted average
Dim mainF As Double = 0
For As int32=0 To dompnt.Count - 1
Private Sub RunScript(ByVal Div As Integer, ByVal S As Surface, ByVal M As Double, ByRef A As Object)
'-----------getting point on the bottom to draw a curve
S.SetDomain(0, New interval(0, 1))
S.SetDomain(1, New interval(0, 1))
Dim xp As New list(Of point3d)
For As int32 =0 To 200
xp.Add(S.PointAt(0, / 200))
Next
'-----------------dividing into regular grid
Dim c As curve = Rhino.Geometry.Curve.CreateInterpolatedCurve(xp, 3)
Dim tarr() As Double = c.DivideByCount(Div, True)
Dim p1 As point3d = c.PointAt(tarr(0))
Dim p2 As point3d = c.PointAt(tarr(1))
Dim di As Double = p1.DistanceTo(p2)
Dim pu0 As point3d = S.PointAt(0, 0)
Dim pu1 As point3d = S.PointAt(1, 0)
Dim h As Double = pu0.DistanceTo(pu1)
Dim N As int32 = Math.Round(h / di)
Dim ptree As New DataTree(Of point3d)
For As int32 = 0 To N
pthi As New GH_Path(i)
For As int32 =0 To Div
ptree.Add((S.PointAt(i / N, j / Div)), pthi)
mlist As New List(Of point3d)
For As int32=0 To (ptree.BranchCount / 2) - 1
Dim ci As Curve = curve.CreateInterpolatedCurve(ptree.Branch(i * 2), 3)
For As int32=0 To (div / 2) - 1
Dim pj As Point3d = ptree.Branch( * 2) item((j * 2))
Dim ti As New Double
ci.ClosestPoint(pj, ti)
Dim frm As New Plane
ci.FrameAt(ti, frm)
ptree.Branch(i * 2) item(( * 2)) = pj + frm.YAxis * M
ptree.Branch(i * 2) item((0)) = ptree.Branch(i * 2) item((div))
190
Private Sub RunScript(ByVal Y As Double ByVal L As Double, ByVal UPD As List(Of Double) ByVal Sample As Integer, ByVal Main As Boolea n ByRef Spectrum As Object, ByRef SamplePoints As Object, ByRef MainFr As Object)
Dim p
New
Y, 0)
Dim lin
New
* L 4 Dim lc
Curve
5
New Interval(0, 1 6 Dim () As Double
lc.DivideByCount(UPD.count True 7 8 9 '-------------drawing the spectogram 10 Dim px As New List(Of Point3d) 11 For As int32=0 To UPD.Count - 1 12 px.Add(lc.PointAt t( ))) 13 Next 14 15 Dim py As New List(Of Point3d) 16 Dim d As New List(Of Double) 17 For As int32=0 To UPD.Count - 1 18 Dim pi As New Point3d(px.item( ).X, UPD.item( ) * (L / 4 ) + Y, 0) 19 py.Add(pi) 20 d.Add(UPD.item(
*
21
22 Dim
py.ToArray 23 Dim
Double
24
25
26
As int32=0 To px.Count - 1 27 Dim ls As New Line(px.item(i , py.item( )) 28 llist.add(ls) 29 Next 30 31 32 33 '-------------selecting sample points according to toogle 34 Dim dompnt As New List(Of Point3d) 35 Dim mainDB As Double = 0 36 If main Then 37 For As int32=py.Count - (1 + Sample) To py.Count - 1 38 dompnt.Add(pyarr( )) 39 mainDB += darr( 40 Next 41 Else 42
45
46
47 48
49
50
mainF += dompnt.item(
* dompnt.item( ).y 52 Next 53 mainF = mainF mainDB 54 55 56 57 58 59 Spectrum = llist 60 SamplePoints = dompnt 61 MainFr = mainF 62 End Sub C:\Users\nico\Desktop\frequency1.vb: 1/1
2
3
4
6
7
8
9 10
11
12
13
14
15
16
17
18
19
20 21
22
23
24
25
26 Next 27 Next 28 29 Dim
30 31
32
33
34
35
36
37
38
39
40
41 Next 42 Next 43 a = ptree 44 45 End Sub
1
2
As
Point3d(0
3
As
line(p, plane.WorldXY.XAxis
As
= lin.ToNurbsCurve
lc.Domain =
=
)
(L / 4 ) + Y)
Next
pyarr() As Point3d =
darr() As
= d.ToArray
array Sort(darr, pyarr)
43
44
End If
51
).x
1
5
Dim
CONCRETE SURFACES
Parabolic based deformation script
5 SO.SetDomain(1 New interval(0 1))
6
Dim intlist As New List Of curve)
22 Dim pntn As New List Of point3d)
24
28 For As int32=0 To PT.BranchCount - 1
Dim pl As New plane(PT.Branch ) item(0 , PT.Branch( ) item 1) PT.Branch )
30 Dim ci1 As curve = Rhino.Geometry.Curve.CreateInterpolatedCurve Pt.Branch ), 3
ci1.Domain = New Interval(0 1)
33 Dim carr() As curve = Nothing
34 Dim parr2() As point3d = Nothing
35 Dim int1 As Boolean = rhino.Geometry.Intersect.Intersection.BrepPlane S, pl, 0.01, Carr, parr2)
36 If int1 = True AndAlso carr.Length > 0 Then
37
38 Dim ci2 As Curve = carr 0)
39 ci2.Domain = New Interval(0 1)
40 Dim int As Rhino.Geometry.Intersect.CurveIntersections = Rhino.Geometry.Intersect.Intersection.CurveCurve ci1, ci2, 0.01 0.01
41
42 If int Count > 0 Then
43 Dim cutvalue1 As New Double
44 Dim cutvalue2 As New Double
45
46 Dim intvalue As New Double
47 Dim pint1 As point3d = int item 0).pointA
48 ci2.ClosestPoint(pint1, intvalue)
49 inpnt.Add(pint1)
50 print(cutvalue1)
51 Dim pint2 As New point3d(0 0, 0)
52
53
54 If int Count = 1 Then
55
56 Dim pintc20 As point3d = ci2.PointAt(0)
57 Dim pintc21 As point3d = ci2.PointAt(1)
58 Dim dint0 As Double = pintc20.DistanceTo(pint1
59 Dim dint1 As Double = pintc21.DistanceTo(pint1
62 If dint0 < dint1 Then 63 print("0ne")
64 cutvalue1 = intvalue
65 cutvalue2 1 66
67 Dim tci1 As New Double
68 ci1.ClosestPoint pintc21, tci1
69 pint2 = ci1.PointAt(tci1)
70 71 ElseIf dint0 > dint1 Then 72 print("0ne")
73 cutvalue1 0 74 cutvalue2 = intvalue
75 76 Dim tci1 As New Double
77 ci1.ClosestPoint pintc20, tci1
78 pint2 ci1.PointAt(tci1)
79 End If 80
81 End If
1/4
191 APPENDICES
1 Private Sub RunScript(ByVal SO
Surface, ByVal Sl As List(Of Brep) ByRef A
Object, ByRef B
Object, ByRef
Object)
As
As
As
C As
2 Dim pllist As New List(Of plane) 3 4 SO.SetDomain(0 New interval(0 1))
Dim
New
7
Dim
New GH_Path
9
As
0
50 10 PT.Add SO.PointAt
50) pathi) 11 Next 12 Next 13 14 15 Dim
16 17
18 19
21
PT As
DataTree(Of point3d
For As int32=0 To 3 8
pathi As
)
For
int32
To
3,
inpnt As New List(Of Point3d
Dim clist As New List Of curve
20
23 Dim clistn As New List Of curve)
27
For g As int32=0 To Sl.count - 1 25 Dim s As Brep = Sl.item(g) 26
29
item(2))
31
32
60
61
C:\Users\nico\Desktop\paraboloid.vb:
Raytracing option_01 script
xp.item(i) = xp.item(i) + ((xv.item( )) * s)
Dim vi As Vector3d = xv.item( )
Dim minl As New Line(xp.item( ), -xv.item( ))
Dim l As New Line(xp.item( ), xv.item( ))
40 Dim cl As NurbsCurve = l.ToNurbsCurve
41 Dim pthl As New GH_path(countlist.item(i))
42 Dim d As Double = 1 - (255 - 15 * countlist.item( ) - count) 255
43 xl.Add(l, pthl)
44 cltree.Add(d, pthl)
45 For As int32=0 To srf.Count - 1
46 Dim sj As Surface = Srf.item( )
47 Dim carr() As Curve = Nothing
48 Dim parr() As Point3d = Nothing
49 Rhino.Geometry.Intersect.Intersection.CurveBrep(cl, sj.ToBrep, 0.01 carr, parr)
50 51 If parr.length > 0 Then
52 countlist.item(i) += 1
53 intpnt.add(parr(0))
54 Dim vl As vector3d = parr(0) - xp.item(i)
55 Dim ut As New Double
56 Dim vt As New Double
57 sj.ClosestPoint(parr(0), ut, vt)
58 Dim nrm As Vector3d = sj.NormalAt(ut, vt)
59
60 Dim pl As New Plane(parr(0), vl, nrm)
61 Dim ang As Double = rhino.Geometry.Vector3d.VectorAngle(nrm, vl)
If ang > math.PI Then
vl.Unitize
((2
xv.item( ) = vl
vl.Unitize
192
APPENDICES
1 Private Sub RunScript(ByVal SPr As Surface, ByVal Abs As Double, ByVal Smth As Double, ByVal reset As Boolean ByVal Srf As List(Of Surf ace) ByVal S As Double, ByRef A As Object, ByRef B As Object, ByRef Lin As Object, ByRef Cn As Object) 2 3 If reset OrElse count = 0 Then 4 5 6 intpnt.Clear 7 countlist.Clear 8 xv.clear 9 xl.clear 10 xp.Clear 11 cltree.Clear 12 SPr.SetDomain(0, New interval(0, 1)) 13 SPr.SetDomain(1, New interval(0, 1)) 14 15 16 For As int32 = 0 To 10 - 1 17 For As int32 =0 To 10 - 1 18 Dim Pi As Vector3d = SPr.PointAt( / 10, j / 10) 19 Dim v As Vector3d = SPr.NormalAt( / 10, 10) 20 v.Unitize 21 xv.add(v) 22 xp.add(pi) 23 countlist.Add(0) 24 Next 25 Next 26 27 For As int32=0 To xp.Count - 1 28 Dim As New line(xp.item(i) xv.item(i)
29 Dim
New
30
31 Next 32 End If 33 34 35
i As
1 36
38
* s)
pth As
GH_path(0)
xl.add(l, pth)
For
int32=0 To xp.Count -
37
39
62 63
64 65
66
67
68 xp.item(
vl * s * abs 69
70
71
72
vl 73 xp.item( ) = parr(0) + vl * s * abs 74 End If 75 76 End If 77 Next 78 Next 79 44 cltree.Add(d, pthl) 45 For As int32=0 To srf.Count - 1 46 Dim sj As Surface = Srf.item( ) 47 Dim carr() As Curve = Nothing 48 Dim parr() As Point3d = Nothing 49 Rhino.Geometry.Intersect.Intersection.CurveBrep(cl, sj.ToBrep, 0.01 carr, parr) 50 51 If parr.length > 0 Then 52 countlist.item(i) += 1 53 intpnt.add(parr(0)) 54 Dim vl As vector3d = parr(0) - xp.item(i) 55 Dim ut As New Double 56 Dim vt As New Double 57 sj.ClosestPoint(parr(0), ut, vt) 58 Dim nrm As Vector3d = sj.NormalAt(ut, vt) 59 60 Dim pl As New Plane(parr(0), vl, nrm) 61 Dim ang As Double = rhino.Geometry.Vector3d.VectorAngle(nrm, vl) 62 63 If ang > math.PI Then 64 65 vl.Rotate(2 * ((2 * math.PI - ang) - (math.PI * 0.5)) pl.ZAxis) 66 vl.Unitize 67 xv.item(i) = vl 68 xp.item( ) = parr(0) + vl * s * abs 69 Else 70 vl.Rotate(2 * (ang - math.PI * 0.5), pl.ZAxis) 71 vl.Unitize 72 xv.item(i) = vl 73 xp.item( ) = parr(0) + vl * s * abs 74 End If 75 76 End If 77 Next 78 Next 79 80
vl.Rotate(2 *
* math.PI - ang) - (math.PI * 0.5)) pl.ZAxis)
) = parr(0) +
Else
vl.Rotate(2 * (ang - math.PI * 0.5), pl.ZAxis)
xv.item( ) =
C:\Users\nico\Desktop\flatray.vb: 1/2
CONCRETE SURFACES
Dim vi As Vector3d = xv.item( )
Dim minl As New Line(xp.item( ) -xv.item( ))
39 Dim As New Line(xp.item( , xv.item( ))
40 Dim cl As NurbsCurve = l.ToNurbsCurve
41 Dim pthl As New GH_path countlist.item( ))
42 Dim d As Double = 1 - 255 - 15 * countlist.item( - count) 255
43 xl.Add(l, pthl)
44 cltree.Add(d, pthl)
45 For j As int32=0 To srf.Count - 1
46 Dim sj As Surface = Srf.item( )
47 Dim carr() As Curve = Nothing
48 Dim parr() As Point3d Nothing
49 Rhino.Geometry.Intersect.Intersection.CurveBrep cl, sj.ToBrep, 0.01 carr, parr)
50 51 If parr.length > 0 Then
52 countlist.item( += 1
53 intpnt.add(parr(0))
54 Dim vl As vector3d = parr(0) - p
55 Dim ut As New Double
56 Dim vt As New Double
57 sj.ClosestPoint parr 0) ut, vt
58 Dim nrm As Vector3d = sj.NormalAt ut, vt)
59 60 Dim pl As New Plane parr 0) vl, nrm)
61 Dim ang As Double = rhino.Geometry.Vector3d.VectorAngle(nrm, vl
62
63 If ang > math.PI Then
64
65 vl.Rotate(2 * ((2 * math.PI - ang) - (math.PI * 0.5)) pl.ZAxis
66 vl.Unitize
67 xv.item( vl
68 xp.item( ) = parr 0) + vl * s * abs
69 Else
70 vl.Rotate(2 * (ang - math.PI * 0.5), pl.ZAxis)
71 vl.Unitize
72 xv.item( vl
73 xp.item( ) = parr 0) + vl * s * abs
74 End If 75 76 End If 77 Next 78 Next
C:\Users\nico\Desktop\pointray.vb: 1/2
193 APPENDICES
Raytracing option_02 script 1 Private Sub RunScript(ByVal P As Point3d, ByVal Abs As Double, ByVal Smth As Double ByVal reset As Boolean ByVal Srf As List Of Surface ) ByVal S As Double, ByRef A As Object, ByRef B As Object, ByRef Lin As Object, ByRef Cn As Object 2 3 If reset OrElse count = 0 Then 4 Dim sph As New Sphere P, 0.001) 5 Dim sphs As NurbsSurface sph.ToNurbsSurface 6 intpnt.Clear 7 countlist.Clear 8 xv.clear 9 xl.clear 10 xp.Clear 11 cltree.Clear 12 sphs.SetDomain 0, New interval(0 1)) 13 sphs.SetDomain 1, New interval(0 1)) 14 15 For i As int32 = 0 To 10 - 1 16 For As int32 =0 To 10 - 1 17 xp.Add sphs.PointAt( / 10 / 10)) 18 countlist.Add(0 19 Next 20 Next 21 Dim vlist As New List(Of Vector3d 22 For i As int32 0 To xp.count - 1 23 Dim v As Vector3d = xp.item ) - P 24 v.Unitize 25 xv.add(v) 26 Next 27 For i As int32=0 To xp.Count - 1 28 Dim As New line(p, xp.item i)) 29 Dim pth As New GH_path(0) 30 xl.add l, pth) 31 Next 32 End If 33 34 35 For
36
37
As int32=0 To xp.Count - 1
xp.item i xp.item( ) + ((xv.item( )) * s
38
79 80
APPENDICES
Mapping script
194
1 Private Sub RunScript(ByVal L As Double ByVal H As Double, ByVal Utiles As Integer, ByVal Grid As Integer, ByRef U As Object, ByRef V As Object, ByRef Vtiles As Object) 2 3 U = Utiles * Grid - (Utiles - 1) 4 Vtiles = MATH.Round(L / H) * Utiles 5 v = Vtiles * Grid - ( Vtiles - 1) 6 7 'V = Vtiles * grid 8 End Sub 9 Private Sub RunScript(ByVal pnt As List(Of Point3d) ByVal ds As Double, ByVal V As Integer ByRef A As Object) 10 Dim plist As New DataTree(Of point3d) 11 12 For As int32=0 To V - 1 13 Dim ghpthi As New GH_Path(i) 14 For j As int32=0 To pnt.Count - 1 15 Dim pj As Point3d = pnt.item(j) 16 Dim vs As New vector3d(0 0 0) 17 If = 0 Then 18 plist.Add((pj) ghpthi) 19 Else 20 vs = Plane.WorldXY.ZAxis * -ds * ( ) 21 plist.Add((pj + vs) ghpthi) 22 End If 23 Next 24 Next 25 26 a = plist 27 End Sub 28 Private Sub RunScript(ByVal Vr As List(Of Point3d), ByVal U As Integer, ByVal V As Integer ByVal G As Integer, ByVal Utiles As Integer, ByV al Vtiles As Integer, ByRef A As Object) 29 Dim ptree As New DataTree (Of Point3d) 30 31 32 33 For As int32 = 0 To U - 1 34 Dim pathi As New GH_Path( ) 35 For j As int32 = 0 To V - 1 36 ptree.Add(Vr.item(V * + ), pathi) 37 Next 38 Next 39 40 41 Dim plist As New DataTree(Of Point3d) 42 For k As int32=0 To (Vr.Count - 1) / G 43 44 45 For Iu As int32 = 1 To Utiles 46 For Iv As int32=1 To Vtiles 47 Dim pathk As New GH_path(Iu, Iv) 48 For As int32=(Iu - 1) * (G - 1) To Iu * (G - 1) 49 For j As int32=(IV - 1) * (G - 1) To Iv * (G - 1) 50 plist.Add((ptree.Branch(i) item( )), pathk) 51 Next 52 Next 53 Next 54 Next 55 Next 56 57 58 59 a = plist 60 End Sub 61 Private Sub RunScript(ByVal x As DataTree(Of Point3d) ByVal y As Integer, ByRef A As Object, ByRef B As Object) 62 63 Dim ptree2 As New DataTree(Of Point3d) 64 Dim plist As New List(Of Point3d) 65 66 67 For k As int32=0 To x.BranchCount - 1 68 Dim ptree As New DataTree(Of Point3d) 69 Dim xlist As List(Of point3d) = x.Branch(k) 70 71 For i As int32=0 To y - 1 72 Dim pthi As New GH_Path( ) 73 For As int32=0 To y - 1 74 ptree.Add(xlist.item((y * i) + ), pthi) 75 Next 76 Next 77 36 ptree.Add(Vr.item(V * i + ), pathi) 37 Next 38 Next 39 40 41 Dim plist As New DataTree(Of Point3d) 42 For k As int32=0 To (Vr.Count - 1) G 43 44 45 For Iu As int32 = 1 To Utiles 46 For Iv As int32=1 To Vtiles 47 Dim pathk As New GH_path(Iu, Iv) 48 For As int32=(Iu - 1) * (G - 1) To Iu * (G - 1) 49 For As int32=(IV - 1) * (G - 1) To Iv * (G - 1) 50 plist.Add((ptree.Branch( ) item( )), pathk) 51 Next 52 Next 53 Next 54 Next 55 Next 56 57 58 59 a = plist 60 End Sub 61 Private Sub RunScript(ByVal x As DataTree(Of Point3d) ByVal y As Integer, ByRef A As Object, ByRef B As Object) 62 63 Dim ptree2 As New DataTree(Of Point3d) 64 Dim plist As New List(Of Point3d) 65 66 67 For k As int32=0 To x.BranchCount - 1 68 Dim ptree As New DataTree(Of Point3d) 69 Dim xlist As List(Of point3d) = x.Branch(k) 70 71 For i As int32=0 To y - 1 72 Dim pthi As New GH_Path( ) 73 For As int32=0 To y - 1 74 ptree.Add(xlist.item((y * i) + ), pthi) 75 Next 76 Next 77 78 79 For i As int32=0 To y - 1 C:\Users\nico\Desktop\mapp.vb: 1/2


 Acoustics| Global Scale| Phase II_Catalogue


