Environmental& EngineeringGeoscience
NOVEMBER2024 VOLUMEXXX,NUMBER4




NOVEMBER2024 VOLUMEXXX,NUMBER4


Volume30,Number4,November2024

173QuarriesasaSourceofNitratePollutioninKarstAquifers:CaseStudy,theEdwardsAquifer,Texas JamesDavidDoyle
193DeterminingGroundwaterTableinSlopesWithHorizontalDrainsandDesignFrameworkforLength andSpacing
MihiraLakruwan,AkiyoshiKamura,andMotokiKazama
211
229
UsingtheTotalApparentSpacingApproachtoOptimizeFoundationDrainOrientations
WilliamM.RomanandJohnN.Berezniak
Developmentofa3DGeologicModelUsedintheSeismicHazardandLiquefactionHazardAnalysisof MadisonCounty,Tennessee
ValarieJoynerHarrison,HamedTohidi,RoyVanArsdale,ChrisCramer,andDavidArellano
UsingLandslidestoLocatetheEpicenterfortheHistoric1882EarthquakeinColorado JustinMarchlewiczandPaulSanti
BookReview
Introduction to Waste Management: A Textbook Thomas Oommen

JAMESDAVIDDOYLE*
200CedarPark,CanyonLake,TX78132
KeyTerms: EdwardsAquifer,Nitrate,Aggregate, Quarries,KarsticAquifer
TheSanAntoniosegmentofthekarsticEdwards Aquiferprovidesanexampleoftheimpactofaggregate quarriesonnitrateloadsinkarstaquifers.Previous publishedreportshavenotevaluatedaggregatequarriesasapossiblecauseofnitrateconcentrationsinthe EdwardsAquiferabovenormalbackgroundlevelsand insteadattributenitratetorecenturbandevelopment directlyovertheaquifer’srechargezone.Quarriesare knowntobesourcesofnitratepollutionofgroundwaterresultingfromuseofammoniumnitratefuel–oil (ANFO)mixturesasexplosivesinminingoperations. Ammoniumnitrateishighlysolubleandleachesreadily intotheformationbeingmined.Largequantitiesare used,upto30percentofwhichisnotconsumedby blasting,thusconstitutingapotentialgroundwater pollutant.GroundwaterdatafromtheTexasWater DevelopmentBoardandstreamdatafromtheTexas CommissiononEnvironmentalQualityshowthat urbanizationcannotexplainthegeographicdistributionandhistoricalchangesofnitrateintheaquifer. Thegeographicdistributionofnumerouslimestone quarries fitswiththedata,andnitrateconcentrations intheEdwardsAquiferhaverisensinceANFOuse asanexplosivebeganonalargescale,whichindicates quarriesareamajorcontributorofnitratetothe aquifer.Water-qualitymeasurementsofnitrateinthe EdwardsAquifermostlyremainatalevelsafefor humans.However,somefreshwateraquaticorganismsareharmedbyprolongedexposuretolower nitratelevels.Recentnitratemeasurementsshowthat mostmeasurementshavereachedalevelthatmight beharmfultosomegroundwaterspecies.
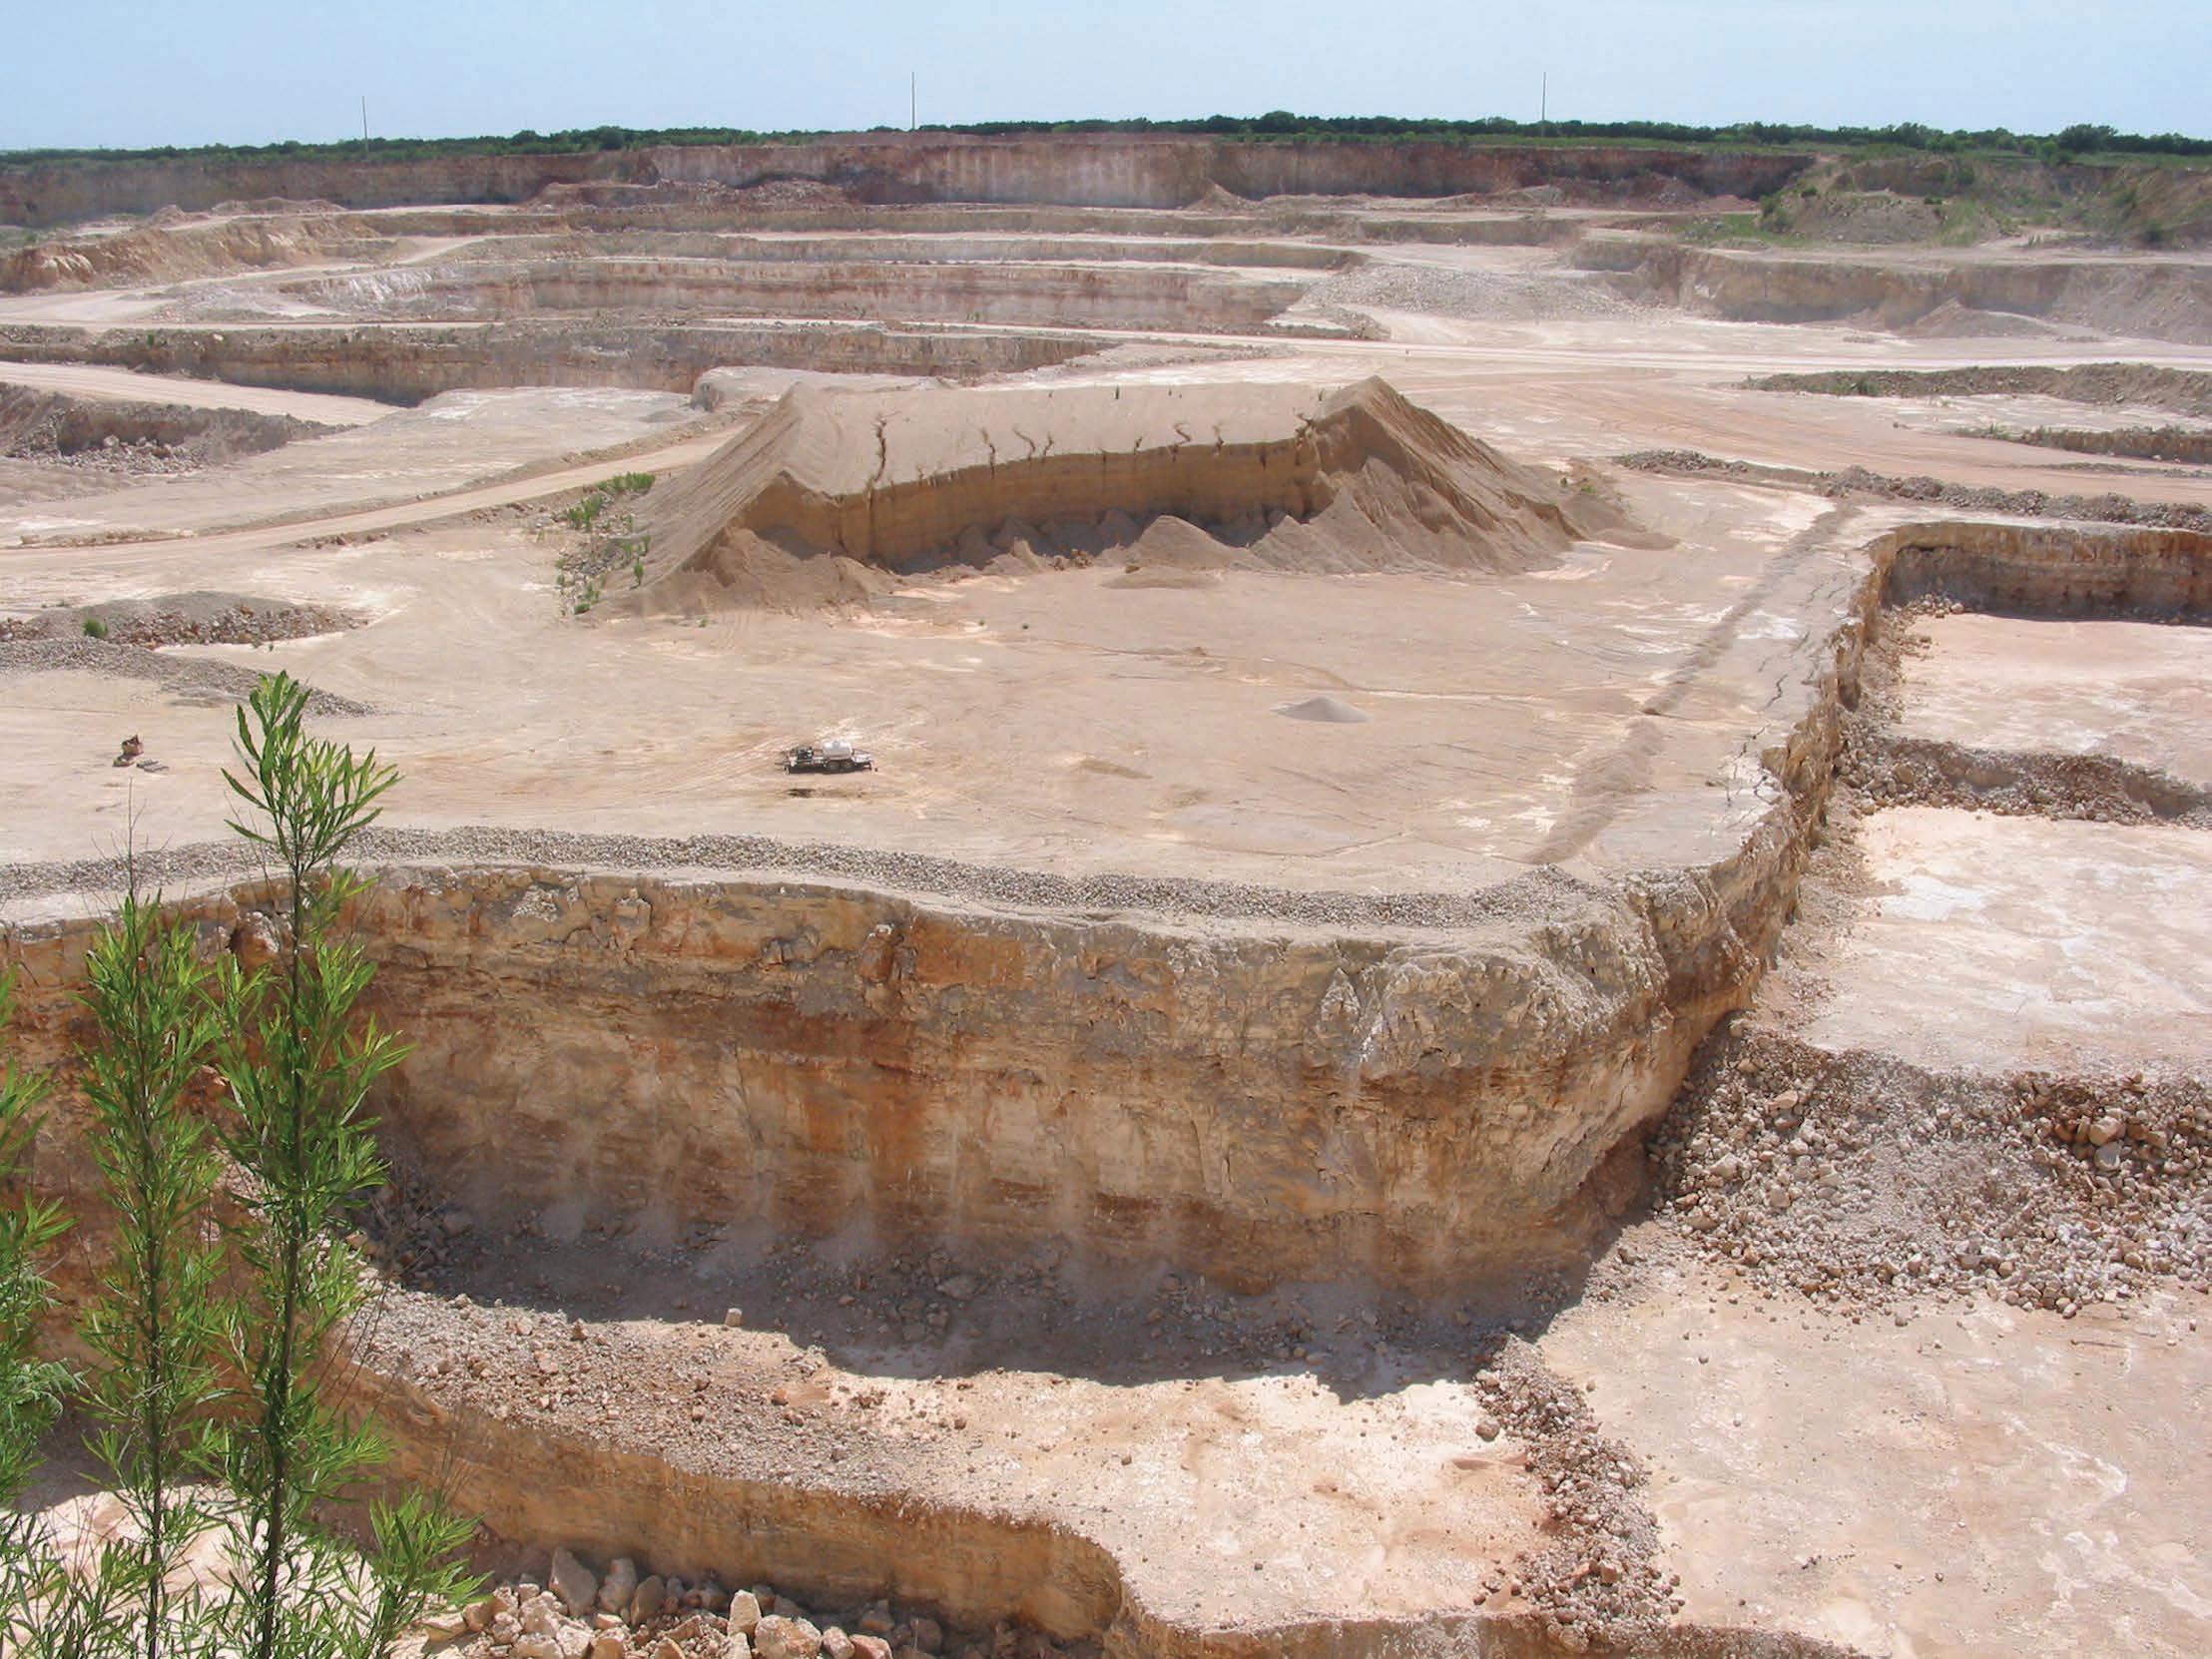
TexasleadsallAmericanstatesintheproductionof crushedstone.TheTexasHillCountryislocatedinthe southeasterncornerofthekarsticEdwardsPlateauand isamajorproductionareaforlimestoneaggregate(Kyle
*Correspondingauthoremail: bangeo1@hotmail.com

andElliot,2019).State-wide,limestoneaggregateproductionhasincreasedsteadilyovertheyears.Forexample,from2010to2018,annualcrushedlimestone productioninTexasincreasedfrom104millionto161 millionmetrictons(NationalMineralsInformationCenter,2021).Air,water,andnoisepollutionfromquarries hasbecomeanincreasingconcern,particularlywhere quarriesareconcentratedalongtheInterstateHighway 35corridor(Figure1;Chasnof,2021).Priorstudiesof nitrateconcentrationintheEdwardsAquiferknownto theauthorhavenotconsideredquarriesasapotential source.Thepurposeofthisstudyistousepublicdatato assesswhetherquarriesaresignificantcontributorsof nitratepollutiontotheSanAntoniosegmentofthe EdwardsAquiferasrepresentativeofkarstaquifersin general.
EdwardsAquiferhydrologicalzonescompriseacontributing(ordrainage)zonethatdeliverssurfacewater toarechargezonewheretheEdwardsLimestoneisat thesurface,andaportionofthewater flowingfromthe contributingzonepassesintothesubsurfaceviafracturesandkarstfeatures.Inarelativelynarrowtransition zone,youngerstrataareatthesurface,butwatercan reachtheEdwardsAquiferthroughfaultsandfractures. TheEdwardsAquiferisunderlainbytheTrinityAquifer,whichalsoextendsnorthoftheEdwardsAquifer rechargezonewheretheTrinitygroupisatthesurface (SharpandGreen,2022).TheEdwardsTrinityAquifer occursinthenorthwesternpartofthestudyarea(Figure 1).Asidefromstreamsthatcrossfromthecontributing zonetotherechargezone,theEdwardsAquiferis sourcedfromrainfallrunoffontherechargezone,from cross-formation flowwiththeTrinityAquiferwherethe EdwardsandTrinityaquifersarejuxtaposedbyfaultsin theBalconesFaultZone,andfromtheEdwardsTrinity PlateauAquiferinUvaldeCounty(Lindgrenetal., 2004).Intheartesianzone,theEdwardsLimestoneis overlainbyyoungerimpermeableformations(Schindel, 2019;TCEQ,2019).Quarriesaremostlysitedonthe rechargezone,whereasthecontributingzonehasafew smallquarries.NearthetownofUvalde,quarriesappear tobetargetinglocalEdwardsLimestoneoutcropssouth oftherechargezone(Figures1–3).

Figure1.Quarrylocationsshownwithreferencetomajoraquifers(TWDB,n.d.a)andzonesoftheEdwardsAquifer.LocationsofEdwards AquiferzonesarefromTCEQ(2019)andEAA(2014).
Theaggregateindustrymostlyusesammoniumnitrate fuel–oil(ANFO)mixturesasexplosives.ANFOmixturesvarysomewhatbuttypicallyareastoichiometric compositionof94.5percentammoniumnitrateand5.5 percentfueloil.AmmoniumnitrateisasaltthatdisassociatesinwatertoNH4þ andNO3 anddissolves readily(Brochu,2010).Nitrifi cationconvertsammoniumtonitratenitrogen(AmericanWaterworksAssociationandEconomicandEngineeringServices,Inc., 2002).LossofANFObyleachingtotheformation beingminedisvariableandin fl uencedbyseveralfactors,includingspecifi cationsoftheexplosive,natureof thesitebeingmined,designofboreholesandexplosive patterns,andlengthoftimebetweenloadingboreholes anddetonation(Brochu,2010).Evenslightamountsof waterinboreholescandissolveenoughANFOtopreventdetonation(KonyaandKonya,2019).Asidefrom beingleachedfromboreholes,about28 –30percentof ANFOthatisusedisnotconsumedinblasting (Alberts,2016).Consequently,nitratepollutionof groundwaterfromminingisarecognizedproblemin somepartsoftheworld(GolderAssociates,2014; Alberts,2016).
Somestates,e.g.,NewHampshireandVermont,regulatetheminingprocesstominimizethepotentialfor groundwatercontaminationandrequiregroundwater monitoringduringthelifeofaquarry(Kernan,2010; AgencyofNaturalResources,2014).TheTexasCommissiononEnvironmentalQuality(TCEQ)requiresa WaterPollutionAbatementPlan(WPAP)forconstructionontherechargezoneandhasestablishedbestmanagementpractices(BMPs)forquarriestomeetwaterqualitystandardsfortheEdwardsAquiferthatarenot applicabletootheraquifers(Barrett,2005;Barrettand Eck,2012).TheBMPsaddresshandlingofsensitive karstfeatures,preventionofspills,andcreationofberms toisolatethesite.However,themannerofconducting blastingoperationsisnotaddressed,andmonitoringof wellsisnotrequired.
Toavoiddirectlyintroducingcontaminantstothe EdwardsAquifer,oneoftheBMPsrecommendedbythe TCEQistomaintainthebaseofquarryoperationsat least7.6m(25ft)abovetheaquiferlevelexpectedfor comparativelywetyears,definedashaving110cm(45 in.)ormoreofrainfall.Theheightabovetheaquiferis basedonanestimateddepthofinducedfractures

Figure2.QuarrylocationsareshownwithreferencetooutcropsofstratigraphicunitscorrelativetotheEdwardsandTrinitygroups.SurfacegeologyisfromtheUSGS(2022).RechargeandtransitionzoneoutlinesarefromTCEQ(2019).
beneathshotholes.Awet-yearaquiferelevationestimateforthequarrysitemustbebasedonawaterelevationmeasurementfromanon-sitewellorcloseoffset well.Therecordedwaterelevationintheon-sitewell mustbeadjustedusingawellinthesamecountywith historicalwatertableelevationdataandbydetermining thedifferencebetweenthewaterelevationsonthe
observationdateintheon-sitewellandthewet-yearelevationinthereferencewell(BarrettandEck,2012). AccordingtotheTexasAggregatesandConcrete Association(TACA),washingofaggregateisaroutine activity(TACA,2020),andthe finesareaccumulatedin settlingponds.Pondsmayusealiner,butduetothe scaleofwaterhandling,operatorsmaycreatepondsby

fiedwithpermissionfromEAA(2020).
sealingvoidsandfracturesonthepond floorandpermeablebedsonthewallsliningthepond.Somewaterloss totheformationisexpected(BarrettandEck,2012).
TheTexasWaterDevelopmentBoard(TWDB)maintainsagroundwaterdatabase(GWDB)thatincludes water-qualitymeasurementsfromwellsamples(TWDB, n.d.b)thatarepredominantlyreportedinmilligramsper literas “nitrateasNO3” butmaybereportedas “nitrate asN.” Theratioofthetwomeasures(TWDB,n.d.c) usedforconversionisasfollows:
nitrateasNO3 ¼ nitrateasN 3 4 427
Inthispaper,nitratereferstonitrateasNO3.
Backgroundnitratelevelsaretypically4.4mg/L(1.0 mg/LnitrateasN)foraquifersingeneral(Dubrovsky etal.,2010)andfortheEdwardsAquiferinparticular (DepartmentoftheInterior,FishandWildlifeService, 2012).TheU.S.EnvironmentalProtectionAgency (EPA)setthemaximumcontaminantlevel(MCL)for nitrateinpublicwatersuppliesat40mg/L(10mg/L nitrateasN)forhumanconsumption(EPA,2017).Above theMCL,risksareprimarilytoinfants,whomaydevelop methemoglobinemia(bluebabysyndrome),whichcanbe fatal.Inaddition,forpregnantwomen,drinkingwater wherenitratelevelsareabovetheMCLhasbeenlinkedto lowbirthweights(Swistock,2022).Somefreshwater aquaticspecieshavenitratetoleranceslowerthanthe MCL.InTexas,theecologicalscreeningbenchmarkfor nitrateadoptedbytheTCEQforprotectingfreshwaterlife is13mg/L(TCEQ,2022b).Othershaveconcludedthata maximumnitratelevelfrom8mg/L(Monson,2022)to9 mg/L(Carmagoetal.,2005)wouldbeanappropriatelimit forprotectingsensitivefreshwaterspecies.
Bushetal.(2000)reviewedwater-qualitydatafor South-CentralTexasfortheperiodfrom1996to1998. AlthoughtheynotedthatnitratelevelsintheEdwards Aquiferwereelevatedrelativetothoseofmostother aquifers,includingtheunderlyingTrinityAquifer,they thoughtitwasrelativelyunaffectedbyhumanactivity. Regardingsurfacewater,theyfoundthatnitrateconcentrationswerehighestclosetowastewatertreatment plants,whicharemostlyovertheartesianzoneofthe EdwardsAquifer,wheretheaquiferisconfinedabove byimpermeablestrata(Figure3).Althoughthecontributingandrechargezoneshadbeguntoexperiencepopulationgrowth,theydescribedthoseareasasmostly rangelandanddidnotgointodetailaboutwhatmay havecausedtheaquifer ’selevatednitratelevel.
ReedyandScanlon(2017)reviewednitrateconcentrationsinallaquifersinTexaswithafocusonunderstandingnitratehotspotsexceedingtheMCL.Nitrate
sourceswereconsideredtobeeithernatural(atmosphericdeposition,nitrogen fixationbylegumes,nitrificationoforganicmaterial,andgeologicalsources)or anthropogenic(fertilizers,animalfeedingstations,septic tanks,andsewagesystems).Theyreviewedpublicwater supplysystems(PWSs)andwater-qualitysamplesfrom wells.FortheEdwardsandTrinityaquifers,nitratewas foundtobegenerallybelowtheMCL.However,regardingpercentagesofsamplesabovetheMCLfornitrate, theEdwardsTrinityAquiferwasamongthefourhighest aquiferstheyanalyzed,withthehighestvaluesfallingin thenorthernpartoftheaquifer.
Musgroveetal.(2016)evaluatednitratelevelsinthe BartonSpringsandSanAntoniosegmentsofthe EdwardsAquifer,whichareseparatedbyapotentiometricdivide.Theyusedsamplestakenin2011and2012 fromstreamsandfromwellsintheSanAntoniosegmentinBexarCountyandconsideredhistoricaldata fromComalSprings.ComalSpringsdataconsistedof sevensamplesfromthe1930sand1940s,onesamplein 1974,and27samplesfrom2000to2012.Althoughthey notedadoublingofnitratevaluesbetweenthe1940s and2000,thedatatotellwhetherthechangewasgradualorabruptwerelacking.TheauthorsstatedthatagriculturallandusesareminorincentralTexasand indicatedthatthesecouldnotaccountforelevated nitratelevelsintheEdwardsAquifer.Theyalsoindicatedthatstreamsamplescannotaccountforelevated nitratevaluesintheEdwardsAquifer.Instead,theypostulatedthaturbanizationsince2000overtherecharge zoneinnorthernSanAntoniocontributeshighlevelsof nitrogenspeciestotheaquiferandthatorganicnitrogen undergoesnitrificationintheaquifer.
SullivanandGao(2016)addressednitrateconcentrationsinsurfacewatersinthedrainagebasinsofCibolo CreekandDryComalCreek,whicharemostlyinBexar, Comal,andKendallcounties.Thestudyareaincludes bothportionsofthecontributingzone,wheretheGlen RoseFormationoftheTrinitygroupisatthesurface,and therechargezone,wheretheEdwardsgroupisatthesurface.ASoilandWaterAssessmentTool(SWAT)model wasdevelopedforsurfacewatersinthedrainagebasins. SullivanandGao(2016)considerednitrateinputsfrom agriculture,urbanization,wildlife,andatmosphericdeposition.Thestudyassumedthesamebackgroundnitrate concentrationforbothEdwardsandTrinityaquifersbased onamedianvalueof8.19mg/L(1.85mg/LnitrateasN) reportedfortheEdwardsAquiferbyMusgroveetal. (2010)for1996–2006.NitratemeasurementsintheGlen RoseportionoftheTrinityAquiferwerenotdirectlyconsidered.Fromthecalibratedmodel,theauthorsconcluded thatthetwomostimportantnitrateinputswerefrom atmosphericdepositionfollowedbylivestock.
Sullivanetal.(2019)useda finitedifferencegroundwatermodel(MODFLOW)toaddressnitrateconcentrationsintheEdwardsAquiferfor2001–2010.Forthe studyareaofSullivanandGao(2016),nitraterecharge valuesfortheEdwardsAquiferwerebasedonthe SWATmodelresults.Elsewhere,theyweresettoaveragevaluesfortheEdwardsAquifer.Crossflowfromthe TrinityAquiferwasmodeledas9.34mg/L(2.11mg/L nitrateasN)basedonanaveragevaluederivedfrom TWDBdata.Theauthorsdeemedthestudysuccessfulin predictingnitratelevelswithin1,000moftherecharge zone.
Quarrylocations(Figure1)werecompiledfromseveralsources(TCEQGISTeam,2020;TexasHearstData VisualizationTeam,2021).Inaddition,quarrieswere outlinedfromsatelliteview.Usingopen-sourcegeographicinformationsystemsoftware,anareawascomputedforeach.
WelldataintheGWDBincludeaquifercodesthat weremostlydeterminedbyTWDBgeologists(TWDB, n.d.c).Theaquifercodeswerethebasisforselecting datafromtheGWDB.Nitratemeasurements,forparametercode71851, “NitrateNitrogen,Dissolved,Calculated(mg/LasNO3),” wereobtainedfromtheGWDB fortheEdwardsAquifer.Inaddition,measurementsfor parametercode618, “NitrateNitrogen,Dissolved(mg/L asN),” wereconvertedtonitrateasNO3.Thesewere reviewedforgeographicvariationandhistoricalchanges. NitratemeasurementsfromtheTrinityandEdwardsTrinityaquiferswerealsoevaluatedtoassesstheirpotentialfor contributingnitratetotheEdwardsAquiferviacrossflow. Somewater-qualityanalysespriorto1940maynotbereliable(WelderandReeves,1964),soallaquifersmeasurementspriorto1940wereexcludedfromthisstudy.Also excludedweresamplemeasurementsdesignatedinthe TWDBdatabasewithareliabilitycodeof14, “reliability unknownornotrecorded.”
Water-qualityanalysesincludingmeasurementsofdissolvedorganicnitrogenwereobtainedfromtheGWDB. ForEdwardsAquifersamples,totalnitrogenwasdeterminedfromdissolvedorganicnitrogen,nitrate,nitrite, andammonia.SamplemeasurementsrecordedasmilligramsperliterasNwereconvertedtomilligramsperliter asNO3.Dissolvedoxygenmeasurementswereobtained fromtheGWDBasavailable.
Nitratemeasurementsforparametercode620, “Nitrate Nitrogen,Total(mg/LasN),” fromsurfacewater-quality datawereobtainedfromtheTCEQ(TCEQ,2022a,2024) andconvertedtonitrateasNO3.Forsurfacewater-quality datawithmeasurementsofdissolvedorganicnitrogen, totalnitrogenwascalculatedandconvertedtomilligrams
perliterasNO3.Dissolvedoxygenmeasurementswere obtainedfromtheTCEQdatabaseasavailable.
TheEdwardsAquiferAuthority(EAA)records water-qualitymeasurementsfromwellandsurface locations.Inresponsetoarequestforallnitratemeasurementscollected,theEAAprovideda fi leofmeasurementstakenfromDecember2004toJuly2023, whichincludedbothsurfaceandgroundwaterdata. SomeEAAdataareintheGWDB.TheEAAusesa uniquenomenclatureforsamplesitesthatisnotcrossreferencedtothestatewellnomenclature(EAAOpen RecordsCenter,2024,personalcommunication).Due tothedif fi cultyofdeterminingtheoverlapbetween EAAandGWDBsources,theEAAdatawereevaluatedseparately.
Agriculturalactivitiesassociatedwithfarmingand livestockmaybeasourceofnitratecontaminationof groundwater(ReedyandScanlon,2017).Croplandharvestedandcattle-and-calvesinventorytabulatedinagriculturalcensusessince1950werereviewedasindicators offarmingactivity(U.S.DepartmentofAgriculture, 2024).Agriculturalcensusdataarereportedbycounty. Tohelpdeterminewhetheragriculturalactivityhas playedasignificantroleinexplainingnitratelevelsin theEdwardsAquifer,distributionoffarmlandbasedon datafromtheMulti-ResolutionLandCharacteristicsConsortium(MRLC)wasexamined(MRLC,2019).Locationsofconcentratedanimal-feedingoperations(CAFOs) relativetotherechargezonewerealsodetermined(CarnegieCorporationandUniversityofIowa,2017).
Musgroveetal.(2016)concludedthaturbanization overtherechargezoneistheprimaryfactorbehindelevatednitratelevelsintheEdwardsAquifer.Aspartof assessingthat,populationchangebycountywasdeterminedbytheU.S.CensusBureau.Thatdata,together withlandusemaps,allowcomparisonofthelocation andtimingofpopulationchangetothelocationandtimingofrisingnitratevalues.
SpecificlimestoneaggregateproductiondataforindividualquarriesortheHillCountryasawholearenot available.Anexceptionisasinglementionofoneday’s useofexplosivesattheServtexPlantinGardenRidge, Texas(Chasnof,2021).FortheServtexexample,explosiveusageperunitvolumeminedwascalculatedfor comparisontotypicalindustryusage.
Toevaluatewhetherminingcontributessignificant amountsofnitratetotheEdwardsAquifer,industry informationontypicalexplosiveuseandunexploded residualsisappliedtoanexampleofaquarriedareaon therechargezone.Thecalculationisbasedontherock volumeremovedfroman8.09 3 105 m 2 (200acre)portionoftheCemexBalconesNewBraunfelsQuarryin ComalCounty.Thevolumeisderivedfromelevation contoursdigitizedfromgeoreferencedU.S.Geological

Figure4.ForpartoftheCemexquarry,contoursweredigitizedfrom USGStopographicmapsfortheNewBraunfels,WestTexas,quadranglefrom(A)1958and(B)2022.Contoursarelabeledinfeet abovemeansealevel.
Survey(USGS)topographicmapsoftheNewBraunfels, WestTexas,quadranglemadein1958(priortoquarrying)and2022(USGS,n.d.),asshowninFigure4.Digitalelevationmodels(DEMs)weremadefromboth topographicmapsandusedtocalculatethevolumeof rockremoved.
Atotalof80quarrieswereidentified.Ofthese,16are onthecontributingzone,andtheremaining64fallalong therechargeandtransitionzones(Figure1).Ofthe16 quarriesonthecontributingzone,10are4.05 3 104 m 2 (10.0acres)orless,andthelargestis4.38 3 105 m 2 (108 acres).Areameasurementsofcontributingzonequarries totaled1.74 3 106 m 2 (429acres).The64quarriesfalling alongtherechargezonerangedupwardto6.7 3 106 m 2 (1,730acres),andthemedianvaluewas2.28 3 105 m 2 (56.3acres).Areameasurementsofrechargezonequarriestotaled4.02 3 107 m 2 (9,920acres).
Historically,miningengineersuseda “powderfactor” toestimatetheamountofexplosiveperunitvolume. Thepowderfactorforamedium-hardrocktypewould be0.4–0.5kg/m3 (DynoNobel,2010).Forcomparison, theServtexPlantinasingledayused5,900kg(13,000 lbs)ofexplosivestoremove2 3 107 kg(20,000tons)of rock(Chasnof,2021).Ifthetypicalvalueofunexploded residual(28percent)isapplied,thatsuggeststhatfor oneday,1,700kg(3,640lbs)ofunexplodedANFO wouldbeavailabletoleachintotheaquifer.Material thatistoo fine-grainedtobecommercialmayconstitute 20–30percentofthevolumemined,asindicatedina WPAPfortheMartinMariettaMaterialsNewBraunfels Quarry(Forster,2010).If25percentofaminedvolume isleftbehind,theexplosiveusageattheServtexPlant translatestoapowderfactorof0.6–0.5kg/m3 foralimestoneporosityrangeof15–25percent(Table1).
Soilthicknessisnegligibleintheareaofthe8.09 3 105m2 (200acre)portionoftheCemexBalconesNew BraunfelsQuarry(Pelletieretal.,2016).Therockvolumeremoved,calculatedbysubtractingthe2022DEM fromthe1958DEM,is1.99 3 107 m 3 (7.03 3 108 ft3). Applyingapowderfactorof0.45kg/m3 andavalueof 28percentforunexplodedresidualwouldresultin2.5 3 106 kg(5.5 3 106 lbs)ofANFO,or2.4 3 106 kg(5.3 3 106 lbs)ofammoniumnitrate,leftbehind(Table2).Since nitratefromANFOcanbeintroduceddirectlytogroundwaterandammoniumissubjecttonitrification(Musgrove etal.,2016),thepotentialamountofnitrateafternitrificationtotals3.7 3 106 kg(8.2 3 106 lbs).
U.S.CensusBureaudatashowacontrastinpopulationgrowthbetweenBexarCounty,alongwithComal
Table1. Explosiveuse(powderfactor)estimatefortheServtexplantinGardenRidge,Texas. *
*BasedonChasnof(2021).
† Usinglimestonematrixdensity ¼ 2.710gm/cc(AsquithandGibson,1982).
‡ Using25percentvolumeofnon-commercial fines(Forster,2010).
Table2. Potentialnitrateresidualfromquarrying8.09 3 105 m 2 (200acres)inComalCounty.
† (kg)ResidualANFO‡ (kg)Ammoniumnitrate
*Basedon1958and2022USGStopographicmapsfortheNewBraunfels,WestTexas,quadrangle(USGS,n.d.).
† Using0.45kg/m3 (DynoNobel,2010).
‡ Using28percentnotconsumedinblasting(Alberts,2016).
§ Using94.5percentofANFObyweight(Brochu,2010).
andHayscounties,andMedinaandUvaldecountiesto thewest.BexarCounty’spopulationincreasedfrom 1,185,394in1990to2,009,322in2020,whichis20percentmorethanitsincreaseintheprevious40years.From 1990to2020,ComalCounty’spopulationincreasedfrom 51,832to161,482,whereastheHaysCountypopulation increasedfrom56,225to241,066.Forthesametime period,thepopulationinMedinaandUvaldecounties increasedfrom27,312to50,739and23,340to24,564, respectively.
TherechargezoneoccursinBexar,Comal,Hays, Medina,andUvaldecounties.SinceMedinaandUvalde countiesareupgradientinthe flowdirectionofthe EdwardsAquifercomparedtothemorepopulouscountiestotheeast(Figure5),nitratemeasurementsmade since1990fromwellsintheEdwardsandTrinityaquifers weredividedintoeastandwestareas(Figure6AandB).
Backgroundnitrateconcentrationsareexpectedtobe4.4 mg/Lorless(Dubrovskyetal.,2010),sonitratevalues wereplacedinseparatecategoriestoemphasizechanges inthelowend.Measurementsinthefourthcategory(5–8 mg/L)andaboveindicatenitrateconcentrationsabove background.Thethreehighestcategoriesmarktherange inwhichnitratevaluesareharmfultosomefreshwater aquaticanimals(8–13mg/L),inexcessoftheTCEQ benchmarkforfreshwaterorganisms(13–40mg/L),and ofconcernforhumanconsumption(.40mg/L).Nitrate measurementsfromtheEAAfortheperiodfromDecember2004toSeptember2023areshownforcomparison (Figure6CandD).
Exactdatesofoperationofthequarriesarenotavailable,sothemaximumnitratevaluerecordedforeach wellfrom1990tothepresentwasdetermined.Forthe Edwards,Trinity,andEdwardsTrinityaquifers,Figure7

Figure5.Generalized flowpatternwithintheEdwardsAquifer.ModifiedwithpermissionfromEAA(2019).

Figure6.For eachwell,nitratemeasurementssince1990aregroupedintooneofsevencategoriesforGWDBmeasurementsfortheEdwards andTrinityaquifers.Barchartsshowthepercentageofeachcategoryfor(A)theeasternareafortheEdwardsAquifer(1,289samplesfrom Bexar,Comal,Guadalupe,andHayscounties)andTrinityAquifer(742samplesfromBexar,Blanco,Comal,Kendall,andHayscounties)and (B)thewesternareafortheEdwardsAquifer(532samplesfromMedinaandUvaldecounties)andTrinityAquifer(318samplesfrom Bandera,Kerr,Medina,Real,andUvaldecounties).AlsoshownarethecategoriescorrespondingintheeasttotheEdwardsAquiferaverage (7.6mg/L)andmedian(7.6mg/L)andtheTrinityAquiferaverage(4.5mg/L)andmedian(1.0mg/L)andinthewesttotheEdwardsAquifer average(8.7mg/L)andmedian(8.0mg/L)andtheTrinityAquiferaverage(1.9mg/L)andmedian(0.13mg/L).Forcomparison,nitratedata since2004providedbytheEAAweregroupedintosevencategories.Thepercentageofeachcategoryisshownfor(C)theeasternareaand (D)thewesternarea.
displaysthecategoryofeachwell’smaximumvaluein mapview.
FortheEdwardsandTrinityaquifersonthecontributingzones,observationsinthetwocategoriesabove 13mg/Lnitratecompriseasmallpercentageofthe total(Figure6).Figure8showscategoriesinmap viewforwellswithmaximumnitratevaluesabove13 mg/L.Aclusterofwellsnorthofthecontributingzone neartheTrinityAquifer ’sborderwiththeEdwards TrinityAquifer(Figure1)havevaluesabove13mg/L (Figure8).
Forthetwoareas,Figure9illustrateschangesby decadeinnitrateconcentrationwithintheEdwards AquiferbyshowingthechangingpercentagesofthevariouscategoriesdefinedinFigure6.ThemedianmeasurednitratevaluefortheEdwardsAquiferisalso shownforeachdecade.
Nitratemeasurementsareavailableforstreamsamplesbeginningin1970(TCEQ,2022a,2024).Figure 10AandBcomparenitratemeasurementsfromsurface watersince1990toEdwardsAquifergroundwater samplessince1990separatelyforeastandwestareas. Inaddition,totalnitrogenfromstreamsamplesiscomparedtototalnitrogenfromgroundwatersamplesseparatelyforeastandwestareasforthesameperiodin Figure10CandD.
Agriculturalactivitiesassociatedwithfarmingand livestockmaybeasourceofnitratecontaminationof groundwater(ReedyandScanlon,2017).Croplandharvested,astabulatedinagriculturalcensusessince1950, isusedasanindicatoroffarmingactivity.Censusdata arereportedbycounty(Figure11).Locationofcropland andCAFOsrelativetotherechargezoneisimportant forunderstandingwhethertheyhaveplayedasignificant roleinexplainingnitrateelevationsintheEdwards Aquifer(Figure12).
FortheentireareaoftheEdwardsTrinityAquifer,6,473 nitratemeasurementsmadesince1940wereobtainedfrom theGWDB.Fromnitratemeasurementstakensince1990, themaximumvaluewasdeterminedforeachof1,117 wellsandassignedtooneofthesevencategories(Figure 13A).Forcountiesinorclosetothestudyarea,thepercentageofeachnitratecategorywasdeterminedfrom758 measurementsin420wells(Figure13B).Inaddition,the changeinmediannitratevalueswasdeterminedforeach decadeforthosecounties(Figure13C).
TheServtexPlant(Chasnof,2021)providedthelone examplefromthestudyareaofusageofANFOper

Figure7.CategorycorrespondingtothemaximumvalueofnitrateforeachwellintheGWDBdatasince1990fortheTrinity,Edwards,and EdwardsTrinityaquifersisshowninmapview.TheMCLfallsinthenitratecategory(.40mg/L),andthecategory(8–13mg/L)isthelevelat whichsomefreshwaterorganismsmaybeharmed.
minedrockvolumeandwasfoundtobeconsistentwith usagetypicalforindustry(Table1).
ApplyingtypicalindustryvaluesforANFOusageand unexplodedresidualofANFOtothevolumeofrock removedfromthe8.09 3 105 m 2 (200acre)portionof theCemexBalconesNewBraunfelsQuarry(Figure4; Table2)illustratesthelargevolumesofnitratethat quarryoperationsmaycontributetotheaquifer.Quarry areaisnotadirectindicatorofvolumemined,because volumeofaparticularminedependsontopographyand quarrybaseelevation,butthetotalareaminedalongthe rechargezoneis50timestheareaoftheCemexexample, whichcanbeusedtoillustratetheorderofmagnitudeof potentialnitratecontaminationfromquarryingovertime. Incontrast,the16smallcontributing-zonequarries,scatteredacrossalargerarea,wouldhavearelativelyminor impactonnitrateconcentrationingroundwater.
BMPsforquarriesfromtheTCEQstipulatethatkarst featuresdeemedlikelytobeconnectedtotheaquifer
andcapableofallowingrapidinflowofwaterbesealed orisolatedusingbuffersuntiltheycanbemined(Barrett andEck,2012).Examplescitedofsensitivekarstfeaturesincludesolution-enlargedfractures,caves,and sinkholes.Togetherwithrequiringaminimumelevation forthebaseofaquarryat7.6m(25ft)abovethewetweatherelevationoftheunderlyingaquifer,theBMPs areintendedtopreventpollutantsfromreachingtheaquifer.However,theyareunlikelytobesuccessful.Surface watercrossingtherechargezone flowsintotheEdwards Aquiferprimarilythroughkarstfeatures,manyofwhich arenotreadilyapparent(Schindel,2019).Johnsonetal. (2010)demonstratedthroughadyetracestudythatwater deliveredtoasurfacesitewithnorecognizablekarstfeaturescouldbedetectedinmonitoringwells.
Ifcorrectlyimplemented,stoppingaquarryingoperation7.6m(25ft)abovetheestimatedgroundwaterlevel mayshieldtheaquiferfromdirectlyintroducingpollutantstotheaquiferthroughfracturesinducedbyblasting.

Figure8.Wellsforwhichthemaximumvalueofnitrateconcentrationobservedsince1990areinthetoptwocategories(aboveTCEQ’secologicalscreeningbenchmarkof13mg/L)areshowninmapview.
However,fracturesinducedduringquarryingwould likelyenhancethepassageofpollutantstothenatural fracturesystemwithinthequarry.Inaddition,thequarryingoperationmayincreasethelikelihoodofnitrate reachingtheaquiferbyreducingthedistanceofthesurfacetotheunderlyingaquifer.
Aggregatewashingisaroutinepractice,andprocess waterisdirectedtosettlingpondswithinaquarry (TACA,2020).Pondsaremonitoredforatleast6 monthstoensuretherateofwaterlosstotheaquifer doesnotexceedanallowedamount(BarrettandEck, 2012).SincethehighlysolubleANFOresiduewould likelybedissolvedinthewashingprocess,anysuch waterlossisanothermeansfornitratetoreachthe underlyingaquifer.
Formostofthecontributingzone,theGlenRoseFormationoftheTrinitygroupisatthesurface(Figures1and2), andrechargeismostlyfrominfiltrationofprecipitation (Jones,2011).Streamscrossingthecontributingzonehave bothgainingandlosingreaches.Inparticular,wherethe
upperGlenRoseisatthesurface,streamlosstotheunderlyingaquifermayberapid(Greenetal.,2011).Using water-qualitymeasurementssubmittedsince1990tothe TWDB,Figure6comparesthelevelofnitrateforthe EdwardsandTrinityaquifers.TrinityAquifermeasurementsaredistinctlylowerthanthoseoftheEdwardsAquiferforboththeeasterncounties,whichhavehadrapid populationgrowthsince1990,andthoseinthewesternpart ofthestudyarea,whichhavenot.Thedatacollectedbythe EAAshowthesamecontrast.Wherecross-faultexchange betweentheTrinityandtheEdwardsaquifersisoccurring, itismostlikelywiththeGlenRoseFormation(Johnson etal.,2010;Schindel,2019).Measurementsfromthe GWDBfromwellsinbothareastakensince1990thatwere recordedasGlenRosehavelownitratevaluesrelativeto theEdwardsAquifer(Figure14).Themapviewofthe maximumrecordednitratevaluessince1990furtherillustratesthecontrastbetweentheTrinityandtheEdwards aquifers(Figure7).Together,Figures6,7,and14show thatcrossflowfromtheTrinityAquifertotheEdwards
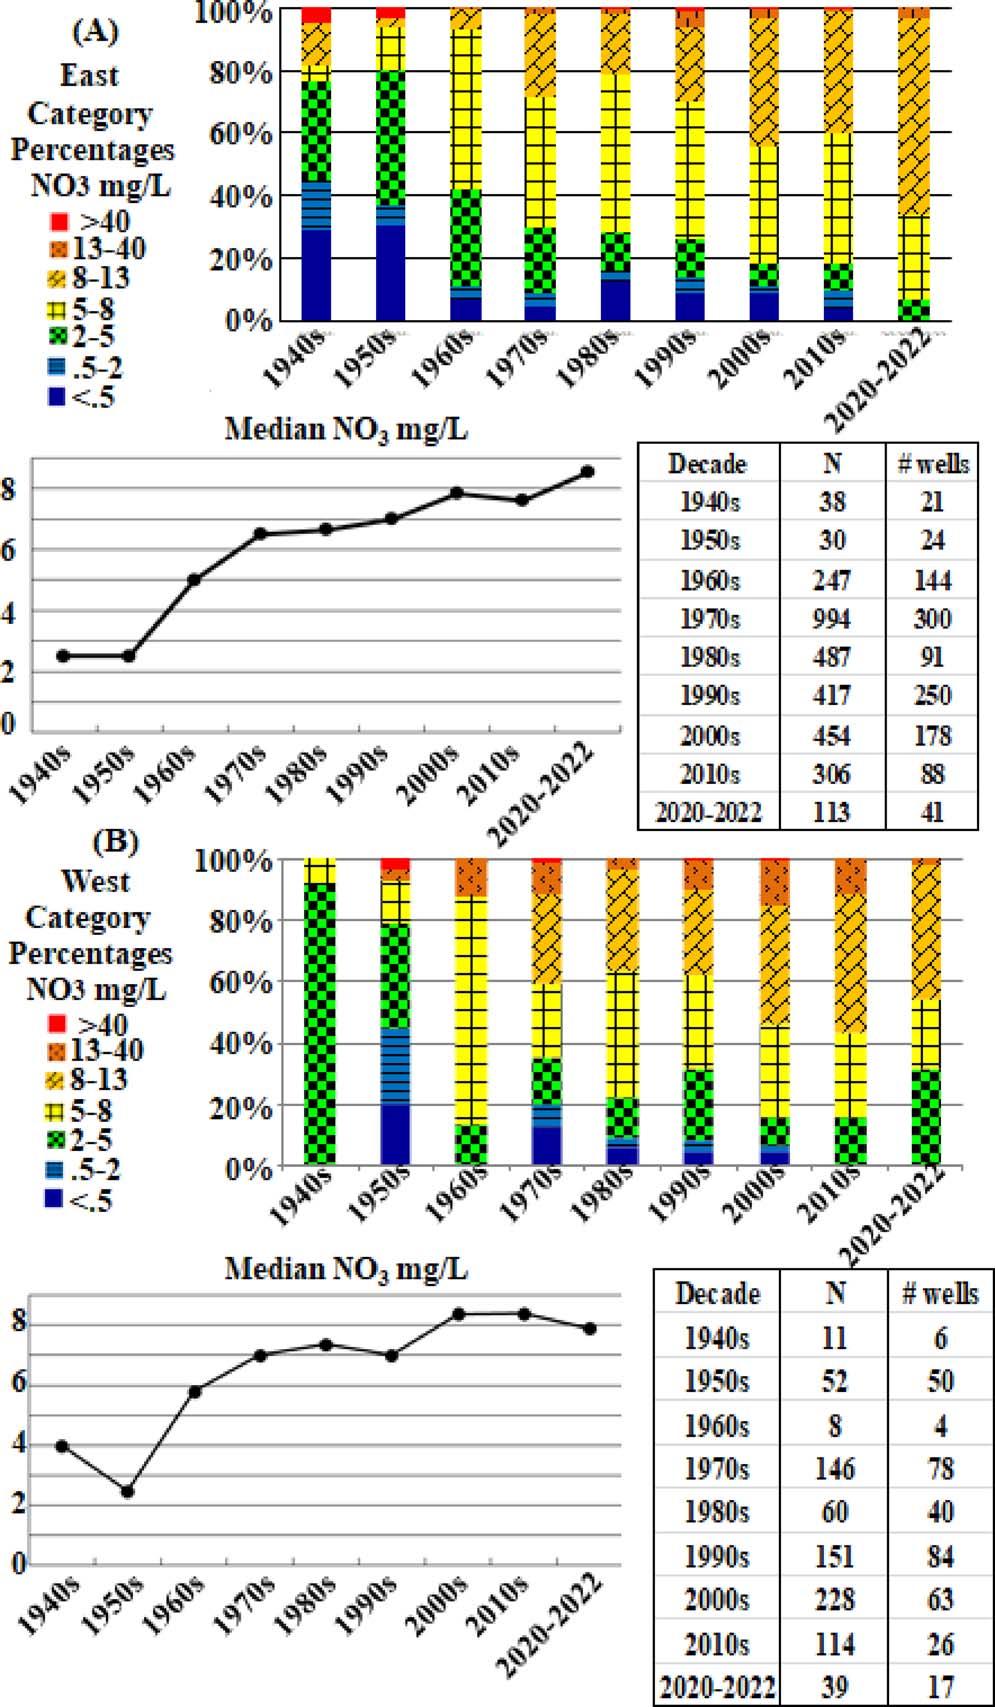
Figure9.FortheEdwardsAquifer,changesbydecadeinthemedian valueandrelativeproportionsofnitratecategoriesfor(A)theeastern area(Bexar,Comal,Guadalupe,andHayscounties)and(B)the westernarea(MedinaandUvaldecounties).
Aquifercannotaccountforthelevelofnitrateinthe EdwardsAquifer.
ThemapviewinFigure7isusefulprincipallyin illustratingtheoverallcontrastinnitratelevelsforthe twoaquifers.Sufficientinformationislackingtointerpretindividualmeasurements.Thatwouldrequire knowledgeofthenatureandtimingofapotentialsource ofnitratenearby,inadditiontothetimingofthewater sample.Basedonstudiesthatmeasurerapidchangesin aquiferparametersfollowingrechargeevents,maximum recordedvaluesinkarstaquifersareoftenwellbelow actualmaximumsduetothehighanisotropyofkarst aquifers.Thismakestheactualmaximumdifficultto recordevenbystandardperiodicmonitoring(George Veni,2022,personalcommunication).Evenmonthlyor
quarterlysamplingofmonitoringwellsisunlikelytoadequatelyrepresentthecontaminantcharge(Worthington, 2011).NitratevaluesinFigure7arenotfrommonitoring wellsbutinsteadareforallwellsintheTWDBdatabase. FortheEdwardsAquifer,46percenthaveonlyonemeasurementand71percenthavethreeorfewermeasurements.FortheTrinityAquifer,thosevaluesare59and91 percent,respectively.Only12EdwardsAquiferwellshad asmanyas20samples,andineachcase,thesamples weretakenonceayear.FortheTrinityAquifer,themost observationsinasinglewelltotaled12.
FortheEdwardsAquifer,observationsinthetwocategoriesabove13mg/Lnitratecompriseonlyasmall percentageofthetotal(Figure6BandD).Highvalues areclusterednearthequarries,andallbuttwoarewithin 10kmofaquarry(Figure8).Althoughindividualmeasurementsmaybehighorlowdependingonthetiming ofthepotentialsourceandsampleandtheposition,clusteringofhighvaluesreflectsproximitytosourcefor wellssituatedfavorablywithinthefracturesystem.
Nitratemeasurementstakenoverthecontributingand rechargezonesinstreamsarelowrelativetothe EdwardsAquifer(Figure10).BMPsforquarriesdictate thatbermsandothermeasuresbeusedtoisolatequarries frombothstormwaterinflowandwateroutflow(Barrett,2005),withtheresultthatquarriesarenotlikelyto directlycontributenitratetostreamsviarunoff.As showninFigure7,nowastewateroutfallsarelocated overtherechargezone,butsomearepresentonthecontributingzoneincludingthreethatareclassifiedasmajor (EPA,2023).Wastewateroutfallsandotheraspectsof increasingpopulationonthecontributingzonecausethe elevationofstreamnitratelevelsrelativetotheTrinity Aquifer(Figures6,10,and14)andlikelytheslightelevationofnitrateintheeastcomparedtothewestGlen Roseportionsoftheaquifer(Figure14).However, nitratelevelsinstreamsarelowerthanintheEdwards Aquifer,andcomparisonoftotal-nitrogenmeasurements betweenstreamsamplesandEdwardsAquifersamples showsasimilarpatterntonitrate.Evenifnitrificationof organicmaterialtakesplaceintheEdwardsAquifer,the total-nitrogenmeasurementsindicatethatsurfacewater crossingtherechargezonecannotaccountfornitrate levelsintheEdwardsAquifer,aspreviouslydetermined byMusgroveetal.(2016).
Assessingsourcesthatpotentiallydelivernitrateto theEdwardsAquiferrequirescomparisonforeachgeographicdistributionofthepotentialsourcetoelevated nitratemeasurementsintheaquiferanddetermination thatapotentialsourceisincreasingcoincidentwiththe timingofanyriseofnitrateconcentrationintheaquifer. Agriculturalactivitiesareananthropogenicsourcethat hasthepotentialtocontaminategroundwater(Reedy andScanlon,2017).Inthestudyarea,farmlandand

Figure10.Fortheentirestudyarea,nitratecategoriesweredeterminedforstreamsamplemeasurementssince1990.Comparisonsaremade between(A)1,289EdwardsAquiferwellsamplesintheeastareaand4,647streamsamplesintheGuadalupeandSanAntonioriverbasinsand (B)532EdwardsAquiferwellsamplesinthewestareaand196streamsamplesintheNuecesRiverbasin.Forwellandstreamsampleswithdissolvedorganicnitrogenmeasurements,nitrogenasNO3 wascalculatedandcategorized.Streamandwellsamplesarecomparedfor(C)285 EdwardsAquiferwellsamplesintheeastareaand4,647streamsamplesintheGuadalupeandSanAntonioriverbasinsand(D)128Edwards Aquiferwellsamplesinthewestareaand434NuecesRiverbasinstreamsamples.
CAFOsoverthecontributingandrechargezonesare limitedcomparedtotheartesianzoneoftheEdwards Aquifer,wheretheaquiferisshieldedabovebyimpermeableformations(Figure12).Withtheexceptionofan increaseinUvaldeCountybetween1969and1982,agriculturalactivityasmeasuredbytheamountofcropland harvestedwasrelativelyconstantordecliningforall countiesduringtheperiodwhennitratelevelswererisingintheEdwardsAquifer(Figures9and11).Forthe studyarea,thetotalsforcattleandcalveswerefairly constantfromthe1950to1992censusesbutdeclinedby 48percentfrom1992to2022.Together,Figures11and

Figure11.Censusdataoncroplandharvested,reportedbycounty,as ameasureofagriculturaltrends.
12confirmtheopinionsofpreviousauthorsthatagricultureisunlikelytobethecauseofrisingnitratelevels.
UsingtheSWATmodel,SullivanandGao(2016) concludedthatatmosphericdepositionofnitratewasthe mostimportantinputofnitratetowaterchargingthe EdwardsAquifer.OnemeasureofsuccessoftheSWAT modelwasthatthecalibratedshallowaquifernitrate concentrationwasconsistentwiththatreportedforthe EdwardsAquiferbyMusgroveetal.(2010).ThecontrastinobservedvaluesbetweentheEdwardsandthe Trinityaquifers(Figures6and7)wasnotaddressed. TheMODFLOWmodel(Sullivanetal.,2019)used averagenitrateconcentrationsfromTWDBdatafor areasbeyondtheSWATmodelstudyforboththe EdwardsandtheTrinityaquifers.Inparticular,nitratein thecrossflowfromtheTrinityAquiferwasmodeledas 9.34mg/L(2.11mg/LnitrateasN).Anaverageis stronglyinfluencedbyextremevaluesandisnotrepresentativeofnitrateintheTrinityAquifer(Figures6B and14).NeitherstudyaddressedelevationofbackgroundlevelsofnitrateintheEdwardsAquifercomparedtotherelativelyundisturbedlevelsmeasuredin the1940sand1950s(Figure9).
Bothregionaldistributionandtimingofatmospheric nitrogendepositionindicateitisnottheprincipalcause ofelevatednitratelevelsintheEdwardsAquifer.

Reactivenitrogenoxide(NOx)islargelyproducedby anthropogenicactivityandintheUnitedStateshas declinedsince1980.Thesharpestdeclinehasbeensince 1995asaresultofthe1990CleanAirActAmendments. Atmosphericammoniadepositionhasbeenessentially flatintheUnitedStatessince1990(NationalAtmosphericDepositionProgram,2016).Nationalmapsof atmosphericdepositionofammonium,nitrate,andtotal nitrogenfrom1986to2016shownoconsistenttrend (NationalAtmosphericDepositionProgram,2020)that couldberelatedtotheriseinnitratelevelsinthe EdwardsAquiferforthesameperiod(Figure9).The largestsourcesofNOx aremotorvehiclesandpower generation.Consequently,depositionofNO3 ishighest inurbanareas(NationalAtmosphericDepositionProgram,2016).Theeffectisillustratedforthisstudyarea byanitrate–Nmapfor2012,whichshowsa50percent declineinatmosphericnitratedepositionfromBexar CountytoUvaldeCounty(ReedyandScanlon,2017, theirFigure16).Consequently,atmosphericdeposition doesnotexplainthesimilarityofEdwardsAquifer nitratemeasurementsintheeastandwestpartsofthe studyarea(Figure6).
AsnotedbyReedyandScanlon(2017),theEdwards TrinityAquifer(Figure1)haselevatednitratelevels, whicharehighestinthenorthlargelyduetoagricultural activity.AssignmentofGWDBmeasurementstonitrate categoriesillustratethis(Figure13A)inshowinga north-to-southdeclineinmeasurednitrate.However, countiesimmediatelynorthofthestudyareahave
observednitratelevelssince1990thatarecomparableto thoseintheEdwardsAquifer(Figure13B).Thisraises thepossibilitythattheEdwardsTrinityAquiferiscontributingnitratetotheEdwardsAquifer.Acrossmostof thestudyarea,anynitratefromtheEdwardsTrinity AquiferwouldhavetoreachtheEdwardsAquifervia spring flowcontributionstocontributingzonestreamsor bycrossflowintotheTrinityAquifer.Neitherstream measurementsnorTrinityAquifermeasurementssupportasignificantnitratecontributioninthoseareas.In westernUvaldeCounty,samplesdesignatedasEdwards TrinityhaveelevatednitratelevelsclosetotheEdwards Aquiferwherecrossflowoccurs.However,oneindicationthatcross fl owfromthewestfromtheEdwards TrinityAquiferisnottheprimarysourceofnitratein theEdwardsAquiferisthatEdwardsAquifernitrate concentrationsarefairlyconstantacrossthestudyarea (Figures6and7).Awesternsourcewouldshowwestto-eastdilution.Inaddition,Lindgrenetal.(2004)concludedinfl owtotheEdwardsAquifer,includingboth thenorthernandthenorthwesternboundaries,wasonly 6.5percentoftotalrecharge.Furthermore,thetiming ofnitrateconcentrationsintheEdwardsTrinityAquifer differsfromthatoftheEdwardsAquiferinthatitrose fromthe1940sto1990sbutdeclinedafterward.
Musgroveetal.(2016)primarilyuseddatafrom BexarCounty,togetherwithdatafromComalSprings, toattributeelevatednitratelevelsintheSanAntonio segmentoftheEdwardsAquifertoanthropogenic sourcesinurbanizedareasoftherechargezone.Thetwo

Figure13.ForEdwardsTrinityAquifersamplesfromtheGWDB,thecategoriescorrespondingtonitratemeasurementsweredetermined.(A) Foreachwell,thecategorycorrespondingtothemaximumnitratemeasurementisdisplayedinmapview.(B)Thepercentageofcategoriesfor 420wellsincountiesinorclosetothestudyarea(Bandera.Blanco,Crockett,Edwards,Gillespie,Hays,Kerr,Kimble,Kinney,Real,Sutton,and ValVerde)wasdeterminedforsamplestakenstartingin1990.(C)Themedianvalueofnitratewasdeterminedbydecadeforwellsinthecounties inorclosetothestudyarea.
areasdistinguishedonthebasisofpopulationchange canbeusedtotestwhetherurbanizationissufficienton itsowntoexplainthenitrateobservations.Medinaand Uvaldecountieshaverelativelysmallpopulationsand lowpopulationgrowth.Developmentovertherecharge zonethereremainslow(Figure15).Withrespectto flow intheEdwardsAquifer,MedinaandUvaldecounties areupgradientoftheurbanizationassociatedwiththe increaseinpopulationofBexar,Comal,andHays countiessince1990(Figure5).Ratherthanlownitrate valuesintheEdwardsAquiferinMedinaandUvalde counties,nitratemeasurementsareelevated(Figures6 and7).
Opsahletal.(2018)evaluatedwaterqualityinthe EdwardsAquiferusingrainfalldata,surfacewatersamples,groundwaterdatafromsixwellsinBexarCounty, andasinglewellinMedinaCounty.Isotopicsamples
analyzedbyOpsahletal.(2018)andMusgroveetal. (2016)foundbothnaturalandanthropogenicsourcesfor nitrate,andbothstudiesindicatethathighervaluesof deltanitrogen-15ofnitrate(d15N-nitrate)markgreater inputofhumanorpetwaste.Thesamplesfromthe MedinaCountywellhadthelowestmeasured d15N-nitrate, whichtheauthorsconsideredtobenatural.However,the isotopicsignatureofsoilnitrogenandammoniumfrom ammoniumnitrateoverlap(Opsahletal.,2018).Bothstudiesconsideredlowerdissolvedoxygeningroundwaterversussurfacewatertobeanindicationofnitrificationtaking placeintheEdwardsAquifer,andMusgroveetal.(2016) interpreteditasevidenceofurbanizationontherecharge zone.TheGWDBhad68measurementsofdissolvedoxygenfrom1994to2022fromwellsinBexar,Comal,and Hayscounties,withamedianvalueof5.9mg/L.For 14,085streamsamplesfromtheGuadalupeandSan

Figure14.Nitratemeasurementssince 1990aregroupedintoone ofsevencategoriesforGWDBsamplesfromtheGlenRose FormationoftheTrinityAquifer.Barchartsshowthepercentage ofeachcategoryfortheeasternareafor401samplesandthewesternareafor198samples.Alsoshownarethecategoriescorrespondingintheeasttothesampleaverage(4.7mg/L)andmedian (1.3mg/L)andinthewesttothesampleaverage(2.4mg/L)and median(0.38mg/L).
Antonioriverbasinsoverthecontributingandrecharge zones,themedianvaluefordissolvedoxygenis8mg/L (TCEQ,2024).Thedropindissolvedoxygenfromsurface samplestogroundwatersamplesintheeasternareaisconsistentwiththepreviousstudies.However,themedian valuefor48wellsamplesfromtheEdwardsAquiferfrom 1996to2022inMedinaandUvaldecountiesis6mg/L, andfor808streamsamplesfromtheNuecesRiverbasin overthecontributingandrechargezones,themedianvalue fordissolvedoxygenis8.6mg/L.Combinedwithlower totalnitrogeninstreamthaningroundwatersamplesacross thestudyarea(Figure10CandD),theconsistentdropin dissolvedoxygenmaybeanindicatorofnitrificationof ammoniumfromANFO.
IfelevatednitratelevelsintheEdwardsAquiferare theresultofurbanizationovertherechargezone,one wouldexpectrisingnitratelevelstocoincideintime withincreaseddevelopmentofthatarea.Landusemaps confirmtheobservationbyBushetal.(2000)thatdevelopmentovertherechargeandtransitionzoneswas mostlyafter1992(Figure15).FortheSanAntoniosegmentoftheEdwardsAquifer,Musgroveetal.(2016) didnotusehistoricaldataofwater-qualitymeasurementsotherthanreportsfromComalSpringsfromthe 1930sand1940s.BasedonTWDBwelldata,median EdwardsAquifernitratelevelsinthe1940sand1950s werenearbackgroundlevels(Figure9).Bythe1960s, nitratelevelsweredistinctlyelevated.FortheSanAntoniosegmentoftheEdwardsAquifer,theplotsbydecade showthatelevationofnitratelevelsprecededintensive developmentovertherechargezone,soanadditional explanationisrequired.
Datesofoperationforallquarriesidenti fi edonFigure1arenotavailable.Quarriesareknowntohave beenpresentintheareafromthelatenineteenth
century,e.g.,Cameron(1994)andHaas(1995).A2010 WPAPapplication(Forster,2010)notedthattherehad beensignifi cantquarryoperationsontheEdwards rechargezoneformorethan80years.Therisein nitrateconcentrationintheEdwardsAquifer(Figure9) coincideswiththeentryofANFOonalargescalein thecommercialexplosivemarketinthemid-1950s,and ANFOdominatedthemarketbythe1960s(Moreira, 2012).
Elevatednitratevaluesarefoundwellintotheartesian zoneoftheEdwardsAquifer(Figure7).Long-distance transportfromsourcesalongtherechargezoneisconsistentwithnitratebeingnearlyinertingroundwater (StarksandChampion,2001).Tracertestsdocument thatsolutionfeaturesallowrapidpassageofwaterin karsticaquifers(Johnsonetal.,2010).InastudyofsamplesfromaPWSwell fieldinBexarCountylocated approximately10kmsoutheastoftherechargezone, Jaguckietal.(2011)showedthatwaterisrelatively young(,1–41years),andwellmixedoverthe150-m (500ft)producinginterval.Frommodeling,theyconcludedthatasaresultofrapidtransportofwaterthrough karstfeatures,morethan40percentofproducedwateris lessthan2yearsold.Contaminantsintroducedintothe rechargezonewouldbedetectableinthePWSwells withinayearandreach90percentoftheintroducedcontaminantlevelin10years.Reductionofacontaminant sourcewouldbedetectableinonetoseveralyears.Nitrate intheEdwardsAquiferhasshownatleasta60-yearrise inconcentration(Figure9),whichindicatesanincreasing amountofnitratecontaminationrelativetothepotential fordilutionbyrecharge.Jaguckietal.(2011)notesome variabilityintheproportionofoldwaterinregionalwells thattheyrelatetotraveltimesandthatwouldimplysaturationofanycontaminantswouldnotbeuniforminthe EdwardsAquifer.
Makinganorder-of-magnitudeestimateofresidual nitratethatmayhaveresultedfromminingallmapped quarriesrequiresestimatingtheacreageminedsince themid-1950sandusingthattoscaleupthepotential nitrateresidualfromquarrying8.09 3 105 m 2 (200 acres)inComalCounty(Table2).Ingeneral,limestone aggregateproductionroughlyincreaseswiththe increaseinTexas ’spopulation(KyleandElliot,2019). Theincreaseinpopulationfrom1955through2022is 88percentoftheincreasesince1930(Macrotrends, 2024).Thatpercentageleadstoanestimateofthe quarryareaminedsince1955of3.5 3 107 m 2 (8,700 acres)andanitrateresidualestimateof1.7 3 108 kg, oranaverageof2.4 3 10 6 kgannuallyover67years. MedianannualrechargetotheEdwardsAquiferisestimatedtobe6.8 3 10 8 m 3 from1934through2021 (EAA,2021).Relativetomedianannualrecharge,the

Figure15.Urbandevelopmentinthestudyareain(A)1992(Sohletal.,2018)and(B)2019(MRLC,2019).
averagepotentialannualnitratecontributiontothe aquiferisontheorderof3.6mg/L. FlowintheEdwardsAquiferisdominatedbyconduitswithcomparativelylittlecontributionfromthe largermatrixvolume(Hauwert,2011).Lindgrenetal.
(2004)citeanestimateofwater-filledporespaceforthe SanAntoniosegmentoftheEdwardsAquiferof2.13 3 1011 m 3 (1.73 3 107 acreft).Forkarsticaquiferslike theEdwardsAquifer,conduitvolumeasapercentageof totalporosityisestimatedtobeasmuchas1percent
(TaylorandGreene,2008).Relativetothatestimateof conduitvolume,thepotentialannualnitrateresidualis ontheorderof1.1mg/L.
Thetimingofnitrateincreaseintheeastandwest areas(Figure9)resultingfromtheintroductionof ANFOtoaggregateoperationswouldbeexpectedtobe similar.However,nitrateconcentrationsobservedinthe westarehigherthanmightbeexpectedcomparedto easterncountiesbasedonthenumberandsizeofquarries(Figures1and6),particularlyinUvaldeCounty. QuarriesinUvaldeCountyareclusteredinarelatively smallareaandareseparatedfromtheremainderofthe SanAntoniosegmentbya flowrestriction,theKnippa Gap(Figure1),whichwasoriginallydefinedfroma steepeningofpotentiometriccontoursintheeasternpart ofthatcounty(Lindgrenetal.,2004).Thoseauthors describethe flowpatternincentralUvaldeCountyas complexandpoorlydefined.Clarketal.(2013)determinedthattheKnippaGapreflectsachangeinorientationofrelayrampsfromsouthwestdippinginMedina CountytonortheastdippinginUvaldeCounty.The EdwardsAquiferlikelyhasadifferentdilutionhistoryin UvaldeCountycomparedtoareastotheeast,whichmay influencetheobservednitratelevels.Inaddition,theelevatednitratelevelsingroundwateroftheEdwardsTrinity PlateauAquiferinnorthwesternUvaldeCountymaycontributenitratetotheEdwardsAquiferbycrossflow.
FourSanAntonioWaterSystemwell fieldsproduce waterexclusivelyfromtheEdwardsAquifer:Castle Hills,Geronimo,MountainLaurel,andTexasResearch Park.Forthesewell fields,nitratemeasurementsmade in2022rangedfrom5.39to9.86mg/L(SAWS,2023). ThesevaluescorrespondtogroupsinFigures6and7, whichshowelevationofnitratelevels.ForwellwaterqualityanalysesfromtheTWDBdatabase,nitratevalues abovetheMCLremainrarefor2020through2022,but 74percentofTWDBnitratemeasurementswere8mg/L orgreater,whichisthecategoryharmfultosomefreshwateraquaticorganisms.
MeasurementsofnitrateintheEdwardsAquiferare elevatedrelativetowhatmightbeexpectedfromunpollutedsourcesandhaveclearlyincreasedovertimetoa pointwheretheypotentiallythreatenaquaticorganisms withintheEdwardsAquiferkarstenvironment.Neithersurfacewaterfromthecontributingzonenorcross-fault flow fromtheTrinityAquiferaccountforelevatednitratemeasurementsintheEdwardsAquifer.Inaddition,itisclear frombothgeographicandtemporalperspectivesthatneitherurbandevelopmentovertherechargezonenoratmosphericdepositionofnitrogenaccountfortheobserved nitratelevelsintheEdwardsAquifer.
UseofANFOinquarryingoperationshasnotbeen previouslypublishedasasourceofnitratepollutionin theEdwardsAquifer.ThehighsolubilityofANFO,the largevolumesofANFOusedinquarryoperations,and thehighpercentageofexplosiveresiduals,togetherwith thefactthatquarryoperationsareaknownsourceof nitratepollutionofgroundwaterelsewhere,makeitclear thataggregatequarriesarelargecontributorsofnitrate totheaquifer.Quarrydistributionalignswellwiththe geographicdistributionofelevatednitrateconcentrationsintheEdwardsAquifer.That,togetherwiththe coincidenceintimeofincreasingnitratelevelswiththe large-scaleintroductionofANFOtoaggregatemining, indicatesthatquarriesareasignificant,ifnotthemain, sourceofnitratepollutionintheaquiferandmakethe EdwardsAquiferausefulexampleoftheimpactof aggregateminingonkarsticaquifers.
GeorgeVeniprovidedextensiveinputtothecontent andorganizationofthispaper.DougWiermanandBrian Smithprovidedhelpfulreviews.
AgencyofNaturalResources,2014, BestManagementPracticesfor BlastingActivitiestoAvoidEnvironmentalContamination:State ofVermont,DepartmentofEnvironmentalConservation,Waste ManagementPreventionDivision,3p.
ALBERTS,N.,2016,Tacklingnitratecontaminationofwaterinmines: MiningNewsDigest,August11,Electronicdocument,available at https://www.mining.com/web/tackling-nitrate-contamination-ofwater-in-mines/
AmericanWaterworksAssociationandEconomicandEngineering Services,Inc.,2002, Nitrification:U.S.EnvironmentalProtection Agency,OfficeofGroundWaterandDrinkingWaterDistribution SystemIssuePaper,17p.
ASQUITH,G. AND GIBSON,C.,1982, BasicWellLogAnalysisforGeologists:AmericanAssociationofPetroleumGeologists,Tulsa,OK, 216p.
BARRETT,M.E.,2005, ComplyingwiththeEdwardsAquiferRules TechnicalGuidanceonBestManagementPractices:TexasCommissiononEnvironmentalQuality,415p.
BARRETT,M.E. AND ECK,B.J.,2012, BestManagementPracticesfor QuarryOperationsComplyingwiththeEdwardsAquiferRules: TexasCommissiononEnvironmentalQualityRG-350,26p.
BROCHU,S.,2010, AssessmentofANFOontheEnvironment,TechnicalInvestigation09-01:DRDCValcartierTM2009-195;Defence R&DCanada,Valcartier,Canada,38p.
BUSH,P.W.;ARDIS,A.F.;FAHLQUIST,L.;GING,P.B.;HORNIG,C.E.; AND LANNING-RUSH,J.,2000, WaterQualityinSouth-Central Texas,1996–98:U.S.GeologicalSurveyCircular1212,34p.
CAMERON,M.B.,1994, Beckman,TX:HandbookofTexasOnline:Electronicdocument,availableat https://www.tshaonline.org/handbook/ entries/beckman-tx
C ARMAGO ,J.;A LONSO ,A.; AND S ALAMANCA ,A.,2005,Nitratetoxicitytoaquaticanimals:Areviewwithnewdataforfreshwater invertebrates: Chemosphere ,Vol.58,pp.1255 –1267. https:// doi.org/10.1016/j.chemosphere.2004.10.044
CarnegieCorporationandUniversityofIowa,2017, CAFOsinthe US:Electronicdocument,availableat https://cafomaps.org/bystate/tx.html
CHASNOF,B.,2021,FromGardenRidgetoNewBraunfels, “Quarry Row” hasresidentsdemandingstricterregulation: SanAntonio ExpressNews,October6,Electronicdocument,availableat https:// www.expressnews.com/news/investigations/article/quarry-row-rockmining-16510615.php
CLARK,A.K.;PEDRAZA,D.E.; AND MORRIS,R.R.,2013, Geologic framework,structure,andhydrogeologiccharacteristicsofthe KnippaGapareaineasternUvaldeandwesternMedinaCounties, Texas:U.S.GeologicalSurveyScientificInvestigationsReport 2013-5149,35p.
DepartmentoftheInterior,FishandWildlifeService,2012, EndangeredandThreatenedWildlifeandPlants;Endangered StatusforFourCentralTexasSalamandersandDesignationof CriticalHabitat:NationalArchivesandRecordsAdministration FederalRegister,Vol.77,No.163,August22,PartII,88p. DUBROVSKY,N.M.;BUROW,K.R.;CLARK,G.M.;GRONBERG,J.M.; HAMILTON,P.A.;HITT,K.J.;MUELLER,D.K.;MUNN,M.D.; NOLAN,B.T.;PUCKETT,L.J.;RUPERT,M.G.;SHORT,T.M.;SPAHR, N.E.;SPRAGUE,L.A.; AND WILBER,W.G.,2010, TheQualityof OurNation’sWater NutrientsintheNation’sStreamsand Groundwater,1992–2004:U.S.DepartmentoftheInterior,U.S. GeologicalSurveyCircular1350,174p. DynoNobel,2010, BlastingandExplosivesQuickReferenceGuide: DynoNobelAsiaPacificPtyLimited,32p.,Electronic document,availableat https://www.lrl.mn.gov/docs/2015/other/ 150681/PFEISref_1/Dyno%20Nobel%202010.pdf
EAA(EdwardsAquiferAuthority),2014, Shapefiles,availableat https://www.edwardsaquifer.org/science-maps/maps/shapefiles/ EAA,2019, GeneralAquiferFlowpath :Electronicdocument, availableat https://www.edwardsaquifer.org/wp-content/uploads/ 2019/04/generalaquiferflowpath.pdf
EAA,2020, WhatIstheAquifer:Electronicdocument,availableat https://www.edwardsaquifer.org/wp-content/uploads/2020/07/Whatis-the-Aquifer.pdf
EAA,2021, 2021GroundwaterRecharge:Electronicdocument, availableat https://www.edwardsaquifer.org/science-maps/researchscientific-reports/hydrologic-data-reports/ EAAOpenRecordsCenter,2024,personalcommunication,EAA, 900E.Quincy,SanAntonio,TX78215.
EPA(U.S.EnvironmentalProtectionAgency),2017, GroundWater andDrinkingWaterNationalPrimaryDrinkingWaterRegulations: Electronicdocument,availableat https://www.epa.gov/ground-waterand-drinking-water/national-primary-drinking-water-regulations EPA,2023, StatusofNutrientRequirementsforNPDES-Permitted Facilities:NationalPollutantDischargeEliminationSystem(NPDES): Electronicdocument,availableat https://www.epa.gov/npdes/statusnutrient-requirements-npdes-permitted-facilities FORSTER,C.P.,2010, RechargeandTransitionZoneExceptionRequest Form,MartinMariettaNewBraunfelsQuarryOperationsModification:Electronicdocument,availableat. https://www.cceo.org/ environmental/documents/WPAP/Martin_Marietta_Materials_New_ Braunfels_Quarry.pdf
GolderAssociates,2014, Amulsargoldproject:Estimateofnitrateand ammoniaconcentrationsinminewaterasaproductofblasting, technicalmemorandum:Electronicdocument,availableat https:// www.lydianarmenia.am/resources/mainFiles/pdf/2864656c847d598 7d1653486d6fdd291.pdf
GREEN,R.T.;BERTETTI,F.P.; AND CANDELARIO,M.O.,2011,Edwards Aquifer UpperGlenRoseaquiferhydraulicinteraction.InGary, M.O.;Gary,R.H.;andHunt,B.B.(Editors),Interconnectionof theTrinity(GlenRose)andEdwardsAquifersalongtheBalcones FaultZoneandRelatedTopics:ProceedingsoftheKarst
ConservationInitiativeMeeting:Austin,TX,pp.30–35,available at https://www.edwardsaquifer.org/wp-content/uploads/2021/ 04/2011-Interconnection-of-the-Trinity-Glen-Rose-and-EdwardsAquifers-along-the-Balcones-Fault-Zone-and-Related-Topics-KarstConservation-Initiative.pdf
HAAS,O.,1995, Ogden,TX(ComalCounty):HandbookofTexas Online, Electronicdocument,availableat https://tshaonline.org/ handbook/entries/ogden-tx-comal-county
HAUWERT,N.M.,2011,CouldmuchofEdwardsAquifer “matrixstorage” actuallybeTrinityAquifercontributionsfromtheBlanco River?InGary,M.O.;Gary,R.H.;andHunt,B.B.(Editors), InterconnectionoftheTrinity(GlenRose)andEdwardsAquifers alongtheBalconesFaultZoneandRelatedTopics:Proceedingsof theKarstConservationInitiativeMeeting:Austin,TX,pp.15–24, availableat https://www.edwardsaquifer.org/wp-content/uploads/ 2021/04/2011-Interconnection-of-the-Trinity-Glen-Rose-andEdwards-Aquifers-along-the-Balcones-Fault-Zone-and-Related-TopicsKarst-Conservation-Initiative.pdf
JAGUCKI,M.L.;MUSGROVE,M.;LINDGREN,R.J.;FAHLQUIST,L.; AND EBERTS,S.M.,2011, AssessingtheVulnerabilityofPublic-Supply WellstoContamination:EdwardsAquiferNearSanAntonio,Texas: U.S.DepartmentoftheInterior,U.S.GeologicalSurveyFactSheet 2011-3142,6p. https://doi.org/10.3133/fs20113142
JOHNSON,S.;SCHINDEL,G.; AND VENI,G.,2010, TracingGroundwater FlowpathsintheEdwardsRechargeZone,PantherSpringsCreek Basin,NorthernBexarCounty,Texas:EdwardsAquiferAuthority ReportNo.10-01,112p.
JONES,I.C.,2011,InteractionbetweentheHillCountryportionofthe TrinityandEdwardsAquifers:Modelresults.InGary,M.O.; Gary,R.H.;andHunt,B.B.(Editors), InterconnectionoftheTrinity (GlenRose)andEdwardsAquifersalongtheBalconesFaultZoneand RelatedTopics:ProceedingsoftheKarstConservationInitiativeMeeting:Austin,TX,pp.36–37,availableat https://www.edwardsaquifer. org/wp-content/uploads/2021/04/2011-Interconnection-of-the-TrinityGlen-Rose-and-Edwards-Aquifers-along-the-Balcones-Fault-Zone-andRelated-Topics-Karst-Conservation-Initiative.pdf
KERNAN,B.,2010, RockBlastingandWaterQualityMeasuresThat CanBeTakenToProtectWaterQualityandMitigateImpacts: DESDrinkingWaterSourceProtectionProgram,NewHampshire DepartmentofEnvironmentalServices,3p.
K ONYA ,A. AND K ONYA ,C.,2019,Blastingmechanicsrevisited: Characteristicsofexplosives:PitandQuarry,March20,Electronicdocument,availableat https://www.pitandquarry.com/ blasting-mechanics-revisited-characteristics-of-explosives/ KYLE,J.R. AND ELLIOTT,B.,2019,Past,present,andfutureofTexas industrialminerals: Mining,Metallurgy&Exploration,Vol.36, pp.475–486. https://doi.org/10.1007/s42461-019-0050-1
LINDGREN,R.J.;DUTTON,A.R.;HOVORKA,S.D.;WORTHINGTON, S.R.H.; AND PAINTER ,S.,2004, ConceptualizationandsimulationoftheEdwardsAquifer,SanAntonioRegion,Texas:U.S. DepartmentoftheInterior,U.S.GeologicalSurveyScientific InvestigationsReport2004-5277,143p. https://doi.org/10.3133/ sir20045277
Macrotrends,2024, Texaspopulation1900–2023:Electronicdocument, availableat https://www.macrotrends.net/global-metrics/states/texas/ population MONSON,P.,2022, AquaticLifeWaterQualityStandardsDraftTechnicalSupportDocumentforNitrate:MinnesotaPollutionControl Agency,21p.,Electronicdocument,availableat https://www.pca. state.mn.us/sites/default/files/wq-s6-13.pdf
MOREIRA,G.,2012,Historyofexplosivesandinitiationdevices: Sand &Stone:Of fi cialPublicationoftheCMPA ,Electronicdocument,availableat https://sandandstone.cmpavic.asn.au/history-ofexplosives-and-initiation-devices/
MRLC(Multi-ResolutionLandCharacteristicsConsortium),2019, DataServicesPage:Electronicdocument,availableat https:// www.mrlc.gov/data-services-page
MUSGROVE,M.;FAHLQUIST,L.;HOUSTON,N.A.;LINDGREN,R.J.; AND GING,P.B.,2010, GeochemicalevolutionprocessesandwaterqualityobservationsbasedonresultsoftheNationalWater-Quality AssessmentProgramintheSanAntoniosegmentoftheEdwards aquifer,1996–2006:U.S.GeologicalSurveyScientificInvestigationsReport2010-5129,93p.
MUSGROVE,M.;OPSAHL,S.P.;MAHLER,B.J.;HERRINGTON,C.;SAMPLE, T.L.; AND BANTA,J.R.,2016,Source,variability,andtransformationofnitrateinaregionalkarstaquifer:Edwardsaquifer,central Texas: ScienceTotalEnvironment,Vol.568,pp.457–469. http:// dx.doi.org/10.1016/j.scitotenv.2016.05.201
NationalAtmosphericDepositionProgram,2016, NitrogenFromthe Atmosphere:Electronicdocument,availableat https://nadp.slh. wisc.edu/wp-content/uploads/2021/05/nitrogenAtmos.pdf
NationalAtmosphericDepositionProgram,2020, AnimatedMaps: Electronicdocument,availableat https://nadp.slh.wisc.edu/mapsdata/animated-maps/
NationalMineralsInformationCenter,2021, USGSAggregates TimeSeriesDatabyState,Type,andEndUse:Electronic document,availableat https://www.usgs.gov/media/files/usgsaggregates-time-series-data-state-type-and-end-use OPSAHL,S.P.;MUSGROVE,M.;MAHLER,B.J.; AND LAMBERT,R.B.,2018, Water-qualityObservationsoftheSanAntonioSegmentofthe EdwardsAquifer,Texas,withanEmphasisonProcessesInfluencing NutrientandPesticideGeochemistryandFactorsAffectingAquifer Vulnerability,2010–16:U.S.GeologicalSurveyScientificInvestigationsReport2018-5060,67p. https://doi.org/10.3133/sir20185060 PELLETIER,J.D.;BROXTON,P.D.;HAZENBERG,P.;ZENG,X.;TROCH, P.A.;NIU,G.;WILLIAMS,Z.C.;BRUNKE,M.A. AND GOCHIS,D., 2016, Global1-kmGriddedThicknessofSoil,Regolith,andSedimentaryDepositLayers:OakRidgeNationalLaboratory,DistributedActiveArchiveCenterforBiogeochemicalDynamics,Oak Ridge,TN. https://doi.org/10.3334/ORNLDAAC/1304
REEDY,R.C. AND SCANLON,B.R.,2017, EvaluationofGroundwater NitrateContaminationinPublicWaterSystemsandMajorand MinorAquifersinTexas:FinalContractReportpreparedforTexas CommissiononEnvironmentalQuality,64p.
SAWS(SanAntonioWaterSystem),2023, WaterQuality2023 Report:Electronicdocument,availableat https://www.saws.org/ your-water/water-quality/water-quality-report/
SCHINDE,G.M.,2019,GenesisoftheEdwards(BalconesFaultZone) Aquifer.InSharp,J.M.,JR.,Green,R.T.andSchindel,G.M. (Editors), TheEdwardsAquifer:ThePast,Present,andFutureof aVitalWaterResource:GeologicalSocietyofAmericaMemoir 215,pp.9–18. https://doi.org/10.1130/2019.1215(02)
SHARP,J.M. AND GREEN,R.T.,2022, TheEdwardsAquifer:The GroundwaterProject,Guelph,Ontario,Canada,Electronicdocument,availableat https://doi.org/10.21083/978-1-77470-029-7
SOHL,T.L.;SAYLER,K.L.;BOUCHARD,M.A.;REKER,R.R.;FREISZ, A.M.;BENNETT,S.L.;SLEETER,B.M.;SLEETER,R.R.;WILSON,T.; SOULARD,C.;KNUPPE,M.; AND VAN HOFWEGEN,T.,2018, ConterminousUnitedStatesLandCoverProjections 1992to2100:U.S. GeologicalSurveydatarelease, https://doi.org/10.5066/P95AK9HP
STARKS,R. AND CHAMPION,K.M.,2001, Thehydrologyandwater qualityofselectspringsintheSouthwestFloridaWaterManagementDistrict:Electronicdocument,availableat https:// digitalcommons.usf.edu/kip_data/90
SULLIVAN,T.P. AND GAO,Y,2016,Assessmentofnitrogeninputsand yieldsintheCiboloandDryComalCreekwatershedsusingthe SWATmodel,Texas,USA1996–2010: EnvironmentalEarthSciences,Vol.75,No.9,20p. https://doi.org/10.1007/s12665-016-5546-0
SULLIVAN,T.P.;GAO,Y.; AND REIMANN,T.,2019,Nitratetransportina karstaquifer:Numericalmodeldevelopmentandsourceevaluation: JournalofHydrology,Vol.573,June,pp.432–448. https:// doi.org/10.1016/j.jhydrol.2019.03.078
SWISTOCK,B.,2022, NitratesinDrinkingWater:Electronicdocument, availableat https://extension.psu.edu/nitrates-in-drinking-water TACA(TexasAggregatesandConcreteAssociation),2020, Howdo Texasquarryoperatorsmanagepreciouswaterresourcesasthey deliverthematerialsTexasneedstogrowandthrive?TACA, January,2p.,Electronicdocument,availableat https://www.txtaca.org/water-management
TAYLOR,C.J. AND GREENE,E.A.,2008,Hydrogeologiccharacterizationandmethodsusedintheinvestigationofkarsthydrology:In Rosenberry,D.O.andLaBaugh,J.W.(Editors), FieldTechniques forEstimatingWaterFluxesbetweenSurfaceWaterandGround Water:U.S.GeologicalSurveyTechniquesandMethods4-D2,pp. 71–114, https://pubs.usgs.gov/tm/04d02/
TCEQ(TexasCommissiononEnvironmentalQuality),2019, Edwards Aquifer,availableat https://gis-tceq.opendata.arcgis.com/maps/TCEQ:: edwards-aquifer/about
TCEQ,2022a, SurfaceWaterQualityViewer,availableat https:// www.tceq.texas.gov/gis/segments-viewer
TCEQ,2022b, TCEQEcologicalScreeningBenchmarks.xlsx:Electronic document,availableat https://www.tceq.texas.gov/remediation/eco TCEQ,2024, TheTexasCleanRiversProgram:Electronicdocument, availableat https://www80.tceq.texas.gov/SwqmisWeb/public/crpweb. faces
TCEQGISTeam,2020, EdwardsAquiferLandUse/Cover:Electronic document,availableat https://gis-tceq.opendata.arcgis.com/datasets/ TCEQ::edwards-aquifer-land-use-land-cover/explore?location ¼ 29.593896%2C-98.544918%2C13.88&showTable ¼true TexasHearstDataVisualizationTeam,2021,DoYouLiveNeara Quarry?SanAntonioExpressNews,October6,Electronicdocument, availableat https://www.expressnews.com/projects/2021/texas-quarrymap/
TWDB(TexasWaterDevelopmentBoard),n.d.a, GISData:Electronic document,availableat https://www.twdb.texas.gov/mapping/gisdata. asp
TWDB,n.d.b, GroundwaterDatabase(GWDB)Reportsand Downloads :Electronicdocument,availableat https://www. twdb.texas.gov/groundwater/data/gwdbrpt.asp
TWDB,n.d.c, ExplanationoftheGroundwaterDatabase(GWDB): Electronicdocument,availableat https://www.twdb.texas.gov/ groundwater/faq/faqgwdb.asp
U.S.DepartmentofAgriculture,2024, CensusofAgriculture:Electronic document,availableat https://www.nass.usda.gov/AgCensus/
USGS(U.S.GeologicalSurvey),2022, TexasGeologicMapData: Electronicdocument,availableat https://mrdata.usgs.gov/geology/ state/state.php?state¼TX
USGS,n.d., TNMDownload(v2.0) :Electronicdocument, availableat https://apps.nationalmap.gov/downloader/#/? z ¼4&y ¼37.99999999999999&x ¼-95&basemap ¼usgs_topo& datasets ¼&layerIds ¼
VENI,G.,2022,personalcommunication,GeorgeVeniandAssociates, 507E.ChapmanRoad,Carlsbad,NM88220.
WELDER,F.A. AND REEVES,R.D.,1964, GeologyandGround-Water ResourcesofUvaldeCounty, Texas:GeologicalSurveyWaterSupplyPaper1584,49p. https://doi.org/10.3133/wsp1584
WORTHINGTON,S.R.H.,2011,Managementofcarbonateaquifers.In vanBeynen,P.(Editor), KarstManagement:Springer,Dordrecht, Netherlands.233–261. https://doi.org/10.1007/978-94-007-12072_11

MIHIRALAKRUWAN*,AKIYOSHIKAMURA, AND MOTOKIKAZAMA
DepartmentofCivilandEnvironmentalEngineering,TohokuUniversity,6-6-06, AobaAramaki,Aoba-ku,Sendai,Miyagi,Japan980-8579
KeyTerms: SlopeStabilization,Landslides,Drainage, HorizontalDrains,WaterTableProfile,PoreWater Pressure,SlipSurface
Horizontaldrains(HDs)arecommonlyimplemented inslopestabilizationtoreducetheporewaterpressure (PWP);however,theyalsocausecomplexthree-dimensional(3D)variationsinthegroundwatertable(GWT), whichrequireintricate3D flowmodels.Toaddressthis challenge,weproposeanovelsemi-empiricalmethod basedonaseriesofnumericalsimulationsvalidated throughnumericaland fieldstudiestodeterminethe GWTofaslopewithHDs.Subsequently,theproposed methodwasextendedtocalculatetheaveragePWP(U) actingonapredefinedslipsurfacevialinearintegration. Thedecreaseof U (DU)resultingfromHDscanbeused toevaluatetheperformanceofHDs.Tocreatedesign chartsthatconsidertheimpactoflengthandspacingof HDson DU foraspecificslope,wedevelopedaPythonbasedcomputerprogram.Twocasestudieswereconducted,whichshowedthat DU increaseswithlonger HDsandshorterspacing.Theresultsalsoindicated thatextendingtheHDsbeyondaparticularlengthdoes notsignificantlyaffect DU;itishighlysensitivetothe spacinginshortHDsandnotsensitiveinlongHDs. Furthermore,wefoundthatthetotallengthofHDs requiredtoachieveatarget DU islessinwidespacings thaninshortspacings.Inconclusion,longHDswith widespacingsaremoreeffectiveandeconomical.Owing totheuniquenatureofeachslopestabilityproblem,this studyoffersapracticaltoolforanalyzingtheeffectivenessofHDsinsteadofprovidingageneralguide.
DesignofHorizontalDrainsinLandslideMitigation Projects
Horizontaldrains(HDs)wereinitiallyintroducedfor groundwatermanagementinagriculturalland(Stuytetal.,
*Correspondingauthoremail: samarasekara.okandapala.arachchige.don. m.b8@tohoku.ac.jp

2005).Today,theyarewidelyusedasaneffectivetechniquefordrainagemanagementinavarietyofgeotechnicalapplications,includingslopeandembankmentstability improvement(Nonveiller,1981;LauandKenney,1984; Martinetal.,1995;Caietal.,1998;Forrester,2001; Rahardjoetal.,2003,2011;Tsaoetal.,2005;Ghiassian andGhareh,2008;Shresthaetal.,2008;andHindsetal., 2021),drainagemanagementbehindsoilnailingand retainingwalls(ChenandChen,2013;GeotechnicalEngineeringOffice,2017;LakruwanandKulathilaka,2020, 2021),enhancementoftheliquefactionresistanceofsoil (Fasanoetal.,2019,2021),andaccelerationofconsolidation(Fengetal.,2020).Thisstudyfocusedonevaluating theeffectivenessofHDsinenhancingslopestability.
TheeffectivenessofHDsinenhancingslopestabilityis primarilybasedonseveraldesignparameterssuchaslocation,spacing,length,anddraintype(Rahardjoetal.,2011; Lakruwanetal.,2021;andAbedetal.,2024).Rahardjo etal.(2003)showedthatinstallationofHDsatthebottom ofaslopewasmoreeffectivethaninstallationofHDsat higherelevations,thusconfirmingtheresultsofLauand Kenney(1984)andMartinetal.(1995).Additionally,some studieshavetriedtoidentifyamaximumlimitforthe lengthofHDs(Royster,1980;LauandKenney,1984;Cai etal.,1998;andCooketal.,2008),andseveralattempts havebeenmadetodevelopdesigncharts(Kennyetal., 1977;Stanic,1984),buttheyaregenerallyonlyvalidfor thespecificslopeconditions(ResnickandZnidarcic,1990). Additionally,thegeneralguidelinesprovidedbyCooketal. (2012)forHDspacingbasedonthesoiltypevarysignificantlydependingonthesoilandrechargeconditions.
PreviousstudieshaveproventhatthedesignofHDsis highlysite-specificandthatprovidinggeneralizedguides isnotfeasible.Hence,insteadofageneralizedguide,a novelmethodthatisapplicabletoawiderangeofslope conditionsisproposedinthisstudytouniquelyanalyze theeffectsofthelengthandspacingofHDsonthepore waterforcereductiononaslipsurfaceand,subsequently, thestabilityenhancementofaslope.
GroundwaterTableProfilebetweenParallelandLong HDs
Amongtheseveraltheoreticalmethodsdevelopedto obtainthegroundwatertable(GWT)profilebetween
Lakruwan,Kamura,andKazama
HDsinagriculturallands(Hooghoudt,1940;Ernst,1954; andKirkham,1958),theHooghoudt(1940)equation, whichisbasedonDarcy’slawandtheDupuit-Forchheimer theoryofhorizontal flow,iswidelyused.Luthin(1966)presentedtheworkofHooghoudt(1940),whichwasoriginally presentedintheNetherlands,as:
Theaccumulationofporewaterpressure(PWP)on theslipsurfacecanbeidentifiedasthemajortriggering factorforrain-inducedslopefailures.Severalstudies haveevaluatedslopestabilitybasedontheporewater forceontheslipsurface( U)(Tsaoetal.,2005;Conte andTroncone,2012,2018).
ProcedureforHDs
Here, hm denotesthemaximumGWTheightatthe mid-pointbetweentheparallelandinfinitelylongHDs (m), S representsthedrainspacing(m), R corresponds totheconstantorsteady-staterechargefromtheground surface(orinfiltration)(m/s), ks denotesthesaturated hydraulicconductivityofthesoil(m/s),and de reflects theequivalentdepthtotheimpermeablelayer(m), whichaccountsfortheradial flowinthevicinityofthe pipethatdoesnotsatisfytheDupuit-Forchheimer assumption.Gregetal.(2013)presentedthefollowing relationshipsfordetermining de:
Currentlyavailableanalyticalandempiricalmethods donotadequatelyaddresstheeffectof3Dvariationinthe GWTinshortHDsonslopes.Additionally,two-dimensional(2D) flowsimulationmodelsneglectthe3Deffect oftheGWTprofile,potentiallyresultinginainadequate design(Lakruwanetal.,2022;Abedetal.,2024).Consequently,toaccuratelycapturethecomprehensiveeffectof the3DvariationoftheGWT,complex3D flowsimulationmodelsarenecessary.However,settingupanaccurate3Dmodeltorepresentanactualslopeischallenging, andthetimeandcomputationalpowerrequiredtoiterate suchcomplexmodelstoobtaintheoptimaldesignparametersforHDssignificantlyincreasethecomplexityofthe process.
where D isthedepthoftheimpermeablelayer(m), rd is thepiperadius(m),and
Althoughafewstudies(Gregetal.,2013;Conteand Troncone,2018)haveusedtheHooghoudt(1940) methodforslopestabilityapplications,itsapplicability toslopesislimitedbecausetheassumptionofsemi-infinitelylongandparallelHDsisinvalidformostslope stabilizationapplications.AlthoughtheHooghoudt (1940)methodassumesauniformvariationintheGWT profilealongtheHDs,thelimitedlengthsresultinnonuniformGWTvariationsalongtheHDsonslopes,leadingtoacomplexdistributionoftheGWTprofilein three-dimensional(3D)space.
CrenshawandSanti(2004)werethe firstresearchers toaddressthisissueandproposedanempiricalmethod fordeterminingthe3DvariationintheGWTalongshort HDs.However,therequirementofaGWTheightof approximately20ft(6m)behindthedrain fieldandthe inabilitytopredicttheGWTprofilebeyondtheHD field aredrawbacksofCrenshawandSanti’s(2004)method.
Incontrast,thisstudyproposesanovelsemi-empirical methodforpredictingthesteady-stateGWTprofileof HDswithlimitedlengthsbasedonaseriesofnumerical simulations.Thismethodwasvalidatedthroughaseries ofnumericalcasesand fieldstudies.Theproposed methodhasfewerlimitations,requiresminimalcomputationalpower,canbeconvenientlyimplemented,and notonlycanpredicttheGWTprofileintheHD field, butalsotheslopebehindtheHD.
Furthermore,weextendtheproposedGWTprediction methodtoobtainthe U andreductionof U (DU)byHDs. Wethendescribetheprocedurefordevelopingadesign charttoselecttheoptimallengthandspacingoftheHDs foragivenslope.Todemonstratetheeffectivenessofour proposedmethodanddesignprocedure,weperformed twocasestudies,andweprovideseveralguidelinesfor selectingtheoptimallengthandspacingofHDs.
TheproposedGWTpredictionmethodanddesign procedureallowdesignerstoefficientlyperformHD designwhileconsideringthe3Dnatureoftheproblem.
Theobjectivesofthisstudyaresummarizedas follows:
1.Todevelopanovelsemi-empiricalmethodtopredict theGWTprofileofaslopewithHDsbasedonthe observationofnumericalsimulationsandtovalidate

theproposedmethodthroughacomprehensiveseries ofnumericalcasestudiesandarigorous fieldstudy, ensuringthereliabilityandapplicabilityoftheproposedmethod;
2.ToestablishanaverageGWTprofilethatadequately captures3Dvariations,whichmaybeutilizedin2D numericalsimulations,providingamoreaccurateand efficientapproachforanalyzingslopestability;
3.Toquantifythe U and DU valuesinthepresenceofaslip surfacebyintegratingacrosstheaverageGWT,andto thoroughlyanalyzetheeffectoftheHDlengthandspacing on DU,highlightingthesignificanceofselectingsuitable valuestoachieveeffectiveandeconomicaldesign;and
4.Toproduceadesignchartforspecificslopeconditions, enablingdesignerstoconfidentlyselectoptimalHD lengthsandspacingbasedonthedesignrequirements, andtoprovideinsightsandrecommendationsforthe selectionofHDlengthsandspacingtoachieveanoptimaldesign.
Thestructureofthisarticle(Figure1)issummarized asfollows:
1.ProposedMethod:Thenovelsemi-empiricalmethod developedtodetermineorpredicttheGWTonaslope
withHDsbasedonaseriesof3D finiteelement(FE) analysesconductedonslopeIispresentedandshown inFigure2.TheaverageGWTobtainedfromthe resultsissubsequentlyusedtocalculatethe U and DU
2.Validation:TheproposedmethodforpredictingGWT, U,and DU iscomprehensivelyvalidatedthrougha numericalcasestudyonslopesIandIIinFigure2and a fieldstudy.
3.ResultsandDiscussion:TheeffectoftheHDlength andspacingonthe DU (andfactorofsafety[FS] enhancement, DFS)valueisrigorouslyevaluatedusing slopesIandIIinFigure2.
NovelSemi-EmpiricalMethodtoPredictGWTProfile ModelSetupandBoundaryConditions
SeriesofFEsteady-state flowanalyseswereperformedona30-m-wide(inthe Y direction)sectionof slopeIusingPLAXIS3D(CONNECTEditionV20) (PLAXIS,2020).Ten-nodetetrahedralelementswere usedforFEdiscretization.The3DFEmodelofslopeI isshowninFigure3.Table1presentsthedetailsofthe

filesusedinthestudy:(a)slopeI,and(b)slopeII.
numericalmodelanalysis,andtheparametersareshown inFigures3and4.
Establishingtheupstreamhydraulicboundaryinslopes ischallengingduetoitscomplexbehaviorinfluencedby hydrologicalconditionsoutsidetheslopedomain.Followingpreviousstudies(Dasetal.,2022;Lerniaetal.,2022), aconstant-headDirichletboundarywithatotalheadof Hi (D þ hi,where hi istheheightoftheGWTattheboundary relativetotheHDlevel)wasused.Althoughthisupstream
headexhibitsseasonalvariation(Lerniaetal.,2022),using thehighheadvalueoftherainyseasonisaconservative approachinsteady-stateanalysis.Theconstraintsforthe locationoftheupstreamboundaryareoutlinedinthesectionon “ConstraintsoftheProposedMethod.” ANeumann boundaryconditionwasassumedatthetopsurfacetosimulatetheinfiltrationduringrain.Althoughinfiltrationhas temporalvariability,weusedtheaveragevalueofthepeak rainfallasaconstantrecharge(R)toprovideaconservative

Figure3.The30-m-wide3DFEmodelofslopeIusedtodevelopthepr oposedsemi-empiricalmethodtoobtaintheGWTpro fi le( S ¼ 5m).
Table1. DetailsoftheFEmodelsusedtodevelopempiricalrelationships(withparametersasillustratedinFigures3and4).
DetailsofPLAXISModels
D (m) B (m) L (m) hi (m) S (m) n 105015,20,25,30,352,5,810,50,0.05,0.1,0.2 9020,30,40,50,60,701050,0.1 205015,20,25,30,35550,0.1
estimateinsteady-stateconditions.Thisrechargerepresentsthein fi ltrationaftersurfacerunoff.Additionally,a0.1mcutoffvaluewasusedtopreventexcessive pondingonthesurface.Linedrainswithzerowater pressurewereemployedastheHDs,neglectingthe effectofentranceheadlossandpressureheadinside fully fl owingpipes.
Weobservedthreedistinctregionsofgroundwater fl owonslopeswithHDs,whichwerecharacterizedby fl owdirection(Figure5).IntheregionbehindtheHDs, the X -directionalcomponentofthegroundwater fl ow ( qx )dominatesthe Y-directionalcomponent(q y),resultingina2D fl owinthe XZ plane.Conversely,when HDswerepresent, qy becamedominantover q x,leading to2D fl owinthe YZ plane.Thetransitionfromthe XZ planetothe YZ planeoccurredthroughanarrowregion attheendoftheHDs.Becausecleardistinctions betweenthethreeregionscouldnotbeestablished basedsolelyongroundwater fl ow,weexaminedthe GWTpro fileatthemid-sectionbetweentheHDs(on the XZ plane).
ThegradualincreaseintheGWTintheHD fieldwas idealizedintotwolinearprofileswithdifferentgradients
Table2. Summaryofvalidation,showingMAEand R2 valuesbetweentheGWTsfrom3DFEmodelsandproposedmethod.
TotalLength (Zones1,2,and3)
MAE(m) R2
OnHD (Zones1and2)OnZone3
R2 MAE(m) R2
Figure10(a)
n ¼ 0.1/S ¼ 2.5m/hi ¼ 22m
L ¼ 10m0.2150.9980.3050.7860.1950.997
L ¼ 20m0.1560.9990.1970.8690.1400.999
L ¼ 30m0.1920.9990.2380.8100.1590.998
L ¼ 40m0.2380.9990.2950.7390.1750.998
L ¼ 50m0.3130.9980.3810.6380.1880.998
n ¼ 0.1/S ¼ 5m/hi ¼ 22m
L ¼ 10m0.1930.9980.3630.7890.1560.998
L ¼ 20m0.2140.9980.3430.8230.1600.998
L ¼ 30m0.2690.9980.3860.8140.1870.997
L ¼ 40m0.3260.9970.4530.8020.1830.997
L ¼ 50m0.4050.9960.5360.7920.1650.998
n ¼ 0.1/S ¼ 10m/hi ¼ 22m
L ¼ 10m0.2100.9980.5020.8140.1480.998
L ¼ 20m0.3020.9960.5070.8140.2170.995
L ¼ 30m0.3610.9960.5090.8440.2580.993
L ¼ 40m0.4120.9950.5430.8580.2640.992
L ¼ 50m0.4790.9930.6210.8740.2200.994
Figure10(b)
S ¼ 10m/L ¼ 30m/hi ¼ 12m
n ¼ 0.050.1800.9970.2770.9010.1120.997
n ¼ 0.10.2000.9960.2960.9130.1320.995
n ¼ 0.30.6870.9720.4470.8940.8550.607
Figure10(c)
n ¼ 0.17/S ¼ 10m/L ¼ 30m
hi ¼ 17m0.2580.9970.4130.8370.1500.998
hi ¼ 12m0.1780.9970.3120.8350.0850.998
hi ¼ 7m0.1720.9930.2520.8310.1150.992
hi ¼ 2m0.1580.9510.2400.6400.1000.917
Figure10(d)
n ¼ 0.1/S ¼ 5m/L ¼ 30m/hi ¼ 22m
h ¼ 2.5°0.3390.9960.5970.7290.1590.999
h ¼ 5° 0.2890.9970.5040.8860.1380.999
h ¼ 10° 0.4980.9940.4980.9410.4980.981

tosimplifytheproposedmethod.Zone1correspondsto theregionwith flowinthe YZ planeandexhibitsa gradualincreaseinGWTwithasmallgradient.Zone2 waslocatednearthedrainend,whereasuddenincrease intheGWToccurred,correspondingtothetransition region.Thelengthofthisregionisapproximatelyequal tothedrainspacing( S)andhasasteepergradientthan thatofzone1.Finally,zone3representsthecurved GWTpro filebehindtheHD field,wherethe fl owisin the XZ plane.
Insummary,wedefinedthreedistinctzonesintheGWT profilebasedonourobservationsof flowdirectionand changesintheGWTgradientalongtheprofile.Thesezones arelabeledaszones1,2,and3,asillustratedinFigure4.
Whenthesaturatedhydraulicconductivityofthesoil wasisotropicandhomogeneous,wedistinguishedthe GWToftheslopeintotwopartsasformedasaresultof hi andtherelativerechargeintensity( n)fromthetop surface(orinfiltration)(Figure4).
n ¼ Rechargefromthetop ðRÞðm=sÞ Hydraulicconductivity of thesoil ðks Þðm=sÞ (5)
TheheightsoftheGWTbetweenzones1and2and betweenzones2and3aredenotedas hc and he (m), respectively.Then, hc and he aredividedintotwoparts obtainedfrom hi and n,suchthat

Figure5.The X and Y directional flowvelocities(qx and qy,respectively)ofslopeIinthesectionatthequarterpointbetweenHDs(S ¼ 10m, L ¼ 25m).

he0,(b) hc0,(c) her,and(d) hcr.
hc ¼ hc0 þ hcr ; (6) and
he ¼ he0 þ her ; (7)
where hc0 (m)and hcr (m)denotethecomponentsof hc causedby hi and n,respectively;and he0 (m)and her (m) denotethecomponentsof he causedby hi and n,respectively.Basedonthenumericalmodelanalysisresults, wederivedthefollowingempiricallinearrelationships for he0, hc0, her,and hcr,asshowninFigure6:
he0 Sp ¼ 2:103 hi B L þ 0:034; (8)
hc0 Sp ¼ 0 930 hi B L þ S þ 0 019; (9)
her hm np ¼ 0 090 B L ðÞ 0 072; (10) and hcr hm np ¼ 0 032 B L þ S ðÞþ 0 368; (11)
where L isthelengthoftheHDinthe X direction (m), B isthelengthof h i attheupstreamboundaryof theslopefromtheHDstartingpoint,and h m indicates themaximumGWTheightobtainedusingtheHooghoudt(1940)method(Eq.1)forparallelandin finitelylongdrains,where h i isthemeasuredheightof theGWT,locatedsuf fi cientlyawayfromtheHD fi eld.
TheGWTprofileinthemid-sectionbetweenHDscan bepredictedasfollows.
• Zone1:
Zw ¼ hc L S X þ D; (12)
where Zw istheGWTprofile(m),and D denotesthe depthtotheimpermeablelayer(m).
• Zone2:
Zw ¼ he hc S ðX L þ S Þþ hc þ D; (13) and
• Zone3:Zone3maybecharacterizedbytwodifferent methods,inlocalcoordinatesandglobalcoordinates.
LocalCoordinates(xz Space) Figure5showsthatthe groundwater flowinzone3mainlyoccursinthe X direction, allowingtheuseoftheDupuit-Forchheimerassumptionfor horizontal flow.UsingDarcy’slawandtheDupuit-Forchheimerassumption,thedischarge( q ,inm 2 /s)per unitslopewidthacrossasectionatpointP,asshown inFigure4,canbeobtainedas:
q ¼ ks z Dz Dx (14)
Theincrementofthewater flow, Dq,isequaltothe rechargefromthetop:
Dq ¼ DxR: (15)
Byintegrationandapplyingboundaryconditions,
q ¼ qi þ B L x ðÞR; (16)
where qi isthewater flowfrombehindtheslope(m2/s).
SubstitutingEq.16intoEq.14,weobtain
qi ks þ B L x ðÞn dx ¼ zdz: (17)
Byintegrationandapplyingboundaryconditions,
z 2 ¼ H 2 e þ H 2 i H 2 e B L þ B L ðÞn x nx 2 ; (18)
where He ¼ he þ D (m),and Hi istheconstantheadat theupstreamboundaryofthemodel hi þ D (m).
GlobalCoordinates(XZ Space) The z isconvertedto Zw inglobalcoordinatesystembyreplacingxwith(X L)
Z 2 w ¼ H 2 e þ H 2 i H 2 e B L þ B L ðÞn X L ðÞ
nX L ðÞ2 : (19)
HDsaretypicallyinclinedtofacilitategravitydrainage, resultinginahigherGWTprofilethanhorizontallyinstalled HDs.Therefore,weintroducedacorrectiontotheproposed methodtoaccountfortheinclinationsoftheHDs.
Thecorrectioninvolvesadjustingthevaluesof hc and he.First,thevalueof hi iscorrectedwithreferenceto theelevationsoftheHDattheboundaryofzones1and 2andthedrainendasfollows(Figure4):
hich ¼ hi L S ðÞtan h ðÞ; (20) and hieh ¼ hi Ltan h ðÞ; (21) where h istheinclinationangleoftheHDstothehorizontal,and hich (m)and hieh (m)arethecorrected hi valuesforcalculating hc0 and he0,respectively.Thevaluesof L and S aremeasuredinthehorizontaldirection.Note thatthevaluesof hcr and her remainunchangedbecause theyaresolelybasedontherechargefromthetop. Finally,thecorrected hc and he valuescanbeobtainedas:
hc ¼ hc0 þ hcr þ L S ðÞtan h ðÞ; (22) and he ¼ he0 þ her þ Ltan h ðÞ: (23)
InthisGWTpredictionmethod,zones1and2provide empiricalsolutions,whereaszone3representsatheoretical GWTprofilewithanempiricalboundary(he).
Theaccuracyoftheproposedmethodforpredictingthe GWTatthemid-sectionbetweentheHDswasvalidated throughacomprehensiveseriesofnumericalcasestudies usingthe3DFEmodelofslopeIIanda fieldstudy.
TheGWTprofilevariationbetweentheHDsonthe YZ planeforslopeIhavingHDswith10mspacingand30m lengthisshowninFigure7.TheGWTprofilebetweenthe drainsconformedtothehalf-ellipticalpatternproposedby Hooghoudt(1940)alongthelengthofthedrains.However,a uniformGWTprofilewasobservedbehindtheHD field. Hence,theaveragevalueoftheGWTprofilealongthelength oftheHDs(zones1and2),denotedas(Zw(avg)),asshownin Figure8,canbeusedtocharacterizetheGWTprofileforfurthercalculationsof U, DU,andfactorofsafety( FS)enhancement( DFS),aswellasincorporationinto2Dnumerical simulations(seeSupplementalMaterialAppendixA).
TheobjectiveofHDsistoenhancetheslopestabilityby reducingthePWPactingontheslipsurface.Once Zw(avg) (m)isdeterminedfromtheproposedmethod,theaverage

¼ 10m, hi ¼ 6m,and n ¼
porewaterforce( U [kN/m])actingontheunitwidth ofaprede fi nedslipsurface( Z s [m])canbecalculated vialinearintegrationbetween Z w(avg) and Z s (Figure 9).Followingthemethodofslices,theslipsurfaceis dividedintoa fi nitenumberofsliceswithlinearbottoms.Theporewaterforceonaslice( u i [kN/m])can beobtainedas
where qw isthedensityofwater(kg/m3), g isthegravitationalacceleration(m/s2),and ai istheangleofthe bottomoftheslicerelativetothehorizontalline.Then, thetotalaveragePWPontheslipis(kN/m2):
Next,thereductionofaveragePWPontheslipsurface(DU [kN/m2])canbeobtainedas:
U0 istheinitialaveragePWPontheslipsurface.
ConstraintsoftheProposedMethod
TheconstraintsoftheproposedGWTprediction methodandconcomitantdesignchartareasfollows:
• Theslopeisassumedtoconsistofisotropicand homogeneoussoil.
• Ahorizontalimpermeablelayerispresentatthebottomoftheslope.
• Aknowngroundwaterlevelexistssufficientlyaway fromtheslopethatcanbeusedastheupstreamconstantheadboundary.Itisrecommendedtolocatethis boundaryatleast15mawayfromtheHD field,which istheminimumdistanceconsideredinthisstudy.
• Anequivalentconstantrechargeratemustbedefined forinfiltration.
• Thereisauniformdistributionofwaterlevelinthe Y direction.Inthecaseofanon-uniformdistribution, particularly hi,itisrecommendedtodividetheslope intosectionswithuniformwaterlevelandapplythe methodtoeachsectionseparately.

filebetweenHDsinzones1and2forcalculating U, DU,and DFS.Thesevalueswereusedin2Danalyses.
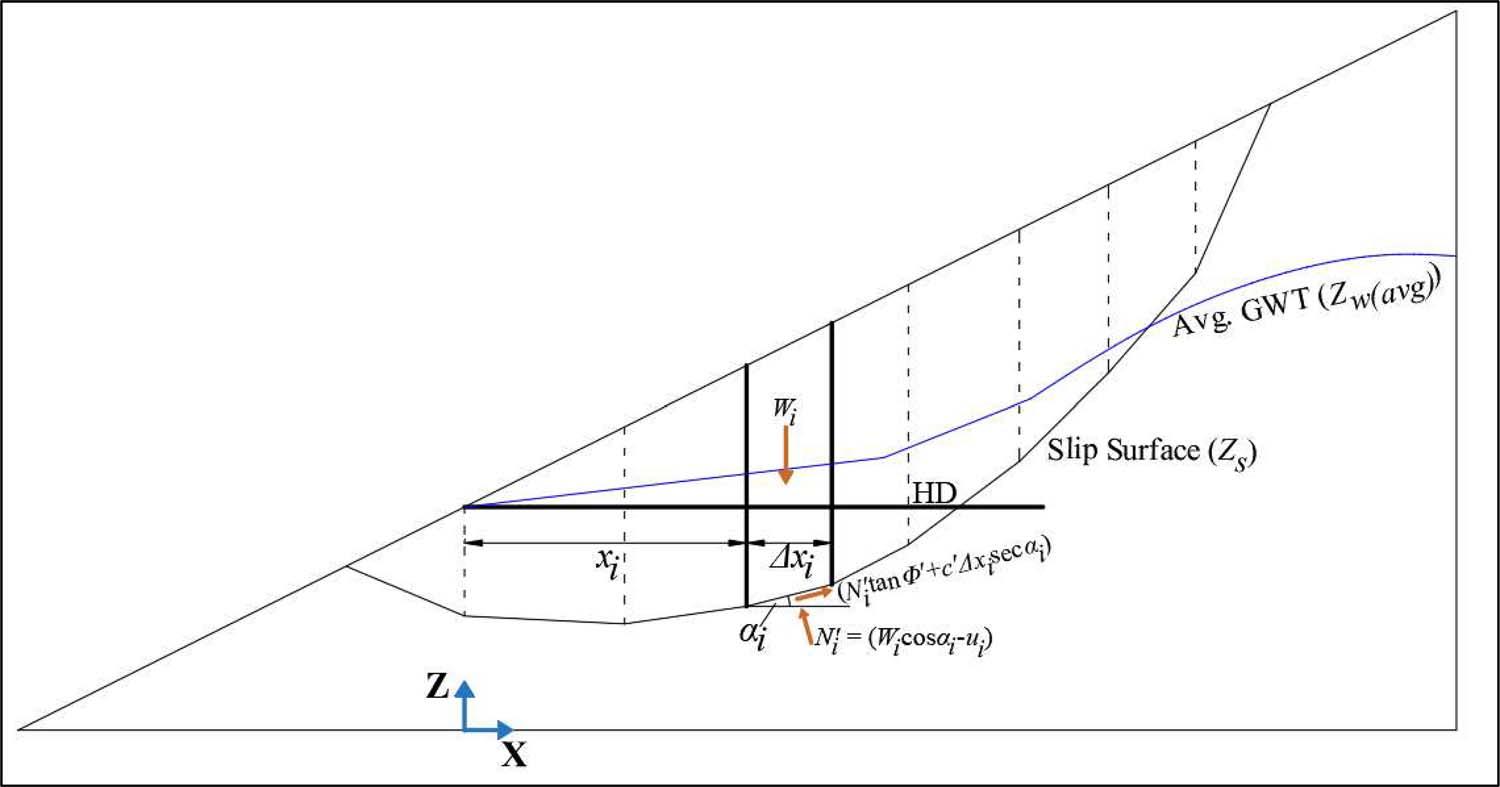
Theproposedmethodinvolvesmultiplerigorousiterative calculationstepstodeterminetheoptimallengthandspacingofHDs.Toovercomethetime-consumingnatureofthe designprocess,aPython-based(Python3.6.2;Rossumand Drake,2009)computerprogramwasdevelopedtoautomate thecalculations.Thestep-by-stepdesignprocedureforHDs, basedontheframeworkproposedinthisstudy,isoutlined inFigureB1(SupplementalMaterialAppendixB).
Thissectionpresentstheverificationoftheproposed GWTpredictionmethodusingaseriesofnumerical casestudiesanda fieldstudy.Also,theaccuracyofthe calculationmethodfor U and DU isdiscussed.
ValidationoftheProposedGWTPredictionMethod throughNumericalCaseStudies
TheproposedGWTpredictionmethodwascomprehensivelyverifiedunderawiderangeofconditionswithin theaforementionedlimitations.VerificationwasperformedonslopeII,consideringvariationsintheHD length,spacing,andinstallationangle,rainfallconditions, andinitialGWT.ThepredictedGWTprofileobtained usingtheproposedmethodwascomparedwiththeGWT profileatthemid-sectionofthe3DFEmodel.Toprevent waterponding,acorrectionwasintroducedtotheproposedmethod,particularlyforthetoeregion.Inaddition toavisualcomparison,aquantitativeevaluationwasconductedusingthemeanabsoluteerror(MAE)betweenthe predictedand3DFEmodelGWTs.TheMAEwascalculatedasfollows:
where Zw(Predict) istheGWTprofilepredictedusingthe proposedmethod, Zw(3DFEModel) istheGWTatthemidpointbetweentheHDsobtainedfromthe3DFEmodel, and m isthenumberofdatapoints.Comparisonsofthe GWTprofilesweremadeat5mintervalsinthe X direction.TheMAEvalueswerecalculatedfortheentire lengthoftheslopeandseparatelyfortheHD field (zones1and2)andbehindtheHDs(zone3).TheMAE valuesaresummarizedinTable2.
Figure10Ashowsacomparisonofthepredictedand 3DFEmodelGWTprofilesforhorizontallyinstalledHDs withdifferentlengthsandspacings.ThesmallMAEvalues indicategoodagreementbetweentheGWTprofiles.Generally,zones1and2showedlessagreementbetweenthe GWTprofilesthanzone3,whichcanbeattributedtothe empiricallinearidealizationoftheGWTinzones1and2. Incontrast,thetheoreticalpredictionoftheGWTprofile withanempiricalboundaryinzone3resultedinlower MAEvalues.Furthermore,theagreementbetweenthe GWTprofilesdeterioratedwithanincreaseinthespacing andlengthoftheHDs.WhentheHDlengthincreased,the distancetotheupstreamboundaryoftheslope(distanceto hi)decreased,leadingtopoorpredictions.Therefore,itis crucialtoestablishthe hi atasufficientdistanceawayfrom theexpectedlengthoftheHDstoensureaccurateresults.
Figure10Bcomparesthepredictedand3DFEmodel GWTprofilesforhorizontallyinstalledHDsatdifferentrainfallintensities(n).Higherrainfallintensitiesresultedina loweragreementbetweentheGWTprofiles,andaslight overestimationinzone2wasalsoobserved.Thelowerconformityindicatedbythelower R2 value(Figure11)forthe

Figure10.ValidationoftheproposedGWTpredictionmethodby3DFEmodelfor:(a)differentlengthsandspacings( n ¼ 0.1)(slopeII);(b)differentrainfallintensities( S ¼ 5m)(slopeII);(c)different hi values( n ¼ 0.17)(slopeII);and(d)inclinedHDs(S ¼ 5mand n ¼ 0.1)(slopeII).
predictionof hcr canbeidentifiedasthereasonforthis behavior.However,itdidnotsignificantlyaffecttheaccuracy oftheGWTprediction.Figure10canddconfirmstheaccuracyoftheproposedmethodinpredictingtheGWTunder differentinitialGWTconditionsandHDangles,respectively.
Figure11comparesthe hc and he valuespredictedby theproposedmethodwiththevaluesobtainedfromthe 3DFEmodels.ThelowMAEandhigh R2 valuessuggestthattheproposedmethodprovidesagoodpredictionof hc and hc
ValidationofProposedGWTPredictionMethodby FieldStudy
TheGinigathhenalandslide,locatedatbridgeno.48/2 attheAvissawella-Hatton-NuwaraeliyaRoadinSri Lanka,wasselectedfor fieldvalidationoftheproposed method.Thedetailsofthelandslidesweredocumented byLakruwan(2019)andLakruwanandKulathilaka (2020,2021).Thelandslidemassconsistedofthick colluviumandaresidualsoillayerunderlainbyhighly

crystallinemetamorphicrock.Theinitialslopefailure occurredonJune22,2014,followedbyexcavationat thetoeforroadwideningandpropagationtotheupper slopeduringtherainyseason.Thelandslidewasmitigatedbyimprovementsindrainageandsoilnailing.
Theaveragehomogeneousandisotropichydraulic conductivityofthesoiloverburdenwasfoundtobe8 3 10 6 m/s,andthebedrockwasconsideredtobeimpermeable(Lakruwan,2019).Thewaterlevelsofthetwo observationwells,W1andW2,located1.7mand42.38 mawayfromHD field,respectively,weremonitoredafter the20-m-longHDswith5mspacingwereinstalled(Figure12).Becausethehorizontalimpermeablebottomlayer onlyexistedinthatsection,onlythetopslopesection
demarcatedbythedottedlinerectangleinFigure12 wasconsideredforthevalidationoftheproposed method.Twocaseswereselectedforvalidation:Case 1,norainfallfromFebruary27toMarch21,2018,and Case2,450mmcumulativerainfallfromMay18to23, 2018(n ¼ 0.11).SincethewaterlevelofW2wasrather constantwithtime,itwasselectedasthe Hi (B ¼ 62.38m and Hi ¼ 15.00m[Case1]/15.58m[Case2]).The observedandpredictedwaterlevelsofW1inCase1(zero elevationatthetopoftheimpermeablelayer)were2.67 and2.77m,respectively.Theobservedandpredictedwater levelsofW1inCase2were3.61and4.06m,respectively. Therefore,despiteaslightoverestimation,theproposed methodcanaccuratelypredictthewaterlevel.


ValidationoftheProposedMethodforObtaining U and DU
SlopeIwasusedforthevalidationoftheproposed methodforobtaining U and DU.Theaverage U (kN/m) fromthe3DFEmodelwasobtainedbyintegratingthe PWPvaluesofthe51stresspointslocatedontheFEmesh oftheslipsurface(FigureB2inSupplementalMaterial AppendixB).Threepoint-rowswerelocated,oneonasectionontheHDandoneeachonsectionsatthemid-and quarter-pointsbetweentheHDs.Eachrowconsistedof19 pointsat2.5mspacingsinthe X direction.
Thegoodagreementbetweenthe U valuesobtained fromthe3DFEmodelsandtheproposedmethod(Eq. 24andEq.25)forslopeI(hi ¼ 6mand n ¼ 0.1),as showninFigure13a,confirmsitsvalidity.Also,the plotsof DU inFigure13bconfirmtheaccuracyofthe proposedmethodincalculating DU.
Thiscomprehensivevalidationconfirmedtheaccuracy oftheproposedGWTpredictionmethodforslopeswith HDsunderawiderangeofconditionssubjectedtothe aforementionedlimitations.Moreover,itvalidatesthe predictionof U and DU inthepresenceofpredefinedslip surface.Therefore,theproposedmethodcanbeusedas anefficienttoolfordesigningHDswhileovercomingthe difficultiesofcomplex3Dnumericalsimulations.
Thissectionpresentsexamplesofapplicationsofthe proposedmethodforthedesignofHDsandprovides
severalconclusionsonselectingappropriatelengthsand spacingforHDs.
EffectofHDonPWPandEffectiveStressonSlip Surface
A3DFEstress-deformationanalysiswasperformedon slopeIusingthestrengthreductionmethodtoobtainthe PWPontheslipsurfaceand FS.Figure14showsthePWP distributionontheslipsurfaceobtainedfromthe3DFE modelofslopeIwithadrainspacingof10m.ThePWP decreasedwithHDlength,andnofurtherreductionoccurred beyondnormalizeddrainlength(L/Ls,where Ls isthe lengthtotheslipsurface)of2.0.Theeffectivestress increased,asshowninFigure15,whilecomplyingwiththe decreaseinPWP,whicheventuallyresultedinsimilar behaviorinthe FS enhancement.
Figures13providesfurtherinsightsintotheeffects oftheHDlength.InFigure13,both U and DU achieveuniformvaluesforlongHDs,andafurther increaseinthedrainlengthbecomesinsigni fi cant, whichcon fi rmstheresultsofCaietal.(1998),Cook etal.(2008),LauandKenney(1984),andRoyster (1980).ThisphenomenonisexplainedinFigureB3 (SupplementalMaterialAppendixB).InshortHDs, thefailurewedgeextendsintoallthreezonesofthe GWT,and U becomeshighlysensitivetothelengthof theHDsbecausethehighGWTinzone3gradually movesawayfromthefailurewedge.Withanincrease inHDlength,zones3and2graduallymoveaway fromthefailurewedge,eventuallylimitingthefailure

wedgetozone1.Inzone1, U showsnegligiblesensitivitytodrainlengthincrementsbecausethegradient oftheGWTisverysmall.
Figure16illustratestheeffectof n,rangingfrom0.01 to0.2,on U fordifferentdrainlengthsandspacing.The U valuesat n ¼ 0.01and n ¼ 0.2aredenotedas U0.01 and U0.2,respectively.HighGWTsinwidelyspaced HDsarehighlysensitivetosurfacerecharge,making n significantlyaffect U atlarge S values.Thiseffect reducesastheGWTlowersincloselyspacedHDs.Furthermore,theimpactof n on U issignificantinshort HDsanddecreaseswithincreasingdrainlength,dueto theshiftintheslipsurfacelocationfromzone3tozone 1,asdiscussedintheprevioussection.
Adesignchartcanbeusedtoef fi cientlyselectthe lengthandspacingofHDstoachievethedesired DU or DFS valuesforaparticularslopefailure.Theprocedurefor calculating DFS isoutlinedinSupplementalMaterial AppendixC.Giventheheterogeneityofthefailures,the designchartsbyKennyetal.(1977)andStanic(1984)were developedforuniqueslopeconditions.Therefore,insteadof producinggeneralizedcharts,weproposecreatingunique designchartsforagivenslopetoselectthedrainlengthand spacing.Thelimitationsonthechartusedareoutlinedinthe section “ConstraintsoftheProposedMethod.” Figure17showsthedesigncharts,andvariationin DU and DFS withdrainspacingfordifferent L/Ls,produced forslopesIandII.Thenon-compatibilityofthedesign chartsforslopesIandIIshowsthattheyareuniquefora

Figure15.Distributionoftheeffectivestressontheslipsurfacefordifferent L valuesobtainedfromthe3DFEmodelanalysis(S ¼ 10m, Ls ¼ 10m, D ¼ 10m, B ¼ 50m, hi ¼ 5m,and n ¼ 0.1).
givenslope,andageneralizeddesignchartcannotbe adopted.
Areductioninthesensitivityofthedrainlengthforlong HDsisalsoreflectedinthedesigncharts,wherethedesign
chartsindicatethattheeffectofdrainspacingismoresignificantinshortHDs,whereasitisnotsignificantinlong HDs.InlongHDs(i.e.,whenthefailurewedgeislocated inzone1),increasingthespacingcausesonlyaslight

Figure16.Effectof n on U fordifferentdrainlengthsinslopeI(S ¼ 5m, Ls ¼ 10m, D ¼ 10m, B ¼ 50m,and hi ¼ 6m).

increaseintheGWTprofileinsidethefailurewedge. Therefore,onlyasmallincrementin U isobservedwhen increasingthespacinginlongHDs,whichisalsoshown byAbedetal.(2024).
Atargetvalueof DFS or DU canbeachievedwitha smallerHDlengthperunitslopewidthwhenlargedrain spacingsareused(Figure18).Forexample,toachieve DU of9.9kN/m2 ( DFS 0.6)inslopeI,5.3and1.7mpipe lengthspermeterwidthofslopearerequiredwhenthe spacingis1.0and5.0m,respectively.Therefore,theuse
ofalargerdrainspacingismoreeconomical.However, twomainissuesarisewithawidedrainspacing.Oneissue istheriskofnon-functioningHDsforvariousreasons, suchascloggingofthe filterscreen,mineralprecipitation, androotgrowthinsidethepipe(Martinetal.,1995;Lee, 2013).Inthecaseofanon-functioningdrainpipe,the drainspacingwillbedoubled,and DFS willbereducedto 0.54and0.35fortheinitialdrainspacingof1.0and5.0m, respectively.Therefore,asmallspacingismoreconservativeinsuchsituations.Thisissuecanbeeliminatedusing

Figure18.TotalHDlengthperslopewidth(m/m)toachievetarget DU for:(a)slopeIand(b)slopeII.
longHDsbecausetheeffectofspacingisnotsignificant. ThenextissueassociatedwithwidelyspacedHDsisthe requirementforapipewithahigherdischargecapacity. Therefore,atrade-offexistsbetweenthepipe flowcapacityandtotalpipelength,andthe flowcapacityofthe drainpipeshouldalsobeconsideredintheselectionof drainspacing.
Thefollowingconclusionshavebeendrawnfromthis study.
1.Anovelsemi-empiricalmethodthatcanbeusedto obtaintheGWTpro fi leofaslopewithHDssubjectedtoconstantrechargefromthesurfaceisproposedinthisstudy,alongwithadesignframework forHDlengthandspacing.Theaccuracyoftheproposedmethodwascomprehensivelyvalidatedthrough aseriesofnumericalcasestudiesforawiderangeof conceivableconditionsandmonitoringdataofan actualslope.
2.Theproposedmethodwasextendedtodeterminethe PWPforceonapredefinedslipsurfacevialinearintegrationbetween Zw(avg) and Zs,whichwassubsequentlyverifiedthroughanumericalcasestudy.The Zw(avg) canbeusedin2Dnumericalmodelstoreplicatethe3DeffectsoftheGWT.
3.APython-basedcomputerprogramwasdevelopedto automatemultiplerigorousiterativecalculationsteps fordeterminingtheoptimallengthandspacingofthe HDs.Auniquedesignchartwasproducedforaspecificslopeusingthedevelopedcomputerprogram.
4.DesignchartsofslopesIandIIwereusedtoevaluatethe effectsoflengthandspacingoftheHDsonthePWP reductionand FS incrementofaslope.TheHDsmust onlybeextendedtoalengthequaltothedrainspacing beyondtheslipsurface.Thelengthandspacingofthe HDsrequiredtoachievethetarget FS increasecanbe obtainedfromthedesignchartproducedforaparticular slopecondition.AlthoughlengtheningtheHDsismore effectivethanreducingthedrainspacing,theriskof drainblockageanddischargecapacityofthedrainpipe mustbeconsideredwhenselectingthedrainspacing.
SupplementalMaterialassociatedwiththisarticlecanbe foundonlineat https://www.aegweb.org/e-eg-supplements.
ThisresearchwassupportedbytheJapanSocietyforthe PromotionofScience(JSPS)Grants-in-AidforScientific Research(KAKENHI)grant(no.JP24K00974).
ABED,M.;PEETHAMBARAN,B.; AND LESHCHINSKY,B.,2024,Evaluating transientdrawdownandslopestabilizationfromhorizontaldrain installation: ComputersandGeotechnics,Vol.167,p.106044. https://doi.org/10.1016/j.compgeo.2023.106044
CAI,F.;UGAI,K.;WAKAI,A.; AND LI,Q.,1998,Effectsofhorizontal drainsonslopestabilityunderrainfallbythree-dimensional finite elementanalysis: ComputersandGeotechnics,Vol.23,No.4,pp. 255–275. https://doi.org/10.1016/S0266-352X(98)00021-4
CHEN,C.N. AND CHEN,H.Y.,2013,Distributionsofporewaterpressuresurroundahorizontaldrainpipeonaretainingwallunder steadystatecondition: JournalofMechanics,Vol.29,No.2,pp. 263–272. https://doi.org/10.1017/jmech.2012.132
CONTE,E. AND TRONCONE,A.,2012,Stabilityanalysisofinfiniteclayey slopessubjectedtoporepressurechanges: Géotechnique,Vol.62, No.1,pp.87–91. https://doi.org/10.1680/geot.10.T.002
C ONTE ,E. AND TRONCONE ,A.,2018,Aperformance-basedmethod forthedesignofdrainagetrenchesusedtostabilizeslopes: EngineeringGeology,Vol.239,pp.158–166. https://doi.org/10.1016/j. enggeo.2018.03.017
COOK,D.I.;SANTI,P.M.; AND HIGGINS,J.D.,2008,Horizontallandslidedraindesign:Stateoftheartandsuggestedimprovements: EnvironmentalandEngineeringGeoscience,Vol.14,No.4,pp. 241–250. http://dx.doi.org/10.2113/gseegeosci.14.4.241
COOK,D.I.;SANTI,P.M.; AND HIGGINS,J.D.,2012,Predictionofpiezometricsurfacesanddrainspacingforhorizontaldraindesign: Landslides,Vol.9,No.4,pp.547–556. https://doi.org/10.1007/ s10346-012-0337-5
CRENSHAW,B.A. AND SANTI,P.M.,2004,Watertableprofilesinthevicinityofhorizontaldrains: EnvironmentalandEngineeringGeoscience, Vol.10,No.3,pp.191–201. https://doi.org/10.2113/10.3.191
DAS,T.;RAO,V.D.; AND CHOUDHURY,D.,2022,Numericalinvestigationofthestabilityoflandslide-affectedslopesinKerala,India, underextremerainfallevent: NaturalHazards,Vol.114,No.1, pp.751–785. https://doi.org/10.1007/s11069-022-05411-x
ERNST,L.,1954, Hetberekenenvanstationariesgroundwaterstorming walkedinverticals flakafgebeeldkunenworden(TheComputation ofSteadyStateGroundwaterFlows,WhichCanBeProjectedinthe VerticalPlane):InstituteofTheNetherlandsOrganizationfor AppliedScientificResearch,Groningen,Netherlands.
FASANO,G.;DE SARNO,D.;BILOTTA,E.; AND FLORA,A.,2019,Design ofhorizontaldrainsforthemitigationofliquefactionrisk: Soils andFoundations,Vol.59,No.5,pp.1537–1551. https://doi.org/ 10.1016/j.sandf.2019.07.004
FASANO,G.;NAPPA,V.;OZCEBE,A.G.; AND BILOTTA,E.,2021,Numerical modellingoftheeffectofhorizontaldrainsincentrifugetestsonsoil structureinteractioninliquefiablesoils: BulletinofEarthquakeEngineering,Vol.19,pp.3895–3931. https://doi.org/10.1007/s10518-02101084-2
FENG,J.;PENGPENG,N.;ZHENG,C.;GUOXIONG,M.; AND MEIJUAN,X., 2020,Positioningdesignofhorizontaldraininsandwichedclay-drain systemsforlandreclamation: ComputersandGeotechnics,Vol.127, p.103777. https://doi.org/10.1016/j.compgeo.2020.103777 FORRESTER,K.,2001, SubsurfaceDrainageforSlopeStabilization:ASCE Press,Reston,VA,208p. https://doi.org/10.1061/9780784400166 GeotechnicalEngineeringOffice,2017, Geoguide7 GuidetoSoilNail DesignandConstruction :CivilEngineeringandDevelopment Department,TheGovernmentoftheHongKongSpecial AdministrativeRegion,HongKong,97p. GHIASSIAN,H. AND GHAREH,S.,2008,Stabilityofsandyslopesunder seepageconditions: Landslides,Vol.5,No.4,pp.397–406. https:// doi.org/10.1007/s10346-008-0132-5
GREG,M.P.;ROSEMARY,W.C.;DONALD,M.R.;RISHI,P.;BALASINGAM, M.;SUTHARSAN,T.;TOM,B.;STEVE,L.; AND KIM,A.W.,2013, GroundwaterTableandHorizontalDrainsinSlopes
DesignGuidelinesforHorizontalDrainsUsedforSlopeStabilization:WashingtonStateDepartmentofTransportation,Olympia, WA,377p.
HINDS,E.S.;LU,N.;MIRUS,B.B.;GODT,J.W.; AND WAYLLACE,A.,2021, Evaluationoftechniquesformitigatingsnowmeltinfiltration-induced landslidinginahighwayembankment: EngineeringGeology,Vol. 291,p.106240. https://doi.org/10.1016/j.enggeo.2021.106240
HOOGHOUDT,S.,1940,Bijdragetotdekennisvanenigenatuurkundige groothedenvandergrond: VerslagbouwkOnderzoek,Vol.46, No.14B,pp.515–707.
KENNY,T.C.;CHOI,W.S.; AND PAZIN,M.,1977,Designofhorizontal drainsforsoilslopes: JournaloftheGeotechnicalEngineering Division(ASCE),Vol.103,No.11,pp.1311–1323. https://doi. org/10.1061/AJGEB6.0000522
KIRKHAM,D.,1958,Seepageofsteadyrainfallthroughsoilintodrains: TransactionsAmericanGeophysicalUnion,Vol.39,No.5,pp. 892–908. https://doi.org/10.1029/TR039i005p00892
LAKRUWAN,S.O.A.D.M.,2019,EnhancementoftheStabilityatthe SiteofanAncientLandslideinaRoadCuttingwithDrainageand Reinforcement CaseHistoryatGinigathhena:M.Sc.dissertation, DepartmentofCivilEngineering,UniversityofMoratuwa,Moratuwa,SriLanka,126p.
LAKRUWAN,M.;KAMURA,A.; AND KAZAMA,M.,2022,Effectof3D watertableprofileofhorizontaldrainsonslopestabilityandidealizationof3D-FEM flowmodelingto2D-FEM flowmodeling.In Feng,H.Y.;Ling,L.Y.;Siong,W.K.;Lee,L.M.;Hon,L.K.; Hung,L.S.;andHan,L.M.(Editors),2ndInternationalConference onCivilandEnvironmentalEngineering(ICCEE2022),E3SWeb ofConferences,347:EDPSciences,Castanet-Tolosan,France,p. 03002. http://doi.org/10.1051/e3sconf/202234703002
LAKRUWAN,M. AND KULATHILAKA,S.A.S.,2020,Economizingsoilnailingdesignbydrainageimprovement CasehistoryatGinigathhena. InVilímek,V.;Wang,F.;Strom,A.;Sassa,K.;Bobrowsky,P.T.;and Takara,K.(Editors), UnderstandingandReducingLandslideDisasterRisk,Vol.5:Springer,Cham,Switzerland,pp.331–339. http:// doi.org/10.1007/978-3-030-60319-9_37
LAKRUWAN ,M. AND KULATHILAKA,S.A.S.,2021,Evaluationofthe performanceoflandslidemitigationmeasuresatGinigathhena. InRanathunga,A.;Karunawardena,A.;Kulathilaka,A.; Kurukulasuriya,C.;Sampath,K.H.S.M.;Nasvi,M.C.M.;De Silva,N.;Nasvi,M.;Alagiyawanna,N.;Priyankara,N.H.; Rathnaweera,P.;Thilakasiri,S.;Navaratnarajah,S.K.;and Nawagamuwa,U.(Editors), InternationalConferenceonGeotechnicalEngineeringICGEColombo2020:SriLankanGeotechnicalSociety,Colombo,SriLanka,pp.459–464.
LAKRUWAN,M.;OIKAWA,H.;KAMURA,A.; AND KAZAMA,M.,2021, Experimentalevaluationofeffectofperforationarrangementon performanceofhorizontaldrainsinlandslidemitigation: Landslides,Vol.18,No.11,pp.3707–3714. http://doi.org/10.1007/ s10346-021-01724-3
LAU,K.C. AND KENNEY,T.C.,1984,Horizontaldrainstostabilizeclay slopes: CanadianGeotechnicalJournal,Vol.21,No.2,pp.241–249. https://doi.org/10.1139/t84-027
LEE,T.S.,2013,Horizontaldrains Stateofpracticethepastseven decadesintheUS.InMeehan,C.;Pradel,D.;Pando,M.A.;and Labuz,J.F.(Editors),Geo-Congress2013:StabilityandPerformanceofSlopesandEmbankmentsIII.ASCE,NewYork,pp. 1759–1773. https://doi.org/10.1061/9780784412787.176
LERNIA,A.D.;COTECCHIA,F.;ELIA,G.;TAGARELLI,V.;SANTALOIA,F.; AND PALLADINO,G.,2022,Assessingtheinfluenceofthehydraulic boundaryconditionsonclayslopestability:TheFontanaMonte casestudy: EngineeringGeology,Vol.297,p.106509. https://doi. org/10.1016/j.enggeo.2021.106509
LUTHIN,J.N.,1966, DrainageEngineering:JohnWiley&Sons,Inc., NewYork,250p.
MARTIN,R.;SIU,K.; AND PREMCHITT,J.,1995, PerformanceofHorizontalDrainsinHongKong:HongKong:GeotechnicalEngineering Office(GEO)ReportNo.42,TheGovernmentoftheHongKong SpecialAdministrativeRegion,HongKong,108p.
NONVEILLER,E.,1981,Efficiencyofhorizontaldrainsonslopestability.In Proceedingsofthe10thInternationalConferenceonSoil MechanicsandFoundationEngineering,15–19June, Stockholm, Sweden:A.A.Balkema,Rotterdam,Netherlands,pp.495–499. PLAXIS,2020, PLAXIS3DReferenceManualCONNECTEdition V20:Bentley,Exton,PA.
RAHARDJO,H.;HRITZUK,J.J.;LEONG,E.C.; AND REZAUR,R.B.,2003, Effectivenessofhorizontaldrainsforslopestability: Engineering Geology,Vol.69,No.3–4,pp.295–308. https://doi.org/10.1016/ S0013-7952(02)00288-0
RAHARDJO,H.;SANTOSO,V.A.;LEONG,E.C.;NG,Y.S.; AND HUA,C.J., 2011,Performanceofhorizontaldrainsinresidualsoilslopes: Soils andFoundations,Vol.51,No.3,pp.437–447. https://doi.org/ 10.3208/sandf.51.437
RESNICK,G.S. AND ZNIDARČIĆ,D.,1990,Centrifugalmodelingofdrains forslopestabilization: JournalofGeotechnicalEngineering,Vol. 116,No.11,pp.1607–1624. https://doi.org/10.1061/(ASCE)07339410(1990)116:11(1607)
ROSSUM,V.G. AND DRAKE,F.L.,2009, Python3ReferenceManual: CreateSpace,ScottsValley,CA.
ROYSTER,D.L.,1980,Horizontaldrainsandhorizontaldrilling:An overview: TransportationResearchRecord,Vol.783,pp.16–20.
SHRESTHA,H.K.;YATABE,R.; AND BHANDARY,N.P.,2008,Groundwater flowmodelingforeffectiveimplementationoflandslidestability enhancementmeasures: Landslides,Vol.5,No.3,pp.281–290. https://doi.org/10.1007/s10346-008-0121-8
STANIĆ,B.,1984,Influenceofdrainagetrenchesonslopestability: JournalofGeotechnicalEngineering,Vol.110,No.11,pp.1624–1636. https://doi.org/10.1061/(ASCE)0733-9410(1984)110:11(1624)
STUYT,L.C.P.M.;DIERICKX,W.; AND BELTRAN,J.M.,2005, Materials forSubsurfaceLandDrainageSystems:FoodandAgricultural OrganizationoftheUnitedNations,Rome,Italy,183p.
TSAO,T.M.;WANG,M.K.;CHEN,M.C.;TAKEUCHI,Y.;MATSUURA,S.; AND OCHIAI,H.,2005,Acasestudyoftheporewaterpressure fluctuationontheslipsurfaceusinghorizontalboreholeworksondrainagewell: EngineeringGeology,Vol.78,pp.105–118. https://doi. org/10.1016/j.enggeo.2004.11.002

WILLIAMM.ROMAN1* ChiefGeologist,GannettFleming,Inc.,CampHillPA
2277SagamoreDrive,StateCollege,PA16803
KeyTerms: ConcreteDams,FoundationDrains, Discontinuities,OptimumDrillingDirection,Uplift,Design
Designoffoundationdrainholesinbedrockwhere fracturescontrolthepermeabilitymaybeoptimized basedonthediscontinuitypattern,speci fi callythe spacingandorientationofthepredominantdiscontinuitysets.Whensuitablerepresentativeoutcropsare available,eithernaturallyorbymeansofexcavation, jointspacingandorientationcanbemeasureddirectly bytraditionalmethodsusingameasuringtapeand compassorpockettransitornewermethodsusing computersoftwaretomeasurevirtualjointsurfaces withinadigitalterrainmodeldevelopedfromdigital photogrammetryorlightdetectionandranging(LiDAR) surveys.Whensuitableoutcropsarenotavailable, jointspacingandorientationcanbemeasuredusing orientedcoredrillingtechniquesordownholeimaging tools(e.g.,opticalandacousticsondes)thatprovide digitalimagesoftheboreholewall.Withanunderstandingofthebedrockjointingpatternobtained fromoneormoreoftheabovemethods,thetotal apparentspacing(TAS)approachcanbeusedto optimizetheorientationofdrainholes.TheTAS approachemploysthevectordotproductformula tominimizethetotalapparentspacingbetween discontinuitiesandmaximizethenumberofdiscontinuitiesinterceptedbythedrainhole.TheTAS approachwasusedtooptimizetheorientationof foundationdrainholesduringrehab ilitationofthe GilboaDaminSchoharieCounty,NY.TheTAS approachhasotherapplications,e.g.,optimizing theorientationofexploratorycoreholestocollect discontinuitydataortheorientationofgroutholes forfoundationgrouting.
1Retired;presentaddress:1080StateParkRd,Newport,PA17074
2Previouslyat:U.S.ArmyCorpsofEngineersHeadquarters,Washington, DC,SeniorCivilEngineer(retired)
*Correspondingauthoremail: bill.roman.bretz@gmail.com

Upliftpressureiscriticaltoboththeslidingandoverturningstabilityofconcretedamsf oundeddirectlyonrock. Theupliftpressurebeneathsuchadamisafunctionofthe hydraulicgradient,whichisassumedtovarylinearlyfrom headwaterattheheelofthedamtozeroortailwateratthe toeofthedam(Figure1a),assumingahomogeneousand isotropicconditionwherehydraulicconductivitydoesnot changesignificantlyoverthedamsite,whichisnotoften thecaseintherealworld.Inthecasewherehydraulicconductivitydoeschange,therelationshipbetweenupliftpressureandheadwaterandtailwaterpressureisnon-linear. StudiesdonebyGrenobleetal.(1995)showedthatrising reservoirlevelscandifferentiallydeformdiscontinuities inthefoundationandcausethehydraulicconductivityto increaseattheheelofthedamanddecreaseatthetoe (taperedjoint).Anon-linearresponsemayproducean upliftpressuredistributionthatis greater thantheconventionallinearassumptionforuplift(EbelingandPace, 1996a).Non-linearresponsesofupliftpressurestoreservoirlevelhavebeenanalyticallymodeled(Ebelingand Pace,1996b)andphysicallyobservedinseveraldams (StoneandWebsterEngineeringCorporation,1992).The expansionandcontractionofdownstreamfacesdueto seasonalambienttemperaturechangesmaycausegreater changesinupliftpressurethanchangesinheadwaterlevels (StoneandWebsterEngineeringCorporation,1992).
Installationofdrainsbeneaththedamcanalterthe hydraulicgradientandhelptoreducetheupliftpressure (Figure1b).Drainsareconsideredtobethemostreliable andcost-effectivewayofreducingfoundationupliftpressures,especiallyforstructuresfoundedonrock(USACE, 2005).Theeffectivenessofthedrainagesystemdepends onthedepth,size,andspacingofthedrains;thecharacter ofthefoundation;andthefacilitywithwhichthedrainscan bemaintained.
Thehydraulicconductivityofajointedrockmassiscommonlycontrolledbyitssecondarypermeability,soinmany civilengineeringapplications,bedrockdiscontinuitiesdominatethedraindesignprocedures.Assumingotherdiscontinuitycharacteristicssuchasaperture,length,and fillingare relativelyuniform,foundationdrainholesdrilledatthe

Figure1.Schematicsshowingtheoreticalupliftdistributionbeneathaconcretedam(A)havingnodrainsand(B)withfoundationdrains.Modified fromU.S.ArmyCorpsofEngineers(2005,FigureC-4).
optimumorientationandinclinationwithrespecttothe orientationandspacingofthepredominantdiscontinuities shouldrelieveupliftpressuremostefficiently.However,it shouldbenotedthattheseverityofupliftpressuremaybe independentofdiscontinuityorientation(Grenobleand Amadei,1990)asdiscontinuityapertureand fillingmay controlupliftpressuresmorethandiscontinuityorientation (Murphyetal.,2002).
Whenotherdiscontinuityparametersarenotrelatively uniformandresultinananisotropicdistributionoffoundationhydrostaticpressures,optimizationofdrainhole orientationsbasedsolelyontheorientationandspacing ofthepredominantdiscontinuitiesisnotappropriate. Anisotropichydrostaticpressuresmayoccurinfoundations wheremultipleepisodesofstructuraldeformationdueto plateconvergenceorriftinghaveproduceddiscontinuity setshavingsignificantlyvaryingdiscontinuityparameters. Variationsinstressregimesmayaffectdiscontinuityaperture andlength,andpreferential flowof fluidsduringstructural deformationmayresultinprecipitationofmineralsthat completely fillcertaindiscontinuitysets.Drillingfoundationdrainholesattheoptimumorientationandinclination withrespecttotheorientationandspacingofthepredominantdiscontinuitiesisappropriateonlywhendiscontinuity parametersarerelativelyuniform,acasemorelikelyto existwithinbedrockfoundationsthathaveexperiencedonly minorstructuraldeformation.Sitereconnaissanceandsubsurfaceinvestigationshouldseektoidentifyandcharacterize thosediscontinuitiesthataffectthehydraulicpressuresin thefoundation,whichcouldincludelessprevalentdiscontinuitiesand,insomecases,evenonesinglediscontinuity.
Severalauthorshaveaddressedaspectsofdrainhole design.Cooketal.(2007)discussedthestateoftheart andpresentedsuggestionsforimprovementinthedesign
oflandslidehorizontaldrains.Twoapproachesforoptimizing boreholeorientationhavebeenpresentedin Environmental& EngineeringGeoscience.ZhouandMaerz(2002)developed anapproachto findtheoptimumdrillingdirectionformaximizingaborehole’sinterceptionofdiscontinuitysets.The basicconceptinvolves findingadrillingdirectionthatminimizesthelinearsamplingbiasindex(LSBI),whichisa functionoftherelativeanglebetweentheorientationofthe boreholeandthemeanorientationofthepolesofeachof thediscontinuitysets.Theoptimumdrillingdirectionisthe directionalongwhichtheLSBIisminimized.Haneberg (2009)observedthatwhiletheLSBIminimizationapproach producescorrectresults,itsuffersfrommultipleshortcomingsthatinhibititsutility.Haneberg(2009)presentedan approachthatbuildsupontheapproachtakenbyZhouand Maerz(2002)byincorporatingchangestomakeitpotentiallymoreusefulandgeometricallymeaningful.Haneberg (2009)describedthisapproachtooptimizeaborehole’s orientationbyminimizingthelinearsamplingangular deviationandprovidedexamplesproducedusingaseries offunctionswrittenforthecomputerprogramMathematica (Haneberg,2004).
Thispaperdescribeshowthetotalapparentspacing (TAS)approachoptimizesdrainholeorientationusinga minimizationprocessbasedondiscontinuityspacingand orientation.TheTASapproachseekstominimizethetotal apparentspacingofdiscontinuitiesalongthedrainhole andtomaximizethenumberofdiscontinuitiesencountered bythedrainhole.Beyondthefoundationdrainholeorientationexampleprovidedherein,useoftheTASapproach tostrategicallyorientadrillholesoastointersectthemaximumnumberofdiscontinuitiesalongthedrillholefora givendrillinglengthmaybeusefulforotherpurposeswithin
therealmsofgeotechnicalexploration,rockengineering,and foundationtreatment.
Fracturesoccurinresponsetostressesthatexceedthe strengthoftherocktoresisttheresultingforce.Fractureproducingstressesmaybetensile,compressive,shear,ora combinationofstresstypes.Stressesmayvaryinstrength andorientationovertimeandspace,sofracturesmayoccur inmultiplesetshavingvaryingorientationsandcharacteristicswithinaregion.Onceformed,fracturescanbemodifiedasaresultoftectonicandthermalstressandstrain, changesin fluidpressure,andphysical,chemical,andbiologicalprocessessuchaserosionandvalleystressrelief, dissolutionorprecipitationofminerals,anddegradationby roots(NASEM,2020).
Planarbedrockdiscontinuities,whichmaynotnecessarily be fl at,oftenoccurinsetsofdiscontinuitieshaving semi-parallelorientationsorfallingwithinarangeof similarorientations.Horizontaltogentlydippingsedimentaryrockswithlimitedtectonicstressesoftenfeaturetwo nearlyorthogonaljointsetsthatarebothroughlyperpendiculartoasetofbeddingjointsdevelopedalongbedding planes.Onejointsetiscomposedof “strikejoints,” which generallystrikeinaboutthesamedirectionasbedding strike,whiletheothersetiscomposedof “ dipjoints, ” whichgenerallystrikeroughlyparalleltothebeddingdip direction.Additionaldiscontinuitysetsareoftenpresentin sedimentaryrockssubjectedtohighertectonicorother externalstresses.Asimilarblockyjointingpatternmay occurinigneousrockshaving flowbanding. “Flat-lying joints” areapproximatelyhorizontalandstrikeparallel tothe flowlinesindicatedbythepreferredorientationofthe longaxesoftherockcrystals.Asecondjointsetiscomposedof “Qjoints” or “crossjoints” thatstrikenearlyperpendiculartothe flowlines.Athirdsetiscomposedof “S joints” or “longitudinaljoints” thatdipsteeplyandstrike paralleltothe flowlines(KrynineandJudd,1957).Inigneousrockmasseslacking flowbanding,localandregional stressandstraindistributionstendtodefinethefracture pattern. “Tensilejoints” formgenerallyparalleltothemaximumstresstrajectory,and “shearjoints” formatanangle ofroughly20to35degreestothemaximumstresstrajectory (NASEM,2020).
Thepatternofdiscontinuitieswithinarockmass,specificallythetypicalorientationandspacingofdiscontinuities, mustbedeterminedinordertousetheTASapproach.The orientationofrelativelyplanardiscontinuitiescanbe expressedbyanazimuth(eitherstrikeordipdirection)and
adipangle.Discontinuityspacingandorientationdatacan becollectedusingoneormoreofseveralavailablesurvey methods.Properlyconductedsurveyscanfurnishdatawitha highprobabilityofaccuratelyrepresentingthetypicalorientationandspacingofthediscontinuitieswithinarockmass. Whensuitablerepresentativeoutcropsareavailable, eithernaturallyorbymeansofexcavation,discontinuity spacingandorientationcanbemeasureddirectlybytraditionalmethods(e.g.,linearscanlineorwindowsampling) usingoneormoretoolssuchasameasuringtapeanda compass,pockettransit,smartphone,ortablet.Corrections forobservationbiashavebeendevelopedforscan-line sampling(Terzaghi,1965)andforboreholesampling, whichmaybeconsideredasasubsurfacescanline(Mauldon andMauldon,1997).Observationalbiasmayberemoved byorientingscanlinesperpendiculartooneanother andbyrecordingthetracelength,orientation,andpoint ofintersectionofeverydiscontinuityalongthescanlines (LaPointeandHudson,1985).Forwindowsampling,the windowshouldbeaslargeaspossibletominimizesampling bias.Ideally,atleasttwowindowsofsimilarsizeshouldbe establishedonadjacentrockexposureshavingdifferent (preferablyorthogonal)orientations(Priest,1993).Window samplingreducestheobservationbiasduetothediscontinuityorientationandlengthassociatedwithscan-linesampling; however,biasmayremainasaresultofcurtailmentofthe discontinuitiesduetooutcropcover.
Newermethodsusecomputersoftwaretomeasurevirtual discontinuitysurfaceswithinadigitalterrainmodelofthe rockoutcropdevelopedbymeansofdigitalphotogrammetryorlightdetectionandranging(LiDAR)surveys (Hanebergetal.,2006;TononandKottenstette,2007; Haneberg,2008;KemenyandTurner,2008;KottenstetteandShaffner,2008;Shaffneretal.,2009;Kemeny etal.,2011;andWatts,2011).UsingbothdigitalphotogrammetryandLiDARimagingmaybeusefulinsome circumstances(Otooetal.,2011).Althoughusefulfor measuringlocationsandorientationsofdiscontinuities, photogrammetrymaynotprovidecriticalgeologicalinformationthatcanbegleanedonlybyhumanexaminationof thediscontinuities(GatesandHaneberg,2012;Battulwar etal.,2021).Traditional fieldcharacterizationandinput fromexperiencedprofessionalsmayenhancethereliability oflaserscanning(Farny,2017).
Whensuitableoutcropsarenotavailable,discontinuity spacingandorientationcanbemeasuredusingoriented coredrillingtechniquesordownholeimagingtools(e.g., opticalandacousticsondes)thatprovidedigitalimagesof theboreholewall.Providedboreholeinstabilitydoesnot precludetheuseandretrievaloftheimagingsonde,boreholeimagingservesasapowerfultoolformeasuringfractureorientationsandspacings,bettercharacterizingzonesof brokencore,andunravelingthemysteriesofcorelosses.
Thesurveymethodsusedshouldprovideanunderstandingofthevariabilityinorientationsanddipangles ofthediscontinuities.Thisunderstandingisveryimportant inultimatelyselectingthetypicaldiscontinuityorientation anddipangle.Largervariabilityinthedatawillmakethe selectionofthetypicaldiscontinuityparametersevenmore important.Moreover,discontinuitydatashouldbecollected asclosetothesiteaspossible.Discontinuitydatafroman off-sitelocationshouldbecomparedtoavailableinformationfromthesitetodetermineitsapplicability.
TheTASapproachforidentifyingtheoptimumfoundationdrainholeorientationisbasedonthefollowing generalassumptions:
1.Jointingistheprimarypathwayofwater flowandpressurethroughtherockmassformingthedamfoundation.
2.Surveysareproperlyconductedandaccuratelyrepresent thetypicaldiscontinuityspacingandorientationofthe predominantdiscontinuitysetswithinthedamfoundation.
3.Thespacingbetweenindividualdiscontinuitieswithin asetisgenerallyuniformthroughoutthedamfoundation; consequently,theaveragediscontinuityspacingofeach setcanbeused.
4.Theorientationsofdiscontinuitieswithinasetare generallyuniformthroughoutthedamfoundation;consequently,theaveragediscontinuityorientationofeach setcanbeused.
5.Thediscontinuitysetsarepersistentthroughoutthedam foundation.
6.Adrainholedirectiontrendingparalleltotheplane representingtheaverageorientationofadiscontinuity sethasaninfiniteapparentspacingandisexcludedas anoptimumfoundationdrainholedirection.
7.Thediscontinuitysetsarerelativelyuniforminaperture, length,and filling.TheTASapproachmaybemodified byaddingweightingfactorswhenthisisnotthecase.
Ifdiscontinuityspacing,orientation,andpersistence aresignificantlynon-uniform,thenconsiderationshould begiventosubdividingthefoundationintoregionsor areasofsimilardiscontinuitypropertiesandperforming separateevaluations.
Foradrainholetodrainwatermosteffectivelyfroma jointedrockmass,thedrainholemustbeorientedsothat itinterceptsthediscontinuitynetworkmostfrequently; i.e.,thehighestnumberofdiscontinuitiesisintercepted perunitlengthofdrillhole.Sincethediscontinuitynetwork
consistsofacertainnumberofpredominantdiscontinuity sets,adrainholewillintercepteachpredominantdiscontinuitysetofthediscontinuitynetworkatacertainaverage distancealongthelengthofthedrainhole.Optimizingthe drainholeorientationthusrequiresaminimizationofthe averagedistancesbetweenjointsetsinterceptedbythe drainhole.Thedotproductformulaprovidesameansto accomplishthisminimization.
Thedesignatedpredominantdiscontinuitysetsshouldbe thosethatsignificantlycontributetopressureinthefoundationofthestructure.Whenthecharacterizationoffoundationconditionsdeterminesthatmultiplediscontinuitysets contributetopressureinthefoundation,butthattheircontributionsvarysignificantly,considerationshouldbegiven toassigningweightingfactorstothepredominantdiscontinuitysetsortosubdividingthefoundationintoregions orareasofsimilardiscontinuitypropertiesandperforming separateevaluations.
Althoughdiscussedintermsof “joints” and “jointsets,” theformulasbelowareapplicabletothebroadercategory ofstructuralbreaksencompassedbytheterms “discontinuity” and “discontinuitysets.”
Thedotproduct(orscalarproduct)oftwothreedimensionalCartesianvectors
a ¼ðax ; ay ; az Þ and b ¼ðbx ; by ; bz Þ isdefinedas:
a
Itcanbeproven(Stewart,2003,p.844)thatEq.1 isequivalentto
where ja j a and jb * j b denotethemagnitudesofvectors a and b * ,and h istheanglebetween a and b * .
Let n * bethenormalvector(pole)ofaplane P thatrepresentstheaveragejointorientationinajointset.Letthe magnitudeof n * (denoted jn * j n)representtheorthogonal (true)averagespacingofthejointswithintheset.Let r beanarbitraryvectorrepresentingtheproposeddrain holeorientationstartingattheoriginandconnectingthe origintoanarbitrarypointonplane P.Themagnitudeof r * (denoted jr j r )representstheapparentaveragespacing ofthejointswithinthesetalongthedrainhole(Figure2).
Let r 0 beavectorwithinplane P connectingthetip of n withthetipof r asshowninFigure2.Vector r 0 is thusequaltothedifferenceof r * and n * :

Figure2.Schematicdrawingillustratingthevectorrepresentingthe poletothejointset(n ),thevectorrepresentingtheproposeddrain holeorientation( r !),andthevectorconnectingthem(r 0 )withinthe planerepresentingtheaveragejointorientation(P).
r 0 ¼ r n ; (3) or,equivalently, r isequaltothesumof n and r 0 :
r ¼ n þ r 0 (4)
Replacing a and b ! with r 0 and n inEq.2showsthat thedotproductofthesevectorsiszerosince r * 0 ? n * , andthereforetheincludedangleisarightangle:
r 0 n ¼jr 0 jjn jcosh
¼ r0 ncos90
¼ 0: (5)
Takingthedotproductof r * and n * andsubstitutinginthe equalitiesofEq.3andEq.4,usingthedistributiveproperty ofthedotproduct,andknowingthat r 0 n ¼ 0,yields:
r n ¼ðn þ r 0 Þ n
¼ðn þðr n ÞÞ n
¼ n n þðr n Þ n
¼ n 2 þ r 0 n
¼ n 2 þ 0
¼ n 2 (6)
Usingtheconventionalunitvectornotationof
^ a ¼ a =ja j¼ a=a,thedotproductof r * and n * canalso bewrittenas:
r n ¼ðr ^ r Þðn ^ n Þ
¼ rn ^ r ^ n (7)
Settingthetwosolvedequalitiesforthedotproduct of r and n equaltoeachotheryields:
rn ^ r ^ n ¼ n 2 (8)
Becausethedotproductoftwovectorsisascalar,Eq. 8canbedividedby n ^ r ^ n :
r ¼ n= ^ r ^ n ðÞ (9)
Let ^ n 1 representtheaveragepoletoJointSet1and ^ r representtheproposeddrainholeorientation.Insphericalcoordinates,theunitvectorsare ^ n 1 ¼ð1; h1 ; u1 Þ and ^ r ¼ð1; h; uÞ.ConvertingtoCartesiancoordinatesproduces ^ n 1 ¼ðsinu1 cosh1 ;
and
UsingEq.1totakethedotproductofvectors ^ n 1 and ^ r yields:
Substitutingtheproductofvectors ^ n 1 and ^ r intoEq. 9anddefiningthisquantityas d1 yields:
Hence, d1 istheapparentjointspacingforJointSet1 whendrillingwithazimuth h andplunge u.
Equation11approximatestheapparentspacingofdiscontinuitiesbelongingtoJointSet1alongatheoreticaldrain hole.Similarequationscanbewrittentosolvefortheapparentspacingofotherrecognizedjointsetsalongatheoretical drainhole.Thetotalapparentspacingapproachminimizes thesumoftheapparentspacingsofallselectedjointsets alongatheoreticaldrainhole,whichisgivenby:
Xwhere k ¼ numberofselectedjointsets, ni ¼ truejointspacingofthe ithjointset, ui ¼ jointdipangleofthe ithjointset, hi ¼ jointdipdirectionofthe ithjointset, u ¼ drainholeinclination,and h ¼ drainholeazimuth.
Itshouldbenotedthattheangularmeasurements inEq.12referencesphericalcoordinatesasusedin
mathematics,so h and hi refertotheangularmeasurementfromthe x axisinacounterclockwisedirection withinthe X- Y plane(witheast ¼ 0degrees),and u and ui refertotheangularmeasurementfromthe z axis (withzerodegreesrepresentingverticallyupwardand 180degreesrepresentingverticallydownward).Ifjoint dipdirectionanddrainholeazimutharemeasuredincompassbearings(0to360degreeswithnorth ¼ 0degrees), thenthecompassbearingshouldbesubtractedfrom90 degreestoconvertto h and hi .Ifjointdipangleanddrain holeinclinationaremeasuredfromthehorizontalplane (with90degreesrepresentingverticallyupwardand 90 degreesrepresentingverticallydownward),thentheangle shouldbesubtractedfrom90degreestoconvertto u and ui .
Equation12providesaformulatominimizethesum oftheapparentspacingsofallselectedjointsetsalongatheoreticaldrainhole,whichisthepurposeoftheTAS approach.ApplicationoftheTASapproachwilltypically involvethefollowingactivities:
1.Performtheresearchandsiteinvestigationsneededto characterizethediscontinuitieswithintherockmass formingthedamfoundationandtogroupthediscontinuitiesintosets.
2.Identifythediscontinuitiesorsetsofdiscontinuities thatsignificantlyinfluenceuplift.
3.AssesstheTASapproachassumptionstodetermine whethertheTASapproachisapplicable.
4.IfthevariationintheparametersoftheselecteddiscontinuitysetsindicatestheTASapproachisnotapplicable, thenconsidersubdividingthefoundationintozonesfor separateevaluationsand/orassigningweightingfactors totheselecteddiscontinuitysets.
5.Determinethebest-fitorientationsoftheselecteddiscontinuitysets.
6.Determinetherangeoffavorabledrainholeorientations.
7.Foreachpossiblefavorabledrainholeorientation,use Eq.11tocalculatetheapparentspacingofeachjoint setandsumtheapparentjointspacingsalongthe drainholeperEq.12.Acomputerspreadsheetwill facilitatethesecalculations.
8.Usethecalculatedresultstoidentifytheoptimumdrain holeorientation.
ThelevelofeffortdevotedtoapplyingtheTASapproach shouldbecommensuratewiththerelativeimportanceofthe draindesignintheoveralldamdesignorstabilityanalysis. Forexample,ifreductioninupliftpressurebyfoundation drainsisnotbeingfactoredintothestabilityanalysis (aconservativeapproach),thenalessrigorousapplication oftheTASapproachmaybewarranted.Rehabilitationof GilboaDamprovidesanexampleoftheapplicationofthe TASapproach.

Figure3.TopographicmapshowinglocationofGilboaDaminSchoharie County,NY.
DuringtherehabilitationofGilboaDaminNewYork State,theTASapproachwasusedtooptimizedrainhole orientation.
GilboaDamislocatedintheCatskillMountainsin southernSchoharieCounty,NY(Figure3).Thedamis situatedapproximately125mi(200km)north-northwest ofManhattanand37mi(60km)southwestofAlbany, NY.GilboaDamimpoundsSchoharieReservoir,which isoperatedbytheNewYorkCityDepartmentofEnvironmentalProtection,andwhichisakeycomponentof thecity’swatersupplysystem.SchoharieReservoirhas anormalstoragevolumeofapproximately20.8billion gallons(7.88 3 107 m3)andcovers1,159acres(469hectares)atnormalpool.Thereservoirhasawatershedarea ofapproximately314mi2 (813km2).
TheeasternportionofGilboaDamconsistsofa160-fthigh(48.8m),1,324-ft-long(404m)concretespillway foundedonrockandhavingacrestelevationof1,130ft (344.4m).Duetothepresenceofadeep,pre-glacialchannel

(CS),earthembankment(EE),anddownstreamretainingwall(RW).
inthebedrock,thewesternportionofGilboaDamconsistsof a180-ft-high(54.9m),700-ft-long(213m)earthembankmentwithacrestelevationof1,150ft(351.5m).Aretaining wallextendsdownstreamfromthejunctionoftheconcrete spillwayandearthembankment(Figure4).
ConstructionofGilboaDambeganin1919andwas completedin1927.AmajorrehabilitationofGilboaDam beganin2006andwascompletedin2014.Therehabilitation includedinstallationof80post-tensionedrockanchorsinthe spillway,placementof57,000yd3 (43,580m3)ofconcrete buttressonthedownstreamsideoftheconcretedam,a newreinforcedconcretelininginthespillwaychanneland plungepool,installationofanew9-ft-diameter(2.7m) low-leveloutlet,andadditionofagallerywithfoundation drains.In2015,theprojectwasnamedtheAssociationof StateDamSafetyOfficialsNationalDamRehabilitation ProjectoftheYear.
BedrockinthevicinityofGilboaDamispartofthe Catskillclasticwedgeandconsistsgenerallyofthicksandstonebedsandthinnerbedsofsiltstone,shale,andmudstone,whicharelocallymappedastheMoscowFormation oftheHamiltonGroup(Fisheretal.,1961).Thesediments formingtheseMiddleDevonianrocksappeartohavebeen depositedwithinamigrating,deltaicshorezonebetween marinesedimentstothewestandnon-marine(fluvial)sedimentstotheeast(BridgeandWillis,1994;BridgeandJarvis,1998;andBridge,2000).Gilboaisthesiteofoneof theworld’soldestfossilforests,andduringtheoriginal constructionofGilboaDam,treestumpfossilsweresent toseveralmuseums(BartholomewandBrett,2003;Hernick,2003).Excavationofaformerquarrydownstreamof thedamduringthedamrehabilitationprovidedan opportunityforresearcherstoobserveandmapaportionofthe

fossilforest(Steinetal.,2012).Theareawasglaciated, andGlacialLakeGrandGorgeandGlacialLakeSchoharie occupiedtheSchoharieValleyduringtheWisconsinanstage (Rich,1935;Titus,2003).
CoreboringsatGilboaDampenetratedasandstonedominatedportionoftheMoscowFormation.Bridgeand Willis(1994,pp.1441–1443)describedtheGilboaDam sectionastwo35-m-thicksandstone-dominatedsequences separatedbya5-mr-thickmudstone-richintervalwithsedimentsofthetwosandstonebodiesshowingmainlywave andtidalcurrentinfluencelowerdownandoffshore-directed currentinfluencehigherup,whichreflectsdepositionin waterbecomingincreasinglyshallowandclosertoland. Inadditiontosandstone,damrehabilitationcoreborings encounteredminorbedsofcalcareoussiltstone,shale,and mudstone,someofwhicharevisibleinoutcropsbelowthe dam(Figures5,6,and7).Analysesofseveral finer-grained markerbedsusingthethree-pointmethodindicatedthe overallbedrockstrikeisN80°W,andtheoveralldipis 1.5degreestothesouth-southwest.
RockoutcropsalongSchoharieCreekbelowGilboa Damwereexaminedaspartofthereconnaissanceeffort forthedamrehabilitation.Duringadetailedlinesurvey consistingof fivetraverses,theorientationsof45discontinuitiesweremeasured,andnotesweretakenontheirproperties(e.g.,length,continuity,roughness,infilling,thickness, waviness,andmoisture).Discontinuityorientationdata aresummarizedinTables1,2,and3.Littlevariationwas observedindiscontinuityproperties,asmightbeexpected inrelatively flat-lyingbedshavingonlyminordeformation duetoplateconvergenceduringtheAlleghenianorogeny,

sodiscontinuitysetswerenotweighted,andthedamsite wasnotsubdividedintozonesduringthefoundationdrain designprocess.
Mostmeasureddiscontinuitysurfaceswerevertical, andallbutonehadadipof75degreesormore.Thegreat circlesandpolescorrespondingtothe44steeplydipping measurementsareplottedinastereonetinFigure8.RocscienceDipssoftwarewasusedtodeterminetheglobal best-fitorientationsofthethreeidentifiedjointsets,which

Table1. JointSet1measurements.* TraverseJoint
ID Trend (°) Distance (ft)No. Strike Direction(°) Dip
Dip Direction(°) A2255105290 2259206990 20519504290 19022604590 19028805090 18535904790 B20051105086140 190201503688306 190201604590 190251805090 190331904787137 190412001790 190512104275312 C19032403290 16762502490 167102703290 167182803090 D15353004990 153123204790 153193403690 153233504390 153263603786307 E19783804690 197174105488324 197314304590 197364505590
Mean04389
Median04590
Best-fitplane04389313
Best-fitpole(plunge/trend) 1133
*Trendsanddirectionsareexpressedincompasscoordinates. 5ft ¼ 1.5m.
expressedintermsofstrikeanddipareN43°E/89°NW, N75°W/88°NE,andN5°W/89°SW.Thethreejointsets wereobservedonboththeeastandwestsidesoftheSchoharieCreekgorgebelowthedam(Figures9and10).The threeidentifiedjointsetsappeartobeofregionalsignificance,astheybearsimilaritiestojointsystemsdepictedin theGilboaandSchoharie15-minutequadrangles(Isachsen andMcKendree,1977a)andtobrittlestructuresdelineated intheGilboa15-minutequadrangle(IsachsenandMcKendree,1977b).Thenortherlystrikeofthethirdjointsetis paralleltotheoveralltrendofSchoharieCreekthroughthe gorgecontainingtheSchoharieReservoirandGilboaBlenheimReservoir,apowersupplyreservoirlocateddownstreamofGilboaDam.
Measurementstakenduringthedetailedlinesurvey providedanapparentspacingofjointsalongeachtraverse. Thetruespacingbetweenjointscanbecalculatedby rewritingEq.11asfollows:
Table2. JointSet2measurements.*
TraverseJoint
ID Trend (°) Distance (ft)No. Strike Direction(°) Dip Angle(°)
B20001029790
190161229085020
190161327987009
190171428383013
190221727584185
190472229187201
C19002328684016 16782628686016
D15322928390 153113128584015 153153328482014
E197103928285192 197164028788017 197354428790
Mean28586
Median28686
Best-fitplane28588015
Best-fitpole(plunge/trend) 2195
*Trendsanddirectionsareexpressedincompasscoordinates. 5ft ¼ 1.5m.
nn ¼ dn ðsinun coshn sinu cosh þ sinun sinhn sinu sinh þ cosun cosuÞ; (13)
wherenn ¼ thetruejointspacingofjointset n, dn ¼ theapparentjointspacingofjointset n, un ¼ theplungeofthepoletojointset n, hn ¼ thetrendofthepoletojointset n, u ¼ theplungeofthetraverse,and h ¼ thetrendofthetraverse.
First,anaverageapparentjointspacingwascalculated foreachjointsetforeachtraversehavingatleasttwomeasurementsforthejointset(Table4).Thetraversetrend wasdeterminedfrom fieldmeasurementwithaBrunton compass.Incaseswherethetraversetrendwasnotconstant, aweightedaveragetrendwascalculatedbasedonthe
Table3. JointSet3measurements.*
TraverseJoint
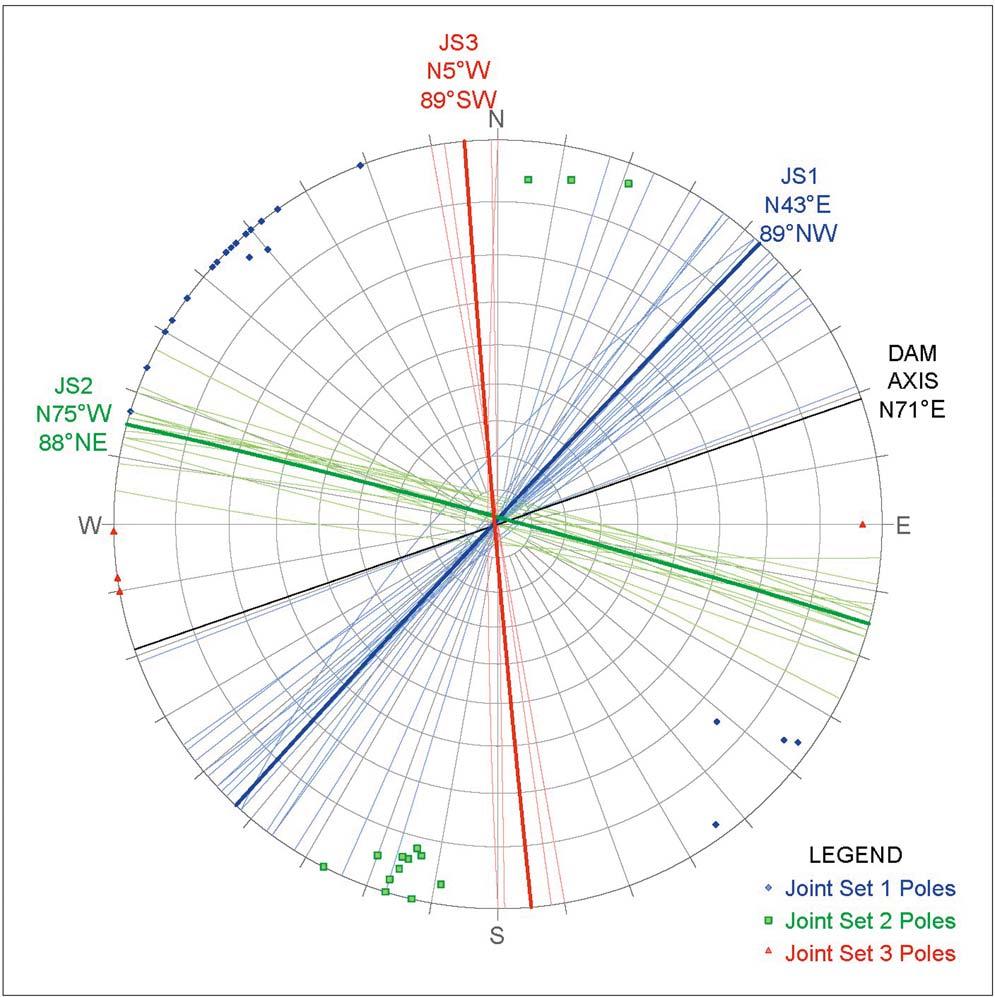
Figure8.Stereonetplotoftheplanesandpolescorrespondingtothe jointmeasurementsandthebest-fitorientationforeachset.
lengthsofeachtraversesegment.Next,theaveragetrue jointspacingwascalculated,andthenaweightedaverage wascalculatedforeachjointsetbasedonthelengthsof thetraverses.Theweightedcalculatedaveragetruejoint spacingforJointSets1,2,and3was3.7ft(1.1m),9.4ft (2.9m),and6.8ft(2.1m),respectively.
Orientation
Basedontheprincipalcomponentandaveragejoint spacingofeachjointset,thederivedequationswereused tocalculatetheapparentspacingbetweenjointsofeachset

*Trendsanddirectionsareexpressedincompasscoordinates. 5ft ¼ 1.5m.
gorge.

fordrainholestrendinginanupstreamdirectionand plungingfrom45to70degreesfromhorizontal.AnExcel spreadsheetwasusedtoperformthecalculationsin 1-degreeincrementsofazimuthandplunge,so4,706 possibledrainholeorientationswereevaluated.Apartial plotoftheresultsindicatesthattheshallowestplunge (45degrees)isthemostfavorableoftheholeinclinations considered(Figure11).
Themostfavorableazimuthsareclusteredaround142, 249,71,and203degrees,inthatorder.Holeshavingthese azimuthsandplunging45degreesareranked1st,15th,77th, and203rdwhentheresultsaresortedbytotalapparent spacing,i.e.,thecombinedapparentspacingofeachjoint setwithintheproposeddrainhole.Thecalculationsindicateadrainholetrending142degreeshastheoptimum totalapparentjointspacingandwillinterceptjointsbelongingtoJointSets1,2,and3every5.2ft(1.6m),20.9ft (6.4m),and17.1ft(5.2m),respectively,onaverage (Figure12).
Aspartofapeerreviewoftheproposedfoundation draindesign,includingthefavorabledrainorientations identifiedusingtheTASapproach,analternateanalysis wasperformedusingtheLSBIapproachofZhouandMaerz (2002).UsingtheLSBIapproach,themostfavorabledrain holeazimuthswerefoundtobeclusteredaround140,74, 251,and199degrees,inthatorder(Figure13).Table5 providesacomparisonoftheresultsforfavorabledrain holeazimuthsusingthetwoapproaches.
Tooptimizeboreholeinclination,theLSBIapproach calculatestheLSBIbasedontheanglebetweentheboreholeinclinationandtheaveragedipsofthejointsetsprojectedontoaverticaleast-westplane(0to180degrees). Drainholesinclined45to90degreesfallintherangeof inclinationsfrom45to135degrees.SimilartotheTAS approach,theLSBIapproachindicatesthatshallowerinclinationsaremorefavorable(Figure14),whichintuitively makessensegiventhenear-verticalaverageorientationsof thethreejointsets.BoththeTASandLSBIapproachesare thoughttobecomputationallysimilarintheapplicationof therespectiveapproachandproducecomparableresults. TheTASapproachusesaformulathatfactorsinbothboreholeazimuthandinclinationtocalculatethetotalapparent spacingalongtheborehole,whiletheLSBIapproachcalculatesaseparateLSBIfortheboreholeazimuthandfor theboreholeinclination.
Foragivendrainholeorientation,drainholelength influencesthereductionoftheupliftpressuresthemost, followedbydrainholespacinganddrainholediameter,in thatorder(daSilva,2005).Drainholelengthhasalarge influenceonthevaluesoftheupliftpressuresupto approximatelyhalfthevalueoftheupstreamreservoir depth.Fromthispointonwards,theinfluenceofthedrain holelengthdecreasesuptoavalueequaltothereservoir
B258.0904677.74.0 C279.9901545.04.0 D297.0902155.35.0 E253.0902849.34.1 225592B257.0904769.49.49.4 C268.690828.07.8 D297.0901336.54.8 E253.09025312.512.5 3591A260.090929.02.36.8 E253.09023223.08.6
¼ 1.5m.

Figure11.PlotoftotalapparentspacingofJointSets1,2,and3fordrainholestrendingfrom071to251degreesandinclinedfrom45to70 degrees.
depth.Afterthat,itsinfluenceisverysmall(daSilva,2005). Currentdesignstandardssuggestthatfoundationdrains shouldbeinstalledtoaverticaldepthoftwo-thirdstothreequartersofthedepthoftheexistinggroutcurtain(USACE, 1995).Thedepthofthefoundationdrainsshouldnever exceedthedepthofthegroutcurtain(ASCEandUSCOLD, 1967).Geologicsetting,engineeringparameters,andoperationalandperformanceobjectivesalsoneedtobeconsidered inevaluatingthedesigndepthofthedrainholes.
AtGilboaDam,the finaldrainholedesignconsisted oftworows(AandB)ofdrainholes.RowAdrainholes weredrilledS38°Eatanangleof45degreesfromverticaland27ft(8.2m)intorock.RowBdrainholeswere drilledvertically10ft(3m)intorock.Giventhecalculatedapparentjointspacings,eachangledRowAdrain holewouldbeexpectedtointerceptatleast five,and possiblysix,jointsbelongingtoJointSet1andatleast one,andpossiblytwo,jointsbelongingtoJointSets2 and3(Figure12).TheverticalRowBdrainholeswould beexpectedtointerceptmainlybeddingjointsdipping 1.5degreestothesouth-southwest.
Thedrainholespacingwillbecontrolledbythe apparentspacingofjointsetsalongthedrainhole,which hasalreadybeendetermined,andtheapparentspacingof jointsetsalongthegallerywherethedrainholesareto
bedrilled.Inordertoavoidgapsbetweendrainholes,the drainholespacingshouldnotexceedtheapparentjoint spacingalongthegalleryofeachjointsetmultipliedby thenumberofjointsbelongingtothejointsettheoreticallypenetratedbythedrainhole.
Theapparentjointspacingofeachjointsetalongthe gallery(dn)canbecalculatedbymodifyingEq.11to considertheazimuthandplungeofthegalleryinsteadof theazimuthandplungeofthedrainhole:
where nn ¼ truejointspacingofjointset n, un ¼ jointdipangleofjointset n, hn ¼ jointdipdirectionofjointset n, u ¼ galleryinclination,and h ¼ galleryazimuth.
Thenumberofjointstheoreticallypenetratedbyeach drainhole(Nj)isgivenby:
where L ¼ lengthofthedrainhole,and dn ¼ apparentspacingofjointset n alongthedrainhole. Thus,themaximumspacingofdrainholesalongthe gallery(Dmax)foraparticularjointsetisgivenby:

Figure12.Schematicplanviewsalongdrainholepathshowingcalculatedaverageapparentspacingofdiscontinuitiesof(a)JointSet1, (b)JointSet2,and(c)JointSet3.
calculationsassumingadrainholelengthof27ft.For JointSets1,2,and3,themaximumdrainholespacings are38.5,22.9,and11.0ft,respectively.JointSet3controlsthemaximumdrainholespacingsincethestrikeof JointSet3hasthesmallestangulardeviationfromthe drainholeorientation.
Drainspacingmustaccountfordeteriorationoffoundation drainsovertimeduetoclogging,incrustation,mineralization, etc.,aswellasconsiderationofnon-linearupliftdistribution. Majorhydraulicstructuresmustbedesignedwithbothresiliencyandredundancy,andareliableandrobustfoundation drainagesystemisoneofthemostimportantaspectsofmaintainingastabledam.Adrainspacingof10ft(3m)was selectedfortheRowAdrainholes.Theabovecalculation doesnotapplytoRowBdrainholessincetheyweredrilled vertically.Aspacingof10ft(3.0m)wasalsoselectedfor theRowBdrainholes.
Nominal3-in.-diameter(7.6cm)drainholesweretypically drilledwithpercussiverotarymethodsusingwater flushata spacingof10ft(3m)(Figure15).Whereexploratoryholes wererequired,NQwirelinedouble-tuberockcoringwas specified.Ateachdrillinglocation,oneholewasdrilledS38° Eatanangleof45degreesfromverticaland27ft(8.2m) intorock,andasecondholewasdrilledvertically10ft(3m) intorock.Intotal,248drainholesweredrilledat124drilling locations.Thedrainholesweredrilledpriortothecreationof thedamgalleryduringconstructionofthedownstreamconcretebuttress(Figures16and17).
Upliftwasconsideredinthedesignofthesitestructures atGilboaDam.Thespillway,spillwaychannel,plunge poolconcretepanels,andretaining/trainingwallswere designedassumingfulluplift.Upliftoftheconcreteslabs inthespillwaychannelandplungepoolwasaddressed usingpassiveanchorbarsgroutedintobedrock.Although thegalleryfoundationdrainsinthespillwayandthe underdrainsystemwithinthespillwaychannelandplunge poolwereincludedinthedesign,thedrainswerenot accountedforasanupliftreductionmethodsincethegalleryandspillwaychannelweredesignedtobebelowtailwaterelevationduring floodconditions.
AtGilboa,thegallerytrendsapproximately253degrees andplungesabout3degreesfromhorizontal.Table6 providesasummaryofthemaximumdrainholespacing
Fracturesdevelopinarockmassinresponsetostresses thatexceedthestrengthoftherocktoresisttheresulting forces.Discontinuitiestypicallyexhibitpreferredorientationsandoftenoccurassets,witheachsetconsistingof regularjointssub-paralleltoeachother.Ineachset,discontinuitiesusuallyhavethesamegeneralorientationand exhibitrelativelycommonphysicalcharacteristics.Rock massesmaycontainmultiplediscontinuitysets,andthree tofoursetsaretypicalofmanyrockmasses.

Figure13.PlotofLSBIforJointSets1,2,and3fordrainholeswithazimuthsfrom071to251degrees.
Upliftisoneoftheprimaryloadsthataffectthestabilityof aconcretedamfoundedonrock.Thehydraulicconductivity ofajointedrockmassiscommonlycontrolledbyitssecondarypermeability,andinmostcivilengineeringapplications involvingrockfoundations,thesecondarypermeabilitycontrolsthedraindesignprocedures.Drainsareusedtoreduce dangerousupliftpressurebeneathhydraulicstructuresand mustbecorrectlyplacedinthree-dimensionalspacetointersecthydraulicallysignificantdiscontinuitiesthatarecapable offracture flow.
Numerousmethods,suchasscan-lineoutcropsurveys andcoreholeimaging,canbeusedtosystematicallycollect thedatarequiredtocharacterizethejointingpatternofa rockmass.Properlyconductedsurveyscanprovidedata ontheorientation,spacing,andphysicalconditionofthe discontinuitysetswithinarockfoundationorrockslope. Thesedatacanprovidethe apriori knowledgeaboutthe
discontinuitystructureoftherockfoundationthatisneeded toeffectivelyutilizetheanalyticalapproachesdescribed herein.TheTASapproachcanbeusedtodefineanoptimum drillingdirection,thatis,thecorrectorientationandinclinationalongwhichaboreholecanbedrilledtointersectas manydiscontinuitiesaspossibleforagivendrillinglength. Thisanalyticaltoolhasadirectapplicationinthedesignof systematicdrainsinstalledinajointedrockfoundation.
AzimuthTAS(ft)AzimuthLSBI 14243.21404.49 24944.02514.95 7145.9744.90 20348.81995.92
LSBI ¼ linearsamplingbiasindex;TAS ¼ totalapparentspacing. *Drainholestrendingdownstreamnotconsidered.5ft ¼ 1.5m.
Primaryandsecondarypermeabilitymayoverlapin somerockfoundations.Inthesecircumstances,rockfoundationsmayexhibitprimarypermeabilitythatisgenerallysimilartosecondarypermeability.Theapproachespresented hereindonotexplicitlyconsidertheeffectofprimarypermeabilityonseepageand,hence,cannotbeusedtoproperly designafoundationdrainagesystemthatissignificantly affectedbyprimarypermeability.Flownets,orotheranalyticalornumericalmethods,arerequiredtodesignafoundation drainagesystemlargelyinfluencedbyprimarypermeability. TheformulausedintheTASapproachwillprovide anin fi nitetotalapparentspacingincertainscenarios. Forexample,usingtheformulatooptimizeascenario includingadiscontinuitysetorientedexactlyparalleltothe proposeddrainholewillhaveasolutionofinfinity,since thedrainholewilltheoreticallyneverinterceptadiscontinuitysetorientedexactlyparalleltothedrainhole.Inthis

Figure14.PlotofLSBIforJointSets1,2,and3fordrainholeswithinclinationsfrom45to135degrees.
case,iftheproposeddrainholeorientationisdeemedtobe necessaryforsomereason,thenapreferablesolutionmight betooptimizetheorientationofonesetofdrainholes basedonthenon-paralleldiscontinuitysetsandaddasecondsetofdrainholeshavinganorientationoptimizedto intercepttheparalleldiscontinuityset.
Likewise,whenmultiplesetsofdiscontinuitiesexist andinfluenceuplift,optimizingthedrainholeorientation basedonananalysisfactoringinallthediscontinuitysets mayresultinacompromisesolutionthatmaybelesseffectivethanadesignincorporatingavarietyofdrainhole orientations,eachoptimizedtotargetasinglesetorgroup ofdiscontinuitysets,e.g.,onedrainholeorientationoptimizedtointersectnear-verticaldiscontinuitysetsandone drainholeorientationoptimizedtointersectnear-horizontal beddingjoints.
Regardlessoftheresultingoptimizeddrillingorientation developedbytheTASoralternatemethods,theactualoptimumorientationresultsmaybelimitedbyfactorsoutside
thenumericalanalysis.Thephysicalcharacteristicsofthe siteandthelimitationsofequipmentandaccessmustbe takenintoaccountpriortodesignatinganorientationfor boreholesinadrillingworkplan,scopeofwork,orcontract.Theanalysismayindicatethatdrainholeshavinga shallowplungefromhorizontalaremostfavorable,butthe mechanicsofexecutingsuchanorientationmaypreclude thefeasibilityofdrillingadrainholehavingthatorientation.Theaccessandlogisticsofasitemayalsopreclude usingequipmentthatmightotherwisebeabletoachieve theoptimizedorientation.Undertheseconditions,alternativescenariosmustbeconsideredtodeterminethebest practicalsolutionduringtheanalysisanddesignphase,rather thanafterequipmentandpersonnelhavebeenmobilized. Drillingtoleranceandthepotentialfordeviationshould alsobeconsideredwhenputtingtheresultsofthesemethods intoaspecificapplication.Atgreaterinclinationsfromvertical,theboreholeismorelikelytodeviatefromthedesired orientation,allotherfactorsbeingequal.
Table6. Summaryofcalculatedmaximumdrainholespacing.
5ft ¼ 1.5m.


Despitearigorouslyexecutedsiteinvestigationprogram, considerablegeologicuncertaintiesmaystillexist.Any siteinvestigationprogrammustbethoroughlyevaluated forsamplingbiasandotherdeficiencies.Siteinvestigation deficienciesandinadequaciesmustbethoroughlyconsideredwhen finalizinganyfoundationdraindesign.
Conclusionsbaseduponlimitedsamplingdatamay introducesignificantepistemicuncertaintyintothegeotechnicaldesignprocess.Thisuncertaintyshouldbefullyrecognizedandconsidered,andsoundengineeringprinciplesand judgementarestillrequiredwhenapplyingtheanalytical approachesdescribedherein.
TheTASapproachcanbeusedtodefineanoptimum drillingdirection,thatis,thedirectionalongwhichaborehole

canintersectasmanydiscontinuitiesaspossibleforagiven drillinglength.Given apriori knowledgeofthejointingpatternwithinarockfoundation,thisapproachprovidesameans torationallydesigntheoptimalorientation,depth,andspacingofrockfoundationdrains.Drainsproperlyinstalledatthe optimalorientation,depth,andspacingwillmoreeffectively andefficientlydiminishthehydraulicpressurebeneathaconcretedamfoundeddirectlyonjointedrock.Whenproperly applied,theTASapproachcansupersedethelong-standing rules-of-thumbthathavehistoricallybeenusedtodesignthe spacing,depth,andorientationoffoundationdrains.
TheTASapproachhasnumerousgeotechnicalexplorationandrockengineeringapplications.Specificapplications includetheorientationofdrillholesusedfor:geotechnical siteinvestigations,permeationgrouting,permeationgroutingverification,pressure(packer)testing,installationof geotechnicalinstrumentation,groundwatersamplingand productionwells,rockslopeinvestigationanddesign,installationofrocksupportanchors,andcollectionofrockcore samplesforengineeringpropertytesting,etc.TheTAS approachmaybeappliedstrategicallytointerceptasmany discontinuitiesaspossibleortofocusoninterceptingthose discontinuitiesofgreatestsignificance,orthosethatpose thegreatestrisksduetostructuralorseepageconcerns.
TheauthorsthankDr.AbdulShakoor,formerco-editor of EnvironmentalandEngineeringGeoscience,forhis invitationtosubmitthismanuscripttothejournalaftera presentationontheTASapproachatanAssociationof EnvironmentalandEngineeringGeologistsAnnualMeeting. TheauthorsalsothanktheNewYorkCityDepartmentof EnvironmentalProtectionforpermissiontousetheGilboa Damrehabilitationprojectasaworkedexample;Jake Romanforhiskindassistanceonthemathematicalaspects ofthemanuscript;andthepeerreviewersfortheirmany
insightfulcommentsandthoughtfulsuggestionsfor improvingthemanuscript.
ASCE(AMERICAN SOCIETYOF CIVIL ENGINEERS) AND USCOLD(UNITED STATES COMMITTEEON LARGE DAMS),1967, JointASCE-USCOLD CommitteeoncurrentUnitedStatespracticeinthedesignand constructionof:Archdams,embankmentdams,andconcretegravity dams:AmericanSocietyofCivilEngineers,NewYork,131p.
BARTHOLOMEW,A.J. AND BRETT,C.E.,2003,TheMiddleDevonian (Givetian)Gilboaforest:Sequencestratigraphicdeterminationof theworld’soldestfossilforestdeposit,SchoharieCounty,New YorkState: GeologicalSocietyofAmericaAbstractswithPrograms,Vol.35,No.3,p.83.
BATTULWAR,R.;ZARE-NAGHADEHI,M.;EMAMI,E.; AND SATTARVAND,J., 2021,Astate-of-the-artreviewofautomatedextractionofrock massdiscontinuitycharacteristicsusingthree-dimensionalsurface models: JournalofRockMechanicsandGeotechnicalEngineering,Vol.13,No.4,pp.920–936.
BRIDGE,J.S.,2000,Thegeometry, flowpatternsandsedimentaryprocessesofDevonianriversandcoasts,NewYorkandPennsylvania, USA.InFriend,P.F.andWilliams,B.P.J.(Editors), NewperspectivesontheOldRedSandstone:SpecialPublication180,GeologicalSociety,London,U.K.,pp.85–108.
BRIDGE,J.S. AND JARVIS,S.,1998,Devonian fluvialtoshallowmarine strata,SchoharieValley,NewYork.InNaslund,H.R.(Editor), FieldTripGuideforthe70thAnnualMeetingoftheNewYork StateGeologicalAssociation:NewYorkStateGeologicalAssociation,Binghamton,NY,pp.43–69.
BRIDGE,J.S. AND WILLIS,B.J.,1994,Marinetransgressionsand regressionsrecordedinMiddleDevonianshore-zonedepositsof theCatskillclasticwedge: GeologicalSocietyofAmericaBulletin, Vol.106,No.11,pp.1440–1458.
COOK,D.I.;SANTI,P.M.; AND HIGGINS,J.D.,2007,Horizontallandslide draindesign:Stateoftheartandsuggestedimprovements: Environmental&EngineeringGeoscience,Vol.14,No.4,pp.241–250.
DA SILVA,J.F.,2005,Influenceofthegeometryofthedrainagesystem andofthefoundationanisotropyontheupliftpressuresunderconcretedams: Infogeo2005 5th BrazilianSymposiumonApplicationsofComputationalMechanicsinGeotechnicalEngineering, BeloHorizonte,Brazil,pp.165–174.
EBELING,R.M. AND PACE,M.E.,1996a,Upliftpressureresultingfrom flow alongtaperedrockjoints: REMRBulletin,Vol.13,No.1,pp.1–4.
EBELING,R.M. AND PACE,M.E.,1996b,Variationinupliftpressures withchangesinloadingsalongasinglerockjointbelowagravity dam: REMRBulletin,Vol.13,No.1,pp.5–8.
FARNY,N.J.,2017,Comparingrockdiscontinuitymeasurementsusing geologicalcompass,smartphoneapplication,andlaserscanning methods: Environmental&EngineeringGeoscience,Vol.23,No. 2,pp.97–112.
FISHER,D.W.;BROUGHTON,J.G.;ISACHSEN,Y.W.;RICKARD,L.V.; AND OFFIELD,T.W.(CompilersandEditors),1961, Geologicmapof NewYork,Hudson-Mohawksheet:NewYorkStateMuseumand ScienceServiceMapandChartSeries5,scale1:250,000.
GATES,W.C.B. AND HANEBERG,W.C.,2012,Comparisonofstandard structuralmappingresultsto3-Dphotogrammetricmodelresults: BoundaryTransformerBanksrockfallmitigationproject,MetalineFalls, Washington.InBobet,A.;Ewy,R.;Gadde,M.;Labuz,J.;Pyrak-Nolte, L.;Tutuncu,A.;andWestman,E.(Editors), 46thU.S.RockMechanics/ GeomechanicsSymposiumProceedings,Vol.2:AmericanRock MechanicsAssociation,Alexandria,VA,pp.1489–1493.
GRENOBLE,B.A. AND AMADEI,B.,1990,Evaluationofupliftpressure forconcretegravitydamsfoundedonjointedrock:analytical
results.In Proceedingsofthe10thUSCOLDMeetingandLecture Series,NewOrleans,LA,U.S.CommitteeonLargeDams,Denver,CO,pp.1–20.
GRENOBLE,B.A.;HARRIS,C.W.;MEISENHEIMER,J.K.; AND MORRIS, D.I.,1995,Influenceofrockjointdeformationsonupliftpressure inconcretegravitydamfoundations:Fieldmeasurementsand interpretation.InMyer,L.R.andCook,N.G.(Editors), Fractured andjointedrockmasses,ProceedingsoftheConferenceonFracturedandJointedRockMasses,LakeTahoe,CA,3–5June1992: A.A.Balkema,Rotterdam,Brookfield,pp.535–542.
HANEBERG,W.C.,2004, ComputationalgeoscienceswithMathematica:Springer-Verlag,Berlin,Germany,381p.
HANEBERG,W.C.,2008,Usingcloserangeterrestrialdigitalphotogrammetryfor3-DrockslopemodelinganddiscontinuitymappingintheUnitedStates: BulletinofEngineeringGeologyandthe Environment,Vol.67,No.4,pp.457–469.
HANEBERG,W.C.,2009,TechnicalNote Improvedoptimizationand visualizationofdrillingdirectionsforrockmassdiscontinuity characterization: Environmental&EngineeringGeoscience,Vol. 15,No.2,pp.107–113.
HANEBERG,W.C.;NORRISH,N.I.; AND FINDLEY,D.P.,2006,Digitaloutcropcharacterizationfor3-Dstructuralmappingandrockslopedesign alongInterstate90nearSnoqualmiePass,Washington: 57thAnnual HighwayGeologySymposiumProceedings,Breckenridge,CO,pp. 146–160.
HERNICK,L.V.,2003, TheGilboaFossils: NewYorkStateMuseum Circular65,NewYorkStateEducationDepartment,Albany,NY.
ISACHSEN,Y.W. AND MCKENDREE,W.G.(Compilers),1977a, GeneralizedmapofrecordedjointsystemsinNewYork:NewYorkState MuseumMapandChartSeriesNo.31F,scale1:1,000,000.
ISACHSEN,Y.W. AND MCKENDREE,W.G.,1977b, Preliminarybrittle structuresmapofNewYork Hudson-Mohawksheet:NewYork StateMuseumMapandChartSeriesNo.31B,scale1:250,000.
KEMENY,J.;BATEMAN,V.;DIMITROPLOS,C.G.;FOLTZ,B.;HADJIN,D.; MCCLELLAND,M.;COMBS,J.;ORTIZ,T.;PELHAM,K.;PRIZNAR,N.; TURNER,K.; AND WEBSTER,B.,2011,Transportationpooledfundprojectofhighwaygeotechnicalapplicationsofground-basedLIDAR: 62ndHighwayGeologySymposiumProceedings,Lexington,KY,pp. 195–211.
KEMENY,J. AND TURNER,K.,2008, Ground-basedLiDARrockslope mappingandassessment:FederalHighwayAdministrationReport No.FHWA-CFL/TD-08-006.
KOTTENSTETTE,J.T. AND SHAFFNER,P.T.,2008,Photogrammetricmappingandgeologicalcharacterizationoffoundationblocksinthe rightabutmentofEastCanyonDam.In 42ndU.S.RockMechanics Symposiumand2ndUS-CanadaRockMechanicsSymposium2008, Vol.3:AmericanRockMechanicsAssociation,Alexandria,VA,pp. 1463–1478.
KRYNINE,D.P. AND JUDD,W.R.,1957, Principlesofengineeringgeologyandgeotechnics:McGraw-HillBookCompany,Inc.,New York,730p.
LA POINTE,P.R. AND HUDSON,J.A.,1985, Characterizationandinterpretationofrockmassjointpatterns:SpecialPaper199,GeologicalSocietyofAmerica,Boulder,CO,37p.
MAULDON,M. AND MAULDON,J.G.,1997,Fracturesamplingonacylinder:Fromscanlinestoboreholesandtunnels: RockMechanics andRockEngineering,Vol.30,No.3,pp.129–144.
MURPHY,W.L.;EBELING,R.M.; AND ANDERSEN,J.M.,2002, Assessmentofgeologyasitpertainstomodelingupliftinjointedrock:A basisforinclusionofuncertaintyin flowmodels:U.S.ArmyCorps ofEngineers,EngineerResearchandDevelopmentCenterReport ERDCTR-02-2.
[NASEM]NATIONAL ACADEMIESOF SCIENCES,ENGINEERING, AND MEDICINE, 2020, Characterization,modeling,monitoring,andremediationof
fracturedrock:TheNationalAcademiesPress,Washington,D.C. https://doi.org/10.17226/21742
OTOO,J.N.;MAERZ,N.H.;DUAN,Y.; AND XIAOLING,L.,2011,LiDAR andopticalimagingfor3-Dfractureorientations: NSFEngineeringResearchandInnovationConferenceProceedings,Atlanta, GA,8p.
PRIEST,S.P.,1993, Discontinuityanalysisforrockengineering:Chapman&Hall,London,U.K.,473p.
RICH,J.L.,1935, GlacialgeologyoftheCatskills:NewYorkState MuseumBulletin299.
SHAFFNER,P.;HEISLER,R.;KROSLEY,L.;KOTTENSTETTE,J.; AND WRIGHT, J.,2009,Characterizationofdamfoundationblocksusingdigital photogrammetricmappingandboreholegeophysicalloggingto createcomprehensive3Dfoundationmodels.In Managingour waterretentionsystems,29thAnnualUSSDConference,Nashville,TN:U.S.SocietyonDams,Aurora,CO,pp.473–505.
STEIN,W.E.;BERRY,C.M.;HERNICK,L.V.; AND MANNOLINI,F.,2012, Surprisinglycomplexcommunitydiscoveredinthemid-Devonian fossilforestatGilboa: Nature,Vol.483,No.7387,pp.78–81.
STEWART,J.,2003, Multivariablecalculus,5thed.:Brooks/Cole ThomsonLearning,Belmont,CA,1204p.
STONEAND WEBSTER ENGINEERING CORPORATION,1992, Upliftpressures, shearstrengths,andtensilestrengthsforstabilityanalysisofconcrete gravitydams, Volume1:ElectricPowerResearchInstituteTechnical ReportTR-100345s,304p.
TERZAGHI,R.D.,1965,Sourcesoferrorinjointsurveys: Géotechnique,Vol.15,No.3,pp.287–304.
TITUS,R.,2003, TheCatskillsintheiceage,reviseded.:PurpleMountain Press,Jamestown,PA,127p.
TONON,F. AND KOTTENSTETTE,J.T.(Editors),2007, Laserandphotogrammetricmethodsforrockfacecharacterization:ReportonaworkshopheldJune17–18,2006inGolden,CO,inConjunctionwith GoldenRocks2006 The41stU.S.RockMechanicsSymposium, ColoradoSc hoolofMines,June17 –21,2006:AmericanRock MechanicsAssociation,Alexandria,VA,120p.
USACE(U.S.ARMY CORPSOF ENGINEERS),1995, Planninganddesign ofnavigationdams:U.S.ArmyCorpsofEngineersEngineerManual EM1110-2-2607,117p.
USACE(U.S.ARMY CORPSOF ENGINEERS),2005, Stabilityanalysisof concretestructures,AppendixC,uplift: U.S.ArmyCorpsof EngineersEngineerManualEM1110-2-2100,pp.C-1–C-4.
WATTS,C.F.,2011,LiDARand3Dphotogrammetryforevaluating geologicstructureinrockslopestabilityanalyses: 25thCentral PennsylvaniaGeotechnicalConferenceProceedings,Hershey, PA:AmericanSocietyofCivilEngineers,CentralPASection, pp.58–71.
ZHOU,W. AND MAERZ,N.H.,2002,Identifyingtheoptimumdrilling directionforcharacterizationofdiscontinuousrock: Environmental &EngineeringGeoscience,Vol.13,No.4,pp.295–307.

Developmentofa3DGeologicModelUsedinthe SeismicHazardandLiquefactionHazardAnalysis
DepartmentofEarthSciences,UniversityofMemphis,109JohnsonHall,Memphis, TN38152-3430andTennesseeDepartmentofEnvironmentandConservation, MemphisEnvironmentalFieldOffice,8383WolfLakeDrive, Bartlett,TN38133-4119
DepartmentofCivilEngineering,UniversityofMemphis,104EngineeringScience Building,Memphis,TN38152andMIGIZIGroup,Inc.,201160thStreetSouth, Suite401,Seattle,WA,98448
DepartmentofEarthSciences,UniversityofMemphis,109JohnsonHall,Memphis, TN38152-3430andDepartmentofEnvironmentalScience,RhodesCollege,2000 NorthPkwy,Memphis,TN38112
CenterforEarthquakeResearchandInformation,UniversityofMemphis,3890 CentralAvenue,Memphis,TN38152-3050
DepartmentofCivilEngineering,UniversityofMemphis,104EngineeringScience Building,Memphis,TN38152
KeyTerms: 3DGeologicModeling,MadisonCounty, Tennessee,NewMadridSeismicZone,Mississippi Embayment,Quaternary,Tertiary,Paleogene,Cretaceous
MadisonCountyofwesternTennesseeisapproximately100kmsoutheastoftheNewMadridseismic zoneand,thus,issubjecttopotentiallydangerous seismicshakingandliquefactionevents.Holocene floodplainalluviumandassociatedPliocene/Pleistocene terracesoftheForkedDeerandHatchieRiverscover alargepartofMadisonCounty.Underlyingthese unconsolidatedsedimentsareapproximately ∼650m ofpoorlyconsolidatedPaleogeneandCretaceousterrestrialandmarinesediments,whichareunderlainby Paleozoiclimestonebedrock.Uniformregionalgeology usedinthe2014UnitedStatesGeologicalSurveyseismichazardmapsassumesahomogenousseismicvelocitystructureabovebedrock.Three-dimensional geologicmappingofthe ∼700mofQuaternary,
*Correspondingauthoremail: Valarie.harrison@tn.gov

Neogene,Paleogene,andCretaceoussedimentsconductedinthisstudyprovidesamoredetailedvelocity structure,resultinginamoreaccurateanddetailed mapoftheexpectedgroundmotionsinMadison Countyduringfutureearthquakes.Inaddition,the surfacegeologicmaprevealsregionsthataresusceptibletoliquefaction.Thispaperdiscussesthemethods usedtoconstructthesurfacegeologymap,subsurface structurecontourmaps,isopachmaps,and3Dgeologicmodelusedintheseismichazardandliquefaction hazardanalysesofMadisonCounty,Tennessee,and summariesoftheresultsoftheseanalysesare presented.
Locatedapproximately100kmsoutheastoftheNew Madridseismiczone,MadisonCounty,Tennessee,and itsprimarycityofJackson(population68,114)(Figure 1)maybeaffectedbybothearthquakegroundshaking andliquefactionintheeventoffuturelargeNewMadrid earthquakes(Chiuetal.,1992;Coxetal.,2001,2006, 2013;Tuttleetal.,2002,2019;Cramer,2006;Csontos
Figure1.(A)LocationofMadisonCounty,Tennessee.(B)Geologicallymapped7.5-minutequadranglesofMadisonCounty.TheMercer,Spring Creek,andCedarGrovequadranglesarehighlightedinyellowandhavenotbeengeologicallymappedandpublished.Thebasemapisa1-m DEMofMadisonCountywiththeblacktowhitecolorrampshowingelevationsfromlow(93m)tohigh(204m),respectively. Harrison,Tohidi,VanArsdale,Cramer,andArellano

3DGeologicMappingofMadisonCounty,Tennessee
andVanArsdale,2008;CramerandBoyd,2014;Cramer etal.,2018a,2023).The2014regionalUnitedStates GeologicalSurvey(USGS)probabilisticseismicground motionmapspredictpeakgroundacceleration(PGA) from0.2to0.7g,wheregisgravitationalacceleration, forMadisonCounty(Figure9A)intheeventoffuture M7.3–7.7NewMadridseismiczoneearthquakes.However,USGSseismicgroundmotionmapsarebasedon uniformstandardgeologyanddonotincludetheeffects ofnear-surfacegeology(Petersenetal.,2014),which canbesignificantintheeventofalargeproximalearthquake(Crameretal.,2023).Inthispaper,wedetailthe processofconstructingthesurfacegeologicmap,structurecontourandisopachmaps,andthe3Dgeologic modelofMadisonCountythatwasusedintheseismologichazardmodelingthatisdetailedinCrameretal. (2023).Thisresearchdocumentsnear-surfacegeology andproducesamoreaccurateanddetailedseismichazardanalysisaswellasliquefactionhazardanalysis.This studyalsoillustratestheusefulnessofcontinued3DgeologicandseismologicmappingperipheraltotheNew Madridseismiczone,whichincludeslargeportionsof westernTennessee,westernKentucky(Zhuetal.,2021), southwesternIllinois,southeasternMissouri,andnortheasternArkansas.
MadisonCountyconsistsoflowland floodplainsof theSouthForkandMiddleForkoftheForkedDeerrivers,HatchieRiver,HatchieRivertributaries,terracesof theserivers,andareasofPaleogeneandLateCretaceous strata(Figure2)(Brown,1968a,b;Parks,1968a,b,c,d, e,f,g;Saucier,1987;Jewel,2006;Antonacciand Hoyal,2011,2012a,b,2014).AthindepositofPleistoceneloessoverliestheterracesandbothPaleogeneand Cretaceoussediments.Beneaththe floodplainandterracedepositsinmostofMadisonCountyareEocene (»34Ma)sedimentsthatoverlieolderPaleogene,Late Cretaceous,andPaleozoicstrata(Figure2andTable1). NofaultshavebeenmappedinMadisonCounty,andthe countyisseismicallyinactive(Figure2A).
Approximately3.6Ma(Odumetal.,2020),theancestralMississippiRiversystem flowedthroughthecentral UnitedStatesanddeposited floodplainsedimentsnow discontinuouslypreservedasahigh-levelterracecalled theUplandComplex(VanArsdaleetal.,2007;Cox etal.,2014;CupplesandVanArsdale,2014;Lumsden etal.,2016).Remnantsofthe3.6Materracehavebeen mappedinObion,Dyer,Lauderdale,Tipton,andShelby countiesinwesternTennessee(Figure1A)(VanArsdale etal.,2007).Remnantsofterraceshavealsobeen mappedinMadisonCounty(Saucier,1987).Incision throughtheUplandComplexthroughoutthelowerMississippi/OhioRiversystembeganintheearly

Figure2.(A)7.5-minutequadranglesofMadisonCountymappedby AntonacciandHoyal(2011;2012a,b;2014),Brown(1968a,b),Jewel (2006),andParks(1968a,b,c,d,e,f,g).QuadrangleslabeledinFigure 1.LineA-A’ inJacksonNorthquadrangleindicateslocationofcross sectioninB.(B)West–eastgeologiccrosssectionoftheJacksonNorth 7.5-minutegeologicquadranglemapwith4Xverticalscale(modified fromJewel,2006).(C)GeologiccolumnofJacksonNorth7.5-minute geologicquadranglemap(modifiedfromJewel,2006).
Table1. Stratigraphyofthesurfaceandsubsurfacegeologyofthe JacksonNorth7.5-minutequadranglemapinnorthcentralMadison County(Figure1B)(modifiedfromJewel,2006).Thisstratigraphyis appropriateforallMadisonCountyandwasinterpretedbasedonoil andgasandhydrologictestwells.
PeriodGroupandFormationSymbol QuaternaryAlluviumQal Tertiary(?)andQuat.FluvialDepositsQTf TertiaryWilcoxGroupPortersCreek ClayClaytonFm. Tw Tp Tcl CretaceousOwlCreekFm.McNairySand DemopolisFm.CoffeeSand Ko Km Kd Kc
PaleozoicsUndifferentiatedLimestonePal Harrison,Tohidi,VanArsdale,Cramer,andArellano
Pleistocenewithgrowthofcontinentalicesheetsand resultantlowersealevels(Saucier,1994;VanArsdale etal.,2007).DuringthePleistocene,theHumboldt, Hatchie,andFinleyterracesformedalongtheObion, ForkedDeer,andHatchierivers(Saucier,1987;Rodbell, 1996)anduptofourloesslayersweredepositedinwesternTennessee(Markewichetal.,1998).InDyerCounty (Figure1A),Rodbell(1996)identifiedPeorialoess (,20ka)andunderlyingRoxannasilt(.65kaloess)on topofHumboldtandHatchieRiverterracealluvium (Reichenbacheretal.,2022).Theresearchersbelieve thattheancestralMississippi/Ohioriversystemandits tributariesentrenched .65kainwesternTennessee becausetheHumboldtterracealluviumisoverlainby the .65kaloessbasedontheDyerandLauderdale counties’ geologichistories.Subsequently,theMississippi/Ohioriversystemanditstributariesfurther entrenchedtoformtheHatchie(also .65ka)andthen Finley(»22ka)terracelevels(Harrison,2022).The finalentrenchmentoftheMississippianditstributary riversinwesternTennesseeoccurredwithinthelast 22,000years,resultinginmostofthemodern floodplain alluviumbeing ,12ka.
ThesurfacegeologyofMadisonCounty exceptfor theMercer,CedarGrove,andSpringCreek7.5-minute topographicquadrangles hasbeenmappedatascaleof 1:24,000(Figure2A)(Brown,1968a,b;Parks,1968a, b,c,d,e,f,g;Jewel,2006;AntonacciandHoyal,2011, 2012a,b,2014).Forthisgeologicandearthquakehazard investigation,MadisonCountywasdividedintothree surfacegeologicunits:Holoceneriver floodplainalluvium,Plioceneand/orPleistoceneriverterracealluvium, andsemi-consolidatedsedimentsofPaleogeneandCretaceousage.BedrockbeneathMadisonCountyis
Paleozoiclimestoneanddolomite(Figure2andTable1) (Jewel,2006).TocompletethesurfacegeologyofMadisonCounty,theMercer,CedarGrove,andSpringCreek 7.5-minutequadrangles(Figure1B)wereinterpretedby using1-mlidardigitalelevationmodels(DEM)andprojectingthesurfacegeologyofadjacent7.5-minutepublishedgeologicquadranglemaps(Figure2A).Mostof theMercerquadrangleinMadisonCountywasmapped bySaucier(1987)asHatchieRiverterrace,andSaucier ’s mapformsthebasisforourmappingofthisquadrangle. TheremainingareawithintheMercerQuadranglewas mappedbyextendingalluviumfromstreamsinthesurroundingquadranglesthroughtheHatchieRiverterrace. TocompletethemappingofMadisonCounty,theSpring CreekandCedarGrovequadranglesweresubdividedinto 27polygons.Thepolygonsadjacenttothepublishedsurfacegeologyweresplitintothethreeclassificationsof Holocene floodplainalluvium,Pliocene/Pleistoceneterrace alluvium,andPaleogeneandCretaceoussedimentsbased onsurfaceelevation.Thesepolygonswerethenreclassified untilthepatternattheperimeteroftheDEMmatchedthe patternoftheknownadjacentpublishedsurfacegeology (Figure2A).Thisprocesswasrepeatedforeachpolygon. TheresultingrastersweremergedintoamosaictorepresenttheinterpretedsurfacegeologyofthethreequadranglesandmergedwiththegeologyclassificationofTable1 toproduceasimplifiedsurfacegeologicmapofMadison County(Figure3).
Subsurfacelithologicboringlogswereacquiredfrom petroleumexplorationwells,TennesseeDepartmentof EnvironmentalControl,andtheStateofTennesseeDepartmentofEnvironmentandConservationDivisionofGeology.Theseboringscontainlithologicdescriptionsofthe Neogene,Paleogene,Cretaceous,andPaleozoicstratathat reachadepthof »410mbelowtheJacksonNorthgeologicquadranglenearthemiddleofMadisonCounty(Figures1Band2B).
ThesubsurfacegeologyofMadisonCountyisillustratedinthecross-sectionthataccompaniesthe7.5minuteJacksonNorthGeologicQuadranglemap(Figure 2B)(Jewel,2006).ThebasalportionofthePaleocene ClaytonFormationisdifficulttodifferentiatefromthetop oftheunderlyingCretaceoussediment(theOwlCreekFormation)insomepublishedquadrangles(e.g.,Figure2B)as theyarebothdescribedasconsistingofglauconiticclay andsand.Therefore,theseunitsarecombinedinthose mapsbasedontheirsimilarlithologies.Becausethe lithologiesareindistinguishable,theyareexpectedto havethesameseismicvelocities.Withinthisstudy,the term “topofCretaceous” isusedevenwhereathinsectionofPaleoceneClaytonispresent,andthus,theuncertaintyofthetopoftheCretaceousstrataisconsideredin the finalground-shakinghazardmaps.Theelevationsof thetopsoftheWilcoxGroup,PortersCreekClay,and
3DGeologicMappingofMadisonCounty,Tennessee
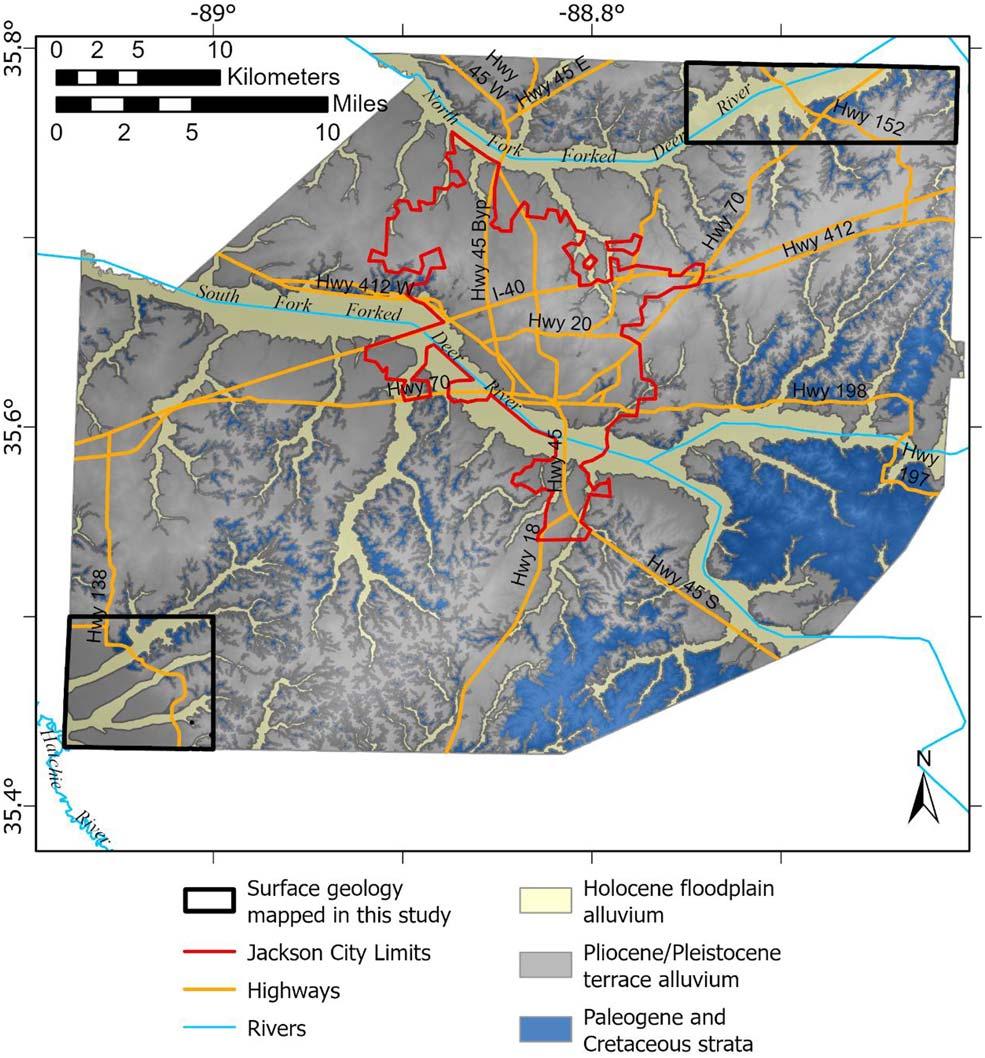
Figure3.SimplifiedgeologicmapofMadisonCountyforthisseismicgroundmotionandliquefactioninvestigation.LiquefactionprobabilitycurvesinFigure9AandBwerecalculatedforthe floodplain strata(Holocene floodplainalluvium)andnon-floodplainstrata (Pliocene/Pleistoceneterracealluvium,Paleogenestrata,andCretaceous strata).EarthquakeliquefactionpotentialishighfortheHolocene floodplainareasofMadisonCounty.
Cretaceousweredeterminedbysurfacecontactelevations frompublished7.5-minutegeologicquadranglemapsin Madisonandadjacentcounties(Figure2A)andfrom welldata.AlltopofPaleozoicelevationpicksinMadison Countyarefromwelldata.
StructurecontourmapsweremadeshowingtheelevationsofthetopsoftheClaiborneGroup,Cretaceous strata,andthetopofthePaleozoicstrata(Table1). ThesemapsweremadeusingtheNaturalNeighborcontouringalgorithm.Planartrendsurfacesofthetopsof theWilcoxGroupandPortersCreekClaywerealso made.Theplanartrendsurfaceswereusedtoextrapolate thetopsoftheWilcoxGroupandPortersCreekClay undermostofMadisonCounty.Controlforthetopof theCretaceouswasobtainedfromoutcropdataineasternMadisonCountyandadjacentcountiesandfrom petroleumexplorationwells.ThetopofPaleozoicstructurecontourmapwasconstructedfromoilwellexplorationdata.Strikesanddipsofthemappedunitswere determinedfrom firstordertrendmapsoftheunits’ elevationdata.
Near-surfacegeologicunitthicknessesarenecessary foracomprehensiveevaluationoflocalgroundmotion andliquefactionpotential(Crameretal.,2023).Therefore, isopachmapswereconstructedoftheLowlandHolocene
alluvium,Pliocene/Pleistoceneterracealluvium,Claiborne Group,WilcoxGroup,PortersCreekClay,andCretaceous sections.LowlandQuaternaryalluviumthicknesseswere locallydeterminedfrompublished7.5-minutegeologic quadranglemapsthathadcross-sectionsacrossriver floodplains.Inaddition,roadbridgecrossingsofthemiddleandsouthforksoftheForkedDeerRiverinMadison Countywerevisited,andtheheightfromthebridgedeck tothebottomofthedeepestpartoftheriver flowing beneaththebridgewasmeasuredbydroppingaweighted measuringtapetotheriverbed.Immediatelyadjacentto thebridgecrossings,1-mlidarDEMdatawereusedto maketopographicprofilesacrossthe floodplain.Bridge deckelevation, floodplainsurfaceelevationderivedfrom the1-mlidardata,andtheheightofthebridgedecktothe bottomofthechannelwereusedtoestimatethe floodplain thicknessatthebridgecrossingsasfollows:Thebridge deckheightabovechannelbottomminusbridgedeck heightabove floodplainequalschanneldepth,which equalsapproximate floodplainalluviumthickness.
Thecalculatedelevationsofthebaseofthe floodplainswereusedtoapproximateplanartrendsurfacesof thebaseofthealluviumbeneaththesouthandcentral ForkedDeerRiver floodplains.Anisopachmapofthe southandcentralForkedDeerRiver floodplainswas madebysubtractingtheelevationsofthe floodplainbase planartrendsurfacefromthe floodplainsurfaceelevations.TheisopachmapofthePliocene/Pleistoceneterrace alluviumwasdeterminedbysubtractingtheelevationsof thebaseoftheterracealluviumfromthegroundsurface elevations;thus,thethinsurfaceloesswasincludedin thisthickness.TheClaiborneGroupisopachmapwas derivedbysubtractingtheelevationofthetopoftheWilcoxFormationfromthesurfaceelevationwheretheClaiborneisexposedandfromtheelevationofthetopofthe Claibornewhereit’scoveredbyHolocene floodplain alluviumorPliocene/Pleistoceneterracealluvium.IsopachmapsoftheWilcoxGroup,PortersCreekClay,and Cretaceoussectionweremadebysubtractingtheelevationsfromthebasalstructurecontourmapfromtheoverlyingstructurecontourmapofeachmappingunit(e.g., PortersCreekClaytopelevation – Cretaceoustopelevation ¼ thicknessofPortersCreekClay).Fordatausedin thisstudy,seeAppendixA.
ThesurfacegeologyofMadisonCounty,structure contourmaps,andisopachmapswerecompiledintoa 3DmodelandanimationofthegeologyofMadison County(AppendixB).S-wavevelocitiesweredeterminedforthemappedsurfaceandsubsurfacegeologic units,andinconjunctionwiththeunits’ respectivethicknesses,averticalseismicvelocityprofilewascalculated forevery0.5km2 ofMadisonCountyanda10-kmsurroundingarea.Adetaileddiscussionoftheseismic methodologyispresentedinCrameretal.(2023).
GeotechnicalanalysisofMadisonCountywasconductedtodevelopliquefactionprobabilitycurves (LPCs)basedongeotechnicalsoilborings,groundwater levels(GWL),andseismicgroundmotionestimates. TheLPCsweredevelopedusingthethree-stepprocedureutilizedbyRixandRomero-Hudock(2006), Crameretal.(2018a,b;2019;2020a,b;2021;2022; 2023)andsummarizedinTohidietal.(2021).However, anoverviewofeachstep,includingspecificmodificationsincorporatedforMadisonCounty,isprovidedas follows.
Step1involvescalculatingthefactorofsafetyagainst liquefactionateach0.6-mdepthincrementtoadepthof 20mofeachsoilboringusingthesimplifiedprocedure ofSeedandIdriss(1971)andtheYoudandIdriss(2001) relationshipfordeterminingthecyclicresistanceratio basedonstandardpenetrationtest(SPT)data.Atotalof 233soilboringlogswerecollectedfromvariousorganizations.However,only69ofthesesoilboringlogsmet thefollowingscreeningcriteriaforliquefactionanalysis: (1)Boringsmustbeatleast20m(66ft)deep,(2)boringsmustincludeN-valuesandUnifiedSoilClassificationSystem(USCS)soilclassificationstoadepthof15 m(50ft),and(3)theboringlocationsmusthavelatitude andlongitudecoordinates.
AftersummarizingtheboringlogsforN-values, USCSsoilclassification,and finescontentusingadepth incrementof0.6mtoatotaldepthof20m,theGWLat eachboringlocationwasestimatedfromtheGWLcontourmapofSchrader(2008)andcorroboratedwithdata from23wellsprovidedbytheJacksonEnergyAuthority (JEA),whichindicatedastablewaterlevelovera15yearperiod(from2006to2020).Themeasurements fromthese15yearsindicatethatthechangeinwater levelisminor.Additionally,JEAhasnotencountered anysuddenriseinwaterlevelsnearrivers.TheJEA GWLsareingeneralagreementwiththelevelsindicated bythecontourmapofSchrader(2008).Therefore,the SchraderGWLcontourmapwasutilizedtoobtainthe GWLateachsoil-boringlocationtoperformliquefactionanalysis.
Step2consistsofcalculatingtheliquefactionpotentialindex(LPI)ateachsoil-boringlocationbasedonthe Iwasakietal.(1978,1982)method.Tohidi(2022)providesanoverviewoftheLPImethodaswellasthe equationsusedtoobtainLPI.LPIvaluesaredetermined ateachsoil-boringlocationforPGAvaluesof0.1,0.2, 0.3,0.4,0.5,0.6,0.7,0.8,0.9,and1.0gandearthquake magnitudes(Mw)of5,5.5,6,6.5,7,7.5,and8.Thus, LPIvaluesaredeterminedforeachof70possiblecombinationsofPGAandMw,i.e.,70earthquakescenarios.
Step3consistsofdevelopinganLPCfortheprobability ofexceedingatargetLPIvalueof5and15foreachprimary
surficialgeologicunit.However,duetotheverylimited numberofsoilboringsavailableinsomenear-surfacegeologicunits,surfacegeologywasseparatedinto floodplain alluviumandnon-floodplainstrataasmappedinFigure3. Thenon-floodplainstrataconsistofriverterracealluvium andTertiary-Cretaceousstrata.However,fornon-floodplainstrata,allboringsarewithintheterracealluvium, andtherearenoboringswithintheTertiary-Cretaceous strata.TheTertiary-Cretaceousstratahavethehighestelevation;consequently,theyhavethelowestGWLandthe lowestprobabilityofliquefaction.Insummary,LPCs weredevelopedbasedonSPTdataof25soilborings withinthe floodplainalluviumand44soilboringsfrom theterracealluvium.
LPCsdeterminedforthisstudyarebasedonthe probabilityofexceedinganLPIvalueof fi ve,whichis moderateliquefactionpotentialbasedontheresultsof Iwasakietal.(1978,1982)andToprakandHolzer (2003).TheprobabilityofexceedinganLPIof fi veis basedonthenumberofsoilboringswithLPIexceeding fi ve(cumulativefrequencydistribution).AnexampleofcomputingtheprobabilityofLPI . 5isgivenin Tohidietal.(2021)andTohidi(2022).Similarly,LPCs arealsodevelopedbasedontheprobabi lityofexceedinganLPIvalueof15,whichis “ severe ” liquefaction potential.
ThesurfacegeologyofMadisonCounty(Figure 2A)wasgeologicallydifferentiatedintothreemappingunitsforseismicandliquefactionhazardanalyses(Figure3):Holoceneriver fl oodplainalluvium, Pliocene/Pleistoceneriverterracealluvium,andsemiconsolidatedsedimentsofPaleogeneandCretaceous age.TheFigure2Bcross-sectionfromtheJackson North7.5-minutegeologicquadrangleisrepresentativeofthegeologythatunderliesmostofMadison County.
ThetopofthePaleogeneandCretaceousstrataare exposedineasternmostMadisonCounty.Overmuchof thecounty,1–25mofPliocene/Pleistoceneterracealluviumand1–9mofHoloceneriveralluviumoverliePaleogeneandCretaceousstrata(Figure3).
Structurecontourmapsweremadefromsurfacedata ofthecontacttopsoftheClaiborneGroup,WilcoxGroup, PortersCreekClay,andCretaceousstratamappedin thepublished7.5-minutegeologicquadranglemapsof Figure2(Figure4AthroughF)(Brown,1968a,b;Parks, 1968a,b,c,d,e,f,g;Jewel,2006;AntonacciandHoyal,
3DGeologicMappingofMadisonCounty,Tennessee

Figure4.(A)Surfaceoutcropdata(bluedots)usedtomakestructurecontourmapin “B” ofthetopoftheClaiborneGroupwithbluelinesshowingpublishedquadranglecross-sectionlines.PlanartrendsurfacestructurecontourmapsoftheWilcoxGroup(C),thePortersCreekClay(D), Cretaceousstrata(E),andthePaleozoicstrata(F)withstratigraphiccontactandboreholedatapointsusedtoconstrainthetopsoftheseunits. Elevationisinmeterswithrespecttosealevel.
2011,2012a,b,2014)andfromdrillholedata.Planartrend surfaceswere fittotheelevationsofthetopsoftheWilcox GroupandPortersCreekClaytomakeplanartrendsurface structurecontourmaps(Figure4CandD).Fittingplanes totheseformationtopsisjustifiedbecausenofaultsor foldshavebeenmappedinMadisonCounty(Figure2A). Strikeanddipofthegeologicformationsweredeterminedfromthecontourlinesintheirplanartrendsurfaces(Figure4CandD).Theseunittopsslopewesterly atlessthan1°:TheWilcoxGroupisN28°E,0.21°NW, andPortersCreekClayisN27°E,0.27°NW.Thestrikes anddipsofthetopsoftheCretaceous(N28°E,0.48°NW) andPaleozoic(N21°E,0.44°NW)inMadisonCounty weredeterminedfromthecontourlinesontheirstructurecontourmaps(Figure4EandF).Thestructural analysisinthisstudyshowsthat,inMadisonCounty, theentirestratigraphicsectionfromthetopofthe PaleogenetothetopofthePaleozoicdipswesterly at ,1°.
Holoceneriver floodplainalluviumthicknessmeasurementsalongtheForkedDeerriversandHatchie Rivertributariesrangefrom1to9m(Figures5and 6A).The floodplainalluviumthicknessinthisstudy,as determinedfromthebridgemeasurements(Figures5and 6A),isanestimatebecause floodplainalluviumcould underliethechannelbaseorthechannelbasecouldbe incisedintoPaleogenestrata.Basedonavailableborehole dataandlithologicdescriptionsintheavailablequadrangles,the floodplaininthisstudyisinterpretedtocontaina surfacesiltandclayoverbanklayer,whichoverliespoint barsandthatmaycontaingravel.
Pliocene/Pleistoceneterracealluviumthicknessisvariablewithvaluesrangingfrom1to25m(Figure6B).In general,terracealluviumisthickestalongdrainage dividesandthinstowardsmodernstreams.ThePliocene/ Pleistoceneriverterracesaretopographicallyhigherthan theHolocene floodplainsandconsistofsurfacesiltand claythatoverliessandandgravel(Figure2C).Athin layerofPleistoceneloessoverliestheriverterracealluvium.Thereareatleasttwoterracelevelsapparentin1-m lidarDEMdata,butthedifferentterracelevelsarenot hereindifferentiated.
PaleogeneandCretaceousstrataareatgroundsurface ineasternmostMadisonCountyandunderliewestern MadisonCounty(Figures2and4andTable1).Insome areas,thePaleogenestrataarecoveredwithathin veneerofPleistoceneloess.TheClaiborneGroupthickensnorthwesterly(Figure6C),butthicknessisirregular becauseitsuppersurfacehasbeenerodedtovariouselevationsbytheentrenchmentofPliocene/PleistoceneriversandtheongoingentrenchmentofHolocenerivers acrossMadisonCounty(Figure2A).TheWilcoxGroup
(Figure6D)andPortersCreekClay(Figure6E)thickento thenorthwest,andtheCretaceoussectionthickenssoutherly(Figure6F).TheClaiborneGroupaverages33mthick, WilcoxGroup37m,PortersCreekClay107m,andthe Cretaceousstrataaverages237mthickinMadisonCounty.
USGSseismicgroundmotionmapsarebasedona uniformstandardgeologyanddonotincludetheeffects ofnear-surfacegeology(Petersenetal.,2014).Seismic groundmotionmapsforMadisonCountyweredeveloped(Crameretal.,2023)usingthegeologicalmodel describedinthispaper.Theshearwavevelocities(Vs) usedintheUSGShazardmodelcalculations(Petersen etal.,2014)areuniformlyhigherthantheaverageshear wavevelocityovertheuppermost30m(Vs30)usedto developourgroundmotionmaps.TheactualshallowVs valuesareaverageswithuncertaintywithinageological formationfrommultichannelanalysisofsurfacewaves/ refractionmicrotremor(MASW/ReMi)measurementsat representativesitesinMadisonCounty.ThedeeperVs values,whichhaveamuchsmallerimpactonseismic hazard,arefromthemeasurementsinsimilargeological stratainShelbyCounty,adjustedfordifferencesindepth ofburial.VsvaluesforhazardcalculationsinMadison Countyareassignedtotheformationsinthe3Dgeology modelusingformationalaveragesanduncertaintyinthe mannerusedinGombergetal.(2003).Twoofthemost importantearthquakeprobabilisticmapsfromCramer etal.(2023)areillustratedhere(Figure8)corresponding totheresponseofstructureslessthantwostorieshigh (PGA)andstructures 10storieshigh(1.0seconds). Theunitsshownonthesemapsareaccelerationing, whichistheaccelerationattheearth’ssurfaceof980.655 cm/s/s.Atshortperiods(PGA),soilresponseinwestern MadisonCountyde-amplifiesgroundmotions(Figure 8C)relativetotheUSGSmaps(Figure8A)duetononlineareffectsathighergroundmotionsclosertotheearthquakesource.Butnonlineareffectsarereducedineastern MadisonCountyduetoincreaseddistancefromtheearthquakesourceandincreasedsoilstiffness(consolidation) ofthenear-surfacegeology,andhence,shortperiod groundmotionsaresignificantlyamplified.Atlongperiods(1.0seconds),soilresponseislessaffectedbynonlinearsoileffects,andhence,groundmotionsareamplified (Figure8D)relativetotheUSGSmaps(Figure8B), whichdependsonthedistancefromthesourceandsoil stiffness(Crameretal.,2023).
WhereastheLPCsforP[LPI.5]wereintroducedin Crameretal.(2023),theLPCsforP[LPI.15]arenewly presentedinthispaper.Figure9AandBshowtheLPCs
3DGeologicMappingofMadisonCounty,Tennessee

Figure5.Holocenelowland floodplainalluviumthicknessmeasurements.Themaponthetoprightshowsnumberedlocationsof floodplaintopographic1-mLidarprofilesandcorrespondingbridgemeasurementswiththewhitelineshowingtheborderofMadisonCounty.The1–8 floodplainsurfaceprofilesand floodplainthicknessmeasurementsarelocatedin “A.” Reddotisbottomofchannelmeasuredatbridgelocations.
Harrison,Tohidi,VanArsdale,Cramer,andArellano

Figure6.IsopachmapsoftheLowlandHolocene floodplainalluvium(A),Pliocene/Pleistoceneterracealluvium(B),ClaiborneGroup(C), WilcoxGroup(D),PortersCreekClay(E),andCretaceousstrata(F).Contoursareinmeterswithrespecttosealevel.

Figure7.3DmodelofthesurfaceandsubsurfacegeologyofMadisonCounty.ColorscorrespondtocolorsusedinFigure2A.Modelis50Xverticalscale.3DanimationisinAppendixB. 3DGeologicMappingofMadisonCounty,Tennessee
for floodplainalluviumandnon-floodplainstrataforthe probabilityofexceedingLPIof5and15denotedasP [LPI.5]andP[LPI.15]versustheratioofPGAover magnitudescalingfactor(MSF).MSFcorrectsforearthquakemagnitudesotherthan7.5andiscomputedusing therevisedrelationshipbyIdriss(1999).
Aswasexpected,theForkedDeerRiversandHatchie Rivertributary floodplainalluviumLPCsaresignificantlyhigherthanthenon-floodplainstrataLPCsfor bothP[LPI.5]andP[LPI.15]duetoashallowgroundwatertableandthepresenceofmoresandysoils. Crameretal.(2023)evaluatedearthquakeliquefaction potentialsforMadisonCountyoverarangeofNew Madridearthquakemagnitudesandepicenterlocations. OnesuchevaluationwasmadeassumingaM7.3Axial faultearthquake.Suchanearthquakewouldresultinan LPI . 5onthe floodplainsinMadisonCounty(Figure 3),thusresultinginmoderateliquefactionpotential.
Holocenealluvium,withestimatedthicknessesrangingfrom1to9m,underliestheMiddleForkandSouth ForkofForkedDeerRiverandHatchieRivertributary
floodplainsinMadisonCounty.Thesurfacegeologyof MadisonCountyalsoconsistsofextensivePliocene/ Pleistoceneriverterracesthathavebeenincisedby Holocenerivers.WespeculatethattheterracesofMadisonCountyareremnantheadwater floodplainsofthe ancestralMississippi/Ohioriver.TherearenoradiometricdatesfortheMadisonCountyterraces,butitis believedthattheterracesareequivalenttothosemapped inwesternmostTennessee(Saucier,1987;VanArsdale etal.,2007;Lumsdenetal.,2016;Odumetal.,2020; Harrison,2022;Reichenbacheretal.,2022).Specifically, thehighestMadisonCountyterracemaybeequivalent tothe3.6MaUplandComplexandsequentiallylower terracesequivalenttotheHenderson,Humboldt,and Hatchieterracespreservedinthedownstreamreachesof theForkedDeerRiverinDyerandLauderdalecounties andtheHatchieRiverinLauderdaleandTiptoncounties (Figure1A)(Harrison,2022;Reichenbacheretal., 2022).Thisterraceinterpretationisconsistentwiththe regionalterracemappingbySaucier(1987)whereinhe mappedHumboldtandHatchieterracesalongthe HatchieRiverinsouthwesternMadisonCounty. Surfaceandsubsurfacegeologicmappinghasprovidedthe3Dgeology(Figure7andAppendixB)and

Figure8.Twopercent–in–50yearhazardmapsshowingthe2014U.S.GeologicalSurvey’snationalseismichazardmapforsiteclassBCconditionsfor(A)peakgroundacceleration(PGA)and(B)1.0secondspectralacceleration.(C)and(D)equivalenthazardmapsaccountingforthe effectsoflocalgeologyforMadisonCounty(fromCrameretal.,2023). Harrison,Tohidi,VanArsdale,Cramer,andArellano
thePliocene-QuaternarygeologichistoryofMadison County.Thisresearchisofvaluetothosewhoseeksubsurfaceinformation,suchaspotentialsandandgravel resourcesintheriverterracesofMadisonCounty.As showninFigure8,thelocalnear-surfacegeologysignificantlyinfluencestheexpectedgroundmotionsduring futureearthquakesand,thus,providesamoreaccurate anddetailedseismichazardassessmentthantheuniform regionalgeologyusedinthe2014USGSseismichazard maps(Petersenetal.,2014).Whencomparingthe groundmotionmapinthisstudywiththeUSGSseismic hazardmapsatshortperiods(PGA),thesurfacegeology
de-amplifiesthegroundmotioneffectsinwesternMadisonCountyandamplifiestheseeffectsineasternMadisonCounty(Figure8).Thisisduetoanincreasein consolidationintheCretaceousstrataandcloserproximitytotheNewMadridearthquakesourceinthewest. Whencomparing1.0-secondhazardmaps,thereisan overallincreaseinground-shakinghazardinMadison Countythatdependsonsoilstiffnessanddistancefrom theearthquakesource.TheLPCsandtheassociatedliquefactionhazardmapsdevelopedforMadisonCounty indicatethatliquefactionpotentialishigherintheForked DeerRiverandHatchieRivertributary floodplainsdueto
3DGeologicMappingofMadisonCounty,Tennessee

Figure9.MadisonCountyliquefactionpotentialindex(LPI)–basedliquefactionprobabilitycurves(LPCs)of floodplains(A)andnon-floodplains (B)fromstandardpenetrationtestdata.ThegraphsshowtheprobabilityofexceedingLPIof5and15versustheratioofpeekgroundacceleration overmagnitudescalingfactor.TheLPCsforP[LPI.5]wereintroducedinCrameretal.(2023),buttheLPCsforP[LPI.15]arenewtothis paper.
shallowgroundwatertableandthepresencesandysoils. ThisstudyofMadisonCounty,Tennessee,furtherillustratestheimportanceofknowingthelocalnear-surface stratigraphyandstratathicknessintheappraisalofpotentialseismicgroundshakingandliquefaction.
WethankLukeEwing,WilliamMann,andElaine FoustoftheTennesseeDepartmentofEnvironmentand Conservation(TDEC),andtheU.S.ArmyCorpsof Engineers,theTennesseeDepartmentofTransportation, andConstructionMaterialsLaboratory,Inc.,forproviding dataneededinthisproject.Wealsoacknowledgethe importanceofthequadranglesmappedbyVinceAntonacci ofTDEC,whichwereintegralinmakingthisgeological model,andtheJacksonEnergyAuthorityandDr.John Smithforprovidingwellgroundwaterdata.
ANTONACCI,V. AND HOYAL,M.,2011,GeologicMapoftheMedina Quadrangle,Tennessee:StateofTennesseeDepartmentofEnvironmentandConservation,DivisionofGeology,scale1:24,000.
ANTONACCI,V. AND HOYAL,M.,2012a,GeologicMapoftheAdair Quadrangle,Tennessee:StateofTennesseeDepartmentofConservation,DivisionofGeology,scale1:24,000.
ANTONACCI,V. AND HOYAL,M.,2012b,GeologicMapoftheHumboldt Quadrangle,Tennessee:StateofTennesseeDepartmentofConservation,DivisionofGeology,scale1:24,000.
ANTONACCI,V. AND HOYAL,M.,2014,GeologicMapoftheBellsQuadrangle,Tennessee:StateofTennesseeDepartmentofConservation,DivisionofGeology.DraftOpenFileMap,scale1:24,000.
BROWN,D.L.,1968a,GeologicMapoftheHendersonQuadrangle, Tennessee:StateofTennesseeDepartmentofConservation,DivisionofGeology,scale1:24,000.
BROWN,D.L.,1968b,GeologicMapoftheLurayQuadrangle,Tennessee:StateofTennesseeDepartmentofConservation,Division ofGeology,scale1:24,000.
CHIU,J.M.;JOHNSTON,A.C.; AND YANG,Y.T.,1992,Imagingthe activefaultsofthecentralNewMadridseismiczoneusingPANDA arraydata: SeismologicalResearchLetters,Vol.63,pp.375–393.
COX,R.T.;CHERRYHOMES,J.;HARRIS,J.B.;LARSEN,D.;VAN ARSDALE, R.B.; AND FORMAN,S.L.,2006,PaleoseismologyofthesoutheasternReelfootriftinwesternTennesseeandImplicationsforintraplatefaultzoneevolution: Tectonics,Vol.25,pp.1–17.
COX,R.T.;LUMSDEN,D.N.; AND VAN ARSDALE,R.B.,2014,Possible relictmeandersofthePlioceneMississippiRiverandtheirimplications: JournalGeology,Vol.122,pp.609–622.
COX,R.T.;VAN ARSDALE,R.B.;HARRIS,J.B.; AND LARSEN,D.,2001, NeotectonicsofthesoutheasternReelfootRiftzonemargin,centralUnitedStates,andimplicationsforregionalstrainaccommodation: Geology,Vol.29,pp.419–422.
COX,R.T.;VAN ARSDALE,R.;CLARK,D.;HILL,A.; AND LUMSDEN,D., 2013,Arevisedpaleo-earthquakechronologyonthesoutheast ReelfootriftmarginnearMemphis,Tennessee: Seismological ResearchLetters,Vol.84,pp.402–408.
CRAMER,C.H.,2006,Quantifyingtheuncertaintyinsiteamplification modelinganditseffectsonsite-specificseismic-hazardestimation intheMississippiembaymentandadjacentarea: BulletinSeismologicalSocietyAmerica,Vol.96,pp.2008–2020.
CRAMER,C.H. AND BOYD,O.S.,2014,WhytheNewMadridEarthquakesareM7-8andtheCharlestonEarthquakeis »M7: Bulletin SeismologicalSocietyAmerica,Vol.104,pp.2884–2903.doi:10. 1785/0120120257
CRAMER,C.H.;DHAR,M.S.; AND ARELLANO,D.,2018a,Updateofthe urbanseismicandliquefactionhazardmapsforMemphisand ShelbyCounty,Tennessee:liquefactionprobabilitycurvesand2015 hazardmaps: SeismologicalResearchLetters,Vol.89,pp.688–701.
CRAMER,C.H.;VAN ARSDALE,R.;ARELLANO,D.;PEZESHK,S.;HORTON, S.;WEATHERS,T.;NAZEMI,N.;JIMENEZ,J.;TOHIDI,H.; AND OGWENO, L.,2018b,SeismicandliquefactionhazardmapsforLakeCounty, northwesternTennessee: GeologicalSocietyAmericaAbstracts Programs,Vol.50,No.3.doi:10.1130/abs/2018SE-312570
CRAMER,C.H.;VAN ARSDALE,R.;ARELLANO,D.;PEZESHK,S.;HORTON, S.P.;WEATHERS,T.;NAZEMI,N.;TOHIDI,H.;REICHENBACHER,R.; HARRISON,V.;BHATTARAI,R.;AKHANI,M.;BOUZEID,K.; AND PATTERSON,G.L.,2023,Seismicandliquefactionhazardmapsfor filewesternTennesseecounties: SeismologicalResearchLetters, Vol.94,pp.2813–2830.
CRAMER,C.H.;VAN ARSDALE,R.;HARRISON,V.;ARELLANO,D.; PEZESHK,S.;HORTON,S.P.;WEATHERS,T.;NAZEMI,N.;JIMENEZ,J.; TOHIDI,H.; AND OGWENO,L.P.,2019, LakeCountySeismicand LiquefactionHazardMaps:CenterforEarthquakeResearchand InformationReport,129p.
CRAMER,C.H.;VAN ARSDALE,R.;HARRISON,V.;ARELLANO,D.;TOHIDI, H.; AND BHATTARAI,R.,2021, TiptonCountySeismicandLiquefactionHazardMaps:CenterforEarthquakeResearchandInformationReport,89p.
CRAMER,C.H.;VAN ARSDALE,R.;HARRISON,V.;ARELLANO,D.;TOHIDI, H.;BHATTARAI,R.;PEZESHK,S.; AND SENEJANI,M.,2022, Madison CountySeismicandLiquefactionHazardMaps:CenterforEarthquakeResearchandInformationReport,99p.
CRAMER,C.H.;VAN ARSDALE,R.;HARRISON,V.;BOUZEID,K.;ARELLANO, D.;TOHIDI,H.;PEZESHK,S.;HORTON,S.P.;BHATTARAI,R.;NAZEMI, N.; AND FARHADI,A.,2020a, LauderdaleCountySeismicandLiquefactionHazardMaps:CenterforEarthquakeResearchandInformationReport,85p.
CRAMER,C.H.;VAN ARSDALE,R.;REICHENBACHER,R.;ARELLANO,D.; TOHIDI,H.;PEZESHK,S.;HORTON,S.;BHATTARI,R.;NAZEMI,N.; AND FARHADI,A.,2020b, DyerCountySeismicandLiquefactionHazard Maps:CenterforEarthquakeResearchandInformationReport,89p. CSONTOS,R. AND VAN ARSDALE,R.,2008,NewMadridseismiczone faultgeometry: Geosphere,Vol.4,No.5,pp.802–813.
CUPPLES,W. AND VAN ARSDALE,R.,2014,Thepreglacial “Pliocene” MississippiRiver: JournalGeology,Vol.122,pp.1–15. GOMBERG,J.;WALDRON,B.;SCHWEIG,E.;HWANG,H.;WEBBERS,A.; VAN ARSDALE,R.;TUCKER,K.;WILLIAMS,R.;STREET,R.;MAYNE,P.; STEPHENSON,W.;ODUM,J.;CRAMER,C.;UPDIKE,R.;HUTSON,S.; AND BRADLEY,M.,2003,LithologyandShear-WaveVelocityinMemphis, Tennessee: SeismologicalSocietyofAmerica,Vol.93,No3,doi:10. 1785/0120020164
HARRISON,V.J.,2022,3DgeologicmappingofLauderdaleandTipton Counties,Tennessee:Ageostatisticalapproach:Memphis,TN, DepartmentofEarthSciences,UniversityofMemphis,MSThesis, 112p.doi:10.1785/0220230036
IDRISS,I.M.,1999,Presentationnotes:anupdateoftheSeed-Idriss simplifiedprocedureforevaluatingliquefactionpotential.In ProceedingsofTRBWorkshoponNewApproachestoLiquefaction: FederalHighwayAdministration,Washington,D.C.,AnnualPublicationNo.FHWARD-99-165.
IWASAKI,T.;TATSUOKA,F.;TOKIDA,K.; AND YASUDA,S.,1978,Apracticalmethodforassessingsoilliquefactionpotentialbasedoncase studiesatvarioussitesinJapan.In Proceedingsofthe2ndInternationalConferenceonMicrozonationforSaferConstructionResearch andApplication,pp.885–896.
IWASAKI,T.;TOKIDA,K.;TATSUOKA,F.;WATANABE,S.;YASUDA,S.; AND SATO,H.,1982,Microzonationforsoilliquefactionpotentialusing simplifiedmethods.In Proceedings3rdInternationalConference onMicrozonation,pp.1319–1330.
JEWEL,J.W.,2006,GeologicMapoftheJacksonNorthQuadrangle, Tennessee:StateofTennesseeDepartmentofEnvironmentand Conservation,DivisionofGeology,scale1:24,000.
LUMSDEN,D.N.;COX,R.T.;VAN ARSDALE,R.B.; AND CUPPLES,W.B., 2016,PetrologyofPlioceneMississippiRiveralluvium:Provenanceimplications: JournalGeology,Vol.124,pp.501–517.
MARKEWICH,H.H.;WYSOCKI,D.A.;PAVICH,M.J.;RUTLEDGE,E.M.; MILLARD,H.T.;RICH,F.J.;MAAT,P.B.;MEYER,R..; AND MCGEEHIN, J.P.,1998,PaleopedologyplusTL,10Be,and14Cdatingastools instratigraphicandpaleoclimaticinvestigations,MississippiRiver valley,U.S.A.: QuaternaryInternational,Vol.51,pp.143–167. doi:10.1016/s1040-6182(97)00041-4
ODUM,W.;HOFMANN,F.;VAN ARSDALE,R.; AND GRANGER,D.,2020, New 26Al/10Beand(U-Th)/Heconstraintsontheageofthe UplandComplex,centralMississippiRiverValley: Geomorphology,Vol.371,pp.1–9.
PARKS,W.B.,1968a,GeologicMapoftheBeechBluffQuadrangle, Tennessee:StateofTennesseeDepartmentofConservation,DivisionofGeology,scale1:24,000.
PARKS,W.B.,1968b,GeologicMapoftheCedarGroveQuadrangle, Tennessee:StateofTennesseeDepartmentofConservation,DivisionofGeology,scale1:24,000.
PARKS,W.B.,1968c,GeologicMapoftheClaybrookQuadrangle, Tennessee:StateofTennesseeDepartmentofConservation,DivisionofGeology,scale1:24,000.
PARKS,W.B.,1968d,GeologicMapoftheJacksonSouthQuadrangle, Tennessee:StateofTennesseeDepartmentofConservation,DivisionofGeology,scale1:24,000.
PARKS,W.B.,1968e,GeologicMapoftheJunoQuadrangle,Tennessee:StateofTennesseeDepartmentofConservation,Divisionof Geology,scale1:24,000.
PARKS,W.B.,1968f,GeologicMapoftheMedonQuadrangle,Tennessee:StateofTennesseeDepartmentofConservation,Division ofGeology,scale1:24,000.
PARKS,W.S.,1968g,GeologicMapoftheBeechBluffQuadrangle, Tennessee:StateofTennesseeDepartmentofConservation,DivisionofGeology.DraftOpenFileMap,scale1:24,000.
PETERSEN,M.D.;MOSCHETTI,M.;POWERS,P.;MUELLER,C.;HALLER,K.; FRANKEL,A.;ZENG,Y.;REZAEIAN,S.;HARMSEN,S.;BOYED,O.;
FIELD,N.;CHEN,R.;RUKSTALES,K.;LUCO,N.;WHEELER,R.; WILLIAMS,R.; AND OLSEN,A.,2014, The2014UpdateoftheUnited StatesNationalSeismicHazardModels:UnitedStatesGeological Survey,OFR2014-X1091,255p.
REICHENBACHER,R.;VAN ARSDALE,R;COX,R.; AND CRAMER,C.,2022, NewMadridSeismicZoneinDyerCounty,Tennessee: EnvironmentalEngineeringGeoscienceJournal,Vol.28,No.2,pp.147–171.
RIX,G.J. AND ROMERO-HUDOCK,S.,2006, LiquefactionpotentialmappinginMemphisandShelbyCounty,Tennessee:ReporttoU.S. GeologicalSurvey,Denver,Colorado,27p.
RODBELL,D.T.,1996, Subdivision,subsurfacestratigraphy,andestimatedageof fluvialterracedepositsinnorthwesternTennessee: U.S.GeologicSurveyBulletin,Vol.2128,24p.
SAUCIER,R.T.,1987, GeomorphologicalinterpretationsoflateQuaternaryterracesinwesternTennesseeandtheirregionaltectonicimplication:U.S.GeologicSurveyProfessionalPaper1336-A,19p.
SAUCIER,R.T.,1994, Geomorphologyandquaternarygeologichistory oftheLowerMississippiValley:Vicksburg,Mississippi:U.S.Army EngineerWaterwaysExperimentStation,Vol.1,364p.,andVol.2, mapplates.
SCHRADER,T.P.,2008, PotentiometricsurfaceintheSparta-Memphis aquiferoftheMississippiembaymentSpring2007:U.S.GeologicalSurveyScientificInvestigationsMap3014.
SEED,H.B. AND IDRISS,I.M.,1971,Simplifiedprocedureforevaluatingsoilliquefactionpotential: JournalSoilMechanicsFoundationsDivision,Vol.97,No.9,pp.1249–1273.
TOHIDI,H.,2022,Evaluationofsurficialnon-liquefiablesoillayer impactsonliquefactionsurfacemanifestationoftheWestTennessee areabasedon finitedifferencemethods:Memphis,TN,Department ofCivilEngineering,UniversityofMemphis,DoctoralDissertation.
TOHIDI,H.;ARELLANO,D.; AND CRAMER,C.H.,2021, InitialliquefactionhazardmappingofnorthwestTennesseebasedonliquefaction probabilitycurves:Geo-Extreme2021,ASCE,ClimaticExtremes andEarthquakeModeling,doi:10.1061/9780784483695.029
TOPRAK,S. AND HOLZER,T.L.,2003,Liquefactionpotentialindex: Fieldassessment: JournalGeotechnicalGeoenvironmentalEngineering,Vol.129,No.4,pp.315–322.
TUTTLE,M.P.;SCHWEIG,E.S.;SIMS,J.D.;LAFFERTY,R.H.;WOLF, L.W.; AND HAYNES,M.L.,2002,Theearthquakepotentialofthe NewMadridseismiczone: SeismologicalSocietyAmericaBulletin,Vol.92,pp.2080–2089.
TUTTLE,M.P.;WOLF,L.W.;STARR,M.E.;VILLAMOR,P.;MAYNE,P.W.; LAFFERTY,R.H.;etal.,2019,EvidenceforlargeNewMadridearthquakesaboutA.D.0andB.C.1050,CentralUnitedStates: SeismologicalResearchLetters,Vol.90,No.3,pp.1393–1406.
VAN ARSDALE,R.B.;BRESNAHAN,R.P.;MCCALLISTER,N.S.; AND WALDRON,B.,2007,TheUplandComplexofthecentralMississippiRiverValley:Itsorigin,denudation,andpossibleroleinreactivationoftheNewMadridseismiczone.InStein,S.and Mazzotti,S.(Editors),ContinentalIntraplateEarthquakes:Science,Hazard,andPolicyIssues:GeologicalSocietyofAmerica SpecialPaper425,pp.177–192.
YOUD,T.L. AND IDRISS,I.M.,2001,LiquefactionResistanceofSoils: SummaryReportfromthe1996NCEERand1998NCEER/NSF WorkshopsonEvaluation992ofLiquefactionResistanceofSoils: JournalGeotechnicalGeoenvironmentalEngineering,Vol.127, No.4,pp.297–313.
ZHU,Y.;WANG,Z.;CARPENTER,N.S.;WOOLERY,E.W.; AND HANEBERG, W.C.,2021,Mappingfundamental-modesiteperiodsandamplificationsfromthicksediments:AnexamplefromtheJacksonPurchaseregionofwesternKentucky,centralUnitedStates: Bulletin SeismologicalSocietyAmerica,Vol.111,pp.1868–1884.doi:10. 1785/0120200300
AppendixAcontainsspreadsheetsofthedatapoints usedtocreatethestructurecontourmaps.AppendixB containsavideoanimationofthe3Dgeologicalmodel ofMadisonCounty,Tennessee.
TheAppendicescanbefoundat: https://www.aegweb. org/e-eg-supplements 3DGeologicMappingofMadisonCounty,Tennessee

512CavettStreet,VanWert,OH45891
1516IllinoisStreet,Golden,CO80401
KeyTerms: Landslides,Seismic,Colorado
OnNovember7,1882,thelargestearthquakein Colorado’srecordedhistoryimpactedanareaestimated tobe470,000km2 (181,000mi2).Whiledifferingaccounts ofintensitywererecordedbyvariouscommunitiesat thetime,thedistributionofreporteddamagesindicated alikelymagnitudebetween6and7.Thisstudyaimed torefinethisestimateusinglandslideswithintheregion thatwerelikelytobeco-seismic.Previouslyproposed methodologywasusedtocalculatesurfaceroughness valuesforlandslidesmappedatvariousscalesdigitized andcompiledbytheColoradoGeologicalSurvey.A searchradiusof54kmsurroundingtheepicentral estimatefortheearthquakewaschosentoevaluate therelativeagesoflandslideswithinthedefinedregion. Whiletheproposedmethodologyrequiresacalibration usingage-datedlandslideswithinthedataset,theuse ofsurfaceroughnessasarelativeagescaleprovedto besufficientlyusefultoconstrainanareawithinthe studythatshowedanomalouslyhighsurfaceroughnessvalues.Basedonthisearthquakebeingoneof theonlylargeearthquakestohaveoccurredinrecorded historyinColorado,aswellasalackofwidedistributionintheanomalousregionexpectedfromastorm event,thisanomalousareacontaininghighsurface roughnesslandslidesacrossvaryingbaselithologieswasconcludedtohaveahighprobabilityof beingco-seismicallyinduced.Utilizingthisinformation, anewinitiationellipsewasgeneratedfromthesedata.
OnNovember7,1882,thelargestearthquakerecorded inColorado ’shistoryaffectedanareaestimatedtobe 470,000km 2 (181,000mi 2 ).ThereportedMercalli intensitiesatthetimerangedfromIItoVII,andbyutilizingregressionequationsthatcomparedintensitytoarea
*Correspondingauthoremail: jmarchlewicz@mines.edu

felt,KirkhamandRogers(1986)assignedamagnitudeof ML6.2 6 0.3.Whilemanyattemptshavebeenmadeby priorresearcherstoconstraintheepicenterofthishistoric earthquake,itisstilluncertainonpreciselywhichfault theslipoccurred.WhileColoradohasnothadadditional earthquakesclosetothismagnitudesince1882orin recordedhistory,itisimportanttoattempttodecipher wherethisearthquakeoccurredsothatadditionalstudiesof thefaultcanbeconductedtoseeifanotherearthquakelike theonefeltin1882ispossibletooccuragain.
Thepurposeofthisstudywastoconstrainanewepicenterestimateforthe1882earthquakebyutilizingco-seismic landslidesresultingfromthisevent,adistinctlynew approach.Ifitispossibletodifferentiatethoselandslides thatlikelyoccurredaroundthesametimeasthisearthquake,thentheselandslidescanbeusedtoconfi rmthe currentepicenterestimateoridentifyanewlocation.
Severalpreviousstudieshavebeenundertakentobetter understandthisearthquake.Theprimarystudyonwhich thisresearchisbasedcomesfromKirkhamandRogers (1986),whocompiledreportedintensitiesfollowingthe 1882earthquake.Asstatedwithintheirstudy,basedon theworkofDamesandMoore(1981),itwasfoundthat fewerthan200,000peoplelivedinColoradoatthetime oftheearthquake,withmanylivinginruralareas.Additionally,severalotherfactorscomplicatedtheaccuracy ofhowtheearthquakewasreportedatthetime,withthe earthquakeoccurringonamajorelectiondayaspolls closed,causingsomenewspaperstoentirelyneglect reportingthetremor.Othersourcestendedtoexaggerate theimpactsoftheearthquake’seffectsortosimplynot reportitatall,astheirreadersonlywantedtoreaduplifting stories.Finally,hearsayreportsemergedincertainnewspapers,whereearthquakeeffectsintownswithdamagewere reportedbytownswherenomajordamageoccurred.By attemptingtominimizetheseeffectswhenevaluatingpublishedreportsofdamagefromthisearthquake,Kirkham andRogers(1986)assembledanisoseismalmapfromthis dataset,notingtheparticulardifficultythatemergeddueto

Figure1.KirkhamandRogers(1986)isoseismalmapconstructedutilizingreportedintensitiesfollowingthe1882earthquake.Colorizationprovided byColoradoGeologicalSurvey.
conflictingreportsandasomewhatnonsensicalgeographic distributionofreportedintensities.Afterareevaluationof thereports,andbyassigningdifferinglevelsofcredibility tothepublishedarticlespertainingtodamagereported, theyconstructedanisoseismalmapofthefeltarea,choosingapredictedepicenterthattheystatedintheirreport maybeoffbyuptohalfadegreeoflatitudeorlongitude. Anupdatedandcolorizedversionofthismap(Kirkham andRogers,1986)publishedbytheColoradoGeological Survey(CGS)isshowninFigure1.
PriorreportsfromDamesandMoore(1981)had suggestedanepicenteralongtheDudleyGulchgraben (seelocationonFigure2),butfromradiocarbondating ofunfaulteddepositsabovethefault,KirkhamandRogers (1986)concludedthatnosurfacerupturesalongthatfault hademergedforatleast1,230 6 60years.Additionally, Eckert(1982)thoroughlystudiedtheDudleyGulchgraben andfoundnoevidenceofeitherhistoricorrecentmovementalongthefault.BeforetheDamesandMoorereport, anotherestimatewasmadebyHadsell(1968)utilizing asimilartechniquetoKirkhamandRogers(1986)but
relyingonadifferentweightingofreportedintensities (Figure2).FortheisoseismalmapthatKirkhamand Rogers(1986)generated,thereportedintensitiesfrom ColoradoSpringswereassignedalesscredibleweight thangivenbyHadsell,leadingtoanepicentralestimate farthernorththanHadsellhadpredicted(Figure2).Additionally,theKirkhamandRogers(1986)estimatewaslater givenfurthercredibilitybySpenceetal.(1996),whoanalyzedthe1984LaramieMountainsearthquakeandcomparedthegeneratedisoseismalmapforthateventwith theonecreatedforthe1882earthquake.Fromtheirstudy, itwasproposedthatwhilethefeltareaforthe1882earthquakeshouldlikelyhavebeenlarger,theKirkhamand Rogers(1986)epicenterestimatewasroughlycentralto thisnewproposedfeltarea,consistentwiththedatafound fromthe1984LaramieMountainsisoseismalmap.
Toconductthisstudy,theepicenterestimatemadeby KirkhamandRogers(1986)wasusedasastartingpoint
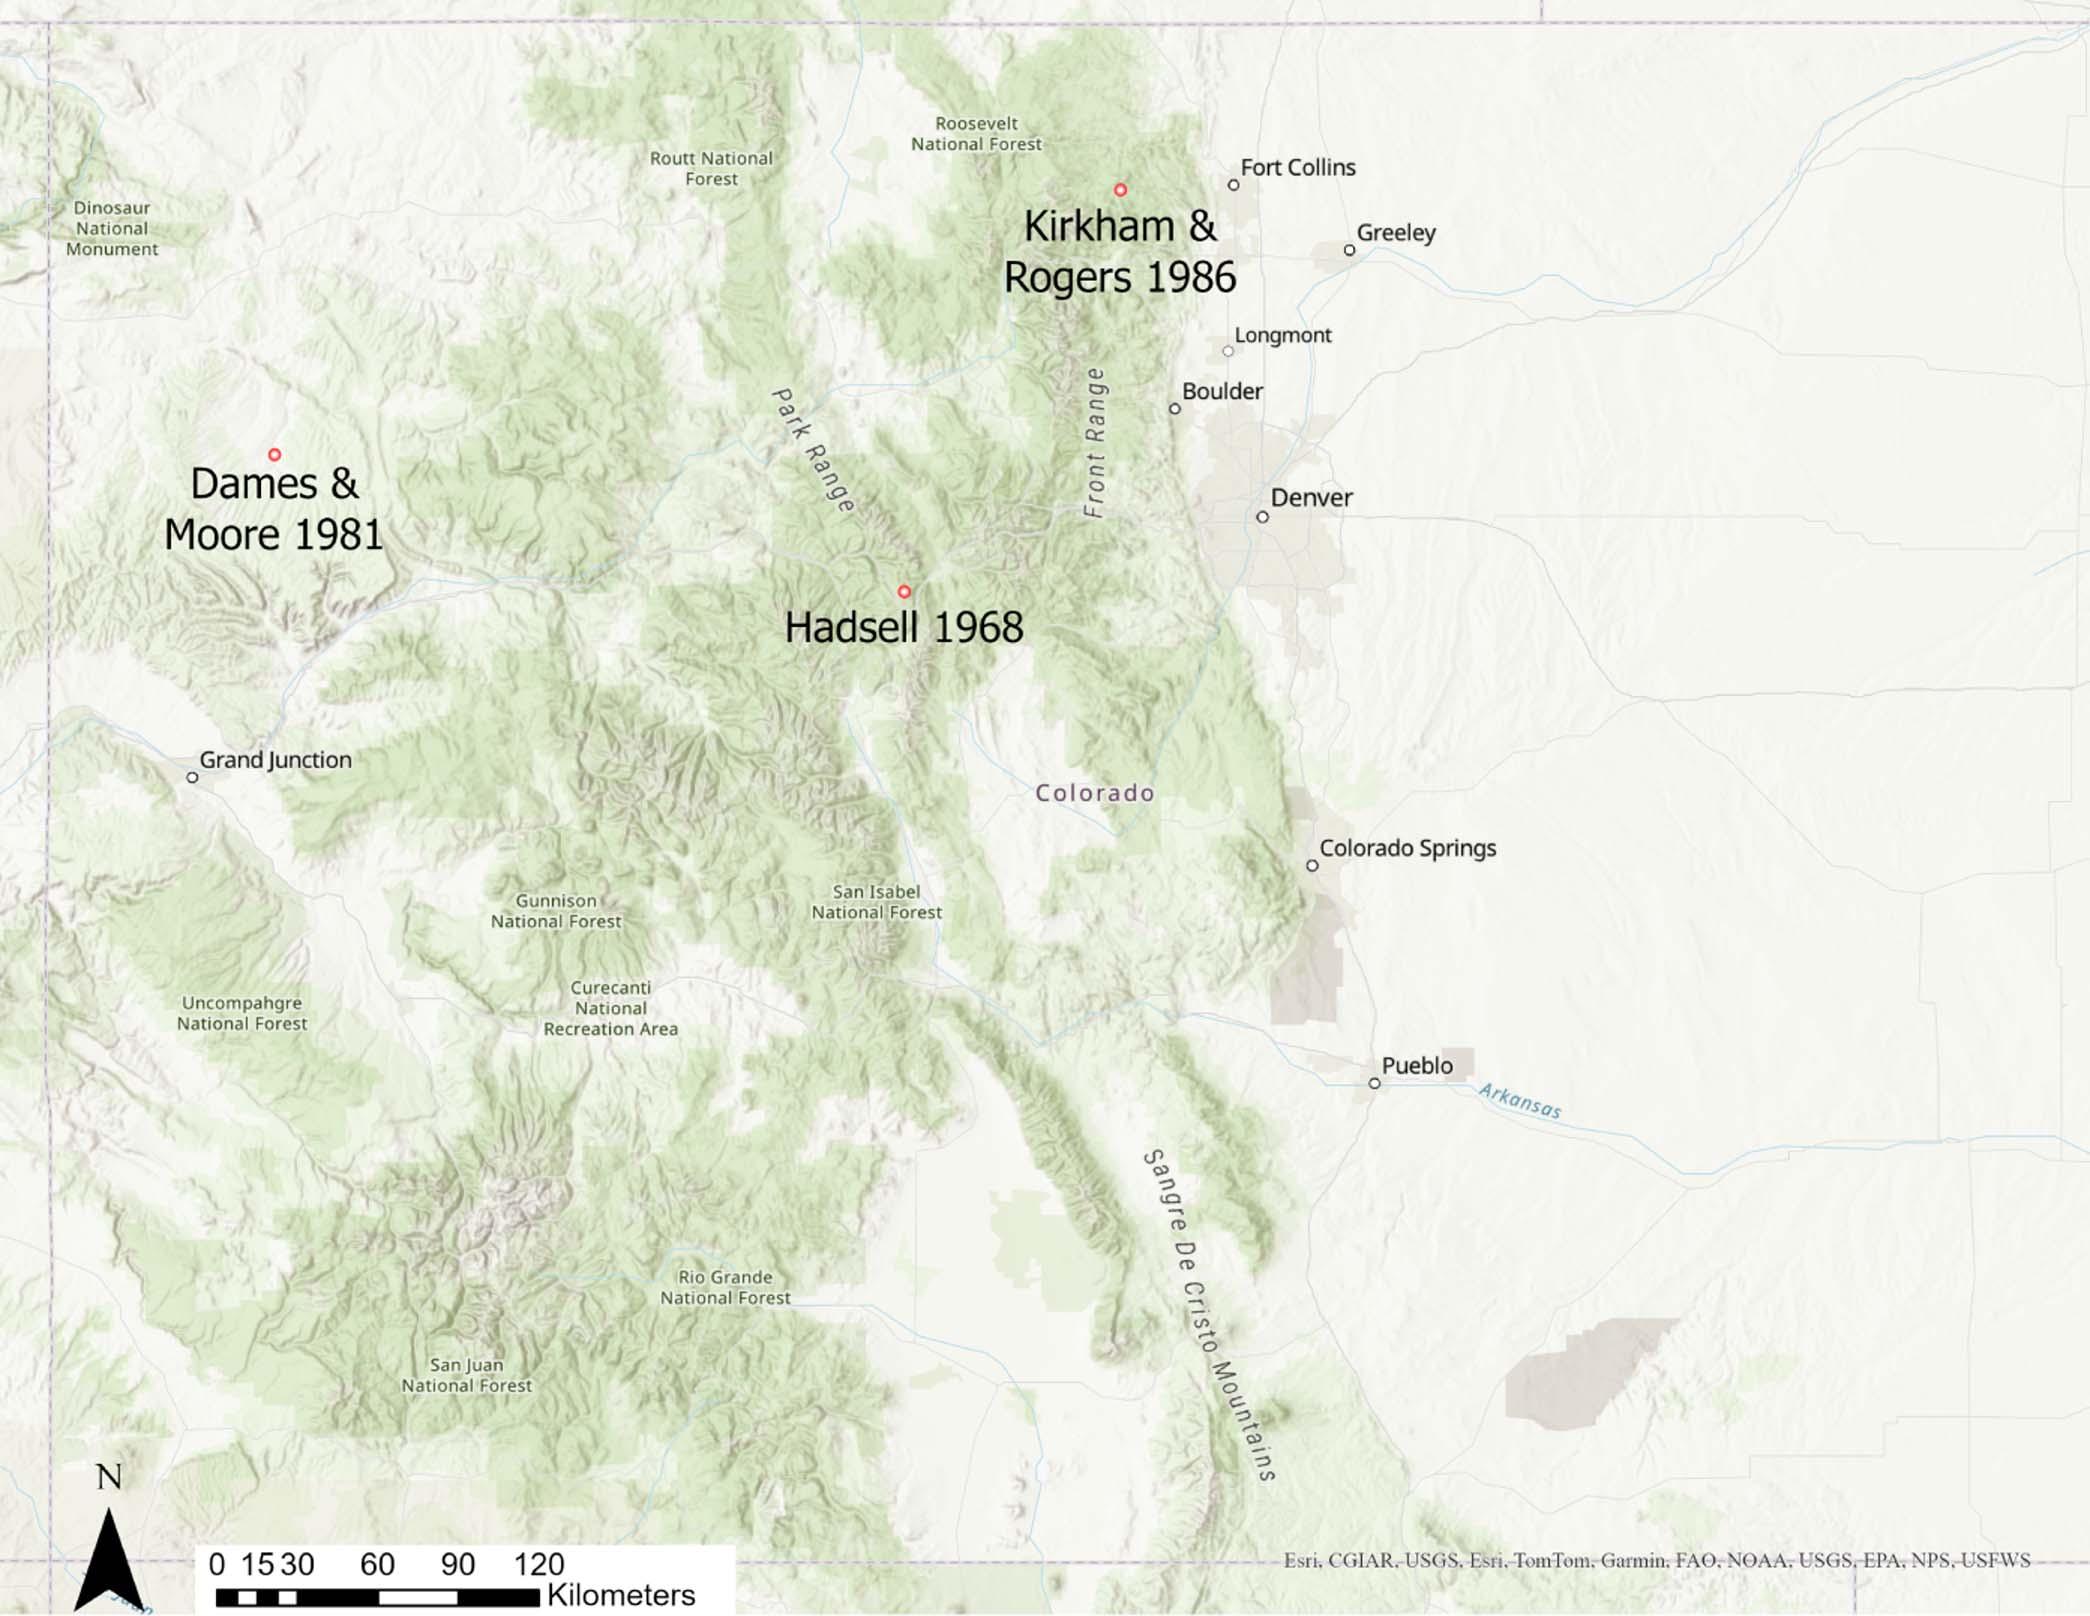
Figure2.Locationsofpredictedepicentersforthe 1882earthquakeproposedbyKirkhamandRogers(1986),DamesandMoore(1981),andHadsell (1968)withinColorado.ESRIbasemapisincludedforreference.
asalikelyzoneforlandslidesinitiatedbytheearthquake. TheKirkhamandRogers(1986)epicenterwasused duetoadditionals upportfortheepicentralareafrom Spenceetal.(1996).Ut ilizingestimatesfromKeefer (1984),amaximumlikelyinitiationradiuswouldbe approximately36kmaroundtheepicentrallocation, witha54kmradiusincludedduetouncertaintyinthe estimatedepicentrallocation.Whileattemptingtoverifythevalidityofthisinitiationradius,archivednewspaperaccountsoftheeventweresearchedinasimilar mannertothatdonebyKirkhamandRogers(1986)to determineifrockfallsorlandslidesbeinginitiated fromthisearthquakewererecorded.From ThePueblo DailyChieftain (1882)publishedonNovember11,1882, anarticletitled “MotherEarth” wasfounddescribing rockfallsandalandslideasrecountedbyranchmenliving intheRockyMountainsnearPueblo,CO,atthetime. Whiletheseaccountsfallwelloutsidetheinitiationradius
predictedbyKeefer(1984),itislikelythatthelowattenuationofseismicenergythroughtheigneous/metamorphic bedrockoftheRockyMountainshelpstoaccountforthese observations.Duetouncertaintiesinthetrueextentofpossibleco-seismiclandslidesinitiatedbythisevent,a54km radiuswaschosenasthelargestsearchradiustorepresent 150%thesizeoftheprimarysearchradius.Anadditional, smallersearchradiusof18kmwasincludedas50%of theprimarysearchradiustoobservevaryingspatialtrends betweentheseregions.Arepresentationofthesearch radiiawayfromtheKirkhamandRogers(1986)epicenter estimateisshowninFigure3,withaninlayofprior mappedlandslidesdigitizedbytheCGSusedtoconduct thisstudy.OncethisdatasetwasloadedintoArcGISPro, thelithologywithinthestudyareawasderivedfrom Tweto(1979),asshowninFigure4.Additionally,light detectionandranging(LiDAR)and1mdigitalelevation model(DEM)dataforthestudyregionwereloaded

Figure3.AreaofinterestwithlandslidesidentifiedbyColoradoGeologicalSurveycoloredbysourceandradiioverlainwithmaximumlandslide initiationradiusdefinedbyKeefer(1984)andFrontRangeepicenterpredictedbyKirkhamandRogers(1986).
throughtheU.S.GeologicalSurvey(USGS)3DElevation Program(3DEP)LidarExplorerapplication(U.S.Geological Survey,2024),andaslopeanglemapwasgenerated,as showninFigure5.
Withinthestudyarea,significantnumbersofCGSidentifiedlandslidesoverlieregionsdesignatedasglacial driftorunconsolidatedmaterial.TheremainderofdesignatedlandslideslieontopofMesozoic-agedsedimentaryclasticrock,theInglesideandFountainFormations, Proterozoicmetamorphicrocks,andgraniticrocksofthe 1700Maagegroup.Fromastudyofthisinformation,the landslidespresentwithinthestudyareagenerallyfellinto twocategories:highslopeangles( .40°)underlainby whatwasconsideredtobecompetentbedrock(igneous andmetamorphosedigneousrock),andshallowerslope angles(,40°)underlainbywhatwasconsideredtobeless competentbedrockorsediments(sedimentaryformations andglacialdrift).
Inadditiontoananalysisofslope,therangeofslope aspectswithinthestudyareawasalsocalculated,using theaspecttoolwithinArcGISPro(Figure6).Following this,asummationofrastercellswithinthedatasetidentifiedby45°aspectincrementswasperformed,andthedata wereexportedtovisualizethequantityofcellsidentified acrosstheentirestudyregionwithinthe54kmsearch radiusaswellasonlyonCGS-identi fi edlandslides. Whiletheseattemptstounderstandandcharacterize thestudyareawereuseful,inordertoidentifylandslides thatwerelikelytobeco-seismic,itwasnecessarytoestimateanageforlandslidesintheregion.Followingthe methodologydefinedbyLaHusenetal.(2016),acalculationofsurfaceroughnesswasperformedforthe611 de fi nedlandslideswithinthedataset.Toconductthis analysis, first,theslopemapgeneratedusingtheUSGS 1mDEMwasclippedtotheextentoflandslidesidentified bytheCGSwithinthestudyareaacrossseveralmapped
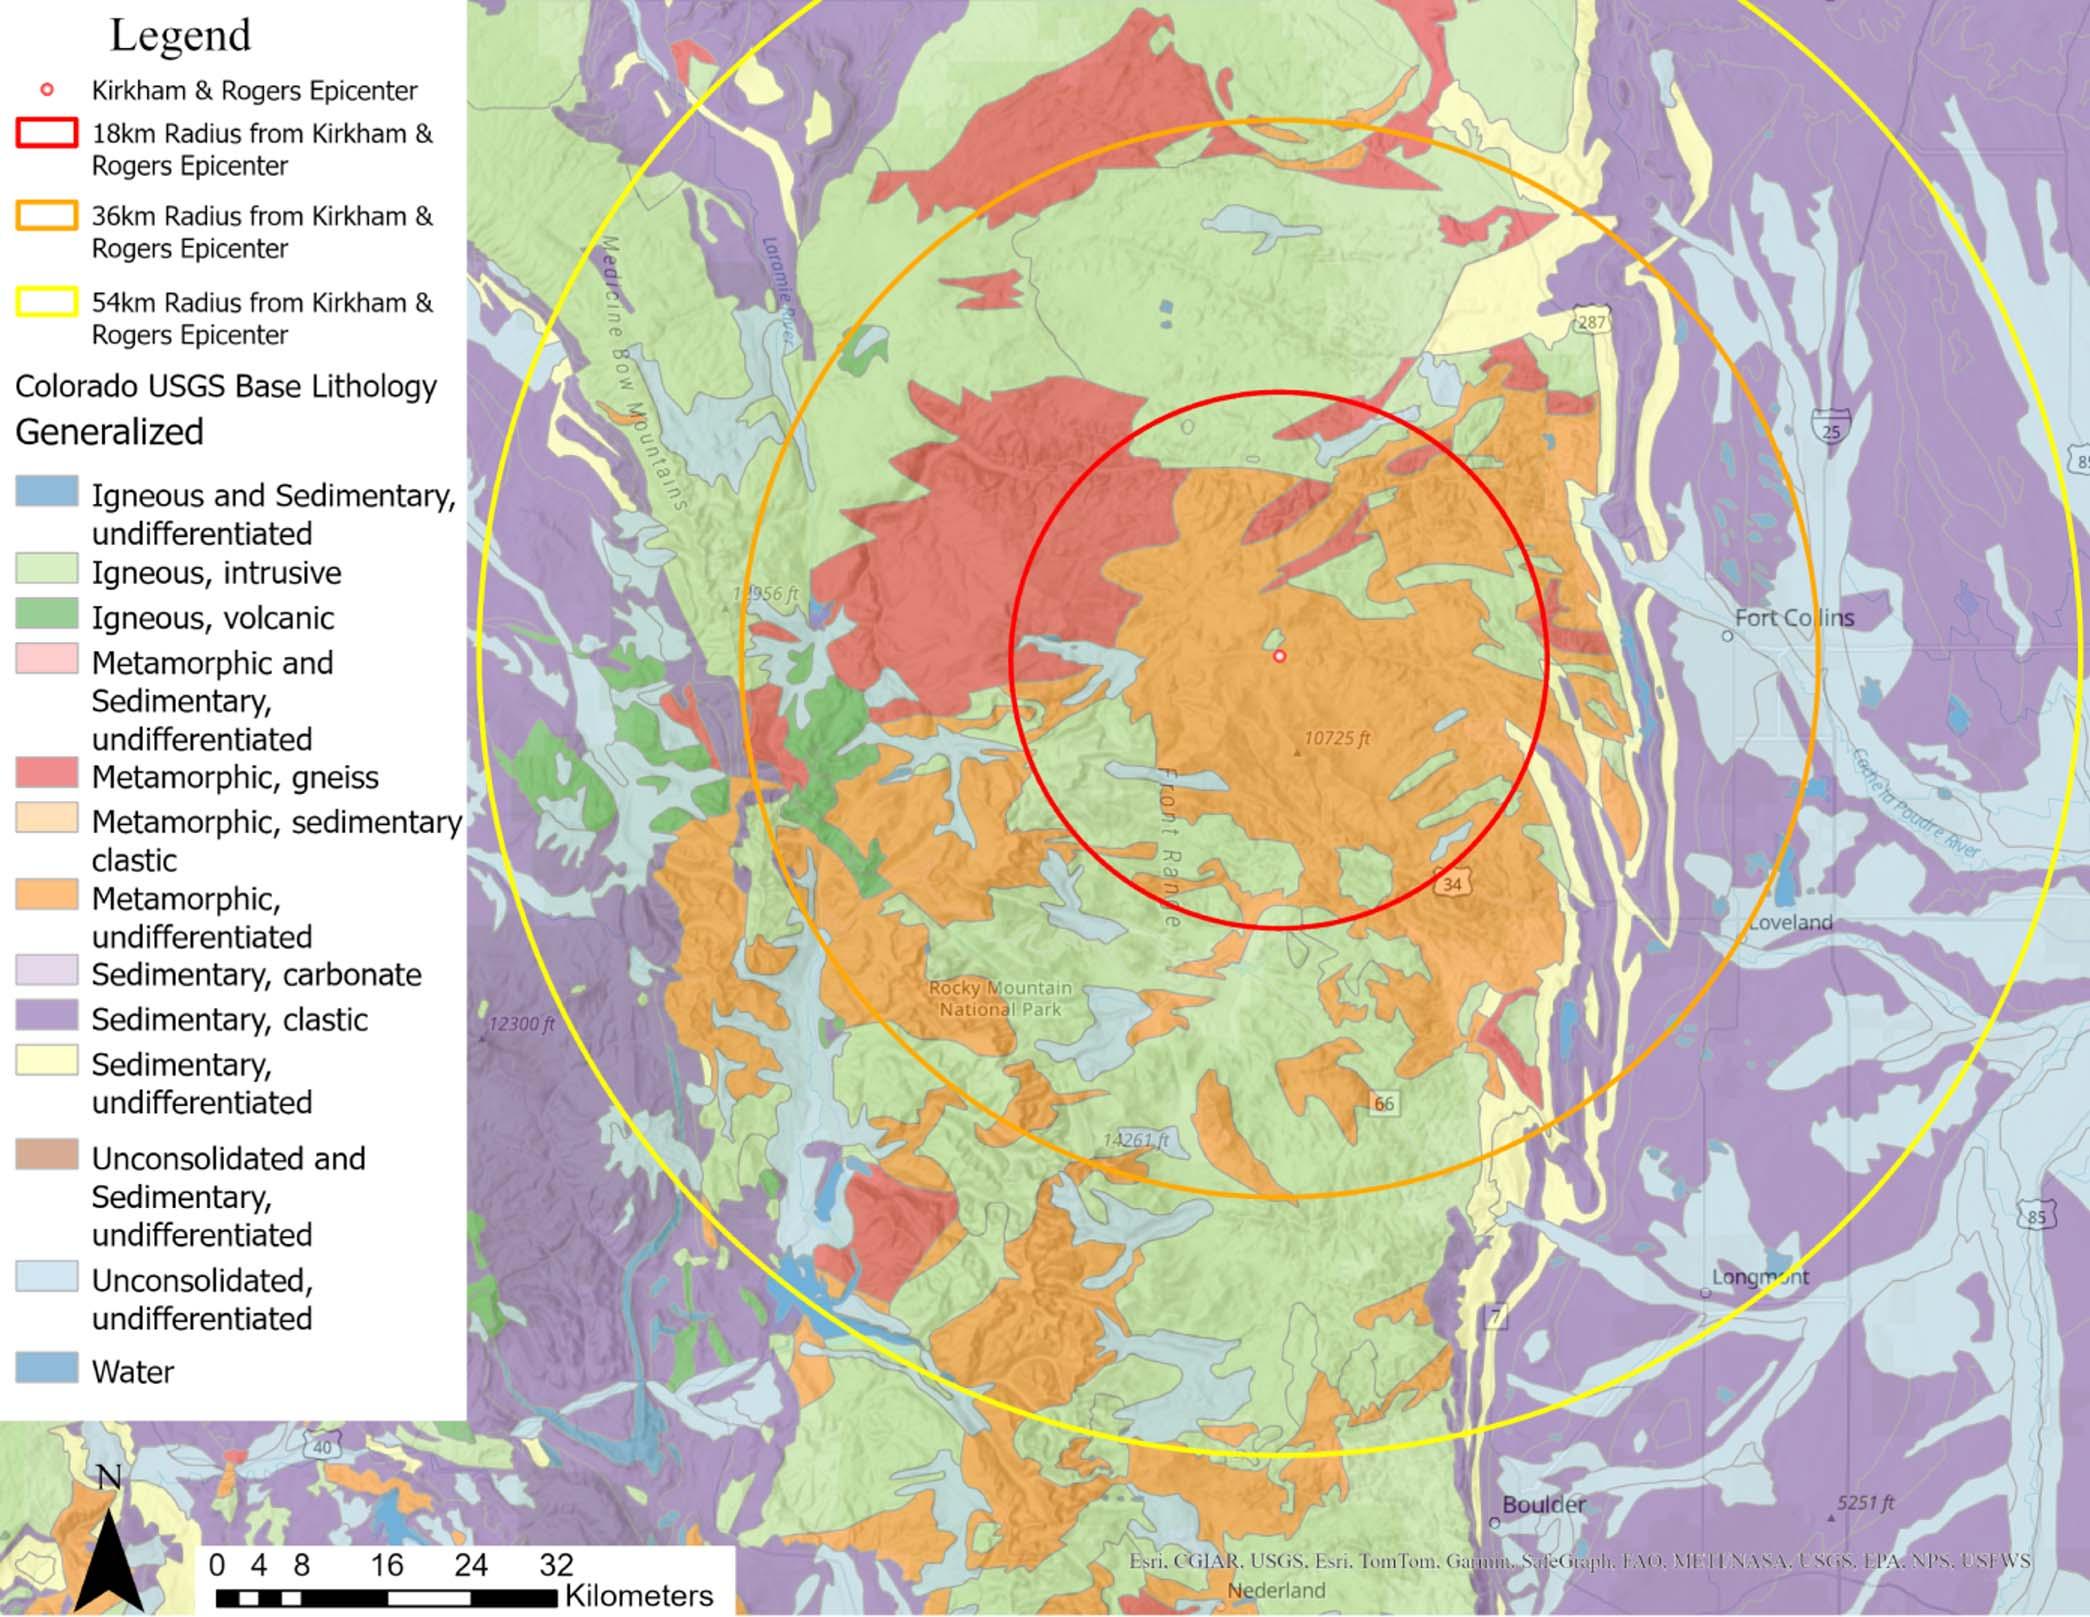
Figure4.GeneralizedlithologyforthestudyareafortheU.S.GeologicalSurvey.ThecentralportionoftheFrontRangeisprimarilydefinedby igneousandmetamorphiccomponents,withsedimentaryandunconsolidatedsedimentslyingtotheeastandwest.Mappingwasconductedby Tweto(1979).
scales(24,000,48,000–100,000,250,000,andBoulder CountyLiDARdataset).Fromthede fi nedmethodology,surfaceroughnessisde fi nedastheaveragestandarddeviationofslopewithinalandslidedeposit.To achievethis,thefocalstatisticstoolwithinArcGISPro wasusedtocalculatethestandarddeviationwithin landslidedepositsfora3m 3 3mwindowpercell. Next,histogramsofrecordedstandarddeviations weregeneratedforeachlandslide,andameanstandarddeviationvaluewasrecordedforeachlandslide. Whiletheproposedmethodologyadvisedtheuseof thezonalstatisticstooltocalculatethemeanofthestandard deviationvaluesassignedtoallpixelswithineachlandslide polygon,ArcGISProwasunabletosuccessfullycomplete thiscalculationforanunknownreason,someanstandard deviationsdeterminedfromhistogramswereusedinstead. Overall,thereisnodifferenceinthemeanvaluesthatwere
calculated,withtheonlydifferencebeingtheamount oftimethatprocessingrequired.Themethodologyfrom LaHusenetal.(2016)alsocallsforacalibrationofthisrelativeage-datingmethodwithabsolutedatingoflandslide depositswithinthedataset,butthiswasbeyondthescope andfundingofthisstudy.Assuch,thisstudyprimarilyfocusedontheuseoftheserelativeageswiththe assumptionthathighercalculatedsurfaceroughness valuesindicatedyoungerlandslidedeposits,andlower valuesindicatedolderlandslidedeposits,duetoyounger landslidedepositsurfaceshavinghadlesstimetoweather tolessvariabletopography.
Followingthesummationofaspectsperrastercell withinboththe54kmstudyareaandonlywithin

Figure5.SlopeanglescalculatedfromU.S.GeologicalSurvey1mdigitalelevationmodelfromlightdetectionandranging(LiDAR)datautilizingthe slopetoolwithinArcGISPro.
CGS-identi fi edlandslides,rosediagramsweregeneratedfromthisprocesssplitbyidentifiedcardinaldirectionsforaspect,illustratedinFigure7.Overall,therose diagramfortheentirestudyareashowsnoclearpattern,as expectedforanindiscriminateanalysisofalargearea. However,fortherosediagramgeneratedonlyforcells identifiedbyCGSaslandslides,aclearpreferenceforE-W orientationsemerges,aswellasadistinctlackofN-Sorientations.Whileitisnotimmediatelyclearwhythistrend exists,itispossiblethatpreferentialweatheringmayoccur onN-Sslopeswithinthestudyarea,whichmadeidenti fi cationoflandslidesmorechallenging,orsimply thatfewerN-S –orientedslopesarepresentwithinthe studyarea.
Followingthecalculationofsurfaceroughnessvalues perlandslide,ananalysisofthesevalueswasconducted toevaluatethedistributionwithineachofthefourscales atwhichlandslidesweremapped,aswellasacombined
setwithallrecordedlandslidesincluded.Figure8shows thedistributionofsurfaceroughnessvaluescalculated withintheentiredataset.Whileafewnotableoutliersexist withinthedata,overallanormaldistributionofroughness valuesappearstoemerge.Additionally,areviewoflandslidesgivenparticularlyhighorlowaveragestandarddeviationvalueswasconductedtoevaluatethevalidityofthe scoring.Notopographicirregularitiesorclearerrorsindata wereseenfortheseoutliers.
Whilethedataappeartofollowaroughlynormaldistributionoverall,thenextstepwastoevaluatewhethera spatialdistributionexistedwithinthedataset.Ifanarea ofanomalouslyhighsurfaceroughnessvaluescanbefound overaregion,thenitispossiblethata “recent” triggering eventcausedtheselandslidestoform.Whilethisstudyused aqualitativeformofagedating,thisdatasetcouldbecalibratedfromquantitativeagedatingoflandslidesincluded withinthedatasetforfurthervalidation.
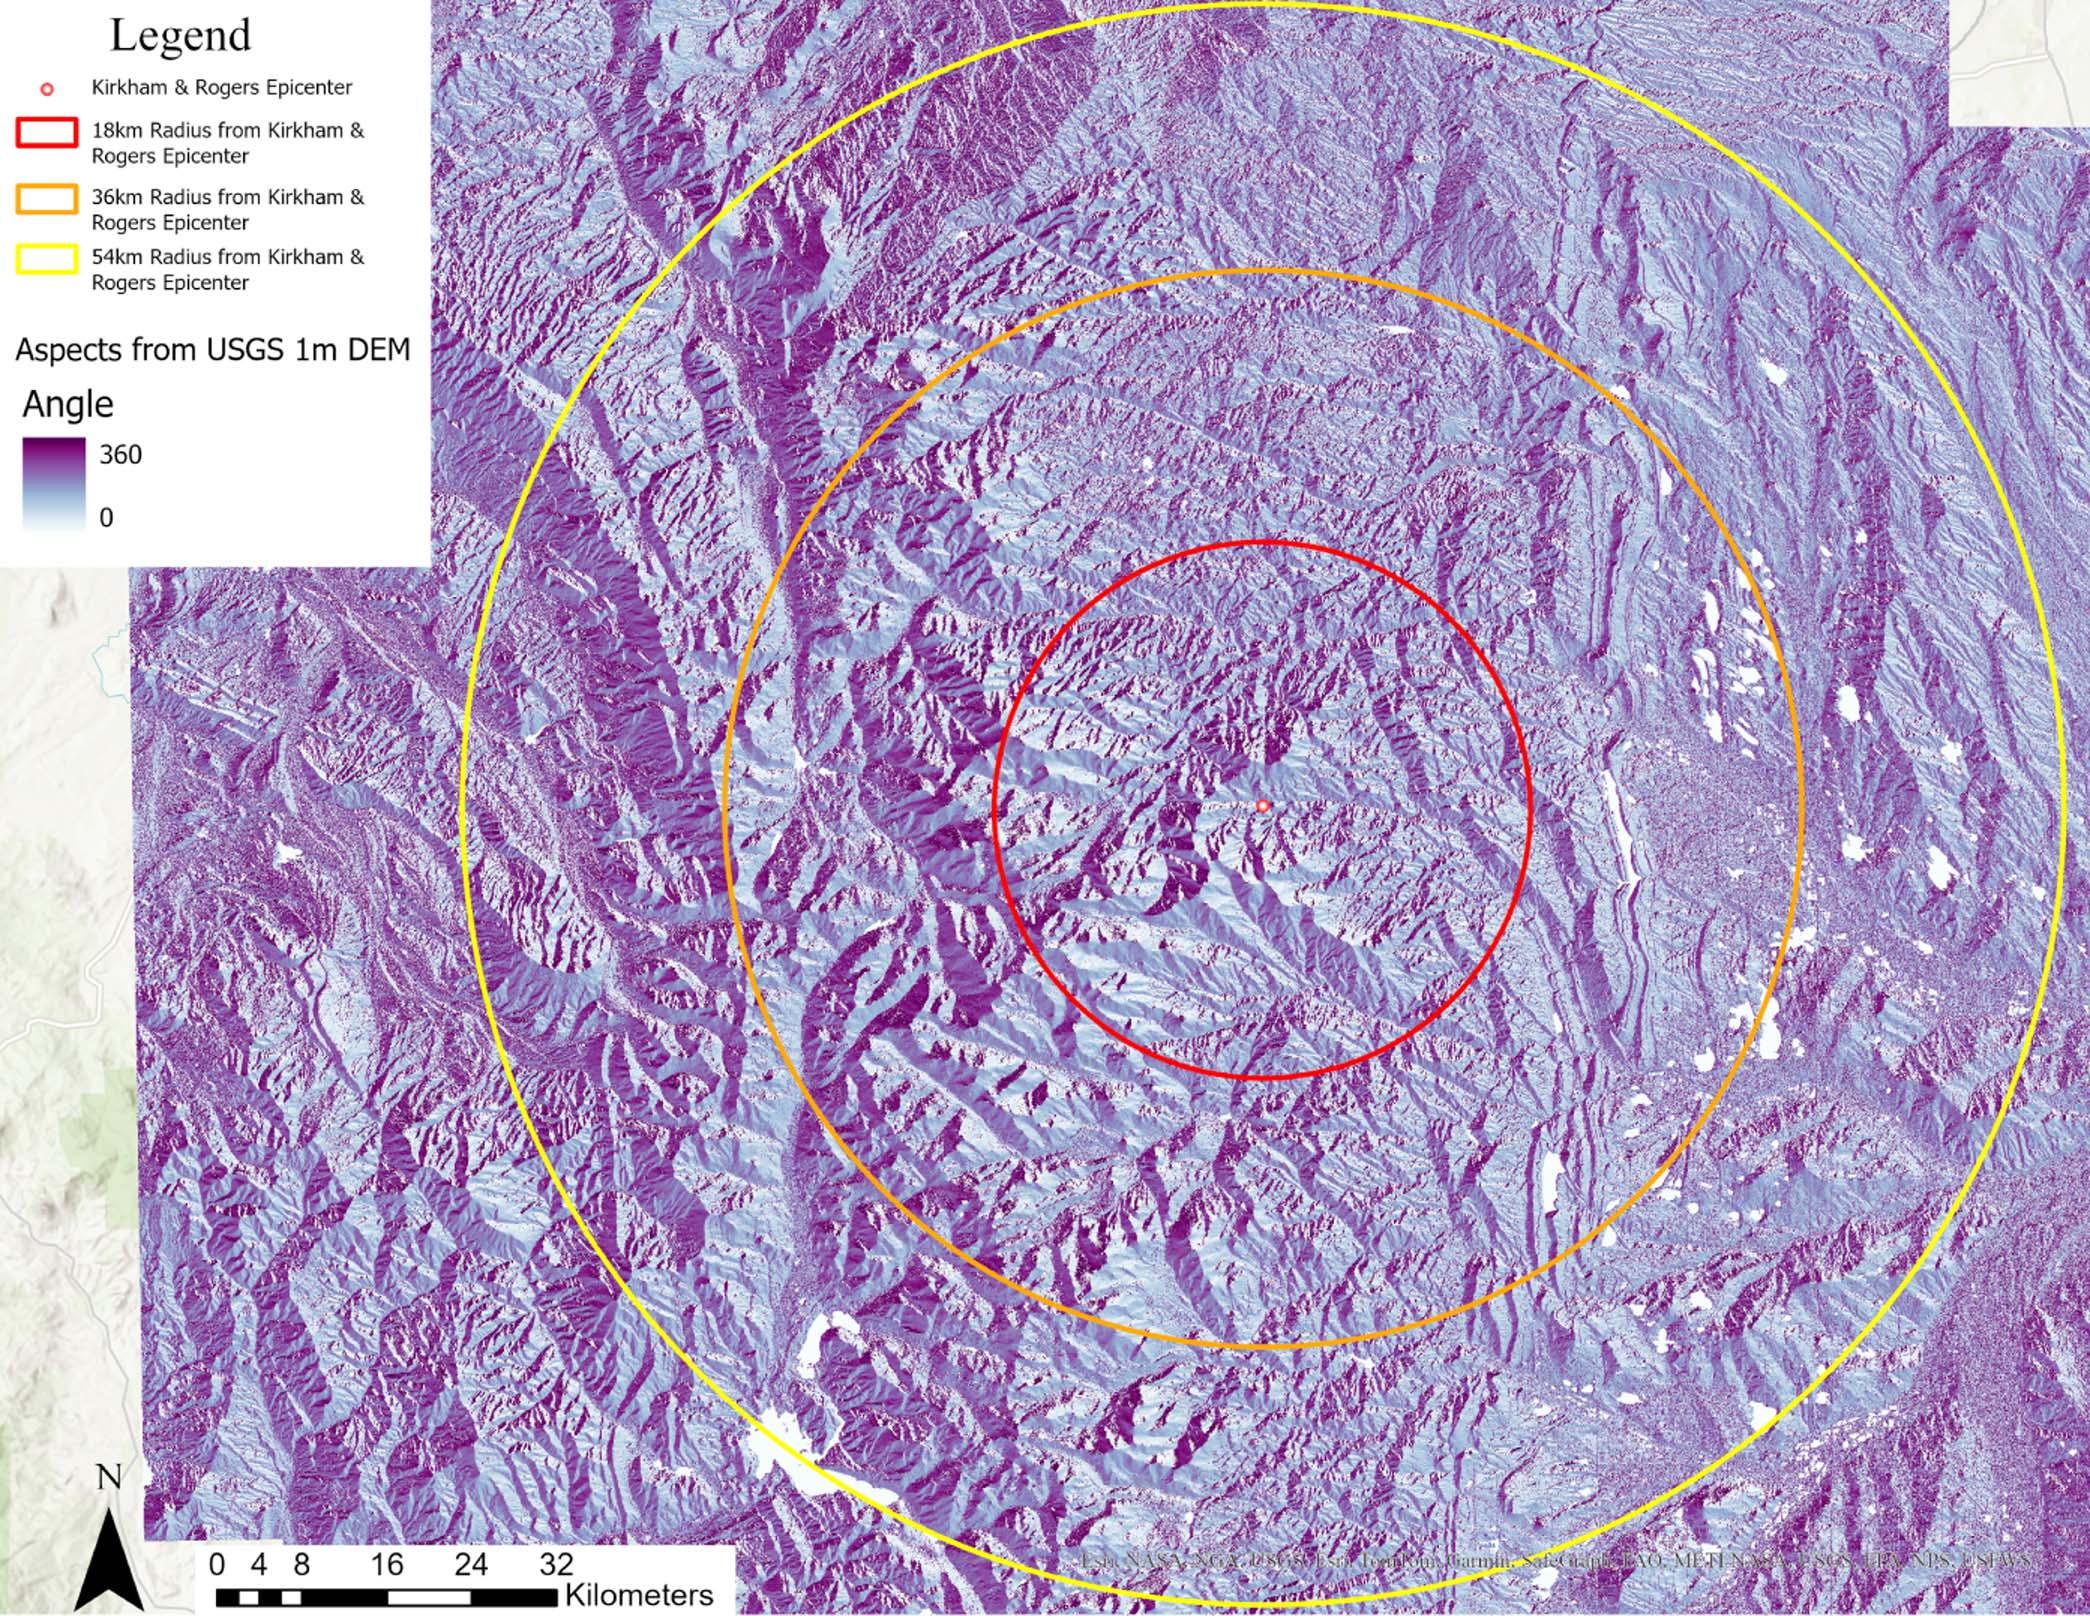
Tobeginthisanalysis,centroidsforthelandslides presentwithinthestudyareawerecalculatedtobetter visualizetheclusteringofdatapresentwithinthedata set,aswellastopreparefordatacontouring.Figure9 isamapofthestudyareawithlandslidecentroidscoloredbysurfaceroughnessvalues.Togaugeifthere wasaspatialtrendbetweentheKirkhamandRogers (1986)epicenterandthesurfaceroughnessvaluesassigned tothelandslidecentroids,theneartoolwithinArcGISPro wasusedtocalculatedistancesbetweenlandslidecentroids andtheKirkhamandRogers(1986)epicenter.Figure10is achartcomparingsurfaceroughnessvaluesperlandslide centroidcomparedagainstthedistanceofthecentroidtothe KirkhamandRogers(1986)epicenter.Asshown,there isnotastrongtrendbetweendistancestotheKirkham andRogers(1986)epicenterandsurfaceroughnessvalues, withageneralnegativetrendemerging(containingsome datascatter)around35km.
BasedonthecolorpatternsinFigure9,aspatialtrend appearedtoexistwithinthedata,withagroupingof rougher(younger)valuesinthemid-lowerleftquadrant. Toinvestigatethispossibility,akrigedrasterwasgenerated tocontourthesurfaceroughnessvaluesofallpointswithin thedataset.Thisrougherregionisevenmoreapparentin Figure11.Overlainonthis figureisadatasetofmapped faultswithinColoradofromtheUSGS(Tweto,1979)to identifyfaultsthatintersectedthisregion.Wechoseanew epicenteralongthefaultlyingclosesttothecenterof theregion,indicatedonthemapasapoint.Additionally, oncethisnewepicenterwaschosen,surfaceroughness valueswereplottedagainstthedistancesofthelandslide centroidstothisnewepicenter,andtheresultsareshown inFigure12.Fromthisgraph,thedatascatterseenwhen conductingthesameprocessasthatconductedforthe KirkhamandRogers(1986)epicenterinFigure10demonstratesanincreaseinthecorrelationwithanegativelinear

Figure7.Rosediagramoftabulatedaspectpixelswithintheentirestudyarea(left)andoverthepixelswithindigitizedlandslideregionsidentifiedbytheColoradoGeologicalSurvey(right).Colorscalerepresentscalculatedangleofpixel,andradiirepresentthenumberofpixelsidentified foreachaspect.
trend,morethandoublingthe R2 valueassociatedwiththe fit.Whilenoteverylandslidecontainedwithinthisdataset islikelytohaveaco-seismicorigin,forsuchastrongtrend toemergefromthisanalysis,itislogicaltoconcludethata largeeventinrecenthistoryoccurredinthisregion,causing severallandslidesatasimilartime.
KirkhamandRogers(1986)concludedthateventhough theirmethodologyrequiredare-analysisofreported intensities,theywerestillabletoidentifyarelatively constrainedregioninwhichtheearthquakeepicenter

Figure8.Distributionofsurfaceroughnessvaluesforthe611landslideswithinthestudyarea.Withtheexceptionofafewoutliers,agenerally normaldistributionisformedwithinthedata.

Figure9.Centroidsoflandslideswithinthestudyareacoloredbycalculatedsurfaceroughnessvalues.
waslikelytofall.Theynotedthattheirestimateof theexactepicenterwaslikelytobeoffbyasmuchas ahalfdegreeoflatitudeorlongitude.Fromouruseof themethodologyproposedbyLaHusenetal.(2016),
evenwithoutanabsoluteagecalibration,therelative agesestimatedbycalculatingthesurfaceroughness valuesoflandslidesidenti fi edaregionofanomalouslyhighroughnessvalues.Thisidenti fi edregion

Figure10.SurfaceroughnessvaluesforeachlandslidecomparedtothedistanceoftheircentroidfromtheepicenterindicatedbyKirkhamand Rogers(1986).

Figure11.Krigedsurfaceroughnessmapgeneratedusinglandslidecentroids,overlainbyColoradofaultsmappedbyU.S.GeologicalSurvey(from Tweto,1979).Analternateepicentermarkedbya filledredcircleislocatedapproximately35kmsouthwestofKirkhamandRogers(1986)epicenter.
fallswithintheestimationoferrorcitedbyKirkham andRogers(1986),withthenewpredictedepicenter being35kmaway.Whilethenewepicenterestimate waschosenbasedonproximitytothecenterportion
oftheidenti fi edregionofhighroughness,itismore appropriatetodesignateanellipsebasedontheinformationobtainedtofurtherconstrainthelikelyarea wheretheepicentermayhavebeen.Figure13shows

Figure12.Surfaceroughnessvaluesforeachlandslidecomparedagainsttheircentroid’sdistancetothenewpredictedepicenter.

anewellipsede fi ningazoneoflikelyinitiationforthe 1882earthquake,centeredaroundournewestimated epicenter.Thisellipsewasde fi nedtobestcontainthe regionwithsurfaceroughnessvaluesabove2.707, representingtheanomalouszonethisstudyidenti fi ed. Tobetterillustratethesizeofthisellipsecomparedto previousstudies,thepossibleearthquakeinitiation ellipseproposedbyKirkhamandRogers(1986)is includedwithinthe fi gure.Basedonourresults,we demonstrateasigni ficantreductioninthesizeofthe likelyinitiationarea.
Whiletheoriginalaimofthisstudywastoidentify landslideswithinthestudyareathathadthepotentialto beco-seismicforastatisticaldeterminationofanepicenter,thestrongspatialtrendobservedwithinthesurfaceroughnessvaluesfortheregionidentifiedalikely productofthe1882earthquake.Whileitispossiblethat alocalizedstormcouldhaveproducedalargenumberof temporallyconsistentlandslideswithinthisrelatively
smallarea,wepresumeitisunlikelythatsuchalocalizedandpowerfulstormoccurredinthepast.Tofurthersupportthisreasoning,datacollectedduringand followingtheexceptionallylarge2013FrontRange rainfalleventwereincorporatedintothestudyutilizing datacompiledbyColoradoStateUniversity(CSU,2013) forpeakcumulativerainfalltotalsover12hoursduringtheevent(Figure14),andthisdatasetwasthen comparedwithUSGS-compileddebris fl ows/landslidesrecordedfollowingthisevent(Figure15).As shown,regionswithhigher12hourrainfalltotalsappear tobecorrelatedwiththenumberofrecordeddebris fl ows/landslides,butthecorrelationisnotperfect.The zoneofdebris fl owsandlandslidesfrom2013covers anareaover50kminwidthandover150kmlong, encompassingthemainconcentrationoftheinventory inFigure15.ThisissimilartotheareaofhighroughnesslandslidesfromtheinventoryweusedinFigure11,usingaroughnessof1.77(approximatelythe

Figure14.Cumulativerainfallmeasurementsover12hoursduringthe2013FrontRangerainfallevent(right)pairedwithlocationsexceeding 50,100,500,and1,000yearrecurrenceintervalsfor12hourprecipitationtotals(left).DataarefromCSU(2013).
medianvalueinFigure8)asthethreshold these arethethreecolorsinFigure11indicatingtheareas ofhighestroughness.Inthisbriefcomparison,then, astormaslargeasthe2013stormwouldbeneeded toaffectanareathislarge.Giventhatthe2013storm surpassedthe1,000yearrecurrenceinterval,it wouldberaretohaveexperiencedastormofthis magnituderecentlyenoughthatthelandslideswould stillhavethehighroughnessvaluesmeasured,and evenmorerareforsuchaneventtohaveoccurred butremainunrecordedincontemporaneousnewspaperaccounts.
The1882earthquakethatoccurredinColorado causedwidespreaddamagetoexistingstructures acrosslargedistancesbasedonreporteddamagesand eyewitnessaccounts.WhileDamesandMoore(1981) indicatedthatsomeofthereportswereexaggerated orunder-representativeofthetrueimpactsofthis earthquakeanditsaftershocks,KirkhamandRogers (1986)effectivelydecipheredthedataavailableto thematthetimetodevelopageographicalellipsethat theywerecon fi dentcontainedtheepicenterforthis earthquake.Theirspeci fi cassignmentofanepicenter hadlesscon fi dencebutwaschosenasthebest fi tfor theavailabledata.Whiletheirmethodologywas basedondatathathadvariablecredibi lity,ourwork forthisstudycorroboratestheirestimations,including thelikelyerrorinthedistancebetweentheirchosen
epicenterandthelocationwesuggestforanewinitiationellipse.Byutilizingdataavailabletoday,suchasa USGS1mDEMforthestudyareaandadigitized repositoryoflandslidesfrompriorFrontRangemapping effortsatvariousmapscalescompiledbytheCGS,a morepreciseconstraintontheepicenterlocationwas identi fi edusingthemethodologyproposedbyLaHusenetal.(2016)thatreliedontopographicsurface roughnessasaproxyforage.Bydeterminingaregion withinthestudyareawithaconcentrationofhigher thanaveragesurfaceroughnessvaluesforlandslides, wesuggestthatthisellipseprovidesabetterconstraint onthelocationofthe1882earthquakeepicenter.Furthermore,wesuggestthattheregionwasunlikelyto haveexperiencedalargeandfocusedprecipitation eventwithintherecenttimeframeneededtogenerate suchaconcentrationofyounglandslideswithhigh roughnessvalues.
Additionalworktocon fi rmthenewepicenterlocationwouldincludeagedatingoflandslidesandof unfaultedsedimentsabovesomeofthefaultslocated withinthisregion.Ontheotherhand,thepossibility existsthatthefaultresponsibleforthisearthquakeis blind,withKirkhamandRogers(1986)estimating thehypocentraldepthtoberoughly20kmbeneath thesurface.Whileitmayprovechallengingto fi nd thefaultdirectlyresponsibleforthisearthquake,itis ofimportancetoknowmoreinformationaboutthe causativestructureduetothepotentialhazardsthat anadditionalearthquakeofthismagnitudecouldpose totheFrontRangeandsurroundingregionsshouldit occuragain.

Figure15.Debris flows/landslidesidentifiedbyU.S.GeologicalSurveyfollowingthe2013FrontRangerainfalleventoverlyingColoradoState Universitycumulativerainfallmeasurements(CSU,2013).
IwouldliketothankDr.JimMcCalpinforbringing thisprojecttomyattention,asthisresearchhaslarge implicationsforthefutureestimationofthepossibility forlargeearthquakeswithintheFrontRangeandassuch wasworthyofadditionalconsiderationbeyondthe constraintsthatpriorconductedresearchwasableto placeuponthesuspectedepicenterofColorado’s1882 earthquake.Additionally,IwouldliketothankDr.Paul Santiforhiscontinuedsupportthroughoutthisprojectin providingideasfornextstepsandbestpracticesfor processingandviewingthedatathatwereabletobe obtained.Finally,IwouldliketothankmywifeTessfor hersupportduringmytimeatColoradoSchoolof Mines,asnoneofthiswouldhavebeenpossiblewithout heratmyside.
CSU(ColoradoStateUniversity),2013, 12HourPrecipitationTotalsand RecurrenceIntervalsfor9/12/2013 [created9/13/2013]:ColoradoState UniversityPrecipitationSystemsResearchGroup,FortCollins,CO. DAMESAND MOORE,1981,GeologicandSeismologicalInvestigations forRockyFlatsPlant:ReportpreparedforU.S.Departmentof EnergyunderContractNumberDE-AC04-80AL10890.
E CKERT,A.D.,1982, TheGeologyandSeismologyoftheDudley GulchGrabenandRelatedFaults,PiceanceCreekBasin, NorthwesternColorado :M.S.Thesis,UniversityofColorado atBoulder,CO,139p.
HADSELL,F.A.,1968,HistoryofearthquakeactivityinColorado: Colorado SchoolofMinesQuarterly,Vol.63,No.1,pp.57–72.
KEEFER,D.K.,1984,Landslidescausedbyearthquakes: GeologicalSociety ofAmericaBulletin,Vol.95,No.4,pp.406–421.
KIRKHAM,R.M. AND ROGERS,W.P.,1986,Aninterpretationofthe November7,1882,Coloradoearthquake.InRogers,W.P.and Kirkham,R.M.(Editors), ContributionstoColoradoSeismicityand Tectonics A1986Update:SpecialPublication28,Colorado
GeologicalSurvey,DepartmentofNaturalResources,Denver,CO. Electronicdocument,availableat https://coloradogeologicalsurvey. org/publications/colorado-seismicity-tectonics-1986
LAHUSEN,S.R.;DUVALL,A.R.;BOOTH,A.M.; AND MONTGOMERY, D.R.,2016,Surfaceroughnessdatingoflong-runoutlandslidesnear Oso,Washington(USA),revealspersistentpostglacialhillslope instability: Geology,Vol.44,No.2,pp.111 –114.
SPENCE,W.;LANGER,C.J.; AND CHOY,G.L.,1996,Rare,largeearthquakesattheLaramideDeformationFront Colorado(1882)and Wyoming(1984): BulletinoftheSeismologicalSocietyofAmerica, Vol.86,No.6,pp.1804–1819.
ThePuebloDailyChieftain,1882,MotherEarth,Page4:Electronic document,availableat https://www.coloradohistoricnewspapers.org/? a¼d&d¼CFT18821111-01.2.17&srpos¼2&e¼ en-20-CFT-1–img-txIN%7ctxCO%7ctxTA-%22Mother þEarth%22 1882 2
TWETO,O.,1979, GeologicMapofColorado:U.S.GeologicalSurvey Open-FileReportOFR92-0507. https://pubs.usgs.gov/of/1992/ofr92-0507/
U.S.GeologicalSurvey, 2024,3DEPLiDARExplorer:Electronic application,availableat https://apps.nationalmap.gov/lidarexplorer/#/ .Accessed7September2023.

IntroductiontoWasteManagement:ATextbook
Reviewby:ThomasOommen
DepartmentofGeologyandGeologicalEngineering,UniversityofMississippi, University,MS-38677
TheUnitedNationsHumanSettlementsProgram notes, “Managingsolidwastewellandaffordablyisone ofthekeychallengesofthe21stcentury,andoneofthe keyresponsibilitiesofacitygovernment” (UN-Habitat 2010,p.xix).Improperwastemanagementcanleadto environmentaldegradation,soilandwaterpollution,and wildlifeharm.Mismanagementofhazardouswastecan posesignificanthealthriskstocommunitiesandthe environment.Wastemanagementhelpsconservenatural resourcesbyreducingwastesenttolandfillsandrecoveringmaterialsthatcanberecycledorreused.
Landfillsareasignificantsourceofmethaneemissions,apotentgreenhousegascontributingtoclimate change.Landfillspaceis finiteandexpensive,andasthe amountofwastegeneratedcontinuestoincrease, finding newlandfillsitesbecomesmoredifficult.Therefore, properwastemanagementpracticesandpoliciesare essentialtoprotectpublichealthandtheenvironmentand conserveresources.In IntroductiontoWasteManagement, Hasan(2022),anexperiencededucator,hascomeforth withacollegetextbookinwastemanagement,distilling informationfroma35-yearteachingcareer.Thebookis writtenforstudentsmajoringinenvironmentalscience, environmentalengineering,environmentalstudies,environmentalgeology,resourcemanagement,andsustainabilityprograms.Itcoversallmajortypesofwaste:municipal solidwaste(MSW),hazardouswaste,medical/healthcare waste(MW),nuclear/radioactivewaste,andelectronic wasteinadditiontoachapteronwasteminimizationand pharmaceuticalsandpersonalcareproducts(PPCPs).
ThisbookbyProfessorHasanprovidesanoverview ofthewastemanagementindustry,includingitshistory, currentpractices,andprospects.Itcoverskeytopics, suchaswastegenerationandcharacterization,collection andtransportation,treatmentanddisposal,andenvironmentalimpactsfromitsmismanagement.Theauthor presentsthematerialclearlyandconcisely,makingthe bookunderstandabletoreaderswithlittletonoprior

knowledgeofthesubject.Thebookiswell-organized witheachchapterbuildingonthepreviousonetoprovideacomprehensiveunderstandingofthetopicat hand.Oneofthebook’sstrengthsisitsuseofreal-world examplesandcasestudiestoillustratetheconceptsdiscussed.Thecontentisillustratedwith85 figures nearly allincolor and87tables,whichmakethematerialeasiertounderstand.Thebookincludesdiscussionofcontemporarytopics,suchasCOVID-19waste,itsproper management,andhowtodealwithMWfromfuture pandemics/epidemicsthatareprojectedtoincreasein frequencyandintensityinthewakeofclimatechange.
Thebookisorganizedinto10chaptersthatcanbeutilizedasthecontentforaone-semestercoursetointroducestudentstowastemanagement.The10chapters providestudentswithafundamentalunderstandingof wastemanagement.Eachchapterbeginswiththechapter ’slearningobjectivesandconcludeswithchaptersummary,studyquestions,relatedsupplementaryreadings, webresources,anddetailedreferences.Solvednumerical problemsoncalculationoflandfilllifeandarea,waste quantities,groundwater flow,etc.,enhancethevalueof thebook.Atextbook flavorpermeatesthroughoutthe book,andthisstylemakesiteasyforthefacultytoadopt itforanintroductorycourseinwastemanagement.
Chapter1discussestheevolutionofwastemanagementpracticesandthedevelopmentofmodernwaste managementsystems.Thechapteralsodefineswaste anditsclassificationintodifferentcategories.Overall, thischapterprovidesasolidintroductiontothesubject, providingacomprehensiveoverviewofthe fieldof wastemanagementanditshistory.Chapter2discusses theessentialsofgeology,itsrelevancetowastemanagement,thevariousgeotechnicalaspectsofearthmaterials, andtheirsignificanceintheselectionofwastedisposal facilitiesandremediationofcontaminatedsites.The chapteralsoexplainstheprinciplesoftoxicologyand relatesthemtohumanandecologicalhealthissuescaused bywastemismanagement.Chapter3describesthehistory andevolutionofenvironmentallawsintheUnitedStates andexplainslawsdealingwithwastemanagementand pollutioncontrol.ThechapteralsodiscussestheEuropean Union’senvironmentallawsalongwithUnitedNations
guidelinesandrecommendations.Chapter4reviewsthe historicalevolutionofMSWmanagementintheUnited Statesandprovidesdetaileddiscussionsofcommon wastedisposalmethods,suchaslandfillsandincinerators, andenvironmentalandhealthimpactsassociatedwith them.Chapter5beginswithdifferentiationbetweenhazardoussubstancesandhazardouswasteandexplains healthproblemscausedbyhazardouswastemismanagement.Thechapteralsocoverssourcesandgeneratorsof hazardouswasteandmethodsforitsstorage,transportation,treatment,anddisposal.Chapter6describesthehistoryandneedforregulatingMW,anddescribesthetypes, sources,andhazardsassociatedwithMWanditssafe management.Thechapterdiscusseswastetypesgeneratedinhospitals,bestmanagementpractices,andthebenefitsofsegregatingcommonwastefromregulated medicalwaste(RMW);summarizesmethodsoftreatment anddisposalofRMW;andreviewsSARS-Cov-2and otheremergingdiseasesandtheirimpactsonMWmanagement.Chapter7describesthehistoryofradioactivity, nuclear fission,atomicphysics,andnucleartechnology. Thechapteralsoprovidesasoundknowledgeof nuclearwastemanagementandtheglobalstatusof high-levelwastedisposal.Chapter8describesthe natureandsourceofelectronicwasteandthelaws governinge-wastemanagement.Thechapteralsosummarizestheproblemofincreasinge-wastequantity andthehealthandenvironmentalimpactsassociated withitsinformalrecycling,highlightingtheurgent needfordealingwithitsmanagementinasustainable
way.Chapter9discussesthehistoricaldevelopmentof wasteminimizationapproachesandcomparesandcontrastsintegratedwastemanagementandsourcereduction.Thechapteralsoexplainsthezero-wasteconcept andU.S.lawsrelatedtowasteminimizationandrecyclinganddescribesinnovativewasteminimization trends.Chapter10de fi nesPPCPs;explainstheirnature andthreattohumanandecologicalhealth;andidentifi esthesource,occurrence,andhazardsofPPCPs.
Introductiontowastemanagement:Atextbook isthe onlybookavailableinthemarketthatoffersacomprehensivecoverageofall fivemajortypesofwaste:solid, hazardous,medical,nuclear,andelectronic.Overall,this bookisanexcellentresourceforstudents,professionals, andanyoneinterestedinlearningaboutwastemanagement.Theauthor ’sexpertiseinthe fieldisevident,and thebookprovidesathoroughandup-to-dateoverview ofthesubject.Ifyouarelookingforacomprehensive guidetowastemanagement,thisbookisamust-read.
HASAN,S.E.,2022, IntroductiontoWasteManagement:ATextbook: JohnWiley&Sons,Hoboken,NJ.436p. UN-Habitat,2010, SolidWasteManagementintheWorld’sCities: WaterandSanitationinWorld’sCities2010:Earthscan,London. 257p.
Environmental&EngineeringGeoscienceJournal (ISSN10787275),Copyright © 2024bytheAssociationofEnvironmental& EngineeringGeologists(AEG)andtheGeologicalSocietyof America(GSA)ispublishedquarterly.EditorialOffices:The UniversityofMississippi,DeptofGeologyandGeological Engineering,University,MS38677.AccountingandCirculation Offices:AEG,2840WestBayDrive#141,BelleairBluffs,FL 33770-2620.Call(727)940-2658x2004tosubscribe.Periodicals postageispaidatAEG,2840WestBayDrive#141,Belleair Bluffs,FL33770-2620.
POSTMASTER: SendaddresschangestoAEG,2840West BayDrive#141,BelleairBluffs,FL33770-2620.Phone: (727)940-2658x2004.Includebotholdandnewaddresses, withZIPcode.CanadaagreementnumberPM40063731. ReturnundeliverableCanadianaddressestoStationAP.O.Box 54,Windsor,ONN9A6J5Email:returnsil@imexpb.com.
CLAIMS: Claimsfordamagedornotreceivedissueswillbe honoredfor6monthsfromdateofpublication.AEGmembers shouldcontactAEG,2840WestBayDrive#141,Belleair Bluffs,FL33770-2620.Phone:(727)940-2658x2004.GSA memberswhoarenotmembersofAEGshouldcontactthe GSAMemberServicecenter.Allclaimsmustbesubmittedin writing.
DISCLAIMERNOTICE: Authorsaloneareresponsiblefor viewsexpressedinarticles.Advertisersandtheiragenciesare solelyresponsibleforthecontentofalladvertisementsprinted andalsoassumeresponsibilityforanyclaimsarisingtherefrom againstthepublisher.AEGandEnvironmental&Engineering Geosciencereservetherighttorejectanyadvertisingcopy.
SUBSCRIPTIONS:
Membersubscriptions: AEGmembers automaticallyreceive digitalaccesstothejournalaspartoftheirAEGmembership dues.Membersmayorderprintsubscriptionsfor$75peryear. GSAmembers whoarenotmembersofAEGmayorderfor$60 peryearontheirannualGSAduesstatementorbycontacting GSA.
Nonmembersubscriptions are$310andmaybeorderedfrom thesubscriptiondepartmentofeitherorganization.Apostage differentialof$10mayapplytononmembersubscribersoutside theUnitedStates,Canada,andPanAmerica.ContactAEGat (727)940-2658x2004;contactGSASubscriptionServices, GeologicalSocietyofAmerica,P.O.Box9140,Boulder,CO 80301.
Singlecopies are$75.00each.Requestsforsinglecopiesshouldbe senttoAEG,2840WestBayDrive#141,BelleairBluffs,FL 33770-2620.
© 2024bytheAssociationofEnvironmentalandEngineering Geologists
Allrightsreserved.Nopartofthispublicationmaybereproducedor transmittedinanyformorbyanymeans,electronicormechanical, includingphotocopying,recording,orbyanyinformationstorageand retrievalsystem,withoutpermissioninwritingfromAEG.
THISPUBLICATIONISPRINTEDONACID-FREEPAPER
EDITORS
THOMAS OOMMEN
DepartmentofGeologyand GeologicalEngineering TheUniversityofMississippi University,MS38677 toommen@olemiss.edu
ERIC PETERSON
DepartmentofGeography, Geology,andtheEnvironment IllinoisStateUniversity Normal,IL61790 309-438-5669 ewpeter@ilstu.edu
K AREN E.SMITH ,EditorialAssistant,kesmith6@kent.edu
SANTI,PAUL ColoradoSchoolofMines DALAL,VISTY MarylandDepartmentof theEnvironment HASAN,SYED UniversityofMissouri, KansasCity
NANDI,ARPITA EastTennesseeStateUniversity SASOWSKY,IRA D. UniversityofAkron
ASSOCIATEEDITORS
ACKERMAN,FRANCES RambollAmericasEngineering Solutions,Inc. BASTOLA,HRIDAYA LehighUniversity
BEGLUND,JAMES MontanaBureauofMinesand Geology
BRUCKNO,BRIAN VirginiaDepartmentof Transportation CLAGUE,JOHN SimonFraserUniversity,Canada DEE,SETH UniversityofNevada,Reno FRYAR,ALAN UniversityofKentucky GARDNER,GEORGE MassachusettsDepartmentof EnvironmentalProtection GHOSH,SUMAN CaliforniaDepartmentof Conservation
HAUSER,ERNEST WrightStateUniversity KEATON,JEFF WSPUSA MAY,DAVID USACE-ERDC-CHL POPE,ISAAC BookReviewEditor SANTI,PAUL ColoradoSchoolofMines SCHUSTER,BOB SHLEMON,ROY R.J.Shlemon&Associates,Inc.
STOCK,GREG NationalParkService
SWANSON,SUSAN (SUE) BeloitCollege
ULUSAY,RESAT HacettepeUniversity,Turkey
WEST,TERRY PurdueUniversity
SubmittingaManuscript
Environmental&EngineeringGeoscience (E&EG),isaquarterlyjournaldevotedtothepublicationoforiginalpapersthatareofpotentialinteresttohydrogeologists,environmentalandengineeringgeologists,and geologicalengineersworkinginsiteselection,feasibilitystudies,investigations,designorconstructionofcivilengineeringprojectsorinwaste management,groundwater,andrelatedenvironmentalfields.Allpapers arepeerreviewed.
Theeditorsinvitecontributionsconcerningallaspectsofenvironmental andengineeringgeologyandrelateddisciplines.Recentabstractscanbe viewedunder “Archive” atthewebsite, “http://eeg.geoscienceworld.org” Articlesthatreportonresearch,casehistoriesandnewmethods,andbook reviewsarewelcome.Discussionpapers,whicharecritiquesofprinted articlesandaretechnicalinnature,maybepublishedwithrepliesfrom theoriginalauthor(s).Discussionpapersandrepliesshouldbeconcise.
Tosubmitamanuscriptgotohttps://www.editorialmanager.com/EEG/ default.aspx.Ifyouhavenotusedthesystembefore,followthelink atthebottomofthepagethatsaysNewusersshouldregisterforan account.Chooseyourownloginandpassword.Furtherinstructions willbeavailableuponloggingintothesystem.Uponsubmission,manuscriptsmustmeet,exactly,thecriteriaspecifiedintherevisedStyle Guidefoundathttps://www.aegweb.org/e-eg-supplements. Manuscriptsoffewerthan10pagesmaybepublishedasTechnical Notes.ThenewoptionalfeatureofOpenAccessisavailableuponrequestfor$750perarticle.
Forfurtherinformation,youmaycontactDr.ThomasOommenatthe editorialoffice.
Coverphoto
LimestonequarryintheEdwardsAquiferRechargeZone,wherenitratesand fueloilusedinquarryexcavationmayentertheaquifer.Photographcourtesyof GeorgeVeni.Seearticleonpage173.