Environmental& EngineeringGeoscience AUGUST2024VOLUMEXXX,NUMBER3 THEJOINTPUBLICATIONOFTHE ASSOCIATIONOFENVIRONMENTALANDENGINEERINGGEOLOGISTS ANDTHEGEOLOGICALSOCIETYOFAMERICA
SERVINGPROFESSIONALSIN
ENGINEERINGGEOLOGY,ENVIRONMENTALGEOLOGY,ANDHYDROGEOLOGY
Environmental& EngineeringGeoscience Volume30,Number3,August2024
TableofContents 95EstimatingBackgroundThresholdValuesforRiskAssessment KennethS.Tramm,JasonT.Minter,andCatherineA.Seaton
111PotentialforEventsSimilartotheDeadlyWestSaltCreekLandslide,GrandMesaArea,Colorado OmidArabnia,PaulSanti,BennettEmmons,andEmilySparks
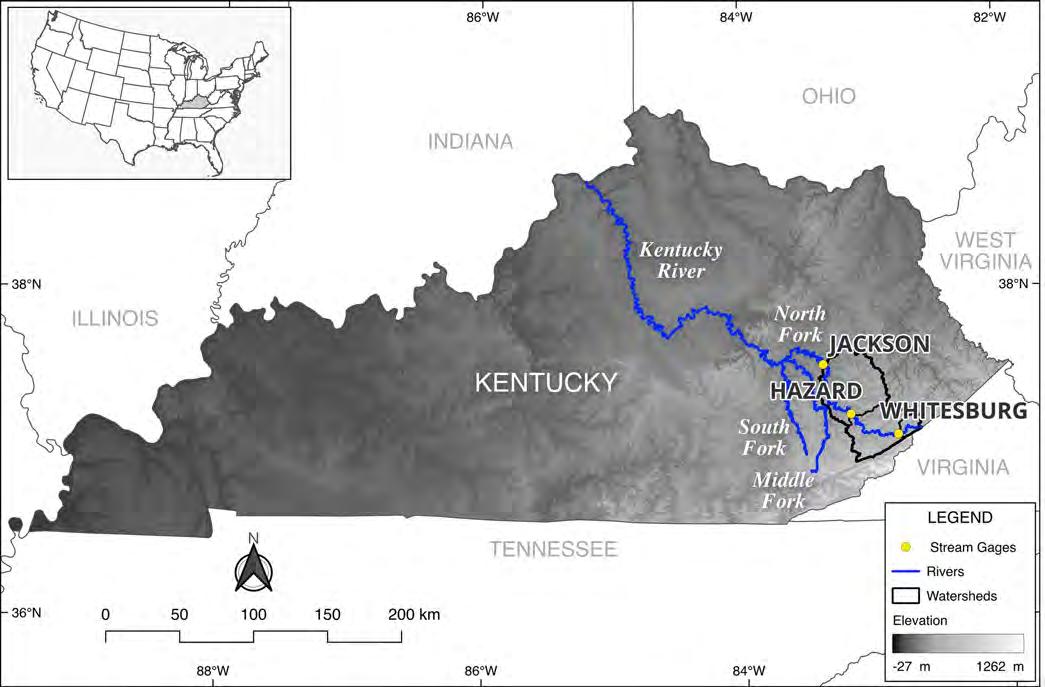
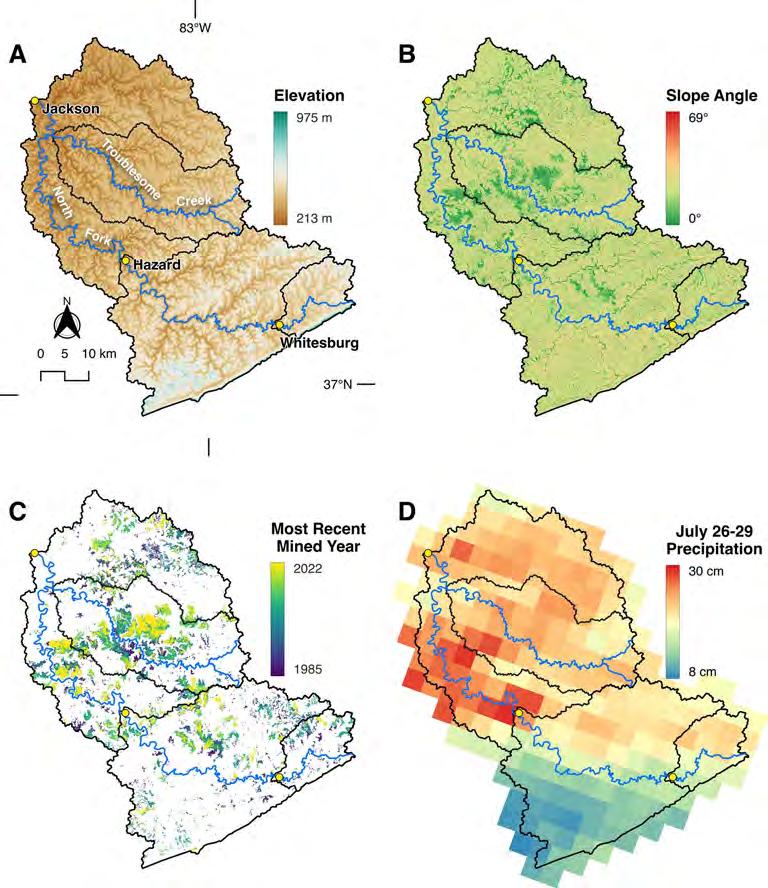
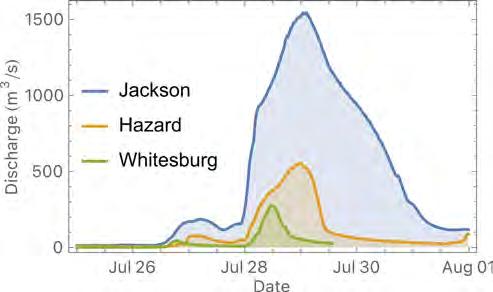
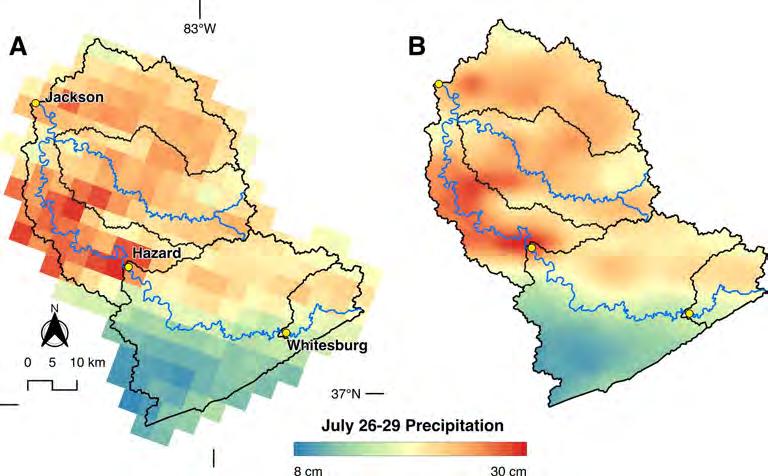
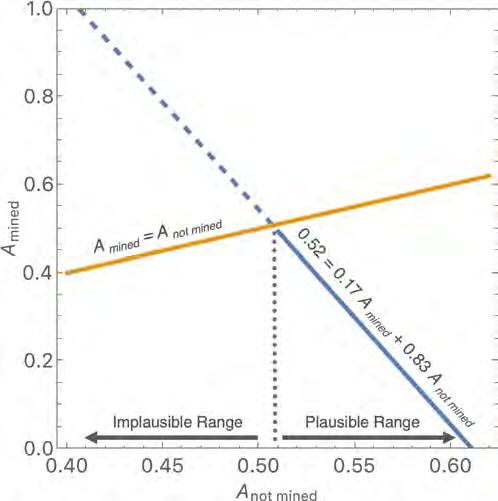
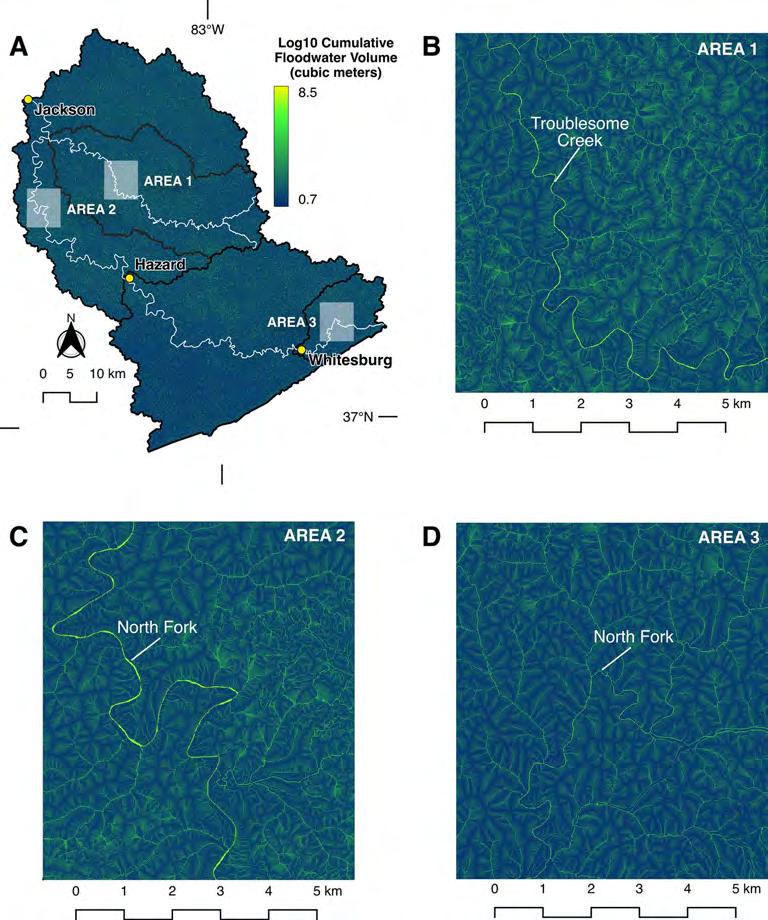
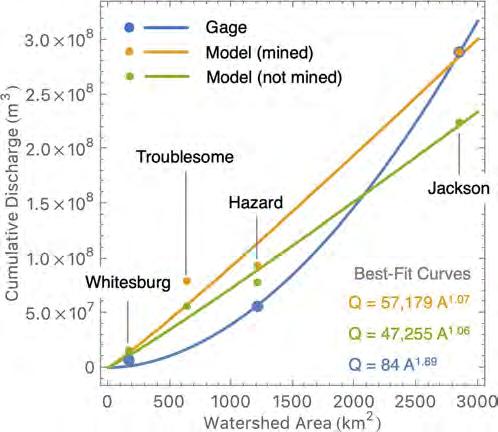
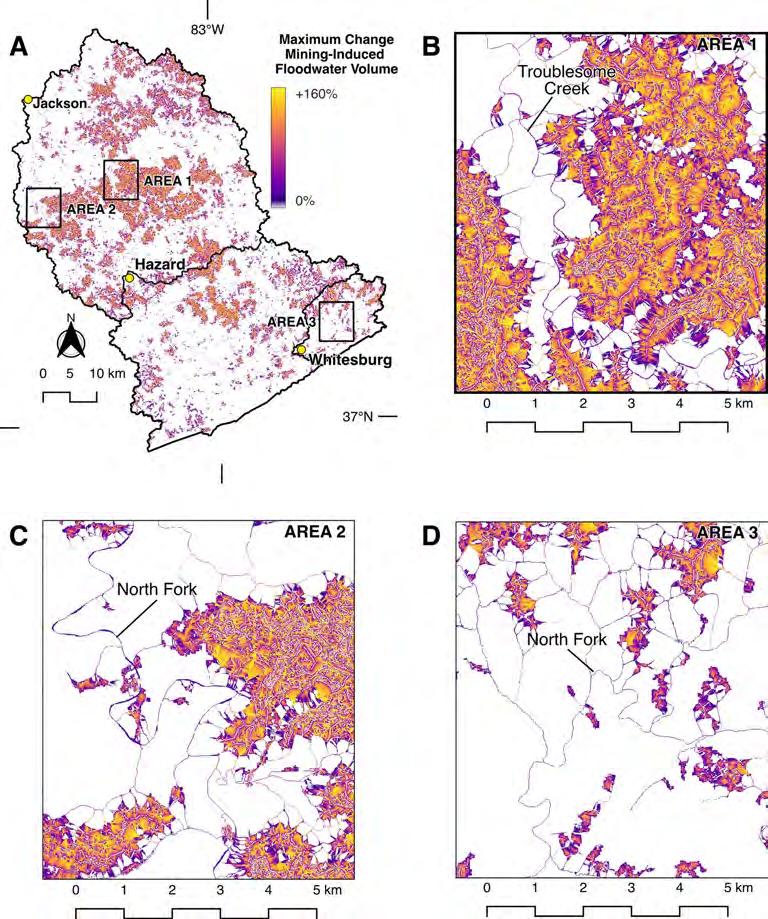
131PrecipitationPatterns,MountaintopRemovalMining,andtheJuly2022NorthForkKentuckyRiverFlood WilliamC.Haneberg
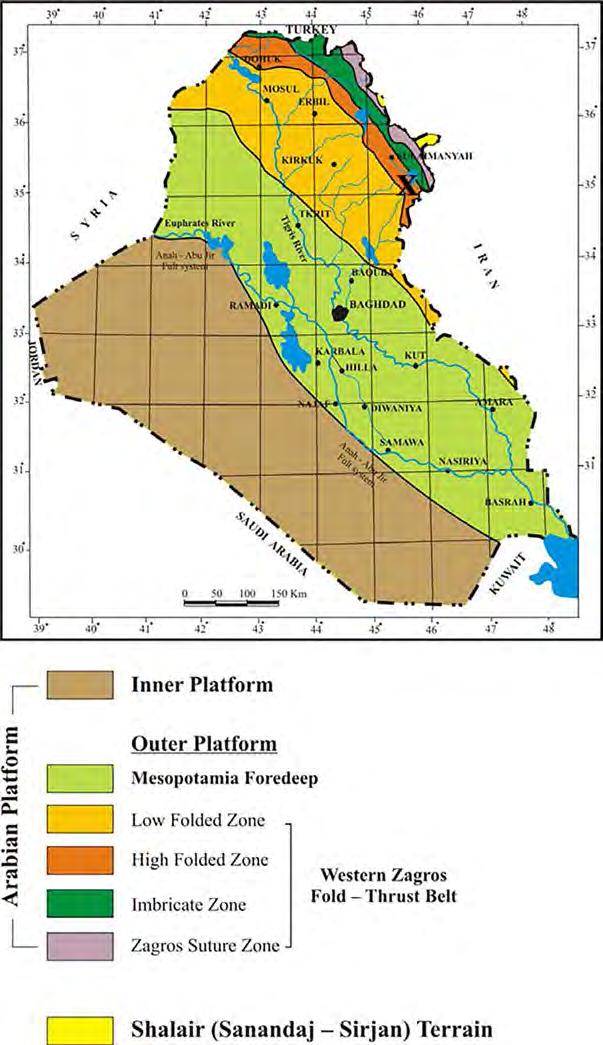
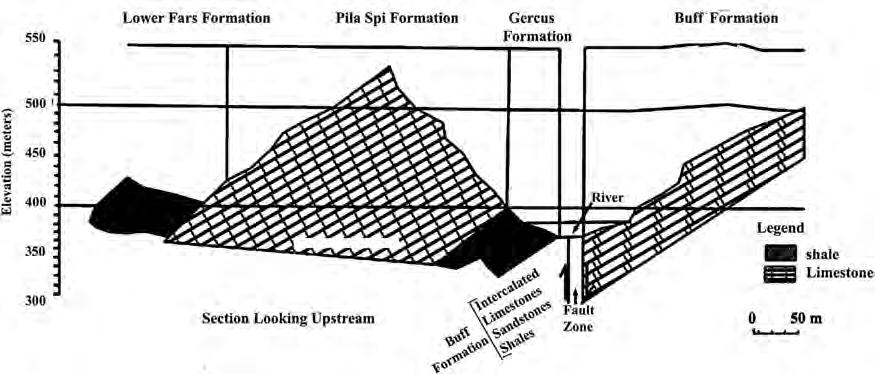
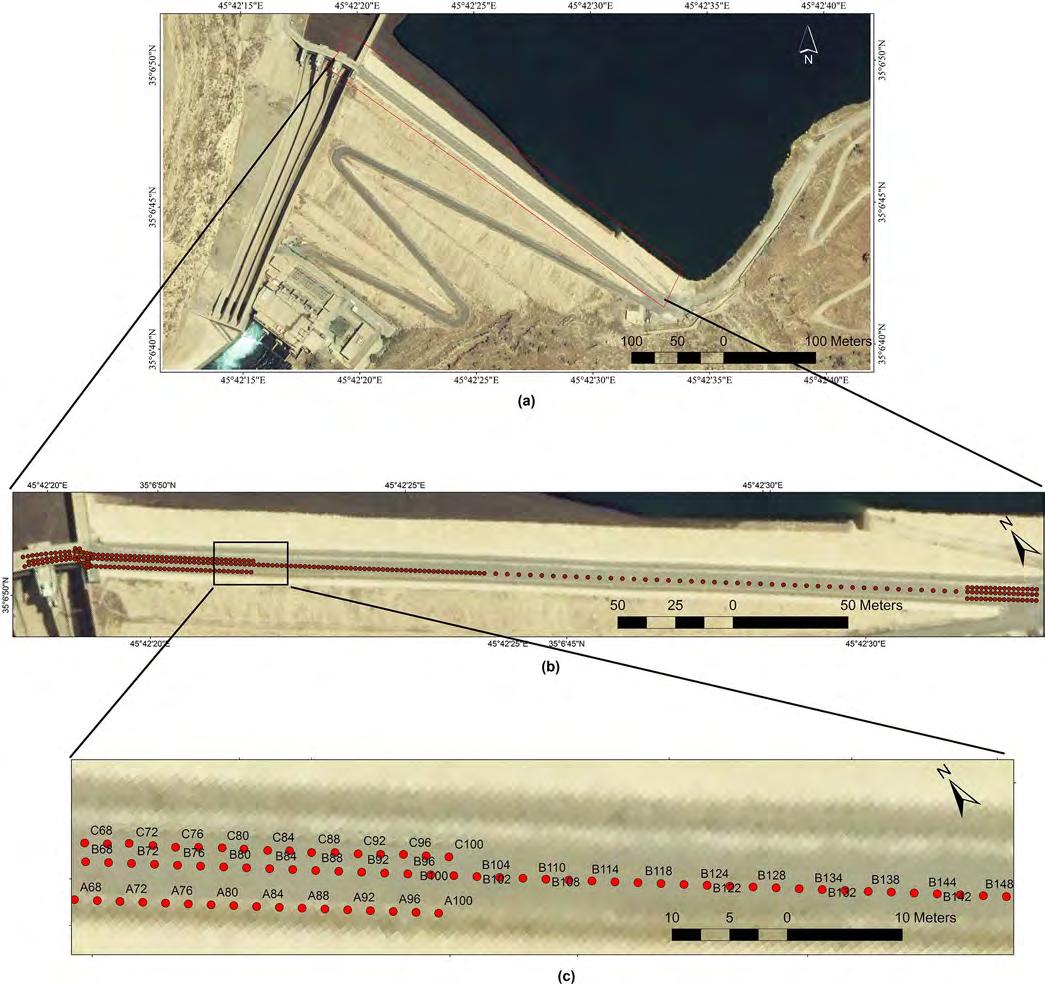
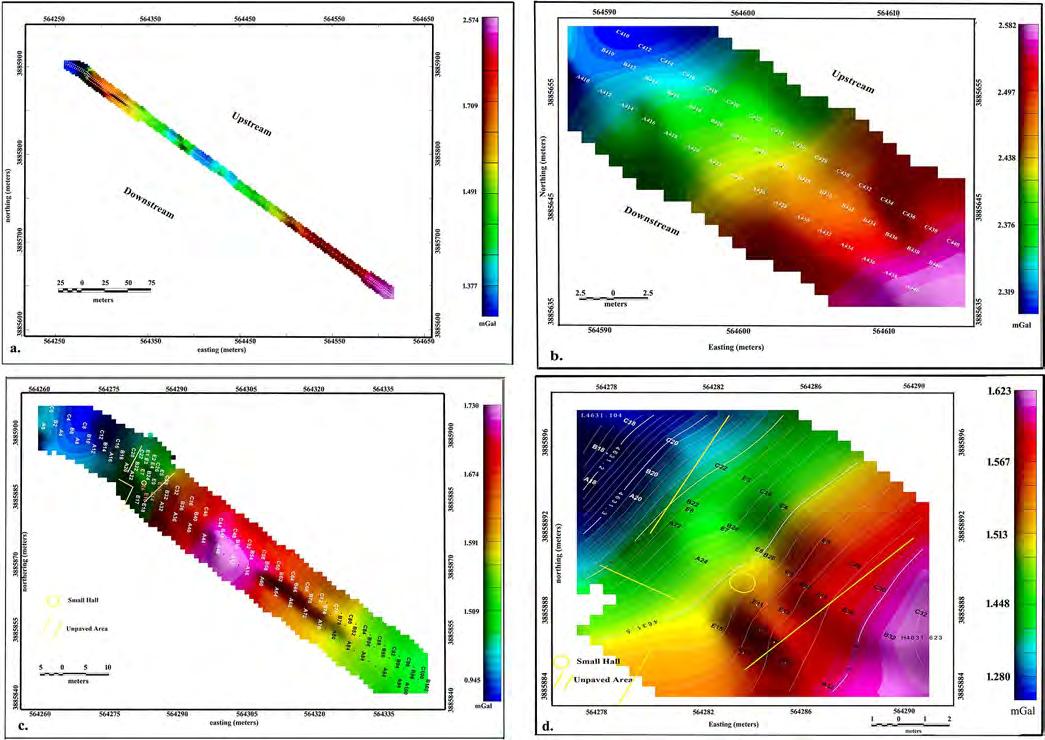
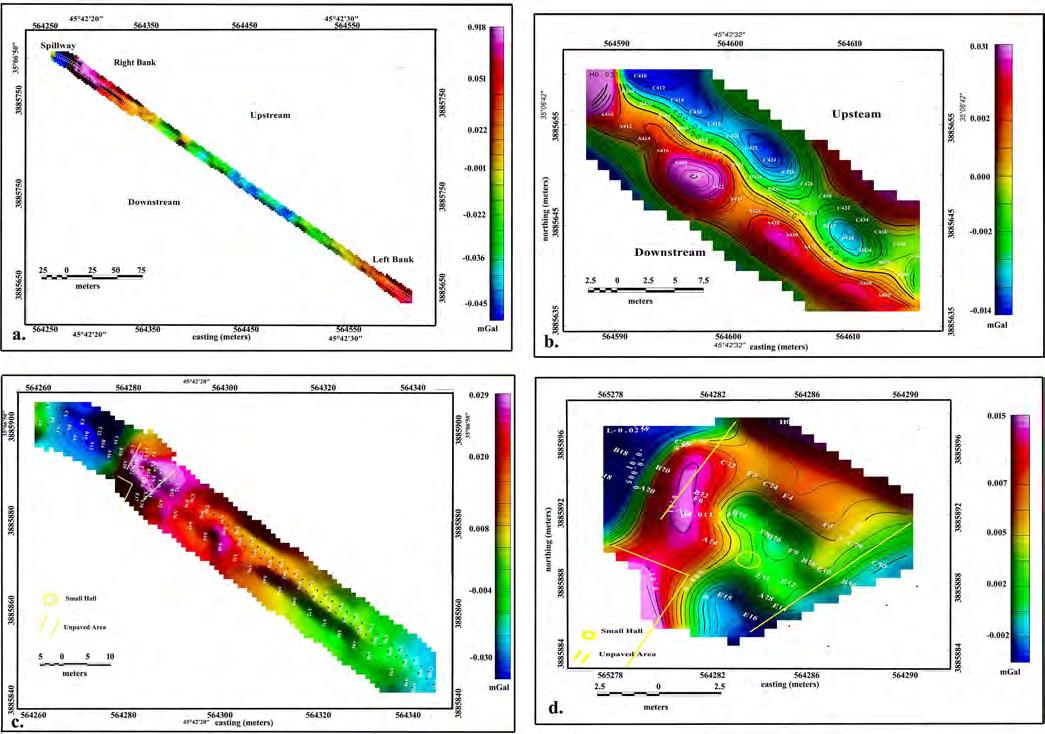
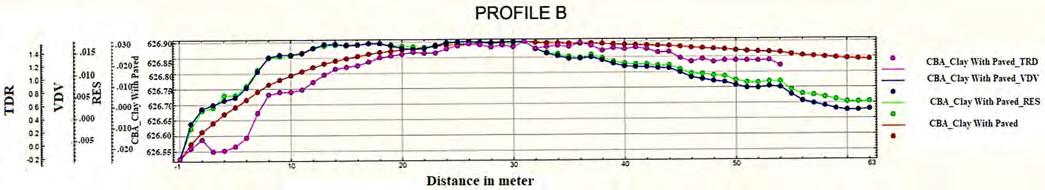
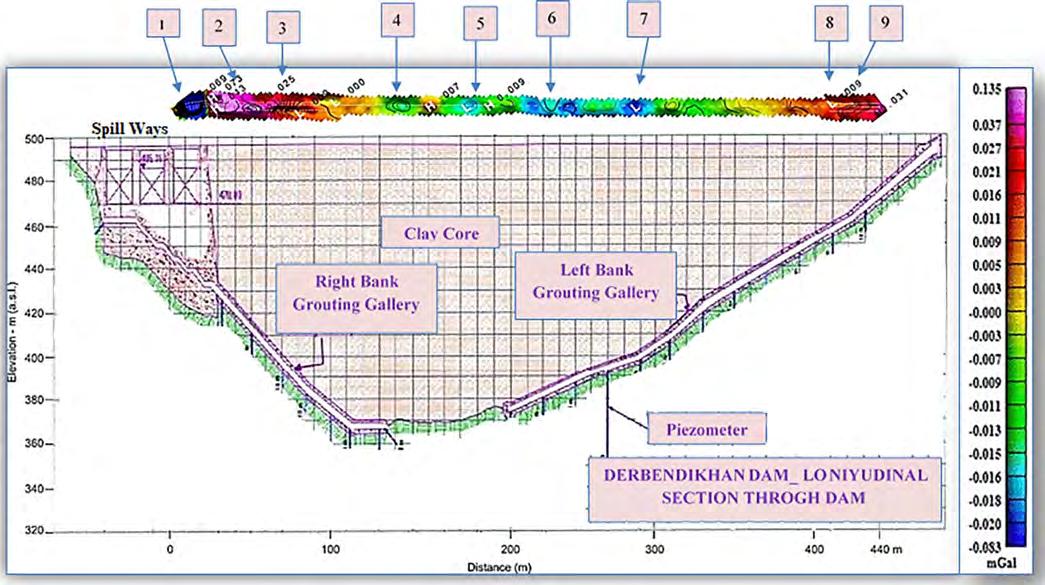
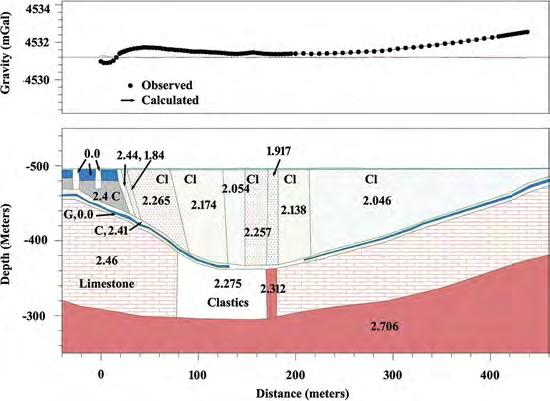
147MicrogravitySurveytoEvaluateEarthquakeEffectsontheDerbendikhanDamSite,Iraq AhmedMousa,HayderAl-Bahadily,andKevinMickus
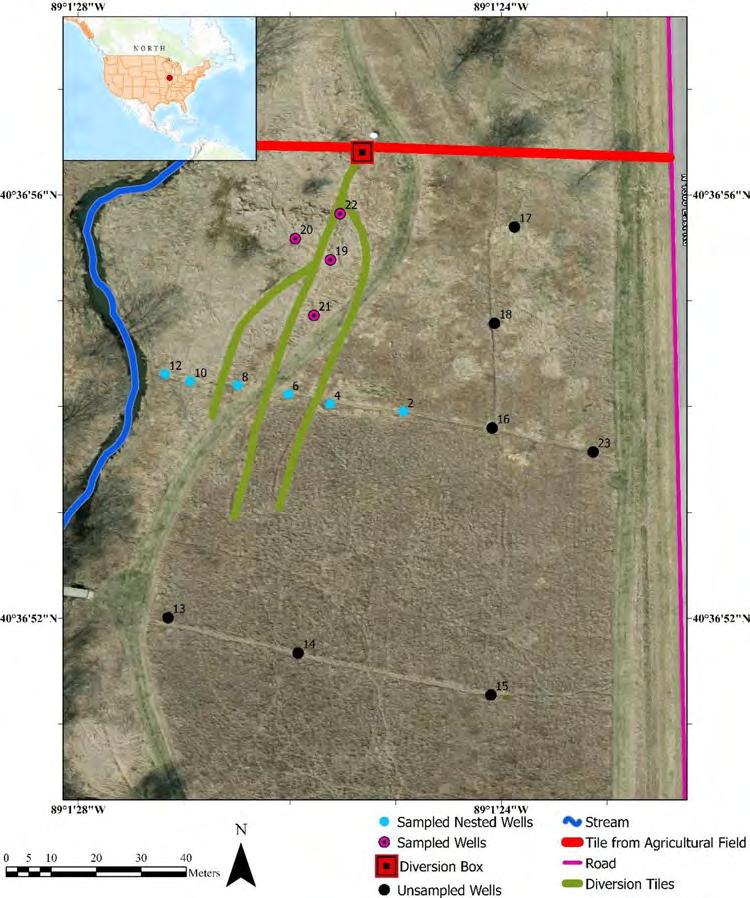
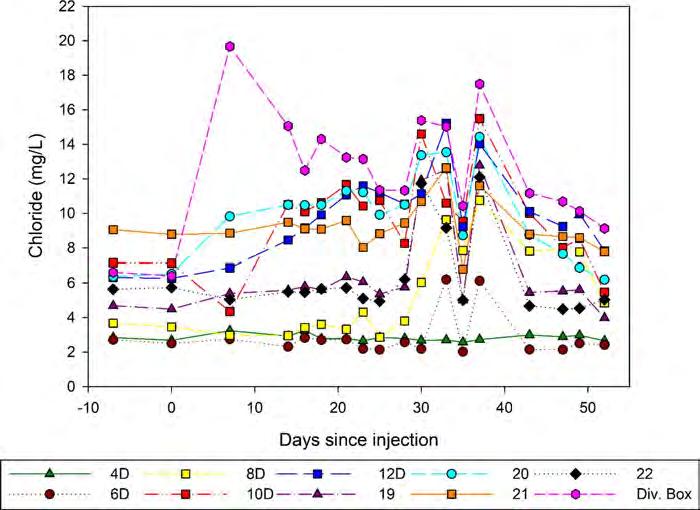
161TransportandFateofNitrateinaSaturatedBufferZoneasAssessedWithaChlorideTracerTest AlhassanSahadandEricW.Peterson
OpenAccessArticle EstimatingBackgroundThresholdValuesfor RiskAssessment KENNETHS.TRAMM* JASONT.MINTER
CATHERINEA.SEATON
ModernGeosciences,5100ThompsonTerrace,Colleyville,TX76034
KeyTerms: BackgroundThresholdValue,Risk-Based CorrectiveAction,UpperPredictionLimit,Upper SimultaneousLimit,UpperToleranceLimit,Metals
ABSTRACT Siteinvestigationsthatanticipatesoilscreeningwithin arisk-basedcorrectiveaction(RBCA)programoften requireanunderstandingofnaturallyoccurringor ambientsoilconditions.BecausemostRBCAprograms offerverylimited,ifany,pre-publishedvaluesfor naturallyoccurringmetals(e.g.,arsenicandlead), itisimperativethattheriskassessmentprocessbe informedbydefensiblescreening-levelbackground thresholdvalues(BTVs).Intheabsenceofrepresentative BTVs,conservativescreeninglevelsfromtheRBCAprocessmayincorrectly “screenin” ambientconditions asarelease(falsepositiveorTypeIerror)whennone hasoccurred.Falsepositivesaddunnecessarycost andconfusiontosubsequentinvestigationorremediationdecisions.Thisarticledemonstratesan effectiveapproachtodevelopingandevaluating soildatasetsforBTVdevelopmentduringanystageof therisk-assessmentprocess.Whereasthisarticlefocuses onthemostcommonmetalsassociatedwithTypeI errors(e.g.,leadandarsenic),theprocesstoestimate BTVsworksforanyorganicorinorganiccontaminants whensufficientdataisavailable.Theapproachoutlined inthisarticleisintentionallyconservativeinnatureto bothincreaseregulatoryacceptanceandsimplifythe statisticalstepsneededforBTVestimationatearlier stagesoftherisk-assessmentprocess.
INTRODUCTION EnvironmentalduediligenceintheUnitedStatesoften beginswithaPhaseIEnvironmentalSiteAssessment toidentifypotentialreleasesofhazardoussubstancesor petroleumproducts.Ifaconcernisidentified(i.e.,potential impactfromarelease),thismayleadtotheperformanceof
*Correspondingauthoremail: ktramm@moderngeosciences.com
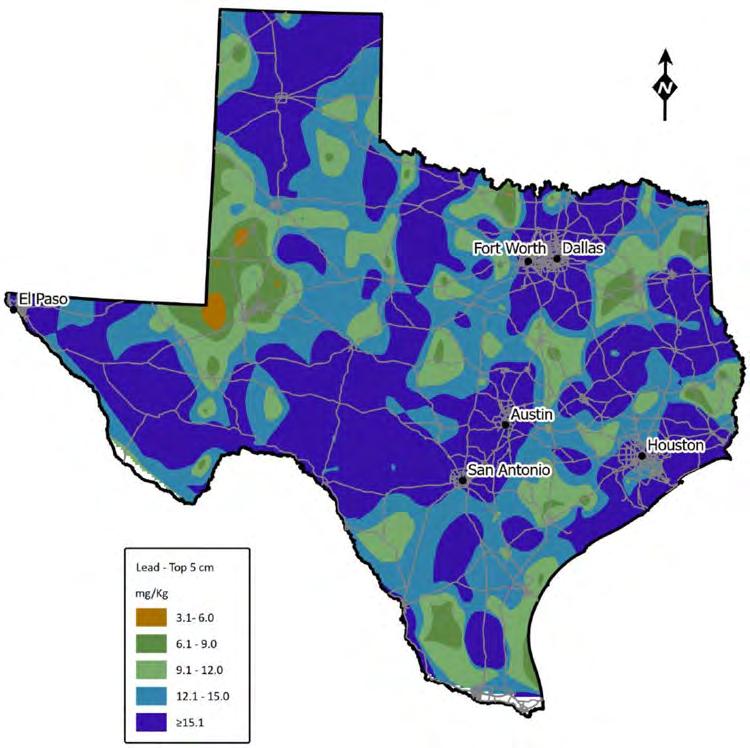
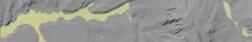
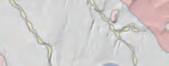
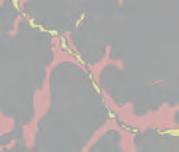
asiteinvestigationtailoredtothemostapplicableriskbasedcorrectiveaction(RBCA)program.RBCAprograms usefederal(i.e.,screeningusingUnitedStatesEnvironmentalProtectionAgency[USEPA]regionalscreening levels[RSLs]),state,orlocalgovernmentcriteriatodetermineifareleaseispresentorrequirescorrectiveaction. AllRBCAprogramsrelyoncontaminantfateandtransport modelstodeveloppre-calculatedsoilscreeningvaluesthat useaconservativesetofsite-specificparameters(e.g.,soil type,soilpH,anddepthtogroundwater)(USEPA1996a, 1996b).Forexample,thesoil-to-groundwaterleachingpathwayisoftenassociatedwiththemostconservativescreening valueinsoilformetalssuchaslead(USEPA,1999)dueto howapartition(distribution)coefficient(Kd)isusedfor modelingpurposes.WhereastheUSEPA(1999)(Pageiii) notesthat “soilscientistsandgeochemistsknowledgeableof sorptionprocessesinnaturalenvironmentshavelongknown thatgenericordefaultpartitioncoefficientvaluesfoundin theliteraturecanresultinsignificanterrorswhenusedto predicttheabsoluteimpactsofcontaminantmigrationor site-remediationoption,” manystate-basedprogramscontinuetouseoverlyconservativeKd valuesforscreening. Asaresult,nationally,thismodelproducessoil-togroundwaterprotectionscreeningvaluesforleadthat rangefrom3mg/kginTexas(30TAC §350;TexasCommissiononEnvironmentalQuality[TCEQ],1999),which islowerthan99.6percentofsoilsamplesinTexas (UnitedStatesGeologicalSurvey[USGS];Smithetal., 2013;andTramm,2024),tobeingdefinedas “immobile” atanyconcentration(USEPA,1996;NewJersey DepartmentofEnvironmentalProtection,2008,2021; HawaiiDepartmentofHealth,2007).Figure1providesavisualrepresentationofthesameleaddataset forTexasrecommendedbytheUSEPAforscreening (USEPA,2023;5cminterval –USGS2013),con fi rmingtherearenoleadsamplesmeetingthiscriterion. Additionally,halfofTexasisexpectedtoexceedthesingularmedian “background” valueof15mg/kgcurrently offeredasan “actionlevel” (TCEQ,2010).Thisapproach neglectsthat “spatialvariabilityofsoilisnotanacademic question.Itisareallandscapeattribute;ourunwillingnessorinabilitytoidentifyitinnowaydecreasesits
Figure1.SurfacesoilleadconcentrationsacrossTexas(Smithetal.,2013).Allofthe433surfacesoilsamples(5cm)takenacrossTexasexceedthe currentsoil-to-groundwaterprotectiveconcentrationlevelof3mg/kg.The “background” valueallowedinTexasforreleasedeterminationisamedian valueof15mg/kg(TCEQ,2010).AlldarkblueareasareexpectedtoexceedthislimitingvalueandresultinhighTypeIerrorrates(falsepositives).
magnitudeorexistence. Asscientistswemust documentthemagnitudeandformofsoilvariability; accommodateitsexistenceinmodelsofsoils;and transmitaccuratelytheexpectedpatternandimplication ofspatialchangestousersofsoilresources” (USEPA, 1992b;Wilding,1985).
TwokeyconservativemodelingdecisionsusedinTexas’ RBCAprogramthatresultedinsuchaconservativevalue (i.e.,3mg/kg)aretheassumptionsthatsoilhasapHof4.9 s.u.andissand(S).BothofthesearecontrarytoUSEPA guidance(USEPA,1996b;USEPA,personalcommunication,July10,2023),whichdirectsmodelingtousean assumedpHof6.8s.u.andsoiltypeofSandyLoam (SL).Further,theUSEPAspecificallynotesleadtobeone ofthe “leastmobile” metalsand “atpHvaluesabove6,lead iseitheradsorbedonclaysurfacesorformsleadcarbonate (USEPA,1992a),andcurrently, “atsitesintheearlystageof investigation,EPAnowrecommendsinvestigatingareas wheretheamountofleadinsoilis200partspermillion (ppm)[mg/kg]ormore.” (USEPA,2024b).Forcontext,
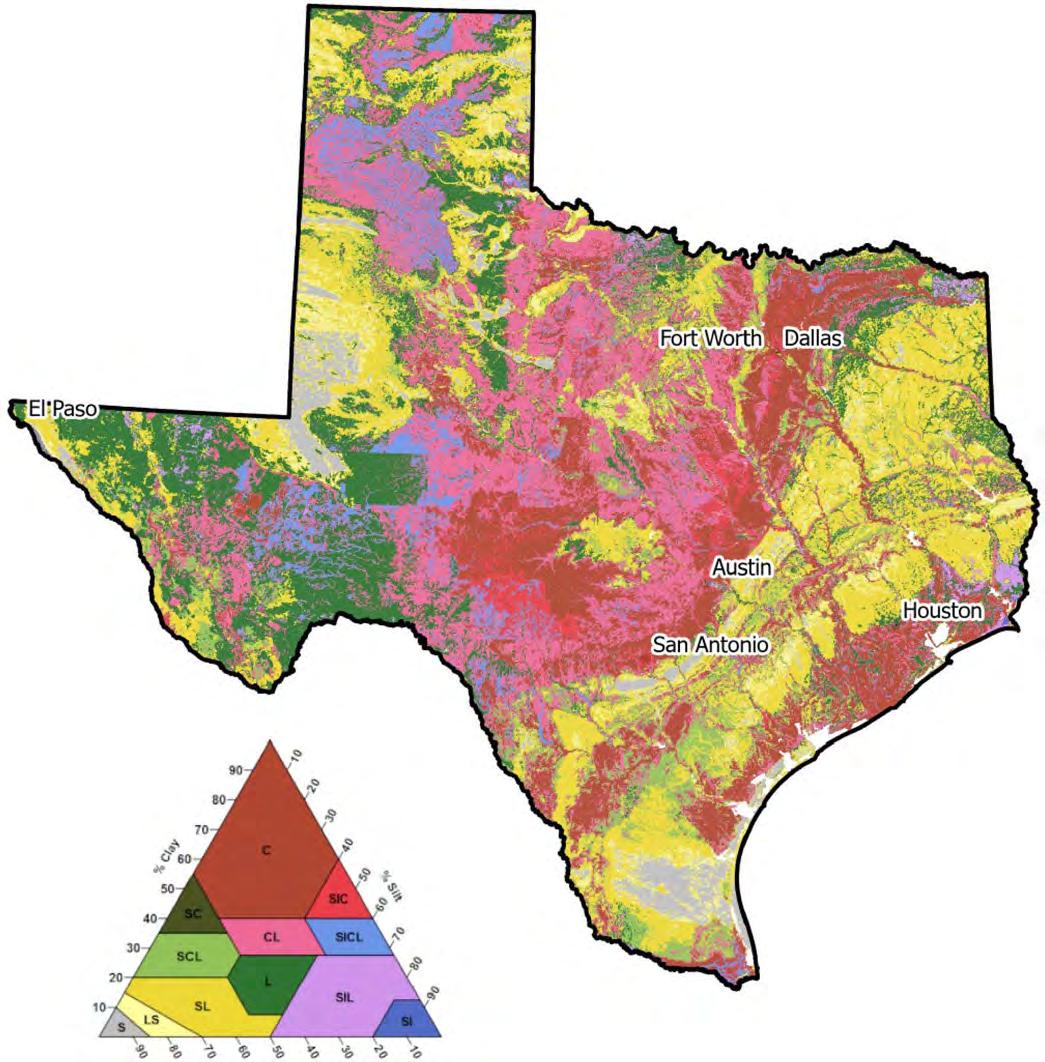
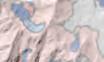
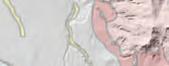
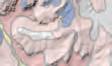
theelectiontouseapH4.9andsandysoilinTexas’ RBCAmodelingisconsistentwithapproximatelythree percentofTexassurfacesoil(Walkinshawetal.,2022). Figure2providesasummaryofactualsoilconditionsin surfacesoilacrossTexas.
Knowingthesepre-calculatedscreeningvaluescanbe significantlylowerthanmanynaturallyoccurringmetal concentrations(e.g.,leadandarsenic),itisimportantto developbackgroundvaluestoinformthescreeningof investigationresultssoareleasedeterminationcanbemade.
Unfortunately,mostRBCAprogramshavelittletono backgrounddatatocompletethisscreening,leavingthe regulatedcommunitytorepeatthisworkindependently andattheirexpense.Undertakingasite-specificbackgroundstudyforeveryinvestigationeffortshouldnotbe theoutcomeintendedbyregulatorsforsimplebaseline assessmentsforwhichmetalsscreeningisnecessary; therefore,thispaperprovidesanapproachthatcanbeundertakenusingexistingdatasets.Forexample,whereasthe USEPA(1996b)directsusersto “compareavailabledatato
EstimatingBackgroundThresholdValues Figure2.SurfacesoiltypesacrossTexas(Walkinshawetal.,2022).Thetypesofsurfacesoils(25cm)arepredominantlyclayeyandloamyin nature.AcrosstheUSDA-NCSSdataset(0–50cm)fromTexas,approximately17percentisconsistentwiththeUSEPA’srecommendedsoiltype ofsandyloam(SL),whereasonly2.9%issandasusedformodelingpurposesinTexas.Atotalof94percentofTexassurfacesoiliseitherclayey (C,CL,SCL)orloamy(L,SCL,SL).
background,” itoffersnopre-calculatedvaluesconsidering naturallyoranthropogenicallyoccurringconditionsorclear approachesfordevelopingabackgroundthresholdvalue (BTV).Evenwhenstate-basedguidancedoesofferbackgroundvalues,thesemaybetooconservativeandresultin unacceptableTypeIerrors(falsepositives)(USEPA,1992c, 1995a,1995b;VosnakisandPerry,2009).Forexample,
theTCEQ(1999)acknowledgesthemedianvalues offeredundertheTexasRiskReductionProgramas “background” had “ noscientifi cbasisfordrawinginferences aboutthedistributionofbackgroundconcentrationsona specificaffectedpropertybasedonavaluewhichrepresentsamedianconcentrationfortheentirestate,” yet theTCEQcontinuestouseitforreleasedetermination
(TCEQ,2010).OneTexasmunicipalityestimatedthe directresultofhavingtouseastate-widemedianbackgroundvaluewasinexcessof$250,000annuallyin unnecessarysoiltesting,management,andevendisposal eventhoughtherewasnorelease(Tramm,Minter,and Seaton,2023).
TheabsenceofreadilyavailableBTVsisprimarilya resultofthecomplexityandvarietyofstatisticaltools availableforevaluatingdatasetsaswellasthevariability inherentwithintypesofgeologyandresultingsoilsfrom acrosstheUnitedStates(USGS,1985;Díezetal.,2009). However,withnew,widelyacceptedtools(i.e.,theUSEPA’sProUCL)andavailabilityofspatiallyrelevantdata (i.e.,USGSdata)tothelargerscientificcommunity,itis nowpossibletodevelopBTVsusingafewconservative principles.ItshouldbenotedthattheutilizationofUSGS datasetsisnotinanywaysuggestedtoreplaceathoroughsiteinvestigationofspecificsourceareasbutrather toprovideatooltoutilizeformetalscomparisonvalues andfordelineationpurposesforspecificmetalsofconcern. Duringarisk-basedassessment,theapplicationofthistechniqueshouldbeconsideredonacase-by-casebasis,taking intoconsiderationtheavailabilityoftheinformationinthe siteareaandthesourceandnatureofthepotentialreleaseto theenvironment.
STUDYOBJECTIVES Theobjectiveofthisarticleistosetforthasimple processwithcleardecisionparameterstoaidtheselection andcensoringofrepresentativedatasetsforBTVestimationusingpubliclyavailabledataandtools.Notethatthis emphasisistoselectivelycensordatasetsinaneffortto optimizeparametricperformanceanddeliverconservative valuesthatwouldgenerallybeacceptedbyregulatorsfor screeningpurposes(i.e.,minimizesubpopulationbiassuspectedofaddingtoaright-taileddistribution).Itisoften thecasethatless “normal” orevennon-parametricdata setswillbesufficientunderamorein-depthstatistical demonstrationtodevelopBTVs.Buttheseinstances shouldhavethebene fi tofregulatoryinputconcerning anycorrectiveactionorremedialdecisions.Accordingly,itisrecognizedthatcensoring,fortheapproach setforthinthisarticle,mayrequiretheexclusionofnaturallyoccurringvaluesasoutliersforthebenefitofdefensible screening-levelBTVs.
RESEARCHMETHODS DataSelection TheUSEPAnotes, “USGSdatasetsforsoilprovidea baselinefortheamountanddistributionofchemicalelementsandmineralsagainstwhichscientistscanmeasure
futurechangesfromnaturalprocessesorhumanactivities” (USEPA,2023).TheUSEPAisalsoclearthat “published data” frompriorsiteinvestigations,localfederalandstate surveys,anduniversitiesareacceptable(USEPA,1995b) fordevelopingBTVs.
DataSetExamples NationalData TwonationalUSGSdatasetshavebeenpartofmany priorbackgroundmetalsvalues.Thisincludesa1981USGS datasetrepresentingsoilsamplesanalyzedbetween1958 and1980thatwereconvertedtoadatabaseformatin1996 byUSGSthatoffersgeospatialinformationneededforBTV development.Thefull1981USGSstudyincluded1,323 samples(»1per6,000km2)collectedacrosstheconterminousU.S.atadepthof20cm(8in.)belowgrade(Boerngen andShacklette,1981).Expandedversionsof1981datasets arepresentedlaterwithmoredataand/orimprovedspatial presentations(ShackletteandBoerngen,1984;Gustavsson etal.,2001).
In2013,theUSGSpublishedastudyinclusiveofsamplingcompletedbetween2007and2010thatutilizeda highlydetailedprocessforsamplepointcollectionthrough analysisthatincludedavoidanceofanthropogenicsources (i.e.,notsamplingwithin200mofamajorhighwayor within5,000mwithinindustrialactivities),highsampling density(»1per1,600km2),multipledepths(e.g.,5cm, HorizonA,HorizonC),andextensiveuseofqualitycontrolprocedureswithinthelaboratoryanalysis(Smithetal., 2013).The2013USGSeffortincludedmorethan4,800 samplepoints(morethan14,400samples)withanalysisof 45majorandtraceelements.
WhereastherearesubtledifferencesbetweentheUSGS methodsutilizedinthesestudiesandUSEPAmethods morecommonlyusedinriskassessment,sufficientverificationhasbeenperformed(Hydrometrics,2013;Brooks, 2021)concerningthestudyperformanceforleadandarsenictoallowuseforBTVdevelopment.However,reviewof USGSvs.USEPAmethodperformancesuggestsavery highbiasinUSGSdatashouldbeexpectedforaluminum (i.e., .100percent)withlesser,butsignificant,highbias observedwithinbarium,chromium,andvanadiumresults (AndersonandYacucci,2021;Tramm,Minter,and Seaton,2023).Likewise,theUSGSmethodformercuryisbiasedlowwhencomparedwiththeUSEPA methodaspreservationtechniquesarenotinvolvedto addressvolatilization.
Ifdevelopingasediment-specificBTVorlookingto supplementsoil-specifi cdata,theUSGSNationalGeochemicalSurvey(NGS)offersdataataveryhighdensity (goalof »1sampleper290km2).Whereasmuchofthis datasetwasinitiallycollectedtosupporttheNationalUraniumResourceEvaluation(NURE)programandarelated
HydrogeochemicalandStreamSedimentReconnaissance (HSSR)effortinthe1970sand1980s,poorlaboratoryperformancerenderedtheinitialdatadifficultforuse.Sincethe initialevaluation,theUSGShasaddedtotheoriginalNURE andHSSReffortbyreanalyzingmanysamplesunder improvedqualityassuranceprogramsandextendingtheinitialsamplingdensityforthecurrentNGS(USGS,2004).
StateData ManystateentitiesmayhavesuitabledataforBTV development.Forthisreview,a2012state-specificand single-intervaldatasetpreparedbythecooperationof USGS,NaturalResourceConservationService,Wisconsin DepartmentofNaturalResources,andWisconsinDepartmentofHealthServiceswasselected(Stensvold,2012) thatfocusedonWisconsin.This2012studyincluded664 soilsamplescollectedatadepthofapproximately15cm (6in.)andanalyzedfor17traceelements.Effortstoavoid anthropogenicinterferenceincludedonly “undisturbed” locationsatleast20feetfromafenceline,100feetfrom historicalconstructionsites,andnotwithin300feetofsuspectedarseniccontaminationsources(e.g.,orchards,cattle dipping,woodpreservationactivities,papermills,orpoultry/swinemanure).AnalyseswereperformedusingEPA Method200.7afterovendrying,grindingforhomogeneity, andacidpreservation/digestion.
RegionalorSite-SpecificData Whereastheauthorsdidnotperformsamplingtorepresentaregionorspecificsiteforthiseffort,spatially relevantUSGSdatahasbeenisolated(Smithetal.,2013) thatwasappropriatelycollected,analyzed,subjecttoquality assuranceevaluationsandthatoffersregionaldatasufficient forBTVdevelopment.Similarsite-specificdatacollection couldbeusedtoinformBTVdevelopmentwithinamore localizedareaifneeded.
StatisticalEvaluation TheUSEPAestablishedanacceptableTypeIerrorrate (falsepositive)goalin1996of0.05(fivepercent)(USEPA, 1996b)forselectionofrepresentativebackgroundconditions.TomeetTypeIerrorrategoals,theauthorsonlyestimatedBTVsusingthespecifiedconfidencecoefficientof 0.95withinaselecteddatasetbeingusedforBTVdevelopment.ThisisthedefaultsettingwithintheUSEPA’s ProUCLaswell.
In2022,theInterstateTechnologyRegulatoryCouncil (ITRC,2022)releasedguidanceonthedevelopmentof BTVsthatincludedinputfrom16separatestateregulatory agencies,theUSEPA,USGS,andUnitedStatesArmy CorpsofEngineersincooperationwithmultipleuniversities,industryrepresentatives,andprivateengineering firms.
TheITRCandUSEPArecognizethatthe95percent uppertolerancelimit(UTL) “hasbecomethemostcommon measureofBTVinpractice ” withthe95percentupper simultaneouslimit(USL)presentedwhenthereareminimalstatisticaloutliers.Moreover,theUSLcanbe “specificallyusedtomitigatetheissueofexcessivefalsepositive errorrateinpoint-by-pointcomparisons” (ITRC,2022). Athirdand “unrealisticallyconservative” toolforBTV purposes,pertheITRC,isthe95percentupperprediction limit(UPL).
TheUTLrepresentsthevalueatwhich95percentof recordedsamplesareexpectedtofallbelowit95percent ofthetime.TheUSListhestatisticatwhichallpotential observations(presentandfuture)fromtheselectedpopulation arelessthanorequaltoitwith95percentconfidence(Singh andNocerino,1997).TheUPLestablishesalimitthatclassifiesfutureobservationsatorbelowthislimitasbeingtaken fromthesamepopulationwitha95percentconfidence.
TheITRCnotesthatminimumsamplesizesacceptable totheUSEPAandallinvolvedstateregulatoryagencies rangefrom8to20samplestoensurethatsufficientstatisticalpowerandrepresentationofsoilheterogeneityarepresent.Tomeetthisgoal,theauthorssuggestthatBTV developmentonregionalorlargerareasincludeatleast20 samplesiftheUSListobeconsidered.Aminimumof eightsamplesisrecommendedforconsiderationofthe UPLandUTL.Site-specificBTVsmaybeacceptabletoa regulatoryagencywithfewersamples,butnon–sitespecificBTVsrequireasuitablestatisticalpowertoaddress expectedheterogeneity.Althoughitisbeyondthescopeof thisarticle,anyriskassessorworkingacrossmultiplephysiographicprovincesshouldunderstandthesignificanceof varyinggeomorphologicalconditionsaffectingsoiltypes. Forexample,soilsderivedfromshale(hydrolyzates)can havemorethan fivetimesthearsenicorleadconcentrationscomparedwithsoilsderivedfromsedimentaryformations(resistates)(USGS,1985).
BTVEstimators Forscreeningpurposes,theauthorsdevelopedUPL, UTL,andUSLvaluesforconsiderationasBTVestimators. Forconsistency,allstatisticalcalculationswereperformed withinUSEPA’sProUCL(version5.2),whichutilizes adjustedformulasbasedonpopulationdistributions. Onceidentifi ed,rawdatafromeacharsenicandlead datasetarethenevaluatedusingProUCL.Thesample number(n),mean(x ),median(M),standarddeviation ( r),minimum,andmaximumobservationswithineach dataset,alongwiththecorrespondingUPL,UTL,and USL,areprovidedforeachdataset.FormulasareprovidedasSupplementalMaterialFigureS1.Supplemental Materialassociatedwiththisarticlecanbefoundonlineat https://www.aegweb.org/e-eg-supplements.Ifthedataset
UPLMostconservative,leastinclusive8
Rof |0.7|andCVof #1.0
UTLModeratelyconservative,moderatelyinclusive8 Rof |0.85|andCVof #0.85 USLLeastconservative,mostinclusive20 Rof |0.95|andCVof #0.5 |RPD|of x andM #10%
containsnon-detectresults,itissuggestedthathalfthe detectionlimitbeappliedforeachsample(USEPA,2006). However,ifthedatasetcontainsmorethan15percentnondetectsamples,thesimplifiedscreeningapproachpresented inthisarticleisnotsuggested,andmorerobuststatistical analysisisneeded(USEPA,2000,2002b)thatareconsistent withthegoverningregulatoryauthority’sexpectations. Alternately,otherdatasetsshouldbesoughtforBTVestimationthatutilizeamoreappropriatesampledetectionlimit.
Notethat,althoughnotutilizedforthiseffort,ifaBTV isbeingdevelopedusingUSGSdataforaluminum,the highestBTVestimatorrecommendedisthemean.Likewise,ifaBTVisbeingdevelopedusingUSGSdatafor barium,chromium,orvanadium,thehighestestimatorrecommendedisthe95percentupperconfidencelimit.These recommendationsarebasedonobservedUSGSmethod performance(i.e.,highbias)whencomparedwithUSEPA methodperformancewithinothernationalstudiesand anexpectationthatriskassessmentwillrelyonUSEPA methodperformanceforallriskdeterminations.Itis worthnotingthatallUSGSmethodresultsformercury shouldbeconsideredbiasedlowiftheydonotinclude preservationstepstoaddressthiselement ’svolatility.
Withinthescreening,theauthorsvisuallyexamined individualquantile-quantile(Q-Q)plotstoidentifypossible right-tailoutliers(presenceofbreaks/gaps)asthis “unarguablyisoneofthemostpowerfuldiagnostictoolsinthe handsofaresearcher” (Singhetal.,1994).Thisvisual examinationiscombinedwithreviewofstatisticaldistribution(e.g.,normalorlognormal)alongwithminimumpopulationstatisticsthatincludealinearcorrelationcoefficient ( R)of |0.7|(NavalFacilitiesEngineeringCommand, 2002)andacoefficientofvariance(CV)of #1.0(USEPA, 2022a,2022b)toconfirmthatthedatasetnormalitythresholdswereacceptabletoallowtheproposedstatisticaltesting.ThisisconsistentwiththeUSEPACVrequirementfor censoringdata(USEPA,2006)andrepresentstheUSEPA’s recommendedmaximumCVwhendiversesoiltypesare anticipated(USEPA,1995a).Anotherbenefitofweighing CVperformanceinBTVestimatorselectionisthat,asCV valuesdecrease,lognormaldistributionsbecomeverysimilartothatofnormallydistributeddatasets(USEPA, 2002a).TheUSEPAalsoemphasizestheimportanceof understandingyourdataset’smeanandmedianrelativeto eachother.Morespecifically,the “meanandmedianprovidesanothermethodofidentifyingtheshapeofthedata.If
themeanisapproximatelyequaltothemedian,thenthe dataaredistributedsymmetrically.Ifthemeanisgreater hanthemedian,thenthedataareright-skewed;ifthemean islessthanthemedian,thenthedataareleft-skewed” (USEPA,2006).AsanadditionalconservativestepinBTV estimation,theauthorsutilizedonlytheProUCL-developed valuescalculated “assumingnormaldistribution.” Itisimportanttonotethatnaturallyoccurringenvironmentaldatawill commonlyexhibitright-skewedlognormal,gamma,or non-parametricdistributions(USEPA,2022a)andthe outlierselectivelyremovedmayindeedbeaportionof abackgrounddataset.Whereasthecensoredanduncensoreddatasetsareoftenlognormaland/orgammaindistributionwithexpectedright-taileddistributions,ProUCL presentsalessconservativeestimatorunderthesetailored estimatorsandmayrequireregulatoryconcurrenceto allowuse.Additionally,onlythehighestobservedconcentrationswereconsideredforcensoring.Itmaybeappropriate,whenwithinaregulatoryprogram,toconsiderequal censoringatthehighestandlowestobservedconcentrations, useofformaloutlierdetectionmethods(e.g.,DixonorRosner),alternatetreatmentofnon-detectsamples,orotherstatisticalprocessestailoredtoadataset(Daniel,2015).
Thisscreeningwasinclusiveofoutliercensoringbased onvisual(i.e.,Q-Qplots)andnumericalconsiderationsin anefforttoyieldthelargestresponsiveBTVestimatorfor agivendatasetasoutlinedinTable1.Notethatitisintentionalthatthescreeningroundtothespecificperformance goalbasedonthesignificantdigitsnoted.
Anormalityquadrantgraph(NQG)wasprovidedwith eachdatasetscreeningtoillustratetheperformanceofthe resulting R andCVvalueswithandwithoutcensoring.Data setswithintheupperleftquadrantoftheNQGwereconsideredsuitableforfurtherstatisticaltestinganddevelopmentof theBTVs.Datasetsfallingoutsidethe upperleftquadrant requirecensoringand/orfurtherevaluationusingnon-parametricmethods,whichisoutsidethescopeofthisarticle.
State and AreaBTVExamples Boundariesselectedforstudyincludedadetailed exampleforfourstatesandtworegionalareas.Additionally, calibrationoftheproposednormalityperformancegoals (Table1)includedafullevaluationofthe2013USGSdata setforeachstateintheconterminousUnitedStates.AsummaryofviableBTVsforleadandarsenicwithineachstate arealsoprovidedfromthiseffort.
Table1. BTVestimatorselectioncriteria.
Table2. Oklahoma:ArsenicandleadBTVestimation.
Censoring
None ,100 ,50 ,45 ,30None ,25 ,18 ,17 ,15 n333331329325316333331327322317
Min5.35.35.35.35.30.80.80.80.80.8 Max12252.447.644.629.625.620.417.516.214.9 x 16.0915.4915.2714.8814.205.825.705.545.3585.197 M 13.4013.4013.4013.4013.154.904.904.904.854.8 RPD 18.2414.4713.0410.477.6817.1615.1312.249.9537.9424 r 10.8707.6417.1196.2514.7644.0103.7203.4323.1342.88 CV 0.6760.4930.4660.4200.3350.6890.6520.6200.5850.554 R 0.7480.8810.8950.9210.9770.9160.9320.9430.9560.967
BTVEstimators
Remarks:
Allconcentrationsinmg/kg. Nonon-detectswerewithintheleadorarsenicdatasets. RPD ¼ relativepercentdifferencebetweenthemean(x Þ andmedian(M). GreenhighlightedcellsrepresenttheselectedBTVforthedataset. BoldvaluesrepresentapotentialBTVestimator.
• Oklahoma:2013USGSdatasetswereisolated,and allverticalintervalswereevaluated.
• Louisiana:2013USGSdatasetswereisolated,andall verticalintervalswereevaluated.
• Wyoming:2013USGSdatasetswereisolated,andall verticalintervalswereevaluated.
• Wisconsin:2012datasets(Stensvold,2012)and2013 USGSdataset.
• SanAntonio,Texas,area:2013USGSdatasetswere isolated,andallverticalintervalswereevaluated.
• Dallas–FortWorth,Texas,area:2013USGSdatasets wereisolated,andallverticalintervalswereevaluated.
• SummaryofconterminousU.S.states:2013USGSdata setswereisolated,andallverticalintervalsevaluated.
RESULTSANDDISCUSSION Oklahoma
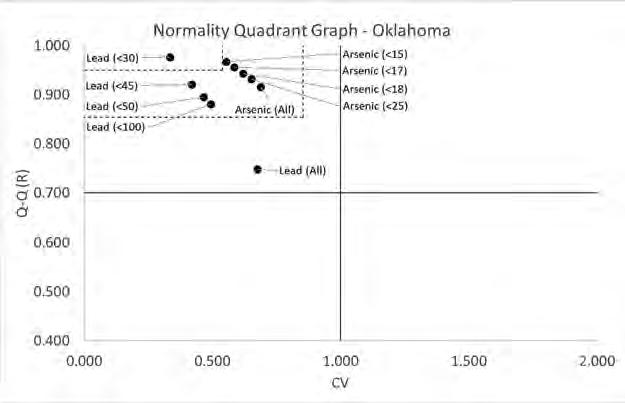
TheOklahomadatasetincluded333soilsamples.The resultsofiterativecensoringandtheresultingstatistical performancearedetailedinTable2(Oklahoma:Arsenic andleadBTVestimation)andFigure3(Normalityquadrantgraph[Oklahoma]).
Figure3.Normalityquadrantgraph(Oklahoma).
Censoring
None ,50 ,40 ,35None ,40 ,20 ,15 n225223218211225224222219 Min4.44.44.44.40.80.80.80.8
Remarks:
Allconcentrationsinmg/kg. Nonon-detectswerewithintheleadorarsenicdatasets. RPD ¼ relativepercentdifferencebetweenthemean(x Þ andmedian(M). GreenhighlightedcellsrepresenttheselectedBTVforthedataset. BoldvaluesrepresentapotentialBTVestimator.
Thelargest(i.e.,mostinclusive)BTVestimatorsforleadand arsenicmeetingnormalitygoalswere34.05mg/kgand13.00 mg/kg,respectively.Figure3providesaclearsummaryof datasetnormalityimprovementsseenwithcensoring. Whereassignificantnormalityimprovementswereseen withintheOklahomaleaddatasetcensoringat45mg/kgand 30mg/kg,eachallowinguseofamoreconservativeestimator,thelargestdefensiblescreening-levelBTVvaluemeeting normalitygoalswastheUPLasthisisaconservativestatistic allowingforaninclusivedataset.Minimalnormality improvementswereseenwithintheOklahomaarsenicdata setcensoring,andthefulldatasetalloweduseoftheUTL.
TheOklahomaDepartmentofEnvironmentalQuality (2023)utilizestheUSEPA’sRSLs,whichhavenobackgroundvaluesformetalsasthebasisofreleasedeterminations.Smallerstate-widestudieswereidentifiedthat rangedfrom6to30soilsamplescollectedstate-wide thatexhibitedsimilarmean(x )concentrationsforlead (10.25–18.3mg/kg)andarsenic(3.44–7.29mg/kg)butdid notdevelopBTVestimates(Richardsetal.,2012).
ThevalueofarepresentativeBTVisimmediatelyapparentwhenconsideringthatthecurrentresidentialUSEPA RSLforarsenicinsoilis0.68mg/kg(targetcancerriskof 10 6,targethazardquotientof1),yetnoneofthe333 USGSsoilsampleswouldmeetthismodeledriskcriteria (USEPA,2024a).
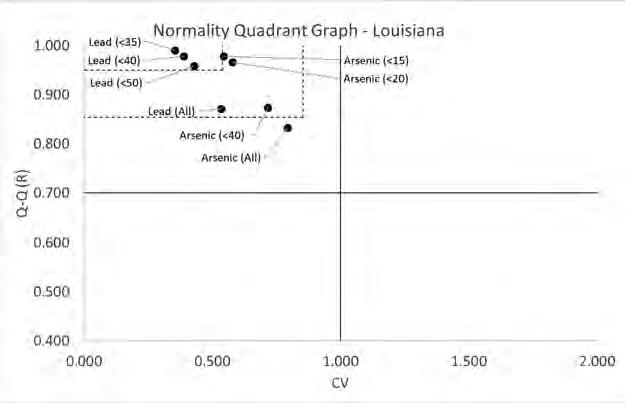
Louisiana TheLouisianadatasetincluded225soilsamples.The resultsofiterativecensoringandthecorresponding
statisticalperformancearedetailedinTable3(Louisiana: ArsenicandleadBTVestimation)andFigure4(Normality quadrantgraph[Louisiana]).
Thelargest(i.e.,mostinclusive)BTVestimatorsfor leadandarsenicmeetingnormalitygoalswere45.44mg/ kgand16.41mg/kg,respectively.Figure4providesa clearsummaryofdatasetnormalityimprovementsseen withcensoring.Significantnormalityimprovementswere seenwithintheLouisianaleaddatasetwhencensoredat 50mg/kganddemonstratingthelargestdefensible screening-levelBTVtobetheUSL.TheLouisianaarsenicdatasetwasbestrepresentedwiththeUSLfollowing sufficientcensoringtoobtainCVnormalityperformance goals.Here,roundingtotherequiredsignificantdigitperformanceforaCVof0.5metperformancegoalsand alloweduseoftheUSL.SeeTable3foranillustrationof thispoint.
TheLouisianaDepartmentofEnvironmentalQuality (LDEQ,2003)currentlyoffersabackgroundvalueof 11.5mg/kg,roundedto12mg/kgintheLDEQ’sscreeningtableundertheRiskEvaluationCorrectiveAction Program(RECAP).RECAPestablishesanacceptable backgroundasthemean(x )plusonestandarddeviation (r).Ifevaluatinginasimilarmannerfromthissamedata set,theresultingRECAP-basedvaluewouldbe11.28 mg/kg.AlthoughRECAPdoesnotofferapublished backgroundvalueforlead,theRECAP-basedvaluefor lead(x þ r)usingtheUSGSdatasetyields28.9mg/kg asbackground.In2021,theLDEQ(2021)beganallowingquantitativeuseofthe2013USGSdatasetforbackgroundevaluation. Table3.
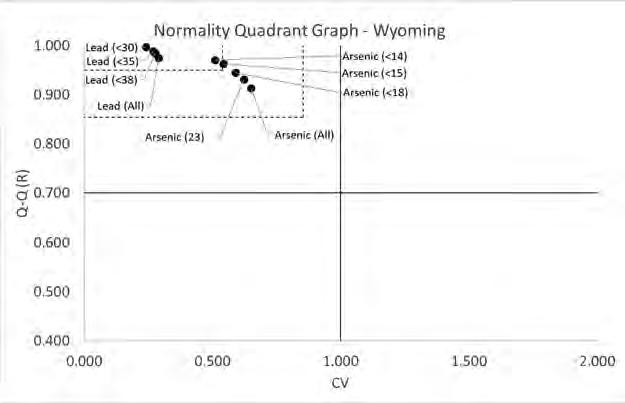
Wyoming
TheWyomingdatasetincluded481soilsamples.The resultsofiterativecensoringandtheresultingstatistical performancearedetailedinTable4(Wyoming:Arsenic andleadBTVestimation)andFigure5(Normalityquadrantgraph[Wyoming]).
Thelargest(i.e.,mostinclusive)BTVestimatorsforlead andarsenicmeetingnormalitygoalswere38.65and14.82 mg/kg,respectively.Figure5providesaclearsummaryof datasetnormalityimprovementsseenwithcensoring.Given
thehighlynormalperformanceofthefullleaddataset,minimalimprovementsinnormalitywerenotedfromcensoring, whereassufficientcensoringofthearsenicdatasettoaddress theriskofremainingoutliersorsubpopulationsallowedconsiderationoftheUSLat ,15mg/kg.TheUSLprovedtobe themostrepresentativeBTVestimatorforleadandarsenic.
TheWyomingDepartmentofEnvironmentalQuality (WDEQ)utilizesitsWyomingEnvironmentalQualityAct andsupplementsitwiththeUSEPA’sRSL,whichoffers nobackgroundvaluesformetals.However,theWDEQ publishedBTVsforarsenic(12mg/kg),lead(32mg/kg),
Censoring
None ,38 ,35 ,30None ,23 ,18 ,15 ,14 n481477474459481480476467460 Min11110.30.30.30.30.3 Max40.437.234.828.831.822.617.814.913.8 x 18.6418.4718.3617.915.655.605.475.265.119 M18.0018.0018.0017.904.804.804.754.704.7 RPD3.492.581.980.0616.2715.3114.1411.178.53 r 5.4315.1234.9374.3413.6813.4853.2262.8472.641 CV0.2910.2770.2690.2420.6510.6230.5900.5420.516 R0.9750.9840.9890.9970.9130.9310.9450.9630.971 BTVEstimators 95%UPL27.6026.9226.5025.0711.7211.3510.809.959.48
Remarks:
Allconcentrationsinmg/kg.
Atotalofthreenon-detectsamples(,0.6mg/kg)wereincludedathalfthedetectionlimit(0.3mg/kg)forthearsenicdataset.Nonon-detectsampleswerepresentintheleaddataset.
RPD ¼ relativepercentdifferencebetweenthemean(x Þ andmedian(M). GreenhighlightedcellsrepresenttheselectedBTVforthedataset. BoldvaluesrepresentapotentialBTVestimator.
Figure4.Normalityquadrantgraph(Louisiana).
Table4. Wyoming:ArsenicandleadBTVestimation.
andselenium(1.4mg/kg)in2015andoutlinedaformal processforothermetalBTVdevelopmentsimilartothat usedinthisstudy(WDEQ,2015,2016).TheWDEQBTVs incorporatedthesame2013USGSdatasetsevaluatedfor thisstudywithselectedprojectdatafrompriorinvestigationsacrossWyomingandselectedtheUTLasitsBTV estimator.SimilartoOklahoma,thevalueofarepresentative BTVisimmediatelyapparentwhenconsideringthecurrent residential “cleanuplevel” forarsenicinsoilis0.29mg/kg (targetcancerriskof10 6,targethazardquotientof1) (WDEQ,2024).
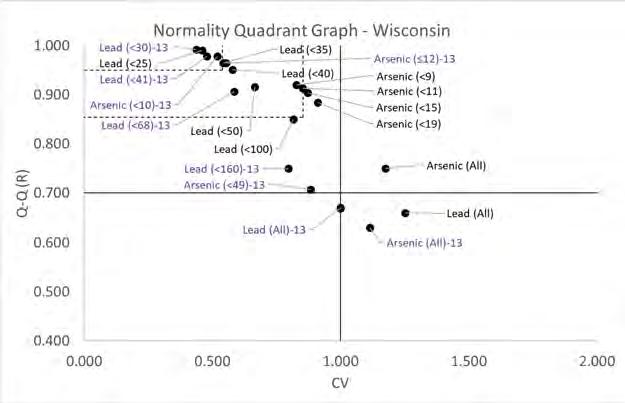
Wisconsin The2012Wisconsindatasetincluded664soilsamples. The2013Wisconsindatasetincluded264soilsamples. Theresultsofiterativecensoringandtheresultingstatistical performancearedetailedinTable5(Wisconsin:Arsenic andleadBTVestimation[2012]),Table6(Wisconsin: ArsenicandleadBTVestimation[2013]),andFigure6 (Normalityquadrantgraph[Wisconsin]).
AsnotedontheNQGforWisconsin’sdatasets(Figure6), noneoftheseinitialdatasetsmetnormalityperformance
Table5. Wisconsin:ArsenicandleadBTVestimation(2012data).
Censoring
None ,100 ,50 ,40 ,35 ,25None ,19 ,15 ,11 ,9 n664659648631622590664662661660657
Min1.3241.3241.3241.3241.3241.3240.50.50.50.50.5 Max319.595.1648.8939.8534.3124.6937.6218.0713.7910.498.295 x 15.2814.0713.1112.2611.9010.932.172.082.062.0382.002 M11.1811.1711.0910.8710.7810.521.471.461.461.4551.451 RPD30.9922.9816.6912.029.883.8238.5935.0334.0433.3831.91 r 19.1311.488.7187.0926.4515.0432.5531.8971.7931.7351.656 CV1.2520.8160.6650.5780.5420.4611.1750.9120.8720.8520.827 R0.6610.8500.9160.9510.9650.9900.7500.8840.9040.9130.920
BTVEstimators
95%UPL46.8232.9927.4823.9522.5319.256.38
Remarks: Allconcentrationsinmg/kg. Nonon-detectswerewithintheleaddataset.Atotalof210non-detectsamples(,1mg/kg)wereincludedathalfthedetectionlimit(0.5mg/kg). RPD ¼ Relativepercentdifferencebetweenthemean(x Þ andmedian(M). GreenhighlightedcellsrepresenttheselectedBTVforthedataset. RedhighlightedcellsfailedperformancegoalsrequiredforBTVestimation. BoldvaluesrepresentapotentialBTVestimator.
Figure5.Normalityquadrantgraph(Wyoming).
Censoring
Table6. Wisconsin:ArsenicandleadBTVestimation(2013data).
BTVEstimators
Remarks:
Allconcentrationsinmg/kg.
Nonon-detectswerewithintheleaddataset.Atotalofthreenon-detectsamples(,0.6mg/kg)wereincludedathalfthedetectionlimit(0.3mg/kg). RPD ¼ relativepercentdifferencebetweenthemean(x Þ andmedian(M). GreenhighlightedcellsrepresenttheselectedBTVforthedataset. RedhighlightedcellsfailedperformancegoalsrequiredforBTVestimation. BoldvaluesrepresentapotentialBTVestimator. ItalicizedvaluerepresentsapotentialBTVestimatorusingUSLthatfailedtheRPDrequirement.
criteriatoallowuseinBTVestimation.Thelargest(i.e., mostinclusive)BTVestimatorsforleadfromthe2012and 2013datasetswere36.11mg/kg(censoredat100mg/kg) and37.75mg/kg(censoredat41mg/kg),respectively. Althoughthe2012arsenicdatasetdoesnotmeetthe normalityperformancecriteriaestablishedforthismethod withanexcessof15percentofthedatabeingnon-detect (32percent),theevaluationprocesswascompletedfor instructionalvalue.Ifhonored,the2012datasetcould yieldanarsenicBTVof5.21mg/kg,demonstratingthe conservativenatureoftheapproachsetforthinthisstudy.
The2013datasetofferedaslightlylowerdetectionlimit forarsenicandyieldedadefensiblescreening-levelBTV of9.6mg/kgfromtheUPLwhencensoredat49mg/kg. Pleasenotethefailureofthe10percentRPDnormality performancegoalthatprecludesallowanceoftheUSL estimateof10.21mg/kg.
The2012study(Stensvold,2012)establishedaBTVfor arsenicof8mg/kgafterapplyingnon-parametricevaluation methodsandremoving10outliers.ThisBTVis acceptedby theWisconsinDepartmentofNaturalResources(WDNR, 2014)forscreeningreleases.The2012studyexhibited
Figure6.Normalityquadrantgraph(Wisconsin).2012datasetspresentedinblack.2013datasetspresentedinpurple.
Table7. SanAntonioandDallas–FortWorthareas:ArsenicandleadBTVestimation.
SanAntonioDallas–FortWorth
Censoring
n54544848474643 Min5.31.72.80.90.90.90.9 Max34.518.128.224.317.515.512.9 x 17.247.5417.107.927.577.356.88 M16.357.3518.557.307.207.006.60 RPD5.302.578.138.084.964.884.11 r 6.6213.5726.4524.6914.0653.8283.481 CV0.3840.4740.3770.5930.5370.5210.506 R0.9730.9710.9870.9690.9900.9890.984
BTVEstimators 95%UPL28.4213.5728.0415.8714.4613.8512.80
Remarks:
Allconcentrationsinmg/kg. Nonon-detectswerewithintheleadorarsenicdatasets. RPD ¼ relativepercentdifferencebetweenthemean(x Þ andmedian(M). GreenhighlightedcellsrepresenttheselectedBTVforthedataset. BoldvaluesrepresentapotentialBTVestimator.
slightlylowermean( x )valuesforlead(13.5mg/kg) andarsenic(2.3mg/kg)whencomparedwiththe2013 USGSdataset.
SimilartoinOklahomaandWyoming,theWDNRrelies ontheUSEPA’sRSLsbutsupplementswithpre-published BTVsforselectmetalssuchasaluminum(28,721mg/kg), arsenic(8mg/kg),barium(9,364mg/kg),cadmium(1 mg/kg),chromium(44mg/kg),copper(35mg/kg),and lead(52mg/kg)tominimizeTypeIerrors(falsepositives) (WDNR,2014).
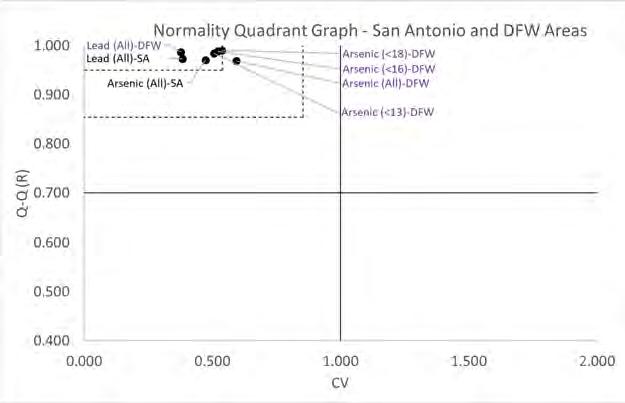
SanAntonioandDallas–FortWorthAreas
TheSanAntoniodatasetincluded54soilsamples collectedfrom17counties.TheDallas–FortWorthdata setincluded48soilsamplescollectedfrom13counties. Theresultsofanyiterativecensoringandtheresulting statisticalperformancearedetailedinTable7(SanAntonio andDallas–FortWorthareas:ArsenicandleadBTVestimation)andFigure7(Normalityquadrantgraph[SanAntonio andDFWareas]).
Figure7.Normalityquadrantgraph(SanAntonioandDFWareas)SanAntoniodatasetspresentedinblack.Dallas–FortWorthdatasetspresentedinpurple.
AsnotedontheNQGfortheSanAntonioandDallas–FortWorthdatasets(Figure7),allofthefulldatasetsare withinUTL(DFWarsenic)orUSL(DFWlead,SanAntonio leadandarsenic)estimatorregions.TheBTVestimatorfor leadandarsenicwithintheSanAntonioareaare37.01and 18.21mg/kg,respectively.TheBTVestimatorforlead andarsenicintheDallas–FortWorthareaare36.08and 19.49mg/kg,respectively.SufficientnormalityimprovementswereseenwithintheDallas–FortWorthareaarsenic datasetcensoringat ,18mg/kgtoallowuseoftheUSL. Notethatdiminishingnormalityperformanceisseeninthe DFWarsenicdatasetfromfurthercensoring(i.e.,decreasing R values).
Asoutlinedpreviously,releasedeterminationsinTexas currentlyutilizeasinglemedianvalueforscreeningpurposesdespitetherebeinghighvariabilityacrossthestate (TCEQ,2010;Tramm,Minter,andSeaton,2023).Asa result,earlyinvestigationscreeningincorrectlyrequires leadover15mg/kg(seeFigure1)orarsenicover5.9mg/ kgtotriggeradditionaleffortdespitebeingwellbelowthe conservativeBTVsestablishedfortheseregionalareasor, ashighlightedsubsequently,forthefullstateofTexas (e.g.,leadBTVof38.4mg/kg;arsenicBTVof16.79mg/ kg).Itisnotablethateventheactualmean(x )andmedian (M)valuesdemonstratedinthe2013USGSdataexceed theTCEQ’scurrentreleasedeterminationcriteria.
SummaryofConterminousStates CalibrationoftheBTVestimationmethodsetforthin thisarticleincludesarobustdataprocessingeffortusing datasetsacrosstheconterminousU.S.statedatasetsrangingfrom1,237soilsamplesforTexastojustsixsoilsamplesfromRhodeIslandandDelaware.Thehighestarsenic (1,100mg/kg)andlead(12,400mg/kg)wereidentifiedas obviousoutliersfromtheNevadadatasets.Thearsenic datasetforFloridaexhibitedtoomanynon-detectresults toallowconsiderationundertheBTVestimationapproach
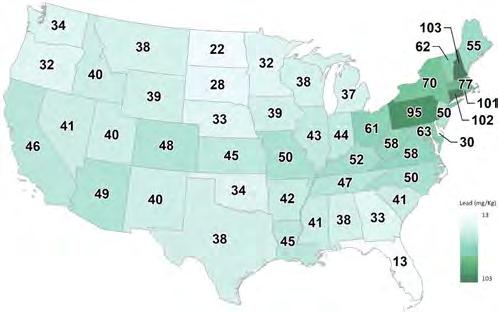
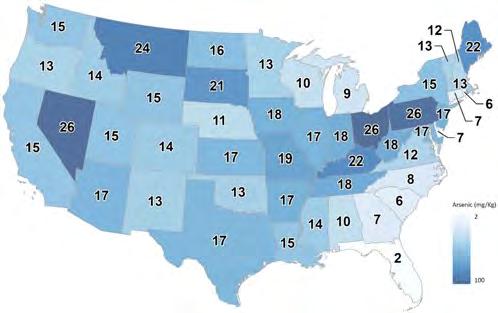
setforthinthisarticle;however,themean(1.96mg/kg) derivedfromthenormallydistributeddetectionsdatasetis selectedasaconservativesurrogateforscreeningpurposes asitisconsistentwiththecurrentregulatorycriteriaand extensiveresearchonarsenicoccurrenceinFlorida(Missimeretal.,2018).Additionally,toofewsampleswere availableforRhodeIslandandDelawaretoallowBTV estimationconsistentwiththisarticle.However,theclosest samplepointfromtheadjacentstatewasusedto increasethesamplesizeandallowBTVestimationfor thesestates.Theresultsofanyiterativecensoringand thecorrespondingstatisticalperformancearedetailedin theprovidedSupplementalMaterial.SupplementalMaterialassociatedwiththisarticlecanbefoundonlineat https://www.aegweb.org/e-eg-supplements.BTVsfor leadandarsenicrangedfrom13.06(Florida)mg/kgto 102.5mg/kg(NewHampshire)and1.96mg/kg(Florida) to26.33mg/kg(Ohio),respectively.Figures8and9 depicttheresultsofallBTVestimationeffortsacrossthe UnitedStates(roundedtothenearestwholenumber).
CONCLUSIONS Basedontheresultsofthisstudy,theproposedprocedurefordevelopingBTVestimatorswasdemonstratedto beanefficientwaytoquicklydevelopdefensibleBTVsfor screeningthroughtheuseofpubliclyavailableandwidely acceptedtoolsanddatasets.Theapproachwasintentionallyconservativetoincreasethelikelihoodofregulator acceptanceandensureonlyalimitedunderstandingofstatisticalmethodswasrequiredfortheenvironmentalpractitioner.ItisessentialthatanyBTVdevelopmentexercise incorporatebothvisual(e.g.,Q-Qplots,NQGs)and numerical(e.g., R,CV,RPDofthemean[x ]andmedian [M])elements.TheapproachtoBTVestimationoutlined inthisstudycanbeappliedtoanyinvestigationeffort inwhichsuf fi cientexistingand/ornewlyobtaineddata allowsanevaluation.Theapplicationofmorerigorous
Figure8.LeadBTVsfortheconterminousUnitedStates.
Figure9.ArsenicBTVsfortheconterminousUnitedStates.
andproject-specificstatisticalmethodsshouldbeconsidered whenwarranted.
ACKNOWLEDGMENTS TheauthorsthankModernGeosciencesforallowing staffhoursandresourcesneededtocompletethispaper. Additionally,thereviewandinputfromHarrisonP. Tramm,LaurenGayre,ZacharyTondre,MeganWingard, RustyL.Simpson,andTruthHippmanwerehelpfulin completingthisarticle.
SUPPLEMENTALMATERIAL SupplementalMaterialassociatedwiththisarticlecanbe foundonlineat https://doi.org/10.2113/EEG-D-24-00009, https://www.aegweb.org/e-eg-supplements
REFERENCES ANDERSON,A. AND YACUCCI,M.,2021, InventoryandstatisticalcharacterizationofinorganicsoilconstituentsinIllinois(ICTProjectR27183-HS):IllinoisCenterforTransportation,UniversityofIllinoisat Urbana-Champaign, https://doi.org/10.36501/0197-9191/21-006
BOERNGEN,J.G. AND SHACKLETTE,H.T.,1981, Chemicalanalysesof soilsandothersurficialmaterialsoftheconterminousUnited States:UnitedStatesGeologicalSurveyOpenFileReport81-197. https://doi.org/10.3133/ofr81197
BROOKS,B.,2021, Soilbackgroundthresholdvalueevaluation:MinnesotaPollutionControlAgencyDocumentNo.C-R1-08. www. pca.state.mn.us/sites/default/files/c-r1-08.pdf
DANIEL,D.,2015,AcasestudyperspectiveonworkingwithProUCL andastateenvironmentalagencyindeterminingbackgroundthresholdvalues: InternationalJournalEnvironmentalResearchPublic Health,Vol.12,No.10,pp.12905–12923, https://doi.org/10.3390/ ijerph121012905
DÍEZ,M.;SIMÓN,M.;MARTÍN,F.;DORRONSORO,C.;GARCÍA,I.; AND VAN GESTEL,C.,2009,Ambienttraceelementbackgroundconcentrationsinsoilsandtheiruseinriskassessment: ScienceTotalEnvironment,No.407, https://doi.org/10.1016/j.scitotenv.2009.05.012 GUSTAVSSON,N.;BOLVIKEN,B.;SMITH,D.; AND SEVERSON,R.,2001, GeochemicallandscapesoftheconterminousUnitedStates New mappresentationsfor22elements:UnitedStatesGeologicalSurveyProfessionalPaper1648, https://doi.org/10.3133/pp1648
HAWAII DEPARTMENTOF HEALTH,2007, Useoflaboratorybatchteststo evaluatepotentialleachingofcontaminantsfromsoils, https://epd. georgia.gov/document/publication/swmuriskpdf/download HYDROMETRICS,2013, Projectreportbackgroundconcentrationsof inorganicconstituentsinMontanasurfacesoils,preparedforMontana DepartmentofEnvironmentalQuality, https://deq.mt.gov/Files/Land/ StateSuperFund/Documents/InorganicBackground/BkgdInorganics Report.pdf
INTERSTATE TECHNOLOGYREGULATORYCOUNCIL,2022, Soilbackgroundand riskassessment, https://sbr-1.itrcweb.org/wp-content/uploads/2022/ 02/SBR-Guidance-Document-Final-1-28-2022-Web-1.pdf
LOUISIANA DEPARTMENTOF ENVIRONMENTAL QUALITY,2003, RiskEvaluation/ CorrectiveActionProgram(RECAP), https://www.deq.louisiana.gov/ assets/docs/Land/RECAP/RECAPfinal.pdf
LOUISIANA DEPARTMENTOF ENVIRONMENTAL QUALITY,2021, 2021RECAP TrainingSeries, https://www.deq.louisiana.gov/assets/docs/Brownfields/ 2021-RECAP-Training-Series/RECAP101-7-9-2021-PowerPointSlides.pdf
MISSIMER,T.;TEAF,C.;BEESON,W.;MALIVA,R.;WOOLSCHLAGER,J.; andCOVERT,J.,2018,Naturalbackgroundandanthropogenicarsenic enrichmentinFloridasoils,surfacewater,andgroundwater:Areview withadiscussiononpublichealthrisk, InternationalJournal EnvironmentalResearchPublicHealth ,Vol.15,No.10,p. 2278, https://doi.org/10.3390/ijerph15102278
NAVAL FACILITIES ENGINEERING COMMAND,2002, GuidanceforEnvironmental BackgroundAnalysis:VolumeI – Soil:UserGuideNFESCUG-2049ENV:BattelleMemorialInstitute.
NEW JERSEY DEPARTMENTOF ENVIRONMENTAL PROTECTION,2008, Guidancefortheevaluationofimmobilechemicalsfortheimpact togroundwaterpathway, https://www.nj.gov/dep/srp/guidance/rs/ immobile_chemicals.pdf
NEW JERSEY DEPARTMENTOF ENVIRONMENTAL PROTECTION,2021, Alternative remediationstandardstechnicalguidanceforsoilandsoilleachatefor themigrationtogroundwaterexposurepathway, https://www.nj.gov/ dep/srp/guidance/srra/ars_migration_to_gw_guidance.pdf
OKLAHOMA DEPARTMENTOF ENVIRONMENTAL QUALITY,2023, Risk-based decisionmakingforsitecleanup, https://www.deq.ok.gov/wpcontent/uploads/2021/02/RiskBasedSiteCleanup.pdf
RICHARDS,J.R.;SCHRODER,J.L.;ZHANG,H.;BASTA,N.T.;WANG,Y.; AND PAYTON,M.E.,2012,Traceelementsinbenchmarksoilsof Oklahoma: SoilScienceSocietyAmericaJournal, https://doi.org/ 10.2136/sssaj2012.0100
SHACKLETTE,H.T. AND BOERNGEN,J.G.,1984, Elementconcentrations insoilsandothersurficialmaterialsoftheconterminous:United StatesGeologicalSurveyProfessionalPaperNo.1270, https://pubs. usgs.gov/pp/1270/
SINGH,A.;SINGH,A.K.; AND FLATMAN,G.,1994,Estimationofbackgroundlevelsofcontaminants: MathematicalGeology,Vol.26, pp.361–388, https://doi.org/10.1007/BF02089229
SINGH,A. AND NOCERINO,J.,1997,Robustintervalsforsomeenvironmental applications: ChemometricsIntelligentLaboratorySystems,Vol.37, pp.55–69. https://doi.org/10.1016/S0169-7439(97)00008-7
SMITH,D.B.;CANNON,W.F.;WOODRUFF,L.G.;SOLANO,F.;KILBURN, J.E.; AND FEY,D.L.,2013, Geochemicalandmineralogicaldata forsoilsoftheconterminousUnitedStates:USGSDataSeriesNo. 801, https://pubs.usgs.gov/ds/801/
STENSVOLD,K.A.,2012, DistributionandvariationofarsenicinWisconsinsurfacesoils,withdataonothertraceelements:USGSScientificInvestigationsReport2011–5202,41p.,1app., https://pubs. usgs.gov/sir/2011/5202/
TEXAS COMMISSIONON ENVIRONMENTAL QUALITY,1999, TRRPPreamble, RuleLogNo.96106-350-WS, www.tceq.texas.gov/assets/public/ legal/rules/rules/pdflib/preamble.pdf
TEXAS COMMISSIONON ENVIRONMENTAL QUALITY,2010, Determining whichreleasesaresubjecttoTRRP, https://www.tceq.texas.gov/ downloads/remediation/trrp/forms/releasestrrprev.pdf
TRAMM,K.S.;MINTER,J.T.; AND SEATON,C.A.,2023,Importanceof backgroundthresholdvaluedevelopmentwithinrisk-basedcorrective actionprograms: VadoseZoneJournal,Vol.23,e20294, https://doi .org/10.1002/vzj2.20294
TRAMM,K.S.,2024,Metals:Importanceofbackgroundthresholdvalues inriskassessment,In SouthTexasAssociationofEnvironmentalProfessionalsQuarterlyMeeting,ModernGeosciences.Unpublished.65 pages.
UNITED STATES ENVIRONMENTAL PROTECTION AGENCY,1992a, Groundwater issue:Behaviorofmetalsinsoils, EPA-540-S92-018, https://www.epa. gov/sites/default/files/2015-06/documents/issue_behavior_metals_soil. pdf
UNITED STATES ENVIRONMENTAL PROTECTION AGENCY,1992b,Preparation ofsoilsamplingprotocols:Samplingtechniquesandstrategies,EPA 600-R-92-128.
UNITED STATES ENVIRONMENTAL PROTECTION AGENCY,1992c,Statistical methodsforevaluatingtheattainmentofcleanupstandards,Vol.3:
Reference-basedstandardsforsoilsandsolidmedia,EPA230-R94-004.
UNITED STATES ENVIRONMENTAL PROTECTION AGENCY,1995a, Determination ofbackgroundconcentrationsofinorganicsinsoilsandsedimentsas hazardouswastesites:EngineeringForumIssue,EPA540-S-96-500, https://www.epa.gov/sites/default/files/2015-06/documents/determine_ background_concentrations.pdf
UNITED STATES ENVIRONMENTAL PROTECTION AGENCY,1995b, Establishing backgroundlevels :QuickReferenceFactSheet,EPAOSWER 9285.7-19FS,EPA540-F-94-030, https://semspub.epa.gov/work/HQ/ 174005.pdf
UNITED STATES ENVIRONMENTAL PROTECTION AGENCY,1996a, Soilscreening guidance:TechnicalBackgroundDocument,EPAPublication540R95-128.
UNITED STATES ENVIRONMENTAL PROTECTION AGENCY,1996b, Soilscreening guidance:User’sguide:EPAPublication9355.4-23.
UNITED STATES ENVIRONMENTAL PROTECTION AGENCY,1999,understanding variationinpartitioncoef ficient,kd,values,vol.i:thekdmodel, methodsofmeasurement,andapplicationofchemicalreaction codes,EPA402-R-99-004A, https://www.epa.gov/sites/default/ files/2015-05/documents/402-r-99-004a.pdf
UNITED STATES ENVIRONMENTAL PROTECTION AGENCY,2000, Guidance fordataqualityassessment Practicalmethodsfordataanalysis: EPAQA/G-9,EPA600-R-96-084, https://www.epa.gov/sites/default/ files/2015-06/documents/g9-final.pdf
UNITED STATES ENVIRONMENTAL PROTECTION AGENCY,2002a, Guidancefor choosingasamplingdesignforenvironmentaldatacollection:EPA/ 240/R-02/005, https://www.epa.gov/sites/default/ fi les/2015-06/ documents/g5s- fi nal.pdf
UNITED STATES ENVIRONMENTAL PROTECTION AGENCY,2002b, Guidance forcomparingbackgroundandchemicalconcentrationsinsoilfor CERCLAsites :EPA540-R-01-003, https://www.epa.gov/sites/ default/ fi les/2015-11/documents/background.pdf
UNITED STATES ENVIRONMENTAL PROTECTION AGENCY,2006, Dataquality assessment Statisticalmethodsforpractitioners:EPAQA/G-9S, EPA240-B-06-003, https://www.epa.gov/sites/default/files/2015-08/ documents/g9s-final.pdf
UNITED STATES ENVIRONMENTAL PROTECTION AGENCY,2022a, ProUCL5.20 TechnicalGuide, https://www.epa.gov/land-research/proucl-software
UNITED STATES ENVIRONMENTAL PROTECTION AGENCY,2022b, ProUCL5.20 UserGuide, https://www.epa.gov/land-research/proucl-software
U NITED S TATES E NVIRONMENTAL P ROTECTION A GENCY,2023, Leadat superfundsites:UnitedStatesGeologicalSurvey(USGS)
backgroundsoil-leadsurvey, https://www.epa.gov/superfund/ usgs-background-soil-lead-survey-state-data
UNITED STATES ENVIRONMENTAL PROTECTION AGENCY,2024a, Regional screeninglevels(RSLs) Generictables(updatedNovember2023), https://www.epa.gov/risk/regional-screening-levels-rsls-generic-tables
UNITED STATES ENVIRONMENTAL PROTECTION AGENCY,2024b, Updated soilleadguidanceforCERCLAsitesandRCRAcorrectiveaction facilities, https://www.epa.gov/system/files/documents/2024-01/ explainer_olem-lead-guidance_formatted.pdf
UNITED STATES GEOLOGICAL SURVEY,1985,Studyandinterpretationof chemicalcharacteristicsofnaturalwater:USGSWaterSupply Paper2254.Reston,VA, https://doi.org/10.3133/wsp2254
UNITED STATES GEOLOGICAL SURVEY,2004,TheNationalGeochemical Survey databaseanddocumentation:USGSOpen-FileReport 2004-1001,Reston,VA, https://doi.org/10.3133/ofr20041001
V OSNAKIS ,K. AND P ERRY,E.,2009,Backgroundversusrisk-based screeninglevels Anexaminationofarsenicbackgroundsoil concentrationsinsevenstates, InternationalJournalSoil,Sediment andWater,Vol.2,No.2,Article2, http://scholarworks.umass.edu/ intljssw/vol2/iss2/2
WALKINSHAW,M.;O’GEEN,A.T.; AND BEAUDETTE,D.E.,2022, Soil properties:CaliforniaSoilResourceLab,UniversityofCalifornia, Davis, https://casoilresource.lawr.ucdavis.edu/soilweb-apps/
WILDING,L.P.,1985,SpatialVariability:Itsdocumentation,accommodation,andimplicationtosoilsurveys.InNIELSEN,D.R., AND J.BOUMA,eds. soilspatialvariability.PUDOC. Wageningen,the Netherlands.pp.166–193.
WISCONSIN DEPARTMENTOF NATURAL RESOURCES,2014, Soilresidual contaminantleveldeterminationsusingtheUSEPAregional screeninglevelwebcalculator:Pub-RR-80, https://widnr.widen. net/s/bkjzdvhxm9/rr890
WYOMING DEPARTMENTOF ENVIRONMENTAL QUALITY,2015, Voluntary RemediationProgramFactSheet#12B :TechnicalSupport MemorandumNo.2, https://deq.wyoming.gov/shwd/voluntaryremediation-program/fact-sheets/
WYOMING DEPARTMENTOF ENVIRONMENTAL QUALITY,2016, Voluntary RemediationProgramFactSheet#24EstablishingSite-Specific BackgroundMetalsConcentrationsinSoil, https://deq.wyoming. gov/shwd/voluntary-remediation-program/fact-sheets/
W YOMING DEPARTMENTOF ENVIRONMENTAL QUALITY,2024, Voluntary RemediationProgramFactSheet#12ECleanupLevelsLook-up Tables, https://deq.wyoming.gov/shwd/voluntary-remediation-program/ fact-sheets/
PotentialforEventsSimilartotheDeadlyWest SaltCreekLandslide,GrandMesaArea,Colorado OMIDARABNIA GeoengineersInc.,1101FawcettAvenue,Suite200,Tacoma,WA98402
PAULSANTI* BENNETTEMMONS EMILYSPARKS
DepartmentofGeologyandGeologicalEngineering,ColoradoSchoolofMines, 1500IllinoisStreet,Golden,CO80401
KeyTerms: Landslide,Mobility,DebrisAvalanche, GrandMesa
ABSTRACT ThedeadlyWestSaltCreekLandslideof2014, oneofthelargestlandslidestooccurintheUnited Statesinhistoricaltime,wassurprisinginitssuddennessandlengthofrunout.Itssourcearea,the edgeofGrandMesainwesternColorado,was potentiallythesourceofothersimilarlandslides inthepast,basedonpreviousmappinginthe region.Thepurposeofthisresearchwastoevaluatethepotentialforsimilareventsbydetailed mappingofseveralcanyons fl ankingWestSalt Creek,usingaerialimageryandage-datingtechniquesnotavailabletopreviousmappers.Weconcludethat,whiletheWestSaltCreekLandslide hasthepotentialtoreactivateinasimilarmanner tothe2014movement,thepotentialforasimilar eventinthe fl ankingcanyonsislow.Mappingand semi-quantitativegeomorphicmethodssuggest thatthedepositspresentinseveralcanyonson eithersideofWestSaltCreekareglacialor streamdeposits,withonecanyoncontaining debris- fl owdeposits.Ourinterpretationsare basedonthemorphologyofdepositsinthecanyons,thepresenceofspeci fi clandformfeatures, measurementsofmobilityindexandlongitudinal pro fi les,andcomparisonwithregionalanalogs. Furthermore,othermassmovementsintheregion thatareofsimilarmagnitudehadeitherslower movementormuchshorterrunout.Thelarge blockattheheadofWestSaltCreekandtheearlierblockthatshatteredandmobilizedin2014 arealsouniquefeatureslocally,distinguishing
*Correspondingauthoremail:
thissettingfromothers,butalsoindicatingthe potentialforafuturesimilarevent.
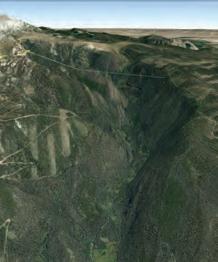
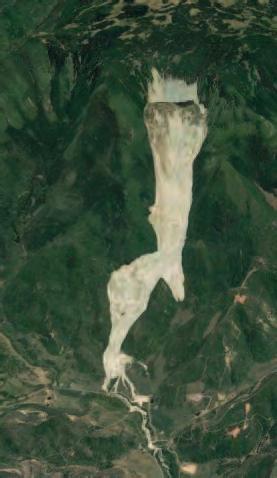
INTRODUCTION InMay2014,theWestSaltCreekLandslide(WSCL) occurredalongthenorthernedgeoftheGrandMesain westernColorado,killing3people,depositing29 3 106 m 3 ofmaterialcovering2.6km2,andnearlyshearingthecaps offseveralgaswells(Whiteetal.,2015)(Figure1).Itis oneofthelargestlandslidestooccurintheUnitedStatesin recordedhistory.TheWSCLeventwasinducedbyrainon-snowconditionsthatinitiatedatitsheadscarpatthe edgeofthebasalt flowscappingGrandMesa,alongan areaknownasthe “landslidebench” (BaumandOdum, 1996)(Figure1).Ittravelednearly4.7km(Whiteetal., 2015)withamobilityindex(heightdroptolengthofrunoutratio,or H/ L)of0.15(Coeetal.,2016),whichisindicativeofahighlymobilemassfailure.Incomparison,the Oso,WA,debris-flowavalanche,whichkilled43people, hadonlyaslightlylongerrunoutmobilityindexof0.11 (Iversonetal.,2015).TheWSCLoccurredinmultiple surgesoveraveryshortduration(minutes)asevidenced byseismicdataandgeologic fieldmapping(Whiteetal., 2015;Coeetal.,2016).However,anintactblockofGreen RiverFormationthatwaspresentatthetopofthevalley beforethefailureback-rotatedtoformagrabendepression, which filledtoformapondthatlaterruptured.
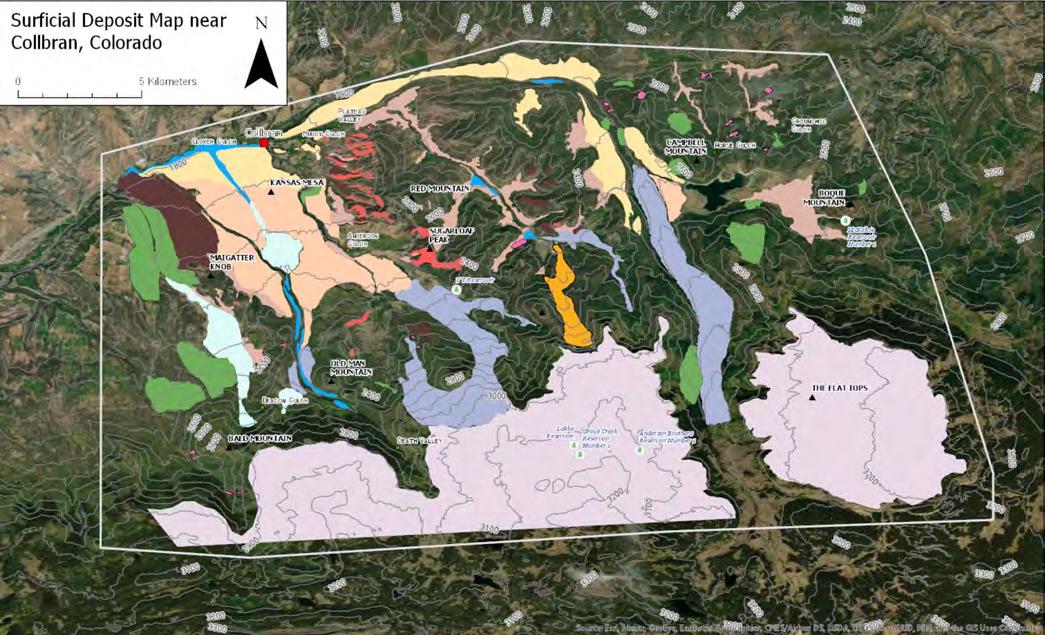
Whilelandslidesanddebris fl owsarecommonin theareaandcoverasmuchas39percentofthesurroundingregion(Figure2)(Soule,1988),thescaleand mobilityoftheWSCLwereunprecedentedinmodern timesforthisregion.GrandMesa,abasalt-capped platformapproximately1,500mabovethemajor regionalriversandadjacentvalleys(Yeend,1969),has experiencedotherlandslidesalongitsmargin(Baum andOdum,1996).AlandslidewasmappedbySoule (1988)intheGreenRiverFormation(Coeetal.,2016)
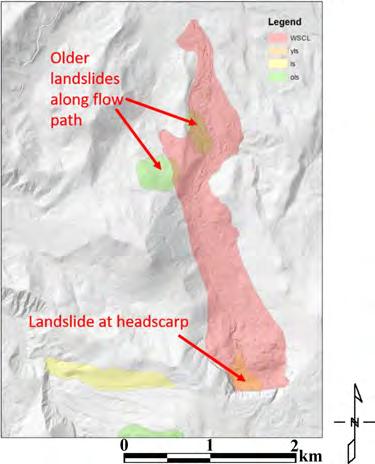
attheheadscarppriortotheWSCLfailure(Figure3). Additionally,twomorelandslidesweremappedalong its fl owpath(Figure3).Giventheuniquehazardcreatedbythislandslide,apressingquestionis:Canwe usegeologicalandgeomorphologicalmapping,along withage-datingandsensitivityanalysis,todetermine
Figure1.(A)ThelocationofthestudyareawithrespecttothestateofColorado.(B)Atopographicmapwithcontourintervalof200ft(61m) showingthelocationsoftheLeon,Park,andWestSaltCreekLandslide(WSCL)depositsandtheEastSaltCreekdrainage(ESCD).Movement (downhill)directionistothenorth.TheboundariesoftheParkandLeondepositsarethesamemappedboundariesthatSoule(1988)usedfor debris-flowdeposits.Theloweredgeofthelandslidebenchisdrawnat9,000ft(2,743m)abovesealevel,whichapproximatelycorrespondsto theboundarybetweentheWasatchFormationandtheGreenRiverFormation.
whetheranotherWSCL-typeeventislikelyinthe future?Speci fi cally,theEastSaltCreek(ESC)drainage,locatedadjacenttoWestSaltCreek(WSC),and thenearbyParkandLeondrainagedepositshavesimilarmorphology,topography,andgeology(Soule, 1988)andarecandidatesforsimilarcatastrophicand
BedrocktoSlopewash
Figure2.TypesofdepositsintheregionsurroundingtheWestSaltCreekLandslide(WSCL),asmappedbySoule(1988).Thepercentagesrefer tothearealcoverageofeachtypeofdeposit.
Leon Deposit Park Deposit Sheep Flats
Figure3.WestSaltCreekLandslideisshownhere,alongwiththree landslidesinits flowpathandtwointheimmediateregion. “ls,” “yls,” and “ols” aremodernlandslides,younglandslides,andold landslides,respectively,asdefinedbySoule(1988).
dangerousslopemovements(Figures1and2).Other valleysnearbywerealsoinvestigatedtounderstand thetypesandextentofgeologicalprocessesinthearea (Figure4).
BecausemanyagentshaveshapedGrandMesasince thedepositionofthebasaltbetween9.45and10.99Ma (Marvinetal.,1966;Coleetal.,2011),includingvolcanic, tectonic,colluvial, fluvial,glacial,glaciofluvial,lacustrine, andanthropogenicprocesses,itisdif fi culttoidentify thedepositionalmechanismformanydepositsinorder toassesstheirpresent-dayhazards.Forexample,Soule (1988)mappedmanyoftheelongate,broad,mounded depositsintheareaas “ olddebris fl ows,” includingthe depositsofParkandLeonCreeks.Soule(1988,p.1) describedthesedepositsasoriginatingfromthetopof GrandMesafromsedimentpackagescreatedbythe meltingice.Incontrast,otherauthorsmapthedeposits astillorbedrock(Yeend,1969;ColeandSexton, 1981).
Inadditiontotheprocessofdeposition,theextent andvolumeofthedeposits,oroftheseparateevents comprisingthedeposits,areunknown.Lobatefeatures canbeseenonboththeParkandLeondeposits,which canbeinterpretedeitherasasingledepositionalevent thatcoveredtheentirevalley(withmultipleevents overashorttimeperiod,likeWSCL)orasanaccumulationofepisodicdepositionaleventsoveralongtime period,whereeachepisodedepositedaseparatelobe. Thesimilarityoftheseandotherlocalcanyondeposits toWSCLwasassessedthroughmappingofsurfi cial
depositsoftheregionusingtoolsunavailabletopreviousmappers,suchasGoogleEarthandlightdetection andranging(LiDAR)views,datingofvariouslobesin theParkandLeondeposits,andreviewofanalogsettingswithsimilardepositsthathavebeenmappedby others.
GEOMORPHOLOGICALANDGEOLOGICAL SETTING Geomorphology TheGrandMesaregionhasbeenshapedbyvolcanic, tectonic,colluvial, fluvial,glacial,glaciofluvial,lacustrine,andanthropogenicprocessessincethemiddleof theMiocene.EarlyresearchandmappingoftheGrand Mesafocusedonglacialdeposits(Henderson,1923; Retzer,1954;andYeend,1969).Researchthenfocused onsurficialdeposits,includinglandslidesanddebris flows(Soule,1988),slump-blockdeposits(Baumand Odum,1996),bedrockgeology(Donnelletal.,1985; Hail,1972a,1972b),andQuaternarydeposits(Coleand Sexton,1981).Thesemapsgenerallyshowthatsincethe depositionofthebasalt, fluvialactionandtheupliftof theColoradoPlateauhaveinvertedthetopography, resultinginanelevatedbasaltplatform flankedbylandslidesandpedimentdeposits.Thesepedimentswere depositedafterabout900–1,200mofdowncuttinginthe Pliocene(Yeend,1969).Thelandslidebenchsurroundingthemesaformedafterextensiveslumpingofthe basaltcapbecauseofundercuttingoftheweakerunderlyingsedimentaryrock.Today,thelandslidebenchhas manylakesandhuman-madedamsandreservoirsinthe ridgeandvalleytopographycreatedbythelargeslump blocks.
Afterthetopographicinversionandtheformationof thelandslidebench,theGrandMesaregionwas reshapedagainbyaglacialicecapover100minthickness(Yeend,1969).Mostofthesurfaceglacialsediment coveringtheregionisofPinedaleage(marineisotope stage2)(Yeend,1969).Onthebasisofabsolutedating methods,theinitialPinedaleadvanceinitiatedinthe RockyMountainsaround30.2 6 1.2kaB.P.,reachedits maximumextentaround22.4 6 1.1kaB.P.,anddisappearedfromtheFrontRangesometimebefore11.8ka B.P.(Nelsonetal.,1979;LeggandBaker,1980; Madole,1986;andBensonetal.,2004).Thedeposits leftbytheicearetypicallylessthan3mthickinmuch ofthehighlandareasand3–30mthickinmoraines depositedbetweenTorevablocksonGrandMesa(Baum andOdum,1996).Theicewasmostlikelythickeron thenorthsideoftheGrandMesa,wherethisstudytook place.
Thegradientsoffthemesaallowedtheicetoform largeicetonguesinthemajorvalleys,especiallyinthe
deepandnarrowonessuchastheLeonandParkCreek drainage.Typically,thesemajorvalleystransitionfrom tillathighelevationstooutwashatlowelevations.Terminalmorainesarerarelypresent(Yeend,1969).Yeend (1969)providedanestimateof1,650mastheelevation forthelowestextentofice,whereasColeandSexton (1981)gaveamoreconservativeestimateof2,000m abovesealevel(asl).
Geology TheGrandMesacaprockiscomposedofmanylayers ofbasalt flowswithavarietyofages,thicknesses,and erodibility.ErosionofaweakpackageofPaleocene throughEocenesedimentaryrockshasunderminedthe basalt(ColeandSexton,1981).Inthevicinityof WSCL,onlyasmallportionofthebasaltremainsintact today,becausemosthasfailedtoformwhatislocally referredtoasthe “landslidebench,” theedgeofwhich liesatapproximately »2,700masl(Figure1).
Thealkalibasalt flowsthatcaptheGrandMesaare partofstage3volcanism(11–9Ma)associatedwiththe upliftoftheColoradoPlateauandSouthernRocky Mountains,aswellasthegenesisoftheRioGrandeRift (Coleetal.,2017).Asmanyas20individual flows makeupthe240msectionofbasalt(ColeandSexton, 1981).Variouslayersofthebasaltarethinandravelto
talus,whileothersaremassiveandformcliffs(Baum andOdum,1996).Interbeddedwiththebasalt flows, thereareintercalatedtuff,bakedsoilhorizons,andvolcanicconglomerates(Marvinetal.,1966;ColeandSexton,1981).
Beneaththebasalt,thereisaPaleocenethrough UpperEocenepackageofsedimentaryrocksthatdip gentlytothenorthwestinthemappingarea(Baumand Odum,1996).TheyoungestoftheseistheGood EnoughFormation,followedinincreasingagebythe Uinta,GreenRiver,Wasatch,OhioCreek,andMesaverdeFormations.Theseformationsaremainlycomprisedofsandstones,siltstones,marlstones,shales,and conglomeratesandmakeupthevalleydepositsinthe area.
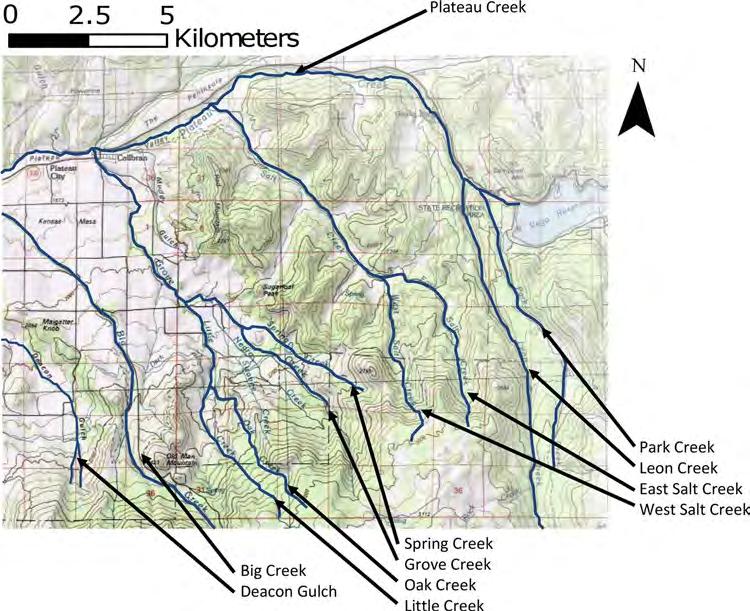
PRIORWORK Previousmappingstudieshaveinterpretedthedepositionalmechanismsforvalleydepositsinthevicinityof WSC(seeFigure4forlocationsofvalleysdiscussed below).TheESCdrainageandthedrainagecontaining theWSCLaresimilar.Bothhavethesamebedrock sequence,similardrainageareas,andsimilargradients. However,theESCdrainagehasnopreviouslymapped failureorintactblockofGreenRiverFormationpresent.
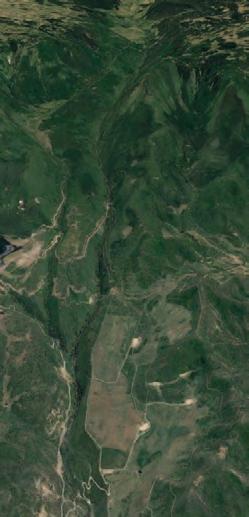
Figure4.Extentofmappedareaforthisstudyshowingvalleyswithmounded,linearsurficialdeposits.
Inaddition,Yeend(1969)mappedextensivePinedale glaciation(marineisotopestage2)depositsinEastSalt CreekbutnotinWestSaltCreek.
TheLeondepositwasmappedbySoule(1988)asa debris flowthatcovers4.1km2 inareaandhasalength of6.6km.IncontrasttoSoule’s(1988)interpretation, Yeend(1969)andColeandSexton(1981)mappedthe LeondepositasaGreenRiverFormationbedrock deposit.
TheParkdepositwasmappedbySoule(1988)asa debris flowthatcovers5.4km2 inareaandhasalength of8.4km.Incontrast,ColeandSexton(1981)interpretedtheParkdepositasglacialneartheheadandoutwashatthetoe.Yeend(1969)mappedtheParkdeposit asPinedaleglaciation–agelowermembertill,although heacknowledgedthattheboundarybetweentillandoutwashwasdifficulttoassessforthisregion.Yeend (1969)alsodescribedthevalleycontainingthePark depositasthelocationofthelongestglaciallobeinthe area,asitiscontinuoustothetopofthemesa,whereit islikelycomposedofdepositsofglacialsediment (groundmoraine).AccordingtoYeend(1969),theglaciallobelikelydammedPlateauandBuzzardCreeks andproducedalakeatthesiteofthemodernVegaReservoir.Fromhere,theglaciallobewaspredictedtohave joinedthethinicesheetoriginatingfromtheBigCreek drainagetothewest.AftercontinuingdowntoPlateau Creek,itjoinedaglaciallobeoriginatinginCottonwood CreekandstoppedshortoftheMesaCreekdrainage (Yeend,1969).
TheSpring/GroveCreekareawasmappedbySoule (1988)asdebris flowbutbyDonnelletal.(1985)astill. TheOak/LittleCreekareawasmappedbySoule(1988) asseverallandforms,includingdebris flow,oldlandslide,andcolluvium-slopewash.Donnelletal.(1985) mappedthatareaastillandWasatchFormationbedrock. TheBigCreekareawasmappedbySoule(1988)as debris flowandstreamalluviumterracedeposits,andit wasmappedbyDonnelletal.(1985)asyoungeralluviumterracegravels.Finally,theDeaconGulchdeposit wasmappedbySoule(1988)asdebris flowandbyDonnelletal.(1985)astill.
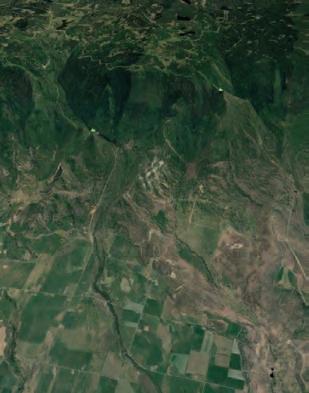
METHODS FieldandDesktopMapping Asurficialgeomorphicmapwasdevelopedtoidentify theprocessesthatshapedthelandscapeandthegenesis ofthevalley-centereddeposits.Themappedregioncoversanareaofapproximately300km2 (Figure4).The WSCLislocatedinthecenteroftheregion,withseveral valleystotheeastandwestthatmayormaynothave similargenesistoWSCL.TheregionincludestheglaciatedGrandMesacaptothesouthandthedominant
PlateauandBuzzardCreekdrainagestothenorth.Mappingprogressediteratively,alternatingbetweendesktop mappingusingGoogleEarthforvisualmapping,and LiDARandtopographicdataforfurtherlandformidentification,and fieldmappingtoverifydesktopworkand toincludeadditionalobservations.Notallmappingareas wereaccessiblebecauseofprivateproperty,butthelocal roadnetwork,BureauofLandManagementland,and NationalForestlandallowedsufficientcoveragetovalidatemostofthedesktop-mappedareas.
Anticipatingthatitwouldbeimportanttodistinguish betweenglacialanddebris-floworlandslide-typedeposits, fieldmappingincludedanassessmentoffeatures indicativeofglacialorigin(striations,eskers,kettles, outwash,moraines,anddrumlins)anddebris-flowdeposition(levees,coarsesnouts,andfans).
Oncemappingwascompleted,andthegenesisofthe valley-centereddepositswashypothesized,wecompletedaliteratureandmapreviewtoidentifyanalog locationstoconfirmtheviabilityoftheseinterpretations. Analogswereexpectedtobewithin100kmofthemappingareatoensuresimilarclimatichistory,inareasthat wereexpectedtobesubjecttothesamegeologicprocesses,mappedbyothersasthesametypeoffeature, similarvisually,andmappedbyusasthesametypeof featureusingourdepositdescriptions.
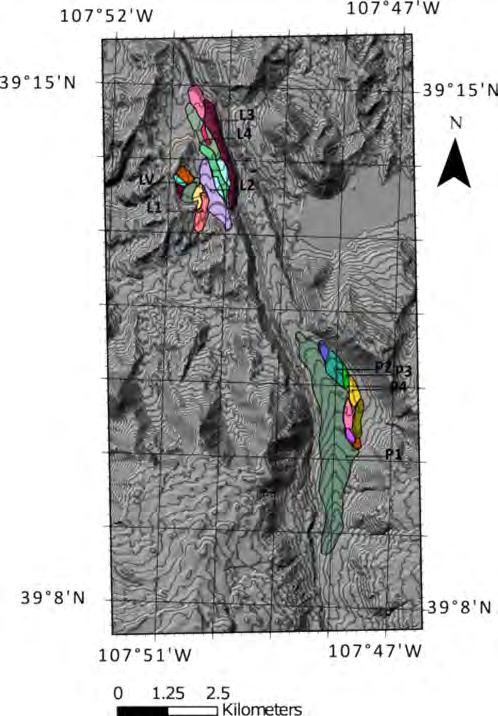
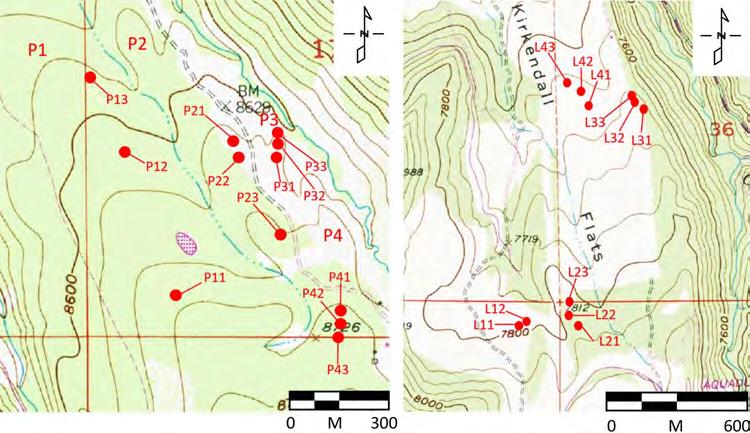
Specialconsiderationwasgivenduringmappingto thelobatefeaturesintheParkandLeondeposits becausetheselobesmayindicatewhetherthedeposits representasingleeventormultipleeventsoveralonger timeperiod.Adesktopmapwasmadeusing2014 LiDARdataprovidedbytheColoradoGeologicalSurvey.TheouterboundariesoftheParkandLeondeposits were firstassumedtomatchthosemappedbySoule (1988).Lobeswereoutlinedwiththeboundariesatthe topographiclowpointswhereconvexandconcavesurfacesintersected.Ifalobecouldbeidentifiedusingthis criterion,evenifitwasnotaprominentlobe,itwas drawnasaseparatelobe.Usingthiscriterion,agully thatformedafterdepositioncouldcauseadepositthat wasasinglelobeupondepositiontobemappedasmore thanonelobe.Thetoeofeachlobewastakenasalocationwithaslopebreak.Vegetativedifferenceswerenot usedinmappingbecausetheywerefoundtobeunreliableindistinguishinglobes.Forexample,onthePark deposit,thecrestofoneofthelobeswasanaspenforest flankedbymeadows,resultingintwotypesofvegetationononelobe.
Lobeswerealsodistinguishedbylongitudinalprofile mapping,wheretheelevationofeachlobewasplotted relativetotheadjacentcreek.Withinglaciofluvialsystems,depositshigherinthelandscapetendtobeolder, assuccessiveepisodesofglaciationandrunoffcut downwardanddeposityoungermaterialsclosertothe
moderndrainageelevation.UsingGoogleEarth,theelevationofeachlobewasmeasuredalongitscenterline, withmeasurementsapproximatelyevery50malongthe lengthofthelobe.Theseelevationpoints,alongthe “spine” ofthelobe,werethenplottedonagraphthat alsoincludedthethalwegofeachmoderncreek(Park CreekfortheParklobes,LeonCreekfortheLeonlobes, andPlateauCreekatthedownstreamendwherethey jointogether).Normally,alongitudinalprofileshouldbe measuredusingtheelevationofthebaseofthedeposit ateachlocationbecauseerosionofthetopsurfacecould affecttheaccuracyofthecomparison.However,the basesofthesedepositswerenotvisible,soitwas assumedthatthedepositswereallofcomparablethickness,thatanypost-depositionalerosionwasconsistent acrossalllobes,andthattherelativeheightsabovethe moderncreekswouldbethesameasifmeasuredfrom thebases.Werecognizethattheseassumptionswill affecttheaccuracyofthismethodoflobecomparison. Similarly,theverticalaccuracyofGoogleEarthpointsis sometimesunreliable,althougharecentstudyhasestimatedarootmeansquareerrorof8.68mfortheUnited States(Meyeretal.,2012).
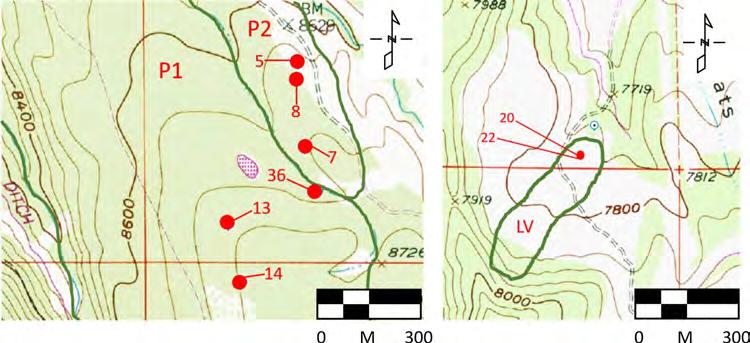
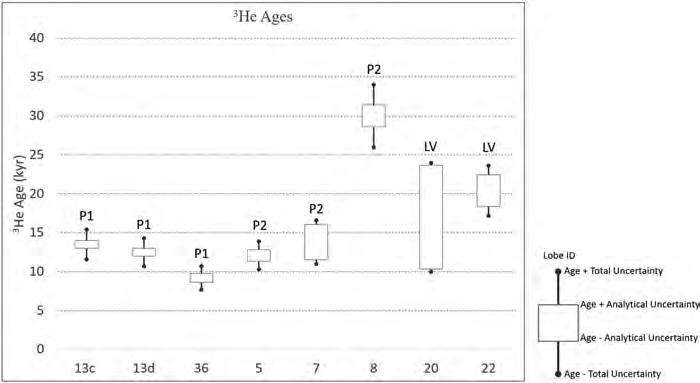
Amongthedelineatedlobes,asubsetwaschosenfor numericalagedatingoftheParkandtheLeondeposits, takingintoconsiderationthedetailsofthedatingtechniques.Forexample,becauseofthenecessityof insitu bouldersfor 3Hecosmogenicdating,lobesontheLeon depositwherebouldershadbeenmovedbyhumansto theedgeofcultivated fieldscouldnotbedatedusing thistechnique.
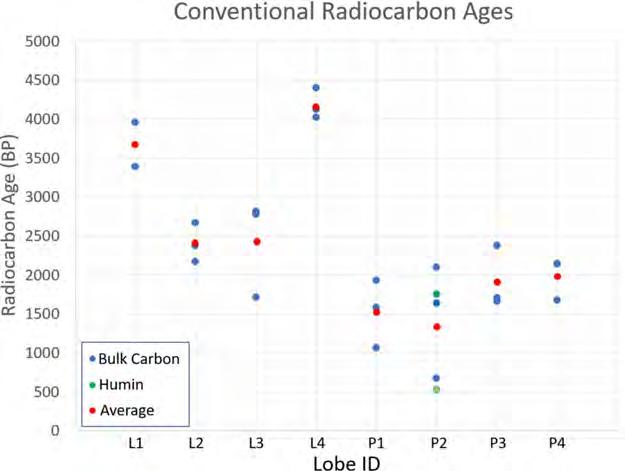
RadiocarbonDating Radiocarbondatingofbulksedimentwasusedto interprettheageofthelobedepositsbecausenomacroparticles,suchascharcoal,werefound.Becausebulk organicmatterinsoilwasused,itwasimportantto understandiftheorganicmattertestedhadawiderange ofagespresent.Evenwithinthesamevalley,widelydifferentagesoforganicmoleculescanbepresentinthe soilthatdonotreflecttheageofdeposition(Ferguson, 1971).Someoftheproblematiccarbonwillmakethe depositionalageappearyoungerthantheactualage, suchasthatsourcedfrommodernroots,organicsindissolvedwater,micro-organisms,andsoilfauna(NowaczykandPazdur,1990;Pessendaetal.,2001).Other sourcesofcarboncanmaketheageofthedepositappear olderthantheactualage,suchasdeadtreesinthepath oftheoriginal flowthatwereentrained.Therefore,the uncertaintyintheradiocarbondateswillbelargerthanif amacro-particle,suchascharcoal,hadbeendated.
Quantifyingthisuncertaintyisdifficult.Themoststableandtheoreticallyoldestorganicfractionisthehumin fraction(Balesdent,1987;Becker-Heidmannetal.,
1988;Pessendaetal.,2001;andWangetal.,2014).If thehuminfractionhasamucholderradiocarbonage thanthebulkorganicmatter,thencontaminationfrom modern-daycarbonortheentrainmentofoldercarbon willbesuspected.Therefore,thebulkorganicmatter andthehumincontentwerebothdatedintwosamples totestfortherangeofagespresentintheorganicmatter dated.Thetwosampleswerechosenwithinthesame valley,oneinagrassyareaandoneinaforestedarea,to alsounderstandhowpossiblecontaminationdiffersasa functionofvegetation.
Thelaboratoryresultswereenteredintothesoftware Oxcal,whichisaradiocarboncalibrationprogramoriginallydevelopedforpaleo-earthquakechronologies.This toolusesBayesianstatisticstoincorporateallavailable chronologicalconstraints(LienkaemperandRamsey, 2009).Oxcalcalibratestheradiocarbonresultstoreport apossiblerangeandconfidenceforthetrueyearof deposition,takingintoaccountvariabilityinatmosphericconcentrationsanduncertaintiesbasedontreeringdata.InOxcal,eachlobewastreatedasa “Phase,” whichforcesnochronologicalordering.Additionally, theR_Datefunctionwasused,whichcalculatedaradiocarbonageforeachsample.
Whereastheabsoluteagesofthelobeswerehelpful toknow,thefeaturesofmostconcernweretherelative agesofthelobes,sinceweweretryingtounderstand whethertheyweresimilarordifferentages.Therefore,if youngeroroldercarbonwasincorporatedintothe depositsatequalrates,thentherelativeagesofthe depositsshouldnotbeaffected.Thiswasconsideredto beareasonableassumptionwhencomparinglobesonly withinonevalleyandatthesamedepth,butnotnecessarilywhencomparingthelobesindifferentvalleys (e.g.,ParkversusLeon).
Sampleswerecollectedatadepthof60cmfrom holesdugusinghandshovels.Thisdepthensuredthat sampleswerewithintheoriginallydepositedmaterial andnotinareasofsoilaccumulationsincedeposition, althoughwesuspectedthiswouldbeveryminorifpresent.Thedepthwaskeptconsistentbetweensamplesto lessenanycomplicationsthatwouldarisefromcontaminationdifferencesatvaryingdepths.Thesurfacesofthe present-daydepositsdidnotappearsignificantlyaltered sincedeposition,andtherefore60cmwasconcludedto beasufficientdepthfromwhichtoextractsamples. SamplesweresenttoBetaAnalyticandDirectAMSfor thedatingofthebulkorganicmatter.
CosmogenicNuclideDating Severalisotopeswereconsideredforcosmogenic nuclidedatinginthisstudy.Themorecommonisotope usedindating,10Be,couldnotbeusedbecauseofthe lackofquartzphenocrystsintheboulderspresentonthe
deposits.The 36Clisotopefromwhole-rocksampleswas alsoconsidered,butitcouldnotbeusedbecauseoflaboratorydelays.Furthermore,afterdiscussionswithseveralresearchers,weconcludedthattheprecisionof whole-rocktestswouldnotbesufficientunlesslarge numbersofsamplesweredated.Therefore,the 3Heisotopewas finallyselected,asithasarelativelyhighproductionrateanditisreadilytrappedinolivinecrystals, makingitsuitableforHolocenedepositsthatcontain basalt,suchasthoseintheGrandMesaregion(Craigand Poreda,1986;Kurz,1986;Cerling,1990;andCerling andCraig,1994).Recentstudiesusingwell-constrained calibrationsiteshaveimproveddeterminationoftherate ofproductionandaccuracyofthemethod(Blardetal., 2013;Goehringetal.,2010).Testingwascompletedat WoodsHoleOceanographicInstitute,andsamplepreparationandtestingprotocolsallowedremovalofmagmatic andradiogenic 3He,sothatcosmogenic 3Hecouldbeisolated.Thisstudytestedtheeffectivenessoftheremoval oftheradiogeniccomponentbyusinganabrasiontechniqueinthelaboratory.Thisinvolveddatingasinglesampletwice:Onedatecorrespondedtothematerialtaken fromtheoutermostlayersofthecrystal,whichiswhere theradiogeniccontaminationisexpectedifitispresent, andtheotherdatedmaterialwastakenclosertothecenter ofthecrystal,wherelessradiogeniccontaminationwould beexpected.Theamountofradiogeniccontamination couldthenbeassessedbycomparingthetwodates.
Severalcriteriawereusedintheselectionoftransportedbasaltbouldersforcosmogenicdating.First,the bouldersshouldhavea b axisover60cmtoincrease theprobabilitythattheyhadnotrolledsincedeposition. Thebouldersshouldhaveaminimumheightabovethe groundof30cmtoincreasetheprobabilitythattheyhad notbeencoveredbysnoworsedimentformuchoftheir past.Also,samplingsurfacesonthebouldersneededto berelatively flattopreventself-shielding,andthey neededtobefreeofmoss,lichen,prominentcracks,and abundantvesicles(indicatingthattheboulderwouldhave originatedfromanundesirablelocationnearthelava flow surface).Sampleswerecollectedassmallchips,extracted withtheuseofhammer,chisel,andabattery-powered hammerdrill.Threesampleswerecollectedfromeach lobetobedatedtoimproveoverallaccuracy.
Ateach 3Hesamplinglocation,latitude,longitude, andelevationwererecordedusingahandheldglobal positioningsystem(GPS)receiver,andthesevalues wereusedtocalibratelaboratoryresults.Thelocation wasdoublecheckedusingaGaiaapplicationonan iPhoneandatopographicmap.Thehorizonwasmapped forcalculationoftopographicshieldingusingaBrunton compass.TheCronusTopographicShieldingCalculator, version2.0,wasusedtocalculatethetopographic shieldingfactor.Nocorrectionwasmadeforsnow
shieldingorradiogeniccontaminationbecauseitwas unlikelytobeanaccuratecorrectionwiththelimited dataavailable.Itisimportanttonotethatwiththeincorporationofsnowshielding,thecalculatedcosmogenic ageswouldbeolderthanvaluescalculatedwithout snowshielding.Bensonetal.(2004)foundthatthe incorporationofsnowshieldingincosmogenicdating calculationsincreasedtheageby12percentindeposits associatedwiththePinedaleglaciation.
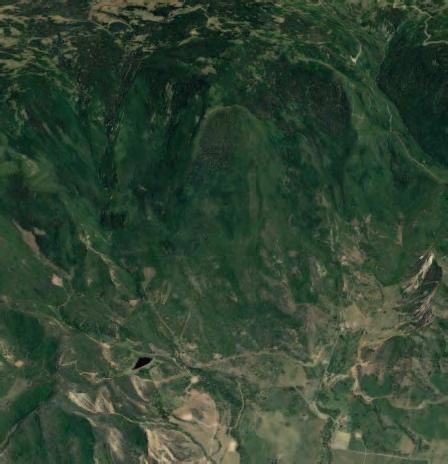
RESULTS SurficialMaterialsMapping Theresultsof fieldanddesktopmappingareshownin Figure5,withadetaileddescriptionoftypesofdeposits inFigure6(alargerscalemapisavailableintheSupplementalMaterialsthataccompanythispaperat https:// www.aegweb.org/e-eg-supplements ).Ofparticularinterestforthisresearchisacomparisonoftheelongate, moundeddepositsofWSCLandtheParkandLeonvalleys.WhilemappingoftheParkandLeondepositsidentifiedindividuallobes,describedinmoredetailbelow, theentiredepositscanalsobeanalyzedasiftheywere eachonesingleprocessorevent,asshowninTable1. Theothervalleysinthemappingareaarealsoincluded inthistable,whichsummarizesthelength( L)andrelief ( H)ofthedominantlandform.Theratioofthese,termed themobilityindex(H/ L),hasbeenusedtocharacterize depositsfrommassmovements.TheParkandLeon depositsweremuchlargerthanWSCLinbotharealcoverageandrunoutlength.ThereliefofWSCL,incontrast,wasmuchgreaterthantheLeonandParkdeposits, sowithhigherreliefandshorterrunout,WSCLhada mobilityindex(H/ L)thatwasafactorof2.5timeslarger thantheParkandLeondeposits.Thissuggeststhat WSCLwasdepositedbyasubstantiallydifferentprocessthantheParkandLeondeposits.Allothervalleys, exceptOak/LittleCreeks,alsohavelowmobilityindices (longerrunout)thataremuchlessthantheWSCL.We interpretthehigh H/L valueforOak/LittleCreekstobe afunctionoftheunusuallyshortglacialtonguethat depositedthemoundedmaterialinthevalley.
TheWSCLevent,whilereferredtoasalandslide,has alsobeentermedarockslideandrock/debrisavalanche (Whiteetal.,2015).Detailedcomputerstabilityanalysis oftheevent(McCoyandSanti,2014)andaggregation ofeyewitness,seismic,and fielddata(Whiteetal., 2015)supportadescriptionoftheeventasalandslide thatthenshatteredandmobilizedintoalong-runout debrisavalanche(mappedasQdaonFigure5).The WSCareacontainsalargeblockofintact,downdroppedGreenRiverFormationatthehead,asnoted earlier,whichisuniqueforthisarea.Usinghistorical GoogleEarthimages,asimilarblockwasnotedbefore
Figure5.SurficialmaterialsmapoftheWestSaltCreekarea.ColorkeyforunitsisshowninFigure6.Onlysignificantlandformsareincludedas mappedpolygons,sounmarkedareaswithinthemappedboundariesareconsideredtobe(1)locallyproducedsoilfromweatheringofbedrockor underlyingmaterial,withminimalmovementbygravityorrunningwater,(2)minoralluvialorcolluvialdeposits,(3)smallordiscontinuousareas ofexposedbedrock,and(4)grounddisturbedbyfarmingorconstruction.Higherresolutionversionofthemapisavailableuponrequestfromthe primaryauthor.
thelandslideevent,andthisistheblockthatmoved, shattered,andmobilizedin2014.Thepre-2014images showanundisturbedcolluvial,alluvial,andbedrockvalleywithnoevidenceofglacialordebris-flowdeposits.
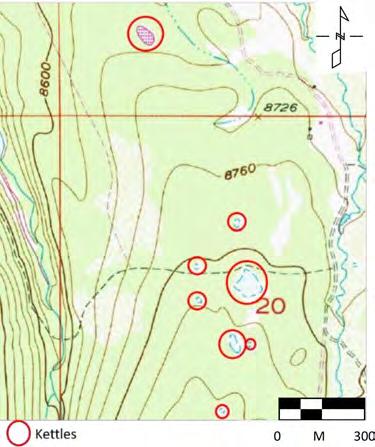
TheParkdeposit,anelongatemoundthatextends continuouslyfromthemesacaptothelowervalley,is interpretedasthegroundmoraineremnantofaglacial tongue(Qgt).Thedepositalsohostsseveralisolated marshesthatareinterpretedasremnantsofglacialkettles(Figure7).Thesefeatureswerenotfoundonother valleydepositsinthearea.
ThedownstreamportionoftheLeondeposit,westand northofVegaReservoir,presentsasarelatively flatplatformatanelevationslightlyhigherthantheParkdeposit, consistentwithwhatwouldbeexpectedforglacialoutwash(Qgo).Amatchingoutwashplatformexistsonthe eastsideoftheParkvalley,atasimilarelevationand morphologytothispartoftheLeondeposit.Weinterpret thesetwoplatformsasasingleoutwashdepositthatwas incisedatalatertimebytheParkglacialtongue.
TheupstreamportionoftheLeondeposit,westand southofVegaReservoir,isasurfacegenerallysloping easttowardstheParkdeposit.Weinterpretthisas
colluviumoverlyingbedrock(notmappedseparatelyon Figure5).Thisareawaslikelymodifiedinpartbythe Parkglacialtongue,anditmaycontainsomeground andlateralmorainematerials.
TheESCdrainageismappedpartlyasagroundmoraine fromaglacialtongue(Qgt),muchliketheParkdeposit, butofsmallerextent.Thedeposithasthesameelongate, moundedmorphology,butitdoesnotextendthroughthe headofthevalleyintothemesacapliketheParkdeposit. Wesuspectthedifferenceresultsfromthehigherslopesat theheadofESCanditssmallersourcearea.
Movingwestward,weinterprettwoadditionalvalleys asgroundmorainefromglacialtongues(Qgt)descendingfromthemesacap(Qgm).Immediatelytothewest ofWSC,theSpringCreekandGroveCreekvalleysjoin toformadepositcomparabletotheParkdepositin length;thisdeposittransitionstoglacialoutwashinthe lowerportionofthedepositclosetoCollbran(Qgtoand Qgo).Thenextsetofvalleystothewest,OakCreekand LittleCreek,containamuchshorterglacialtongue depositconfinedtothehigherelevationsofthevalleys. AllofthesedepositstothewestofWSCappearto mergeatthemesacap.
PotentialforDeadlyLandslideEvents Mass Was ng Deposits
Qyls - Young landslides and young earthflows
Visible, lightly vegetated to unvegetated scarps and scars are present. Some mes contain many fallen trees that are aligned in the downhill direc on. Unaligned trees were not used to indicate presence or absence of this unit, since they may be due to beetle kill. Many of these areas are suspected to be ac ve, whether periodically or seasonally. O en have rota onal components to movement, indica ng deeper seated failure surfaces.
Qols – Old landslides and old earthflows
Bare scars and scarps are no longer visible due to heavy vegeta on. Downed trees are rarely present as in Qyls. Boundaries are difficult to iden fy, and individual outlines may include mul ple landslides. Characteris c landslide topography (scarp and hummocks) is present. These areas are not suspected to be ac ve. Many are located in convergent valleys on steep terrain. Rela vely thicker deposits than Qyls, since only the larger deposits are s ll visible today. Deposits that are outlined, but have high uncertainty as to their boundaries or origin are labeled with a “?”. All of these deposits may not be iden fied, as they are difficult to locate.
Qdfl – Debris flows
Each outline is assumed to represent a single flow event. Commonly composed of lobate landforms. Similar in morphology to Qgt, but shorter in runout, smaller in volume, and lateral spreading at the toe.
Qda - Debris / Rock avalanche
These deposits form from a collapsed slope of a hillside and travel downslope in a single flow. Composed of pulverized rock, and clast sizes range from very large boulders to clay and silt sized rock flour. Clasts are generally angular to subangular and are extremely blocky. While similar to debris flows, debris avalanches move much faster and contain less water. Rock avalanches, by contrast, contain a smaller propor on of finer material (gravel and smaller diameters).
Colluvial Deposits
Qu – Undifferen ated colluvium / Residual soil /Alluvium
Only significant landforms are included as mapped polygons. Unmarked areas within the mapped area are considered to be 1) locally produced soil from weathering of bedrock or underlying material, with minimal movement by gravity or running water, 2) minor alluvial or colluvial deposits (including what is normally mapped as Quaternary Alluvium, Qal), 3) small or discon nuous areas of exposed bedrock, or 4) ground disturbed by farming or construc on.
Qava – Alluvial valleys and aprons
These alluvial units are predominantly found in valleys and topographic depressions. Sediment is mainly locally derived and is sourced from streams, intermittent streams, and alluvial aprons. Sediment size varies but is predominantly sand. Alluvial valleys and aprons currently mapped are more extensive, while smaller deposits in the region are included in the Qu category.
Fluvial
Qt – Abandoned terrace from modern channel (Qal)
Slope and flow direc on mimic the modern channel. Higher in eleva on than adjacent Qal. Sediment is well rounded and is derived from upstream sources.
Qp – Pediment
These landforms are capped by sediment and represent remnants of more extensive pla orms. Probably includes some colluvium and alluvium. Commonly broad and flat topped, higher in eleva on and larger than Qt deposits.
Glaciofluvial
Qgto – Till/outwash transi on
Deposited by flowing water from mel ng ice. These deposits are rela vely less hummocky than the adjacent Qgt located upstream. Commonly interfinger on the downstream end with Qgo. Light vegeta on is commonly present. Likely mixed with debris flows in some areas, such as on Kansas Mesa. Sediment is sourced from the Grand Mesa.
Qgo – Outwash
Alluvium deposited by mel ng ice tongues. Located downstream of Qgto and Qgt. Less hummocky than Qgt and Qgto. Commonly lightly vegetated. Expected to have been deposited in a braided river environment where unconfined. Likely mixed with debris flows in some areas, such as on Kansas Mesa. Sediment is sourced from the Grand Mesa.
Glacial
Qgm – Ground moraine from stagnant ice
This ll is located at high eleva ons (mainly above 3000 m) on the top of the Grand Mesa. Most iden fiable lithology is basalt. Stria ons are not common. Surface has a very low gradient. Serves as a source for the Qgt, Qgto, and Qgo deposits. Mapped by others as Pinedale or Bull lake in age. Sediment is sourced from the Grand Mesa.
Qgt – Moraines from glacial tongues
Mobile glacial tongues that moved under their own weight. Located in major valleys connected to the mesa with minimum eleva ons around 2250 m. Commonly found as lobate landforms that combine to form larger mul -lobate deposits. Surface has very low gradient and contains many large (greater than 0.5 m) basalt boulders. May have kettle lakes on the surface. Stria ons were not iden fied. Qgto deposits are adjacent and downstream at many loca ons. Qgm deposits are adjacent and upstream at many loca ons. Lateral spreading of the deposit is much less than Qdfl deposits, and thickness is greater. Mapped by others as Pinedale or Bull lake in age. Sediment is sourced from the Grand Mesa.
Bedrock
Tb – Paleocene and Eocene Bedrock
These are sedimentary units (claystone and fine to medium grained sandstone) in which the bedding is visible. Mostly part of the Shire Member of the Wasatch Forma on (as mapped by Donnell and Yeend, 1985).
Figure6.KeyanddescriptionofsurficialmaterialsoftheWestSaltCreekarea(materiallocationsshownonFigure5).
Thenextvalleytothewest,whichcontainsBig Creek,iscomparableinsizeandpenetrationsouth intothemesacapastheParkdeposit,butitdoesnot containasigni fi cantglacialtonguedeposit.Materialsarecolluvial(Qcl),withaprominentstreamterrace(Qt)andminorglacialtongue(Qgt)and outwashdeposits(Qgto)thatbecomemorewidespreaddownstream.
Thelastvalleyinthemappingarea,DeaconGulch,is areentrantintotheGrandMesabetweenBigCreekto theeastandCottonwoodCreektothewest,anditwas mappedascolluvium(Qcl)anddebris-flowdeposits
Table1. Geomorphicgenesisandtopographiccharacteristicsofthedominantsur fi cialdepositineachvalleysystem.
ComponentValleySystem(inOrderfromEasttoWest)
Toptobottom ofQd fl unit
Mesarimtotop ofQd fl unit
Mesarimto bottomof Qgtunit
Mesarimto bottomof Qgtunit
Topoflandslide scarptotoe oflandslide (Qda)
Toptobottom ofQgtunit
Toptobottom ofQgounit
Toptobottom ofQgtunit
OldstreamterraceDebris fl ow
Glacialtongue andground moraine
Glacialtongue andground moraine
Dotserodebris fl ow(0.083)
Howard(0.076 and0.035)
Yampa(0.042) Buford(0.066) MedicineBow (0.037)
Yampa(0.042) Buford(0.066) MedicineBow (0.037)
Rock/debris avalanche
GlacialoutwashGlacialtongue andground moraine
Glacialtongue andground moraine
Dotsero landslide (0.23)
Yampa(0.042) Buford(0.066) MedicineBow (0.037)
Durango(0.008 and0.000) Yampa(0.028)
Yampa(0.042) Buford(0.066) MedicineBow (0.037)
Where H and L measured
Deposittype
H / L foranalogdeposits (Figures8and9)
*ReliefanddepositlengthmeasurementsweremadeusingGoogleEarth.Estimatedaccuracyis L 6 150mand H 6 30m.
**Furtherjusti fi cationfortheinterpretationofdeposittypeisgiveninTable2.
(Qdfl).Therearealsosomelandslides(ols)similarin arealextenttoWSCL,butstartingatalowerelevation andwithalesselongateshape(shorterrunoutfora givenarealextent).
Mappeddepositsoflandslidesanddebris fl owsin theareaaremuchlessprominentthanasinterpretedby Soule(1988).Debris- fl owdeposits(Qd fl )areonlypresentonthewesternmarginofthemappingarea,older landslides(ols)arepresentontheeasternandwestern margins,andyoungerlandslides(yls)arefound throughout,butassmallisolatedevents.Otherwidespreaddepositsinthemappingareaareinter fi ngered alluviumandcolluvium(Qacl)insomeofthedrainages,andglacialoutwash(Qgo)inthemajorPlateau andBuzzardCreekdrainagesatthenorthmarginof thearea.
Asigni fi cantobservationfromthe fi eldmapping, then,isthattheWSCListheonlynotedvalley-wide andvalley-centeredmassmovement,withtheexceptionofthedebris fl owinDeaconGulch,whichis smallerthantheothervalleysandonlyhasanintermittentstream.
SurficialMaterialsAnalogs Becauseourinterpretationofthemajorvalleysurficialdepositsiscentraltothisstudy,welookedforconfirmationintheformofanalogsfromotherregional sites.Whiletherearenumerousexamplesthatcould havebeenchosen,wepresentasmallgroupofthemin Figures8and9.
Figure8focusesontheglacialtonguemorainal deposits(Qgt)andglacialoutwashdeposits(Qgo).In
theseexamples,theQgtanalogsallhaveanelongate, moundedmorphology,likeourmappedareasofPark, EastSaltCreek,andtheOak/LittleCreekandSpring/ GroveCreekdeposits.Alsolikethemappeddeposits, theanalogscontainmultiplesmallerlobeswithinthe largerroundedtongue-shapeddeposit.Allofthedepositsareofsimilarsize.Asdetailedinthe figurecaption, alloftheanalogshavealsobeeninterpretedasQgt-type depositsbypreviousmappers.
TheQgoanalogsalsoshowsimilarmorphologyto ourmappeddeposit(theLeondepositinthiscase),asa gentlysloping, flatplatformofthesamemagnitude, mappedbypreviousresearchersasoutwashandterrace alluvium,withminorlobatesubunits,andalsolocated downstreamofglacialmorainedeposits.
Figure9focusesonlandslide,debris-flow,andriver terracedeposits.Whiledebrisavalanches,likeWSCL, arenotuncommoninthewesternUnitedStates,wedid not findanycomparableanalogswithrecentmovement withinan »100kmradius.Therearedepositsonthe westandsouthsideofGrandMesathathavebeen mappedaslandslidesresultingfromretrogressive slumpingofGrandMesabasaltcapblockswherethe loadingcauseslateralspreadingoftheunderlyingclaystone(BaumandOdom,1996).Thisisdifferentfrom thegeologyofWSCL,whichdoesnotinvolvethebasalt blocksandthelandslidebenchtheycreate.Furthermore, theselandslideshavenothadrecentlarge-scalemovement,althoughtherearelocationswheretheyshow long-runoutmobilization.Theanaloglandslidenear Dotsero(Figure9)isalargerockmass,liketheoriginal landslideblockatWSC,butithasnotmobilizedintoa long-runoutdebrisavalanche.Othernotablelargelandslidesincentral-westernColoradoarealsosignificantly differentfromWSCL:
• TheSlumgullionLandslidesouthofLakeCityissimilarinsize,butitisaslow-movingearthflowrather thanafasteventlikeWSCL(VarnesandSavage, 1996).
• TheMuddyCreekLandslidenorthofPaonia Reservoirislarger,butalsoslowmoving,andmorphologicallyitismuchwiderandacoherentmass withnoextensiverunout(StoverandCannon,1987).
• TheDebequeCanyonLandslidesouthofDebequeis alsolarger,butitiscomposedofalargerockmass similartotheDotseroanaloglandslideandtheoriginallandslideblockatWSC(Whiteetal.,2003).
TheBigCreekterracedeposits(Qt)sharemorphology withtheanalogs,asplanarribbon-shapedsurfacesclose tothelevelofanactivestreamorriver.TheDeacon Gulchdeposit(Qdfl)hasbeendissectedbynearby streams,soitdoesnotappearascompleteastheanalog deposit,andtheDeaconGulchdepositismuchlarger.
Figure7.Locationsofkettle-likefeaturesontheParkdeposit.
Arabnia,Santi,Emmons,andSparks
Figure8.AnalogcomparisonsforQgtandQgodeposits.Left-handimagesareanalogs,andright-handimagesarefromourmappedareanear WestSaltCreek.AllimagesarefromGoogleEarth,andlatitude/longitudeofthecenterofeachimageisshown.(A)Glacialoutwashdepositsin Durango,CO(verticalexaggeration[V.E.] ¼ 33).Mappedas(glaciallyderived)terracealluviumbyCarrolletal.(1999).(B)Glacialoutwash andtongue/groundmorainedepositsaboveYampa,CO(V.E. ¼ 33).Mappedas “oldergravel-bearingterracealluvium” (Qgo)and “glacial deposits” [till](Qgt)byMadole(1991).(C)Tongue/groundmorainedepositsoutheastofBuford,CO.Mappedas “glacialdeposits” [till](Qgt)by Madole(1989).(D)Tongue/groundmorainedepositnearSugarloafMountain,MedicineBowRange,WY(V.E. ¼ 33).Mappedas “Quaternary glacialdepositsundivided” (Qgt)byHoustonetal.(1977).(E)Easternmostdeposits(eastofWestSaltCreekLandslide[WSCL])mappedfor thisstudy(V.E. ¼ 33).(F)DepositsdirectlywestofWSCLmappedforthisstudy(V.E. ¼ 33).
Nevertheless,bothdepositshavelobatemorphology,laterallyspreadingtowardsthetoe,andevidenceofsome minorraisedleveesorientedinthe flowdirection.
Themobilityindices(H/Lvalues)fortheanalogsites areshownonTable1,withremarkablesimilarity betweentypesoflandforms.Ingeneral,allofthedepositsfallintoalowrange(indicatinglowangleandlong runout),exceptfortheWSCLanditsanalognearDotsero,whicharemuchhigher(indicatingsteeperdeposits).Asnotedearlier,theOakandLittleCreekdepositis anomalouslysteep.
LobeMapping UsingthecriteriaestablishedintheMethodssection above,lobemapswereconstructedforboththeParkand theLeondeposits(Figure10).Intotal,15separate depositlobeswithintheLeondepositand9lobeswithin theParkdepositwereidentified.Soilformationsince depositionwasverythin,evenintheforestedareas. WhiletheLeondepositwasfoundtobemoreanthropogenicallydisturbedthantheParkdeposit,therewere basaltboulderslargerthan90cmindiameterthatcould
Figure9.AnalogcomparisonsforQda,Qt,andQdfl deposits.Left-handimagesareanalogs,andright-handimagesarefromourmappedarea nearWestSaltCreek.AllimagesarefromGoogleEarth,andlatitude/longitudeofthecenterofeachimageisshown.(A)Examplelargelandslide nearDotsero,CO(verticalexaggeration[V.E.] ¼ 33).Mappedas “Qls Landslidedeposits” byStreufertetal.(2008).Thiswouldcorrespondto “ols” inthemappingunitsusedinthisstudy.NotethesimilaritywiththeupperblockoftheWestSaltCreekLandslide(WSCL)(E),butwithout thelongdebris-avalancherunout.(B)YoungstreamterracedepositsnearHowardsville,CO.ComparabletoQtmappedforthisstudy,butno detailedpublishedsurficialmapsofthisareaareavailable.(C)YoungstreamterracedepositsnearDurango,CO.Mappedas “streamchannel, floodplain,andlowterracedeposits” (Qt)byCarrolletal.(1999).(D)Debris-flowdepositsnearDotsero,CO.Mappedas “olddebris flowdeposits” (Qdfo)byStreufertetal.(2008)(V.E. ¼ 33).(E)WestSaltCreekLandslide(V.E. ¼ 33).Noteintactblockatthetopofthelandslidewith shattered flowmass(debrisavalanche)below.(F)Westernmostdepositsmappedforthisstudy(V.E. ¼ 33).
besampledinundisturbedareasinbothdeposits.These basaltbouldershadbeentransportedseveralkilometers fromthenearestbasaltbedrockontheGrandMesacap.
ThemajorParklobe,P1,extendedcontinuouslyin theup-valleydirectiontothetopofthemesa,whichwas thesedimentsourceforthesedeposits.Incontrast,the Leonlobesdonothaveasingleclearsourcearea.As eachlobewastraversedintheup-valleydirection,it appearedthatthereweretwopossiblesourceareas. LobesL1andLVappearedtohaveadifferent,more western,sourceareathanlobesL2,L3,andL4.
Relativelobeagescouldbedistinguishedbylongitudinalprofilemapping,asshownonFigure11.Thefour evaluatedParklobesshowsomehummockyvariability,
butingeneral,theselobesarecloseinelevation(within 50m)tothemodernParkCreek,indicatingthattheyare fairlyyoungdeposits.Theyallappeartobesimilarin elevation,accountingforthevariabilityintheprofile measurementsalongthelengthofeachlobe,butingeneral,weinterprettheminageorder,fromoldesttoyoungest,asP1,P2,P4,andP3.
Incontrast,theLeonlobesaremucholder,with heightaboveLeonCreekintherangeof100m.These lobeshaveslightlymoredistinctdifferencesinelevation thantheParklobes,andtheycanbeinterpretedinage range,fromoldesttoyoungest,asL3,L4,L1/L2.
Recallthat,becauseofexposurelimitations,wewere forcedtomeasuretotopelevationsofthesedeposits,
Figure10.LobeswithintheLeon(left)andPark(right)depositsare shownindifferentcolorsonatopographicmapwith6m(20ft)contourinterval.(NotethattheboundariesoftheLeondepositarefrom Soule[1988],whichdifferslightlyfromour finalmap.)Thelobes evaluatedforagedatingarelabeled.
whichpotentiallyintroducesmoreerrorthanmeasuring thebottoms.Therefore,whilewebelieveitislikelythat theLeonlobes,ingeneral,areolderthantheParklobes, butwecannotsaywithconfidencewhetherthelobes representdifferentepisodesofdeposition.Itdoesappear thattheLeondepositmayrepresentdifferentepisodes, butthesupportforthisisnotdefinitivelyshownbythe longitudinalprofilealone.
RadiocarbonDating Samplelocationsforradiocarbondatingareshownon Figure12fortheLeonandParkdeposits.Allreported conventionalradiocarbonageshavebeencorrectedfor totalfractionationeffects,withreporteduncertaintiesof 630years.TheradiocarbonresultsaregraphicallyrepresentedinFigure13,withtheaverageageforeach depositalsoplotted.
TheParkdepositlobesareestimatedtohavebeen depositedatthesametimeusingtheagerangesand
averagesshownonFigure13.Adjacentlobes(P1/P2, P3/P4)hadmuchcloserradiocarbonagesthanthe nonadjacentlobes.AverageagesforP1andP2were separatedby189years,andaverageagesforP3and P4wereseparatedby72years.Incontrast,notall Leondepositlobesappeartobethesameageusing theagesrangesandaverages.LobesL1andL4appear tohavedistinctlydifferentages(older)thanlobesL2 andL3,andweconcludethattheLeondepositconsistedofatleasttwodepos itionalevents.Humincarbonagesarewithintherangesofothervalues, indicatingthattherewasnoevidenceofsystematic contaminationwithyoungeroroldercarbonbydating thehuminfraction.
CosmogenicNuclideDating DatingoflobesP1,P2,andLVwascompleted usingthecosmogenictechnique(Figure14).Samples werealsocollectedfrombouldersonotherlobes,but because 3 Hedatingisnotwidelyused,ittookan unusuallylongtimetocompletethework(over2 years),andwewereunabletotestasecondroundof samples.
Cosmogenicages,accountingfortopographicshieldingandmagmaticandradiogeniccontributions,areplottedonFigure15.TheresultssuggestthatlobesP1and P2weredepositedwithinasingletimeperiod,basedon overlapintotaluncertaintyranges.Thedatesforsamples13dand36fromlobeP1didnotoverlapusingthe analyticaluncertainty,buttheydidoverlapwhenusing thetotaluncertainty.Becausethesesamplesweretaken inverycloseproximityandonthesamelobe,thissuggeststhattheanalyticaluncertaintywastoosmallto estimatethetrueageofasinglelobe.Sample13c,which wasabradedtoremoveradiogeniccontamination,was theonlysampletoundergothismethodologyandthereforemaynotcomparewelltotheothersampledates. Sample8fromlobeP2isconsideredanoutlier:This samplewasmucholderthantheothersamplesforP1 andP2,soinheritanceisexpectedinthissample,andit wasnotusedinevaluatingtherelativeagesoflobesP1 andP2.
LobeLVwasestimatedtobeolderthanthePark depositlobesusingcosmogenicages.Althoughtheage ofsample20overlapswiththeParkdepositsamples,the analyticaluncertaintyofsample20wasverylarge(6.7 k.y.)becauseofitsverysmallfractioncrushvalue.Sample22wasabetterestimateoftheageoflobeLV becauseofitshigherfractioncrushvalue.Usingeither theanalyticalortotaluncertainty,sample22hadanage estimationthatdidnotoverlapwithanyofthePark depositageestimations.
Figure11.LongitudinalprofileformajormappedlobesfromtheParkandLeondeposits,withrelativeelevationsaboveLeonandPlateauCreeks.
DISCUSSION AgeDating Themajorsourceofuncertaintyforcarbondating, thepotentialincorporationofpresent-dayorganicmatter,issuspectedtohaveoccurredatacomparablerate forallsamplesoneachlobe.Thisisbecauseofthe
proximityofthesamplestoeachother,thesimilarityof vegetation/animalactivity,andthelackofsoildevelopmentoneachlobe.Therefore,theagesofthelobespresentedhereareexpectedtoaccuratelyre fl ectthe relativeagesequencebutnotnecessarilythetrueage ofthedepositbecausesomeoftheuncertaintiesarenot quantifi ed.
Figure12.SamplelocationsforradiocarbondatingforthePark(left)andLeon(right)deposits.Thethree-charactersampledesignationis:Park orLeonlobe(PorL),lobenumber,samplenumberfromthatlobe.
Radiocarbondatingprovidesaminimumpossibleage forglacialdepositsbecauseofalagtimebetweendeposit emplacementandaccumulationofdatableorganicmatter. Sincecosmogenic 3Hewouldbeginaccumulatingimmediatelyaftertheicemelting,radiocarbondateswould likelyreflectayoungeragethanthecosmogenicnuclide agesforthesameglacialdeposit.ForthePinedaleglaciation,whichismostprobableinourarea,thelagtime betweentheretreatoftheglacierandtheaccumulation ofdatableorganicmattercanbehundredstothousands ofyearsdependingonlocation(Balco,2011).Thisis indeedwhatwasobserved,withalagof »8–13k.y.for lobeP1, »10–13k.y.forlobeP2,and »13–18k.y.for theLeonlobes,comparingthedifferenceinvaluesfrom Figures13and15.
Anumberoffactorscouldcontributetotherangeof cosmogenicdatesfromtheP1,P2,andLVlobes,such asvariabilityin 3He/4Hecrushratios,difference betweenabradedandunabradedsamples(seeninsamples13cand13d),fractioncrushvalues(nothreshold hasbeenpublished,butsamples5,20,and22hadvalues below1percentandthereforeshouldbeusedwithcaution),and 3He/4Hemeltratios(samples20and22were belowtherecommendedratioof6–8Raandshouldbe usedwithcaution).Furthermore,agesareprobably underestimatedby8percentbecauseofradiogeniccontaminationand12percentfromsnowshielding(Benson etal.,2004).Addingthis20percenttothemeasured agesdoesnotchangetherelativeagesofthedeposits andonlychangestheabsoluteagesbyasmallamount.
Figure14.CosmogenicnuclidesamplelocationsforthePark(left)andLeon(right)deposits.
Figure13.RadiocarbonagesforParkandLeondepositlobes.Bulkcarbon,humin,andaveragedatesareplottedforeachlobe.
Figure15.Graphicalrepresentationofcosmogenicagedatingresultswithanalyticalandtotaluncertainites.13dreferstothesampleinwhichthe abrasiontechniquewasappliedtotestforradiogeniccontamination.
Accountingforthesefactors,agedatingsupportsthe conclusionthattheLeondepositsareolder,withatleast twoepisodesofdeposition,andtheParkdepositisyounger,withlikelyoneepisodeofdeposition.Bothdeposits areconsideredtooriginatefromthePinedaleglaciation.
LandformEvidence Table2summarizesthevariouslinesofevidencewe usedtoidentifythemostlikelygeneticoriginofeachof themainvalleydeposits.Aswithallmapping,some subjectivejudgementisrequired,butthetableprovides anindicationoftheweightofevidenceandtherelative possibilityofdifferentgeneticorigins.
TheWSCL,whichistheonlydepositionalevent occurringduringhistorictime,isbestdescribedasa debrisavalanche.Thevalleys flankingWSCL,which includePark,EastSalt,Spring,Grove,Oak,andLittle Creeks,areallconcludedtobeglacialtonguemoraine deposits,basedonstrongmorphologicalindicatorsand features,withsomeconfirmationfrom H/L values,longitudinalprofiles,andagedating.TheLeondepositis alsoconcludedtobeglacialinorigin,butitisanoutwashterraceratherthanamoraine,supportedonthe basisofmorphologyandtheheightabovethemodern drainage.BigCreekandDeaconGulcharemappedas youngterraceanddebris-flowdeposits,respectively, almostsolelyonthebasisofmorphology.NearbyanalogswerefoundforalltypesofdepositsexceptWSCL, furtherindicatingitsuniqueness.
WillItHappenAgain? Attheoutsetofthispaper,weaskwhetherwecanuse geologicalandgeomorphologicalmapping,alongwith agedatingandsensitivityanalysis,todeterminewhether
anotherWSCL-typeeventislikelyinthefuture.Ourconclusionisthatthiswasauniqueeventthatisunlikelyto berepeated,exceptperhapsatthesamelocation,because therecurrentlyexistsanupperlandslideblockthatcould shatterandmove,muchliketheprocessthatoccurredin 2014.Wealsoconcludethatmassfailuresintheregion arelesscommonthanmappedpreviously:Manyfeatures mappedinthepastasolddebris flows(odf)areactually glacialinorigin,withamuchsmallerextentofdebrisflowdeposits.Thereareasignificantnumberofyoung andoldlandslides,buttheextentismorelimitedthanpreviouslymapped.WeattributethenearbyParkandLeon depositstoaglacialorigin,soanalogouseventsarethereforeunlikelytooccurintheclimatethatexiststoday.We concludethattheyweredepositedasasingleevent(Park) butalsoinmultipleevents(Leon),basedonourinterpretationofalimiteddataset.
Sowhydidthistypeofcatastrophiclandslideoccurat WSCbutnotintheadjacentvalleys?Whiteetal.(2015) describedpotentialtriggeringmechanismsforWSCL thatcouldalsoapplytotheadjacentvalleys:northwest dipofgeologicunits,highgroundwaterlevelsatthe timeoffailure,andbedrocksusceptibletoweakening andfracturingwithsaturationanddisturbance.However, therearedifferencesthatallowustoproposetwopotentialreasonsfortheuniquebehavioratWSC:
1.Adjacentvalleysdonothavethelargelandslideslump blockattheheadofthevalley.Inadditiontodriving movementbecauseofitsweight,thisblockwascomposedoffracturedandweakmaterialthatshatteredand thenmovedrapidlydownslopeasanavalanche (McCoyandSanti,2014;Whiteetal.,2015).
2.TheWSCdrainagebasinwastheidealsizeforthis sortoffailure(a “Goldilocks” situation).Ifthevalley hadbeenlargerorcutdeeperintothemesacap,there
Table2. Linesofevidenceforthegenesisofvalleylandforms.
Evidence
Morphology
Dis nct headscarp, evacuated mass from source area, long rocky runout deposit
Elongated mounded mass with some lobate features
Gently sloping, smooth pla orm, similar to a high terrace but much wider
Planar, ribbon-shaped surfaces close to level of ac ve stream or river
Slightly hummocky, some lobate features, laterally spreading towards toe, minor raised levees
Features
Possible landform indicated WSC Park, East Salt, Spring, Grove, Oak, Li le Creeks
Ke les (Park)
Contains basalt boulders from mesa cap
Deposit connects to a glacial source area(not East Salt Creek)
Presence of outwash terraces downstream Contains mul ple lobes
Measurements
Low H/L values
High H/L values
Longitudinal profiles parallel to nearby stream (not measured for terraces)(only Park and Leon)
Higher longitudinal profile indicates older event that would survive subsequent glacial ac vity (only Park and Leon)
Lower longitudinal profile in valley center indicates youngest glacial event (only Park and Leon)
Age Da ng
Difference in lobe ages indica ve of mul ple episodes of deposi on (only Park and Leon)
Similar lobe ages indica ve of single deposi onal event (only Parkand Leon)
Carbon ages younger than cosmogenic, indica ng lag for accumula on of organics (only Park and Leon)
Analogs
Similar features in the region mapped by others, with similar size and H/L values
wouldhavebeenmoreglacialandalluvialmodificationofthevalleyitself,creatingalowerreliefwatershedalongthethalwegwithlowermobility(H/L) values.Ifthevalleyhadbeensmaller,itwouldnot captureenoughwatershedtoaccumulatesufficient groundwatertotriggermovement.
Finally,itshouldbenotedthatourworkrepresentsthe latestinaseriesofmappingeffortstounderstandthis area.WhilewehavetheadvantageofGoogleEarthimagery,LiDAR,andagedating,whichwerenotavailableto previousmappers,werecognizethatourinterpretations arebasedonlimitedinformationandthatadditionaldata byotherworkersinthefuturecouldleadtorevisions.
CONCLUSIONS TheWSCLin2014,bestcategorizedmorespecificallyasadebrisavalanche,wasasurprisinganddeadly eventthatdetachedfromthesideofthemassive,high-
Leon Big Creek Deacon Gulch
elevationGrandMesa.Historicmappingindicatesthat therewereotherlarge-scalemass-movementeventson thesidesofGrandMesa,sothisstudywasmotivatedby thepressingneedtobetterunderstandtheoriginofother surficialdepositsintheareaandtoevaluatethepotential foranotherWSCL-typedebrisavalanche.Ourobservationsandtestingsuggestthatthispotentialislow,based onthefollowingconclusions:
• Mappingandsemi-quantitativegeomorphicmethods suggestthatthedepositspresentincanyonsoneither sideofWestSaltCreek(threetotheeastandfourto thewest)areglacialorstreamdeposits,withonecanyoncontainingdebris-flowdeposits.
• AbsoluteandrelativedatingsuggeststhattheLeon Creekdeposits,interpretedasglacialoutwash,were depositedinatleasttwodifferenttimeframes.The adjacentParkCreekdeposits,interpretedasglacial tongueandgroundmorainesediments,areyounger andlikelydepositedinoneepisode.Therefore,while thesedepositsarecloseinlocationtoWestSalt
PotentialforDeadlyLandslideEvents Creek,andtheyhavesimilarlongandvalley-wide footprints,theyaredistinctlydifferentinoriginand shouldnotbeusedtomakeinferencesaboutthelikelihoodofdebrisavalanchesintheregion.
• TheWSCLrepresentsauniqueeventinthispartof Colorado,withnocloseanalogswithin »100km. Othermassmovementswithinthisradiusthatareof similarmagnitudewereeitherslowermovingorhad muchshorterrunout.Thelargeblockattheheadof WSC,andtheearlierblockthatshatteredandmobilizedin2014,arealsouniquefeatureslocally.
• TheESCvalley,adjacenttoWSC,alsocontainsglacialtongueandgroundmorainesediments,butitlacks alargeblockatthehead,soeventhoughitsharessize andproximitywithWSC,itisunlikelytogeneratea similardebrisavalanche.
Whileweconcludethatadjacentcanyonsareunlikely toexperiencethesecatastrophicmovements,thereisthe potentialthattheWSCLitselfcouldreactivateinthe futurewithasimilartypeofmovement,socautionin thisareaisadvised.
SUPPLEMENTALMATERIAL SupplementalMaterialassociatedwiththisarticlecan befoundonlineat https://doi.org/10.2113/EEG-D-2300053 , https://www.aegweb.org/e-eg-supplements
ACKNOWLEDGMENTS FundingforthisstudywasprovidedbytheColorado GeologicalSurvey,forwhichweareverygrateful.The opinionsexpressedhereinaresolelythoseoftheauthors anddonotnecessarilyreflectthoseoftheColorado GeologicalSurvey.Wearealsogratefulfor field assistancebyBryceMeisandTroyDuron.
REFERENCES BALCO,G.,2011,Contributionsandunrealizedpotentialcontributions ofcosmogenic-nuclideexposuredatingtoglacierchronology, 1990–2010: QuaternaryScienceReviews,Vol.30,pp.3–27. doi:10.1016/j.quascirev.2010.11.003
BALESDENT,J.,1987,Theturnoverofsoilorganicfractionsestimated byradiocarbondating: ScienceoftheTotalEnvironment,Vol.62, pp.405–408.
BAUM,R.L. AND ODUM,J.K.,1996, GeologicMapofSlump-Block DepositsinPartoftheGrandMesaArea,DeltaandMesaCounties,Colorado:U.S.GeologicalSurveyOpen-FileReport96-17, 12p.
BECKER-HEIDMANN,P.;LIANG-WU,L.; AND SCHARPENSEEL,H.W.,1988, RadiocarbondatingoforganicmatterfractionsofaChineseMollisol: ZeitschriftfurPflanzenernährungundBodenkunde,Vol.151, pp.37–39.
BENSON,L.;MADOLE,R.;PHILLIPS,W.;LANDIS,G.;THOMAS,T.; AND KUBIK,P.,2004,Theprobableimportanceofsnowandsediment shieldingoncosmogenicagesofnorth-centralColoradoPinedale
andpre-Pinedalemoraines: QuaternaryScienceReviews,Vol.23, pp.193–206.
BLARD,P.H.;LAVÉ,J.;SYLVESTRE,F.;PLACZEK,C.J.;CLAUDE,C.; GALY,V.;CONDOM,T.; AND TIBARI,B.,2013,Cosmogenic 3HeproductionrateinthehightropicalAndes(3800m,20°S):Implicationsforthelocallastglacialmaximum: EarthandPlanetary ScienceLetters,Vol.377,pp.260–275.
CARROLL,C.;GILLAM,M.;RUF,J.;LOSEKE,T.; AND KIRKHAM,R.,1999, GeologicMapoftheDurangoEastQuadrangle,LaPlataCounty, Colorado:ColoradoGeologicalSurveyOpen-FileReport99-6. CERLING,T.E.,1990,Datinggeomorphologicsurfacesusingcosmogenic 3He: QuaternaryResearch,Vol.33,pp.148–156.
CERLING,T.E. AND CRAIG,H.,1994,Geomorphologyandin-situcosmogenicisotopes: AnnualReviewofEarthandPlanetarySciences,Vol.22,pp.273–317.
COE,J.A.;BAUM,R.L.;ALLSTADT,K.E.;KOCHEVAR B.F.,JR.; SCHMITT,R.G.;MORGAN,M.L.;WHITE,J.L.;STRATTON,B.T.; HAYASHI,T.A.; AND KEAN,J.W.,2016,Rock-dynamicsrevealed bylarge-scale fieldmappingandseismicsignalsatahighlymobile avalancheintheWestSaltCreekvalley,westernColorado: Geosphere,Vol.12,pp.607–631.
COLE,R.D.;BEARD,L.S.;KARLSTROM,K.E.;YOUNG,R.E.; AND BILLINGSLEY,G.H.,2011,SignificanceoftheGrandMesabasalt fieldinwesternColoradofordefiningtheearlyhistoryoftheupper ColoradoRiver.InBeard,L.S.;Karlstrom,K.E.;Young,R.E.; andBillingsley,G.H.(Editors), CREvolution2 OriginandEvolutionoftheColoradoRiverSystem,WorkshopAbstracts:U.S. GeologicalSurveyOpen-FileReport2011–1210,pp.55–61.
COLE,R.D. AND SEXTON,J.L.,1981,Pleistocenesurficialdepositsof theGrandMesaarea,Colorado.InEpis,R.C.andCallender,J.F. (Editors), WesternSlopeColorado:32ndFieldConferenceGuidebook,NewMexicoGeologicalSociety,Socorro,NM,pp.121–126.
COLE,R.D.;STORK,A.;HOOD,W.C.; AND HEIZLER,M.,2017,GeochemicalandGeochronologicalCharacterizationofGrandMesa VolcanicField,westernColorado.InKarlstrom,K.E.;Gonzales, D.A.;Zimmerer,M.J.;Heizler,M.;andUlmer-Scholle,D.S. (Editors), TheGeologyoftheOuray-SilvertonArea:68thField ConferenceGuidebook,NewMexicoGeologicalSociety,Socorro, NM,pp.103–113.
CRAIG,H. AND POREDA,R.J.,1986,Cosmogenic 3Heinterrestrial rocks:ThesummitlavasofMaui: ProceedingsoftheNational AcademyofSciencesoftheUnitedStatesofAmerica,Vol.83,pp. 1970–1974.
DONNELL,J.R.;YEEND,W.E.; AND SMITH,M.C.,1985, Preliminary GeologicMapoftheCollbranQuadrangle, MesaCounty,Colorado:U.S.GeologicalSurveyMiscellaneousFieldStudiesMap 1825.
FERGUSON,C.W.,1971,Tree-ringdatingofColoradoRiverdriftwood intheGrandCanyon.InEvans,D.D.(Editor), Hydrologyand WaterResourcesinArizonaandtheSouthwest,Vol.1:Annual MeetingProceedings,AmericanWaterResourcesAssociation, ArizonaSection,andArizonaAcademyofScience,Hydrology Section,Tempe,AZ,pp.351–366.
GOEHRING,B.M.;KURZ,M.D.;BALCO,G.;SCHAEFER,J.M.;LICCIARDI, J.; AND LIFTON,N.,2010,Areevaluationof insitu cosmogenic 3He productionrates: QuaternaryGeochronology,Vol.5,pp.410–418.
HAIL,W.J.,JR.,1972a, ReconnaissanceGeologicMapoftheHotchkissArea,DeltaandMontroseCounties,Colorado:U.S.GeologicalSurveyMiscellaneousGeologicInvestigationsMapI-698.
HAIL,W.J.,JR.,1972b, ReconnaissanceGeologicMapoftheCedaredgeArea,DeltaCounty,Colorado:U.S.GeologicalSurveyMiscellaneousGeologicInvestigationsMapI-697.
HENDERSON,J.,1923,TheglacialgeologyofGrandMesa,Colorado: TheJournalofGeology,Vol.31,pp.676–678.
HOUSTON,R.;MCCALLUM,M.; AND CHILDERS,M.,1977, Preliminary GeologicMapoftheMedicineBowQuadrangle, Wyoming:WyomingStateGeologicalSurveyOpen-FileReportOFR77-2.
IVERSON,R.M.;GEORGE,D.L.;ALLSTADT,K.;REID,M.E.;COLLINS, B.D.;VALLANCE,J.W.;SCHILLING,S.P.;GODT,J.W.;CANNON, C.M.;MAGIRL,C.S.;BAUM,R.L.;COE,J.A.;SCHULZ,W.H.; AND BOWER,J.B.,2015,Landslidemobilityandhazards:Implications ofthe2014Osodisaster: EarthandPlanetaryScienceLetters, Vol.412,pp.197–208.
KURZ,M.D.,1986, Insitu productionofterrestrialcosmogenichelium andsomeapplicationstogeochronology: GeochimicaetCosmochimicaActa,Vol.50,pp.2855–2862.
LEGG,T.E. AND BAKER,R.G.,1980,PalynologyofPinedalesediments,DevlinPark,BoulderCounty,Colorado: ArcticandAlpine Research,Vol.12,pp.319–333.
LIENKAEMPER,J.J. AND RAMSEY,C.B.,2009,OxCal:Versatiletoolfor developingpaleoearthquakechronologies Aprimer: SeismologicalResearchLetters,Vol.80,pp.431–434.
MADOLE,R.F.,1986,LakeDevlinandPinedaleglacialhistory,Front Range,Colorado: QuaternaryResearch,Vol.25,pp.43–54.
MADOLE,R.F.,1989, SurficialGeologicMapoftheMeeker30 0 3 60 0 Quadrangle,Garfield,Moffat,RioBlanco,andRouttCounties, Colorado:U.S.GeologicalSurveyMiscellaneousInvestigations SeriesMapI-1823.
MADOLE,R.F.,1991, SurficialGeologicMapoftheSteamboatSprings 30 0 3 60 0 Quadrangle,Grand,Jackson,andRouttCounties,Colorado:U.S.GeologicalSurveyMiscellaneousInvestigationsSeries MapI-1825.
MARVIN,R.F.;MEHNERT,H.H.; AND MOUNTJOY,W.M.,1966, Ageof BasaltCaponGrandMesa:U.S.GeologicalSurveyProfessional Paper550,81p.
MCCOY,K. AND SANTI,P.,2014, SummaryReport StabilityAnalysis ofUpperBlock,WestSaltCreeklandslide, MesaCounty,Colorado:ColoradoSchoolofMines,DepartmentofGeologyand GeologicalEngineering,Golden,CO,preparedforMesaCounty EngineeringDivision,15p.
MEYER,D.;TACHIKAWA,T.;ABRAMS,M.;CRIPPEN,R.;KRIEGER,T.; GESCH,D.; AND CARABAJAL,C.,2012,Summaryofthevalidationof thesecondversionoftheASTERGDEM. ISPRS-International ArchivesofthePhotogrammetry:RemoteSensingandSpatial InformationSciences,Vol.39,pp.291–293.
NELSON,A.R.;MILLINGTON,A.C.;ANDREWS,J.T.; AND NICHOLS,H., 1979,Radiocarbon-datedUpperPleistoceneglacialsequence,
FraserValley,ColoradoFrontRange: Geology,Vol.7,pp.410–414.
NOWACZYK,B. AND PAZDUR,M.F.,1990,Problemsconcerningthe 14C datingoffossildunesoils: QuaestionesGeographicae,Vol.11/12, pp.135–151.
PESSENDA,L.C.R.;GOUVEIA,S.E.M.; AND ARAVENA,R.,2001,Radiocarbondatingoftotalsoilorganicmatterandhuminfractionand itscomparisonwith 14Cagesoffossilcharcoal: Radiocarbon,Vol. 43,pp.595–601.
RETZER,J.L.,1954,Glacialadvancesandsoildevelopment,Grand Mesa,Colorado: AmericanJournalofScience,Vol.252,pp.26–37.
SOULE,J.M.,1988, Surficial-GeologicandLandslideMapofVega ReservoirandVicinity,MesaCounty,Colorado:ColoradoGeologicalSurveyOpen-FileReportOF-88-01.
STOVER,B.K. AND CANNON,S.,1987, ReportofInvestigationofthe MuddyCreekLandslideComplex:U.S.BureauofReclamation, Washington,D.C.,166p.
STREUFERT,R.;KIRKHAM,R.;SCHROEDER,T.; AND WEIDMANN,B.,2008, GeologicMapoftheDotseroQuadrangle,GarfieldandEagle Counties,Colorado:ColoradoGeologicalSurveyOpen-File ReportOF-08-14.
VARNES,D. AND SAVAGE,W.,1996, TheSlumgullionEarthFlow:A Large-ScaleNaturalLaboratory:U.S.GeologicalSurveyBulletin 2103,95p.
WANG,Z.;ZHAO,H.;DONG,G.;ZHOU,A.;LIU,J.; AND ZHANG,D., 2014,Reliabilityofradiocarbondatingonvariousfractionsof loess-soilsequenceforDadiwansectioninthewesternChinese LoessPlateau: FrontiersofEarthScience,Vol.8,pp.540–546.
WHITE,J.;ELLIS,W.;HIGGINS,J.;GAFFNEY,S.;COE,J.; AND DESSENBERGER,N.,2003,Geology,instrumentation,andmovement historyoftheDebequeCanyonLandslide,MesaCounty,westcentralColorado.InBoyer,D.D.;Santi,P.M.;andRogers,W.P. (Editors), EngineeringGeologyinColorado:Contributions, Trends,andCaseHistories:AEGSpecialPublication15andColoradoGeologicalSurveySpecialPublication55,ColoradoGeologicalSurvey,DepartmentofNaturalResources,Denver,CO, CD-ROM.
WHITE,J.L.;MORGAN,M.L.; AND BERRY,K.A.,2015, TheWestSalt CreekLandslide:ACatastrophicRockslideandRock/DebrisAvalancheinMesaCounty,Colorado:ColoradoGeologicalSurvey Bulletin55,45p.
YEEND,W.E.,1969, QuaternaryGeologyoftheGrandandBattlement MesasArea:U.S.GeologicalSurveyProfessionalPaper617,49p.
OpenAccessArticle PrecipitationPatterns,MountaintopRemoval Mining,andtheJuly2022NorthForkKentucky RiverFlood WILLIAMC.HANEBERG*
GeologicalandGeohazardsConsultant,Albuquerque,NM87120
KeyTerms: FloodRecurrence,CoalMining,MTRVF, Lidar,DigitalTerrainModeling,GIS
ABSTRACT HeavyrainovereasternKentuckyduringlateJuly 2022causedcatastrophic floodingalongtheNorth ForkKentuckyRiver.Adisproportionatenumberof the45deathsattributedtothe floodoccurredalong ornearTroublesomeCreek,atributarythathashad 25percentofitswatershedaffectedbymountaintop removalcoalminingoverthelast40years.Flood recurrenceintervalsatgagesalongtheNorthFork rangedfrom94yearsatJacksonto2yearsupstream atHazardto850–1,000yearsfarthestupstreamat Whitesburg.Therecurrenceintervalvariabilityisconsistentwiththespatialdistributionofrainfallduringthe event,whichvariedbyafactorof3overthewatershed upstreamfromJackson.Atopographicallydrivencumulative fluxmodelbaseduponacumulativeprecipitation map,alidardigitalelevationmodel,andabsorptioncoefficientscalibratedtostreamflowandprecipitationdata showthatTroublesomeCreekcontributed35percentof thecumulativedischargeoftheNorthForkattheconfluencefrom28percentoftheupstreamwatershedarea. Comparisonofthecalibratedmodeltoahypothetical modelthatassumesnomining-relatedreductionin absorptionsuggeststhemaximumincreaseincumulativestreamdischargeduringthe floodpotentially attributabletomountaintopremovalminingis22percentalongtheNorthForkatWhitesburg,28percent alongtheNorthForkatJackson,41percentalong TroublesomeCreekatitsconfluencewiththeNorth Fork,greaterthan50percentupstreamalongreaches adjacenttominedareas,and50to150percentinsmall tributariesemanatingfromminedareas.
INTRODUCTION IntenserainsduringthelastweekofJuly2022ledto deadly fl oodingandwidespreadlandslidesineastern
*Correspondingauthoremail: bill@haneberg.com
Kentucky.Asmanyas45deathswereattributedtothe flooding(onebodywasneverfound),morethan600helicopterrescuesandcountlessswift-waterrescueswereperformed,nearly9,000homeshousing22,000peoplewere destroyedordamaged,and13ofKentucky’s120counties weredeclaredFederalEmergencyManagementAgency disasterareas(DixonandShelton,2023;Klesta,2023). TheKentuckyGeologicalSurveydocumentednearly1,100 newlandslidesanddebris flowsvisiblefrompublicroads duringtheweeksafterthe flooding(Crawfordetal.,2023), andmanymorearelikelytohaveoccurredininaccessible areas.Estimatesofthecosttorebuildthedamagedhomes rangefrom$450millionto $950million,dependingonthe numberofhomesrelocatedtoless flood-proneareas(Dixon andShelton,2023).AsauthorSilasHouse(House,2023) wroteaboutanAppalachian floodfromhisyouthinapoem composedforthe2023Kentuckygubernatorialinauguration, “Allthecreeksconspiredtotheragingriver.” AsKentucky ’sstategeologistanddirectorofthe KentuckyGeologicalSurveyatthetimeofthe fl ood,I respondedtodozensofrequestsforinterviewsfrom local,national,andinternationaljournalists.Common questionsemergedfromalmostallinterviews:What makeseasternKentuckysoproneto fl ooding?Wasit a1,000-year flood?Didtheregion’slegacyofsurface coalmining,especiallythegeomorphologicallydestructivepracticeofmountaintopremovalmining,increasethe severityofthe floods?Didclimatechangeplayarole? Thispaperofferssomeanswersandsuggestionsforfuture research.
Purpose The purpose ofthispaperisthreefold.First,thepaper providesageneralsummaryoftheJuly2022rainfallevent and floodalongtheNorthForkKentuckyRiver(referred toassimplytheNorthForkthroughouttherestofthe paper).Second,thepaperexplainsthedisproportionate amountofdamageandlossoflifealongTroublesome Creek,atributaryoftheNorthFork,usingpublicly availablerainfallandairbornelidarelevationdataas inputforgeographicinformationsystem(GIS) –based volumetric fl uxmodeling.Third,thepaperevaluates
Kentucky,streamgages.
thepotentialeffectsofsurfacecoalmineson floodseverity usingdifferencesinend-memberhydrologicmodelsto simulatetheeffectsofincreasedrunofffromareasdisturbedbysurfacecoalmining.
StudyArea Groundsurfaceelevationsinthestudyarearangefrom 213to975mabovesealevel(Figure2A)andcalculated slopeanglesrangeupto69°,withremarkablylarge flat areaswherethenaturaltopographyhasbeenalteredby mountaintopremovalmining(Figure2BandC;alsosee Pericaketal.,2018;SkyTruth,2023).
ExceptforanarrowstripofsoutheasterlydippingMississippianthroughPennsylvanianbedsalongPineMountainandadjacenttothePineMountainthrust,whichmarks thesoutheasternboundaryofthestudyarea,thebedrock geologyofthestudyareaconsistsof flat-lyingMiddle PennsylvanianstrataoftheAppalachianPlateauincisedby adendriticnetworkofdeepstreamvalleysandsubsidiary unchanneledhollows(McFarlan,1943;RiceandWolcott, 1973;McDowell,1986;andNoger,1988).Quaternary alluviumhasbeenmappedalongthebottomsoflarger streamvalleys,butpublishedgeologicquadranglemaps coveringtheareaarenotdetailedenoughtoshowfeatures suchasindividualstreamterracesandalluvialfansthat mightbesignificantin floodhazardstudies(e.g.,Riceand Wolcott,1973).
Thestudyareadescribedinthispaperisthewatershed oftheNorthForkabovetheU.S.GeologicalSurveystream gageatJackson,Kentucky,includingupstreamgagesand subwatershedsatHazardandWhitesburg(Figure1).The U.S.GeologicalSurveygagenumbersforthethreeare 03280000(Jackson),03277500(Hazard),and03277300 (Whitesburg),andthosewatershedsdrainareasof2,852, 1,207,and172km2,respectively(U.S.GeologicalSurvey, 2024).Theonlymajor floodcontrolfeatureinthestudy areaisCarrCreekLake,whichisimpoundedbyadam completedin1976andliesapproximately26kmupstream fromHazard.TheweatherstationinJacksonreceivesan annualaverageof131cmofprecipitationandaJuly monthlyaverageof13cmofprecipitation(National WeatherService,2024a).Gebertetal.(1987)estimated theaverageannualrunoffintheareatobeapproximately 51cm/yr,about39percentoftheaverageannualprecipitationatJackson,duringa1951–1980studyperiod.
Figure1.MapofKentuckyshowinglocationoftheNorthForkKentuckyRiverandwatershedsabovetheWhitesburg,Hazard,andJackson,
Figure2.MapsoftheNorthForkKentuckyRiverwatershedabovetheJackson,Kentucky,streamgagebasedontheKentuckystatewidelidar DEMandotherdataascited.YellowcirclesshowthelocationsoftheJackson,Hazard,andWhitesburgstreamgages.(A)LidarDEMtopography,NorthForkKentuckyRiver,andTroublesomeCreek.(B)LidarDEMslopeangleemphasizinglarge flatareasassociatedwithmountaintop removalmining.(C)Mostrecentyearofmountaintopremovalmininginferredfromsatelliteimageanalysis(Pericaketal.,2018;SkyTruth, 2023).(D)July26–29,2022,totalprecipitationfromNCEP/EMCstageIV4by4kmgridquantitativeprecipitationestimates(Du,2011).
TheJuly2022Flood
TherainfallthatgaverisetotheJuly2022eastern Kentucky fl oodresultedfromtheintersectionof(1) moisture-ladenairbroughtnorthfromtheGulfofMexico bystronglow-levelwinds,(2)astationaryfrontover southeasternKentucky,and(3)strongupper-leveljet streamwindsnorthofthefront;thecombinationrepeatedly generatedthunderstormsthatremainedinplaceforseveral hoursatatimeoverseveraldays(DayandChen,2023; NationalWeatherService,2024a).SucheventsarecommoninthemidcontinentalUnitedStates,althoughthey occurmorecommonlyduringspringthansummer,andare
knownaswarmseasonelevatedthunderstorms(Moore etal.,2003).
IncontrasttoitsannualandJulymonthlyaveragesof 131and13cm,respectively,theweatherstationatJackson received38cmofraininJuly2022(NationalWeatherService,2024a).Mostoftheprecipitationfellduringa4-day periodinthelastweekofthemonth.AmapofJuly26–29, 2022,precipitationtotalsacrossthestudyareafrom NationalCentersforEnvironmentalPredictionEnvironmentalModelingCenter(NCEP/EMC)4-km-gridded (GRIB)stageIVprecipitationdata(Du,2011)showsthat theamountofrainfallduringthosedaysvariedconsiderablyinspaceandrangedoverafactorof4acrossthestudy
Figure3.FlooddischargehydrographsfortheNorthForkKentucky RiverattheWhitesburg,Hazard,andJackson,Kentucky,stream gagesforJuly25 –31,2022.Datasource:U.S.GeologicalSurvey (2024).
area(Figure2D).Theheaviestrainfallwasconcentratedin anareajustoutsideoftheNorthForkwatershedandisnot showninFigure2D.July26–29precipitationtotals withintheNorthForkwatershed thefocusofthis paper rangedfromjustover8cminthefarsouthern portiontonearly30cmoverportionsoftheTroublesome Creekwatershed,theheadwatersoftheWhitesburgwatershed,eastofJackson,andalongtheNorthForkbetween JacksonandHazard.Historicrainfallrecordswerebroken atseveralweatherstationsinthearea,andtherecurrence intervalforthe4-dayrainfalltotalexceeded1,000years (NationalWeatherService,2024a).
Figure3isasetof flooddischargehydrographsplottedusingdatafromtheU.S.GeologicalSurvey(2024) fromtheJackson,Hazard,andWhitesburggagesforthe periodofJuly25–31,2022.TheWhitesburggagewas damagedduringthe floodbutrecordeddataintermittentlyuptoandpastthepeakdischarge;itshydrograph endsmiddayonJuly29becauseanewstage-discharge ratingcurveisbeingdevelopedforthesite.Althoughit containsthesmallestofthethreepeaks,theWhitesburg hydrographisremarkablebecauseits2022 floodpeak stageof6.64manddischargeof278m3/srepresent increasesof48and27percent,respectively,overthepreviouslyrecordedpeakannualstageanddischargerecordsof 4.48mand219m3/s,respectively,in1957(theyearthe gagebeganoperation).ThestageanddischargeatWhitesburghadbeenaslowas0.5mand0.8m3/s,respectively, aslateasJuly26.Threeotherthingsarenotableaboutthe setofhydrographs:First,theHazard floodpeakappears disproportionatelysmallcomparedtotheareaofitswatershedandthoseoftheWhitesburgandJacksongages.Second,the floodpeakatHazardlagsabout13hoursafterit peakedatWhitesburg;however,thepeakatJackson occurredatvirtuallythesametimeasthepeakatHazard. Third,thesimpleshapeoftheWhitesburghydrographsuggeststhatitrepresentsasingleprecipitationpulseonJuly
28,whereastheshouldersontherisinglimbsoftheHazard andtoalesserextent,theJackson hydrographmay representresponsestoatleasttwopulsesinprecipitationor flowfromtributaries.TheJacksonhydrographalsohasa shoulderonitsfallinglimbthatmayrepresentresponseto athirdsuchpulse.
DayandChen(2023)calculatedrecurrenceinterval estimatesforthreegageswithinwatershedsdrainedby eachofthethreeforksoftheKentuckyRiver,coincidentallyincludingtheWhitesburggagediscussedinthis paper.TheyconcludedthatthetwogageswithintheSouth ForkandMiddleForkdrainagesrecordedJuly27–28, 2022, floodswithapproximately1-yearrecurrenceintervals,whereastheWhitesburggagealongtheNorthFork recordedaJuly27–28 floodwitha1,000-yearrecurrence interval.DayandChen(2023)attributedtheremarkabledifferenceinrecurrenceintervalstoacombination ofgreaterantecedentrainfall,steepertopography,and largerproportionofbarrengroundastheresultofmountaintopremovalmininginthewatershedaboveWhitesburg (58.5percentforthewatershedaboveWhitesburgonthe NorthForkversus26.4and2.7percentforthelessheavily minedMiddleandSouthForkwatersheds).DayandChen (2023)didnotlistasourcefortheirlandcovervalues.
Haneberg(2023)plottedpeakannualdischargevalues overtimeandcalculatedrecurrenceintervalsforthe July2022 floodasrecordedattheWhitesburg,Hazard, andJacksongages.Thepeakannualdischargevalues showedageneraldecreaseovertheperiodsofrecord, withthe2022dischargesatWhitesburgandJackson assignificantexceptionstothetrend.Haneberg(2023) calculatedrecurrenceintervalsof851,2,and94years, respectively,fortheWhitesburg,Hazard,andJackson gages.Inaregionalstudyofpeakstream fl owtrends, LevinandHoltschlag(2022)reportedeithernomonotonictrendordecreasesinpeakstreamflowforselected locationsineasternKentucky,attributingthedecreasesto largesurfacewaterimpoundments.
Christianetal.(2023)publishedamapshowingboth theapproximatelocationsofdeathsattributedtothe2022 easternKentucky floodsandtheareasdisturbedbymountaintopremovalmining.Theyshowedthat38.9percentof thefatalities knownatthetimeoftheiranalysisoccurred within100mofTroublesomeCreekand47.2percent occurredwithin800mofTroublesomeCreek.Overall, 69.4percentoftheknownfatalitiesoccurredwithin0.8 kmoffeaturesintheU.S.GeologicalSurveyNational HydrographyDataset.AlthoughChristianetal.(2023) wrotethattheirmapcouldnotprovemountaintopremoval miningwasresponsiblefordeathsassociatedwiththeJuly 2022 floods,theydidconcludethatlivingnearmountaintopremovalminingsites “ couldincreaseriskof fl oodrelatedinjuryordeath. ”
MountaintopRemovalMiningandFlooding Mountaintopremovalmining,sometimesreferredto morecompletelyasmountaintopremovalandvalley fill miningorsimplyMTRVFmining,isamethodthathas beenwidelyadoptedinCentralAppalachiainr ecent decades.Inmountaintopremovalmining,coalseams areexposedbyblastingandremovingmountaintops abovethecoalandplacingtheresultingdebris(knownas spoil)inadjacentvalleys,resultinginpermanentandminimallyreclaimablelandscapealteration(e.g.,Shobeetal., 2024).Althoughthemountaintopremovaloffersaneconomicalwaytominecoalifexternalitiessuchasenvironmentalandhumanhealthconsequencesarenotconsidered, themethodhasbeenassociatedwithhydrologicconsequencessuchasincreaseddownstream flooding;erosion, sliding,andchemicalweatheringofminespoil;water qualitydegradation(WileyandBrogan,2003;Phillips, 2004;Ferrarietal.,2009;Palmeretal.,2010;McCormick andEshleman,2011;Zégreetal.,2014;MillerandZégre, 2014,2016;andReedandKite,2020);andvariousserious humanhealthproblems(Christianetal.,2023,andreferencestherein).
Theresultsofpublishedempiricalstudiesoftheeffects ofmountaintopremovalminingondownstream flooding havebeenequivocal.Borchersetal.(1991)compared hydrologiccharacteristicsofminedandunminedwatershedsinWestVirginia,includingareasofmountaintop removal,andconcludedthatpeakstreamdischargesfrom theminedwatershedswerelessthanthosefromthe unminedwatersheds;however,pH,dissolvedmanganese,andsuspendedsedimentloadswerehigherin streamsdrainingminedwatersheds.WileyandBrogan (2003)inferredstreampeakdischargeduringa2-day rainfalleventoversixWestVirginiawatersheds,three ofwhichhadbeenaffectedbymountaintopremoval miningandthreeofwhichhadnot.Theycalculated floodrecurrenceintervalsrangingfromlessthan2yearsto morethan100yearsandattributedtheirresultstothespatialvariabilityofrainfall,whichrangedoverafactorof5 acrosstheirstudyareaduringtherainfallevent.Boththe twolargestandthesmallestrecurrenceintervalswerefrom thethreewatershedsaffectedbymountaintopremoval mining;thethreewatershedsnotaffectedbymountaintop removalminingproducedintermediateresults.Inareview ofprimarilyempiricalwork,MillerandZégre(2014)concludedthatthelimitednumberofrelevantmountaintop removalminingstudiespublishedatthetimeshowed “significantvariabilityinhydrologicresponse” torainfallin watershedsaffectedbymountaintopremovalmining. Zégreetal.(2014)wrotethattheiranalysisoflong-term trendsfromaWestVirginiawatershedshowed “significant decreasesinmaximumstreamflowandvariability,and increasesinbase-flowratioattributedtovalley fillsand deepminedrainage.” MillerandZégre(2016)suggested
thatvalley fillsandundergroundminescouldmitigate stormflowpeaksbystoringandgraduallyreleasingwater inwatershedsaffectedbymountaintopremovalmining. Nippgenetal.(2017)showedthatminedwatershedsdeliveredmorewater(butalsomorehighlyalkalineandsaline water)throughsustainedbaseflowduringdryperiodsand significantlylesswaterinresponsetostormsthanunmined watersheds.ReedandKite(2020)documentedsignificant gullyandlandslidedevelopmentonsupposedlystablevalley fillslopesineasternKentuckyandcentralWestVirginia. Otherauthorshaveusedhydrologicmodelstoevaluatethecontributionofmountaintopremovalminingto flooding.Phillips(2004)usedrelativerunoffand flow detentioncalculationsbasedonvaluesfromapreviously studiedmountaintopremoval fill location(theStarfire mine) withinthestudyareaandtypicalforestedKentuckylandscapestoinferthatmountaintopremovalmining waslikely,butnotguaranteed,toincrease floodpotential; hefurtheremphasizedthatlocalsiteconditionscouldproducearangeofresults(potentiallyincludingreduced flood potential).Phillips(2004)alsoperformedageostatistical analysisofradar-quantifiedprecipitationpatternsfromtwo stormsandconcludeditwasunlikelythatnearbywatershedswouldreceivesubstantiallydifferentamountsof flood-producingrainfall(cf.WileyandBrogan,2003).Ferrarietal.(2009)andMcCormickandEshleman(2011) concludedthatevenwhenreclaimed,theresponseofsurface-minedareasismorelikethatofurbanizedareasthan deforestedbutotherwiseunmodifiedareasbecausesoil compactionduringreclamationreducesinfiltrationcapacity andincreasesstormflow.Inparticular,Ferrarietal.(2009) concludedthat floodmagnitudesincreaseataratelinearly proportionaltotheamountofareadisturbedbyminingand thatthisrateincreasesforlargerrecurrenceintervals.WilliamsonandBarton(2020)usedacombinationof field hydraulicconductivitymeasurementsandmodelingto showthatminedareasreclaimedusingamodernforestrydrivenapproachrespondedtorainfallinamannermore likeunminedareasthanconventionallyreclaimedareasbut thatallreclaimedsoilstheystudiedwerethinnerandless capableofstoringwaterthannaturalsoilsinunminedareas.
DATAANDMETHODS Themapsdescribedinthispaperwereproducedprimarilyusingtheopen-sourcesoftwareQGIS,includingGRASS (QGIS.org,2024).Theopen-sourceWhiteboxToolsgeomorphologicanalysisplug-inwasadditionallyusedfor volumetric fluxandotherspecializedcalculations(Lindsay, 2016,2023).
Thedigitalelevationmodel(DEM)usedasthebasis forthehydrologicmodelingdescribedinthispaper wasdevelopedbyaggregatingthepubliclyavailable KyFromAbovestatewidelidarDEM(Commonwealth
ofKentucky,2024a)from5ft(1.5m)to25ft(7.6m) rastersandclippingittothestudyareaboundaries.Itis basedonphase1KyFromAbovecoveragerepresenting pre-2022 floodconditions.TheaggregatedDEMreduces filesizeandcomputingtimewhileretainingacceptable landformresolutionacrosslargeareasformanykindsof projects(e.g.,terracedvalley fillslopesandothermountaintopremovalmininglandscapeartifactsremainvisible intheaggregatedDEM).Evenatitsreducedresolution, theaggregatedDEMcomprisesnearly49millionnonnull rasters.BecausesubsequentGIScalculationswerebased ontheaggregatedversionofthestatewideDEM,theprojectdatumandcoordinatesystemwerethesameasthe originalstatewideDEM:NAD83andKentuckyState PlaneCoordinateSystem(singlezone)inU.S.surveyfeet (EPSG3089)withdistancesconvertedtometricforpublication.GIS filesusingotherdatumsorprojectionswere reprojectedtoEPSG3089withinQGISasnecessary.EPSG standsforEuropeanPetroleumSurveyGroup,whichpublishesawidelyuseddatabaseofmapcoordinatesystem informationwidelyusedintheGIScommunity.
ThepathsoftheNorthForkandTroublesomeCreek wereobtainedfromastatewide1:24,000NationalHydrologicDatasetbluelinestreamcoverage(Commonwealthof Kentucky,2024b).Watershedcatchmentareasaboveeach ofthethreestreamgagesweredownloadedviathenational U.S.GeologicalSurveyHydroNetworked-LinkedIndex webapplicationprogramminginterfacedescribedby Blodgett(2023).AfourthwatershedforTroublesome CreekaboveitsconfluencewiththeNorthFork,whichis notgaged,wasextractedforthisprojectusingther.watershedandr.water.outletfunctionsinGRASS.Thewatershedsarenested,whichistosaythattheJacksonwatershed incorporatestheHazard,Whitesburg,andTroublesome Creekwatersheds;likewise,theHazardwatershedincludes theWhitesburgwatershed.
PrecipitationinputwasobtainedasNCEP/EMCGRIB stageIVprecipitationdatashowing24-hourtotalsforthe4 daysofmostsignificantrainfallovertheNorthForkwatershedaboveJackson(July26–29,2022).Dailytotalprecipitationmapswereaddedtogethertocalculatea4-daytotal precipitationmap(Figure2D)andthenreprojectedand reducedtoa7.6-mrastersizeusingbicubicinterpolation viatheGDALwarpfunctioninQGIS.Resizingtheraster cellsisnecessarybecausethe fluxroutingfunctionusedin thisanalysisrequiresallinputmapstohaveidentical dimensionsandrastercellsizes.Thealternative,reducing theprecipitationmapcellsize,wouldhavebeentoaggregatetheDEMupwardto4-kmcells,whichwouldhave greatlydiminisheditstopographic fidelityandusefulness forthisanalysis.Borgaetal.(2022)raisedconcernsabout theuseofunprocessedradarprecipitationdataforhydrologicmodeling;however,Carpenteretal.(2001)concludedthatappropriatelyprocessedradardatacan
produceresultscomparabletothoseobtainedfromraingage observations.NCEP/EMCstageIVdataareproducedusing manualqualitychecksandintegrateavailableraingagedata (Du,2011).
The2022NorthFork floodwassimulatedandsummarizedusingavolumetric fluxapproachthatallowsfor moreexplicitincorporationofspatialvariabilitythanthe relativerunoffand flowdetentioncalculationsperformed byPhillips(2004)butrequireslessparameterization thanthedistributeddynamic fl owroutingmodelsused byauthorssuchasFerrarietal.(2009)andWilliamson andBarton(2020).Thissimplifi edapproachalsohas theadvantageofsummarizingtheaggregateeffectsof aspatiallyandtemporallycomplicatedeventinasingle mapofcumulativevalues.
TheprojectDEMwaspreprocessedusingtheBreachDepressionsLeastCostfunctionwithoptionalsingle-cell pit fillingintheWhiteboxToolsQGISplug-in(Lindsay, 2023),whichcreatesaDEMwithoutartifi cialclosed depressions.CloseddepressionsinaDEMwilldisruptcalculated flowacrosstopographicsurfaces,anditisstandard practicetoremovethemfromDEMsbeforehydrologic modeling.
Avolumetric fluxmapwasthenproducedusingthe DInfMassFluxfunctioninWhiteboxTools(Lindsay,2023). Forconstantdensity,conservationofmasscanbemoresimply writtenintermsofvolumetoarriveatthefollowing:
Vout ¼ EL A þ Vin ðÞ (1)
InEq.1, Vout isthevolumeofwater flowingoutofa rastercell, L isaloadingtermrepresentingwateradded tothecell, A isanabsorptiontermwiththesameunitas L, Vin isthevolume flowingdownslopeintothecell,and 0 # E # 1isanefficiencyfactorrepresentingtheproportionalabilityoftherastertotransmitvolume.Inthis paper, L istheprecipitationfallingontoeachrastercell and A representsacombinationofprocesses,suchascanopyinterception,evapotranspiration,andshallowinfiltration,thatremovewaterfromthecell.The A termisnot restrictedtophysicalabsorptionofthewateralone. E and A aresomewhatredundantbecausetheybothreducethe amountofmaterialleavingthecell,buttheydosoindifferentways.Forsimplicity,asdiscussedlater,thispaper assumesthat E ¼ 1anduses A toaccountforanyreduction in flowoutofeachcell.The Vin and Vout termsrepresent water flowingintoandoutofeachrastercelldownthe topographicslopedefinedbytheDEM,andthewater flowingoutofeachrasterisapportionedamongmultiple downslopecellsusingaD-infinityalgorithm(e.g.,Gruber andPeckham,2009;Lindsay,2023).
Forthesimplecaseofonlytwolanduseclasses in thispaper,minedandunmined withpotentiallydifferentabsorptionvalues,therelationshipbetweenthetwo
Figure4.MapsshowingtheeffectofinterpolatingandreprojectingJuly26–29totalprecipitationdata.(A)OriginalNCEP/EMCGRIBstageIV data.(B)Originalmapreprojectedtotheprojectcoordinatesystem(EPSG3089)andinterpolatedtothe7.6-mrastercellsize.
absorptionvaluesisrelatedtothewatershedscaleinflow andoutflowbythefollowingweightedlinearcombination:
Vout Vin ¼ Pmined Amined þ Punmined Aunmined (2)
InEq.2,the P valuesrepresenttheproportionofeach landuseclass,the A valuesrepresenttheabsorptionvalues foreachlanduseclass,andthe V valuesrepresentthe flow intoandoutoftheentirestudyarea(inthiscase,takento bethewatershedoftheNorthForkabovetheJackson gage).Theinflow, Vin,istheprecipitationintegratedover thestudyarea,and Vout istheintegralofastreamdischarge hydrographattheoutletfromthestudyarea.
RESULTS ReprojectionandinterpolationoftheJuly26–29precipitationmapproducedasmoothed7.6-mrasterversion oftheoriginal4-kmrastermapwithminimaandmaximathatagreewellinbothlocationandmagnitude(Figure4).The4-dayprecipitationtotalsvaryconsiderably acrossthestudyarea,rangingfrom9.2to29.6cm(Table 1).AbouthalfoftheHazardwatershedreceivedlowerthan-average4-daytotalprecipitation,whereasareas alongtheNorthForknorthoftheHazardgagereceived thelargestamountsof4-daytotalprecipitation.Muchof thecourseofTroublesomeCreekandthenorthernhalf oftheWhitesburgwatershedfallwithinareasofaboveaverage4-daytotalprecipitation,whereasthesouthern
halfoftheWhitesburgwatershedfallswithinanareaof lower-than-average4-daytotalprecipitation.
Theinterpolated4-dayprecipitationmap(Figure4B) wasconvertedfromcentimeterstometersandmultiplied bytherasterarea,7.62 m2,tocalculatethevolumeofwater fallingonto eachrastercellinunitsofcubicmeters.The resultwastheloadingmapforthevolume fluxcalculations.
The4-dayaveragetotalprecipitationovertheentire studyareawas20.4 6 4.5cm(Table1).Multiplication oftheaverageprecipitationbytheareaoftheNorth ForkwatershedaboveJacksonyieldeda4-dayinflowof 108.76 m3.NumericalintegrationoftheJacksonstream gagehydrographshowninFigure3yieldeda4-dayoutflowvalueof108.45 m3.Divisionofthecumulative1985–2022minedareashowninFigure2CbytheJacksonwatershedareayieldedaminedproportionof17percent.SubstitutedintoEq.2,thosevaluesyieldedthefollowing:
Eq.3allowsaninfinitenumberofpossible Amined and Aunmined combinations,comprisingthesolidbluelinein Figure5.Evenifminedareasabsorballprecipitation fallingontothem(Amined ¼ 1),theirproportionalareais smallenoughthattheunminedareaswouldberequired tohaveanaverageabsorptioncoefficientof Aunmined ¼ 0.4 toaccountforacalculated fluxratioof Vout/Vin ¼ 0.51.At
Parameter
Table1. PrecipitationandstreamdischargefortheJuly26–29 flood,NorthForkKentuckyRiverandTroublesomeCreek.
StreamGageand/orWatershedOutlet
1 Mean 6 standarddeviation.
2 Mean 6 standarddeviation(minimum,maximum).
3 Haneberg(2023).
theotherendoftherange,avalueof Aunmined ¼ 0.61 wouldbesufficienttoaccountforthecalculated Vin/Vout ratioiftheminedlandshadnoabsorptioncapacity(i.e., Amined ¼ 0).Assumingthatreclaimedminelands,regardlessofthemethodsemployedortimesincereclamation, haveabsorptioncoefficientslessthanareasthathavenot beenmined,thevalidrangeof A combinationscanbe restrictedtothesolidportionsofthebluelinebeneath thegold A mined ¼ A unmined lineinFigure5.Thisplaces aheuristiclimitontheplausiblerangeofabsorption values.Therecouldbesomeunminedareaswithsmall absorptioncoeffi cients,forexample,areascoveredby buildings,roads,orparkinglots;however,theireffects
Figure5.Plotshowingtheplausiblerangeofvalidabsorptioncoefficientpairs(solidblueline)basedonwatershed-scaleprecipitation andoutflowvaluesfortheJuly26–29storminEq.3.
arealreadyincorporatedintothewatershed-widevolume calculationinEq.3.
Thispaperusestwoend-memberscenariosdeveloped toevaluatethemaximumpossibleinfluenceofsurface minesontheJuly2022 flood:(1)aminedendmemberin whichminedareashavenoabsorptioncapacity(Amined ¼ 0)and,toaccountfortheknownwatershed-wide Vin/Vout ratio, Aunmined ¼ 0.61,and(2)aunminedendmemberin whichtheentirelandscapehasanabsorptioncoefficientof 0.61basedontheunminedvaluecalculatedintheprevious paragraph.Thiscouldapplytoeitheranentirestudyarea thathadnotbeenminedoroneinwhichreclamationpracticesresultedinrestorationofminedareastothesamestate asunminedareas.TheminedscenariodoesnotrepresentactualvaluesduringtheJuly2022storm;instead, itisusedtoestimatethemaximumpossibleeffectsof surfaceminingduringthestormbyincorporatinginto themodelthemostdifferentplausiblepairofabsorptionvalues( A unmined ¼ 0.61and A mined ¼ 0).
Fortheunminedscenario,theabsorptionmapwassetto 0.61timestheloadingmapfortheentirestudyarea.Forthe minedscenario,theabsorptionmapwassetto0.61times theloadingmapforareaswithnopreviousminingand0for allminedareas,asshowninFigure2C,regardlessofage. TheefficiencycoefficientinEq.1wassetto E ¼ 1forthis paperbecausetheabsorptioncoefficientsalreadyplacea limitontheamountofwater flowingoutofeachcell.
Resultsofthevolume fluxcalculationsareshownin Figure6,includingthreemagnifiedareastoillustratethe concentrationof flowintotheNorthForkandTroublesomeCreek,andaresummarizedforkeylocationsin Table1.TheTable1dischargevalueswereobtainedby manuallyselectingrastercellsclosetothestreamgage locationsor,forTroublesomeCreek,justupstreamfromits confluencewiththeNorthFork.Thegageandthemined scenariomodelcumulative fl uxresultsfortheJackson gageagreebecausetheabsorptioncoeffi cientsforthe minedscenariowerecalculatedusingthegagevalue.
Figure6.Mapsshowinglog10 cumulative floodwatervolumecalculatedusingJuly26–29totalprecipitation,alidarDEM,andadownslope flux algorithmasdescribedinthetext.Thecolored floodwatervolumescalebarisidenticalforallfourpanels.(A)NorthForkwatershedabovethe Jacksonstreamgage.(B)DetailshowingaportionoftheTroublesomeCreekwatershedaboveJackson.(C)DetailshowingaportionoftheNorth ForkwatershedaboveJackson.(D)DetailshowingaportionoftheNorthForkwatershedaboveWhitesburg.
Thegageandmodeledcumulative fluxincreasedownstreamasafunctionofwatershedareaandinqualitative agreementwiththe floodhydrographsinFigure3.Figure7 showspointvaluesandbest-fitcurvesoftheform Q ¼ kAc forboththethreegagesandthemodelresults(minedand unminedscenarios).Inthebest-fitcurves, Q isthecumulative flux, k isthespecific flux(i.e.,thecumulative fluxpredictedperunitareaofthewatershed),and c isapowerlaw coefficientrepresentingthebehaviorofthewatershed.The gagevaluesfollowawell-developedpowerlawrelationship oftheform c ¼ 1.89,whereasthemodelvaluesfollow nearlylinearrelationships,with c ¼ 1.07forthemined
scenarioand c ¼ 1.06fortheunminedscenario.Different stormswilllikelyproducedifferentresults.Thevariable Q iscommonlytakentobeaninstantaneousvaluesuchasthe peakannualdischarge(e.g.,Galster,2007)butinthispaper isthecumulative flux(i.e.,dischargeintegratedovertime). TheminedmodelandgagevaluesagreefortheJackson gagebecausethosearethevaluesusedtocalculatethe absorptioncoefficientsbasedonaweightedcombinationof minedandunminedareas.Themodelssignificantlyoverpredictthegage fluxatHazardandslightlyoverpredict thegage fl uxatWhitesburg.TroublesomeCreekisnot gaged,soitisimpossibletocomparethemodelresults
Figure7.Comparisonofgageandmodelminedscenariocumulative fluxandwatershedareasforthelateJuly2022 flood.
toanobservedvalue,butthemodelsigni fi cantlyoverpredictsthebest- fi tgagecurve.TroublesomeCreek contributes10 7.90 /10 8.35 or35percentofthemined model fl uxintheNorthForkjustdownstreamfromthe confluencewhiledrainingonly28percentofthearea abovetheconfluencebecausetheTroublesomeCreek watershedreceivedmorerainthantherestofthewatershed abovetheconfluence.
Figure8illustratesthemaximumpossibledifference in fluxattributabletothemodeledsurfacemineimpacts, calculatedbydividingthedifferencebetweenthemined andtheunminedcumulative fluxmapsbytheunmined cumulative fluxmap.Themaximumpossible flowincreases rangefrom21percentfortheNorthForkattheHazard gage,whichdrainsawatershedwithboththelowestproportionofitsareaaffectedbysurfaceminingandthesmallest 4-dayprecipitationvalue,to41percentfortheTroublesome Creekwatershed,whichdrainsawatershedwithboththe highestproportionofitsareaaffectedbysurfaceminingand thehighest4-dayprecipitation.AsshowninFigure7,especiallyinthemagnifiedpanels,thedifferencesbetweenthe minedandtheunminedscenariosarelargewithinand immediatelyadjacenttominedareas,inmanyinstances greaterthan100percent,butfalloffwithdistancefromthe minedareas.Manytributarieshavemaximumpossible increasesapproachingorevenexceeding100percent attheircon fl uenceswiththeNorthForkandTroublesomeCreek.
DISCUSSION Muchofthevariabilityingaged flooddischargesand theconcentrationofdeathsalongTroublesomeCreek
duringtheJuly2022 floodiscorrelatedwiththespatial variabilityofprecipitationduringthestorm.Evenin theirGRIBformat(Figure4),theavailableprecipitation datashowsignificantlocation-to-locationvariationsin cumulativeprecipitation,whichrangedoverafactorof 3acrossthestudyareaduringthelastweekofJuly2022. InananalysisoftheeffectsofmountaintopremovalminingonAppalachian flooding,Phillips(2004)suggested thatnearbywatershedswouldnotbeexpectedtoreceive substantiallydifferentamountsof flood-producingrainfall. Theimplicationwasthatsignificantlydifferent flooddischargesfromnearbywatershedsduringasingleevent couldbeattributedtotheeffectsofmining,notspatially variablerainfall.However,thatconclusionappliedto watershedsseparatedatmostbyafewkilometers.The watershedoftheNorthForkaboveJacksonextends about76kmalongaNW-SEaxisandabout50kmalong aSW-NEaxis,comprising2,852km2.Theresultsdescribed inthisstudyaremorealongthelinesofthosereportedby WileyandBrogan(2003),whoobservedthatprecipitation overawatershedofasimilarsizetothatoftheNorthFork aboveJacksonrangedoverafactorof5andrecurrence intervalsforsixwatershedsrangedfromlessthan2years tomorethan100yearsduringasinglestorm.Thereare noknownpublishedattributionstudiesassessingthepossiblein fl uenceofclimatechangeontheseverityofthe July2022 fl ood.
Themostnotableofthethreestreamgagerecords fromtheNorthForkduringtheJuly2022 floodistheone fromWhitesburg,whichrecordeda floodwitharecurrence intervalatornear1,000years.Aboutone-thirdofthe watershedabovetheWhitesburggagereceivedmorethan 20cmofrainovertheJuly26–29period,andtheareaof heaviestraincoincidedwiththeareaofmostextensivesurfaceminingnorthoftheNorthFork.Comparedtotherest ofthestudyarea,theWhitesburgwatershedisnotunique intermsoftheproportionmined,slopesteepness,orrainfallreceivedduringtheJuly2022event(Table1),yetits calculated floodrecurrenceintervalof851years(Haneberg,2023)to1,000years(DayandChen,2023)isexceptionalcomparedtothoseforHazard(2years)andJackson (94years).Themostlikelyexplanationforthelarge Whitesburg floodrecurrenceintervalis,allotherthings beingequal,thatasmallwatershedislesslikelythana largewatershedtoreceiveanextremelargeamountofrainfalloverarelativelyshortperiodofrecord(47yearsfor theWhitesburggage).
Giventheexceptionallylargerecurrenceintervalfor the floodatWhitesburg,itisalsonotablethatthe flood atthenextgagedownstream,atHazard,hadanestimated recurrenceintervalofonly2years(Haneberg,2023).This canalsobeunderstoodlargelyintermsofprecipitationpatterns.TheHazardwatershed(includingtheWhitesburg watershedupstream)hadthelowestaverageprecipitation
Figure8.Mapsshowingtheinferredmaximumeffectofmountaintopremovalminingoncumulative floodwatervolumeduringthelateJuly2022 flood,expressedasthedifferenceincumulative floodwatervolumebetweentheminedandtheunminedscenariosdescribedinthetext.Thecolored floodwatervolumescalebarisidenticalforallfourpanels.(A)NorthForkwatershedabovetheJacksonstreamgage.(B)Detailshowinga portionoftheTroublesomeCreekwatershedaboveJackson.(C)DetailshowingaportionoftheNorthForkwatershedaboveJackson.(D)Detail showingaportionoftheNorthForkwatershedaboveWhitesburg.
ofanyofthefourwatershedsincludedinthispaper.The precipitationmap(Figure4)furthershowsthatasubstantialportionofthewatershedreceivedlessprecipitation thananyotherpartofthestudyareaduringthestorm.
Thelargestamountofrainfallinthestudyareaduring theJuly2022storm,slightlymorethan29cm,fellalong theNorthForkbetweenHazardandJackson(Figure4). Secondarily,muchofthecourseofTroublesomeCreek alignswithaswathofabove-averageprecipitation.The TroublesomeCreekwatershedreceivedthelargestaverage rainfall(22.6cm)andcontainsthelargestproportionof areaaffectedbysurfacemining(25percent)ofthefour
watershedsanalyzedinthispaper.Thelargeamountof rainfallacrosstheJacksonwatershedbelowHazard, includingtheTroublesomeCreeksubwatershedthatcontributedadisproportionatelylargeamountofthemodeled flowrelativetoitsarea,likelycontributedtothesignificant 94-yearrecurrenceintervalestimatedforthe floodat Jackson(includinganymitigatingeffectsoftheCarr CreekreservoiralongatributarythatjoinstheNorth ForkbetweenHazardandJackson).
Theabsorptioncoefficientrangeof0.51 # Aunmined # 0.61estimatedfromavailableprecipitationandstream gagedataisconsistentwiththenationwiderunoffmap
byGebertetal.(1987),whichshowsaverageannual runoffintheprojectareaofapproximately51cm/yrduringa1951–1980studyperiod.AverageannualprecipitationattheweatherstationinJacksonis131cm/yr (NationalWeatherService,2024b).Thoseaveragerunoffandprecipitationvaluessuggestalandscape-wide absorptioncoefficientontheorderof1 51/131 ¼ 0.61, whichisidenticaltotheunminedvalueusedinthispaper forthelateJuly2022storm.Theexactagreementmaybe coincidental;however,obtainingasimilarvaluefroman independentstudyconductedwhenasignificantlysmaller amountoflandhadbeendisturbedbymountaintop removalminingsuggeststhat A unmined ¼ 0.61isareasonable fi rstapproximationfortheunminedareasin thisstudyandforthelateJuly2022storm.Different stormsmayyielddifferentresults.
ThepowerlawexponentsinthegageandmodelbestfitcurvesinFigure7differsignificantly.Galster(2007) offeredtheinterpretationthatallotherthingsbeing equal,thepowerlawcoefficientshouldbe »1(i.e.,alinearrelationshipbetweenwatershedareaanddischarge becauseofmassconservation).Galster(2007)wrotethata valueof »1 “seemstobethemaximumpossibleinnatural settings” andthatvalues . 1suggestthateithertheupper reachesofawatershedareinefficientindeliveringprecipitationasrunofforthatdownstreamreachesgeneratedisproportionatelymorerunoffthanupstreamreaches.In eithercase,thedifferencecouldbetheresultofnatural factorsorhumanfactors.Galsteretal.(2006)discusseda heavilyurbanizedwatershedinwhichthepowerlaw coefficientapproached2,ostensiblybecauseanincrease inimpermeableurbansurfacescontributeddisproportionatelymorerunoffthanthelessdevelopedheadwaters.
Thebest-fitpowerlawcoefficientof c ¼ 1.89forthe gagedatainthisstudyisclosetovaluesof »2thatGalsteretal.(2006)attributedtothedisruptiveeffectsof urbanization.Moreover,bothFerrarietal.(2009)and McCormickandEshleman(2011)concludedthatextensivelyminedwatershedsbehavelikeurbanwatersheds withlargeamountsofimpervioussurfaces.However,it isnotclearwhethertheobserved c ¼ 1.89inthisstudy isattributabletosurfaceminingoristheresultofother factorsnotincludedinthemodels.Thereasonisthat boththeminedandtheunminedscenariomodelsproducednearlylinearcurvesyielding c valuesof »1.Given thedetailedmapsofareasaffectedbysurfacemining, fromwhichtheminedandunminedabsorptioncoefficient mapsweredeveloped,andprecipitationvariabilityusedin themodels,themodelresultsshouldhaveaccuratelyincorporatedminingimpacts.
Ofthethreegages,theHazardgagedepartsthemost fromthestraight-linemodelpredictions.AlargeproportionoftheHazardwatershedsouthoftheNorthFork appearstohavebeenlessheavilyminedandreceivedless
precipitationthanotherportionsofthestudyarea(Figure 2CandD).ItispossiblethatthecombinationoflessminingdisturbanceandlessintenserainfallduringtheJuly 2022stormincreasedtheactualabsorptioncapacityofthe landtoadegreenotincorporatedinthemodels.UsingvaluesfromTable1fortheHazardwatershedexclusiveofthe Whitesburgwatershed,Eq.2requiresvaluesof Amined ¼ Aunmined ¼ 0.71or Amined ¼ 0and Aunmined ¼ 0.80forthere tobenooverpredictionoftheHazardgagecumulative flux.Thosevaluesarehighbutmightoccurundertheright conditions.Understandingtheeffectsofprecipitationintensityanddurationonabsorptioncoefficientvaluesmaylead tobettermodelresults.
Ininterpretingthephysicalsignificanceoftheabsorptioncoefficientsandtheirrelationtomodelresults,itis importanttorememberthatthecoefficientsmathematically representallprocessesthathinderorotherwisepreventthe flowofwateroutofarastercell,notjustphysicalabsorptionofrainfallbysoilorcolluvium.Thoseotherprocesses mightincludecanopyinterception,evapotranspiration, temporarystorageofwaterbyrunoffretentionfeaturesin operatingorreclaimedmines,bufferingofpeakstormflow bytransientstorageofwaterwithinvalley fills,ordeep infiltrationintoundergroundmines.Borchersetal.(1991), WileyandBrogan(2003),MillerandZégre(2014),and Nippgenetal.(2017)publishedorsummarizedresults showingthatsomevalley fillsassociatedwithmountaintop removalminingmayactasbuffersthatreducestormflow duringwetperiodsandenhancebaseflowtostreamsduring dryperiods.MillerandZégre(2016)concludedthatexistingundergroundmines,whichwerenotconsideredinthis paper,mayplayasignificantroleinbufferingstormflow. Minereclamationmayhaverestoredsomeabsorption capacity,although field-basedstudiessuchasWilliamson andBarton(2020)suggestthatevenareasreclaimedusing modernbestpracticeshavediminishedproperties.Ofthose studies,itappearsthatonlyWileyandBrogan(2003) includeresultsfromeventsasextremeas100-year flood discharges,andnoneconsiderconditionsasextremeasan 851-or1,000-year flood.
Accuratemapsdistinguishingzonesofmountaintop removalfromzonesofvalley fill notjustareasimpacted bysurfaceminingthatdonotdiscriminatebetweenzones ofremovaland filling towhichdifferentabsorptioncoefficientsmightbeassigned,wouldhelptoimprove flood modelssuchastheoneusedinthispaper.Onepossibility mightbetoreconstructpreminingtopographytoinferareas ofremovalversus fillingusinglegacyDEMs;however,that isataskmoreeasilyconceptualizedthancompleted.Haneberg(2018)concludedthatthe95percentconfidencelimit fordetectionofrealchangebetweenamodern1.5-mlidar DEMandalegacy10-mDEMdigitizedfrom photogrammetricallyderivedcontoursisabout 618mintwoeastern Kentucky7.5-minutequadrangles.Muchofthatdifference
wasattributedtolocalizedzonesorbandsofsignificanthorizontalerrorsaslargeas30to45minunminedportionsof thelegacyDEMs.Therefore,legacyDEMswouldhaveto undergosignificantprocessing(e.g.,Zhuetal.,2022)to transformthemintoconformitywiththemoreaccuratelidar DEMsiftheyareusedtoreconstructpreminingtopography. Itwouldnotbesuffi cienttosimplylayeroneDEM overtheother.ReconstructionofpreminingtopographytoimproveAppalachian fl oodmodelsshouldbea topicforfutureresearch.
Finally,thecumulative fluxdifferencemapinFigure 8showsmaximumdifferencesthatmayhaveoccurred astheresultofmining-relatedeliminationofabsorption capacity,notnecessarilyactualvaluesrealizedduring the2022 flood.Itisbasedonanarea-wideestimationof Aunmined ¼ 0.61andtheassumptionthatanyareaswith evidenceofminingasshownontheSkyTruth(2023) mapshavenocapacitytoabsorb floodwater.Asdiscussed earlier,thatmayormaynotbethecase,especiallygiven theoverpredictionofthemodelforcumulative flowatthe WhitesburgandHazardgagesandsomepublishedevidencethatvalley fillsmaybuffertheeffectsofheavyprecipitationbyservingastemporaryreservoirsforinfiltrating water.Overall,however,themined-casemodelwascalibratedtodischargemeasurementsfromtheJacksongage alongtheNorthFork.Changingtheratioofminedto unminedabsorptioncoefficientstoothervaluesalongthe lineofallowablecombinationsinFigure5wouldhave noeffectonthemodeledtotalcumulativedischargeat Jackson,becausethecombinationssimplyre fl ectdifferentwaysofpartitioningtheaveragevaluecalculated fortheentirewatershedaboveJackson.
Thesignificanceofincreasesincumulative fluxcan beunderstoodintermsofrecurrenceintervalsusingthe best-fitlog-PearsontypeIII floodfrequencycurves developedbyHaneberg(2023).Approximatinga flood hydrographasatriangle,itiseasytoshowthattheproportionalincreaseincumulative fluxwillbeequaltothe proportionalincreaseinpeakdischargeifthe flooddurationremainsconstant(i.e.,a20percentincreaseinpeak dischargewillproducea20percentincreaseincumulative flux).FortheWhitesburggage,forexample,increasing peakdischargeby20percentfrom100to120m3/s increasestherecurrenceintervalofahypothetical flood from7to12years,andincreasingpeakdischargeby40 percentfrom100to140m3/sincreasestherecurrence intervalfrom7to19years.Likewise,increasingpeakdischargeatHazardby20percentfrom1,000to1,200m3/s increasestherecurrenceintervalofahypothetical flood from10to19years,andincreasingpeakdischargeby40 percentfrom1,000to1,400m3/sincreasestherecurrence intervalfrom10to35years.Modeledcumulative flux increases potentiallyrangingfrom22percentalongthe NorthForkattheHazardgageto50percentalongpartsof
TroublesomeCreek,andgreaterthan100percentalong sometributarystreamsemanatingfromminedareas arecauseforconcernandcallforadditionalresearch onthetopic.
CONCLUSIONS Publiclyavailabledatashowthatdifferencesinthe amountofrainthatfellacrosstheNorthForkwatershed, whichrangedfromjustover9cm(3.2in)tonearly30 cm(10.6in)betweenJuly26and29,2022,areconsistentwiththesignificantdifferencesin floodrecurrence intervalscalculatedfortheNorthForkstreamgagesat Jackson(94years),Hazard(2years),andWhitesburg (850–1,000years).TroublesomeCreek,alongwhicha disproportionatelylargenumberofpeoplediedduring the flood,isnotgaged;therefore,arecurrenceinterval cannotbecalculated.However,theTroublesomeCreek watershedreceivedhigheraveragerainfallthantheentire NorthForkwatershednorthofJacksonandtheHazard andWhitesburgsubwatersheds.Accordingtothecomputermodeldescribedinthispaper,whichwascalibrated toknownrainfall,streamflow,andtheamountofarea affectedbysurfacemining,TroublesomeCreekcontributedadisproportionatelylargeproportionofthecumulative flowintheNorthForkattheconfluenceduringthe July2022 flood(35percentofthe flowfrom28percent ofthewatershedarea).Resultsfromcomputermodels withandwithoutminingeffectsshowthatifknown minedareashadnocapacitytoabsorborretainrunoff, theycouldhaveincreasedcumulative fl ooddischarge by22percentalongtheNorthForkatWhitesburgto morethan100percentinsmalltributariesemanating fromminedareas.
ACKNOWLEDGMENTS Preliminaryaspectsofthisandrelatedresearchonthe July2022 floodeffectsweresupportedbytheKentucky GeologicalSurveyandtheNationalScienceFoundation (NSF21-547,GLD:2242120).CommentsbyJayChristian, JasonDortch,MeredithSwallom,andthreeanonymous reviewershelpedtoimprovetheclaritythemanuscript; however,theresultsandconclusionsaretheresponsibility oftheauthor.
REFERENCES BLODGETT,D.,2023, TheHydroNetwork-LinkedDataIndex:Electronic resource,availableat https://waterdata.usgs.gov/blog/nldi-intro/ BORCHERS,J.W.;EHLKE,T.A.;MATHES JR.,M.V.; AND DOWNS,S.C., 1991, Theeffectsofcoalminingonthehydrologicenvironmentof selectedstreambasinsinsouthernWestVirginia:U.S.Geological Survey,Water-ResourcesInvestigationsReport84-4300,119p, https://doi.org/10.3133/wri844300
BORGA,M.;MARRA,F., AND GABELLA,M.,2022,Rainfallestimationby weatherradar.InMorbidelli,R.(Editor), Rainfall:Elsevier,pp. 109–134.
CARPENTER,T.M.;GEORGAKAKOS,K.P., AND SPERFSLAGEA,J.A.,2001, OntheparametricandNEXRAD-radarsensitivitiesofadistributedhydrologicmodelsuitableforoperationaluse: Journalof Hydrology,Vol.253,pp.169–193, https://doi.org/10.1016/S00221694(01)00476-0
CHRISTIAN,W.J.;MAY,B.; AND LEVY,J.E.,2023,Floodfatalitiesineastern Kentuckyandthepublichealthlegacyofmountaintopremovalcoal mining: JournalofMaps,Vol.19, https://doi.org/10.1080/17445647. 2023.2214159
CommonwealthofKentucky,2024a, KyFromAbove:Electronic document,availableat https://kyfromabove.ky.gov
CommonwealthofKentucky,2024b, Ky24KNHDBluelineStreams: Electronicdocumentavailablefrom https://opengisdata.ky.gov/ CRAWFORD,M.M.;WANG,Z.;CARPENTER,S.;SCHMIDT,J.;KOCH,H.J.; AND DORTCH,J.M.,2023, ReconnaissanceofLandslidesand DebrisFlowsAssociatedwiththeJuly2022FloodinginEastern Kentucky:KentuckyGeologicalSurvey,Series13,Reportof Investigations13,14p, https://doi.org/10/13023/kgs.ri56.13 DAY,C.A. AND CHEN,J.,2023,Hydrometeorologicalobservationsfrom theUpperKentuckyheadwaters flash floods,26–29July2022: Weather,onlineversionofrecord, https://doi.org/10.1002/wea.4448 DIXON,E. AND SHELTON,R.,2023, HousingDamagefromthe2022 KentuckyFlood:Electronicdocument,availableat https:// ohiorivervalleyinstitute.org/housing-damage-2022-ky-flood/ DU,J.,2011, NCEP/EMC4KMGriddedData(GRIB)StageIVData, Version1.0:UCAR/NCAR–EarthObservingLaboratory, Electronicdata,availableat https://doi.org/10.5065/D6PG1QDD
FERRARI,J.R.;LOOKINGBILL,T.R.;MCCORMICK,B.;TOWNSEND,P.A.; AND ESHLEMAN,K.N.,2009,Surfaceminingandreclamation effectson floodresponseofwatershedsinthecentralAppalachian Plateauregion: WaterResourcesResearch,Vol.45,W04407, https://doi.org/10.1029/2008WR007109
GALSTER,J.C.,2007,Naturalandanthropogenicinfluencesonthe scalingofdischargewithdrainageareaformultiplewatersheds: Geosphere,Vol.3,pp.260–271, https://doi.org/10.1130/GES00065.1
GALSTER,J.C.;PAZZAGLIA,F.J.;HARGREAVES,B.R.;MORRIS,D.P.; PETERS,S.C.; AND WEISMAN,R.N.,2006,Effectsofurbanizationon watershedhydrology:Thescalingofdischargewithdrainagearea: Geology,Vol.34,pp.713–716, https://doi.org/10.1130/G22633.1
GEBERT,W.A.;GRACZYK,D.J.; AND KRUG,W.R.,1987, Average AnnualRunoffintheUnitedStates,1951–80:U.S.GeologicalSurvey,HydrologicAtlas710,1sheet, https://doi.org/10.3133/ha710 GRUBER,S. AND PECKHAM,S.,2009,Land-surfaceparametersand objectsinhydrology: DevelopmentsinSoilScience,Vol.33,pp. 171–194, https://doi.org/10.1016/S0166-2481(08)00007-X HANEBERG,W.C.,2018,Comparinglidarandlegacydigitalelevation modelstoquantifytopographicchangeinareasofmountaintop removalcoalmining,McDowellandPikevillequadrangles,Kentucky: GeologicalSocietyofAmerica, AbstractswithPrograms, Vol.50,No.6, https://doi.org/10.1130/abs/2018AM-320360
HANEBERG,W.C.,2023, RecurrenceIntervalEstimatesfortheJuly 2022EasternKentuckyFloods,NorthForkoftheKentuckyRiver: KentuckyGeologicalSurvey,Series13,Open-FileReport1, https://doi.org/10.13023/kgs13of12023
HOUSE,S.,2023,ThepoemSilasHousewroteforGov.AndyBeshear's inauguration: “ThoseWhoCarryUs”.LexingtonHerald-Leader, December14,2023.Electronicdocument,availableat https://www. kentucky.com/opinion/op-ed/article283005968.html
KLESTA,M.,2023, ResilienceandRecovery:InsightsfromtheJuly 2022EasternKentuckyFlood:Electronicdocument,availableat https://doi.org/10.26509/frbc-cd-20230927
LEVIN,S.B. AND HOLTSCHLAG,D.J.,2022, AttributionofMonotonic TrendsandChangePointsinPeakStreamflowintheMidwestRegion oftheUnitedStates,1941–2015and1966–2015:U.S.Geological SurveyProfessionalPaper1869-D,22p, https://doi.org/10.3133/ pp1869
LINDSAY,J.B.,2016,WhiteboxGAT:Acasestudyingeomorphometric analysis: Computers&Geosciences,Vol.95,pp.75–84, https://doi. org/10.1016/j.cageo.2016.07.003
LINDSAY,J.B.,2023, WhiteboxToolsv2.3:Electronicdocument, availableat http://www.whiteboxgeo.com
MCCORMICK,B.C. AND ESHLEMAN,K.N.,2011,Assessinghydrologic changeinsurface-minedwatershedsusingthecurvenumber method: JournalofHydrologicEngineering,Vol.16,pp.575–584. MCDOWELL,R.C.,1986, TheGeologyofKentucky ATexttoAccompanytheGeologicMapofKentucky(OnlineVersion1.0):U.S.GeologicalSurvey,ProfessionalPaper1151-H(OnlineVersion1.0), Electronicdocument,availableat https://pubs.usgs.gov/pp/p1151h/ MCFARLAN,A.C.,1943, GeologyofKentucky:UniversityofKentucky Press,Lexington,KY,531p.
MILLER,A.J. AND ZÉGRE,N.P.,2014,Mountaintopremovalmining andcatchmenthydrology: Water,Vol.6,pp.472–499, https://doi. org/10.3390/w6030472
MILLER,A.J. AND ZÉGRE,N.P.,2016,Landscape-scaledisturbance: InsightsintothecomplexityofcatchmenthydrologyinthemountaintopremovalminingregionoftheeasternUnitedStates: Land, Vol.5,22, https://doi.org/10.3390/land5030022
MOORE,J.T.;GLASS,F.H.;GRAVES,C.E.;ROCHETTE,S.M., AND SINGER,M.J.,2003,Theenvironmentofwarm-seasonelevatedthunderstormsassociatedwithheavyrainfalloverthecentralUnitedStates. WeatherandForecasting,Vol.18,pp.861–878, https://doi.org/10 .1175/1520-0434(2003)018,0861:TEOWET.2.0.CO;2 NationalWeatherService,2024a, HistoricJuly26th–July30th,2022 EasternKentuckyFlooding:Electronicdocument,availableat https://www.weather.gov/jkl/July2022Flooding NationalWeatherService,2024b, NOWData NOAAOnlineWeather Data:Electronicdocument,availableat https://www.weather.gov/ wrh/climate?wfo¼jkl NIPPGEN,F.;ROSS,M.R.;BERNHARDT,E.S.; AND MCGLYNN,B.L., 2017,Creatingamoreperennialproblem?Mountaintopremoval coalminingenhancesandsustainssalinebaseflowsofAppalachianwatersheds: EnvironmentalScience&Technology,Vol.51, pp.8324–8334, https://doi.org/10.1021/acs.est.7b02288 NOGER,M.C.,1988, GeologicMapofKentucky(1:500,000):U.S. GeologicalSurvey,1sheet, https://ngmdb.usgs.gov/Prodesc/proddesc_ 16355.htm
PALMER,M.A.;BERNHARDT,E.S.;SCHLESINGER,W.H.;ESHLEMAN, K.N.;FOUFOULA-GEORGIOU,E.;HENDRYX,M.S.;LEMLY,A.D.; LIKENS,G.E.;LOUCKS,O.L.;POWER,M.E.; AND WHITE,P.S.,2010, Mountaintopminingconsequences: Science,Vol.327,pp.148–149. PERICAK,A.A.;THOMAS,C.J.;KROODSMA,D.A.;WASSON,M.F.; ROSS,M.R.V.;CLINTON,N.E.;CAMPAGNA,D.J.;FRANKLIN,Y.; BERNHARDT,E.S.; AND AMOS,J.F.,2018,Mappingtheyearly extentofsurfacecoal.MininginCentralAppalachiausingLandsat andGoogleEarthEngine: PLoSOne,Vol.13,e0197758, https:// doi.org/10.1371/journal.pone.0197758
PHILLIPS,J.D.,2004,Impactsofsurfaceminevalley fillsonheadwater floodsinEasternKentucky: EnvironmentalGeology,Vol.45,pp. 367–380, https://doi.org/10.1007/s00254-003-0883-1
QGIS.org,2024, QGISGeographicInformationSystem:OpenSource GeospatialFoundation,Beaverton,OR, http://qgis.org
REED,M. AND KITE,S.,2020,Peripheralgullyandlandslideerosionon anextremeanthropogeniclandscapeproducedbymountaintop removalcoalmining: EarthSurfaceProcessesandLandforms, Vol.45,pp.2078–2090, https://doi.org/10.1002/esp.4867
RICE,C.L. AND WOLCOTT,D.E.,1973, GeologicMapoftheWhitesburgQuadrangle,Kentucky–VirginiaandPartoftheFlatGap Quadrangle,LetcherCounty,Kentucky:U.S.GeologicalSurvey, GeologicQuadrangleMapGQ-1119, https://ngmdb.usgs.gov/ Prodesc/proddesc_10660.htm
SHOBE,C.M.;BOWER,S.J.;MAXWELL,A.E.;GLADE,R.C.; AND SAMASSI,N.M.,2024,Theuncertainfutureofmountaintopremoval-minedlandscapes1:Howminingchangeserosionprocessesandvariables: Geomorphology,Vol.445,108984, https:// doi.org/10.1016/j.geomorph.2023.108984 SkyTruth,2023, UpdatedMTMData:Electronicdocument,available at https://skytruth.org/mtr-data-files/ U.S.GeologicalSurvey,2024, USGSWaterDatafortheNation: Electronicdocument,availableat https://waterdata.usgs.gov/nwis WILEY,J.B. AND BROGAN,F.D.,2003, ComparisonofPeakDischarges amongSiteswithandwithoutValleyFillsfortheJuly8–9,2001,Flood
intheHeadwatersofClearFork,CoalRiverBasin,Mountaintop Coal-MiningRegion,SouthernWestVirginia:U.S.GeologicalSurvey,Open-FileReport03-133,12p.
WILLIAMSON,T.N. AND BARTON,C.D.,2020,Hydrologicmodelingto examinetheinfluenceoftheforestryreclamationapproachandclimatechangeonminelandhydrology: ScienceoftheTotalEnvironment,Vol.743,140605.
ZÉGRE,N.P.;MILLER,A.J.;MAXWELL,A.; AND LAMONT,S.J.,2014, Multiscaleanalysisofhydrologyinamountaintopmine-impacted watershed: JournaloftheAmericanWaterResourcesAssociation, Vol.50,pp.1257–1272, https://doi.org/10.1111/jawr.12184
ZHU,Y.;DORTCH,J.M.; AND HANEBERG,W.C.,2022,Non-affine georectificationtoimprovethetopographic fidelityoflegacygeologicmaps: InternationalJournalofAppliedEarthObservation andGeoinformation,Vol.115,103127, https://doi.org/10.1016/j.jag. 2022.103127
MicrogravitySurveytoEvaluateEarthquake EffectsontheDerbendikhanDamSite,Iraq AHMEDMOUSA
HAYDERAL-BAHADILY
IraqGeologicalSurvey,POBox986,Baghdad,Iraq
KEVINMICKUS*
DepartmentofGeology,MissouriStateUniversity,901S.NationalAve., Springfield,MO,USA,65897
KeyTerms: Microgravity,WeaknessZones,DerbendikhanRockfillDam,EarthquakeEffects
ABSTRACT Amicrogravityinvestigationwasconductedalong theaxisoftheDerbendikhanrockfilldaminIraq.The damliesinanearthquake-proneareawithintheHigh FoldedZoneoftheWesternZagrosFold–ThrustBelt. Thegoalofthesurveywastoevaluatetheexpected subsurfacedamagethatcouldthreatenthestabilityof thedamduetotheeffectsofa7.3magnitudeearthquakeandfutureearthquakesthatcausefoundation crackingandlandslides.Thesurveyconsistsof324 microgravitystationsdistributedonfourprofiles. Residualgravityanomalieswereobtainedbyremoving theregionaleffectofa5-mupwardcontinuation filter. Severalnegativeandpositiveanomaliesaredistinguishableinaresidualanomaliesmapthatreflectsthe subsurfaceheterogeneitywithintheclaymaterialthat makesupthedam.Theresultsrevealthatthereareno recognizableindicationsregardingtheevolutionof subsurfacechannelsaftertheearthquakewasgiven. Furthermore,twoprominentanomaliesappearclose totherightbankatroughly21mindepth.Thesepositiveandnegativeanomaliessuggestthathigh-and low-densityzonescoincidewithdifferentdegreesof compressionalstressescausedbytheearthquake.Twodimensionalmodelingindicatesseverallow(lesscompacted)andhigh(morecompacted)densityareasthat warrantfurtherinvestigationintermsofmaterial strength.Theresultscanbeusedasaguideforadrillingprogramtoexaminethesourcesoftheanomalies.
INTRODUCTION Clay-corerockfilldamsarecommonlyusedbecauseof theirlowcostandrelativelyfastconstructiontime,and
*Correspondingauthoremail: kevinmickus@missouristate.edu
theyareanimportantcomponentinwatermanagement andpowergeneration(Bergaetal.,2006).Despitetheir advantages,clay-corerockfilldamshaveseveraldisadvantages,includingwaterleakagethatcanleadtofailure (Dubeyetal.,2004;Leeetal.,2005)anddamfailurein earthquake-proneregions(Loperteetal.,2016).These problemsareincreasedwhenthereisawaterreservoir impoundmentbehindthedam,thedamisbuiltnearurban centers,orthedamhaslargeamountsofagriculturedownstreamofthedam(Liuetal.,2016).Consequently,thestabilityofaclay-corerockfilldamembankmenthastobe monitoredcontinuouslyusinggeophysical,engineering, anddrillingmethods(Leeetal., 2005).Thisisespecially trueinearthquake-proneregions(Sunbuletal.,2017).
NorthernIraqhasseveralclay-corerockfilldams, includingtheDerbendikhanandAltunkopridams(Alridha etal.,2012;MollamalahmutogluandBedirhanoglu,2019). OneprobleminnorthernIraqandespeciallynortheastern Iraqisthatthisregioniswithinasignificantseismichazard area(AlsinawiandAl-Qasrani,2003;Hosseinietal., 2014)thatencompassesthecurrentlyseismicallyactive ZagrosFoldandThrustBelt(Yaminifardetal.,2012). ThisactiveseismiczonehasgeneratedseverallargeearthquakesmainlywithinIran,includingarecent7.3event (momentmagnitudescale)onNovember12,2017,within theKermanshahregionofIran(Figure1)(Chenetal., 2018).Theepicenterwaslocatedat34.88°Nand45.84°E neartheIran–Iraqborderatadepthof23kmaccordingto theNationalCenterofBroadbandSeismicNetworkof Iran.Thefocalmechanismindicatedafaultdippingshallowlytothenortheastoronafaultdippingsteeplytothe southwestandwasprobablytriggeredbythemovementof theZagrosMountainFrontFaultinthePol-e-Zahabregion ofIran(Chenetal.,2018).
Theepicenterofthe2017eventoccurred30km fromtheDerbendikhandam(Figure1).Thedamwas assessedtobeseismicallysafeforeventsofM w 6.5 andsmaller,andgiventhesizeofthe2017event,there wasaseriousconcernaboutthesafetyofthedam(AlHusseinawietal.,2018).Duringtheearthquake,the damwasdeformedandexperiencedsomesediment
Figure1.LocationoftheDerbendikhanDamwithinIraq(redoutline)andthe2017Sarpole-ZahabearthquakeinIran.Blueareasarereservoirs andrivers.Blackcirclesaremajorcities.InsetshowsthelocationofthestudyareawithinIraq.
settlement(Al-Husseinawietal.,2018).Inthedownstreamsideofthedam,aslipphenomenonoccurred thatwasrelatedpartiallytoknownwaterseepageinthe damandrelativelylowresistanceofthedownstream sediments(Abbasetal.,2012).
LargeearthquakescancausedisplacementofthesedimentswithinrockdamsasSunbuletal.(2017)evaluated thethree-dimensionalstaticanddynamicbehaviorof degradingofaclay-corerockfilldamthroughmodeling usingthe finitedifferencemethod.Thedynamicpartof theirstudyshowedhowagivendamrespondstoanactual earthquakewiththetypicalpeakgroundaccelerations. Afteraclay-corerockfilldaminTurkeywassubjectedto groundaccelerationscausedbythe1999Mw 7.1Duzce earthquake,Sunbuletal.(2017)detectedan86-cmvertical displacementatthecrestofthedaminthe first5seconds oftheearthquakeaffectingthedam.Suchdisplacements cancausethefailureofdams,dependingontheinternal structureofthedam(AlonsoandGens,2006).Thus,the internalstructureofadammustbemonitoredbydrillhole
and/orgeophysicalmethodstodetermineanyweaknesses thatmayinducefailureduringlargeearthquakes.
Geophysicalmethodsarecommonlyusedtodetermine theinternalstructureofdams(Butleretal.,1989a,b; Loperteetal.,2016;Sentenacetal.,2017;andAdamo etal.,2020).Geophysicalmethods,includingseismic (refraction,surfacewaves),gravity,electricalresistivity, electromagnetics(EM),ground-penetratingradar(GPR), andthermalmethodscanbeusedtostudythephysical propertieswithinthedam,whichthencanbeinterpreted forvariationsoftheinternalstructureofthedam(Butler etal.,1989a,b;Adamoetal.,2020).Electricalresistivity, EM,andGPRarethemostcommonlyusedmethods(Oh andSun,2008;Oh,2012;andSentenacetal.,2017)as theycanbeusedtomonitorthelocationofwaterseepage anddeterminethelocationoffracturesandpiping,stabilityoftheclay,andweakregionsintheclayand/orrock. Seismicandgravitymethodscanalsobeusedtodeterminethelocationofpipingandthestabilityandweak zoneswithintheclaycoreorrock(Yuleetal.,1998;Min andKim,2006).However,giventhenatureofmost dams,amajorityofthesegeophysicalmethodshavenoise problemsthatmakethemdifficulttouse(Yuleetal., 1998).Electricalresistivity,EM,andGPRaresusceptible toelectricalnoise,includingundergroundcables,wire meshing,overheadpowersources,andelectromagnetic fieldsinswitchyards.Seismicmethodscanbehindered bynoisefrompowerhouses,andmosttargetsarerelativelysmall,whichrequirescloselyspacedsourcesand sensors,whicharedifficulttodoatmanydams(Yule etal.,1998).Gravitydoesnothavemostoftheseproblems,anddespitehavingalowerlateralresolutionthan seismicmethods,itmaybetheonlygeophysicalmethod thatcanbeusedtoinvestigateweaknessandstructural changeswithinarockdam(Butleretal.,1989a).
Thegravity fieldchangesduetostructuralvariations withinadamarecommonlysmallandareusuallymeasuredintensofamicrogal(Blizkovsky,1979).Gravity ismeasuredingals,whichistheaccelerationofgravity, andtheaveragevaluefortheEarthis980Gal.Thecommonlyusedmeasurementinmostgravitystudies(tectonics,mineralexploration,andpetroleumstudies)are milligal.However,inengineeringstudies,thesizeofthe gravityanomaliesaresosmall,typicallyafewtensor hundredsofamicrogal,thathigh-precisioninstruments areneeded(Blizkovsky,1979;Sheriff,2006).Amicrogravitysurveyiseffectivetodetectsourceslessthan about0.1mGal,areequalto100 mGal,butsuchasurvey needsagravitymeterthatismoresensitivethanmost commonlyusedgravitymeters(e.g.,LacosteandRombergModelG),andsuchmetersarecommonlyknown asmicrogravitymeters.Additionally,thegravitymeasurementsorstationscanbeonlyafewmetersapart, andtheheightsmustbemeasuredwithahighprecisionto
approximately1cm(Blizkovsky,1979).Yuleetal.(1998) suggestthatthestationspacingfortypicalengineeringsurveysbebetween1.5and6m.Terraincorrectionshaveto bedeterminedastheterrainanomaliescancommonlybe largerthanthegravityanomaliesduetofeaturesofinterest (DebegliaandDupont,2002).Commonly,onemusttake intoaccountthegravitationaleffectsofman-madestructures,suchasbuildingsanddams,intheterraincorrection process(DebegliaandDupont,2002).
Inthisstudy,weusedthemicrogravitytechnique becauseofitscapabilityofdetectingsmallchangesin thedensitiesandstructureswithintheclaycoreofa rockfilldamthatmayhavebeenchangedbylargeearthquakes.Thehigh-resolutiongravitydatawereanalyzed bydeterminingresidualgravityanomaliesandtheconstructionofatwo-dimensional(2D)gravity-forward modeltodeterminetheinternalstructuralchangesofthe DerbendikhandamsiteinnortheasternIraqduetothe 2017earthquake.Thegravityanomalymapsandmodels areinterpretedtodeterminetheregionswithinthedam thataremostsusceptibleforfailureinfuturelarge earthquakes.
GEOLOGICALBACKGROUND TheDerbendikhandamislocatedwithintheZargos FoldandThrustBeltandrepresentstheMiddleEastern segmentoftheAlpine-Himalayanorogenicsystem(Dercourtetal.,1986;Koshnawetal.,2017)(Figure2).The ZagrosFoldandThrustBeltextendsfromsouthernIran, goesalongnortheasternKurdistanIraq,andendsin southeasternTurkeywhenitmeetstheEastAnatolian StrikeSlipFault(Bretisetal.,2011;LeGarzicetal., 2019)(Figure2)andislocatedwithinthenortheastern partoftheArabianPlate.TheFoldandThrustBeltrepresentstheclosurebetweentheArabianandEurasian Plates(LeGarzicetal.,2019).Morespecifically,within Iraq,theDerbendikhandamislocatedwithintheWesternZagrosFoldandThrustBelt(Fouad,2012)(Figure 3),whichcontainsfourdifferentzonesbasedonthe amountofdeformation.ThezonesaretheLowFolded Zone,theHighFoldedZone(HFZ),theImbricateZone, andtheSutureZone(Figure3).Specifically,theDerbendikhandamisfoundwithintheHFZ,whichischaracterizedbynumerousNW-andE-trending,high-amplitude, short-wavelengthsouthwesterlyandsoutherlyoriented folds(Fouad,2014).Thrustfaultsareassociatedwith thesteeplydippingsoutheasternandsouthernlimbsof someoftheanticlines,whereasregionalsurfacefaulting isabsent(Fouad,2012).
Geologically,thedamisunderlainbythePilaSpiFormation(UpperEocene),whichconsistsoflimestoneandis exposedonbothbanksofthedam(Figures4and5)andis underlainbytheBuffandGercusFormations,which
Figure2.SimplifiedtectonicmapoftheArabianplateandthesurroundingplates(adaptedfromSternandJohnson,2010).Largeredarrows showtherelativemotionsoftheplates.Smallredarrowsindicaterelativemotionalongextensionalplateboundaries.Blacklineswithblacktrianglesarecompressiveplateboundaries.RedXisthelocationoftheDerbendikhanDam.
consistofredshale,limestone,andmudstone.Ageological cross-sectionalongthedamaxis(Figure5)interpretsthe Diyala-SirwanRiverwheretheDerbendikhandamoccurs, beingwithinafaultzone(Willis,1954).
MICROGRAVITYSURVEY Thecollectionofthemicrogravitydatausingmicrogravitymethodscoincidedwithatopographicsurvey. Thetopographicsurveyincludedthecollectionof324 stationsthatincludeddeterminationofthehorizontal location(inbothgeographicandUniversalTransverse Mercatorcoordinates)andelevation(inmetersabove sealevel),andthesevaluesareusedinprocessingthe gravitydata.Thestationsweredistributedalongfour parallelprofilesalongthedamcrest(profilesA,B,C, andE)withstationspacingsbetween2and3mwith separationdistancebetweeneachprofileofapproximately2manda fifthprofile(D)perpendiculartothe damaxisalongtheconcretewallofthespillway(Figure 6).Thelengthandthestationspacing(Dd)foreachprofileareshowninTable1.Thepositionofeachstation wasdeterminedusingLiecatotalstationmodel1201 withahorizontalaccuracyof 61second,andtheelevationwasmeasuredbyLiecadigitallevelmodelDAA03 withanaccuracyof 61mmfora1-kmdoublerun.
AmicrogravitymeterScintrexModelCG-5(Autograv)wasusedtocollectthemicrogravitydata.Itcan detectthevariationsinthegravity fieldof 61 mGal.The gravitystationswerecollectedatthesamelocationas thetopographicstations.Thegravitystationswereprocessedtoremoveallknowngravitationaleffects(Sheriff,2006).Thecorrectionsincludetimevariationsofthe gravity field,includinginstrumentaldriftandgravity tidalvariations.Thesetimevariationswereremovedby thereoccupationofabasestation(atB74)every30–40 minutes.Anassumptionwasappliedthatthegravityvaluesatallstationsinthesurveyareavariedinthesame mannerasatthebasestation.
Toremovethegeneralincreaseinthegravityvalues withlatitudeinanorthwarddirection,alatitudecorrectionwasapplied.Commonly,oneoftheInternational GravityFormulaasafunctionoflatitudeisusuallyused (Morelli,1976)(e.g.,1967or1980),butonecanalso usethelatitudecorrectionformula(Sheriff,2006):
DgLC ¼ 60:811 sin 2h ðÞ DS ; (1) where Dg isthevalueofthelatitudecorrectioninmicrogal becauseofthevarianceinpositionbetweenthemeasuring pointandareferencelocation; h isthelatitude,whichin ourstudyis35 6 0 4500 ,and DS isthedifferenceinnorthing betweenthemeasuringpointandthereference.
Figure3.GeologicaldivisionsofIraqspecificallyshowingthedivisionsoftheWesternZagrosFoldandThrustBelt.ModifiedafterFouad (2014).XisthelocationoftheDerbendikhanDam.
Freeairgravitycorrectionswereappliedusingmean sealevelasadatum,andsimpleBouguergravitycorrectionswereappliedusingmeansealevelasadatumand 2.67gm/ccastheBouguergravitydensity.Inourstudy area,thedamisasignificanttopographicfeature,andits gravitationaleffectmustberemoved.Terraincorrections werecalculatedforeachstationusingthemethodsof Kane(1962)andNagy(1966).Aregionalterraincorrectiongridusinga1-kmdigitalelevationmodel(DEM)
wasusedfordistancesoutto20km,whereasa90-m DEMwasusedforterraincorrectionswithin1,000mof astation.Aterraindensityof2.67gm/ccwasused.A 90-mDEMprobablydoesnothavetheresolutionto determineallofthesmall-scaletopographicchanges associatedwiththedam,buttheseeffectswereremoved whencreatingtheresidualgravityanomaliesas describedsubsequently.Allofthesecorrectionswere appliedtoeachgravitystationtoobtaincomplete
Figure4.Geologicalmapofthestudyarea(DerbendikhanDam)andsurroundingarea(afterSissakianandFouad,2017).
Bouguergravityanomalydata.ThecompleteBouguer gravitydataweregriddedata2-mspacingtoproducea completeBouguergravityanomalymapofthedamaxis (Figure7a)andtheleftbankarea(Figure7b)andtwo completeBouguergravityanomalymapsfortheright bank(Figure7candd).Therightbankregionwas dividedintotworegionstostudythisareainmoredetail. The firstarea,namedtheABCarea,extendsfrommeasuringpointzerotomeasuringpoint200forprofilesA,
B,andC,andasecondarea,namedtheclayspillway area,istheregionbetweentheclaycorewiththeconcretewallofthespillway.
GRAVITYMAPANALYSIS Theinterpretationofgravitydatacommonlyinvolves thecreationoftransformedmapstohighlightfeaturesof interestandanomaliesthatmaybesubtleinthecomplete
Figure5.Geologicalsectionalongthedamaxis(lookingupstream)(afterWillis,1954).
Bouguergravityanomalymap(Mickusetal.,1991).There areavarietyofmethodsthatcanbeused,includingwavelength filtering(Peeplesetal.,1986),upwardcontinuation (Jacobsen,1987),polynomialtrendsurfaces(Gabtniand Jallouli,2017),andavarietyofderivativemethods(Cordell,1979;Reidetal.,1990).Thesemethodscanbeused tocreatearesidualgravitymap,whichisusuallycreatedto highlightanomaliesduetodensitysourcesofinterest (Skeels,1967).
ResidualGravityAnomalyMap Aresidualgravityanomalymap(RAM)wascreated tohighlightgravityanomaliesduetodensitysources withintheDerbendikhandam.Allofthepreceding methodsweretriedtocreatesuchananomaly,andwe decidedthatupwardcontinuationproducedthemost consistentgravityanomalymapwithoutthedistorting effectsthatmaybecreatedbythemathematicalmethods (e.g.,wavelength filtering).Becausetheupwardcontinuation filterproducesasmoothedversionofthegravity fieldasonecontinuesthegravity fieldupward(Fairhead, 2011),thedepthofthedensitysourcesisroughlyrelated toonehalfofthecontinuationdistance(Jacobsen, 1987).A5-mupwardcontinuation filterwasconstructed fromthecompleteBouguergravityanomalydata,andit wasthensubtractedfromthecompleteBouguergravity anomalygridtoproduceresidualgravityanomalymaps ofthedamaxis(Figure8a),leftbank(Figure8b),and rightbank(Figure8candd),respectively.
DerivativeAnalysis Thederivativemethodsaregoodatlocatingtheedgesof densitysources(Fairhead,2011).Themostcommonlyused methodsarethe firstvertical(VDR),horizontal,andtilt
derivative(TDR).Derivativemethodsaremostusefulwhen analyzingshallowdepthsourcesandgeologicbodieswith largedensitycontrasts(CooperandCowan,2004).Both VDRandhorizontalderivativesprovideinformationabout densitysources,butdifferentinformationisobtainedashorizontalderivativesarebettersuitedtolocateorenhancethe edgeofabody(Cordell,1979),whereasverticalderivatives areusefulinnarrowingthewidthoftheanomaliessothat thesourcebodycanbebetterlocated(CooperandCowan, 2004).Additionally,verticalderivativesmayenhanceshallowersourcesbetterthanthehorizontalderivative(Marson andKlingele,1993).Additionally,theeffectoflong-wavelengthregionalgravitygradientsisminimizedinusingthe VDRoperator,soVDRanomaliesoscillateaboutzero.
TheamplitudesofthederivativeanomaliesarecontrolledbytheamplitudeoftheirassociatedBouguergravityanomalies.Forbodieswithsmalldensitycontrasts, comparingwiththesurroundingmaterialwillgenerate smallBouguergravityandderivativeanomalies,andthe converseistrueforbodieswithlargedensitycontrasts. TheTDRmethodwasdevelopedtocreateanomaliesin whichbodieswithsmallandlargedensitycontrastshave basicallythesameanomalyamplitudes(Verduzcoetal., 2004).Thus,smallerdensitycontrastbodiesaremoreeasilydetectablethanwiththeotherderivativemethods.The VDRandTDRresultsareshowninprofileform.
MAPANALYSISANDMODELING TobetterdiscussandillustratecompleteBouguer gravityanomaliesassociatedwithdensitysourcesinthe dam,thestudyareawasbrokendownintosmallerareas. Figure7afocusesonthedamaxis,Figure7bfocuseson theleftbank,Figure7canddfocusontherightbank, whereasFigure9showstheanomaliesalongprofileB
alongprofilesA,B,andC.
(seeFigure6foritslocation).Figure7ashowsthecompleteBougueranomalymapofthedamaxis,onwhich themiddlepartofthedamshowsarelativelylow-gravityarea.Thisgravitylowiscausedbythelargethicknessoftheclaycoreofthedam,andthethinningofthe claycoreleadstohighergravityvaluesattheleftbank.
ThecompleteBougueranomalymapfortheleftbank (Figure7b)isshowntodetermineifthereiscompaction oftheclaycore.Thereisasmall-amplitudenegative anomalyintheupstreamdirectionwithasmallpositive anomalyinthedownstreamdirection.Theseanomalies
suggestthatthereiseitherathinningoftheclaycore downstreamortheclaycoreiscompacting.
ThecompleteBouguergravity fieldABCarea(Figure 7c)ontherightbankhasamaximumanomaly(pink) andthenatransitionzone(olive)thatrepresentsthearea betweenthedamandtheconcretestructurethatleadsto thespillways.Thespillwaysaredistinguishedbytheir gravityminima.
Theclayspillwayareaoftherightbankwasstudied inmoredetailbyincreasingthenumberofstationsand reducingthestationspacinginterval.Thecomplete
Figure6.AerialphotooftheDerbendikhandam.Lowertwophotosshowthelocationofthemicrogravityandtopographystations(reddots)
Table1. Microgravitysurveyparametersusedinthestudyarea.
ProfileLength(m) Dd(m)Direction
No.of measuringpointsRemarks
A1302NW67Dividedintotwoparts;100mlengthattherightbankand30m lengthintheleftbank
B4402and5NW157The Ddis2mfrommeasuringpointB0toB200andfrommeasuringpointB410toB440.The Ddis5mfrommeasuring pointB200toB420.
C1302NW67Dividedintotwoparts;100mlengthattherightbankand30m lengthintheleftbank D453NE15
EDiscrete1NW18Startsfromtheclaycore–concretewallboundaryatmeasuringpoints A20,B20,andC20andextends10mtowardclaycoreatSE
Bougueranomalymapalongthedamaxisisshownin Figure7d,whichdemonstratesthatasmallpositive anomaly(E11andE12nexttoasmallhall)issurroundedbysmallnegativeanomalyareas.
Figure9showsthecompleteBougueranomalies alongprofileB(red)frommeasuringpointB22atthe
clay-coreconcretewallareatopointB82,theresidual gravityanomalies(green),VDR(blue),andTDR (pink).ThecompleteBougueranomalypatternhasa large-amplitudegravityminimumontheleftanda broadmaximumalongtherestofthepro file.However, theVDRandresidualgravityprofi leshaveseveral
Figure8.(a)Residualgravityanomalymapofthedamaxis.(b)Residualgravityanomalymapoftheleftbankofthedam.(c)Residualgravity anomalymapoftherightbank(ABCarea)ofthedam.Yellowstraightlinesaretheunpavedarea(d)Residualgravityanomalymapoftheclay spillwayarea(rightbank).Yellowstraightlinesdelineatetheunpavedarea.
small-wavelengthminimathatareassociatedwithdensitychangesintheclaycorebutstillhavealarge amplitudeminimumontheleftside(points-1to10). TheTDRstillhasalargeminimumontheleftbut showsmoredetailsintheminimacomparedwiththe VDRandresidualgravityprofiles,forexample,thenegativeanomaliesatdistances4,10,and22m;forthepositive anomaliesatdistances2and8m;andthebroadpositive anomalybetween25and30m.
ResidualGravityAnomalyMaps TheRAMs(Figure8a–d)haveseveralsmall-wavelengthgravityanomaliesthatreflectnearsurfaceinhomogeneityoftheclaycorewhencomparedwiththoseof completeBougueranomalymaps(Figure7a–d).The RAMalongthedamaxis(Figure8a)hasatleastfour regionsofgravityminimathatareprobablyrelatedto changesintheclaycoreofthedam.
Figure9.CompleteBougueranomalyofprofileB(red)fromstationsB22toB82,theresidualgravityanomaly(green),VDR(blue),andTDR (pink).
Figure10.Theresidualgravityanomaliesoverlainbyacross-sectionofthemakeupofthedamalongitsaxis.Thenumbersrefertothegravity anomaliesdiscussedinthetext(modifiedfromShaheretal.,2017).
TheRAMoftheleftbank(Figure8b)hasalongitudinalgravitymaximumandminimumwiththemaximum locatedalongthedownstreamregion,whereastheminimumisalongtheupstreamarea.Thesedensityvariationsarerelatedtothenearsurfacedam fillproperties; thegravitymaximumiscausedbymorecompacted regions,andthegravityminimumisrelatedtothickeror lesscompactedclays.
TheRAMoftheABCregionoftherightbank(Figure 8c)hasagravitymaximum,whichcouldbecausedbya compactedclayareaatstationsB46,B48,A48,and A50.TheRAMoftheclayspillwayareaoftheright bank(Figure8d)hasanorth–southtrendinggravity maximumbetweenpointsA22,E6,andB22.This anomalymaybecausedbythegravityresponseofthe concretewall.Thegravityminimumisseeninthemiddleofthisarea,anditiscausedbyanunknownnearsurfacelow-densitysource.
TheRAMalongthedamaxiswasoverlainovera cross-sectionofthematerialmakingupthedam(Shaher etal.,2017)toshowthegravityresponsesofthesubsurfacematerials(Figure10).Themainresidualanomalies arenumberedfromonetonine,forwhichoneisagravityminimumassociatedwiththespillwayandiscaused bytheemptyspacebelowthespillway.Residualanomalytwoisagravitymaximumandisaffectedbytheconcretewall,whichisinclinedsteeplytowardtheclay
core.Residualanomalythreeisagravitymaximumthat mayberelatedtocompactedclay.Residualanomaly fourisagravityminimumanomalythatmayberelated tofracturesintheclaycore.Residualanomaly fiveisa gravityminimumthatoverliesthefaultzone(Figure6). Residualanomaliessixandsevenaregravityminima thatreflectrelativelylow-densityareaswheretheclay maybefractured.Residualanomalyeightisalongitudinalgravityminimumthatcouldberelatedtoeitherthe effectofagallerythatisclosertothegroundsurfacein thisareaortoalow-densityzone.Residualanomaly nineisagravitymaximumofamplitudethatisprobably relatedtothehigh-densitylimestonebedsthatappear closetothegroundsurface.
2DForwardModeling Two-dimensionalforwardmodelingwasusedfora quantitativeinterpretationtodeterminethedepthand shapeofthedensitysourcesoftheRAMandcomplete Bougueranomalymap.Forwardmodelingofanygeophysicaldataisnonunique,andoutsideconstraints(e.g., geologymapping,drillholes,seismicreflection/refractionmodels)areneededtoproduceageologicallyvalid model.Inourcase,weknowthedetailedgeologysurroundingthedam(Figure5)andthemakeupofthedam (Figure10).OnemodelwasconstructedalongprofileA (Figure6)usingtheobservedcompleteBouguergravity
Figure11.2DforwardmodelofthedamaxisalongprofileA(Figure6).Themodeldisplaysdensityzoningintheclaycore.Formoredetails refertothetext.Numbersinthebodiesarethedensities.C ¼ Concrete,Cl ¼ Clay,G ¼ Gallary.
anomalydatautilizingtheseconstraintsaboutthegeologyandmakeupofthedam.The finalmodelwascalculatedusingatrial-and-errormethodinwhichthedepths, geometries,anddensitiesofthebodiesmakingupthe damandsurroundinggeologicalmaterialwerevaried untilthecalculatedgravityanomaliesmatchedthe observedcompleteBouguergravityanomalies.The final model,whichrepresentsapossiblegeologicallyreasonablemodel,isshowninFigure11.
The finalmodel(Figure11)hasaclaycorethatwas modeledwithadensityof2.04gm/cm3 (Willis,1954). Anydensitiesaboveorbelowthisvaluecanbeassumed tohavebeenaffectedbysometypeofevent(earthquake, fracturing,internalmovement).Theclaycorealongthe rightbankhasseveralareaswithvariabledensitiesthat mayhavehappenedduringthe2017earthquake.All theseareashaverelativelyhighdensitiesof2.22,2.24, 2.11,and2.20gm/cm3,whichimpliesthattheyhave beencompactedatsometime.Theclaycoreattheleft bankwasmodeledwithanormalclaydensityof2.04 gm/cm3 and,thus,doesnotseemtohavebeenaffected byanygeologicalevent.Thesmallwavelengthofthe anomaliesalongtherightbankimpliesbasedonthe RAMthatthesourcescannotbeinthegeologicalunits belowthedamandmustbeintheclaycore.
DISCUSSION ThegravityanalysisoftheDerbendikhanDamdeterminedseveralsmall-amplitudeandwavelengthanomaliesthatarecausedbythedensitydistributionwithinthe dam.Thisdensitydistributionconsistsofseveralhigher densityregionsprobablycausedbythecompactionof theclaycore.ThecompleteBouguergravityanomaly
andRAMoftherightbankhaveseveralgravitymaxima thatcouldbeduetotheeffectofahighercompactclay core(Figures7c,8c,and10).Theseanomaliesanda subsequentforwardmodel(Figure11)providemore detailonthedistributionofcompactionthanthestudy bySunbuletal.(2017),inwhichthey findthatthemaximumcompactionoccursalongtheconcretewallofthe rightbank(Figure4).Alongtherightbank,thecomplete Bouguergravityanomalyvalues(Figure7c)showa transitionzonewithsmall-amplitudegravitymaxima andminima.TheseanomalieswereenhancedbycreatingaRAMmap(Figures8a–d)andderivatives(VDR andTDR)(Figure9).Especially,theTDRhighlightsthe regionswithgravitymaximathatwerethenmodeled (Figure11).
The2Dforwardmodeling(Figure11)imagedsubsurfacedensitydistributionconsistsofmultipleregionsof highandlowdensitieswithintheclaycore.Thehighdensityregionsespeciallyalongtherightbankmaybe duetotheeffectsofthe2017earthquake.Thephysical properties(mainlyashrinkingvolumeandincreasing density)oftheclayinthisregionmayhavechangedasa resultofdifferentdegreesofcompaction.Thiszoningof densityhasbeenreflectedinthegravity fieldasgravity highsandlowsthatareeasilyseenintheRAM,VDR, TDR,and2Dmodeling.Anassumption,whichcan deducethezoning,isthatsomeofthetransmittedenergy fromtheclaycoretotheconcretewallofthespillway wasreflectedtotheclaycoreduetothesuddenchange intheelasticmodulusbetweentheclayandconcrete, exactlylikethereflectedenergyoftheseismicwavesat theboundarybetweentwodifferentvelocitylayers.This reflectedenergysplittheclaycorefromtheconcrete wallasitwasalreadyaweaknesszone.
Theresultsofthegravityanalysisindicatedseveral regionsinthedam,especiallytherightbankarea,that shouldbeexaminedforweaknessesintheclaycore. Futureearthquakes,especiallylargerevents,maycause furtherdamageintheseregions.Anyhigh-density regionsasmodeledinFigure11shouldbedrilledand coredtoexaminethephysicalpropertiesoftheclayto determineifitisstrongenoughtoremainintactduring futurelargeearthquakes.Specifically,thelow-density bodyatapproximately21mindepthshouldbeexaminedtodeterminethestrengthofthematerialinthis region.Additionally,itisnotexcludedthatthelow-densityzonethatoverliesthefaultzone(Figure11)is causedbyareactivationofthemainfaultasaresultof theenergyfromtheearthquake.Additionally,microgravitysurveysshouldbeconductedafterthereservoir ofthedamis filledtodetermineiftheincreasedweight ofthewateraffectedthedensitiesofthealreadyaffected regionsdeterminedbythisstudy.Additionally,amicrogravitysurveyshouldbeconductedimmediatelyafter anylargeearthquaketodetermineifthealreadyaffected regionsintheclaycoreasbefurtherdegraded.
CONCLUSIONS ThemicrogravitysurveyandanalysisoftheDerbendikhanrockfilldamrevealseveralnearsurfaceand deepervariationsofdensitydistributionthathavecaused variationsofcompactionwithintherockfillmaterial. Thesevariationsarebelievedtohaveformedbythe effectsofearthquakestressescompactingtheclayin someareasandweakeningitinothers.Theresultsshow thatthereisnoobviousevidenceregardingthedevelopmentofsubsurfacechannelsaftertheoccurrenceofthe 2017earthquake.Themostconspicuousanomalyatthis deepestlevelisagravityminimuminthecentralpartof thestudyarea.Thisgravityminimumbasedontwodimensionalforwardmodelingisrelatedtoarelatively low-densityzonecoincidingwithafaultzoneandlowdensityclasticbedsbeneaththedam.
Themaximumdepthsoftheanomalysourcesare5, 10,24.1,and55mintheleftbank,ABCarea,clayspillwayarea,anddamaxis,respectively.Twoprominent anomaliesoccuratanaveragedepthofabout21mwith the firstbeingagravitymaximumbetweenmeasuring pointsB156andB164andthesecondbeingagravity minimumbetweenB126andB140.Theseanomalies suggestthatthehigh-andlow-densityzonescoincide withcompressionandextensionstressesresultingfrom theNovember13,2017,earthquake.
Two-dimensionalforwardmodelingoftheBouguer gravity fieldindicateseveralregionsofhigher(compacted)andlower(lesscompacted)densityregions withintheclayzonethatmakesupthedam.Theright
bankofthedamhashigherdensitiesduetocompacting oftheclaycore.Thevariationsinthemodeleddensitiessuggestthereweredifferentstagesofcompaction thatoccurredduringthe2017earthquake.Theresults ofthegravityanalysissuggestthatthereareseveral areaswithintheclay fi llofthedamthatneedfurther investigationintermsofmaterialstrengthsothatfuture largeearthquakeeventsdonotcausefurtherdamageto thedam.
REFERENCES ABBAS,M.;TAKADA S.; AND SEPAND,S.,2012,FujinumaDamperformanceduring2011Tohokuearthquake,JapanandfailuremechanismbyFEM.In Lisboa:The15thWorldConferenceon EarthquakeEngineering,vol.24,pg.19524–19540,RedHook, NY,USA.
ADAMO,N.;AL-ANSAR,N.;SISSAKIAN,V.;LAUE,J.; AND KNUTSSON,S., 2020,Geophysicalmethodsandtheirapplicationsindamsafety monitoring: JournalofEarthSciencesandGeotechnicalEngineering,Vol.11,pp.291–345.
AL-HUSSEINAWI,Y.;LI,Z.;CLARK P.; AND EDWARDS,S.,2018,EvaluationofthestabilityoftheDerbendikhanDamafterthe12November2017Mw7.3Sarpol-eZahab(Iran–IraqBorder)earthquake: RemoteSensing,Vol.10,p.1426.
ALONSO,E.E. AND GENS,A.,2006,Aznalcólardamfailure.Part1: Fieldobservationsandmaterialproperties: Géotechnique,Vol.56, pp.165–183.
ALRIDHA,N.;BAQIR,R.; AND HAMID,A.,2012,SeismicityandseismotectonicstudyforAltunkopridamsitenorthIraq: IraqiJournalof Science,Vol.53,pp.595–601.
ALSINAWI,S. AND AL-QASRANI,A.,2003,EarthquakehazardconsiderationsforIraq.In FourthInternationalConferenceofEarthquake EngineeringandSeismology,Tehran,Iran.
BERGA,L.;BUIL,J.M.;BOFILL,E.;DE CEA,J.C.;PEREZ,J.G.; MAÑUECO,G.;POLIMON,J.;SORIANO,A.; AND YAGÜE,J.,2006, DamsandReservoirs,SocietiesandEnvironmentinthe21stCentury:Taylor&Francis,London,U.K.1076p.
BLIZKOVSKY,M.,1979,Processingandapplicationsinmicrogravity surveys: GeophysicalProspecting,Vol.27,pp.841–868.
BRETIS,B.;BARTL,N.; AND GRASEMANN,B.,2011,Lateralfoldgrowth andlinkageintheZagrosfoldandthrustbelt(Kurdistan,NE Iraq): BasinResearch,Vol.23,pp.615–630.
BUTLER,D.;LLOPIS,J.; AND DEAVER,C.,1989a,Comprehensivegeophysicalinvestigationofanexistingdamfoundation: TheLeading Edge,Vol.8,pp.10–18.
BUTLER,D.;YULE,D.;LLOPIS,J.; AND SHARP,M.,1989b, Technical assessmentoffoundationconditions:RightabutmentMillCreek Dam.U.S.Army,WaterwaysExperimentStation,CorpofEngineersReportGL-89-12.
CHEN,K.;XU,W.;MAI,P.M.;GAO,H.;ZHANG,L.; AND DING,X., 2018,The2017Mw7.3SarpolZahabEarthquake,Iran:Acompactblindshallow-dippingthrusteventinthemountainfrontfault basement: Tectonophysics,Vol.747,pp.108–114.
COOPER,G. AND COWAN,D.,2004,Filteringusingvariableorderverticalderivatives: ComputersandGeosciences,Vol.30,pp.455–459.
CORDELL,L.,1979, GravimetricexpressionofGrabenfaultingin SantaFecountryandTheEspanolaBasin,NewMexico.InNew MexicoGeologicalSocietyGuidebook,30thFieldConference, pp.59–64.
DEBEGLIA,N. AND DUPONT,F.,2002,Somecriticalfactorsforengineeringandenvironmentalmicrogravityinvestigations: Journalof AppliedGeophysics,Vol.50,pp.435–454.
DERCOURT,J.,etal.,1986,GeologicalevolutionoftheTethysBelt fromtheAtlantictothePamirssincetheLIAS: Tectonophysics, Vol.123,pp.241–315.
DUBEY,C.S.;VENKATACHALAM,K.;RATNAM,M.,etal.,2004,Causesof seepagewaterindrainageandgroutinggalleriesofthePandoh Dam,CentralHimalaya: BulletinofEngineeringGeologyandthe Environment,Vol.63,pp.19–23.
FAIRHEAD,J.D.,2011, GravityandMagneticinToday’sOilandMineralIndustry:UniversityofLeeds,Leeds,U.K.,251p.
FOUAD,S.F.A.,2012, TectonicMapofIraq,3rded.:GEOSURV, scales1:1000000Baghdad,Iraq.
FOUAD,S.F.A.,2014,GeologyoftheHighFoldedZone: IraqiBulletinofGeologyandMinerals,SpecialIssue6,pp.53–71.
GABTNI,H. AND JALLOULI,C.,2017,Regional-residualseparationof potential field:AnexamplefromTunisia: JournalofAppliedGeophysics,Vol.137,pp.8–24.
HOSSEINI,R.;LASHKARIPOUR,G.;MOGHADAS,N.; AND GHAFOORI,M., 2014,SeismotectonicprovincesforKurdistanregion-north-eastern Iraq: InternationalJournalofCurrentLifeSciences,Vol.4,pp. 9060–9066.
KANE,M.,1962,Acomprehensivesystemofterraincorrectionsusing adigitalcomputer: Geophysics,Vol.27,pp.455–462.
KOSHNAW,R.;HORTON,B.;STOCKLI,D.;BARBER,D.;TAMAR-AGHA,M.; AND KENDALL,J.,2017,Negoeneshorteningandexhumationofthe ZagrosFold-ThrustBeltandforelandbasinintheKurdistanregion ofnorthernIraq: Tectonophysics,Vol.694,pp.332–354.
JACOBSEN,B.H.,1987,Acaseforupwardcontinuationasastandard separation filterforpotential-fieldmaps filterforpotential-field maps: Geophysics,Vol.52,pp.1138–1148.
LE GARZIC,E.;VERGÉS,J.;SAPIN,F.;SAURA,E.;MERESSE,F.; AND RINGENBACH,J.C.,2019,EvolutionoftheNWZagrosFold-andThrustBeltinKurdistanRegionofIraqfrombalancedand restoredcrustal-scalesectionsandforwardmodeling: Journalof StructuralGeology,Vol.124,pp.51–69.
LEE,J.;CHOI,Y.;KIM,H.; AND YUN,S.,2005,Hydrologiccharacteristicsofalargerockfilldam:Implicationsforwaterleakage: EngineeringGeology,Vol.80,pp.43–59.
LIU,S.;WANG,L.;WANG,Z.; AND BAUER,E.,2016,Stress-deformation analysisofcut-offwallinclay-corerockfilldamonthickoverburden: WaterScienceandEngineering,Vol.9,pp.210–226.
LOPERTE,A.;SOLDOVIERI,F.;PALOMBO,A.;SANTINI,F.; AND LAPENNA,V., 2016,AnintegratedgeophysicalapproachforwaterinfiltrationdetectionandcharacterizationatMonteCotugnorock-filldam(southern Italy): EngineeringGeology,Vol.211,pp.162–170. MARSON,I. AND KLINGELE,E.,1993,Advantagesofusingthevertical gradientofgravityfor3-Dinterpretation: Geophysics,Vol.58,pp. 1588–1595.
MICKUS,K.;KENNEDY,D.; AND AIKEN,C.,1991,Regional-residual gravityanomalyseparationusingtheminimumcurvaturetechnique: Geophysics,Vol.56,pp.279–283.
MIN,D. AND KIM,H.,2006,Feasibilityofthesurfacewavemethodfor theassessmentofphysicalpropertiesofadamusingnumerical analysis: JournalofAppliedGeophysics,Vol.59,pp.236–243.
MOLLAMALAHMUTOGLU,C. AND BEDIRHANOGLU,I.,2019,Investigation ofdamageonDerbendikhanDamduringearthquakeexcitation.In InterdependencebetweenStructuralEngineeringandConstructionManagement.STR-87-1–STR-87-6.
MORELLI,C.,1976,Modernstandardforgravitysurveys: Geophysics, Vol.27,p.445.
NAGY,D.,1966,Theprismmethodforterraincorrectionsusingdigital computers: PureandAppliedGeophysics,Vol.63,pp.31–39. OH,S.,2012,Safetyassessmentofdamsbyanalysisoftheelectrical propertiesoftheembankmentmaterial: EngineeringGeology,Vol. 129,pp.76–90.
OH,S. AND SUN,C.,2008,Combinedanalysisofelectricalresistivity andgeotechnicalSPTblowcountsforthesafetyassessmentofa filldam: EnvironmentalGeology,Vol.54,pp.31–42.
PEEPLES,W.;COULTRIP,R.; AND KELLER,G.,1986,Quasi-idealspatial filtersforlargemaps: AnnalesGeophysica,Vol.4,pp.547–554. REID,A.B.;ALLSOP,J.M.;GRANSER,H.;MILLETT,A.J.; AND SOMERTON,I.W.,1990,MagneticinterpretationinthreedimensionsusingEulerdeconvolution: Geophysics,Vol.55,pp.80–91.
SENTENAC,P.;BENES,V.;BUDINSKI,V.;KEENAN,H.; AND BARON,R., 2017,Post floodingdamageassessmentofearthdamsandhistoricalreservoirsusingnon-invasivegeophysicaltechniques: Journal ofAppliedGeophysics.Vol.146,pp.138–148.
SHAHER,T.B.;JABER,K.S.;HASSAN,R.A.; AND HUSSAIN,A.A.,2017, Preliminaryreportonevaluationtheearthquakeeffectsonthe DerbendikhanDam.IraqiMinistryofWaterResources,61p. SHERIFF,R.E.,2006, EncyclopedicDictionaryofAppliedGeophysics, 4thed.:SocietyofExplorationGeophysicists,429p.
SISSAKIAN V.K. AND FOUAD S.F.A.,2017, GeologicalMapofIraq scale1:1000000.1sted.:GEOSURV,Baghdad,Iraq.
SKEELS,D.C.,1967,Whatisresidualgravity?: Geophysics,Vol.32, pp.872–876.
STERN,R. AND JOHNSON,P.,2010,ContinentallithosphereoftheArabianPlate:Ageologic,petrologicandgeophysicalsynthesis: EarthScienceReviews,Vol.101,pp.29–67.
SUNBUL,A.B.;CAVUSLI,M.;KARTAL,M.E.; AND SUNBUL,F.,2017, A casestudyon3Dnon-linearanalysisofaclaycorerockfilldam.In TheEurasiaProceedingsofScience,Technology,Engineering& Mathematics,Vol.1,pp.388–396.
VERDUZCO,B.;GREEN,C.M.; AND MACKENZIE,C.,2004,Newinsights intomagneticderivativesforstructuralmapping, TheLeading Edge,Vol.23,pp.116–119.
WILLIS,C.L.,1954, Geologicalreport(onDerbendikhandamsite) HarzaEngineeringCompany,USA.MinistryofIrrigation,Baghdad,115p.
YAMINIFARD,F.;SEDGHI,M.H.;GHOLAMZADEH,A.;TATAR,M.; AND HESSAMI,K.,2012,Activefaultingofthesoutheastern-mostZagros (Iran):Microearthquakeseismicityandcrustalstructure: Journal ofGeodynamics,Vol.55,pp.56–65.
YULE,D.E.;SHARP,M.K.; AND BUTLER,D.K.,1998,Microgravity investigationoffoundationconditions: Geophysics, Vol 63,pp. 95–103. Mousa,Al-bahadily,andMickus
OpenAccessArticle TransportandFateofNitrateinaSaturatedBuffer ZoneasAssessedWithaChlorideTracerTest ALHASSANSAHAD1 AND ERICW.PETERSON*
DepartmentofGeography,Geology,andtheEnvironment,IllinoisStateUniversity, CampusBox4400,Normal,IL61790
KeyTerms: Nitrate,SaturatedBufferZone,Tracer Test,Denitrification,PlantUptake,End-MemberMixing, TileDrainage
ABSTRACT TheUpperMississippiBasin,whichincludesIllinois, hashighlyfertilesoilsandexperiencesintensiveagriculturalpractices.Althoughfertile,thesoilsdonotdrain well,resultingintheinstallationoftile-drainagesystems. Thepracticesoftilesystemscoupledwiththeapplicationofnitrogen-richfertilizershaveledtotheexcessive exportofnitratefromtheagricultural fieldsintosurface waters,contributingtoeutrophicationandthedevelopmentofhypoxiczonesinaquaticenvironments. Saturatedriparianbufferzones(SRBs)havebeenproposedasameanstoreducetheamountofnitratedischargedfromtile-drainedwatersintostreams.Previous worksshowareductioninthenitrateaswaterstravel throughanSRB,but insitu measurementsoftravel timesarelimited.Usingtheresultsfroma52-daytracer test,wedevelopedamathematicalmodelcombiningendmembermixingofatracer,chloride,andconcentrations ofnitrateasnitrogen(NO3-N)todeterminethetravel timeofthetilewatersinanSRBandtoquantifythe amountofNO3-NreductionoccurringwithinanSRB. Forthe first30days,dissolvedoxygen(DO)concentrationsindicatedaerobicconditionswithinthewatersof mostoftheSRB,whichsawaconcomitantincreasein NO3-Nconcentrationsalonggroundwaterpathways.As DOconcentrationsdecreasedbelow4.5mg/L,NO3-Nconcentrationsbegantoloweralongthe flowpathways,resultinginNO3-Nreductionsrangingfrom23to97percent.
INTRODUCTION Agricultureisaleadingcontributorofsurfacewater pollution,contributingnutrientssuchasnitrogen(N),to aquaticenvironments(Andersonetal.,2014).Nisa
1Presentaddress:InstituteforDataScienceandInformatics,Universityof Missouri-Columbia,22HeinkelBuilding,Columbia,MO,65211
*Correspondingauthoremail: ewpeter@ilstu.edu
primarynutrientrequiredforthegrowthanddevelopmentofplants.Theneedtoincreasecropyieldhasled totheincreasedapplicationofN-basedfertilizersto agricultural fields(Lemkeetal.,2011;Milleretal., 2011;andRobertsonandSaad,2013).Concomitantwith theincreasedapplication,nitrateasnitrogen(NO3-N) concentrationsinriversandreservoirsthroughoutagriculturalregionshaverisen(Gentryetal.,1998;David andGentry,2000).N-fertilizersandorganicnitrogenin manurearemajorsourcesofnitrogenpollutionascrops donotassimilatealloftheappliedN(Lutzetal.,2020).
TheuseofN-fertilizersintheMidwestoftheUnited Stateshasincreasedsincethemid-20thcentury.Notallof theN-fertilizerisutilizedbythecrops,whichhasledtoelevatedconcentrationsofnitrateinsurfacewaters(Peterson etal.,2001).Excessivenitrateaccumulationdegradesfreshwatersystemsandcauseschangestobiodiversityandthe deathofaquaticorganisms(DavidandGentry,2000).For example,thewaterswithintheMississippiRiverBasinregistersomeofthehighestconcentrationsofnonpointsource nitrate(NO3-)intheworld(HypoxiaTaskForce,2018).The algalbloomsandhypoxiczonesintheGulfofMexicoand LakeErieillustrateclearmanifestationofthenegative impactofNO3- exportintowaterbodies.Accordingto KeeneyandHatfield(2008),theIllinoisRiver,atributaryof theMississippiRiver,contributesfrom15to20percentof thetotalnitrogenthatistransportedintotheGulfofMexico.
IntheMidwestregion,particularlyinIllinois,thesoil typicallyhasahighwatertablethathindersthegrowthof mostcrops.Excessivesoilmoisturestuntsplantgrowth duetoanoxygendeficiencyintherootzoneandareductioninnitrogenuptakeresultingfromdenitrificationand leaching(Kauretal.,2017).Toimprovesoildrainageand increasecropyield,farmershaveinstalledsubsurface drainingsystems(tiles)todrainthesoilwaterdirectlyinto surfacewaterbodies(Fauseyetal.,1995).However,the tilesshort-circuittherolesofthesoilinthenitrogencycle, reducingoreliminatingtheopportunityfordenitrification, plantuptake,andmicrobialimmobilization.Whereasthe installationoftiledrainshassuccessfullyopenedadditional landsforagriculturaldevelopmentsandincreasedcrop yield,theshort-circuitingprocessdirectlycontributesto52 percentofnitrateenteringtheGulfofMexico(Davidand Gentry,2000).Removalofthetiledrainstoprotectwater
bodiesisnotpractical;thus,asolutionmustbefoundto mitigatethenegativeimpactoftilesonwaterquality.
In2008,anationalstrategyactionplanwasimplemented toaddresshypoxiaintheNorthernGulfofMexicoandto improvewaterqualityintheMississippiRiverBasin (USEPA,2017).In2015,Illinoisdevelopeditsownplan, theIllinoisNutrientLossReductionStrategy,withthegoal ofreducingnitrogenandphosphorusloadsby45percentin thelongterm,andinterimgoalsof15percentreductionin nitrateand25percentreductioninphosphorusby2025 (IEPAetal.,2019).Fourbestmanagementpracticesfor agriculturalnonpointsourceswereproposedtoachieve thesegoals:freewatersurface–constructedwetlands,denitrifyingbioreactors,controlleddrainage,andsaturatedriparianbufferzones(SRBs)(Carstensenetal.,2020).Withan SRB,tile-drainwaterisredirectedintoariparianbuffer zonewherethewatertravelsasgroundwatertothestream. WhilebeingtransportedthroughanSRB,thenitrogen-rich watersencounterconditionsfavorablefordenitrification, assimilation,plantuptake,anddilutionofthenitrate(Jaynes andIsenhart,2014;Carstensenetal.,2020).
IntheMidwest,widelyimplementingSRBscouldresult ina5to10percentreductionoftheestimatedNloadfrom landdrainedbytilesystems(Chandrasomaetal., 2019). However,thereportedefficienciesofSRBstoreduceN loadinghasbeenhighlyvariable.AftermonitoringsixSRBs inIowawith17site-yearsofdata,JaynesandIsenhart(2019) reportednitrateremovalbetween8and84percent.Grohetal. (2019),monitoringthreeSRBsintheMidwest,concludedthat cumulativedenitrificationcouldaccountforupto77.3percent oftotalnitrateremoved.ForaperiodfromSeptember2016to February2017,BrooksandJaynes(2017)observed61percent lossofnitrateloadingacrosssevenactivebuffersinIowa,Illinois,andMinnesota.SRBshavebeenshowntolowerNO3-N concentrationsthroughdenitrification,plantuptake,and dilution(JaynesandIsenhart,2014;Grohetal.,2019; Milleretal.,2019;andBosompemaaetal.,2021).
ResearchconcerningtheuseofSRBsasmeansto removenitratefromagriculturalwatershashighlighted thevariabilityamongsystemstoreducenitrate.One aspectassociatedwithremovalisthetraveltimeofthe waterwithintheSRB,whichhasbeenreportedonthe orderofweeks(JaynesandIsenhart,2019).Thiswork reportstheuseofatracertesttoidentifytraveltimesof divertedtilewaterthroughanSRBandtheuseofthe tracertestdatacoupledwithanend-membermixing modeltoassessthefateofthenitrate.Theresultshighlighttheheterogeneityofthesystemandsuggestthatthe lossofnitrateisspatiallyandtemporallyvariable.
MATERIALSANDMETHODS StudySiteDescription
ThestudyareaisincentralIllinois(40.614382°N, 89.023542°W)andencompassesa floodplainthatwasonce
farmedbuthasbeenrestoredtoagrassland(Figure1).A thirdorderstream,Tributary3(T3),servesasthewestern boundaryofthestudyarea.SimilartootherIllinoisstreams (Mattinglyetal.,1993;BeckerandPeterson,2022),T3has beenmodifiedandreceivestiledrainagefromatilesystem draininga fieldtotheeast.Thesegmentofstreamadjacent tothesitehasnotbeenmodifiedinthelast30years.The agricultural fieldislocatedapproximately90mtotheeast andisseparatedfromthepropertybyacountyroad.
Acrossthesite,thesurfacematerial(0–0.6m)isdark organic-richtopsoil,whichisunderlainbyaclayloam (0.6–1.5m).Between1.5and2m,theclayloamcoarsenswithanincreasingsandandgravelpercentage.The coarse-grainedmediumisunderlainbyblue-gray,dense diamictonbelongingtotheTiskilwaTillmemberofthe WedronFormationdepositedduringtheWisconsinglaciation(Weedmanetal.,2014).Thethicknessofthediamictonintheregionrangesfrom30to45mterminating atSiluriandolomitebedrock(Wickhametal.,1988). Theorganicmattercontentinthetop60cmis6.0percentbutdecreasesto2percentatadepthof90cm (Sanksetal.,2015;Bosompemaaetal.,2021).
Surfacewaterinfiltratesthroughthesoilstothesand andgravelzonewhereitthen flowshorizontally.Thesand andgravelwatersrepresentthe “shallow” waters,whereas thewatersobtainedfromthediamictonarereferredtoas “diamicton” waters.Theshallowandthediamictonwaters havedistinctgeochemicalsignatures.Watersinthesand andgravelzoneareabicarbonate-richwaterascompared withwatersderivedfromthediamicton,whicharesulfaterich(Akaraetal.,2016).Thesandandgravelzonehasa hydraulicconductivity(K)valueof2.2 3 10 5 m/s,calculatedfromthegeometricmeanofslugtestresultsfrom17 wells.Atadepthof1m,theaverageporosityis0.32 (Sanksetal.,2015).Thedepthtogroundwaterisapproximately2mduringthedryseasonandlessthan0.5mduringtherainyseasonswhenthetileisrunning.Locally,the groundwater flowsfromtheeasttowestwith flowtoward thestreamT3(Figure1).
Thestudysitehasbeenmodifiedwiththeinstallation ofanagriculturaltreatmentsystem(controlbox)that directsthetilewater(agriculturalrunoff)intothesubsurfacewithintheriparianarea,creatinganSRB.Thecontrolboxconsistsofthreechambersseparatedbyasetof stoplogs.Thestoplogbetweentheupperandmiddle chambershasa45°v-notchedweirthatispositioned0.18 mbelowthelandsurface;theelevationoftheweiris 227.85mabovemeansealevel(m.a.m.s.l.).Theupper chamberreceivestheagriculturalrunoff,whereasthe middlechamberredirectsthewaterintoa15-cmoutlet pipethatbifurcatesintothreedistributiontilespositioned 1mbelowthesurface.Thethreetileshaveindividual lengthsof95m(easterntile),110m(middletile),and50 m(westerntile)(Figure1).Thedistancefromthestream, AlhassanSahadandEricW.Peterson
Figure1.IllustrationoftheT3SRBstudysite.Thelocationofthemonitoringwells,control(diversion)box,diversiontiles,andstream(T3)are noted.Sampledwellsincluded4C,4D,6C,6D,8C,8D,10C,10D,12C,12D,19,20,21,and22.
whichhasawatersurfaceelevationofapproximately 225.70m.a.m.s.l.whenthe tileisrunning,totheclosest tile varies,rangingfromroughly15mtoslightlymorethan 50mindistance.Thesystemisdesignedtodeliverexcess tilewatertothestreamwhenthetiledischargeexceeds thecapacityofthemiddlechamber;however,continuous monitoringindicatesthatwaterhasnotbreachedthemiddlechamber.Thus,allwaterenteringthemiddlechamber isdeliveredtothedistributiontilesystem.Thetilesstart torunfromlatewinter(lateFebruary–earlyMarch)to latespring(lateMay–earlyJune).
Withinthestudysite,35observationwellshavebeen installed;eachwellhasa0.75-mlongscreen.Aseries ofnestedwells,wells2,4,6,8,10,and12,arealigned withgroundwater flowandintersectthedistributiontiles
(Figure1).Thenestedwellsconsistoffourwells, labeledAthroughD.TheAandBwells,installedtoa depthof3.8and3.0m,respectively,allowcollection ofwaterfromthediamicton.WellsCandDhave screeneddepthsthatendat2.3and1.5m,respectively, andaredesignedtocollectgroundwatersamplesfrom thesandandgravelzone.Theother11wellsare screenedtoa2.3-mdepth.Theverticalhydraulicgradientcalculatedfromthenestedwells2,4,6,and8consistentlyhaveadownwardverticalgradient,whereas, nearwells10and12,anupwellingofwatersfromthe diamictonintothesandandgravelzonehasbeen observed.Waterchemistrydatacon firmtheupwelling andindicatethatupwellingmayalsooccurnearwell 20(Akaraetal.,2016).
Figure2.Timeseriesgraphofchlorideconcentrationsmeasuredinwatersofthewellsandthediversionbox.Thesamplingonday-7occurred7 dayspriortotheinjection.Thesampleatthediversionboxonday0waspre-tracerinjection.
TracerTest AtracertestwasconductedwithintheSRBinthespring of2021.ThetracerteststartedonMarch9,2021(day0) followingsustained flowwithinthetilefortheprevious sevendays.Sixkilogramsofsodiumchloride(NaCl)were mixedwith19Lofwaterandaddedtotheupperchamber ofthecontrolbox.Theinjectionintotheupperchamberof thecontrolboxallowedfortheincomingtilewatertofurthermixwiththetracersolutionbeforeenteringintothe middlecompartment,whereitwasdivertedintotheSRB throughthediversiontiles.
Pre-andPost-TracerTestSampling Groundwatersamplesweretakenfromthewellswithin theSRBandthecontrolboxpriortothestartofthetracer testtoascertainthebackgroundconcentrationofthe majoranions.The firstsamplingpost-injectionoccurred after7daysonMarch16,andsamplingcontinuedfor52 daysfollowinginjection.Precipitation(recharge)events occurredondays24and34.Therechargeevents impactedthebreakthroughcurvesfortheCl- (Figure2). Foralllocations, insitu waterqualityparameters,includingspecificconductance,dissolvedoxygen(DO),and temperature,wererecordedusingaYSI85probe.Water levelmeasurementsinthewellswererecordedwithan electronicwatertape.Priortosamplecollection,thewells werepurgedforstabilizationofthe insitu parameters. Fromeachsampledwell,withdrawnwaterwas filtered througha1-mmglass fiber filterandcollectedin60-mL
high-densitypolyethylenecontainers.Sampleswerestored oniceinthe fieldandwhileintransit.Sampleswerestored at4°CuntilbeinganalyzedusingaDIONEXICS-1100ion chromatographformajoranions,chloride(Cl-),bromide (Br-),nitrateasnitrogen(NO3-N),andsulfate(SO42-)followingtheU.S.EnvironmentalProtectionAgencymethod 300.1(HautmanandMunch,1997).
Post-tracergroundwatersamplingstarted7daysafter theinitiationofthetracertest.Initially,theplannedsamplingfrequencywasonceaweek;however,the firstsamplingrevealedelevatedCl- concentrationsinawell,and thesamplefrequencyincreasedtothreetimesaweek. Eachsamplingeventfollowedthesameprotocolasthe pretestsampling.Sampleswerecollectedfromwells4C, 4D,6C,6D,8C,8D,10C,10D,12C,12D,19,20,21, and22duringthe52-daystudyduration.
ChlorideTravelTime Breakthroughcurveanalysiswasusedtocalculatethe traveltimeofCl-.Themeanvelocity(v )of flowofthe tilewaterfromadiversiontiletoawellwascalculated as:
v ¼ d tP ; (1)
where d isthedistancefromtheupgradienttiletothe welland tp isthetimetopeakCl- concentrationidentifiedonthebreakthroughcurve.Thehydraulicconductivity(K)wasdeterminedusingDarcy’slaw:
AlhassanSahadandEricW.Peterson
K ¼ v 3 n ðÞ i ; (2)
where n istheeffectiveporosityoftheaquiferand i isthe hydraulicgradient.Duringthetracertest,thehorizontal hydraulicgradient(i)acrossthestudyareawas0.002m/m. ThehydraulicconductivityvaluescalculatedusingDarcy’s lawwerecomparedtoslugtest–derivedKvaluesusinga paired t-test(a ¼ 0.05)asavalidationofthetracertest.
End-MemberMixingModel WhereasCl- isaconservativeanion,ananionwithlittle tonolossfromchemicalreactionsorsorptioninthe groundwater,theNO3-Nmaynotbehaveconservativelyas itcanbeaddedorremovedfromthesystem.Anend-member,two-component,mixingmodelwasusedtoassessthe transportandfateofnitrate(Triskaetal.,1989).Theend componentswererepresentedbytheupgradientgroundwater(g)andbythewaterinthecontrolbox(t),whichmixed toproducethewatersoftheobservedwell(w).Twoequationswereemployed:
Qw ¼ Qt þ Qg ; (3)
Qw 3 Clw ¼ Qt 3 Clt ðÞ
whereQw,Qt,andQg representthevolumeofwaterfor eachcomponentandClw,Clt,andClg aretheconcentrationsofCl- intheobservedwell,controlbox,andupgradientgroundwater,respectively.Thevolumeofwaterin thewellandgroundwaterwerenotknown,butcombiningEqs.(3)and(4)allowsfortheproportionoftile watertowateratthewelltobecalculated:
Table1. Summarystatisticsforthechlorideconcentrationsamong thewellwatersoftheSRB.
Chloride(mg/L)
WellMinimumMean 6 StandardDeviationMaximum
4C2.903.60 6 0.444.28
4D2.572.83 6 0.193.26
6C2.123.14 6 1.216.45
6D2.022.85 6 1.236.19
8C2.665.90 6 2.9712.39
8D2.865.49 6 2.5210.75
10C4.626.97 6 1.6710.25
10D4.359.82 6 2.6615.49
12C5.699.98 6 2.4915.33
12D6.2610.10 6 2.2015.21
193.986.66 6 2.7112.77
206.1910.01 6 2.3314.42
216.809.21 6 1.3412.63
224.486.24 6 2.3112.09
quantifythelossorgainofnitratefromthewaterasit travelsfromthecontrolboxtotheobservedwells.A measuredNO3-Nconcentrationforagivenwellthatis greaterthanthemodeledconcentrationfromEq.(6) impliesthatthereisadditionofnitrate,i.e.,nitrification. Ameasuredconcentrationlessthanthemodeledconcentrationindicatesnitrateremoval,whichcouldbedueto denitrificationorplantuptake.
RESULTS ChlorideData AssumingaconservativenaturefornitrateandsubstitutingtheconcentrationofNO3-NforCl-,Eq.(5)canbe rearrangedtocalculatetheexpectedconcentrationof NO3-Ninanobservedwell(NO3-Nw):
ThebackgroundconcentrationoftheCl- inthegroundwaterandthewatersofthecontrolboxwerestablepriorto thestartofthetest(Figure2).Afterinjection,concentrations inthewatersofthedowngradientwellsincreased,whereas theconcentrationswithinthewatersofthecontrolbox decreased.TheconcentrationsoftheCl- inthegroundwater asmeasuredfromthewellsdownstreamofthediversiontile rangedfromaslowas2.02mg/Ltoamaximumof15.49 mg/L(Table1).Wells4Cand4DexhibitednoelevatedClconcentrations,whereaswells6Cand6Dexperienced higherCl- concentrationsfollowingtherechargeevents whenallotherwellsexperienceddilutions.Giventhelack ofaresponseinCl- concentrations,well6wasinterpreted asnotreceivinginputfromtheupgradienttiles.
Theconcentrationscalculatedforthewell(NO3-Nw)representedthetheoreticalNO3-NconcentrationassumingdilutionistheonlymechanismactingontheNO3-N.However, nitrateisnotconservativeandcanbeaddedvianitrification andremovedthroughdenitrificationorplantuptakefroman SRB.DifferencesbetweenthemodeledNO3-Nw concentrations,Eq.(6),andthemeasuredNO3-Nconcentrations
Recordedpeakconcentrationswereobservedoneither day33or37ofthetestdespitetherechargeeventsondays 24and34thatdilutedconcentrationsinthewellwaters(Figure2andTable1).Velocitiesforwaterstravelingfromthe tilestothewells,calculatedfromEq.(1),rangedfrom0.03 to0.34m/daywithameangroundwatervelocityof0.19m/ day(Figure3andTable2).UsingEq.(2),thecalculatedvelocityvalues,ahorizontalgradientof0.002, andaneffectiveporosityof0.032,amagnitudelower
Figure3.Boxandwhiskerplotsforthegroundwatervelocitiescalculatedusingthepeakchloridearrivaltimes(tp)withacomparisonofhydraulic conductivityvaluesgeneratedfromthetracertestandfromslugtestsconductedinthewells.Theendsoftheboxesrepresentthe25thand75th percentileswiththesolidlineatthemedianandthedashedlineatthemean;theerrorbarsdepictthe10thand90thpercentiles,andthepoints representthe5thand95thpercentiles.Dashedlinerepresentsthemeanvalue.
thanthemeasuredporosity(Sanksetal.,2015),the hydraulicconductivity(K)valuesrangedfrom5.31 3 10 6 m/sto6.32 3 10 5 m/s(Figure3).Amongthe wells,nosignificantdifferencewasobservedbetweenthe Kvaluesobtainedfromthetracertest(M ¼ 3.43 3 10 5 , SD ¼ 1.95 3 10 5)andKvaluescalculatedfromthe slugtest(M ¼ 2.65 3 10 5,SD ¼ 2.02 3 10 5 ; t(5) ¼ 0.741, p ¼ 0.492).Thesimilaritybetweenthetracer hydraulicconductivityandslugtesthydraulicconductivityvaluesprovidedvalidationofthetracertestresults.
EndMemberMixingModel Resultsfromthemixingmodelaregroupedintotwosets. The firstsetresultedfromquantifyingtheproportionoftile
watertogroundwaterinthewatersreceivedinthedowngradientwells(Eq.5),andthesecondsetwasgeneratedbycalculatingtheexpected(modeled)concentrationoftheNO3-N inthewellwatergiventhemixingofwaters(Eq.6).The differencebetweenthemodeledconcentrationandthemeasuredconcentrationinthewellwaterindicatedeitheran additionoraremovalofNO3-N.Tocalculatetheproportion oftilewatertogroundwater,thetimetopeakconcentration (tp)wasincorporatedbyusingconcentrationsoftilewater ( Clt)andgroundwater(Clg) tp dayspriortothedayofsampling,usingtheconcentrationmeasuredinthewell(Clw)for thedayofthesampling.Todetermine Clt forthedaysin whichasamplingwasnotperformed,theconcentrations werelinearlyinterpolatedbetweentheprecedingandfollowingsampledconcentrationsdates.Thetimeseriesnatureof
Table2. Timetopeak(tp),tracervelocities,andhydraulicconductivityvaluesforthedowngradientwells.
NA ¼ noslugtestshavebeencompletedwithinthewell.
Table3. Ratiosoftilewater(Qt)relativetothegroundwater(Qw) calculatedinthesampledwells.
thesamplescollectedgenerallyexhibittemporalcontinuity, sousingthatmethodofinterpolationwaslogical.ThismethodologyresultedinalimitedsetofthedatabecausethecalculationofNO3-Nconcentrationscouldonlystartafterthe daytheCl- arrivedatagivenwell.Thus,resultsofthemixingmodelstartthedayoftheobservedpeak(tp).
Themixingoftilewaterandgroundwatervariedspatiallyandtemporallyduringthedurationofthetest. Amongthewells,meanratios(Qt/Qw fromEq.[5]) rangedfrom0.09to0.72(Table3).Thevariabilityof theratiossuggestedheterogeneitieswithinthemedium hadaninfluenceonthemixingthatoccurswithinthe SRB.ModeledNO3-Nw concentrationsforthedowngradientwells,Eq.(6),indicatedthattheSRBbothcontributedandremovednitratetoandfromthesystem(Figure 4andTable4).Uptoday43,wells8D,10C,10D,12C, 12D,and20experiencedmeasuredconcentrationsthat weretwotimeslargerthanthepredictedconcentrations, indicatingthatnitratewasaddedtothesystem(Figure 4).Inthefourotherwells,measuredNO3-Nconcentrationswerebelowthemodeledconcentrations.Byday 47,watersinallthewellsrecordedNO3-Nconcentrationsbelowthemodeledconcentrations,signifyinga lossofnitrateinthesystem.
DissolvedOxygen TheDOconcentrationsinthedowngradientwellsranged from0.88to11.21mg/L(Figure5).Pre-testandearlyDO concentrationsweregenerallythehighestobservedconcentrations.Concentrationsbegantodecreasefollowingday7. Atday36,onlywells10Cand19hadDOconcentrations higherthan4.5mg/L,andbyday52,allwellshadconcentrationslessthan4.5mg/L.
DISCUSSION Duringthetracertest,allwaterenteringthecontrol structurewasredirectedintothediversiontiles.The
two-componentmixingmodelverifiedthatthedowngradientwellsreceivedtilewatersthathadmixedwiththe incominggroundwaters.Theincorporationofthetilewater intothegroundwaterwasnotuniformthroughoutthesystem asnotedbythespatiallyvariableratiooftilewaterto groundwatercalculatedforthewells.Thevariabilitycould bearesultofeitherheterogeneityoftheglacialmaterialsor afunctionoftheerrorassociatedwiththeinterpolationof Cl- concentrationsrequiredtoensurethecorrectlagtime. Thereisthelimitationofusingatwo-componentmixing modelwhenthefrequencyofsamplingisnotoptimal (Andersonetal.,2014),butwefeeltheobservednitrate lossesprovidedviableresults,whichalignedwithother studies(Uttetal.,2015;JaynesandIsenhart,2019).
Themixingmodelresultsidentifiedperiodsofnitrate additionandremovalbytheSRB.Thenitrateremoval rangedfrom23to97percent.Whereasthisisalarge range,thevaluesareconsistentwithotherreportedvalues. Uttetal.(2015)reportedthatnitratereductionsrangefrom 23 6 28percentintheSRBswithintheMidwest.Inthe fallfallowseason,BrooksandJaynes(2017)documented a61percentreduction.JaynesandIsenhart(2019)providedthemostcomprehensivesaturatedbufferassessment todatewithmonitoringofsixsaturatedbuffersinIowa. Theyreportedannualnitratelossrangingfrom7to92percentinindividualyearsandaveraged44 6 26percent (median,35percent)acrossallsiteyears.Inareview paper,Johnsonetal.(2023)summarizedfrom fivestudies withproperdesignstotalNloadreductionsrangingfrom7 to92percent.
Withalltilewaterdivertedintothesystem,theSRBhad thepotentialtoremoveasignificantquantityofthenitrate transportedwithintheagriculturaldischarge.Nitrate removalcouldoccurviadenitrificationofnitratetoN2 or N2Ogas,plantuptake,microbialassimilation,anddissimilatorynitratereductiontoammonium(Lutzetal.,2020). Theseprocessestaketimetooccur,andthetimerequired fortilewaterstomovethroughtheSRBisanimportant aspectfortheutilizationofSRBsasanutrient-reduction strategy.WhilequantifyingtheeffectivenessofanSRBto reducetileNO3-NconcentrationsineasternIowa,Streeter andSchilling(2021)reporteddenitrificationbegantooccur withinlessthanaday.Withinaspanof7days,theyreported a10-foldreductionfrom15mg/LNO3-Nto1.5mg/L. Applyingtheirresultstothiswork,theobservedtraveltimes of33to37daysforwatersfromthediversiontilestothe wellsshouldhaveprovidedsufficienttimeforremovalof nitratewithintheT3SRB.
ThetransportandbehaviorofnitratereflectstheconditionswithintheSRB.Asthetilebeganto flowandsaturatethevadosezone,theDOconcentrationswithinthe watersreflectedaerobicconditionsconducivetonitrification.WithinthestudiedSRB,previousworksobserved increasedconcentrationsofNO3-Ninwaterduringthe
Figure4.(A)Modelnitrateasnitrogen(NO3-N)concentrationsversusobservedNO3-Nconcentrationsinwatersofthewellsfordays33–52. Pointsbelowthe1:1lineindicateadditionofnitrate,andpointsaboverepresentremovalofnitrate.(B)PercentagedifferencebetweenthemodeledandobservedNO3-Nconcentrationsforgivendaysfollowingtracerinjection.Thepositivedifferencesindicateremoval(denitrificationor plantuptake),andnegativedifferencessignifyaddition(nitrification)ofNO3-N.
non-growingseason(Milleretal.,2019;Bosompemaa etal.,2021).Bosompemaaetal.(2021)hypothesized thatthedegradationoftheplantmaterialduringthe non-growingseasongeneratednitrateinthevadose zone.Duringmultiple24-hoursamplingeventsinthe winterandspring,Milleretal.(2019)observedrising NO3-Nconcentrationsofthegroundwater,attributing theincreasetonitrifi cationassociatedwiththeassimilationofdecayingplantmaterial.Thetimingofthe observationsbyMilleretal.(2019)repr esentedthe sametimeperiodastheinitiationofthetracertest. Whereasthetilediversionsystemhadbeenrunningfora
coupleofdayspriortothestartofthetest,theunsaturated zoneoftheSRBwasbeginningtobecomesaturated.We positedthatthenitrateaccumulatedfromthedecayand degradationofplantmaterialwithintheunsaturatedzone duringthefallandwinterwasbeing flushedfromthe unsaturatedzone,contributingtotheelevated(above modeled)NO3-Nconcentrations.TheNO3-Nconcentrationsabovethemodeledconcentrationsweremeasuredin wellswithDOconcentrationsabove4.5mg/L,thethresholdobservedfordenitrificationbyAndersonetal.(2014). AsthesoilsoftheSRBsaturated,DOconcentrations decreased,fallingbelow4.5mg/Linallwellwaterbythe
Table4. DifferencebetweenmodeledconcentrationsofNO3-Nduringthevarioussamplingandthecorrespondingpercentagedifferenceinconcentration.Positivevalues,modeledvaluesweregreaterthanthemeasuredconcentrations,suggesttheremovalofnitratealongthepathway fromtiletowell,whereasnegativevaluesareindicativeofnitrateadditionalongthepathway.
conclusionofthetest(Figure5).ThelowerDOconcentrationscoincidedwithmeasuredNO3-Nconcentrations fallingbelowthemodeledconcentrations,whichindicatedalossorremovalofnitratefromthesystem.
Plantuptakeanddenitrificationhavebeenpostulatedas meanstoremovenitratewithintheT3SRB(Milleretal., 2019;Bosompemaaetal.,2021).Denitrificationleadstothe permanentremovalofnitrate,whereastheplantuptakeisa temporalremovalofnitrate.Theoccurrenceofdenitrificationrequiresanaerobicconditionsandlabileorganiccarbon. WhentheagriculturalrunoffenterstheSRB,therunoffdisplacesoxygeninthesoil,creatinganaerobicconditions.The averagemeasureddissolvedoxygenduringtheperiodofthe tracertestis4mg/L.StreeterandSchilling(2021)observed thatdenitrificationismostlydominantwhenthedissolved oxygenratewithinanSRBrangesfrom2to4.5mg/L.With DOconcentrationsbelow4.5intheT3SRB,thestudysite hadtherequiredanaerobicconditionsrequiredfordenitrificationtotakeplace.
Asoilorganiccarboncontentgreaterthan0.75percent isrecommendedtoinducedenitrification(USDA-NRCS, 2018;JaynesandIsenhart2019).Thesurficialmaterials,the top1.5m,oftheT3SRBcomprisesiltsandclays,richwith organicmatter.Bosompemaaetal.(2021)reportedanaverageorganicmattercontentatthestudysitetobe6.0percent atadepthof60cm,indicatingthatthereissufficientorganic matterfordenitrificationtooccurwithinthestudysite. Whereasplantuptakehasbeenproposedasacontributing factortotheobservedlossofnitratewithinthesite,the uptakerequirestheplantstobegrowing.Asarestoredprairie,thestudysiteisdominatedbyswitchgrass,whichcan recover66percentofappliednitrogen(Bransbyetal., 1998).However,attheinitiationofthetracertest,theplants werestilldormant.InApril,theplantswerebeginningto emergefromdormancy,andgrowthwasobserved.Whereas theremovalofnitratealignswiththereemergenceofthe plants,anobservationconsistentwithotherstudies(Munoz etal.,1993;Clémentetal.,2003;andLietal.,2016),the
observedreductionofnitrateinwellspriortoplantgrowth supporteddenitrificationasthemainremovalmechanism (Milleretal., 2019;Lutzetal.,2020).Additionalsupport fordenitrificationcomesfromGrohetal.(2019);they reported insitu denitrificationwithinSRBsviatheacetyleneinhibitionmethodandfoundoutthatdenitrification accountedforbetween4and77percentofthetotalnitrate removedwithintheSRB.
Anexpectationwouldbethatwaterssampledfromwells fartherawayfromdiversiontileswouldhaveexperienced greaternitrateremovalgiventheextendedtraveldistance andtime.However,thewellsclosertothediversiontiles experiencedgreaterlossofnitrate.Wells19and22experiencedaverageremovalofnitraterepresenting91and59percentofthenitratedeliveredfromthetilewaters,whereas wellsfartherdowngradient,wells10and12,witnessed meandifferencesrepresentinganadditionofnitrate.However,bytheendofthetest,NO3-Nconcentrationsforthe watersinallwellsshowalossofnitratewithmaximumloss rangingfrom23to97percent.Additionally,similarresearch conductedbyAndersonetal.(2014)showedthattherewas nostrongrelationshipbetweentheamountofnitrate removedanddistanceawayfromdiversiontiles.They observedsomewellsclosertodiversiontilesthathadhigher nitrateremoval,andtheirresultscomparequitewellwith theresultsfromourtest.
CONCLUSIONS Theresultsfromthetracertesthighlightedperiodsof differentnitratebehavior,additionandremoval,withinthe SRB.WhentheSRBwasbeingsaturatedatthebeginning ofthetracertest,theintroducedtilewaters flushedthe vadoseofnitrateaccumulatedfromthebreakdownof plants.Limiteddenitrificationoccurredasthepresenceof aerobicconditionsnearwellswouldpreventdenitrification.AstheSRBcontinuedtoreceivetilewater,aerobic conditionstransitionedtowardanerobicconditions,which
AlhassanSahadandEricW.Peterson
Figure5.(A)Dissolvedoxygenconcentrationsmeasuredwithinthewellwatersforthedurationofthetracertests.(B)Measureddissolvedoxygenconcentrationwithinthewellwatersongivensamplingdates.Negativesdaysarepre-testwiththeinjectionbeginningthetracertestoccurringonday0.Thehorizontalshadedhighlightstheconcentrationfrom2to4.5mg/Linbothgraphs.Theverticalshadedareain(B)indicatesthe periodcorrespondingtothemixing-modelresults.
correspondedtoacoincidingdecreaseinNO3-NconcentrationsthatwerebelowtheexpectedNO3-Nconcentrations.Astimeprogressedandtheplantsbecamemore active,greaterlossofnitratewascalculated.Overall,the SRBwitnessednitratereductionsbetween23and97percent.Theobservedreductionscomparedfavorablywith otherpublishedstudiesexploringSRBandreinforcedthe effectivenessofSRBstoremovenitrate.Thus,SRBs remainaneffectivenitrateloss-reductionpractice,However,SRBsalonewilllikelynotbesufficienttomeetthe waterqualitygoalssetoutbytheIllinoisNutrientLoss ReductionStrategy
ACKNOWLEDGMENTS Theauthorsthankthreeanonymousreviewersfortheir commentsandfeedback,whichhaveimprovedthepaper. ThisresearchwasfundedbytheIllinoisWaterResources Center,grantnumber079901-17840.Theauthorsthank
theCityofBloomington(IL)foraccesstothestudy location.Allauthorscontributedtothestudyconception anddesign.Materialpreparationanddatacollectionby A.S.andE.W.P.DataanalysisandvisualizationsbyA.S. andE.W.P.The firstdraftofthemanuscriptwaswritten byA.S.withA.S.andE.W.P.workingonthe finalpaper. Allauthorsreadandapprovedthe finalmanuscript.
REFERENCES AKARA,M.;BRUENING,B.;CHABELA,L.P.;FRANCIS,A.K.;HAPPEL,A.; HAWN,W.;KISFALUSI,Z.D.;MEISTER,P.;MILLER,J.;RHOADS,M.; O’REILLY,C.;PETERSON,E.W.; AND TWAIT,R.,2016,Groundwater flowalongagravel-sandlenseinaglaciatedterrain. Geological SocietyofAmericaAnnualMeeting,Denver,CO,2016,Vol.48: GeologicalSocietyofAmerica,doi:10.1130/abs/2016AM-285159 ANDERSON,T.R.;GROFFMAN,P.M.;KAUSHAL,S.S.; AND WALTER,M.T., 2014,Shallowgroundwaterdenitrificationinriparianzonesofa headwateragriculturallandscape: JournalEnvironmentalQuality, Vol.43,pp.732–744.
BECKER,J.P. AND PETERSON,E.W.,2022,Streamrecoverypostchannelization:Acasestudyoflow-gradientstreamsincentralIllinois, USA: Hydrology,Vol.9,p.160.
BOSOMPEMAA,P.;PETERSON,E.W.;PERRY,W.; AND SEYOUM,W.M.,2021, Recyclingofnitrateandorganicmatterbyplantsinthevadosezone ofasaturatedriparianbuffer: WaterAirandSoilPollution,Vol.232, No.245,pp.14,doi:10.1007/s11270-021-05202-3
BRANSBY,D.;MCLAUGHLIN,S.; AND PARRISH,D.,1998,Areviewofcarbonandnitrogenbalancesinswitchgrassgrownforenergy: BiomassBioenergy,Vol.14,pp.379–384.
BROOKS,F. AND JAYNES,D.,2017, Quantifyingtheeffectivenessof installingsaturatedbuffersonconservationreserveprogramto reducenutrientloadingfromtiledrainagewaters:UnitedStates DepartmentofAgriculture,AG-3151-P-16-0225,55p.
CARSTENSEN,M.V.;HASHEMI,F.;HOFFMANN,C.C.;ZAK,D.;AUDET,J.; AND KRONVANG,B.,2020,Efficiencyofmitigationmeasurestargetingnutrientlossesfromagriculturaldrainagesystems:Areview: Ambio,Vol.49,pp.1820–1837.
CHANDRASOMA,J.M.;CHRISTIANSON,R.D.; AND CHRISTIANSON,L.E., 2019,Saturatedbuffers:WhatistheirpotentialimpactacrosstheUS Midwest? AgriculturalEnvironmentalLetters,Vol.4,p.180059.
CLÉMENT,J.C.;HOLMES,R.M.;PETERSON,B.J.; AND PINAY,G.,2003, Isotopicinvestigationofdenitrificationinariparianecosystemin westernFrance: JournalAppliedEcology,Vol.40,pp.1035–1048. DAVID,M.B. AND GENTRY,L.E.,2000,AnthropogenicinputsofnitrogenandphosphorusandriverineexportforIllinois,USA: Journal EnvironmentalQuality,Vol.29,pp.494–508.
FAUSEY,N.R.;BROWN,L.C.;BELCHER,H.W.; AND KANWAR,R.S.,1995, DrainageandwaterqualityinGreatLakesandcornbeltstates: JournalIrrigationDrainageEngineering,Vol.121,pp.283–288.
GENTRY,L.E.;DAVID,M.B.;SMITH,K.M.; AND KOVACIC,D.A.,1998, Nitrogencyclingandtiledrainagenitratelossinacorn/soybean watershed: AgricultureEcosystemsEnvironment,Vol.68,pp.85–97.
GROH,T.A.;DAVIS,M.P.;ISENHART,T.M.;JAYNES,D.B.; AND PARKIN, T.B.,2019,Insitudenitrificationinsaturatedriparianbuffers: JournalEnvironmentalQuality,Vol.48,pp.376–384.
HAUTMAN,D.P. AND MUNCH,D.J.J.E.O.,1997,Method300.1: Determinationofinorganicanionsindrinkingwaterbyionchromatography: U.S.EnvironmentalProtectionAgency,Cincinnati,OH,40p.
HypoxiaTaskForce,2018, Progressreportoncoordinationfornonpoint sourcemeasuresinhypoxiataskforcestates:U.S.Environmental ProtectionAgency,39p.
IllinoisEnvironmentalProtectionAgency;IllinoisDepartmentof Agriculture;andUniversityofIllinoisExtension,2019, Illinois NutrientLossReductionStrategybiennialreport2017-2018, IISG19-RCE-RLA-071,Spring field,IL.
JAYNES,D.B. AND ISENHART,T.M.,2014,Reconnectingtiledrainageto riparianbufferhydrologyforenhancednitrateremoval: Journal EnvironmentalQuality,Vol.43,pp.631–638.
JAYNES,D.B. AND ISENHART,T.M.,2019,Performanceofsaturated riparianbuffersinIowa,USA: JournalEnvironmentalQuality, Vol.48,pp.289–296.
JOHNSON,G.;CHRISTIANSON,L.;CHRISTIANSON,R.;DAVIS,M.;DÍAZGARCÍA,C.;GROH,T.;ISENHART,T.;KJAERSGAARD,J.;MALONE,R.; PEASE,L.A.; AND ROGOVSKA,N.,2023,Effectivenessofsaturated buffersonwaterpollutantreductionfromagriculturaldrainage: JournalNaturalResourcesAgriculturalEcosystems,Vol.1,pp.49–62.
KAUR,G.;ZURWELLER,B.A.;NELSON,K.A.;MOTAVALLI,P.P.; AND DUDENHOEFFER,C.J.,2017,Soilwaterloggingandnitrogenfertilizermanagementeffectsoncornandsoybeanyields: Agronomy Journal,Vol.109,pp.97–106.
KEENEY,D.R. AND HATFIELD,J.L.,2008,Thenitrogencycle,historical perspective,andcurrentandpotentialfutureconcerns.InHatfield, J.L.andFollett,R.F.(Editors), NitrogenintheEnvironment (SecondEdition),AcademicPress,SanDiego,pp.1–18.
LEMKE,A.M.;KIRKHAM,K.G.;LINDENBAUM,T.T.;HERBERT,M.E.; TEAR,T.H.;PERRY,W.L.; AND HERKERT,J.R.,2011,Evaluating agriculturalbestmanagementpracticesintile-drainedsubwatershedsoftheMackinawRiver,Illinois: JournalEnvironmental Quality,Vol.40,pp.1215–1228.
LI,X.;RENNENBERG,H.; AND SIMON,J.,2016,SeasonalvariationinN uptakestrategiesintheunderstoreyofabeech-dominatedN-limited forestecosystemdependsonNsourceandspecies: TreePhysiology, Vol.36,pp.589–600.
L UTZ ,S.R.;T RAUTH ,N.;M USOLFF,A.;VAN B REUKELEN ,B.M.; K NÖLLER ,K.; AND F LECKENSTEIN ,J.H.,2020,Howimportantis denitri fi cationinriparianzones?Combiningend-membermixingandisotopemodelingtoquantifynitrateremovalfrom ripariangroundwater: WaterResourcesResearch ,Vol.56,p. e2019WR025528.
MATTINGLY,R.L.;HERRICKS,E.E.; AND JOHNSTON,D.M.,1993,ChannelizationandleveeconstructioninIllinois:Reviewandimplicationsfor management: EnvironmentalManagement,Vol.17,pp.781–795.
MILLER,J.;PETERSON,E.W.; AND BUDIKOVA,D.,2019,Diurnalandseasonalvariationinnitrate-nitrogenconcentrationsofgroundwaterina saturatedbufferzone: HydrogeologyJournal,Vol.27,pp.1373–1387.
MILLER,J.D.;SCHOONOVER,J.E.;WILLIARD,K.W.J.; AND HWANG, C.R.,2011,Wholecatchmentlandcovereffectsonwaterquality inthelowerKaskaskiaRiverWatershed: WaterAirSoilPollution, Vol.221,pp.337–350.
MUNOZ,N.;GUERRI,J.;LEGAZ,F.; AND PRIMO-MILLO,E.,1993,Seasonaluptakeof15N-nitrateanddistributionofabsorbednitrogen inpeachtrees: Plantsoil,Vol.150,pp.263–269.
PETERSON,B.J.;WOLLHEIM,W.M.;MULHOLLAND,P.J.;WEBSTER,J.R.; MEYER,J.L.;TANK,J.L.;MARTÍ,E.;BOWDEN,W.B.;VALETT,H.M.; HERSHEY,A.E.;MCDOWELL,W.H.;DODDS,W.K.;HAMILTON,S.K.; GREGORY,S.; AND MORRALL,D.D.,2001,Controlofnitrogenexport fromwatershedsbyheadwaterstreams: Science,Vol.292,pp.86–90.
ROBERTSON,D.M. AND SAAD,D.A.,2013,SPARROWmodelsusedto understandnutrientsourcesintheMississippi/AtchafalayaRiver Basin: JournalEnvironmentalQuality,Vol.42,pp.1422–1440.
SANKS,K.;PETERSON,E.W.;TAYE,T.;O’REILLY,C.;KISFALUSI,Z.D.; ROTHSCHILD,T.J.; AND TWAIT,R.,2015,Understandingtheamountof nitrateinrelationtopercentoforganicmatterinriparianbufferzone soilsatstreamT3inHudson,Illinois: AbstractswithPrograms,GeologicalSocietyofAmerica,Baltimore,MD,Vol.47,No.7,p.534.
STREETER,M.T. AND SCHILLING,K.E.,2021,QuantifyingtheeffectivenessofasaturatedbuffertoreducetileNO3-Nconcentrationsineastern Iowa: EnvironmentalMonitoringAssessment,Vol.193,p.500.
TRISKA,F.J.;KENNEDY,V.C.;AVANZINO,R.J.;ZELLWEGER,G.W.; AND BENCALA,K.E.,1989,Retentionandtransportofnutrientsina third-orderstreaminnorthwesternCalifornia:Hyporheicprocesses: Ecology,Vol.70,pp.1893–1905.
U.S.DepartmentofAgriculture–NaturalResourcesConservationService, 2018, Conservationpracticestandard,saturatedbuffer,code604. USDA-NRCS fieldofficetechnicalguide:Bismarck,ND,4p.
U.S.EnvironmentalProtectionAgency,2017, MississippiRiver/Gulfof MexicoWatershedNutrientTaskForce2017ReporttoCongress: Washington,DC,121p.
UTT,N.;JAYNES,D.; AND ALBERTSEN,J.,2015,Demonstrateandevaluate saturatedbuffersat fieldscaletoreducenitratesandphosphorusfrom subsurface fielddrainagesystems: MississippiRiverBasinWaterManagement,pp.1–74.
WEEDMAN,N.R.;MALONE,D.H.; AND SHIELDS,W.E.,2014, SurficialgeologicmapoftheNormalWest7.5MinuteQuadrangle,McLeanCounty, Illinois,2014GSAAnnualMeeting:Vancouver,BritishColumbia.
WICKHAM,S.S.;JOHNSON,W.H.; AND GLASS,H.D.,1988, Regional geologyoftheTiskilwatillmember,Wedronformation,northeasternIllinois:Circularno.543.
Environmental&EngineeringGeoscienceJournal (ISSN10787275),Copyright © 2024bytheAssociationofEnvironmental& EngineeringGeologists(AEG)andtheGeologicalSocietyof America(GSA)ispublishedquarterly.EditorialOffices:The UniversityofMississippi,DeptofGeologyandGeological Engineering,University,MS38677.AccountingandCirculation Offices:AEG,2840WestBayDrive#141,BelleairBluffs,FL 33770-2620.Call(727)940-2658x2004tosubscribe.Periodicals postageispaidatAEG,2840WestBayDrive#141,Belleair Bluffs,FL33770-2620.
POSTMASTER: SendaddresschangestoAEG,2840West BayDrive#141,BelleairBluffs,FL33770-2620.Phone: (727)940-2658x2004.Includebotholdandnewaddresses, withZIPcode.CanadaagreementnumberPM40063731. ReturnundeliverableCanadianaddressestoStationAP.O.Box 54,Windsor,ONN9A6J5Email:returnsil@imexpb.com.
CLAIMS: Claimsfordamagedornotreceivedissueswillbe honoredfor6monthsfromdateofpublication.AEGmembers shouldcontactAEG,2840WestBayDrive#141,BelleairBluffs, FL33770-2620.Phone:(727)940-2658x2004.GSAmembers whoarenotmembersofAEGshouldcontacttheGSAMember Servicecenter.Allclaimsmustbesubmittedinwriting.
DISCLAIMERNOTICE: Authorsaloneareresponsiblefor viewsexpressedinarticles.Advertisersandtheiragenciesare solelyresponsibleforthecontentofalladvertisementsprinted andalsoassumeresponsibilityforanyclaimsarisingtherefrom againstthepublisher.AEGandEnvironmental&Engineering Geosciencereservetherighttorejectanyadvertisingcopy.
SUBSCRIPTIONS:
Membersubscriptions: AEGmembers automaticallyreceive digitalaccesstothejournalaspartoftheirAEGmembership dues.Membersmayorderprintsubscriptionsfor$75peryear. GSAmembers whoarenotmembersofAEGmayorderfor$60 peryearontheirannualGSAduesstatementorbycontacting GSA.
Nonmembersubscriptions are$310andmaybeorderedfrom thesubscriptiondepartmentofeitherorganization.Apostage differentialof$10mayapplytononmembersubscribersoutside theUnitedStates,Canada,andPanAmerica.ContactAEGat (727)940-2658x2004;contactGSASubscriptionServices, Geological SocietyofAmerica,P.O.Box9140,Boulder,CO80301.
Singlecopies are$75.00each.Requestsforsinglecopiesshouldbe senttoAEG,2840WestBayDrive#141,BelleairBluffs,FL 33770-2620.
© 2024bytheAssociationofEnvironmentalandEngineering Geologists
Allrightsreserved.Nopartofthispublicationmaybereproducedor transmittedinanyformorbyanymeans,electronicormechanical, includingphotocopying,recording,orbyanyinformationstorageand retrievalsystem,withoutpermissioninwritingfromAEG.
THISPUBLICATIONISPRINTEDONACID-FREEPAPER EDITORS
THOMAS OOMMEN
DepartmentofGeologyand GeologicalEngineering TheUniversityofMississippi University,MS38677 toommen@olemiss.edu
WATTS,CHESTER “SKIP” F. RadfordUniversity HASAN,SYED UniversityofMissouri, KansasCity
ADVISORYBOARD
NANDI,ARPITA EastTennesseeStateUniversity SASOWSKY,IRA D. UniversityofAkron
ASSOCIATEEDITORS
ACKERMAN,FRANCES RambollAmericasEngineering Solutions,Inc.
BASTOLA,HRIDAYA LehighUniversity
BEGLUND,JAMES MontanaBureauofMinesand Geology BRUCKNO,BRIAN VirginiaDepartmentof Transportation CLAGUE,JOHN SimonFraserUniversity,Canada DEE,SETH UniversityofNevada,Reno FRYAR,ALAN UniversityofKentucky GARDNER,GEORGE MassachusettsDepartmentof EnvironmentalProtection GHOSH,SUMAN CaliforniaDepartmentof Conservation
HAUSER,ERNEST WrightStateUniversity KEATON,JEFF WSPUSA
MAY,DAVID USACE-ERDC-CHL POPE,ISAAC BookReviewEditor SANTI,PAUL ColoradoSchoolofMines SCHUSTER,BOB SHLEMON,ROY R.J.Shlemon&Associates,Inc. STOCK,GREG NationalParkService SWANSON,SUSAN (SUE) BeloitCollege ULUSAY,RESAT HacettepeUniversity,Turkey WEST,TERRY PurdueUniversity
SubmittingaManuscript
Environmental&EngineeringGeoscience (E&EG),isaquarterlyjournaldevotedtothepublicationoforiginalpapersthatareofpotentialinteresttohydrogeologists,environmentalandengineeringgeologists,and geologicalengineersworkinginsiteselection,feasibilitystudies,investigations,designorconstructionofcivilengineeringprojectsorinwaste management,groundwater,andrelatedenvironmentalfields.Allpapers arepeerreviewed.
Theeditorsinvitecontributionsconcerningallaspectsofenvironmental andengineeringgeologyandrelateddisciplines.Recentabstractscanbe viewedunder “Archive” atthewebsite, “http://eeg.geoscienceworld.org” Articlesthatreportonresearch,casehistoriesandnewmethods,andbook reviewsarewelcome.Discussionpapers,whicharecritiquesofprinted articlesandaretechnicalinnature,maybepublishedwithrepliesfrom theoriginalauthor(s).Discussionpapersandrepliesshouldbeconcise.
Tosubmitamanuscriptgotohttps://www.editorialmanager.com/EEG/ default.aspx.Ifyouhavenotusedthesystembefore,followthelink atthebottomofthepagethatsaysNewusersshouldregisterforan account.Chooseyourownloginandpassword.Furtherinstructions willbeavailableuponloggingintothesystem.Uponsubmission,manuscriptsmustmeet,exactly,thecriteriaspecifiedintherevisedStyle Guidefoundathttps://www.aegweb.org/e-eg-supplements.
Manuscriptsoffewerthan10pagesmaybepublishedasTechnical Notes.ThenewoptionalfeatureofOpenAccessisavailableuponrequestfor$750perarticle.
Forfurtherinformation,youmaycontactDr.ThomasOommenatthe editorialoffice.
Coverphoto Author,K.Tramm,screenssoilforheavymetalconcentrationsusinganXRFunit followingremedialwork.PhotographcourtesyofJasonT.Minter.Seearticleon page95.
ERIC PETERSON
DepartmentofGeography, Geology,andtheEnvironment IllinoisStateUniversity Normal,IL61790 309-438-5669 ewpeter@ilstu.edu
K AREN E.SMITH ,EditorialAssistant,kesmith6@kent.edu