OpenAccessArticle
ACenturyofLandslidesinSeattle,Washington:
CoalescingandDigitizingtheCity’sHistoricLandslide Inventories
ELIZABETHJ.DAVIS*
DepartmentofEarthandSpaceSciences,UniversityofWashington,JohnsonHall Rm070,400015thAvenueNE,Seattle,WA98195
SUSANCHANG
SeattleDepartmentofConstructionandInspections,P.O.Box34019,Seattle, WA98124
STEVEHOU
SeattleDepartmentofTransportation,P.O.Box34996,Seattle,WA98124
TAMMYTEAL
JacobsEngineeringGroup,Inc.,1110112thAvenueNE,Bellevue,WA98004
KEVINCOWELL
Shannon&Wilson,Inc.,3990CollinsWay,Suite100,LakeOswego,OR97035
SANDRAGARCIA-ARCEO
1212144thStreetSW,Lynnwood,WA98087
KeyTerms: Landslides,GeologicHazardsMaps,GeologicHazards,LandUse,UrbanGeology,UrbanPlanning,EngineeringGeology,PublicPolicy

ABSTRACT
Landslideshaveimpactedthebuiltenvironmentofthe cityofSeattleforoveracentury.WepresentanewhistoriclandslideinventoryforSeattlebuiltfromover100 yearsoflandsliderecords.Seattlehastrackedlandslide occurrencesincethe1890sandhascommissionedvariousstudiestoexaminewhereandwhylandslidesoccur.Duringthistenure,methodsforcollection,display, anddisseminationoflandslidedatahavevaried,resultinginacomplex,non-uniform,andrichdataset.For thenewdatabasecompletedin2019,multipleinventoriesandthousandsofhistoricdocumentswerecombinedtomeettheCityofSeattle’sobjectivesofkeeping landslideareasprecisewithrespecttopropertyboundaries.Comparedwithpriormaps,thenewmapprovidesmoreinformationfromthehistoricalrecord,maps landslideextentmoreaccurately,andtagsfewerpri-
*Correspondingauthoremail:edav@uw.edu
vatepropertieswithlandslidefeaturesthanpriormaps. Inaddition,digitizedhistoricdocumentsarenowattachedtolandslidefeaturesintheCityofSeattle’s publicgeographicinformationsystem(GIS)map.The historicinventoryiscomplementarytoalightdetectionandranging(LiDAR)inventorycoveringthesame area.Thiscasestudyshowshowhistoricdatacanbe usedtorecordlandslidesinurbanareaswheregeomorphologicalsignaturesmayberemovedbydevelopment. InSeattle,accesstoinformationabouthistoriclandslideswillstreamlineworkflowsforpublicandprivate engineersandgeologistsandwillservepropertyownersandthegeneralpublic.Themapiscurrentlyavailableathttps://www.arcgis.com/apps/webappviewer/ index.html?id = f822b2c6498c4163b0cf908e2241e9c2.
INTRODUCTION
Landslidemapsarecriticaltohazardplanning worldwide,andcountlesscommunitieshaveconstructedsuchmapsasapreliminarysteptoward landslidehazardassessments.Variousmethodsfor constructinglandslidemapshavebeenused,including geomorphicmappinginthefield,visualmapping onaerialphotos,orondigitalelevationmodels
Environmental&EngineeringGeoscience,Vol.XXVIII,No.4,November2022,pp.335–346

335
Figure1.IndexmapshowingSeattlecitylimits(1A),andlocation inWashingtonState(1B).Labelledaretwoexamplelandslideareas,PerkinsLaneinMagnolianeighborhoodandSunsetAvenuein WestSeattleneighborhood.
constructedfromthelightdetectionandranging (LiDAR)remotesensingmethod(e.g.,Haugerud etal.,2003;Mickelsonetal.,2019),andautomated approaches(e.g.,McKeanandRoering,2003;Booth etal.,2009).Whilethesetechniquesmaybeveryeffectiveinundevelopedandevenvegetatedareas(Guzzetti etal.,2012),alloftheseapproacheshavelimiteduse inurbansettingswheregeologicandgeomorphic indicatorsforslopeinstabilitymaybesubstantially alteredbydevelopment.Historicrecordsfillthisgap, providinginformationaboutpriorlandslideswhere theirgeomorphologicalcluesnolongerexist.Such recordshavebeenconstructedinregionswithlong writtenrecordsworldwide,likethenearly1,000-year recordinUmbria,Italy(Salvatietal.,2009).Inthe presentinvestigation,weaddressedthechallengesof historicmapproductionandintegrationtolandslide hazardassessmentswithacasestudyfromSeattle, Washington(Figure1).Inparticular,wepresenteda newhistoriclandslidemaprecordinglandslidesfrom overacentury,compareditwithaLiDAR-based inventory,anddemonstrateditsinfluenceontheCity ofSeattle’sassessmentoflandslidehazards.
BACKGROUND
ThemostrecentphaseofinterestinSeattlelandslidesbeganNewYear’sEve,1996,whenhundredsof landslidesoccurredfollowingprolongedheavyrainfall,amajorsnowstorm,thenmoreheavyrain,which rapidlymeltedaboutafootofaccumulatedsnow (Baumetal.,1998).Marginallystableslopesall aroundthecityweresaturated,triggeringhundredsof landslides.Thetwogeotechnicalengineersonstaffat theCityofSeattle,aswellasmanyothermunicipalem-
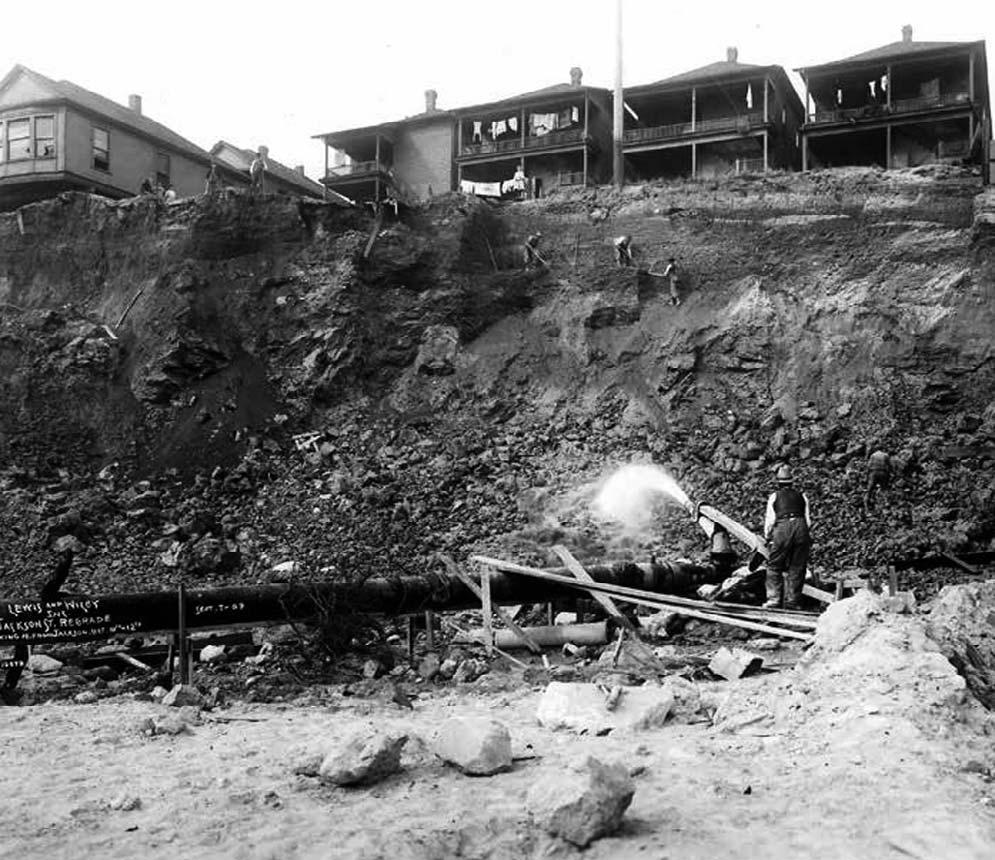
Figure2.HydraulicsluicingofahillsideduringtheJacksonStreet re-gradeofSeptember1909.Manyhomeownersreportedlandslides anddamagetotheirpropertiesfollowingthere-grades,whichremovedentirehillsinsomeplacesandcutlevelroadwaysinothers. Thesereports,includingclaimsfordamages,photos,andotherdocuments,areretainedinthelandslidefiles.Thisphotocanbefound infileSEDJ-1-B.PhotobyLewisandWiley,Inc.
ployees,workedaroundtheclockresponding,fielding andcatalogingreportsoflandslides,assessingdamages,andinspectingbuildings(D.Griswold,Cityof SeattleDepartmentofConstructionandInspections, Seattle,WA,unpub.data,2019).
This1996–97stormeventwasfarfromthefirst landslidewinterinSeattle’shistory(Laprade,1986; Miller,1991).Cityrecordsnotesimilareventsover wintersof1933–34,1971–72,1985–86,and1995–96 (e.g.,SEDA-2-31933,SED25-D1972,SED47-D 1986,SEDP-21996,CityofSeattleDepartmentof Transportation,Seattle,WA,unpub.data,2019).A riseingroundwaterlevelthataccompanieswetSeattlewintersheightenslandslideriskinsomeareasof thecitybutisnottheonlycauseortrigger(Laprade etal.,2000).Localgeologymakestheregionparticularlysusceptibletoslopefailures,whichmaybetriggeredbynaturalprocessesorhumanactivity(Figure2) (Baumetal.,2005).Geologistshavemappedancient landslidecomplexesaroundmanyofthecity’sslopes (e.g.,Tubbs,1974;Troostetal.,2005;Mickelsonetal., 2019).Thefrequencyandhazardoflandslidesresulted inSeattledepartmentskeepingrecordsoflandslides since1890.
Inanefforttoreducetheharmcausedbylandslides, theCityofSeattleregulatesdevelopmentonpropertiesinlandslide-proneareas(2015;SeattleMunicipal Code[SMC]25.09.012A.3and4).Landslide-proneareasincludelocaleswherelandslidesareknowntohave occurred,definedinSMC25.09.012A.3:
Davis,Chang,Hou,Teal,Cowell,andGarcia-Arceo
336 Environmental&EngineeringGeoscience
,Vol.XXVIII,No.4,November2022,pp.335–346
Knownlandslidesareasidentifiedbydocumented history,orareasthathaveshownsignificantmovement duringthelast10,000yearsorareunderlainbymass wastagedebrisdepositedduringthisperiod.
Toaddressthefirstpoint,landslidesidentifiedby documentedhistory,theCityofSeattlemaintains mapsshowinglocationswherelandslideshaveoccurred.Variationinrecordingmethodsandfilingpracticesoverthepast100yearsledtoarichanddiversecollectionofinformationretainedwithintheCity ofSeattle’slandslidefiles.Whilethesefilesarepublicrecords,priortotheprojectdescribedinthisstudy, publicaccessinvolvedseveralsteps,aspecificrequest, andusuallyanin-personvisit.Previousiterationsof thehistoriclandslidedatabasealsousedinconsistent waysofvisualizinghistoriclandslides.
Thenewmappresentedasaresultofthisresearch includesinformationfrommultiplelandslideinventories,standardizingtheformatforthemapandmakingallhistoricdocumentsavailableonline.Dataare presentedconsistentlyandwithincreasedeaseofuse, enablingcityplanners,consultants,andthepublicto evaluateavailablehistoricinformationaboutknown landslidesatindividualproperties.
DATASOURCES
TheCityofSeattlehasmaintainedextensivepaper recordsregardinglandslidesforoveracentury.The earliestrecordsoflandslides,datingfrom1890,were collectedandmaintainedbytheSeattleEngineering Department(SED),whichlaterseparatedintoseveral departments,includingtheSeattleDepartmentof Transportation(SDOT),SeattlePublicUtilities,and SeattleDepartmentofConstructionandLandUse (DCLU).SDOTbecameresponsibleformanaging landslidefiles,butin1985,DCLUbegancompiling landslidereportsindependently,particularlythose whichimpactedprivatepropertiesthatwereoutside ofSDOTjurisdiction.Theserecordsconsistofreportsmadebyresidents(manyofwhomsoughtrelief fromtheCityofSeattlethroughlegalorothermeans); notes,reports,andsketchesmadebycityengineers,geologists,andinspectors;correspondencebetweenand amongcityemployeesandthepublic;andplans,legal documents,photos,andexternalgeotechnicalreports (Figure3).Cityengineersbeganplottinglandslide locationsmanuallyonlargeMylarmaps.Landslides werefrequentlymappedascirclesratherthanactual extent.Otherdocumentssometimescontainedmore information,includinglandslideextentorphotos.In ordertoaccessthesedocuments,engineersorothers madeanappointmentwithanSDOTengineerto checkoutfiles.
In1990,pursuanttothepassingofSeattle’sInterim EnvironmentallyCriticalAreasRegulations,thelocationsoflandslidesdocumentedbybothDCLUand theSDOTwerecollatedintheEnvironmentallyCriticalAreas(ECA)folios(CityofSeattle,1990).These folioswereupdatedwithnewlandslideswhenthe regulationsbecameeffectiveOctober31,1992.Some landslideswereplottedaspoints,othersasdetailed outlines.
Duetothedevastatinglandslideseasonduringthe winterof1996–97,theSeattleCityCouncilcreated alandslidetaskforce,whichgeneratedrecommendationstomitigatethelandslidehazardthroughoutthe city.ThisresultedinthespotdrainageprogrammanagedbySeattlePublicUtilities,publicoutreach,educationonlandslideprevention,andtheSeattleLandslideStudycompiledbyconsultingfirmShannon& Wilson,Inc.,firstpublishedin2000(Lapradeetal., 2000)andlaterupdatedin2003(Shannon&Wilson, Inc.,2003).
TheSeattleLandslideStudy(Lapradeetal.,2000; ShannonandWilson,Inc.,2003)reviewedcityrecords andcreatedanewinventorymapplottinglocationsof landslideinitiationaspoints.Theresultingmapwas adoptedinageographicinformationsystem(GIS)as anupdatedKnownLandslideAreaslayerin2001, inaccordancewithDirector’sRule15-2001(Cityof Seattle,2001).Lapradeetal.(2000)andShannon& Wilson,Inc.(2003)systematicallyassembledinformationforeachlandslide,includingslidestyle,date,and estimatedtriggermechanisms,andverifiedwithfield observationsthelocationsofmanyhistoriclandslides.
Duringthelastdecade,theSeattleEmergencyOperationsCenter(EOC)institutedtheuseofanew program,WebEOC(Juvare,2007),whichincludesa wayforcitydepartmentstodocumentresponsesto landslides.TheSeattleDepartmentofConstruction andInspections,SeattleDepartmentofTransportation,SeattlePublicUtilities,andSeattleParksand RecreationtypicallydocumenttheirinspectionsofreportedslidesinWebEOC.Someoftheserecordswere addedtotheKnownLandslidelayerinGISasasinglepointinthecenteroftheparcelwheretheslide originated.
THENEWMAP
ThegoalofthenewmapwastoincreasetheaccuracyandresolutionofSeattle’shistoriclandslide databaseandtodisseminatelandslidedetailsandsupportinghistoricdocumentstothepublic.Seattle’s historiclandslideinventoryhasdevelopmentconsequencesforprivateandpubliclandowners.Propertiesthatoverlapamappedlandslideareregulatedas EnvironmentallyCriticalAreas(ECA,asdefinedin
ACenturyofLandslidesinSeattle,Washington
Environmental&EngineeringGeoscience
337
,Vol.XXVIII,No.4,November2022,pp.335–346
SMCChapter25.09)andsubjecttoenhancedgeotechnicalreviewcomparedtothoseoutsideofmapped ECAs.Therefore,accurate,consistentmappingandaccessibledocumentationbenefitspropertyowners,city engineers,andtheexternalgeotechnicalcommunity alike.
In2016,webegananewefforttocollate,modernize,andcentralizelandslideinformationforthe
CityofSeattle.Attheproject’sstart,thecity’slandslidedatabaseconsistedofredundantdatafromseveralsources:landslideinitiationpointscreatedbythe 2000and2003datafromtheSeattleLandslideStudy (Lapradeetal.,2000;Shannon&Wilson,Inc.,2003), digitizedlandslidepolygonsfromprioranalogmaps (includinglargecircularartifactsintroducedbydigitizinglow-resolutioncopiesofthefirstMylarmaps),and

Davis,Chang,Hou,Teal,Cowell,andGarcia-Arceo
Figure3.CityofSeattlehistoriclandsliderecordscontainavarietyofdatatypes,includingphotos(3A;SED10-B-21932),sketchesfrom geotechnicalreports(3B;SED12-A1976),andengineeringcorrespondence(3C;SEDB-9-A).
338 Environmental&EngineeringGeoscience
,Vol.XXVIII,No.4,November2022,pp.335–346
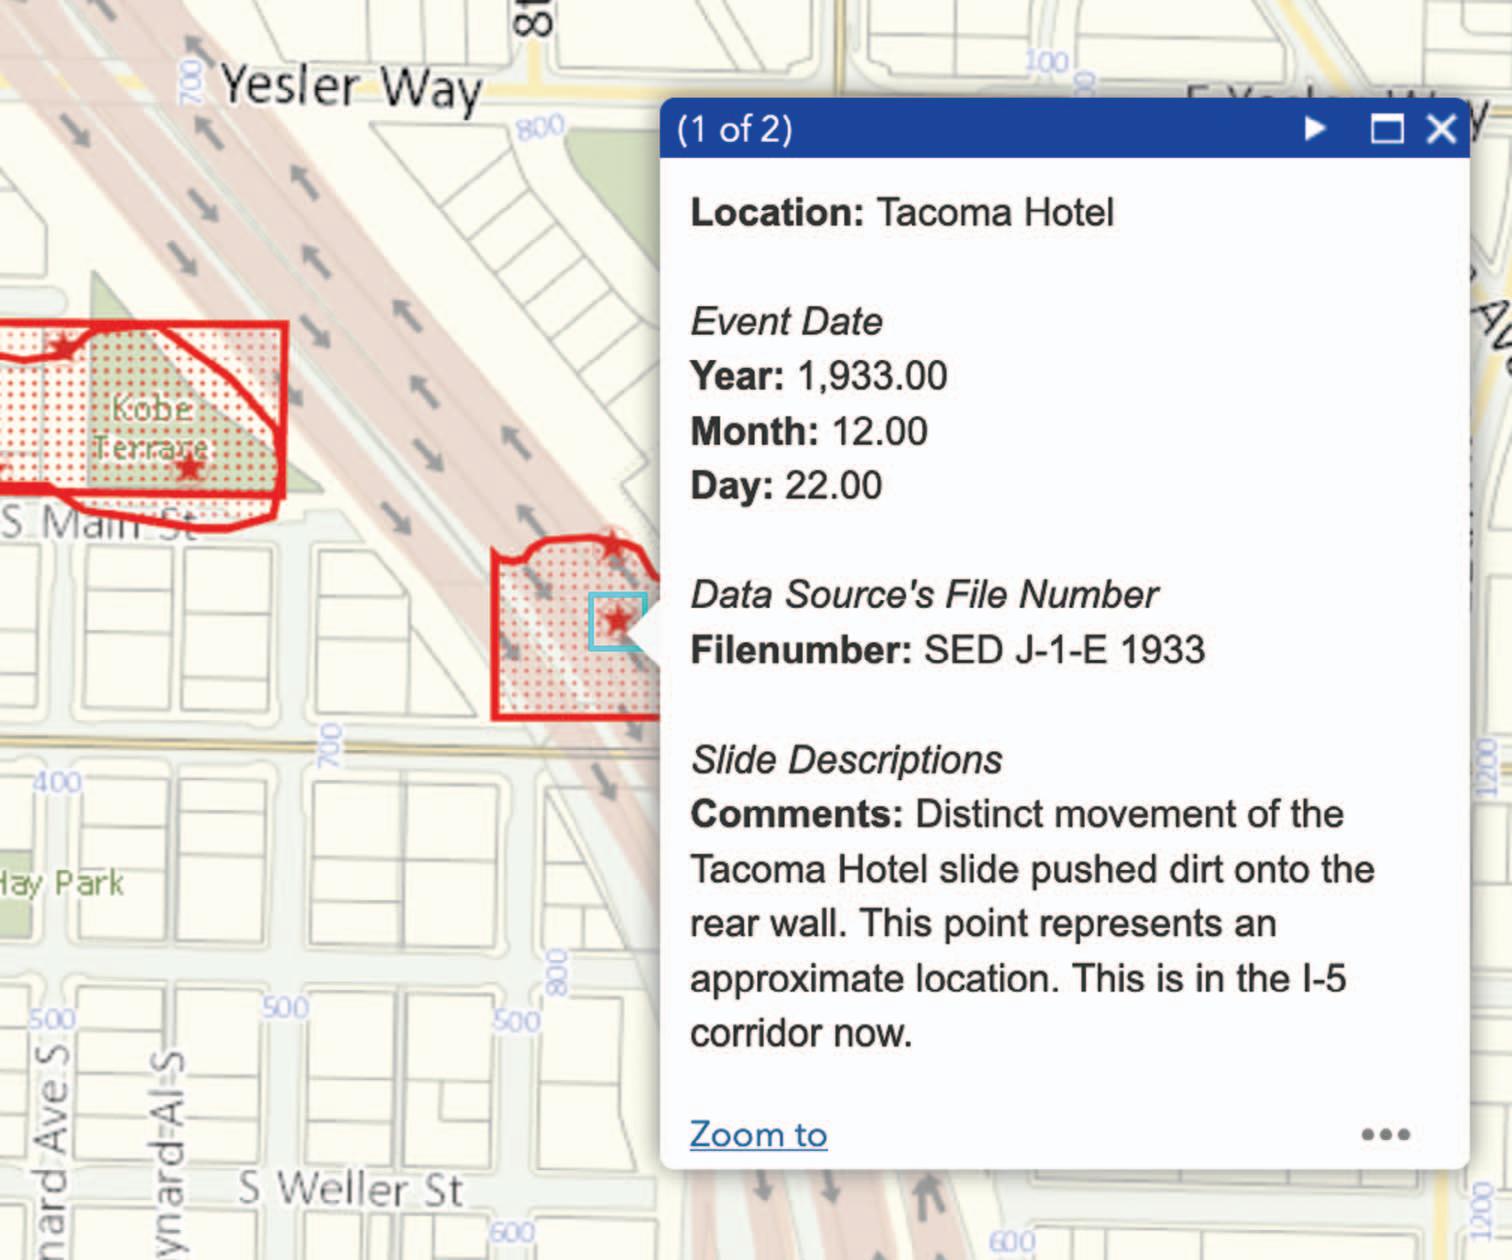
Figure4.Clickingonalandslidefeatureintheonlineviewerdisplaysthelandslide’sdateofoccurrence,abriefdescriptionoftheevent,and historicdocumentsavailablefordownload.ThisexampleshowsapartiallandslideoutlinedescribedinfileSEDJ-1-E1933.Thelandslide occurredin1933;thatslopewasremovedwhenU.S.Interstate5wasconstructed.
pointsautomaticallydroppedontoimpactedpropertiesbytheWebEOCmanagementsoftware.
ScopeandPriorities
Wereviewedtheoriginaldatasourcesandeveryfeatureontheformerlandslidemap,adoptedconsistent mappingstandards,adjustedfeatureswhereevidence warranted,addedrecentevents,anddigitizedthehistoricpaperfiles.Thenewmapispublishedasalayerin theCityofSeattle’sonlineGISdatabase,wherelandslidefeaturescontainbriefdescriptionsoftheevents andarelinkedtothedocumentsthatsupportthem (Figure4).
Landslidesweremappedaccordingtoavailableevidence,withparticularcaretowherelandslidefeatures fellwithrespecttopropertyboundaries.Noparcelwas taggedwithoutexplicitdocumentation;thereforethe newmapismoreaccuratethanpriorversions.The updatedKnownLandslidesECAlayerpresentlyincludescityrecordsofreportedeventsthroughJuly15, 2019.
METHODS
Wereadthousandsoflandslidefilesandevaluated theexistingGISmapwhereitintersectedeverypropertyinSeattle.Wherefilesevidencedlandslidesona property,weadjustedexistingGISfeaturesoradded newfeaturestorepresenteachlandslideevent.We wrotebriefdescriptionsofeacheventintheattributes ofeachGISfeature.Wherefeaturesexistedonpropertiesunsupportedbyhistoricallandslidedocumentation,weremovedoradjustedfeaturesaccordingly.We recordedchangesandjustificationsinaspreadsheet whichisavailabletothepublicviarequestfromthe SeattleDepartmentofConstructionandInspections (SDCI)geotechnicalgroup.Allfileswerescannedor digitizedanduploadedtotheGISlayerasattachments tothefeaturestheydescribe.
WhatCountsasaLandslide?
Cityrecordsdescribeavarietyofgeotechnicaland engineeringquandaries,fromroofscollapsingunder snowtoreportsofmysteriousholesthatappearedin
ACenturyofLandslidesinSeattle,Washington
Environmental&EngineeringGeoscience
339
,Vol.XXVIII,No.4,November2022,pp.335–346
yards.Itwasnotalwaysstraightforwardtoassumethat agivenreportrepresentedalandslide.
Wedefinedknownlandslidesasthefollowing:
Mudflows,debrisflows,rotationallandslides, slumps,erosion
Groundcracking,scarps,settlement,andset-downs Retainingwallfailure,whenaccompaniedby groundmovement
Slopefailuresfollowingsewerorwaterpipebreaks Landslidedebrisandleaningorfallentreesonsite Landsliderunout
Groundmovementfollowingexcavationorgrading.
Generally,thefollowingwerenotinterpretedasknown landslides:
Retainingwallfailurenotaccompaniedbyground movement
Structuralfailurenotapparentlyrelatedtoground movement
Earthquakedamage,exceptwhentriggeringslope movement
Unexplainedsinkholes.
ComplicationsofaCentury-LongMunicipalRecord
SystematicattentiongiventolandslidesinSeattle hasvariedthroughthepastcentury.Fromperiods whencityworkersprioritizedmeticulousrecordkeeping,manyaccountsoflandslidesremain.Other periodslacksubstantialrecords,despitealikely continuationofsliding.Furthermore,decadesof municipalreconfigurationshavecomplicatedrecord keeping.Departmentsresponsiblefordocumentinglandslides,organizationoffiles,andfilenaming schemeshaveevolved.Today,thenamesoflandslide filesreflecttheirhistoricprovenance.Table1describes currentvariationsinfilenamesandtheirorigins.
Ascityprioritieshavechangedthroughtime,variouseffortstocollatethelandslidehistoryhaveresulted innumerousscalesofinformation,fromfinescale(e.g., surveyedoutlinesofindividuallandslides)tocoarse (e.g.,abriefreportofslopefailureonacertainblock). Theupdatedescribedinthisresearchwasthelatest inalonglineofdatabaseupdatesthatservedanew need—specifically,adaptationforaddedGIScapabilities(e.g.,fileattachmentsanddownloadsfromnon–CityofSeattlecomputers).
MuchhaschangedinSeattleoverthepast100years, includingsomestreetnames.Inmanycases,wereviewedavarietyofhistoricalmapsandsewercards toidentifythecorrectboundariesoflandslideswhere streetshadbeenre-namedorpropertyboundarieshad changed.
VariedMapExpressionDependingonInformation TypeandQuality
Weapproachedthesechallengesbyconsideringeach slideareaonanindividualbasisatthescaleofafew cityblocks,drawingGISfeaturesasneededtoprovidethemostinformationfortheindividualslidearea. Landslideeventsarerepresentedintheupdatedlayer aseitheroutlinesoflandslidesderivedfromhistoric maps,rectangularpolygonsonareasknowntohave beenimpacted,linesthatrepresentmappedlandslide headscarps,and/orpointsthatrepresentsingleevents.
Evidencefromhistoricfileswasrequiredforalandslidefeaturetooverlapaprivateparcel.WhereinitiationpointsmappedbyShannon&Wilson,Inc.,were present,weleftthoseinplace,thoughamodestnumber(fewerthan10%)weremodifiedbasedonadditionalinformationfoundinthecurrentrecords(City ofSeattleDepartmentofConstructionandInspections,Seattle,WA,unpub.data,2019).
Thiscase-by-caseapproachsimplifiedthedatabase forusersevaluatinganeighborhood’slandslidehistory butintroducedlimitationsforuseofthedatabaseto evaluatecity-widestatisticaltrends.Noteverylandslideismarkedbyapointorapolygon,andsome landslidesaremarkedbybothpointsandpolygons (Table2).Forexample,landslideoccurrencerates basedonlyonmappedpointswouldexcludesome largerandbetter-documentedslopefailures,whilearea statisticsbuiltaroundpolygonswouldomitthose slidesdocumentedonlybypoints.Themapbestserves detailedevaluationofhistoriclandslidesatspecific properties.
CASESTUDIES
MagnoliaNeighborhood,PerkinsLane
PerkinsLane,aresidentialroadbelowthescarpof MagnoliaBluff(Figure5),isconstructedonanancient landslidebench.MagnoliaBluffconsistsprimarilyof glacialtill.Ancientlandslideshavedepositedthethick layerofcolluviumuponwhichPerkinsLaneisconstructed.Landslidesherehavetroubledresidentsand thecityfordecades,andcityrecordsofPerkinsLane landslidesareabundantandcomplicated.Thefirst sliderecordsretainedbythecityarefromthewinterof 1933–34,andmanyseriouseventshaveoccurredsince then.In1996,newtensioncracksformedatthetopof thebluff,abovePerkinsLane.Thesesymptomsindicatedmovementofadeep-seatedrotationallandslide thatwouldintensifyafterthe1996–97winterstorm (SEDP-21997,CityofSeattleDepartmentofTransportation,Seattle,WA,unpub.data,2019).By1998,at leastsixhomesweredestroyedbycontinuedsliding.
Davis,Chang,Hou,Teal,Cowell,andGarcia-Arceo
340 Environmental&EngineeringGeoscience
,Vol.XXVIII,No.4,November2022,pp.335–346
Table1. Historicfilenumbersandsources.
EraFileSource,2017 FilenameFormat ExamplesExplanation
1890topresentCityofSeattle Engineering Department (SED),(now maintainedby SDOT)
SEDA-1;SEDA-1 1933;SEATRAN
1985–99?DCLU(nowSDCI)DCLUJ121; DCLUA121; 1512WTaylor St.
SEDfilesdatebackto1890.Theletterornumberrefersto thestreetname,andthefollowingnumbersandletters refertoanindexmovingalongthestreet.Ayearafterthe filenumberreferstotheyearoftheevent,assignedduring the2016–17updateoftheCityofSeattleLandslide Database.Olderfilesfrequentlycontainother informationaboutstreetprojects.
DCLUfilesdateto1986.DCLUJ#filesoccurredin January1986.DCLUA#representlandslidesthat apparentlyoccurredbetween1988and1991,butfor whichnodetailedinformationremains.Filesmayalsobe namedonlybytheaddressoftheevent.
January,1997DCLU96–97StormAdevastatinglandslideseasonoverthewinterof1996–97 ledtodocumentationofhundredsoflandslidesina concentratedeffort.Whenincludedinlargerdatabases, alloftheselandslideswerereferredtowiththeidentifier “96–97Storm.”
2000and2003Shannon&Wilson,
TheSeattleLandslideStudywaspublishedbyShannon& Wilson,Inc.,in2000(Lapradeetal.,2000).Eachslide wasgivenauniquenumber(SW_ID,whichisseparate fromtheslide’sfilename)andwasrepresentedbyasingle pointinthegeodatabase.Iftheeventoccurredduringthe 1996–97storm(Dec.31toJan.1),thefilenumberislisted assuch.IftheslidewasdocumentedinShannon& Wilson’sprofessionalfiles,filenumbersarelistedaseither “S+W,”“MP##”forrailroadmilepostnumbers,or “j-##.”SlidesaddedtotheSeattleLandslideStudyfrom CityofSeattledocumentswerelistedwiththeirCityof Seattlefilenumber.
EOC#Duringthelastdecade,theSeattleEOCinstitutedtheuseof theprogram,WebEOC(Juvare2007),whichincludes,as oneofitsfeatures,awayforcitydepartmentsto documentresponsestolandslides.TheSeattle DepartmentofConstructionandInspections,Seattle DepartmentofTransportation,SeattlePublicUtilities, andSeattleParksandRecreationtypicallydocument theirinspectionsofreportedslidesinWebEOC.Priorto thisupdate,theserecordswereoccasionallyaddedtothe KnownLandslidelayerinGISasasinglepointinthe centeroftheparcelwheretheslideoriginated.
ACenturyofLandslidesinSeattle,Washington
Inc.,Seattle LandslideStudy 96–97Storm;S+W; MP##;j-##
2008–19CityofSeattle Emergency Operations Center(EOC)
SDOT = SeattleDepartmentofTransportation;DCLU = SeattleDepartmentofConstructionandLandUse;SEATRAN = SeattleTransportation;SDCI = SeattleDepartmentofConstructionandInspections;GIS = geographicinformationsystem. Table2. Examplesofinformationtypesandresultinglayerrepresentation. AvailableInformation LayerRepresentation Engineerorgeologist’ssketchoflandslideareaPolygonshowingslideoutline(Lapradeetal.,2000; Shannon&Wilson,Inc.,2003),initiationpointifpresent Inspectionreportsorphotosdescribinglandslides onmultipleindividualproperties,without enoughinformationtodefinealandslideextent Rectangularpolygonindicatingparcelstaggedbylandslide butnotshape Geotechnicalengineeringreportshowing landslidescarpsbutlackingslideareas Scarpline Reportsoflandslidere-initiationyearsaftera majorandwell-documentedevent Polygonshowingtheextentoftheoriginaleventandpoints markingincidencesofsubsequentslippage Environmental&EngineeringGeoscience,Vol.XXVIII,No.4,November2022,pp.335–346 341
Figure5.AerialphotoofPerkinsLaneandMagnoliaBluffpriortothe1997–98landslides.Photolooksnortheast.Glacialtillofthenearly verticalMangoliaBluffisvisiblethroughvegetation.PerkinsLane,whichextendedtotherightedgeofthephoto,wasconstructedona colluvialbench.FromfileSEDP-2photos,p.4.Unknownphotographeranddate.
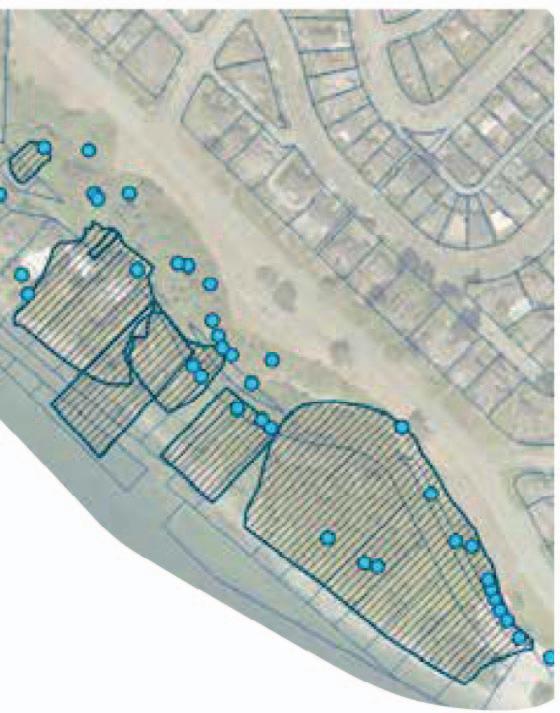
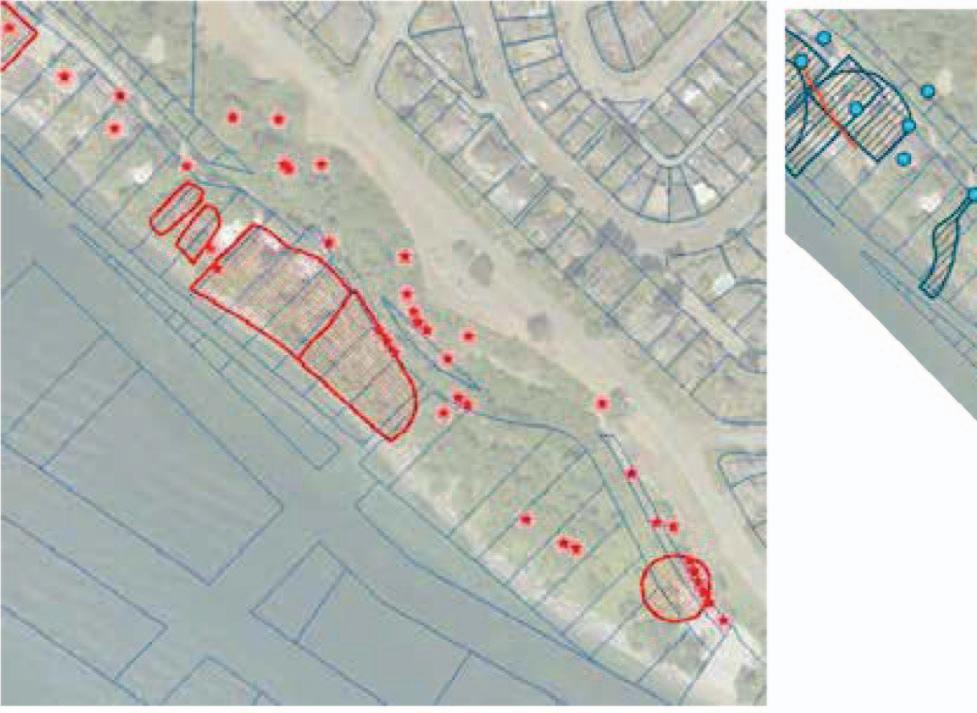
Figure6showsthenewlandslidemap(right),in comparisonwiththeoldermap(left).Theoldermap lackedanoutlineforthecatastrophic1997event,as wellasoutlinesforpriorevents.Thenewmapincludes
severaladditionalslideoutlinesmappedinengineering documentsandgeotechnicalreports.Thisincludedthe landslideoutlineforthecatastrophic1996–97failure ofthesoutheasternendoftheroad.
Figure6.SeattlecitylandslidemapatPerkinsLane,before(6A)andafter(6B)theupdate.Landslidesarerepresentedaspolygonsorpoints. Thenewmapincludesmanymorelandslideoutlinesandremovespolygonsthatwerenotsupportedbythehistoricrecord.Thecircular artifactinthe“before”panel(6A)waslikelyintroducedduringdigitizationofalower-resolutionMylarlandslidemap,inwhichdotswere plottedinthelocationsoflandslides.

Davis,Chang,Hou,Teal,Cowell,andGarcia-Arceo
342 Environmental&EngineeringGeoscience,Vol.XXVIII,No.4,November2022,pp.335–346
WestSeattleNeighborhood,SunsetAvenue
AnotherexamplefromtheWestSeattleneighborhoodshowslandslidesthatwerecomplicatedbyinfrastructure(Figure7).OnFebruary10,1916,thefailureofawoodenbulkheadatSunsetAvenueandthe breakageoftheJerseyStreetsewer,whichranthrough theravinebetweenSunsetandAlkiAvenues,resulted inamudslidethatremovedpartofSunsetAvenueat 45thStreet(SEDP-61916,CityofSeattleDepartment ofTransportation,Seattle,WA,unpub.data,2019).
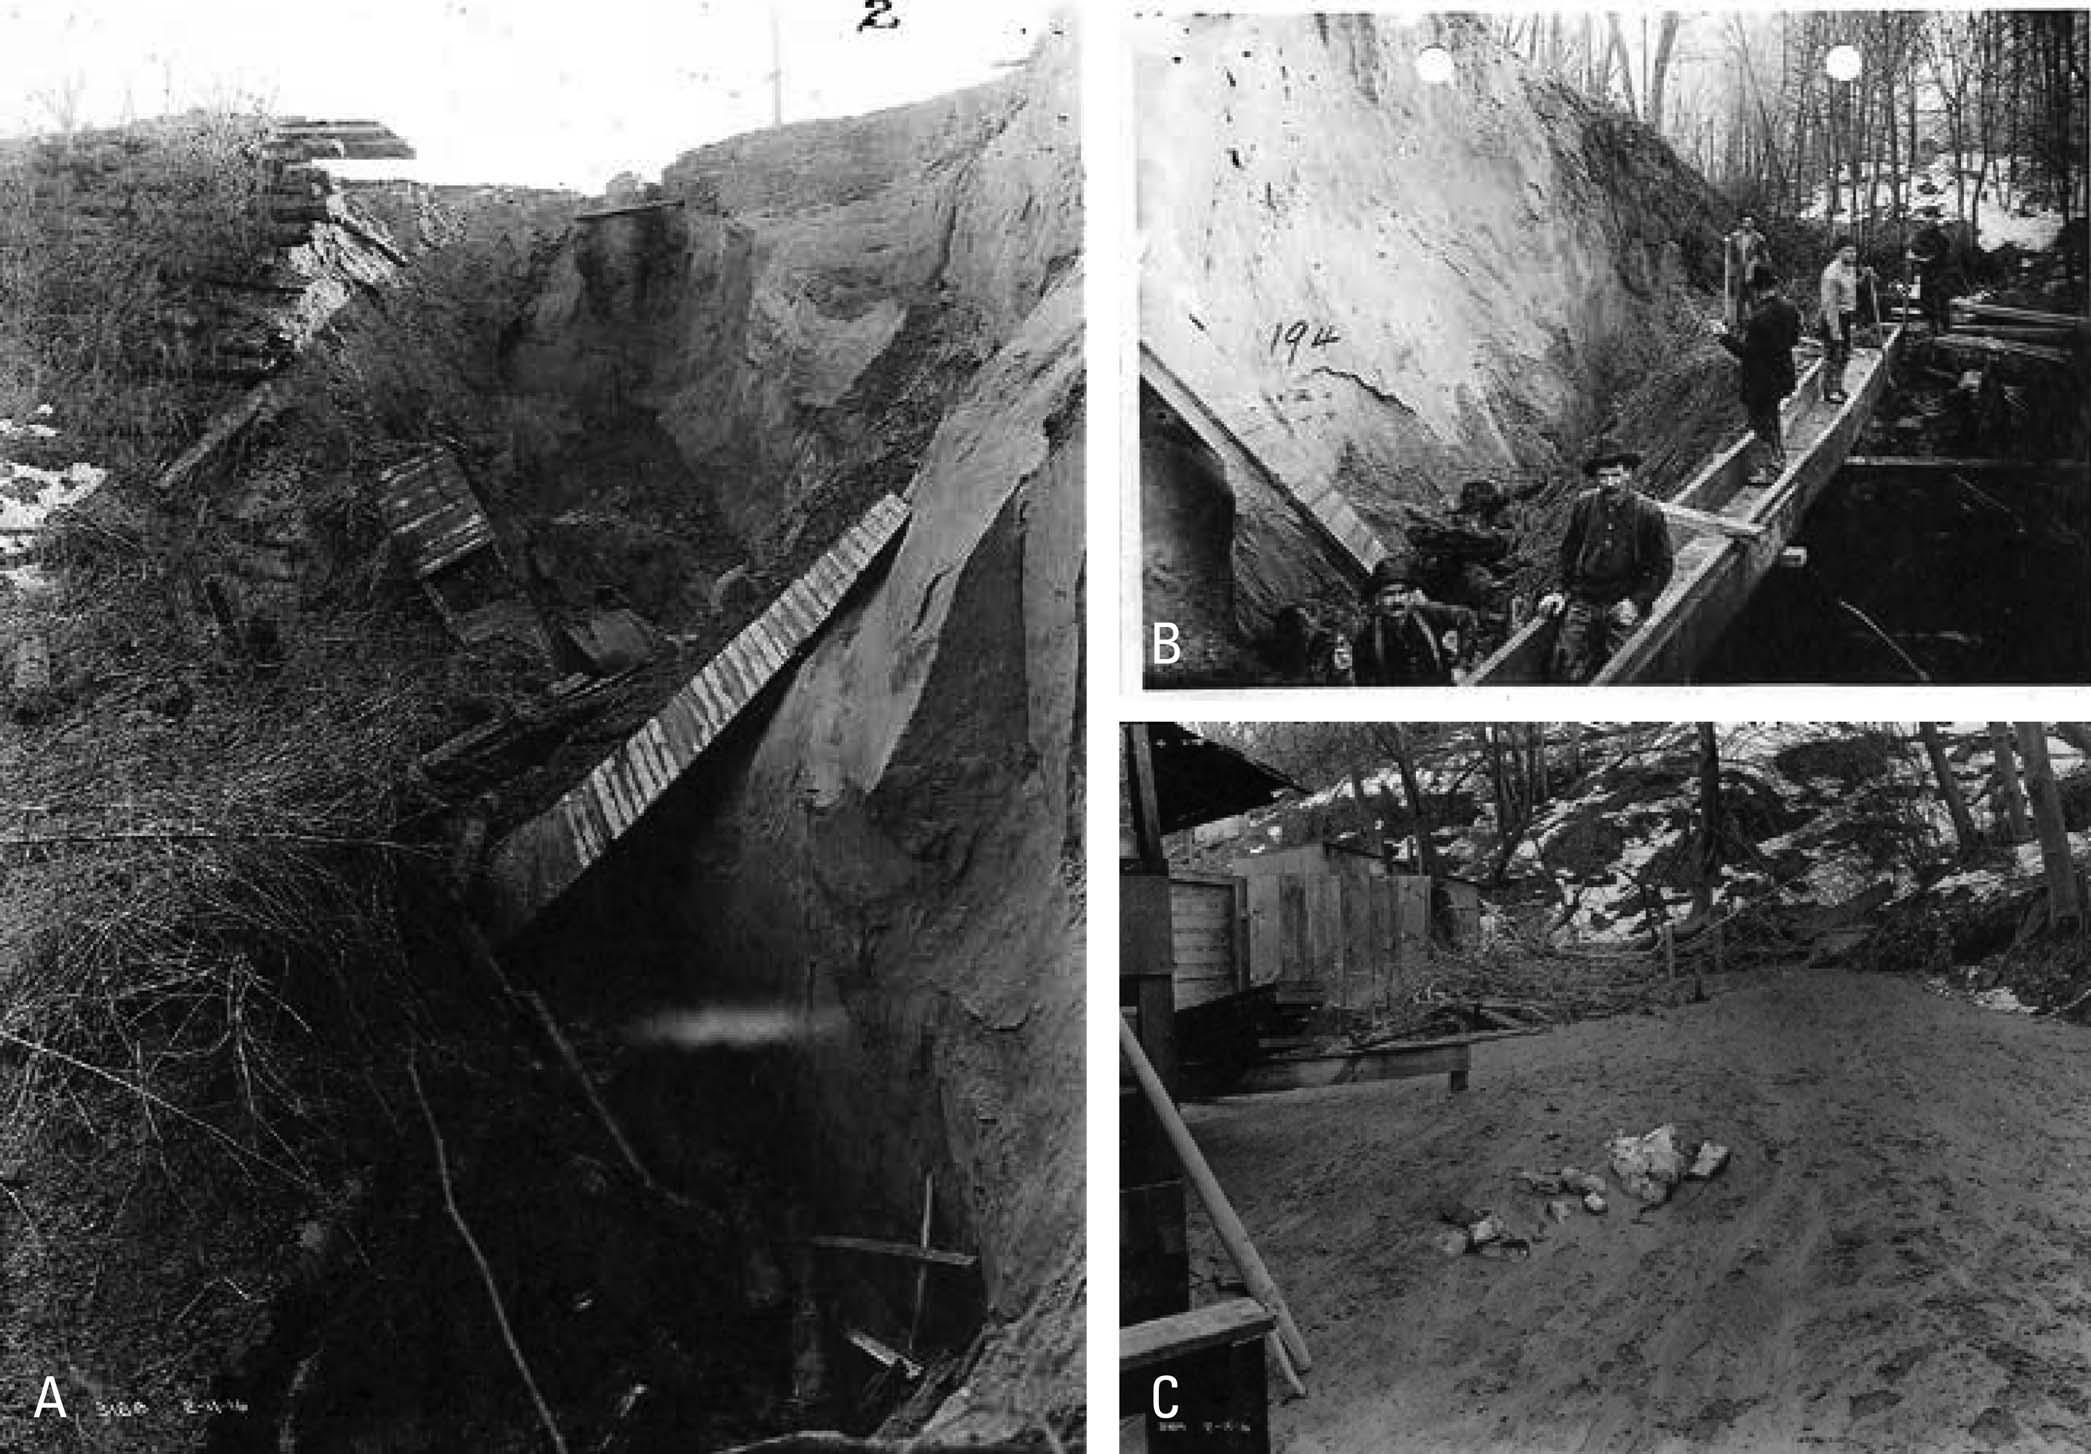
Propertiesonthe1300blockofSunsetAvenuewere damaged,andwater,sewage,andmudflowedinto atleastsevenofthehomesbelow.Thissamesewer mayhavebrokentheyearprior,in1915.TheJersey Streetsewerbrokeagain33yearslater,inassociation withanotherlandslide,damagingmanyofthesame downslopeproperties.
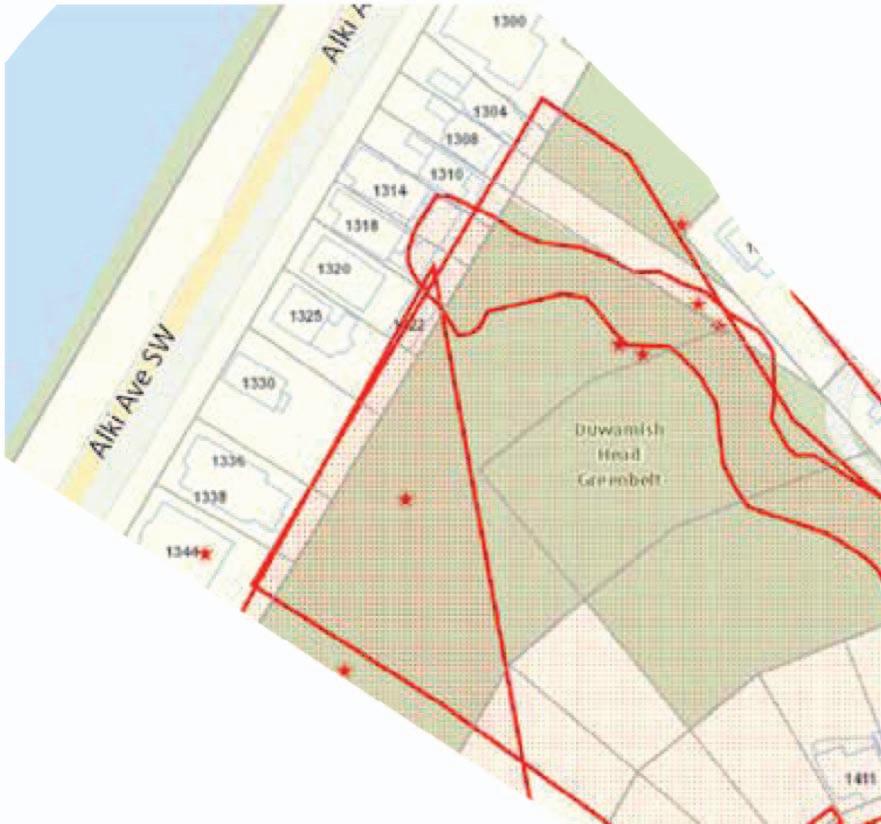
Ournewlandslidedatabasemapseachofthese events(Figure8).Thoughphotosweretakenfollowingthe1916slide,thefiledidnotcontainenoughin-
formationtodrawalandslideoutline.Thestraightsidedpolygonsufficestocovereverypropertythatwas namedasaffectedinthefile.Latereventsin1983and 1996–97arewelldescribedbygeotechnicalreports, whichincludeslideoutlines.
DISCUSSION
Thenewmapisaccuratewithrespecttothehistoricalrecordandoffersmanynewbenefitstoproperty owners,engineers,andcityemployees.Thenewmap tags12%fewerparcelsthantheoldmap(Table3). Propertiesaremoreaccuratelytagged,aseveryfeatureissupportedbyhistoricaldocuments,andfewer propertyownerswillberequiredtoprovidegeotechnicalanalysestodeveloptheirpropertiesduetomappingofknownlandslides.Thisupdatewillalsobenefitgeologistsandengineers,whowillhavefasterand morestreamlinedaccesstoinformationaboutspecificparcels.Whereasthelandslidefilesformerlywere onlyaccessiblethroughanin-personvisittoSDOT’s
Environmental&EngineeringGeoscience,Vol.XXVIII,No.4,November2022,pp.335–346
ACenturyofLandslidesinSeattle,Washington
Figure7.Photosof1916landslidebelowSunsetAvenue,WestSeattle,fromfileSEDP-6,February11,1916.(A)Lookingupatthelandslide scarp.(B)WorkersstandinginadrainbelowSunsetAvenueslide.(C)Runoutbelowfailure.
343
Figure8.LandslidefeaturesinthenewmaparoundSunsetAvenueinWestSeattle.Landslideeventsaredenotedbyredboxes,polygons,or dots.Therewaslessinformationavailableabouttheoldereventin1916(representedbyabox)thanthosein1983and1996–97(represented bylandslideoutlines).SeveralothereventsoccurredandaremarkedwithlandslideinitiationpointsplacedbyShannon&Wilson,Inc.,in 2000.

engineeringoffice,nowindividualfilescanbedownloadeddirectlyfromthewebviewer.Cityemployees alsohaveeasieraccesstotheinformation,facilitating informeddecisions.


Comparedwithlandslidemapsproducedby othermethods,thehistoricalrecordprovidesmore metadata—forexample,informationaboutlandslide timing,triggers,andconsequences.Ofparticularinterestinthisinventoryareco-seismiclandslides,such asthosethatfollowedthe2001Nisquallyearthquake (e.g.,SED19-A,CityofSeattleDepartmentofTransportation,Seattle,WA,unpub.data,2019).Historic co-seismiclandslidescanbedifficulttoidentifyconfidentlyinothertypesoflandslidemaps,likethose producedthroughfieldmappingorLiDAR.Therefore, thishistoricaldatasetoffersnewopportunitiesforregionalresearchonmultihazards.
Completenessofthehistoricdatasetisdifficultto evaluatebecausetherealnumberoflandslideswithin
Table3. Numberofparcelsandtotalareacoveredbylandslidefeaturesinboththenewandoldmaps.Thenewmap,whichrepresents thebestinformationavailable,tagsfewerpropertiesandlessoverall areathantheoldmap.
OldNew%Reduction


Numberofparcels3,0502,65712.9 Totalarea(sq.ft)127,827,197.30116,580,425.298.8
thecitylimitsisunknown.Thehistoricalrecordonly representsasubsetofalllandslidestohaveoccurred duringthistimeperiod.Onlylandslidesreportedto orinvestigatedbytheCityofSeattlearedescribedin thedataset,solandslidesareunder-representedfrom less-populatedareas,newerneighborhoods,orneighborhoodslesslikelytoreportlandslides.Thehistoric datasetalsomissesprehistoricdormantlandslidesas mappedbypublishedgeologicmaps(e.g.,Troostand Booth,2008)ortheWashingtonGeologicalSurvey LiDARdatabaseasdescribedbelowin“Comparison withaLiDARLandslideInventory”(Mickelsonetal., 2019).
Theconsistencyofrecordkeepingoverthepasthundredyearshasbeencomplicatedbyturnoverincity employeesresponsibleforthedataset,avarietyoftechnologicaldevelopments,andseveralmunicipalreorganizations.Oversomeperiods,landsliderecordswere meticulouslymaintained.Duringothers,therewere fewerupdates.Becauseofthisincompleteness,care shouldbetakenwhenusingthedatabasetoevaluate spatiotemporaltrendsinlandslidesacrossSeattle.
ComparisonWithaLiDARLandslideInventory
In2019,WashingtonGeologicalSurvey(WGS) publishedaLiDAR-basedlandslideinventoryofwesternKingCounty,includingSeattle(Mickelsonetal., 2019).Comparedwiththehistoricdataset,theLiDAR
Davis,Chang,Hou,Teal,Cowell,andGarcia-Arceo
344 Environmental&EngineeringGeoscience,Vol.XXVIII,No.4,November2022,pp.335–346
inventorycoversmoregroundandcaptureslandslides indifferentareas.ToproducetheLiDARinventory forSeattle,geologistsatWGSvisuallyidentified ∼800 landslidefeatureswithinSeattlecitylimitsusingLiDARimagesflownin2016with3-footgridresolution (Mickelsonetal.,2019).Landslidedeposits(N = 252), scarps(N = 286),flanks(N = 256),andfans(N = 11)weredigitizedbyhand.Theentiredatabasewasreviewedbyalicensedgeologist.Fortheinventory,37% ofslideswerefieldcheckedandslidefeatureswereassignedaconfidencelevelofhigh(49%oftotalslide areainSeattle),medium(36%),orlow(15%).
Comparedwiththehistoricdataset,LiDARmappedlandslidestagged7,070parcelsinSeattle, 4,413parcelsmorethanthenewhistoricdatabase (LiDAR-mappedslidestouched166%moreparcels thanhistoriclandslides).ManyofthelandslidesidentifiedinLiDARarelocatedinparksorgreenbelts wherelandslideswereless-frequentlyreported,orin largeswathsofhummockyterrainthatmayrepresentancientlandslidesnotdepictedinthehistoric record.Conversely,theLiDARinventorymissedlandslidesmappedinthehistoricdatabase,particularly indevelopedareas(e.g.,downtownSeattle)andon slopeswhereshallowsurficialslideswerethedominantslidemechanism(e.g.,alongsteepshoresofLake Washington).
WhencomparedwithallofSeattle’sECAs,which includeareasofsteepslopesandpotentiallandslide areasgivengeologicconditions,theLiDARinventory touchesonly3%moreparcelsthanexistingECAs,suggestingasimilarextentofhazardsasassessedbyboth methods.Consideredinconcert,theLiDARandhistoricinventoriesarecomplementary—LiDARlocates landslidefeaturesinless-disturbedareas,whilehistoric datamapslandslidesinmodifiedareasandprovides preciseagesfortheseevents.
CONCLUSION
ThiscasestudyfromSeattle,Washington,produced anurbanlandslideinventorywithhighaccuracywith respecttopropertyboundariesandpreciselandslide ages.Whileincomplete,thehistoricmaplikelyhas highergeographicalandthematiccorrectnessthan geomorphic-basedmapsfordevelopedsettings.When combinedwithotherhazardmapslikeaLiDAR landslideinventoryorareasofpotentiallandslides, thehistoricmapcontributestoacomprehensiveunderstandingoflandslidehazardwithinandoutsideof developedareas.Theinteractivehistoricmapandthe datausedtoproduceitareavailablethroughaGIS webviewer.ForusersinSeattle,thenewdatasetis moreaccurateandthepublicGISdisseminatesinformationmoreefficientlyandlikelymoreeffectivelythan
priormethods.Regionally,thenewmap,whichisunusualinitstemporalresolution,historicalreach,and inthequantityofinformationavailableforeachslide, willprovideacomparisonwithotherregionallandslideinventories,andmayfacilitateongoingstudies aboutcascadinghazardsintheregion,includingcoseismiclandslides.Onabroaderscale,thisdatasetadds totheglobalcatalogofhistoricallyrecordedlandslides andprovidesanexampleforothersengagedinsimilar efforts.
ACKNOWLEDGMENTS
ThisworkwasfundedprimarilybytheCityofSeattleDepartmentofConstructionandInspections.AdditionalfundingwasprovidedbytheCityofSeattleDepartmentofTransportation.DeanGriswoldof SDCIwasinstrumentaltothisprojectprovidingstories,historicperspective,andmappingassistance.We thankothergeotechnicalstaffatSDCIandSDOTfor theirreviews,carefulqualitycontrolchecks,andhumor.CityofSeattleemployeesscannedallofthedocumentsdescribedinthisstudy,andCityofSeattleGIS staffKenMarandChristinaThomasdevelopedthe toolsthatmadethisprojectpossible.Themanuscriptis improvedbyreviewsbyRobMcIntosh,JulietCrider, KelsayStanton,ErichHerzig,andthreeanonymous reviewers.
REFERENCES
Baum,R.L.;Chleborad,A.F.;andSchuster,R.L.,1998, Landslidestriggeredbythewinter1996-97stormsinthePugetLowland, Washington:U.S.GeologicalSurveyOpen-FileReport 98-239,pp.1–16.
Baum,R.L.;Coe,J.A.;Godt,J.W.;Harp,E.L.;Reid,M.E.; Savage,W.Z.;Schulz,W.H.;Brien,D.L.;Chleborad,A.F.; McKenna,J.P.;andMichael,J.A.,2005, RegionallandslidehazardassessmentforSeattle,Washington,USA:Landslides, Vol.2,No.4,pp.266–279.
Booth,A.M.;Roering,J.J.;Perron,J.T.,2009,Automated landslidemappingusingspectralanalysisandhigh-resolution topographicdata:PugetSoundlowlands,Washington,and PortlandHills, Oregon:Geomorphology,Vol.109,No.3–4,pp. 132–147.
CityofSeattle,WA,DepartmentofConstructionandLand Use,1990, EnvironmentallyCriticalAreas [map]:Print.
CityofSeattle,WA,2001,Director’sRule15-2001, UpdateofEnvironmentallyCriticalAreasMapping: Electronicdocument, availableathttps://web6.seattle.gov/DPD/DirRulesViewer/ Rule.aspx?id=15-2001
CityofSeattle,WA,2015,MunicipalCode25.09.012, DesignationandDefinitionsofEnvironmentallyCriticalAreas: Electronicdocument,availableathttps://library.municode. com/wa/seattle/codes/municipal_code?nodeId=TIT25ENP RHIPR_CH25.09REENCRAR_25.09.012DEDEENCRAR
Guzzetti,F.;Mondini,A.C.;Cardinali,M.;andFiorucci,F., 2012,Landslideinventorymaps:Newtoolsforanoldproblem: Earth-ScienceReviews,Vol.112,No.1–2,pp.42–66.
ACenturyofLandslidesinSeattle,Washington
Environmental&EngineeringGeoscience
345
,Vol.XXVIII,No.4,November2022,pp.335–346
Davis,Chang,Hou,Teal,Cowell,andGarcia-Arceo
Haugerud,R.;Harding,D.J.;Johnson,S.Y.;Harless,J.L.; Weaver,C.S.;andSherrod,B.L.,2003,High-resolution LiDARtopographyofthePugetLowland, Washington–Abonanzaforearthscience:GSAToday,Vol.13,No.6, pp.4–10.
Juvare,2007, WebEOC [computersoftware],Electronicdocument, availableathttps://www.juvare.com/webeoc/ Laprade,W.T.,1986,Unusuallandslideprocesses,January17and 18,1986,storm,Seattle,Washington:In AssociationofEngineeringGeologists29thAnnualMeeting:BetterLivingThrough EngineeringGeology,p.55.
Laprade,W.T.;Kirkland,T.E.;Nashem,W.D.;andRobertson,C.A.,2000, Seattlelandslidestudy:Shannon&Wilson, Inc.,InternalReportW-7992-01,164p.
McKean,J.andRoering,J.,2003,Objectivelandslidedetection andsurfacemorphologymappingusinghigh-resolutionairbornelaseraltimetry: Geomorphology,Vol.57,No.3–4,pp. 331–351.
Mickelson,K.A.;Jacobacci,K.E.;Contreras,T.A.; Gallin,W.N.;andSlaughter,S.L.,2019, Landslide inventoryofwesternKingCounty,Washington:WashingtonGeologicalSurveyReportofInvestigations41, 7p.
Miller,D.J.,1991,DamageinKingCountyfromthestorm ofJanuary9,1990: WashingtonGeology,Vol.19,No.11, pp.28–37.
Salvati,P.;Balducci,V.;Bianchi,C.;Guzzetti,F.;and Tonelli,G.,2009,AWebGISforthedisseminationofinformationonhistoricallandslidesandfloodsinUmbria,Italy: Geoinformatica,Vol.13,No.3,pp.305–322.
Shannon&Wilson,Inc.,2003, Seattlelandslidestudyupdate,addendumtotheSeattlelandslidestudy,stabilityimprovementareas:unpublishedconsultantreport21-1-08913-016,forSeattle PublicUtilities,Seattle,WA,12p.
Troost,K.G.andBooth,D.B.,2008,GeologyofSeattleand Seattlearea,Washington.InBaum,R.L.;Godt,J.W.;and Highland,L.M.(Editors), LandslidesandEngineeringGeologyoftheSeattle,WashingtonArea,Vol20:GeologicalSociety ofAmerica,Boulder,CO,pp.1–36.
Troost,K.G.;Booth,D.B.;Wisher,A.P.;andShimel,S. A.,2005. TheGeologicMapofSeattle–AProgressReport: U.S.GeologicalSurveyOpen-FileReport2005-1252,scale 1:24,000.
Tubbs,D.W.,1974, LandslidesinSeattle:StateofWashingtonDepartmentofNaturalResourcesInformationCircular No.52, Olympia,WA,26p.
346 Environmental&EngineeringGeoscience
,Vol.XXVIII,No.4,November2022,pp.335–346
SimpleShearStrengthAnalysisofInherentAnisotropy foraTropicalAlluvialSoil
ALSIDQIHASAN* NISAISMAIL
DepartmentofCivilEngineering,UniversitiMalaysiaSarawak,UNIMASWest Campus,94300KotaSamarahan,Sarawak,Malaysia
LEELINJYE
GeotechnicalandSlopeEngineeringUnit,SarawakPublicWorksDepartment,Wisma Saberkas,JalanTunAbangHajiOpeng,93582Kuching,SarawakMalaysia

KHALIDALSHIBLI
DepartmentofCivilandEnvironmentalEngineering,325JohnD.TickleEngineering Building,851NeylandDrive,TheUniversityofTennessee,Knoxville,TN37916
KeyTerms: AlluvialSoil,OrganicMaterial,Scanning ElectronMicroscopy,SimpleShear,Anisotropy
ABSTRACT
Tropicalalluvialsoilshaveunusualengineeringpropertiesandtheirbehaviorisnottypicaloffine-grained soils.Theliteratureregardingstrengthpropertiesof alluvialsoilsislimited.Thisstudypresentsanexperimentalevaluationofinherentanisotropyofundisturbed tropicalalluvialsoilsamplesbycomparingthedirect simpleshear(DSS)testresultsof52specimenscut inhorizontalandverticalorientations.Thetestswere carriedoutunderconsolidatedundrainedconstantvolumewithexcessporewaterpressuremeasurements. Thepeakshearstrength,effectivestresspaths,and secantshearmodulusanalysesshowedthatthedifferenceinpropertiesbetweenhorizontallyandvertically cutspecimenswasnegligible.Nonetheless,theresults forverticallycutspecimenspresentedahigherrandom errorcomparedtotheresultsforhorizontalspecimensin allaspects.Agoodrelationshipbetweentheundrained shearstrengthandover-consolidationratiowasfound butwasnotcomparabletopastDSSresultsfornatural clays.Scanningelectronmicroscopyimagesrevealed flocculatededge-to-edgeandedge-to-faceparticleassociations.Directionalityanalysisofmicrofabricshowed thatthealluvialsoilshadlowpreferredorientationof particles.Thegeneralnotionthatallalluvialsoilsare highlyanisotropicwasnotevident,basedontheexperimentsreportedinthisstudy.Thefindingshereinare usefulforgeotechnicalengineerstobetterunderstand thestrengthbehavioroftropicalalluvialsoils.
*Correspondingauthoremail:halsidqi@unimas.my
INTRODUCTION

Tropicalalluvialsoilsexhibitunusualphysicalcharacteristicsandengineeringpropertieswhencompared tocommonsedimentarysoils(Zhangetal.,2004). Theirparticlesoriginatefromprofilesthataredeeply andcontinuallyweathered;theyareexposedtoa highernumberofweatheringcyclesthanalluvialsoils insubtropicalortemperateregions(Edelmanand vanderVoorde,1963;Buringh,1979).Suchweatheringprocessesinfluencemicrofabricpropertiessuch asgrainsize,composition,arrangement,andparticleshape,whichsignificantlyaffecttheirengineeringproperties(MitchellandSoga,2005;Alshibli andHasan,2008;HasanandAlshibli,2010).Fabric anisotropy,alsoknownasinherentanisotropy,isassociatedwiththesedimentationprocessthatusually leadstodifferentmechanicalresponses(Yimsiriand Soga,2000;LeungandNg,2004).Todate,theeffect ofinherentanisotropyonthemechanicalbehaviorof tropicalalluvialsoilshasnotbeenthoroughlystudied usingundisturbedsamples.
Thenecessityforexpansionofinfrastructuredevelopmentintotropicalalluvialsoilschallengesengineers todesigntheproperfoundationsystemstosupport heavystructures.Thesoft,deepnatureofthesoiloften requiresfrictionpilefoundationstobeusedtosupport structures.Thisrequiresathoroughunderstandingof themechanismsthatgovernthesoil–pileinteraction, whichcanbeapproximatedusingthedirectsimple shear(DSS)test,widelyusedtocharacterizestaticor cyclicstrengthpropertiesofsoilswithvarioustypes ofDSSapparatus(e.g.,BjerrumandLandva,1966; RandolphandWroth,1981;Budhu,1984).Initsapplications,theDSStesthasbeenprimarilyusedtocharacterizemarineclaysandoffshoresoils(e.g.,Talesnick
Environmental&EngineeringGeoscience,Vol.XXVIII,No.4,November2022,pp.347–360 347
andFrydman,1991;Lanzoetal.,2009).Comparedto thedirectshearboxtest,theDSStestnotonlyrepresentstheclosestapproximationtotherealshearingmechanismwithinthesoil,butalsooffersbetter stressuniformityandmoreconservativestrengthproperties(Hanzawaetal.,2007).ThelackofsoilcharacterizationassociatedwithusingtheDSStestisdue tothelimitedavailabilityofsuchtestapparatusand thevariabilityofcomplexanalysesinvolved.Studies tocharacterizestrengthpropertiesofalluvialsoilshave beencarriedoutonlybyusing in-situ tests,directshear boxtest,ortriaxialtests(YilmazandKaracan,1997; Mlynareketal.,2012).
Theobjectiveofthisstudywastopresentexperimentaldatafromsimpleshearstrengthtestsofa tropicalalluvialsoilfocusingonthesoil’sinherent anisotropy,whichwasevaluatedbycomparingthetest resultsandanalysesof52undisturbedspecimensthat weresampledintwoorthogonalcuttingorientations (i.e.,horizontalandvertical).Thestudyexaminesthe generalbeliefthatalluvialsoilparticlesarealwaysdepositednaturallyviaacertainangleduringthesedimentationprocessandtherefore,thestrengthcharacteristicsofthesoildependonthespecimenorientation. Theimportanceofthisexaminationcanbedirectlyappliedinanalyzingtheshearingmechanismofsoiladjacenttopilesduringthepileinstallationdriving.
SAMPLEACQUISITIONAND CHARACTERIZATION
Thestudyareacoveredthreedifferentsitesnearthe estuariesofRajangRiverintheSarawakregionof northernBorneo,Malaysia:MuaraLassa(location1, 2°26 48 N.,111°31 24 E.),BatangPaloh(location 2,2°22 4 N.,111°25 47 E.),andBatangRajang(location3,2°11 22 N.,111°33 50 E.).TheSarawak regionreceiveshighratesofrainfallanddenudation (VijithandDodge-Wan,2020).TheRajangBasinis oneofthetwomajorcatchmentsystemsthatbring sedimentfromthehighlandstothecoastalregion, whichismostlyunderlainbyriveralluviumsoilsthat weregeneratedduringthePleistoceneEpoch(Jabatan MineraldanGeosains[JMG],2020).Theselocations layinthecenterofthealluvialregion,wherenumerousbridgeandwharffailureshaveoccurreddueto soilconditions(Leeetal.,2013).Currently,thereare threeoutoftenlongbridgesbeingconstructedinthese locationsaspartofacoastalroadnetworkproject (SarawakCoastalRoadNetwork,2021).
Inallthreestudylocations,undisturbedsoilsampleswereextractedfromboreholesusingathin-walled sampler(Shelbytube)thatconformedtoindustrial standardpracticeBS-5930(BritishStandards[BS], 1999).Thesamplerusedwasastainlesssteeltubewith
anouterdiameterof63.5mm,awallthicknessof1.0 mm,alengthof600mm,andacuttingedgeofabout 60° withrespecttothelong-axis;thiswasgreaterthan the5° suggestedbyHightandLeroueil(2003).Acuttingshoeandcorecatcherwerenotused.Theinside clearanceratiowas0percent;thatis,thewallwasflush (straight)fromedgetoedge,lowerthanthe1percent recommendedbyBS-5930(BS,1999).Theratiobetweentheouterdiameterandthewallthicknesswas 63.5,greaterthanminimumrecommendedratioof45 byLaddandDeGroot(2003).Thesecriteriawould yieldthebestqualityundisturbedsamples(Clayton etal.,1998;LaddandDeGroot,2003;Lowetal., 2011).Alltheundisturbedsamplesinthethin-walled samplerwereplacedincushionedboxesandcarefully transportedtothelaboratorytoensureminimumdisturbancetothesoil.Therecoveryratioinallsampling wassuccessfullyobtainedintherangeof75100percent.Priortoeachtest,anadequatesoilsamplewas takenfromthethin-walledsamplerusingahydraulic extruder.
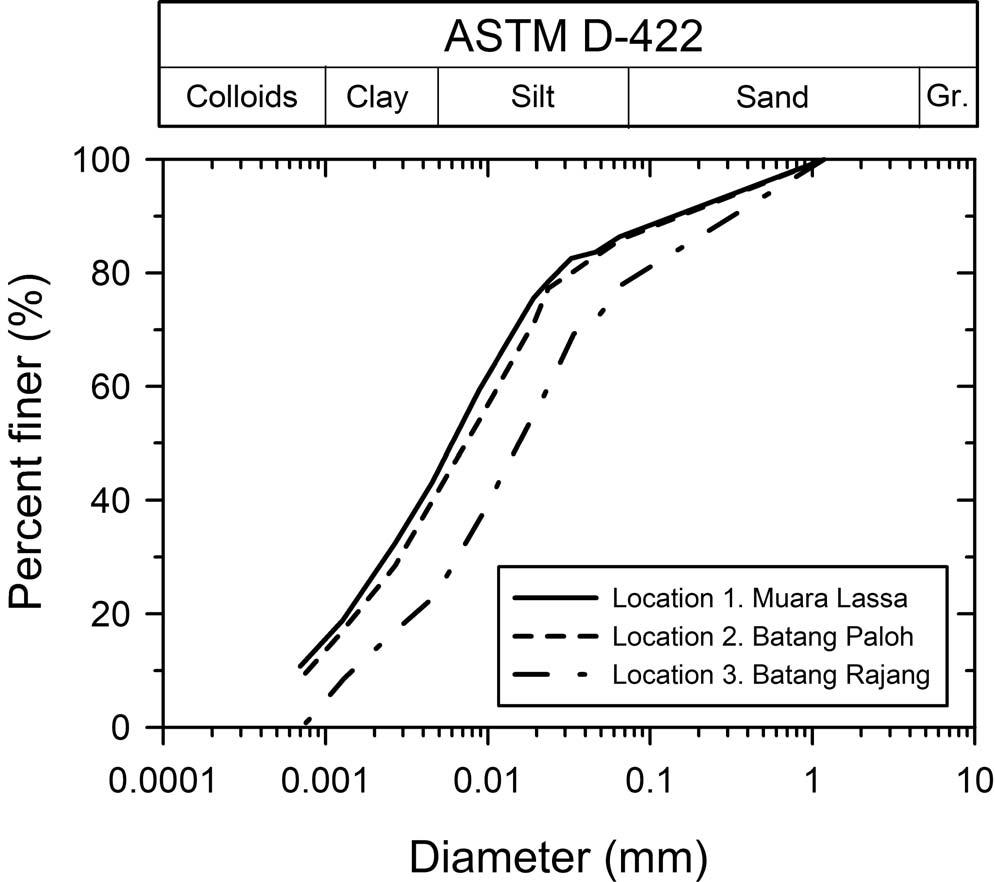
Someofthesampleswereusedforindexproperty teststoevaluatethephysicalpropertiesofthesoils (Table1).Thesampleshadabout8–10percentorganic material(matter)thatcausedaslightlylowerspecific gravityofsolidsvalueswhencomparedtoinorganic soils.However,theorganicfiberwasnotapparent.The organicmatterwasidentifiedonlybythepatchydark colorwithinthesamplesandthedarkcolorsuspensioninthewaterduringspecificgravityandhydrometertests.Theextrudedsampleshadanaturalwater contentslightlylowerthantheirliquidlimits.Toqualifyfororganicclassification,ASTM-D2487(American SocietyforTestingandMaterials[ASTM],2017a)requiredtheliquidlimittobeperformedonbothovendriedandnot-driedspecimens.Figure1showstheparticlesizedistribution(bymass)ofthesoilsamples determinedbyusingthehydrometertestprocedure (ASTM-D422;ASTM,2007).Itshowsthatallsampleparticleswereprimarilywithinthesiltsizerange. Thesampleswereclassifiedassandyorganicsilt(OH) accordingtotheUnifiedSoilClassificationSystem (ASTM-D2487;ASTM,2017a).TheelementalcompositionbypercentofmassusingenergydispersiveXrayspectrometerislistedinTable2.
DIRECTSIMPLESHEAR(DSS)EXPERIMENTS
DSSApparatus
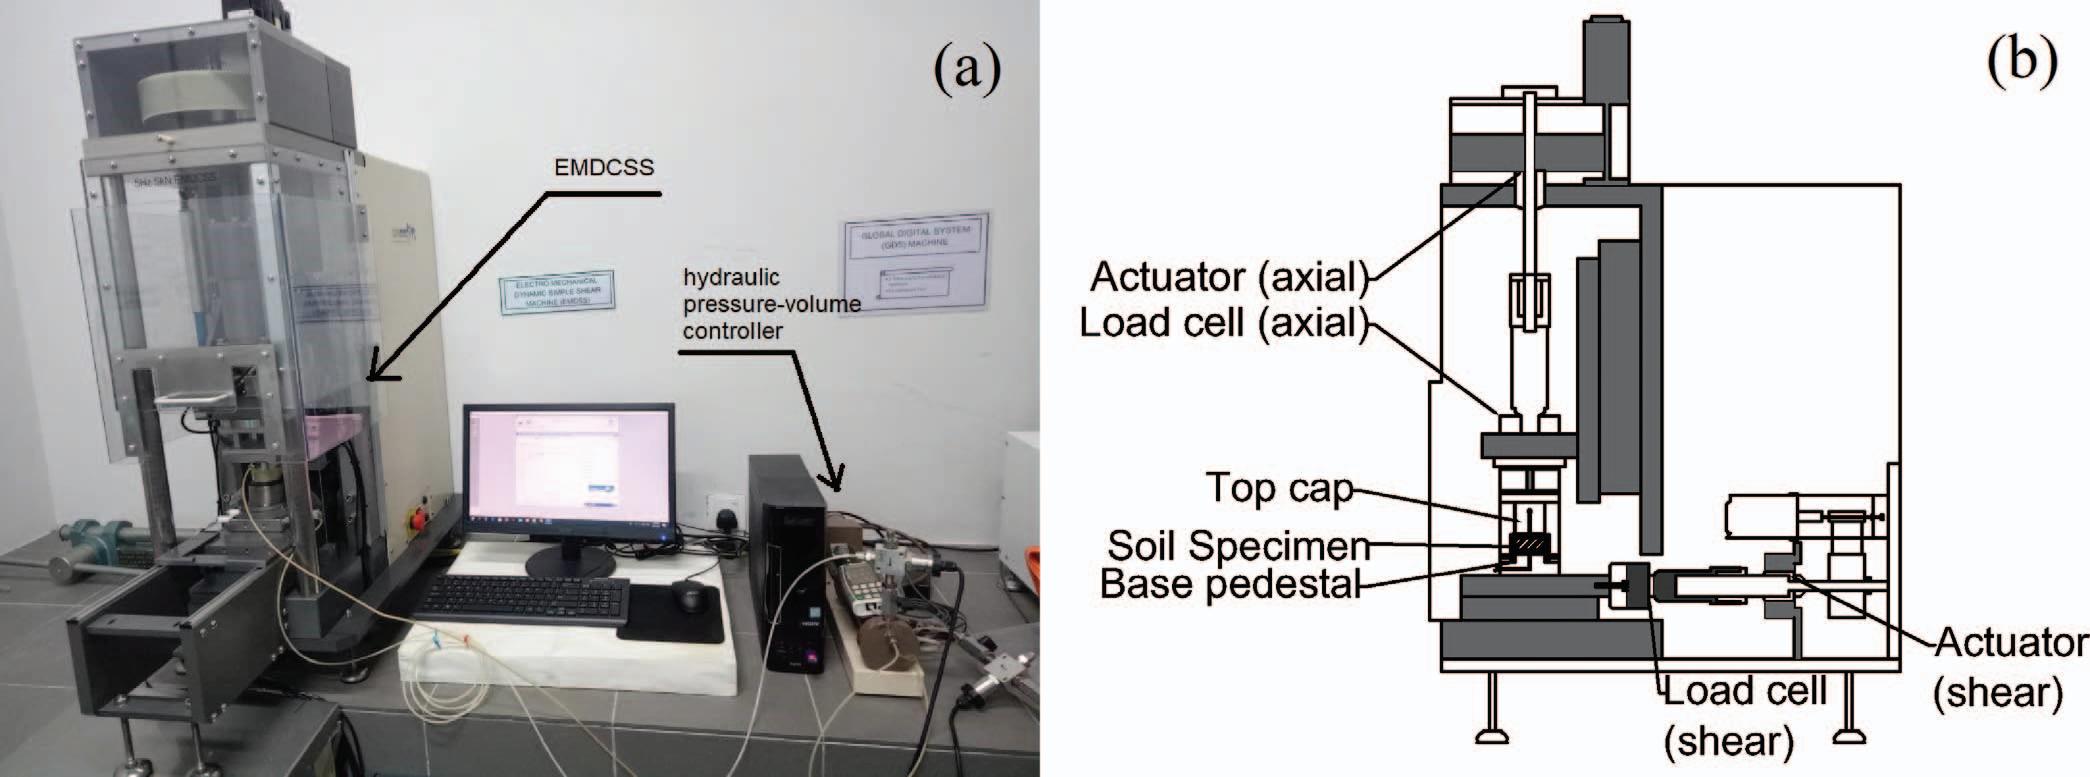
DSSexperimentswereconductedusinganelectromechanicalsimpleshearapparatus,ElectromechanicalDynamicCyclicSimpleShearDevice(EMDCSS;GDSInstruments,Hampshire,U.K.;Figure2). Themaincomponentsoftheapparatusweretwo
Hasan,Ismail,Lee,andAlshibli
348 Environmental&EngineeringGeoscience,Vol.XXVIII,No.4,November2022,pp.347–360
Table1. Indexpropertiesofthetropicalalluvialsoilsamples.
LiquidLimit(%)2 PlasticLimit(%)2 PlasticityIndex,PI2
Location SpecificGravity ofSolids(Gs )1 Non–OvenDried OvenDried Non–OvenDried OvenDried Non–OvenDried OvenDried Organic Matter(%)3 Moisture Content(%)4 12.507254433327218.058.7 22.428057443237258.157.7 32.4972474423282410.658.1
1 ASTM-D854;ATSM,2014.
2 ASTM-D4318;ATSM,2017b.
3 ASTM-D2974;ATSM,2020.
4 ASTM-D2216;ATSM,2005.
ASTM = AmericanSocietyforTestingandMaterials.
Figure1.Particlesizedistributions.
loadingactuators,twodisplacementmeasuringsensors,twoforcemeasuringsensors,ahydraulic pressure-volumecontrollersystem,andalateralconfinementdevice.Thetwoloadingactuatorsapplied vertical(axialornormal)loadtothespecimentop capandhorizontalorshearloadtothespecimenbase pedestal.Duringshearing,theverticalactuatorcould befixedviapassiveheightcontrolwithnorotation whilethehorizontalactuatorappliedshearloadvia astrain-controlledloadingmode.Built-inencoders withintheactuatorsmaintainedtheirprecisestrain rateduringloading.Thedisplacementmeasuringdevicesincludedaverticalandahorizontallinearvariabledifferentialtransformercapableofmeasuringdisplacementwithanaccuracygreaterthan99.9percent full-scaleoutput.Theforce-measuringsensorsconsistedofverticalandhorizontal10-kNcapacity“pancaketype”loadcells“in-line”withtheactuators.The hydraulicpressure-volumecontrollerappliedandmeasuredporewaterpressure(backpressure)withinthe specimen(Figure2a).Thelateralconfinementdevice
SimpleShearAnalysisforaTropicalAlluvialSoil
Table2. Elementalcompositionsofsoilsamplesandclayfractionofsamples. ElementPercentagebyMass(%) RandomParticlesinSamplesClayParticlesinSamples No.SymbolNameLocation1Location2Location3Location1Location2Location3 1OOxygen37.140.747.349.440.553.8 2SiSilicon26.926.233.922.311.618.9 3CCarbon21.318.67.11834.28.2 4AlAluminum8.78.48.74.76.111.5 5KPotassium32.5—1.12.31.8 6YbYtterbium1.41.7———— 7WTungsten1————— 8PbLead0.6—31.41.1— 9FeIron—1.3—3.13.84.1 10MgMagnesium—0.6——0.40.6 11SSulphur —————1.1 Environmental&EngineeringGeoscience
349
,Vol.XXVIII,No.4,November2022,pp.347–360
consistedofastackofTeflon-coatedringsthatencircledthecylindricalsoilspecimen.Theinnerdiameter, outerdiameter,andthicknessoftheringswere51,6.5, and1mm,respectively.Alldeviceswereconnectedtoa dataacquisitionsystemtocontrolaswellastoregister themeasurementsinacomputersystem.TheEMDCSSdevicecouldbesetandruninafullyautomatic modefromtheconsolidationstageuntiltheendofthe shearingstage.
Specimens
Thespecimenswerecylindrical,measuring50mm indiameterand20mminheight,whichconformed toASTM-D6528(ASTM,2017c).Theyweretrimmed fromextrudedShelbytubesamplesusingaspecial ring-shapedcutterwithasharpedgetominimizedisturbanceduringspecimencutting(Figure3aandb). Thespecimenswerecuthorizontallyandvertically.Table3listsallspecimensusedintheDSStestsandtheir cuttingorientations.Samplesfromlocation1weredividedintosixgroups(group1to6):threegroupswere cuthorizontally;theotherthreewerecutvertically. Thesamplesfromlocations2and3wereeachdivided intotwogroups(group7to10):onegroupwascuthorizontally,theothervertically.Eachgroupconsistedof threetosixspecimens.Thetotalnumberofgroupsand specimenswere10and52,respectively.The insitu verticalstress(σ v 0 )ofthespecimenswascalculatedfrom thesaturatedunitweight(γsat )andthedepthofthe samples.
Afterbeingtrimmed,eachspecimen(withthecutter)waspre-saturatedbybeingsubmergedintapwater for3days.Pre-saturationwasfoundtobeveryuseful
forexpeditingthesaturationstageduringtesting. Nospecimensexhibitedswellingafterpre-saturation. Thepreparationbeforethetestwasaccordingtothe followingsequence:(1)Thespecimenwasremoved fromthecutter;(2)specimenwasplacedonthebase pedestal;(3)specimenwasenclosedinalatexmembraneusingaspecialmoldwithasuctionhose;(4) thelatexmembrane(0.5mmthick)wassealedusing arubberO-ringatthebottom(Figure3c);(5)the specimenwasenclosedwithinalateralconfinement deviceconsistingofastackofTeflon-coatedrings (Figure3d),madeslightlylongerthanthespecimen toproperlyinsertthetopcap;(6)thetopcapwas lowereduntilittouchedthesurfaceofthespecimen; and(7)thelatexmembranewasstretchedaround thetopcapandsealedwithtworubberO-rings (Figure3e).
Notethatthelatexmembranewasusedtodirectly measuretheexcessporewaterpressure(e.g.,Ishihara andYamazaki,1980;MengandChu,2011;Lietal., 2017).Thediameterofthemembranewasslightly lessthan50mmtoprovidesubstantialliningbetweenthespecimenandrings.Theinitialmembrane resistance(hoopstress)wasverysmall,andmembraneresistancecorrectionduringverticalloadingwas notneededsincethespecimenwasrestrictedbythe rings(Greeuwetal.,2001).Theringsmaintaineda constantdiameterofthespecimenthroughoutthe testwithminimalfriction.Afterthetest,thespecimendeformedfollowinganobliquecylindershape (Figure3f).
TheDSSexperimentswereconductedaccordingto ASTM-D6528(ASTM,2017c)standardexceptforthe drainagecondition,wherespecimenswerecompletely
Hasan,Ismail,Lee,andAlshibli
Figure2.GDSEMDCSS(GlobalDigitalSystems,ElectromechanicalDynamicCyclicSimpleShearDevice)directsimpleshearapparatus. (a)Thepictureoftheapparatusand(b)theschematicdiagram.
350 Environmental&EngineeringGeoscience,Vol.XXVIII,No.4,November2022,pp.347–360
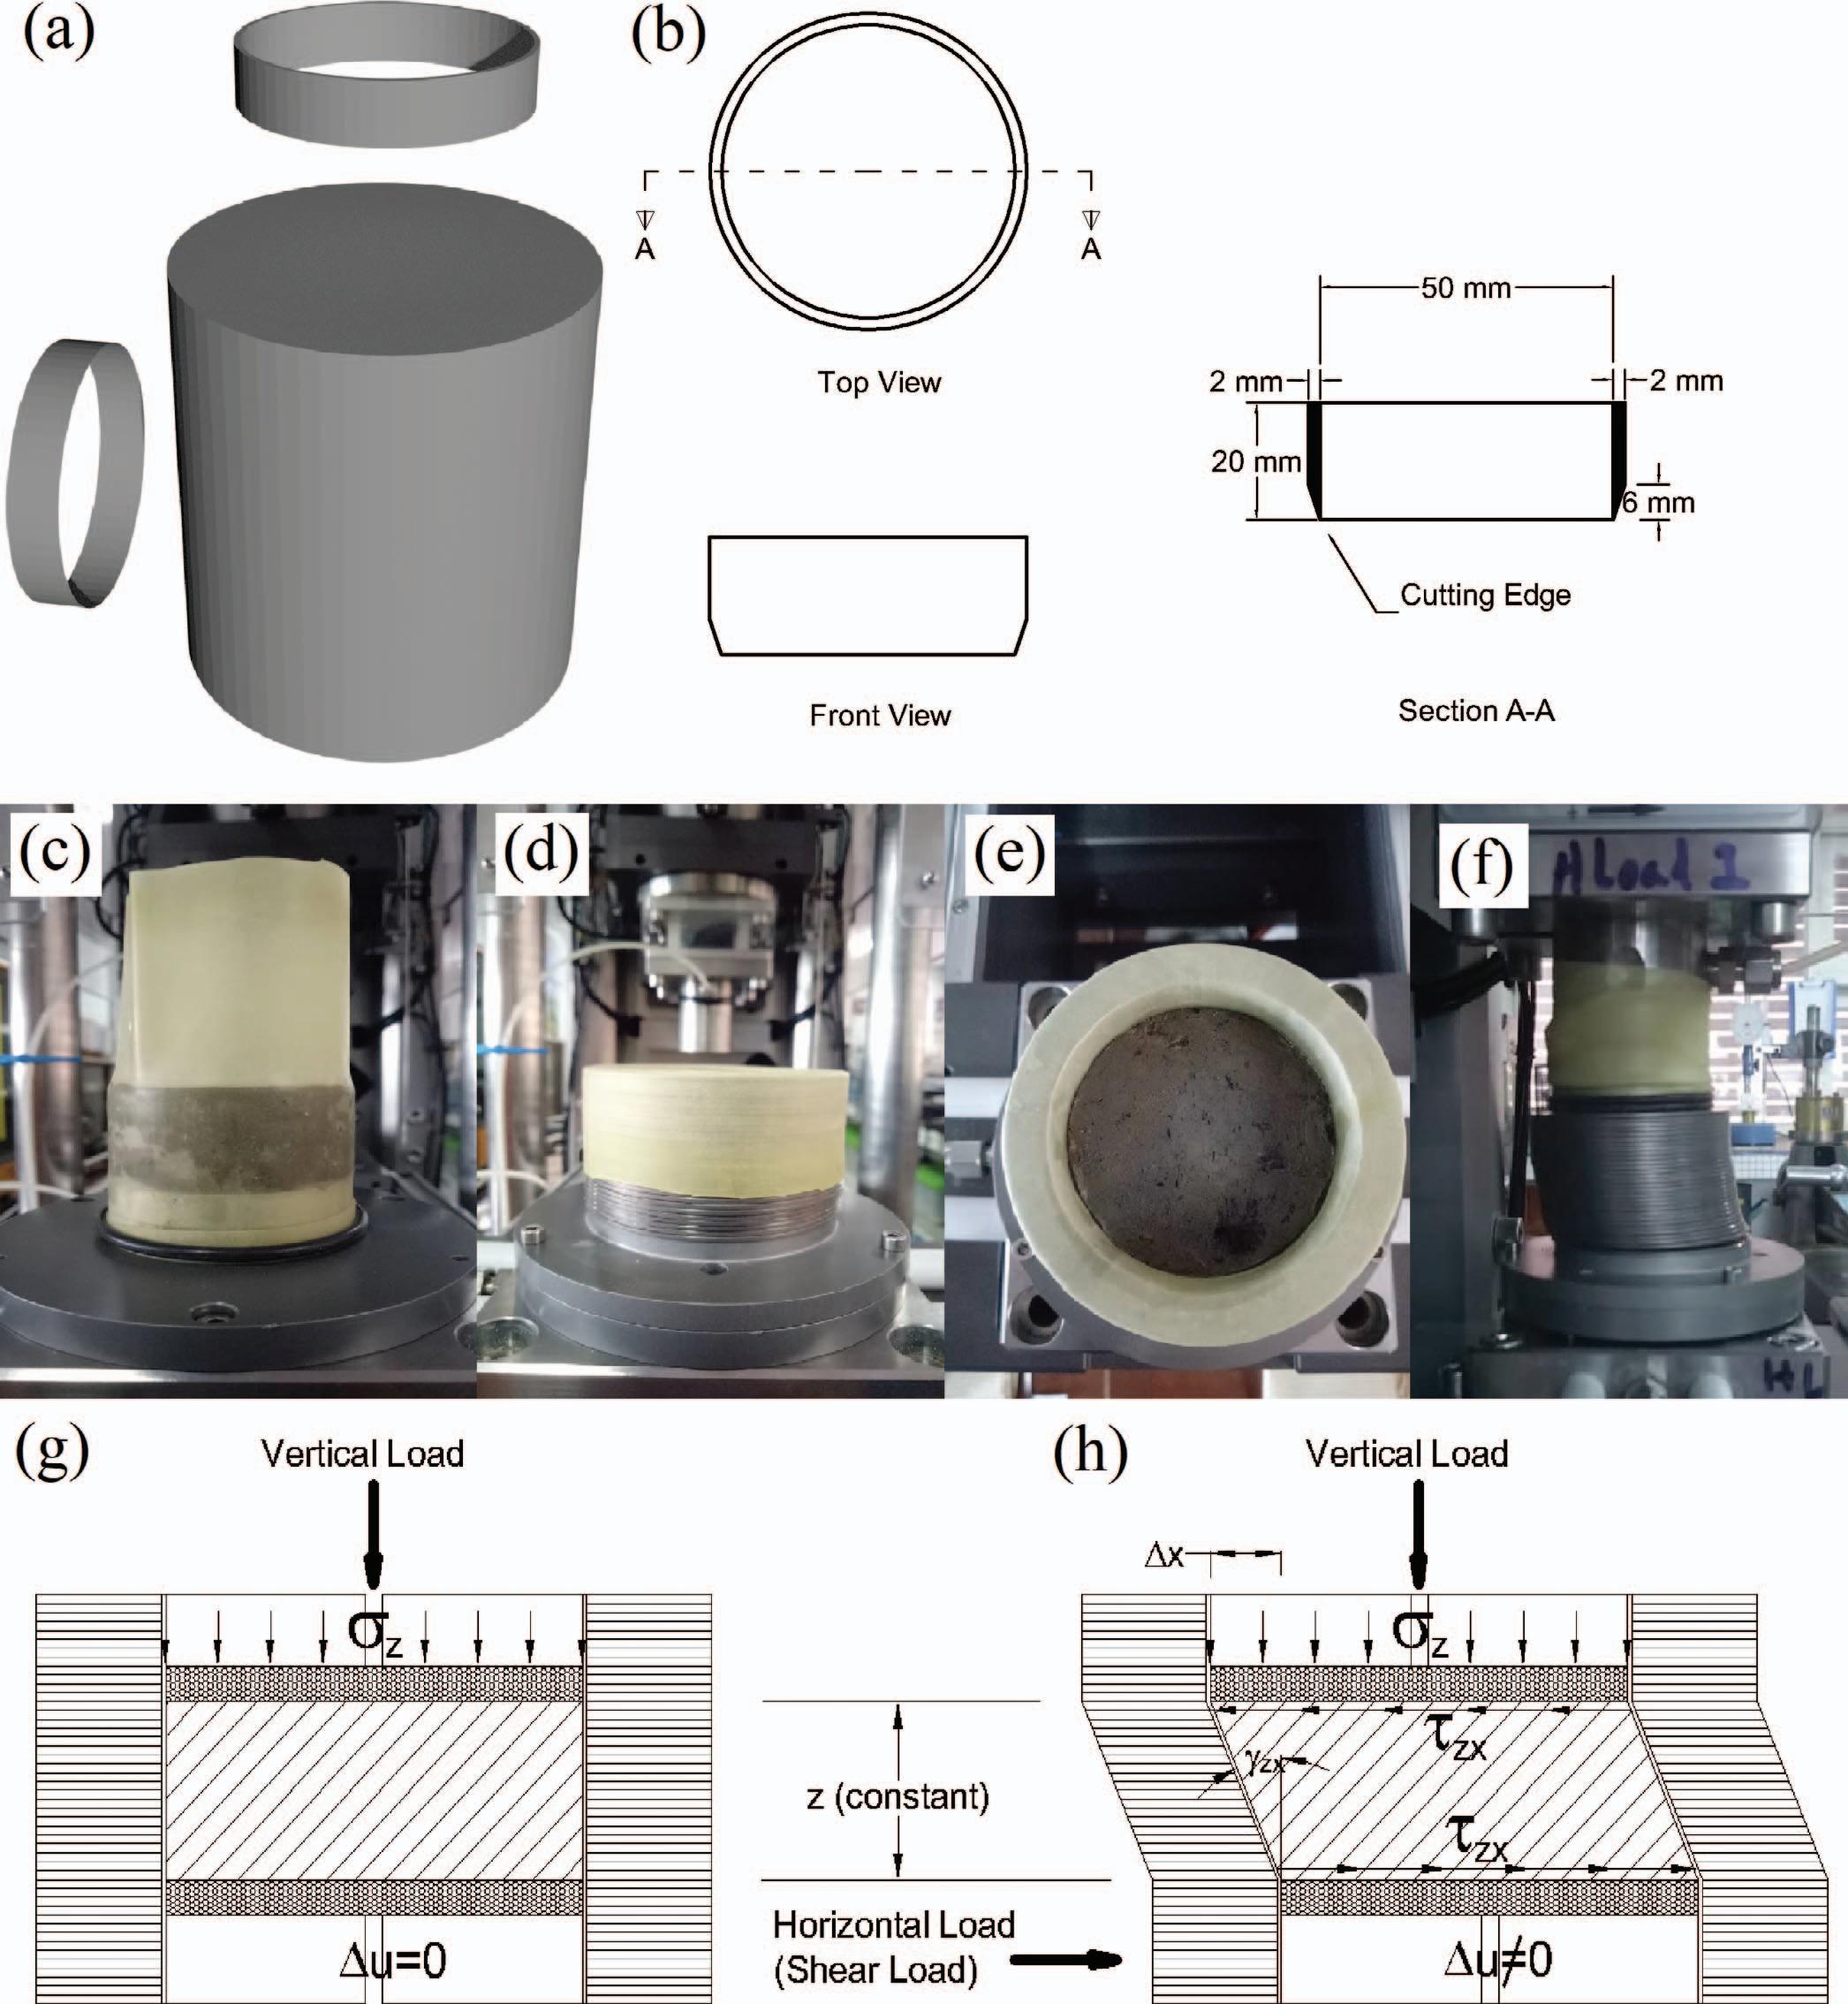
SimpleShearAnalysisforaTropicalAlluvialSoil Figure3.Thespecimen.(a)3Drenderingofanextrudedsampleandtwocuttingdirections,(b)detailsofspecimencutter,(c)afterenclosing withthelatexmembrane,(d)afterplacingTefloncoatedrings,(e)topviewofthespecimen,(f)specimenafterthetest,(g)diagramafter consolidation,and(h)diagramafterundrainedshearing. Environmental&EngineeringGeoscience,Vol.XXVIII,No.4,November2022,pp.347–360 351
Table3. Specimendetails.
Location Group NumberGroupName
Numberof Specimensin EachGroup
Depthfrom GroundLevel (m)
SaturatedUnit Weight, γsat (kN/m3 )
Insitu Vertical EffectiveStress, σ v 0 (kPa) Cutting Orientation 11M1-H612.515.874.8Horizontal 2M2-H66.516.342.0 3M3-H621.516.3140.4 4M1-V69.015.047.3Vertical 5M2-V512.515.874.5 6M3-V413.516.286.5 27P-H412.515.874.5Horizontal 8P-V64.515.626.0Vertical 39R-H615.516.4102.5Horizontal 10R-V34.516.229.0Vertical
H = horizontal;V = vertical.
sealed(undrained)throughouttheshearingphaseof thetestandporewaterpressurewasmeasured.Once apre-saturatedspecimenwasfullypreparedinthe DSSapparatus(withtopcapinplaceandsealed),the testcommencedfirstwithamanualsaturationcheck. Backpressurewasincreasedwhilethetopcap(verticalactuator)wasfixedandseatingpressurewasmaintainednearlyconstantforafewminutes.Backpressurewasthenstoppedandthespecimenwasslightly compressed.Ifporewaterpressureincreasedrapidly (<15seconds),itwasassumedthespecimenwasfully saturated.Notethatthesaturationcheckfolloweda proceduresimilartothecontrolled-strainloadingconsolidationtest,ASTM-D4186(ASTM,2012).
Thenextstepwastoconsolidatethespecimenaccordingtothetargetconsolidationpressure(σ z 0 ), between20kPaand640kPa(Table4).Theoverconsolidationclassificationwascalculatedbasedon insitu verticalstress(σ v 0 ).Thenumberofoverconsolidated(OC)andnormallyconsolidated(NC) specimenswere18and34,respectively.Duringconsolidation,porewaterwasallowedtodrainfromthe
specimenintothehydraulicpressure-volumecontrolleruntilexcessporewaterpressuredissipated(Figure3g).Sincethesoilwasmainlysilt,theconsolidation phasewasachievedrelativelyquickly;forexample,in 640kPaconsolidationpressure(σ z 0 ),theconsolidationterminatedwithin0.5hours.Oncetheconsolidationphasewascompleted,theverticalactuator waslockedinpositiontomaintainaconstantsample height.Thehorizontalactuatorappliedtheshearload bymovingthebasepedestalwithaconstanthorizontaldisplacementrateof5mm/hour.Duringshearing, porewaterdrainagewasalwaysclosed(undrained), andexcessporewaterpressure( u)wasmonitored. Sincewaterisnearlyincompressible,aconstantvolumecouldbeassumed(Figure3h).
Thevertical(normal)load, Fz (kN);horizontal (shear)load, Fh (kN);horizontal(shear)displacement, x (mm);andtheexcessporewaterpressure, u (kPa) wererecordedevery5seconds.Fromthesedata,vertical(normal)stress, σz (kPa);shearstress, τzx (kPa);and shearstrain, γzx (percent)werecomputed.Theshearingwasterminatedatabout14mmhorizontal(shear)
M1-H674.820(OC),40(OC),80(NC),160(NC),320(NC),640(NC) M2-H64220(OC),40(OC),80(NC),160(NC),320(NC),640(NC)
M3-H6140.420(OC),40(OC),80(OC),160(NC),320(NC),640(NC) M1-V647.320(OC),40(OC),80(NC),160(NC),320(NC),640(NC)
M2-V574.520(OC),40(OC),80(NC),160(NC),320(NC)
M3-V486.540(OC),80(OC),160(NC),320(NC) P-H474.540(OC),80(NC),160(NC),320(NC)
P-V62620(OC),40(NC),80(NC),160(NC),320(NC),640(NC)
R-H6102.520(OC),40(OC),80(OC),160(NC),320(NC),640(NC)
R-V32940(NC),80(NC),160(NC)
H = horizontal;V = vertical;OC = over-consolidated;NC = normallyconsolidated.
Hasan,Ismail,Lee,andAlshibli
Table4. Listoftests. Specimen Group Numberof Specimens Insitu VerticalEffective Stress, σ v 0 (kPa) ConsolidationPressure(EffectiveVerticalStress)Applied, σ z 0 (kPa)
352 Environmental&EngineeringGeoscience
,Vol.XXVIII,No.4,November2022,pp.347–360
Figure4.Voidratioversusnormalizedconsolidationpressure.
travelofthebasepedestal,whichwasequivalentto ashearstrain(γzx )of70percentorashearangleof 35° withrespecttotheverticalaxis.Aftershearing,the horizontalactuatorwasretractedtoitsinitialposition toeaseindismantlingthespecimen.Watercontentwas measuredandthetestwascompleted.
RESULTS
ConsolidationPhase
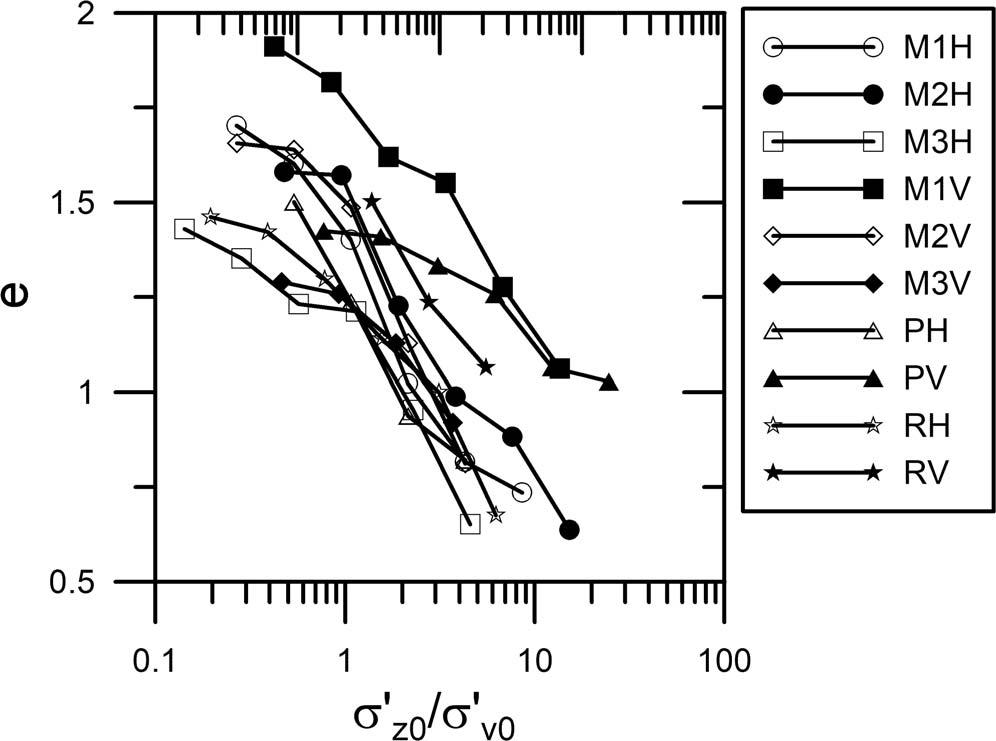
Figure4showscompressibilityplotsofthevoidratio(e)andlogofnormalizedconsolidationpressure withrespectto insitu verticalstress(σ z 0 /σ v 0 )forall specimens.Eachdatapointrepresentstheresultofone test.Forfullysaturatedspecimens,thevoidratio(e)is calculatedasfollows: e = w Gs (1) where Gs isthespecificgravityofsolidsand w iswatercontentofthespecimen.Thecurvesindicatethat asnormalizedconsolidationpressureincreases,void ratiodecreasescorrespondingtotheamountofpore waterpressuredissipationfromthespecimens.The curvesslightlyturnatnormalizedconsolidationpressureequaltounity,whichdemonstratesthatthespecimensarenormallyconsolidated.Thisconclusionisin agreementwiththefactthattherewasnorecordofany structures,hills,orfillontopofthesoildepositinthe past.
ShearingPhase
Figure5showstherelationshipofshearstress, τzx (kPa);excessporewaterpressure, u (kPa);andtotal verticalstress, σz (kPa),versusshearstrain, γz (percent)forM1-Hspecimens.Theresultsofallother specimensaregiveninAppendixA(seeSupplemental
Material,AppendixA).Overall,shearstressincreased asshearstrainincreaseduntilitreachedthepeak shearstressstate,afterwhichitgraduallyplateaued. Thepeakshearstressstateexisted(obviouslyvisible)forthespecimenswithconsolidationpressuresof 160kPaandhigherthatwereattainedbefore20percentofshearstrain.Afterthepeak,mostcurves reachedresidualstates(well-plateauedcurve)except forspecimenswith640kPaconsolidationpressure. Thecurveslopeanglebeforethepeakstateindicated thattheshearmoduluscorrespondedtoconsolidation pressure,whichwasaresultofreducingvoidratio(increasingindensity)asevidencedinFigure4.
Excessporewaterpressurechangeswerebetween2 and 4kPa,whichisquiteinsignificantcomparedto changesinverticalstress.Hence,therewasnoequalitybetweenchangeinverticalstresswithchangein porewaterpressure,whichdisagreeswiththeassertion fromBjerrumandLandva(1966).Theyconducted aconstant-volumedraintestbutasserted(strongly predicted)theequivalencybetweenchangeinvertical stressandchangeinporewaterpressure(inaconstantvolumeundrainedtest).Forthemostpart,theexcess porewaterpressurecurvestendedtodecreaseasshear strainincreased.Thechangeintheexcessporewaterpressuremighthavebeenduetothedistribution ratewithinthespecimenduringshearing,whichcorrelatedwiththeuseddisplacementrate.Thetotalverticalstresscurvesdecreasedasshearstrainincreased andgraduallydiminishedtoapproximatelyaconstant (plateau)valueafter20percentofshearstrain.The specimenswithhigherconsolidationpressureshowed amoresignificantdecrease.Fromvisualobservation, therewasnoevidenceofslippagebetweenthetopcap orbasepedestalandthespecimenduringshearingin anyspecimen.Thetopcapandbasepedestalhadcorrugatedsurfacesthathelpedpreventslippageevenat thelowestconsolidationpressureof20kPa.Afterbeingsheared,thespecimensformedanobliquecylinder shape,andthesideswereinclined.
ANALYSESANDDISCUSSIONS
PeakStrength
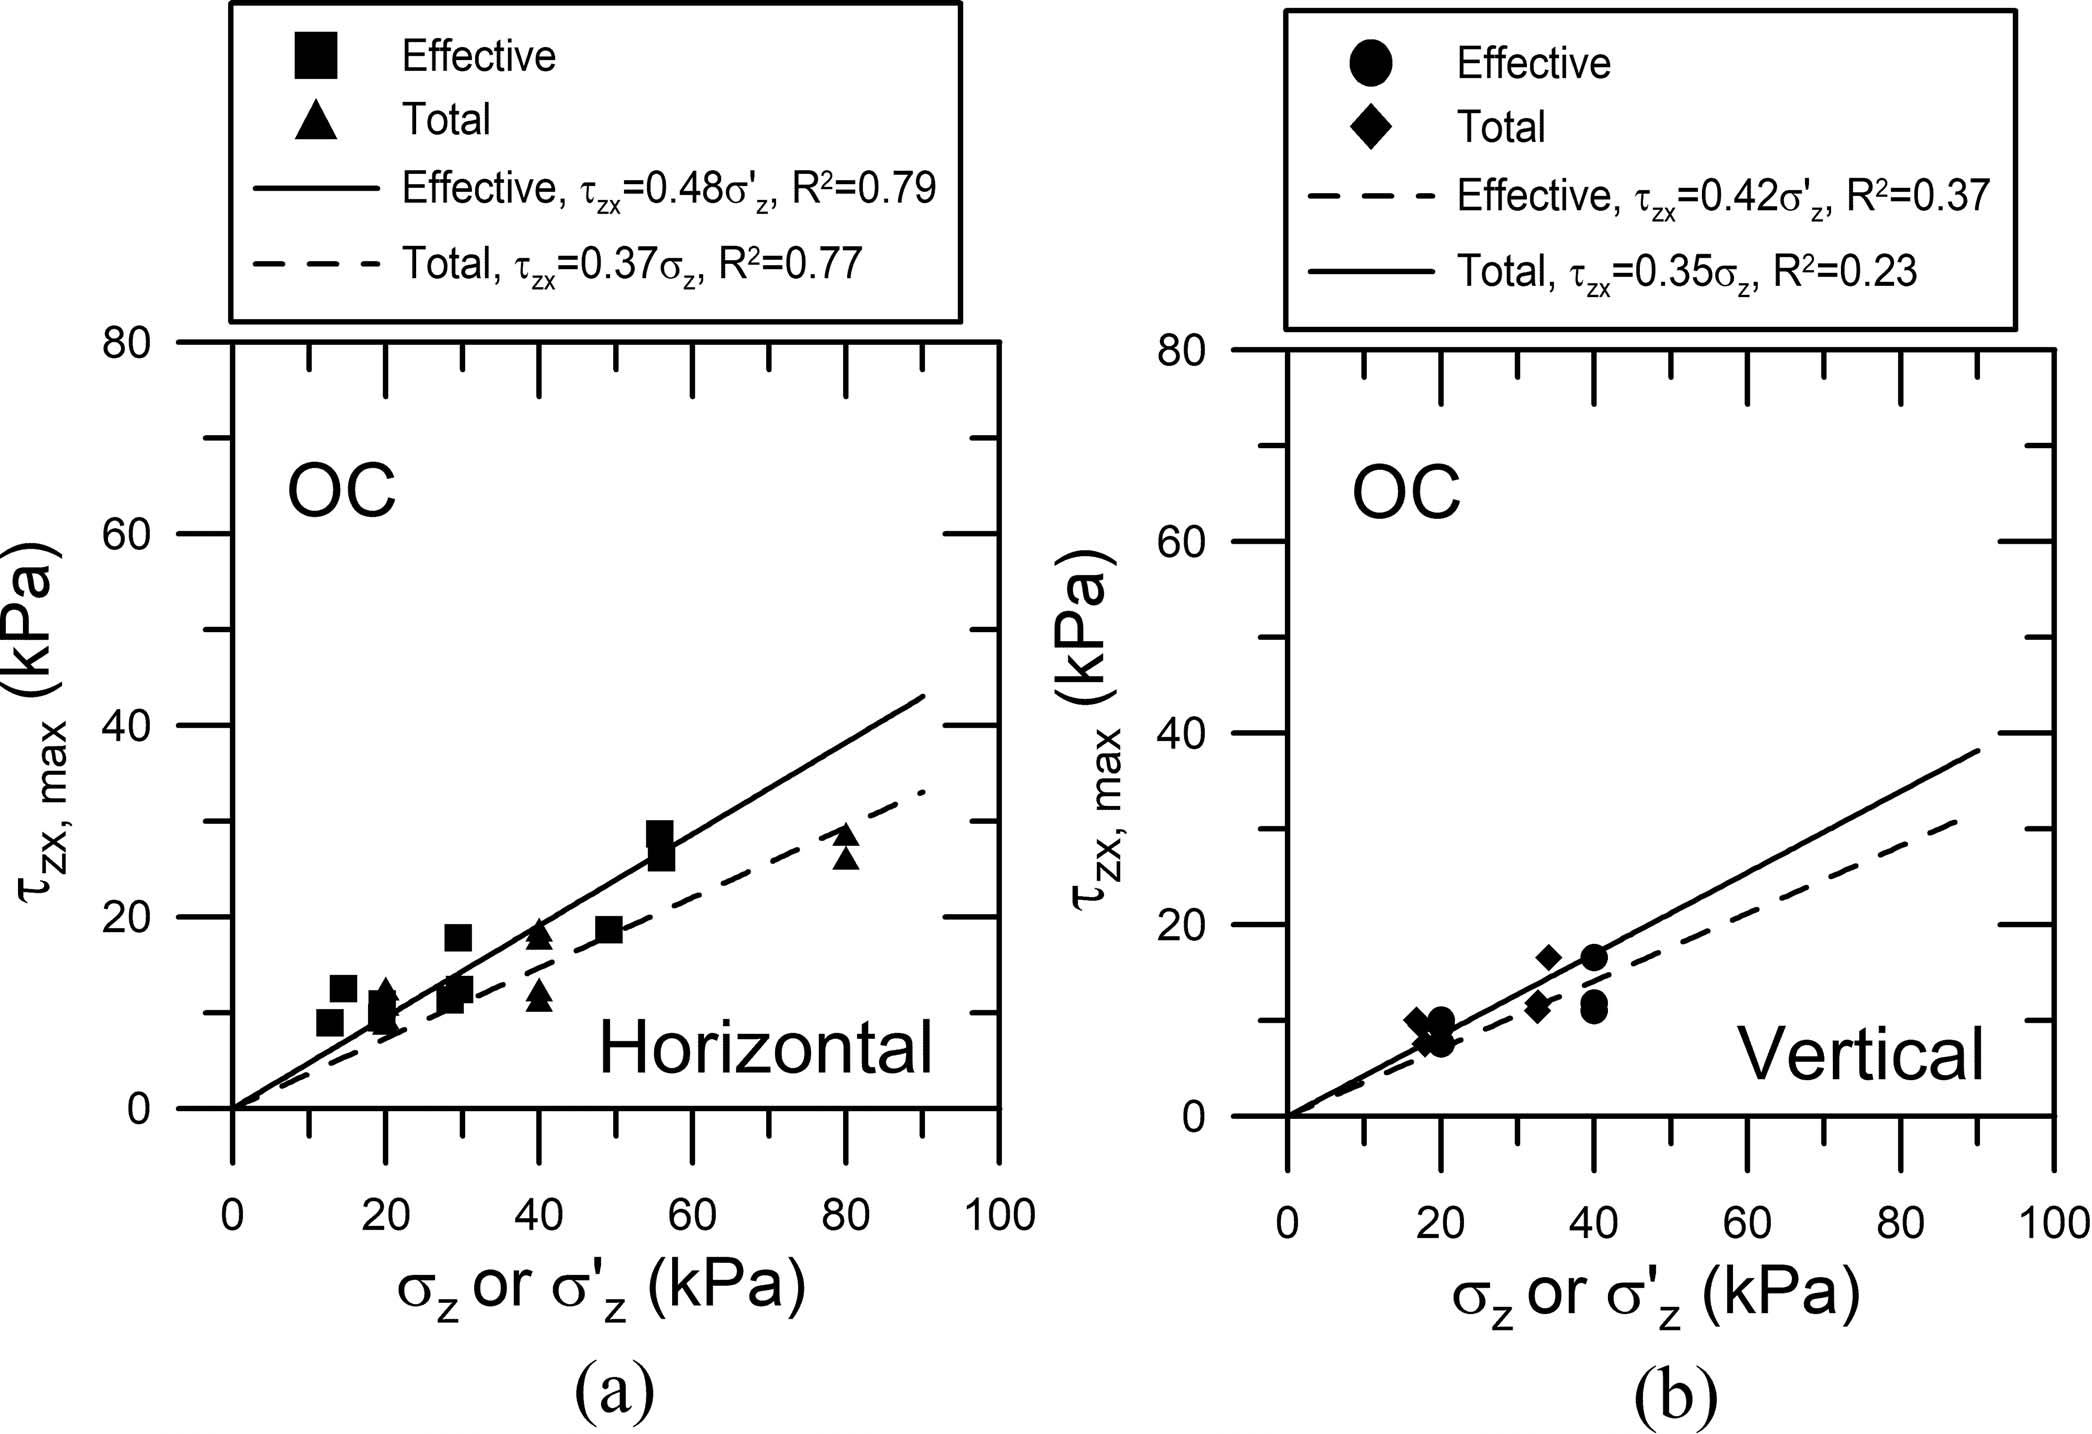
Figure6aandbshowplotsofthepeakshear strength(τzx, max )andcorrespondingverticalstress(totalandeffective)forOCspecimens.Theresultsof NCandthecombinationofOCandNCspecimens aregiveninAppendixB(seeSupplementalMaterial,AppendixB).Notethatpeakshearstrengthis equaltomaximumshearstrengthduringshearing. However,ifthepeakisnotreachedbefore20percent ofshearstrain,thentheshearstressat20percentshear strainistakenasthepeak.The20percentshearstrain
SimpleShearAnalysisforaTropicalAlluvialSoil
Environmental&EngineeringGeoscience
353
,Vol.XXVIII,No.4,November2022,pp.347–360
Figure5.M1-Hspecimens:results.(a)Shearstressversusshearstrain,(b)excessporewaterpressureversusshearstrain,and(c)totalvertical stressversusshearstrain.

isassociatedwithpracticalserviceabilitylimit,and ASTM-D6528(ASTM,2017c)specifiesamaximum shearstrainof20percentinasimplesheartest.The datawerefittedintotheMohr–Coulombmodelassumingtherelationshipsstartedfromtheoriginofcoordinates.Thisassumptionwasmadebasedonthevisualobservationthattherewasnotruecohesionfound inthesamples;thatis,theunconfinedsamplecouldbe easilybrokenifsubmergedinwater.
TheNCspecimensexhibitedaverygoodfitwiththe Mohr–Coulombmodel.Basedoncoefficientsofdetermination(R2 ),horizontallycutspecimensshowed abetterrandomerrorthanverticallycutspecimens. Similarly,effectiverelationshipswerebetterthantotal stressrelationships.Thecurvefittingshowedslopesof 0.44and0.23foreffectiveandtotalcases,respectively. Therewasnodifferenceintermsofslopebetweenhorizontallyandverticallycutspecimens.Also,thecombinationofOCandNCdidnotchangetheslope.Becausethe y-axisinterceptwaszero,thepeakeffective frictionangle(ϕ dss )andtotalfrictionangle(ϕdss )were calculatedas:
TheOCspecimensshowedapoorerfitforthe Mohr–CoulombmodelwhencomparedtotheNC specimens.However,theslopewasnotsignificantlyaffectedwhenOCdatawerecombinedwithNCdata. TodescribetheeffectofOCtothemaximumshear strength,ageneralizedempiricalfunctionwasadopted
fromLaddetal.(1977): cu σz 0 = C × OCR (4) OCR = σ p σz 0 (5) where cu istheundrainedshearstrength(i.e.,equivalenttomaximumshearstrength[τzx ,max ]), σ z 0 isconsolidationpressure, C and areconstants,OCRis theover-consolidationratio,and σ p ispastmaximum pressureequivalenttothecurrent insitu verticalstress (σ v 0 )inthisexperiment.Theconstant C wasused todeterminetheupperboundorlowerboundlimits. Mayne(1988)collectedDSStestdatafornaturalclays andproposed0.35,0.15,and0.8forupperbound C, lowerbound C,and ,respectively.Figure7shows log-logscaleplotsofnormalizedpeakshearstrength versusOCRforthepresentdata,upperboundand lowerbound(Mayne,1988),anddatafromalluvial claytill(AtkinsonandLau,1991).Theplotsshowthat datapointsscatterwithinandbeyondtheupperbound andlowerboundplotsofnaturalclays.Thepresent datafittingintoEq.4showedasignificantdifference intermsofslopewhen wascomparedtoMayne’s (1988).The forhorizontalandverticalspecimens wasfoundtobe0.46and0.38,respectively.The C valuesforhorizontalandverticalspecimenswere0.25 and0.28,respectively.However,DSSdataofalluvial claytillweresomewhatinagreementwiththepresent data.Thus,theslope( )mightbedependentonsoil type.Despitethesimilarityincurve-fittingcoefficients, thedatapointsfortheverticalspecimenshowedasignificantlyhigherrandomerrorindicatedbyalower R2 valuecomparedtothehorizontalspecimens.
Hasan,Ismail,Lee,andAlshibli
ϕdss = tan 1 τzx σz = tan
=
◦
ϕdss = tan 1 τzx σz = tan 1
= 13◦
1 (0 43 )
23 3
(2)
(0.23 )
(3)
354 Environmental&EngineeringGeoscience,Vol.XXVIII,No.4,November2022,pp.347–360
Figure6.Maximumshearstrengthversustotalandeffectiveverticalstressforover-consolidated(OC)specimens.(a)Horizontallycutspecimensand(b)verticallycutspecimens.
DSSEffectiveStressPathontheHorizontalPlane
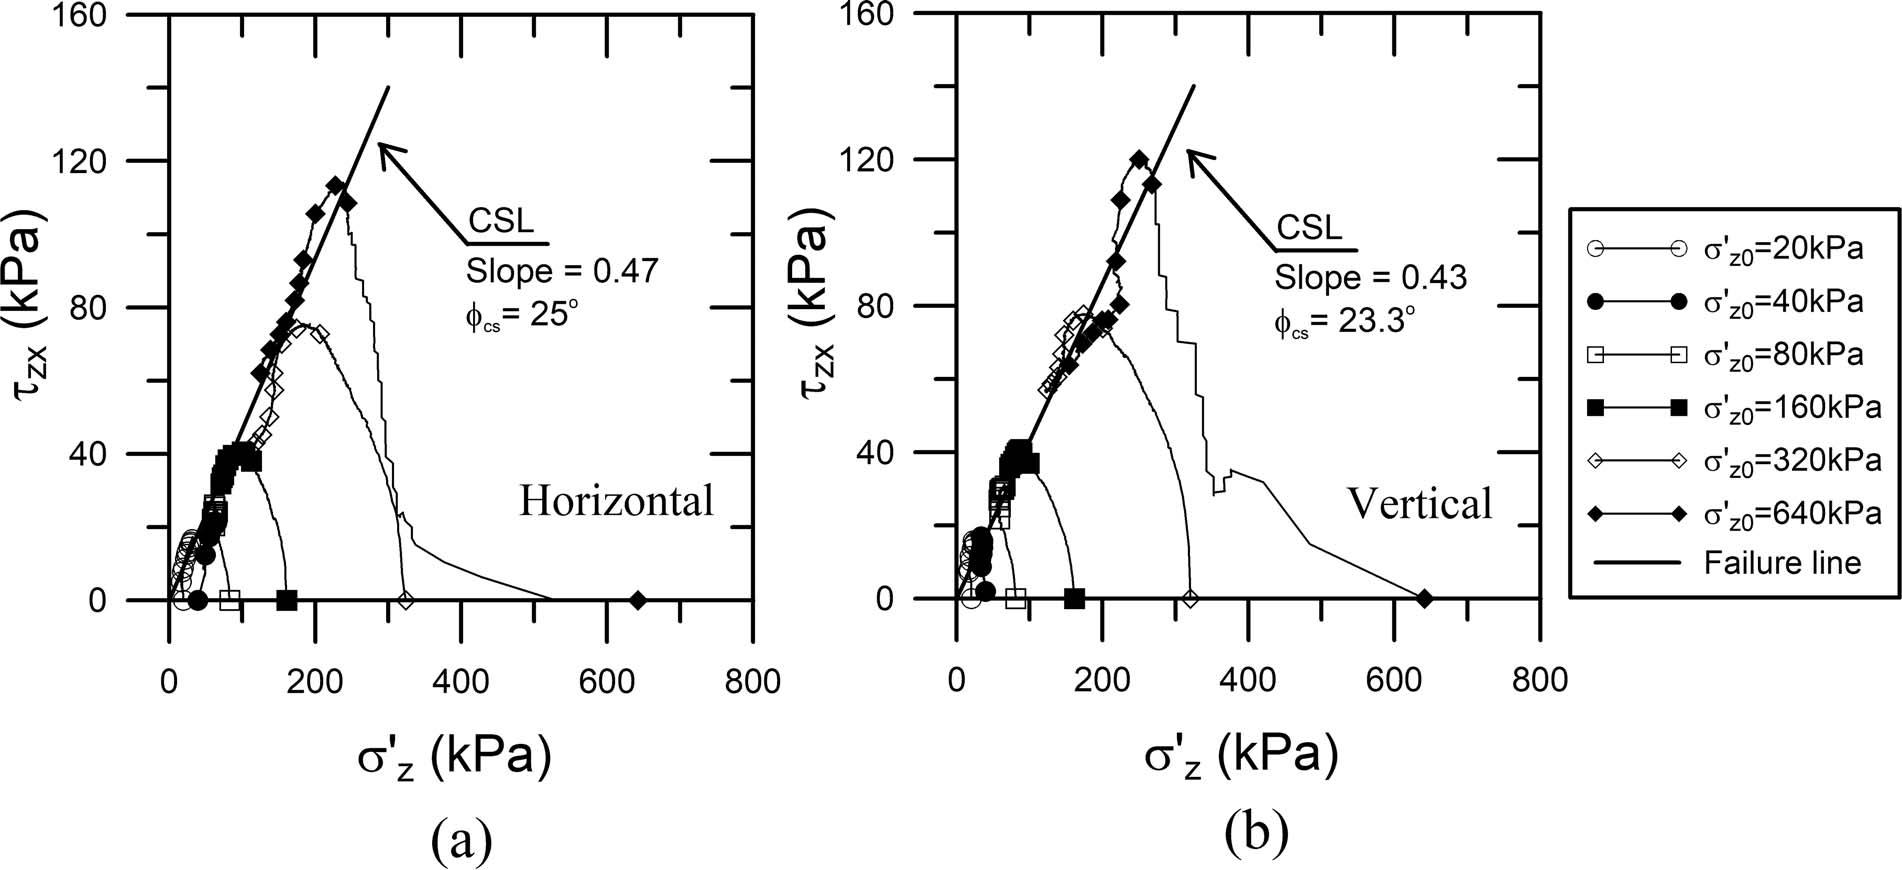
Figure8aandbdisplaysplotsofeffectivestress pathsonthehorizontalplaneforM1-HandM1-V specimens,respectively.Resultsofallotherspecimens aregiveninAppendixC(seeSupplementalMaterial, AppendixC).Datapointsfromhorizontallycutspecimensandverticallycutspecimensarecomparedside byside.Theeffectivestresspathsareusedtokeeptrack ofshearstress(τzx )aftertheconsolidationstageuntiltheendofshearingstage.Allcurvesinitiatedwith verticaleffectivestressequaltoconsolidationpressure (σ z 0 ),andshearstress(τzx )wereequaltozero.At thispoint,since τzx = 0,the x-axismustbeatthe principalstressplane.Asshearstrengthincreased, τzx and σ z werenolongeraprincipalstressplanesince τzx 0.Thetrajectoryofeffectivestresspathscurves towardstheleft,wheretheverticaleffectivestressreducesgradually.Interestingly,theirshapesaresimilar totheeffectivestresspathsofconsolidatedundrained triaxialtests,althoughtheincreaseofporewaterpres-
sureinthepresentDSStestswasinsignificant;thatis, themeasuredverticalstresswasalmostequaltotheeffectiveverticalstress.Aftershearstrengthreachedits maximumvalue,bothshearstrengthandverticaleffectivestressdecreasedandfinallyterminatedalongthe failurelines.Sincealltestshadbeenshearedtolarge shearstrain,thefailurelinesmustlieonthecritical stateline(CSL).
Recentnumericalstudiesshowedthattheprincipal stressplaneandtheplaneofmaximumstressobliquity (maximum τ/σ z )rotatecontinuouslyasshearstrain increasesandthehorizontalplanebecomestheplane ofmaximumstressobliquityatlargestrains(Doherty andFahey,2011;Wijewickremeetal.,2013).Basedon thisfinding,theCSLshowninFigure8aandbshould beattheplaneofmaximumstressobliquity,thatis, tangenttoMohr’scircle.TheDSScriticalstatefriction angle, ϕ cs,dss iscomputedas: tan ϕcs,dss = τzx σz (6)
SimpleShearAnalysisforaTropicalAlluvialSoil
355
Environmental&EngineeringGeoscience,Vol.XXVIII,No.4,November2022,pp.347–360
Figure7.Log-logscaleplotsofnormalizedpeakshearstrengthversusover-consolidationratio(OCR).
Figure8.Directsimpleshear(DSS)stresspaths;shearstressversusverticalstressdifferentiatingbetweenhorizontalandverticalspecimens. (a)M1-Hspecimensand(b)M1-Vspecimens.

Hasan,Ismail,Lee,andAlshibli
356
Environmental&EngineeringGeoscience,Vol.XXVIII,No.4,November2022,pp.347–360
TheCSLsshowedthattheaveragefrictionangles forhorizontalspecimensandverticalspecimenswere 23° and24.2°,respectively.Thehorizontalspecimen’s frictionanglewasslightlylowerthanthepeakeffective frictionangle.
SecantShearModulus(G50 )
Thesecantmodulusparameterisusefulforgeotechnicalengineerstoapplyinfoundationengineering practicetopredicttheelasticdeformationduetoshear. Itistheratiobetweenthechangeofshearstress andshearstrain,whichreducesprogressivelywith theshearstrain(VardanegaandBolton,2013;Dong etal.,2018).Theelasticcomponentinshearstrain canbeapproximatedwiththeratioofshearstressat halfofthepeakandthecorrespondingshearstrain (LambeandWhitman,1969).Itisusefultofindthe relationshipsbetweenmodulusandlevelsofapplied stressratherthannormalizingwithundrainedshear strength(Caseyetal.,2016).Figure9showsplotsof elasticshearmodulus, G50 ,forhorizontalandverticalspecimensagainsttheverticaleffectivestress(σ z ). Therangeofshearmoduluswasbetween95kPaand 14,000kPa,withintherangeoftypicalvaluesreported intheliterature.
TheNCspecimens(forbothhorizontalandvertical) showedagoodfitwithapowerfunction.Thefitting forhorizontalspecimensshowedahighercoefficientof determinationcomparedtotheverticalsamples.However,theover-consolidatedspecimens(forbothhorizontalandvertical)showedscattereddatapointsand didnotshowgoodrelationships.Thismightbedueto thestresshistoryofthespecimens,andadetailedinvestigationisrecommendedforfutureworks.
DirectionalityofMicrofabric
Theinherentanisotropyofthesoilswasquantified bymeasuringthemicrofabricdirectionality(orientation)inscanningelectronmicroscopy(SEM)imagesof averysmall,thinfractionofdriedsamples(Figure10). TopreparetheSEMsamples,undisturbedsamples fromdepthsof6.5m(location1),4.5m(location2), and4.5m(location3)wereovendried.Whencompletelydry,thesamplesweremanuallysplitinaverticalorientation.Athinsliceofuntouchedexposed surfacewascarefullycutandplacedintotheSEM sampleholder(note:theuntouchedsurfacefacedupward).TheSEMimageswerecroppedintosquare images(900 × 900pixels)toremoveimagelegend andscalebar.Thesesquareimages,whichrepresented 44 μm × 44 μmofactualsize,areshowninFigure 10atoc,left,forlocations1,2,and3,respectively.The SEMimageswereprocessedandanalyzedusingFiji
Figure9.Secantshearmoduli. G50 comparisonbetweenhorizontal andverticalspecimens.

software,basedonImageJsoftwarethatprovidedan open-sourceplatform,processingtools,andpluginsto conductimageanalyses(Schindelinetal.,2012).
TheSEMimagesrevealedflocculatededge-to-edge andedge-to-faceparticleassociations.ThemicrofabricintheSEMimageswasdominatedbyflake-shaped clayparticles(inadditiontoroundsiltparticles);their direction(orientation)couldbedeterminedfromthe orientationoftheiredges.Theedgesweredetected withtheFijiprocessingtoolFindEdge,whichusesthe Sobeledgedetectorandhighlightsthesharpchanges inlocalintensity.Theresultsoftheedgedetectionare showninFigure10atoc,middle,asscribble(random)linesrepresentedbywhitepixels.TheorientationsoftheselineswerequantifiedviatheDirectionalityplugin(Liu,1991;Deravietal.,2017;Sensinietal., 2018).ThepluginusedFouriercomponentsanalysisthattransformedtheimageintoFourierpower spectra.Thespectrawereusedtocalculatespatial
SimpleShearAnalysisforaTropicalAlluvialSoil
357
Environmental&EngineeringGeoscience,Vol.XXVIII,No.4,November2022,pp.347–360
Figure10.Directionalityofmicrofabricofspecimens:(a)location1,vertical;(b)location2,vertical;(c)location3,vertical;(d)location1, horizontal;(e)location2,horizontal;and(f)location3,horizontal.

frequencieswithinanimageinagivensetofradialdirections.Figure10atoc,right,arepolarbarcharts withabinsizeof2° orientedina0° to360° orientation.Eachbinrepresentsanormalizedamountof linesinagivendirection.Thehighestpeaksofthebar chartswerefittedbyGaussianfunctiontodetermine theorientationsandthegoodnessoffit.Theanalysis showedparticleorientationsof15.9° , 1.6°,and18.3° withrespecttohorizontalandgoodnessoffitof0.51, 0.54,and0.65(in0–1range)forsamplesinlocations 1,2,and3,respectively.Theaveragegoodnessoffitof 0.57indicatedpoorpreferentialdirection.Therefore,it wasconcludedthatthetropicalalluvialsoilsfromthe threelocationshadlowpreferredorientationofparticles,asinlowinherentanisotropy.Suchbehaviorwas similartosoftmarineandbrackish-waterilliticclays (MitchellandSoga,2005).Forthepurposesofcomparison,directionalityanalysiswasalsoconductedfor thinslicestakenfromhorizontallysplitsamples(at thesamedepths).Thesameprocedureswereapplied asthosefortheverticallysplitsamples.Theimages areshowninFigure10dtofforlocations1,2,and 3,respectively.Theanalysisforsamplesinlocations1, 2,3showedparticleorientationsof 5.1° , 53°,and 96° withrespecttohorizontalandgoodnessoffit of0.52,0.17,0.46,respectively.Theaveragegoodness
offitof0.38indicatedpoorpreferentialinhorizontal direction.
CONCLUSIONS
DSStestingandanalysesofatotalof52specimens wereconductedforundisturbedtropicalalluvialsoils ofnorthernBorneo.Theanalysescomparedtheinherentfabricanisotropyeffecttothestrengthcharacteristicsofthesoilsbygroupingspecimensintotwo cuttingorientations,horizontalandvertical.Itisconcludedthattherewasnosignificantdifferencebetween thestrengthcharacteristicsofhorizontallyandverticallycutspecimensduetolowpreferredorientation ofparticles.However,datashowedthatthevertically cutspecimenshadasignificantlyhigheroccurrence ofrandomerrorscomparedtohorizontallycutspecimens.Thefollowingarethemainconclusionsfrom thisstudy:
1.Peakstrengthanalysisshowednodifferencebetweenhorizontallycutandverticallycutspecimens. UsingMohr–Coulombmodelfitting,horizontal andverticalspecimentypeshadpeakeffectiveand totalfrictionanglesof23° and13°,respectively. However,theresultsoftheverticallycutspecimen
Hasan,Ismail,Lee,andAlshibli
358
Environmental&EngineeringGeoscience,Vol.XXVIII,No.4,November2022,pp.347–360
showedalowercoefficientofdetermination, R2 , whencomparedtothehorizontalspecimens.
2.Therelationshipbetweennormalizedshearstress andOCRhadagoodfitwithexponentialsfunction usingadifferent valuefromDSStestresultsof compilednaturalclays.Thepresentresultsgave valuesof0.46and0.38forhorizontalandvertical specimens,respectively.
3.Effectivestresspathsshowedthatthetrajectory endedatCSLs.TheslopeanglesoftheCSLswere 23° and24.2° forhorizontalandverticalspecimens, respectively.
4.Goodrelationshipswerefoundforbothhorizontal andverticalspecimensforanormallyconsolidated case.
5.QualitativeandquantitativeanalysesofSEMimagesshowedthatthealluvialsoilshadlowpreferred orientationofparticles.
SUPPLEMENTALMATERIAL
SupplementalMaterialassociatedwiththisarticle canbefoundonlineathttps://www.aegweb.org/e-egsupplements.
ACKNOWLEDGMENTS
TheauthorswouldliketoacknowledgethefinancialsupportfromindustrialresearchgrantIG/ F02/SSMC/2019:GeotechnicalCharacterizationof SarawakSoftMarineClay,fundedbySarawakPublic WorksDepartment,Sarawak,Malaysia,incollaborationwithUNIMASHoldingSdnBhd.
REFERENCES
Alshibli,K.andHasan,A.,2008,Spatialvariationofvoidratio andshearbandthicknessinsandusingX-raycomputedtomography: Géotechnique,Vol.58,No.4,pp.249–257.
ASTM-D2216,2005, StandardTestMethodforLaboratoryDeterminationofWater(Moisture)ContentofSoilandRockby Mass:ASTMInternational,WestConshohocken,PA.
ASTM-D2487,2017a, StandardPracticeforClassificationofSoils forEngineeringPurposes(UnifiedSoilClassificationSystem): ASTMInternational,WestConshohocken,PA.
ASTM-D2974,2020, StandardTestMethodsforDeterminingthe Water(Moisture)Content,AshContent,andOrganicMaterial ofPeatandOtherOrganicSoils:ASTMInternational,West Conshohocken,PA.
ASTM-D4186,2012, StandardTestMethodforOne-Dimensional ConsolidationPropertiesofSaturatedCohesiveSoilsUsing Controlled-StrainLoading:ASTMInternational,WestConshohocken,PA.
ASTM-D422,2007, StandardTestMethodforParticle-SizeAnalysisofSoils:ASTMInternational,WestConshohocken, PA.
ASTM-D4318,2017b, StandardTestMethodsforLiquidLimit, PlasticLimit,andPlasticityIndexofSoils:ASTMInternational,WestConshohocken,PA.
ASTM-D6528,2017c, StandardTestMethodforConsolidated UndrainedDirectSimpleShearTestingofFineGrainSoils: ASTMInternational,WestConshohocken,PA.
ASTM-D854,2014, StandardTestMethodsforSpecificGravityof SoilSolidsbyWaterPycnometer:ASTMInternational,West Conshohocken,PA.
Atkinson,J.H.;Lau,W.H.W.;andPowell,J.J.M.,1991, Measurementofsoilstrengthinsimplesheartests: Canadian GeotechnicalJournal,Vol.28,No.2,pp.255–262.
Bjerrum,L.andLandva,A.,1966,Directsimple-sheartestsona Norwegianquickclay: Géotechnique,Vol.16,No.1,pp.1–20.
BS-5930,1999, Codeofpracticeforsiteinvestigations:BritishStandardsInstitution,London,U.K.
Budhu,M.,1984,Nonuniformitiesimposedbysimpleshear apparatus: CanadianGeotechnicalJournal,Vol.21,No.1, pp.125–137.
Buringh,P.,1979, Introductiontothestudyofsoilsintropicaland subtropicalregions:CentreforAgriculturalPublicationsand Documentation,Wageningen,TheNetherlands.
Casey,B.;Germaine,J.T.;Abdulhadi,N.O.;Kontopoulos, N.S.;andJones,C.A.,2016,UndrainedYoung’smodulus offine-grainedsoils: JournalGeotechnicalGeoenvironmental Engineering,Vol.142,No.2,doi:10.1061/(ASCE)GT.19435606.0001570
Clayton,C.R.I.;Siddique,A.;andHopper,R.J.,1998,Effectsofsamplerdesignontubesamplingdisturbance–numericalandanalyticalinvestigations: Géotechnique,Vol.48,No.6, pp.847–867.
Deravi,L.;Sinatra,N.R.;Chantre,C.O.;Nesmith,A.P.; Yuan,H.;Deravi,S.K.;Goss,J.A.;Macqueen,L.A.; Badrossamy,M.R.;Gonzalez,G.M.;Phillips,M.D.;and Parker,K.K.,2017,Designandfabricationoffibrousnanomaterialsusingpullspinning: MacromolecularMaterialsEngineering,Vol.302,No.3,doi:10.1002/mame.201600404
Doherty,J.andFahey,M.,2011,Three-dimensionalfiniteelementanalysisofthedirectsimplesheartest: Computers Geotechnics,Vol.38,No.7,pp.917–924.
Dong,Y.;Lu,N.;andMcCartney,J.S.,2018,Scalingshearmodulusfromsmalltofinitestrainforunsaturatedsoils: Journal GeotechnicalGeoenvironmentalEngineering,Vol.144,No.2, doi:10.1061/(ASCE)GT.1943-5606.0001819
Edelman,C.H.andvanderVoorde,P.K.J.,1963,Important characteristicsofalluvialsoilsinthetropics: SoilScience,Vol. 95,No.4,pp.258–263.
Greeuw,G.;denAdel,H.;Schapers,A.L.;anddenHaan,E.J., 2001,Reductionofaxialresistanceduetomembraneandside drainsinthetriaxialtest: ProceedingsoftheSoftGroundTechnologyConference,GeotechnicalSpecialPublicationsGSP112,ASCE,pp.30–42.
Hanzawa,H.;Nutt,N.;Lunne,T.;Tang,Y.;andLong,M., 2007,AcomparativestudybetweentheNGIdirectsimple shearapparatusandtheMikasadirectshearapparatus: Soils andFoundations,Vol.47,No.1,pp.47–58.
Hasan,A.andAlshibli,K.,2010,Experimentalassessmentof 3Dparticle-to-particleinteractionwithinshearedsandusing synchrotronmicrotomography: Géotechnique,Vol.60,No.5, pp.369–379.
Hight,D.W.andLeroueil,S.,2003,Characterisationofsoilsfor engineeringpurposes.InTan,T.S.;Phooh,K.K.;Hight,D. W.;andLeroueil,S.(Editors). CharacterisationandEngineeringPropertiesofNaturalSoils,Vol.1:A.A.Balkema,Lisse, TheNetherlands,pp.255–360.
Ishihara,K.andYamazaki,F.,1980,Cyclicsimplesheartestson saturatedsandinmulti-directionalloading: SoilsandFoundations,Vol.20,No.1,pp.45–59.
,Vol.XXVIII,No.4,November2022,pp.347–360
SimpleShearAnalysisforaTropicalAlluvialSoil
Environmental&EngineeringGeoscience
359
JabatanMineraldanGeosains(JMG),2020, PetaGeologiSarawak,Malaysia:Electronicdocument,availableat https://www.jmg.gov.my
Ladd,C.C.andDeGroot,D.J.,2003,Recommendedpractice forsoftgroundsitecharacterization:ArthurCasagrandeLecture.InCulligan,P.J.;Einstein,H.H.;andWhittle,A.J. (Editors), Proceedingsofthe12thPanamericanConferenceon SoilMechanicsandGeotechnicalEngineering:VerlagGlückauf GMBH,Essen,Germany,Vol.1,pp.3–57.
Ladd,C.C.;Foot,R.;Ishihara,K.;Schlosser,F.;andPoulos,H.G.,1977,Stressdeformationsandstrengthcharacteristics.In Proceedingsofthe9thInternationalConferenceon SoilMechanicsandFoundationEngineering:JapaneseSociety ofSoilMechanicsandFoundationEngineering,Tokyo,Japan, pp.421–494.
Lambe,T.W.andWhitman,R.V.,1969, SoilMechanics:John WileyandSons,NewYork,576p.
Lanzo,G.;Pagliaroli,A.;Tommasi,P.;andChiocci,F.L.,2009, Simplesheartestingofsensitive,verysoftoffshoreclayfor widestrainrange: CanadianGeotechnicalJournal,Vol.46,No. 11,pp.1277–1288.
Lee,L.J.;Shenbaga,K.;andTaib,S.N.L.,2013,Monitoring thegroundmovementandporewaterpressureatthebanks ofestuariesduetotidalfluctuation.InLong,P.D.(Editor), Proceedingsofthe2ndInternationalConferenceonGeotechnics forSustainableDevelopment:ConstructionPublishingHouse, Hanoi,Vietnam,pp.691–700.
Leung,E.H.Y.andNg,C.W.W.,2004,Inherentanisotropicstiffnessofdecomposedtuffandalluvium.InJardine,R.J.;Potts, D.M.(Editors) ProceedingsofAdvancesinGeotechnicalEngineering:TheSkemptonConference:ThomasTelford,London, U.K.,pp.488–497.
Li,Y.L.;Yang,Y.;Yu,H-S;andRoberts,G.,2017,Monotonicdirectsimplesheartestsonsandundermultidirectional loading: InternationalJournalGeomechanics,Vol.17,No.1, doi:10.1061/(ASCE)GM.1943-5622.0000673
Liu,Z-Q.,1991,Scalespaceapproachtodirectionalanalysisofimages: AppliedOptics,Vol.30,No.11,pp.1369–1373.
Low,H.E.;Maynard,M.L.;Randolf,M.F.;andDeGroot, D.J.,2011,Geotechnicalcharacterisationandengineering propertiesofBurswoodclay: Géotechnique,Vol.61,No.7, pp.575–591.
Mayne,P.W.,1988,DeterminingOCRinclaysfromlaboratory strength: JournalofGeotechnicalEngineering,Vol.114,No.1, pp.76–92.
Meng,G-H.andChu,J.,2011,Shearstrengthpropertiesofa residualsoilinSingapore: SoilsandFoundations,Vol.51,No. 4,pp.565–573.
Mitchell,J.K.andSoga,K.,2005, FundamentalofSoilBehavior, 3rded.:JohnWiley&Sons,Hoboken,NJ.
Mlynarek,Z.;Stefaniak,K.;andWierzbicki,J.,2012,Geotechnicalparametersofalluvialsoilsfrom in-situ tests: Archivesof Hydro-EngineeringandEnvironmentalMechanics,Vol.59,No. 1–2,pp.63–81.
Randolph,M.F.andWroth,C.P.,1981,Applicationofthefailurestateinundrainedsimpleshearshaftcapacityofdriven piles: Géotechnique,Vol.31,No.1,pp.143–157.
SarawakCoastalRoadNetwork,2021,Electronicdocument, availableathttps://web.archive.org/web/20211221040326/ https://kuchingborneo.info/sarawak-coastal-road-network/ Schindelin,J.;Arganda-Carreras,I.;Frise,I.;Kaynig,V.; Longair,M.;Pietzsch,T.;Preibisch,S.;Rueden,C.; Saalfeld,S.;Schmid,B.;Tinevez,J-Y.;White,D.J.; Hartenstein,V.;Eliceiri,K.;Tomancak,P.;andCardona, A.,2012,Fiji:anopen-sourceplatformforbiologicalimage analysis: NatureMethods,Vol.9,No.7,pp.676–682.
Sensini,A.;Gualandi,C.;Zucchelli,A.;Boyle,L.A.;Kao,A. P.;Reilly,G.C.;Tozzi,G.;Cristofolini,L.;andFocarete, M.L.,2018,Tendonfascicle-inspirednanofibrousscaffold ofpolylacticacid/collagenwithenhanced3D-structureand biomechanicalproperties: ScientificReports,Vol.8,No.1,p. 17167.doi:10.1038/s41598-018-35536-8
Talesnick,M.andFrydman,S.,1991,SimpleshearofanundisturbedsoftmarineclayinNGIandtorsionalshearequipment: GeotechnicalTestingJournal,Vol.14,No.2,pp.180–194.
Vardanega,P.J.andBolton,M.D.,2013,Stiffnessofclays andsilts:normalizingshearmodulusandshearstrain: JournalGeotechnicalGeoenvironmentalEngineering,Vol.139,No. 9,pp.1575–1589.
Vijith,H.andDodge-Wan,D.,2020,Spatialandtemporalcharacteristicsofrainfalloverforestedriverbasinin NWBorneo: MeteorologyAtmosphericPhysics,Vol.132, pp.683–702.
Wijewickreme,D.;Dabeet,A.;andByrne,P.,2013,Someobservationsonthestateofstressinthedirectsimplesheartest using3Ddiscreteelementanalysis: GeotechnicalTestingJournal,Vol.36,No,2,pp.292–299.
Yilmaz,I.andKaracan,E.,1997,Geotechnicalpropertiesofalluvialsoils:anexamplefromsouthofSivas(Turkey): Bulletin EngineeringGeologyEnvironment,Vol.55,pp.159–165.
Yimsiri,S.andSoga,K.,2000,Micromechanics-basedstress–strainbehaviourofsoilsatsmallstrains: Géotechnique,Vol. 50,No.5,pp.559–571.
Zhang,G.;Germaine,J.T.;Whittle,A.J.;andLadd,C. C.,2004,Soilstructureofahighlyweatheredoldalluvium: Géotechnique,Vol.54,No.7,pp.453–466.
Hasan,Ismail,Lee,andAlshibli
360 Environmental&EngineeringGeoscience
,Vol.XXVIII,No.4,November2022,pp.347–360
InvestigationofPhysicochemicalChangesofSoftClay aroundDeepGeopolymerColumns
MAJIDBAGHERINIA* NE¸SEI¸SIK
DepartmentofCivilEngineering,UniversityofAtaturk,Erzurum25240,Turkey
KeyTerms: DeepMixing,Geopolymer,SoftClays, Full-ScaleTests,GroundImprovement
ABSTRACT
Geopolymersshowgoodpromiseforsoftclaystabilization.Thispaperaimedtoimprovesoftclaywith geopolymerandevaluatetheeffectsofgeopolymerstabilizedcolumnsonthemechanicalandchemicalbehaviorofthesurroundingclay.Rangesoftestswere conductedonbothstabilizedandunstabilizedspecimenstodeterminetheimpactsofgeopolymeronthe claystructure.Theresultsshowedthatincreasingthe bindercontentandcuringtimesignificantlyincreased theunconfinedcompressivestrengthofstabilizedsamples.Microstructureandmineralogyanalysesrevealed thathardenedmaterialswereformedwithinthegeopolymermatrixfromtheamorphousclayphases.Inaddition,theformationoftheeffectiveareaaroundthe geopolymer-stabilizedcolumnsresultedinthewater contentofsoftclaydecreasingwhiletheundrainedshear strength,pH,andelectricconductivityvaluesincreased. Furthermore,thebearingcapacityofsoftclaydramaticallyincreased(30-fold)duetoanincreaseincolumn area.
INTRODUCTION
Softsoilsareamajorconcerningeotechnicalengineeringbecauseoftheirlowshearstrengthand largedeformationunderlightloads(Cristeloetal., 2013;Yaghoubietal.,2020).Inground-improvement projects,thedeepmixing(DM)methodisanalternativetotheusualground-improvementtechniquesin softground,suchasstonecolumnsandsandcompactionpiles.InDM,bindersinadryorwetform areinjectedintothegroundwithahollowaugerand mixedbytherotationofcuttingtools.Asaresult,the groundparticlesareultimatelyblended,andstabilized columnarelementsareformed(BruceandBruce,2003; KitazumeandTerashi,2013).Thestabilizedareahas


*Correspondingauthoremail:majid.bagherinia13@ogr.atauni.edu.tr
highstrengthandstiffness,lowpermeability,andlow settlement(KitazumeandTerashi,2013;Jamsawanga etal.,2017).Thismethodissuitableforproviding anappropriatebearingcapacityforlighttomedium loadsandissuperiortoothermethods,botheconomicallyandpractically(Bruceetal.,2013;Kitazumeand Terashi,2013).
Limeandcementarecommonlyusedastraditional bindersinDM,andtheystabilizeweaksoilswitha bindercontentofupto30percentbyweightrelative tothesoil(Rogersetal.,2000;Shenetal.,2003a; Horpibulsuketal.,2011;PakbazandAlipour,2012; andBruceetal.,2013).Thesebinders,especiallyPortlandcement(PC),haveanegativeimpactontheatmosphereandcauseseriousenvironmentalproblemsdue totheemissionofcarbondioxide(CO2 )duringcombustionandchemicalcalcination(Zhangetal.,2013; Duetal.,2016;andYaghoubietal.,2018).Inaddition,thedurabilityofcementisunacceptable,resultinginexcessivecostandtimerequiredforre-fixation. Duetothesechallenges,researchintonewmaterialsisessential.Therefore,thisstudyaimedtoinvestigateanalternativematerialtoPCforuseintheDM application.
Geopolymersareinorganicmaterialsthathave recentlyreceivedspecialattentionfromresearchers.In additiontothemechanicalperformanceofgeopolymers,comparedtotraditionalbinders,theirenvironmentaladvantagesmakethemanattractivealternative (Yaghoubietal.,2019).Previousstudieshavereported thatgeopolymersareanalternativetoPCduetotheir preferablecompressiveandflexuralstrength,higher ductility,lowershrinkage,andsuperiordurability (suchasfireandacidresistance)(Gaoetal.,2013; Zhangetal.,2013;Phoo-Ngernkhametal.,2015, 2016;Duetal.,2016,2017;NathandSarker,2017; andRiosetal.,2017).
Ageopolymerisatypeofinorganicmaterialthat appearsasananalogofthermosetorganiccrosslinkingagents(Sukmaketal.,2013b).Geopolymerization(alkalineactivation)occurswhenaluminosilicateandalkalinematerialsreactwitheach other.Duringthereaction,silicaandaluminaunits blendinconjunctionandconnecttheoxygenions; thisisknownasthepolycondensationreaction
Environmental&EngineeringGeoscience
371
,Vol.XXVIII,No.4,November2022,pp.371–386
(Davidovits,1991;Gaoetal.,2013;andPourakbar etal.,2016).Davidovits(2013)concludedthatkaolinite(withahighcontentofsilicaandalumina)ispolymerizedbyalkalistoformahard,concrete-likematerial.Intheliterature,differenttypesofwastematerials (e.g.,flyash,blastfurnaceslag,andvolcanicash)have beenactivatedwithvariousalkalies(e.g.,sodiumoxide,sodiumhydroxide,sodiumsilicate,potassiumhydroxide,andcalciumhydroxide)toimprovesoftclay soils(Cristeloetal.,2013;Sargentetal.,2013;and Miaoetal.,2017).Theresultsindicatethatthecompressivestrengthofthestabilizedsoftclayincreased significantly,whiletheswellingpotentialandplasticityindexdecreased.Otherresearchersindicatedthat soiltype,bindertypeandratio,andmixingproperties areimportantfactorsaffectingtheperformanceofstabilizedsoils(Huseienetal.,2016;OliviaandNikraz, 2012;Pacheco-Torgaletal.,2008;Phoo-Ngernkham etal.,2015,2016;NathandSarker,2017;andWu etal.,2019).Geopolymerscanbeusedingeotechnicalapplicationssuchassoilstabilizationingroundimprovement(Phetchuayetal.,2016;Pourakbaretal., 2016;Singhietal.,2016;Duetal.,2017;andYaghoubi etal.,2018)andDMprojects(Arulrajahetal.,2018; Mohammadiniaetal.,2019).
AftertheinstallationofDMcolumns,themechanicalandchemicalpropertiesofthesurroundingsoft clayareaffectedbyionmigration.Manystudieshave alreadyreportedthemigrationofionsfromlimeor lime-cementcolumnsintosoftclay,andtheireffects ontheadjacentgroundhavebeeninvestigated.Nevertheless,knowledgeofionmigrationrelatedtothe behaviorofgeopolymericcompoundsandtheireffect onsoilproperties,suchasundrainedshearstrength, bearingcapacity,settlement,etc.,islimited.Inarecentstudy,BagheriniaandZaimo ˘ glu(2021)installed DMcolumnswithpotassiumhydroxideasabinder andfoundthatthepropertiesofsoftclayimproveddue toionmigration.
Thispaperpresentsanexperimentalstudyonthe stabilizationofsoftclaywithgeopolymers.Rangesof testswereconductedonbothstabilizedandunstabilizedspecimenstoevaluatetheeffectsofbindercontent,curingtime,andconditionduringthegeopolymerizationprocess,includingunconfinedcompressive strength(UCS),X-raydiffractionpattern(XRD),and scanningelectronmicroscopy(SEM)analyses.The mainobjectivewastoincreasethebearingcapacityof softclayandreducesettlementbyinstallinggeopolymerDMcolumns.Todeterminetheeffectivearea aroundthecolumnsduetoionmigrationandthe distanceofthisareafromthecolumn,experiments wereperformedtodeterminepH,electricconductivity(EC),watercontent,andundrainedshearstrength (St)inthesurroundingclay.
Table1. Indexpropertiesofclay.
PropertyClay
Claycontent, <0.002mm(%)17 Finercontent, <0.075mm(%)80 Specificgravity,Gs2.65 Liquidlimit,LL(%)44 Plasticlimit,PL(%)26 Plasticityindex,PI(%)18 Optimumwatercontent(%)16 Maximumdryunitweight, γdmax (kN/m3 )18.5 Hydraulicconductivity, k (cm/s)6.980 × 10 7
MATERIALSANDMETHOD
Materials
Claysoilwascollectedfromthefield(asitein Kır¸sehir,Turkey),fromabout3.5mbelowtheground surface,anddriedinanovenat105°Cfor1day;it wasthenpulverizedandpassedthrougha1mmsieve. Thesoiltypeselectedforthestudywasalluvialsoil, whichisclassifiedaslow-plasticityclayaccordingto theUnifiedSoilClassificationSystem(USCS).DifferentpropertiesofclayareshowninTable1.The XRDandX-rayfluorescence(XRF)patternsofthe clayillustratedthepresenceofkaolinite(46.65percent),quartz(27.14percent),aluminumoxidesilicate (5.24percent),nacrite(7.6percent),andalunite(4.39 percent)ascommonmineralsinthissoil.Theremainingminerals(8.98percent)wereamorphousinnature.Thesoilalsocontainedalumina(Al2 O3 = 26percent)andsilica(SiO2 = 69percent),whichconveyed geopolymericpropertiesontheclay(Gaoetal.,2013; Pourakbar,2016).
Sodiumhydroxide(NaOH)intheformofbeads (purity:97percent)wasobtainedfromlocalsuppliersinTurkey.WhiteNaOHbeads,withapHof12, wereusedintheexperimentsasanalkalineadditive thatissolubleinwater,ethanol,andmethanol.Other characteristicsofNaOHareshowninTable2.NaOH solutionwithhighermolaritiesisdangeroustoworkersbecauseofitscorrosivenature(Phoo-Ngernkham etal.,2015;Phetchuayetal.,2016;andSubektietal.,
BagheriniaandI¸sik
Table2. Chemicalpropertiesofsodiumhydroxide. PropertySodiumHydroxide ChemicalformulaNaOH Molecularweight39.9771g/mol Meltingpoint318°C Boilingpoint1,388°C pH12 Density2.13g/cm3 SolubilityWater,ethanol,methanol 372 Environmental&EngineeringGeoscience,Vol.XXVIII,No.4,November2022,pp.371–386
Table3. Summaryofexperimentalprogram.
Materials(%)
SampleNameClayat44%WaterContentNaOHTotalCuringTime(days)NumberofSamples
Stage1:Unconfinedcompressionstrengthtest(38mm × 76mm)
S1100—1007,14,28,56,11215 S29911007,14,28,56,11215 S39731007,14,28,56,11215 S49551007,14,28,56,11215
S59371007,14,28,56,11215
S6*9191007,14,28,56,11215
S789111007,14,28,56,11215
Total = 105
Stage2:Small-scalemodeltest(watercontent,pH,EC,andSt)
SC1100—1007,14,28,56,1125 SC29911007,14,28,56,1125 SC39731007,14,28,56,1125 SC49551007,14,28,56,1125
SC59371007,14,28,56,1125 SC69191007,14,28,56,1125
Total = 30
Stage3:Large-scalemodeltest(load-bearingcapacity)
LS919100561,3,and7columns
*S6isthesampleusedforXRDandSEManalysesat28,56,and112days.
2017).Therefore,itwasusedindryformintheexperimentstoreduceitsharmfuleffects.
SamplePreparationandTesting
Thelaboratorytestingprogramwasplannedinthree stages:(1)UCStest,(2)small-scaletest,and(3)largescaletest(Table3).Anoptimumbindercontentof20 to25percent(Horpibulsuketal.,2011;Bushraand Robinson,2013)upto30percent(Bruceetal.,2013; KitazumeandTerashi,2013)hasbeensuggestedfor thestabilizationofclayeysoilsusingtheDMmethod. Intheexperiments,theNaOHcontentwasselectedas 1,3,5,7,9,and11percent(bymassofsoil),whichis verylowcomparedtotheliteraturevalues.
Previousstudies(LorenzoandBergado,2004;Horpibulsuketal.,2011;Cristeloetal.,2013;Phetchuay etal.,2016;andArulrajahetal.,2018)indicatedthat theoptimumwatercontentfortheimprovementof clayeysoilswithhighwatercontentis1.0liquidlimit (LL)ofthesoil.Thesamevaluewaschosenforthis study.Thenaturalwatercontentandliquidlimitof the insitu claywas38to51percentand44percent, respectively.
FortheUCStest,thedriedclayandwaterwere placedinamechanicalstirrerandmixedforapproximately5minutes.Themixturewaspouredintoaplasticbagandkeptfor1daytobehomogenized.Then, theNaOHbeadswereaddedtothemixture,andthe mixingprocesswasrepeatedat150rpm.Themixture
wascollectedfromthemechanicalstirrer,andthree layerswerepouredintoacylindricalmetalmoldwith alengthof76mmandadiameterof38mm.Theinnersurfacesofthemoldswerelubricatedwithathin layer(Greaseoil)tofacilitatetheextrusionofthetest specimens.Theedgeofthemoldwaslightlytapped byhandtoreduceairbubbles.Thepreparedspecimenswerekeptinacuringroomat20 ± 3°Cambienttemperatureand90 ± 5percenthumidityfor 7,14,28,56,and112days.Alkali-stabilizedsamplesneedtobecuredatahightemperature(butbelow100°C)tocompletethegeopolymerizationprocess(Davidovits,2017).Sincecuringathightemperaturesisnotpossibleinthefield,acuringtemperature suitableforfieldconditionswaschosen.Therefore,the ambienttemperaturewasselectedtodetecttheformationofthegeopolymericproductsintheclaystructure.ThepreparationofthespecimensandthecuringconditionswereperformedaccordingtoJapanese GeotechnicalSociety(2000),EuroSoilStab(2002), andArasanetal.(2017).Attheendofthecuringperiod,theUCStestwasconductedonthespecimensaccordingtoASTMD2166/D2166M(2016)(Figure1). Thetestingloadwasappliedatarateof1.0mm/min. ForeachNaOHratioandcuringtime,threespecimens wereprepared,andtheUCSvaluesweredetermined byaveragingthreemeasurements.
FollowingtheUCStest,sampleS6wasevaluated usingXRDandSEManalysestoassesssoftclay stabilization.TheXRDpatternswererecordedwith
ClayChangesaroundGeopolymerColumns
Environmental&EngineeringGeoscience,Vol.XXVIII,No.4,November2022,pp.371–386 373
Figure1.Unconfinedcompressivestrengthtestafter(a)7,(b)14,(c)28,(d)56,and(e)112days.
anEMPYREANdiffractometerandanalyzedwith thePANalyticalmeasurementprogram.Themeasurementswereconductedontreatedanduntreatedclay soilat λ = 1.54060ÅwavelengthfromtheCu-Ku source,atascanningrangeof5° to75°,ascanning speedof2degrees/min,andascreeningstepof0.0260 degrees(BagheriniaandZaimo ˘ glu,2021).

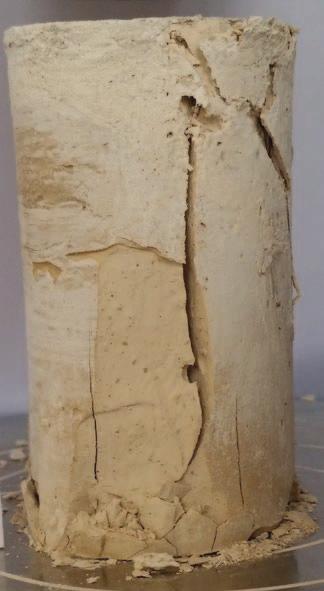
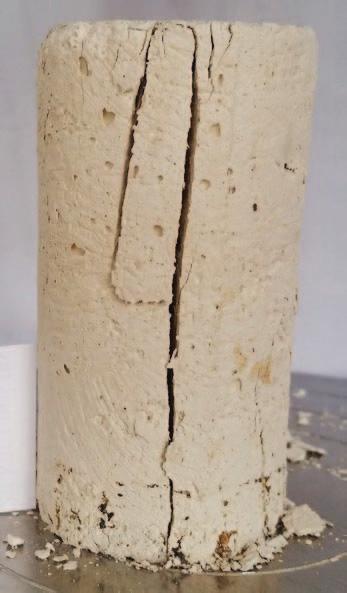
TheSEMimagesweretakenofthesamplestoevaluatetheinteractionsbetweenNaOHandclayminerals. Thesampleinthepowderedformwasputonthesampleplatewithacarbonbandadheredandcoatedwith gold(5nminthickness),andvacuumtreatmentwas carriedoutfor3minutes.Finally,itwasplacedinthe sampleholderandanalyzedusingaZeissSigma300 (BagheriniaandZaimo ˘ glu,2021).
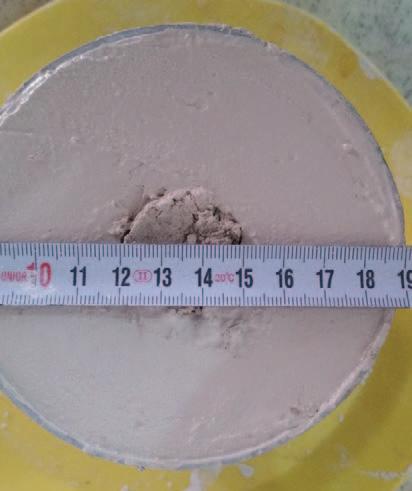
InstallationofDMColumns(Small-ScaleTest)
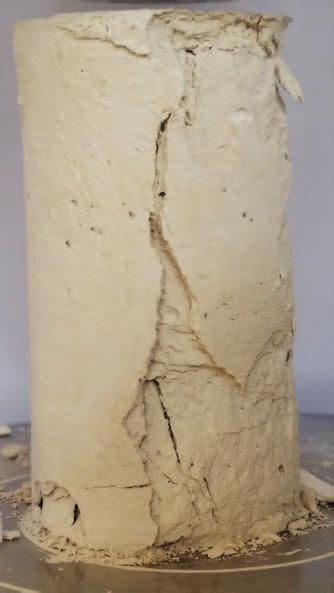
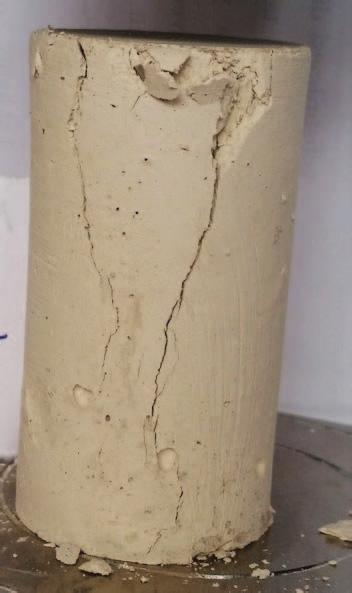
Atthisstage,theend-bearinggeopolymerDM columnswereinstalledintotheclaytoinvestigatethe effectsofionmigrationonthemechanicalandchemicalpropertiesofthesurroundingsoftclay.
Aclaymixturewithoptimummoisturecontent(and LL = 44percent)waspreparedinthesameway asthatdonefortheUCStest.Acylindricalmold madeofpolyvinylchloride(PVC),withaheightof 110mmandadiameterof100mm,wasusedtoprepareclaybeds.Theclaymixturewasfilledintothe moldandcompactedintothreelayersusingawooden tamper(MalarvizhiandIlamparuthi,2004;¸Sengör, 2011;Demiretal.,2013;andMalekpoorandPoorebrahim,2014).Then,thecolumnswereinstalledusing adrymixmethodforDM(Figure2).Thedrymix methodreferstothestateofthebinderasitisdistributedinthemixerandthesoilasadrypowder.The
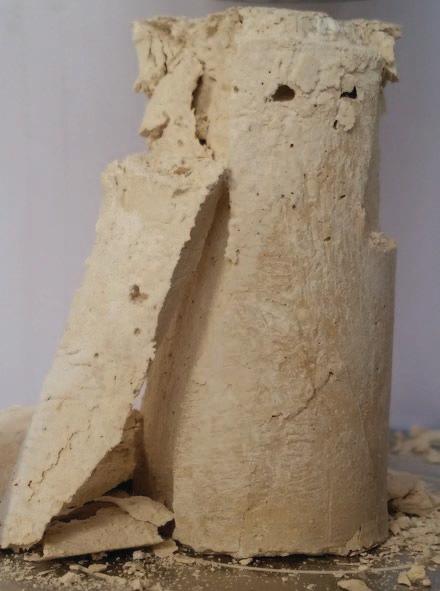
NaOHpowderwascastintothesoftclayasfollows, toinstallcolumnswith30mmdiameterand110mm height.
Atubewithaninnerdiameterof30mmwasverticallypushedintothesoftclay.Anothertubewith aninnerdiameterof10mmwasthenplacedinside arodwithanouterdiameterof30mm,andtherod waspluggedatoneend.Thesmallertubeandtherod werethenplacedwithinthelargertubeanddrivenverticallydowntothedesireddepth.Therod,pluggedat theend,wasthenremoved.Thesmallertube(inner diameterof10mm)wasfilledwithapre-determined amountofNaOH.Afterawhile,the10mmtubewas pulledout,andtheNaOHremainedintheclay.A mixingtoolwithashaft-tippedblade,25mmindiameter,wasrotatedandinsertedthroughthesoftclay, downtotheintendeddepthandwithdrawnatarateof 2m/minandrotationalvelocityof320rpm(Larsson etal.,2009;BagheriniaandZaimo ˘ glu,2021).Themix-
Figure2.Imagesofinstallationofsmall-scalegeopolymerDMcolumn:(a)planviewand(b)cross-sectionview.
BagheriniaandI¸sik
374 Environmental&EngineeringGeoscience,Vol.XXVIII,No.4,November2022,pp.371–386
Figure3.SchematicviewofinstallationofDMcolumninsoftclay.
ingprocesswasrepeatedintriplicateforeverycolumn. Finally,the30-mm-diametertubewaspulledout.A schematicviewoftheinstallationoftheDMcolumn isdisplayedinFigure3.ThePVCmoldsweresealed withaplasticcovertopreventthelossoftheclay’s watercontent.Thesampleswerekeptinthecuring roomat20 ± 3°Cambienttemperatureand90 ± 5percenthumidityfor7,14,28,56,and112days. Attheendofthecuringtimes,watercontent,pH, EC,andSttestswereconductedat5,10,15,20,and 25mmdistancesfromthecolumnedgeand20mm depthfromthesurface,accordingtothefollowing experiments.
Watercontenttest:Thesamplesweretakenfrom thespecifiedintervalsanddepthsusingaverythin metalruler,andthetestswereconductedaccording toASTMD2216(2019).
pHandECtest:Thesamplingprocedurewasperformedasinthewatercontenttest.Subsequently, air-driedsoilpassingthroughano.10sievewas collectedandplacedinaglasscontainer,followed bydistilledwater,andthemixturewasstirredevery10minutesfor1hour.Then,thepHandECof themixturewerereadbyapHandECmeter,respectively.Theratioofdistilledwaterwas1:1and 1:2.5forthepHandECtests,respectively.ThepH andECtestswereperformedaccordingtoASTM D4972(2019)andRaymentandHigginson(1992), respectively.
Sttest:TheSttestwasperformedaroundthe columnsaccordingtoISO/TS17892-6:(CSNEN ISO17892-6,2004)todeterminethestrengthdevelopmentofthesoftclay.Thistestmeasuresthe conepenetrationdepth,whichiscorrelatedwiththe
undrainedshearstrength.TheStvalueswereevaluatedaccordingtoEq.1(Hansbo,1957).
St = Cg m i 2 . (1)
Stisundrainedshearstrength(kPa), C isaconstant determinedbytheanglebetweenthegroundandthe cone(C = 0.8at30°C), g istheaccelerationdueto gravity(9.81cm/s2 ), m isthemassofthecone(g),and i istheconepenetrationdistance(mm).
InstallationofDMColumns(Large-ScaleTest)
Alarge-scalemodeltestwasperformedtoinvestigatetheload-settlementbehavioroftheDMcolumns inthesoftclayandsimulatetheirbehaviorinpractice. Moreover,asinglecolumnwasproducedtoexamine loadcapacityduringsettlementinthesoftclay,and theresultwascomparedtotheclaybedcontaining nocolumn(untreatedsoil).Tomeasuretheeffectof columngroupsontheload-settlementbehaviorofthe softclay,twodifferentareareplacementratios(triple columns,as = 0.0748,andsevencolumns,as = 0.1745) wereusedinthisstudy.
Intheexperiment,acylindricalmetaltank(1,000 mmindiameter,400mminheight,and20mmin thickness)wasusedtoinstalltheend-bearingcolumns (30mmindiameterand200mminheight).Accordingly,theclaybedandcolumnswerepreparedasdescribedinthesmall-scalemodeltestusinga300-mmlongauger(Fig.4a).Thetankwasthensealedwitha plasticcoverfor56daysat20 ± 3°Ctocontrolhumidity(90 ± 5percent).Itshouldbenotedthatthehighest compressivestrengthvalueobtainedintheUCStest waswith9percentNaOH,sothisamountwasused
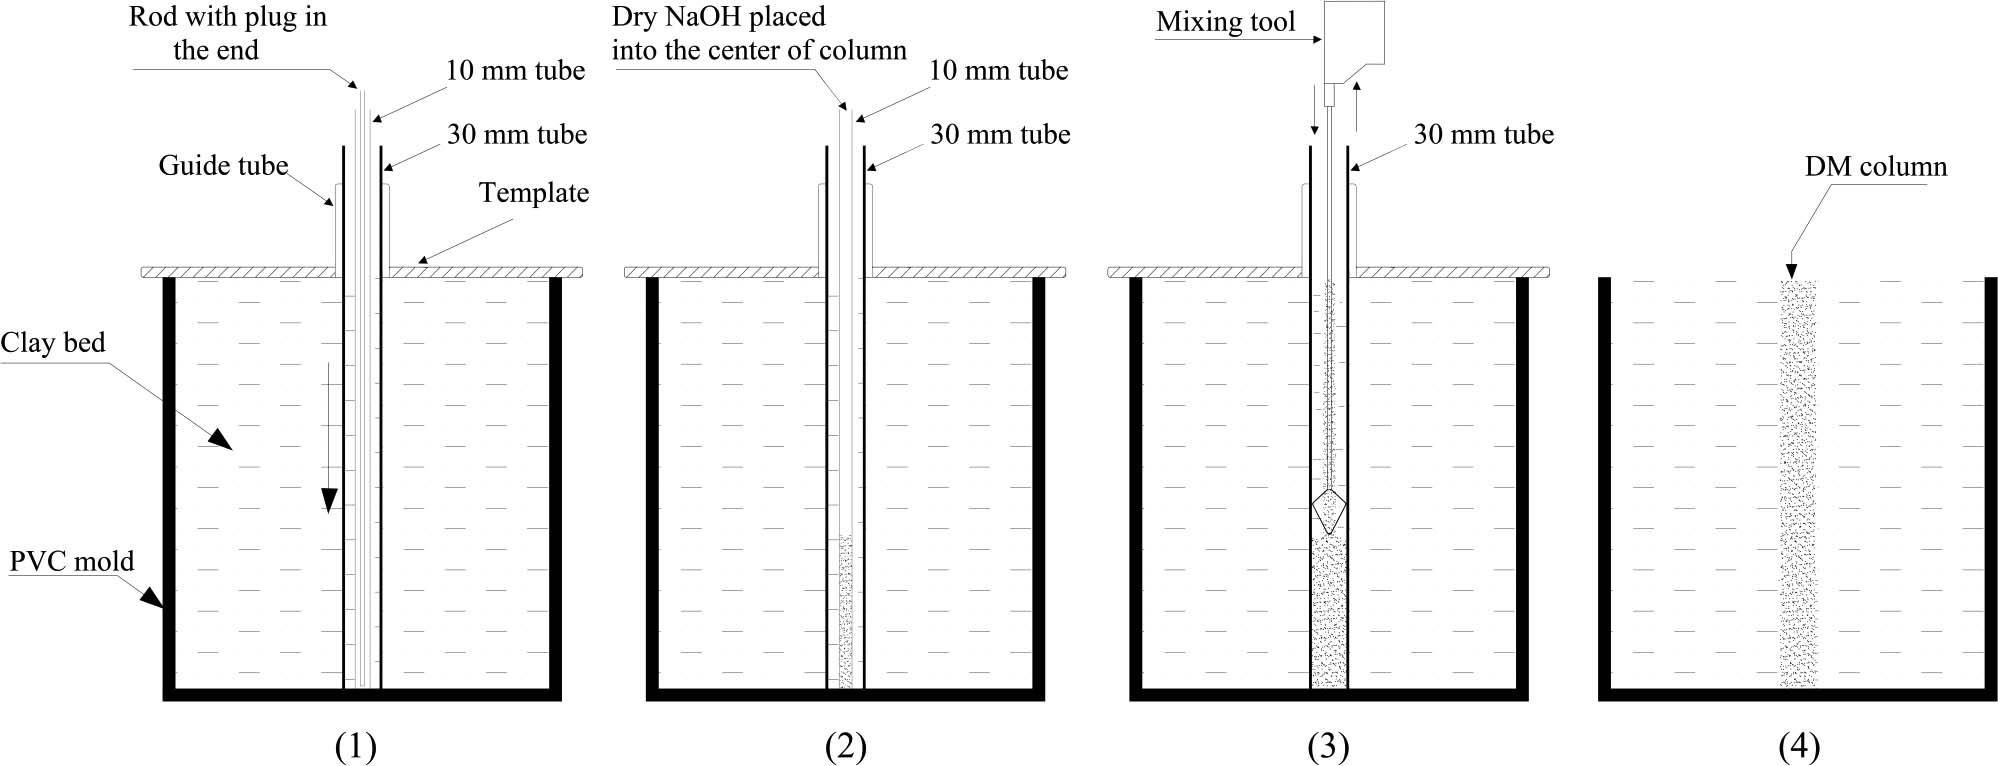
ClayChangesaroundGeopolymerColumns
Environmental&EngineeringGeoscience,Vol.XXVIII,No.4,November2022,pp.371–386 375
Figure4.Large-scalemodeltest:(a)preparationofclaybedandinstallationofgeopolymerDMcolumns,(b)attachmentLVDTs,and(c) testingcolumns.
inthecolumninstallation,andthespacingbetween columnsinthecolumngroupswaschosenbasedon themosteffectiveareafromthesmall-scaletestresults (distancecolumnperiphery = 25mm).
Attheendofthecuringperiod,thecolumnswere subjectedtoverticalloadingataconstantstrainrateof 1.0mm/minusingaloadingframe.Theverticalload wasappliedtothecolumnsviaarigidcircularplate withadiameterof80mmand190mmforthesingle andcolumngroups,respectively.Allplateshadathicknessof20mm.AnLVDT(linearvariabledifferential transformer)wasattachedtomeasurethesettlement oftheplateduringloading(Figure4bandc).
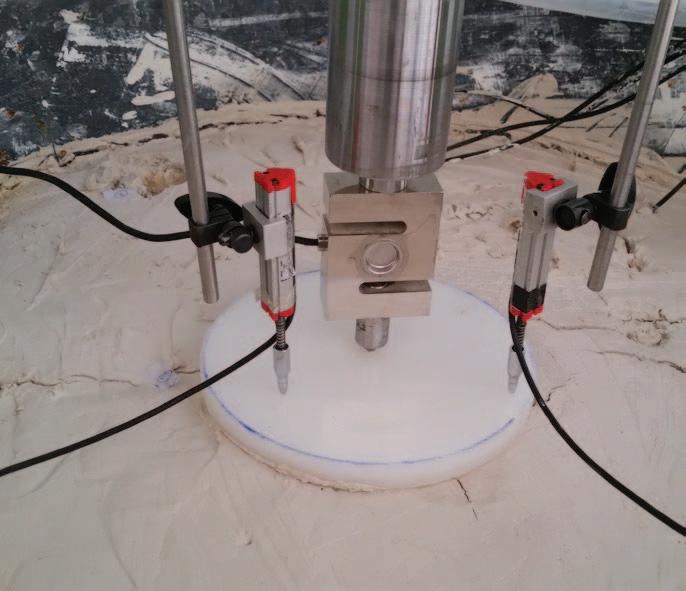
RESULTSANDDISCUSSION
UCSTestResults
TheeffectsoftheNaOHratioandcuringtimeon theUCSofthesamplesarepresentedbelow.The UCSresultsofthestabilizedspecimenswerecompared
withuntreatedspecimensandotherstudiesfromthe literature.
Figure5showstherelationshipbetweentheNaOH ratioandtheUCSvalueatdifferentcuringages.Generally,thestrengthofalltreatedspecimensincreased withtheincreaseofNaOHratiofrom1percent
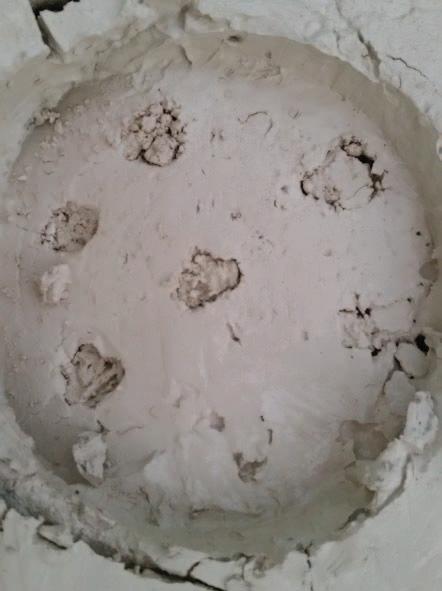

Figure5.RelationshipbetweentheUCS-NaOHratioandcuring timeoftreatedanduntreatedsoftclay.
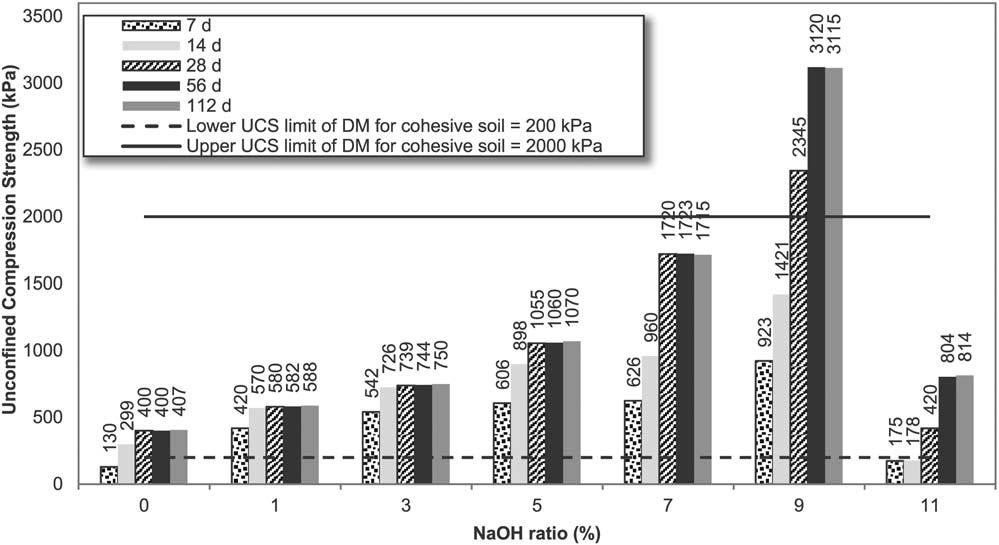
BagheriniaandI¸sik
376
Environmental&EngineeringGeoscience,Vol.XXVIII,No.4,November2022,pp.371–386
to9percent.Between1percentand3percent,there wasanegligibleincreaseinUCSvalues,indicatingthatthelowbindercontentdidnotsufficiently completegeopolymerizationinthesoil.TheUCS valuesincreasedsteadilyat7percentandthenincreaseddramaticallywhentheNaOHcontentreached 9percent.Previousstudieshavealsoreporteda significantstrengthimprovementformixturespreparedwithNaOH(NematollahiandSanjayan,2014; Phoo-Ngernkhametal.,2015;andYaghoubietal., 2018).Moreover,NaOHhasanoticeablepotential forstrengthdevelopmentinthesoftclaycomparedto KOH(BagheriniaandZaimo ˘ glu,2021).Thisimplies apossibledifferenceinionicdiameterbetweensodium andpotassium.
BasedonFigure5,theUCSvaluesdramaticallydecreasedwhenmorethan9percentNaOHwasadded tothesoil.Thiscouldhavebeenduetotheexcessive NaOHcontent,which,whenitpenetratestheclaylayers,separatestheminsteadofstickingtogether.Similarresultswerenotedbyotherauthorswhoshowed thatthecompressivestrengthofthespecimensdecreasedwhenthebindercontentwasabove10percent (Consolietal.,2009;Sabetetal.,2013;andValipour etal.,2014).
Inaddition,increasingthecuringperiodhadnomajoreffectontheUCSvaluesofsamplesS2(1percent), S3(3percent),andS4(5percent).TheUCSvalues ofsampleS5(7percent)showedagradualincrease after14daysbutremainunchangeduntil112days. Otherwise,thecuringagesweremoreeffectiveforS6 (9percent).Here,UCSvaluessuddenlyincreasedafter 7days,andadramaticincreasewasobservedupto112 days,indicatingthecriticalroleoftheNaOHratioin geopolymerizationatearlystagesandthereafter.The highestUCSvaluewasreachedusing9percentNaOH after56curingdays.TheUCSvaluesofthespecimens atthisratioforthecuringperiodsof7,14,28,56,and 112dayswere923,1,421,2,345,3,120,and3,115kPa, respectively.ThehighestUCSvalue(9percentNaOH and3,120kPa)ofthetreatedsamplewas680percent higherthanthatoftheuntreatedspecimens(0percent NaOHand400kPa)forthesamecuringtime.Nevertheless,thelowestUCSvalueobtainedfromthe9 percentNaOHresultswashigherthanthelowerUCS limitforcohesivesoil(200kPa)fortheDMmethod (Bruceetal.,1998;BruceandBruce,2003).ThisresultindicatesthatNaOHisanacceptablebinderinthe DMapplication.
Thecuringstateofthespecimensstabilizedwithalkalinematerialsiscrucialingeopolymerization;low temperaturesleadtolowstrength,whilehightemperaturesleadtohighstrength(Abdeldjouadetal.,2019). Theresultsdemonstratedthatsoftclaywithhighaluminaandsilicacontentscanbegeopolymerizedat
Figure6.XRDanalysisof(a)untreatedclay,(b)clay + 9percent NaOHafter28days,(c)clay + 9percentNaOHafter56days,and (d)clay + 9percentNaOHafter112days.
roomtemperature(20 ± 3°C),andthestrengthvalues ofthestabilizedsamplesareacceptable,accordingto theliterature.
ItisworthmentioningthattheUCSvaluesofthe samplespreparedwith7percentand9percentNaOH slightlydecreasein112dayscomparedtothatat56 days.Thiswasprobablyrelatedtothetimerequiredfor theformationofthenucleationphase.Thesameresult waspreviouslyobservedforsoilstabilizationwithlime (Cristeloetal.,2009)andalkalinematerials(Cristelo etal.,2013).
XRDResults
TheXRDanalysisfocusedonthespecimensthatexhibitedthehighestcompressivestrengthfromtheUCS test.TheeffectofthecuringperiodontheXRDof thetreatedspecimenswasinvestigated,andtheresults werecomparedwiththoseoftheuntreatedclay.
Figure6displaystheXRDresultsoftheuntreated clayandthestabilizedspecimensofS6after28,56, and112days.Theuntreatedclaywascomposedof amorphoustosignificantlycrystallinematerials.The peakcrystallinephaseswerereducedbetween28and 56daysbytheadditionof9percentNaOHandremainedunchangeduntil112days.Thereductionin XRDpeaksaftersoftclaytreatmentshouldincrease thestrengthofthesamples(Villaetal.,2010;Cristelo etal.,2013;andPhoo-Ngernkhametal.,2015).After28days,newamorphousphaseswerefound,some ofwhichoverlappedwiththemainpeaks.Theseobservationssuggestthatcompoundssuchassodium aluminosilicatehydrate(NASH),sodiumhydrogen aluminosilicate,andhydrogensodiumaluminosilicate formedbythereactionofNaOHandclayminerals (silicaandalumina)inthepresenceofwater.Onthe otherhand,anadditionalsemi-crystallinepeakofhydrosodalite(θ = 14°)andNASH(θ = 32.5°)increased after28and56days,respectively.Thealumina-silicate
ClayChangesaroundGeopolymerColumns
Environmental&EngineeringGeoscience,Vol.XXVIII,No.4,November2022,pp.371–386 377
inthekaolinitemineralreactswithNaOHtoformhydrosodalite(Marshetal.,2018).Hydrosodalitecauses somegeopolymerization,whichleadstoanincreasein strength(Somnaetal.,2011;Phoo-Ngernkhametal., 2015),andsotheformationofNASHgelsinthesystemmayhaveenhancedthestrengthofthesamples (Ismailetal.,2014;Phoo-Ngernkhametal.,2015;and Phetchuayetal.,2016).
SEMResults
SEMimagesprovideusefulinformationformonitoringstructuralchangesinclayasaresultofchemical reactions.Figure7showstheSEMmicrographsofuntreatedclay,NaOH,andS6after28,56,and112days ofcuring.TheSEMofclayillustratesaporoustexturewithwidelyspacedplatesandlooseandscattered layers(Figure7aandb).NaOHhasanangularand filledstructure.TheparticlesizeofNaOHisgenerally smallerthanthatofclay(Figure7candd).InFigure7eandf,softclaystabilizedwith9percentNaOH showsgeopolymerizationandbondingbetweenlayersafter28days,withstrengthincreasingwithtime (from400kPato2,345kPa);however,somemicroporesarestillpresentbetweenclaylayers.Atthisage, tinyparticlesoflessthan0.1 μmaredetectedinthe compactedmass(Figure7f),indicatinggeopolymerizedparticles(Sukmaketal.,2013a;Miaoetal.,2017). Figure7gandhshowsthatthegeopolymerizedcompoundsadheretomostclayparticlesafter56daysand, subsequently,causesignificantagglomerationinthe soilstructure,enhancingthestrengthbydecreasingthe microporevolume(3,120kPa).TheformationofhydrosodaliteandNASHgelswithintheclaystructure significantlyincreasedthestrengthofsoftclayover time(Somnaetal.,2011;Ismailetal.,2014;PhooNgernkhametal.,2015;andPhetchuayetal.,2016). ThiscanbeattributedtoanincreaseintheSi/Alratio inthesystem.Similarconclusionsweredrawninpreviousstudies,whenNaOHwasusedasanalkalitopreparethegeopolymericproducts,andthemechanical improvementwasobserved via microstructureanalysis (Wangetal.,2005;Komljenovi ´ cetal.,2010;Cristelo etal.,2013;Singhietal.,2016;andYaghoubietal., 2018).Inaddition,theSEManalysisresultsdisplayed thegeopolymerizationofsoftclayatroomtemperature,whichwasalsosupportedbytheXRDandUCS testresults.
Small-ScaleTestResults
Todeterminethemigrationofgeopolymersintothe surroundingsoftclay,testswereperformedforwatercontent(percent),pH,electricalconductivity(EC), andundrainedshearstrength(St)fromthedistance
columnperiphery(DCP).Thenegligibleresultofthe DMcolumnpreparationwith1percentNaOHisnot includedinthetestresults.AfterDCP = 25mm(0.83d, d = columndiameter),thevaluesoftheaforementionedtestsdroppeddrastically(similartothesoftclay values)andwere,therefore,excludedfromtheresults.
WaterContentTestResults
Figure8displaystheresultsofthechangesin watercontentaroundthegeopolymer-stabilizedDM columnsatdifferentpointsofDCPandcuringage. Foralladditiveratios,thewatercontentofsoftclay decreasednearthecolumnandincreasedfarfromthe columnedge(athighDCP).Thisdemonstratesthatinteractionbetweenthegeopolymercolumnandtheclay particlesismoreeffectivenearthecolumnthanfarther away.Inotherwords,ionmigrationishighnearthe column.
Furthermore,thewatercontent,especiallynearthe columns,decreasedslightlywithincreasingNaOHratio,andthiscanbeattributedtothemigrationofthe hydroxylgroups(BagheriniaandZaimo ˘ glu,2021)and sodiumions.Thesereductionswereevenmorepronouncedwithincreasingagingtime(upto56days) andthenreachedaplateauwithin112days.Asimilar trendwasobservedfortheimprovementofsoftclay soilswithlimecolumns(Tonozetal.,2003).Theminimumwatercontent(42.7percent)wasobtainedfor SC6in56days,whichwas3.0percentlowerthanthe initialvalue(untreatedclay = 44percent).
pHTestResults
ThepHtestwasperformedonthesoftclayaround thegeopolymerDMcolumnstodeterminethechanges inthealkalinityofthesoil,whichisanimportantfactorinstabilizingclaysoils.AsshowninFigure9,the pHsimultaneouslyincreasednearthecolumnwhen theNaOHratioincreased,anditdecreasedwithdistancefromthecolumn.ItisexpectedthatthepHof thesoilnearthecolumnswillbehighduetotheintenseiontransfer;hydroxylionscanmigratewithinthe clayandcausehighlyalkalineconditions(Diamond andKinter,1966;BagheriniaandZaimo ˘ glu,2021).In theclay-watersystem,ahighalkalinestatusindicatesa highpH,whichleadstoeffectivegroundstabilization (Vural,2012;Ghobadietal.,2014;andBagheriniaand Zaimo ˘ glu,2021).Accordingly,thehighestpHvalueillustratesstiffandfirmground,whilethelowestvalue describesweakandlooseground.Accordingtotheresultsandliteraturereview,theincreasedpHofsoft claynearthecolumnindicatesimprovedclayproperties(Shenetal.,2003a,2003b,2008;Tonozetal.,2003; Larssonetal.,2009).
BagheriniaandI¸sik
378 Environmental&EngineeringGeoscience,Vol.XXVIII,No.4,November2022,pp.371–386
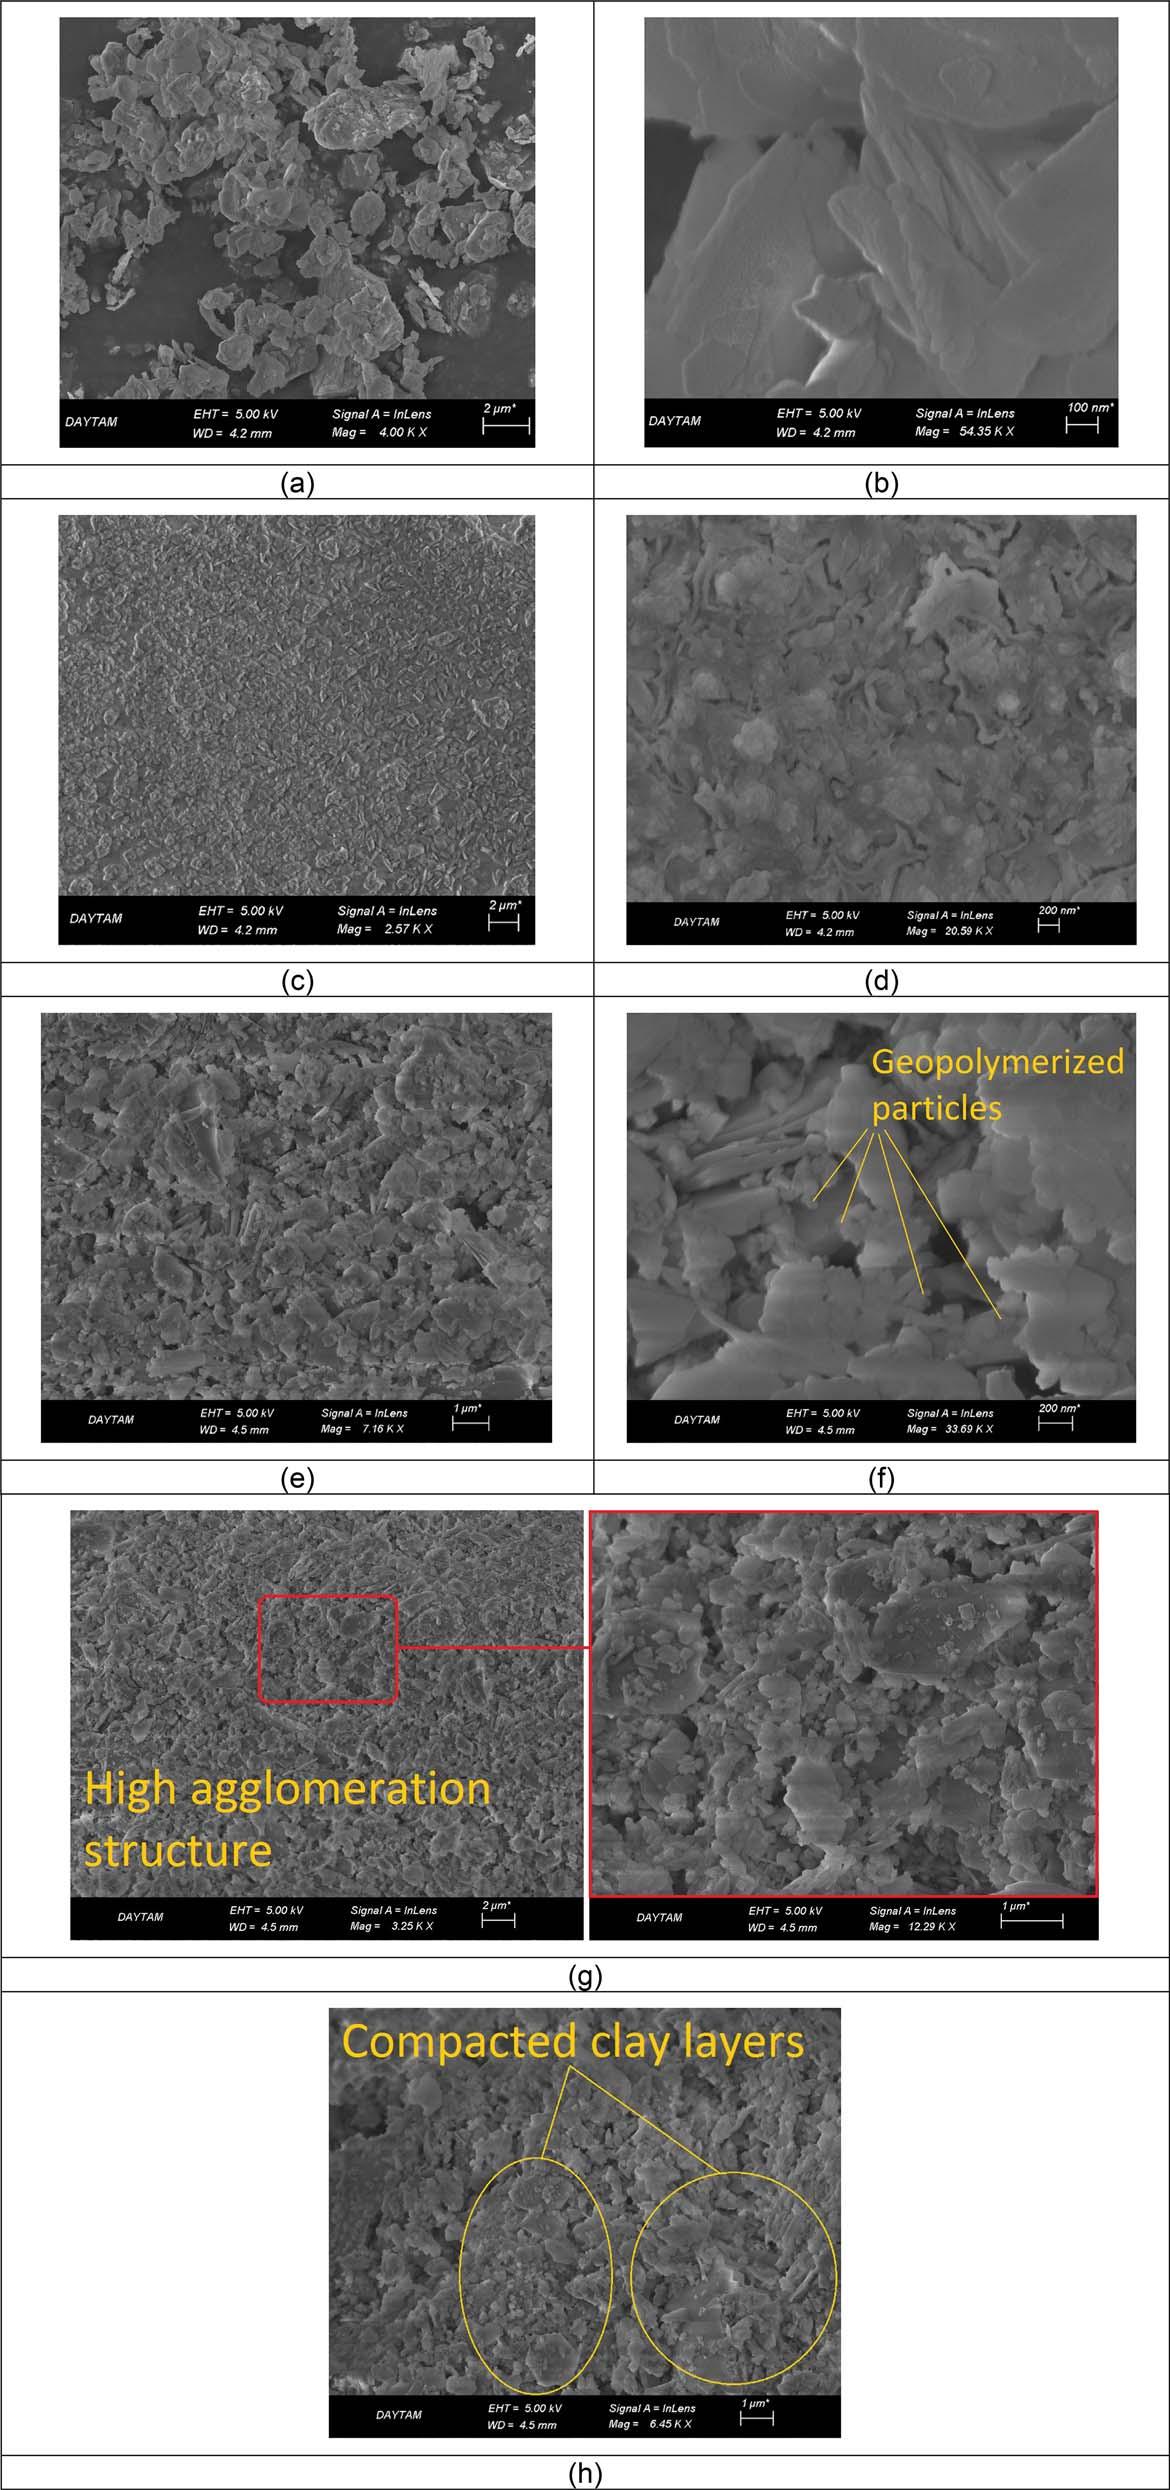
ClayChangesaroundGeopolymerColumns
+ 9percentNaOHafter28 days,(g)clay + 9percentNaOHafter56days,and(h)clay + 9percentNaOHafter112days.
379
Figure7.SEMmicrographsatdifferentmagnificationsofsamples:(a–b)untreatedclay,(c–d)NaOH,(e–f)clay
Environmental&EngineeringGeoscience,Vol.XXVIII,No.4,November2022,pp.371–386
Figure8.WatercontentvaluesaroundthegeopolymerDMcolumns.
Moreover,thepHvaluesshowedanupwardtrend withgreateragingtime.ForallNaOHratios,soilpH increasedfrom7to56daysandremainedconstantuntil112days.ThemaximumpHof8.78wasreachedat DCP = 5mm,9percentNaOH(SC6),andacuring periodof56days.Thisvalueis35percenthigherthan thatforrawclay(6.5).
ElectricConductivityTestResults
Theelectricalconductivityoftheclay-watersystem dependsonthetypeandnumberofionsinthemixture.Whenionsontheclaysurfacearedissolvedinto thesolution,theconductivityofthecationunderthe electricfieldandthemovementofthecolloidalparticlesincreasetheconductivityofthesolution.
Figure10displaystherelationshipbetweentheelectricalconductivityoftheclaysoilandthedistance fromtheedgeofthecolumnatdifferentcuringtimes. TheECvaluesofthesurroundingsoftclayincreased withtheincreaseoftheNaOHcontentinthegeopolymerDMcolumns(from3percentto9percent)and thecuringtime.Ontheotherhand,similartothewatercontentandpHtests,theECofthesurrounding clayincreasedsteadily,peakingwithin56days(atall
NaOHratios)andthenremainingconstantordecreasingupto112days.TheincreaseoftheECwasmore efficientnearthecolumns,particularlyat7percent and9percentNaOH,indicatingmigrationofNa+ and OH ionsintothesurroundingsoftclayandincreased colloidalparticleandionconcentrationactivity.The maximumECvalueof1.78mS/cmwasreachedat DCP = 5mm,9percentNaOH,and56daysofcuring,whichisabout88percenthigherthantheoriginal value(untreatedclay = 0.943mS/cm).Itshouldbe notedthattheECvaluedidnotincreaseafter56days. Thesetrendscouldbeduetodecreasediontransfer fromthegeopolymerDMcolumnstothesurrounding softclay,probablyleadingtoNaOHconsumption.As reportedearlier(SalimiandGhorbani,2020),theEC valueofthegeopolymer-stabilizedsamplesdecreased withagingafter56days,whichcouldbeduetolower ionconcentrationandadditiveconsumption.
UndrainedShearStrengthTestResults
Theundrainedshearstrength(St)testwasperformedaroundthecolumnstomeasurethemechanicalimprovementofthesoftclayandtoinvestigatethe effectsofthegeopolymerDMcolumnsontheshear
BagheriniaandI¸sik
380 Environmental&EngineeringGeoscience
,Vol.XXVIII,No.4,November2022,pp.371–386
strengthofthesoil.Theeffectsofcuringtimesand NaOHratiosonthestrengthdevelopmentofthesoft claywereinvestigatedatdifferentDCPs.Theresultsof SttestsareshowninFigure11.
Figure11showsthatthestrengthoftheclaysoilincreasedwithanincreaseinNaOHratiofrom3to9 percent.Duetothehigherionconcentrations,theincreasesweregreaterneartheperipheryofthecolumns thanatgreaterdistancesfromtheedgeofthecolumns.
Atrendsimilartothatdescribedabovewasalsoobservedduringthelongagingprocess.TheStvaluesincreasedwithincreasingcuringtime(7to56days)for allNaOHratiosandthenremainedunchangeduntil112days.Theeffectofcuringtimewasmorepronouncedfor9percentNaOHandclosedistancesfrom thecolumn.Aswiththetestsforwatercontent,pH, andEC,theStofthesurroundingsoftclayremained unchangedafter56days.Asdescribedintheprevious section,suchtrendscouldbeduetodecreasedionmigrationthatresultsinNaOHconsumption.
ThemaximumStvalueof5.68kPawasreached forSC6atDCP = 5mmand56daysofcuring, whichisabouteighttimeshigherthanthevaluefor theuntreatedclay(0.63kPa).AccordingtoBagherinia andZaimo ˘ glu(2021),theundrainedshearstrengthof
softclaycanbeimprovednearDMcolumnsprepared withalkalinematerials.TheyreportedthattheDM columnscontainaneffectiveareaortransitionzone duetothemigrationofpotassiumandhydroxylions, andthatthestabilizationofthesoiloccursduetothe reactionbetweentheclayparticlesandthemigrating ions.Ghobadietal.(2014)reportedthattheundrained shearstrengthoflime-stabilizedspecimensincreased withincreasingpH.Theyindicatedthatalkalinityis afactoraffectingthestabilizationofclaysoils.Other studiesfocusedonionmigrationanditseffectsonthe undrainedshearstrengthofsoftclayaroundlimeor cementcolumns(Shenetal.,2003a,2003b,2008;Larssonetal.,2009).
Large-ScaleTestResults
Figure12showstheload-settlementbehaviorof theclaybed,asinglecolumn,andthree-andsevencolumngroupsofend-bearingcolumnsafter56days. Asshown,thebearingcapacityoftheclaybed withnocolumnincreasedfrom0.05to0.20kNaftertheinstallationofthesinglecolumn.Inother words,thegeopolymerDMcolumnnoticeablyimprovedthebearingcapacityofthesoftclay.Theeffec-
ClayChangesaroundGeopolymerColumns
Figure9.ThepHvaluesofsoftclayaroundthegeopolymerDMcolumns.
Environmental&EngineeringGeoscience
381
,Vol.XXVIII,No.4,November2022,pp.371–386
tivearea(transitionzone)increasedwhenthenumber ofcolumnswasincreased,whichfurtherimprovedthe bearingcapacityofthesoftclay.Thebearingcapacity ofthreeandsevencolumnswas0.6and1.7kN,respectively.
Theultimatebearingcapacityof1,3,and7endbearingcolumnswasapproximately275percent,1,018 percentand2,990percenthigherthantheultimate bearingcapacityoftheclaybedwithnocolumns,respectively.ThesevaluessuggestthattheDMcolumns weresuccessfullyinstalledintothesoftclayandsignificantlyimprovedthemechanicalpropertiesofthesurroundingsoftclaybyincreasingthearearatio(numberofcolumns).Nevertheless,theresultsofthisstudy couldbemorebeneficialthanotherstudiesondeep mixedorstonecolumnsintheliterature(Malarvizhi andIlamparuthi,2004;Alietal.,2010;Malekpoorand Poorebrahim,2014).
CONCLUSIONS
Inthisstudy,seriesofunconfinedcompressivetests andsmall-andlarge-scalemodeltestswereconducted
toinvestigatetheeffectsofgeopolymerDMcolumns onthemechanicalstrengthandchemicalchangesof thesurroundingsoftclay.Thefollowingconclusions andrecommendationscanbedrawnfromthetest results.
ThemaximumUCSvalueobtainedinthisstudywas approximately56percentgreaterthantheaccepted limitvalue(i.e.,2,000kPa)fordeepmixedclaysoils withcementreportedintheliterature.
Claysoilsthatarerichinsilicaandaluminacanbe geopolymerizedwithNaOHbeadsatroomtemperature,whichwasconfirmedbytheXRDandSEM analyses.
Thetransitionzone(DCP = 25mm)formedaround thegeopolymerDMcolumnsduetothemigration ofions.
Thepropertiesofthesoftclaycanvaryinthetransitionzone.Whiletheundrainedshearstrength,pH, andECofthesoftclayincreased,thewatercontent decreased.Thetransitionofionsdependedonthe ratioofadditive,curingtime,anddistancefromthe edgeofthecolumn.
BagheriniaandI¸sik
Figure10.TheECvaluesaroundthegeopolymerDMcolumns.
382
Environmental&EngineeringGeoscience,Vol.XXVIII,No.4,November2022,pp.371–386
Figure11.TheStvaluesaroundthegeopolymerDMcolumns.
Theend-bearinggeopolymerDMcolumnincreased theload-bearingcapacityofthesoftclay,andincreasingthenumberofcolumnsincreasedtheloadbearingcapacityofthesoftclay.
Theload-bearingcapacityofthesoftclayafterinstallingsevengroupsofend-bearingcolumnswas approximately30timeshigherthanthatofsoftclay withoutanycolumns.
Consideringtheresultsofthisstudyandtheliteraturereview,NaOHcanberecommendedasanew binderforstabilizingsoftclaysoilsusingthedeepmixingmethod.Fieldstudiesareneededtoconfirmthe resultsofthisstudy.
REFERENCES
Abdeldjouad,L.;Asadi,A.;Huat,B.B.K.;Jaafar,M.S.; Dheyab,W.;andElkhebu,A.G.,2019,Effectofcuring temperatureonthedevelopmentofhardstructureofalkaliactivatedsoil: InternationalJournalofGEOMATE,Vol.17, No.60,pp.117–123.
Ali,K.;Shahu,J.;andSharma,K.,2010,Behaviourofreinforced stonecolumnsinsoftsoils:anexperimentalstudy. Proceedings ofIndianGeotechnicalConference,Mumbai,India,16–18December,p.620–628.
Arasan,S.;Bagherinia,M.;Akbulut,R.K.;andZaimoglu,A. S.,2017,Utilizationofpolymerstoimprovesoftclayeysoils usingthedeepmixingmethod: Environmental&Engineering Geoscience,Vol.23,pp.1–12.
Arulrajah,A.;Yaghoubi,M.;Disfani,M.M.;Horpibulsuk,S.; Bo,M.W.;andLeong,M.,2018,Evaluationofflyash-and slag-basedgeopolymersfortheimprovementofasoftmarine claybydeepsoilmixing: SoilsandFoundations,Vol.58,pp. 1358–1370.
Figure12.Load-settlementcurvesforend-bearinggeopolymerDM columns.
ASTMD2166/D2166M,2016, StandardTestMethodforUnconfinedCompressiveStrengthofCohesiveSoil:ASTMInternational,WestConshohocken,PA. Environmental&EngineeringGeoscience,Vol.XXVIII,No.4,November2022,pp.371–386

ClayChangesaroundGeopolymerColumns
383
ASTMD2216,2019, StandardTestMethodsforLaboratoryDeterminationofWater(Moisture)ContentofSoilandRockby Mass:ASTMInternational,WestConshohocken,PA.
ASTMD4972,2019, StandardTestMethodsforpHofSoils:ASTM International,WestConshohocken,PA.
Bagherinia,M.andZaimoglu,A.¸S.,2021,Effectofdeepchemicalmixingcolumnsonpropertiesofsurroundingsoftclay: ProceedingsoftheInstitutionofCivilEngineers—GroundImprovement,Vol.174,No.2,pp.95–104.
Bruce,M.E.C.;Berg,R.R.;Collin,J.G.;Filz,G.M.;Terashi, M..;andYang,D.S.,2013,Deepmixingforembankment andfoundationsupport.FederalHighwayAdministration DesignManual.
Bruce,D.A.andBruce,M.E.C.,2003,Thepractitioner’sguide todeepmixing.InJohnsen,L.F.;Bruce,D.A.;andByle,M.J. (Editors), GroutingandGroundTreatment:Proceedingsofthe ThirdInternationalConferenceonGroutingandGroundTreatment:AmericanSocietyofCivilEngineers,NewOrleans,LA, pp.474–488.
Bruce,D.A.;Bruce,M.E.C.;andDimillio,A.F.,1998,Deep mixingmethod:Aglobalperspective: CivilEngineering— ASCE,Vol.68,No.12,pp.38–51.
Bushra,I.andRobinson,R.G.,2013,Effectofflyashoncement admixtureforalowplasticitymarinesoil: AdvancesinCivil EngineeringMaterials,Vol.2,pp.608–621.
Consoli,N.C.,Vendruscolo,M.A.,Fonini,A.,andDalla Rosa,F.,2009,Fiberreinforcementeffectsonsandconsideringawidecementationrange: GeotextilesandGeomembranes, Vol.27,pp.196–203.
Cristelo,N.,Glendinning,S.,Fernandes,L.,andPinto,A. T.,2013,Effectsofalkaline-activatedflyashandPortland cementonsoftsoilstabilisation: ActaGeotechnica,Vol.8, pp.395–405.
Cristelo,N.,Glendinning,S.,andJalali,S.,2009,Subbasesof residualgranitesoilstabilizedwithlime: SoilsandRocks,Vol. 32,pp.83–88.
CEN(EuropeanCommitteeforStandardization),2004,CEN ISO/TS17892-62004:Geotechnicalinvestigationandtesting –laboratorytestingofsoil–Part6:Fallconetest.InternationalOrganizationforStandardization,Geneva,Switzerland.
Davidovits,J.,1991,Geopolymers—Inorganicpolymericnewmaterials: JournalofThermalAnalysis,Vol.37,pp.1633–1656.
Davidovits,J.,2013, GeopolymerCement:AReview:TechnicalPaper21,GeopolymerInstitute,Saint-Quentin,France,pp.1–11.
Davidovits,J.,2017,Geopolymers:Ceramic-likeinorganicpolymers: JournalofCeramicScienceandTechnology,Vol.8, pp.335–350.
Demir,A.;Sarici,T.;Laman,M.;Bagriacik,B.;andOk,B., 2013,Anexperimentalstudyonbehaviourofgeosyntheticreinforcedstonecolumns. Proceedingsofthe2ndInternational BalkansConferenceonChallengesofCivilEngineering,BCCCEEpokaUniversity,Tirana,Albania,23-25May,pp.832–841.
Diamond,S.andKinter,E.B.,1966,Adsorptionofcalciumhydroxidebymontmorilloniteandkaolinite: JournalofColloid andInterfaceScience,Vol.22,pp.240–249.
Du,Y.J.;Bo,Y.L.;Jin,F.;andLiu,C.Y.,2016,Durabilityof reactivemagnesia-activatedslag-stabilizedlowplasticityclay subjectedtodrying-wettingcycle: EuropeanJournalofEnvironmentalandCivilEngineering,Vol.20,pp.215–230.
Du,Y.J.;Yu,B.W.;Liu,K.;Jiang,N.J.;andLiu,M.D., 2017,Physical,hydraulic,andmechanicalpropertiesofclayey soilstabilizedbylightweightalkali-activatedslaggeopolymer: JournalofMaterialsinCivilEngineering,Vol.29,No.2,pp. 04016217.
EuroSoilStab,2002,Developmentofdesignandconstruction methodstostabilizesoftorganicsoils,DesignGuideSoftSoil Stabilization,CT97–0351.ProjectNo.BE96–3177,Industrial &MaterialsTechnologiesProgramme(Brite-EuRamIII),EuropeanCommission.
Gao,K.;Lin,K.L.;Wang,D.;Hwang,C.L.;Tuan,B.L.A.; Shiu,H.S.;andCheng,T.W.,2013,EffectofnanoSiO2 onthealkali-activatedcharacteristicsofmetakaolin-based geopolymers: ConstructionandBuildingMaterials,Vol.48, pp.441–447.
Ghobadi,M.H.;Abdilor,Y.;andBabazadeh,R.,2014,StabilizationofclaysoilsusinglimeandeffectofpHvariationson shearstrengthparameters: BulletinofEngineeringGeologyand theEnvironment,Vol.73,pp.611–619.
Hansbo,S.,1957, ANewApproachtotheDeterminationof theShearStrengthofClaybytheFall-ConeTest:Swedish GeotechnicalInstitute,Stockholm,Sweden,46p.
Horpibulsuk,S.;Rachan,R.;andSuddeepong,A.,2011,Assessmentofstrengthdevelopmentinblendedcementadmixed Bangkokclay: ConstructionandBuildingMaterials,Vol.25, pp.1521–1531.
Huseien,G.F.;Mirza,J.;Ismail,M.;andHussin,M.W.,2016, InfluenceofdifferentcuringtemperaturesandalkaliactivatorsonpropertiesofGBFSgeopolymermortarscontaining flyashandpalm-oilfuelash: ConstructionandBuildingMaterials,Vol.125,pp.1229–1240.
Ismail,I.;Bernal,S.A.;Provis,J.L.;SanNicolas,R.;Hamdan,S.;andVanDeventer,J.S.,2014,Modificationofphase evolutioninalkali-activatedblastfurnaceslagbytheincorporationofflyash: CementandConcreteComposites,Vol.45, pp.125–135.
Jamsawanga,P.;Nuansrithongb,N.;Voottipruexc,P.;Songpiriyakijd,S.;andJongpradiste,P.,2017,Laboratoryinvestigationsontheswellingbehaviourofcompositeexpansiveclaysstabilizedwithshallowanddeepclay-cementmixing methods: AppliedClayScience,Vol.148,pp.83–94.
JapaneseGeotechnicalSociety,2000,0821-00:PracticeforMakingandCuringStabilizedSoilSpecimensWithoutCompaction (TranslatedVersion):JapaneseGeotechnicalSociety,Tokyo, Japan.
Kitazume,M.andTerashi,M.,2013, TheDeepMixingMethod: CRCPress,BocaRaton,FL.
Komljenovic,M.;Bašcarevic,Z.;andBradic,V.,2010,Mechanicalandmicrostructuralpropertiesofalkali-activatedfly ashgeopolymers: JournalofHazardousMaterials,Vol.181, pp.35–42.
Larsson,S.;Rothhamel,M.;andJacks,G.,2009,Alaboratorystudyonstrengthlossinkaolinsurroundinglime-cement columns: AppliedClayScience,Vol.44,pp.116–126.
Lorenzo,G.A.andBergado,D.T.,2004,Fundamentalparametersofcement-admixedclay—Newapproach: Journalof GeotechnicalandGeoenvironmentalEngineering,Vol.130,pp. 1042–1050.
Malarvizhi,S.andIlamparuthi,K.,2004,Loadversussettlementofclaybedstabilizedwithstoneandreinforcedstone columns. ProceedingsofGeoAsia-2004,Seoul,Korea,20-23 June,pp.322–329.
Malekpoor,M.R.andPoorebrahim,G.R.,2014,Behaviorof compactedlime-soilcolumns: InternationalJournalofEngineering,Vol.27,pp.315–324.
Marsh,A.;Heath,A.;Patureau,P.;Evernden,M.;and Walker,P.,2018,Amildconditionssynthesisroutetoproducehydrosodalitefromkaolinite,compatiblewithextrusion processing: MicroporousandMesoporousMaterials,Vol.264, pp.125–132.
BagheriniaandI¸sik
384 Environmental&EngineeringGeoscience
,Vol.XXVIII,No.4,November2022,pp.371–386
Miao,S.;Shen,Z.;Wang,X.;Luo,F.;Huang,X.;andWei,C., 2017,Stabilizationofhighlyexpansiveblackcottonsoilsby meansofgeopolymerization: JournalofMaterialsinCivilEngineering,Vol.29,pp.04017170.
Mohammadinia,A.;Disfani,M.M.;Conomy,D.;Arulrajah, A.;Horpibulsuk,S.;andDarmawan,S.,2019,Utilizationof alkali-activatedflyashforconstructionofdeepmixedcolumns inloosesands: JournalofMaterialsinCivilEngineering,Vol. 31,pp.04019233.
Nath,P.andSarker,P.K.,2017,Flexuralstrengthandelasticmodulusofambient-curedblendedlowcalciumflyash geopolymerconcrete: ConstructionandBuildingMaterials, Vol.130,pp.22–31.
Nematollahi,B.andSanjayan,J.,2014,Effectofdifferentsuperplasticizersandactivatorcombinationsonworkabilityand strengthofflyashbasedgeopolymer: Materials&Design,Vol. 57,pp.667–672.
Olivia,M.andNikraz,H.,2012,PropertiesofflyashgeopolymerconcretedesignedbyTaguchimethod: Materials&Design (1980-2015),Vol.36,p.191–198.
Pacheco-Torgal,F.;Castro-Gomes,J.;andJalali,S.,2008, Alkali-activatedbinders:Areview—Part1.Historicalbackground,terminology,reactionmechanismsandhydration products: ConstructionandBuildingMaterials,Vol.22, pp.1305–1314.
Pakbaz,M.S.andAlipour,R.,2012,InfluenceofcementadditiononthegeotechnicalpropertiesofanIranianclay: Applied ClayScience,Vol.67–68,pp.1–4.
Phetchuay,C.;Horpibulsuk,S.;Arulrajah,A.;Suksiripattanapong,C.;andUdomchai,A.,2016,Strengthdevelopmentinsoftmarineclaystabilizedbyflyashandcalcium carbideresiduebasedgeopolymer: AppliedClayScience,Vol. 127–128,pp.134–142.
Phoo-Ngernkham,T.;Maegawa,A.;Mishima,N.;Hatanaka, S.;andChin-Daprasirt,P.,2015,Effectsofsodiumhydroxideandsodiumsilicatesolutionsoncompressiveandshear bondstrengthsofFA–GBFSgeopolymer: Constructionand BuildingMaterials,Vol.91,pp.1–8.
Phoo-Ngernkham,T.;Sata,V.;Chindaprasirt,P.;Hanjitsuwan,S.;Ridtirud,C.;andHatanaka,S.,2016,Compressivestrength,bendingandfracturecharacteristicsofhighcalciumflyashgeopolymermortarcontainingPortlandcement curedatambienttemperature: ArabianJournalforScienceand Engineering,Vol.41,pp.1263–1271.
Pourakbar,S.;Huat,B.B.;Asadi,A.;andFasihnikoutalab, M.H.,2016,Modelstudyofalkali-activatedwastebinderfor soilstabilization: InternationalJournalofGeosyntheticsand GroundEngineering,Vol.2,pp.1–12.
Rayment,G.andHigginson,F.R.,1992, AustralianLaboratory HandbookofSoilandWaterChemicalMethods:InkataPress PtyLtd.,Melbourne,Australia.
Rios,S.;Ramos,C.;VianaDaFonseca,A.;Cruz,N.;and Rodrigues,C.,2017,Mechanicalanddurabilityproperties ofasoilstabilisedwithanalkali-activatedcement: EuropeanJournalofEnvironmentalandCivilEngineering,Vol.23, pp.245–267.
Rogers,C.D.F.;Glendinning,S.;andHolt,C.C.,2000,Slope stabilizationusinglimepiles—acasestudy: Proceedingsofthe InstitutionofCivilEngineers–GroundImprovement,Vol.4,No. 4,pp.165–176.
Sabet,F.A.;Libre,N.A.;andShekarchi,M.,2013,Mechanicalanddurabilitypropertiesofselfconsolidatinghighperformanceconcreteincorporatingnaturalzeolite,silicafume andflyash: ConstructionandBuildingMaterials,Vol.44, pp.175–184.
Salimi,M.andGhorbaniA.,2020,Mechanicalandcompressibilitycharacteristicsofasoftclaystabilizedbyslag-based mixturesandgeopolymers: AppliedClayScience,Vol.184, pp.105390.
Sargent,P.;Hughes,P.N.;Rouainia,M.;andWhite,M.L., 2013,Theuseofalkaliactivatedwastebindersinenhancing themechanicalpropertiesanddurabilityofsoftalluvialsoils: EngineeringGeology,Vol.152,pp.96–108.
¸ Sengör,M.Y.,2011, TheDeformationCharacteristicsofDeep MixedColumnsinSoftClayeySoils: Doctoratethesis,METU University,Ankara,Turkey,128p.
Shen,S.-L.;Han,J.;andDu,Y.-J.,2008,Deepmixinginduced propertychangesinsurroundingsensitivemarineclays: JournalofGeotechnicalandGeoenvironmentalEngineering,Vol. 134,pp.845–854.
Shen,S.L.;Huang,X.C.;Du,S.J.;andHan,J.,2003a,Laboratorystudiesonpropertychangesinsurroundingclaysdueto installationofdeepmixingcolumns: MarineGeoresources& Geotechnology,Vol.21,pp.15–35.
Shen,S.L.;Miura,N.;andKoga,H.,2003b,Interactionmechanismbetweendeepmixingcolumnandsurroundingclay duringinstallation: CanadianGeotechnicalJournal,Vol.40, pp.293–307.
Singhi,B.;Laskar,A.I.;andAhmed,M.A.,2016,Investigation onsoil-geopolymerwithslag,flyashandtheirblending: ArabianJournalforScienceandEngineering,Vol.2,pp.393–400.
Somna,K.;Jaturapitakkul,C.;Kajitvichyanukul,P.;and Chindaprasirt,P.,2011,NaOH-activatedgroundflyash geopolymercuredatambienttemperature: Fuel,Vol.90,pp. 2118–2124.
Subekti,S.;Bayuaji,R.;Darmawan,M.;Husin,N.;Wibowo,B.; Anugraha,B.;Irawan,S.;andDibiantara,D.,2017,Potentialstrengthofflyash-basedgeopolymerpastewithsubstitutionoflocalwastematerialswithhigh-temperatureeffect. InternationalConferenceofAppliedScienceandTechnology forInfrastructureEngineering(ICASIE),Surabaya,Indonesia,IOPPublishing,Vol.267,pp.012001.
Sukmak,P.;Horpibulsuk,S.;andShen,S.-L.,2013a,Strength developmentinclay-flyashgeopolymer: Constructionand BuildingMaterials,Vol.40,pp.566–574.
Sukmak,P.;Horpibulsuk,S.;Shen,S.-L.;Chindaprasirt,P.; andSuksiripattanapong,C.,2013b,Factorsinfluencing strengthdevelopmentinclay-flyashgeopolymer: Construction andBuildingMaterials,Vol.47,pp.1125–1136.
Tonoz,M.;Gokceoglu,C.;andUlusay,R.,2003,Alaboratoryscaleexperimentalinvestigationontheperformanceof limecolumnsinexpansiveAnkara(Turkey)clay: BulletinofEngineeringGeologyandtheEnvironment,Vol.62, pp.91–106.
Valipour,M.;Yekkalar,M.;Shekarchi,M.;andPanahi,S., 2014,Environmentalassessmentofgreenconcretecontaining naturalzeoliteontheglobalwarmingindexinmarineenvironments: JournalofCleanerProduction,Vol.65,pp.418–423.
Villa,C.;Pecina,E.T.;Torres,R.;andGomez,L.,2010, Geopolymersynthesisusingalkalineactivationofnaturalzeolite: ConstructionandBuildingMaterials,Vol.24, pp.2084–2090.
Vural,P.,2012, TheEffectofCementandZeolite(NaturalPozzolan)onEngineeringPropertiesofClaySoilswithSwelland DispersiveCharacteristics,Eskisehir,Turkey: M.S.Thesis,ESOGÜUniversity,Eski¸sehir,Turkey,186p.
Wang,H.L.;Li,H.H.;andYan,F.Y.,2005,Synthesisandmechanicalpropertiesofmetakaolinite-basedgeopolymer: ColloidsandSurfacesA–PhysicochemicalandEngineeringAspects, Vol.268,pp.1–6.
ClayChangesaroundGeopolymerColumns
385
Environmental&EngineeringGeoscience,Vol.XXVIII,No.4,November2022,pp.371–386
Wu,H.L.;Jin,F.;Ni,J.;andDu,Y.J.,2019,Engineeringpropertiesofverticalcutoffwallsconsistingofreactivemagnesiaactivatedslagandbentonite:Workability,strength,andhydraulicconductivity: JournalofMaterialsinCivilEngineering, Vol.31,pp.04019263.
Yaghoubi,M.;Arulrajah,A.;Disfani,M.M.;Horpibulsuk, S.;Bo,M.;andDarmawan,S.,2018,Effectsofindustrialbyproductbasedgeopolymersonthestrengthdevelopmentofa softsoil: SoilsandFoundations,Vol.58,pp.716–728.
Yaghoubi,M.;Arulrajah,A.;Disfani,M.M.;Horpibulsuk,S.; Darmawan,S.;andWang,J.,2019,Impactoffieldcondi-
tionsonthestrengthdevelopmentofageopolymerstabilized marineclay: AppliedClayScience,Vol.167,pp.33–42.
Yaghoubi,M.;Arulrajah,A.;Disfani,M.M.;Horpibulsuk,S.;andLeong,M.,2020,Compressibilityandstrength developmentofgeopolymerstabilizedcolumnscuredunderstress: SoilsandFoundations,Vol.60,pp.1241–1250.
Zhang,M.;Guo,H.;El-Korchi,T.;Zhang,G.P.;andTao,M. J.,2013,Experimentalfeasibilitystudyofgeopolymerasthe next-generationsoilstabilizer: ConstructionandBuildingMaterials,Vol.47,pp.1468–1478.
Environmental&EngineeringGeoscience,Vol.XXVIII,No.4,November2022,pp.371–386
BagheriniaandI¸sik
386
WaterQualityMonitoringofFiveKarstSpringswithina PasturelandinSouthwestPolkCounty,Missouri
RAMONAGÓMEZ MÉLIDAGUTIÉRREZ*
DepartmentofGeography,Geology,andPlanning,MissouriStateUniversity, SpringfieldMO65897


KeyTerms: Nitrate,Chloride,KarstSpring,Water QualityMonitoring,Ozarks
ABSTRACT
Thefracturednatureofkarstterrainmakestheseareashighlysusceptibletocontamination.Besidesaquifer contamination,impairedkarstspringscannegatively impacttheaquatichabitatoftheirreceivingstreams. FivespringsofashallowkarstaquiferinsouthwestPolk County,Missouri,andtheirreceivingstreamwereselectedtoconstructabaselineofwaterqualitydata,usingnitrate(NO3 )asindicator.Themainlanduseinthe studyareaiscattlefarming.Watersampleswerecollectedduringa12-monthperiodandanalyzedforpH, turbidity,Ca,Mg,HCO3 ,Cl,SO4 ,andNO3 .Results showthateachspringhaditsownrangeofvalues.NO3 andClvalueswerebelowcontaminationlevelsandonly inafewinstancesexceededthresholdlevelsreportedfor karstareas(NO3 -N <3mg/L;Cl <13mg/L),implying thatthenumberofcattleperacreismaintainedatasustainablelevelandleakingfromtheSpringfieldPlateau aquifertotheunderlyingOzarkaquiferposesaminor threat.Interestingly,NO3 andCldidnotcorrelatedespitetheircommonsource,suggestingthattheyundergo differentchemicalandmicrobiologicalprocessesalong theirpath.TheyearlynitrateexportfromtheLittleSac Riverwasestimatedas286.8Mg,andthemaximumN loadwasobservedinMarch.Monitoringofspringsand streamsisrecommendedforthisenvironmentallyfragile area.
INTRODUCTION
Karstterrainsformafterdissolutionofbedrock, primarilylimestoneanddolostone.Asdissolutionenlargesthefractures,theresultantsecondaryporosity allowstherocktoholdgroundwater,formingakarst aquifer(Kresic,2013;Maasetal.,2019;andMedici andWest,2021).Karstaquifersareimportantsources ofdrinkingwater,supplyingwatertoabout10%of
*Correspondingauthoremail:mgutierrez@missouristate.edu
theworld’spopulation(Stevanovic,2019).Otherkarst featuresincludesprings,caves,dolines,andsinkholes (GoldscheiderandDrew,2014).
Thefracturednatureofkarstproducesconduits ofpreferentialflow,restrictingbothfiltrationofcontaminantsandadsorptiontosolidsurfaces(Allshorn etal.,2007;TagneandDowling,2020;andVisser etal.,2021).Unconfinedkarstaquifersarethuseasilyimpactedbyactivitiesthattakeplaceonthesurface(Kresic,2013;Knierimetal.,2015).However,the waterflowandthechemicalandbiologicalprocesses occurringwithinakarstsystemarecomplex,aswaterflowsfasterthroughtheseconduitsofpreferential flowandslowerthroughthelesspermeablerockmatrix,creatingzoneswithvariousdegreesofbiological activity(Husicetal.,2020;Visseretal.,2021).
Nitrogenasnitrate(NO3 -N)isacommonindicator ofagriculturalcontaminationbecauseofitsstableand solublenatureandforbeingassociatedwithmineral fertilizers,manure,andseptictankeffluents(Kresic, 2013;Medicietal.,2021;andVisseretal.2021).NO3 Nhasgainednotorietyrecentlyasaleadingcauseof theGulfofMexico’shypoxiczone(Schillingetal., 2019;TagneandDowling,2020).Therefore,NO3 contributionfromagriculturallandscapesrequiresmonitoringoflevels,startingatasmallwatershedlevel (TagneandDowling,2020),inordertodevelopstrategiestomitigatenutrientexportatalargerscale.
IntheUnitedStates,karstisprominentinmany states,includingFlorida,NewYork,andmidwestern statesfromTexastoMichigan(Venietal.,2001;Katz, 2020).Pannoetal.(2006)usedNO3 -Nconcentrations from232karstspringsinIllinoisanddetermined athresholdconcentrationforkarstspringstobe 2.5mg/LNO3 -N.Thethresholdvalueforpresent-day precipitationisreportedtobe0.7mg/LNO3 -N(NationalAtmosphericDepositionProgram,2022)for thestudyarea.Otherstudiesreportingnitrateinkarst springsintheU.S.MidwestincludeMaasetal.(2019) innorthwesternIllinois,TagneandDowling(2020)in theOhioRiverbasin,Schillingetal.(2019)inIowa, andFordetal.(2019)inKentucky.IntheOzarks, waterqualityofkarstspringshasbeenreportedby Adamski(2000),Mugel(2002),Petersonetal.(2002),
Environmental&EngineeringGeoscience
387
,Vol.XXVIII,No.4,November2022,pp.387–396
Figure1.LocationofPolkCountywithintheOzarkPlateausProvinceandofthesamplinglocations.TheSpringfieldPlateauconsistsof exposedlimestoneandtheSalemPlateauofexposeddolomite(modifiedfromAdamski,1997).
andOwenandPavlowsky(2011).Waterqualityisalso reportedbytheU.S.GeologicalSurvey(USGS)NationalWaterInformationSystem(https://waterdata. usgs.gov/mo/nwis/qw)andtheMissouriDepartment ofNaturalResourcesintheMissouriCleanWater InformationSystems.WefocusedourstudytoapasturelandareainsouthwestPolkCounty,Missouri, locatedontheedgeofthelimestoneplatformknown astheSpringfieldPlateau(Figure1).
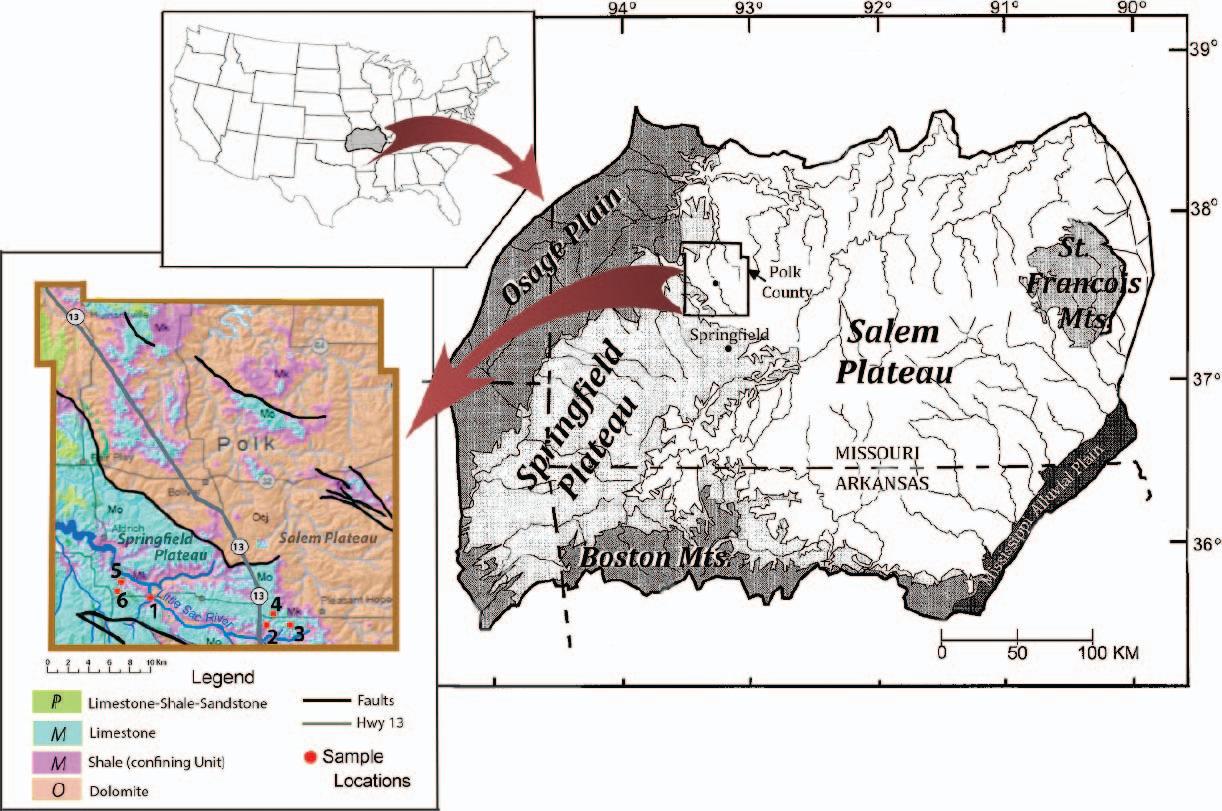
Themajorthreattoshallowwaterqualityisthat fromongoingagriculture,animaloperations,andurbanization(Mugel,2002;Gillmanetal.,2008;Katz, 2020;andTagneandDowling,2020).TheSpringfield PlateauaquiferseparatesfromtheunderlyingOzark aquiferbyarelativelythin(asthinas6m)(Mugel, 2002)andfracturedconfininglayer.Whilethereare numerousstudiesfocusingonwaterqualityofsurface waterandthedeeperOzarkaquifer,studiesfocusing onwaterqualityoftheSpringfieldPlateauaquiferare lessabundant.
StudyObjectives
ThewaterqualityoftheSpringfieldPlateauaquifer isrelevantfortwomajorreasons.Oneisthecontaminationthreattothedeeperaquiferasaresultfrom
severalfaultsandtheotheranegativeimpactthatcontaminatedspringdischargemayhaveontheaquatic habitatsofthereceivingstreamsand,inthecaseofnitrate,hypoxiazonesasthewaterreachestheocean.A waterqualitybaselineofthisaquiferisthereforekey totheprotectionofwaterresourcesoftheregion.The objectivesofthisstudywerethefollowing:
CompilewaterqualitydataoffivekarstspringsdischargingintotheLittleSacRiverinsouthwestern PolkCountyMissouri.
Determinethetemporalvariationinwaterquality foreachofthefivestudiedspringsbasedonseason andprecipitationevents.
Identifythespringsandtheconditionsleading tocontaminatedgroundwaterbasedonnitrate content.
RESEARCHMETHODS
StudyArea
ThestudyareaislocatedinsouthwesternPolk Countyandlayswithinthephysiographicprovinceof theOzarkPlateau(Adamski,1997;Haysetal.,2016) (Figure1).Thestudiedspringsclusterinaruralarea
GómezandGutiérrez
388 Environmental&EngineeringGeoscience
,Vol.XXVIII,No.4,November2022,pp.387–396
Figure2.StratigraphiccolumnofPolkCounty,Missouri.(Source: MSDISMissouriImagery.)
approximately25kmnorthofSpringfield,Missouri, attheedgeoftheSpringfieldPlateau,wherelimestone bedrockiscoveredbyathinlayerofsoil,thereforereferredtoasmantledkarst.Themaineconomicactivityiscattlefarming,astheabundantprecipitationof theOzarksisconducivetothegrowthofgrasses.Nbasedfertilizerisappliedtopasturelandatarateof 150kg/ha(2–4poundsper1,000ft2 ),commonlyduringthespringofeachyear(Maasetal.,2019).
TheSpringfieldPlateauaquiferiswithinathin(10–20m)layerofhighlyfracturedlimestone(chertyin someplaces)ofMississippianage,whosesurfacecoincideswiththeSpringfieldPlateauphysiographicregionshowninFigure1.TheOzarkconfiningunitseparatestheshallowSpringfieldPlateauaquiferfromthe underlyingOzarkaquifer(Figure2).TheOzarkconfiningunit,composedoflayersofshaleandmudstone, variesinthicknessinthestudyareafrom20to26m, whereastheOzarkaquiferiswithinathick(300–600m)layeroffractureddolostonesandlimestones (Figure2).TheoverlyingMississippianlimestoneand confininglayerareabsentintheSalemPlateau,exposingolder(Ordovician)dolomites.
Thesurfacehydrologyofthestudyareaisshownin Figure3.Springswithinthiswatershedareadrainwaterintosmallspring-fedstreamsandthen,withinafew kilometers,intotheLittleSacRiver.Formanagement
purposes,theLittleSacRiverwatershedisdividedinto upperandlowerwatersheds.TheupperLittleSacwatershedistheprimarysourceofthepublicdrinking waterforthecityofSpringfield,andthereforeitswaterqualityhasbeencloselymonitored,mainlywithrespecttobacteria(Escherichiacoli)loading(Watershed CommitteeoftheOzarks,2010).Oursamplesarelocatedattheboundarybetweenupperandlowerwatersheds,withthreesamplingsitesintheupperandthree inthelowerLittleSacRiverwatershed(Figure3).
Theclimateistemperatehumid,witha106-cmaverageannualprecipitationscatteredthroughouttheyear, slightlymoreintenseinthespringandwinter.Sincethe SpringfieldPlateauaquiferisthinandunconfinedand morelikelytobecontaminated(Adamski,1997),most wellsintheareatapintothedeeperOzarkaquifer (Popeetal.,2009).
Inkarstspringselsewhere,precipitationhasbeenreportedtofirstflushsolutesfromthesoilfollowedby adecreaseinconcentrationasaconsequenceofdilution(Huebschetal.,2014;Schillingetal.,2019;Tobinetal.,2021;andVisseretal.,2021).Thiseffect requiresacontinuousmeasurementprobe(Huebsch etal.,2014).Becauseofthediscontinuoussamplingof ourstudy,moreelevatednitrateconcentrationscould haveeasilybeenoverseen;however,thisprocessmay explainahighconcentrationobservedafterarain eventthatfollowsarelativelylongdryperiod.
LandUse
With56,600cows,PolkCountyhasthesecondlargestnumberofcattleinMissouri(U.S.DepartmentofAgriculture,2020).Manuregeneratedbycattle andpoultrycontainsnutrients(N,P),coliformbacteria,andvariouschemicals(e.g.,antibiotics,pesticides)thatposeathreattolocalkarstaquifersand downstreamwaterways(Adamski,1997;Tagneand Dowling,2020).Confinedanimalfeedingoperations (CAFOs)arelargeanimaloperationsthatkeepfrom 300to >7,000animals(hogs,cattle,andpoultry)confinedinpens.AlthoughtherearenoCAFOswithin thestudyareaandonlyoneinPolkCounty,CAFOs areabundantinotherpartsofMissouri,increasing thelikelihoodofamorewidespreadpresenceinthe OzarkPlateausinthefuture(Mugel,2002;Tagneand Dowling,2020).
SamplingandAnalyses
WeselectedfivespringswithintheSpringfield PlateauinPolkCountybasedontheirlocationand accessibilityandcollectedsamplesduring11months in2021andonein2022.ExceptforLeithSpring,all springsweresmall,andtheirwaterqualityotherthan
FiveKarstSprings
Environmental&EngineeringGeoscience,Vol.XXVIII,No.4,November2022,pp.387–396 389
pH,temperature,andTDSisseldomreported.The samplinglocationsareshowninFigures1and3and listedinTable1.
Watersampleswerecollectedinclean1-Lplastic containersandkeptcoolduringtransporttothelaboratory,whereturbidity,pH,andalkalinityweremeasuredonarrival.Theremainderofthesamplewasfilteredandkeptrefrigeratedat4°Cforfurtheranalyses, whichwerecompletedwithin3daysofsamplecollection.Thechemicalparametersweredeterminedusing standardmethodology(Clescerietal.,1998).TurbiditywasanalyzedusinganHfScientificDRT-15CEturbiditymeter.Totalalkalinity,chloride,calcium,and magnesiumweredeterminedtitrimetrically,sulfateby thenephelometricmethod,andtotalnitratecolori-

metricallyusingaHachDR3900spectrophotometer asnitrite + nitrate,towhichnitritewassubtracted (mostvalueswerebelowdetectionlimit)andreported asNO3 -N.Ammoniawasprobedusingacommercial kittodetermineifproperdeterminationswerenecessary,butallsamplescamebelowdetectionlimits.Na andKaremostlyreportedasminorcationsandare notdirectlyrelatedtothisstudy;therefore,theywere measuredforthreesamplespersiteandtheirmedian valueusedforpercenterrorbalance(%EB).
Allchemicaldeterminationsfollowedstandard guidelinesforqualitycontrol,whichincludeddaily calibrationofreagentsandinstrumentsandreplicates andblanksevery10thsample.Thepercenterrorofthe electricbalanceforthesampleswasbelow5%formost
GómezandGutiérrez
Figure3.HydrologyofthestudyareaandlocationofsamplingsiteswithintheLittleSacRiverwatershed(modifiedfromWatershedCommitteeoftheOzarks,2010).
Table1. Location,flow,* andelevationofsampledsprings. SpringNo.Latitude(°N)Longitude(°W)Elevation(AMSL) Flow(m3 /min)Minimum Maximum 2.Unnamed37.446393.3404336.5NRNR 3.Unnamed37.444293.3086358.7NRNR 4.Unnamed37.458293.3464342.3NRNR 5.EudoraSpring37.499493.5268288.00.451.14 6.LeithSpring37.488993.5340305.421.89191.12 *Flowmeasuredin2015(MissouriDepartmentofNaturalResources,unpublisheddata). AMSL = abovemeansealevel;NR = notreported. 390 Environmental&EngineeringGeoscience
,Vol.XXVIII,No.4,November2022,pp.387–396
Figure4.Piperdiagramofthewaterfromthefivestudiedsprings andtheLittleSacRiver.
samplesAfewsampleshadEBupto7.5%,whichwe consideredacceptableandkeptinthedatabase.
PearsoncorrelationanalysesusingMicrosoftExcel wereappliedtothedatatodetermineanyassociationamongchemicalparametersthatcouldbeassociatedtoacommonsource.Forexample,bothCl andNO3 arepresentinanimalwastesandseptictank effluents.Correlationcoefficients(r)largerthan0.6 wereconsideredstrong,andtheirsignificancewasdeterminedusingatwo-tailed t-distributionalsousing Excel.
RESULTS
Table2liststhevaluesobtainedforselectedchemicalparametersandFigure4thePiperdiagram.The PiperdiagramshowsallspringsbutEudoraSpring plottingclosetogether.ThewaterisaCa-Mg-HCO3 watertypeforallspringsexceptforEudoraSpring, whichhasaCa-Mg-HCO3 -SO4 watertype.
TheresultsinTable2showmodestvariationsof waterchemistrywithinanyonespringcomparedtoa moreevidentvariationamongsprings.Turbiditywas higherforallspringsontwooccasions,March12and July16,bothtimesbecauseofanintenseprecipitation event.Onthesedates,thevaluesofHCO3 andCain springnos.2and3andEudoraSpringdecreased,suggestingdilution,buttheseeffectswerelessnoticeable inspringno.4andLeithSpring.NO3 -Ndidnotfollowthispatternofdilution.
NaandKconcentrationsweredeterminedfora smallernumberofsamples.Theresultsareshown inTable3.Errorbalancecalculationswere <10.0% forallsamplesexceptfortwosamplesofEudora Spring(10.26%and10.29%EB),whichwerekeptin thedatabaseanddidnotaffectthecorrelationre-
sults,asEudoraSpringsampleswereexcludedfrom thecorrelationcalculationsduetoitsdifferentwater type.
Becauseoftheirdifferentwatertypes,correlation datawereseparatedintotwogroups,onecombining springnos.2,3,4,and6andoneforEudoraSpring. ExceptforthecorrelationbetweenCaandalkalinity (r = 0.63, p < 0.01),waterqualityparametersdidnot correlateinthegroupofcombinedspringnos.2,3,4, and6.CorrelationcoefficientsforEudoraSpringwere notstatisticallysignificant.
DISCUSSION
Amongthesprings,therewasalargevariationin waterchemistryinspiteofbeingallwithina20-km lineardistance,likelytheresultofeachspringhaving aparticularflowpathandchemicaltransformations throughsoilandepikarst.Thespringsmorelikelyto becontaminatedwithanimalwasteorseptictanks wereidentifiedasthosesurpassingthethresholdvaluesof2.5mg/LNO3 -Nand13mg/LCl(Pannoetal., 2006).
Springno.2showedthelargestNO3 concentration, 3.3mg/LNO3 -N,andsurpassedtheNO3 -Nbackgroundvaluein44%ofthesamples.Springno.2was alsotheonlyspringtocompletelydryduringdryspells ofAugust–September2021andremaineddryforseveralmonths.Springno.4surpassedthekarstNO3 -N thresholdlevelsonce(7%ofthesamples).Visualappraisaloftheflowsofspringnos.2and4rankedthem asthesmallestofallsprings,andthislackofdilutionis probablyacontributingfactoroftheirhigherNO3 -N highcontent.
Chlorideconcentrationssurpassedbackgroundvaluesin7%ofthesamplesinspringno.3and47%ofthe samplesinspringno.4.Thehigh(>13mg/LCl)valuesoccurredconcurrentwithlowNO3 -Nvalues;however,thisinverserelationwasweak(r = 0.10)andnot statisticallysignificant.
EudoraSpring(no.5)showedadistinctlydifferent waterchemistrythantheotherfoursprings,withlow chlorideandnitratecontentandalargesulfatecontent.ThelocationofEudoraSpringcoincideswith aPennsylvanianstreamchannelexposure,achannel carvedintotheMississippianlimestonethatiscomprisedofsandstonesandshales.Thedifferentlithology explainsitsdistinctwaterquality.
ThelackofcorrelationbetweenNO3 andotherpossiblyrelated(anthropogenic)parameters,suchasCl andSO4 (bothareindicatorsof,e.g.,contamination fromsepticsystems)observedinallsprings,suggests thatnitrogentransformationsaretakingplaceseparatelyandmoreintenselyforNcompoundsthanthose ofClorSO4 .Theseprocessesoccurintheoverlying
FiveKarstSprings
Environmental&EngineeringGeoscience,Vol.XXVIII,No.4,November2022,pp.387–396 391
Table2. SelectedwaterqualityparametersoftheLittleSacRiver(no.1),threeunnamedsprings(nos.2–4),EudoraSpring(no.5),andLeith Spring(no.6).
Sample No. Date, 2021–2022pH Turbidity (NTU)HCO3 (mg/L)Ca(mg/L)Mg(mg/L)NO3 (mg/L)Cl(mg/L)SO4 (mg/L) 1Feb.57.963.0114.769.69.71.6813.59.2 Feb.267.9914.0109.8NDND1.0016.07.0 Mar.127.9322.9107.462.41.20.8521.312.0 Mar.197.9122.1100.469.210.21.3613.56.1 Apr.28.176.4117.169.68.71.077.17.2 Apr.308.028.3100.060.07.80.7217.09.6 May148.197.6119.669.66.81.119.27.6 Jun.118.286.5119.673.66.30.7611.37.7 Jul.168.0417.685.455.217.00.7728.47.0 Aug.288.019.2112.263.214,10.5026.611.8 Sep.268.054.1112.263.89.70.1722.113.0 Oct.318.022.2129.376.310.71.736.712.2 Nov.308.031.0124.464.012.20.8624.813.4 Dec.308.071.1107.467.212.60.1625.115.3 Jan.318.011.3131.864.012.20.5027.715.6 2Feb.57.472.4167.187.28.33.025.34.0 Feb.267.963.3163.587.29.73.327.66.1 Mar.127.5842.1114.777.60.51.906.76.1 Mar.197.280.8134.275.28.32.7211.45.1 Apr.27.360.4131.886.41.52.551.14.3 Apr.307.360.3131.885.66.32.4312.44.0 May147.440.7131.881.65.42.400.75.4 Jun.117.340.3126.984.03.92.013.54.0 Jul.167.191.4117.274.47.82.236.44.3 ———Dry————
3Feb.57.612.2128.171.26.30.995.317.6 Feb.267.642.2109.870.47.30.607.417.0 Mar.127.5520.659.853.60.50.816.416.4 Mar.197.685.373.248.81.51.057.810.2 Apr.27.691.6126.981.69.70.805.316.2 Apr.307.612.1129.380.08.80.5820.219.6 May147.801.5136.680.06.80.7710.015.2 Jun.117.342.1102.548.816.50.1311.711.2 Jul.167.1913.678.136.811.20.116.87.0 Aug.287.574.7134.259.221.40.0512.49.1 Sep.267.562.6131.857.622.30.014.610.4 Oct.317.390.8144.076.86.83.116.75.2 Nov.307.731.4153.788.812.20.2712.124.8 Dec.307.830.9153.087.212.60.2311.323.0 Jan.317.880.8153.788.012.20.2610.623.6 4Feb.57.573.3104.964.06.32.158.53.8 Feb.267.484.1104.961.67.82.079.96.9 Mar.127.459.3109.873.61.01.9418.86.3 Mar.197.413.278.056.00.51.934.63.0 Apr.27.371.5102.568.05.82.213.94.4 Apr.307.381.5102.567.24.41.6014.54.9 May147.581.6100.461.63.91.726.45.2 Jun.117.331.4100.067.26.81.9811.75.1 Jul.167.186.290.357.64.41.6810.93.6 Aug.287.3810.9117.176.09.71.7015.64.8 Sep.267.322.2120.076.08.81.669.65.0 Oct.317.272.1124.479.22.41.7015.27.1 Nov.307.421.4129.380.09.21.7719.17.6 Dec.307.511.3119.680.010.21.8519.07.0 Jan.317.891.2119.679.09.01.8418.96.5 5Feb.56.423.139.035.611.10.06 <0.0252.0 Feb.266.452.536.632.010.20.05 <0.0252.5 Mar.126.3121.531.739.22.90.140.0740.0 Mar.196.5516.028.728.03.90.13 <0.0226.8
GómezandGutiérrez
392 Environmental&EngineeringGeoscience,Vol.XXVIII,No.4,November2022,pp.387–396
Table2. Continued.
Sample No. Date, 2021–2022pH Turbidity (NTU)HCO3 (mg/L)Ca(mg/L)Mg(mg/L)NO3 (mg/L)Cl(mg/L)SO4 (mg/L) Apr.26.635.936.639.23.90.041.0660.4 Apr.306.185.830.528.811.7 <0.013.5056.0 May146.568.524.430.48.3 <0.01 <0.0256.8 Jun.116.140.534.233.69.7 <0.011.162.8 Jul.165.9831.314.614.43.40.161.820.8 Aug.286.223.436.639.211.20.0611.357.6 Sep.266.2319.934.232.88.8 <0.019.657.6 Oct.316.1211.439.035.27.3 <0.012.166.0 Nov.306.1018.731.728.810.7 <0.01 <0.0262.8 Dec.306.3013.229.328.013.6 <0.011.157.6 Jan.316.463.431.728.213.0 <0.01 <0.0259.2 6Feb.58.191.3125.169.47.31.4810.67.2 Feb.268.101.1129.378.48.81.075.39.1 Mar.128.067.7109.880.27.80.8912.18.8 Mar.198.064.4112.276.02.41.063.23.6 Apr.28.190.7141.583.26.81.262.08.2 Apr.308.181.1139.189.68.70.6110.37.5 May148.361.4148.890.43.90.972.86.1 Jun.118.041.1112.271.26.31.225.35.5 Jul.168.024.2126.984.06.80.645.75.2 Aug.288.040.4122.071.23.91.3513.15.5 Sep.268.080.2109.872.011.70.467.46.1 Oct.317.880.4153.760.010.70.5012.79.6 Nov.307.910.1141.572.014.60.758.49.6 Dec.308.060.6141.588.012.60.547.411.2 Jan.3180.10.3136.684.013.00.748.211.6
ND = notdetermined;— = dry.
soilandepikarstzoneandincludenitrification,denitrification,plantuptake,andseveralsoilandwatermicrobiologicalprocesses(Visseretal.,2021).
Figure5showsNO3 -Nconcentrationvariationsfor eachspringandtheirrelationshiptoprecipitation(cumulativeprecipitationof3dayspriortosamplingdate) andthedischargeoftheLittleSacRiveronthedayof sampling).Duringthesamplingperiod,thedischarge oftheLittleSacRivervariedbetween0.3and140m3/ s (historicalminimaandmaximaare0.06and782m3 /s, respectively),meaningthatbothrainyanddryweather
wererepresented.NO3 -Nvaluesvariedoverarelativesmallrangeofvaluesandhadaquickresponseto precipitationeventsasdescribedbyMugel(2002)and Huebschetal.(2014),respectively.
SpringswithaquickerresponseofNO3 -Ntoaprecipitationeventwerenos.2and3,EudoraSpring,and theLittleSacRiver,whereasLeithSpringandspring no.4showedadelayedresponse.Apossibleexplanationforthedelayresponseisalongerflowpath, smallerwaterconduits,orboth.AngelandPeterson (2015)usedNO3 -NandClasparametersofconcern
LittleSacRiverSpringNo.2SpringNo.3SpringNo.4EudoraSpringLeithSpring
Environmental&EngineeringGeoscience,Vol.XXVIII,No.4,November2022,pp.387–396
FiveKarstSprings
Sodium(Na)andpotassium(K)concentrationsinselectedsamplesfromtheLittleSacRiverandstudiedsprings.
Table3.
Na,mg/L8.42.93.65.40.82.5 8.53.43.86.81.44.1 11.4—7.46.60.93.1 18.0—18.09.31.44.6 K,mg/L0.91.70.31.31.40.8 2.00.82.11.02.81.1 1.9—0.93.02.61.9 2.9—1.21.12.60.6 = dry.
393
Figure5.NitrateconcentrationforeachofthefivespringsandtheLittleSacRiver.Barsrepresentriverdischarge,inm3 /s,and3-day cumulativeprecipitation(mm).
andfoundminimallyimpactedkarstspringsinKentucky,withvaluesupto1.5mg/LNO3 -N,whereas Schillingetal.(2019)reportedvaluesupto22mg/L NO3 -NforspringsinIowa.Precipitationseemedto impactturbidity;however,thisvisualeffectonceusingturbiditymeasurementsproducedanonsignificant correlationwithprecipitation.
Sincechlorideisaconservativeelementandacontaminantpresumedtosharethesamesourceoforigin asNO3 ,agraphshowingClvariationsforeachspring wasconstructedandisshowninFigure6.
Thedailyexportofnitratefromthisrelativelysmall (614km2 )watershedwasestimatedas0.786Mg/d (286.75Mg/yr)basedonthemedianvalueofthe15
consecutivenitrateloadsoftheLittleSacRiverat theUSGS06918740LittleSacRivernearMorrisville, showninTable4.
Althoughthevaluesforpotentialcontaminantsnitrateandchloridearerelativelylowinthefivestudied springs,thefactsthatsomewereabovebackground levelsandthatmostofthemrespondedtoprecipitationeventswereconsideredsignsofconcernwithrespecttotheamountofNO3 potentiallydischarged intothestream.Theresultsprovidebackgroundvalues thatcouldbeusefultofuturestudies,suchastopredictimpactduetopotentialchangesineitherweather patterns(e.g.,globalclimatechange)orlanduse(e.g., landdevelopmentandCAFOs).
Figure6.ChlorideconcentrationsforeachoffivespringsandtheLittleSacRiver.Barsrepresentriverdischarge,inm3 /s,and3-daycumulative precipitation(mm).

GómezandGutiérrez
394 Environmental&EngineeringGeoscience,Vol.XXVIII,No.4,November2022,pp.387–396
Table4. NitrateloadattheU.S.GeologicalSurvey06918740Little SacRiverneartheMorrisville,Missouri,location.
Date, 2021–2022 NO3 (mg/L) Discharge (m3 /s) NO3 -Nload (Mg/d) Feb.51.688.471.229 Feb.261.685.520.802 Mar.120.8514.301.054 Mar.191.3645.595.357 Apr.21.078.100.749 Apr.300.7212.630.786 May141.1114.361.377 Jun.110.767.620.500 Jul.160.7725.801.716 Aug.280.500.510.022 Sep.260.170.370.005 Oct.311.737.221.079 Nov.300.861.420.105 Dec.300.161.440.020 Jan.310.501.340.058
CONCLUSIONS
Water–rockinteractionandprecipitationwere,in thisorder,thecontrollingfactorsofwaterquality offivekarstspringsoutflowingfromtheSpringfield PlateauinPolkCounty,Missouri.Thechemistrywas uniqueforeachspringandmostlybelowthresholdconcentrationsreportedforotherkarstsprings (2.5mg/LNO3 -Nand13mg/LCl),whichindicates thatthenumberofcattleinthepasturelandiskeptat asustainablelevelandtheirwasteisnotsignificantly impactingthewaterqualityoftheSpringfieldPlateau aquifer.Springnos.2and4hadNO3 -Nvaluesabove karstthresholdlevelsin44%and7%ofthesamples, respectively.Bothofthesespringscorrespondedtothe smallestflows,andthisisprobablyacontributingfactorfortheirhigherNO3 -Ncontent.Inallcases,NO3 Ndidnotcorrelatewithotherpotentialhuman-related parameters,eitherClorSO4 ,suggestingthateachof thesecompoundsundergoesdifferenttransformations alongtheirflowpath.
Cattlefarmingisthemaineconomicactivityofthe studyareaandcouldexpandinfollowingyearsif farmerswererequiredtoincreasetheirproduction.A waterqualitydatabasefortheunconfinedSpringfield aquiferiskeyforcomparisonpurposesifchangesin landuse(e.g.,CAFOandurbanization)andmoreintenseweatherpatternsweretooccur.Specifically,the databasewouldhelppredicttheextentandperiodicityofcontaminationandtheeffectofrainevents oncontaminantlevels.TheNexportfromthewatershedisimportantforwaterbodiesdownstream andthusfortheconservationofwaterresources.The presentexportofNbythiswatershedwasestimated as287Mgofnitrogenperyear.Monitoringnutrientsatsmall-scalewatershedsisimportanttoidentify
thespringsandtheconditionsthatfavortheirrelease. Thedatacanthenbeusedtodevisewaystoprotecttheaquiferfromcontaminationandtomitigate Nexport.
ACKNOWLEDGMENTS
WearegratefultotheMissouriLouisStokesAlliancesforMinorityParticipationProgramforpartialfundingofthisstudyandtotheNationalScience Foundation1828069CHEgrantAcquisitionofan Inductively-CoupledPlasmaMassSpectrometerSystemawardedtoMissouriStateUniversity.
REFERENCES
Adamski,J.C.,1997,NutrientandPesticidesinGroundWaterof theOzarksPlateausinArkansas,Kansas,Missouri,andOklahoma:USGSWater-ResourcesInvestigationsReport96-4313, 34p.doi:10.3133/wri964313
Adamski,J.C.,2000,GeochemistryoftheSpringfieldPlateau aquiferoftheOzarksPlateausProvinceinArkansas,Kansas, MissouriandOklahoma,USA: HydrologicalProcesses, Vol.14,pp.849–866.https://doi.org/10.1002/(SICI)10991085(20000415)14:5<849::AID-HYP973>3.0.CO;2-7
Allshorn,S.J.L.;Bottrel,S.H.;West,L.J.;andOdling N.E.,2007,Rapidkarsticbypassflowintheunsaturated zoneoftheYorkshirechalkaquiferandimplicationsfor contaminanttransport.InParise,M.andGunn,J.(Editors), NaturalandAnthropogenicHazardsinKarstAreas: Recognition,AnalysisandMitigation:SpecialPublications, Vol.279,TheGeologicalSociety,London,U.K.pp.111–122. https://doi.org/10.1144/SP279.10
Angel,J.C.andPeterson,E.W.,2015,Nitratesinkarstsystems:Comparingimpactedsystemstoarelativelyunimpacted system: JournalGeographyandGeology,Vol.7,pp.65–76. doi:10.5539/jgg.v7n1p65
Clesceri,L.S.;Greenberg,A.E.;andEaton,A.D.,1998, StandardMethodsfortheExaminationofWaterandWastewater,20thed.:AmericanPublicHealthAssociation,American WaterWorksAssociation,WaterEnvironmentalFederation, Washington,DC,1,325p.
Ford,W.I.;Husic,A.;FogleA.;andTaraba,J.,2019, Long-termassessmentofnutrientflowpathwaydynamics andin-streamfateinatemperatekarstagroecosystemwatershed:HydrologicalProcesses,Vol.33,pp.1610–1628. doi:10.1002/hyp.13427
Gillman,J.;Crews,R.G.;andPrewett,J.,2008,Dyetracing animalwasteeffluentintheNorthForkBasin,SouthernMissouri.In 11thMultidisciplinaryConferenceonSinkholesand theEngineeringandEnvironmentalImpactsofKarst:American SocietyofCivilEngineers,Tallahassee,FL,pp.467–476.
Goldscheider,N.andDrew,D.,2014, MethodsinKarstHydrogeology:CRCPress,BocaRaton,FL,280p.
Hays,P.D.;Knierim,K.J.;Breaker,B.;Westerman,D.A.; andClark,B.R.,2016,HydrogeologyandHydrologicConditionsoftheOzarkPlateausAquiferSystem: U.S.GeologicalSurveyScientificInvestigationsReport2016–5137,61p. http://dx.doi.org/10.3133/sir20165137
Huebsch,M.;Fenton,O.;Horan,B.;Hennessy,D.;Richards, K.G.;Jordan,P.;Goldscheider,N.;ButscherC.;and Blum,P.,2014,Mobilisationordilution?Nitrateresponseof
FiveKarstSprings
Environmental&EngineeringGeoscience
395
,Vol.XXVIII,No.4,November2022,pp.387–396
karstspringstohighrainfallevents: HydrologyEarthSystem Sciences,Vol.18,pp.4423–4435.doi:10.5194/hess-18-44232014
Husic,A.;Fox,J.;Adams,E.;Pollock,E.;Ford,W.; Agouridis,C.;andBackus,J.,2020,Quantificationof nitratefateinakarstconduitusingstableisotopesand numericalmodeling: WaterResearch,Vol.170,115348. doi.org/10.1016/J.WATRES.2019.115348
Katz,B.G.,2020,Nitratecontaminationinsprings.InKatz, B.G.(Editor), NitrogenOverload:EnvironmentalDegradation,RamificationsandEconomicCosts:AmericanGeophysical UnionGeophysicalMonograph250,JohnWiley&Sons,New York,pp.155–174.
Knierim,K.J.;Hays,P.D.;andBowman,D.,2015, QuantifyingthevariabilityinEscherichiacoli(E.coli) throughoutstormeventsatakarstspringinnorthwesternArkansas,UnitedStates: EnvironmentalEarthWatch, Vol.74,pp.4607–4623.https://doi.org/10.1007/s12665-0154416-5
Kresic,N.,2013, WaterinKarst:Management,Vulnerability,and Restoration:McGraw-Hill,NewYork.708p.
Maas,B.;Peterson,E.W.;Honings,J.;Oberhelman,A.; Oware,I.R.;andWatson,A.,2019,Differentiation ofsurfacewaterandgroundwaterinakarstsystemusinganthropogenicsignatures: Geosciences,Vol.9,148. https://doi.org/10.3390/geosciences9040148
Medici,G.;Baják,P.;West,L.J.;Chapman,P.J.;and Banwart,S.A.,2021,DOCandnitratefluxesfromfarmland: ImpactonadolostoneaquiferKCZ: JournalHydrology,Vol. 595,125658.https://doi.org/10.1007/s12665-015-4416-5 Medici,G.andWest,L.J.,2021,Groundwaterflowvelocitiesinkarstaquifers:Importanceofspatialobservation scaleandhydraulictestingforcontaminanttransportprediction: EnvironmentalSciencePollutionResearch,Vol.28,8. https://doi.org/10.1007/s11356-021-14840-3
Mugel,D.N.,2002, Ground-WaterQualityandEffectsofPoultry ConfinedAnimalFeedingOperationsonShallowGroundWater, UpperShoalCreekBasin,SouthwestMissouri: U.S.GeologicalSurveyWater-ResourcesInvestigationsReport02-4125,41 p.https://doi.org/10.3133/wri024125
NationalAtmosphericDepositionProgram,2022,National TrendsNetwork:Electronicdocument,availableathttps:// nadp.slh.wisc.edu/networks/national-trends-network Owen,M.andPavlowsky,R.T.,2011,Baseflowhydrologyand waterqualityofanOzarksspringandassociatedrecharge area,southernMissouri,USA: EnvironmentalEarthScience, Vol.64,pp.169–183.https://doi.org/10.1007/s12665-0100836-4
Panno,S.V.;Kelly,W.R.;Martinsek,A.T.;andHackley,K. C.,2006,Estimatingbackgroundandthresholdnitrateconcentrationsusingprobabilitygraphs: Groundwater,Vol.44, 6970709.https://doi.org/10.1111/j.1745-6584.2006.00240.x
Peterson,E.W.;Davis,R.K.;Brahana,J.V.;andOrndorff, H.A.,2002,Movementofnitratethroughregolithcovered karstterrane,NWArkansas: JournalHydrology,Vol.256, pp.35–47.
Pope,L.M.;Mehl,H.E.;andCoiner,R.,2009,QualityCharacteristicsofGroundWaterintheOzarkAquiferofNorthwesternArkansas,SoutheasternKansas,SouthwesternMissouri, andNortheasternOklahoma,2006–07: U.S.GeologicalSurveyScientificInvestigationsReport2009-5093.60p.
Schilling,K.E.;Jones,C.S.;Clark,R.J.;Libra,R.D.;Liang, X.;andZhang,Y.,2019,ContrastingNO3 -NconcentrationpatternsattwokarstspringsinIowa(USA):Insightson aquifernitrogenstorageanddelivery: HydrogeologyJournal, Vol.27,pp.1389–1400.https://doi.org/10.007/s10040-01901935-y
Stevanovic,Z.,2019,Karstwatersinpotablewatersupply:A globalscaleoverview: EnvironmentalEarthScience,Vol.78, 662.https://doi.org/10.1007/s12665-019-8670-9
Tagne,G.V.andDowling,C.,2020,Land-usecontrolson nutrientloadsinaquifersdrainingagriculturalandmixedusekarsticwatersheds: EnvironmentalMonitoringAssessment, Vol.192,168.https://doi.org/10.1007/s10661-020-8126-4
Tobin,B.W.;Polk,J.S.;Arpin,S.M.;Shelley,A.;and Taylor,C.,2021,Aconceptualmodelofepikarstprocesses acrosssites,seasons,andstormevents: JournalHydrology,Vol. 596,125692.https://doi.org/10.1016/j.jhydrol.2020.125692
U.S.DepartmentofAgriculture,2020,MissouriCattleCountyEstimates:Electronicdocument,availableat http://www.nass.usda.gov
Veni,G.,Duchene,H.,Crawford,N.C.,Groves,C.G.,Huppert,G.N.,Kastning,E.H.,Olson,R.;andWheeler,B. J.,2001, LivingwithKarst:AmericanGeologicalInstituteEnvironmentalAwarenessSeries4,CLBPrintingCo.,Kensington, MD.69p.
Visser,A.N.;Lehman,M.F.;MazoD’Affonseca,F.;Grathwohl,P.;Blackwell,N.;Kappler,A.;andOsenbrück, K.,2021,Fateofnitrateduringgroundwaterrechargeina fracturedkarstaquiferinSouthwestGermany: HydrogeologyJournal,Vol.29,pp.1153–1171.https://doi.org/10.1007/ s10040-021-02314-2
WatershedCommitteeoftheOzarks(WCO),2010, LittleSac WatershedManagementPlan:WatershedCommitteeofthe OzarksincooperationwiththeGreeneCountySoilandWater District,Springfield,MO.78p.
GómezandGutiérrez
396 Environmental&EngineeringGeoscience
,Vol.XXVIII,No.4,November2022,pp.387–396
AssociationbetweenCOVID-19andHeavyMetal PollutioninIraqiCitiesDeterminedfromHierarchical Prediction

ARAMMOHAMMEDRAHEEM*
DepartmentofCivilEngineering,UniversityofKirkuk,Al-SayadaStreet,Kirkuk, Iraq,36001
KeyTerms: COVID-19,ConfirmedCases,Heavy Metal,Contamination,DistinctiveIraqiCities,StandardLimits,HierarchicalPredictionApproach
ABSTRACT
Thisstudyassessestherelationshipbetweencoronavirus(COVID-19)andthespreadofvariousheavy metalcontaminantsacrossIraq.Thestudycollectsall confirmed,recovered,anddeathcasesoftheCOVID19virusatitsonsetinIraquntilMay2,2020,comparingIraqwiththetopthreeinfectedcountriesinthe world(theUnitedStatesSpain,andItaly).Inaddition,numerousheavymetalcontaminationindifferent Iraqicitieshavebeensummarizedandassociatedwith theallowableupperandlowerworldwidestandardlimits.Furthermore,thestudyintroducesahierarchicalpredictiveapproachfortherelationshipbetweenconfirmed infectedcasesanddeathsduetotheCOVID-19virus andheavymetalcontaminationinvariousIraqicities.It isconcludedthatallthestudiedIraqicitieshaveheavy metalcontaminationfordifferentchemicalelementsexceedingtheallowablestandardlimits.Extremecontentsofcopper,nickel,lead,andzincareconcentrated inAl-Qadisiyah,Al-Sulaimaniyah,Erbil,andBaghdad withlimitsof160 µg/g,240.9 µg/g,378 µg/g,and 1,080 µg/g,respectively.Basedonthehierarchicalpredictionapproach,alinearpositiverelationshipbetween bothconfirmedcasesanddeathsduetoCOVID-19with differentheavymetalcontaminationwasobtainedwith amaximumcoefficientofdetermination(R2 )of0.97.
INTRODUCTION
Coronavirus(COVID-19)startedinWuhan,Hubei Province,China,andeventuallyreachedtheentire world(Malayetal.,2020a;Tosepuetal.,2020).CoronavirusesarepartoftheCoronaviridaegroupand aresingle-strandedenvelopedviruseswitharibonucleicacid(RNA)genomeofapproximately26–32kb

*Correspondingauthoremail:engaram@yahoo.com, aram_raheem@uokirkuk.edu.iq
involume(Clementetal.,2020).COVID-19couldbe aresultofevolvingorre-evolvingdiseases,defecatinganimalsorhumans,orboth(El-SayedandKamel, 2020;Malayetal.,2020b).OnMay2,2020,Iraqi officialshadreported2,153confirmedcasesofthe COVID-19virussincethebeginningofthepandemic. InIraq,thetopthreecitieswithconfirmedaccumulativecasesofCOVID-19wereBaghdad,Al-Najaf,and Al-Basrah,citieswith384,303,and281cases,respectively.NormalindicationsfortheCOVID-19virusincludesignsofseverebreathingcomplaints,includinga hightemperatureaccompaniedbycoughing.Theperiodofsicknessrangesfrom5to14days,wheresevere casescreatecriticalbreathingdifficulties,pneumonia, kidneybreakdown,anddeath.Preliminaryclinicalindicationshaveshownthatmanycasesincludefever, whileafewcasesincludebreathingproblemswithmassivepneumoniainfiltrationinbothlungs(Holshue etal.,2020;LorikaandStefan,2020;andPerlman, 2020).ThemedicalsignsofsuchharshanddangerousCOVID-19diseasearereasonablysimilartoMiddleEastrespiratorysyndromeandsevereacuterespiratorysyndrome(Wangetal.,2020a).Earlierstudies showedthatseveralfactors,suchasa2-week-longcriticalwindspeedbeforethespreadoftheCOVID-19 virusanddailytemperature,havestronginfluences onpopulations(Bashiretal.,2020;¸Sahin,2020).In addition,anautoregressiveintegratedmovingaveragemodelhasbeenusedtopredictthefuturetime evolutionofCOVID-19casesindifferentcountries (Ceylan,2020).InIraq,nostudieshavetriedtoinvestigatetheenvironmentalissuesandtheirassociation withthespreadofCOVID-19.
Toxicheavymetalsandradionuclidepollutionhave beenamajorhealthandpoliticalproblem(Guoetal., 2016).Inrecentyears,theproblemsofenvironmentalpollutioninIraqhaveincreased,especiallyheavy metalpollution(Al-Janabietal.,2019).Suchmetals havebeenreleasedintotheecosystemathighratesand areseverecontaminantsbecauseoftheirtoxicity,firmness,andbioaccumulativeharm(Saharetal.,2020). Massivemetalconcentrationsarehazardousandmay persistinthesystemforalongtime,despitethefact
Environmental&EngineeringGeoscience,Vol.XXVIII,No.4,November2022,pp.397–413 397
thatmostoftheseheavymetalsarephysicalelements oftheearth’sshell(Volpeetal.,2020).However,heavy metalsinvolvedinrockweatheringaredissolvedinwater(Mokhtaretal.,2015;Khanetal.,2020a,2021a, 2021b,2021c;andLuoetal.,2020).
Thecontaminationcausedbyheavymetalsin bothagriculturalandurbansoilsorwaterarises fromsourcessuchasmanufacturing,mining,paints, pesticides,batteries,automobiles,anddomesticand industrialsludge(TawfiqandGhazi,2017;Umaetal., 2020;andWangetal.,2020b).Itwasshownthatusing asedimentationtankmethodcouldremoveheavy metalsby70%;however,thesemethodsbuildupheavy metalsintraps,ponds,andtanks,generatingatoxic wasteproductthatisdifficulttoeliminate(Cairns etal.,2020).Soilscancontainheavymetalseither fromnaturalgeologicalsourcesorfromhuman-made sources,suchasfertilizers,industrialwaste,deposits, andirrigation(Liuetal.,2020).Sourcessuchasenergy production,humananthropogenicactions,removalof wastes,manufacturingreleases,andvehicledischarges wouldaccumulatedepositsofheavymetalsonany urbansurface.Naturalsoilsfromdifferentplaces, includingurbanareas,landfills,andgasandoillocations,mightinfluencehumanhealthsincesuchsoils couldincludeanthropogeniccontamination(Steffan etal.,2018).Anothercrucialsoilpollutionfactoris crudeoilobtainedfromprocessingoilproductionand wastes.Severalvitalmetalsrepresentedbycadmium (Cd),copper(Cu),iron(Fe),lead(Pb),manganese (Mn),nickel(Ni),andzinc(Zn)arethemajorheavy metalpollutantsinthewater.Levelsofheavymetals andaccumulatedsedimentsinrivershaveincreasedbecauseoftheincreaseinthereleaseofmassiveamounts ofindustrialanddomesticwasteintothesystem.
TheCu(II)ionisanecessaryconstituentinboth chemistryandbiochemistry.However,itsconcentrationinwastewatercancauseharmtohumans,plants, andanimals(Awualetal.,2019).ExtremeCu(II)ion canaltertheredoxstateoftheintracellularenvironment,spoilthestructuralperformanceofcells,and destroycells.Moreover,exposuretoahugeamount ofCu(II)mightcausehealthproblemsrangingfrom stomachdistresstobraindamage.Themaximumacceptablelimitisaccuratelyadjusted,asthepermissible Cu(II)ionindrinkingwateris0.05mg/L.
Humantoxicitymighthaveresultedfromthe sourcesofthesoilsupplies,asthesoilhasagreatimpactonhumanhealth.Dependingonsoilconditions, thesoilcanaffecthumanlifepositivelyornegatively. Aswithanynecessaryelementforhumanhealth,there isanideallimitthatthebodyrequires,andhaving anyconcentrationabovesuchalimitcancausetoxicity(Greenetal.,2016).Ascontaminatedsoilisirrigatedtocropplantsandfoods,suchobtainedfruitsor
vegetablesareconsideredriskstohumanhealth (Jankaite,2009).Justassoilcanprovidehumanswith miscellaneousnutrients,itcanalsodeliverdangerousingredientstothebodythroughfoodconsumed (OliverandGregory,2015).Thus,thehealthofhumanscanbeaffectedbychemicallycontaminatedsoil.
Heavymetalscanbereleasedfromthesurficialsedimentsofwatertotheupperwaterenvironmentand thuscanbeusedintentionallyforirrigationprocesses accompaniedbyharmfulimpactstofishinthewater (Yinetal.,2020).Thefoodcharacteristicsaccompaniedbytherisktohumanhealthareaffectedmainly bythetypeofagriculturalproducts,wherethequalityofsuchproductsiscontrolledbythetypeofsoil anditsmetalcontaminationlevel(HadiaandAhmed, 2018).Heavymetalsareharmfulmaterials,astheyaccumulateinthetissuesofthehumanbody(Kirchmann etal.,2017).
Also,theexistenceofmanganeseions(Mn+2 )iningestingwaterclogssupplypipesbecauseoftheoxidationofMn+2 toMnO2 ,resultinginablackcoloranda metallictasteinthewateranddiscolorationinhouseholdandwashingfixtures(Asirietal.,2018).ContinuedexposuretoahighconcentrationofMn+2 is hazardousandcanhurthumanhealth,causingmood swingsanddepression.
Ingeneral,heavymetalsaremetallicchemicalelementswithhighatomicmassesanddensities.Someof themareessentialtothehumanbodyatlowlevelsbut cancausepoisoningathigherlevels.Frequently,adensityofatleast5gm/cm3 isusedtodescribeaheavy metal.Moreover,heavymetalsinvolveanatomicmass greaterthan23oranatomicnumberhigherthan20. Investigatingtheperiodictableofchemicalelements, heavymetalsdominatecolumns3–16ofperiods4–6, includingthetransitionmetals,post-transitionmetals,andlanthanides(Duffus,2002).Therearemore than50constituentsofheavymetals,whereonly17 ofthemareclassifiedastoxicelements(Canoetal., 2013;Khanetal.,2020b).PbandCdaretwoofthe mostdangerouselementstohumanhealth,andsuch constituentscancausecoughing,headache,vomiting, anddeadlychestpain.
Pbisoneofthemostwidespreadsoilcontaminants theworldover;itssourcesincludelead-basedpaints, leadedgasoline,variousindustrialactivities,andlead smeltingandmining(Balabanovaetal.,2017).Urban soilcontaminatedwithPbisamajorsourceofhealth problemsforchildren(Lietal.,2015).Fertilization combinedwithsewage,slurry,orindustrialactivities arethemainsourcesofCdcontaminationinthesoil (Nordbergetal.,2014),andChinesesoiliscontaminatedmostlywithCd.Cd-contaminatedsoilcaused theitai-itaidiseaseeruptioninJapaninthefirstpart ofthe20thcentury(Nordbergetal.,2014).
Raheem
398 Environmental&EngineeringGeoscience
,Vol.XXVIII,No.4,November2022,pp.397–413
Asnitrogenisnecessaryforplantsinthesoil,its overuseorinappropriateusecancausealeachingof excessnitrateintothesurfaceorgroundwater,leadingtoseveretoxicityduetotheformationofnitrites(Zhangetal.,2015).Nitritetendstoreactwith hemoglobinandformmethemoglobin,whichprevents oxygenfrombeingtransportedtotheentirebody.Fe shortageleadstoanemiasinceitisavitalelementof hemoglobin.Around2billionpeopletheworldover strugglewithadeficiencyofFe.Inaddition,toomuch Fecancausemetabolicandgeneticdiseases(Fraga, 2005).Zndeficiencyinitiatesnegativeeffectsonseveralofthebody’sabilities,suchastheimmunesystemresponse,thehealingofwounds,andtheability tobothsmellandtaste(Fraga,2005).Basedoncation exchangecapacity,silvernanoparticleshavebeenused toremoveheavymetalionsofPbfromwater(Khan etal.,2013).
Inrecentyears,worldadvancementhascausedenvironmentalpollution,asconcentrationsofheavymetalsinurbanareashavepassedtheiroriginalacceptable standards(Duanetal.,2018).Cd,Cu,andZnhavealteredthenatureofthesoilfromuncontaminatedconditionstotolerablycontaminatedconditions.Itwasreportedthatthespeciesoftheinhabitantplantstendto betreatedbyphytoremediationofsoilscontaminated byCd,chromium(Cr),Cu,andPb.However,other studieshavedemonstratedenvironmentalbiological toxicitywithsubstantialheavymetalsrepresentedby arsenic(As),Cr,Cu,Ni,tin,andZn(LiuandChen, 2018).Moreover,currentstudieshaveshownthatairpollutedcountriesaremorevulnerabletosuffering fromtheCOVID-19virus,whichimpliesapositiverelationshipbetweencontaminationandtheCOVID-19 virusinfectionrate(Albuquerqueetal.,2020).Itis worthwhiletomentionthatanionshavemanypositive effectsonhumanhealth,suchasbindingredblood cellsandincreasingoxygenintake,decreasingblood pressure,increasingthebloodpressurerate,andforcingthecontractionoftheheart(Imetal.,2018).Thus, itisbelievedthatanionsshouldhavenonegativeimpactsonhumanhealthandnopossiblerelationswith COVID-19.
DifferentcitiesinIraqareunderthethreatofheavy metalpollutionintheabsenceofstandardenvironmentalrulesandregulations,especiallycitieswitha highpopulation.Forexample,Baghdadhasthehighestpopulation,estimatedatalmost7millionin2011, andsuchalargepopulationisareasonfortheintensivelypooranthropogenicactivity(Demographia, 2014).Inaddition,attentiontocrudeoilwasteis requiredafterthegrowthofthepetroleumsubdivisioninthenorthernregionofIraq(Ahmedand Gulser,2019).IntheseIraqienvironments,constructionworkers,farmers,andminersareintouchwith
suchsoils,andtheirhealthisexposedtoriskatdifferentrates.Hence,theprocessofheavymetalassessment playsacrucialroleinIraqienvironmentalpollution studies.
Particulatematter(PM)isdefinedasasetofparticlesdiffusedintheairforalongenoughtimetobedispersedandtransferred.PMconsistsofinhalablecorpusclesthatproducedistinctivedestructiontohuman healthduetotheirsmallsize.ThetoxicityofPMis amplifiedsinceitcanabsorbotherconstituents,such aspolycyclicaromatichydrocarbonsandheavymetals. Hydrocarbonsareobtainedfromoilandarehighestin concentrationduringthewinterseason.Heavymetals areordinarycomponentsoftheEarth’scrust.Mostof theheavymetals(As,Cd,Cr,Pb,mercury,anduranium)aretoxic.Cardiovasculareffectsarecausedby PMandareassociatedwiththedepositionofparticlesinthelungs,wheretheirtranslocationsintothe air–bloodbarriercancausesystemicinflammation. Thus,heavymetalscanhaveastrongassociationwith COVID-19,wherebothcaninducedrasticharmtothe lungsandthreatenhumanlife.
Destroyingthehealthofhumansisthetarget forbothCOVID-19andheavymetalcontamination, wherebothworkindividuallyortogethertomaintaintheirgoal.Ininvestigatingtheconsequencesof COVID-19andheavymetalcontamination,itisobviousthatbothharmthesameordifferentportions ofthehumanbody.Mathematically,thetarget(human health)isaffectedbytheindividualorcombinedvariationofthevariables(COVID-19andheavymetalcontamination).Moreover,theeffectofincreasingoneof thevariables(COVID-19orheavymetalcontamination)andtheirimpactsonthetarget(humanhealth) canhelptheothervariableindefeatingthetarget faster.ThecomplicatedconnectionsofhumanlifeassociatedwithboththeCOVID-19virusandcontaminationcausedbydifferentheavymetalshavecreated thefocusforthisinvestigation.Inaddition,nopreviousstudieshavetriedtoexaminesuchanassessmentin Iraq.Thenoveltyofthisworkcanbeachievedbyprovidingamathematicalrelationshipbetweenconfirmed deathcasesofCOVID-19andtheindividualdistributionofheavymetalsinIraq.Themathematicalcorrelationthatisusedisderivedfromacomprehensive surveyofheavymetaldistributionsinvariousIraqi citiesintermsofconfirmeddeathcasesofCOVID-19 recordedoveraspecifictime.Hence,themainobjectiveofthisstudywastoinspecttheparalleldistributionforboththeCOVID-19virusandheavymetal contaminationinIraqicitiesdependingonavailable data.Specifically,thestudyhastriedtotesttherelationshipbetweentheCOVID-19virusandheavymetal contaminationindifferentIraqicitiesusingahierarchicalpredictiveapproach.
AssociationbetweenCovid-19andHeavyMetalPollutioninIraqiCities
Environmental&EngineeringGeoscience,Vol.XXVIII,No.4,November2022,pp.397–413 399
Table1. Allowablelimitforheavymetalconcentrationinsoil(μg/g) (EuropeanCommissionDirectorGeneralEnvironment,2010).
ElementGermanyNetherlandsSwedenUnitedStatesIreland
Cd1.00.50.41.91.0 Cr60.030.060.0150.0— Cu40.040.040.075.050.0 Hg0.50.50.30.851.0 Ni50.015.030.021.030.0 Pb70.040.040.015.050.0 Zn150.0100.0100–150140.0150.0
METHODS
StudyArea
IraqoccupiestheheartoftheMiddleEast,where Baghdadisthecapitalcitywiththehighestpopulation.Baghdadliesat33.312805latitudeand44.361488 longitude.ThetotalareaofIraqis437,072km2 and consistsof18provinces.Basedonthedataof2018, thetotalpopulationinIraqis38.43millionwithan annualgrowthrateof2.3percent.
DataCollection
Usingofficialonlinereports,thenumbersof COVID-19casesinIraqhavebeencollectedfromthe firstcaseuptoMay2,2020.Inaddition,thedetailsof confirmedcases,casespermillionforeachcity,recoveredcases,anddeathshavebeenassembled.Theprocessofheavymetalcontaminationhasincludedseveral worldwidestandards,asshowninTable1.Moreover, thedetailsofheavymetalcontaminationinallIraqi citiesaresummarizedinTable2.
RESULTSANDDISCUSSION
COVID-19Cases
TotalconfirmedCOVID-19casesfortheentirepopulationinIraquptoMay2,2020,comparedwith thetopthreecountriesintheworldareshownin Figure1a.ItisclearlyshownthatIraqhadarateof 0.004percentforthetotalconfirmedcasesperpopulation,whereasSpainhadthehighestrateof0.461 percentforthetotalconfirmedcasesperpopulation. However,boththeUnitedStatesandItalyhadalmost thesamerateofthetotalconfirmedcasesperpopulationupto0.344percent.Figure1bshowsthetotaldeathsfromCOVID-19casesintheentirepopulationinIraquptoMay2,2020,comparedwiththe topthreecountriesintheworld.ItisrevealedthatIraq hadthelowestrateoftotaldeathcasesperpopulation of0.0002percentcomparedwiththetopthreecountries.Spainhadthehighestrateofdeathsperpopulationcasesof(0.0534percent),followedbyItalyandthe
Figure1.ComparisonbetweenIraqandthetopthreecountriesin worldfor(a)confirmedcasespertotalpopulationofCOVID-19 virus,(b)deathcasespertotalpopulationofCOVID-19virus,and (c)recoverycasespertotalpopulationofCOVID-19virus.
Raheem
400 Environmental&EngineeringGeoscience
,Vol.XXVIII,No.4,November2022,pp.397–413
Table2. DatacollectionfordifferentchemicalelementsoverallofIraq.
ReferenceElement Concertation (μg/g)Remarks
Al-JaberiandAl-Dabbas (2014)
Co17.7City:Al-Basrah Cu41No.ofsamples:23
Ni119Location:sedimentsofcoastline
Pb18Methodoftesting:inductivelycoupledplasma-atomicemissionspectrometry Zn127Placeoftesting:UppsalaUniversity,Sweden
Concentration:maximumtestedvalues
Almayahietal.(2014)Cd0.88City:Al-Najaf
Co1.31No.ofsamples:12
Cr1.37Location:differentplacesinthecity
Pb3.35Methodoftesting:flameatomicabsorptionspectrophotometry
Placeoftesting:UniversityofKufa,Iraq
Concentration:maximumtestedvalues.
Benni(2014)Co39City:ThiQar. Cr418No.ofsamples:436
Cu144Location:alloverthecity
Ni494Methodoftesting:atomicabsorptionanalysis
Pb54Placeoftesting:chemicallaboratories,IraqGeologicalSurvey U2.66Concentration:maximumtestedvalues
Zn310
Othmanetal.(2014)Cd10.4City:Mosul Cu135No.ofsamples:20
Fe455.4Location:crowdedstreetsandneargenerators Mn)229.6Methodoftesting:atomicabsorptionanalysis Pb289.6Placeoftesting:MosulUniversity,Iraq Si21.8Concentration:maximumtestedvalues
Al-Hamdanietal.(2016)Cd0.54City:Kirkuk Co14.426No.ofsamples:99
Cr128.64Location:alloverthecity(onesample/km2 )
Cu76.45Methodoftesting:inductivelycoupledmassspectrometry Ni120.37Placeoftesting:LaboratoryofSoilMechanics,KirkukConstructionLab,Iraq Pb341.44Concentration:maximumtestedvalues Zn229.48
Mohammedand Abdullah(2016)
Cd4.31City:Baghdad
Cr123No.ofsamples:24
Cu82Location:variousplaces,nearnorthofeastBaghdadoilfield Ni196.5Methodoftesting:inductivelycoupledplasma-massSpectrometry
Pb31Placeoftesting:ALSGroupLabs,Spain
Zn1,080Concentration:maximumtestedvalues
Yousif(2016)Cd56.52City:Dohuk
Co56.52No.ofsamples:120
Ni82.7Location:placesnearthepavementedgesoffivedifferentzones Pb85.15Methodoftesting:Shimadzudevice,model6401F,Japan
Zn83.79Placeoftesting:ZakhoUniversity,Iraq
Concentration:maximumtestedvalues
Abood(2017)Cr93City:Diyala
Cu38No.ofsamples:28
Fe16,650Location:Differentplacesalloverthecity Ni121Methodoftesting:X-rayfluorescence
Pb93PlaceofTesting:UniversityofDiyala,Iraq
Zn240Concentration:maximumtestedvalues
TawfiqandGhazi(2017)Cd1.10City:Misan
Cr86.8No.ofsamples:28
Ni90.1Location:residential,industrial,commercial,andagriculturalzonesinthecity Pb78.7Methodoftesting:inductivelycoupledplasma-massspectrometry
Placeoftesting:UniversityofBaghdad,Iraq
Concentration:maximumtestedvalues
Al-Dabbasetal.(2018)Co18City:Al-Qadisiyah
Cu160No.ofsamples:12
Ni200Location:westernandeasternzonesinthecity
Environmental&EngineeringGeoscience,Vol.XXVIII,No.4,November2022,pp.397–413
AssociationbetweenCovid-19andHeavyMetalPollutioninIraqiCities
401
Table2. Continued.
ReferenceElement Concertation (μg/g)Remarks
Pb110Methodoftesting:X-raydiffractionandX-rayfluorescence Zn190Placeoftesting:UniversityofBaghdad,Iraq Concentration:maximumtestedvalues
Sürücüetal.(2018)Cd5.01City:Al-Sulaimaniyah Co10.21No.ofsamples:120
Cr300.6Location:threesectionsofmainroadsconnectingthecity Pb245Methodoftesting:atomicabsorptionspectrometry,PerkinElmer8800 Ni240.9Placeoftesting:UniversityofSulaimania,Iraq
Concentration:maximumtestedvalues
Ahmedand Abd-Alhameed(2019)
Cr74City:Erbil Cu85.2No.ofsamples:41
Fe6,700Location:differentlocationssurroundingthesteelcompanyinthecity Ni10.2Methodoftesting:X-rayfluorescence Pb378Placeoftesting:SalahaddinUniversity-Erbil,Iraq Zn220.4Concentration:maximumtestedvalues
Hmoodetal.(2019)Cd0.211City:Karbala Pb11.712No.ofsamples:12
Location:selectedschoolsinthecity Methodoftesting:atomicabsorptionSpectrometry Placeoftesting:UniversityofKerbala,Kerbala,Iraq Concentration:maximumtestedvalues
Khazaaletal.(2019)Cd0.201City:Al-Anbar Cr0.132No.ofsamples:100
Fe0.423Location:alongthecenterofLakeAl-Habbaniyyahinthecity Ni0.095Methodoftesting:atomicabsorptionspectrometry Pb0.602Placeoftesting:NationalResearchCouncilCanada Concentration:maximumtestedvalues
Maneaetal.(2019)As8.20City:Babil Cd11.5No.ofsamples:13
Co43Location:bothsoilandriversedimentsinthecity Cr31.6Methodoftesting:atomicabsorptionspectrometry Cu102Placeoftesting:UniversityofBaghdad,Iraq Fe3,120Concentration:maximumtestedvalues Mn74 Ni68
Pb76.5 Zn131
Al-DabbasandAbdullah (2020)
Co32.5City:SalahAl-Din Cu55.1No.ofsamples:10
Pb19.8Location:agriculturalareainthecity Zn140.8Methodoftesting:X-rayfluorescence
Placeoftesting:UniversityofBrighton,UnitedKingdom,andUniversityof Baghdad,Iraq
Concentration:maximumtestedvalues
AlSharaaetal.(2020)Cr47City:Al-Muthanna Cu42No.ofsamples:300
Ni49Location:Achemicalweaponsstoragefacilityinthecity Pb34Methodoftesting:noinformation
Zn407Placeoftesting:UniversityofTechnology,Baghdad,Iraq
Concentration:maximumtestedvalues
Issaetal.(2020)Cd2City:Wasit Co25.4No.ofsamples:18
Cr425.2Location:sedimentscoveringTigrisRiverinthecity Cu56.2Methodoftesting:X-raydiffractionandX-rayfluorescence Mn1,069Placeoftesting:UniversityofBaghdad,Iraq Mo15.8Concentration:maximumtestedvalues Ni226.6 Pb35.2 Zn190.3
Environmental&EngineeringGeoscience,Vol.XXVIII,No.4,November2022,pp.397–413
Raheem
402
Table2. Continued.
ReferenceElementConcertation(μg/g)Remarks
RemarksVariouschemical contaminants
MinimumelementcontentisNi(0.095)in Al-Anbar,whereasmaximumelement contentisFe(16500)inDiyala
City:allIraqicities
No.ofsamples:range(10–436)
Location:variouslocations,suchasresidential,industrial, commercial,agricultural,andriversediments
Methodoftesting:mainlyatomicabsorptionspectrometryand rarelyX-raydiffractionandX-rayfluorescencemethods Concentration:maximumtestedvalues
UnitedStates(0.0467percentand0.0199percent,respectively).TotalrecoveryfromCOVID-19casesinthe entirepopulationofIraquptoMay2,2020,compared withthetopthreecountriesintheworldisshownin Figure1c.AspresentedinFigure1c,Iraqhadthe lowestrecoverycasesperpopulationof0.003percent incontrasttoSpain,whichhadthehighestrecovery casesperpopulationof0.249percent.Inaddition,it isworthwhiletopointoutthattherecoverycasesper populationwere0.129percentand0.0431percentin ItalyandtheUnitedStates,respectively.
TotalconfirmedCOVID-19casesinallIraqicities uptoMay2,2020,areshowninFigure2a.Baghdad hadthehighestnumberofconfirmedcasesfollowed byAl-Najaf,Al-Basrah,Erbil,andAl-Sulaymaniyah. ConfirmedcasesinthetopIraqicitiesrangefrom384 inBaghdadto138inAl-Sulaymaniyah.Thisismainly becausethesefivecitieshaveinternationalairportsthat facilitatedtheentranceoftheviruswithlimitedhealth monitoringsystemsinsuchairports.Figure2bshows thetotalconfirmedCOVID-19casespermillionofthe citypopulationinallIraqicitiesuptoMay2,2020. ThehighestrateforthetotalconfirmedCOVID-19 casespermillionofthecitypopulationwasinAlNajaf(upto216),whereasthelowestratewasrecorded inAl-Anbar.Inaddition,DohukandAl-Basrahare thetwocitieswithnoreportednumbersforthetotalconfirmedCOVID-19casespermillionofthecity population.ItissignificanttorecognizethatAl-Najaf isacrowdedplacesinceitholdsanimportantIslamic shrine.Figure2creportsthetotalrecoveredCOVID19casesinallIraqicitiesuptoMay2,2020.AlNajafhadthehighestnumberofrecoveredcases(270), whileSalahal-Dinhadthelowest(1).Totaldeathsof COVID-19casesinallIraqicitiesduringthestudyperiodarereportedinFigured.Baghdadhadthehighest numberdeaths(30),followedbyAl-Basrah,Al-Najaf, andKarbala(17,6,and6,respectively).
HeavyMetalContamination
Forheavymetalrepresentation,theobtaineddata fromTable2havebeendrawnfromalloverthe
country.ThedistributionofCdindifferentIraqicities isshowninFigure3a.Basedonthecollecteddata,DohukhasthehighestCdcontentwithaconcentrationof 56.52 µg/g(61percentofthetotalCdconcentrationin allIraqicities).ThemainreasonforthehighCdconcentrationinDohukisattributedtotherecentworkof oilcompanieswithinadequateobligationstoenvironmentalrules.TheaveragereportedCdconcentration foranareawithcoalpowerplantsis0.06 µg/g,which ismuchlowerthanthatformostIraqicities(Okedeyi etal.,2014).Thus,morelimitationsandregulations shouldbeappliedtominimizetheincreaseofCdconcentrationinIraqicities.
Similarly,thedistributionsofCrandCuarereportedinFigure3bandc,respectively.ItcanbenoticedthatWasit,ThiQar,andAl-Sulaimaniyahare thetopthreeIraqicities,withCrconcentrationsof 425.2 µg/g,418 µg/g,and300.6 µg/g,respectively. TheconsecutiveCrconcentrationsinWasit,ThiQar, andAl-Sulaimaniyahrepresent25percent,24percent, and17percentofthetotalCrconcentrationinall Iraqicities.Inaddition,itcanbeobservedthatAlQadisiyah,ThiQar,andMosularethetopthreeIraqi cities,withCuconcentrationsof160 µg/g,144 µg/g, and135 µg/g,respectively.TheconsecutiveCuconcentrationsinAl-Qadisiyah,ThiQar,andMosulrepresent16percent,14percent,and13percentofthetotalCuconcentrationinallIraqicities.TheaveragereportedCrandCuconcentrationsforanareawithcoal powerplantsare63.27 µg/gand56.15 µg/g,respectively(Okedeyietal.,2014).Also,therecordedCrand CuconcentrationsinIraqicitiesarehigherthanthe reportedvalues.Hence,topreventanyupcomingenvironmentalcatastrophe,IraqiauthoritiesshouldcontroltheincreaseofbothCrandCuconcentrations.
ThedistributionsofNi,Pb,andZnareshownin Figure4a,b,andc,respectively.Itcanbeseenthat Al-Sulaimaniyah,Wasit,andAl-Qadisiyaharethetop threeIraqicities,withaNiconcentrationsof240.9 µg/g,226.6 µg/g,and200 µg/g,respectively.TheconsecutiveNiconcentrationsinAl-Sulaimaniyah,Wasit,andAl-Qadisiyahrepresent12percent,11percent, and10percentofthetotalNiconcentrationinall
AssociationbetweenCovid-19andHeavyMetalPollutioninIraqiCities
Environmental&EngineeringGeoscience,Vol.XXVIII,No.4,November2022,pp.397–413 403
Figure2.Mapdistributionof(a)confirmedCOVID-19casesinallIraqicities,(b)confirmedCOVID-19casespermillionofcitypopulation inallIraqicities,(c)recoveredCOVID-19casesinallIraqicities,and(d)deathcasesofCOVID-19inallIraqicities.
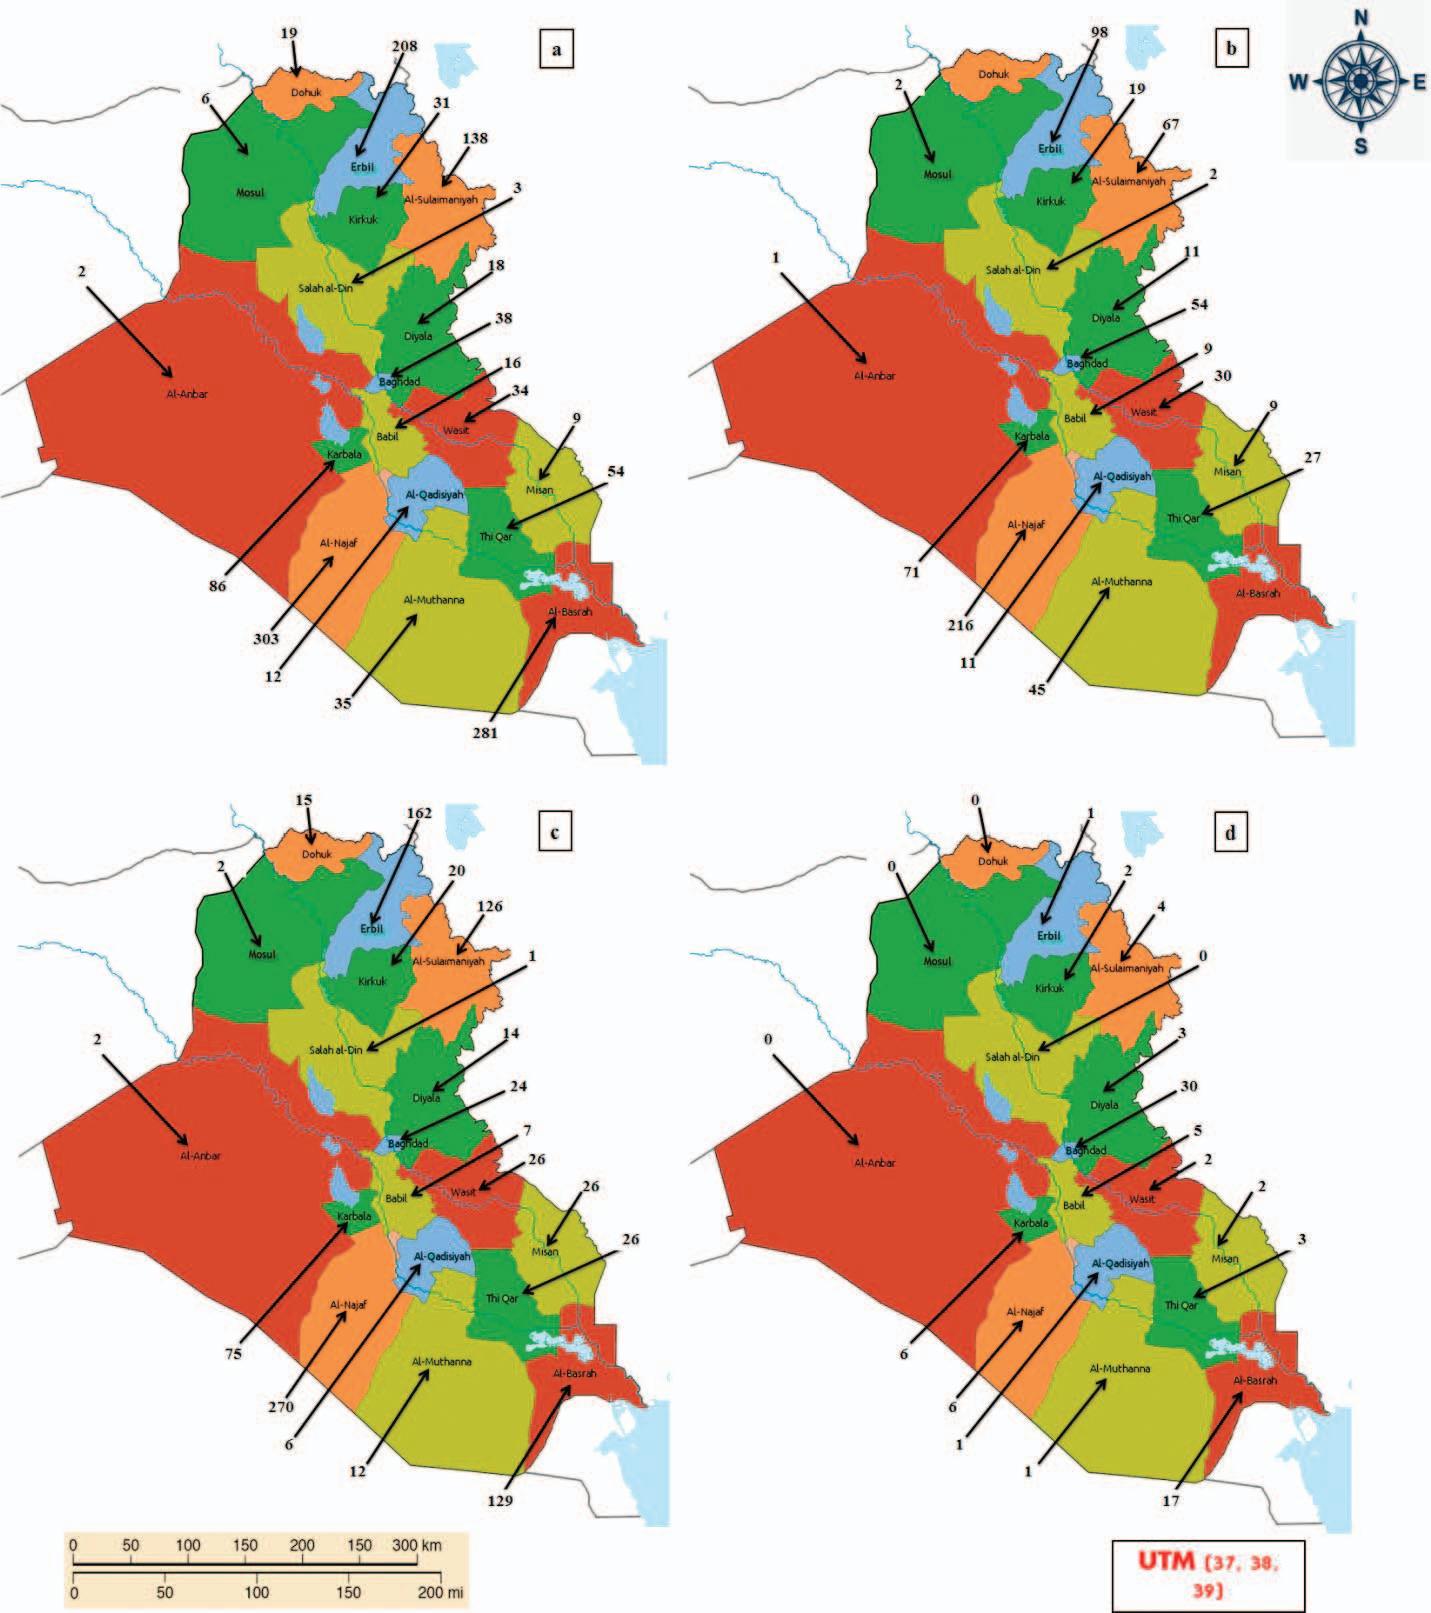
Raheem
404 Environmental&EngineeringGeoscience,Vol.XXVIII,No.4,November2022,pp.397–413
Figure3.Mapdistributionofvariouschemicalelements(μg/g)in differentIraqicities:(a)Cd,(b)Cr,and(c)Cu.
Figure4.Mapdistributionofvariouschemicalelements(μg/g)in differentIraqicities:(a)Ni,(b)Pb,and(c)Zn.

Environmental&EngineeringGeoscience,Vol.XXVIII,No.4,November2022,pp.397–413

AssociationbetweenCovid-19andHeavyMetalPollutioninIraqiCities
405
Iraqicities.Inaddition,itcanbeobservedthatErbil, Kirkuk,andMosularethetopthreeIraqicities,witha Pbconcentrationof378 µg/g,341.44 µg/g,and289.6 µg/g,respectively.TheconsecutivePbconcentrations inErbil,Kirkuk,andMosulrepresent20percent,18 percent,and15percentofthetotalPbconcentration inallIraqicities.Moreover,Baghdad,Al-Muthanna, andThiQararethetopthreeIraqicities,withZnconcentrationsof1,080 µg/g,407 µg/g,and310 µg/g,respectively.TheconsecutiveZnconcentrationsinBaghdad,Al-Muthanna,andThiQarrepresent32percent, 12percent,and9percentofthetotalZnconcentration inallIraqicities.TheaveragereportedNi,Pb,andZn concentrationsforanareawithcoalpowerplantsare 31.79 µg/g,52.05 µg/g,and86.49 µg/g,respectively (Okedeyietal.,2014).Inaddition,therecordedNi,Pb, andZnconcentrationsinIraqicitiesarehigherthan thereportedvalues.ThecurrentNi,Pb,andZnconcentrationsportendanupcomingenvironmentaldisasterinIraq.
Acomparisonbetweentheheavymetaldistributionwithupperandlowerallowablestandardlimits hasbeeninvestigated.ThevariationofCddistribution comparedwithstandardallowablelimitsisshownin Figure5a.ItisclearlyshownthatplacessuchasDohuk,Babil,andMosulhaveCdconcentrationshigher thantheallowableupperlimit.TheCdconcentration ratehasexceededtheallowableupperlimitby30,6, and5timesinDohuk,Babil,andMosul,respectively.
Similarly,thevariationofCrdistributioncompared withstandardallowablelimitsisshowninFigure5b. ItisindicatedthatcitiessuchasWasit,ThiQar,and Al-SulaimaniyahhaveCrconcentrationshigherthan theallowableupperlimit.TheCdconcentrationrate hasexceededtheallowableupperlimitbyalmost3,3, and2timesinWasit,ThiQar,andAl-Sulaimaniyah, respectively.
ThevariationofCudistributioncomparedwith standardallowablelimitsisshowninFigure5c.SeveralIraqicitieshaveexceededtheallowableupper limit,suchasThiQar,Mosul,Kirkuk,Baghdad,AlQadisiyah,Erbil,andBabil.ItisnoticeablethatAlQadisiyah,ThiQar,andMosulhavethehighestCu concentrationscomparedtootherIraqicities.TheCu concentrationratehasexceededtheallowableupper limitbyalmost2,1.9,and1.8timesinAl-Qadisiyah, ThiQar,andMosul,respectively.
ThevariationofNidistributioncomparedwith standardallowablelimitsisreportedinFigure5d. MostofthecitieshaveNiconcentrationshigherthan theupperallowablelimit,whereThiQarhadthehighestNiconcentrationexceedingtheupperallowable limitby9.9times.Inaddition,Al-Sulaimaniyahand WasithaveexceededtheNiallowableupperlimitby 4.8and4.5times,respectively.
ThevariationofPbdistributioncomparedwith standardallowablelimitsisshowninFigure5e.Allthe IraqicitieshaveaPbconcentrationwithdifferentrates, wherenineofthecitieshavePbconcentrationshigher thantheallowableupperlimit.ItcanbeseenthatErbil,Kirkuk,andMosularethetopthreeIraqicities thatexceededthePballowableupperlimitbyalmost 5.4,4.9,and4.1times,respectively.
ThevariationofZndistributioncomparedwith standardallowablelimitsisshowninFigure5f.Eight IraqicitieshaveaZnconcentrationhigherthanthe allowableupperlimit.ItcanbeseenthatBaghdad,Al-Muthanna,andThiQararethetopthree IraqicitiesthatexceededtheZnallowableupper limit.TheZnconcentrationratehasexceededthe allowableupperlimitbyalmost7.2,2.7,and2.1 timesinBaghdad,Al-Muthanna,andThiQarcities, respectively.
Asanoverallassessment,differentIraqicitieshave variouslevelsofheavymetalcontamination.Itis worthwhiletomentionthatDiyalahadthehighestFe concentrationof16,650 µg/g,anditisclearlysummarizedinTable2.
RelationbetweenCOVID-19andHeavyMetal Contamination
Basedonthereportedinformationregardingboth COVID-19andheavymetaldistribution,asuitablehierarchicalpredictivestatisticalmodelhasbeenproposed.Thismodelisbasedonthefactthattheincreaseinheavymetalcontaminationcanincreasethe rateofdeathresultingfromreducedhumanbodyresistance.Similarly,COVID-19exhibitsthesametrendin termsofweakeningthehumanbody’sresistance.The target(humanhealth)ismathematicallyaffectedby theindividualorcombinedvariationofthevariables (COVID-19andheavymetalcontamination).Furthermore,increasingoneofthevariables(COVID-19or heavymetalcontamination)anditsimpactonthetarget(humanhealth)canaidtheothervariableindefeatingthetargetmorequickly.Hence,alinearaccumulativehierarchicalstatisticalmodelhasbeenproposed assumingthattheaccumulativeconfirmedordeath COVID-19casesarelinearlyproportionedtotheaccumulativeheavymetalconcentration.Theproposed modelhasthefollowingform: (Conf Cases )i (Conf Cases ) (% ) = A + B
(HeavyMetalConcentration )i (HeavyMetalConcentration ) (% ) (1) where (Conf. Cases)i istheaccumulativesumof confirmedcasesofCOVID-19, (Conf. Cases)isthe
Raheem
406 Environmental&EngineeringGeoscience
∗
,Vol.XXVIII,No.4,November2022,pp.397–413
totalsumofconfirmedcasesofCOVID19, A and B are arbitraryconstants, (HeavyMetalConcentration)i istheaccumulativesumofaspecificheavymetalconcentration,and (HeavyMetalConcentration)isthe totalsumofaspecificheavymetalconcentration.
Asimilarproposedstatisticalmodelcanbeapplied fordeathcasesofCOVID-19.Thestatisticalmodelfor

AssociationbetweenCovid-19andHeavyMetalPollutioninIraqiCities
μ
Figure5.Barchartcomparisonbetweenvariouschemicalelementdistributions(
g/g)withupperandlowerstandardlimitsinseveralIraqi cities:(a)Cd,(b)Cr,(c)Cu,(d)Ni,(e)Pb,and(f)Zn.
(Deaths
(Deaths )
= A + B ∗ (HeavyMetalConcentration
407
deathcasesofCOVID-19isasfollows:
)i
(% )
)i (HeavyMetalConcentration ) (% ) (2) Environmental&EngineeringGeoscience,Vol.XXVIII,No.4,November2022,pp.397–413
Table3. Statisticalmodelparameters(Eqs.1–3).
ConfirmedCasesCOVID-19(Eq.1)DeathCasesofCOVID-19(Eq.2)
HeavyMetalTypeABR2 ABR2
Cd32.50.650.8415.130.800.83 Cr17.40.960.899.151.090.81 Cu16.20.880.9119.30.880.84 Ni7.960.950.9116.520.900.86 Pb28.860.700.9527.50.730.90 Zn21.160.850.9725.060.850.94
where (Deaths)i istheaccumulativesumofthe deathsofCOVID-19and (Deaths)isthetotalsum ofthedeathsofCOVID-19.
Theaccuracyofthesuggestedstatisticalmodels (Eqs.1and2)hasbeenevaluateddependingonthe coefficientofdetermination(R2 ).Thecoefficientofdetermination(R2 )isdefinedasfollows: R2 = ⎛ ⎝ i (xi x )(yi y ) i (xi x )2 i (yi y )2 ⎞ ⎠ 2 (3)
where yi istheactualvalue, xi isthepredictedvalue fromthestatisticalmodel, y isthearithmeticmeanof theactualvalues,and x isthearithmeticmeanofcalculatedvalues.
AlltheproposedstatisticalmodelshavebeenvalidatedusingthereportedIraqiCOVID-19datawith thevariousheavymetalconcentrationsindifferent Iraqicities.Severalrandomvariations(gradualincrease)wereinvestigatedforbothCOVID-19cases andheavymetalconcentrations,andthebestdistributionwiththehighestR2 waschosen.Thevariationsof COVID-19withCdconcentrationforconfirmedand deathcasesareshowninFigure6aandb.Inaddition, themodelparametersforconfirmedanddeathcases concerningallheavymetalvariationsaresummarized inTable3.Itisclearlyshownthattheproposedstatisticalmodelshavepredictedthevariationsofconfirmed anddeathcasesverywellwithavalueof(R2 )reaching 0.84(Table3).FromFigure6candd,thevariations oftheCOVID-19withCrconcentrationforconfirmed anddeathcasesbecomeclear.Thesuggestedstatisticalmodelshavepredictedthevariationsofconfirmed anddeathcasesverywellwithamaximumvalueofR2 of0.89(Table3).Similarly,thevariationsofCOVID19confirmedanddeathcaseswithCu,Ni,Pb,and ZnconcentrationsappearinFigures6eandf,7aand b,7candd,and7eandf,respectively.Theproposed statisticalmodelshavepredictedthevariationsofconfirmedanddeathcasesverywell,andthisistrueforall thevariousheavymetalconcentrations.Themaximum
obtainedR2 forthevariationswithCu,Ni,Pb,andZn were0.91,0.91,0.95,and0.97,respectively.
Basedontheresultsoftheproposedstatisticalmodels,thereisapositivelinearrelationshipbetweenconfirmedanddeathCOVID-19caseswiththedifferent typesofheavymetaldistribution.Thisindicatesthat increasinganytypeofheavymetalconcentrationbeyondtheallowableupperlimitmayresultinincreasing COVID-19confirmedanddeathcases.
RegardingbothCOVID-19victimsandheavymetal contaminationdistribution,severalIraqicitiesmight beunderarealthreatofsuchsevereheavymetalpollution,whichhasharsherconsequencesthanCOVID-19 virus.Inaddition,thedistributionofheavymetalcontaminationwouldweakenthehumanimmunesystem, andthismightreflectanincreaseofCOVID-19cases insuchplacesinshort-orlong-termevaluations.
CONCLUSIONS
Inthisstudy,theeffectsofbothCOVID-19and heavymetaldistributioninallIraqicitiesuptoMay 2,2020,havebeeninvestigated.Ontheonehand,the detailsofconfirmedandrecoveredcaseswithtotal deathsinallIraqicitieshavebeeninspected.Onthe otherhand,theheavymetalcontaminationinallIraqi citieshasbeenstudiedusingthevariousavailableliterature.Inaddition,thestudyhassuggestedalinearstatisticalrelationshiptocorrelateconfirmedanddeath COVID-19caseswithdifferentheavymetalconcentrations.Ingeneral,thestudyhasrevealedthefollowing:
1.Uptothestudieddate,thetotalnumberofIraqi COVID-19confirmedcasesperpopulationwas 0.004percentcomparedto0.461percentinSpain (thehighestrateintheworld).
2.Uptothedateofthisstudy,Iraqhadthelowestrate oftotaldeathcasesperpopulation(0.0002percent) comparedwiththetopthreecountriesintheworld, whereasSpainhadthehighestrate(0.0534percent).
3.Forheavymetalcontamination,Dohukhadthe highestCdcontent(56.52 µg/g;61percentofthe
Raheem
408 Environmental&EngineeringGeoscience,Vol.XXVIII,No.4,November2022,pp.397–413
Figure6.HierarchicalmodelpredictionforthevariationofCOVID-19withdifferentchemicalelementsfor(a)Cd-confirmedcases,(b) Cd-deathcases,(c)Cr-confirmedcases,(d)Cr-deathcases,(e)Cu-confirmedcases,and(f)Cu-deathcases.
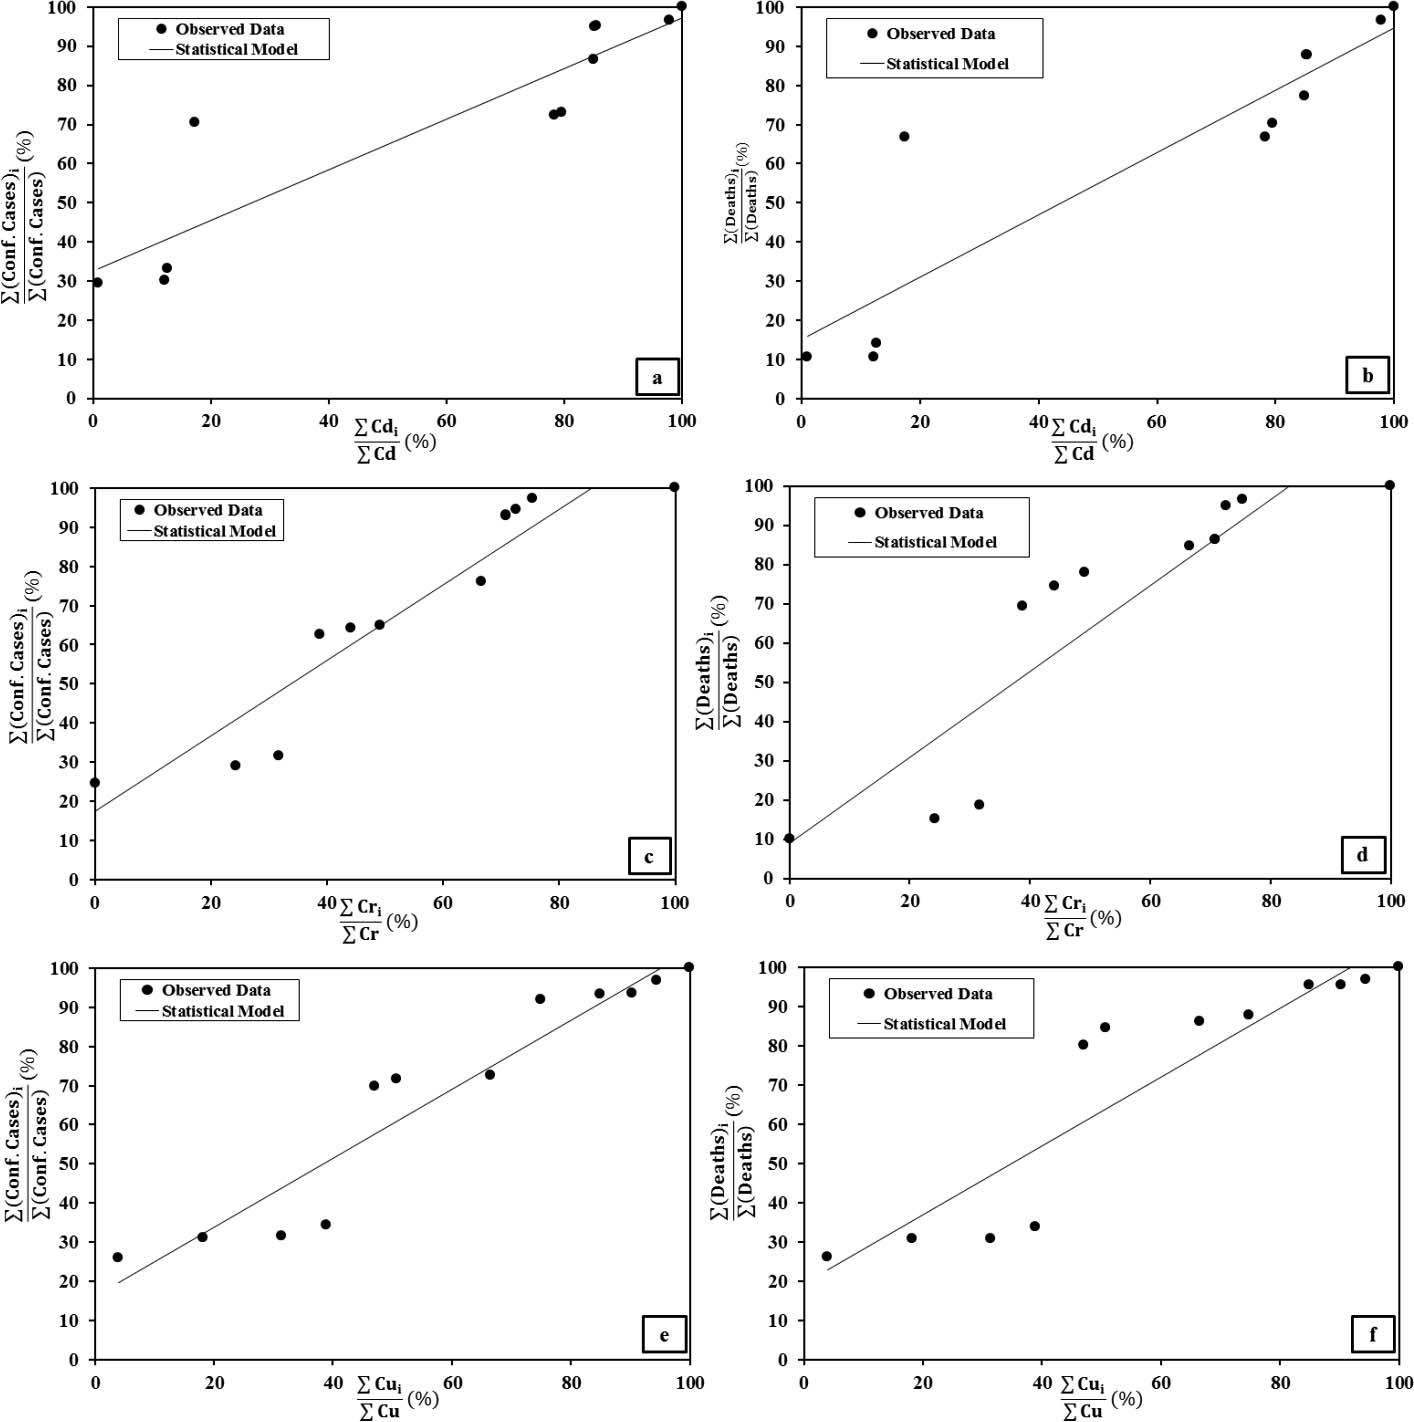
totalconcentrationinallIraqicities),whileWasit showedthehighestCrconcentration(425.2 µg/g; 25percentofthetotalconcentrationinallIraqi cities).
4.TheextremecontentsofCu,Ni,Pb,andZnare concentratedinAl-Qadisiyah,Al-Sulaimaniyah, Erbil,andBaghdad,withlimitsof160 µg/g, 240.9 µg/g,378 µg/g,and1,080 µg/g,respectively.
5.InvariousIraqicities,thelevelsofheavymetalcontaminationfordifferentchemicalelementshaveexceededtheupperallowableworldlimits.wherethe maximumratewasforCdcontentinDohuk,exceedingtheallowableupperlimitby30times.
6.Basedontheproposedstatisticalmodel,thereisa linearpositiverelationshipforboththeconfirmed rateandthedeathrateofCOVID-19caseswith
AssociationbetweenCovid-19andHeavyMetalPollutioninIraqiCities
409
Environmental&EngineeringGeoscience,Vol.XXVIII,No.4,November2022,pp.397–413
Figure7.HierarchicalmodelpredictionforthevariationofCOVID-19withdifferentchemicalelementsfor(a)Ni-confirmedcases,(b)Nideathcases,(c)Pb-confirmedcases,(d)Pb-deathcases,(e)Zn-confirmedcases,and(f)Zn-deathcases.
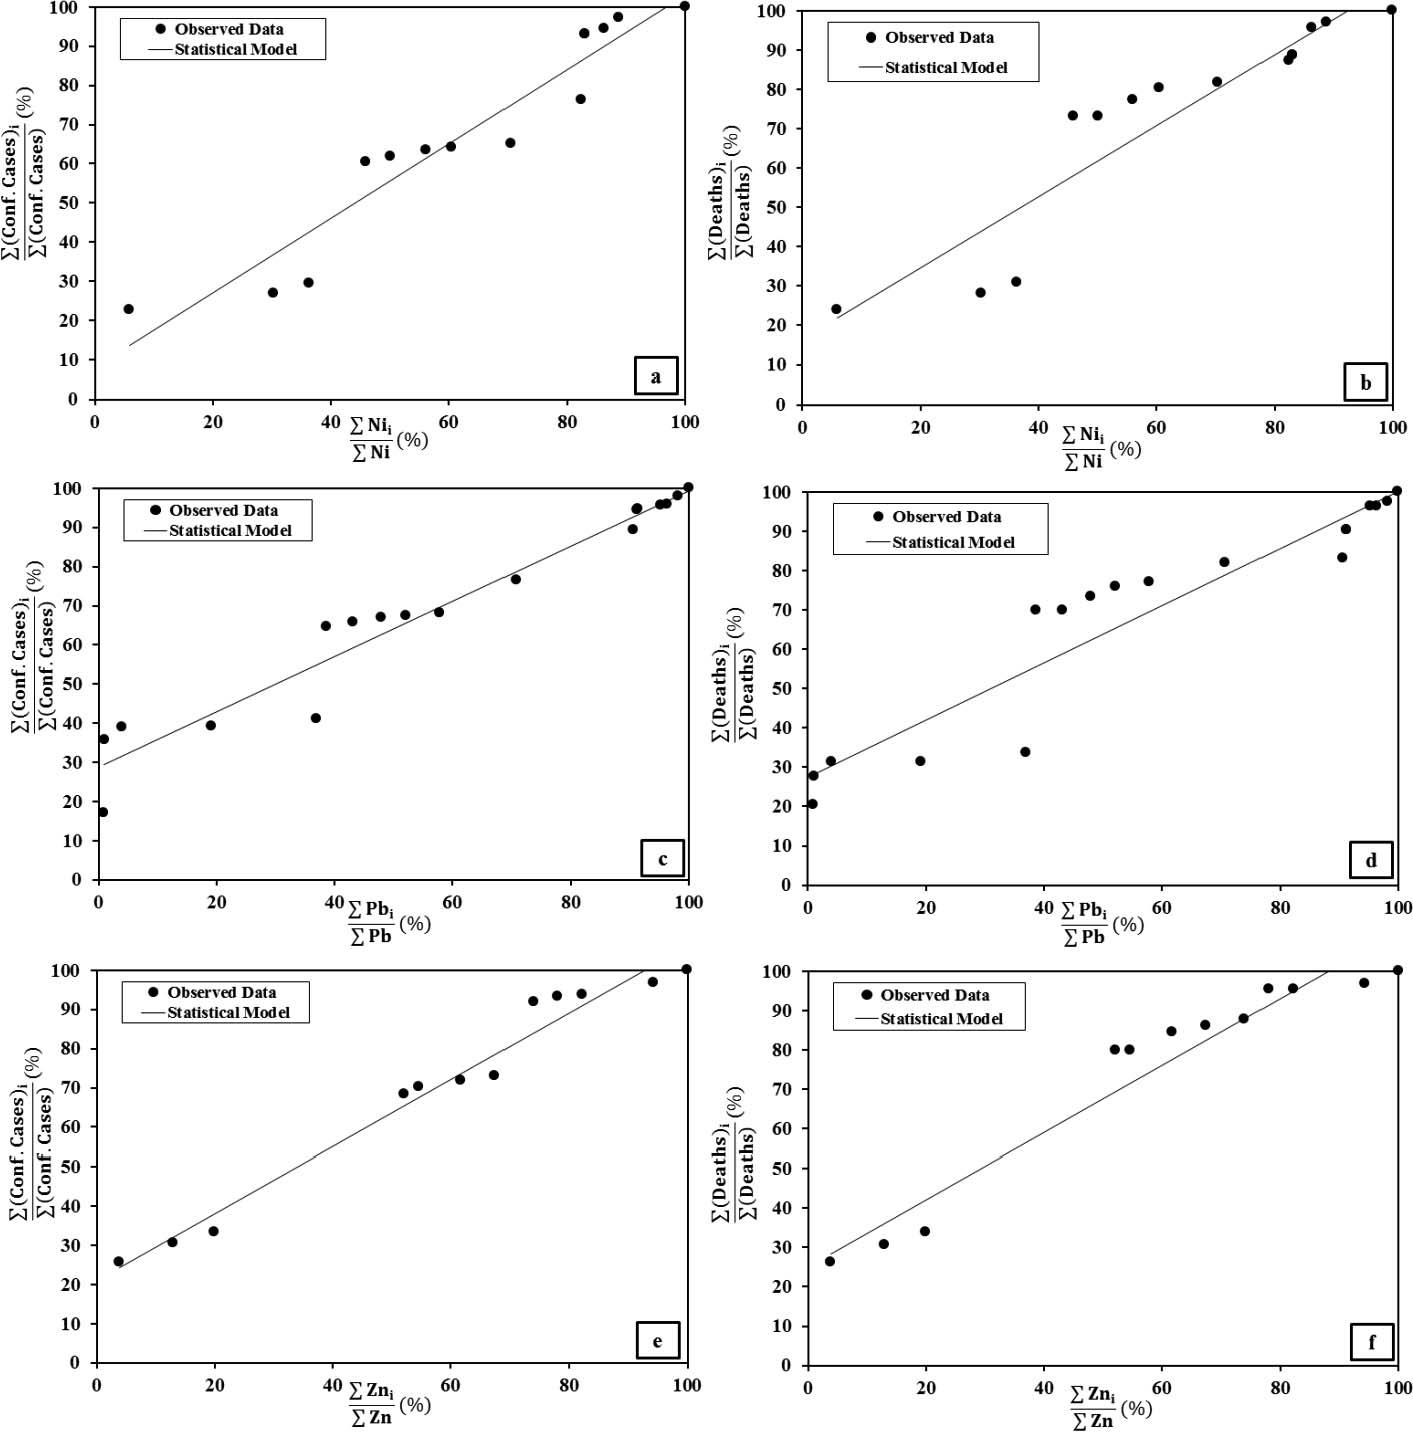
differentlevelsofheavymetalcontaminationwith amaximumR2 valueof0.97.
DISCLAIMER
Itisherebydeclaredthatthisarticlehasnoconflict ofinterest.DatafromofficialIraqisourceshavebeen used.
REFERENCES
Abood,I.J.,2017, MathematicalModelingtoEvaluationtheSoil ContaminationbyHeavyMetalsinDiyalaGovernorate:M.Sc. Thesis,UniversityofBaghdad.
Ahmed,A.N.andGulser,F.,2019,Industrycausedheavymetal pollutioninthesoilsofnorth-Iraq: FreseniusEnvironmental Bulletin,Vol.28,pp.1057–1064.
Ahmed,I.T.andAbd-Alhameed,M.M.,2019,Spatialdistributionofheavymetalsinsurfacesoilhorizonssurrounding 410 Environmental&EngineeringGeoscience,Vol.XXVIII,No.4,November2022,pp.397–413
Raheem
ErbilSteelCompany(ESC)areas:ZANCO JournalPureAppliedSciences,Vol.31,No.3,pp.32–38.http://dx.doi.org/ 10.21271/ZJPAS.31.3.5
AlSharaa,H.M.J.;AlObaidy,A.M.J.;andZiboon, A.T.,2020,Assessmentofheavymetalcontaminationin thesoilofAl-Muthannastoragesiteusinggeospatialtechniques: IOPConferenceSeries:MaterialsScienceEngineering, 012218,pp.737–744.http://dx.doi.org/doi:10.1088/1757899X/737/1/012218
Albuquerque,T.T.D.A.;Santos,J.M.;andAndrade,M. D.F.,2020,Urbanairquality,climate,andpollution: Frommeasurementtomodelingapplications: EnvironmentalSciencePollutionResearch,Vol.27,pp.35873–35874, https://doi.org/10.1007/s11356-020-09336-5
Al-Dabbas,M.A.andAbdullah,M.A.,2020,Assessmentof soilpollutionintheIshaqiprojectarea,SalahAl-Deangovernorate,Iraq: IraqiJournalScience,Vol.61,No.2,pp.382–388. https://doi.org/10.24996/ijs.2020.61.2.16
Al-Dabbas,M.A.;Mahdi,K.H.;Al-Khafaji,R.;andObayes, K.H.,2018,HeavymetalscharacteristicsofsettledparticlesofstreetsdustfromDiwaniyahcity, Qadisiyahgovernorate,southernIraq:IOPConferenceSeries:JournalPhysics, 1003,012023.https://doi.org/10.1088/1742-6596/1003/1/ 012023
Al-Hamdani,J.A.J.;Awadh,S.M.;andIbrahim,O.S.,2016, Geochemicalpartitioningofheavymetalsintheurbansoil, Kirkuk,Iraq: IraqiGeologicalJournal,Vol.39–49,No.1, pp.1–24.
Al-Jaberi,M.H.A.andAl-Dabbas,M.A.,2014,Assessment ofheavymetalspollutioninthesedimentsofIraqicoastlines: InternationalJournalScientificResearch,Vol.3,No.9, pp.455–459.
Al-Janabi,Z.Z.;Zaki,S.R.;Alhassany,J.S.;Al-Obaidy,A. M.J.;Awad,E.S.;andMaktoof,A.A.,2019,Geochemicalevaluationofheavymetals(Cd,Cr,Fe,andMn)insedimentofShattAl-Basrah, Iraq:EngineeringandTechnology Journal,Vol.37C,No.2,pp.237–241.http://dx.doi.org/ 10.30684/etj.37.2C.6
Almayahi,B.A.;Hakeem,E.;Alduhaidahawi,F.J.;and Aqeela,H.,2014,Heavymetalsconcentrationindifferentsoil samplesinNajafcity,Iraq: InternationalJournalEngineering TrendsTechnology,Vol.16,No.2,pp.69–71.
Asiri,A.M.;Hussain,M.M.;Arshad,M.N.;andRahman, M.M.,2018,Sensitiveandselectiveheavymetalion, Mn2+ sensordevelopmentbasedonthesynthesized(E)N chlorobenzylidene-benzenesulfonohydrazide(CBBSH) moleculesmodifiedwithnafionmatrix: JournalIndustrial EngineeringChemistry,Vol.63,pp.312–321.doi:https://doi. org/10.1016/j.jiec.2018.02.032
Awual,M.R.;Hasan,M.M.;Rahman,M.M.;andAsiri, A.M.,2019,Novelcompositematerialforselectivecopper(II)detectionandremovalfromaqueousmedia: Journal MolecularLiquids,Vol.283,pp.772–780.https://doi.org/ 10.1016/j.molliq.2019.03.141
Balabanova,B.;Stafilov,T.,Šajn,R.andAndonovska,K. B.,2017,Quantitativeassessmentofmetalelementsusing mossspeciesasbiomonitorsindownwindareaoflead-zinc mine: JournalEnvironmentalScienceHealth,PartA,Vol. 52,No.3,pp.290–301.https://doi.org/10.1080/10934529. 2016.1253403
Bashir,M.F.;Ma,B.;Bilal;Komal,B.;Bashir,M. A.;Tan,D.;andBashir,M.,2020,CorrelationbetweenclimateindicatorsandCOVID-19pandemicinNew York,USA: ScienceTotalEnvironment,Vol.728,138835. https://doi.org/10.1016/j.scitotenv.2020.138835.
Benni,T.J.,2014,DistributionofsomeheavymetalsintherecentsedimentsofAl-Nasiriyaarea,Mesopotamiaplain,south Iraq: IraqiBulletinGeologyMining,Vol.10,No.1,pp.73–93.
Cairns,S.;Robertson,I.;Sigmund,G.;andPerrott,A.S., 2020,Theremovaloflead,copper,zincandcadmiumfrom aqueoussolutionbybiocharandamendedbiochars: EnvironmentalSciencePollutionResearch,Vol.27,pp.21702–21715. https://doi.org/10.1007/s11356-020-08706-3
Cano,J.V.F.;Ramos,R.L.;Barron,J.M.;Coronado,R. M.G.;Piña,A.A.;andDelgado,G.J.L.,2013,SorptionmechanismofCd(II)fromwatersolutionontochicken eggshell: AppliedSurfaceScience,Vol.276,pp.682–690. https://doi.org/10.1016/j.apsusc.2013.03.153
Ceylan,Z.,2020,EstimationofCOVID-19prevalenceinItaly, Spain,andFrance: ScienceTotalEnvironment,Vol.729, 138817.https://doi.org/10.1016/j.scitotenv.2020.138817
Clement,A.Y.;Patrick,S.U.E.;andDaniel,A.A.,2020, RiskanalysisandhotspotsdetectionofSARS-CoV-2inNigeriausingdemographicandenvironmentalvariables:Anearly assessmentoftransmissiondynamics: InternationalJournal ofEnvironmentalHealthResearch,Vol.32,pp.1111–1122. https://doi.org/10.1080/09603123.2020.1834080
Demographia,2014, DemographiaWorldUrbanAreas (WorldAgglomerations):10thAnnualEdition:Demographia,USA.
Duan,Z.;Wang,J.;Cai,X.;Xuan,B.;Hu,F.;andWang,K., 2018,Spatialdistributioncharacteristicsandassessmentof heavymetalsinurbansoilofGuiyangcity,China: Fresenius EnvironmentalBulletin,Vol.27,pp.567–573.
Duffus,J.H.,2002,“Heavymetals”—Ameaninglessterm?: Pure AppliedChemistry,Vol.74,pp.793–807.https://doi.org/ 10.1351/pac200274050793
El-Sayed,A.andKamel,M.,2020,Climaticchangesandtheir roleinemergenceandre-emergenceofdiseases: EnvironmentalSciencePollutionResearch,Vol.27,pp.22336–22352. https://doi.org/10.1007/s11356-020-08896-w
EuropeanCommissionDirectorGeneralEnvironment,2010, Heavymetalsandorganiccompoundsfromwastesusedas organicfertilizers:FinalReportJuly.WPAConsultingEngineersInc.Ref.No.TEND/AML/2001/07/20,pp.73–74. http://ec.europa.eu/environment/waste/compost/pdf/hm_ finalreport.pdf
Fraga,C.G.,2005,Relevance,essentialityandtoxicityoftrace elementsinhumanhealth: MolecularAspectsMedicine,Vol. 26,pp.235–244.https://doi.org/10.1016/j.mam.2005.07.013
Green,H.;Broun,P.;Cakmak,I.;Condon,L.;Fedoroff,N.; Gonzalez,V.J.;Graham,I.;Lewis,J.;Moloney,M.;Oniang’o,R.K.;Sanginga,N.;Shewry,P.;andRoulin, A.,2016,Plantingseedsforthefutureoffood: Journal ScienceFoodAgriculture,Vol.96,No.5,pp.1409–1423. https://doi.org/10.1002/jsfa.7554
Guo,K.;Han,F.X.;Kingery,W.;Sun,H.;andZhang, J.,2016,Developmentofnovelnanomaterialsforremediationofheavymetalsandradionuclidesincontaminated water: NanotechnologyEnvironmentalEngineering,Vol.1,7. https://doi.org/10.1007/s41204-016-0008-1
Hadia,E.F.andAhmed,A.,2018,Heavymetalpollution— Aminireview: JournalBacteriologyMycology:OpenAccess,Vol.6,No.3,pp.179–181.https://doi.org/10.15406/ jbmoa.2018.06.00199
Hmood,A.N.;Alhesnawi,A.;Hameed,A.S.;andAshour,N. I.,2019,Assessmentofthenaturalradioactivityandconcentrationsofsomeheavyelementsinthedustofsome schoolsinKarbala,Iraq: IranianJournalMedicalPhysics,Vol. 16,pp.280–284.https://doi.org/10.22038/ijmp.2018.33977. 1425
AssociationbetweenCovid-19andHeavyMetalPollutioninIraqiCities
Environmental&EngineeringGeoscience
411
,Vol.XXVIII,No.4,November2022,pp.397–413
Holshue,M.L.;DeBolt,C.;Lindquist,S.;Lofy,K.H.;Wiesman,J.;Bruce,H.;Spitters,C.;Ericson,K.;Wilkerson,S.; Tural,A.;Diaz,J.;Cohn,A.;Fox,L.;Patel,A.;Gerber,S. I.;Kim,L.;Tong,S.;Lu,X.;Lindstrom,S.;Pallansch,M. A.;Weldon,W.C.;Biggs,H.M.;Uyeki,T.M.;andPillai, S.K.,2020,Firstcaseof2019novelcoronavirusintheUnited States: NewEnglandJournalMedicine,Vol.382,pp.929–936. https://doi.org/10.1056/NEJMoa2001191.
Im,J.H.;Park,T.G.;Goh,S.;andYu,J.H.,2018,The effectsoftheanionclothesonhumanbodychangein youngadults: Neurotherapy,pp.19–24.http://dx.doi.org/ 10.17817/2018.01.26.111237
Issa,M.J.;Al-Obaidi,B.S.;andMuslim,R.I.,2020,Evaluationofsometraceelementspollutioninsedimentsof theTigrisriverinWasitgovernorate,Iraq: BaghdadScienceJournal,Vol.17,No.1,pp.9–22.http://dx.doi.org/ 10.21123/bsj.2020.17.1.0009
Jankaite,A.,2009,Soilremediationfromheavymetalsusingmathematicalmodelling: JournalEnvironmentalEngineeringLandscapeManagement,Vol.17,No.2,pp.121–129. https://doi.org/10.3846/1648-6897.2009.17.121-129
Khan,A.;Asiri,A.M.;Rub,M.A.;Azum,N.;Khan,A. A.P.;Khan,S.B.;Rahman,M.M.;andKhan,I., 2013,Synthesis,characterizationofsilvernanoparticleembeddedpolyanilinetungstophosphate-nanocompositecation exchangeranditsapplicationforheavymetalselective membrane: Composites:PartB,Vol.45,pp.1486–1492. http://dx.doi.org/10.1016/j.compositesb.2012.09.023
Khan,M.H.R.;Liu,J.;Liu,S.;Li,J.;Cao,L.;andRahman,A., 2020b,AnthropogeniceffectonheavymetalcontentsinsurfacesedimentsoftheBengalBasinriversystem,Bangladesh: EnvironmentalSciencePollutionResearch,Vol.27,pp.19688–19702.https://doi.org/10.1007/s11356-020-08470-4
Khan,R.;Saxena,A.;andShukla,S.,2020a,Evaluationof heavymetalpollutionforRiverGomti,inpartsofGanga AlluvialPlain,India: SNAppliedSciences,Vol.2,1451. https://doi.org/10.1007/s42452-020-03233-9
Khan,R.;Saxena,A.;andShukla,S.,2021b,Assessment oftheimpactofCOVID-19lockdownontheheavy metalpollutionintheRiverGomti,Lucknowcity,Uttar Pradesh,India:EnvironmentalQualityManagement,pp.1–9. https://doi.org/10.1002/tqem.21746
Khan,R.;Saxena,A.;Shukla,S.;Sekar,S.;andGoel,P.,2021c, EffectofCOVID-19lockdownonthewaterqualityindex ofRiverGomti,India,withpotentialhazardoffaecal-oral transmission: EnvironmentalSciencePollutionResearch,Vol. 28,pp.33021–33029.https://doi.org/10.1007/s11356-02113096-1
Khan,R.;Saxena,A.;Shukla,S.;Sekar,S.;Senapathi,V.; andWu,J.,2021a,Environmentalcontaminationbyheavy metalsandassociatedhumanhealthriskassessment:Acase studyofsurfacewaterinGomtiRiverBasin,India: EnvironmentalSciencePollutionResearch,Vol.28,pp.56105–56116. https://doi.org/10.1007/s11356-021-14592-0.
Khazaal,S.H.;Al-Azawia,K.F.;Eassa,H.A.;Khasraghi, A.H.;Alfatlawi,W.R.;andAl-Gebori,A.M.,2019, StudythelevelofsomeheavymetalsinwateroflakeHabbaniyahinAl-Anbar-Iraq: EnergyProcedia,Vol.157,pp.68–74.https://doi.org/10.1016/j.egypro.2018.11.165
Kirchmann,H.;Börjesson,G.;Kätterer,T.;andCohen,Y., 2017,Fromagriculturaluseofsewagesludgetonutrientextraction:Asoilscienceoutlook: Ambio,Vol.46,pp.143–154. https://doi.org/10.1007/s13280-016-0816-3
Li,P.;Lin,C.;Cheng,H.;Duan,X.;andLei,K.,2015, Contaminationandhealthrisksofsoilheavymetals
aroundalead/zincsmelterinsouthwesternChina: EcotoxicologyEnvironmentalSafety,Vol.113,pp.391–399. https://doi.org/10.1016/j.ecoenv.2014.12.025
Liu,S.;Zhao,H.;Wu,K.;Zhang,Z.;Hou,Y.;Chen,T.;andJin, Q.,2020,Evaluationofheavymetaldistributioncharacteristicsofagriculturalsoil–ricesysteminahighgeologicalbackgroundareaaccordingtotheinfluenceindexofcomprehensivequality(IICQ): EnvironmentalSciencePollutionResearch, Vol.27,pp.20920–20933.https://doi.org/10.1007/s11356020-08453-5
Liu,Y.andChen,J.,2018,AccumulationofCd,Pb,CuandCrin nativeplantsgrowingonacontaminatedindustrialwasteland inChina: FreseniusEnvironmentalBulletin,Vol.27,pp.1394–1403.
Lorika,S.B.andStefan,S.,2020,Manualemptyingof ventilatedimprovedpitlatrinesandhygienechallenges—A baselinesurveyinaperi-urbancommunityinKwaZuluNatal,SouthAfrica: InternationalJournalEnvironmentalHealthResearch,Vol.32,No.5,pp.1043–1054. https://doi.org/10.1080/09603123.2020.1823334
Luo,C.;Routh,J.;Dario,M.;Sarkar,S.;Wei,L.;Luo,D.;and Liu,Y.,2020,Distributionandmobilizationofheavymetals atanacidminedrainageaffectedregioninSouthChina,a post-remediationstudy: ScienceTotalEnvironment,Vol.724, 138122.https://doi.org/10.1016/j.scitotenv.2020.138122
Malay,P.;Koushik,C.;Md,J.R.;Praffulit,B.;Raghunath, P.;Sylvia,S.;Indrajit,P.;Bhagirath,B.;Qiuhua,L.; Sabu,S.P.;andParmeshwar,U.,2020b,ClimaticinfluenceonthemagnitudeofCOVID-19outbreak:Astochasticmodel-basedglobalanalysis: InternationalJournalEnvironmentalHealthResearch,Vol.32,No.5,pp.1095–1110. https://doi.org/10.1080/09603123.2020.1831446
Malay,P.,Parmeshwar,U.,Praffulit,B.,Koushik,C.,Sylvia, S.andIndrajit,P.,2020a,Climaticfactorsinfluencethe spreadofCOVID-19inRussia: InternationalJournalEnvironmentalHealthResearch,Vol.32,No.4,pp.723–737. https://doi.org/10.1080/09603123.2020.1793921
Manea,M.H.;Al-Tawash,B.S.;andAl-Saady,Y.I.,2019,Environmentalgeochemicalassessmentofheavymetalsinsoil andsedimentof(Shatt-Al-Hilla)Babilgovernorate,central Iraq: IraqiJournalScience,Vol.60,No.5,pp.1055–1068. https://doi.org/10.24996/ijs.2019.60.5.15
Mohammed,M.S.andAbdullah,E.J.,2016,HeavymetalspollutionassessmentofthesoilinthenorthernsiteofeastBaghdad oilfield,Iraq: IraqiJournalScience,Vol.57(1A),pp.175–183.
Mokhtar,N.F.;Aris,A.Z.;andPraveena,S.M.,2015,Preliminarystudyofheavymetal(Zn,Pb,Cr,Ni)contaminationsinLangatriverEstuary,Selangor: ProcediaEnvironmentalSciences,Vol.30,pp.285–290.https://doi.org/10.1016/ j.proenv.2015.10.051
Nordberg,G.;Fowler,B.;andNordberg,M.,2014, Handbook ontheToxicologyofMetals:AcademicPress,NewYork.
Okedeyi,O.O.;Dube,S.;Awofolu,O.R.;andNindi,M.M., 2014,Assessingtheenrichmentofheavymetalsinsurfacesoil andplant(Digitariaeriantha)aroundcoal-firedpowerplants inSouthAfrica: EnvironmentalSciencePollutionResearch, Vol.21,pp.4686–4696.https://doi.org/10.1007/s11356-0132432-0
Oliver,M.A.andGregory,P.J.,2015,Soil,foodsecurityand humanhealth:Areview: EuropeanJournalSoilScience,Vol. 66,No.2,pp.257–276.https://doi.org/10.1111/ejss.12216
Othman,F.R.;Al-Rawi,S.M.;andAl-Rawi,A.T.,2014,Heavy metalspollutionofroadsidesoilsinMosulcity/Iraqbyemissionsofvehiculartrafficandelectricity-producinggenerators: TheAllahabadFarmer,Vol.70,No.1,pp.52–67.
Raheem
412 Environmental&EngineeringGeoscience
,Vol.XXVIII,No.4,November2022,pp.397–413
Perlman,S.,2020,Anotherdecade,anothercoronavirus: Mass MedicalSociety,Vol.382,pp.760–762.https://doi.org/ 10.1056/NEJMe2001126
Sahar,K.;Abdolreza,K.;Mehdi,H.;andMahmoud,S., 2020,Exposureriskassessment,pollutionlevel,andsource identificationofarsenicinsoil:AcasestudyoftheBardsirPlain(southeasternIran): InternationalJournalEnvironmentalHealthResearch,Vol.32,No.5,pp.1123–1136. https://doi.org/10.1080/09603123.2020.1836134
¸ Sahin,M.,2020,ImpactofweatheronCOVID-19pandemic inTurkey: ScienceTotalEnvironment,Vol.728,138810. https://doi.org/10.1016/j.scitotenv.2020.138810
Steffan,J.J.;Brevik,E.C.;Burgess,L.C.;andCerdà,A., 2018,Theeffectofsoilonhumanhealth:Anoverview: EuropeanJournalSoilScience,Vol.69,No.1,pp.159–171. https://doi.org/10.1111/ejss.12451
Sürücü,A.;Mohammad,D.M.;Günal,E.;andBudak,M., 2018,ConcentrationofheavymetalsinsoilsalongthreemajorroadsofSulaimani,northeastIraq: CarpathianJournal EarthEnvironmentalSciences,Vol.13,No.2,pp.523–538. https://doi.org/10.26471/cjees/2018/013/045
Tawfiq,L.N.M.andGhazi,F.F.,2017,HeavymetalspollutioninsoilanditsinfluenceinsouthofIraq: InternationalJournalDiscreteMathematics,Vol.2,No.3,pp.59–63. https://doi.org/10.11648/j.dmath.20170203.11
Tosepu,R.;Gunawan,J.;Effendy,D.S.;Ahmad,L.O.A. I.;Lestari,H.;Bahar,H.;andAsfian,P.,2020,CorrelationbetweenweatherandCovid-19pandemicinJakarta, Indonesia: ScienceTotalEnvironment,Vol.725,138436. https://doi.org/10.1016/j.scitotenv.2020.138436
Uma,M.B.;Sivakumar,V.M.;andThirumarimurugan,M., 2020,Leadadsorptionfromaqueoussolutionusingnovel
nanoparticlessynthesizedfromwasteaquaticweeds: NanotechnologyEnvironmentalEngineering,Vol.5,10.https:// doi.org/10.1007/s41204-020-00074-0
Volpe,M.G.;Ghia,D.;Omid,S.;andPaolucci,M.,2020, Fastnon-destructiveassessmentofheavymetalpresenceby ATR–FTIRanalysisofcrayfishexoskeleton: EnvironmentalSciencePollutionResearch,Vol.27,pp.21021–21031. https://doi.org/10.1007/s11356-020-08405-z
Wang,H.;Li,X.;Chen,Y.;Lia,Z.;Hedding,D.W.;Nel, W.;Ji,J.;andChen,J.,2020c,Geochemicalbehaviorand potentialhealthriskofheavymetalsinbasalt-derivedagriculturalsoilandcrops:AcasestudyfromXuyiCounty, easternChina: ScienceTotalEnvironment,Vol.729,139058. https://doi.org/10.1016/j.scitotenv.2020.139058
Wang,Y.;Wang,Y.;Chen,Y.;andQin,Q.,2020a,Uniqueepidemiologicalandclinicalfeaturesoftheemerging2019novel coronaviruspneumonia(COVID-19)implicatespecialcontrol measures: JournalMedicalVirology,Vol.92,No.6,pp.568–576.https://doi.org/10.1002/jmv.25748
Yin,J.;Wang,L.;Liu,Q.;Li,S.;Li,J.;andZhang,X., 2020,MetalconcentrationsinfishfromninelakesofAnhuiProvinceandthehealthriskassessment: EnvironmentalSciencePollutionResearch,Vol.27,pp.20117–20124. https://doi.org/10.1007/s11356-020-08368-1
Yousif,K.M.,2016,PreliminaryassessmentofheavymetalinselectedsiteswithinDuhokcity,Iraq: AmericanScientificResearchJournalEngineering,Technology,Sciences,Vol.26,No. 2,pp.316–325.
Zhang,X.;Davidson,E.;Mauzerall,D.;Searchinger, T.;Dumas,P.;andShen,Y.,2015,Managingnitrogen forsustainabledevelopment: Nature,Vol.528,pp.51–59. https://doi.org/10.1038/nature15743
AssociationbetweenCovid-19andHeavyMetalPollutioninIraqiCities
Environmental&EngineeringGeoscience
413
,Vol.XXVIII,No.4,November2022,pp.397–413
Environmental & Engineering Geoscience (ISSN 1078-7275) is published quarterly by the Association of Environmental & Engi neering Geologists (AEG) and the Geological Society of America (GSA). Periodicals postage paid at AEG, 3053 Nationwide Park way, Brunswick, OH 44212 and additional mailing offices.
EDITORIAL OFFICE: Environmental & Engineering Geoscience journal, Kent State University, Kent, OH 44242, U.S.A., ashakoor@kent.edu.
CLAIMS: Claims for damaged or not received issues will be honored for 6 months from date of publication. AEG members should contact AEG, 3053 Nationwide Parkway, Brunswick, OH 44212. Phone: 844-331-7867. GSA members who are not members of AEG should contact the GSA Member Service center. All claims must be submitted in writing.
POSTMASTER: Send address changes to AEG, 3053 Nation wide Parkway, Brunswick, OH 44212. Phone: 844-331-7867. Include both old and new addresses, with ZIP code. Canada agreement number PM40063731. Return undeliverable Canadian addresses to Station A P.O. Box 54, Windsor, ON N9A 6J5 Email: returnsil@imexpb.com.
DISCLAIMER NOTICE: Authors alone are responsible for views expressed in articles. Advertisers and their agencies are solely responsible for the content of all advertisements printed and also assume responsibility for any claims arising therefrom against the publisher. AEG and Environmental & Engineering Geoscience reserve the right to reject any advertising copy.
SUBSCRIPTIONS:
Member subscriptions: AEG members automatically receive digital access to the journal as part of their AEG membership dues. Members may order print subscriptions for $75 per year. GSA members who are not members of AEG may order for $60 per year on their annual GSA dues statement or by contacting GSA.
Nonmember subscriptions are $310 and may be ordered from the subscription department of either organization. A postage differential of $10 may apply to nonmember subscribers outside the United States, Canada, and Pan America. Contact AEG at 844-331-7867; contact GSA Subscription Services, Geological Society of America, P.O. Box 9140, Boulder, CO 80301.
Single copies are $75.00 each. Requests for single copies should be sent to AEG, 3053 Nationwide Parkway, Brunswick, OH 44212.
© 2022 by the Association of Environmental and Engineering Geologists
All rights reserved. No part of this publication may be reproduced or transmitted in any form or by any means, electronic or mechanical, including photocopying, recording, or by any information storage and retrieval system, without permission in writing from AEG.
THIS PUBLICATION IS PRINTED ON ACID-FREE PAPER
EDITORS
Abdul Shakoor Kent State University Kent, OH 44242 ashakoor@kent.edu
ADVISORY BOARD
Watts, Chester “Skip” F. Radford University Hasan, Syed University of Missouri, Kansas City Nandi, Arpita East Tennessee State University
Oommen, Thomas Board Chair, Michigan Technological University Sasowsky, Ira D. University of Akron
ASSOCIATE EDITORS
Ackerman, Frances Ramboll Americas Engineering Solutions, Inc. Bastola, Hridaya Lehigh University Beglund, James Montana Bureau of Mines and Geology
Bruckno, Brian Virginia Department of Transportation Clague, John Simon Fraser University, Canada Dee, Seth
University of Nevada, Reno Fryar, Alan University of Kentucky Gardner, George Massachusetts Department of Environmental Protection
Hauser, Ernest Wright State University Keaton, Jeff AMEC Americas May, David USACE-ERDC-CHL Pope, Isaac Book Review Editor Santi, Paul Colorado School of Mines Schuster, Bob Shlemon, Roy R.J. Shlemon & Associates, Inc. Stock, Greg National Park Service Swanson, Susan (Sue) Beloit College Ulusay, Resat Hacettepe University, Turkey West, Terry Purdue University
Submitting a Manuscript
Environmental & Engineering Geoscience (E&EG), is a quarterly jour nal devoted to the publication of original papers that are of potential in terest to hydrogeologists, environmental and engineering geologists, and geological engineers working in site selection, feasibility studies, inves tigations, design or construction of civil engineering projects or in waste management, groundwater, and related environmental fields. All papers are peer reviewed.
The editors invite contributions concerning all aspects of environmental and engineering geology and related disciplines. Recent abstracts can be viewed under “Archive” at the web site, “http://eeg.geoscienceworld.org”. Articles that report on research, case histories and new methods, and book reviews are welcome. Discussion papers, which are critiques of printed articles and are technical in nature, may be published with replies from the original author(s). Discussion papers and replies should be concise.
To submit a manuscript go to https://www.editorialmanager.com/EEG/ default.aspx. If you have not used the system before, follow the link at the bottom of the page that says New users should register for an account. Choose your own login and password. Further instructions will be available upon logging into the system. Upon submission, man uscripts must meet, exactly, the criteria specified in the revised Style Guide found at https://www.aegweb.org/e-eg-supplements.
Manuscripts of fewer than 10 pages may be published as Technical Notes. The new optional feature of Open Access is available upon re quest for $750 per article.
For further information, you may contact Dr. Abdul Shakoor at the ed itorial office.
Cover photo
Eric Peterson
Department of Geography, Geology, and the Environment Illinois State University Normal, IL 61790 309-438-5669 ewpeter@ilstu.edu
Karen E. Smith, Editorial Assistant, kesmith6@kent.edu
Photographed on January 21, 1924 were slope failures that undermined buildings along South Jackson Street in Seattle, Washington, complicating regrading projects. This photo and others are compiled in the City of Seattle historic landslide database which is used to evaluate present-day landslide hazards. Photographer unknown, City of Seattle landslide file SED J-1B. Courtesy of Elizabeth Davis. See article on page 335.
