

Volume30,Number1-2,May2024
1DocumentingtheCollisionofaLandslideinPermafrostwithaHighwayEmbankment
MargaretM.Darrow,RonaldP.Daanen,andMeaghanC.Gould

19NeedforaMulti-SensorMonitoringApproachforEmbankmentFailures:LessonsLearnedfromthe EdenvilleDamFailure
JobinThomas,Ryanklida,ThomasOommen,SajinkumarK.S.,BinZhang,andXieHu
31ElectricalResistivityImagingofRecentLandslidesinColoradoSprings,Colorado,USA MoamenAlmaz,KevinMickus,MohamedH.Aly,andGregoryDumond
45PossibleRoleofInternalErosionintheDevelopmentofGroundFissuresaroundLakeZiway,Ethiopia YonathanAdmassuandTrufatGugsa
59TheSeptember18,2018,DebrisSlideinWarrensville,NC:ALandslideResponseCaseStudy
RichardM.Wooten,BartL.Cattanach,G.NicholasBozdog,andSierraJ.Isard
77EvaluationofPlant-BasedNaturalExtractsasCoagulantsforSurfaceWaterTreatment ZanibFida,MuhammadAshrafTanoli,QaisarMahmood,MuhammadSohailAlamgir,andDilawarSajjad
TechnicalNote
91AProposedProcess-Landform-Material(PLM)SystemforEngineeringGeologyFieldMapping PaulM.SantiandJeffreyR.Keaton

MARGARETM.DARROW*
UniversityofAlaskaFairbanks,P.O.Box755900,Fairbanks,AK99775-5900
RONALDP.DAANEN
AlaskaDepartmentofNaturalResources,DivisionofGeologicalandGeophysical Surveys,3354CollegeRoad,Fairbanks,AK99709
MEAGHANC.GOULD
U.S.ArmyCorpsofEngineers,AlaskaDistrict,22043rdStreet, JBER,AK99506-1898
KeyTerms: Landslide,FrozenDebrisLobe,Shear Strength,Infrastructure,BrooksRange,Alaska
Frozendebrislobes(FDLs)areslow-movinglandslidesinpermafrost.FDL-A,thelargestmonitored FDLintheBrooksRangeofAlaska,hassteadily progresseddownslopetowardtheDaltonHighway, whichistheonlyroadtotheoilandgas fieldsofthe NorthSlope.Toavoidthisencroachinglandslide,the DaltonHighwaywasrealignedfartherdownslopein 2018.Theabandonedportionofthehighwaywasleft inplace,providingauniqueopportunityforafullscale fieldexperimenttomonitortheimpactofa landslideonanengineeredstructure.In2020,weconductedasubsurfaceinvestigation,drillingandsamplingthesubsurfacesoilsandinstallinggeotechnical instrumentationwithintheabandonedhighway embankment.Here,wepresenttheintegrationof multipledatasetstoprovideadetaileddescriptionof thelandslide–embankmentcollision.FDL-Aisshearingwithinweatheredbedrock »7.6mbelowthe embankmentsurface.Ithorizontallydisplacedaportionoftheembankment »0.3masofNovember1, 2023.Usingtheinfiniteslopeapproachandstrength propertiesdeterminedfromlaboratorytesting,we estimatethatFDL-Aisimpactingthehighway embankmentandunderlyingsoilswithatleast77.8 kN/mwidthshearforce.Asthisforceoccursapproximately4mbelowthebottomoftheembankment,we postulatethatthepresenceoftheabandonedDalton
*Correspondingauthoremail: mmdarrow@alaska.edu

HighwayembankmentdoeslittletostopFDL-A
downslopeprogression.
Wededicatethispapertooneofourco-authors our long-timecolleagueinFDLresearchanddearfriend Dr.Ronald(“Ronnie”)Daanen,whodiedinahelicopter crashwhileconducting fieldworkontheNorthSlopeof AlaskaonJuly20,2023.
Landslidesaredestructiveevents,causinganestimated$3.5billionworthofdamageannuallyinthe UnitedStates(USGS,2017).Linearinfrastructureis especiallysusceptibletodamagebecause,byitsnature, itmustsometimestransversedifficultandlandslide-susceptibleterrain.Alaska’sDaltonHighway, “oneofthe northernmostroadsintheworld” (ADOT&PF,n.d.),is anexcellentexampleoflinearinfrastructurecrossing difficultterrain.TheDaltonHighwayis666km(414 mi)long,stretchingfromLivengoodinInteriorAlaska toDeadhorseontheArcticCoastalPlain(ADOT&PF, n.d.;Figure1a).Originallybuiltinthe1970stosupport theconstructionoftheTransAlaskaPipelineSystem, currentlytheDaltonHighwayfacilitatesthetransportationofgoodsandservicesfromcitieslikeAnchorage andFairbankstotheoilandgas fieldsoftheNorth Slope.UnderlainbycontinuousanddiscontinuouspermafrostandcrossingtheBrooksRangeinnorthern Alaska,theDaltonHighwayhasexperienceditsshareof geohazards,includingthawsettlement,avalanches,slush flows,andlandslides.Inthispaper,wefocusonaspecificgeohazardimpactingtheDaltonHighwayinthe

Figure1.Locationoftheresearcharea.(a)PortionofAlaskawithselectedcommunities,majorroads(inorange),theDaltonHighway(inpurple),and thelocationoftheprojectarea(redrectangle).(b)AreaofinterestintheBrooksRangewithninemonitoredFDLsandthelocationofinfrastructure. (c) FDL-A’sandsurfacemeasurementpinlocationsin2020.(d)ToeofFDL-Awithlocationsofrelevantinstrumentation;A-A 0 isthecross-sectionpresentedinFigure9,andblueandredtransparentconesindicateviewdirectionsofnorthandsouthcameras,respectively.TAPS ¼ TransAlaskaPipeline System.BasemapdataarefromADOT&PF(2020),AGC(2020),GINA(2001),and2020lidar(unpublished)andcourtesyofAPSC(unpublished).
south-centralBrooksRange,namely,frozendebrislobes (FDLs;Daanenetal.,2012;Darrowetal.,2016).
FDLsareslow-moving(CrudenandVarnes,1996) landslidesinpermafrost,typicallycomposedofsilty sandwithgravelbasedontheUnifiedSoilClassification System(USCS)followingASTMD2487-17e1(ASTM, 2017a).Inadditiontothesoilcomponent,FDLscontain somequartz-richcobblesandbouldersthatlikelyare
remnantsofresistantveinsintheheavilyfracturedmetasedimentaryrocksthatformthecatchmentsfromwhich thesefeaturesoriginate(Darrowetal.,2016).Although thesoilmatrixisice-poor,FDLscontainareasofmassiveinfiltrationice,whichformsincracksthatareopen atthesurfaceduetodownslopemovementthroughout theyear(Darrowetal.,2016).FDLsalsocontain organicmaterialandwoodydebris.BecauseFDLs
predominantlyconsistofsoil,maturespruceforests growontheirsurfaces.AsFDLsmovedownslope,their movementknocksoverthesetreesandthoseontheslope infrontofthem,andtheyentrainthatwoodydebris,as wellastheoriginalorganicmatintotheirmovingmass.
OurFDLresearchbeganin2008withtheinitialinvestigationoffourFDLs(Daanenetal.,2012).Wenowregularlymonitornineoftheselandslides(Figure1b).Our previousinvestigationsincludedmappingandtestingof rocksinthesurroundingcatchments,analysisofhistoricand currentmovementrates,changedetectionanalysisusing lidarandinterferometricsyntheticapertureradar,andthermalmodeling(Darrowetal.,2016,2017,2019;Gyswyt etal.,2017;Byrdetal.,2019;andGongetal.,2019).
ThelargestandclosestFDLtotheDaltonHighwayis termedFDL-A(Figure1c).OurinitialstudiesofFDL-A includedsubsurfaceinvestigationsandanalysisofgeotechnicalinstrumentationdata(Darrowetal.,2013; Simpsonetal.,2016).WeinformedtheAlaskaDepartmentofTransportationandPublicFacilities(ADOT&PF) aboutFDL-A’shazardousincreasingrateofmovement, whichpromptedADOT&PFtorealigntheDaltonHighway,movingit »125mdownslopein2018.Aportionof theabandonedhighwayalignmentwasleftinplaceinfront ofFDL-A,providingauniqueopportunitytoobservethe impactofalandslidewithacompactedembankment.In 2020,we alongwithpersonnelfromtheADOT&PF NorthernRegionMaterialSection(NRMS) conducteda subsurfaceinvestigation,drillingandsamplingthesubsurfacesoilsandinstallinggeotechnicalinstrumentationwithin theabandonedpartofthehighwayembankment.The objectivesofthispaperareto1)summarizeresultsofthis full-scale fieldexperimenttomonitortheimpactofalandslidewithaninstrumentedembankment,2)evaluatethe movementmechanismsatFDL-A’stoe,and3)estimatethe forceFDL-Aisimpartingtotheembankmentandsubsurfacesoils.Weintegratedatafromabove-groundandsubsurfaceinstrumentation(includinglocalclimate,ground temperatures,groundwaterpressure,andslopemovement), laboratorytesting,lidar,andrepeatphotographytobuilda conceptualmodeloftheinteractionbetweenFDL-Aand theabandonedDaltonHighwayembankment.Thispaper includesdatacollectedfromaprevious2018subsurface investigationandfromthe2020subsurfaceinvestigation untilNovember1,2023.
FDLSurfaceMovementMeasurements
In2012,weinstalledanarrayofsurfacemarkerpins onFDL-A(Figure1c),whosechangingpositionswe havedocumentedsincethattimeusingareal-time
kinematicglobalpositioningsystem(RTK-GPS).For thisproject,wecontinuedthosemeasurements,usinga LeicaVivasystem(includingGS14receiversanda CS15controller)astheRTK-GPSdevice.Withpostprocessing,thissystemisaccuratetowithin5cmin bothhorizontalandverticaldirections.
OurjointUniversityofAlaskaFairbanks(UAF)–AlaskaDivisionofGeologicalandGeophysicalSurveys (DGGS)researchteamcompletedtwoboreholesin2018, eachto3.05m(10ft),usingahandheldpowerheadand augerassembly(Figures1dand2a).Thepurposeofthis investigationwastomeasurechangesinthesubsurface temperatureandporewaterpressureasFDL-A approachedandcoveredtheinstrumentlocations.Thus, welocatedeachboringclosetoboththetoeofFDL-A andastreamdrainingfromit.Intoeachborehole,we installedatemperaturesensorcableandavibratingwire piezometer(VWP) whichwepreviouslytestedandcalibratedinthelaboratory andbackfilledeachboringwith cement–bentonitegrout.Finally,wehand-duga »15-cmdeeptrenchintowhichweburiedtheinstrumentation cables,routingthemtoanautomateddataacquisitionsystem(ADAS).TheADASconsistedofadatalogger,multiplexer,solarregulator,solarpanel,enclosure,battery bankwithenclosure,andtemperaturesensorstomeasure airandsurfacetemperaturesattheADASlocation.
OurUAF-DGGSresearchteam,alongwithpersonnel fromADOT&PFNRMS,performedthesubsurface investigationandgeomechanicalequipmentinstallation intheabandonedsectionoftheDaltonHighwayinmidAugust2020.Priortogoingtothe field,wecalibrated thetemperaturesensorcablesandVWPsandtestedthe componentswiredintotheADAS.Onceinthe field, usingasmalltrackexcavator,ADOT&PFNRMSpersonneldugashallowtrench(»0.4mdeep)intotheembankmentsurfaceforburialofinstrumentationcabling.All boreholeswereadvancedusingatruck-mountedCME55 drillrig,whichwascenteredoverthetrench(Figure2b). Wecompletedfour12.19-m-deepboreholes(40ftdeepas measuredfromtheembankmentsurface)usinga16.5-cm (6.5in.)outsidediameter(OD)hollow-stemauger,which allowedforsplit-spoonsamplingduringdrillingandserved asacasingtokeepeachboreholeopenduringinstrument installation(locationsareprovidedinFigure1d).Wecollectedsamplesusinga1.51-kN(340lb)hammertopound a7.6-cm(3in.)ODsplit-spoonsamplerat0.76-m(2.5ft) intervals,providingnear-continuousvisualizationofthe subsurfacematerials.Wecollectedrepresentativesamples
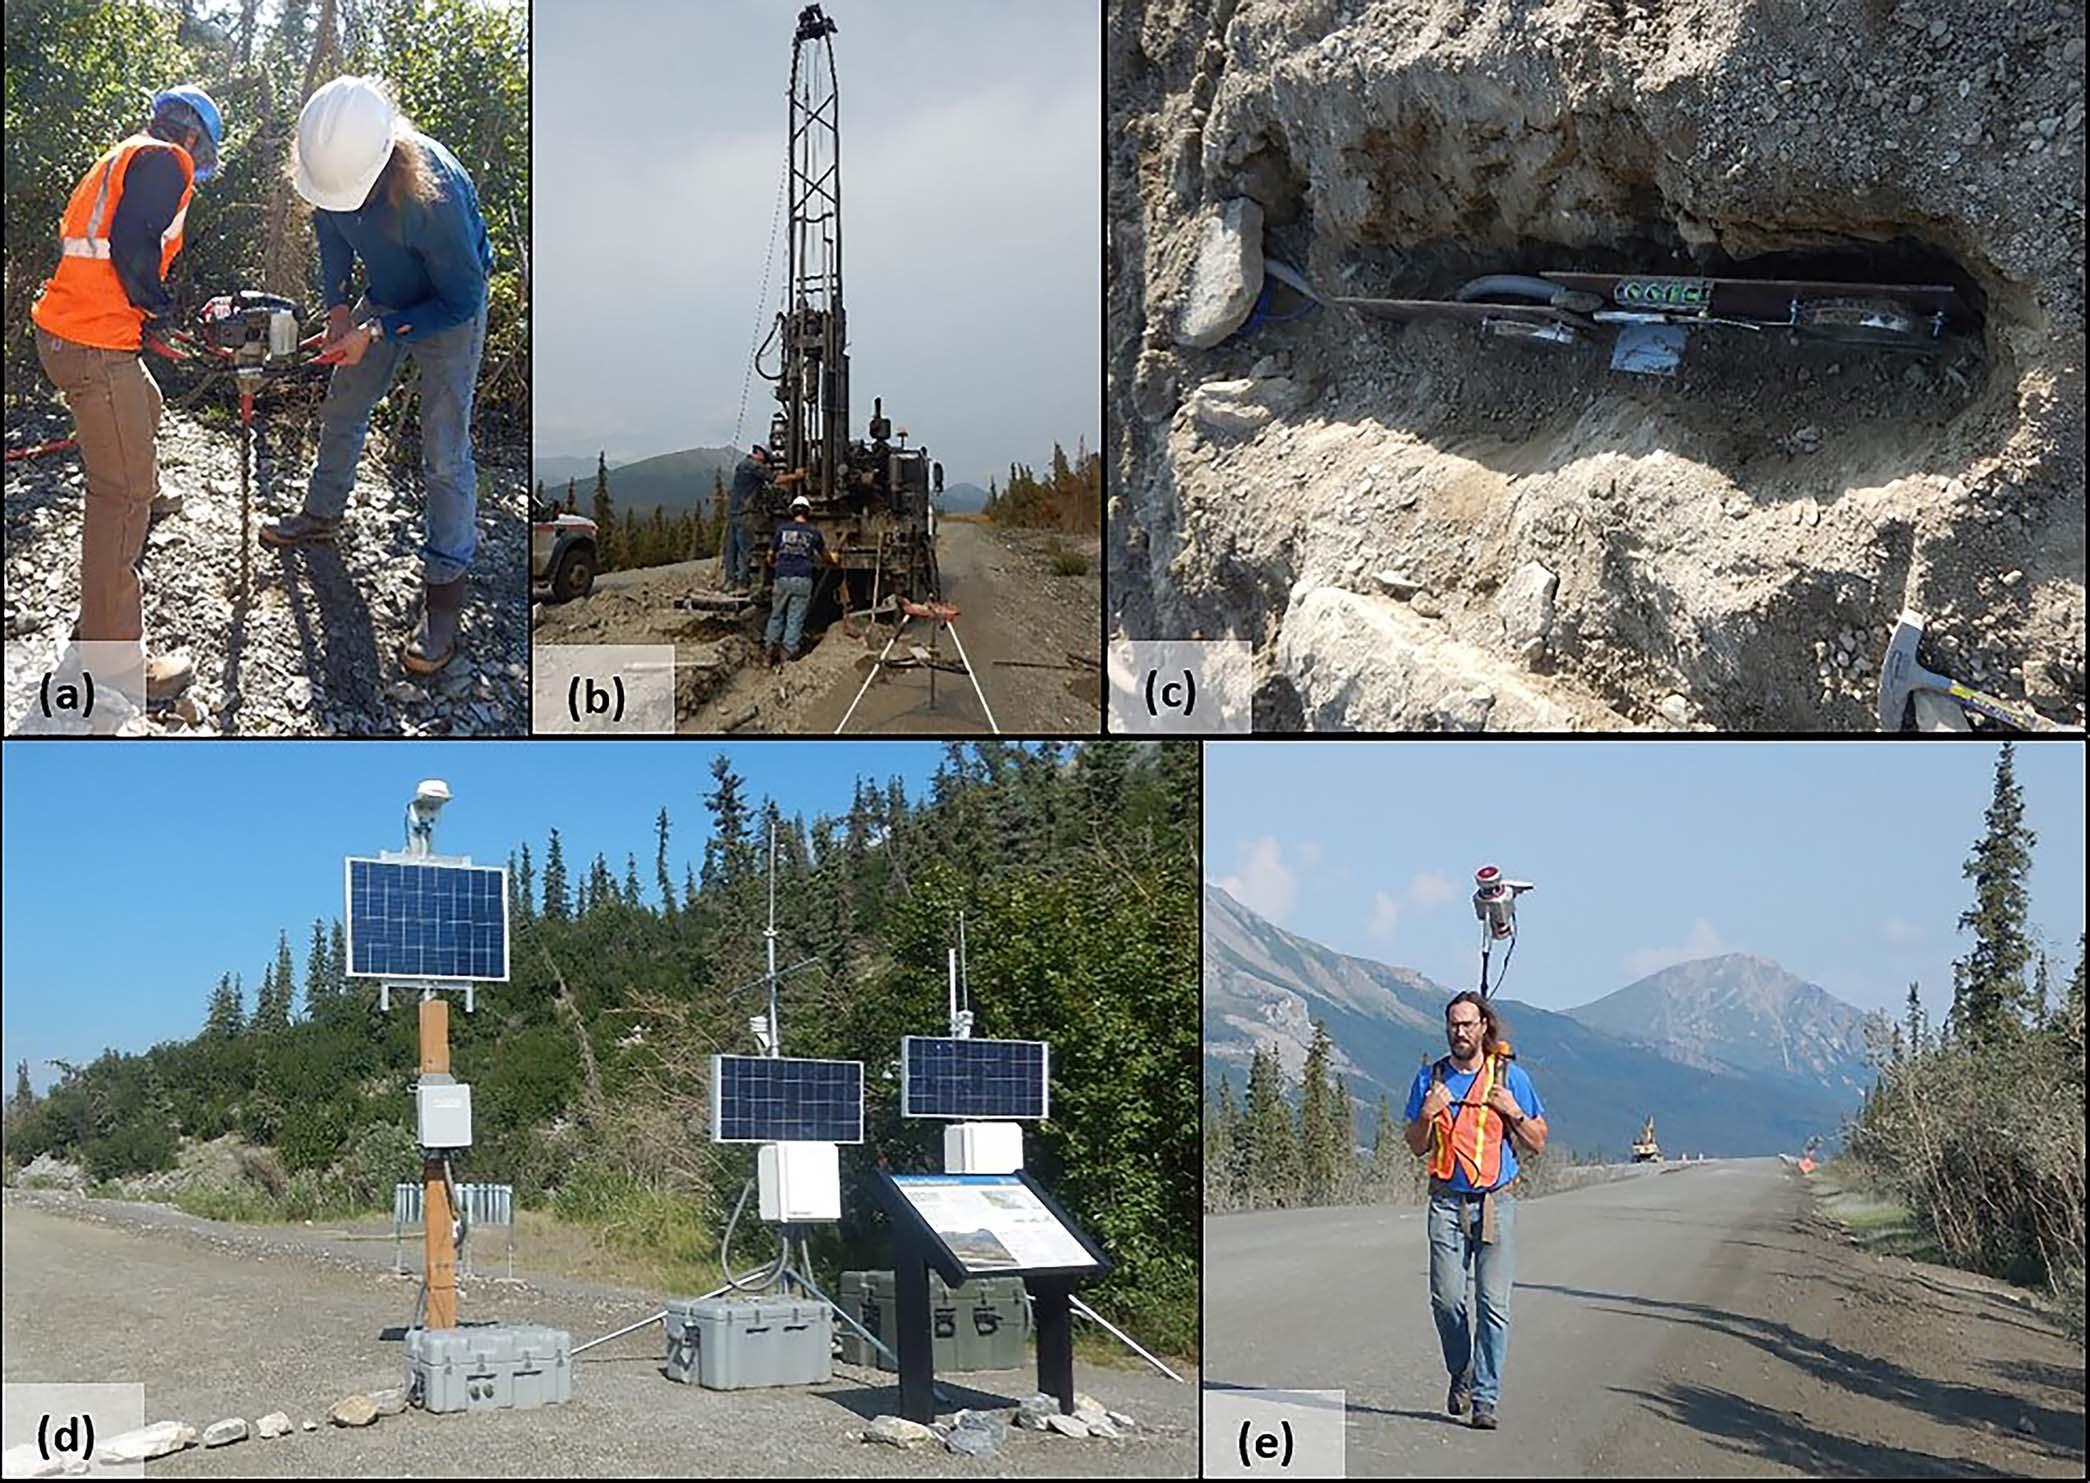
Figure2.Imagesfromthe2018and2020drillingprograms.(a)Drillingaboreholewiththehandheldpowerheadandaugerassembly.(b)Drill truckcenteredonthetrenchtodrillTH20-03.(c)Lookingdownatthe2-and5-MPapressureplatesandtiltmeterembeddedintotheuphillside slopeoftheembankmentatTH20-02.(d)AllADASatthesouthernendoftheprojectlocationin2022.(e)Collectinglidardatawiththebackpackcollectionconfiguration.
fromeachborehole,whichweresealedandtransportedto theFrozenSoilTesting(FROST)LaboratoryatUAF.In eachboring,weinstalledonemicro-electro-mechanical system–basedin-placeinclinometer(M-IPI),atemperaturesensorcable,andaVWPandthenbackfilledwith cement–bentonitegrout.Allcablingwasroutedtoan ADASthroughthetrenchandburied.Simultaneous withthedrilling,theUAF-DGGSresearchteamlaidout tiltmetersandpressureplatesforinstallationontheeast oruphillsideoftheembankment.Foreachborehole location,a2-MPapressureplateandtiltmeter(both affixedtoasinglesteelplate)wereinstalledvertically intoaslotdugintotheedgeoftheembankment.The exceptionwasatTH20-02,whereanadditional5-MPa pressureplateonitsownsteelplatewasinstalledimmediatelyadjacenttothe2-MPapressureplateandtilt meter(Figure2c).Itwasduringthiseffortthatwediscoveredthatthetiltmetercableswereprovidedtothe specifiedlengthinfeetinsteadofmetersandthuswere
tooshorttobeinstalledwheredesired.Toaccommodate theshortcables,wemovedtheADASassociatedwith the2018subsurfaceinvestigationintothemiddleofthe embankmentandduganadditionaltrenchtoroutethe remaining2018instrumentationcables,plusthetilt meterandpressureplatecabling,tothiscentralADAS. Later,insummer2022,weexposedtheburiedcables, extendedthemthroughsplicing,routedtheextended cablestothesouth,andmovedthisADASoutofthe wayofFDL-A’simminentimpactwiththeembankment (Figure2d).
In2020,weinstalledtwoADASsatthesouthendof theembankmentsection,oneforthetime-lapsecamera systemandonetoserveasthemainADASforthe majorityoftheinstrumentation.Thetime-lapsecamera system(NupointSystemsInc.)wassetuptotakeone photographperdayofthetoeofFDL-A,whichwas transmittedtoUAFviaasatelliteuplink.Wemounted twoadditionalstand-alone fieldcameras(Reconyx)to
Table1. Summaryofgeomechanicalinstrumentationinstalledin2018and2020.
YearInstalledInstrumentManufacturerSpecifications
2018VWPGeokon4500,350-kPapressurerange;installedat3mbgs
TemperaturesensorstringGeokonAccuracy 6 0.2°C;thermistorsspacedat0.25,0.5,1,2,and3mbgs 2020VWPGeokon4500B(slimmodel),700-kPapressurerange
Temperaturesensorstring re-usedforthisinstallationandfailedtoworkproperly;seetextforexplanation M-IPIMeasurandSAAV,10-mlongwith200.5-m-longsegments
PressurecellGeokon4815(forgranularsoil);4at2MPa,1at5MPa;armoredcableuntilcenterline, transitioningtoregularcable
TiltmeterGeokonNEMA4enclosure;biaxialmodel;armoredcableuntilcenterline,transitioning toregularcable
acquireimagesofthelandslidecollisionfromdifferent angles.ThemainADASconsistedofadatalogger,solar regulator,solarpanel,batterybank,andthenecessary instrumentationtoserveasaweatherstationfortheprojectarea,includingmeasurementsofairtemperature, precipitation,andsnowdepth.ADAScomponentswere mountedinsideanenclosureordirectlyontoarugged tripodthatwasanchoredintotheembankmentsurface. Table1isasummaryofthegeomechanicalinstrumentationinstalledduringbothdrillingprograms.
WetransportedallsamplestotheUAFFROSTLaboratoryforstandardtests,includingmoisturecontent(ASTM D2216-19,ASTM,2019),Atterberglimits(ASTMD431817e1,ASTM,2017b),unitweight(ASTMD7263-21, ASTM,2021a),andparticle-sizedistributionconsistingof hydrometertests(ASTMD7928-21,ASTM,2021b),specificgravitytests(ASTMD854-14,ASTM,2014),and sieveanalyses(ASTMD6913M-17,ASTM,2017d).We classifiedsamplesusingtheUSCS(ASTMD2487-17e1, ASTM,2017a).Wewereabletocollectthreesplit-spoon samplesofthebedrockmaterialinTH20-04.Thehigh moisturecontentandweatheredconditionofthebedrock samplesallowedustopreparetestspecimensfordirect sheartests(ASTMD6528-17,ASTM,2017c).
WeconductedlidarscanningoftheFDL-Atoeareain May2021andJune2022,usingaRiegleVUX-LRintegratedintoafullydynamiclidarsystembyPhoenix LiDAR.Weusedabackpacktotransportthelidarsystem, whichallowedhigh-resolutionscanningofthesmalltoe area(Figure2e).ThesystemissetupwithRTK-GPSfor accuratelocationinformationat10pointspersecond. BetweenRTK-GPSreadings,thesystemreliesona NorthropGrummaninertialmomentumunitatarateof 100timespersecond.Thecombinationofthesetwo devicesmakesitpossibletoknowthelocationandorientationofthedevicewithanaccuracyofabout1cm.We
produceddigitalelevationmodels(DEMs)ataresolution of10cmfromeachlidarscan.Weusedthesedatasets,as wellasapreviouslycollected2020dataset,toconduct thechangedetectionanalysis.WealsousedtheDEMsto producelongitudinalprofilesacrosstheDaltonHighway embankmentandupthetoeofFDL-A,whichwereused toproducescaledconceptualmodelsofmovement.
Figure3acontainsairtemperaturedatafromthetoe ofFDL-AandfromColdfoot,Alaska(approximately 70.8kmsouthoftheresearchsite;Figure1a).Forthe4 years(2019–2022)ofcompletetemperaturedatafrom theFDL-Aresearchsite,themeanannualairtemperature(MAAT)was 5.0°C,whereasfortheColdfoot location,theMAATwas 4.0°C.ThewarmerColdfoot airtemperaturesalsoareapparentintheairthawing index(ATI)andairfreezingindex(AFI)summarizedin Table2.Despitetheslightdifferenceinairtemperature betweenlocations,weusetheColdfootdataasaproxy forFDL-A,aswedonothaveacompleterecordofprecipitationorsnowdepthfromtheresearchsitedueto intermittentequipmentmalfunctions.Figure3bandTable 3containsnowdepthandprecipitationdataforColdfoot bywateryear(awateryearbeginsonOctober1andends onSeptember30;USGS,2016).Thewinterof2020/21 (orwateryear2021)isthemostnotableduringthisperiod ofobservation,asitexperiencednearlyhalfthetypical snowfall,whichalsostartedaccumulatingaboutamonth laterthannormal(seeboldvaluesinTable3).Thislack ofsnowfallismanifestedinotherdataattheFDL-A researchsite,whicharediscussedlater.
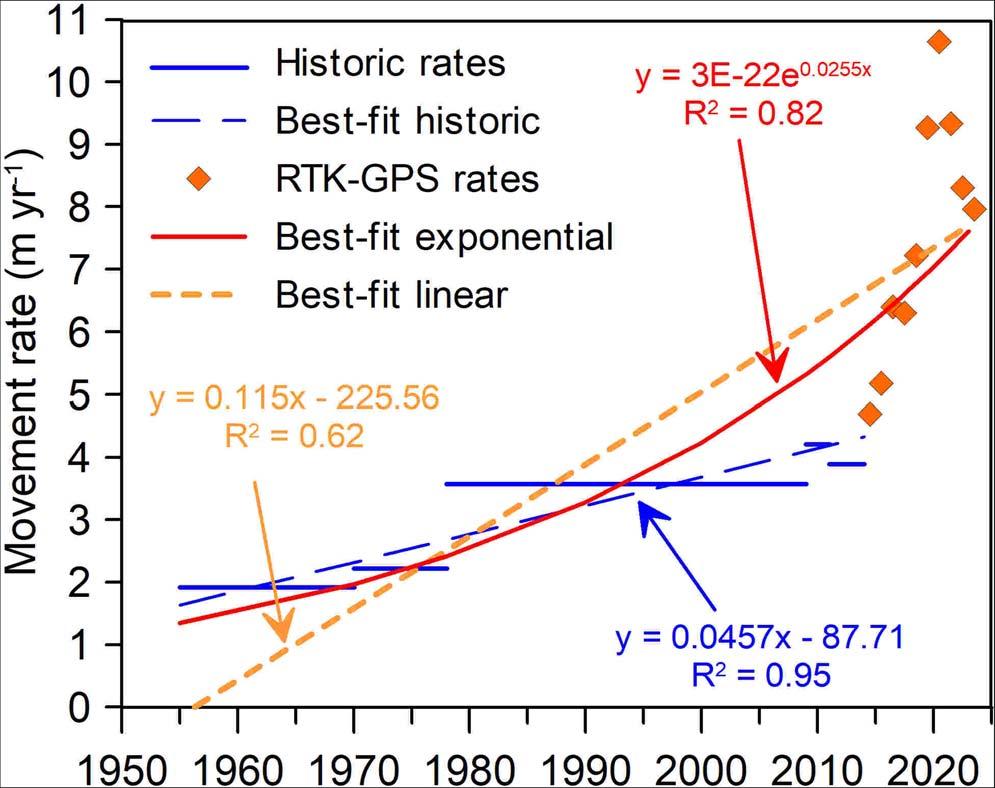
Figure4isasummaryofFDL-A’srateofmotion, includingratesobtainedfromanalysisofhistoricimagery andrecentRTK-GPSmeasurements(refertoDarrow
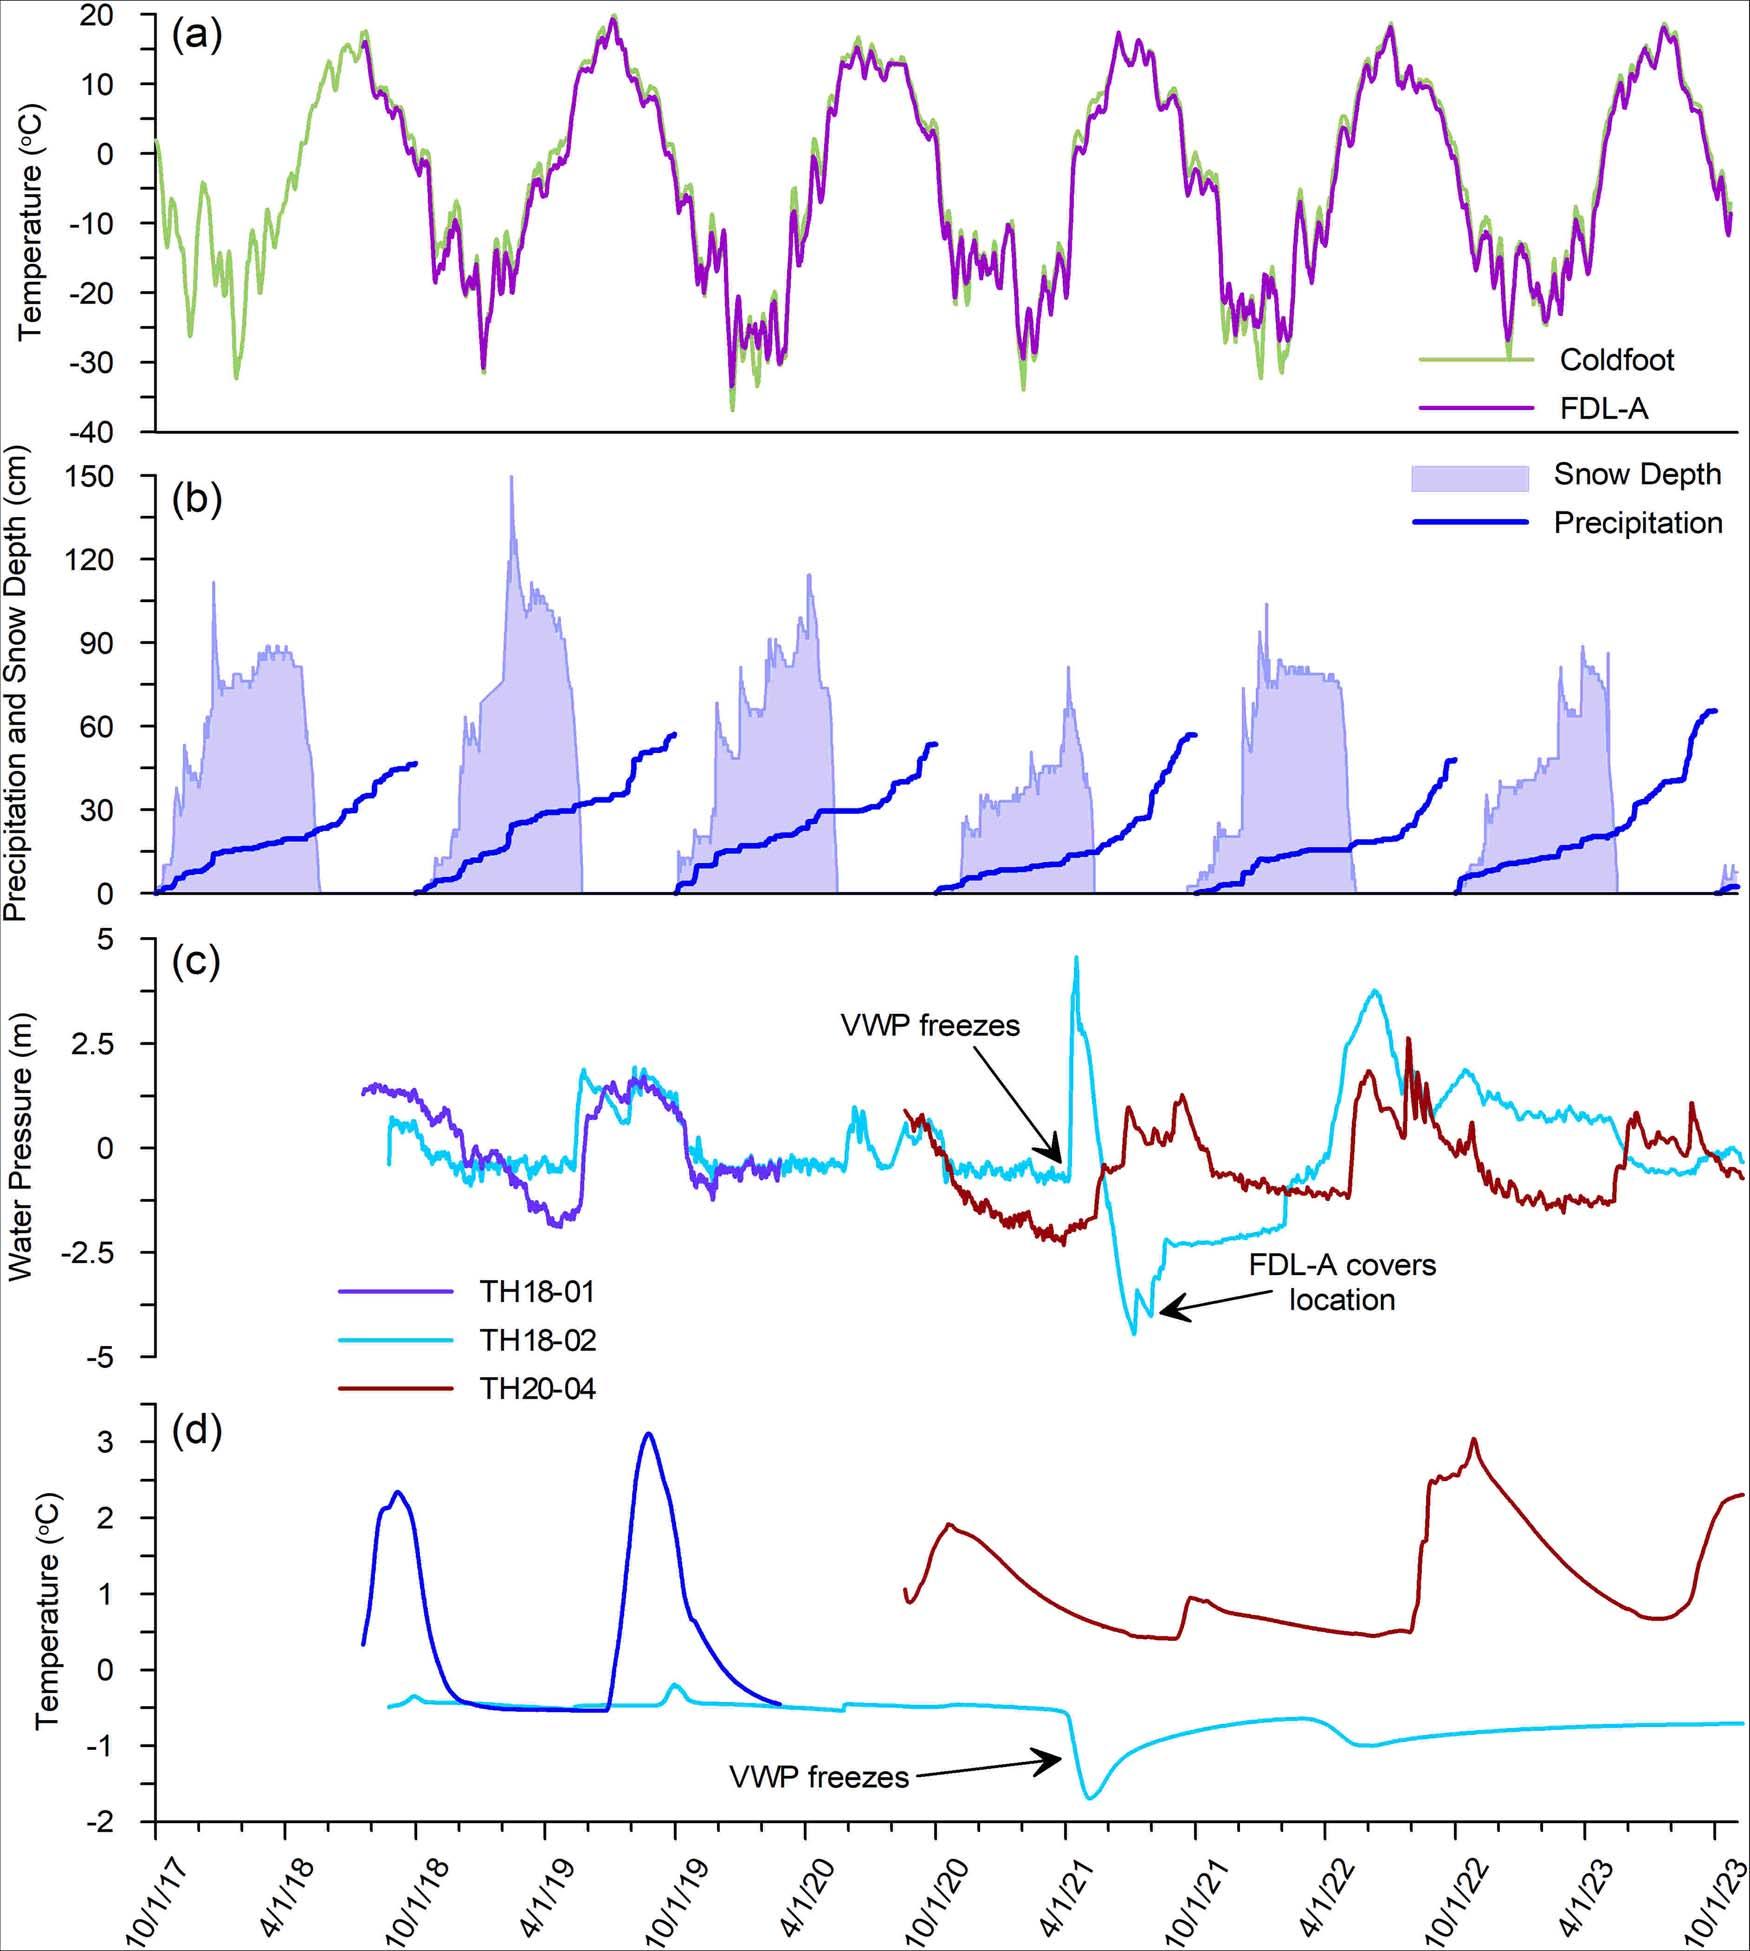
Figure3.Climateandwaterpressuredata.(a)AirtemperaturesfromColdfoot,Alaska(snowtelemetry[SNOTEL]site958;USDA,n.d.)andthetoeof FDL-A.(b)CumulativeprecipitationandsnowdepthforColdfoot.SelectedVWP(c)waterpressureand(d)temperaturedatafromthetoeofFDL-A.
etal.,2016,formoreinformationonthehistoricimagery analysis).Alineartrendisthebest fitforthehistoricrate ofmotion,withan R2 of0.95(blueseries,Figure4). WhentherecentRTK-GPSratesareadded,thebest fitis nolongerlinear(orangeserieswith R2 of0.62)but becomesexponential(redserieswith R2 of0.82).The RTK-GPSmeasurementsdemonstrateapeakinFDL-A’s movementratein2020,followedby3yearsoflower annualmovementrates.Weattributethisslowingtothe below-averagesnowfallduringthewinterof2020/21. Thelackofinsulationprovidedbythesnowhadtheeffect ofcoolingthesubsurface,whichincreasedtheshear
strengthofthefrozensoilandslowedthedownslope movementinsubsequentyears.Weobservedasimilar below-averagesnowfallduringthewinterof2012/13, whichresultedincoldergroundtemperatureswithinthe lobeandlowerstrainrates(Darrowetal.,2017).
Figure5containsschematicsofthefourboreholes, includingasummaryofthelaboratorytestingresults.
Table2. SummaryofATIandAFIforthetoeofFDL-Aandfor Coldfoot,Alaska(SNOTEL958;USDA,n.d.).
Calendar Year FDL-AColdfoot
Wheredrilled,theembankmentrangedfrom3.05to 3.66m(10–12ft)thick,consistingofmoist,brown,nonplasticsiltygravelwithsandtosiltysandwithgravel. Thefoundationsoilstypicallyconsistedofbrown,nonplasticslightlyorganicsiltysandwithgraveltosilty gravelwithsand.Thesesoilsweremoisttowetwhere unfrozen.Weinterceptedgray,whitemicaschistbedrock inallboreholes,varyingbetween4.27and9.75m(14.0 and32.0ft)belowtheembankmentsurface.Thehighly weatheredbedrockwasmoisttowetwhereunfrozen.We interceptedthepermafrosttable6.04–7.62m(19.8–25.0 ft)belowthegroundsurface(bgs)inTH20-01through TH20-03;TH20-04wasunfrozen.Weattributethisdepth topermafrosttothelackofwintermaintenanceandthe insulatingeffectsofsnowaccumulationontheabandoned embankment’ssurface.Awatertablewasperchedonthe permafrosttableinTH20-01andTH20-02.WealsointerceptedawatertableinTH20-04.
Weconducteddirectsheartestsontwosetsofthree unfrozensamplesoftheweatheredwhitemicaschist collected4.9–5.2mbgsinTH20-04(samplelocations notshownonFigure5).Thesesampleswerecollected fromtheunfrozenlayerabovethepermafrosttableand testedatabove-freezingtemperatures.Althoughthesampleswerenotorientedinacardinaldirectionwhentaken inthe field,thefoliationwithintheschistwas
Table3. SummaryofprecipitationdataforColdfoot,Alaska (SNOTEL958;USDA,n.d.).
Water Year Total Precipitation (cm)
Average Snowfall Depth (cm) Peak Snowfall Depth (cm) Dateof First Snow Dateof Last Snow 201846.538.2111.810/5/20175/19/2018 201957.236.9149.910/14/20185/22/2019 202053.636.9114.310/5/20195/15/2020 202156.9 20.181.310/25/2020 5/11/2021 202247.833.6104.19/20/20215/13/2022 202365.527.188.910/5/20225/16/2023
Dataaresummarizedbywateryear.Themostnotablewinterduring thisperiodofobservationisinbold.
approximatelyperpendiculartothelongaxisofthesample,orapproximatelyparallelwiththegroundsurface. Thefollowingisasummaryoftheaverageresults obtainedfromthetests:dryunitweightof16.76kN/m3; gravimetricmoisturecontentof6.4percent,frictionangle of30.8degrees,andcohesionof8.79kPa.
Duetohardwareconflictsandprogrammingissues, wewereunabletoobtainlong-termdatafromthetemperaturecablesinstalledintheborings,despitemultiple attemptstotroubleshootthesystemwiththeaidofthe vendor.Becauseofinterferencewithrecordingotherdata fromthesite,wedisconnectedthetemperaturecablesin 2022.Fortunately,theM-IPIscontaintemperaturesensors ineachoftheirinstrumentedsegments.Althoughuncalibrated,thesesensorscanserveasabackupfortemperaturemeasurements(DarrowandJensen,2012).Asan example,Figure6containstemperatureprofilesfor TH20-01formonthsforwhichwehavecompletedata. At1mbgsinTH20-01,theembankmenttemperature rangedbetween 5°Cand15°C.Thedepthofzero annualamplitude(ZAA)wasat6.6mbgsin2020and 2021,deepeningto7.1mbgsin2022(theinterpretation ofZAAdepthislimitedtothespacingofthesensors withintheM-IPI).ThedeepestthawatTH20-01occurred inSeptemberorOctober,dependingontheyear.
Figure3ccontainstheporewaterpressuremeasurementsfromboth2018VWPs(eachat3.0mbgs)and fromthesouthernmostVWP(TH20-04at8.0mbgs)as
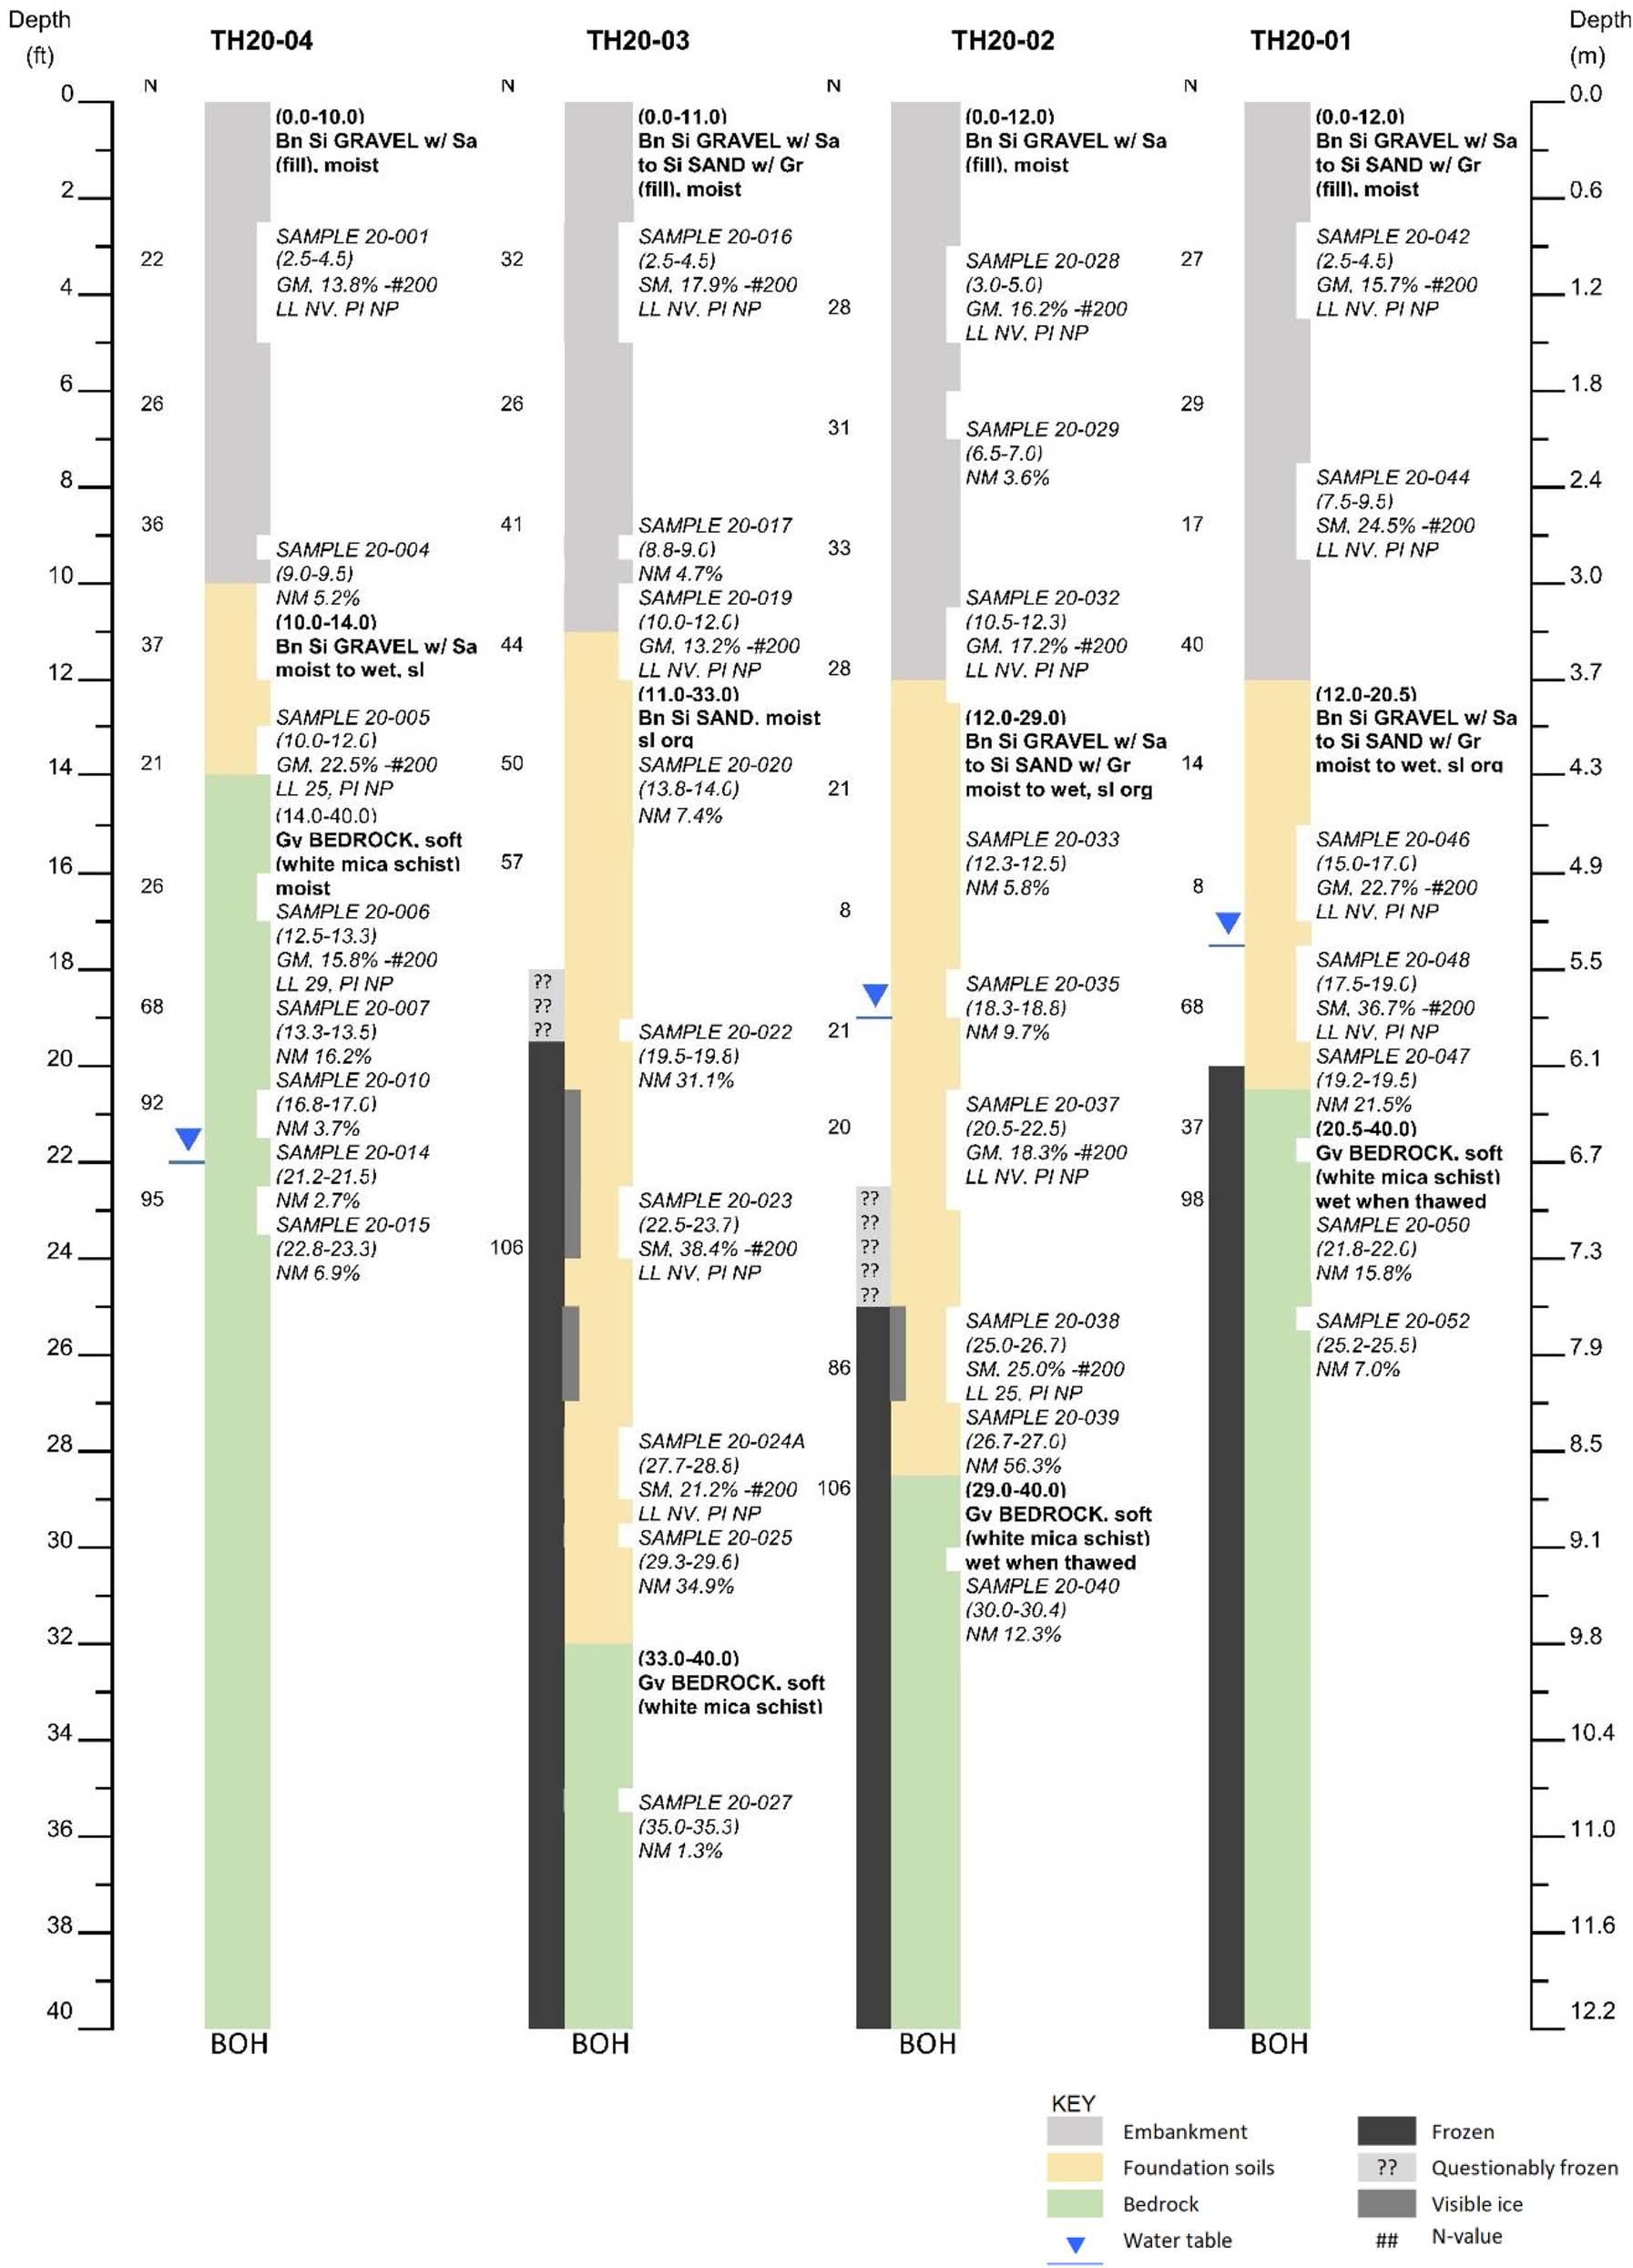
Figure5.Schematicsofthe2020boreholes,presentedfromsouthtonorthtomatchtheorientationofcross-sectionA-A 0 (Figures1dand9). Depthsareinfeettomatchhowtheywerelogged(metersareprovidedontherightforreference).

examplesofthe2020installations.TheVWPinstrumentsalsocontainthermistorbeads,allowingtemperaturemeasurementsattheinstallationdepth(Figure3d). Typicaldataindicatedtwopeaksinwaterpressure,the firstoccurringwiththeendofsnowmeltinmid-tolate Mayandthesecondoccurringwiththeincreaseinlate summerprecipitationinlateJuly.TheTH18-01installationfailedonFebruary24,2020,afteritwasoverrunby thetoeofFDL-A.Followingthebelow-normalsnowfall duringthewinterof2020/21,theVWPinTH18-02 frozeinearlyApril2021,causingaspikeandsubsequentdropinwaterpressure.FDL-AcoveredtheTH1802locationinJuly2021,afterwhichtheVWPthawed; however,asthefreezingmayhavedamagedthediaphragmwithintheVWP,thedatamaynolongerbe accurate.TheotherVWPsdidnotexperiencefreezing. Peaktemperaturesoccurredinearlytomid-September at3.0mbgsinTH18-01andinlateSeptembertolate Octoberat8.0mbgsinTH20-04.
Figure7containsgraphsofthetemperaturesrecorded bythetiltmetersandpressureplates(Figure7a)andthe pressureplate(Figure7b)andtiltmeter(Figure7c) readings.Asallofthesedeviceswereburiedwithin0.6 m(2ft)ofthesurface,themeasuredtemperaturesdemonstratedseasonal fluctuations.Thetemperaturesfrom pressureplate1(PP1)andtiltmeter1(Tilt1;both installednearTH20-01)wereabout2.4°Cwarmerduringthewinterof2022/23andabout4.2°Ccoolerin thesummerof2023thantheotherreadings.Weattribute thistothetoeofFDL-Acoveringthispartofthe embankmentinthelatesummerof2022,whichwe observedinthe fieldinJuly2022.
Thepressureplatesarecomposedofstainlesssteel plateswithde-airedhydraulicoilasaworking fluid
(Geokon,2020).Thepressurereadingsarecorrectedfor temperature;however,weattachedthepressureplatesto steelplatestomakethemmorerobustagainsttheimpact ofFDL-A.Thesteelplatesmaybeaddingadditional temperaturesensitivitytothepressureplatereadings (Figure7b),asallreadingsincreasedwithsub-freezing temperaturesandthendecreasedastheembankment thawedinthespring.Thewinterincreaseinpressurealso maybeattributedtopressureexertedbytheembankment soilsastheyunderwenttheseasonalfreeze–thawcycle. ThePP1readingsincreasedmorethantheothersduring thewintersof2021/22and2022/23,andalthoughthe readingsalsodroppedwiththespringthaw,theycontinuedtoincreasethroughthesummer.AlthoughthePP4 readingsalsoincreasedduringwinterof2022/23,we knowfromvisualobservationsthatFDL-AisnotimpactingtheTH20-04location.Oneofthetiltsensorsatthe TH20-01location(Tilt1A;Figure7c)alsostartedto deviatefromtheotherreadingsonAugust2,2022.These changesaremostlikelyduetotheimpactofFDL-A.Furtherobservationsduringthelandslide–embankmentcollisionarerequiredforafullexplanationofthepressure plateandtiltmeterdata.
Figure8acontainsplotsoftheM-IPImeasurements forthefour2020boreholes(locationsprovidedinFigure 1d)intheA0direction(i.e.,thedirectionofgreatest movement downslope).Wedetectedmovementin TH20-01,TH20-02,andTH20-03immediatelyuponthe firstreadingonSeptember6,2020,whilethetoeof FDL-Awasstillmorethan10maway.Figure8bisa graphoftherateofhorizontaldisplacementforselected depthsalongeachofthefourM-IPIs.Inthisanalysis, forTH20-01throughTH20-03,weselectedthesensorat thedepthexperiencingthemostchange;forTH20-04,
Figure7.Pressureplateandtiltmetermeasurementsovertheprojectmeasurementperiod.(a)Temperaturesfromallpressureplateandtiltmeter devices.(b)Pressureplatereadings.(c)Tiltmeterreadings.
wechoseamediandepthwithintheembankment. Throughtheperiodofobservation,therateofdisplacementinTH20-04hasbeensteady,atanaveragerateof 0.013mm/d.Aftertheirinstallation,thenorthernthree M-IPIsdemonstratedsimilarratesofdisplacement,peaking atanaveragerateof0.223mm/d.Unfortunately,thereare missingdatafromthewintersof2020/21and2021/22due tohardwareconflictsandprogrammingissues;however, theperiodsofexistingdatasuggestthatTH20-01startedto divergewithagreaterhorizontaldisplacementrateinJune 2021andhascontinuedthistrendthroughouttheobservationperiod.ThenorthernthreeM-IPIsalldemonstrated peaksinmovementratesometimebetweenmid-October andmid-Novemberandtheslowestmovementratesin mid-MaytoearlyJune.Thesedataareingoodagreement withpreviousanalysisofstrainratedatafromaM-IPI installedwithinFDL-Ain2012,fromwhichapredictive formulaindicatedamaximumvelocityinthefallanda minimumvelocityinearlyspring(Darrowetal.,2017).
Figure9isschematicillustratingthesimplifiedsubsurfaceandincludesthecumulativedisplacementofthe M-IPIsastheyarepositionedalongtheembankment;in thisschematic,allcumulativedisplacementsaredrawn tothesamehorizontalscale.Thesedataindicatethatthe baseofFDL-Aisshearingintotheweatheredbedrock (TH20-01)andbelowthepermafrosttable(TH20-01 throughTH20-03).ThesedataalsoindicatethatFDL-A hasdisplacedtheareaaroundTH20-01approximately 0.32mhorizontally,withthisM-IPIdemonstrating
aboutthreetimesmorehorizontaldisplacementthan TH20-02orTH20-03.TheM-IPIinTH20-04demonstratesaslowandsteadydownslopemovementofthe embankmentmaterial,indicatingthatFDL-Ahasnotyet startedtoimpactthisportionoftheembankment.The subsurfaceinterpretationinFigure9alsoindicatesthat therearesomevariationsinthebedrocksurfacebeneath theembankment.Forexample,weinterprettheTH2003areaasapaleo-drainage,asthisareawasalsooccupiedbythemoderndrainagebeforeFDL-Amodifiedits path.Resultsfromothersubsurfaceinvestigationsinthe area(e.g.,Simpsonetal.,2016)indicatedthatthebedrocksurfaceistypically3.7mbgs,similartotheTH2001location.
Wetookthedifferencebetweenthe2021datasetand ourdatasetcollectedin2020(notpartofthisproject) andthedifferencebetweenthe2022and2021datasets, producingDEMsofdifference(DoDs);seeFigure10. Weassumedspatiallyuniformerrorsandappliedthe squarerootofthesumofsquarestocalculatetheerror oftheDoDs(Wheatonetal.,2010),whichwas0.43m. BothDoDsweremaskedtoexcludedifferencesofless than0.5mtobeconservative.Someerrorsstillremain intheDoDs;forexample,the2021–2020differencing indicatedmovementwherethereshouldbelittle(e.g., greenareaswestoftheembankmentinFigure10a).This

Figure8.M-IPIdatafortheperiodofanalysis.(a)CumulativedisplacementmeasurementsintheA0direction(i.e.,directionofgreatestmovement)forselecteddates.Boreholesarepresentedfromsouthtonorthtomatchthecross-sectionA-A 0 orientation(Figures1dand9).Notethe changeinthecumulativedisplacementscalebetweenTH20-01andremainingboreholes.(b)Ratesofhorizontaldisplacementforselecteddepths. Cum.Displ. ¼ cumulativedisplacement.
maybeduetoacquiringthe2020lidarafterleaf-out inthespring,asthispartoftheembankmentiscoveredbydenseshrubs.The2021datasetcontained pixelatedareasthatproducedartifactsandanapparentelevationgain(greenareaindicatedbypurple arrowinFigure10b)alongtheeasternpartofthe embankment,whichiserroneousbasedonvisual observationsofthesite.
Despitetheseerrorsandartifacts,theDoDsalsoillustratedramaticchangesinthepositionofFDL-A,with verticalchangesupto8.2masthetoeadvancedtoward theembankment.The2021–2020DoDalsocaptured sediment fillingasmallbasinattheinletofaculvertthat usedtoprovidecross-drainageforthestreamdraining fromFDL-A(indicatedbytheredarrowinFigure10a). Asanothermeansofchangedetection,thelocationsof FDL-A’stoe,asmappedusingtheRTK-GPSdevice from2020until2023,areprovidedinFigure10c.These curvesillustratetheproximityofthetoetoTH20-01by July2023.
BasedontheM-IPIdata,FDL-Awasshearingapproximately4mbelowthebottomoftheDaltonHighway embankmentattheTH20-01locationbeforethisproject startedin2020andwhilethelobewasstillmetersaway. Figure11illustratesthemovementprocessesevidentin March2021.Thedailyphotograph(Figure11a)indicated anoverallsteepeningofthetoe.Duringatriptothesite thatmonth,wenotedashearplanethatdaylightedin FDL-A’stoe,about3mabovethegroundsurfaceinfront ofthelobe(Figure11b).Figure11cisascaledconceptual modelofthetoeofFDL-A;thegroundsurfacewas derivedfromthe2020lidarDEM.Wedeterminedthe thicknessofFDL-AnearitstoeusingTH22-02;although thisboreholewasdrilledforadifferentprojectandisnot discussedinthispaper,weincludeitspositionheretoconstraintheconceptualmodel.Basedon fieldobservations andtheM-IPIdata,wehypothesizethatadécollement
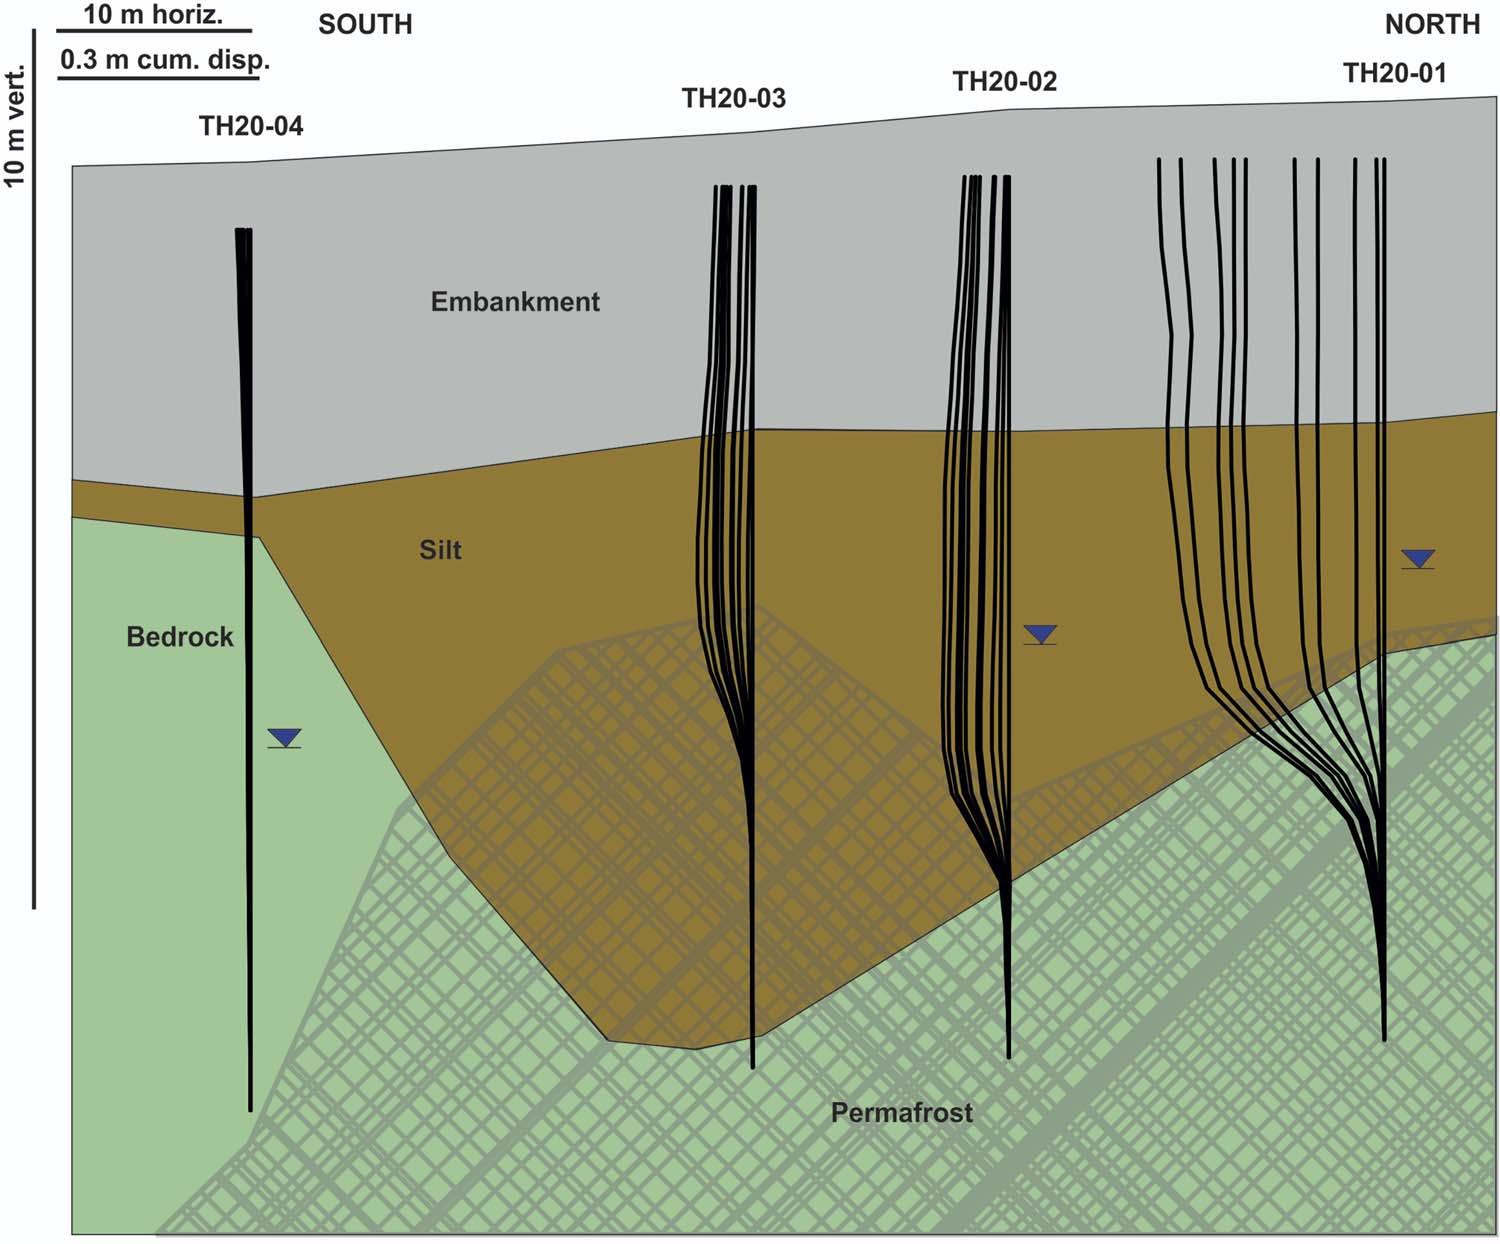
Figure9.Schematicinterpretationofthesubsurfacealongcross-sectionA-A 0 (asindicatedinFigure1d),withcumulativedisplacementofthe fourM-IPIssuperimposed.Thedisplacementisperpendiculartothecross-section(i.e.,90degreesfromwhatisshown,or “intothepage”);the schematichas4.5timesverticalexaggeration.vert. ¼ vertical;horiz. ¼ horizontal;cum.disp. ¼ cumulativedisplacement.
formsthebaseofFDL-A,whereitsmassshearsalongthe bedrocksurface(Figure11c).Aseriesofminorthrust faultsoriginateatthedécollementanddaylightwithin thetoeslope;theyalsoformtheinterfacebetween FDL-Asoilandtheoriginalgrounddownhillofit. OnlythedécollementwasevidentintheTH20-01MIPIdatainMarch2021,approximately7.6mbelowthe embankmentsurfaceandabout1.3mbelowthebedrocksurface(Figure11d).
BeginningSeptember19,2021,inthedailyphotographsweobservedamoundofsoilrisingfromthe groundsurface(redovalinFigure12a).Thismound, locatedbetweenFDL-AandTH20-01,wasobviousduringatriptothesiteinOctober2021(Figure12b).Our camerainstalledatthenorthendoftheFDL-Asite recordedtheformationofthesoilmound(redovalin Figure12c),aswellasFDL-Apushinganear-surface layerofsoilinfrontofittowardtheembankment(northernextentofshearedsoilsindicatedbytheorangearrow andcurveinFigure12c).Wehypothesizethatthe moundformedassoilwasforcedupwardduetorotationalmovementandbucklingasFDL-Aapproachedthe embankment(Figure12d).Duringthefallof2021,the M-IPIatTH20-01continuedtodemonstratesteady
horizontaldisplacementatthedécollementlocatedwithin theupperbedrock(Figure12e).
Basedon fieldobservations,andRTK-GPSmeasurementsofFDL-A’stoeandthetoeoftheembankment, FDL-Astartedtooverlapthesideslopeofthehighway embankmentinJuly2022.Thenextnoteworthychange inthewestwardprogressionofFDL-Awasthebacktiltingoftreesthatbecamevisibleinthedailyimageson March1,2023(Figure13a).Thissuggestsashallowrotationalfailureofthetoe,possiblyalongoneofthethrust faultsdevelopedduringthefallof2021.Duringa field visitinJune2023,wenotedthepresenceofscarpsand down-droppedblocksinthevicinityoftheback-tilted trees,whichisadditionalevidenceofrotationalfailure (Figure13b).Figure13cillustratesthelocationofthe shallowrotationalfailurerelativetothethrustfaultsand décollement,thelatterofwhichcontinuedtobedemonstratedbytheM-IPIinTH20-01(Figure13d).
BySeptember2023,therewereseveralpulsesofsoil slumpingdownthetoe,causingthetreestorotateforwardtowardtheembankment(Figure14a).Theremoval ofthiswetandloosesurfacelayeragainexposedthe minorthrustfaultsdaylightinginFDL-A’stoe(indicated byorangelinesinFigure14b).Figure14cillustratesthe multipletypesofmovementnowobservedwithinthe
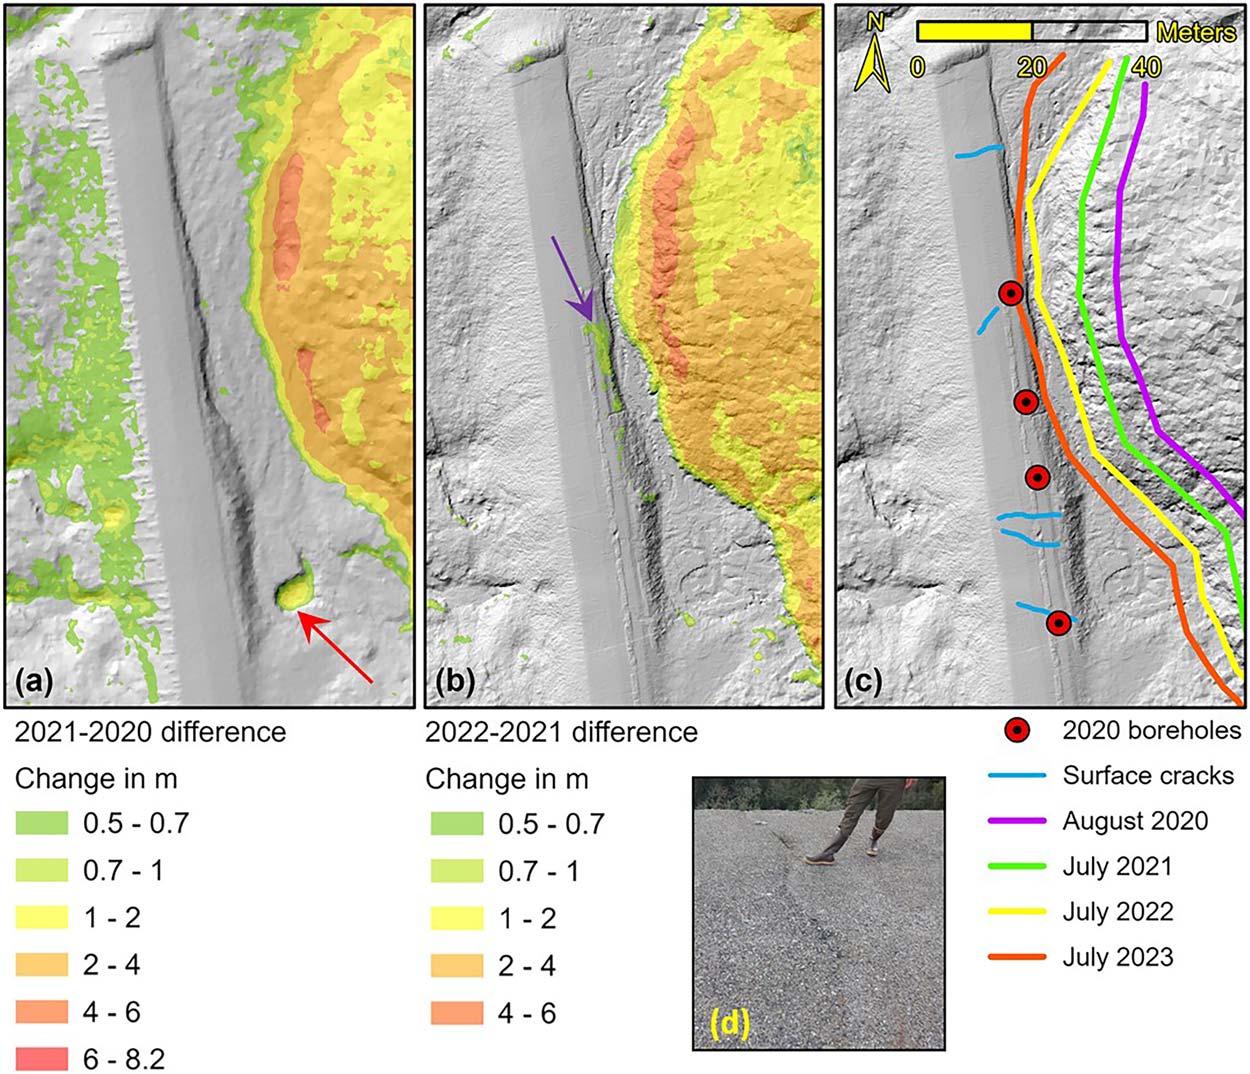
Figure10.ChangedetectionatthetoeofFDL-A.DoDsfor(a)2020–2021and(b)2021–2022.(c)LocationsofFDL-A’stoeprogressionfor 2020–2023,andpersistentcracksintheembankmentasmeasuredinMay2023.(d)Exampleofonecrack(person’slegsforscale;photograph takenJuly26,2023).Basemapdataare2020and2022lidar(unpublished).
toeofFDL-A.TheM-IPIreadingsinTH20-01(Figure 14d)indicateddownslopeleaningofthedevicebeginningabout2mbelowtheembankmentsurface.We interpretthisasFDL-A’smass finallyimpactingthe embankmentatandabovetheoriginalgroundsurface, whichiscorroboratedbythepressureplateandtiltmeter readingsnearTH20-01(Figure7)andthroughvisual observations. Certaindeformationfeaturesdemonstratedduringthe collisionofFDL-Awiththeabandonedpartofthe
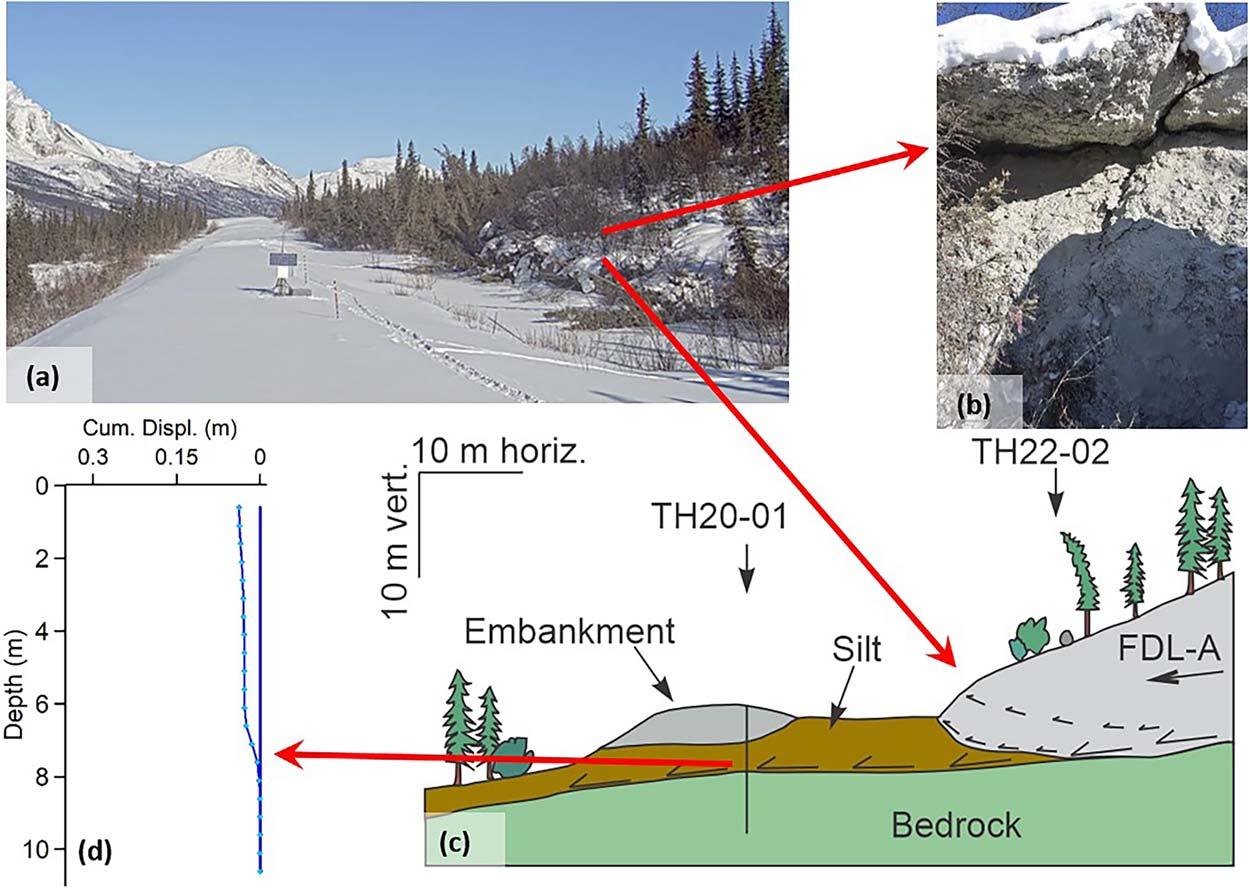
Figure11.FDL-AmovementandinteractionwiththeabandonedDaltonHighwayembankmentinMarch2021.(a)Dailyphotographofthe embankmentandFDL-Atoe(takenMarch20,2021).(b)PhotographoftheshearplanedaylightedinthetoeofFDL-A(takenMarch20,2021). (c)SchematicofmovementprocesseswithlocationsofTH20-01andTH22-02.(d)M-IPIdataforTH20-01forMarch2021.vert. ¼ vertical; horiz. ¼ horizontal;Cum.Displ. ¼ cumulativedisplacement.
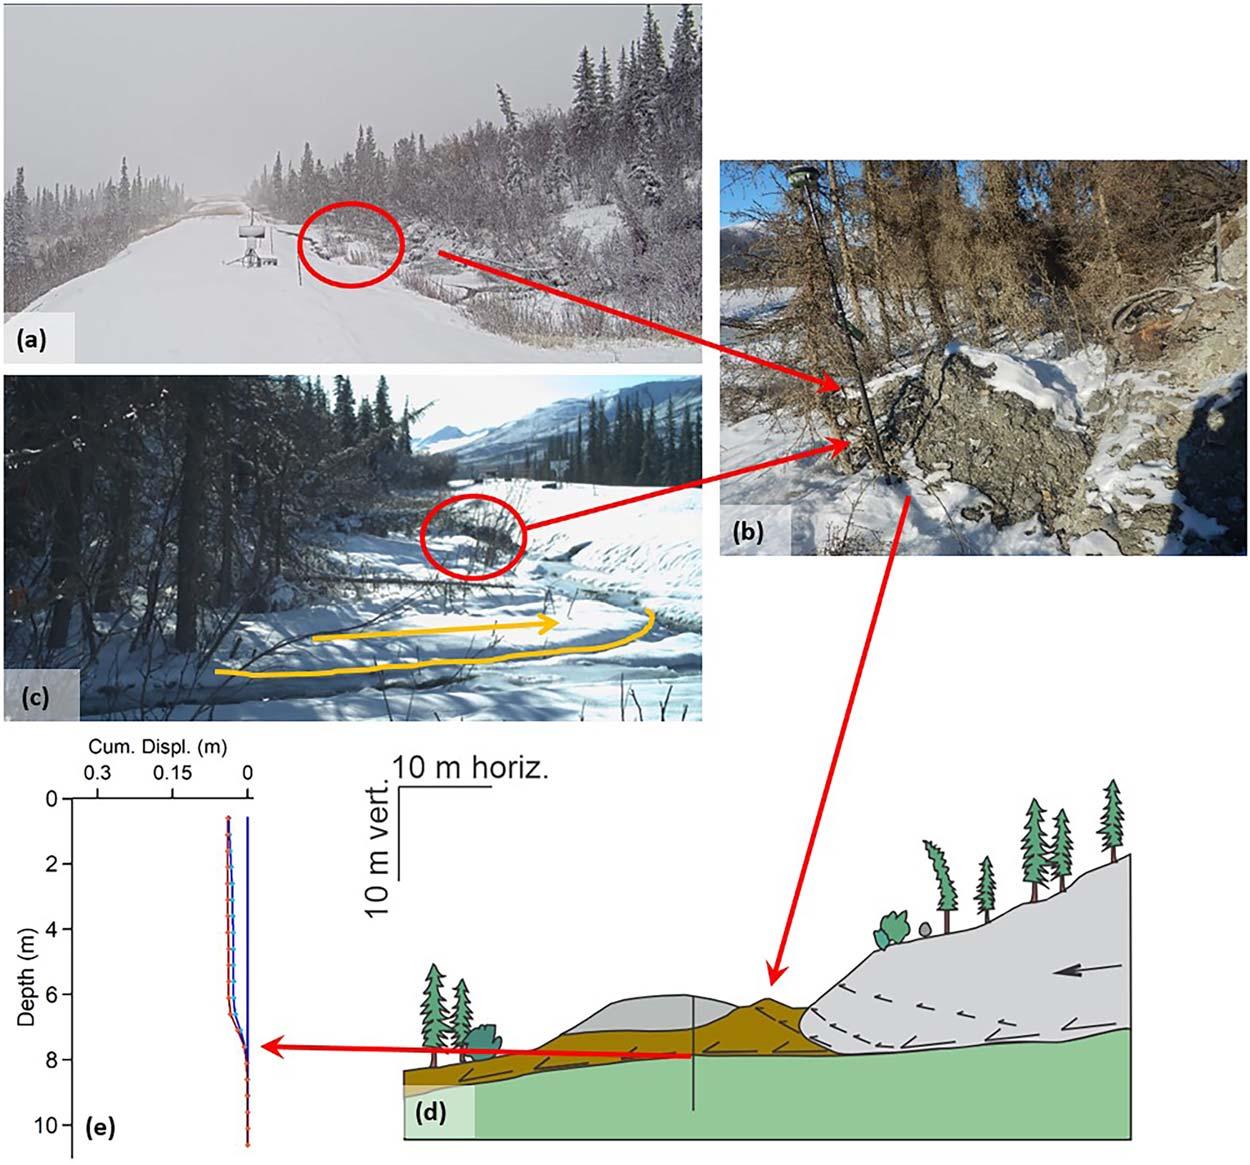
Figure12.FDL-AmovementandinteractionwiththeabandonedDaltonHighwayembankmentinSeptember2021.(a)Dailyphotographofthe embankmentandFDL-Atoe(takenSeptember19,2021)withanupliftedsoilmoundindicatedbytheredellipse.(b)Photographofthesoil moundatthetoeofFDL-A(takenOctober2,2021).(c)Annotatedphotographfromthenorthcamera,indicatingthesoilmoundandshearingof surfacesoil.(d)SchematicofmovementprocessesforSeptember2021.(e)M-IPIdataforTH20-01forSeptember2021.vert. ¼ vertical; horiz. ¼ horizontal;Cum.Displ. ¼ cumulativedisplacement.
DaltonHighwayembankmentareanalogoustopro-glacialpushmoraines.Forexample,theareaofnear-surface soilshearingcapturedbythenorthcamerainOctober 2021(Figure12c)issimilartoaforelandwedge,andthe soilmoundformedduringthesametimemayrepresent distalfoldingaheadofthethrustfaultswithinthetoe (Bennett,2001).Likewise,themajorshearzoneatthe baseofFDL-Acanbeinterpretedasadécollement,above whichFDL-Ashearsdownslopeandbelowwhichnosignificantdeformationoccurs(AberandBer,2011).The resultsofthedirectsheartestsoftheunfrozenweathered whitemicaschistindicateamoderatefrictionangleof 30.8degreesandlowcohesionof8.79kPaalongfoliation.Forcomparison,GonzálezdeVallejoandFerrer (2011)listvaluesof20–30degreesand2–15MPafor frictionangleandcohesion,respectively,forfreshschist alongfoliation.Recognizingthatthesesampleswere testedunderthawedconditionsanddonotnecessarily reflectthestrengthofthefrozenbedrock,thislowcohesionsupportsthehypothesisthattheweatheredbedrock representsaweaklayerwithanunfavorablefoliationorientationalongwhichFDL-Ashearsdownslope. Basedonthelimitedsubsurfacedatausedtoproduce theconceptualmodels,wehypothesizethatthebedrock surfaceisparallelwiththegroundsurfaceattheresearch
site.Thisgeometry,aswellasFDL-A’sshearingwithin aweakzoneintheupperbedrock,lendsitselftoinfinite slopeanalysis(Cornforth,2005;Duncanetal.,2014). UsingthegeometrydefinedintheschematicinFigure 15aandassumingnogroundwater,theresistingshear force(S)canbecalculatedusing:
S ¼
/ (1) where c iscohesion, r isgeostaticstress,and / isthe frictionangle(Cornforth,2005).Forthiscalculation,we assumea1by1msoilcolumn(b equals1).Eq.1representsthetotalshearforce.Todeterminetheportionof theshearforceresistingthemovementofFDL-A (SFDL),wemustresolvethegeostaticstressintoitsprinciplecomponentsandsubtractthecomponentoriented inthedownslopedirection(i.e.,thelastterminEq.2):
FortheTH20-01location,thereis3.66mofembankmentwithamoistunitweightof21.95kN/m3,basedon typicalmaximumunitweights,optimummoisturecontent
cb cosb þ b cos br tan SFDL ¼ cb cosb þ b cos br tan / b r sin b (2)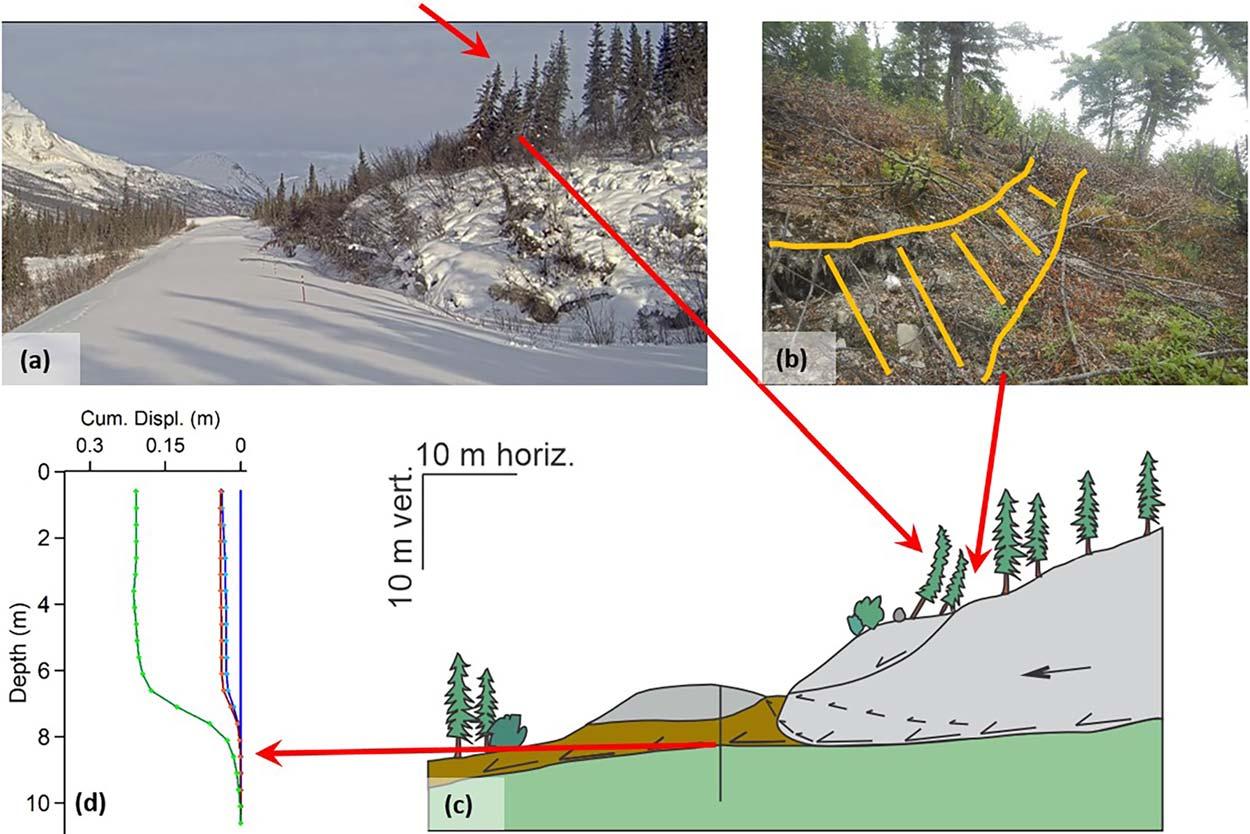
Figure13.FDL-AmovementandinteractionwiththeabandonedDaltonHighwayembankmentinMarch2023.(a)Dailyphotographofthe embankmentandFDL-Atoe;thearrowpointstoback-tiltedtrees(takenMarch1,2023).(b)Photographofascarp(indicatedinorange)uphillof theback-tiltedtrees(takenJune22,2023).(c)SchematicofmovementprocessesforMarch2023.(d)M-IPIdataforTH20-01forMarch2023. vert. ¼ vertical;horiz. ¼ horizontal;Cum.Displ. ¼ cumulativedisplacement.
ofsoilfromlocalmaterialsites(Maxwell,2016),and95 percentcompaction.Recognizingthattheembankmentis notcontinuousacrosstheentireslope,wetreateditasa striploadandreducedthisverticalstressusinganinfluencefactorandtheprincipleofsuperposition(Osterberg, 1957).Figure15bisaschematicofthepositionofTH2001withintheembankment;weassumedauniform embankmentthicknessforthesecalculations.Thevalues A1, B1, A2,and B2 weredeterminedfromlidardata.We reducedtheverticalstresscausedbytheembankmentat
thedepthofshear(indicatedbyareddotinFigure15b) bydividingtheembankmentintotwoportions,andcalculatingtheterms
,and
.Usingthetwo pairsofterms(i.e.,either
and
or A
and B2 z ), wedeterminedinfluencefactorsforeachportionofthe embankmentusingtheOsterberg(1957)chart,addedthe influencefactorstogether,andthenmultipliedtheresult totheverticalstressfromtheembankment,resultingin 71.5kPa.Theembankmentisunderlainby2.59mofsilty
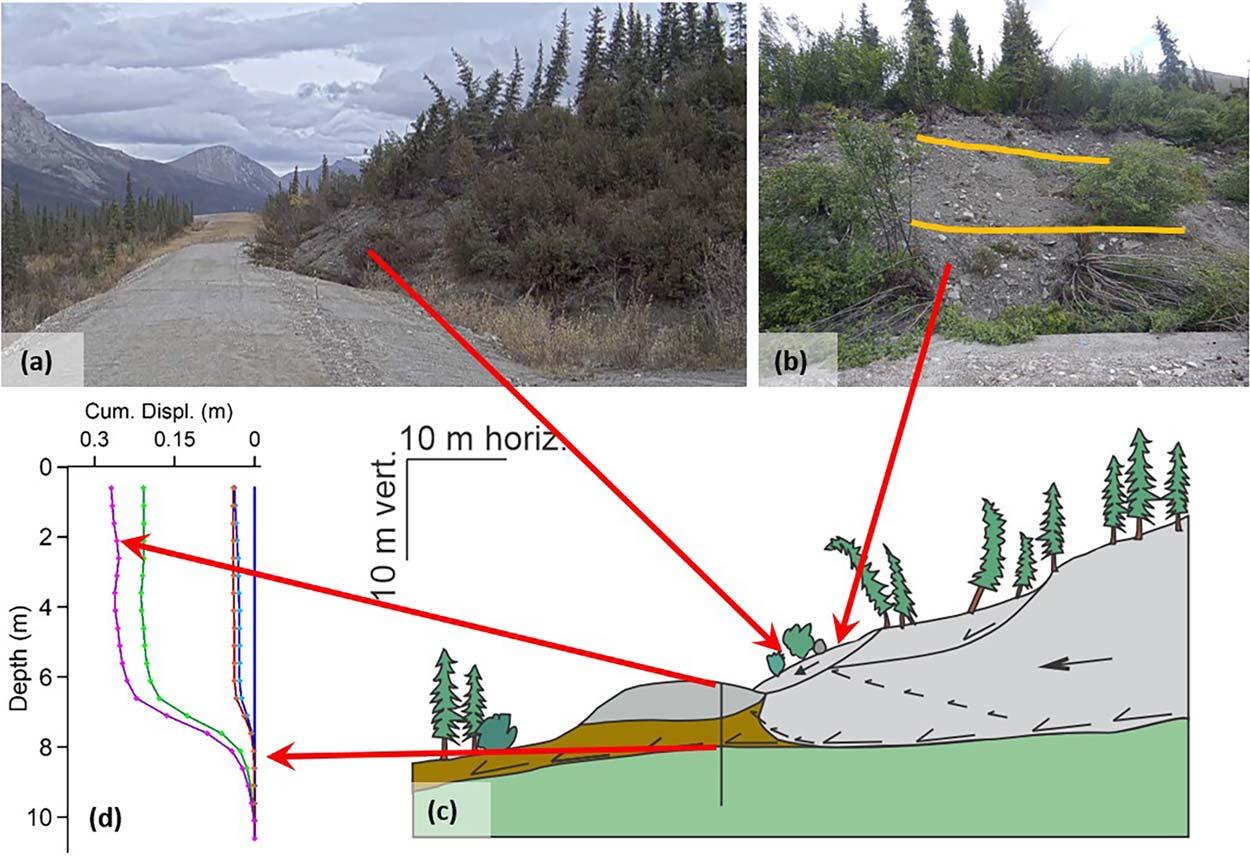
Figure14.FDL-AmovementandinteractionwiththeabandonedDaltonHighwayembankmentinSeptember2023.(a)Dailyphotographofthe embankmentandFDL-Atoewithsurfaceslumpingontothehighwayembankment(takenSeptember9,2023).(b)Photographofminorshear zones(indicatedinorange)daylightingwithinthetoeofFDL-A(takenJune20,2023).(c)SchematicofmovementprocessesforSeptember 2023.(d)M-IPIdataforTH20-01forSeptember2023.vert. ¼ vertical;horiz. ¼ horizontal;Cum.Displ. ¼ cumulativedisplacement.
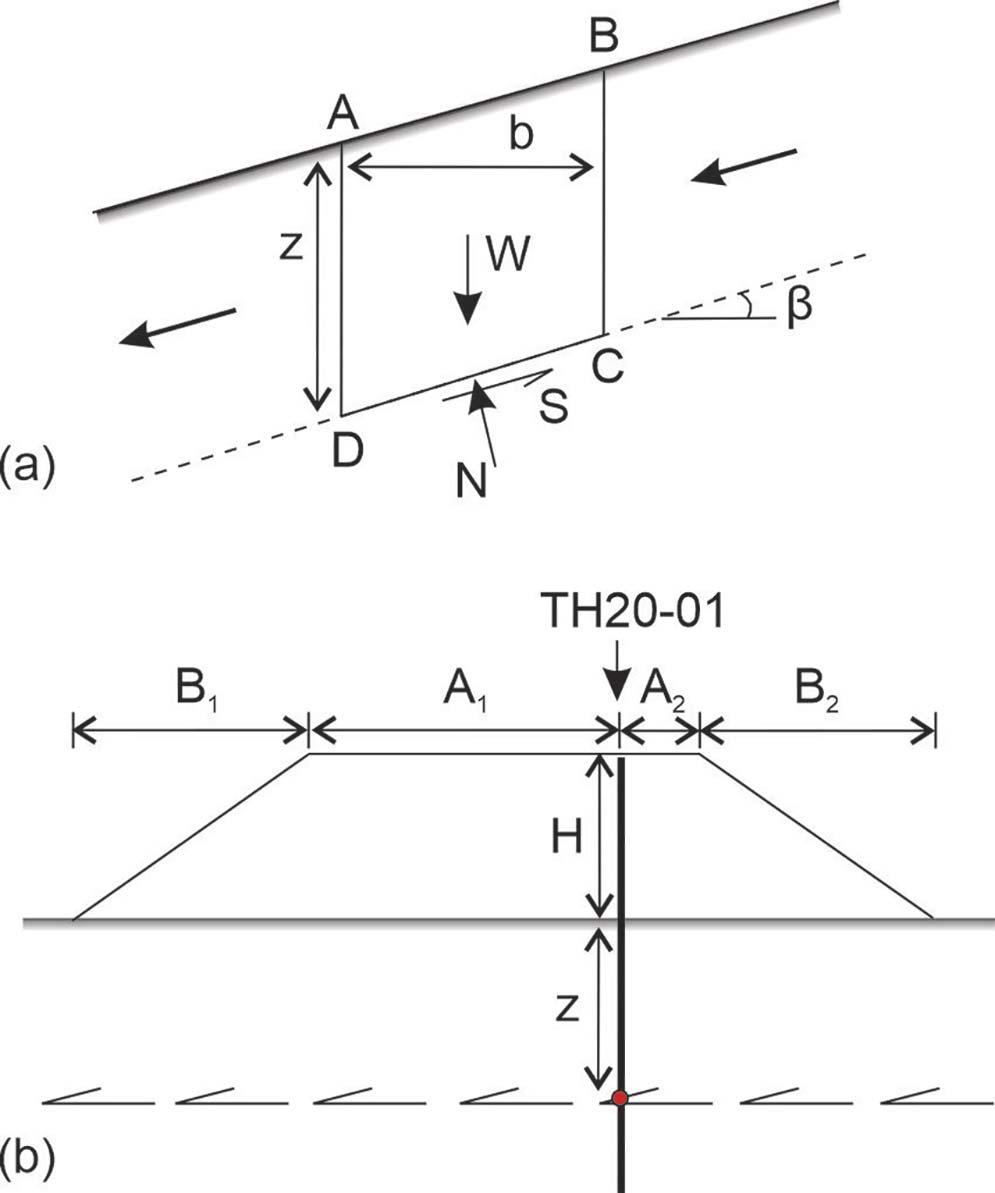
sandwithanassumedmoistunitweightof19.75kN/m3 (Codutoetal.,2011),inturnunderlainby1.35mof weatheredwhitemicaschistbedrockabovetheshearsurfacewithaunitweightof17.83kN/m3.Thisresultsina totalgeostaticstressof146.7kPaatthedepthofshear (7.6m).Forthe b angle,weusedthelidardatatocalculateaslopeangleof7.0degreesadjacenttoFDL-A.For c and /,weusedtheresultsfromthedirectsheartestson thewhitemicaschistsamples(c of8.79kPaand / of 30.8degrees).Theseassumptionsyieldedan SFDL of77.8 kN/mwidth.SinceFDL-Aismoving,weassumeafactor ofsafetyof1,meaningthat77.8kN/mwidthistheminimumvalueofthedrivingforceaswell.Thissimple approach,withallofitsassumptions,providesanorderof magnitudefortheimpactfromFDL-A.
Aspreviouslyindicated,theM-IPIinTH20-01 recorded »0.3mofhorizontaldisplacementbetween September6,2020,andNovember1,2023.Thedisplacementisnotyetdiscerniblethroughclosevisual inspectionofthedailyphotographsorthroughthe DoDs,butthishorizontaldisplacementismanifestedas cracksintheembankment(Figure10candd).In2022, wenoticedpersistentcracksintheembankmentsurface andmappedtheirpositionsusingtheRTK-GPSdevice inMay2023.Itispossiblethatthesecracksformedthrough thawsettlement,asthisportionoftheembankmentisno
longermaintained;however,theirlocationsandorientations alsosuggestthattheycouldbeduetohorizontalshearing fromFDL-A.ByJuly2023,thenorthcamerawasindangerofbeingoverrunbyFDL-A’stoe.Wemovedthis cameratothewestoftheembankmentinalocation wherewehopetocaptureevidenceoftheembankment’s horizontaldisplacement.
FDL-A’sannualizedmovementrateforJuly2022to July2023was7.96m/yr.ThedatapresentedinFigure4 indicatedareductioninthemovementratesince2020, whichweattributemainlytocoolingofthelobedueto lowandlatesnowfallduring2020/21.Thishypothesisis supportedbyasimilarslowinginnearlyallmonitored FDLsafterthatwinter.Thisreinforcespreviouswork indicatingthatFDLmovementiscloselytiedtoitsinternaltemperature,whichiscontrolledbyairtemperature andprecipitation,especiallysnow(Darrowetal.,2017). UnliketheotherFDLs,FDL-Aalsohasbeeninteracting withthehighwayembankment,whichmayserveasan additionalimpedimenttoslow althoughnotstop its downslopemovement.Continuedmonitoringwillresolve thisquestion.
ResultsfromourinitialresearchindicatedthatFDL-A wasanimpendingthreattotheDaltonHighway.Based ontheseresults,ADOT&PFrealignedthehighwayto avoidthegeohazard,leavinginplaceasectionofthe abandonedembankment,whichweinstrumentedin 2020.Theintegrationofmultipledatasetsobtained throughthisfull-scale fieldexperimenthasallowedusto produceadetaileddescriptionofthecollisionofalandslideinpermafrostwithanengineeredembankment. Althoughwehavemade fieldobservationsofthissite foroveradecade,thisprojectmadeitpossibletounderstandthenuancesofmovement.Forexample,whilestill metersawayonthesurface,FDL-AwasalreadyimpactingtheDaltonHighwayembankmentbyshearingwithin theupperbedrockat7.6mbelowtheembankmentsurfaceinoneoftheboreholelocations.FDL-Amade “official” contactwiththehighwayembankmentinJuly 2022andhashorizontallydisplacedaportionofthe embankmentby »0.3masofNovember1,2023.Using theinfiniteslopeapproachandstrengthpropertiesdeterminedfromlaboratorytesting,weestimatethatFDL-A isimpactingthehighwayembankmentandunderlying soilswithatleast77.8kN/mwidthshearforce.Asthis force,manifestedbythemeasuredhorizontaldisplacement,occursatdepthbelowthebottomoftheembankment,wepostulatethatthepresenceoftheembankment willdolittletostopFDL-A’sdownslopeprogression. AnalysisofthedatapresentedheresupportsthehypothesisthatFDL-A’sannualizedmovementrateistiedtoground
temperatureandthussensitivetochangesinairtemperature andprecipitation(namely,snow).Wealsoreconfirmthat FDL-A’speakmovementrateoccursinlatefall theperiod ofdeepestthaw,asmeasuredintheembankment.ManyfeaturesobservedatthetoeofFDL-Abetween2020and2023 aresimilartopushmorainesproducedinapro-glacial environment.Alloftheseobservationscanbeincorporated intomodelingofthelandslidetodetermineappropriate andeffectivemitigationmeasures.Withcontinuedmonitoring,wehopeto1)obtainproofofconceptforthetilt meterandpressureplateinstrumentation,2)observehorizontaldisplacementwithintheembankmenttoverifythe causeofcrackinginthesurface,and3)determinehowthe presenceoftheabandonedDaltonHighwayembankment affectsthemovementcharacteristicsandlong-termmovementratesofFDL-A.
Inseveralplacesinthisarticle,wereferredto changesobservedindailyimagesfromthecamerasat theresearchsite.Asanimatedsequencesprovideabettermeansforvisualizationthanstaticimages,theFDL website(UAF,n.d.)providestime-lapsemoviesfrom thenorthandsouthcamerasthatshowtheprogression ofFDL-A’sapproachandcollisionwiththeabandoned DaltonHighwayembankment.
ThisresearchwassupportedbyaPacificNorthwest TransportationConsortiumgrant(UWSC10217),an ADOT&PFgrant(ADN45-2-1065),andongoingsupport fromtheAlyeskaPipelineServiceCompany(APSC).We thankJ.Schwarberforhertruegritduringthe2018 field work,andP.Presler,J.Simpson,P.Lanigan,andS.Parker fortheirexpertiseandenthusiasminthe fieldduringthe 2020geotechnicalinvestigation.WethankD.Cronmiller forguidingustorecentworkonpushmorainesandM.Bray, Y.Shur,B.Leshchinsky,andtheanonymousreviewersfor improvingthispaperthroughtheirthoroughreviewsand suggestions.
Disclaimer
Theviews,opinions, findings,andconclusionsreflectedin thispaperaretheresponsibilityoftheauthorsonlyanddonot representtheofficialpolicyorpositionoftheADOT&PF, APSC,U.S.ArmyCorpsofEngineers,orotherentity.
ABER,J.S. AND BER,A.,2011,Glaciotectonicstructures,landforms, andprocesses.InSingh,V.P.;Singh,P.;andHaritashya,U.K. (Editors), EncyclopediaofSnow,IceandGlaciers:Encyclopedia ofEarthSciencesSeriesSpringer,Dordrecht,theNetherlands, https://doi.org/10.1007/978-90-481-2642-2_217
ADOT&PF(AlaskaDepartmentofTransportationandPublicFacilities), 2020, AlaskaDOT&PFRouteCenterlines:Electronicdocument, availableat https://dot.alaska.gov/stwddes/gis/shapefiles.shtml
ADOT&PF,n.d., DaltonHighway:Electronicdocument,availableat https://dot.alaska.gov/highways/dalton/ AGC(AlaskaGeospatialCouncil),2020, AlaskaCoastlineShapefiles: Electronicdocument,availableat https://gis.data.alaska.gov/search? q¼alaska%20boundary
ASTMD854-14,2014, StandardTestMethodsforSpecificGravityof SoilSolidsbyWaterPycnometer: ASTMInternational,West Conshohocken,PA.
ASTMD2487-17e1,2017a, StandardPracticeforClassificationof SoilsforEngineeringPurposes(UnifiedSoilClassificationSystem): ASTMInternational,WestConshohocken,PA.
ASTMD4318-17e1,2017b, StandardTestMethodsforLiquidLimit, PlasticLimit,andPlasticityIndexofSoils:ASTMInternational, WestConshohocken,PA.
ASTMD6528-17,2017c, StandardTestMethodforConsolidated UndrainedDirectSimpleShearTestingofFineGrainSoils:ASTM International,WestConshohocken,PA.
ASTMD6913M-17,2017d, StandardTestMethodsforParticle-Size Distribution(Gradation)ofSoilsUsingSieveAnalysis:ASTM International,WestConshohocken,PA.
ASTMD2216-19,2019, StandardTestMethodsforLaboratory DeterminationofWater(Moisture)ContentofSoilandRockby Mass:ASTMInternational,WestConshohocken,PA.
ASTMD7263-21,2021a, StandardTestMethodsforLaboratory DeterminationofDensityandUnitWeightofSoilSpecimens: ASTMInternational,WestConshohocken,PA.
ASTMD7928-21,2021b, StandardTestMethodforParticle-Size Distribution(Gradation)ofFine-GrainedSoilsUsingthe Sedimentation(Hydrometer)Analysis:ASTMInternational,West Conshohocken,PA.
BENNETT,M.R.,2001,Themorphology,structuralevolutionandsignificanceofpushmoraines: Earth-ScienceReviews,Vol.53,pp. 197–236, https://doi.org/10.1016/S0012-8252(00)00039-8
BYRD,M.R.;DARROW,M.M.;DAANEN,R.P.; AND SCHWARBER,J.A., 2019,Measuringsedimentationduetofrozendebrislobeswithin theBrooksRange,AlaskausingLiDAR. 18thInternationalConferenceonColdRegionsEngineeringand8thCanadianPermafrost Conference,August18–22,2019,QuébecCity,Québec,Canada.
CODUTO,D.P.;YEUNG,M.R.; AND KITCH,W.A.,2011, Geotechnical Engineering:PrinciplesandPractices:PearsonHigherEducation, Inc.,UpperSaddleRiver,NJ,794p.
CORNFORTH,D.H.,2005, LandslidesinPractice: JohnWileyand Sons,Inc.,Hoboken,NJ,596p.
CRUDEN,D.M. AND VARNES,D.J.,1996, Landslidetypesandprocesses:TransportationResearchBoard,U.S.NationalAcademyof Sciences,SpecialReport247,pp.36–75.
DAANEN,R.P.;GROSSE,G.;DARROW,M.M.;HAMILTON,T.D.; AND JONES,B.M.,2012,Rapidmovementoffrozendebris-lobes: Implicationsforpermafrostdegradationandslopeinstabilityinthe south-centralBrooksRange,Alaska: NaturalHazardsandEarth SystemSciences,Vol.12,pp.1521–1537,doi:10.5194/nhess-121521-2012
DARROW,M.M.;DAANEN,R.P.; AND GONG,W.,2017,Predicting movementusinginternaldeformationdynamicsofalandslidein permafrost: ColdRegionsScienceandTechnology,Vol.143,pp. 93–104, http://dx.doi.org/10.1016/j.coldregions.2017.09.002
DARROW,M.M.;DAANEN,R.P.; AND SIMPSON,J.M.,2013,Analysisof afrozendebrislobe:A firstlookinsideanimpendinggeohazard: ISCORD2013:PlanningforSustainableColdRegions,pp.139–148,https://doi.org/10.1061/9780784412978.014
DARROW,M.M.;FREEMAN,A.E.; AND DAANEN,R.P.,2019,Exploring subsurfacetemperaturedynamicsoffrozendebrislobesthrough thermalmodeling. 18thInternationalConferenceonColdRegions Engineeringand8thCanadianPermafrostConference,August 18–22,2019,QuébecCity,Québec,Canada.
DARROW,M.M.;GYSWYT,N.L.;SIMPSON,J.M.;DAANEN,R.P.; AND HUBBARD,T.D.,2016,Frozendebrislobemorphologyandmovement:Anoverviewofeightdynamicfeatures,southernBrooks Range,Alaska: TheCryosphere,Vol.10,pp.977–993,doi:10. 5194/tc-10-977-2016
DARROW,M.M. AND JENSEN,D.D.,2012, EvaluationofMEMS-Based In-placeInclinometersinColdRegions,AlaskaUniversityTransportationCenter:Electronicdocument,availableat https://rosap. ntl.bts.gov/view/dot/25726
DUNCAN,J.M.;WRIGHT,S.G.; AND BRANDON,T.L.,2014, SoilStrength andSlopeStability:JohnWileyandSons,Inc.,Hoboken,NJ,317p. Geokon,2020, InstructionManual,Model4800Series,VWEarth PressureCells:Electronicdocument,availableat https://www.geokon. com/content/manuals/4800/index.html#t¼topics%2Fcover.htm
GINA(GeographicInformationNetworkofAlaska),2001, Interferometric SyntheticApertureRadar(IfSAR):Electronicdocument,availableat http://www.gina.alaska.edu/data/ifsar
GONG,W.;DARROW,M.M.;MEYER,F.J.; AND DAANEN,R.P.,2019, Reconstructingmovementhistoryoffrozendebrislobeinnorthern Alaskausingsatelliteradarinterferometry: RemoteSensingof Environment,Vol.221,pp.722–740, https://doi.org/10.1016/j.rse. 2018.12.014
GONZÁLEZDE VALLEJO,L.I. AND FERRER,M.,2011, GeologicalEngineering:CRCPress/Balkema,NewYork,678p.
GYSWYT,N.L.;DARROW,M.M.; AND DAANEN,R.P.,2017,Using LiDARtoanalyzemassmovementoffrozendebrislobes,Brooks Range,Alaska. 3rdNorthAmericanSymposiumonLandslides, June4–8,2017,Roanoke,Virginia.
MAXWELL,K.,2016, DaltonHighwayReconstructionMP209to235 GeotechnicalReport,ProgramZ60919000,FederalProject 0655013:StateofAlaskaDepartmentofTransportationandPublic Facilities,187p.
OSTERBERG,J.O.,1957,Influencevaluesforverticalstressesina semi-infinitemassduetoembankmentloading: 4thInternational ConferenceonSoilMechanicsandFoundationEngineering,London,U.K.
SIMPSON,J.M.;DARROW,M.M.;HUANG,S.L.;DAANEN,R.P.; AND HUBBARD,T.D.,2016,Investigatingmovementandcharacteristics ofafrozendebrislobe,South-CentralBrooksRange,Alaska: EnvironmentalandEngineeringGeoscience,Vol.22,pp.259–277. UAF(UniversityofAlaskaFairbanks),n.d., FrozenDebrisLobes: Electronicdocument,availableat https://fdlalaska.org/ USDA(U.S.DepartmentofAgriculture),n.d., ColdfootAlaskaSite Number958;PublicReports,Air&WaterDatabasePublic Reports: Electronicdocument,availableat https://wcc.sc.egov. usda.gov/nwcc/site?sitenum¼958
USGS(U.S.GeologicalSurvey),2016, ExplanationsfortheNational WaterConditions:Electronicdocument,availableat https://water. usgs.gov/nwc/explain_data.html
USGS,2017, Hazardaguess?Theriskiestsciencequizyouwillever take! Electronicdocument,availableat https://www.usgs.gov/ news/science-snippet/hazard-guess-riskiest-science-quiz-you-willever-take-10
WHEATON,J.M.;BRASINGTON,J.;DARBY,S.E.; AND SEAR,D.A.,2010, AccountingforuncertaintyinDEMsfromrepeattopographicsurveys:improvedsedimentbudgets: EarthSurfaceProcessesand Landforms,Vol.35,pp.136–156, https://doi.org/10.1002/esp.1886
NeedforaMulti-SensorMonitoringApproachfor EmbankmentFailures:LessonsLearnedfromthe EdenvilleDamFailure
JOBINTHOMAS
DepartmentofGeologyandGeologicalEngineering,UniversityofMississippi, Oxford,MS38677,USA
RYANKLIDA
DepartmentofGeologicalandMiningEngineeringandSciences,Michigan TechnologicalUniversity,Houghton,MI49931,USA
THOMASOOMMEN*
DepartmentofGeologyandGeologicalEngineering,UniversityofMississippi, Oxford,MS38677,USA
SAJINKUMARK.S.
DepartmentofGeology,UniversityofKerala,Thiruvananthapuram,Kerala 695581,India
BINZHANG
FacultyofGeo-InformationScienceandEarthObservation,UniversityofTwente, 7511AEEnschede,TheNetherlands
XIEHU
CollegeofUrbanandEnvironmentalSciences,PekingUniversity,Beijing100871,China
KeyTerms: EmbankmentFailure,EdenvilleDam, SyntheticApertureRadar,PersistentScatterer Interferometry,SoilMoistureIndex
ABSTRACT
TheEdenvilleDam,anearthenembankmentin Midland,MI,failedonMay19,2020,after3daysof elevatedrainfall(3.83–8.0in.;9.7–20cm),which caused floodingdownstreamofthedam.DaminfrastructuresimilartothatattheEdenvilleDamisnot uncommonintheUnitedStatesandhencerequires periodicmonitoring.Apre-failureanalysiswasconductedinthedamtoexploretheapplicationofremote sensingindammonitoring.Persistentscattererinterferometry(PSI),aformofsyntheticapertureradar (SAR)interferometry,wasusedtoanalyze97Sentinel1imagestomeasuretheline-of-sight(LOS)displacement priortothefailure.ThePSIanalysisshowedhardlyany
*Correspondingauthoremail: toommen@olemiss.edu
signsofdeformationatthefailurelocationandimplied stableembankmentswithvelocitiesrangingfrom3.1 to 5.4mm/yr.Thesoilmoistureindex(SMI)derived using14Landsat-8imagesbetween2016and2020 suggestedthepresenceofsubsurfaceseepageanda potentialfailurezone.Thisstudyillustratestherequirementformulti-sensorremotesensing–basedapproaches forcontinuousdammonitoringandanalysis.
OnMay19,2020,theEdenvilleDaminMichigan, midwesternUnitedStates,failedduetostaticliquefaction instabilityafteraheavyspellofrainfallspatiallyranging between3.83in.(9.7cm)and8.0in.(20cm)over2 days.TheEdenvilleDam,constructedbetween1923and 1925,wasdesignedfor floodcontrolandhydroelectric powergeneration(Pradeletal.,2021;Franceetal., 2022).Thefailureresultedinthewaterimpoundedbythe dam(WixomLake)surgingdownstreamintoSanford Lake,ultimatelyleadingtotheovertoppingandfailureof
Thomas,Klida,Oommen,K.S.,Zhang,andHu
theSanfordDamonMay20,2020.Theseeventsresulted intheinundationofthe floodplainsoftheTittabawassee andTobaccoRivers,includingthecityofMidland,MI.
The floodtriggeredtheevacuationof11,000residents andcausedanestimated245millionU.S.dollarsinpropertyandinfrastructuredamages(Pradeletal.,2021; FEMA,2022).Unfortunately,damfailuressuchasthese arenotuncommonintheUnitedStates(Graham,2009).
TheCommitteeonFailuresandAccidentstoLargeDams oftheU.S.CommitteeonLargeDamsreportedthatnaturalerodiblematerialsformtheembankmentsfornearly 80percentofthelargedamsintheUnitedStates(Redlingeretal.,1975).Thesestructuresarehighlylikelytobe subjecttodeformationandfailure,particularlyunder extremehydrologicalconditions(Wuetal.,2011).
Onameanbasis,roughly10damfailuresoccurredin theUnitedStatesannuallybetween1848and2017,and recentdecadesshowanincreaseinthenumberoffailures (i.e.,24peryear)(NationalPerformanceofDamsProgram,2018).Yearsofneglectingaginginfrastructurehave leftmanydamsintheUnitedStatesinfairtopoorconditions.AccordingtotheonlinedaminventoryoftheDam SafetyProgramoftheMichiganDepartmentofEnvironment,GreatLakesandEnergy(EGLE),Michiganhas 2,545damswithvaryingdimensions,where10percentof allthedamshave “high” or “significant” hazardpotential, includingtheEdenvilleandSanfordDamsbeforetheirfailures(EGLE,2023).TheMichiganSectionoftheAmericanSocietyofCivilEngineers(ASCE)(2023)listeddams inMichiganwithanoverallevaluationofa “C ” intheir 2023infrastructurereportcard,andatthetimeofthe report,twothirdsofthedamswereolderthantheir50year designlife.Constructedin1924,theEdenvilleDamwas designedbeforethemoderngeotechnicalengineeringpracticesofProfessorKarlTerzaghiwerewidelypracticedand builtbeforethequality-controlassessmentofearth fill compactionwasdevelopedbyRalphProctorinthe1930s (Pradeletal.,2021).Investigatingthedamfailure,the Embankments,Dams,andSlopesCommitteeofASCE’s Geo-Institutepostulatedpossiblefailuremechanisms, including:(1)staticliquefactionduetotheriseinreservoir waterelevation,resultinginlossofstrength,and(2)slope instabilityduetothecorrespondingincreasedpore-water pressures(Pradeletal.,2021).
Damembankmentsaresubjecttodeformationandpotentialfailure,mostlylinkedtoinadequatedesignand/orconstruction,operational flaws,andhigh-magnitude floods (Fosteretal.,2000;Graham,2009).Suchfailuresposesignificant floodanddebrisriskstopeople,property,andinfrastructuredownstreamofthestructure.Forinstance,on October4,2010,theembankmentfailureoftheNo.10red mudreservoirinHungarycaused10fatalitiesandsubstantialeconomiclosses(GrenerczyandWegmuller,2011). Similarly,theFundãoDaminBrazilcollapsedon
November5,2015,killing19peopleandspillingabout 32.6millioncubicmetersofminingwaste,causingsevere environmentalissues(Muraetal.,2018).InJanuary2019, thetailingsdamoftheBrumadinhoironmineinBrazil failed,resultinginadeathtollofmorethan250(SilvaRotta etal.,2020).Hadtheinstabilityoftheseembankmentsbeen detectedatanearlystage,appropriatemeasurescouldhave beentakentopreventstructuralfailure.Indeed,periodic embankmentmonitoringisacriticalcomponentinpreventingtheimpactsofsuchunforeseenevents.Furthermore, agingdaminfrastructureincreasestheneedforperiodic daminspectionsandmonitoringtomitigatetherisksassociatedwithdamfailures.Nevertheless,damsafetyhugely reliesonadvancementsindammonitoringtechniques.
Traditionaldaminspectionandmonitoringmethods requiresignificanttimeandhumanresourcesinthe field, andthemonitoringdatasets,suchasglobalpositioning system(GPS)data,elevation,andpiezometerreadings, offeronlypointinformation.Ontheotherhand,remotely senseddataoffertheabilitytosupplement insitu monitoringorreplace insitu/fieldmeasurementswherethey areabsent.Remotesensingcan:(1)acquirecontinuous dataovertheentireembankment(asopposedtodiscrete, point-sourcedatafrom insitu methods),(2)assessthe structuralconditionandprecursorsofstructuralfailures inanon-invasivemanner,preventinganypotentialnegativeimpactonthestructure,and(3)continuouslymonitor thedamwithminimalhumanresources.Interferometric syntheticapertureradar(InSAR)techniquesarewidely appliedformonitoringearthendamstability,where multi-temporalanalysisofthesyntheticapertureradar (SAR)imagesfacilitatesaccuratemonitoringofstructural deformation.Oneoftherobustmethodsispersistentscattererinterferometry(PSI),whichusespermanent/persistentscatterers(PS)withhighphasestabilityoverlong timeintervals(Ferrettietal.,2001,2011).However,the performanceofPSIsignificantlydependsonnumerous factors,suchasthesensor,numberofSARimages,PS density,anddeformationcharacteristics(Crosettoetal., 2016).Numerousresearchershavedemonstratedthe applicabilityandcompetencyofvariousInSAR-based approachesformonitoringthedeformationofembankmentsandsubsidenceworldwide(e.g.,Grenerczyand Wegmuller,2011;Zhangetal.,2015;Othmanetal., 2019;Besoyaetal.,2020;andMalteseetal.,2021).
Oneofthemajorcausesofearthenembankmentfailuresisuncontrolledsaturationandincreasedseepagedue tointernalerosion.Manyresearchershaveillustratedthe significanceofvariousnon-invasivemonitoringmethods toassessthestructuralhydrologicalcondition,particularlybasedonremote-sensingdata(SilvaRottaetal., 2020;Zumretal.,2020;andLinetal.,2021).Amongthe variousapproaches,thestudiesofSilvaRottaetal. (2020)andLinetal.(2021)combinedsoilmoisture
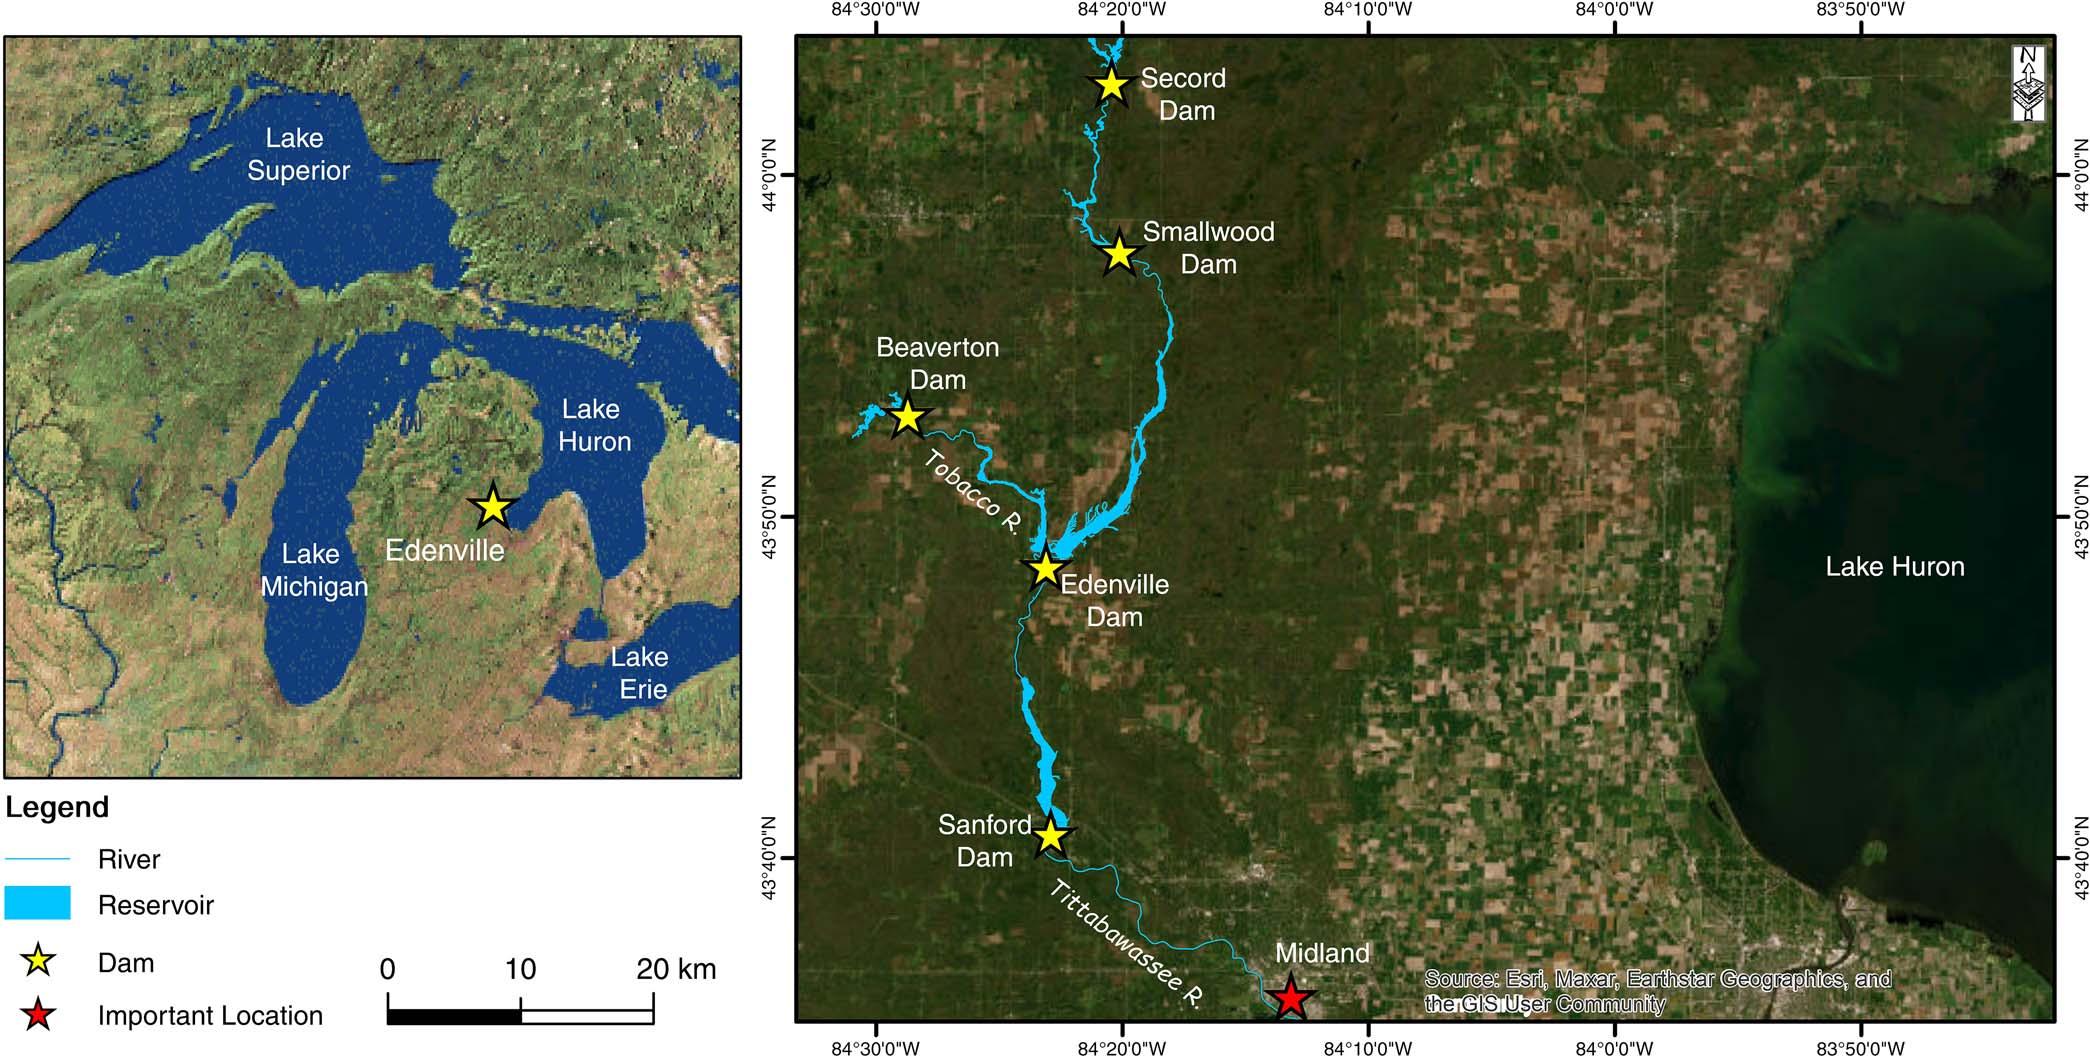
Figure1.(a)LocationofEdenvilleDaminMichigan’sLowerPeninsula.(b)Locationofthe fivedamslocatedalongtheTittabawasseeand TobaccoRivers.EdenvilleDamislocatedupstreamoftheconfluenceofthetworiversandimpoundsbothrivers.
analysisusingthermalandopticalimagerywithSAR analysis.TheprimarycauseofthefailureoftheBrumadinhotailingsdamwasseepageerosion(piping),which wasevidentinthetemporalvariabilityofthesoilmoistureindex(SMI)intheyearspriortofailure(SilvaRotta etal.,2020).Similarly,Linetal.(2021),whileanalyzing theSMItimeseriesbetween2013and2020,noteda decadalincreaseinsoilmoisturealongtheeasternpartof thecollapsedarea.ConsideringtheapplicabilityofSAR techniquesandmulti-spectralimagingfordeformation studies,inthisstudy,weutilizedPSIandSMItoconduct apre-failureanalysisoftheEdenvilleDam.
TheEdenvilleDam(Figure1)isoneof fivedams alongtheTittabawasseeandTobaccoRiversinthecentralregionofMichigan’sLowerPeninsula.Located alongtheborderofGladwinandMidlandCounties,the EdenvilleDamimpoundstheTittabawasseeandTobacco Riversjustnorthoftheirconfluence.TheTobaccoRiver flowsintotheTittabawasseeRiver,downstreamofthe EdenvilleDamandupstreamoftheSanfordDam.The EdenvilleDamconsistsofaseriesofearthenembankments,spillways,andapowerhousespanningapproximately6,600ft(2,012m)acrosstheTittabawasseeand TobaccoRivers.Thereservoirimpoundedbythedamis WixomLake.Figure2illustratesthegeographicallayout ofEdenvilleDam.
TheTobaccosectioniscomprisedoftheTobaccoSpillway,thewestembankment,andthewestcrest.Thewest embankmentisapproximately1,300ft(396m)longand beginswestofMichiganHighwayM-30,extendswestwardtotheTobaccoSpillway,andthencontinuestothe westcrest.Thewestcrestisapproximately900ft(274m) longandextendswest-northwestfromthewestembankmenttothewestabutment.Theportionofthewest embankmentthatlieswestoftheTobaccoSpillwayand thewestcrestisacontinuousembankment.However,they wereseparatedinthisstudyduetovaryingembankment heights.Thewestembankmenthasaheightrangingfrom 32to47ft(9.8to14.3m),whilethewestcresthasan approximateheightof12ft(3.7m).Theupstreamand downstreamslopesoftheembankmentswereinitiallyconstructedataratioof2.5H:1V(horizontaltovertical)and 2H:1V,respectively(Franceetal.,2022).Portionsofthe downstreamembankmentslopehavebeen flattened,and bermshavebeenadded.Surveydataindicatethatportions ofthedownstreamslopesaresteeperthanthedesignratio.
TheTittabawasseesectioniscomprisedofthesoutheastembankment,eastembankment,andeastcrest.The southeastembankmentbeginssouthoftheEdenville Spillwayandextendssoutheast,approximately650ft (198m)totheeastabutment.Theheightofthesoutheast embankmentrangedbetween52ft(15.8m)immediately southofthespillwayto30ft(9.1m)towardtheabutment.TheapproximatefailurelocationisshowninFigure2,andtheheightofthefailurelocationwasbetween 30and32ft(9.1and9.8m)(Franceetal.,2022).The
Thomas,Klida,Oommen,K.S.,Zhang,andHu
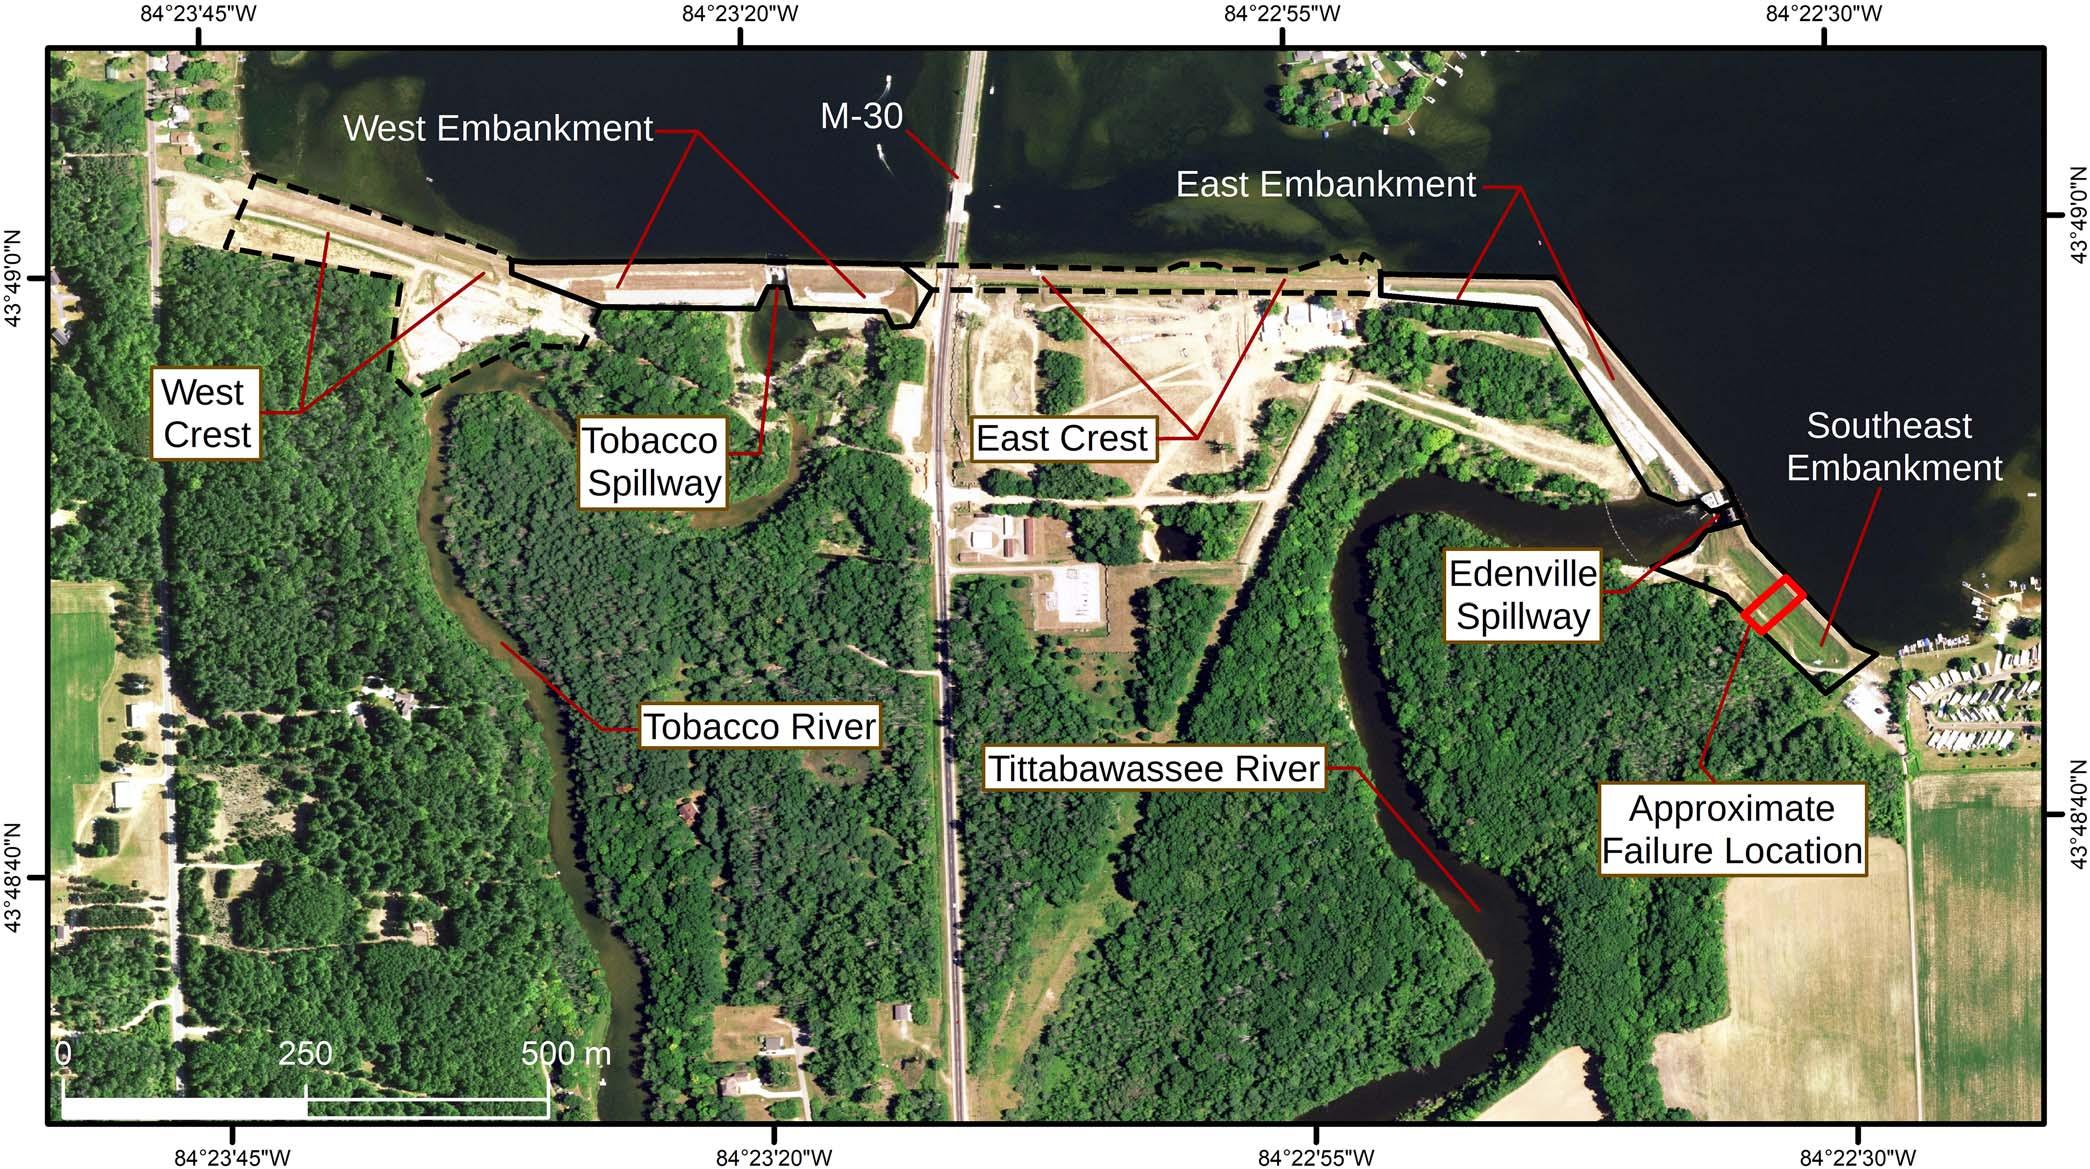
Figure2.EdenvilleDamsitelayoutimage.HighwayM-30,showninthecenteroftheimage,dividesthedamintotheTobacco(western)and Tittabawassee(eastern)sections.(BackgroundaerialimageiscourtesyofNationalAgricultureImageryProgram[NAIP],imagecapturedonJuly 16,2016andaccessedfromtheU.S.GeologicalSurvey[USGS]EarthExplorerwebsite: https://earthexplorer.usgs.gov.)Theapproximatefailure locationisshowninred.
eastembankmentandeastcrestarecontinuousembankments,buttheywereagainseparatedinthisstudydueto varyingembankmentheights.Theeastembankment extendsfromtheEdenvilleSpillway1,300ft(396m)to theeastcrest.Theeastcrestextends1,450ft(442m) fromtheeastembankmenttoM-30.Theaverageheights oftheeastembankmentandeastcrestare40and15ft (12.2and4.6m),respectively.SimilartotheTobacco section,theupstreamanddownstreamslopesofthe embankmentswereoriginallyconstructedataratioof 2.5H:1V(horizontaltovertical)and2H:1V,respectively (Franceetal.,2022).Surveysconductedafterthe flood showthatsomesectionsofboththeupstreamanddownstreamembankmentsaresteeperthantheinitialdesign ratio(Franceetal.,2022).
TheEdenvilleDamwasbuiltbetween1923and1925 tomanage floodwatersandgeneratehydroelectric power(Pradeletal.,2021;Franceetal.,2022).Thedam hadtwooperatinglevelsofthereservoir,normaland winterpoollevels.Thenormalpoolelevationwas675.8 ft(205.98m),andthewinterpoollevelwas672.8ft (205.07m)(Pradeletal.,2021).Dailyvariationinpool elevationwasnottoexceed0.9ftand0.7ft(0.27and 0.21m)forthenormalandwinterpools,respectively. Thedamwasconstructedofloose,poorlygradedsand withoutaclaycore.Theonlysub-drainsystemconsisted
ofclaydraintileswithoutflowstoadrainageditch, whichranparalleltothetoeoftheembankment. Accordingtohistoricalphotographs, fillwasplaced en masse ratherthaninliftsusedinmodernearthconstructions.Fillwasdumpedviatraincar,andcompaction effortsontheplaced fill(i.e.,rollers)werenotrecorded inthehistoricaldocumentation(Pradeletal.,2021; Franceetal.,2022).Thedamfoundationconsistedofglacialtillandoutwashsands,whichweredepositedduring theretreatoftheSaginawLobeoftheLaurentideIce Sheet.Post-glacialerosionanddepositionproduceda seriesof fluvialterracesalongtheTittabawasseeand TobaccoRivers(DorrandEschman,1970;Larsonand Schaetzl,2001;andKehewetal.,2012).Thevariationin theelevationofthefoundationterracesresultedinvariationinthedam fillthicknessthroughoutthestructure.
TheEdenvilleDamfailedonMay19,2020,at approximately5:30pmESTaftera3dayelevatedrainfallevent.Atotalof9.7cmofrainfallwasrecordedfor May17–19attheEdenvilleDam(Pradeletal.,2021). OnMay18,bothspillwayswereoperatingatmaximum capacity.Adepressionalongthecrestofthesoutheast embankment,attheapproximatefailurelocationshown inFigure2,wasnotedbyresidentsandbystandersabout 30minutesbeforefailure.Atthetimeoffailure,itwas estimatedthattheWixomLakereservoirelevationwas
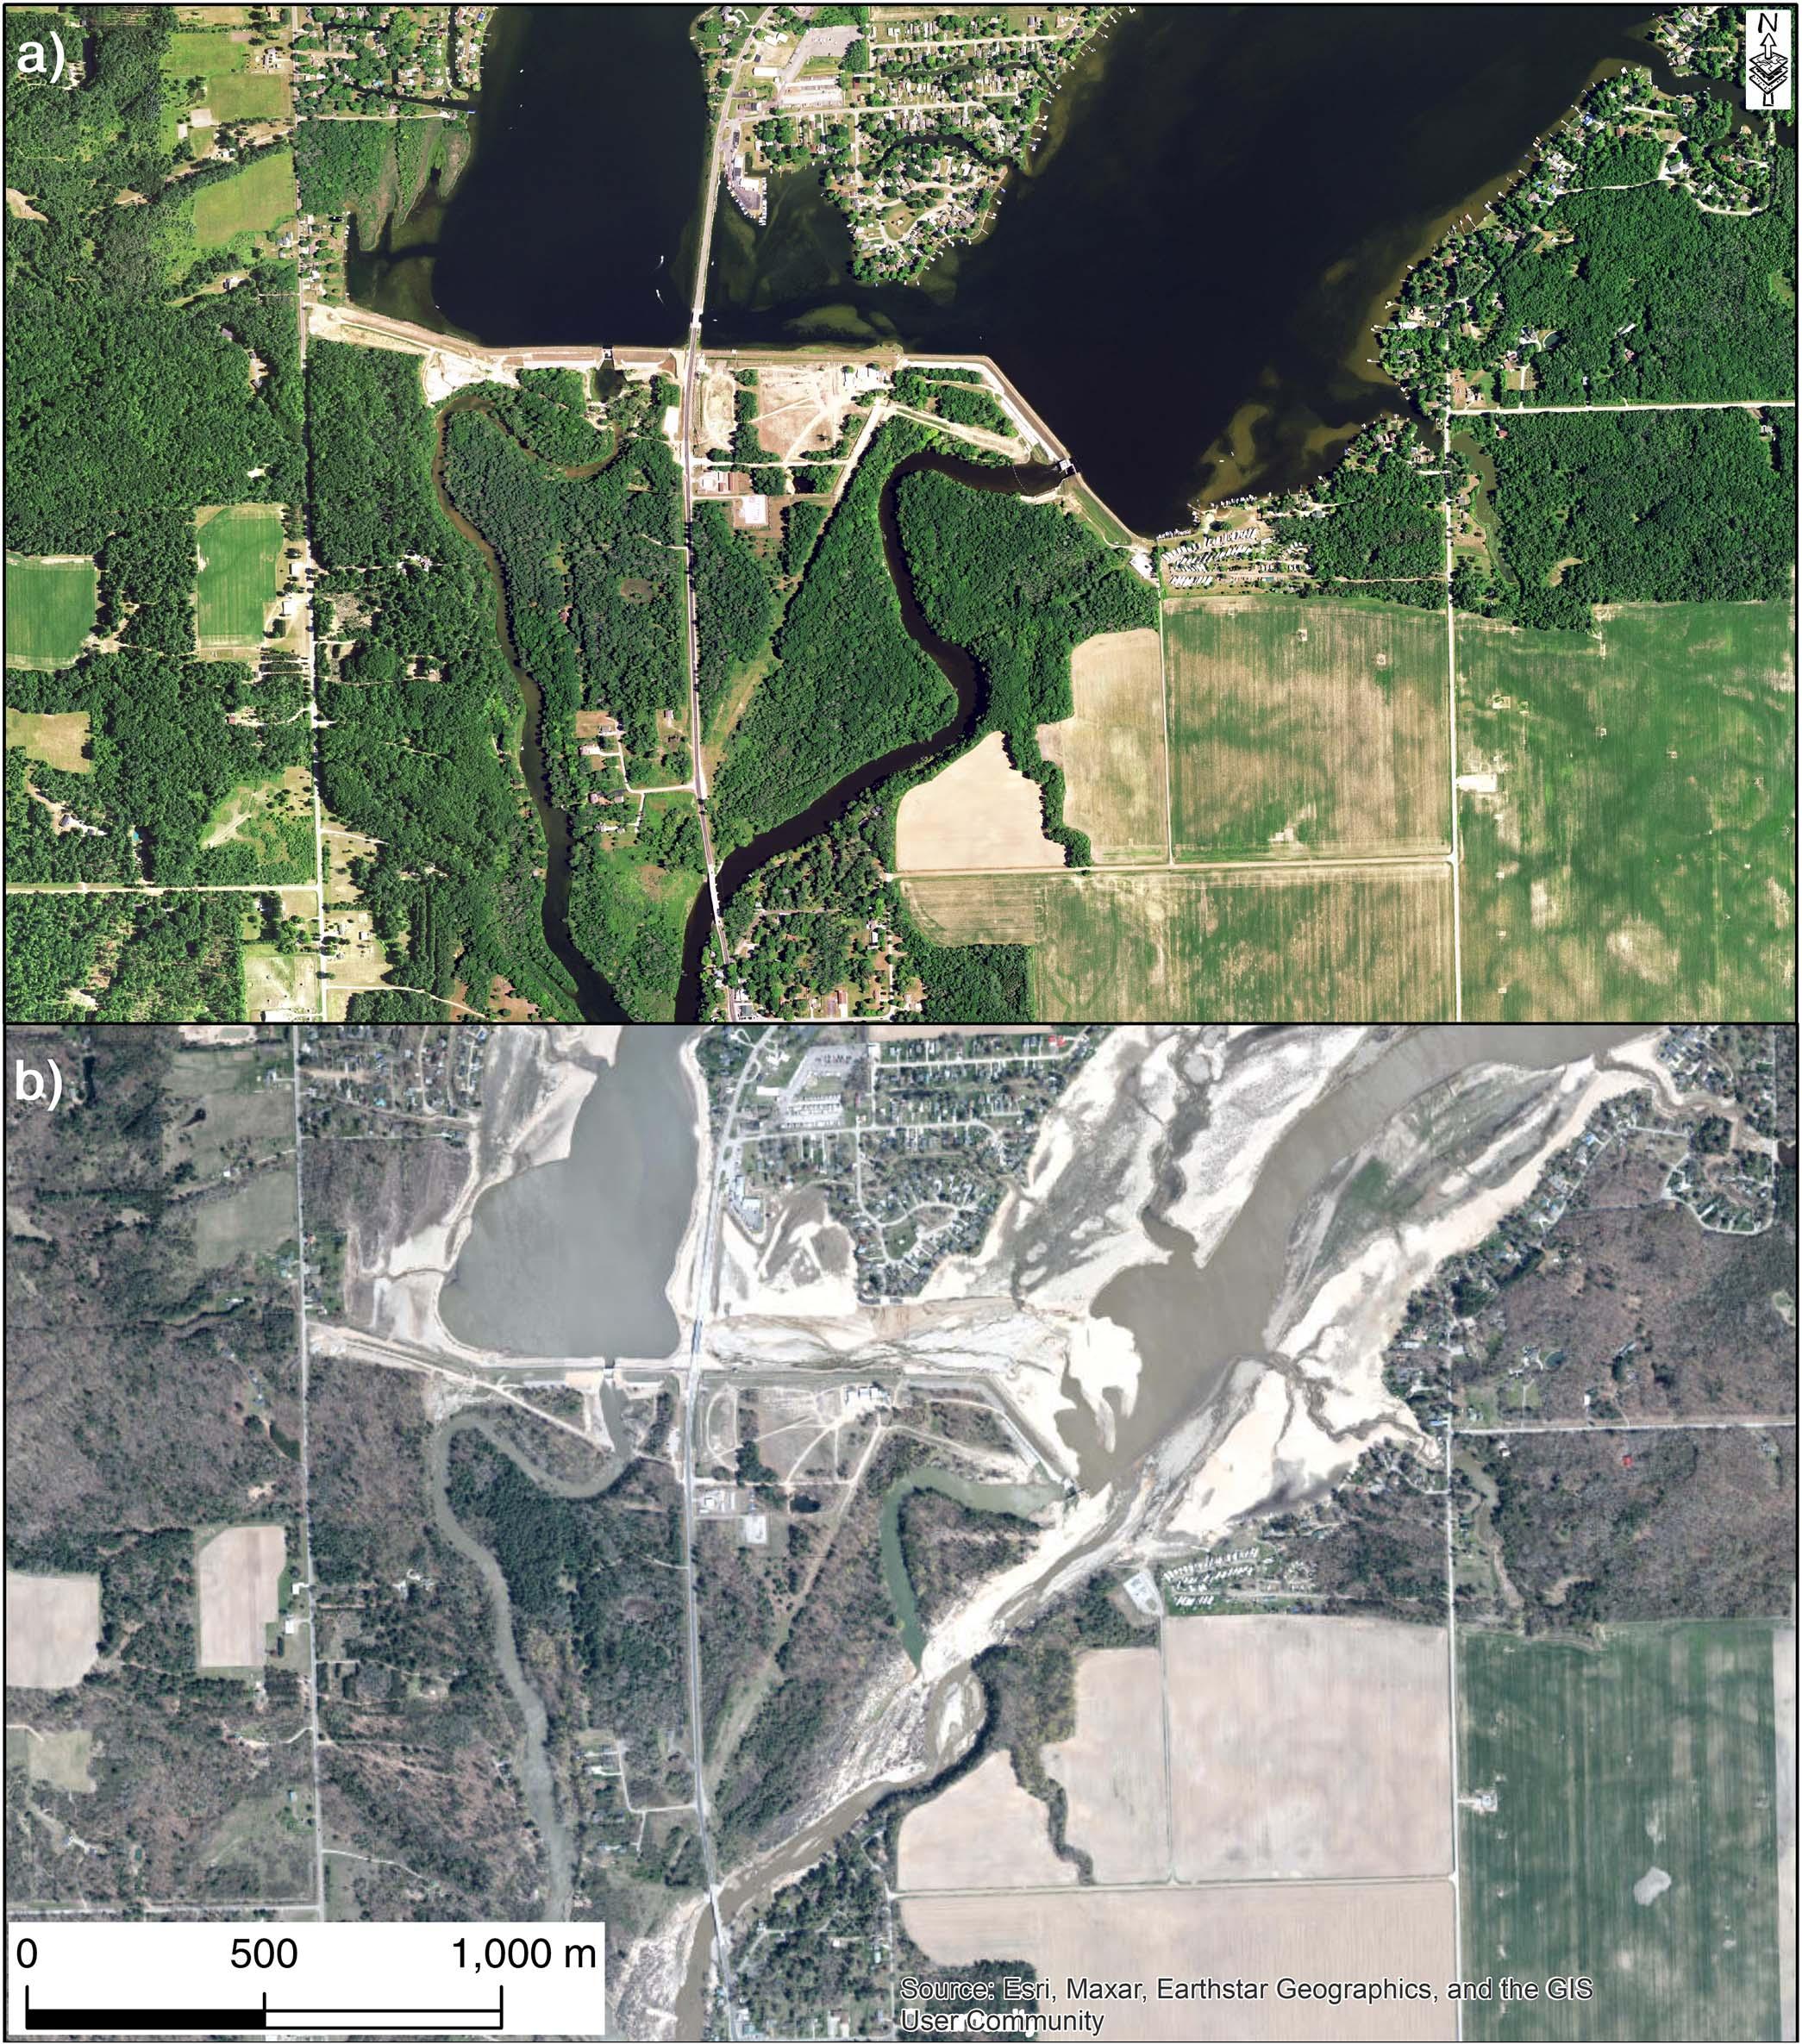
Figure3.(a)Pre-failureand(b)post-failureimageryoftheEdenvilleDam.Theapproximatefailurelocationwherethedepressionwasobserved isshowninred.(Pre-failureimagery:NAIPimage;post-failureimagery:ArcGISworldimagery.)
5.5ft(1.68m)higherthannormaloperatinglevels (approximately1.5ft[0.46m]belowthecrestelevation ofthesoutheastembankment).Thefailurewidened throughouttheeveningofMay19,andWixomLake
wasemptied.Figure3presentsapre-andpost-failure comparisonoftheEdenvilleDam.Itwasalsoreported thatthedownstreamembankmentslopewasnotuniform andwasover-steepenedinareas,andabulgingfeature
Thomas,Klida,Oommen,K.S.,Zhang,andHu
Table1. Parametersusedforprocessinginterferometricsynthetic apertureradar(InSAR)time-seriesanalysis.
ParameterValueParameterValue weed_standard_dev(rad)1.2unwrap_time_win180 unwrap_method3Dunwrap_grid_size10 scla_deramp ‘ y ’ scn_time_win180 scn_wavelength50
waspresentina2017lightdetectionandranging (LiDAR)survey.Aslopestabilitymodelshowedalow factorofsafety(1.08)forarotationalslidewhenmodeledwiththereservoirlevelatthetimeoffailure.
Thedeformationoftheearthenembankmentofthe EdenvilleDamwasinvestigatedusingSentinel-1SAR data.TheSentinel-1missionoftheEuropeanSpace Agency(ESA)includesaconstellationoftwopolarorbitingsatellitesutilizingC-bandSARimaging.In total,97single-lookcomplex(SLC)SARscenesin interferometricwide(IW)swathmodeandfromascendingorbitswereacquiredbetweenDecember2,2016, andMay3,2020,fromtheESA.Thecomplexvalueof SLCscenescanbeinterpretedasphaseandamplitude components,inwhichthephasepresentstheranging distancefromtheSARsensortotheground,andthe amplitudesuggeststhebackscatteringaftertheelectromagneticwavesinteractwiththegroundsurface. Grounddeformationcanbemeasuredbycomputingthe phasedifference,i.e.,rangingdistancedifference.Sentinel-1scenesobtainedduringthewinterseasonwere excludedduetosnowcoverandthusvolumetricdecorrelationofSARsignals.Followingtheco-registration andresamplingofalltheSARscenestoagivenreferencescene(acquisitiononNovember22,2018,inthis study),interferogramsweregeneratedbyconjugatemultiplicationofselectedtwocomplex-formatSARscenes. Theamplitudedispersionindex(ADI)(Ferrettietal., 2001)wassettobe #0.7tosortoutthePStargetwith comparativelystableamplitudespanningthetime,e.g., man-madestructuresandrocks(Table1).
Long-wavelengthphasenoiserepresentedasaphase rampwasestimatedandremovedforeachinterferogram.TheStatistical-Cost,Network-FlowAlgorithm forPhaseUnwrapping(SNAPHU)algorithmandagrid sizeof10mwereappliedtounwraptheinterferometric phases(ChenandZebker,2001).Thedisplacement phasewasgeneratedbyremovingphaseartifactsdueto topographicerror,orbiterror,andtroposphericdelay.A moderatetemporalwindowof180dayswasappliedto
fi lteroutthetemporallyhighfrequencyturbulenttroposphericdelayduringdisplacementinversion.Eventually, wederivedspatiotemporalgrounddeformationatthe locationofPStargetsthroughleast-squareestimations.
TheSMIisanindexusedtomodeltherelativesoil moisturecontentbasedonthedryandwetedgesofthe scatterplotbetweenlandsurfacetemperature(LST)and normalizeddifferencevegetationindex(NDVI).The SMIvaluesrangefrom0to1,with0representingrelativelydriersoiland1representingrelativelywettersoil (Zhimingetal.,2004;Mallicketal.,2009;Paridaetal., 2013;andYuanetal.,2020).SMIwascalculatedasfollows(Zhimingetal.,2004):
where a and b aretheslopeandintercept,respectively, ofthedryandwetedges.
TheboundaryconditionsoftheLST-NDVIspaceare thedryandwetedges,or LSTmax and LSTmin ,respectively. Theseboundinglayersarethetheoreticalmaximumand minimumofSMIvaluesforthegivensceneandarelinear. Tomodelthedryandwetedges,linearregressionwas used.TheNDVIandLSTdatacorrespondingtoeach scenewereprocessedindividually.Tomodelthedryedge, theLST-NDVIplotwassubsetalongtheNDVI x axisto representtheboundaryslopesforboththedryandwet edges.Withinthesubset,theLST/NDVIscatterplotwas dividedintobinsofwidth0.01alongtheNDVIaxis.The meanofthe10highestLSTvalueswithineachbinwas usedto fitthelinearregressionmodel(Mallicketal., 2009;Paridaetal.,2013;andYuanetal.,2020).Tomodel thewetedge,ahorizontallinewas fittedtotheLST-NDVI scatterplot.Forallscenesanalyzed,thewetedgewas nearlyhorizontal(slope , 0.01);therefore,thewetedge wasmodeledasahorizontallinewithaslopeof0(Mallicketal.,2009).Similartomodelingthedryedge,the fivelowestLSTvaluesineachbinwererecordedformodelingthewetedge.Further,themeanofthelowestLST valueswas fittedtothehorizontallinearmodel.Valuesin theLST/NDVIspaceoutsidethedryandwetedgeswere reclassifiedtoeitherdryorwetedges(LSTmin or LSTmax ).
TheU.S.GeologicalSurvey(USGS)managesLandsat multi-sensorimagearchivesthatarerestructuredintoaformalcollectionstructuretoensureauniformdataquality standard.TheLandsatCollection2representsthesecond
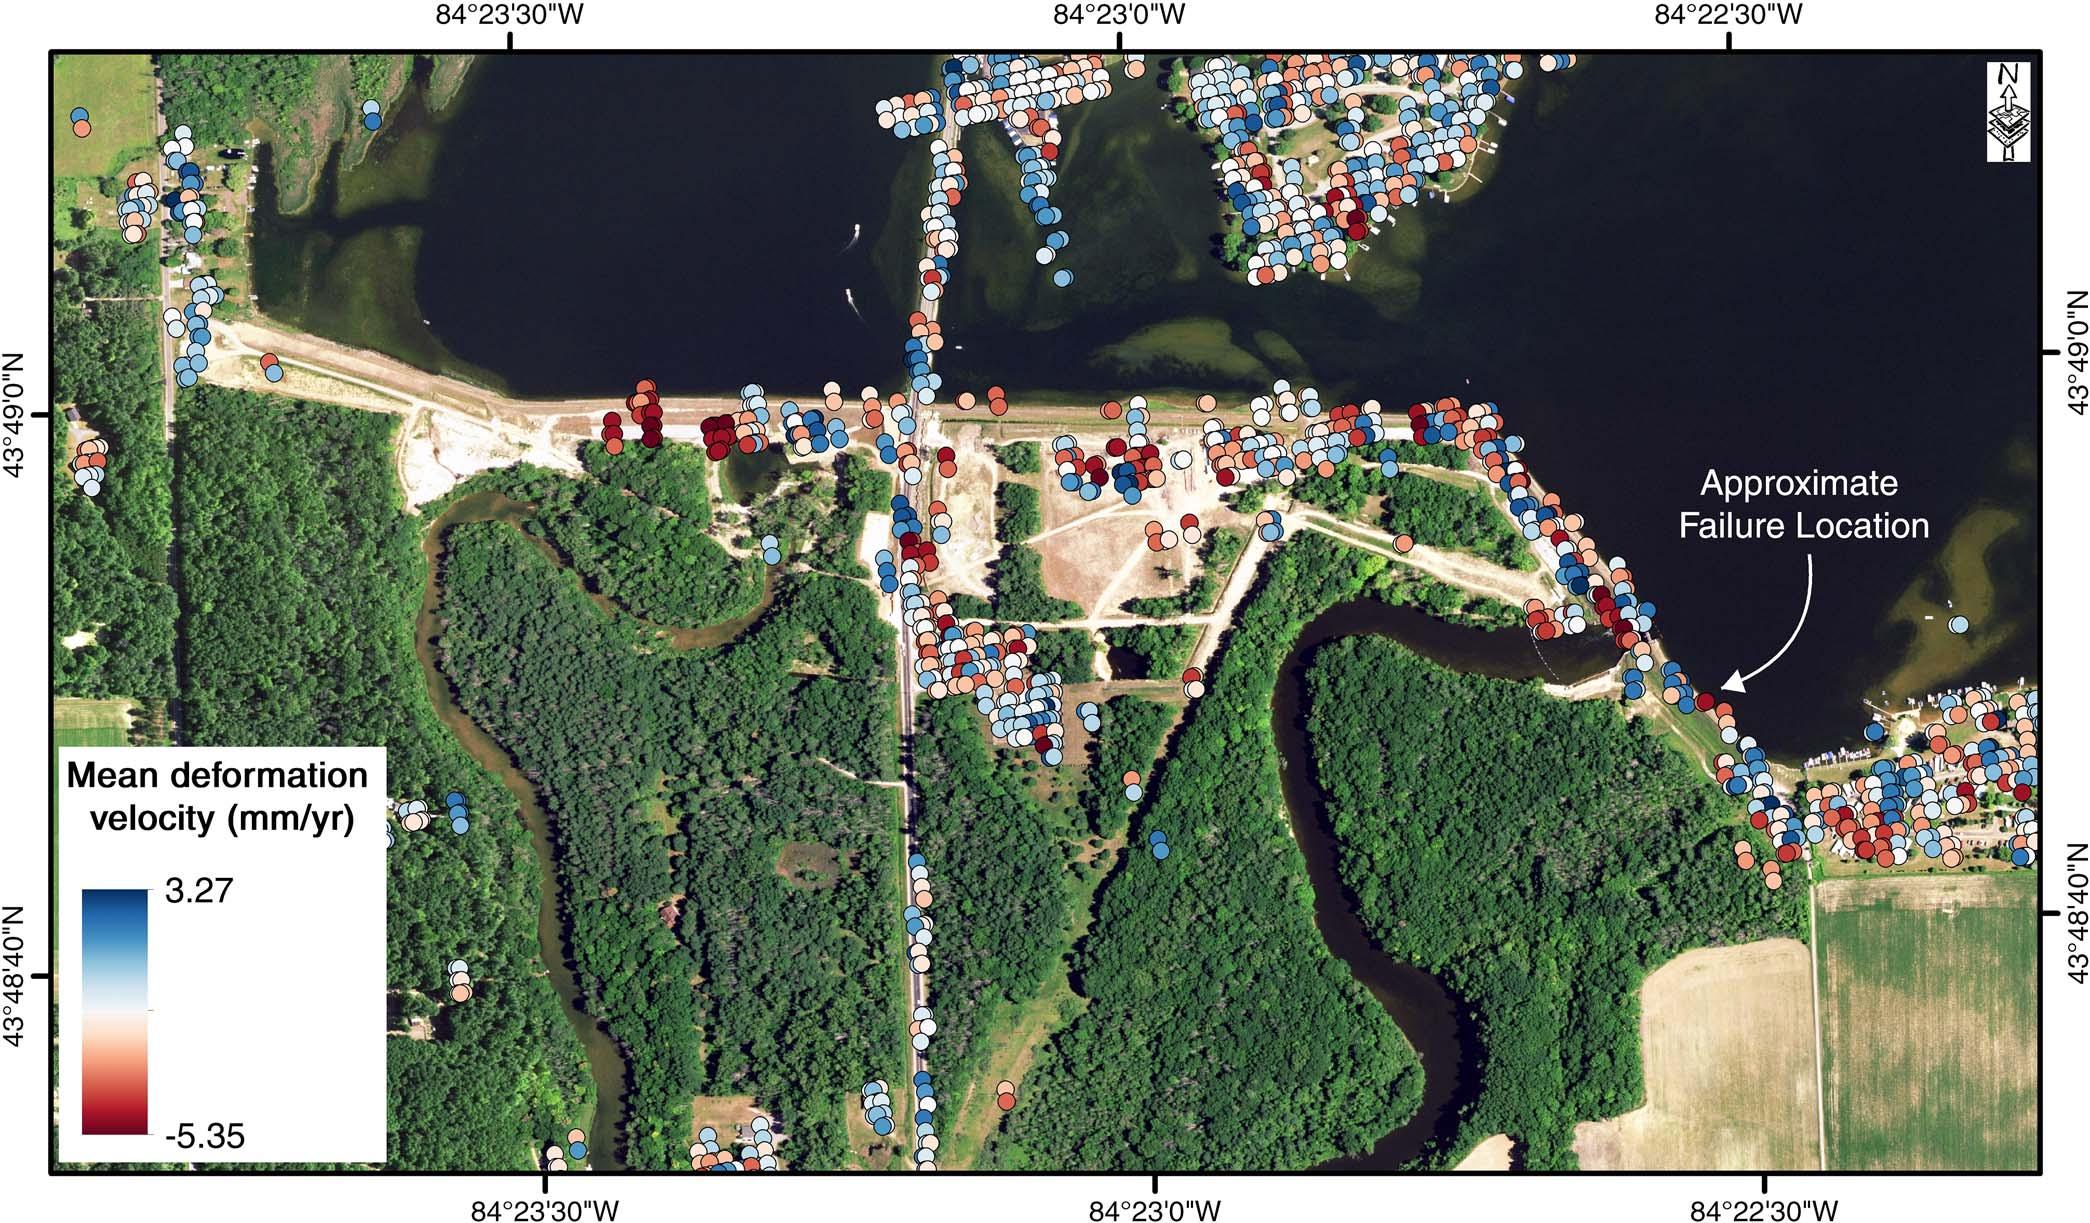
Figure4Averagevelocity(mm/yr)betweenDecember2,2016,andMay3,2020,measuredusing97Sentinel-1imageswithPSIprocessing.
significantupdatetothisreprocessingeffort,comprising calibrated,quantized,andscaleddigitalnumberswithsubstantialimprovementsinabsolutegeolocationaccuracy (Crawfordetal.,2023).FourteenCollection2Level1 Landsat8imageswereobtainedbetweenApril23,2016, andMay4,2020,fromtheUSGSEarthExplorer(https:// earthexplorer.usgs.gov).ImagesbetweenNovemberand Februarywereexcludedduetosnowcoverandseasonal vegetationdormancy.Sceneswithcloudcoverwithinthe speci fi edextentwereexcludedfromtheanalysis.The LSTandNDVIlayersweregeneratedusingtheERDAS IMAGINEsoftware.ThespatialresolutionofLandsat data(multi-spectralOperationalLandImager[OLI]and resampledThermalInfraredSensor[TIRS]thermalbands) is30m;therefore,thespatialresolutionofSMIis30m. AtimeseriesoftheSMIwasderivedfromtheLandsat8 images.AstandarddeviationmapoftheSMItimeseries wasalsoderivedtoanalyzetheregion’stemporalvariation ofmoisturecontent.
ThemeandeformationvelocityfromthePSImeasurementsfromDecember2,2016,toMay3,2020,forthe
region,isshowninFigure4.Themeandeformation velocityoftheregionvariedbetween 5.35mm/yrand 3.27mm/yr.Themeandeformationvelocitywasmeasuredintheline-of-sight(LOS)direction(approximately N80°E,40°tonadir),wherepositiveandnegativevalues werePStargetsmovingtoward(i.e.,upward)andaway (e.g.,downward)fromthesatellite,respectively(Vassilevaetal.,2017).Threeareasofinterest(AOIs)were identifiedtocomparethemovementalongthedamoutline:thewestembankment,theeastembankment,andthe southeastembankmentwherethefailureoccurred.The threeembankmentsincludedintheAOIshadadifference inelevationfromthereservoirtothetoeofthedam between8and12m.Thesoutheastembankmentcontainingthefailurelocationbeginsimmediatelysoutheastof theEdenvilleSpillwayandextendssoutheasttotheeasternmostabutment.Themean(standarddeviation)deformationvelocityforthePSImeasurementsofthewest, eastandsoutheastembankmentswere 1.1mm/yr(1.8 mm/yr), 0.1mm/yr(1.5mm/yr),and 0.5mm/yr(1.1 mm/yr),respectively(Table2).ThisvariabilityinInSAR resultedfromtheheavilyvegetated floodplainenvironmentandcoarsespatialresolutionrelativetothenarrow embankmentsystem.Theaveragecumulativedisplacementsoftheeast,west,andsoutheastembankments showednomajordifferencesandwere 21.3mm, 47.5
Thomas,Klida,Oommen,K.S.,Zhang,andHu
Table2. Summaryofthepersistentscattererinterferometry(PSI)analysisoftheembankmentsoftheEdenvilleDam. SoutheastEastWest NumberofPS4411657
mm,and 33.2mm,respectively.MostPStargetsinall threeAOIshaddeformationvelocitiesthatfellwithintwo standarddeviations.Althoughthesoutheastembankment isconsideredtorepresentanunstableareaofthedam,as thefailureoccurredwithinthisAOI,insufficientnumbers ofPStargetswereresolvedwithintheapproximatedfailurelocation.
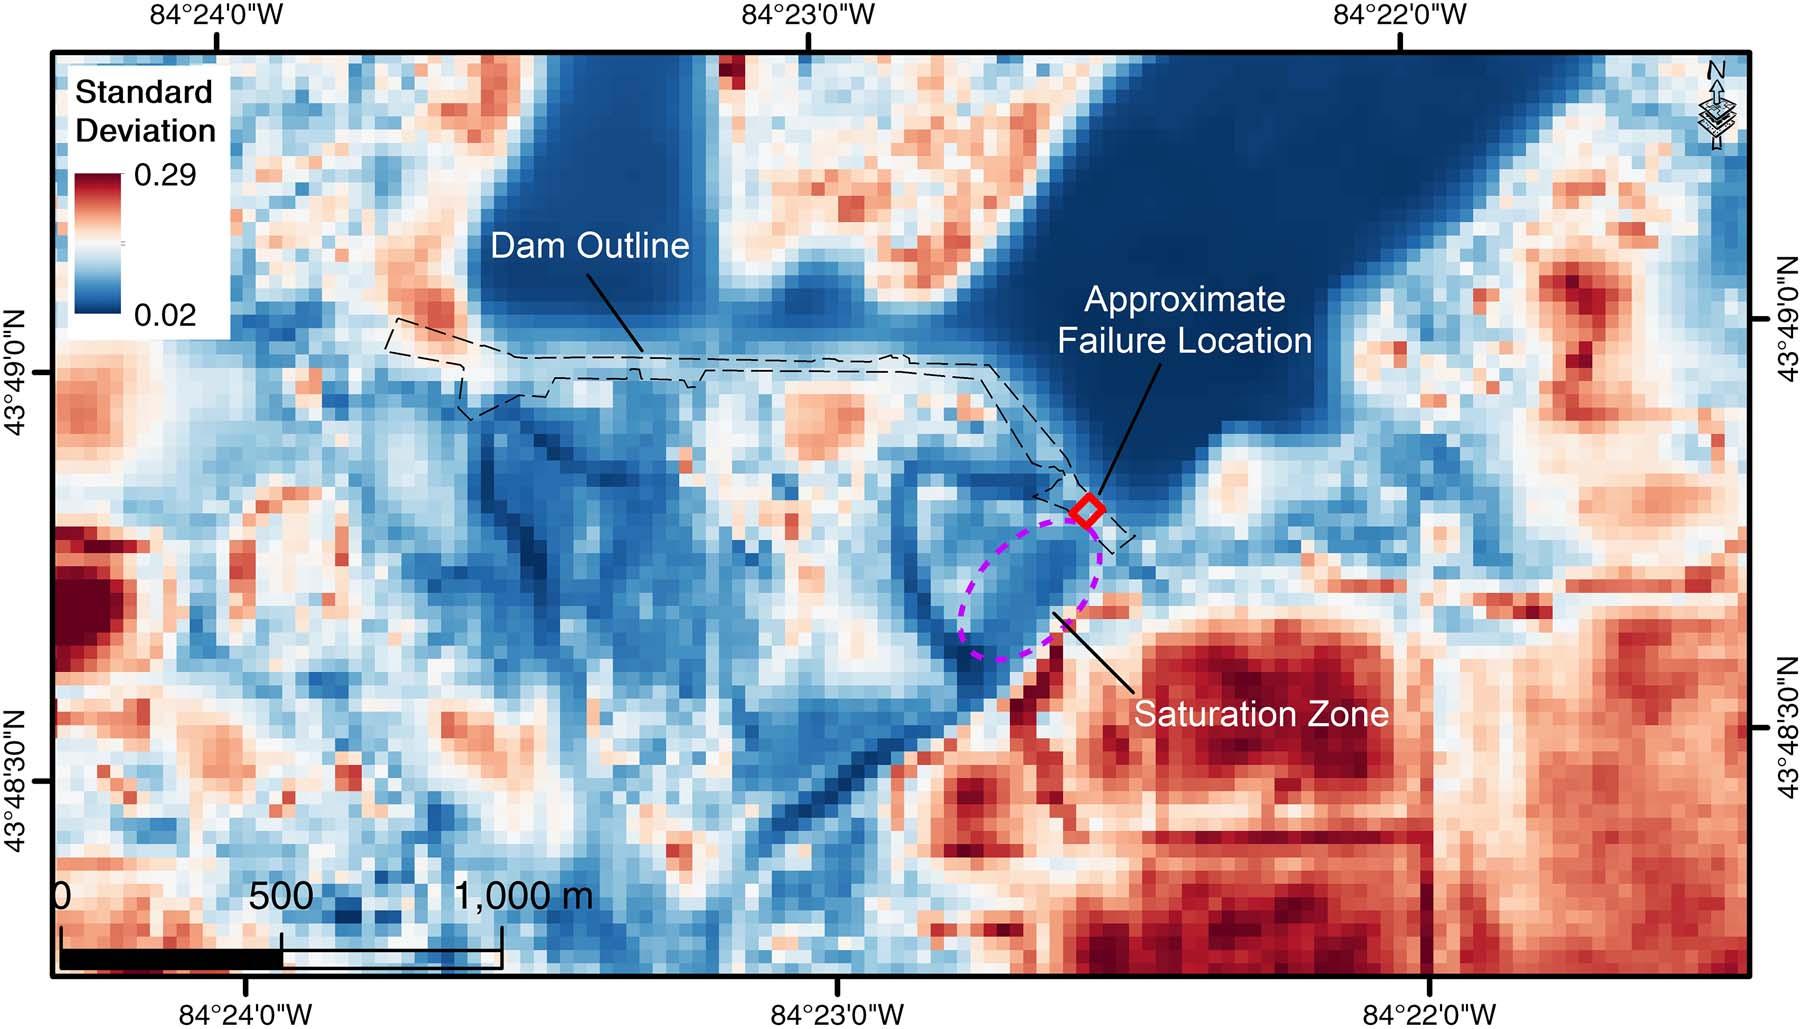
TheSMIrepresentingrelativemoistureinthestudy areawasderivedfromtheLandsat8imagesbetween April23,2016,andMay4,2020(Figure5).ThestandarddeviationoftheSMItimeseriesisshowninFigure 6.TheSMIsceneswerenotevenlydistributedovertime duetothelackofcloud-freeimages.Basedonthestandarddeviation,theareaswiththegreatestvariabilityin theentiresceneweretheagricultural fieldsshowninthe southeastcornerandthetwo “bull’s-eye” featuresalong thewesternedgeofthescene,withvaluesrangingfrom 0.20to0.30.TheSMIvaluesfortheEdenvilleDam rangedbetween0.5and0.9.Asexpected,thehighest SMIvalueswereobservedatoraroundWixomLake andtheTobaccoandTittabawasseeRivers,whilethe lowestSMIvalueswereobservedintheurbanareas,the landareabetweentheeastandwestsidesofWixomLake, andtheagricultural fieldstothesoutheastoftheEdenville Dam.Areasdownstreamofthesoutheastembankment alsoshowedrelativelylowertemporalvariabilityinthe SMI.TheSMIscenesinAprilandMayappearedtohave lesscontrast(“blurrier”)betweenvaryingland-usetypes, i.e.,urban,agricultural,forested,andwater.
TheresultsofthePSIanalysisoftheEdenvilleDam didnotprovideanysignificantobservationssupporting thedeformationofthesoutheastembankmentandapparentdisplacementatthefailurelocationovertheperiod ofstudy.Althoughthesoutheastembankmentrecorded anegativedisplacement,themagnitudewasnotsignificant(withintwostandarddeviations)andwascomparablewiththeeastandwestembankments,representing
stableconditions.Thelackofevidenceofnoticeable deformationofthesoutheastembankmenthighlightsthe limitationsofInSARtechniquesinvegetated floodplains orwhenthedeformationmagnitudeisbeyondthecapabilitiesoftheInSARtechnique.Theoretically,themaximumrelativedeformationratemeasurableforSentinel-1 istensofcentimetersperyearinadistanceofonepixel spacing,butitvarieswiththenoiselevelofthedataand thespecificphaseunwrappingtechniqueusedtoresolve phaseambiguities(Crosettoetal.,2016).
TheSMIanalysisfortheEdenvilleDamillustrates thevariationsinrelativesoilmoisturecontentfrom April2016toMay2020.Consistentsoilmoistureconditionsaretobeexpectedinanearthdamstructureconstructedwithengineereddrainage.Relativelyhigher SMIvaluesareanticipatedintheareasnearthedamand spillway,whichisevidentinFigure6.However,alinear stretchofconsistentsaturation(orhigherSMIvalues) trendingsouthwestwasobservedinmostoftheimages. Therelativelylowerstandarddeviationofthiszone (Figure6)impliesconsistentsaturationofthezone,suggestingthepossibilityofperennialsubsurfaceseepage. Itisworthnotingthatthepost-dambreakriverchannel developedthroughthissaturationzone.Hence,weargue thatthesaturatedzoneperpendiculartotheembankment reflectsthepresenceofapotentialconduitmechanism forseepageandinternalerosionfortheembankment failure.Pradeletal.(2021)identifiedsixterracelevels inthevicinityofthedam,wherethesecondandthird terracelevelspassbeneaththedamattheapproximate failurelocationandcorrespondtoachangeinelevation alongthebaseofthedam(»6.6ft; »2.0m)anda changeinunderlyinggeology.Theassociationbetween differentterracetreadsandglacialstratigraphyimplies thattheembankmentpredominantlyrestsonglacialtill ofvaryingagesandphysicalcharacteristics.However, incertainareas,thesub-damstratigraphyislikelycomposedofglacialoutwashand fluvialsands.Sincethe damwasconstructedacrosstheseterraces,resultingin lateralvariationsinthethicknessoftheembankment andgeologicalsubstrates(Pradeletal.,2021),thesedifferencesintheterracescouldlikelyhavefacilitatedconsistentseepage.Aspreviouslynoted,Pradeletal.(2021)
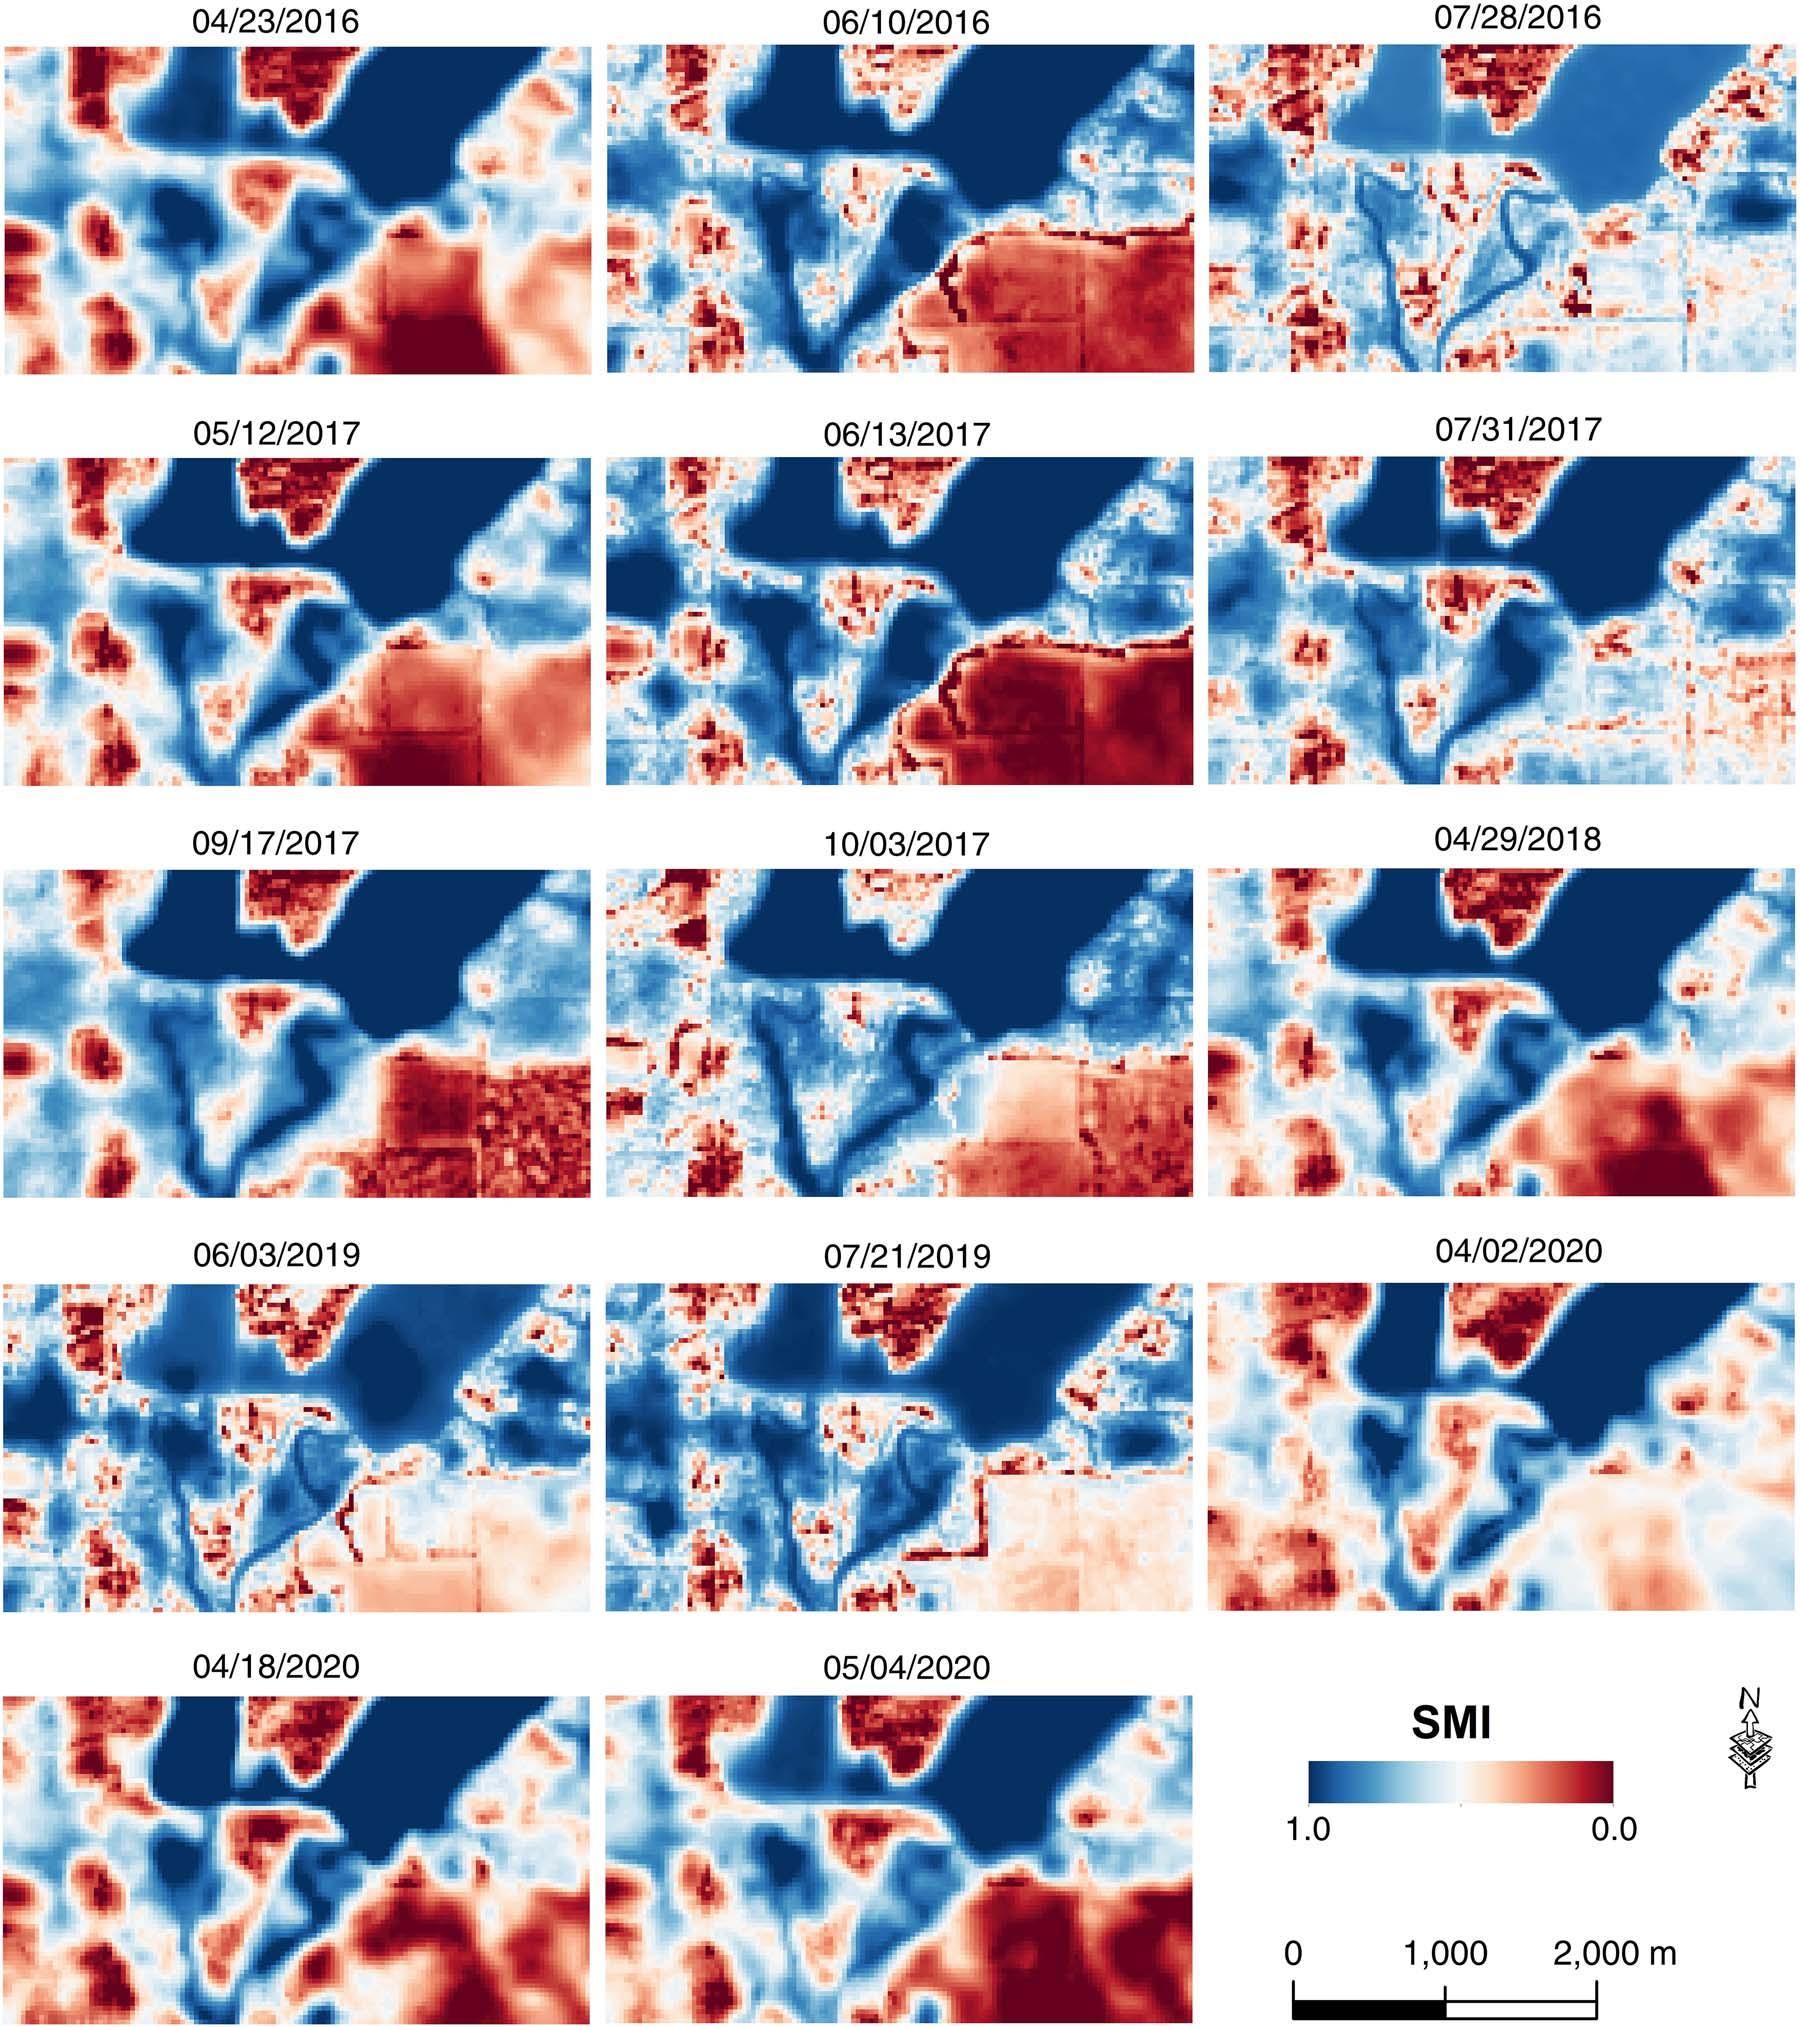
Figure5.SMItimeseriesforthe14Landsat8imagesobtainedbetweenApril23,2016,andMay4,2020.
reportedthatthefailedpatchoftheembankmentcorrespondstothetopographicstepbetweenthesecondand thirdterracesurfaces.BasedontheresultsoftheInSAR andSMIanalysis,weproposeamodelforthefailureof theembankment.Thesoutheastembankmenthadconsistentsubsurfaceseepage(zoneofsaturation)betweenthe secondandthirdterracelevels,reachingtheTittabawasseeRiverroughly750mdownstreamoftheEdenville Spillway.Theelevatedreservoirlevelsduetothestorm eventcouldhaveenhancedthepore-waterpressureand seepage,formingafailurezone.Thefullreservoirlevel
oftheWixomLakealsocausedstaticliquefactionof earthen fillmaterials(Pradeletal.,2021),andthesefactors,incombination,facilitatedaconventionalrotational slopefailure.Thelackofevidenceonthedeformationof theembankmentbytheInSARmethodsalsoreaffirms thishypothesisasstaticliquefactionoccursveryquickly.
Theoperatingrulecurvesforthereservoir(i.e., WixomLake)weretomaintainwaterlevelsbetween þ0.3ft(0.09m)and 0.4ft( 0.12m)ofthenormal poollevel,exceptduring floodsandwinteroperations (Franceetal.,2022).Drawdownforthewinterpool
levelbeganafterDecember15andlasteduntilJanuary 15.WixomLakewouldreturntonormalpoollevelonce surfacetemperaturesreached39°F(3.9°C).Withconsistentpoollevelsandadequatetimewhenchangingpool levelstoavoidrapiddrawdown,itisreasonableto assumethatthephreaticsurfacewouldremainconsistent throughouttheyearifproperdrainagewereinstalled. Rainfallcouldchangethephreaticsurface;however, properlyengineereddrainagewouldallowrainfallinfiltration.ThedrainagesystemfortheEdenvilleDamconsistedofclaytilesinstalledatthetimeofconstruction (Pradeletal.,2021;Franceetal.,2022).Originaldesign drawingsdidnotshowthetiles;however,a2012survey ofthedam’sunderdrainnotedthattheclaytileswere installedperpendiculartothefaceoftheembankment, wereuniformlyspaced,andweredischargedtoadrainageditchthatranparalleltothetoeoftheembankments. Thesurveyalsopointedoutthatalongthesoutheast embankment,claytilesweremissingfromthecenterof theapproximatefailurelocation,andsomeobstructions inthetileswerealsoobserved(Franceetal.,2022).The lackoftilescouldhaveresultedinahigherphreaticsurfacethaninareaswithgreaterclaytiledensity.
AlthoughInSAR-basedmethodshavebeendemonstratedtobepreciseandhighlyeffectiveinmonitoringthe deformationofearthenembankmentanddamfailures(e.g., GrenerczyandWegm€ uller,2011;Gamaetal.,2019;and SilvaRottaetal.,2020),thepre-damfailureanalysisofthe EdenvilleDamusingPSIdidnotofferanysignificantsigns ofmovementacrossthesoutheastembankment.However,
theSMI-basedanalysisfacilitatedtheidentificationof potentialfailurezoneswithperennialseepage.Hence,this studyundoubtedlysuggeststherequirementforamulti-sensor-basedapproachforperiodicmonitoringofdams.A majorlimitationoftheSMIanalysisisthelackofuniform temporaldistributionduetocloud-coveredscenes.Ofthe morethan50Landsat8imagesobtainedbetweenApril 2016andMay2020(excludingwintermonths),only14 wereabletobeusedintheanalysisduetocloudcover.The coarsespatialresolutionoftheSMIdatasetsisanotherlimitationofthisstudy.Thecurrentadvancementsindronebasedmulti-spectralimagingwillprovideasignificant opportunitytoovercomethelimitationsoftherelianceon satellite-basedSMIestimates.Inthe 2019Brumadinho damfailureanalysis(SilvaRottaetal.,2020),thespatial extentofthetailingsdamwaslargeenoughthattheuseof 30msatellitedatawasappropriateandcouldshowvariationsinmoisturecontent.Hence,arecommendationfor futureanalysisofspatiallysmallembankmentsistouse drone-baseddatasets,asgroundsamplingdistancesare muchsmaller,thereforeallowingtheobservationofsoil moisturevariationsingreaterdetail.Adrone-basedSMI analysiswouldalsoimprovetemporaluniformityasthe dronecanoperateirrespectiveofthecloudcover.
Inthisstudy,weinvestigatedthepotentialmanifestationsoftheEdenvilleDamfailure(Michigan,midwesternUnitedStates)onMay19,2020,usingbothPSIand
SMIanalyses.Thepre-failureanalysisofthesoutheast embankmentofthedamusingPSIprovidednoclear evidenceofdisplacementanomalies.Further,therateof deformationandcumulativedisplacementofthefailed (southeast)embankmentwerecomparablewiththestable conditions(eastandwestembankments).Thetime-series analysisofthesatellite-derivedSMIhighlightedthepotentialfailurezoneasachronicsubsurfaceseepagezone (zoneofsaturation)betweenthesecondandthirdterrace levels,whichissupportedbythepost-failurechannel development.Basedontheresultsoftheanalysis,weproposedamodelforthefailureoftheEdenvilleDam:The elevatedreservoirwaterlevelduringthestormeventmight havecausedstaticliquefactionofearthen fillmaterialsand increasedthepore-waterpressureandseepage,potentially creatingazoneofweakness,andthesefactors,incombination,likelyledtoaconventionalrotationalslopefailure andfailureoftheembankment.Thus,thisstudyhighlights thesignificanceofmulti-sensor-basedremote-sensing (multi-spectral,thermal,andradar)approachesintheperiodicmonitoringofcriticalinfrastructure,suchasdams.
The firstauthoracknowledgesthepartialsupportforthis workfromMichiganSpaceGrantConsortium(MSGC) Fellowshipgrantno.80NSSC20M0124.
DISCLAIMER
Theauthorsdeclarenoconflictofinterest.
B ESOYA ,M.;G OVIL ,H.; AND B HAUMIK ,P.,2020,AreviewonsurfacedeformationevaluationusingmultitemporalSARinterferometrytechniques: SpatialInformationResearch,Vol.29,No.3, pp.267–280.
CHEN,C.W. AND ZEBKER,H.A.,2001,Two-dimensionalphaseunwrappingwithuseofstatisticalmodelsforcostfunctionsinnonlinear optimization: JournaloftheOpticalSocietyofAmericaA,Vol.18, No.2,pp.338–351.
CRAWFORD,C.J.;ROY,D.P.;ARAB,S.;BARNES,C.;VERMOTE,E.; HULLEY,G.;GERACE,A.;CHOATE,M.;ENGEBRETSON,C.;MICIJEVIC, E.;SCHMIDT,G.;ANDERSON,C.;ANDERSON,M.;BOUCHARD,M.; COOK,B.;DITTMEIER,R.;HOWARD,D.;JENKERSON,C.;KIM,M.; KLEYIANS,T.;MAIERSPERGER,T.;MUELLER,C.;NEIGH,C.;OWEN,L.; PAGE,B.;PAHLEVAN,N.;RENGARAJAN,R.;ROGER,J.-C.;SAYLER,K.; SCARAMUZZA,P.;SKAKUN,S.;YAN,L.;ZHANG,H.K.;ZHU,Z.; AND ZAHN,S.,2023,The50-yearLandsatCollection2archive: Science ofRemoteSensing,Vol.8,pp.100103.
CROSETTO,M.;MONSERRAT,O.;CUEVAS-GONZÁLEZ,M.;DEVANTHÉRY,N.; andCRIPPA,B.,2016,PersistentScattererInterferometry Areview: ISPRSJournalofPhotogrammetryandRemoteSensing,Vol.115, pp.78–89.
DORR,J.A. AND ESCHMAN,D.F.,1970. GeologyofMichigan:UniversityofMichiganPress,AnnArbor,MI,488p.
EGLE(DepartmentofEnvironment,GreatLakes,andEnergy),2023, MichiganDamInventory:Electronicdocument,availableat https:// gis-egle.hub.arcgis.com/datasets/egle::michigan-dam-inventory/about
FEMA(FederalEmergencyManagementAgency),2022, MichiganDam IncidentResponseReview AnAnalysisofthe2020Edenvilleand SanfordDamFailureResponse:Electronicdocument,availableat https://www.fema.gov/sites/default/files/documents/fema_michigandam-incident-response-review_report.pdf
FERRETTI,A.;FUMAGALLI,A.;NOVALI,F.;PRATI,C.;ROCCA,F.; AND RUCCI,A.,2011,Anewalgorithmforprocessinginterferometric data-stacks SqueeSAR: IEEETransactionsonGeoscienceand RemoteSensing,Vol.49,No.9,pp.3460–3470.
FERRETTI,A.;PRATI,C.; AND ROCCA,F.,2001,Permanentscatterersin SARinterferometry: IEEETransactionsonGeoscienceandRemote Sensing,Vol.39,No.1,pp.8–20.
FOSTER,M.;FELL,R.; AND SPANNAGLE,M.,2000.Thestatisticsof embankmentdamfailuresandaccidents: CanadianGeotechnical Journal,Vol.37,No.5,pp.1000–1024.
FRANCE,J.W.;ALVI,I.A.;MILLER,A.C.;WILLIAMS,J.L.; AND HIGINBOTHAM,S.,2022, InvestigationofFailuresofEdenvilleandSanfordDams:FederalEnergyRegulatoryCommission.Electronicdocument,availableat https://damsafety-prod.s3.amazonaws.com/s3fspublic/files/Edenville-Sanford_Final%20Report_Main%20Report %20and%20Appendices.pdf
GAMA,F.F.;PARADELLA,W.R.;MURA,J.C.; AND DE OLIVEIRA,C.G., 2019,AdvancedDINSARanalysisondamstabilitymonitoring AcasestudyintheGermanominingcomplex(Mariana,Brazil) withSBASandPSItechniques: RemoteSensingApplications: SocietyandEnvironment,Vol.16,pp.100267.
GRAHAM,W.J.,2009,MajorU.S.damfailures Theircause,resultant losses,andimpactondamsafetyprogramsandengineeringpractice.InRogers,J.R.(Editor), GreatRiversHistory:Proceedings andInvitedPapersfortheEWRICongressandHistorySymposium: AmericanSocietyofCivilEngineers,KansasCity,MO,pp.52–60. GRENERCZY,G. AND WEGMÜLLER,U.,2011,Persistentscattererinterferometryanalysisoftheembankmentfailureofaredmudreservoir usingENVISATASARdata: NaturalHazards,Vol.59,No.2,pp. 1047–1053.
KEHEW,A.E.;ESCH,J.M.;KOZLOWSKI,A.L.; AND EWALD,S.K.,2012, GlaciallandsystemsanddynamicsoftheSaginawLobeofthe LaurentideIceSheet,Michigan,USA: QuaternaryInternational, Vol.260,pp.21–31.
LARSON,G. AND SCHAETZL,R.,2001,OriginandevolutionoftheGreat Lakes: JournalofGreatLakesResearch,Vol.27,No.4,pp.518–546.
LIN,Y.N.;PARK,E.;WANG,Y.;QUEK,Y.P.;LIM,J.;ALCANTARA,E.; AND LOC,H.H.,2021,The2020HpakantJademinedisaster, Myanmar Amulti-sensorinvestigationforslopefailure: ISPRS JournalofPhotogrammetryandRemoteSensing,Vol.177,pp. 291–305.
MALLICK,K.;BHATTACHARYA,B.K.; AND PATEL,N.K.,2009.Estimatingvolumetricsurfacemoisturecontentforcroppedsoilsusinga soilwetnessindexbasedonsurfacetemperatureandNDVI: AgriculturalandForestMeteorology,Vol.149,No.8,pp.1327–1342. MALTESE,A.;PIPITONE,C.;DARDANELLI,G.;CAPODICI,F.; AND MULLER, J.-P.,2021,Towardacomprehensivedammonitoring On-site andremote-retrievedforcingfactorsandresultingdisplacements (GNSSandPS-InSAR): RemoteSensing,Vol.13,No.8,pp.1543. MichiganSectionoftheAmericanSocietyofCivilEngineers,2023, 2023ReportCardforMichigan’sInfrastructure:American SocietyofCivilEngineers.Electronicdocument,availableat https://infrastructurereportcard.org/wp-content/uploads/2016/10/Report2023-MI-IRC-Final-WEB.pdf
MURA,J.;GAMA,F.;PARADELLA,W.;NEGRÃO,P.;CARNEIRO,S.;DE OLIVEIRA,C.; AND BRANDÃO,W.,2018,Monitoringthevulnerability ofthedamanddikesinGermanoironminingareaafterthecollapseofthetailingsdamofFundão(Mariana-MG,Brazil)using DInSARtechniqueswithTerraSAR-Xdata: RemoteSensing,Vol. 10,No.10,pp.1507.
NationalPerformanceofDamsProgram,2018, DamFailuresinthe U.S.:DepartmentofCivil&EnvironmentalEngineering,Stanford University.Electronicdocument,availableat https://npdp.stanford. edu/sites/default/files/reports/npdp_dam_failure_summary_compilation_ v1_2018.pdf
OTHMAN,A.A.;AL-MAAMAR,A.F.;AL-MANMI,D.A.M.;LIESENBERG, V.;HASAN,S.E.;AL-SAADY,Y.I.;SHIHAB,A.T.; AND KHWEDIM,K., 2019,ApplicationofDInSAR-PSItechnologyfordeformation monitoringoftheMosulDam,Iraq: RemoteSensing,Vol.11,No. 22,pp.2632.
PARIDA,B.R.;COLLADO,W.B.;BORAH,R.;HAZARIKA,M.K.; AND SAMARAKOON,L.,2013,Detectingdrought-proneareasofriceagricultureusingaMODIS-derivedsoilmoistureindex: GIScience& RemoteSensing,Vol.45,No.1,pp.109–129.
PRADEL,D.;LOBBESTAEL,A.;ATHANASOPOULOS-ZEKKOS,A.;BROOKS,C.; CHAMPAGNE,C.;CLARK,M.;DOBSON,R.;EDMONDS,D.;ESSER,A.; GONG,W.;HILLE,M.;MANOUSAKIS,J.;MARION,N.;MARTIN,H.; MIDTTUN,N.;NIEMI,N.;OOMMEN,T.;TOWNSEND,K.;YANITES,B.; AND ZEKKOS,D.,2021, EdenvilleandSanfordDamFailures:Field ReconnaissanceReport:AmericanSocietyofCivilEngineers, Reston,VA.
REDLINGER,J.F.;COPEN,M.D.;JUDD,W.R.;MATTHEWS,J.S.;PERDUE, J.M.,JR.;SHERLOCK,P.;VITHALANI,J.;WAHLER,W.A.; AND WILSON,G.R.,1975, LessonsfromDamIncidentsUSA:American SocietyofCivilEngineers,NewYork,NY.
SILVA ROTTA,L.H.;ALCÂNTARA,E.;PARK,E.;NEGRI,R.G.;LIN,Y.N.; BERNARDO,N.;MENDES,T.S.G.; AND SOUZA FILHO,C.R.,2020, The2019Brumadinhotailingsdamcollapse:Possiblecauseand impactsoftheworsthumanandenvironmentaldisasterinBrazil: InternationalJournalofAppliedEarthObservationandGeoinformation,Vol.90,pp.102119.
VASSILEVA,M.;GIULIO TONOLO,F.;RICCARDI,P.;LECCI,D.;BOCCARDO, P.; AND CHIESA,G.,2017,SatelliteSARinterferometrictechniques
insupporttoemergencymapping: EuropeanJournalofRemote Sensing,Vol.50,No.1,pp.464–477.
WU,W.M.;ALTINAKAR,M.S.;AL-RIFFAI,M.;BERGMAN,N.; BRADFORD,S.F.;CAO,Z.X.;CHEN,Q.J.;CONSTANTINESCU,S.G.; DUAN,J.G.;GEE,D.M.;GREIMANN,B.;HANSON,G.;HE,Z.G.; HEGEDUS,P.;VAN HOESTENBERGHE,T.;HUDDLESTON,D.;HUGHES, S.A.;IMRAN,J.;JIA,Y.F.;JORGESON,J.D.;KAHAWITA,R.;KLUMPP, C.C.;LAI,Y.;LANGENDOEN,E.J.;LIU,S.E.L.;MOREDA,F.; MORRIS,M.;MORVAN,H.;ORENDORFF,B.;PAK,J.;PEETERS,P.; REED,S.;SANDERS,B.F.;SCOTT,S.H.;SOARES-FRAZAO,S.;SONG, C.R.;SUTHERLAND,J.;TEAL,M.J.;TSUBAKI,R.;WAHL,T.L.; WESTON,D.M.;WILLIAMS,D.T.;ZECH,Y.;ZHANG,L.M.; AND ASCEEWRITASK COMMITTEEON DAM/LEVEE BREACHING,2011, EarthenEmbankmentBreaching: JournalofHydraulicEngineering,Vol.137,No.12,pp.1549–1564.
YUAN,L.;LI,L.;ZHANG,T.;CHEN,L.;ZHAO,J.;HU,S.;CHENG,L.; AND LIU,W.,2020,SoilmoistureestimationfortheChineseLoessPlateauusingMODIS-derivedATIandTVDI: RemoteSensing,Vol. 12,No.18,pp.3040.
ZHANG,Z.;WANG,C.;TANG,Y.;FU,Q.; AND ZHANG,H.,2015,Subsidencemonitoringincoalareausingtime-seriesInSARcombining persistentscatterersanddistributedscatterers: InternationalJournalofAppliedEarthObservationandGeoinformation,Vol.39, pp.49–55.
ZHIMING,Z.;QIMING,Q.; AND XIN,W.,2004,TheapplicationofLST/ NDVIindexformonitoringlandsurfacemoistureinsemiarid area.In IGARSS2004:2004IEEEInternationalGeoscienceand RemoteSensingSymposium,Vol.7:TheInstituteofElectricaland ElectronicsEngineers,Piscataway,NJ,pp.1551–1554.
ZUMR,D.;DAVID,V.;JEŘÁBEK,J.;NOREIKA,N.; AND KRÁSA,J.,2020, Monitoringofthesoilmoistureregimeofanearth-filleddamby meansofelectricalresistancetomography,closerangephotogrammetry,andthermalimaging: EnvironmentalEarthSciences,Vol. 79,No.12,pp.299.
MOAMENALMAZ
DepartmentofGeosciences,340N.CampusWalk,216GearhartHall, UniversityofArkansas,Fayetteville,AR72701
DepartmentofGeography,GeologyandPlanning,901S.NationalAve., MissouriStateUniversity,Springfield,MO65897
DepartmentofGeosciences,340N.CampusWalk,216GearhartHall, UniversityofArkansas,Fayetteville,AR72701
KeyTerms: ElectricalResistivity,InverseModels, Landslides,Colorado
Landslidescancausesignificantinfrastructuredamage andthousandsofdeathsaroundtheworld.Colorado Springshasexperiencednumerousdamaginglandslidesthathavenotbeenpreviouslygeophysically investigatedduetoitsgeologicalandclimaticconditions aswellasincreasedurbandevelopmentintolandslideproneareas.In2015,heavyrainfallcausedtheSkyway andBroadmoorBluffslandslidesthatdestroyed30 homes.Inthisstudy,thesetwolandslideswerestudied usingtheelectricalresistivitymethodtoevaluatethe natureofthelandslides.Two-dimensionalinversemodelsconstrainedbygeologicalandboreholedataindicate thatbothlandslidesoccurredwithintheweatheredportionoftheCretaceousPierreShale.Thedepthtothe landslidefailuresurfacerangedbetween3to6mand 6to8mfortheSkywayandtheBroadmoorlandslides, respectively.Bothlandslideshavecharacteristicsofa rotational-typelandslide,butthreemodels(twofor Skyway,oneforBroadmoor)donothavesmooth failuresurfaces.ThePierreShaleischaracterized bysignificantlylowerresistivitythantheoverlyingclay. Thissuggeststhelandslidefailurewaspromoted byhighmoisturecontentwithinthePierreShale. Therefore,theSkywayandBroadmoorareasneed tobemonitoredforfuturelandslidesduringhighprecipitationevents.Additionalgeophysicaldataare neededtofullydeterminethenatureandextentofthe landslidesinColoradoSprings.Ourresultspresentthe
*Correspondingauthoremail: kevinmickus@missouristate.edu
firstsubsurfacemodelsoftheSkywayandBroadmoor landslides.Cityplannerscanusethesemodelsascritical dataformitigatingfuturelandslides,whichcanbeused forfutureurbandevelopment.
ThestateofColoradohasbeenaffectedbylandslides sincehistoricaltimesbecauseofitssteepterrainandgeologicalandclimaticconditions(Ivesetal.,1976).TheoccurrenceoflandslidesinColoradohasincreasedinmodern timesasaresultoflanddevelopmentintoregionsthatare susceptibletolandslides(Ivesetal.,1976).Theselandslides havecausednumerousdeathsanddamageintheorderof millionsofdollarsperyearthroughdestroyingtransportationlines,homes,buildings,andblockedwaterways(Ives etal.,1976;Carrara,1979).InColorado,themainfactors triggeringlandslidesareprecipitation,geologicalconditions,constructionactivities,andfastsnowmeltonland thathassteepslopes(Wieczoreketal.,1989).Whereas landslidesoccurinnumerouslocationsinColorado,El PasoCountyincentralColoradoandespeciallytheeasternslopeoftheFrontRangeoftheRockyMountainsare consideredhigh-risklocationsforlandslides(Figure1) duetotheirunstablegeology(friablerockanddipping layers)andafastpopulationgrowth(Depalo,2018).
ColoradoSpringsisthemajorurbancitywithinElPaso County,whichislocatedintheeast-centralportionofColorado;itoccupiesanareaof505km2 (Figure2).ThewesternpartofColoradoSpringsisapopularchoiceinwhich tolivebecauseoftheviewsoftheRockyMountainFront Range(Henryetal.,2017).Thispopulationgrowthhasled todevelopmentintohigh-landslide-riskregions,which,in turn,increasestheprobabilityofalandslideoccurrence (Squire,2006;Henryetal.,2017).
fiedfromDepalo,2018).
Thecityanditssurroundingregionhaveasemiaridclimatewithanaverageannualprecipitationof420mm(Figure3).Ofimportancetolandslidedevelopment,isthe summermonsoonalrainthatenterstheregionmainlyfrom theSouthwestUnitedStates(Henryetal.,2017).These monsoonalrainsproducesudden,heavyrainsthatcanact aslandslidetriggers.Inadditiontothemonsoonalrain,a varietyofclimaticeventstriggeredseverallandslidesin the1990s(Squire,2006).In1993,landslidesoccurredduringaheavyraineventthatdamagedtheBroadmoorgolf course,andin1995,threehomesweredestroyedbya heavysnowfalleventthatcausedseverallandslidesinthe southwesternpartofthecity.In1999,heavyrainscaused landslidesthatresultedinaround$80millionindamages (Squire,2006).Additionally,severalexceptionallyheavy raineventsin2015reactivatedoldlandslidesurfacesand causednewlandslidesthatdestroyed30homes(Squire, 2006;Henryetal.,2017).
Theconnectionbetweenlandslidemechanismsand precipitationcanbeseenbymonthlyprecipitationdata (January2014toJune2015)(Figure4)thatprecededthe SkywayandBroadmoorlandslidesthatoccurredin 2015.TherainfalldataindicatethatboththeSkyway andBroadmoorlandslideareaswereaffectedbyheavy rainfall.BeforelandslidesoccurringinMay2015,the landslideareasexperiencedheavyprecipitationsixtimes in2014inApril,June,July,August,September,and
OctoberandonetimeinApril2015.Overa15-month period,thelandslideareasbecamemoresaturatedand morevulnerabletolandslideoccurrences.
ColoradoSpringshasgrownbeyondthedevelopedmain cityandintothesurroundingareas,especiallyonhillslopes onthewesternsideclosertotheRockyMountains(Henry etal.,2017),wherethegroundconsistsofunstableshale, claystone,andolderlandslidedeposits(White,2017).This developmenthasdecreasedthestabilityofthehillslopeareas andmadethisregionvulnerabletolandslides.Consequently, thewesternsideofthecityhasexperiencednumerouslandslidesduringthelast43years.Afterthe2015landslide events,thecityofficialsandthehomeownersmettodiscuss waystostudytheselandslidestominimizefuturedamage, andtheyrecognizedtheSkywayandBroadmooractive landslidezones(Henryetal.,2017).
Thereareseveralmethodstoinvestigateandmonitor thenatureandlocationoflandslides,includingboreholes, geodeticmethods,remotesensing,andgeophysicalmethods(Perroneetal.,2014;Zeybeketal.,2015;Zhaoand Lu,2018;andWhitleyetal.,2019).Althoughallofthese methodsareneededtofullyinvestigatethepotentialfor landslidemovement,geophysicalmethodsareidealfor determiningboththelateralextentanddepthoftheregions susceptibletolandslidemovements.Mostgeophysical methods,includingelectricalresistivity(ER),electromagnetics,seismicreflection,seismicrefraction,surfacewaves,
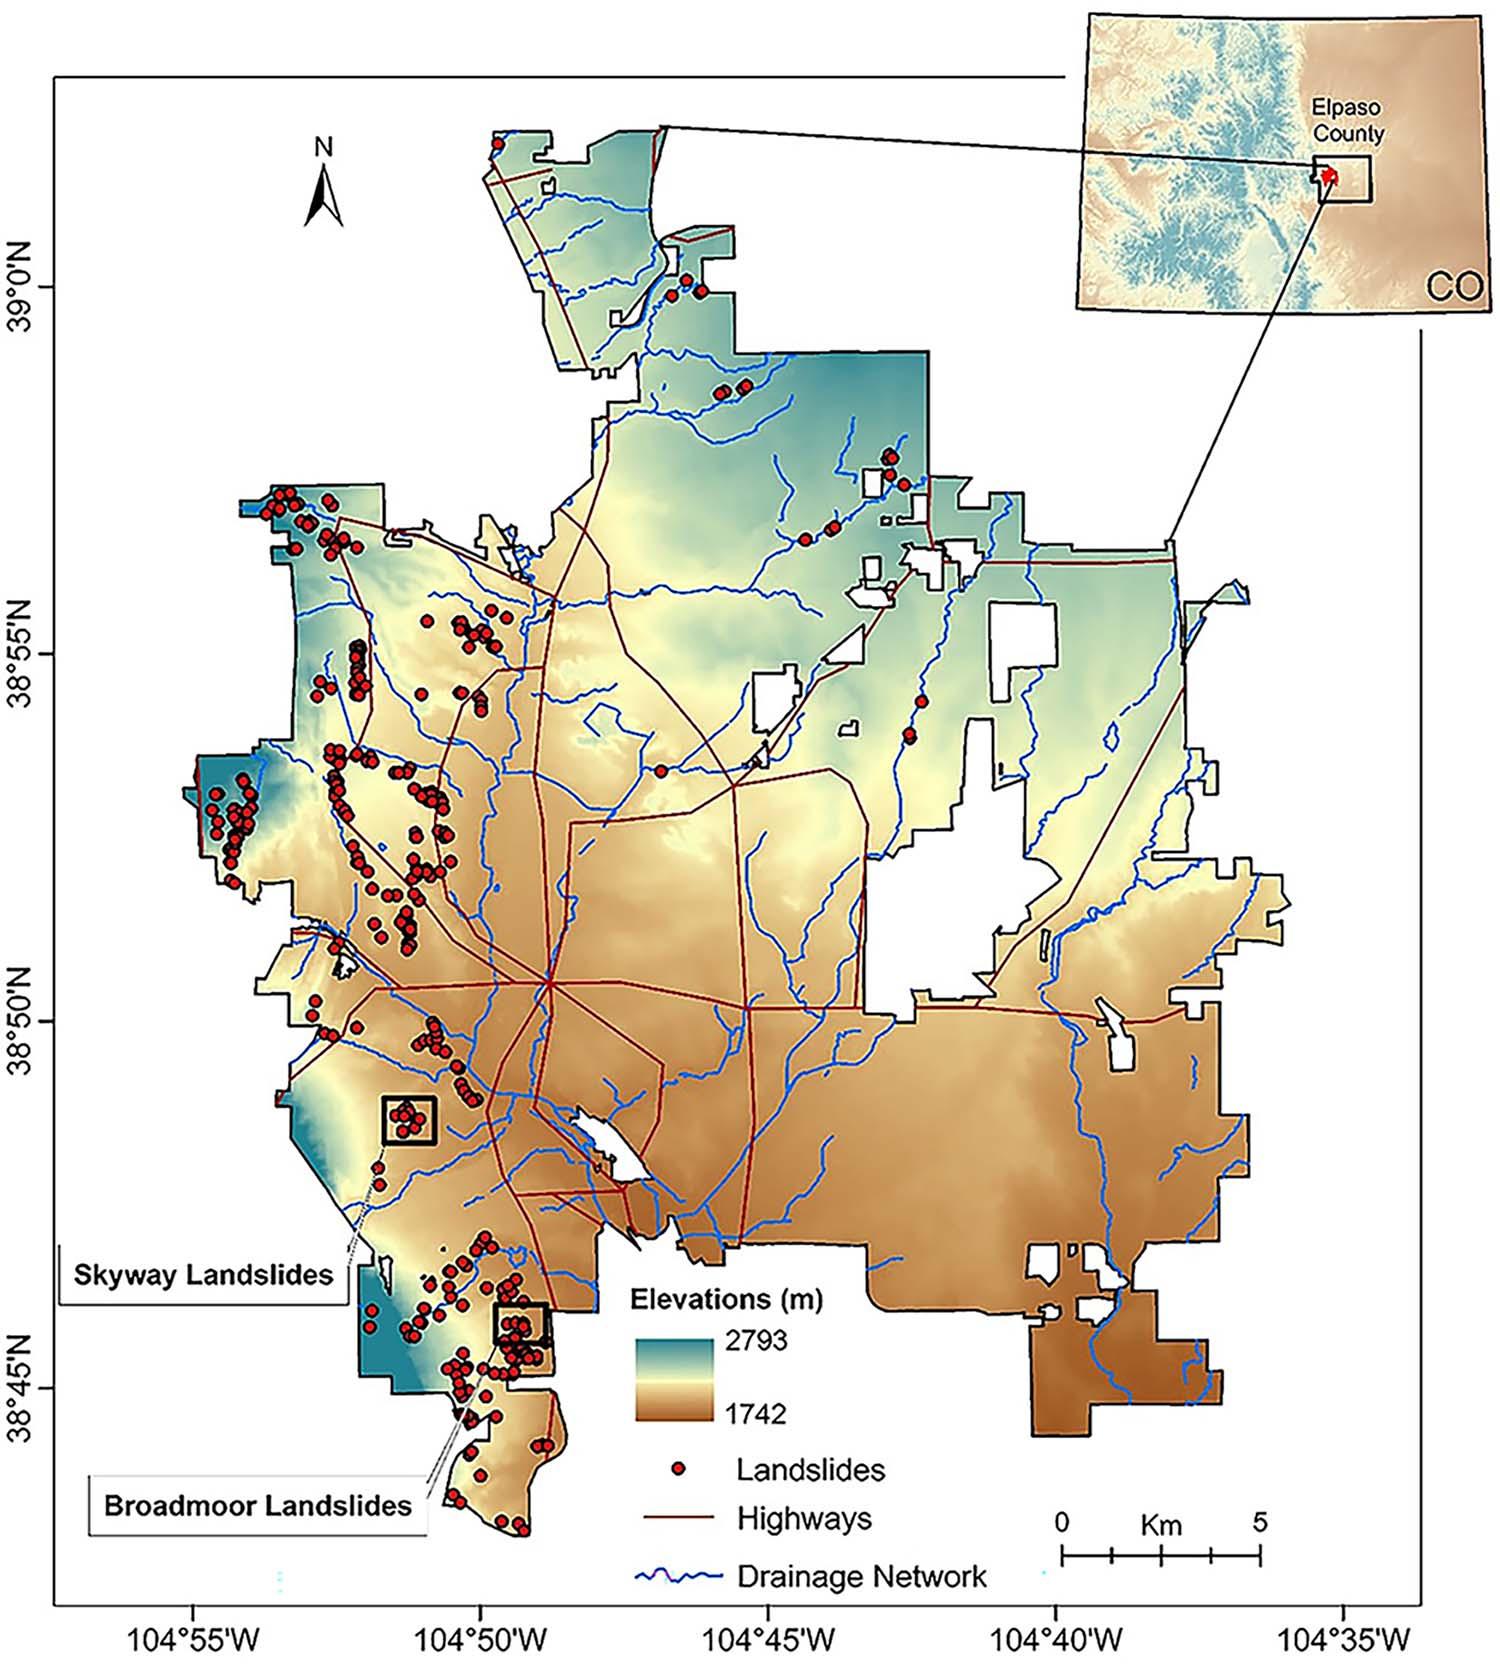
ground-penetratingradar,andmicrogravity,canprovide informationononeormoreofthesubsurfaceparameters thatdefinelandslidemovements.Theseparametersinclude watercontent,claycontent,materialdensity,velocityvariationsinmaterialcomposition,andslipsurfaces(Whitley etal.,2019).Oneofthemostusedgeophysicaltechniques istheERmethod,whichcanalsobeusedtoestimatethe waterandclaycontentofthesubsurfaceandimageany potentialslipsurfaces.Additionally,ERdataarerelatively easytocollectandcanalsobecollectedrepeatedlyover timetocontinuouslymonitoraregionthatispronetolandslidehazards(Crawfordetal.,2018;Huntleyetal.,2020).
Inthisstudy,weusedERbecauseitisoneofthemost suitablegeophysicalmethodsforshallowexplorationof landslides(Telfordetal.,1990;Reynolds,1997).Many studiesuseERtostudylandslidespartlybecausethefactorsthatcontrolbothERandlandslidesarealmostthe
same(CarisandvanAsch,1991;Schmutzetal.,2000; Lapennaetal.,2003;andHuntleyetal.,2020).Someof thesefactorsarerockandsoiltypes,rockandsoilthicknesses,typeofbedrock,andwatercontent(Crawford etal.,2018).Electricalresistivityissensitivetothenature ofthesubsurfacematerials,especiallyclaycontent,water content,waterconductivity,andtheweatheringofrocks. Consequently,ERcanprovidevaluableinformationabout thelocationofthefailuresurface,thegeometryofthe landslidesurface,themoisturecontent,andtheboundary interfacesbetweenvarioussoilsandrocktypes(McCann andForster,1990;Ganceetal.,2016;CrawfordandBryson,2018;andCrawfordetal.,2018).ThederivedER modelsarethe firstgeophysicalstudyonthelandslides withinthesusceptibleregionofColoradoSpringsarea, Colorado,andwillaidcityandcountyplannersindeterminingfutureurbandevelopment.
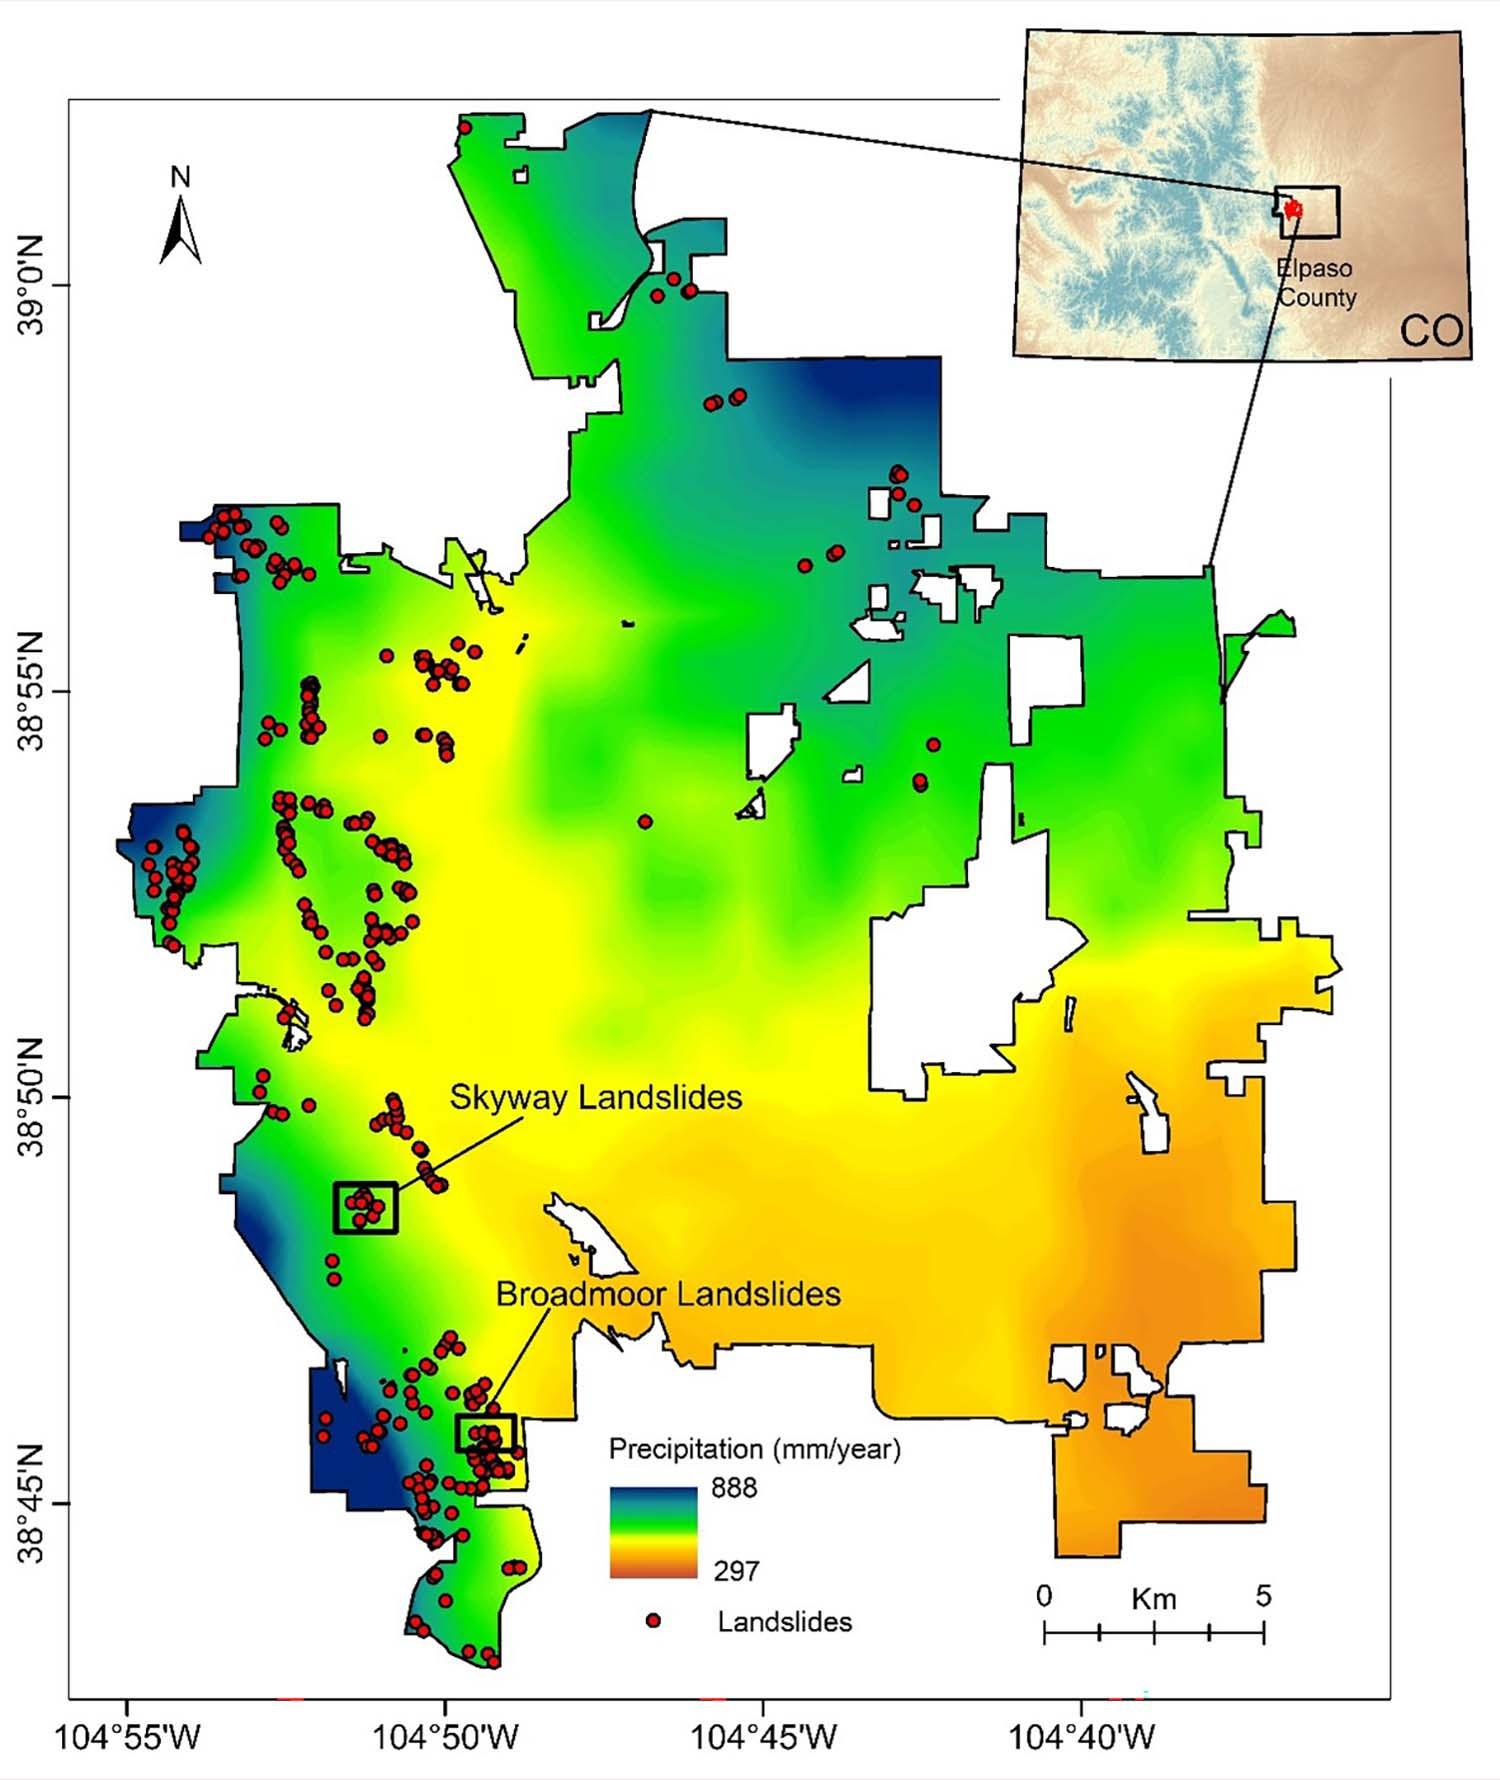
ColoradoSpringsisadjacenttotheFrontRangeofthe RockyMountains.ThegeologicalunitswithinandsurroundingtheColoradoSpringsareaconsistmainlyofQuaternary torecentdepositsoverlyingPaleozoictoMesozoicsedimentaryrocks,andthesesedimentaryunitsareunderlain byProterozoicgranites,granodiorites,andmetamorphic rocks(CarrollandCrawford,2000;Siddowayetal.,2013; andWhite,2017).TheProterozoicrocksandthemajority ofthePaleozoicandMesozoicunitscropoutwithinthe FrontRange,whereaseastoftheFrontRange,thegently slopingtopographyisdominatedbyoutcroppingofQuaternarytorecentsurficialdeposits.Anumberofrockoutcrops eastoftheFrontRangeincludetheCretaceousPierreShale,
andthisunitformsthebedrockforthelandslidesthatare thefocusofthisstudy(Figure5).
Thesurficialdepositsaretypically .1.5mthick,but inplaces,theycanbethinner(CarrollandCrawford, 2000).Thesesurficialdepositsincludeavarietyofcolluvium,eolian,andalluviumdepositsthatformterraces, fans,andstreamdeposits.Ofimportancetothisstudyare thecolluviumdeposits,whichcontainmainlysilt,sand, gravel,andclayandalsoincludetalusandlandslide deposits(CarrollandCrawford,2000;Southerland, 2020).Thelandslidedepositsincluderecentlandslides andolderHolocenetoPleistocenelandslides.The olderlandslidedepositsaregenerallyinactiveand includetranslationallandslides,rotationallandslides, andearth fl ows.Themajorityoftherecentandolder

Figure4.Monthlyprecipitationdatafor(Jan2014–June2015)forSkywayandBroadmoorlandslideareaswith0.25° 3 0.25°resolutionfromthe GlobalPrecipitationClimatologyCentrewebsite(Schneideretal.,2017).
landslidesoriginatedintheweaker,i.e.,lesscompetenteastdippingunits,whichincludetheCretaceous PierreShale,theGlenEyrieShalememberofthe PennsylvanianFountainformation,andtheclay-rich layerswithintheCretaceousLaramieandPaleocene Dawsonformations(White,2017).However,afew smallrecentlandslidesformedwithintheProterozoic granodiorite(CarrolandCardwell,2003).
ThePierreShaleformation,amaincomponentofthe landslides,wasformedinashallowmarineenvironment duringtheLateCretaceouswhentheWesternInterior SeawaycoveredcentralandeasternColorado(Noblett, 1994;Southerland,2019).ThePierreShalemainlycontainsbrowntogreenishclayandalsocontainsanupper sandypartinadditiontothinbentonitelayersandsome fractures filledwithsulfosalts(CarrollandCrawford, 2000).WeatheringofthePierreShaleproducesabundant smectiteandbentonite(clay)layers,thataresusceptible toshrinking,swelling,andheaving(Squire,2006).These propertiesmakethePierreShaleunstablewithalow cohesivestrength.Theclaylayersareespeciallysusceptibletolandslideformation(CarrollandCrawford,2000). ThePierreShaleoccursthroughoutColoradoSpringsand ismainlyfoundinitswesternpartonslopesrangingfrom 15°to45°.Inthisregion,thedipoftheshaleisnearlythe sameasthetopographicslope(Figure6).Inadditionto theerosionofthematerialsoverlyingtheconsolidated PierreShaleformation,theshaleitselfhasthepotentialto expandwhenitgetswet,whichincreasestheprobability oflandslideoccurrences(Squire,2006).
Structurally,theColoradoSpringsareaisdominated bythecentralFrontalRange,atopographichighthatformed duringtheLateCretaceousLaramideorogeny(Siddoway etal.,2013).ThisMesozoicorogenygeneratedabasement
upliftinwhichtheRampartRangefaultzonebroughtProterozoicgranitoidrocksuptothesurface(Siddowayetal., 2013).Aseriesofback-thrustfaultsandfrontal-thrustfaults emplacedPaleozoicsedimentaryunitsadjacenttoMesozoic sedimentaryunitstothewestofColoradoSprings.The PierreShaleliesina flexuralbasintotheeastoftheFront RangeupliftandgraduallydecreasesinslopeeastofColoradoSprings(Figure6;Siddowayetal.,2013).
WithinthegreaterColoradoSpringsarea,therearetwo landslidezonesthatwereactivein2015:theSkywayand theBroadmoorBluffs.TheSkywaylandslidezoneisarelativelynewzoneincontrasttotheothertwozonesthat containreactivatedlandslides.Precipitation,lithology types,soiltypes,andhighslopesgreatlyin fl uencedthe amountofmovementandtheareaaffectedbythe2015 landslides(Henryetal.,2017).BoththeSkywayand theBroadmoorlandslidesarelocatedwithintheregion ofhighestprecipitationinColoradoSprings(Figure3). The2015landslidesweredevastatinganddestroyed30 homes(White,2017).Figure7showsvariousfeatures (e.g.,scarp,toe,propertydamage,etc.)relatedtotheSkywayandtheBroadmoorlandslides.Mostofthe2015landslidesarestillactiveandneedfurtherstudy.
TheSkywayneighborhoodhadnotpreviously experiencedanylandslidespriorto2015whenthe Skywaylandslidesuddenlyoccurred.Additionally, thelandslidesusceptibilityhadnotbeendetermined
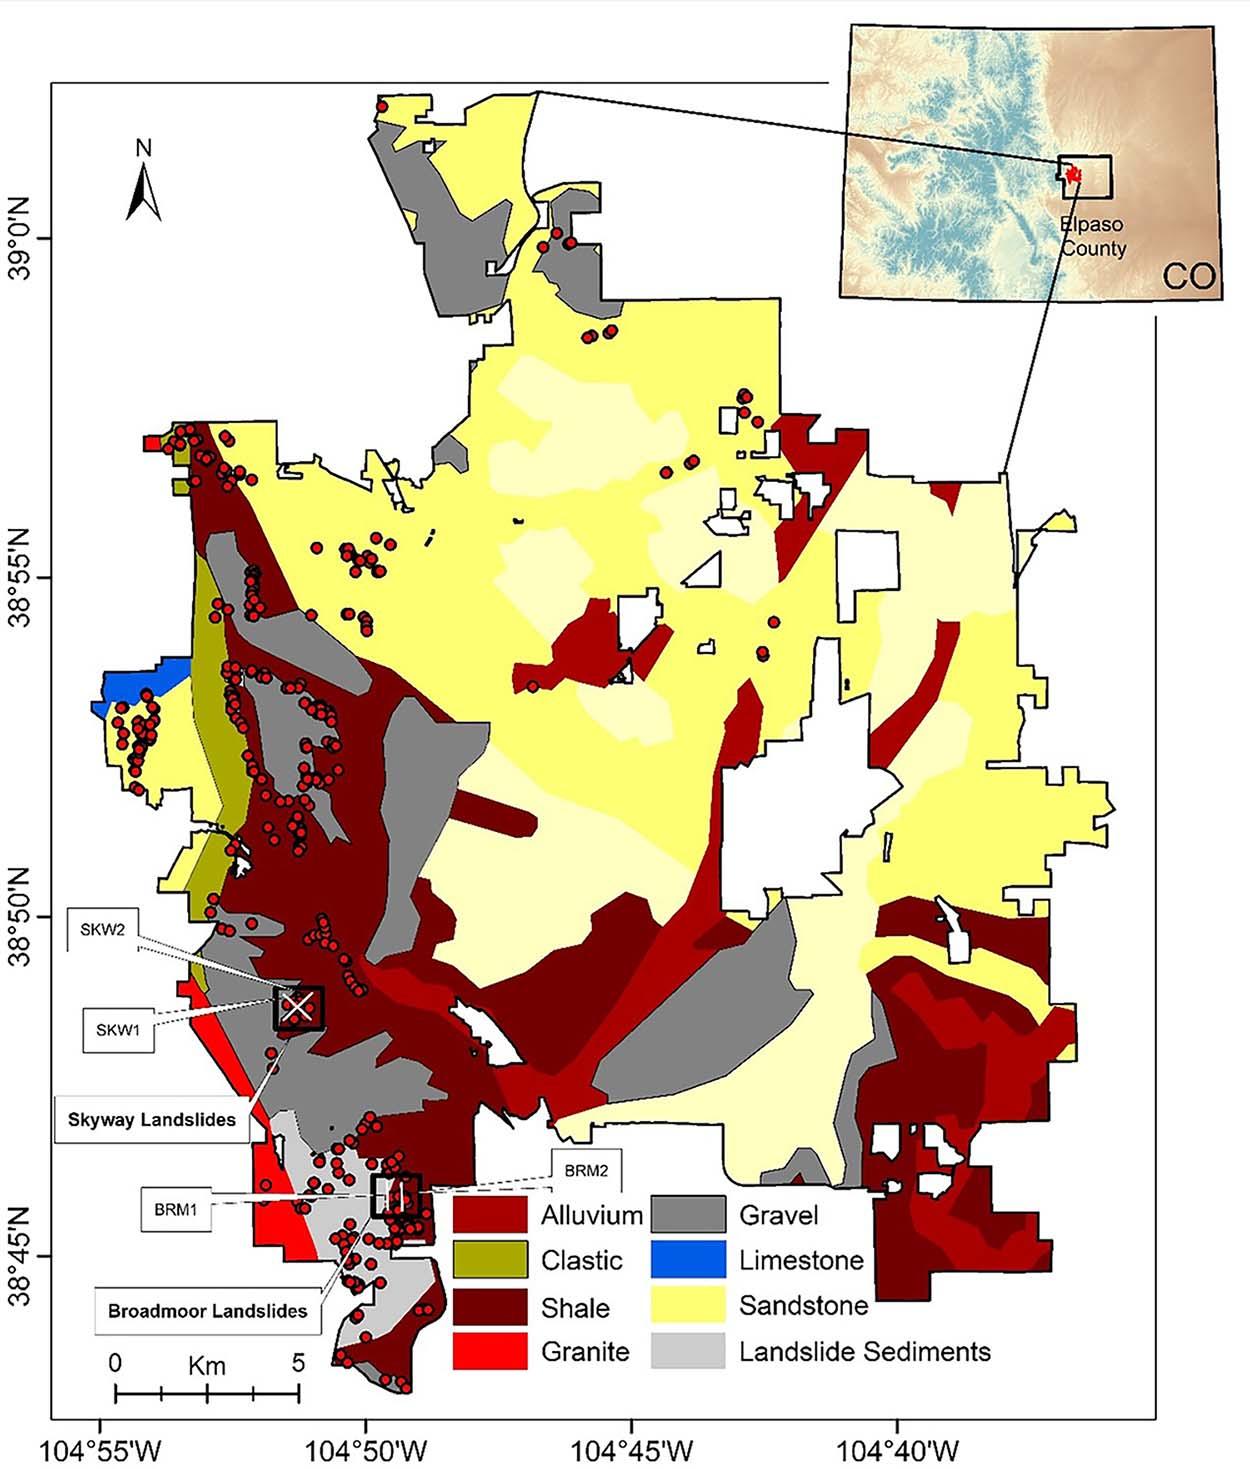
inthisneighborhoodatthetimeofbuildingofthehomes (Henryetal.,2017).TheSkywayneighborhoodwasbuilt alongthebase,side,andtopofamesawithsandandgravel depositscoveringthetopofthemesa.
ThereisasteepslopebetweenhomesonZodiac Driveatthebottomofthemesaandthehilltophomes onConstellationDrive(Figure8).OnJuly4,2015, theSkywaylandslidewas fi rstobservedonConstellationDrivebyahomeownerwhonoticeda fi ssurein thelandscape.Then,alandslideformedwiththe heightoftheheadscarpbeing »6.7m.Thetoeofthe SkywaylandslidedestroyedseveralhomesonZodiac Drive(Figure7).
BecausetherehadbeennolandslideswithintheSkyway landslideareapriorto2015,therewaslittle knownabout thesusceptibilitytolandmovement.Thus,theoccurrenceof the2015landslidewassomewhatofasurprise(Henry etal.,2017).However,WhiteandWait(2003)state thatthePierreShale,whichliesbetweenthevalley fl oorandthemesatopanddipsinthesamedirectionof theslope,makesthisareasusceptibletolandslides.
ParalleltoBroadmoorBluffsDrive,whichliesonaridge withintheBroadmoorGlenSouthdevelopment(Figure9) inColoradoSprings,alandslideheadscarpdevelopedin 2015(Figure9).TheheadscarpoftheBroadmoorBluffs Drivelandslidecutthroughsixofsevenhomes,destroying them.Someresidentsmovedoutbecausetheirhomeswere splittingintotwosides(Figure7C).Ageologicalhazard studyperformedbeforetheconstructionofhomeson BroadmoorBluffsDriveshowsthatbothsidesofBroadmoorBluffsDrivehadexperiencedlateralgroundmotion withinthelast20years(Henryetal.,2017).Unfortunately,mosthomeswereconstructedonrecentlandslide deposits(Terracon,1999),andtheshearfailuresurface existedundermanybuildinglots.
BecausetheBroadmoorBluffsareahadexperienced landslidesbefore,thereismoreboreholedatathanthe Skywaylandslidearea.CTLThompson(1997)foundthat theclaystone/shaleinterfacederivedfromsoil-boringlogs betweentheCheyenneMountainZooandthebaseofthe
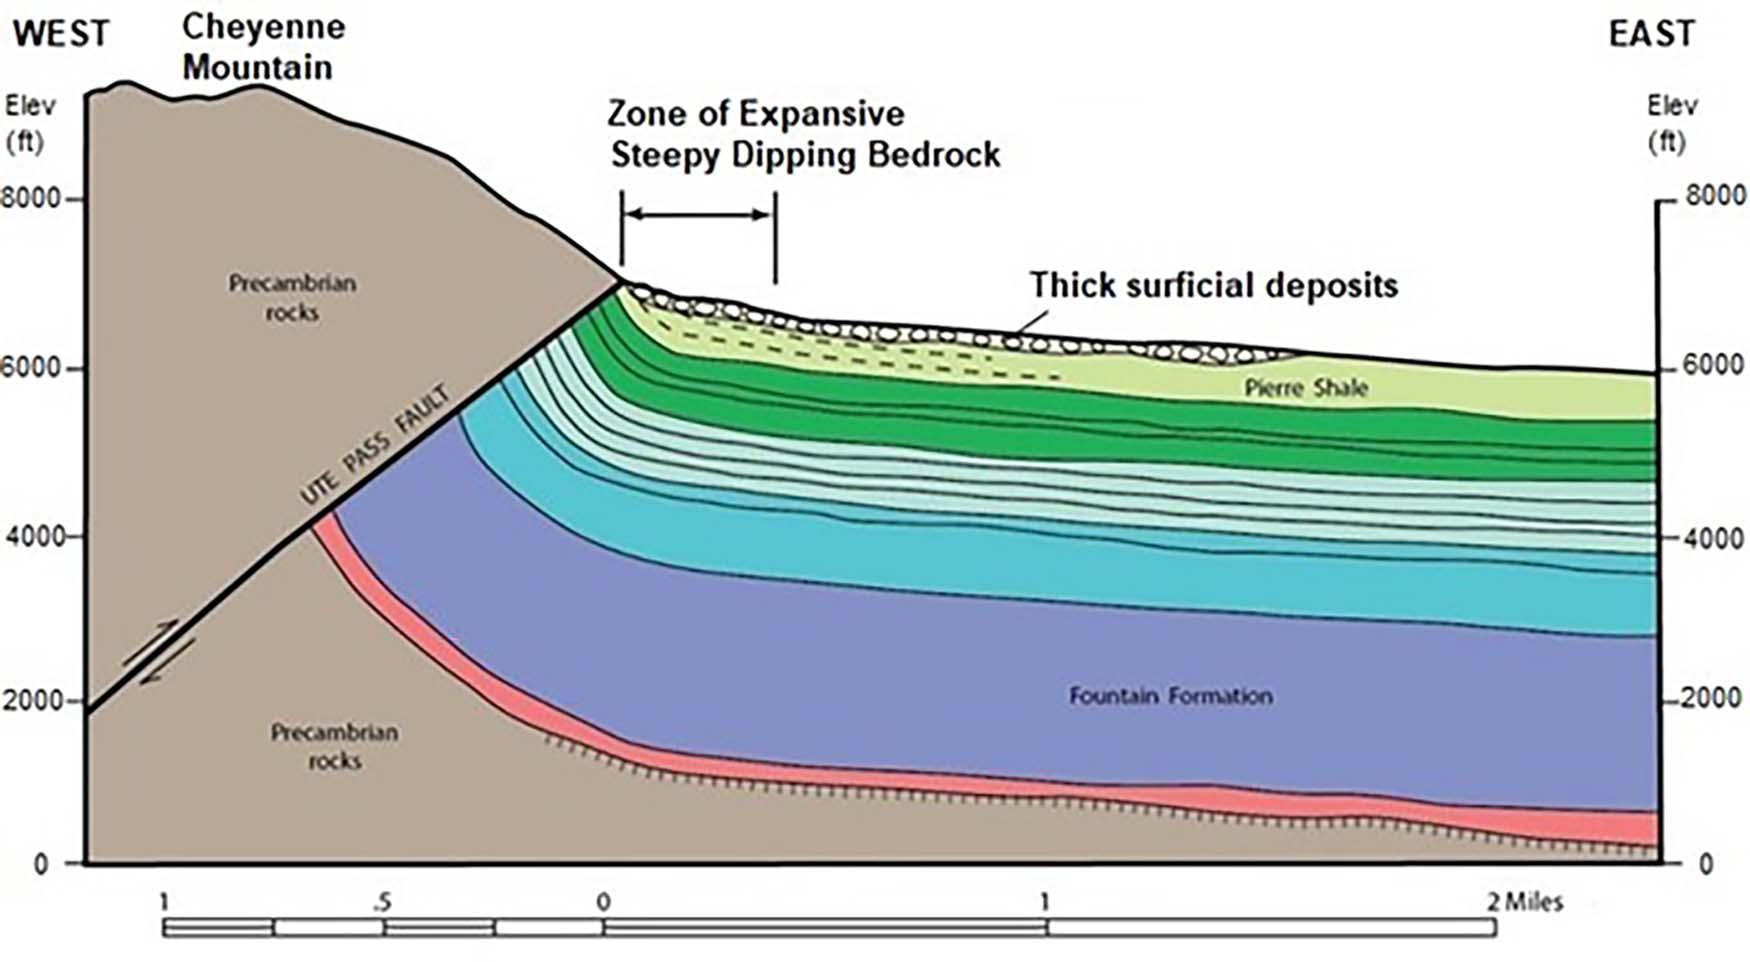
Figure6.Geologiccross-sectiononthesouthwesternpartofthecityattheCheyenneMountainFront,ColoradoSprings,ElPasoCounty, Colorado(CarrollandCrawford,2000;White,2017).
oldBroadmoorSkiAreathatrangedfrom4.2to10.4m (Table1).Additionally,fortheBroadmoorGlenSouth neighborhood,theboreholedatafoundthatthedepthof theclaystonerangesfrom1.2to18.3m(Table2)(Chen,
1987;Terracon,1998,2005a;andCTLThomson,2005a).
FortheBaron’sRidgeandBroadmoorResortcommunities,theclaystonedepthrangesfrom3.1to7.6m(Table3) (CTLThompson,2005a,2008a,2008b;Terracon2005b).
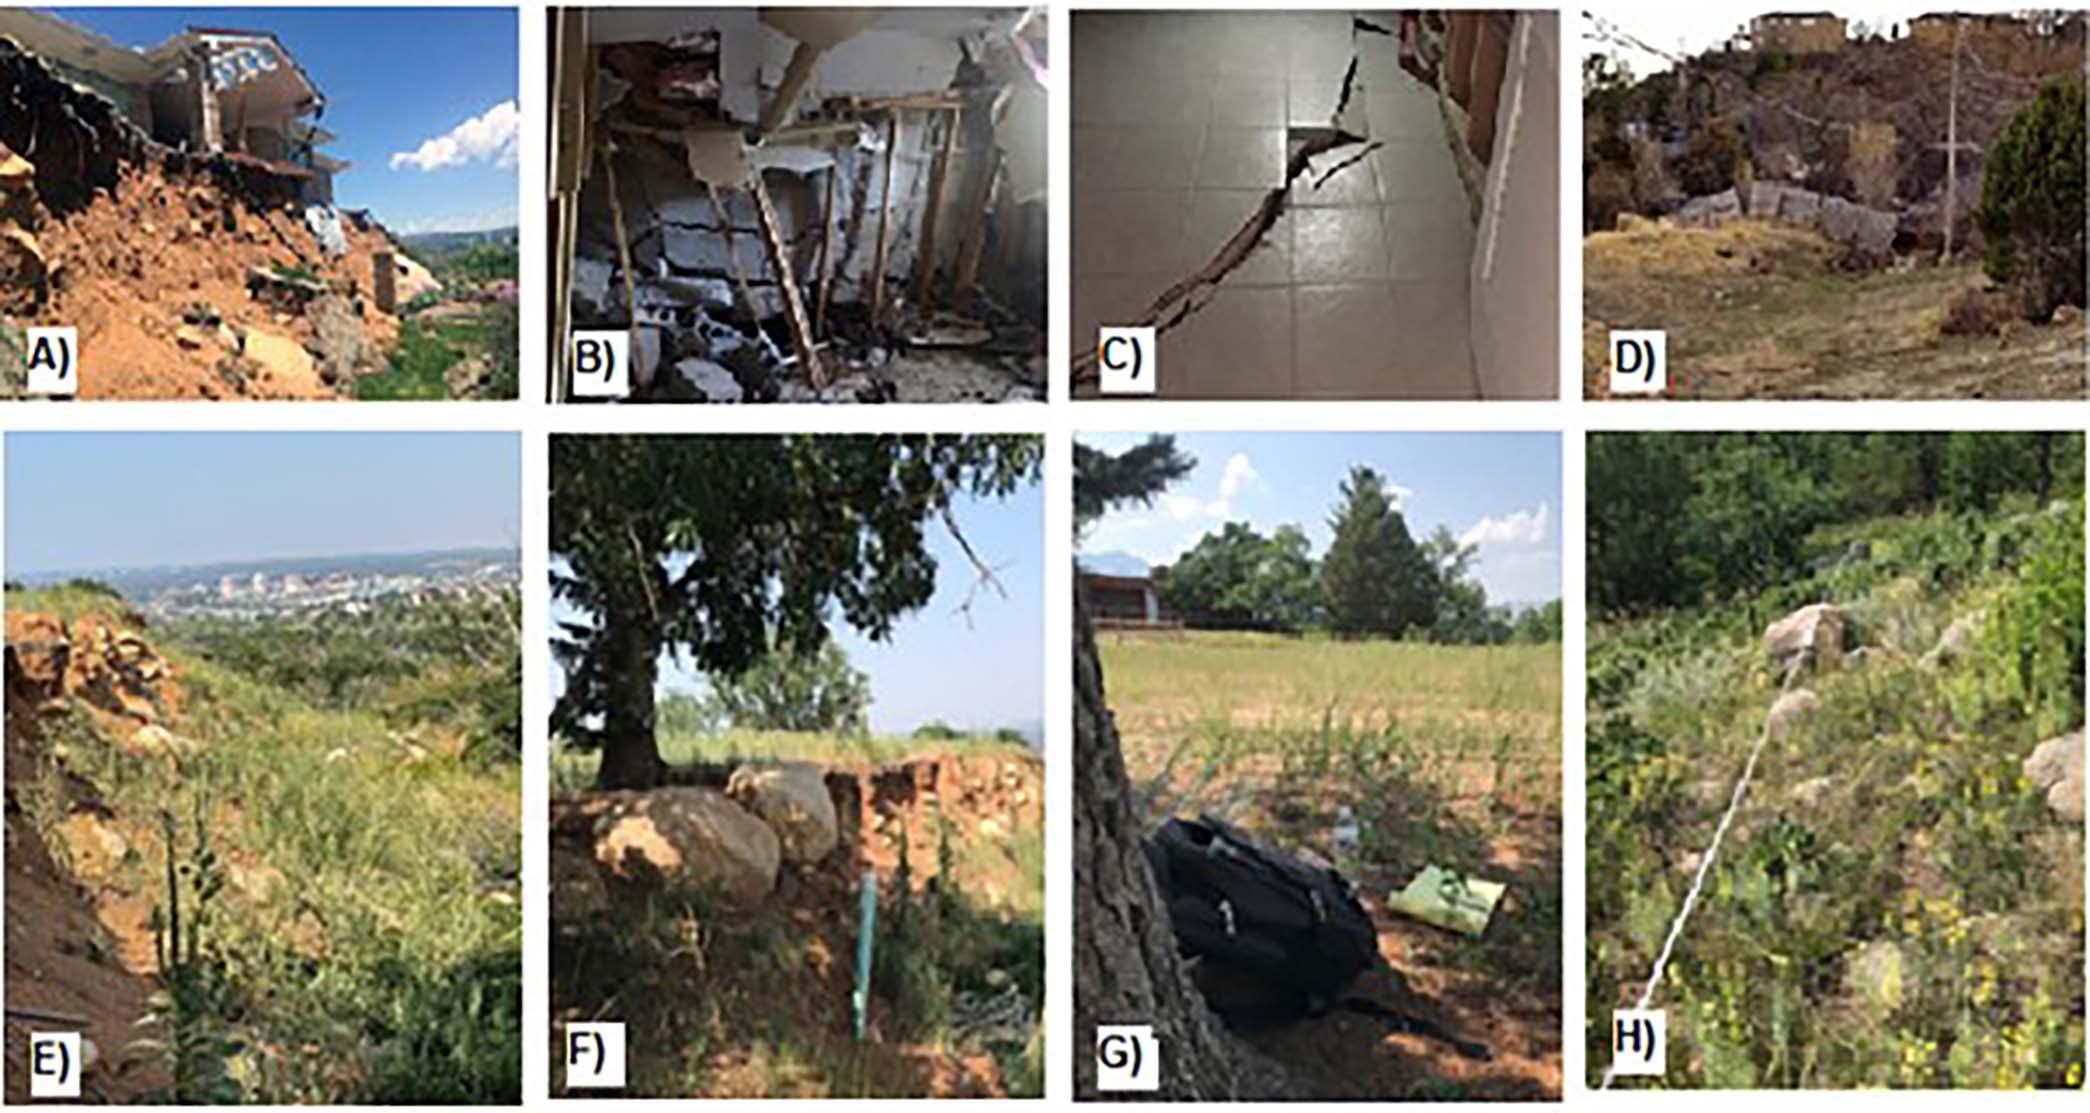
Figure7.PhotosoftheSkywayandtheBroadmoorlandslidesandthedamagetheycausedafterthe 2015heavyprecipitation.(A)Skywayheadscarpata destroyedhouse.(B)DestroyedinterioratthetoeoftheSkywayslide.(C)Breaking floorofahomeattheSkywayslide.(D)Toeandsag-pondofSkyway slide(afterHenryetal.,2017).(E)thecurrentSkywayheadscarp.(F)ThelastpartsofthedestroyedhouseattheSkywaylandslideshowninFigure7A. (G) ThetopoftheSkywayheadscarp.(H)Thelocationsoftheresistivityprofiles,whichshowthedifficultyofspreadingthecablesattheBroadmoorlandslide.
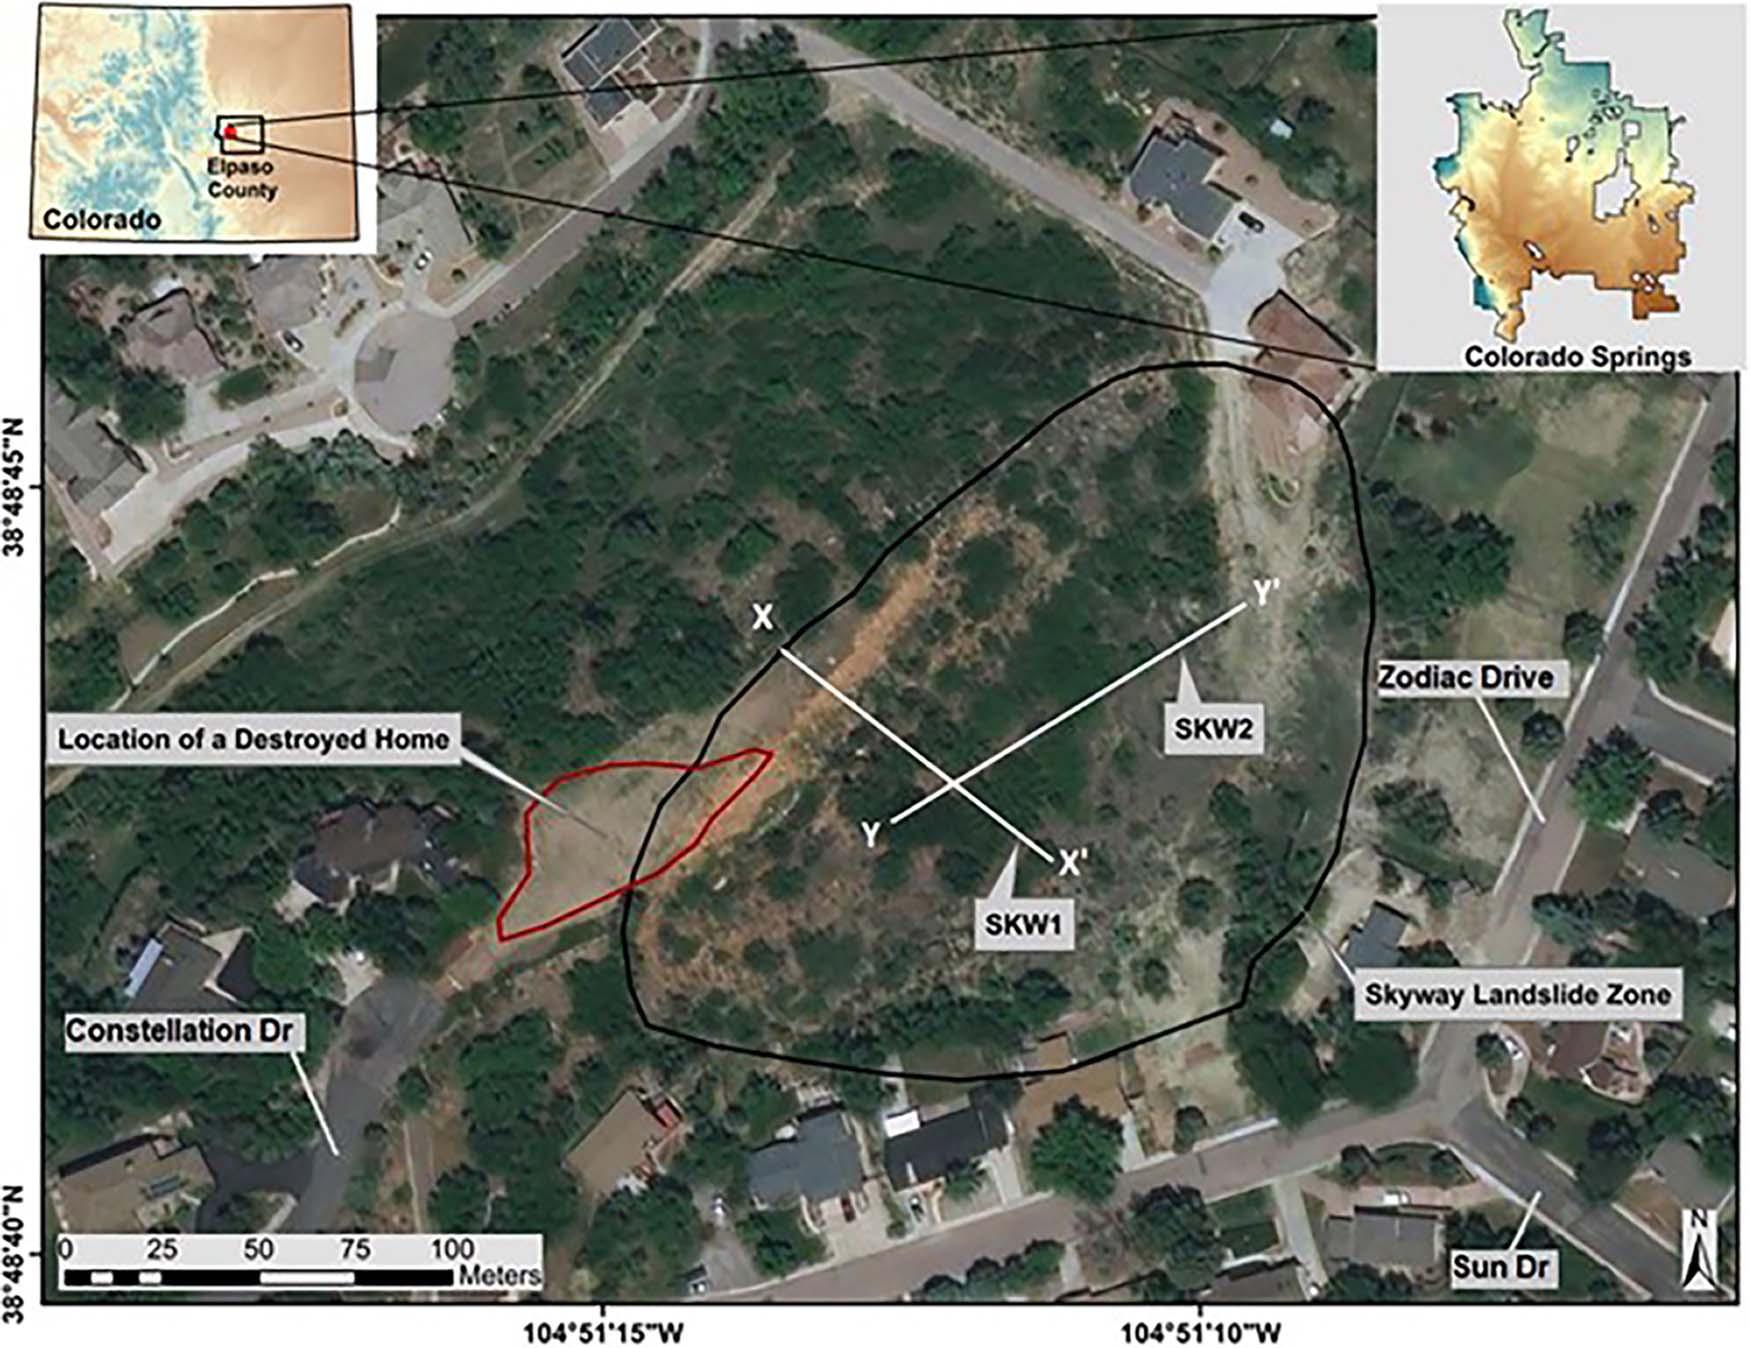
Figure8.LocationmapoftheSkywaylandslidezoneinColoradoSprings.Blackcircle-thelandslidezone,redcircle-locationofadestroyed homebecauseofthelandslide.ThetwowhitelinesshowthelocationoftheresistivityprofilesSKW1andSKW2.
Thedepthofthefailuresurfacerangedfromlessthan3m toabout12m(Henryetal.,2017),andtheslopeofthe underlyingclaystoneofthePierreShalevariedfrom5to .30percent(Terracon,1999).
Electricalresistivityisageophysicalmethodthatis commonlyusedtoinvestigatetheinternalmakeupoflandslides(Whitelyetal.,2019).Thisgeophysicalmethodis usuallynoninvasive,easilydeployable,andrelativelyquick; itallowsfortheinvestigationoflargeareasandisrelatively inexpensivecomparedwithboreholemethods.ERsurveys areconductedinthreemainstages:dataacquisition,data processing,anddatainterpretation.
Electricalresistivityworksbyinjectingadirectcurrent throughtwoelectrodesspacedasetdistanceapartandmeasuringtheelectricalpotentialdifferencebetweentwoother electrodes.BecausetheERmethoddependsonOhm ’s Law,thephysicalparameterdeterminedistheelectricalresistance,andbecausethecurrenttravelsthrough avolume,thephysicalparameterisknownasresistivity(ohm-m).BecausetheEarthisnothomogenous,the measuredparameterisreferredtoasapparentresistivity.
Theapparentresistivityvaluesdependontheelectrical propertiesofthesubsurfaceandonhowthedataare collected.MostERdataarecollectedinalinearfashionwiththedistancebetweenthecurrentandvoltage electrodesvarying.Therearemanydifferentelectrode configurations(arrays),amongwhichtheWenner,Schlumberger,anddipole –dipolearraysarethemostcommon (Telfordetal.,1990).
TheERsurveywasperformedusingamulti-electrode GFInstrumentsAutomaticResistivitySystem(ARES). ThisERsystemiscomposedof64steelelectrodes;multielectrodecables;andabattery-powered,computer-based receiver.Thesteelelectrodesareinsertedintotheground andarefastenedtothemulti-electrodecablestoinjectcurrentintotheground.Eachmulti-electrodecablehaseight electrodes,andeachcableisconnectedtoanothercableto formthedesiredprofilelength.Thecomputer-basedreceiver containsaprogrammableswitchboxthatautomaticallyperformstheelectricalresistivitysurveysaftertheuserassigns thevariousfactors,includingthearraytype,numberofelectrodes,electrodespacing,lengthoftheprofile,dataerror,
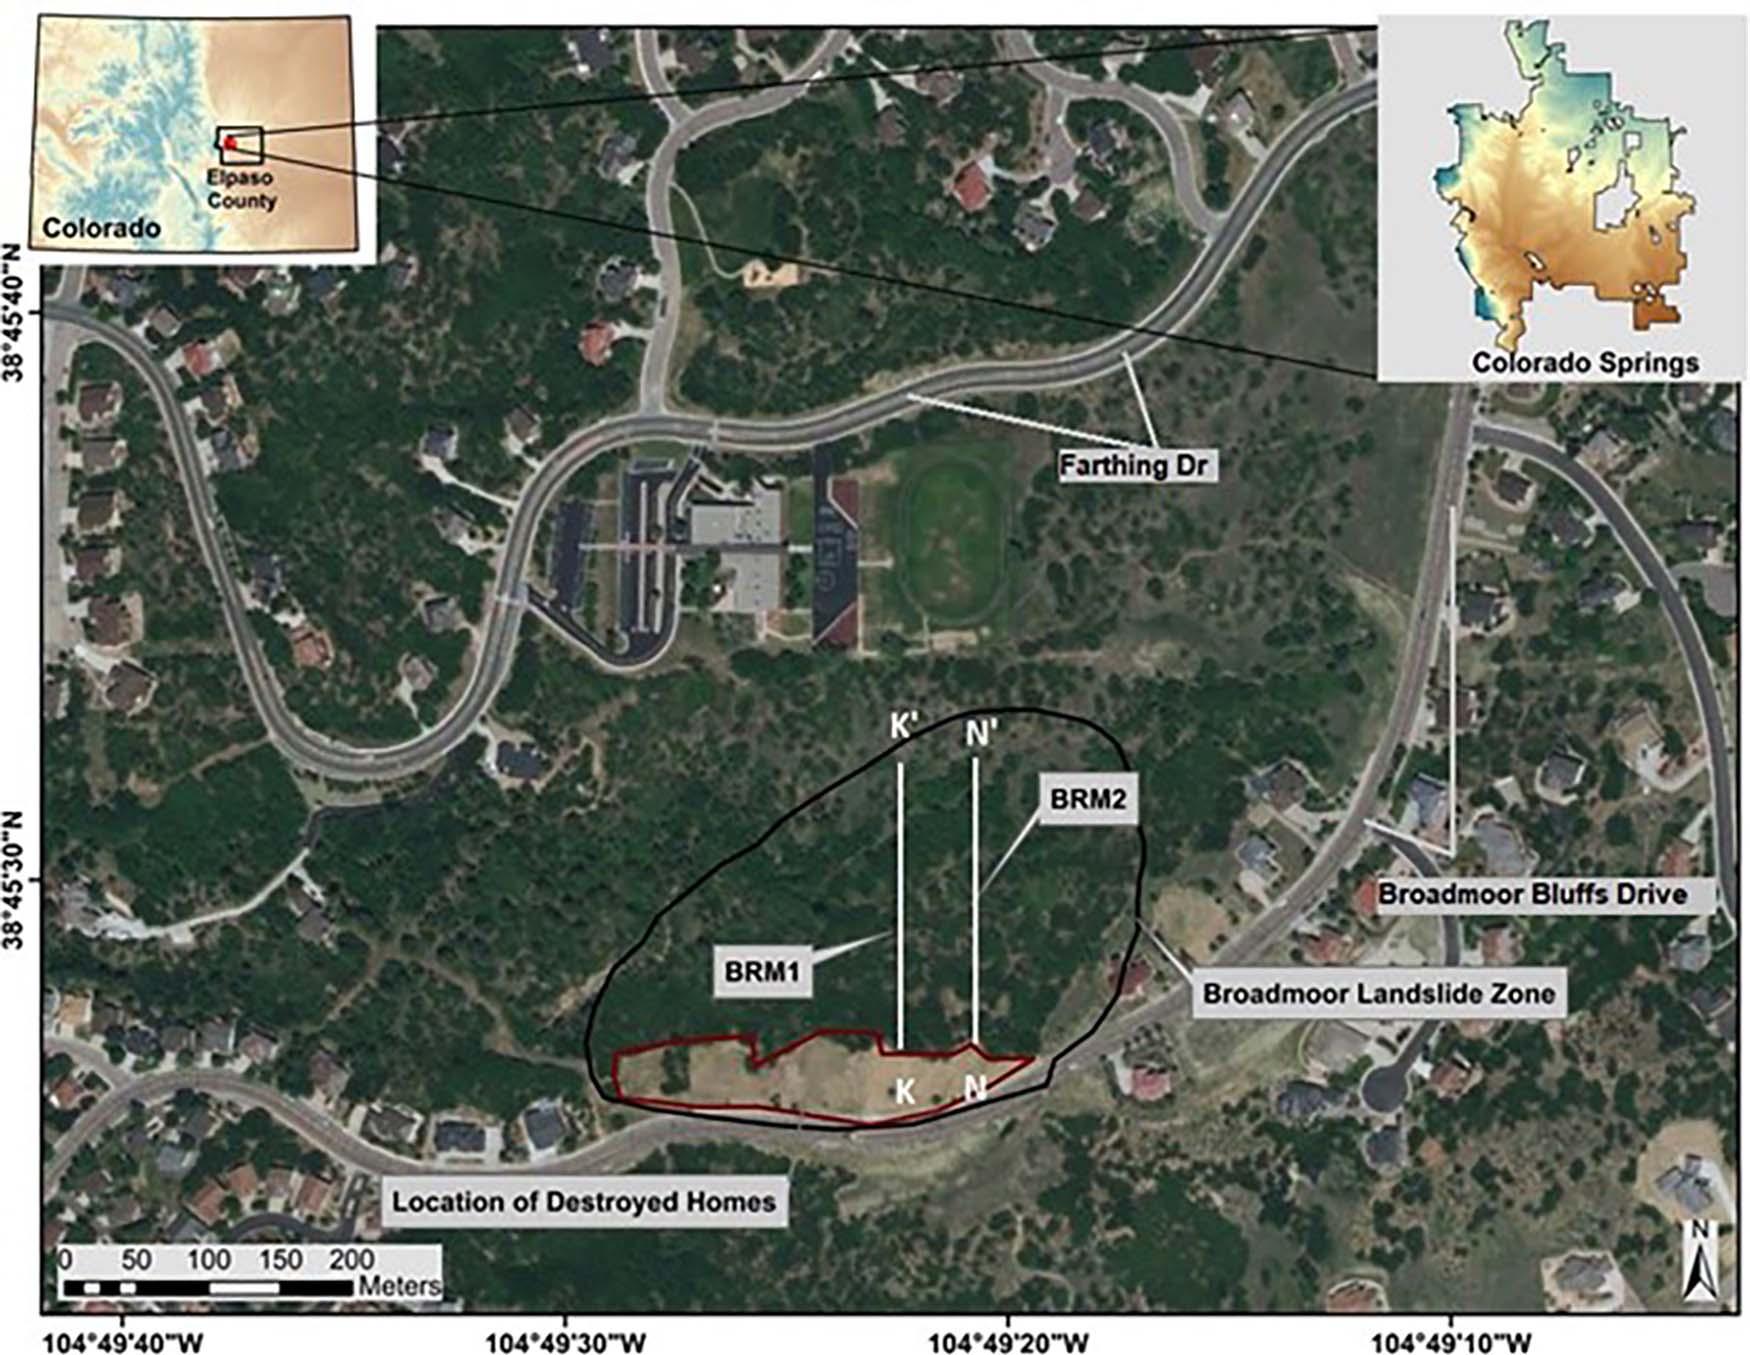
Figure9.LocationmapoftheBroadmoorlandslidezoneinColoradoSprings.Blackcircle-thelandslidezone,redcircle-thelocationof five destroyedhome.ThetwowhitelinesshowthelocationoftheresistivityprofilesBRM1andBRM2.
andnumberofreadingstakenateachelectrode(stackingto reducenoise;Berglund,2012).Beforecollectinganydata, theinstrumentcalculatesthecontactresistanceateachelectrodeandinformstheuserofanyelectrodethatistwostandarddeviationsaboveorbelowthemeancontactresistance.
TheERsurveyautomaticallycollectsdatabyselecting thepotentialandcurrentelectrodepairstogeneratethe resistivitydata.Themainunitstorestheresistivitydatato belatertransferredtoacomputerforprocessingpurposes. ToinvestigatetheSkywayandBroadmoorlandslides,the Schlumbergerarraywasusedasitislessaffectedbyurban noisesources.Severalelectrodespacingswereusedbased
Table1. Claystone/shaleinterfacederivedfromsoilboringlogs retrievedfromtheinvestigationforBaron’sRidgeandBroadmoor ResortCommunityDevelopment(TH-15,TH-23)andtheBroadmoor GolfCourse(A-2,A-4,andC-20)(CTLThompson,1997). SpecimenDepth(m)
ontherequireddepthtoreachthebottomofthelandslides. Smallelectrodespacings(1and1.5m)wereusedtostudy thethinnerSkywaylandslide,anda3-melectrodespacing wasusedforthethickerBroadmoorLandslide(Table4). Increasingtheelectrodespacingincreasesthepenetration depthbutreducesthelateralresolution.
Topographyalongeachprofilewasalsoconsideredas topographicvariationscaninfluencetheresistivitymeasurements,andtheseelevationsmustbeincludedinmodelingtoobtainreliablemodels.Thetopographyalongeach profilewasdeterminedusingTopconAT-G7GlobalPositioningSystem(GPS)unitandastadiarodtomeasurethe
Table2. DepthtoweatheredclaystoneinslopestabilityanalysesconductedfortheBroadmoorGlenSouthneighborhood(Chen,1987; CTLThomson,2005a;Terracon,1998,2005a).
IndividualHome vs.MultipleLots
Depthto Claystone(m)
SlopeofClaystone LayertoNearest(%)
Individualhome11.6–12.832
Individualhome18.35
Commerciallot1.2–3.113
CheyenneMountainRanch10.7–12.2Slopefailedat6° dipor10.5%grade
Table3. DepthtoweatheredclaystoneinslopestabilityanalysesconductedfortheBaron’sRidgeandBroadmoorResortCommunities (CTLThompson,2005a,2008a,2008b;Terracon2005b).
LocationDepthtoClaystone(m)
HavershamDrive5.5 HavershamDrive3.1–4
IvyBrookLane4.3–5.8
ChildeDrive6.1
CharlesGrove6.1–7.6
relativeelevationalongeachprofileevery10m.ATrimble GPSunitwasusedtocollectgeospatial(latitudeandlongitude)informationattheendpointsofeachprofileandatall othersignificanttopographicvariationsalongeachprofile. TheseGPSdatawerecollectedwithaverticalaccuracyof 0.5m.Repeatmeasurementswereperformedwhenastandarddeviationforasinglepointwashigherthan10percent.
Theresistivitydatafromeachprofileweredownloaded toacomputerusingtheGFInstrumentssoftwareandconvertedintoaformatreadablebytheAGIEarthImager2-D (two-dimensional)modelingsoftware.Thetopography datawerealsoenteredintotheAGIEarthImagersoftwareforuseinthemodelingprocess.Therawresistivity datawere fi rstviewedinpseudo-sectionformat.Thisis donetoseeifanyanomalousvaluescomparedwiththe surroundingvaluesarehighorlow.Thesoftwareautomaticallyremovessingularspikes,andtheusercanmanuallyremoveanyanomalousvaluesthatstillexist.Thedata qualityforthemajorityoftheprofileswaspoortogood, dependingonthenumberofanomalousvaluesthathadto beremoved.Poordatawereduetothepartsoftheground thatconsistedofloosegravelandrocks(Figure7H).This madethecontactresistanceshighandmadeitdifficultto injectcurrentintotheground.Thisoccurreddespitevariouseffortstoovercometheseconditions,suchaspouring salinewaterontoeachelectrode.Thedataforoneprofile weresopoorthattheprofilecouldnotbeusedinthisstudy, whereastheremainingprofileshadenoughdatatocreate 2-Dmodels.
Table4. Electricalresistivityprofilesforeachlandslide.
Landslide Profile Name Length (m) ElectrodeSpacing(m)Description
SkywaySKW1641Paralleltoslope failure
SKW294.51.5Transverseto slopefailure
BroadmooreBRM11893Paralleltoslope failure
BRM21893Paralleltoslope failure
Thedataalongeachprofilewereinvertedfora2-D resistivitymodelusingthesoftwareofLoke(1999).The inversionmethodusedwasaquasi-Newtonoptimization withsmoothnessconstrainedleastsquares.Theoptimization methodstartswitha2-Dresistivitymodelanditeratively makesadjustmentstoreducethedifferencebetweenthecalculatedandobservedresistivitydatauntilavaluelessthan theassignedspecificdataerrorisreached.Weapplieda 10percentdataerroroneachoftheprofiles,andallthe resistivitymodelsincludedthetopographyalongeach profile.Multiplestartingmodelsusingavarietyofresistivityvaluesandinversionparameterswereevaluatedto determinewhichfeaturesinthemodelwereconsistently requiredbythedata.Eachmodelrequiredbetween5and 17iterationstoreachapointatwhichtheroot-mean-squared (RMS)valuecouldnotbeloweredanyfurther.Forallthe finalmodels,thenumberofiterationstoachieveareasonablemodelwas fiveandseven.Foriterationsbeyondseven, theprogramwastryingto fittheregionswithpoordata qualityandtheregionswithgooddataquality,andthe modeldidnotchangeappreciably.Evenintheregionswith poordata,themodelsdidnotchangenoticeablywith increasediterations.Theinterpretationofthemodelsisconcentratedintheregionswithgooddataqualityasmostmodelshaveareaswithpoordataqualityinwhichreasonable modelscouldnotbeobtained.TheselatterareasareresponsibleforthehighRMSerroronsomeofthemodelsand, thus,arenotinterpreted.Eachmodelhassufficientregions ofgooddataqualitytomakeinterpretationsoftheelectrical resistivitymakeupofthelandslides.Giventhenon-uniquenessoftheresistivitymethod,thelackofdepthandphysical parameterconstraints,andtheattentionpaidtotheregions withgooddataquality,the finalmodelsrepresentageologicallyreasonableresistivitymodelofthesubsurfacealong eachprofileintheregionswithgooddataquality.
Theelectricalresistivitymodelscanprovideconstraints onthelandslidetype,thelithologicalvariations,thefailure zones,andthemoistureconcentration.Themodelswere interpretedwithknowledgeofthelocalgeologyandnearby boreholedata,andwhencombinedwiththeresistivity measurements,a finalinterpretationofeachlandslidewas reached.Thisprocedurehasbeensuccessfulinnumerous otherresistivitystudies(e.g.,McCannandForster,1990; CarisandvanAsch,1991;Schmutzetal.,2000;and Ganceetal.,2016).Tworesistivityprofileswerecollected overtheSkywaylandslide(SKW1andSKW2,Figure8), andtwopro fi les(BRM1andBRM2,Figure9)were collectedintheBroadmoorareathatrecentlyexperiencedlandslides.BRM1andBRM2weremeasured paralleltotheslopefailureandparalleltoeachotherwith thedistancebetweenthembeingapproximately30m.
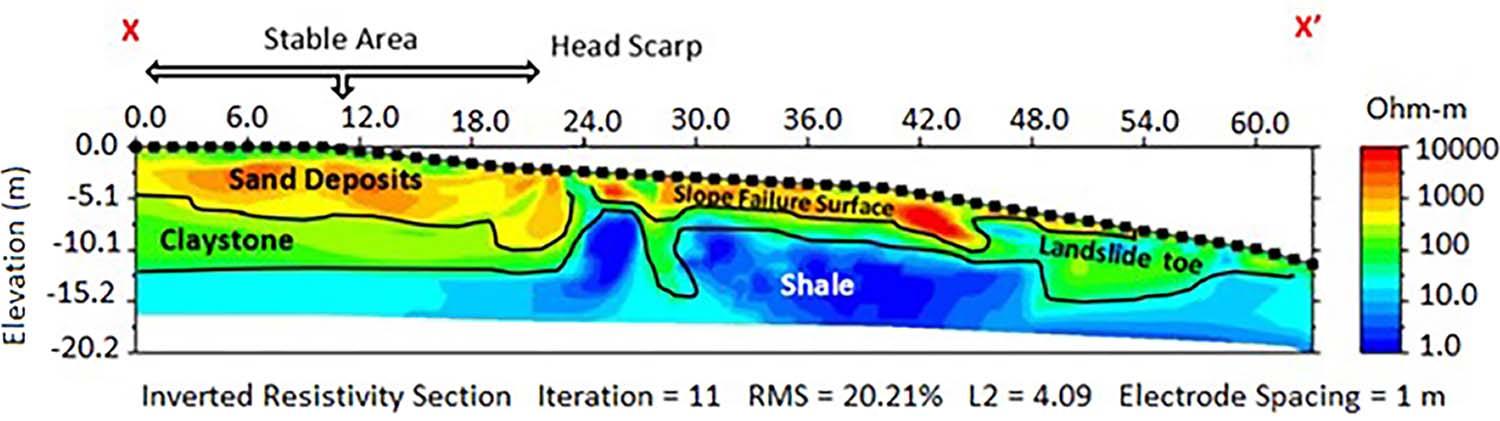
Inaccessibilitypreventedcollectionofdataparalleltothe slippagefaceoftheBroadmoorlandslide.
TheSKW1modelofthelandslideisparalleltoitsslippageface,which,therefore,aidsinidentifyingallportions ofthelandslide.ThelengthoftheSKW1profileis64m, which,giventhesubsurfaceresistivities,allowedforapenetrationdepthofapproximately20m.Theelevationdifferencebetweentheendsoftheprofileisaround13m.The SKW1profilebeginsbeforetheheadscarp,thencrosses theheadscarpandthefailurezoneuntilitreachesthetoe ofthelandslide(Figure8).The firstportionoftheprofile (1to22m)waslocatedbeforethefailurezoneandisnoted byhighresistivityvalues.Theentirelandslideisbetween 22and64malongtheprofile(Figure8).Theheadscarp ofthelandslideisfrom22to28m,andthelandslidetoe rangedfrom46to64m(Figure8).
Ahigh-resistivityzoneunderthestableareaisinterpretedtoberesistantsanddeposits(Figure10).This layeroccursatthesurface,extendsto22malongthe modelprofileandisupto5mthick.Thelowerresistivityareaoccursunderneaththehigh-resistivityzoneand isinterpretedtobeporousclaystonebasedonthelocal geology(Henryetal.,2017).Thedepthoftheclaystone layerrangesfrom5to8m,whichagreeswiththeboreholedatainTables2and3.Thislowerresistivityarea extendsalongmostofthemodelwithathicknessrangingfrom2.5to5m.Thelowestresistivitylayeroccurs undertheclaystone,anditisdeterminedtobethePierre Shale.Thedepthtotheclaystone/shaleinterfaceranges from5to12m,whichmatchestheboreholedatain
Table1.However,poordataqualityintheNWportion oftheprofileprecludesadefiniteinterpretationinthis area.Notably,thePierreShaleoccursalongthewhole profile,andithasthelargestthicknessofalltheprofiles intheSkywayarea.Thefailuresurfacebeginsatthe headscarpandextendsbelowthegroundlevelbetween thehigh-resistivitylayerandtheclaylayer.Thefailure surfaceliesbelowtheclaystoneportionofthePierre Shaleandappearsasasmoothsurfaceunlikeitsappearanceintheothermodelprofilesinthestudyarea.The claystoneandshalelayershadthelargestthicknesscomparedwiththeotherrocktypesandprobablycontaina highamountofmoistureasrevealedbythelowresistivity valuesandmayhavepromotedlandslidedevelopmentin thisarea.Thehigh-resistivityanomalyabovetheslopefailuresurfaceisinterpretedtobedryrockdebrisdeposited duringpreviouslandslideevents.
TheSKW2modelis94.5mlong,anditisatanangle totheslopefailure(notparalleltothefailureslope) becausetheroughterrainofferedlimitedaccess(Figure 8).TheSKW2profilebeginsaftertheheadscarpwithin thefailurezoneandthencrossestherestofthelandslide (Figure8).The finalmodelshowsasmallhigh-resistivityzonethatoccursontheNWportionofthemodeland maybeasanddepositduetoitshighelectroderesistance (Figure11).Underthiszone,twothicklayersoflower resistivityarepresent,andtheyareidentifiedtobeclaystoneandshalebasedonthelocalgeology(Henryetal., 2017).Thisprofileisdominatedbythelow-resistivity layersattributedtothewater-saturatedPierreShaleand
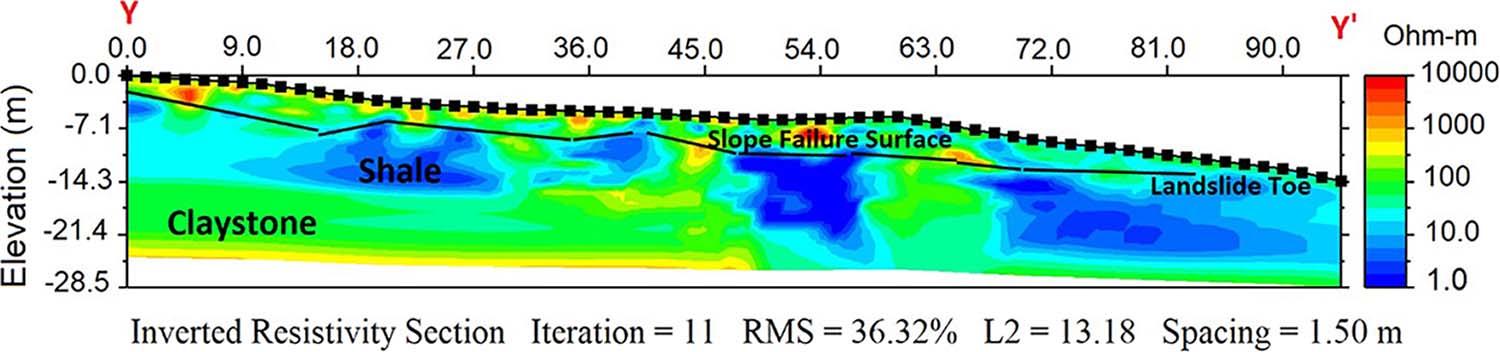 Figure10.2-DelectricalresistivitymodelandinterpretationofprofileSKW1(Figure7).
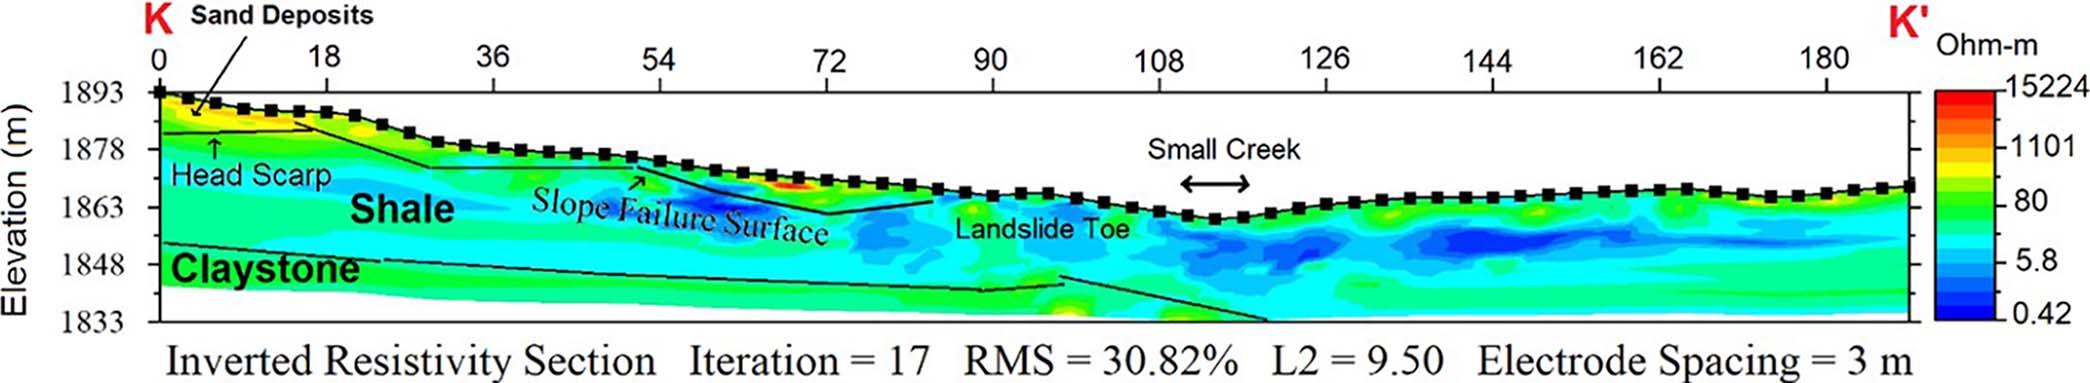
hassmallhigh-resistivitylayersbecausetheprofilehas beenentirelymeasuredwithinthefailurezone.Thismade itunfeasibletodeterminethetotalextentofthelandslide. Thefailuresurfaceisinterpreted,basedontheresistivity modeland fieldobservations(e.g.,Henryetal.,2017),to varyindepthbetween3and8m.Thefailuresurfaceis thenlocatedwithintheclaystoneatthetopofthePierre Shaleandisnotasmoothsurfaceasiscommoninlandslides(Crawfordetal.,2018).Thisprofiledoesnotshow theheadscarp,andasemi-rotationalslopefailuresurface maynotbeveryclear,butitshowstheexpectedlocations ofpotentiallandslidesduetothehighthicknessofclaystoneandshale.Consequently,landslidesinthisareacan belikelytriggeredbyhigh-precipitationevents.
SettinguptheresistivitycablesintheBroadmoorlandslideareawasdifficultbecausetheareahassincebeen coveredwithmanysmalltreesthatmadeaccessdifficult. Thus,onlytworesistivitypro fi leswerecollectedinthis area(Figure9).ProfilesBRM1andBRM2areparallelto thedirectionoftheslopefailure.Collectionofanytransverseprofileswasnotpossibleduetolackofsafeaccess. Thelengthofthetwoprofilesis189meachwithelectrodespacingsof3m(Figures12and13).Bothprofilesare beneficialtolandslidecharacterizationastheyshowthe sidesofthelandslides.
TheelevationoftheBRM1profilerangesfrom1,893m onthesouthendoftheprofiletoaround1,863monthe northendoftheprofile(Figure12).BRM1beginsnexttoa roadandnearthelocationofahomethatwasdestroyedby apreviouslandslide(Figures9).Theprofilecrossesthestableareaonthesouthendoftheprofile,theheadscarp,the failurezones,andthelandslidetoe.Asmallhigh-resistivity
sanddepositoccursonthetopnearthesouthendofthe profile.Thelowerresistivityclaystoneisfoundbelowthe high-resistivitylayerandisfollowedbyunderlyingshale andclaystonelayers.Claystoneisinferredtwiceinthis profilebecauseofthehigherdepthofthisprofile,which reachesupto40m,comparedwiththeSkywaymodels, whichimagedtoaround20mindepth.ThePierreShale layerisabundantatdepthinthestudyarea(White,2017) andimagedasalow-resistivityregionalongthewholeprofile.Thedepthtothefailuresurfaceisbetween6and8m, slightlydeeperthanseenontheSkywaymodels(Figures 10and11).Thefailuresurfaceisrelativelysmooth.Similar totheSkywaymodels,thefailuresurfaceoccurswithina higherresistivityregion(claystone)abovethelowresistivity ofPierreShale.ThethicknessofthePierreShaleisaround 23minthisstudyarea.Inadditiontothehighthickness ofshale,ithasahighmoisturecontent,whichisindicated bythepresenceofacreekthatcarriessurfacewater.On theotherhand,thethicknessoftheclaystonelayeris around7m,anditisnotaswidespreadalongtheprofile comparedwithshale.
TheelevationoftheBRM2profileissimilartothe BRM1.TheBRM2profileisalsonexttoaroad,butitwas carriedout »30mfromprofileBRM1andthedestroyed home(Figure9).The finalmodel(Figure13)showsbasicallythesamelandslidefeaturesastheBRM1model(Figure12).Themodelhassanddepositsandclaystone,which isfollowedatdepthbyshaleandclaystone.Also,the PierreShaleiswidelyspreadintheBroadmoorarea (Henryetal.,2018),andthismodelhasthethickest occurrenceofthePierreShaleintheBroadmoorarea. Thefailuresurfaceislocatedatadepthbetween6and
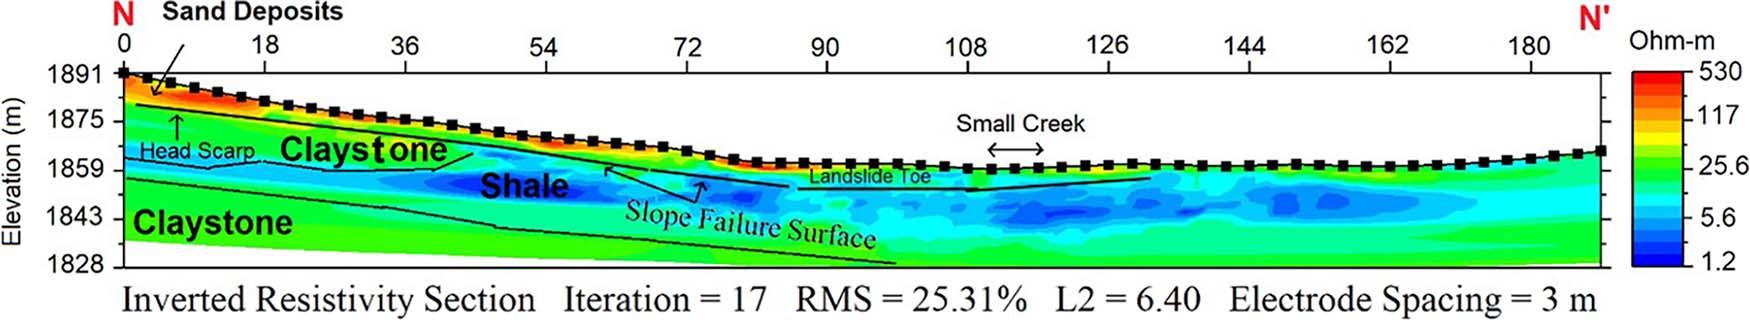 Figure12.2-DelectricalresistivitymodelandinterpretationofprofileBRM1(Figure8).
8mbelowthesurface.Thefailuresurfaceresides,as intheothermodels,withintheclaystoneunitsontop ofthePierreShale.Thedepthtotheclaystoneranges from8to12m,whichmeetswiththeboreholedatain Tables2and3.Theinterpretedfailuresurfaceseems tobesmootherthanimagedinmodelBRM1althoughthe lowresolutionofthedatamakesthisdifficulttovalidate. Again,thePierreShalehaslowresistivitiesandprobably hashighmoisturecontent,contributingtogroundfailure. Theareaishighlyvulnerabletolandslidesinthefuture becauseofthehighthicknessoftheshalelayerandits highmoisturecontent.
Thefourmodels(Figures10–13)indicate,basedon geologicalstudies(e.g.,White,2017;Henryetal.,2018), thatbothlandslidesoccurredwithinthePierreShale.However,theactualfailuresurfacewasintheweatheredupper portion(claystone)ofthePierreShaleandnotthemain unititself.ThePierreShaleinallthemodelsappearsasa low-resistivityunitinwhichthelowresistivityiscaused byahighmoisturecontent.Themodelsindicatethatthe landslidesareofarotationaltype,andexceptforBRM2, thefailuresurfaceisnotasmoothsurface.Thismaybe duetovariationsofmoisturecontentseeninthePierre Shale.Thelengthofthelandslidesvariedbetween30and 50m.Thedepthtothefailuresurfacerangedbetween3 and6mfortheSkywaylandslideand6and8mforthe Broadmoorlandslide.Giventhatthesurveywasperformedinthedrytimeoftheyear(May),thelikelyhigh moisturecontentduringwetseasonshouldbeaconcern forfuturelandslidesinthesetwoareas.Iflandslidesoccur ineitherareaagain,modelsindicatethattheareaaffected mayberelativelysmallintermsofdepthtoapotential failuresurface,butanylandslidemaycausedamagefor 30to60mperpendiculartotheheadscarp.Thesetwo areasshouldbeespeciallymonitoredforlandmovement duringanylargerprecipitationevents.
TheSkywayandBroadmoorlandslidesinColorado Springswereinvestigatedbytwo-dimensionalelectrical resistivitysurveystodeterminethegeophysicalcharacteristicsofeachslide.TheColoradoSpringsregionis especiallysusceptibletolandslidedevelopmentdueto climatic,geologic,andurbandevelopmentconditions. Thepresentedmodelsarethe firstgeophysicalstudiesto investigatetheselandslidesandwillformthebasisfor futurestudies.Foreachlandslide,twoprofileswereobtained usingtheSchlumbergerelectrodearraywithdifferentlengths andelectrodespacings.Thedatawereinvertedtodetermine anelectricalresistivitysubsurfacemodelandtheninterpreted toaidindeterminingthethickness,length,watercontent, andlocalfailuresurfaceforeachlandslide.The finalmodels indicatethatthelandslidesinbothareasoccurredwiththe
weatheredportions(claystone)ontopofthePierreShale. Thefailuresurfaceoccurredatshallowerdepths(3to6m) fortheSkywaylandslidethanfortheBroadmoorlandslides (6and8m).Thelandslidesseemtobeofarotationaltype, butonlymodelBRM2hadarelativelysmoothfailuresurface.ThePierreShalehadlowresistivityvalues,whichare interpretedtobecausedbyhighmoisturecontent,andthis highamountofmoisturewaskeytotheformationofthe landslides.GiventhatthePierreShalealreadymighthavea highmoisturecontent,theSkywayandtheBroadmoorareas shouldbemonitoredforpotentiallandslideswheneverthere arehigh-precipitationeventsinthearea.Themodelsprovide decisionmakerswithconstraintsonthepotentialsizesof futurelandslidesinbothareas.Itisrecommendedtoperform additionalERsurveysinadditiontoothergeophysicalstudies,includingseismicrefraction,verylowfrequencyelectromagnetics,andmultichannelanalysisofseismicwavesin theColoradoSpringsareabeforeanyfuturedevelopmentsto fullyunderstandthesubsurfaceandtoknowmoreaboutthe rocktypesandlayerconfigurationthatmaytriggerlandslides inthefuture.
Wearegratefulforthelocalgeologyadvicewereceived fromProfessorChristineSiddowayfromColorado College.Thisstudywasconductedusingelectrical resistivityequipmentfromMissouriStateUniversity.The datafromthisresearchcouldnothavebeencollected withoutthehelpofDonaldWormingtonfromMissouri StateUniversityandBenjaminOpiyo,RyanStrickland, andJahangirAlifromtheUniversityofArkansas.We thankthecityofColoradoSpringsforprovidingpermits thatallowedforthisstudytohappen.
BERGLUND,J.L.,2012, AnAppliedKarstStudyoftheWardBranch WatershedNeartheJamesRiverFreeway/SouthCampbellInterchange: PublishedM.S.Thesis,DepartmentofGeography,Geology,and Planning,MissouriStateUniversity,Springfield,MO,184p.
CARIS,J.P.T. AND VAN ASCH,T.W.,1991,Geophysical,geotechnical, andhydrologicalinvestigationsofasmalllandslideintheFrench Alps: EngineeringGeology,Vol.31,pp.249–276.
CARRARA,P.E.,1979,Thedeterminationofsnowavalanchefrequency throughtree-ringanalysisandhistoricalrecordsatOphir,Colorado: GeologicalSocietyAmericaBulletin,Vol.90,pp.773–780.
CARROLL,C.J. AND CRAWFORD,T.A.,2000, GeologicmapoftheColoradoSpringsquadrangle,ElPasoCountyColorado:Colorado GeologicalSurvey,CO.
CHENAND ASSOCIATES,1987,CheyenneMountainRanchLandslide Investigation,Job2-222-87.
CTLTHOMPSON,INC.,1997,LandslideHazardEvaluationPortionsof BroadmoorResidentialResortCommunity,PhaseI,Including Baron’sRide,PhasesIIandIIIVillasatLogHollow,EstatesLot 9,JobNo.CS7322,ColoradoSprings,CO,189p.
CTLTHOMPSON,2005a,GeologicHazardsEvaluation,Lot6,Broadmoor GlenSouth,FilingNo.7,ProjectNumberCS15312-105,57p.
CTLTHOMPSON,2005b,LettertoMr.S.ScottregardingLot11, BroadmoorHillsPark,Filing10,ProjectNumberCS15161-105,23p.
CTLTHOMPSON,INC.,2008a,GeologicHazardsEvaluation,Lot6, BroadmoorHillsPark,FilingNo.10,ProjectNumberCS15,161105,ColoradoSprings,CO,24p.
CTLTHOMPSON,INC.,2008b,GeologicHazardsEvaluation,Lot1, BaronsRidgeatBroadmoorResortCommunity,Filing1-A, ProjectNumberCS17193-105,ColoradoSprings,CO,56p.
DEPALO,L.,2018, 2018–2023ColoradoHazardMitigationPlan:ColoradoDepartmentofPublicSafety,1065p.
CRAWFORD,M.M. AND BRYSON,L.S.,2018,Assessmentofactivelandslidesusing fieldelectricalmeasurements. EngineeringGeology, Vol.233,pp.146–159.
CRAWFORD,M.M.;BRYSON,L.S.;WOOLERY,E.W.; AND WANG,Z., 2018,Using2-Delectricalresistivityimagingforjointgeophysical andgeotechnicalcharacterizationofshallowlandslides: Journal AppliedGeophysics,Vol.157,pp.37–46.
GANCE,J.;MALET,J.-P.;SUPPER,R.;SAILHAC,P.;OTTOWITZ,D.; AND JOCHUM,B.,2016,Permanentelectricalresistivitymeasurements formonitoringwatercirculationinclayeylandslides: Journal AppliedGeophysics,Vol.126,pp.98–115.
HENRY,K.S.;LOVEKIN,J.; AND MITROS,T.,2017,Historyandgeologic settingofactivelandslidesinColoradoSprings: Geo-Risk,pp. 143–161.
HUNTLEY,D.;HOLMES,J.;BOBROWSKY,P.;CHAMBRES,J.;MELDRUM,P.; WILKINSON,P.;DONOHUE,S.;ELWOOD,D.;SATTLER,K.;HENDRY,M.; AND MACCIOTTA,R.,2020,Hydrogeologicalandgeophysicalpropertiesofthevery-slow-movingRipleyLandslide,ThompsonRiver valley,BritishColumbia: CanadianJournalEarthSciences,Vol. 57,pp.1371–1391.
IVES,J.D.;MEARS,A.I.;CARRARA,P.E.; AND BOVIS,M.J.,1976,NaturalhazardsinmountainColorado: AnnalsAssociationAmerican Geographers,Vol.66,pp.129–144.
LAPENNA,V.;LORENZO,P.;PERRONE,A.;PISCITELLI,S.;SDAO,F.; AND RIZZO,E.,2003,High-resolutiongeoelectricaltomographiesinthe studyofGiarrossalandslide(southernItaly): BulletinEngineering GeologyEnvironment,Vol.62,pp.259–268.
MCCANN,D.M. AND FORSTER,A.,1990,Reconnaissancegeophysical methodsinlandslideinvestigations: EngineeringGeology,Vol.29, pp.59–78.
NOBLETT,J.B.,1994, AGuidetotheGeologicalHistoryofthePikes PeakRegion:GeologyDepartment,ColoradoCollege,Colorado Springs,CO,43p.
PERRONE,A.;LAPENNA,V.; AND PISCITELLI,S.,2014,Electricalresistivitytomographytechniqueforlandslideinvestigation:Areview. EarthScienceReviews,Vol.135,pp.65–82.
REYNOLDS,J.M.,2011, AnIntroductiontoAppliedandEnvironmental Geophysics,2nded.:JohnWiley&Sons,NewYork,710p.
SCHMUTZ,M.;ALBOUY,Y.;GUERIN,R.;MAQUAIRE,O.;VASSAL,J.; SCHOTT,J.J.; AND DESCLOITRES,M.,2000,Jointelectricalandtime domainelectromagnetism(TDEM)datainversionappliedtothe SuperSauzeearthflow(France): SurveysGeophysics,Vol.21,pp. 371–390.
SCHNEIDER,U.;FINGER,P.;MEYER-CHRISTOFFER,A.;RUSTEMEIER,E.; ZIESE,M.; AND BECKER,A.,2017,Evaluatingthehydrologicalcycle overlandusingthenewlycorrectedprecipitationclimatologyfrom theGlobalPrecipitationClimatologyCentre(GPCC):Atmosphere, Vol.8,p.52.
SOUTHERLAND,L.E.,2019, LandslideSusceptibilityMappingUsinga LogisticRegressionApproach:ACaseStudyinColoradoSprings, ElPasoCounty,Colorado,PublishedPhDThesis,Departmentof GeologyandGeologicalEngineering,ColoradoSchoolofMines, Golden,CO,60p.
SQUIRE,M.W.,2006,The1999ColoradoSprings,Coloradolandslides–federal,stateandlocalgovernmentresponse;publicinvolvement; andfuturelong-termrisksandchallenges: Geo-Risk,p.9.
TELFORD,W.M.;GELDART,L.P.; AND SHERIFF,R.E.,1990, AppliedGeophysics,2nded.:CambridgeUniversityPress,Cambridge,UK,p.770.
TERRACON,1998, GeotechnicalEngineeringandGeologyServices,6.6-acre CommercialSite,NWcornerofBroadmoorBluffsandFarthing Drives,ColoradoSprings,Colorado:TerraconProjectNo.23985012, 54p.
TERRACON,2005a, GeologicHazardsStudyUpdate,SingleFamily Residence,4865BroadmoorBluffsDrive,ColoradoSprings,Colorado, TerraconProjectNo.23035093,84p.
TERRACON,2005b,GeologicHazardsStudy,Lot3,BroadmoorHills Park,FilingNo.8,TerraconProjectNo.23055010,47p.
WHITE,J.L.,2017, LandslideSusceptibilityintheColoradoSprings Area – GeologyandHistory,TechnicalSession#18:Landslide HazardsofColoradoSprings:WhattheGeneralPublicNeedsto Know,AssociationofEngineeringGeologist60thAnnualMeeting,ColoradoGeologicalSurvey,ColoradoSprings,CO.
WHITE,J.L. AND WAITE,T.C.,2003, ColoradoSpringsLandslideSusceptibilityMap,ElPasoCounty,Colorado:ColoradoGeological Survey,DivisionofMineralsandGeology,DepartmentofNatural Resources,Denver,CO.
WIECZOREK,G.F.;LIPS,E.W.; AND ELLEN,S.D.,1989,Debris flowsand hyperconcentrated floodsalongtheWasatchFront,Utah,1983and 1984: BulletinAssociationEngineeringGeologists ,Vol,26,pp. 191 –208.
YONATHANADMASSU*
DepartmentofGeologyandEnvironmentalScience,JamesMadisonUniversity Harrisonburg,Virginia22807,USA
TRUFATGUGSA
SchoolofEarthSciences,AddisAbabaUniversityPOBox1176,AddisAbaba, Ethiopia
KeyTerms: GroundFissures,InternalErosion, Piping,Pseudokarst,LakeZiway
Ground fissuresarelinearorcurvilinearcracksthat arecommonintheMainEthiopianRift,whichispart oftheEastAfricanRiftSystem.Theyareaunique typeofgeohazardaffectingroadsandrailwayinmany partsoftheriftvalley.ThevicinityofLakeZiway isunderlainbylacustrine,pyroclastic,and/orvolcaniclasticsedimentsthatarecutbynumerous ground fi ssures,whichrunfor2–3kmwithupto 1 –3-m-wideopenings.Plausiblecausesofground fissureevents,asdescribedinpreviousstudies,include extensionalmovementduetoactiverifttectonics, hydro-compaction,andpiping.However,theexact mechanismoftheirevolutionispoorlyunderstood. Basedon fi eldobservationsandsedimentcharacterization,weproposeastrongcasefortheroleplayedby internalerosionorpipingofpumicedepositsinthe developmentofground fissures.Internalerosioncauses theformationofsubsurfaceconduits,whichgrowin sizeandeventuallycollapse,formingground fissures. Typicalsediment-erosion–relatedgeomorphologicfeaturessuchasdisappearingstreams,sinkholes,blind gullies,andpipingmoundshavebeenobserved.These featuresindicatethepresenceofanetworkofpipes thatconnectthegroundwaterwithsurfacewaterina mannerverysimilartokarsthydrology.Pumicedepositsinthestudyareaarefoundtobethemostsusceptibletointernalerosionleadingtoground fissuringdue totheirbimodalgrainsizedistributionandultralow density(averagespecificgravity 5 0.6).
TheMainEthiopianRift(MER)isalinearbeltofextensionaltectonicstructuresmarkedbynormalfaultsystems. TheMERisalsoriddledwithground fissures,whichare commonly1–3-m-widecracksthatmayextendfor2to 3km(Figure1).Therehavebeenveryfewreportsoftheir impactoninfrastructureinEthiopiasincethe1950s (GouinandMohr,1967).Asfaw(2000)arguedthat ground fi ssuresshouldbeconsideredasextensional geologicstructuressimilartonormalfaults.Mohr(1967), Asfaw(1998),andYirguetal.(1997)proposeda directrelationshipbetweenground fi ssuresandearthquakes.Mostpreviousresearchhaslinkedground fissuresto rifttectonicsbasedontheirorientationbeingparallelwith theNE-SWriftaxis(Asfaw,1998,2000;Yirguetal.,1997). DespitetheirwidespreadoccurrenceintheEthiopian riftvalleyandtheirgeohazardpotential,ground fi ssureshavenotreceivedenoughattentionintermsof geologicalandengineeringinvestigations.
Ground fissureshavealsobeenreportedandstudied inmanyotherpartsoftheworld.Theearliestreportwas fromthePicachoMountainsinArizona,southwestern UnitedStates,wherea15km fissureopenedfollowinga heavyrainfallaroundtheyear1927(Leonard,1929). Moreground fissureeventsandsubsequentstudieswere undertakenmainlyinArizonaandothersouthwestern U.S.states(Carpenter,1993;Galloway,1999).Mostof the fissuresthatforminthesouthwesternUnitedStates arelong,linearfeaturesorparallelanastomosingcracks thatshowmainlyhorizontalmovementwithaminorverticalcomponent(Carpenter,1993).Therearealsoseveral reportsofground fissuringfromChina’sShanxigraben systemandtheNorthChinaPlain,whereformationof ground fissuresisattributedtopre-existingfaultscoupled
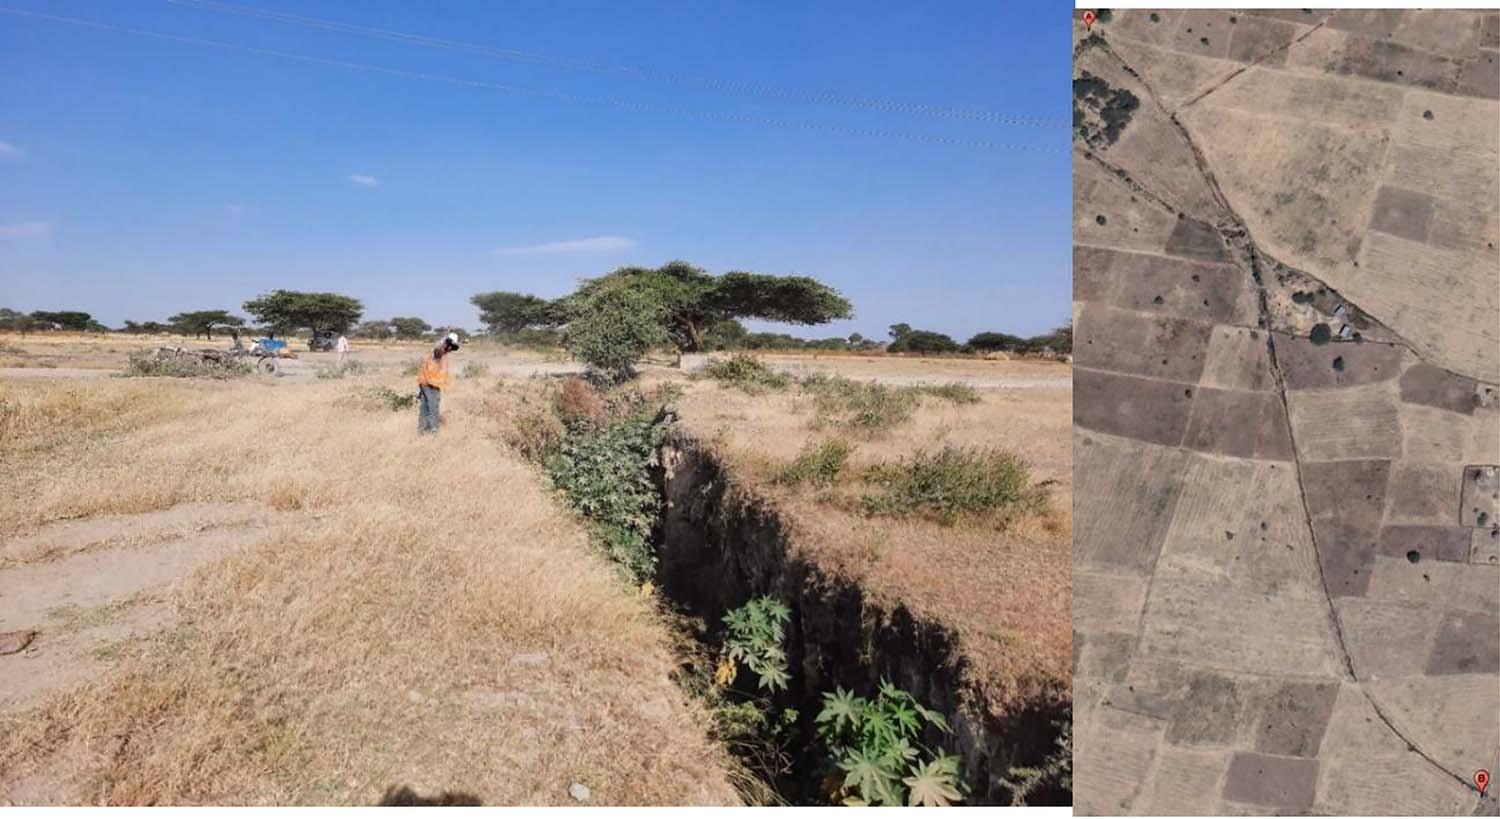
withexcessivegroundwaterwithdrawal(Leeetal.,1996; Pengetal.,2016,2018,2020).Arecentgiantground fissure(approximately50ft[15m]deepand65ft[20m] wide)fromtheKenyanpartoftheriftvalleyoccurredin 2018,cuttingtheMaiMahiu–Narokroad.Thisground fissurereceivedworldwideattentionbythepressandmedia becauseitwaswronglythoughttobeasignofsplittingof theAfricancontinent.Priortotheincident,severalother ground fissureshadbeenreportedfromtheKenyansegmentoftheEastAfricanRiftSystem(EARS),specifically intheLakeNakuruarea(NgecuandNyambok,2000).In westernSaudiArabia,ariseinthenumberofground fissuresassociatedwithdifferentialcompactionofloosesedimentsduetoexcessivegroundwaterwithdrawalhasbeen reported(BankherandAl-Harthi,1999).
Thestudyarea(boundedby7°56 0 10.12 00 Nand8° 03 0 11.95 00 Nlatitudeand38°38 0 22.49 00 Eand38° 45 0 03.64 00 Elongitude)isinthevicinityofLake Ziway;thisareaisunderlainbyunconsolidated pyroclastic/volcaniclasticandlacustrinesediments, whichareriddledwithseveralground fi ssuresthat threatenthestabilityofthenewlybuiltMeki-Ziway freeway.Theobjectiveofthisstudywastoinvestigatethemechanisms(sur fi cialortectonicprocesses) thatpromotetheformationanddevelopmentof ground fi ssuresbasedondatacollectedfromthe environsofLakeZiway(Figure2).LakeZiwayisoneof fourmajorlakes,alsoincludingShala,Abaya,andLangano,thatwereconnectedtoforman »2,960km 2 paleolakeinthelateQuaternaryoccupyingtheMER (Gillespie,1983).TheMERispartofEARS,whichis majortectonicfeaturemarkingazoneofextensionalong theboundarybetweentheNubianandSomaliPlates. TheextensionaltectonicsintheMERhasproducedtwo
mainsetsofNE-SW –trendingboundaryfaultsand NNE-SSW–trendingfaults,whicharesub-orthogonalto theE-Wextensionalfaults(Cortietal.,2013).Lake Ziwayisfedbytwomajorstreams(KetarandMeki) anddrainedbytheBulbulaRiver.Theaveragerainfallis837mm(Alemayehu,2010),andthelake receivesanapproximategroundwaterin fl owof 220,700m 3 /dandout fl owof40,047m 3/d(Ayenew, 2001).Groundwaterrechargeismainlyfromthehighlandstotheeastandwestofthelake.Aquifersarerepresentedbylacustrine/alluvial/volcaniclasticsedimentsand fracturedvolcanicunits(FentawandMihret,2011).
PossibleGeneticModelsforGroundFissure Development
Ground fissuresaffectingsedimentscanbetheresult ofsurficialprocessessuchasinternalerosion,decayof organicmatter,hydro-compaction(rapidsettlementofloose soiluponadditionofwater),faultmovements,and/orhorizontalseepagestress(Ayalew,2004).However,mostpreviousworksinEthiopia(GouinandMohr,1967;Asfaw, 1982,1998;andAyalew,2004)reportthattheorientationof ground fissuresissubparalleltotheNE-SWriftaxis,suggestingatectoniccontrolontheirgenesis.Fromcursory observationsintheZiwayarea,onecannoticeasignificantnumberofground fissuresthatdonotconformwith theNE-SWorientationoftheriftaxis.Theubiquityof ground fissuresandtherarityofearthquakeactivityinthe Ziwayareamakeitdifficulttodirectlylinktectonicswith theground fissures.Ayalew(2004),basedonamorecomprehensivestudyintheMuletiarea(»100kmsouthof LakeZiway)inthecentralpartoftheEthiopianriftvalley, stronglydisagreedwiththeconnectionbetweenground fissuresandearthquakeactivityandproposedtwomechanismsasprobablecauses:(1)thepossiblepresenceof
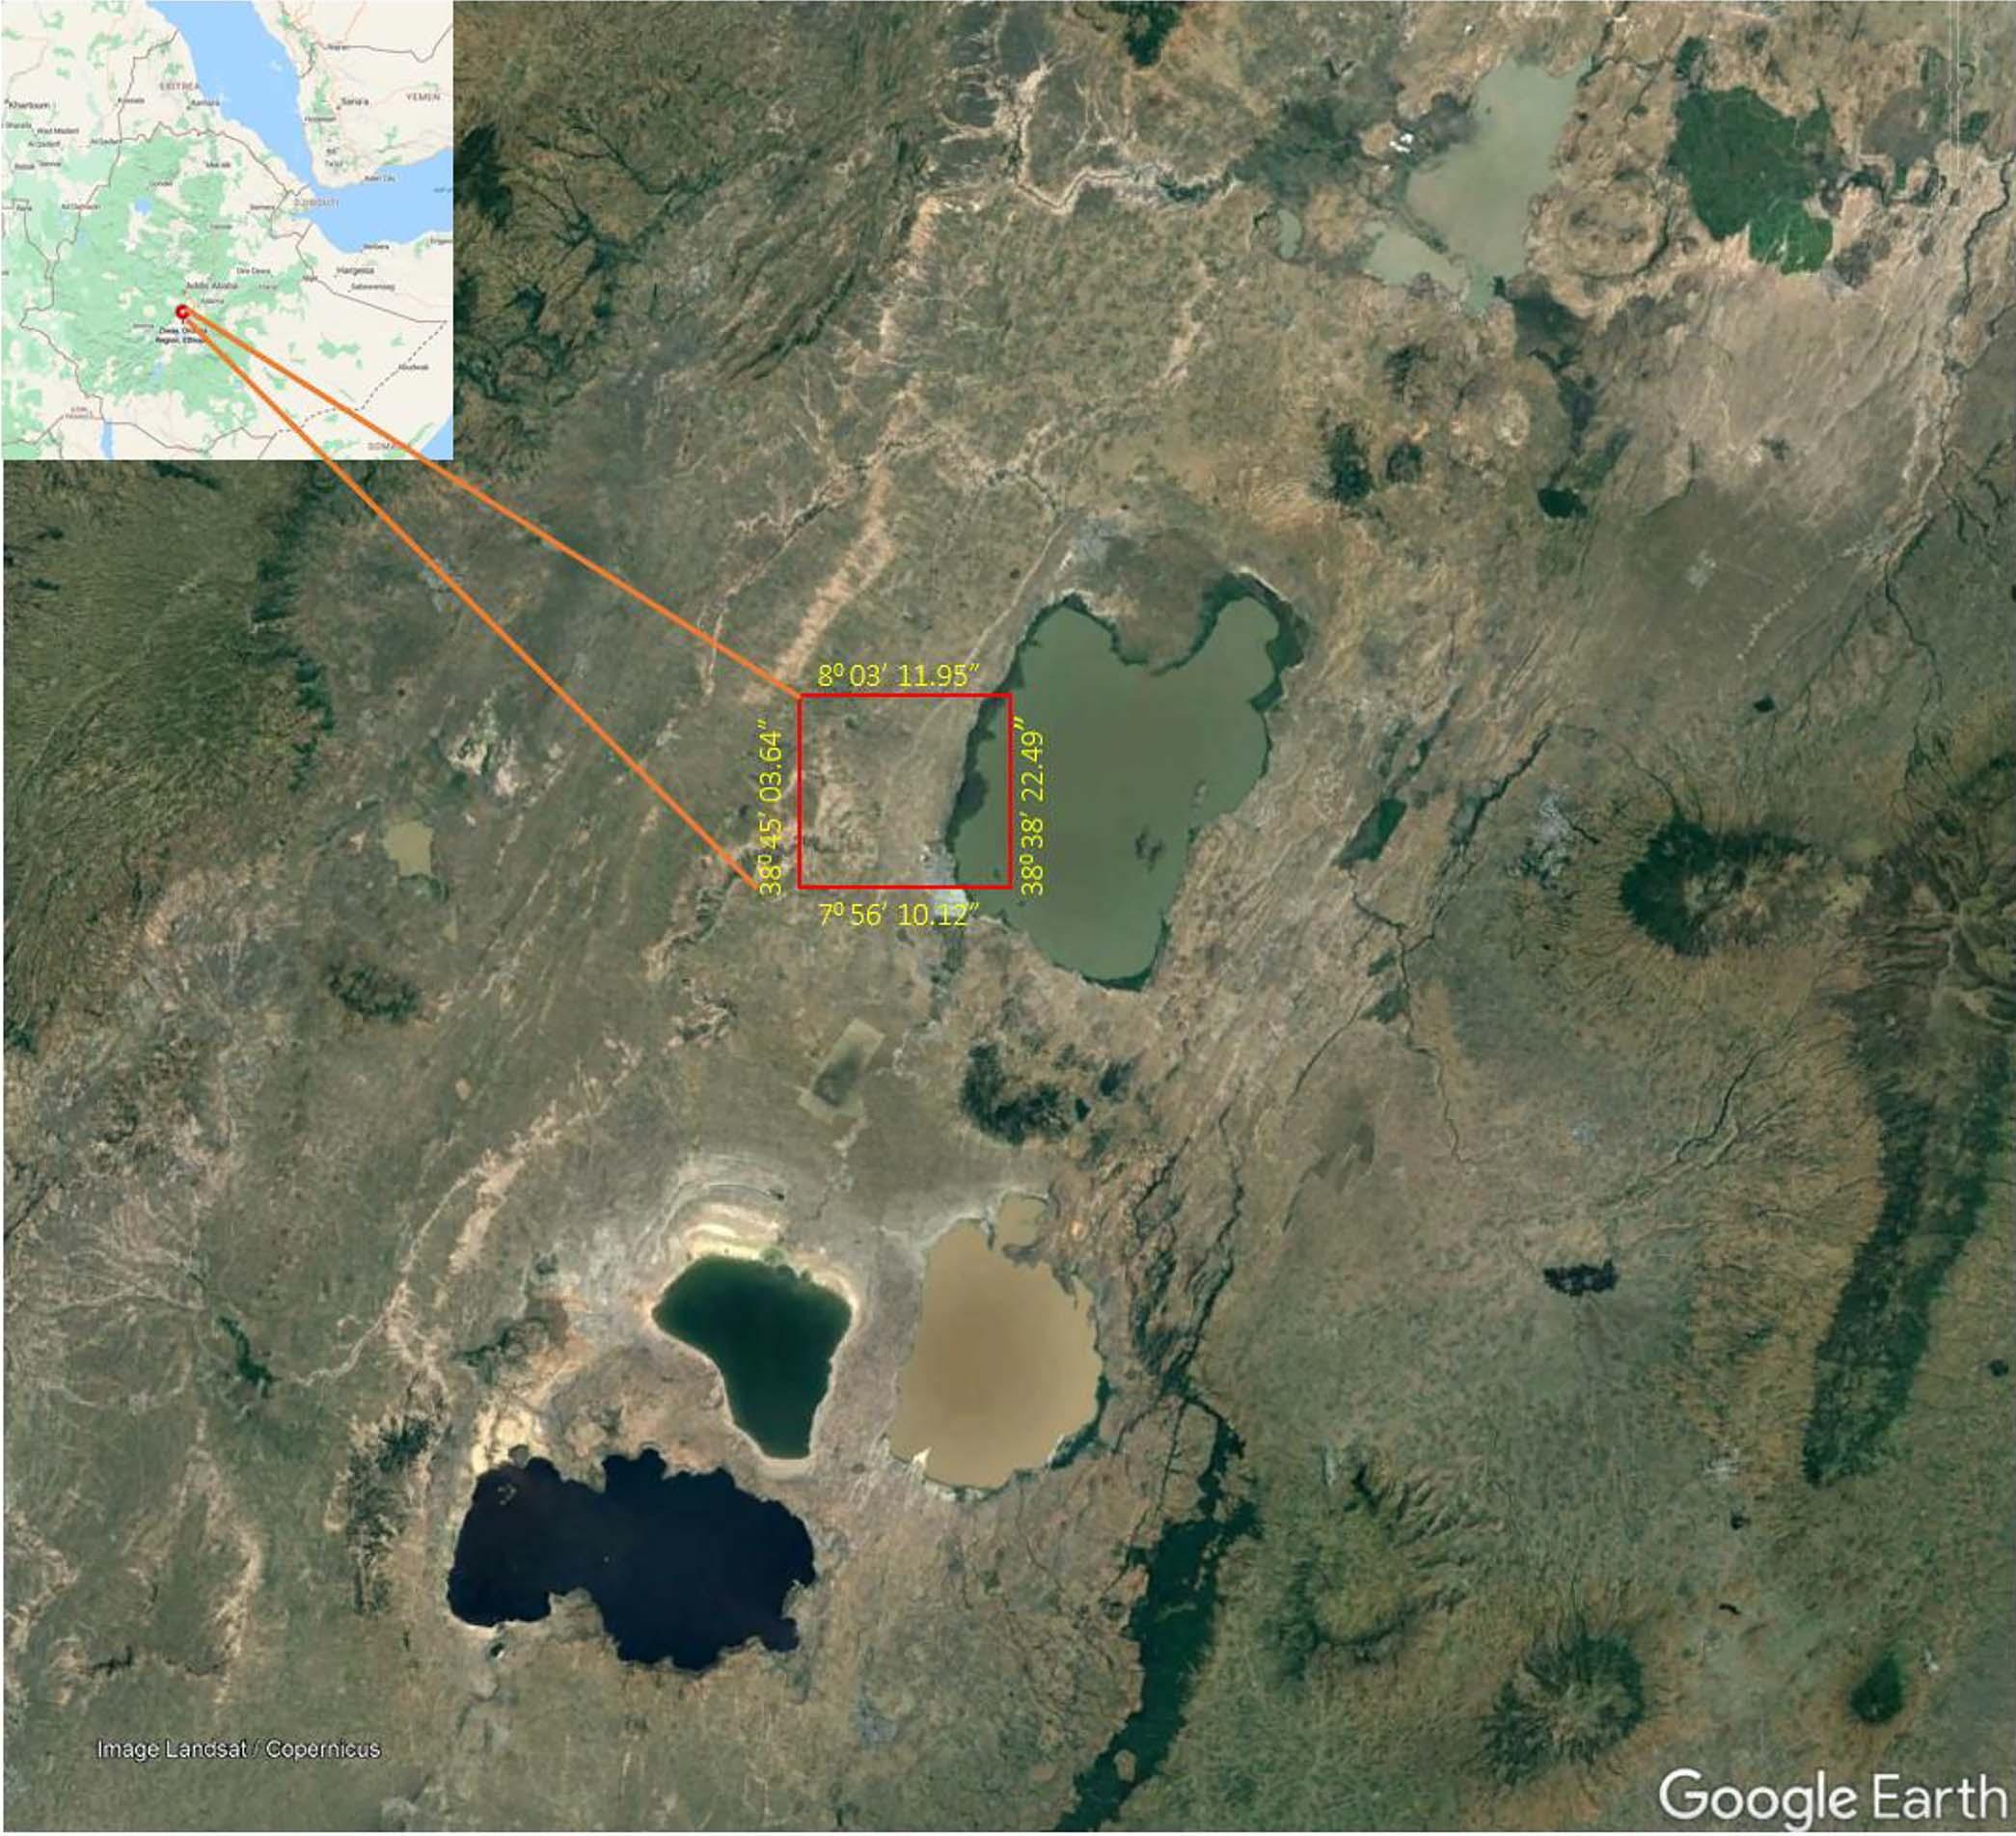
unrelievedstressthatcouldspreadtothesurfaceupon beingsubjectedtoheavyrainfall,whichwouldreduce tensilestrength,leadingtotheformationof fi ssures, and(2)rainfall-inducedhydro-compactionofloosely packedalluvialsoils,whichcoulddensifyandbuildtensile stressthatwouldeventuallyproducecracks.Theeffectof groundwaterwithdrawalhasbeenextensivelyinvestigated byShengetal.(2003),whosuggesteddifferentialaquifer deformationduetogroundwaterextractioncausingextensionalstressalongplanesofweaknesssuchasfaultplanes andburiedbedrockedges.IntheZiwayarea,however, thereislittlegroundwaterextractionthatcouldaccountfor ground fissuredevelopment.
Analternativemodelthatmayexplainground fissure developmentintheZiwayareaisthegeomorphologic expressionsofinternalerosion,alsoknownaspipingof sediments.AccordingtoBernatek-JakielandPoesen (2018),internalerosionofsoilscanproducesurfacefeaturessuchassinkholes,blindgullies,andpipingmounds (Figure3).Thesefeatures,aswellasdisappearingstreams, arealsowellevidentinGoogleEarthimageryintheZiway area,suggestingtheinfluenceofinternalerosion(Figure4). Internalerosionofsoils/sediments,alsoknownassuffusion ofinternallyunstablesoils/unconsolidatedsediments,leads totheformationofopenconduitsorpipesthatserveaspassagewaysforturbulentgroundwater flow.Duetoseepage
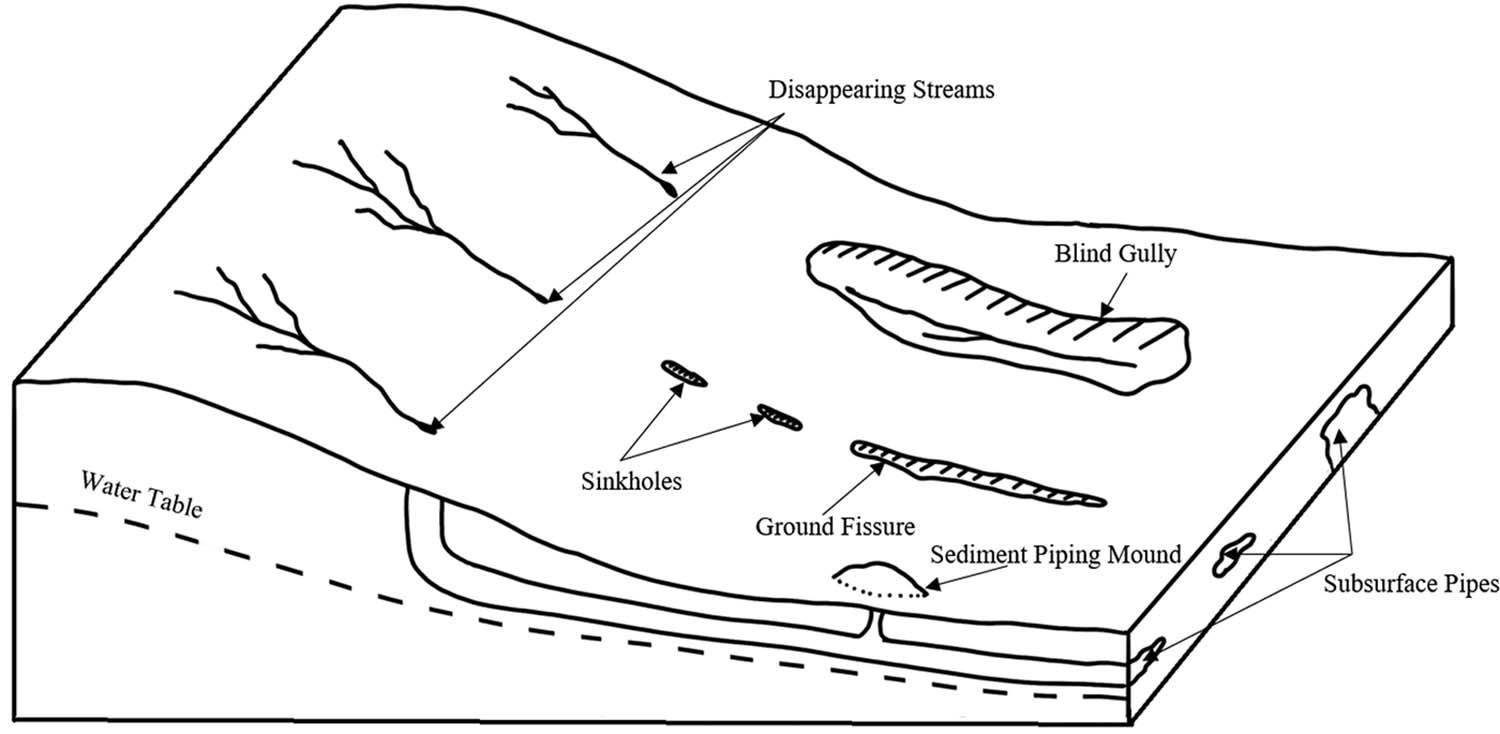
forces,internallyunstablesedimentslose finergrainsizes throughporespacescreatedbylargergrains.Continued internalerosionformssubsurfaceconduitsthatcancollapse, initiallyformingsinkholes,whichthencoalescetoform ground fissures.Overtime,ground fissureswidenaswalls collapsetobecomeblindgullies(Figure5).Internalinstabilitydependsonthegrainsizedistributionandthemagnitudeofseepageforces.Itisthereforenecessaryto characterizethepipingpotentialofthemainlyunconsolidatedpyroclasticrocksunderlyingtheZiwayarea
basedonthehighhydraulicgradientandbimodalgrain sizedistribution.
Soil/SedimentSusceptibilitytoInternalErosion
Internalerosionistriggeredwhengroundwaterseepage forcesexceed insitu soil/sedimenteffectivestress,leading totheformationsubsurfacepipes.Seepageforcesarea functionofhydraulicgradientandsaturateddensityofsediments/soils.Thecritical hydraulicgradientvalueatwhich effectivestressofsoil/sedimentbecomeszeroandpiping
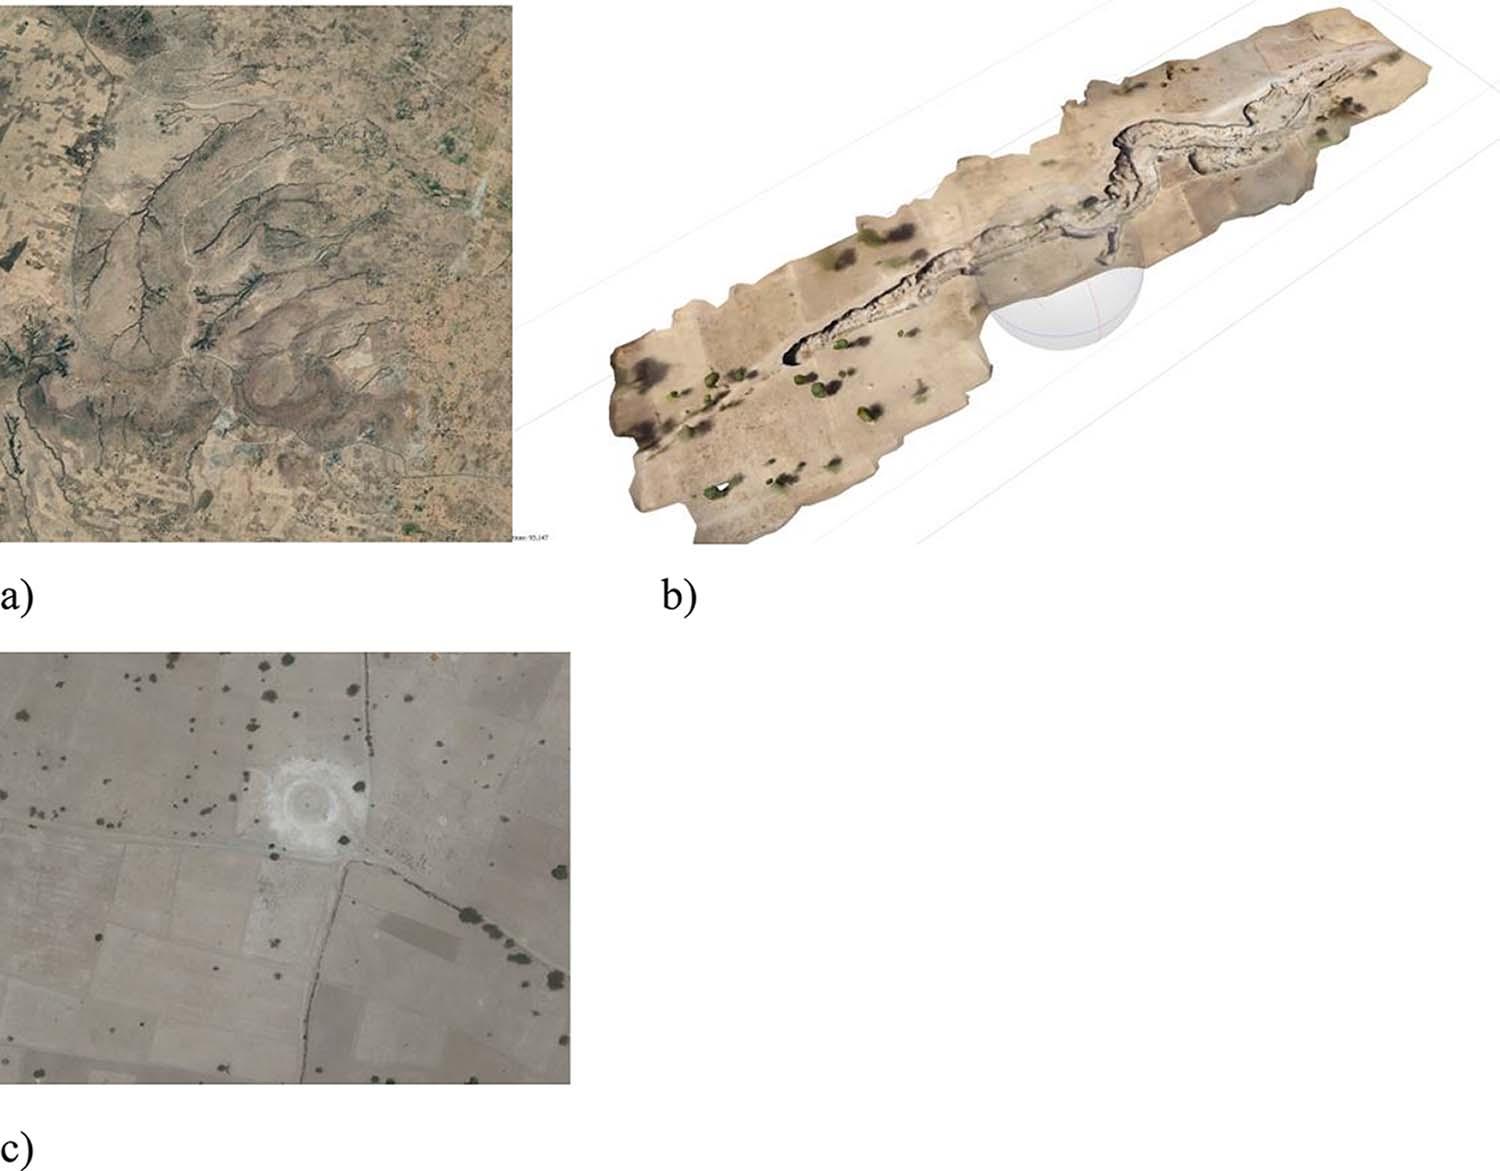
Figure4.GoogleEarthimageryshowing(a)disappearingstreams,(b)circularsedimentmound,and(c)blindgullyintheLakeZiwayarea.
Figure3.Geomorphologicfeaturesassociatedwithinternalerosion.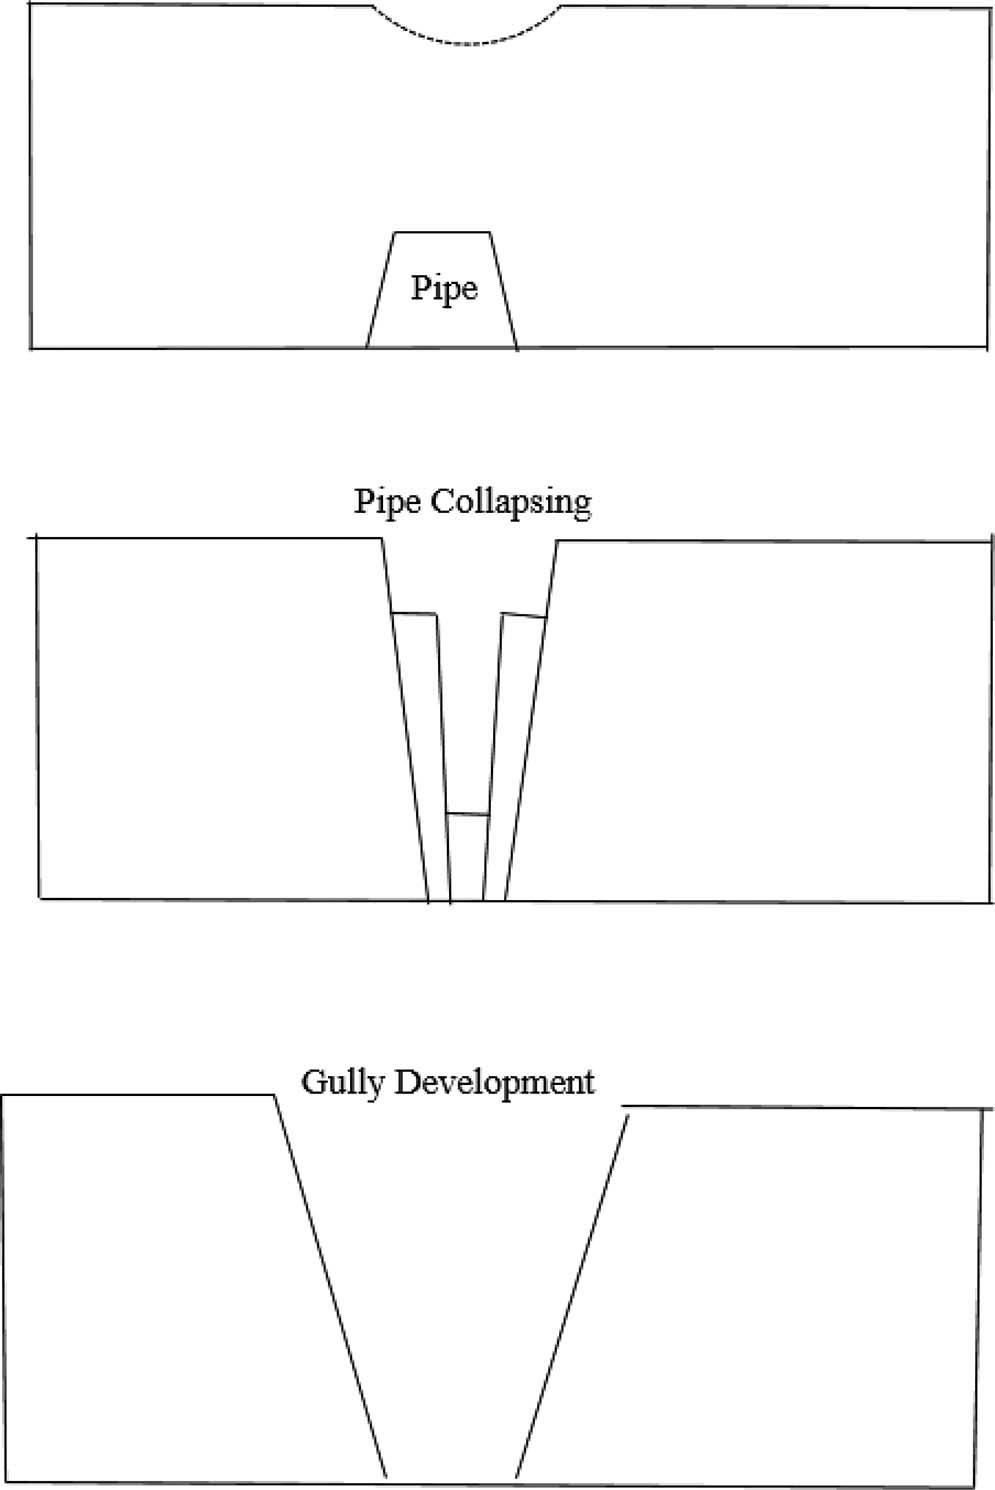
Figure5.Developmentofablindgullyfromcontinuederosionofa subsurfacepipe.Thepipegrowsinsizeduetocontinuederosion,forming initiallyaground fissureandeventuallyaburiedvalley.
occursis »1formostsoilsandsiliciclasticsedimentswith specificgravityof »2.65.Atverticalhydraulicgradients largerthan1,soilparticleswouldlosestrengthandbegin to flowandinternallyerode.Thecriticalhydraulicgradient (ic)iscalculatedbytheequationbelow(Terzaghi,1939):
ic ¼ð!sat !wÞ=!w; (1) where !sat isthesaturatedunitweightofsoil/sediment, and !w istheunitweightofwater.
Internalerosioncanalsooccurathydraulicgradientvalueslessthan1,particularlyforsoils/sedimentsthatlack certaingrainsizefractions,exhibitingabimodalgrain sizedistribution(SkemptonandBrogan,1994).Suchsoils areknownasgapgradedbecausetheyconsistoflarge grainsizeswithoutintermediatesizes,allowing finergrains tobewashedthroughthelargeporespacescreatedbythe coarserfractions.Well-gradedsoilsarethereforemorestable asporespacesareprogressively filledby finerfractions.
Thedegreeofgapgradationcanbeevaluatedbyvisual inspectionofcumulativegrainsizedistributioncurvesto
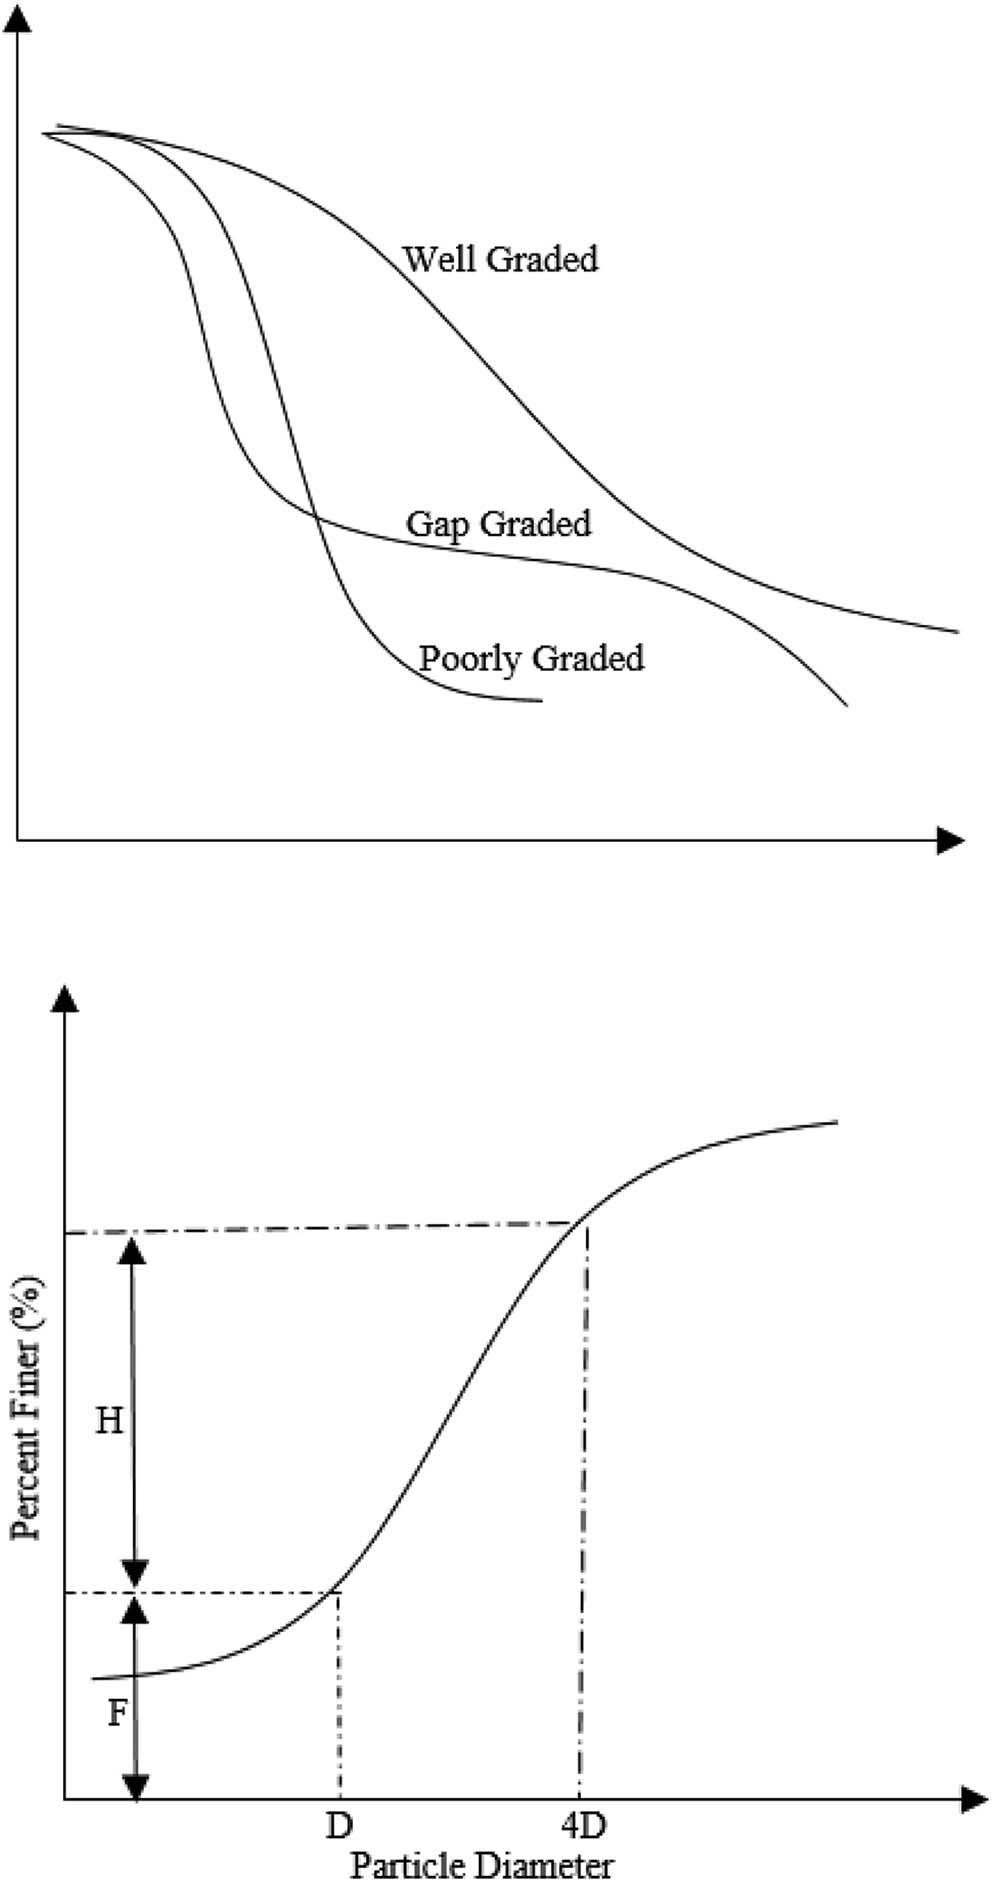
Figure6.(a)Cumulativegrainsizedistributioncurveshowingcurve forgap-gradedsoilsand(b)KenneyandLau’s(1985)methodof measurementofgap-gradeddistribution.
identifyifagivensoil/sedimentismissingcertaingrain sizeranges.Cumulativegrainsizedistributioncurvesfor gap-gradedsoilstypicallyhave flatsection(s)onthecurve wheregrainsizesaremissing(Figure6),asopposedto theuniformgentleslopesofwell-gradedsoils.Toevaluatethepresenceof flatsectionsindicatinggap-gradeddistribution,KenneyandLau(1985)proposedtheuseofthe H/F value,where H isthedifferenceinpercentofgrains passingbetweenarbitrarygrainsizesofonediameter (1D)and4D,and F isthepercentofgrainscorresponding tograinsize D (Figure6).Several H/F valuescanbecalculated,buttheminimumisusedtoidentifygap-graded
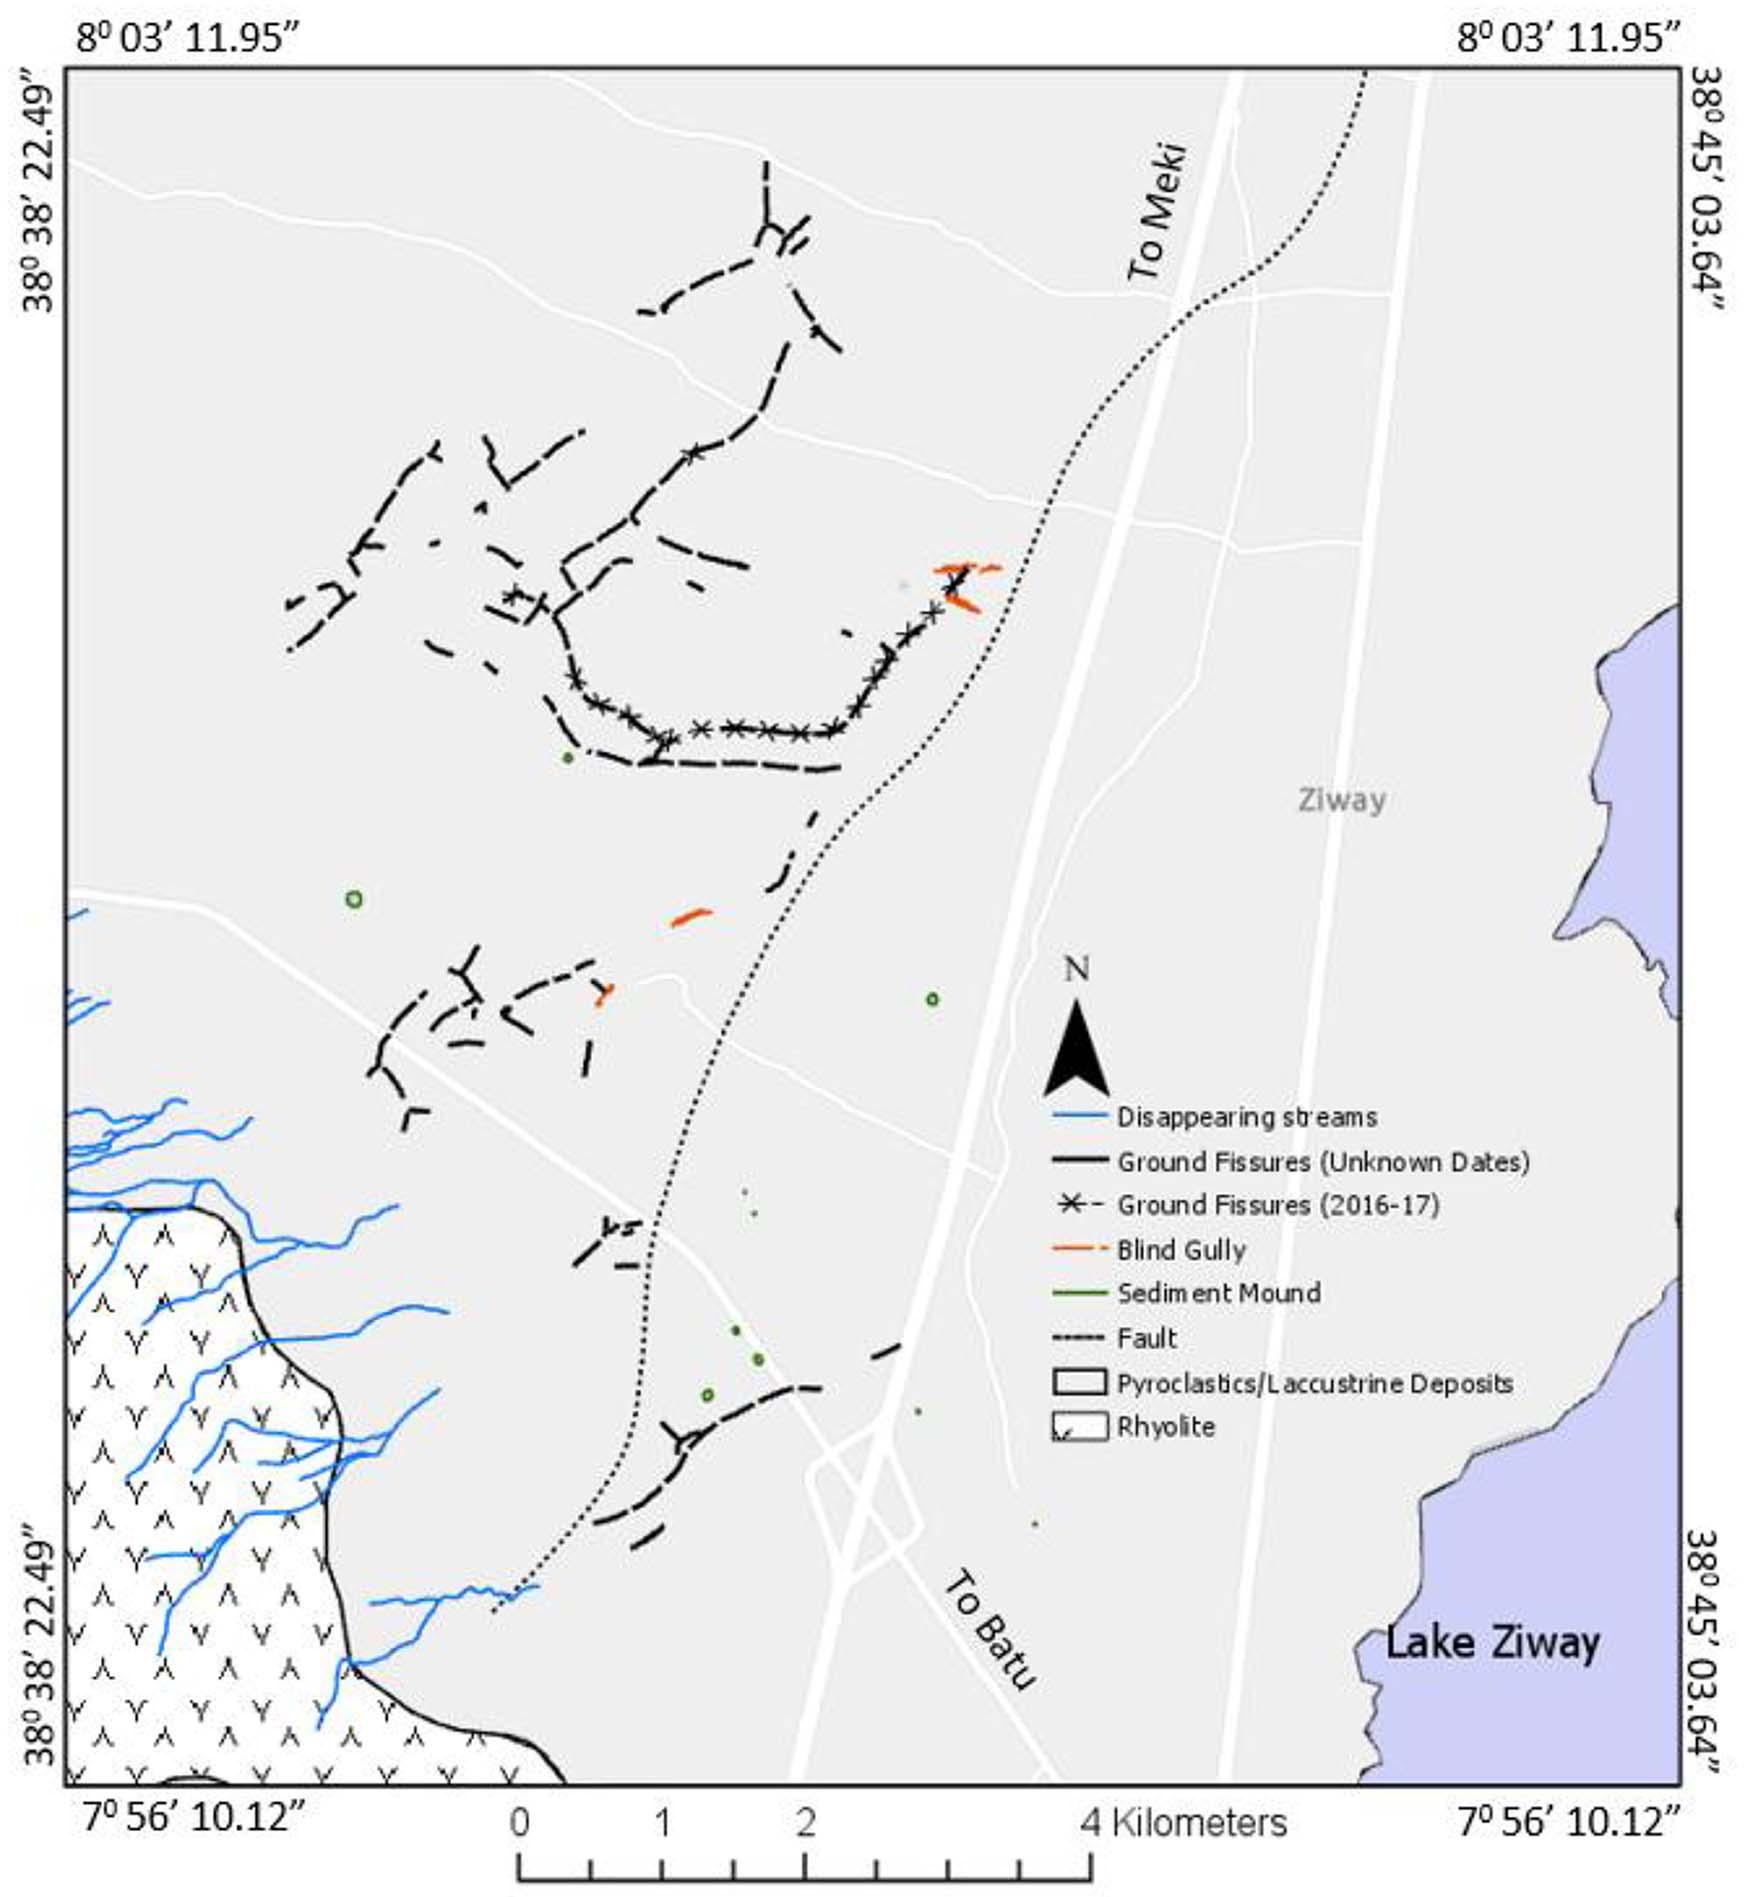
distributions.Soils/sedimentswith H /F ,1areconsideredasgapgradedandthereforesusceptibletointernal erosion.OthergraphicallydeterminedquantitativemeasuresofpipingsusceptibilityincludeTerzaghi’s filtercriteriarule(Terzaghi,1939).Terzaghi’s filtercriteria originallywasdesignedtoselectsoilsthatwouldactas filtersblockingthetransportof finesfromearthdams. Thecriteriawasmodifiedtoassesspipingpotential withinagivensoil/sedimentbyseparatingthegrainsize distributioncurveintocoarseand finegrainsizefraction distributioncurves.Iftheratioofthegrainsizecorrespondingto15percent(d15)passingofcoarsefraction tothegrainsizecorrespondingto85percent(d85)
passingofthe finerfractionisgreaterthan4,then finer grainsizescanbeerodedthroughporespacescreatedby thecoarserfraction,andhenceinternalerosionispossible(SkemptonandBrogan,1994).Additionally,the coefficientofuniformity(CU),whichmeasurestheuniformityofthegrainsizedistribution,isalsousedto characterizeinternalinstability.
CU ¼ d 60=d 10; (2)
where d60 isthegrainsizecorrespondingto60percent passing,and d10 isthegrainsizecorrespondingto10percentpassingonthecumulativegrainsizedistributioncurve.
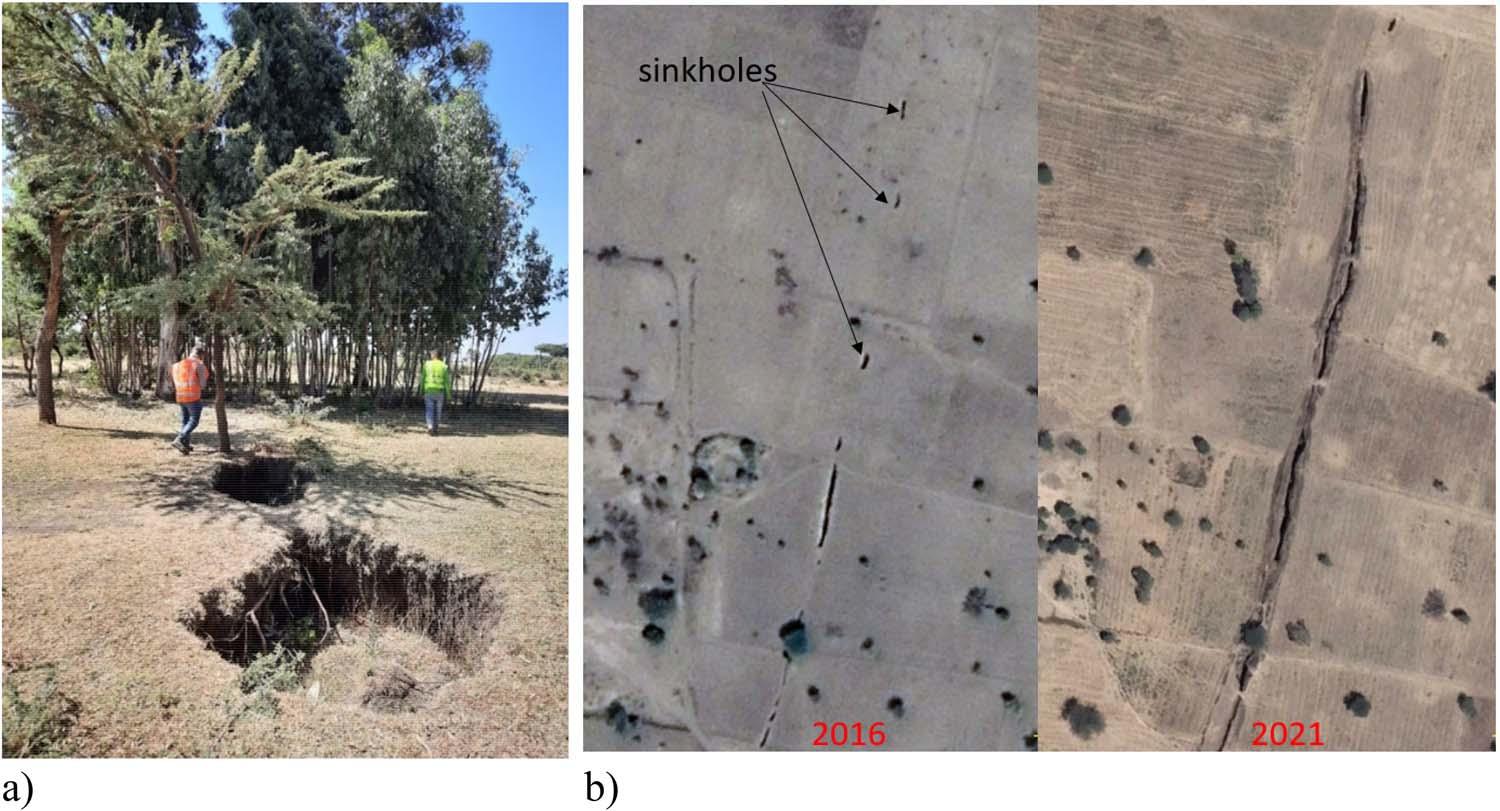
High CU values(.10)mayindicateawell-gradedgrain sizedistribution,whichisalsotypicalforinternallyunstablesoils/sediments(Kovacs,1981).
Toexplorethepresenceofgeomorphologicalevidence forinternalerosionandsusceptibilityofsedimentstothe processofpiping,theresearchmethodologyincludedGoogle Earthimageryinterpretation, fieldinvestigation,grainsize analysis,andprecipitation/earthquakedatainterpretation.
Ground fissuresweremappedbytracingtheirextent onGoogleEarthimagery,whichprovideshigh-resolution imagesthatwereunavailablewhenmostofthepreviousworksonground fissureswerepublished.Itwasalso possibletoconstrainthetimeoftheiropeningusinghistoricalGoogleEarthimagery,whichprovidedhigh-resolution aerialphotographsdatingbacktoearly2010s.Planetscope imageswith3mresolutionfrom www.planet.com were usedtoconstraintimingonsomeground fissures.
OnGoogleEarthimageries,ground fissuresappearas linear/curvilinearopenings,whichcanbecontinuousfor upto2–3kmper fissure.Insomecases,linearvegetation tracksarealsocommonmanifestationsofground fissures. TheirorientationwasdeterminedusingGoogleEarth’s “ruler” tool.TheorientationsofGround fissuresshoweda moredominantN-Sorientationaswellasasigni fi cant E-Wtrend(Figure7).Some fi ssuresappearedtohave polygonalgeometry,andothersshowedbranchingrelationships,whereshorter fi ssuresconnectedperpendicularly withlonger,moreextensive fissures.FromhistoricalGoogleEarthimagery,ground fissuresappearedtogrowover time,insomecasesbyasmuchashundredsofmetersina
fewyears.Thehistoricalimagesalsoshowedthat fissuring startedoutassinkholes,whicheventuallyconnectedto formlinearcracks(Figure8).Itwasdifficulttotellifthe growthwasgradualorsuddenjustfromGoogleEarth imagery,whichdoesnothaveshorttemporalresolution andonlydatesbacktothe2010s,especiallyforthehighresolutionimages.However,usingtheavailablehistorical imagery,the(2016–2017)timeperiodshowedwidespread fissuredevelopment(Figure7).
Imageinterpretationwasfollowedby fieldmappingof thestudyarea ’sgeologyandgroundtruthingofground fissuresandgeomorphologicalfeaturesinterpretedfrom GoogleEarthimagery.During fi eldinvestigation,a geologicmapandrepresentativestratigraphicsections wereproduced(Figure7).Ground fi ssuresinterpreted fromGoogleEarthimageryweregroundchecked.Geologic contactsandgeomorphologicfeaturesweremapped. Samplesfromthepyroclasticandlacustrinedeposits werecollectedforgrainsizecharacterization.
Groundtruthingofimage-interpreted fissuresshowed thatGoogleEarthimagerywasareliabletooltomap fissureswithopeningsasnarrowas ,1mwidth.Field investigationshowedthatground fissurescanbe1–3m widewithnoverticaldisplacementcomponentandoften runforupto2–3km.Theirdepthisverydifficulttoestimate,butmostwereestimatedtobeatleast10–20m deep.ThegeologyoftheZiwayareaismarkedbyextensiveunconsolidatedpyroclasticsedimentsinterlayered withlacustrinedeposits(Figure7).Thelakeandits environsarewithinfault-boundedcalderadepressions, whichprovidedaccommodationspaceforsediment accumulationandformationofthelake.Thepyroclastic depositsappeartobederivedfromnearbyvolcanoes,
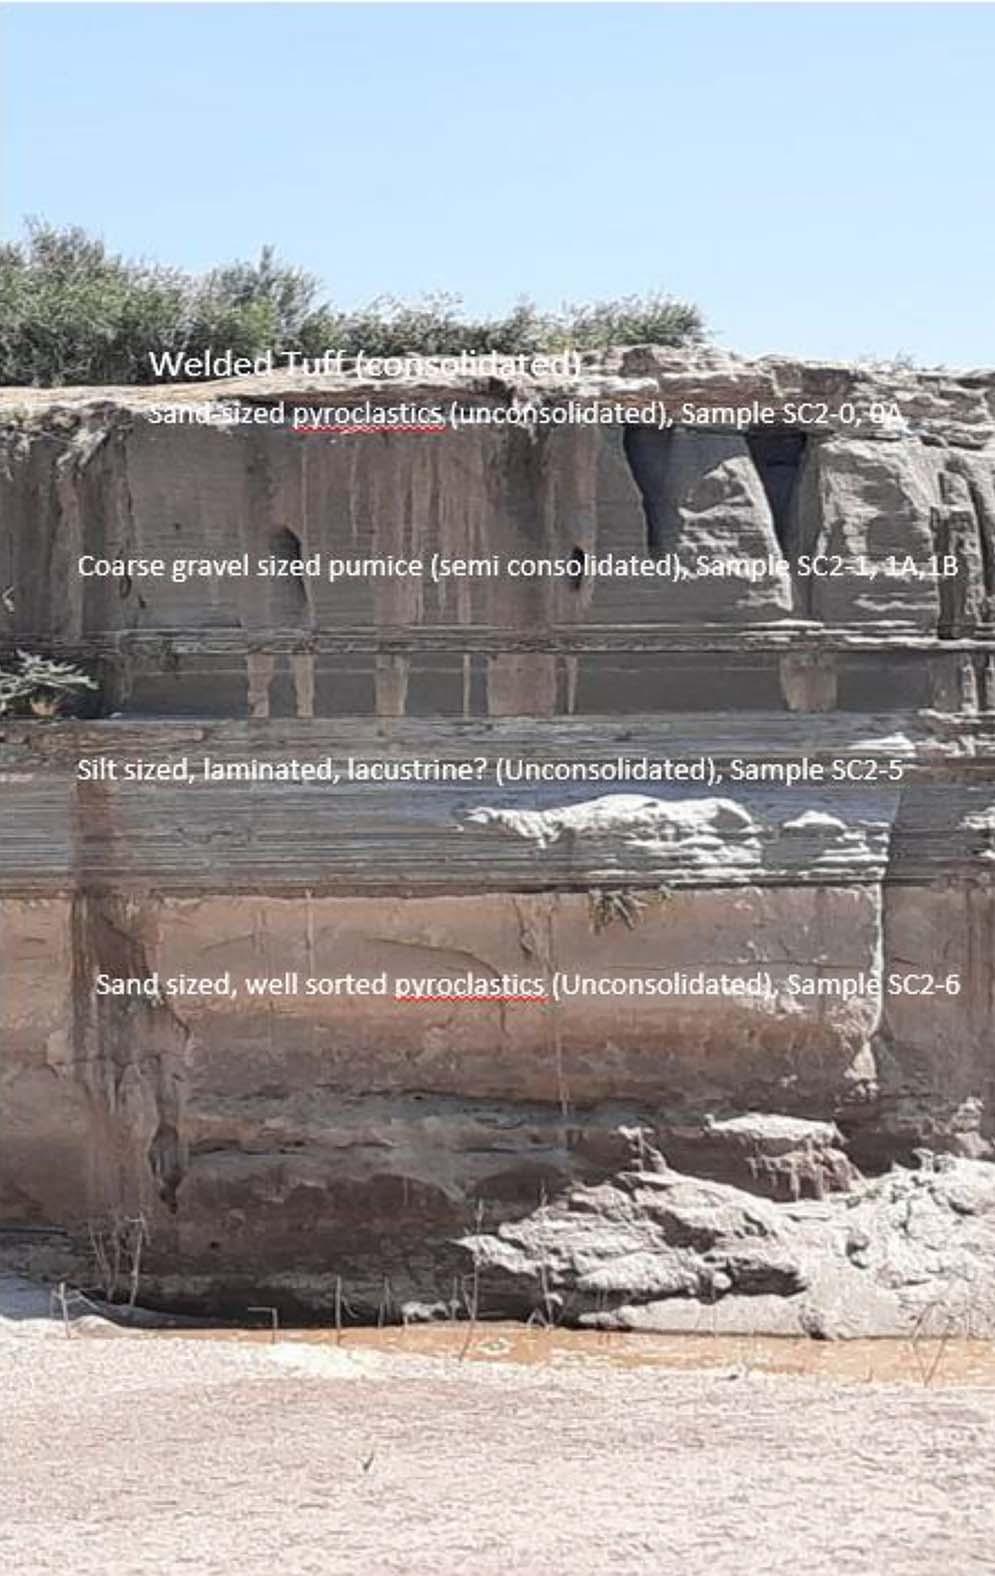
observedintheupperlayerofgravelpumice.
andthelacustrinedepositsaretheresultofshrinkingof alargepaleo-lakethatprecededLakeZiway(Gillepsie etal.,1983).Thepyroclasticdepositsconsistofunconsolidatedsedimentsrangingfrom fineashtogravelsizedpumicedeposits.Itispossiblethatsomepyroclasticmaterialmayhavebeenreworkedbywateraction. Weldedtuffwiththickne ssesrangingfrom10to30cm andlacustrinedepositswerealsoobserved.Arepresentativestratigraphyasexposedonstreamsectionsshows, fromtoptobottom,weldedtuff,unconsolidatedsand-sized pyroclasticdeposits,unconsolidatedgravel-sizedpumice, siltyandclayeylacustrinedeposits,andunconsolidated sand-sizedpyroclasticdeposits.
Therearenodrillingdatatoestablishthedepthto bedrock,butitispossiblethatsedimentthicknessmay pinchoutwestwardtothebasinboundary.Theonlybedrockmappedisinthesouthwesterncorner,whererhyoliteoutcropsasafootwallofanormalfault(Figure7). Fieldmappingalsoidentifiedgeomorphologicalfeatures
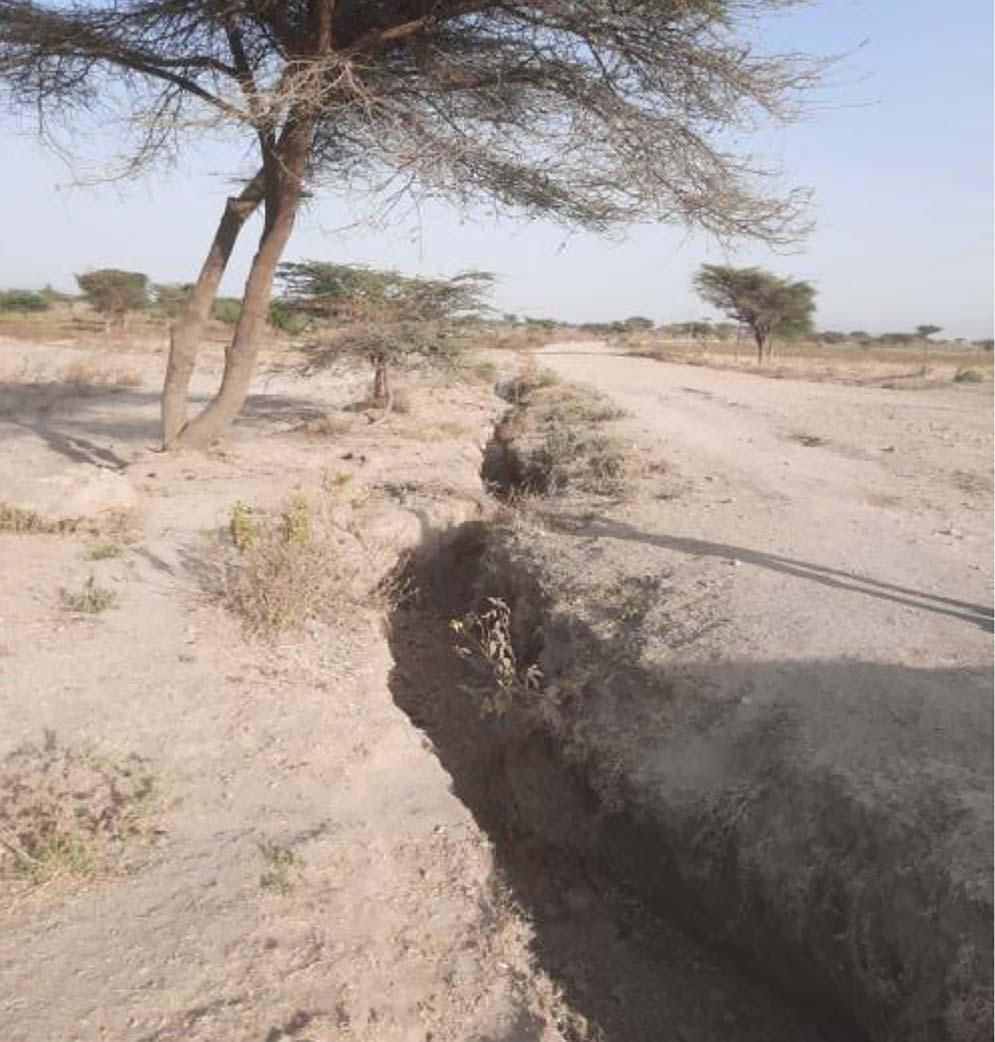
includingdisappearingstreams,blindgullies,andsedimentmoundsthatareindicativeofaprocessbywhich surfacewaterisconnectedtothesubsurfaceviaopenconduitssimilartokarsttopography(Figure7).Most fissures lieinthemiddleofopen fields,buttheyarealsoobserved developingalongthedrainageditchesadjacenttofoot paths(Figure9).
Sedimentsamplesweresievedinthelaboratoryto characterizesediments’ susceptibilitytointernalerosion. Atthestudyarea,pyroclastic/volcanoclasticandlacustrinesedimentsamplesforgrainsizedistributionanalysiswerecollectedonastreamsectionofMekiRiver (Figure10).Samplesweresievedusingsievesizes22.4, 11.2,8,4.75,4,2,0.85,and0.423mm.Saturateddensityanddrydensitywerealsomeasured.
Aplotofpercentbyweightretainedbyeachsieve showedthattwosievesizes(2mmand4.75mm) retainedhighamountsforthecoarse-grainedpumice (SC2-1A,B,C),indicatingabimodaldistribution,which wasfurtherconfirmedbylow H/ F values(Figure11; Table1).Thecumulativedistributioncurvealsoshowed thatthecoarse-grainedpumicelayerhas flatsections, indicatinggap-gradeddistribution(Figure11).Saturated anddrydensitieswerealsodeterminedinthelaboratory. Thedryandsaturateddensityvaluesofthepumicelayer wereverylow,and,correspondingly,thecalculatedhydraulicgradientswerealsoverylow(Table1).Thepumicelayer
Figure9.SamplingsiteontheMekiRiversection.Pipesare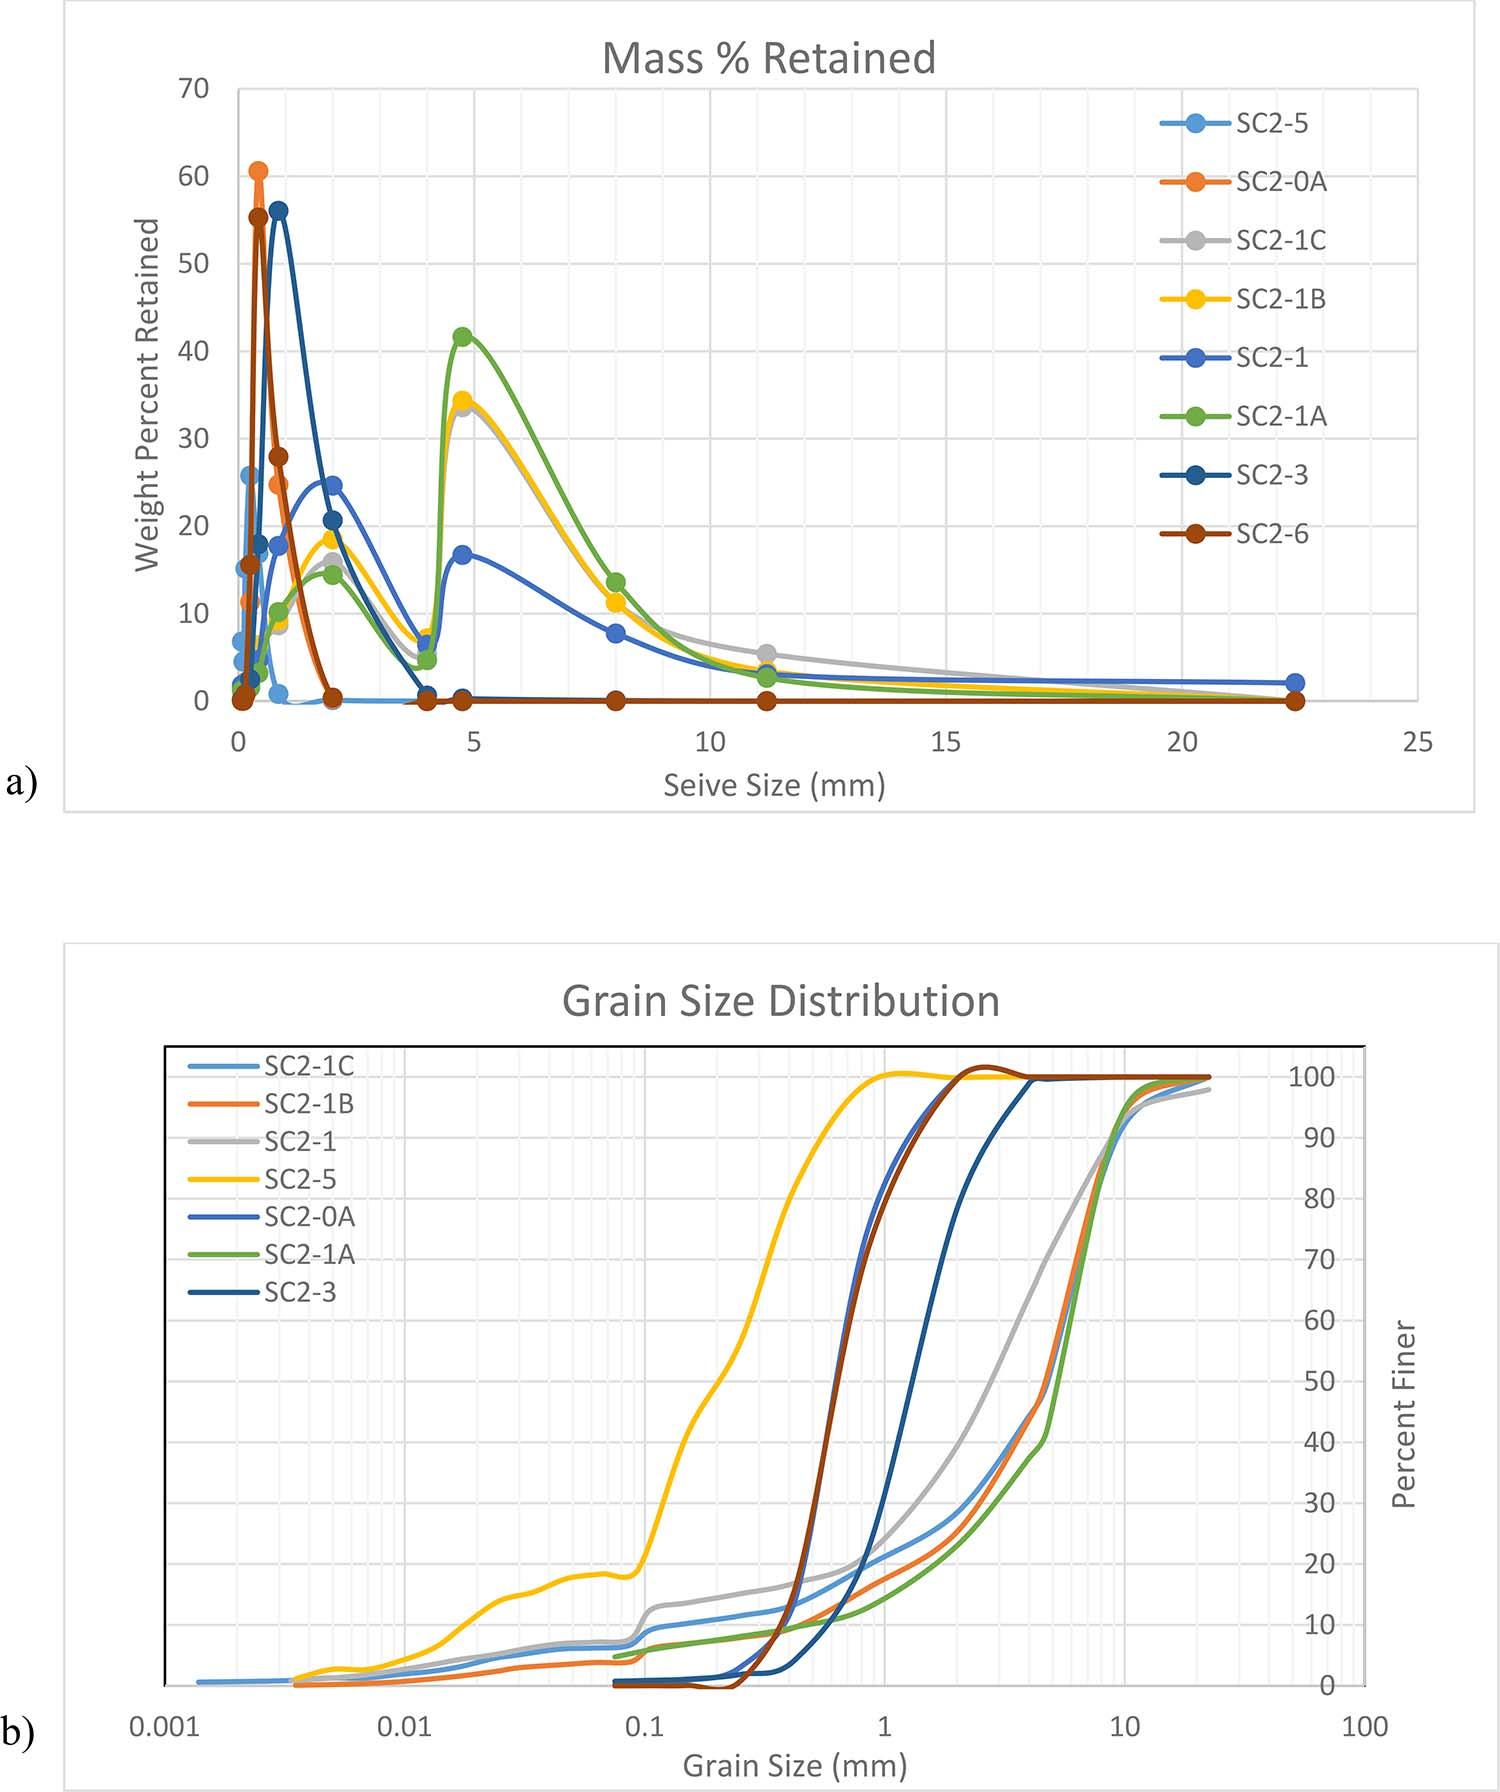
Figure11.(a)Weightpercentageretainedbysievesand(b)cumulativegrainsizedistributioncurvesofsamplesfromtheMekiRiversection.
exhibitedbothgap-gradeddistributionandextremelylow criticalhydraulicgradientvalues,makingithighlysusceptibletointernalerosion(Table1).
Tostudythelinkbetweenground fissuredevelopment andearthquakeandhighrainfallevents,earthquakeevents datingbackto1950andrainfalldatasince1980were obtainedfromtheU.S.GeologicalSurvey(https://earthquake .usgs.gov/earthquakes/map/)andtheClimateResearchUnit GriddedTimeSeries(CRUTS)database(https://www.uea .ac.uk/web/groups-and-centres/climatic-research-unit/ data),respectively.Table2showsearthquakeevents within100kmfromthestudyareasince1950.One
particularearthquake,29.5kmfromLakeZiway, appearstohavebeenthemostspatiallyandtemporally relatedtoground fi ssuresthatoccurredsincethe2010s.
TheCRUTSprecipitationdatabaseisacompilationof interpolatedmonthlyclimateanomalies(Harrisetal., 2020).BasedonCRUTSprecipitationdata,theyear 2016receivedthelargestamountofrainat1,278.5mm, followedby1983(1,215mm),1996(1,207.7mm),and 2021(1,200.6mm)(Figure12).
Themechanismofground fi ssuringinthecentralrift valleycanbecomplicated.Accordingtoprevious
Table1. Summaryoflaboratory-determineddensityvaluesanddescriptorsofgrainsizedistribution.
SampleNo.DryDensity(g/cm3)SaturatedDensity(g/cm3)CriticalGradient CUH/Fd15/d85
SC2-0A0.441.070.071.7571
SC2-10.431.020.0242.20.33
SC2-1A0.311.110.1110.90.53.33
SC2-1B0.291.010.1312.90.53.33
SC2-1C0.311.030.03400.443.33
SC2-3a0.421.080.0853.252
SC2-3b0.551.160.16
SC2-51.021.430.4315.20.64
SC2-60.581.160.161.8932
CU ¼ coefficientofuniformity; H/F ¼ H/F valueproposedbyKenneyandLau(1985); d15/d85 ¼ percentofgrainsizepassingspecifiedfraction (15or85percent).
work,themostfavorablecauseisrelatedtoextensional tectonics(Asfaw1982,1998;Yirguetal.,1997).Ayalew ’s(2004)moreextensiveanalysisproposedacombinationofreleaseofelasticstrainduetoheavyrainfall andhydro-compaction.Althoughplausible,itisdifficulttoshowthepresenceofelasticstraininunconsolidatedsediments.Thisstudyshowedthatthe orientationsofground fi ssuresarenotincomplete agreementwiththegeneralE-W–directedextensionof theriftvalley.Animportantobservationmadeinthe fi eldwasthatthetwosidesofground fi ssuresdonot havethesameoutlineasonewouldexpectfroman extensionalcrack,andalsonoverticaloffsettypicalof extensionalfaultswasobserved.Mostground fissure eventsdonotcoincidewithseismicevents,asground fi ssuringismuchmorefrequentthanearthquakeactivities.Outoftheearthquakeeventssince1950,only eightwerewithin100kmradiusfromthestudyarea, andnonewaswithin30km.However,oneevent,from January27,2017,at »37kmfromthestudyarea,was suspectedtohaveplayedaroleinthedevelopmentof thenumerousground fi ssuresthatformedwithinthe 2016 –2017timeframe.Toverifythis,satellite imageswithknownacquisitiondateswereobtained fromPlanetScope( www.planetscope.com ).ThePlanetscopeimage(3mresolution)showninFigure13demonstratesthatoneofthe2016–2017 fissuresexistedin
December2016,whichiswellbeforetheearthquakehad happenedonJanuary27,2017.
Fieldinvestigationofgeomorphologicfeaturesand sedimentgrainsizeanalysisshowedthatpipingcaused byinternalerosionofultralow-densitypyroclastic depositsisthemostplausiblemechanism.Instriking similaritytoareassubjecttointernalerosiondescribed byBernatek-JakielandPoesen(2018),geomorphologic featuressuchasdisappearingstreams,blindgullies,and circularsedimentmoundsarewellevidentinthestudy area.Subsurfaceconduitscanlinksurfacewaterwith groundwater,causingstreamstodisappear.Theconduits couldserveassubsurfacecontinuationsofsurfacedrainageandalsoreappearonthesurface,depositingsedimentsintheformofcircularsedimentmoundsorin somecasesformingcircularponds.
Thepresenceofgeomorphologicfeaturesindicative ofinternalerosionandthepresenceofultralow-density pyroclasticsedimentsareproofthatinternalerosioncan easilybetriggeredatverylowcriticalhydraulicgradientsthataremuchlowerthantheidealcriticalgradient of1.Inadditiontotheirlowdensity,thegravel-sized pumicedepositsshowlargevariationsingrainsize,as shownbygrainsizedistributioncurvesand H/ F values, promotingtheirlikelihoodtointernallyerodeandmakingthemthemostsusceptibletointernalerosion.ObservationsalongtheMekiRiversectionshowedopen
Table2. Earthquakeoccurrencesince1950within100kmdistancefromLakeZiwayarea(https://earthquake.usgs.gov/earthquakes/map ).
ApproximateDistancefrom ZiwayArea(km)EarthquakeMagnitudeDate(month/day/year)EpicenterLocation 36.64.57/4/200632kmEofZiwayTown 375.31/27/201729kmSofZiwayTown 374.98/14/198526kmNEofButajiraTown 64.64.23/31/20159kmWofWerabeTown 674.412/29/201432kmNEofShashemeneTown 775.32/13/199313kmSofWenjiTown 97.651/20/199511kmNofHawassaTown 994.410/17/201114kmNofHosainaTown
Figure12.PrecipitationdatacompiledfromCRUTS(ClimateResearchUnitGriddedTimeSeries):(a)monthlyand(b)annual.
conduitsthatarestrata-boundwithinthe4–5-m-thick gravellypumicelayer(Figure10).Thefactthatground fissuresfollowheavyrainfallisthereforeduetoincreased groundwater flowinsubsurfaceconduits,whichincreases
theerosionofconduits,leadingtoroofcollapse.Although itneedsthoroughinvestigation,theabsenceofground fissuresindrierareasunderlainbysediments(Asfaw,1998) isfurtherproofthatground fissuringiserosioncontrolled.
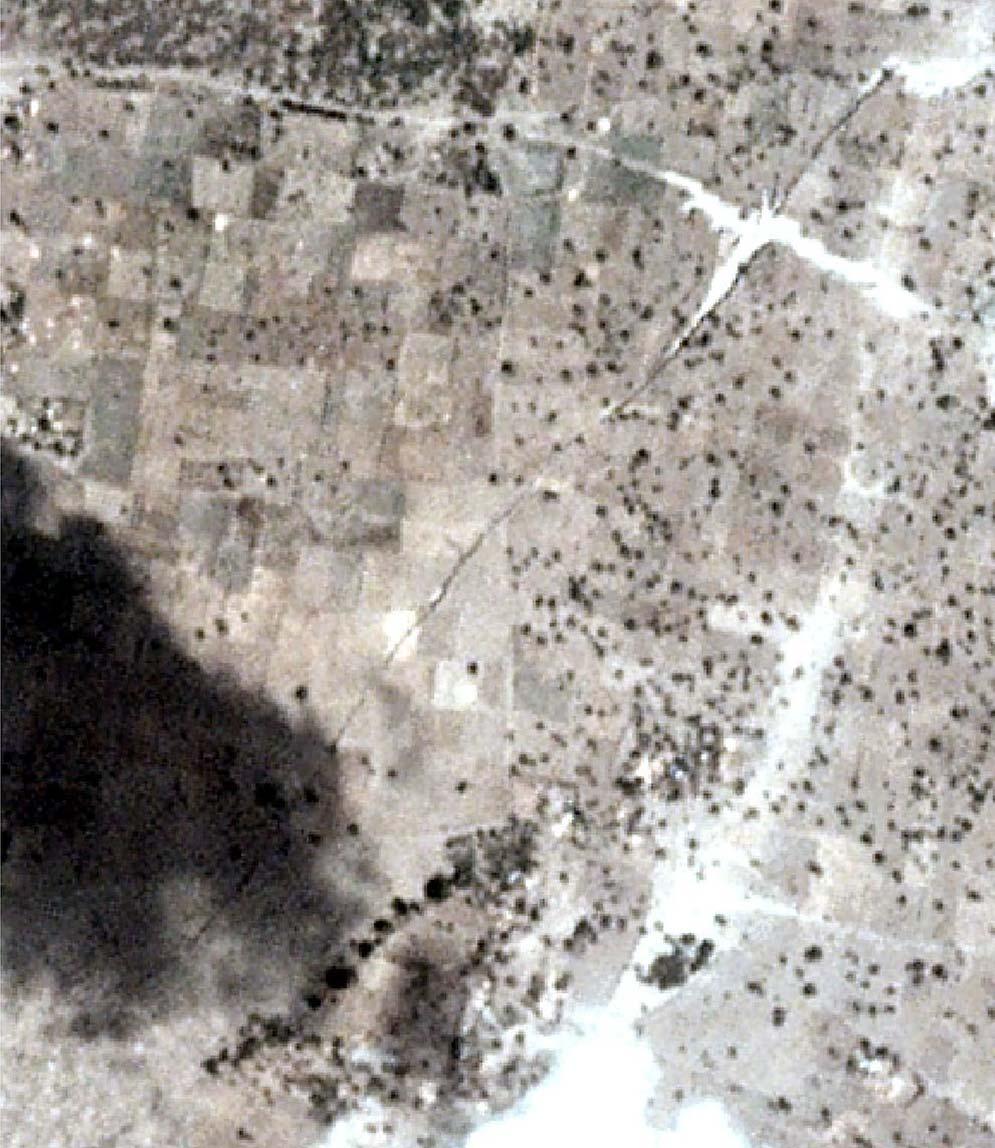
Figure13.PlanetscopeimagecapturedinDecember2016showing thepresenceofa2016–2017ground fissurebeforetheearthquake eventonJanuary27,2017.
AlongtheMekiRiversection,collapsedpipesobserved ontheriversectioncanbeseeninplanviewinitiating ground fissuredevelopment(Figure14).Linearground fissuresdevelopassubsurfacegroundwaterconduitsor pipesgrowinsizeandeventuallycollapse.Continued erosionwillwidenground fissuresandturntheminto blindgullies.Asimilargeneticmodelwasproposedfor thedevelopmentground fissuresintheLakeNakuruarea ofKenya,whereburiedfaultsserveassitesofsubsurface flow,causingerosionofoverlyingsediments,whichsubsequentlycollapsetoformlinearground fissures(Ngecu andNyambok,2000).ThewidelypublicizedKenyan fissurefrom2018followedheavyrainfall,andnopreceding seismicactivitywasrecorded.Ground fissuringactivity inthe2016–2017timeperiodintheZiwayarea,asconstrainedbyhistoricalGoogleEarthimagery,canbedirectly relatedtotheyear2016,whichrecordedthelargestamount ofrainfallinover40years.Basedonconversationswith locals,thetimingofseveral fissuresintheareaoccurredas overnighteventsinMayandAugustof2016following heavyrainfall.Inadditiontopipingduetointernalerosion, anadditionalplausiblemechanismforthedevelopmentof ground fissuresissurfaceerosion,asobservedalongdrainageditches,causingdeeperosionthateventuallymanifests asground fissures.
Arelevantgeomorphologicalmodelthatbestexplains theformationofdisappearingstreams,blindgullies,and
ground fissureswasdescribedaspseudokarst,which produceskarst-likefeaturesinsoils/sediments(Kempe andHalliday,1997).AccordingtoHaliday(2007),one ofthemechanismsforpseudokarstdevelopmentispipingofpoorlyconsolidatedsediments,formingpiping caves,funnel-shapedsinks,anddryvalleys.Pipingin soilscanbecausedby(1)soilwithverticalpermeability differencesthatcauselateralwatermovement,(2)a steepslopethatmaycausehighhydraulicgradient,and (3)thepresenceofdispersivesoils(Wilsonetal.,2017). Therefore,ground fissuresintheareassurroundingLake Ziwayappeartobecontrolledbythepresenceofpumiceouslayersthatarehighlysusceptibletointernalerosionandpromotepseudokarstformation.Heavyrainfall usuallyprecedesground fissuringandactsasatriggeringfactor.Earthquakeeventscanalsopotentiallyhavea triggeringeffect.Theproposedpresence/patternofsubsurfacegroundwaterconduitsshouldbeinvestigated usinggeophysicalmethodssuchaselectricalresistivity andground-penetratingradar(GPR).
Althoughnotbasedonthoroughinvestigation,areas ofhighground fissureoccurrenceappeartobespatially linkedtocircularcalderabasinsandanearbylake.This spatialassociationistruefortheZiway,Gedemsa,and MuletiareasinthecentralEthiopianriftandLake NakuruinKenya.Thismaybeduetothehigherhydraulicgradientwithinthesebasinsandthefactthatthelakes canprovidelargeaccommodationspacefordeposition ofinternallyerodedsediment.Theimportanceofpumice layersbeingsusceptibletointernalerosionishighlighted inthisstudy.Interestingly,studiesintheMuletiareaof EthiopiaandLakeNakuruofKenyareportthepresence ofthickdepositsofpumiceinareasaffectedbyground fissures(NgecuandNyambok,2000;Ayalew,2004).As forpreferredlocations/alignmentsofground fissures, furtherresearchshouldbedonetoounderstandifthere arerolesplayedby(1)buriedfaults/fracturezones, whichmayplayapassiverolebyservingaspreferential groundwater flowconduits,promotingthedevelopment ofsubsurfacepipes,and(2)oldburiedchannels,which mayserveasconduitsofconcentratedgroundwater flow, promotinginternalerosion.Extensional fi ssuresin bedrock,asdescribedinAcocellaetal.(2003),may beunderlyingtheunconsolidatedsediments,providing sitesofconcentratedgroundwater flow,andpotentially explainingtheground fissuresthatareorientedconcordanttotheE-Wriftextension.
Theresultsandconclusionsofthisworkshouldbe limitedtoground fi ssuresformingintheriftvalley underlainbylow-densityvolcanicsedimentssuchas pumice.Itwouldbeanover-simplifi cationtoextend theroleofinternalerosiontoallground fi ssuring observedintheMER.Forinfrastructureengineers, ground fi ssure –relatedstudiesshouldfocusonhowto

Figure14.(a)PipecollapseontheMekiRiversection.(b)Traceofthecollapseinplanviewshowinginitiationofground fissuredevelopment.
predictground fi ssuringandidentifyingengineering solutionstoslowtheprocessandprotectcivilstructures.Amodelrelatingground fi ssuringeventswiththe presenceofinternallyerodiblesedimentsandrainfall amountsshouldbeformulated.Suitablegeophysical methodstomapsubsurfaceconduitsshouldbeidentifi edtoproactivelydesignengineeringsolutionstostop orslowinternalerosion.Possibleremediesmayinclude increasingrunoffwhiledecreasingin fi ltration,and designinggeotechnical fi ltermechanismsatsiteswhere ground fi ssuringislikelytoaffectinfrastructure.
Thefollowingconclusionscanbedrawn:
(1)Ground fissuresprimarilyaffectingsedimentsin theLakeZiwayareadonotappeartohaveany significantassociationwithextensionaltectonics andassociatedseismicactivity.
(2)Astrongargumentcanbemadethatground fissuresaffectingsedimentarydepositsintheZiway
areaaretheresultsofcollapsingsubsurfacegroundwaterconduits.Thesubsurfacegroundconduits appeartoresultfrominternalerosionofgravelly pumicelayers,whicharegapgradedandhaveultralowdensity.
ACOCELLA,V.;KORME,T.; AND SALVINI,F.,2003,Formationofnormal faultsalongtheaxialzoneoftheEthiopianrift: JournalofStructuralGeology,Vol.25,pp.503–513.
ALEMAYEHU,T.,2010,GroundwaterdynamicsintheEastAfricanrift system.InXu,Y.andBraune,E.(Editors), SustainableGroundwaterResourcesinAfrica:CRCPress,TaylorandFrancis,Boca Raton,FL,pp.93–106.
ASFAW,L.M.,1982,Developmentofearthquake-induced fissuresin theMainEthiopianRift: Nature,Vol.297,No.5865,pp.393–395.
ASFAW,L.M.,1998,Environmentalhazardfrom fissuresintheMain EthiopianRift: JournalofAfricanEarthSciences,Vol.27,No. 3–4,pp.481–490.
ASFAW,L.M.,2000,Tensional fissuresinsedimentsassignatureofrift tectonicsintheMainEthiopianRift: SINET:EthiopianJournalof Science,Vol.23,No.1,pp.103–113.
AYENEW,T.,2001,Numericalgroundwater flowmodelingoftheCentralMainEthiopianRiftlakesbasin: SINET:EthiopianJournalof Science,Vol.24,No.2,pp.167–184.
BANKHER,K.A. AND AL-HARTHI,A.A.,1999,Earth fissuringandland subsidenceinwesternSaudiArabia: NaturalHazards,Vol.20,No.1, pp.21–42.
BERNATEK-JAKIEL,A., AND POESEN,J.,2018,Subsurfaceerosionbysoil piping:Significanceandresearchneeds: Earth-ScienceReviews, Vol.185,pp.1107–1128.
CORTI,G.;PHILIPPON,M.;SANI,F.;KEIR,D.; AND KIDANE,T.,2013,Reorientationoftheextensiondirectionandpureextensional faultingatobliqueriftmargins:ComparisonbetweentheMain EthiopianRiftandlaboratoryexperiments: TerraNova ,Vol.25, No.5,pp.396 –404.
FENTAW,B. AND MIHRET,M.,2011, HydrogeologicalMapofAkaki–Beseka(Ethiopia):GeologicalSurveyofEthiopia,Ministryof MinesSheetNC37-14,scale1:250,000.
GOUIN,P. AND MOHR,P.A.,1967,RecenteffectspossiblyduetotensionalseparationintheEthiopianriftsystem: BulletinoftheGeophysicalObservatoryAddisAbaba,Vol.10,pp.69–78.
HARRIS,I.;OSBORN,T.J.;JONES,P.; AND LISTER,D.,2020,Version4of theCRUTSmonthlyhigh-resolutiongriddedmultivariateclimate dataset: ScientificData,Vol.7,No.1,pp.109.
KEMPE ,S. AND HALLIDAY,W.R.,1997,Reportonthediscussionon pseudokarst.In Proceedingsofthe12thInternationalCongress ofSpeleology, Volume6:InternationalUnionofSpeleology,La Chaux-de-Fonds,Switzerland.
KENNEY,T.C. AND LAU,D.,1985,Internalstabilityofgranular filters: CanadianGeotechnicalJournal,Vol.22,pp.215–225.
LEE,C.F.;ZHANG,J.M.; AND ZHANG,Y.X.,1996,Evolutionandorigin oftheground fissuresinXian,China: EngineeringGeology,Vol. 43,pp.45–55.
MOHR,P.A.,1967,TheEthiopianRiftSystem: BulletinoftheGeophysicalObservatoryAddisAbaba,Vol.11,pp.1–65.
NGECU,W.M. AND NYAMBOK,I.O.,2000,Groundsubsidenceandits socio-economicimplicationsonthepopulation:Acasestudyof theNakuruareainCentralRiftValley,Kenya: Environmental Geology,Vol.39,No.6,pp.567–574.
PENG,J.;QIAO,J.;SUN,X.;LU,Q.;ZHENG,J.;MENG,Z.; AND ZHAO,J., 2020,Distributionandgenerativemechanismsofground fissures inChina: JournalofAsianEarthSciences,Vol.191,pp.104–218.
PENG,J.;QU,W.;REN,J.;ZHANG,Q.; AND WANG,F.,2018,Geological factorsfortheformationofXi’angroundfractures: Journalof EarthScience,Vol.29,No.2,pp.468–478.
PENG,J.;XU,J.;MA,R.; AND WANG,F.,2016,Characteristicsand mechanismoftheLongyaoground fissureonNorthChinaPlain, China: EngineeringGeology,Vol.214,pp.136–146.
SHENG,Z.;HELM,D.C.; AND LI,J.,2003,Mechanismsofearth fissuringcausedbygroundwaterwithdrawal: Environmental&EngineeringGeoscience,Vol.9,No.4,pp.351–362.
SKEMPTON,A.W. AND BROGAN,J.M.,1994,Experimentsonpipingin sandygravels: Geotechnique,Vol.44,No.3,pp.449–460.
TERZAGHI,K.,1939,45thJamesForrestlecture,Soilmechanics A newchapterinengineeringscience: JournaloftheInstitutionof CivilEngineers,Vol.12,No.7,pp.106–142.
YIRGU,G.;DI PAOLA,G.M.;KEBEDE,F.;HAGOS,M.;TEFERI,A., TILAHUN,G.; AND GEMETESA,N.,1997, StudyReportonGround FracturingintheMuletiArea,AwasaZuriaWoreda:AddisAbaba UniversityandSNNPRProfessionalPaper,Awasa,Ethiopia,7p.
NorthCarolinaGeologicalSurvey(ret.),24TwoOaksDrive,Fletcher,NC28732
BARTL.CATTANACH G.NICHOLASBOZDOGNorthCarolinaGeologicalSurvey,2090U.S.Highway70,Swannanoa,NC28778
CityofAsheville,WaterResources,70CourtPlaza,Asheville,NC28801
KeyTerms: Landslide,BlueRidgeMountains,North Carolina,UncrewedAerialSystems
Adebrisslideandsubsequent fireonSeptember 18,2018,destroyedabankbuildinganddamaged propertyinWarrensville,NorthCarolina.Theslide pushedapropanetankandanelectricalgenerator againstthebank.Inthatcollision,anelectricalarc causedthepropanetoexplode,whichproduceda fireball.Employeesinthebanknarrowlyescaped withminorinjuries,andslidedebrisburiedpartof anunoccupieddrive-throughlane.NorthCarolina GeologicalSurveygeologistsrespondedtoarequest fromtheAsheCountyEmergencyManagerand investigatedtheslideareatoassessslopestabilityfor publicsafety.Aidedbyuncrewedaerialsystem imagery,wedocumentedslopeanddebrisslidefeaturesandgeologicmaterialsandconstructedageologiccrosssectionthroughthe1,400m2 debrisslide. Weconcludedthatrecordabove-normalprecipitationfollowedbyrainfallfromtheremnantsof HurricaneFlorenceduringSeptember15–18,2018, inducedtheslide,andthatgeologicconditionsand hillsidemodificationsoverpriordecadeshadpredisposedtheslopetofailure.Colluvialdepositsderived fromshearedamphibolitebedrock,andcurvedtrees withinandadjacenttothe2018slideindicatedpreexistingmarginallystablehillslopeconditions.The 2018slideincludedtheareaofa2000slidethat involvedacutslopeconstructedduringearliersite development.Stabilityanalysesshowedthatthe describedconditionsledtoanunstableslopeatthe timeofthe2018slide.Asepticleach fieldinvolvedin
*Correspondingauthoremail: Richard.M.Wooten@gmail.com
the2018slidewasdamaged;however,itisuncertain ifitwasacausalfactorintheslide.
Landslidesarethemostcommongeohazardinthe southernAppalachianMountainsofwesternNorthCarolina. Debris flowsanddebrisslides,dominantamonglandslide processeshere,aretriggeredbyrainfallonsteep,soilmantledslopesoftheBlueRidgePhysiographicProvince (Wootenetal.,2016,andreferencestherein).Inaddition tocounty-widelandslidehazardmapping,respondingto landslideeventsisaprimaryfunctionoftheNorthCarolina GeologicalSurvey(NCGS)geohazardsteam.Landslide dataandcounty-widelandslidehazardmapsareavailable onaninteractiveWebmap(http://mapviewer.landslidesncgs .org),whichissupplementedbyalandslidehazardsWebsite(http://landslidesncgs.org),bothdevelopedinpartnershipwiththeNationalEnvironmentalModelingandAnalysis Center(NEMAC)attheUniversityofNorthCarolina–Asheville.Asofthiswriting,county-widelandslidemapping forAsheCountyispending,andcurrentlytwodocumented landslidesareshownontheaforementionedNCGSlandslideWebmapviewer.OncelandslidemappingiscompletedforAsheCounty,thenumberofdocumentedlandslides therewillundoubtedlyincrease.
Since1990,theNCGShasrespondedtoeventsinvolvingover360landslidesintheBlueRidgeMountainsof NC(Figure1),includingthoseresultinginfatalities,injuries,destroyedanddamagedhomes,andthreatstoregional infrastructure(Baueretal.,2012;Wootenetal.,2017, 2022).Responsestotheserequestsforassistanceonlandslideeventsfromlocal,state,andfederalgovernmentagencies,thepublic,andconsultantshaveentailedcommunicating with firstresponders,thepublic,andthemedia,andgiving expertwitnesstestimonyincasesinvolvinglitigation.Aprimarylandslideresponseobjectiveistoprovidestakeholders
Figure1.MapsshowingthelocationsofWarrensville,NC,andNCGSlandslideresponsesfrom1990toJuly2023bycategory.Landslide responsecategories:emergency responsetimecritical,involveslossoflifeorseriousinjury,severedamage,andposesanimmediatethreatto publicsafetyorproperty; urgent responsetimeimportant,andposesapotentialthreattopublicsafetyorproperty; routine responsetimenot criticalandposesalowpotentialthreattopublicsafetyorproperty,orresponsemaybeforinformationalpurposesonly.Insetmapbottomright: longitudeandlatitudecoordinatesforthe2018debrisslidemainscarp;mapcontourinterval ¼ 50m. Wooten,Cattanach,Bozdog,andIsard
withtimely,unbiased,scientificinformationtohelpprotect publicsafetyandproperty.Akeyresponsefunctionistohelp increasesituationalawarenessforemergencyresponders. Post-landslideeffortsincludeassistancewithdamage assessments,contingencyplansifunstableslopesremain athreat(e.g.,Wittetal.,2012),anddocumentationtosupportrecoveryandmitigationfunding.Asinlandslide responseprogramsinotheragencies(DeGraffetal.,2007; Reidetal.,2021),anoverarchingobjectiveistoreducethe riskfrompast,ongoing,andfuturelandslides.Importantly, theresponsesandsubsequentinvestigationsbytheNCGS areneitherintendedtobenorcarriedoutasforensicinvestigationsforthepurposesofestablishingresponsibilityor liabilityofthepartiesinvolved.TheNCGSisnotaregulatoryagency;therefore,guidanceandrecommendations offereddonotcomewithanyregulatoryrequirements.
OnSeptember19,2018,NCGSgeologistsconducted areconnaissance fieldinvestigationoftheslopefailure thatoccurredonTuesday,September18,2018,inWarrensville,NC.Thedebrisslide(asdefinedbyCrudenandVarnes,1996)andsubsequent firedestroyedtheLifeStore Bank,locatedat4951N.C.Highway88West,Warrensville,AsheCounty,NC,anddamagedproperties adjacenttothebank.Theheadscarpofthedebrisslide islocatedatapproximatelylat36.45858°Nandlong 81.51667°W(Figure1).
TheAsheCountyEmergencyManagementDepartment reportedthattheemergencycalltotheir911dispatchcentercameinat3:03p.m.EDTonTuesday,September18, 2018.Firstrespondersdeterminedthatalandslidepusheda propanetankagainstthebackofthebuilding.Anelectrical arcfromanauxiliarygeneratorintheimpactareaignited
Figure2.FiredestroyedtheLifeStoreBankafterthedebrisslidestruckthebuilding.The911callreportingthe firewasat3:03p.m.(15:03 hours)onTuesday,September18,2018.PhotoisfromavideoexcerptprovidedbyAsheCountyEmergencyManagementthatwastakenbya passerbywhowitnessedthe fireshortlyafterthedebrisslideoccurred.Viewlookingsouth.
thepropanefromtherupturedtank,whichproducedthe fireballobservedbywitnesses(Figure2).Bankemployees insidethefrontofthebanknarrowlyescapedsafely,with onepersonsustainingminorburns.Awitnesstotheslide whowasoutsideattheadjacentpropertytothesoutheast reportedthattherewasa “whooshingnoise” whentheslide movedrapidly,pushedametaloutbuildingoffitsfoundation,andburiedthedrive-throughlanebehindthebank (Figures3and4).
Thepurposeoftheinvestigation,asrequestedbythe AsheCountyEmergencyManagementDepartment,was toassessthestabilityoftheslopewithrespecttopublic safetynearthedebrisslideandadjacentproperties.Our verbalcommunicationswithstakeholders,andsubsequent reporttoAsheCountyEmergencyManagement(Wooten etal.,2018),aimedtoprovidegeneralguidance,convey theobservationsand findingsoftheinvestigation,anddocumentthecircumstancesandconditionsleadingtotheslope failure,sothatsimilarsituationscanberecognizedand avoidedinthefuture.Inthispaper,wesummarizethe2018 investigationandreport,andwediscusstheWarrensville debrisslideinthecontextoftheperiodofrecordrainfall andincreasedlandslideactivityduring2018–2020inwestern NorthCarolina.
OnSeptember19,2018,weconductedareconnaissancelevelinvestigationofslopeanddebrisslidefeaturesand geologicmaterialsexposedinthevicinity,andweconstructeda field-developedgeologiccrosssectionthrough thedebrisslide.Fieldclassificationsofsoilandrock
materialsandstationlocationswererecordedandgeolocatedusingglobalpositioningsystem(GPS) –equipped fi eldcomputers.Uncrewedaerialsystem(UAS)imageryofthedebrisslidetakenbytheNorthCarolinaCooperativeExtensiononSeptember19,2018,was georegisteredinageographicinformationsystem(GIS) andusedtohelpmapthedebrisslideandrelatedfeatures intheofficephaseoftheinvestigation(Figure5).Observationsweremadeofpre-slidesiteconditionsusing1993, 1998,2005,2010,and2014(Figure6A)vintagesof orthophotography.Inour2018study,weassessedsite topographyusing “ legacy” lightdetectionandranging (LiDAR)data(Figure6A)collectedin2004at6mpixel resolution(NCDPS,2005).In2019,quality-level1(QL1) LiDARdatacollectedforNorthCarolinain2017became available(NCDPS,2020).The2004and2017datasets werereducedtobare-earthdigitalterrainmodels(DTMs) with6mand0.5mpixelresolution,respectively.The 2004LiDARdatausedinthe2018reportweresupplementedbythehigher-resolution2017LiDARdata,which showedslopeconditionspriortothe2018debrisslide. Thiscasestudyalsoincludesastabilityanalysis.
Astructureatthelocationofthebankbuildingisnot shownonthe1966U.S.GeologicalSurvey1:24,000scale topographicmapoftheWarrensville7.5minutequadrangle;however,abuildingatthebanklocationisvisiblein 1993andlaterorthophotography.Basedonthetopography shownontheWarrensville7.5minutequadrangle,andthe
Wooten,Cattanach,Bozdog,andIsard
Figure3.Toeofthedebrisslidedepositwhereitovertoppedtherock andwirebasketretainingwall,buriedthedrive-throughlane,and pushedthepropanetankandthegeneratorintothebackofthebank building.Slidedebriscoversthepropanetankinthisphotograph. Viewlookingsoutheast.September18,2018,photocourtesyofAshe CountyEmergencyManagement.
presentslopeconfigurationsatthesiteandadjacentproperties,sitegradingforthebuildingandthedrive-through lanelikelyresultedincutslopesexcavatedintothehillside, seenasthesteepslopesimmediatelybehindthebuilding sitesinFigure7.Asepticleach fi eldwithin fi ltration benchesandpumpstationsbuilt(dateunknown)into thehillsideforusebytheadjacentrestaurantareclearly visiblein2017LiDARdata(Figure7).Effluentfromthe adjacentrestaurantwaspumpeduphilltotheleach field. Thelayoutsandrespectivedatesofsepticsystemsatthe sitecouldnotbereliablydeterminedfromsepticpermits providedbyAsheCounty.
Thepropertyownerrecalledthattheslopebehindthe bankbuildinghadfailedin2000,afterwhichtheexisting rock-filledwirebasketretainingwallwasconstructedat thetoeoftheslope.Thesteepslope(remnantscarp)interpretedtocoincidewiththesourceareaofthe2000slope failureisvisiblein2005orthophotographyand2017 LiDARdata(Figure7).Theareaofthe2018debrisslide appearstoincludetheareaofthe2000slopefailure.A propanetanklocatedontheuphillsideoftheretaining
Figure4.Geologistsstandonthetoeofthedebrisslidedepositnear thesouthcornerofthebankbuildingwhereitburiedthedrivethroughlaneanddamagedthetellerwindow.Groundwaterseepage fromtheslidedeposit flowsontothepavement.Viewslookingsouthwest.September18,2018,NCGSphoto.
wall,anddownslopefromtheinferredareaofthe2000 failure,isvisiblein2005,2010,and2014orthophotography(Figure6A).Thepavedareabetweentheretaining wallandthebankbuildingservedasadrive-throughlane forthetellerwindowonthesoutheastsideofthebank.
WarrensvilleislocatedintheBlueRidgePhysiographic ProvinceandwithintheNeoproterozoictoMiddleOrdovicianAsheMetamorphicSuite,consistingofthicksequences ofmetaclasticrocksinterspersedwithamphibolite(metamorphosedbasaltic flowsordikes)andultramaficbodies (possibleophioliticcrust).AsheMetamorphicSuiterocks werecomplexlydeformedandmetamorphosed(upper amphibolitefacies)duringPaleozoicorogenesis(Misra andConte,1991;RaymondandAbbott,1997).Amphibolitewastheonlyrocktypeobservedinthevicinityofthe debrisslide.Thedebrisslideoccurredonnortheast-facing slopeswherethenortheasternextentofThreeTopMountain hasbeendowncutbyBuffaloCreek,atributarytotheNorth ForkNewRiver(Figure1).PeakelevationatthenortheasternextentofThreeTopMountainisapproximately 3,180ft( »969m),andtheelevationnearthetoeofthe slopeatthedebrisslideisapproximately2,700ft ( »823m),resultingin480ft(146m)oftopographic relief.Topographiccontoursindicatethatintermittent stream fl owisprimarilywithinnortheast-drainingdraws tothenorthwestandsoutheastofthedebrisslideandthe septicdrain field(Figure6A).Hillslopesontheinterfluve betweenthesedrainagesareslightlyconvexabovethe debrisslideandgenerallyplanarinthefootslopearea wherethedebrisslideoccurred.
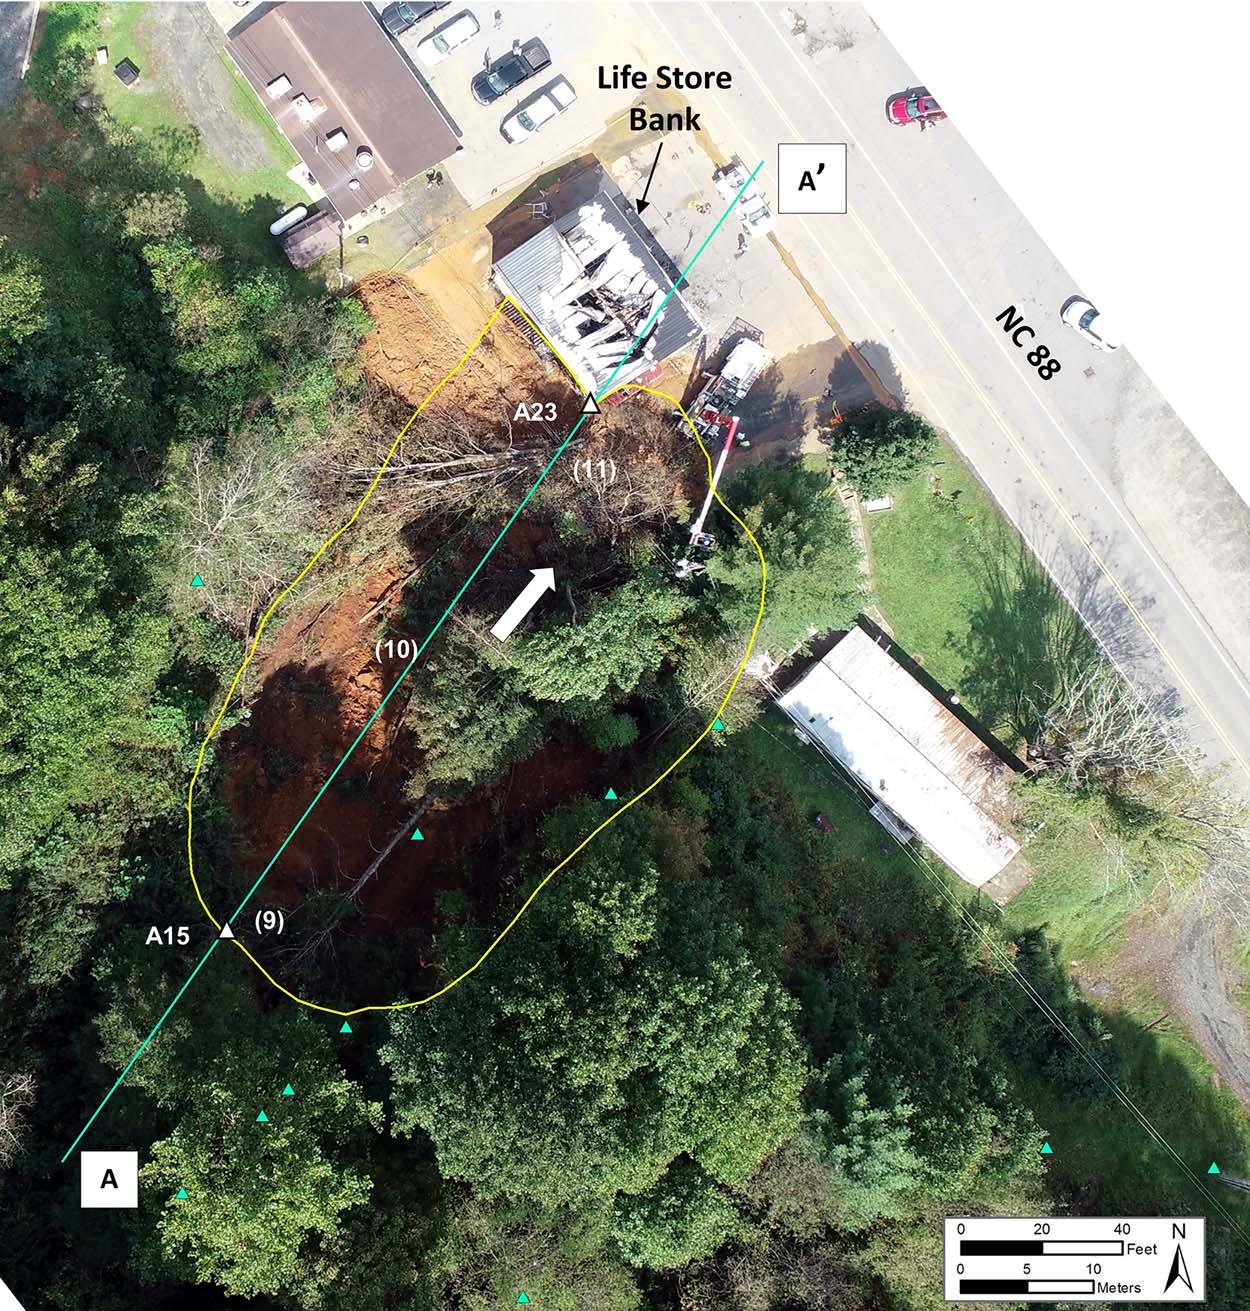
Figure5.AerialviewoftheSeptember18,2018,debrisslideandthedamagedbankbuildinginageoregisteredSeptember19,2018,UASimage. Yellowpolygon ¼ debrisslideoutline;whitearrow ¼ generaldirectionofslidemovement;blue-greenline ¼ locationofcrosssectionA-A 0 ; A15andA23 ¼ cross-sectionreferencestationlocations;blue-greentriangles ¼ otherSeptember19,2018,datapoints.Mappedfeatureswere geospatiallylocatedrelativetoGPSlocationsof fieldpoints,2014orthophotography,andgeoregisteredSeptember18,2018,UASimagery.UAS imageiscourtesyoftheNorthCarolinaCooperativeExtension.NumbersinparenthesesarelocationsforFigures9–11,respectively.Notethe crewwithabuckettruckrepairingutilitylinesdownedbytheslide.
Thepurposeoftheinvestigationdidnotincludea completedamageassessment,anditwasunsafetoenterthe buildingorcloselyinspectitsexteriorforsignsofdamage fromthedebrisslide.Weattributedthefollowingdamageto thebuildingexteriortobefromthedebrisslideimpact (excludingthatcausedby fire):(1)Theslidedebrisburied aportionofthedrive-throughlanebehindthebanktoa depthofapproximately6ft(1.8m)anddamagedthedrivethroughtellerwindow;(2)theslidedebrispushedthegeneratorthroughalowersectionoftherearwall;(3)slideimpact damagedthemetalstairwayinthebackofthebuilding;and (4)andtreesdownedbythedebrisslidepossiblydamaged thebank’sroof.Theseobservationsindicatedthatdirect damagetothebuildingfromthedebrisslideimpactwas likelyreparable;however,theensuing fi reessentially destroyedthebankbuilding.
Theslidedisplacedanddestroyedportionsofthesepticleach fieldbenches(Figures7,8,9,and10).Damaged
remnantsofthesepticsystemcomponentswereobservedin themainscarp(Figure9)andotherareasaffectedbythe debrisslide.Otherdamagefromthedebrisslideincludedthe following:(1)Theslidedebrisovertoppedtheretainingwall behindthebank,whereitseverelydamagedtheupper rock-filledwirebasket;(2)slidedebrisadvancedpastthe southeastsideofthebankbuilding,coveringaportion ofthedrive-throughlaneandparkinglot;(3)utilitypoles weredamaged,andutilitylinesweredowned;(4)ametal outbuildingonanadjacentpropertywaspushedoffits foundationanddamaged;and(5)runoffandgroundwaterdrainagefromtheslideresultedinon-site sedimentation.
UnconsolidatedQuaternaryslopedepositsofunknown agescomprisethecolluvialdepositsfrompastslope movementactivityobservedinandaroundthedebris slide(Figures6A,8,and10),likelyoriginatingfrom soilcreep,debrisslides,anddebris- fl owprocesses.In general,thesedepositsconsistofgravel-toboulder-sized

Figure6.(A)Aerialviewoftheareain2014orthophotographypriortothe2018debrisslidewithbedrockstructuraldataatoutcroplocations. Yellowpolygon ¼ 2018debrisslideoutline.LocationsBandCcorrespondtooutcroplocationsin figurepartsBandC,respectively. TopographiccontourswerederivedfromaLiDARDTMwith6mpixelresolution.Contourinterval ¼ 20ft(6.1m).(B)Amphibolitebedrock outcrop.ArrowpointstoNW-strikingfractureface.Viewlookingsouthwest.(C)Subangularamphibolitebouldersinafootslopedebrisdeposit overlietheamphiboliteoutcropatphotoright.Dashedwhitelineapproximatescontactofamphiboliteoutcropandthedebrisdeposit.Thedebris deposithereconsistsofamphiboliteboulders,cobbles,andgravelandsoilmatrixoriginatingfrompastprehistoric(?)slopemovements.View lookingsouthwest.September19,2018,NCGSphotos.

Figure7.Groundslopeoftheareasuperimposedontoashadedreliefmapderivedfroma0.5m2017LiDARDTMshowingpre-2018slideslope conditions.Yellowarrows ¼ generalmovementdirectionsofthe2000and2018slopefailures.The2017LiDARDTMbecameavailablein 2019,afterthe2018debrisslideinvestigationandresponse.
amphiboliterockfragmentsinvariousweatheringstates intermixedwithsoilmatrixrangingfromclayey,sandysilt tosiltysand.Proportionsofsoilmatrixrelativetorockfragmentsvary,resultinginmatrix-supportedandclast-supported soiltextures.Briefdescriptionsofthethreecolluvialsoilunits encounteredintheimmediatevicinityofthedebrisslideare givenongeologiccrosssectionA-A0 (Figure8).Exposures ofin-placebedrockwerenotobservedwithintheperimeter
oftheslide,indicatingthattheslidemassdidnotinvolve,or expose,in-placebedrock.Althoughtheagesofthesedeposits areunknown,thebrowntoyellowMunsellhueand claycontentofthelowercolluvialunitsuggestitmay beasoldasLatetoMiddlePleistocene(MillsandAllison, 1995;Mills,2005)andanalogoustosimilardepositsderived fromamphiboliteoftheAsheMetamorphicSuiteinneighboringWataugaCounty(Mills,1998).
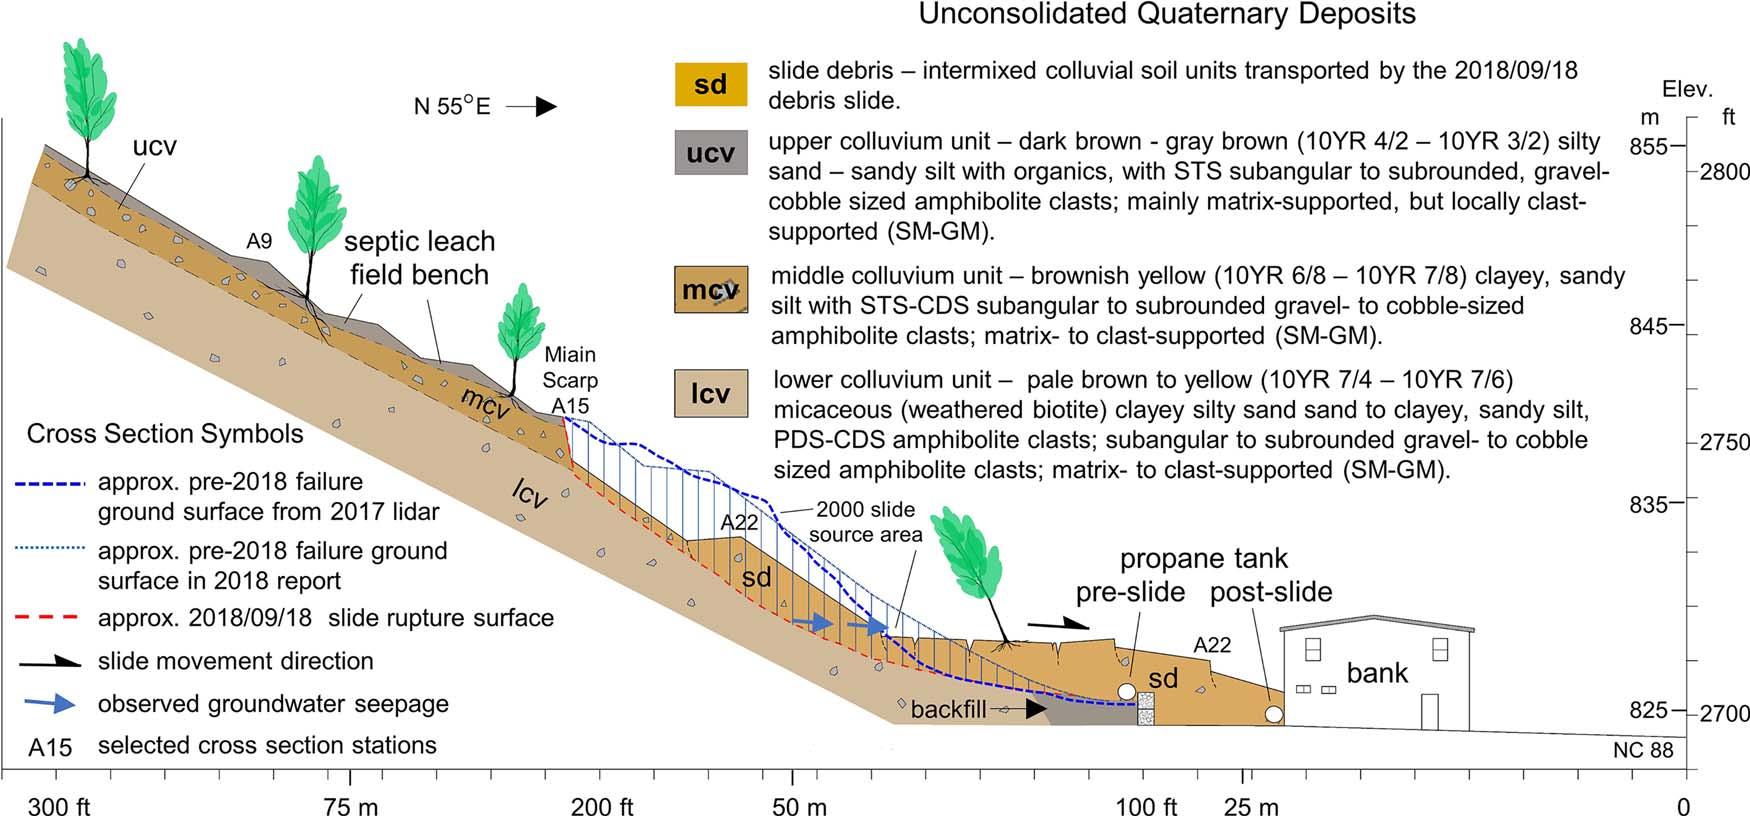
Figure8.Schematicgeologiccross-sectionA-A 0 throughtheSeptember18,2018,debrisslidemeasuredonSeptember19,2018.SeeFigures5, 7,9,and10forcross-sectionlocations.Survey:clothtape,Bruntoncompass,clinometer,GPS-equipped fieldcomputer;supplementedbya LiDARDTMwith6mpixelresolution.Note:Thepre-2018failuregroundsurfacederivedfromthe2017LiDAR(seeFigure9)updatesthepre2018failuregroundsurfaceestimatedinthe fieldasshownintheoriginal2018report.Alldistances,elevations,andlocationsofgeologicunits areapproximate.SoilclassificationisingeneralaccordancewithAmericanSocietyforTestingandMaterials(2002).Rockclastweathering descriptors:STS ¼ stainedstate;PDS ¼ partlydecomposedstate;CDS ¼ completelydecomposedstate(fromWilliamson,1984).
TheNationalResourcesConservationService(NRCS) SoilSurveyGeographicDatabase(SSURGO)(NRCS, 2023)showsEvardstonyloam(Esf)withintheEvardsoil seriesmappedinthesourceareaofthedebrisslide.The overallparentmaterialorigingivenfortheEvardseriesis felsictomafic,igneous,andhigh-grademetamorphicrocks, suchasmicagneiss,hornblendegneiss,andamphibolite.Amphiboliteistheprimaryparentmaterialforthe soilobservedintheareaofthedebrisslide.
Bedrockoutcropsobservedbothupslopeandalong aroadcuttothesoutheastofthedebrisslideconsist of fi nelylayered,shearedamphiboliteoftheAshe MetamorphicSuite(Figure7).Weatheringproducts oftheamphibolitebedrockarethesourceofthecolluvialsoildepositsdiscusseda bove.Theorientation ofthestrikeoflayering(foliationandmyloniticfoliation)isgenerallyNEwithdipsthatrangefrom43° to72°towardtheSE.Withdipdirectionsnearly90° fromtheNEdirectionofslidemovement,foliationis notfavorablyorientedtoactasslope-parallelslide planes.Joints(fractures)withintherocksoccurpredominantlyintwosets.OnesetstrikesWSWwith dipsaround30°towardtheNW,anditisunfavorably orientedtofacilitateNE-directedslidemovement.A secondsetstrikesNNWanddipsaround80°toward theNE,anorientationfavorableforrockblockstodetach andaccumulateinthedownslopedebrisdepositspresent atthesite.
Wedidnotobservesurfacewater flowingintothe landslidearea.Smallerosiongulliesfrompriorsurface runoffwerepresent,butnotinareasthatappearedto
draindirectlyintothedebrisslide.Thepropertyowner hadreportedthatarockcliffupslopefromthedebris slide “hadwaterconstantlyrunningoutofit.” Wedid notobservewater flowingfromarockslope,but field traversesmaynothavecoveredthatlocation.
FieldmappingandgeoregisteredUASimageryindicate theareaofthedebrisslideencompassesabout15,000ft2 (»1,400m2).Thein-placevolumeofearthmaterialon thehillsidebeforetheslidemoved,andsubsequently involvedintheslide,wasestimatedtobeontheorderof 3,700yd3 to4,200yd3 (2,829–3,211m3).Themaximum lengthoftheslidefromthemainscarptothetoeofthe slidedebrisdepositwas »175ft(53m),withamaximum widthof »105ft(32m).Anominalgroundslopeof approximately30°sestimatedforthepre-failuredebris slideuppersourcearea.Thegroundsurfaceprofilederived fromthe2017LiDARDTMupdatedthepre-2018failure groundsurfaceestimatedinthe fieldasshowninthe2018 report(Figure8).The2017groundprofilerevealedanominalgroundslopeofabout45°inthe2000slidesource area(Figure10).
Thedisplacedmassofthedebrisslide(slidedebris) wasmadeupofintermixedcolluvialslopedepositsfrom pastslopemovementactivity,designatedhereastheupper, middle,andlowercolluvialunitsoncrosssectionA-A 0 (Figures8 –10).Themiddlecolluviumunitappeared tocomprisethebulkofthedisplacedmass.Aportion ofthesliderupturesurfacecoincidedroughlywiththe
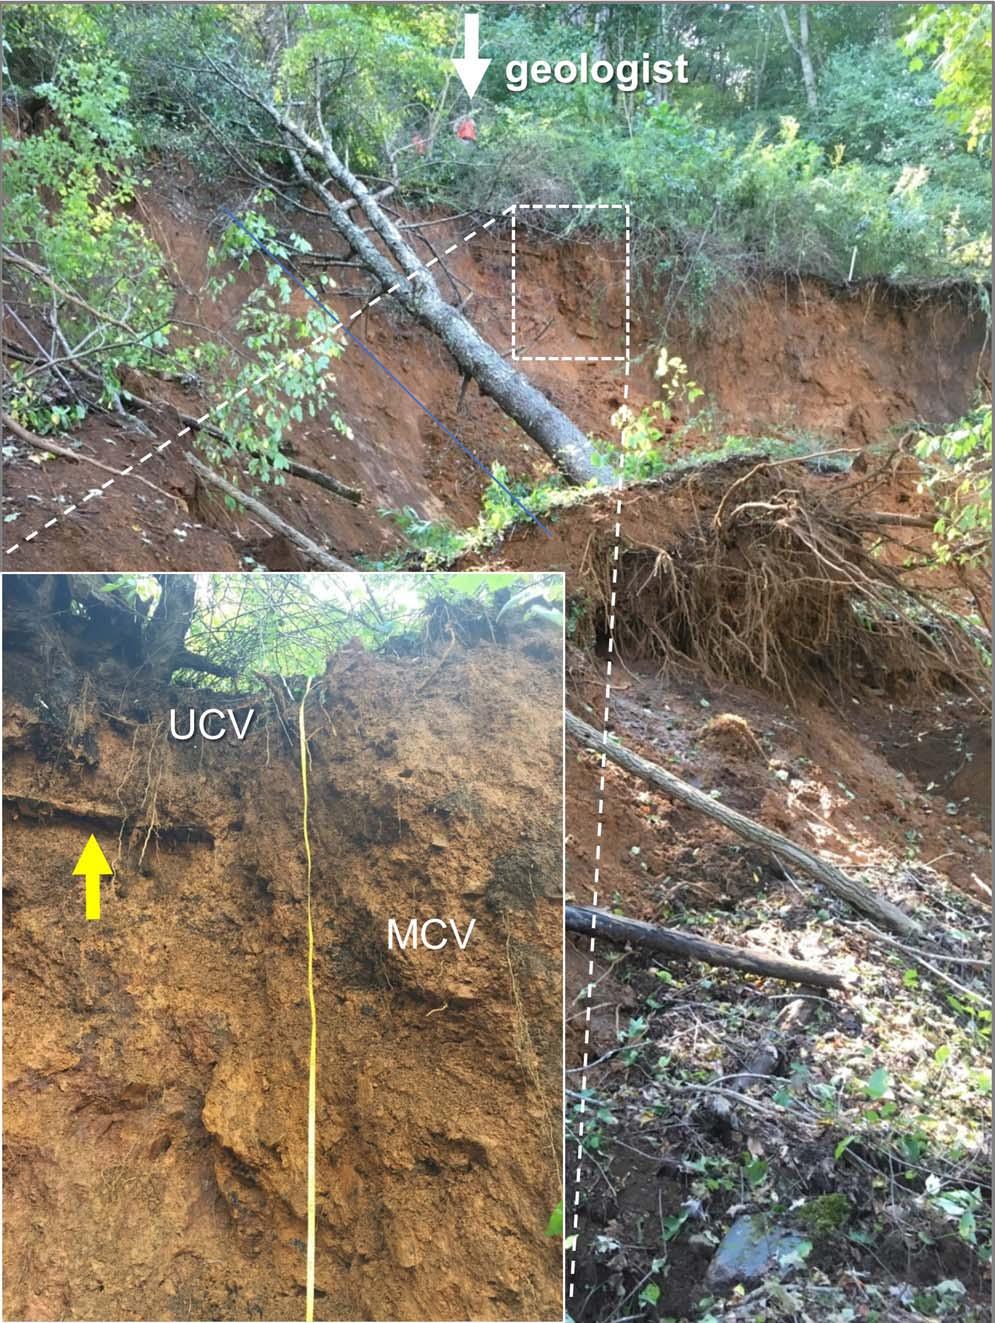
Figure9.Viewofthemainscarpofthedebrisslidealongcross-sectionA-A 0 .Inset:Viewoftheupper(UCV)andmiddlecolluvium (MCV)unitsexposedinthemainscarp.Weatheredamphibolite clastsprojectfromthescarpsurface.Yellowarrowpointstodamagedremnantsofthesepticsysteminfiltrationchamber.Measuring tapeis0.5in.(1.3cm)wideforscale.Viewlookingsouthwest. September19,2018.NCGSphotos.Location9inFigure5.
contactbetweenthemiddleanduppercolluvialunits.
Curvedtreesonthedisplacedslidemassprovidedevidence thatsomeoftheslopewas,orhadbeen,undergoingslow movement(creep)priortotheestimatedrapidtoveryrapid movement(»ft/stom/srates)onSeptember18(Figure11).
Curvedtreespresentontheslopesadjacenttothe2018slide alsoindicatedpastand/orongoingsoilcreep;however, obviousscarpsortensioncracksbeyondtheimmediate perimeterofthe2018slideareawerenotobserved.Indicationsofunequivocalprecursorscarpsorotherground-displacementfeatures(e.g.,displacedsepticinfi ltration benches)werenotevidentonthe2017LiDARDTM upslopefromtheinferredsourceareaofthe2000slope failure(Figure7).
Moistsoilwaspresentintheportionsofthemain scarpthatexposedremnantsofthesepticleach field.We didnotdetectactiveseepageorsepticodorsinthese areas,althoughtheabsenceofodoralonedoesnotprecludetheinfluenceofsepticwaterontheslide.Seriesof groundwaterdischargeareaswereactiveinazonenear
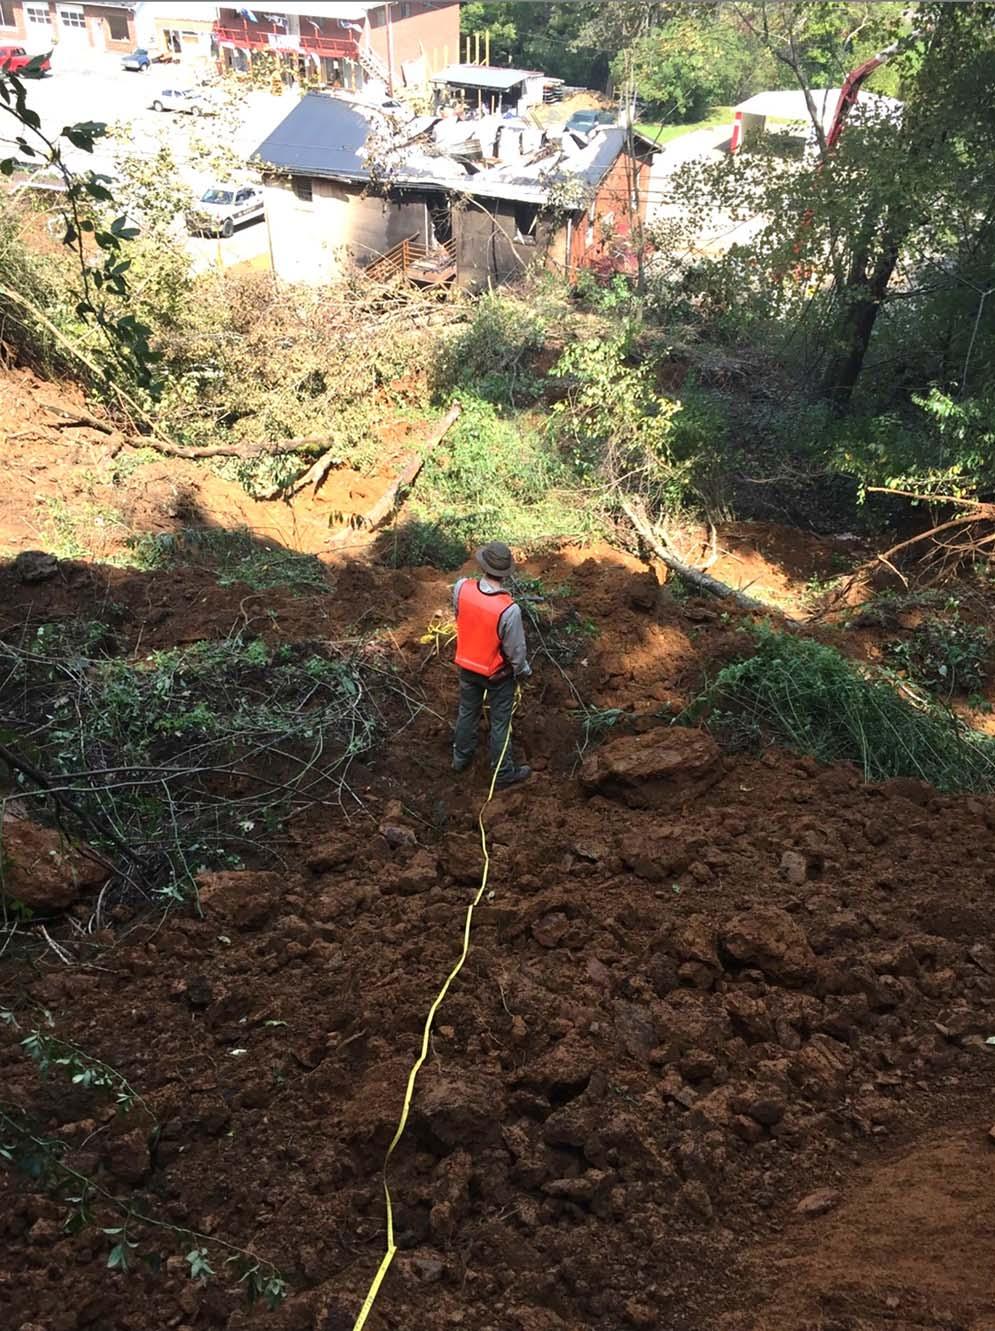
Figure10.Viewlookingdownslopealongcross-sectionA-A 0 toward thedestroyedbankbuilding.Geologistisstandingonslidedebris. Viewlookingnortheast.September19,2018,NCGSphoto.Location 10inFigure5.
themiddleofthedebrisslidedownslopefromstation A22oncrosssectionA-A 0 (Figure8).Seepagealsocontinuedfromthetoeofthedebrisslidedepositinthearea excavatedtoremovethepropanetank,andfromthetoe oftheslide(Figure4).Septicodorswerenotdetectedin theseseepageareas.
TheNationalWeatherService,Blacksburg,VA,Weather ForecastOfficeprovidedrainfalldatatodocumenttheprecipitationconditionspriortotheSeptember18,2018,debris slide.Recordabove-normalrainfallbeganinMay2018with asharpincreaseinAugustthatresultedintheareabeing 13.3in.(»334mm)abovenormalwithelevatedmoisture conditionspriortothepassageoftheremnantsofHurricane FlorenceonSeptember15–18,2018(Figure12).
SoutheastofWarrensville »260mi(»418km),HurricaneFlorenceproducedhistoricamountsofrainfallofup to30to50in.(762–1,270mm)alongcoastalandinland areasofNorthandSouthCarolina(Figure13),resulting inrecordpeakstreamflowsandcatastrophic floodingin theseareas(Feasteretal.,2018).Hadtheheaviestrainfall
Wooten,Cattanach,Bozdog,andIsard
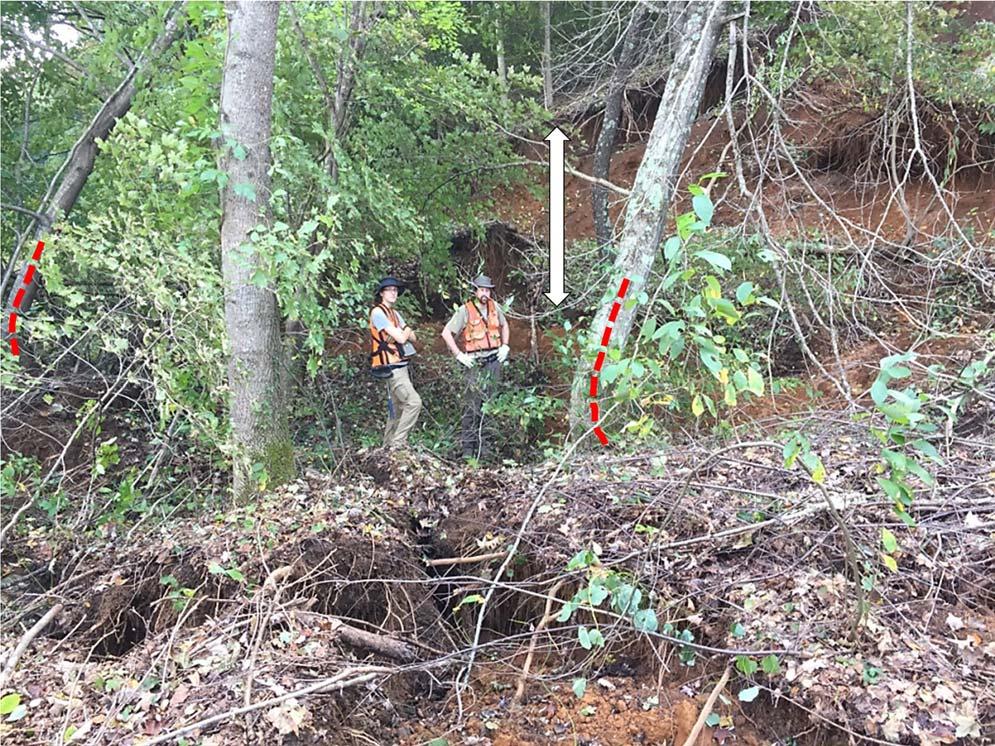
Figure11.Geologistsstandonslidedepositblockscomprisedofsoil androotmatnearthetoeofthedebrisslide.Curvedtrees(reddashed lines)transportedbythedebrisslideareevidenceofslopecreepprior totheSeptember18,2018,debrisslide.Doublewhitearrowindicates verticaldisplacementalongtheright(southeast)lateralscarpofthe debrisslide.Viewlookingsoutheast,downslopetotheleft. September19,2018,NCGSphoto.Location11inFigure5.
impactedwesternNorthCarolina,theremostcertainly wouldhavebeenhistoriclevelsof floodingandlandslides intheBlueRidgeMountains,perhapsevensurpassingthe levelsofdamagefromthe1916and1940tropicalcyclones (Wootenetal.,2016).
The3dayrainfalltotalsfromHurricaneFlorenceand latershowersendingTuesdaymorningonSeptember18, 2018,recordedatthreeraingaugestationsnearWarrensville(Figure14)areasfollows:5.0in.(127mm)atClifton,NC;4.64in.(»118mm)atLansing,NC;and8.09 in.(»206mm)attheAsheCountyAirport(KGEV),inJefferson,NC.ThebulkoftherainfallfromFlorencerecorded atthesestationsbeganthemorningofSeptember15and diminishedintheearlyhoursofSeptember17,subsiding approximately33to39hourspriortothe911callreporting thedebrisslideat3:03p.m.(15:03hours)onSeptember18. LocallyheavyshowerspassedovertheWarrensvilleareaon theeveningofSeptember17,withrainfallextendinginto theearlymorninghoursofSeptember18.Althoughrainfall hadceased »9to10.5hoursbeforethedebrisslide(Figure 15),groundwaterdischargecontinuedfromthetoeofthe debrisslide(Figure4)andatseverallocationsat,ornear, theexposedrupturesurfaceoftheslide(Figure8),indicatingpost-stormdrainageoftheslope.
OurreporttotheAsheCountyEmergencyManagement Department(Wootenetal.,2018)madethefollowinggeneral findings.(1)TheSeptember18,2018,debrisslidewas likelytriggered(induced)byrainfallfromtheremnantsof HurricaneFlorencecoupledwiththeabove-normalrainfall forAugust.(2)Thepropanetankwasinavulnerable
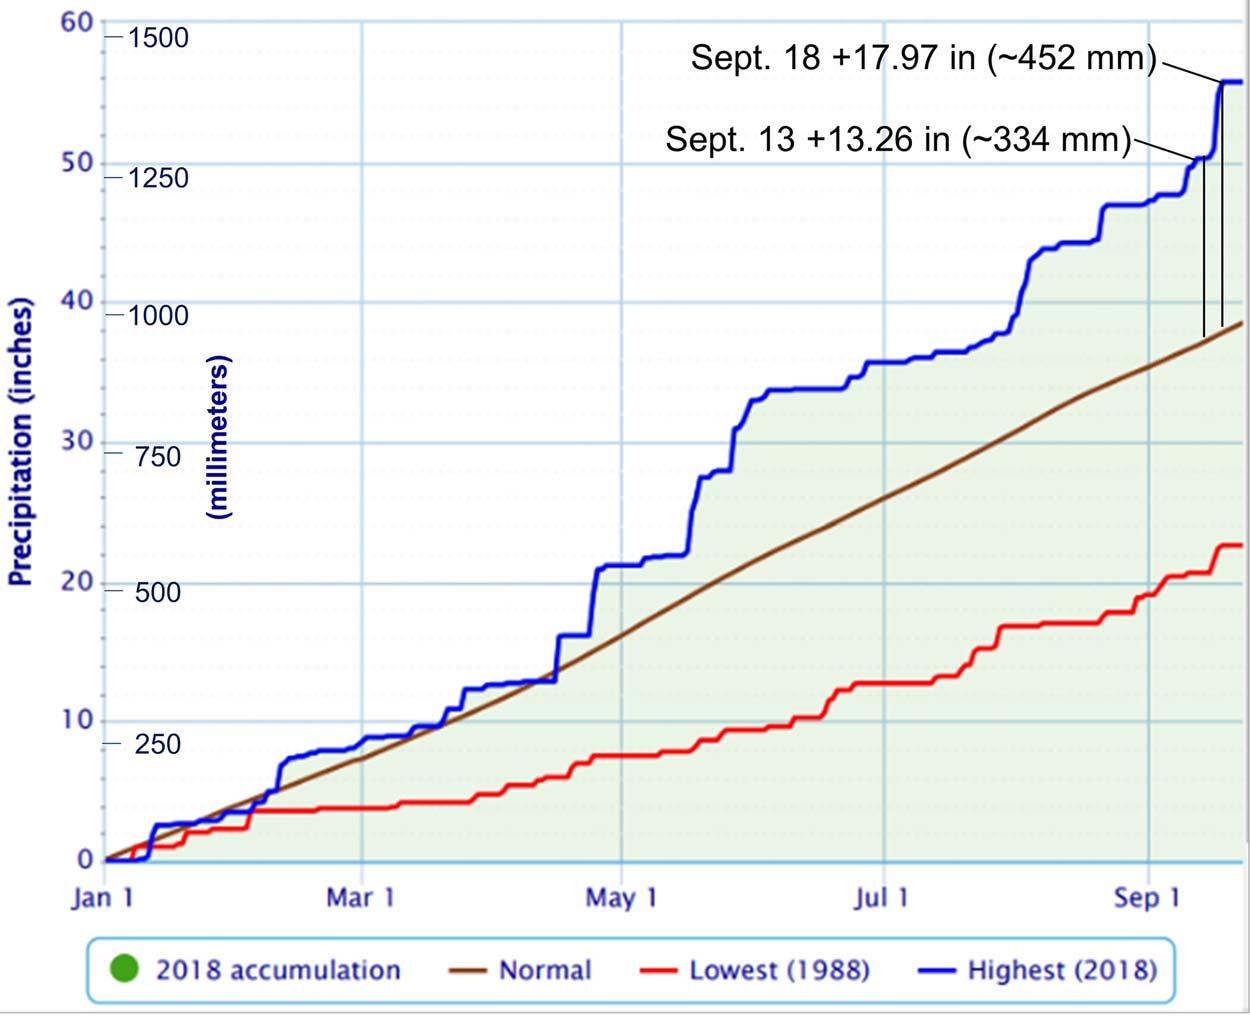
Figure12.Chartofrainfallaccumulation(in./mm)anddeparturefromnormalforJanuary1toSeptember30,2018,showingrecordrainfallfor thistimeintervalatraingaugeJefferson2E,NC.Recordedabove-normalvaluesareshownforSeptember13,2018,priortorainfallfrom HurricaneFlorence,andforSeptember18,2018,withrainfallfromHurricaneFlorencerainfallpriortothedebrisslide.RefertoFigure14for raingaugestationlocation.Datasource:NationalOceanicandAtmosphericAdministration(NOAA)OnlineWeatherData(NOWData), https:// www.weather.gov/wrh/Climate?wfo¼rnk ,accessedSeptember6,2023.
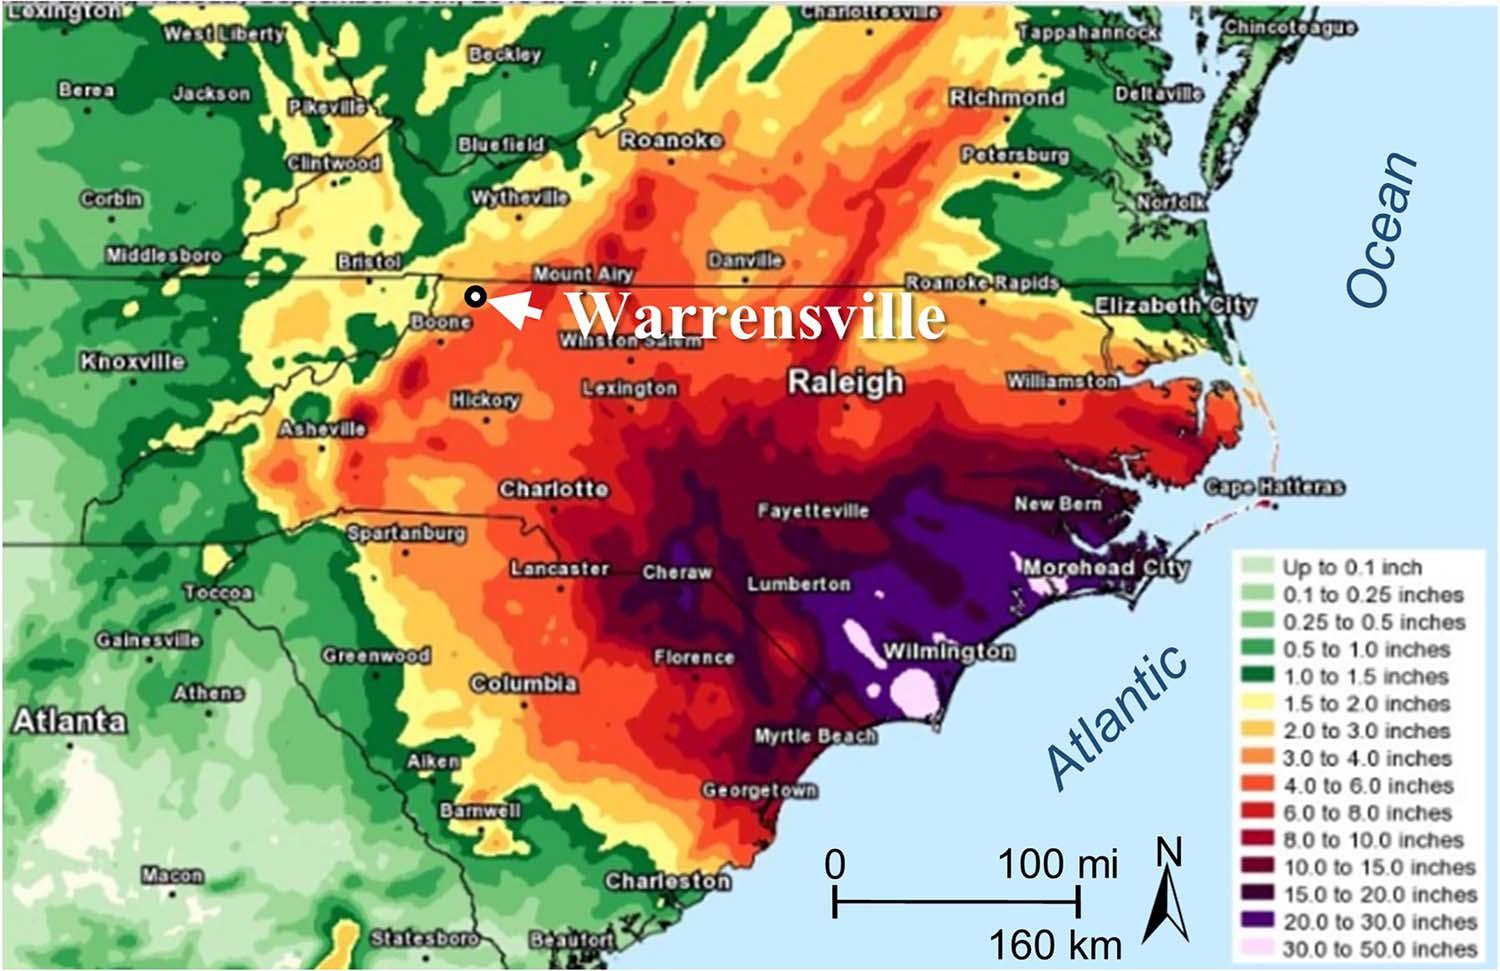
Figure13.ObservedprecipitationtotalsfromHurricaneFlorenceendingTuesdayat2:00p.m.EDT,September18,2018.Multi-sensorrainfall estimateswereproducedbytheNOAA-NWS,EasternRegionHeadquarters.
locationupslopeoftheretainingwallbetweenanunstable slopeandthebuilding.Hadthepropanetanknotbeen involvedinthedebrisslide,thendamagetothebuilding fromthedebrisslideprobablywouldhavebeenreparable. (3)Thescarpareasoftheslideareover-steepenedandare consideredunstable;therefore,thescarpsandslopesadjacenttothemaresubjecttofutureslopefailures.(4)The debrisslidedepositconsistsofloose,unstablematerial, especiallywhenthewatercontentofthedepositiselevatedsuchasfromgroundwaterdischarge,rainfallinfiltration,andsurfacewaterrunofffromupslopeareas.(5)The fieldreconnaissancedidnotrevealanysignsofimpending slopeinstabilityabovethebuildingsontheadjacentproperties.Curvedtreesobservedontheslopesadjacenttothe slide,however,indicatedpastorongoingsoilcreep.Slope modificationstotheseareascouldincreasethepotential forfutureslopefailures.
Basedontheinvestigationand findings,the2018report madethefollowingrecommendations.(Notethatagency policyrequiresthatNCGSgeologistsdonotmakespecific engineeringrecommendationstostabilizeormitigateunstableslopes;inthesecases,stakeholdersarereferredtoqualifiedgeotechnicalengineers.)(1)Involvementofaqualified engineertoadvisedemolitionofthebankbuildingisrecommended.Loadsfromtheslidedebristhatremainagainstthe buildingcouldresultinshiftingandaffecthowthebuilding collapsesduringdemolition.Workingbetweentheslide debrisandthebuildingcouldbehazardous,especiallyifthe slidematerialiswet.(2)Theslopesaffectedbythedebris slideareover-steepenedandunstableandcouldposeathreat topublicsafety,particularlyduringorafterperiodsofheavy
rainfall.Theslopesshouldbestabilized,orthehazard shouldbemitigatedinsomeway,undertheguidanceofa qualifiedgeotechnicalengineer.(3)Ahazardmitigation effortshouldinvolveaslopestabilityanalysisbyaqualifiedgeotechnicalengineer.Iftheuseoftheleach fieldfor septicsystemistobecontinued,thenthehydrologicand slopemodificationeffectsofthesepticsystemshouldbe incorporatedintothestabilityanalysis.(4)Continueduse oftheexistingleach fieldforthesepticsystemshouldbe certifiedbyaqualifiedenvironmentalhealthprofessional. (5)Slopesintheareaofthedebrisslideshouldbemonitoredforanyindicationsoffurthermovementorinstability.
AlthoughtheNCGSuseslimitequilibrium–basedslope stabilitymodelsforcounty-widedebris-flowsusceptibility modeling(Baueretal.,2012;Wootenetal.,2016),sitespecificslopestabilityanalysesarebeyondthescopeand resourcesoftheNCGS’slandslideresponsefunctions. Thiscasestudy,however,presentsanopportunityforaretrospectivestabilityanalysis.Intheabsenceofsoiltestdata andgroundwatermonitoringdataforthesite,ouranalysis aimstoconstrainsiteparametersatthetimeoffailure andtoprovideaconceptualframeworkforsimilarconditionsinhillslopesunderlainbycolluvium.
Weevaluatedthestabilityoftheslopeusingacomputer programthatutilizesthemethodsoflimitequilibriumanalysespresentedbyMorgensternandPrice(1965)andsimplifiedversionofBishop(1955).Wemodeledtwoslope stabilityscenarios:onedepictingconditionsafterthe2000
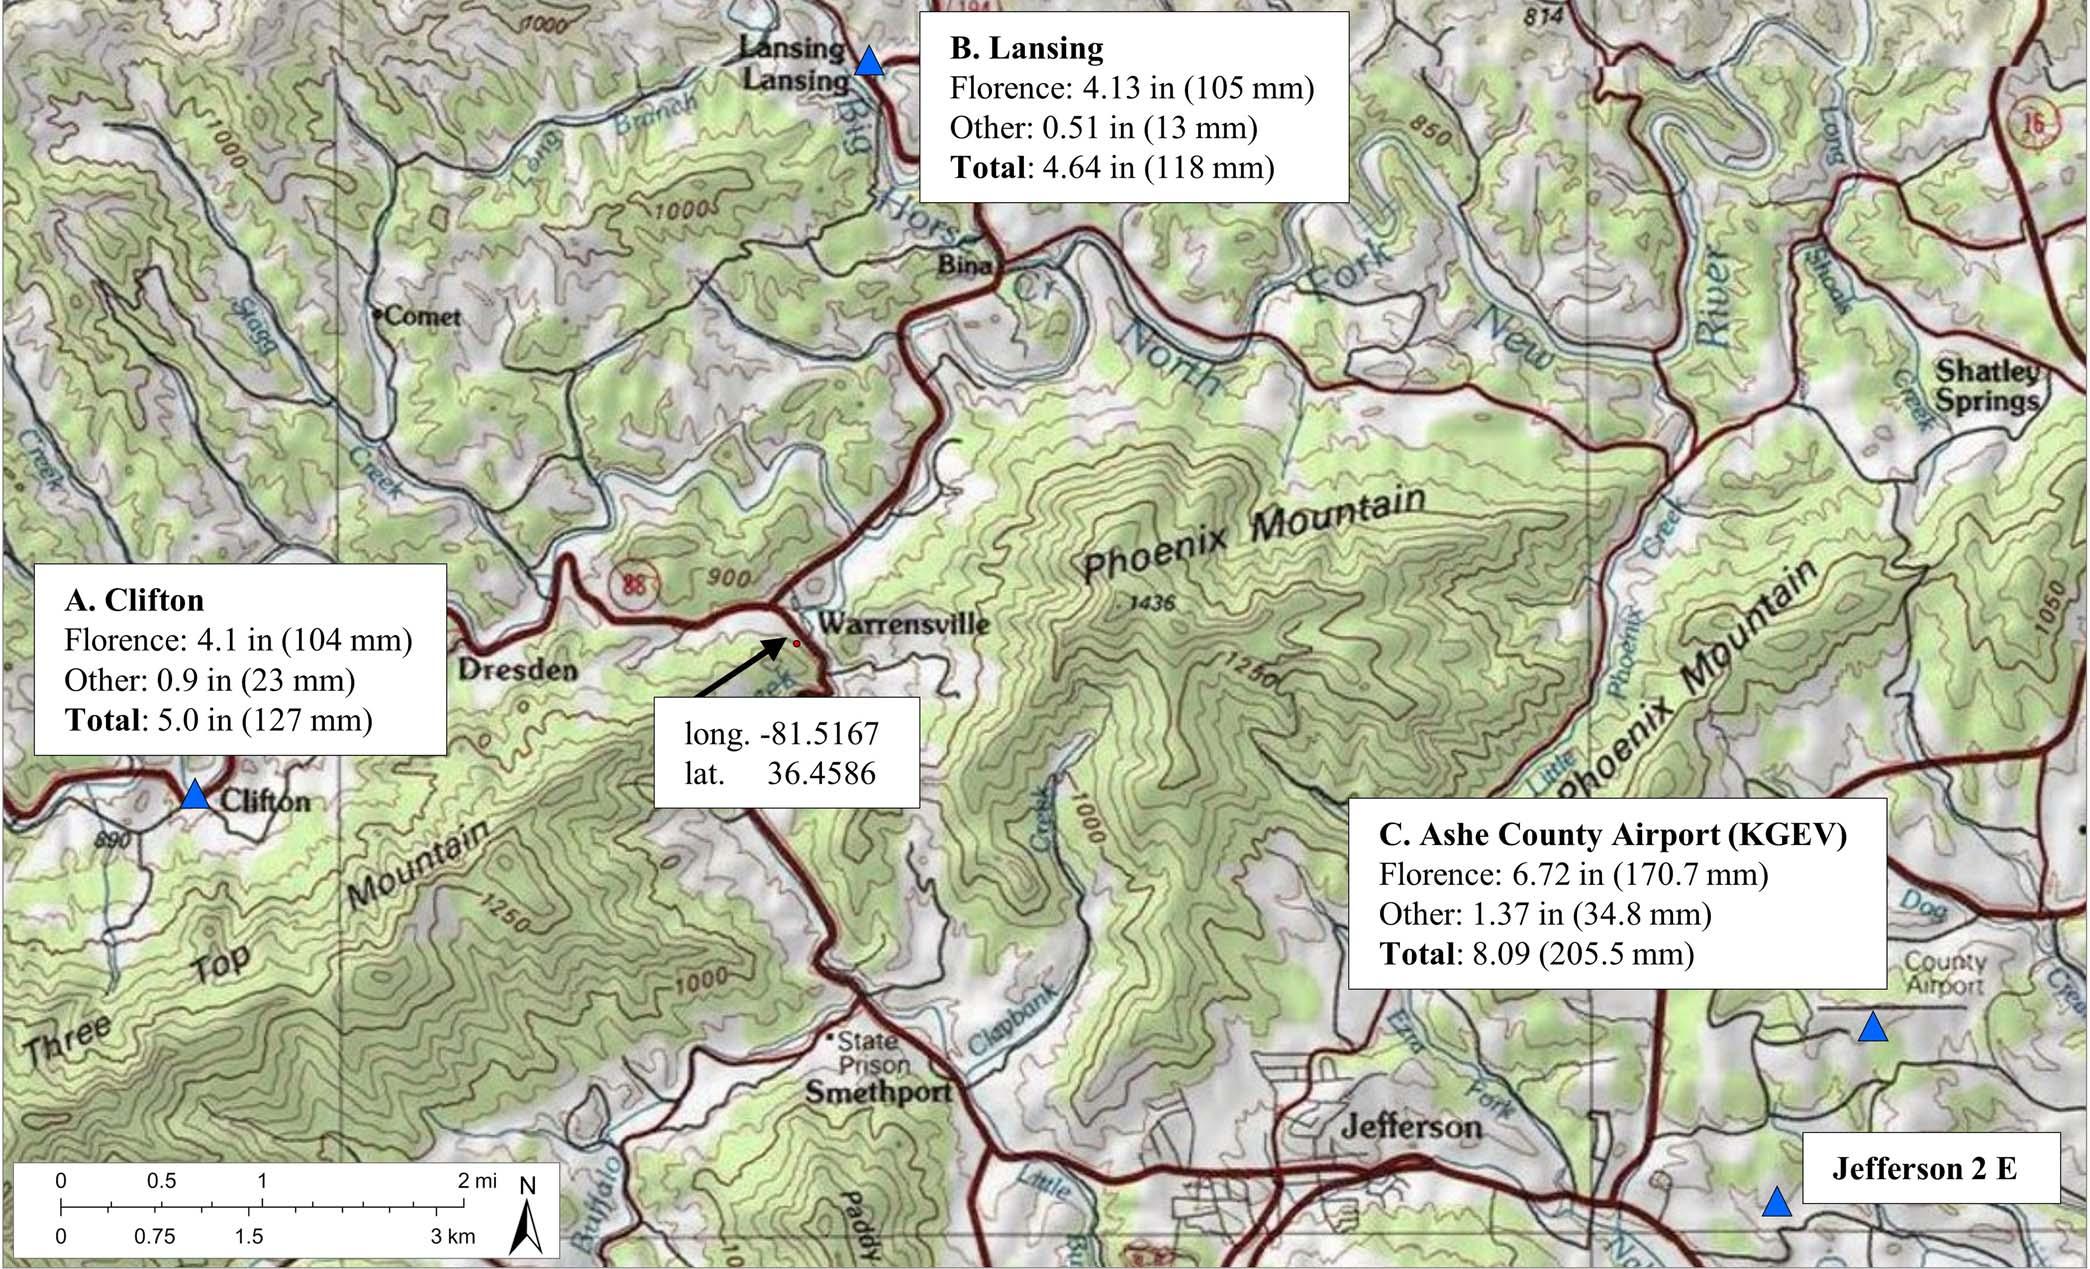
Figure14.MapofraingaugestationlocationsneartheWarrensvilledebrisslide.Rainfalltotalsgivenforeachstationareforthebulkofrainfall fromHurricaneFlorenceandsubsequentrainfallprecedingtheSeptember18,2018,debrisslide.RefertoFigure12fortheJefferson2Erainfall datachartandFigure15fortheClifton,Lansing,andAsheCountyAirportrainfalldatacharts.Mapcontourinterval ¼ 50m.
failurebutpriortothe2018debrisslide,andonerepresentingconditionsatthetimeofthe2018debrisslide. The fi eld-developedcrosssection(Figure8)servedas thegeologicconceptualmodelusedtode fi nematerials andtheirdistributionsfortheanalyses.Weusedthe2017 LiDARDTM(Figure7)toapproximatetheslopeprofile afterthe2000slopefailureintheareaaffectedbythe2018 debrisslide.Weperformedaback-calculationanalysisof soilshearstrengthbyvaryingstrengthparameterstoarrive atarepresentativemodelofmetastableconditionsinthe over-steepenedslopesafterthe2000failurewithnomodeledphreaticsurface.Wethenappliedaphreaticsurfaceto thismodeltoproduceinstability(i.e.,afactorofsafetyof 0.99)andrepresenttheslopefailureconditionsin2018.
Table1summarizesthematerialpropertiesusedin theanalyses.Tosimplifytheanalysis,wecombinedthe upperandmiddlecolluvialsoilunitsintheslopestability modelandarrivedataneffectivefrictionangleof32°and aneffectivecohesionof100lb/ft3 (4.8kPa)toaccountfor rootreinforcementonthemixedforestslopewithshrubs andgrasses.Forthelowercolluvialunit,wearrivedatan effectivefrictionangleof34°andnocohesion.Halesetal. (2009)reportedameanvalueof159lb/ft3 (7.61kPa)for rootcohesionmeasuredintestpitswithmixedforestspecies intheNorthCarolinaBlueRidge;however,rootbiomass androotcohesionvaluesgenerallydecreasetolessthan125 lb/ft3 (6kPa)inthedepthrangeof1.3to3.6ft(0.4–1.1m) andarenegligibleatdepthsof5.25ft(1.6m).Thus,root reinforcementwasconsideredbeinconsequentialinthe lowercolluvialunit,whichisgenerallyatdepthsgreater than8ft(2.4m).Forcompleteness,weassignedmaterial propertiesfortherockandwirebasketretainingwalland amphibolitebedrock;however,varyingthesepropertieshad noeffectontheresultsofthestabilityanalysis.
Weconstrainedthecirculararcfailuresurfaceusedin themodelwiththreepointsdeterminedfrom field
Tohelpconstrainestimatesofstrengthparametersfor thecolluvialsoilunitsusedintheback-calculationanalysis,wereliedonshearstrengthvaluesandunitweightsfor colluviumfromdebris-flowsourceareasandhillslopehollowsfrom13sitesintheNorthCarolinaBlueRidgethat weredeterminedfromconsolidatedundrainedtriaxialtestingofShelbytubesamples.Testvaluesforeffectivefrictionangles(ueff)rangedfrom29°to39°.Colluviumwas generallycohesionless;however,wherepresent,effective soilcohesion(Ceff)rangedfromto20to144lb/ft2 (0.96to 6.9kPa).Publishedvaluesofthesesoiltestdataaregiven inWootenetal.(2012)andHalesetal.(2009).
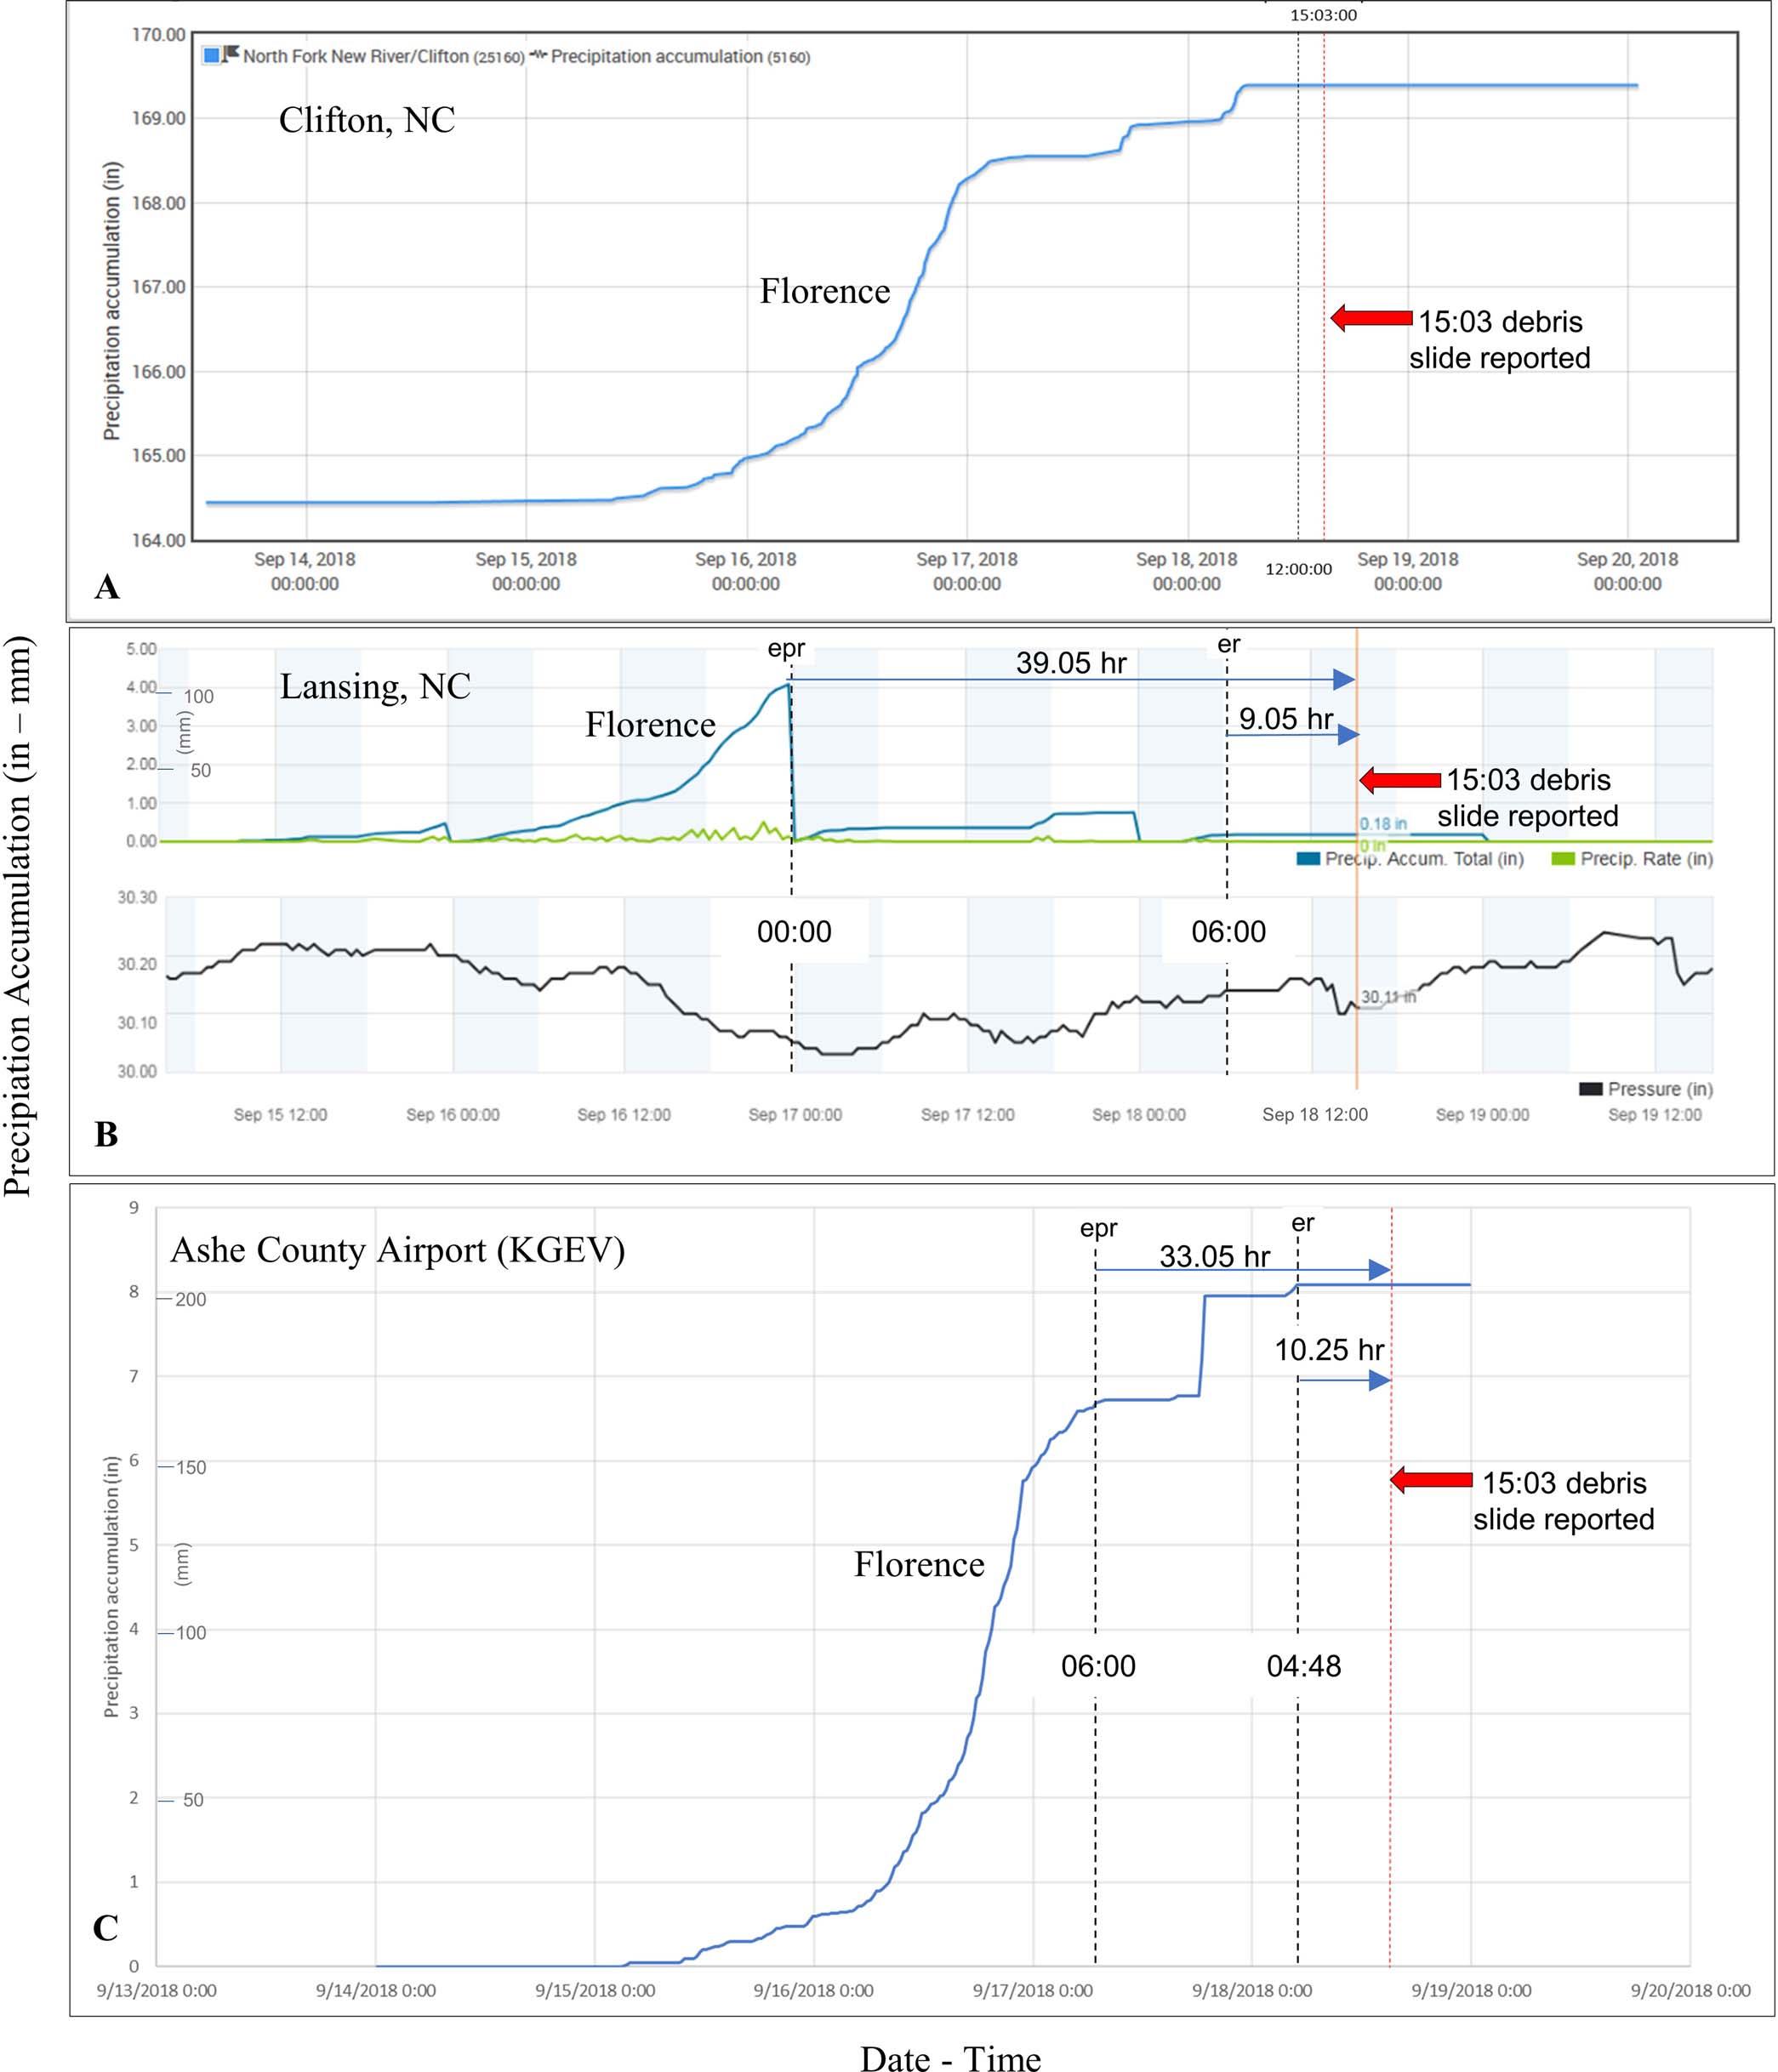
Figure15.Cumulativerainfall(in./mm)chartsforHurricaneFlorenceandafterwardsthatprecededtheSeptember18,2018,debrisslideatstation locationsnearWarrensvilleshowninFigure14.Redarrowspointtothetimemarkerlineat3:03p.m.(15:03hours)onSeptember18,2018,whenthe debrisslidewasreportedtoAsheCountyEmergencyManagementdispatch.Approximatetimes(hours)fromtheendofpeakrainfall(epr)andtheendof rainfall(er)thatprecededthedebris flowareshownforeachstation.(A)Clifton,NC.(B)Lansing,NC. https://wunderground.com,accessedSeptember 2018.(C)AsheCountyAirport(KGEV),NC. https://mesonet.agron.iastate.edu,accessedNovember2023.Dataanddatasourcesarecourtesyofthe NOAA-NWSWeatherForecastOffice,Blacksburg,VA.
Material
Table1. Summaryofmaterialpropertiesusedintheslopestabilityanalyses.
Effective Cohesion, Ceff
EffectiveFriction Angle, ueff (degrees)
MoistUnitWeight, cmoist (lb/ft3)
SaturatedUnitWeight, csat (lb/ft3)
1.Rock-filledwirebasketretainingwall035°(sliding)130(20.42kN/m3)__
2.Upper-middlecolluvialsoilunits100lb/ft3 (4.8kPa)32°90(14.14kN/m3)110(17.28kN/m3)
3.Lowercolluvialsoilunit034°95(14.92kN/m3)122(19.16kN/m3)
4.Amphibolitebedrock040°(planardiscontinuity)180(28.3kN/m3)__
observationsportrayedinthe field-developedcrosssection. Thephreaticsurfaceappliedinthemodeltoproduceinstabilitywassetslightlyabovethecontactbetweenthelower andmiddlecolluvialunits,whichcoincidedwithourobservationsofgroundwaterdischargeatornearthiscontact.
Theresultsofthestabilityanalysesarepresentedin Figure16.Afactorofsafetyof1.126representsmarginallystableconditionswithmoistsoilconditions,withno appliedphreaticsurface(Figure16A).Theadditionof themodeledphreaticsurfaceproducedafactorofsafety of0.996,whichdepictsfailureconditionsforthe2018 debrisslide(Figure16B).
Rainfallhaslongbeenrecognizedasatriggeringmechanismforlandslidesworldwide(Wieczorek,1987;Polemio andPetrucci,2000,andreferencestherein)includingthe southernAppalachianhighlands(Wieczoreketal.,2004; Wootenetal.,2016,andreferencestherein).Weconclude thattheSeptember18,2018,debrisslidewaslikelytriggered(induced)byrainfallfromtheremnantsofHurricane Florencecoupledwithabove-normalrainfallforthearea beginninginMay2018thatledtoelevatedantecedentsoil moistureconditions(Figure12).Thesharpincreasein
above-normalrainfallduringAugust2018waslikelya compoundingfactor.StudiesinwesternNorthCarolina haveshownthatduringperiodsofextendedrainfall,lag timesinexcessof30dayscanberelevanttomoisture conditioningofsoilpriortoalandslide-triggeringrainfall event(Nippgenetal.,2016;Milleretal.,2019).
AlthoughmostofmountainouswesternNorthCarolina receivedrainfallfromHurricaneFlorence(Figure13),and theregionhadalreadyexperiencedabove-normalrainfall, nolandslidesrelatedtoHurricaneFlorenceotherthanthe Warrensvilledebrisslidehavebeendocumentedbythe NCGS.Presumably,therequisiterainfallthresholdswere notattainedtoproducenumerousslopefailures,asinother stormeventsinwesternNorthCarolina(Wootenetal.,2017, 2022;Milleretal.,2021a,2021b).Althoughpeakrainfall fromHurricaneFlorencerecordedattheAsheCountyairportwasapproximately5in.(127mm)over18hours,which exceededthegeneralthresholdof5in.over24hoursused asarule-of-thumbestimateforlandslide-triggeringrainfall inwesternNorthCarolina(EschnerandPatrick,1982;Wootenetal.,2007),theCliftonandLansingstationsfellbelow thisthresholdatapproximately5in.(127mm)and4.25in. (108mm)over24hours,respectively.The2000and2018 Warrensvilleslopefailuresinvolvedanexcavatedslope,and insomecases,rainfallthresholdsneededtoinducefailures
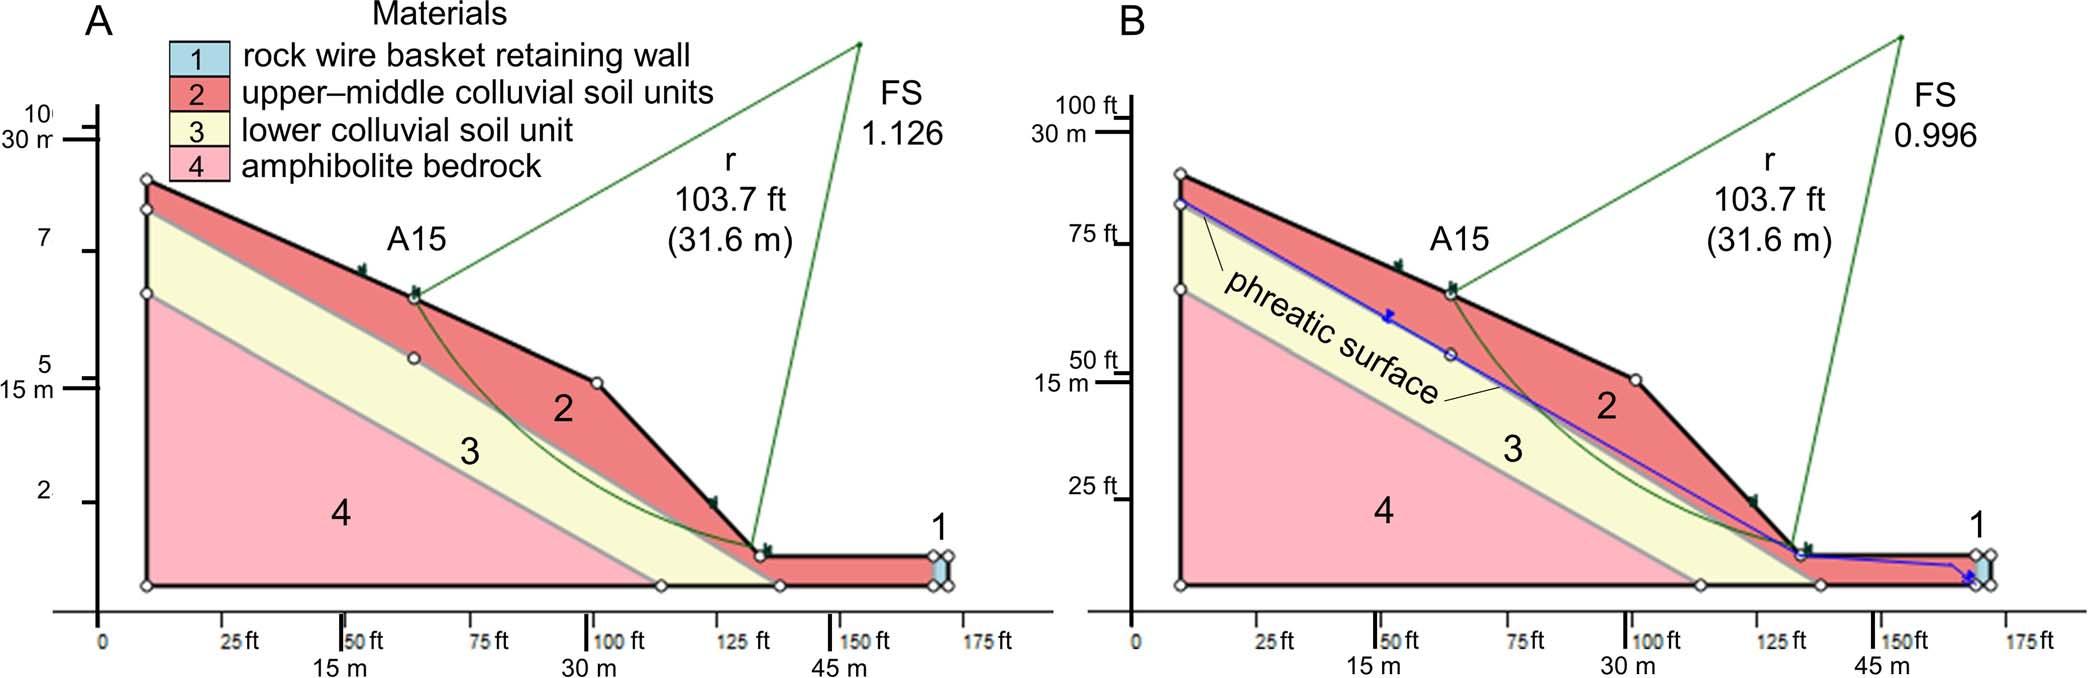
Figure16.Crosssectionsusedinthestabilityanalyses.FS ¼ factorofsafety, r ¼ radiusofcirculararcfailuresurface.StationA15coincides withthesamestationlocationinFigure8atthetopofthemainscarpofthe2018debrisslide.(A)Analysisrepresentingmetastableslopeconditions(FS ¼ 1.126)afterthe2000failureandpriortothe2018failurewithnophreaticsurface.(B)Analysisrepresenting2018failureconditions (FS ¼ 0.996)withaphreaticsurfaceapplied.ResultingfactorsofsafetyinbothcasesarethesamefortheanalysismethodsofMorgensternand Price(1965)andthesimplifiedmethodofBishop(1955).RefertoTable1formaterialproperties.Groundprofilesweresimplifiedtoeliminate computationalerrors.
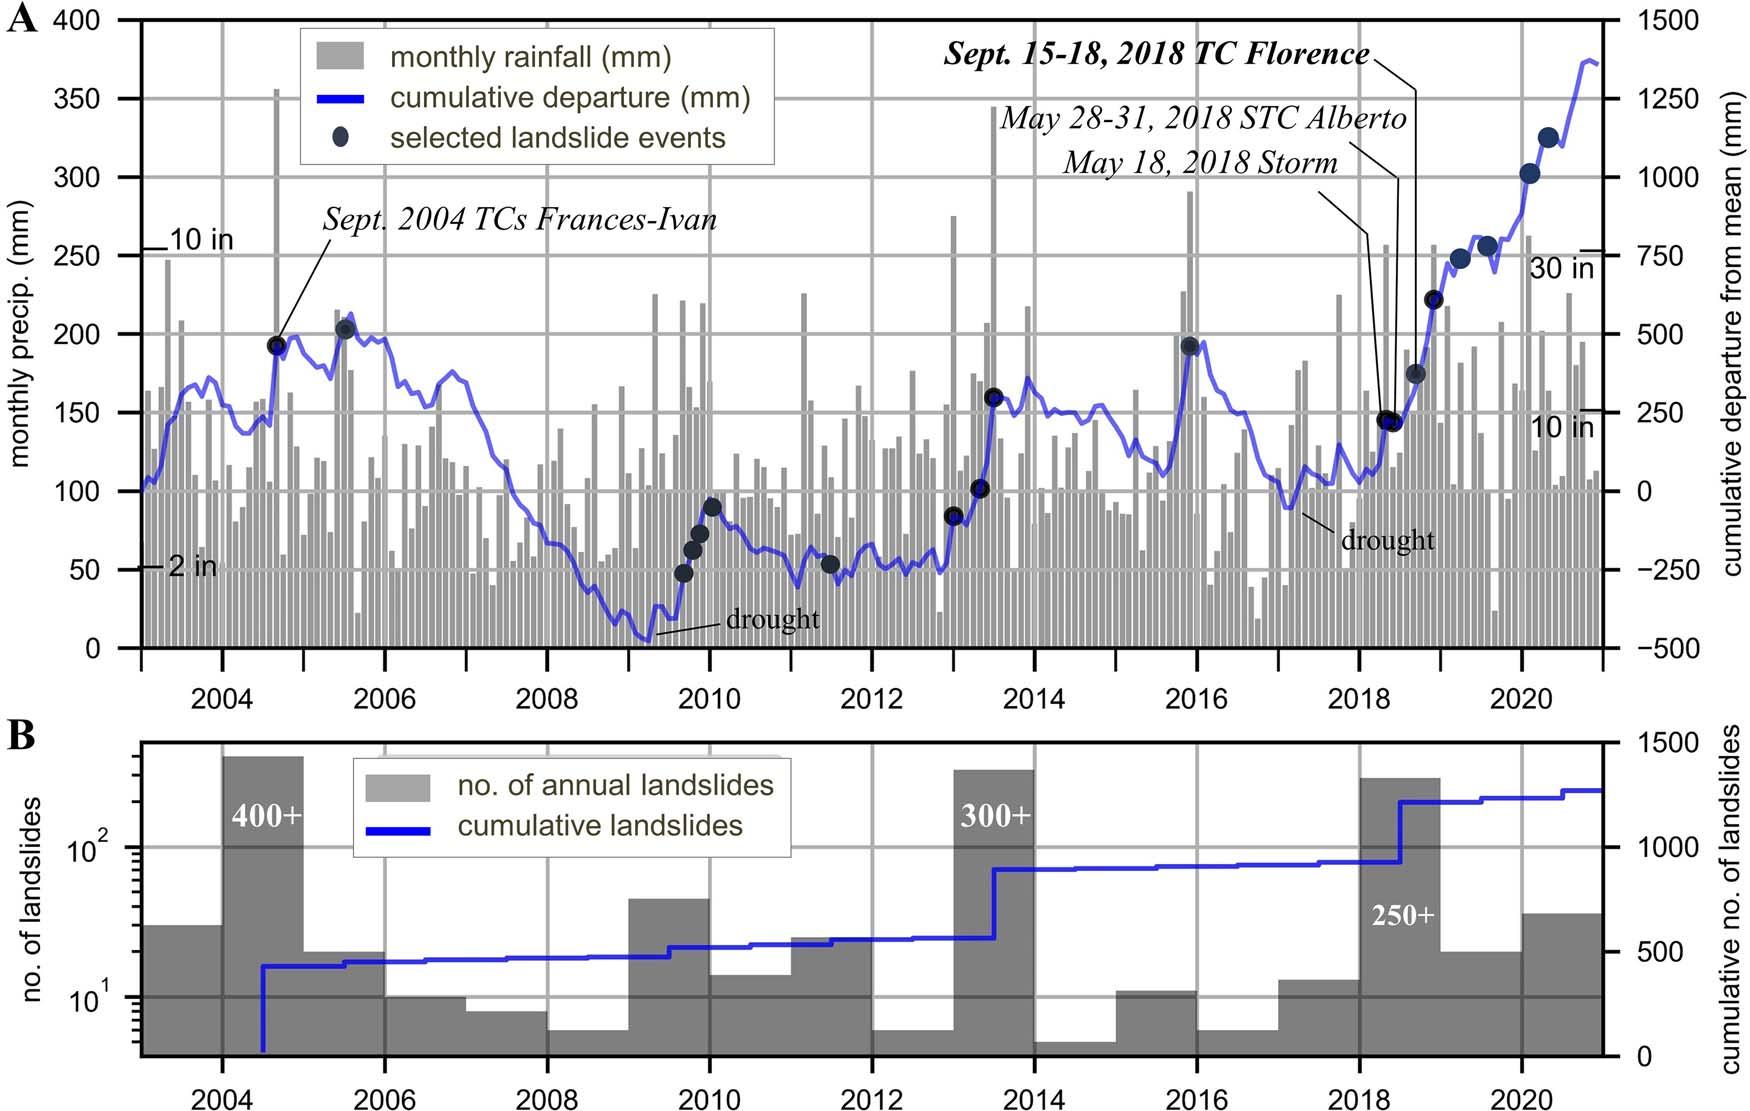
Figure17.(A)Cumulativerainfalldeparture(CRD)fromthemeanandmonthlyprecipitationplotof2003–2020rainfalldatafromAsheville,NC (NOAA,2021)shownwithselectedlandslideeventsinwesternNorthCarolinafortheperiod.Landslide-producingrainfallfromtheMay18, 2018,storm,SubtropicalCycloneAlberto,andHurricaneFlorence(Warrensvilledebrisslide)coincidedwiththeonsetofrecordabove-normal rainfallinwesternNorthCarolinaduring2018–2020.(B)Numbersoflandslidesandcumulativelandslidesforthesameperiod.Numbersof annuallandslides,CRDanalysis,andmonthlyprecipitationindicateperiodsofbelow-normalandabundantrainfall,withabundantrainfallcoincidentwithlandslideevents.FigureismodifiedfromWootenetal.(2022).
ofmodifiedslopessuchasthisarebelowthoseneededto inducefailuresonunmodified,forested(i.e.,natural)slopes (Wootenetal.,2017).
Infiltratingrainfallcanleadtoincreasesinsoilporewaterpressure(anddecreasesinmatricsuction),which decreasesoilstrength,therebyleadingtoslopefailure (LuandGodt,2013).Shallowdebris flowsanddebrisslides (generallylessthan6ft[2m]deep)canbetriggeredwhen positiveporepressuresfrominfiltratingwaterovercome soilstrength(notnecessarilyalongdiscreteslipsurfaces), whereasmovementofdeeperlandslidescanbeinducedby risinggroundwaterlevelsthatcreatepositiveporepressuresonslipsurfaces(VanAschetal.,1999).Antecedent moistureconditionspriortolandslide-triggeringeventsare importantconsiderationsindevelopingrequisiterainfall thresholdsfordifferinghydrometeorologicalconceptual modelsappropriateforshallowdebris flowsversusdeeper landslides(BogaardandGreco,2018).
Thelagtimesof »33–39hoursfromtheendofpeak rainfalland »9–10.5hoursfromtheendofrainfalluntil theWarrensvilledebrisslideoccurredcontrastwithother documentedcasesinNorthCarolinawheredebris flows initiatedatornearthetimeofpeakrainfallrates(Wooten etal.,2017,2022).GroundwaterdischargeonSeptember 19withintheWarrensvilleslidescar(zoneofdepletion)
wasobservednearthecontactofthemiddleandlowercolluviumunits(Figure8),indicatingthatincreasedporewaterpressuresinthatzonealongthatslipsurfaceatabout 12to14ft(»3.7–4.2m)belowthepre-slidegroundsurfacetriggeredtherapidslidemovement.Ourstabilityanalysisofslopeconditionsatthetimeofthe2018failure (Figure16B)areconsistentwiththisinterpretation.The lagtimebetweenrainfallandslidemovementcouldbe explainedbythetimerequiredforrainfallinfiltratinginto therechargeareaupslopetoresultincriticalpore-water pressuresalongtheslipsurfaceatdepthinthefootslope debrisdeposits.Fromlong-termmonitoringoftheAlani-Paty landslide,Reid(1994)determinedthataftertheonsetofrainfall,deeperporepressuresnearthebasalslidesurfaceshowed adelayed(althoughattenuated)responseincontrasttoshallowporepressures.Fromthepublicsafetyperspective,the Warrensvilledebrisslidedemonstratesthathazardsfrom rapidtoveryrapidslidemovementcanoccurover2days afterpeakstormrainfallandhoursafterrainfallceases.
TheMay18,2018,stormeventthattriggeredover240 debris flowsinPolkCounty,NC(Wootenetal.,2022), markedtheabruptbeginningofa2yearperiodofincreased
landslideactivityinwesternNorthCarolinaoverthepreviousfouryears(2014–2017).Thecumulativerainfall departurefromthemeananalysisforwesternNorthCarolina(Figure17)showsthatrainfallconditionssteadily increasedfromearly2018to2020,withacommensurate overallincreaseinlandslidefrequency.Inhindsight,the September2018Warrensvilledebrisslide,attributedhere toelevatedantecedentrainfallcoupledwiththatfrom HurricaneFlorence,occurredat4monthsintothisthis 2yeartrend.Similarincreasesinlandslideactivity wereseenin2004,2009–2010,and2013,coincidentwith periodsofextendedabove-normalrainfall.Withinthese periodsofabove-normalrainfall,individualextremerainfalleventstriggerednumerousrapidlymovingdebrisslides anddebris flows(Milleretal.,2019,2021a,2021b). Cumulativerainfallduring2018–2020reactivatedlarge, slow-movingdebrisslidesandweathered-rockslides,with primeexamplesbeingtheBright’sCreekandHowardGap landslidesinPolkCounty,andtheBuffaloCreekslidein RutherfordCounty,whichcontinuetothreatenprivate propertyandinfrastructure(Wootenetal.,2019,2022).
Theshiftfromrecorddrought(2016–2017)torecord rainfall(2018–2020)asseeninwesternNorthCarolina (Figure17)isacontinuationoftheoverallpatternofincreased droughtseverityandmoreextremeprecipitationdistributionsthatLaseteretal.(2012)identifiedinclimatedata from1935to2010attheCoweetaHydrologiclaboratory insouthwesternNorthCarolina.Theseextremeprecipitationpatternsmayalsoinfluencethetransitionfrommetastableorslow-movinglandslidesandslopestorapid accelerationandcatastrophicfailureanalogoustothat documentedfortheMudCreeklandslideinCalifornia (Handwergeretal.,2019)andasexperiencedinthe Warrensvilledebrisslide.Giventhepredictedincr ease inprecipitationextremeswithchangingclimatelinked tolandslidemovement(Handwergeretal.,2019)coupled withfutureincreasesinstormintensityandfrequency(e.g., Preinetal.,2017),acommensurateincreaseinlandslide activitycanbeexpected.
AseriesoffactorsthatcontributedtotheSeptember 18,2018,debrisslidetookplaceoveraperiodofyears thatpredisposedtheslopetofailureandincreased losses.Colluvialdepositscanbemarginallystableinan undisturbedor “natural” condition,andslopemodificationssuchasexcavationscandecreasethestabilityof colluvialdepositsinwesternNorthCarolina(Wooten etal.,2017)andelsewhere(FlemmingandJohnson, 1994;Turner,1996).Colluvialdepositsfrompastslopemovementactivityhavethepotentialforslopeinstabilitywhendisturbed,asevidencedherebythereported failureofthecutslopein2000.Theretainingwallbuilt
afterthe2000slopefailuredidnotadequatelyprotect thebankfromthedebrisslide.Curvedtreespresenton thedisplacedmassoftheslideareevidencethatthe slopewas,orhadbeen,movingslowlybycreepandwas alreadymarginallystable.Groundwaterdischarging withinthedebrisslidenearthelowercolluvialunitindicatedthatporepressureswithinthecolluvialsoilaquifer likelyhadadestabilizinginfluenceontheslope,asshown inourstabilityanalyses.Assessmentofthedegreeto which,ifany,theslopemodificationsandleachaterelated tothesepticsystemcontributedtotheMay18,2018,slope failurewasbeyondthescopeofourinvestigation.Although thesepticleach fieldwasconstructedinavulnerablelocationanddamagedbytheslide,itwasuncleariftheleachate moisturefromitwasacontributingfactortotheslopefailure.Damagetothesepticsystempresentedaneconomic hardshiptotheownerwithnegativeimpactstotherestaurantitserved.
Locatinggastanksandtransmissionlinesinvulnerable locationsonornearslopessusceptibletofailurewithout theappropriateprotectionmeasuresisunwise.OnMay30, 2018,duringrainfallfromsubtropicalstormAlberto(Figure 17),twolandslide-relatedfatalitiesoccurredinWatauga County,NC(WootenandWitt,2018).TheWataugaCounty Sheriff ’sOfficereportedasequenceofeventsinwhicha landslidedamagedalow-pressuregasregulator,causingan explosionthatdestroyedonehome,killingtheoccupants (WataugaDemocrat,2018).Inthe2018Warrensville case,thepropanetankwasplacedinavulnerablelocation upslopeoftheretainingwall,therebybeinglocated betweenanunstableslopeandanoccupiedbuilding. Thedebrisslidestruckthepropanetank,andtheensuingexplosiondestroyedthebuilding.
Fortunately,noliveswerelost,andnoseriousinjuries resultedfromtheWarrensvilledebrisslide.Certainly,the circumstancescouldhavebeentragicifcustomershad beeninthedrive-throughlanebehindthebank,orif employeesorcustomersinsidehadnotbeennearthefront ofthebankatthetime.
Landslideeventslikethesecanresultinlossesand negativeimpactstocommunitiesthatlastforyears.The damagedbankbuildingbelowthe2018slidescarisvisible in2021and2022orthophotographyhostedontheAshe CountyGISWebsite(https://gis.ashecountygov.com/maps/ default.htm).AnAugust31,2023,sitevisitrevealedthatthe heavilydamagedandabandonedbuildingstillstands,and remnantsofthedebrisslidedepositandretainingwallare overgrown.Anymajoractionstakentomitigatetheslope failurehazardtherewerenotreadilyapparent.Anongoing challengeistorecognizethepotentialnegativeimpactsof seeminglyindependent,butinterrelated,land-usepracticesin mountainousterrainthatmaytakeyearsordecadesfortheir cumulativeeffectstoresultindamaginglandslides.Landscape changesassociatedwithurbanizationcanhaveadecades-long Wooten,Cattanach,Bozdog,andIsard
effectonlandslidesusceptibility,whereurbanizedareasare generallymoresusceptibletolandslides(Rohanetal., 2023).Understandinginteractionsbetweenlanduseand landslidesandapplyingthisknowledgetopromotesmart developmentinmountainousterrain(SidleandOchiai, 2006)canhelptoreducelandslidelosseslikethosethat continuetoimpactthetownofWarrensville,NC.
StephenKeighton,NationalWeatherService,Blacksburg, VA,WeatherForecastOfficegraciouslyprovidedtherainfall datatodocumenttheprecipitationconditionsleadingupto theSeptember18,2018,debrisslide.ImageryfromUAS flightsbytheNorthCarolinaExtensionservicewasan invaluableresourceforassessinganddocumentingthedebris slide.Logisticalsupportandinformationprovidedby theAsheCountyEmergencyDepartmentaregratefully acknowledged.KennethB.Taylor,NorthCarolina StateGeologist,wasinstrumentalinguidingtheNCGS landslideresponseprograminclosecoordinationwith stateandlocalemergencymanagers.Wethankthree reviewersfortheircomments,whichresultedinsubstantial improvementstothemanuscript.
AmericanSocietyforTestingandMaterials(ASTM),2002, DesignationD2488-84 Standardpracticefordescriptionand identi fi cationofsoils(visual-manualprocedure).In Annual BookofASTMStandards,v.04.08,SoilandRock,Building Stones,Geotextiles:ASTMInternational,WestConshohocken,PA, 2003.
BAUER,J.B.;FUEMMELER,S.F.;WOOTEN,R.M.;WITT,A.C.;GILLON, K.A.; AND DOUGLAS,T.J.,2012,Landslidehazardmappingin NorthCarolina Overviewandimprovementstotheprogram.In Eberhardt,E.;Froese,C.;Turner,K.;andLeroueil,S.(Editors), LandslidesandEngineeredSlopes:ProtectingSocietyThrough ImprovedUnderstanding,Proceedingsofthe11thInternationalSymposiumonLandslidesand2ndNorthAmericanSymposiumonLandslides,June2–82012,Banff:CRCPress,BocaRaton,FL,p.373 BISHOP,A.W.,1955,Theuseoftheslipcircleinthestabilityanalysis ofslopes: Géotechnique,Vol.5,No.1,pp.7–17.
BOGAARD,T. AND GRECO,R.,2018,Invitedperspectives:Hydrological perspectivesonprecipitationintensity-durationthresholdsfor landslideinitiation:Proposinghydro-meteorologicalthresholds: NaturalHazardsEarthSystemsSciences,Vol.18,No.1,pp.31–39. https://doi.org/10.5194/nhess-18-31-2018
CRUDEN,D.M. AND VARNES,D.J.,1996,Landslidetypesandprocesses.InTurner,A.K.andSchuster,R.L.(Editors), Landslides: InvestigationandMitigation:SpecialReport247,Transportation ResearchBoard,Washington,D.C.,pp.36–75.
DE GRAFF,J.V.;CANNON,S.H.; AND GALLEGOS,A.J.,2007,Reducing post-wildfiredebris flowriskthroughtheBurnedAreaEmergency Response(BAER)process.InSchaefer,V.R.;Schuster,R.L.;and Turner,A.K.(Editors), ConferencePresentations,1stNorthAmericanLandslideConference:SpecialPublication23,Associationof Environmental&EngineeringGeologists,Vail,CO,pp.1440–1447.
ESCHNER,A.R. AND PATRICK,J.H.,1982,Debrisavalanchesineastern uplandforests: JournalofForestry,Vol.80,pp.343–347.
FEASTER,T.D.;WEAVER,J.C.;GOTVALD,A.J.. AND KOLB,K.R.,2018, PreliminarypeakstageandstreamflowdataatselectedU.S.GeologicalSurveystreamgagingstationsinNorthandSouthCarolina for floodingfollowingHurricaneFlorence,September,2018;U.S. GeologicalSurveyOpen-FileReport2018-1172,36p.,doi:10. 3133/ofr20181172
FLEMMING,R.W. AND JOHNSON,A.M.,1994, LandslidesinColluvium: U.S.GeologicalSurveyBulletin,Vol.2059B,30p.
HALES,T.C.;FORD,C.R.;HWANG,T.;VOSE,J.M.; AND BAND,L.E., 2009,Topographicandecologiccontrolsonrootreinforcement: JournalofGeophysicalResearch,Vol.114,p.F03013.doi:10. 1029/2008JF001168
HANDWERGER,A.L.;HUANG,M.;FIELDING,E.J.;BOOTH,A.M.; AND BÜRGMANN,R.,2019,Ashiftfromdroughttoextremerainfall drivesastablelandslidetocatastrophicfailure: ScientificReports, Vol.9,p.1569. https://doi.org/10.1038/s41598-018-38300-0
LASETER,S.H.;FORD,C.R.;VOSE,J.M., AND SWIFT,L.W.,JR.,2012, Long-termtemperatureandprecipitationtrendsattheCoweetaHydrologicLaboratory,Otto,NorthCarolina,USA: HydrologyResearch, Vol.43,No.6,pp.890–901. https://doi.org/10.2166/nh.2012.066
LU,N. AND GODT,J.W.,2013, HillslopeHydrologyandStability: CambridgeUniversityPress,Cambridge,U.K. doi.org/10.1017/ CBO9781139108164
MILLER,D.;FORSYTHE,J.;KUSSELSON,S.;STRAKA W.,III;YIN,J.;ZHAN, X.; AND FERRARO,R.A.,2021a,AstudyoftwoimpactfulheavyrainfalleventsinthesouthernAppalachianMountainsduringearly2020, partI:Societalimpacts,synopticoverview,andhistoricalcontext: RemoteSensing,Vol.13,p.2452. https://doi.org/10.3390/rs13132452
MILLER,D.;ARULRAJ,M.;FERRARO,R.;GRASSOTTI,C.;KULIGOWSKI,B.; LIU,S.;PETKOVIC,V.;WU,S.; AND XIE,P.,2021b,Astudyoftwo impactfulheavyrainfalleventsinthesouthernAppalachianMountainsduringearly2020,partII:;Regionaloverview,rainfallevolution,andsatelliteQPEutility: RemoteSensing,Vol.13,p.2500. https://doi.org/10.3390/rs13132500
MILLER,D.K.;MINIAT,C.F.;WOOTEN,R.M.; AND BARROS,A.P., 2019,Anexpandedinvestigationofatmosphericriversinthe southernAppalachianMountainsandtheirconnectiontolandslides: Atmosphere,Vol.10,No.2,p.71.
MILLS,H.H.,1998,SurficialdepositsandlandformsonthewestpiedmontlopesofRichandSnakeMountainsbetweenSilverstone, NorthCarolina,andTrade,Tennessee.In AFieldGuide;Southeast FriendsofthePleistoceneFieldTrip.ReprintedinStewart,K.and Wooten,R.(Editors),2018,OldWineinNewBottles:ActiveTectonicsandActiveLandscapesinanAncientOrogen:FieldTrip Guidebook,CarolinaGeologicalSociety,Durham,NC,pp.46–54.
MILLS,H.H.,2005,Relative-agedatingoftransportedregolithand applicationtostudyoflandformevolutionintheAppalachians: Geomorphology,Vol.67,pp.63–96.
MILLS,H.H. AND ALLISON,J.B.,1995,ControlsonvariationoffansurfaceageintheBlueRidgeMountainsofHaywoodCounty, NorthCarolina: PhysicalGeography,Vol.15,No.5,pp.465–480.
MISRA,K.C. AND CONTE,J.A.,1991,AmphibolitesoftheAsheand AlligatorBackFormations,NorthCarolina: GeologicalSocietyof AmericaBulletin,Vol.103,pp.737–750.
MORGENSTERN,N.R. AND PRICE,V.E.,1965,Theanalysisofthestabilityofgeneralslipsurfaces: Géotechnique,Vol.15,pp.79–93. NationalOceanicandAtmosphericAdministration(NOAA),2021, ClimateataGlance,DivisionalTimeSeries:Database:Electronic document,availableat https://www.ncdc.noaa.gov/cag/divisional/ time-series
NaturalResourcesConservationService(NRCS),2023, UnitedStates DepartmentofAgricultureWebSoilSurvey:Electronicdocument, availableat https://soilseries.sc.egov.usda.gov/OSD_Docs/E/EVARD. html
Wooten,Cattanach,Bozdog,andIsard
NorthCarolinaDepartmentofPublicSafety(NCDPS),2005, Issue50 PhaseIIIQualityControlofLightDetectionandRanging(LIDAR): NorthCarolinaCooperatingTechnicalStateMappingProgram, Raleigh,NC,February2005,11p.Electronicdocument,availableat https://flood.nc.gov/ncflood_bucket/issue/ip50_final_phaseIII_lidar_ qc.pdf
NorthCarolinaDepartmentofPublicSafety(NCDPS),2020, LiDAR QualityControlReport StatewideLiDARProjectPhasesFour (4)andFive(5):NorthCarolinaDepartmentofPublicSafety, DivisionofEmergencyManagement,NorthCarolinaGeodetic Survey,Raleigh,NC,154p.,Electronicdocument,availableat https://geodeticsurvey.nc.gov/docs/2018_Phase_5_QC_LAS_signed. pdf
NIPPGEN,F.;MCGLYNN,B.L.;EMANUEL,R.E.; AND VOSE,J.M.,2016, WatershedmemoryattheCoweetaHydrologicLaboratory:The effectofpastprecipitationandstorageonhydrologicresponse: WaterResources,Vol.52,pp.1673–1695.
POLEMIO,M. AND PETRUCCI,O.,2000,Rainfallasalandslidetriggering factor:Anoverviewofrecentinternationalresearch.InBromhead, E.;Dixon,N.andIbsen,M.(Editors) Proceedingsofthe8thInternationalSymposiumonLandslides:Cardiff,U.K.,June2000, ThomasTelfordLtd.,London,UK,Vol.3,pp.1219–1226.
PREIN,A.F.;LIU,C.;IKEDA,K.;TRIER,S.B.;RASMUSSEN,R.M.; HOLLAND,G.J.; AND CLARK,M.P.,2017,Increasedrainfallvolume fromfutureconvectivestormsintheUS: NatureClimateChange, Vol.7,No.12,pp.880–884.
RAYMOND,L.A. AND ABBOTT,R.N.,1997,PetrologyandtectonicsignificanceofultramaficrocksneartheGrandfatherMountainWindowintheBlueRidgebelt,Toeterrane,westernPiedmont,North Carolina.InStewart,K.G.;Adams,M.G.;andTrupe,C.H.,(Editors), PaleozoicStructure,Metamorphism,andTectonicsofthe BlueRidgeofWesternNorthCarolina:FieldTripGuidebook,CarolinaGeologicalSociety,Durham,NC,pp.67–85.
ROHAN,T.;SHELEF,E.;MIRUS,B.; AND COLEMAN,T.,2023,Prolonged influenceofurbanizationonlandslidesusceptibility: Landslides,Vol. 20,pp.1433–1447. https://doi.org/10.1007/s10346-023-02050-6
REID,M.E.,1994,Aporepressurediffusionmodelforestimatinglandslideinducingrainfall: JournalofGeology,Vol.102,pp.709–717.
REID,M.E.;GODT,J.W.;LAHUSEN,R.G.;SLAUGHTER,S.L.;BADGER, T.C.;COLLINS,B.D.;SCHULZ,W.H.;BAUM,R.L.;COE,J.A.;HARP, E.L.;SCHMIDT,K.M.;IVERSON,R.M.;SMITH,J.B.;HAUGERUD,R.A.; AND GEORGE,D.L.,2021,Whenhazardavoidanceisnotanoption: Lessonslearnedfrommonitoringthepost-disasterOsolandslide,USA: Landslides,Vol.18,pp.2993–3009.doi:10.1007/s10346-021-01686-6
SIDLE,R.C. AND OCHIAI,H.,2006, Landslides:Processes,Prediction andLandUse:WaterResourcesMonograph18,AmericanGeophysicalUnion,Washington,D.C.,312p.
TURNER,A.K.,1996,Colluviumandtalus.InTurnerA.K.and Schuster,R.L.(Editors), LandslidesInvestigationandMitigation: SpecialReport247,TransportationResearchBoard,Washington, D.C.,pp.525–554.
VAN ASCH,T.W.J.;BUMA,J.; AND VAN BEEK,L.P.H.,1999,Aview onsomehydrologicaltriggeringsystemsinlandslides: Geomorphology,Vol.30,pp.25–32.
WataugaDemocrat,June4,2018,TimelineofeventsreleasedinPine Ridgelandslideexplosion:Electronicdocument,availableat https:// www.wataugademocrat.com/news/timeline-of-eventsreleased-in-pineridge-landslide-explosion/article_790c5fe1-a8cf-5411-a2ac-340460f7 3f89.html
WIECZOREK,G.F.,1987,Landslidetriggeringmechanisms.InTurner, A.K.andSchuster,R.L.(Editors), Landslides:Investigationand Mitigation: SpecialReport247,TransportationResearchBoard, Washington,D.C.,pp.76–90.
WIECZOREK,G.F.;MOSSA,G.S.; AND MORGAN,B.A.,2004,Regional debris flowdistributionandpreliminaryriskassessmentfrom
severestormeventsintheAppalachianBlueRidgeProvince, USA: Landslides,Vol.1,pp.53–59.
WILLIAMSON,D.A.,1984,Unifiedrockclassificationsystem: Bulletinof theAssociationofEngineeringGeologists,Vol.XXI,pp.253–254.
WITT,A.C.;GILLON,K.A.;WOOTEN,R.M.;DOUGLAS,T.J.;BAUER, J.B.; AND FUEMMELER,S.F.,2017,Determiningpotentialdebris flowinundationzonesforanemergencyresponseusingLAHARZ: TheGhostTownDebrisFlow,MaggieValley,N.C.,USA:InDe Graff,J.V.;andShakoor,A.(Editors), Landslides:PuttingExperience,KnowledgeandEmergingTechnologiesintoPractice:SpecialPublication27,AssociationofEnvironmental&Engineering Geologists,pp.381–389.
WOOTEN,R.M.;BAUER,J.B.; AND CATTANACH,B.L.,2019,Stop5: BuffaloCreekdebrisslide.InBauer,J.B.(Editor), DebrisFlows, RockSlides,RockFallsandBigSlowMovers:WhoCouldAskfor AnythingMore?:LandslideFieldCourseGuidebook,Annual Meeting,September17–19,2019,AssociationofEnvironmental &EngineeringGeologistsAsheville,NC,pp.39–45.
WOOTEN,R.M.;CATTANACH,B.L.;BOZDOG,G.N.; AND ISARD,S.J., 2018, TheSeptember18,2018,LandslideinWarrensville,Ashe County,NorthCarolina:unpublished fieldreportNovember29, 2018,byNorthCarolinaGeologicalSurveysubmittedtoAshe CountyEmergencyManagement,24p.
WOOTEN,R.M.;CATTANACH,B.C.;BOZDOG,G.N.;ISARD,S.J.; FUEMMELER,S.J.;BAUER,J.B.;WITT,A.C.;DOUGLAS,T.J.; GILLON,K.A.; AND LATHAM,R.S.,2017,TheNorthCarolinaGeologicalSurvey’sresponsetolandslideevents:Methods, findings, lessonslearnedandchallenges.InDeGraff,J.V.andShakoor,A. (Editors), Landslides:PuttingExperience,KnowledgeandEmergingTechnologiesintoPractice:SpecialPublication27,AssociationofEnvironmental&EngineeringGeologists,pp.359–370.
WOOTEN,R.M.;DOUGLAS,T.J.;BAUER,J.B.;FUEMMELER,S.J.; GILLON,K.G.;WITT,A.C.; AND LATHAM,R.S.,2012,Geologic, geomorphicandgeotechnicalaspectsofdebris flowinitiationsites intheBlueRidgeMountainsofwesternNorthCarolinaatstudy locationsinBuncombe,Haywood,Henderson,Jackson,Macon, TransylvaniaandWataugaCounties: GeologicalSocietyofAmericaAbstractswithPrograms,Vo.44,No.7,p.147.
WOOTEN,R.M.;LATHAM,R.S.;WITT,A.C.;GILLON,K.A.;DOUGLAS, T.D.;FUEMMELER,S.J.;BAUER,J.B.; AND REID,J.C.,2007,LandslidehazardsandlandslidehazardmappinginNorthCarolina.In Schaefer,V.R.;Schuster,R.L.;andTurner,A.K.(Editors), ConferencePresentations,1stNorthAmericanLandslideConference: SpecialPublication23,AssociationofEnvironmental&EngineeringGeologists,Vail,CO,pp.458–471.
WOOTEN,R.M.;SCHEIP,C.M.;HILL,J.S.;DOUGLAS,T.J.;KORTE, D.M.;CATTANACH,B.L.;BOZDOG,G.N.; AND ISARD,S.J.,2022, ResponsestolandslidesandlandslidemappingontheBlueRidge Escarpment,PolkCounty,NorthCarolina,USA: Environmental& EngineeringGeoscience,Vol.XXVIII,No.1,pp.25–54.
WOOTEN,R.M. AND WITT,A.C.,2018,Landslidesandlandslidehazard mappinginWataugaCounty,NorthCarolina.In:Stewart,K.and Wooten,R.(Editors), OldWineinNewBottles:ActiveTectonicsand ActiveLandscapesinanAncientOrogen:FieldTripGuidebook,CarolinaGeologicalSociety,Durham,NC,pp.133–159.
WOOTEN,R.M.;WITT,A.C.;MINIAT,C.F.;HALES,T.C.; AND ALDRED, J.A.,2016,Frequencyandmagnitudeofselectedhistoricallandslide eventsinthesouthernAppalachianhighlandsofNorthCarolinaand Virginia:Relationshipstorainfall,geologicalandecohydrologicalcontrols,andeffects.InGreenberg,C.H.andCollins,B.S.(Editors), NaturalDisturbancesandHistoricRangeofVariation:Type,Frequency, Severity,andPost-disturbanceStructureinCentralHardwoodForests USA:ManagingForestEcosystemsVolume32,Springer,NewYork, pp.203–262.
ZANIBFIDA*,MUHAMMADASHRAFTANOLI,andQAISARMAHMOOD
DepartmentofCivilEngineering,COMSATSUniversityIslamabad,Abbottabad Campus,22060Abbottabad,Pakistan
DepartmentofWorks,AbbottabadUniversityofScienceandTechnology,Havelian Campus,22500Abbottabad,Pakistan
DepartmentofCivilEngineering,UniversityofLahore,IslamabadCampus, Islamabad,Pakistan
KeyTerms: GreenTechnology,NaturalCoagulants, WaterTreatment,SustainableEnvironment
Thisstudyinvestigatedtheuseofnaturalextractsas bio-coagulantsforwatertreatmentandpurification.The utilizationofnaturalmaterialsrepresentsimportantprogressinsustainableenvironmentalinitiatives,andtheir applicationisdirectlyassociatedwithimprovedquality oflifeduetotheirlowtoxicity,cost-effectiveness,andnaturallyrenewableproperties.Therefore,threeplantspecieswereidentified,andtheireffectivenesswasevaluated inthelaboratoryonsurfacewatersamples: Moringaoleifera(MO),Cicerarietinum(CA), and Pinusroxburghii (PR).WatersampleswerecollectedfromtheRiver Kunhar,GarhiHabibullah(Mansehra)forlaboratory analysis.Acombinedtreatment(coagulationand filtration)wasfoundtobemoreefficientcomparedtodirect filtrationorcoagulationalone.Thehighestturbidity removalof99.17percent,solidsreductionof93.21percent,hardnessreductionof67.35percent,andtotalcoliformremovalof86.13percentwereachievedforthe filteredwatersamplestreatedwith MO. CA providedthe maximumchloridereductionof54.85percentcompared totheothertwo.Theseextractsslightlyaffectedthe acidity,alkalinity,pH,andconductivityofwatersamples. However,aslightincreaseinbiologicalandchemical oxygendemandwasfoundintreatedwater.Among thethreenaturalcoagulants, MO causedasignificant increaseinorganicmatter.Thisproblemcanbeavoided byusingthepurifiedformofactivecoagulatingagents ratherthancrudeextract.Thisresearchshowstheeffectivenessof MO forsurfacewatertreatmentandalso
*Correspondingauthoremail: zanibfida@cuiatd.edu.pk
illustratesthegreatpotentialof CA and PR aspromisingbio-coagulantsforthetreatmentofpollutedsurfacewatersamples.
InPakistan,about70percentofthepopulationobtains waterfordrinkingpurposesfromgroundwateraquifers. Surfacewaterisanothermainsourceofwaterfordrinkingandotherdomesticpurposes(Daudetal.,2017). Mostoftheworld’spopulationdoesnothaveaccessto safeandcleandrinkingwater.ThePakistanNational ConservationStrategyreportshowedthatwater-related diseasesrepresent40percentofcommunicablediseases. InPakistan,60percentofinfantdeathsarecausedby water-relateddiarrhea,whichisthehighestproportionin Asia(Daudetal.,2017).Wateravailabilityhasdeclined dramaticallyfrom5,000m3/yrpercapitain1951to1,100 m3/yrpercapitain2005,anditwillfallto800m3/yrper capitaby2025(QureshiandAshraf,2019).
Freshwaterresourcesandtheenvironmentareseverely threatenedbecauseofurbanization,industrialization,and overpopulationstresses(Ensinketal.,2004).Bigcitiesare constantlyproducinghugeamountsofeffluentwaterthat needpropermanagementanddisposal(GhoshandSingh, 2005).Only2percentofthecitiesinPakistanhavethe advantageofwastewater-treatmentfacilities(Clemettand Ensink,2006).Thedeficienciesintreatmenttechnologies leadtohealthaswellaseconomicconsequences(Fuente etal.,2020;McClellandetal.,2022).
InPakistan,90percentofthetotaluntreatedwastewater isdischargedintolocalwaterbodies.Themajorpollutants influencingthewaterqualityincludepathogensandheavy metals(AlAkeel,2013),aswellasnon-metallicsubstances,fertilizers,pesticides/herbicides,hydrocarbons, variousorganicsolvents,andexplosives(Tanvir,2010).
Highturbidityisanotherpollutantprevalentinlower areasofPakistan(TahirandAslam,2010).
IndenselypopulatedcitieslikeKarachi,Lahore,Rawalpindi,Peshawar,Faisalabad,Sialkot,andGujrat,drinking waterishighlypollutedduetovariousactivitiesandcannot berecommendedforhumanconsumption(Bhuttaetal., 2005).Athigheraltitudes,thereisnoprovisionforthesafe disposalofthegeneratedhouseholdwastewaterandsolid waste.Inmostcases,suchkindsofdomesticliquidandsolid wastesaredischargedintofreshwaterstreams,whichserve aspotentialsourcesoffreshwatersupplytodownstream localities(Fergusonetal.,2007).Thus,thehighlevelof drinkingwatercontaminationhasledtoanincreaseindissolvedorganiccarbon(DOC),whichactsasavectorforthe transportofbacteriaandviruses.Consequently,consumption ofthispollutedwateristheleadingcauseofvariousacute diseases,includinghepatitis,tuberculosis,diarrhea,andcholera,especiallyininfants(Soomroetal.,2011).
Differentphysico-chemicalmethods,suchasdistillation, sedimentation, filtration,chemicaloxidation,andchlorination,havepreviouslybeenemployedfortheremovalof pollutantsfromdifferentwatersystems.Forthepreservationofthehealthandwell-beingofhumans,thetreatment ofrawwaterbeforeconsumptioniscruciallyessential. Coagulation/flocculationisoneoftheunitprocessesamong thedifferentphysico-chemicalprocessesusedforwater treatment.Itsapplicationincludestheremovalofdissolved chemicalspeciesandturbidityfromthewaterbyusing conventionalchemical-basedcoagulants,namely,alum (Al2[SO4]3·18H2O),ferricchloride(FeCl3),andpolyaluminumchloride(PAC)(Yin,2010).Althoughtheefficacyof thesechemicalsascoagulantsiswellrecognized,thereare neverthelessdisadvantagesassociatedwiththeuseofthese coagulants:Whiletheyarerelativelycheap,theyarestill quiteexpensivefordevelopingcountries(Konkoboetal., 2021);fromanenvironmentalpointofview,theirusesignificantlyproducesmetallicresidues(Krupinska,2020; Fouadetal.,2021);and finally,theiruseexposeshumansto apossibleriskofcontractingAlzheimer ’sdisease,because thealuminumresiduesthatremaininthewateraftertreatmentaresuspectedtoberesponsibleforthatdisease(Kandimallaetal.,2016;Zhangetal.,2019).
Itis,therefore,imperativetoreplacethesechemical coagulantswithnaturalusefulsubstitutestocounterbalance thedrawbacks.Currently,muchofthisworkisbeingdone ontheuseofplant-basednaturalcoagulantsforwaterand wastewatertreatment(Yin,2010).Thesenaturalextracts actasadsorbents,coagulants,and flocculantsforthetreatmentofsurfacewater.Theyalsoactasnaturalantimicrobialandantibacterialagents(KaziandVirupakshi,2013). Theydonotproduceanytoxiceffectsintreatedwater (Konkoboetal.,2023).TheydonotrequirepHandalkalinityadjustmentsanddonotcausecorrosionproblems
likealum.Theyproducerelativelysmallervolumesof sludge,whichcanbeusedasbio-fertilizersinruralareas. Itisquiteacheapermethodandcanbeusedinareas wherenotreatmentfacilitiesareavailable(Kaziand Virupakshi,2013).
Forthispurpose,severalnaturalplantshavebeenstudied scientifically.Theseextractshavebeenderivedfromdifferentpartsofplants,includingtheseeds,roots,leaves,bark, andfruits(Yongabi,2010).Forexample,seedsof Jatropha curcas (physicnut)werefoundtobeveryusefulforthe treatmentofwastewater. Parkiabiglobossa (locustbean seed)wasusedinnorthernNigeriaforturbidwaterclarification. Citrusaurantifolia (limejuice)isbasicallyacidicin natureandthustoxictoseveralmicroorganisms(Yongabi, 2010).Ithasbeenusedasadisinfectantindifferentwatertreatmentsystems. Moringaoleifera ( MO)isatropical plantthatshowedstrongcoagulationactivityduetothe presenceofdimericcationicproteins(Yongabi,2010). Parkinsoniaaculeate and Vignaunguiculata areplantspecies inwhichcationicproteinswerefoundtobeactivecoagulatingagents(Blix,2011).Previousstudiesreportedthatseeds of Cicerarietinum ( CA)havebeenusedasanaturalcoagulantforthetreatmentofsurfacewateraswellastannery wastewater(Asrafuzzamanetal.,2011;KaziandVirupakshi,2013). Pinusroxburghii ( PR),beingastrongadsorbent, hasbeenusedfortheremovalofchromiumfromsynthetic andindustrialwastewater(Ahmadetal.,2005).Theutilizationofplant-basedcoagulantsforturbidwaterpurification datesbackseveralmillennia(Sanghietal.,2002),anddifferenttypesofplantspeciesarecurrentlybeingexplored forwater-treatmentfacilities.Therealsoexistnumerous studiesfocusedontheusageofthesematerialsfortreating industrialwastewater(Sanghietal.,2002;SanghiandBhattacharya,2005;andVijayaraghavanetal.,2011).
Withthewidespreadenvironmentaldeteriorationand thepresentdepletionofEarth’snaturalresources,theapplicationofthesecoagulantsrepresentsapromisingideain the fieldofsustainableenvironmentaltechnology.Therefore,thisstudyinvestigatedtheuseoflocallyavailable plants,theextractsofwhichcouldbeusedasbio-coagulants,andevaluatedtheirefficacybycoagulation/flocculationfollowedbyslowsand filtrationintheprocessofraw waterpotabilization.Filtrationisbasicallyatechnology thathasbeenusedforpotablewaterpurification.Itisaprocesswellsuitedforsmall,ruralcommunities,sinceitis simple,reliable,andinexpensive,anditdoesnotrequirea highdegreeofoperatorskillorattention.Nochemical additionisrequiredforproper filtrationoperation.Particle removalisaccomplishedprimarilythroughbiologicalprocessesthatprovidetreatment.Slowsand filters(SSF)are notbackwashedlikerapidrate filters(ThomasandKani, 2016).Gravity flowkeepstheoperatingcostslowand allowsSSFtobeusedinremotelocationswithoutaccess
topower;thatiswhyanSSFcolumnwasusedinthis researchwork(Bielefeldt,2011).
InnorthernareasofPakistan,peopleareboundtoconsumerawsurfacewaterthatiscontaminatedbecauseof industrialandmunicipalwasteeffluents.Thehighmortalityratebecauseofwater-bornediseasesismainlyattributedtotheconsumptionofpollutedwaterthatneedsto betreated.Thus,thefocuswastoconserveandsafeguard localwaterbodiesbyusingnaturalplantextractsfor watertreatment.Thisstudyfocusedon MO, CA,and PR.
Themainobjectivesofthisstudywere:
(1)toidentifylocalplantspeciesthatcanbeusedas coagulantsandcoagulantaidsforwatertreatment ofKunharRiversurfacewater;
(2)tooptimizethedosageofplant-basedcoagulants usedinthecoagulationprocess;and
(3)toevaluatetheeffi cacyofplant-basedcoagulants intheremovalofturbidityandothercommon pollutants.
Throughouttheprojectduration,varioustypesof materialswereused.Thedetailsofthematerials’ preparationandproceduresaredescribedinthissection.
Therawwatersamplesusedinthisresearchworkwere takenfromtheRiverKunhar,GarhiHabibullah(Mansehra).Alocationmapofthestudyareaandriverfrom whichthewatersamplesweregatheredisshowninFigure 1.Watersampleswerecollectedinplasticairtightbottles andbroughttothelaboratoryforfurtheranalysis.New watersampleswerecollectedeverysecondtothethirdday.
Aftercollectingsamples,alltheanalyticalparametersforriverwatersampleswereanalyzedperstandard methods(Carranzo,2012)intheEnvironmentalEngineeringlaboratory,COMSATSAbbottabad(A224), within24hours.
Moringaoleifera
Inthisresearchwork,theleavesof MO wereusedfor water-treatmentpurposesbecausetheactivecoagulating agentinthesaidplantisproteins.Previousstudies revealedthattheproteincontentof MO leaveswasfound
tobehigher(Sultana,2020)ascomparedtotheseedsof thisplant(Sivakumar,2013).Leavesof MO werecollectedandwashedthoroughlytoremovedirtanddust particles.Theleavesweredriedundershadefor10days untilaconstantweightwasachievedbecauseshade-dried leavescontainthehighestproteincontentascomparedto sun-driedleaves(Deepaetal.,2021).Thedriedleaves werethenpulverizedandsievedtogetthenaturalextract of MO inpowderedformhavingaparticlesizeofless than100 lm(VermaandNigam,2014).
CA seedswerecollectedfromthelocalmarketof Abbottabad.Theseedsampleswerecleanedtoremove grit,dirt,andbrokengrainsandthenpackedinairtight jarsatroomtemperature.Afterthat,theseedswere groundtoa finepowderhavingaparticlesizeofless than100 lmandstoredinairtightcontainersforwater orwastewater-treatmentanalysis(Sharmaetal.,2013).
Barkof PR wascollectedfromtheMansehrahills. Thesebarksampleswerecarefullyremovedwithastainless-steelpenknifeatanaverageheightofabout2m abovetheground(Baslaretal.,2009).Theywerethoroughlywashedandthendriedundershadefor10days. Thedriedsampleswerethengroundintoa finepowder (Khanetal.,2012)andsievedtogetaparticlesizeof 60–150 lm(Ahmadetal.,2005).
Thepowderobtainedfrom MO leavesisgreenincolor. However,thepowderobtainedfrom CA and PR issalmonwhiteanddarkbrownincolor,respectively.Apictorial representationofthepowderedformofthethreenatural coagulantsisgiveninFigure2.
OptimizationofDosageofNaturalCoagulantsbyJar Testing
Ajartestisthemostwidelyusedmethodtodetermine theefficacyofnaturalplantextractsbecauseitiseasyto perform.Theexperimentwascarriedoutasabatchtest. Thestandardassemblyofthejartestingapparatusconsistsofsixbeakerswitha1Lcapacityeach.Here,thejar testapparatusshowninFigure3consistedoffourbeakers havingacapacityof100mLbecausethisassemblysetup wastheonlyoneavailableintheEnvironmentalEngineeringlaboratoryforlaboratoryanalysis.Eachjarwas filledwith100mLofrawwatersamplewithidentical
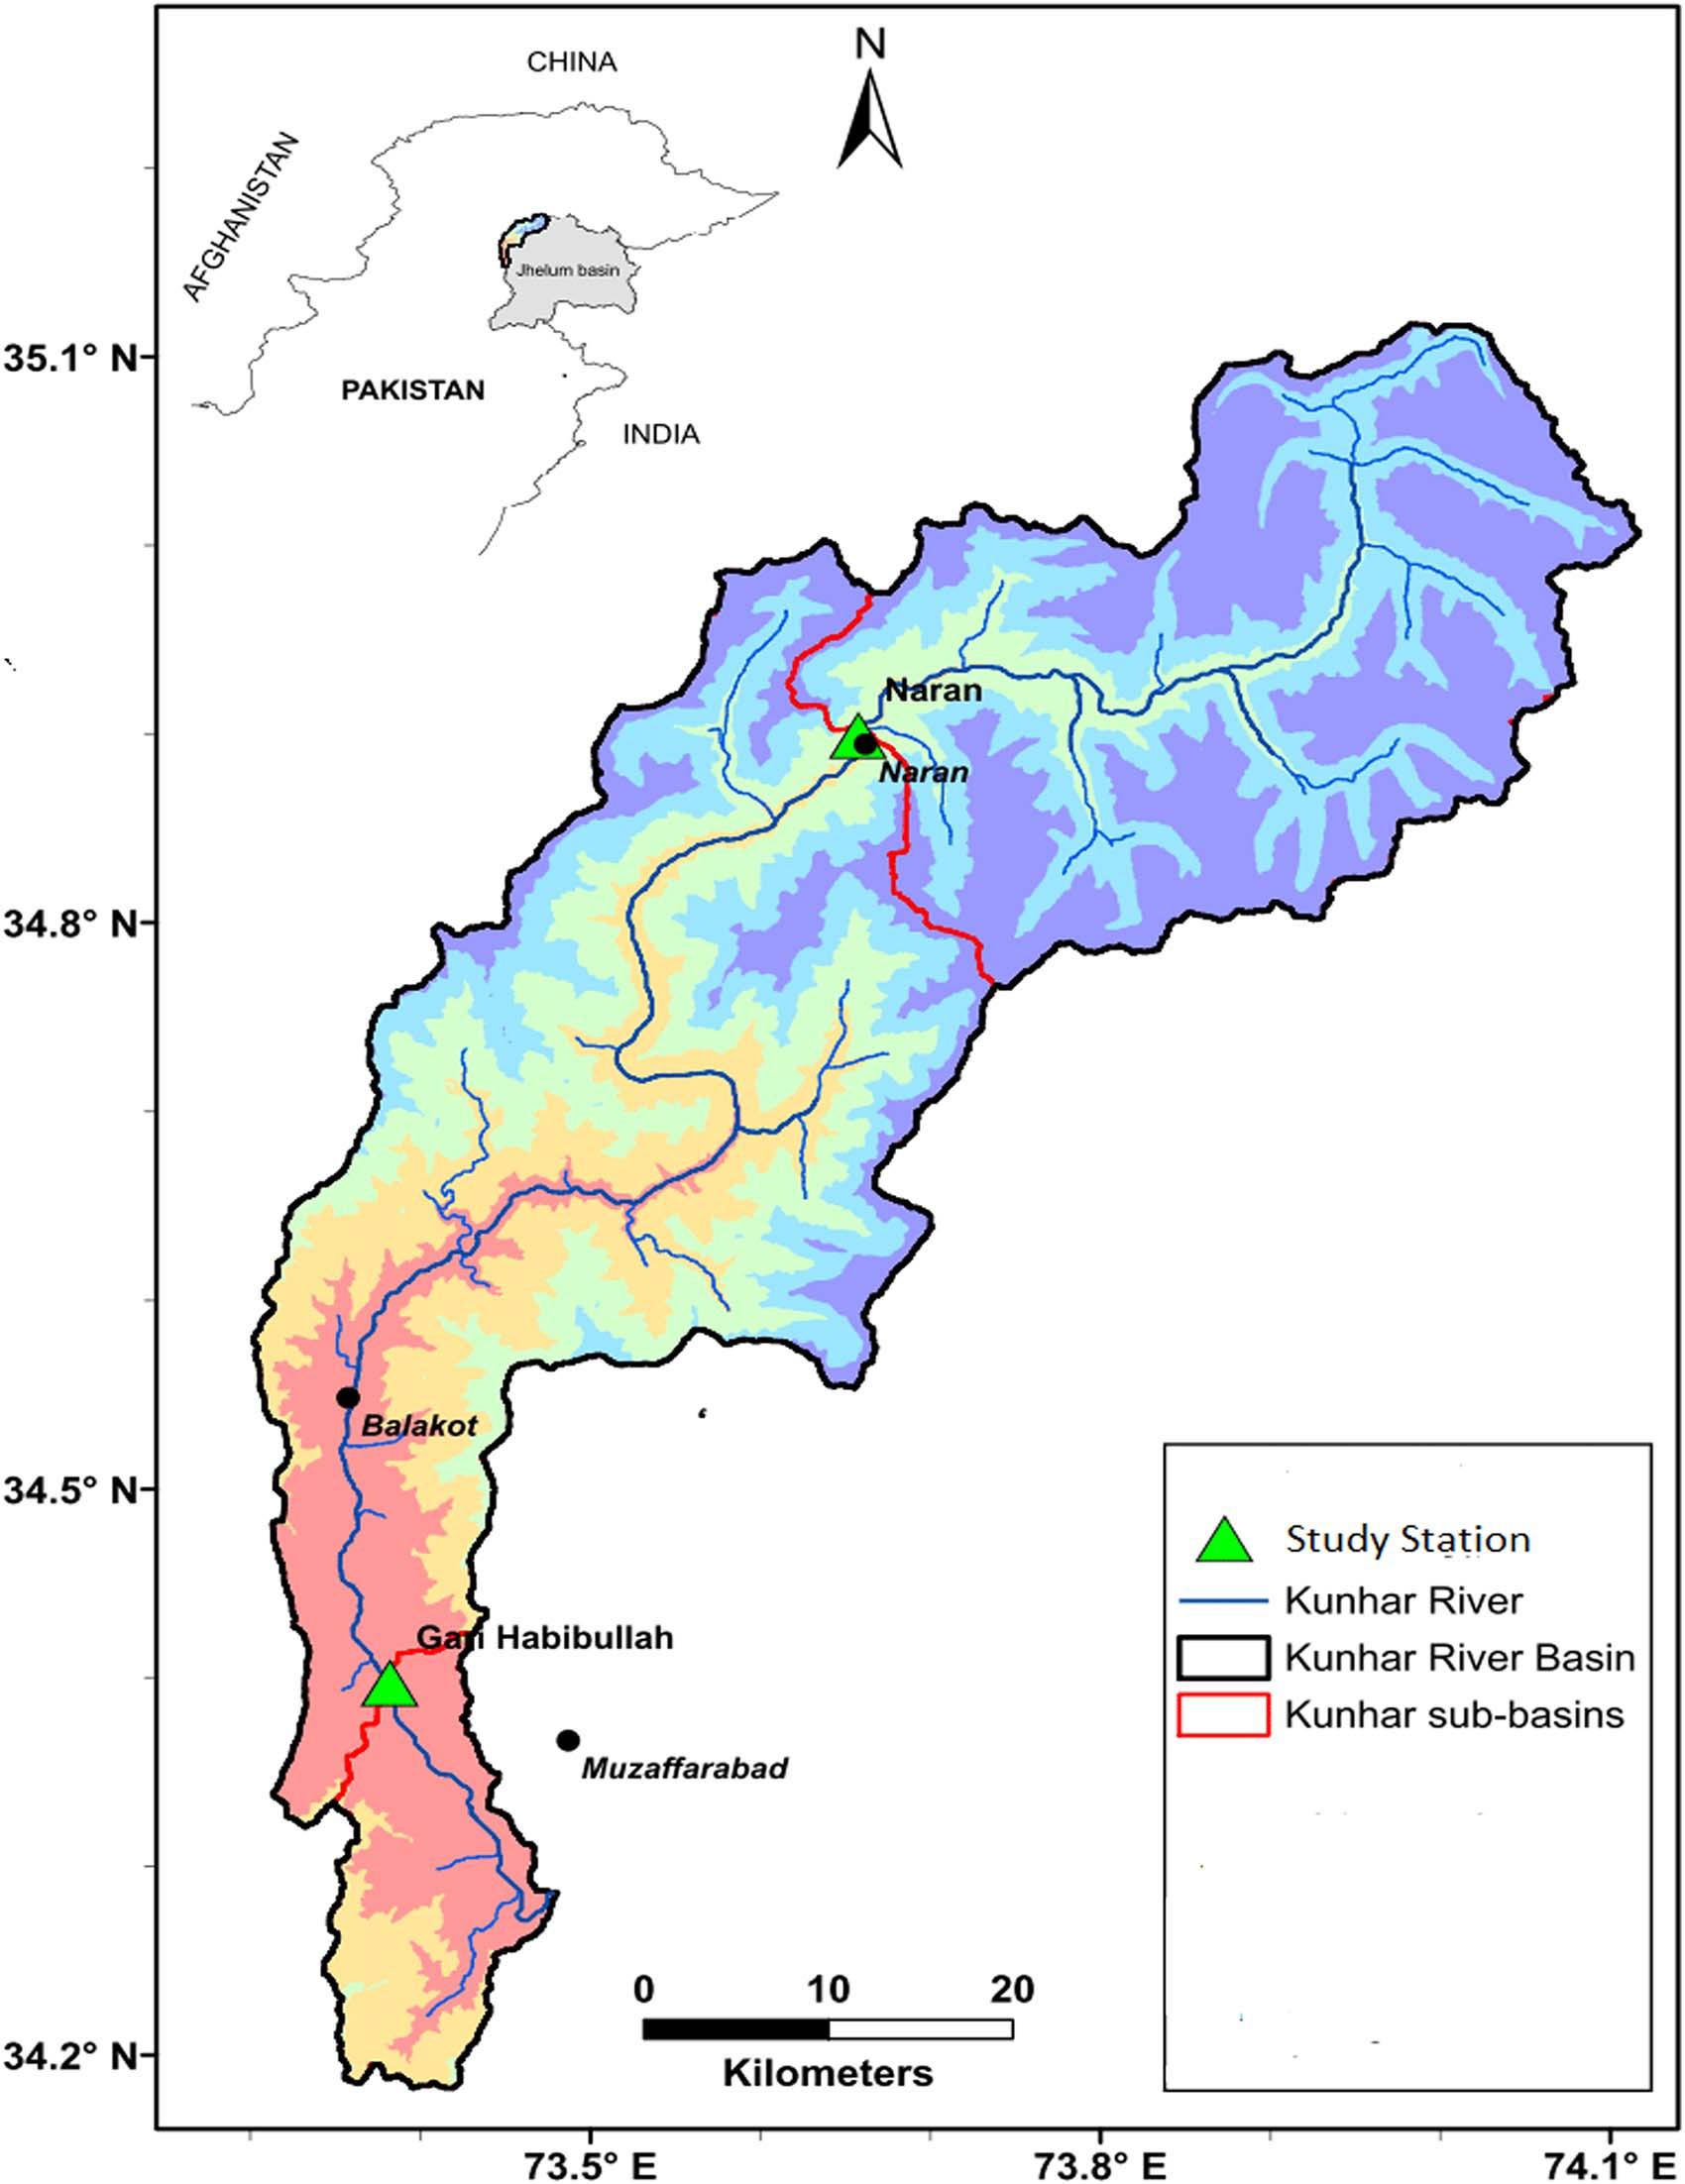
turbiditylevels.Theinitialstirringratewassetto150 rpm(Konkoboetal.,2023).Differentamountsofselected coagulantswereaddedtothreeofthejars.After3minutes, thestirringratewasloweredto40rpm,andthiswasmaintainedfor15minutes.Then,thestirrerswerestoppedcompletely,andthejarswereleftfor1hourofsedimentation (Asrafuzzamanetal.,2011).Thejarwiththehighest
claritywasselectedtoassessthecoagulantactivityinterms ofturbidityreduction.Thewatersamplewasthenwithdrawnfromthetopofthejartoevaluatewater-quality parameters.Theamountofcoagulantthatgavethelowest residualturbiditywasconsideredtheoptimumdosage.The effectofdosagesofnaturalcoagulantsonturbidityreductionwasalsostudied(Satterfield,2005).
Figure1.Locationmapofstudyarea.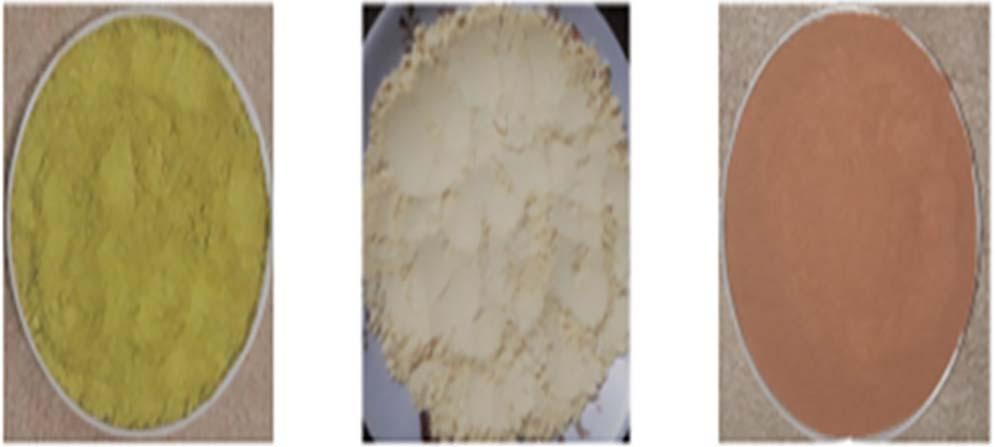
Aftercoagulation,watersampleswerepassedthrough aSSFcolumnhavingaheightofsandabout1/3ofthe totalheightofthecolumn.Thetotalheightofthecolumn was3.0m.Figure4showsasketchofatypicalSSF. Throughthe filter,SSFsystemsarenormallyoperated withagravityfeedofwater,designedfor filtrationrates of2to7m3/m2 filterarea/d(0.083–0.3m/hr).The flow ratewasmaintainedatavalueof0.3m/hr(1.5L/15min). Thesandwaspackedinabedwithatypicaldepthof0.6 to1.4m.Thesandbeddepthwasmaintainedat1min thisresearchwork.Belowthesandbed,thereisasupportinglayer,whichistypicallygravel.Thegravelsupportistypicallythreetosixlayers,withthe finestgrain sizeunderthesandandthecoarsegrainsizedirectlyover theunderdrain.Eachlayerwasgenerally10cm,witha totaldepthof30cm(Bielefeldt,2011).Afterpassing throughthe filtercolumn,thesampleswereagainanalyzedtoevaluatethequalityofthewater.
Toassessthecoagulationactivityofthenaturalextracts andtheefficiencyofthesand filters,physico-chemicaland bacteriologicalparameterswereanalyzedperstandardmethods(Carranzo,2012).Thephysico-chemicalparameters includedpH,turbidity,conductivity,totalsolids,acidity,

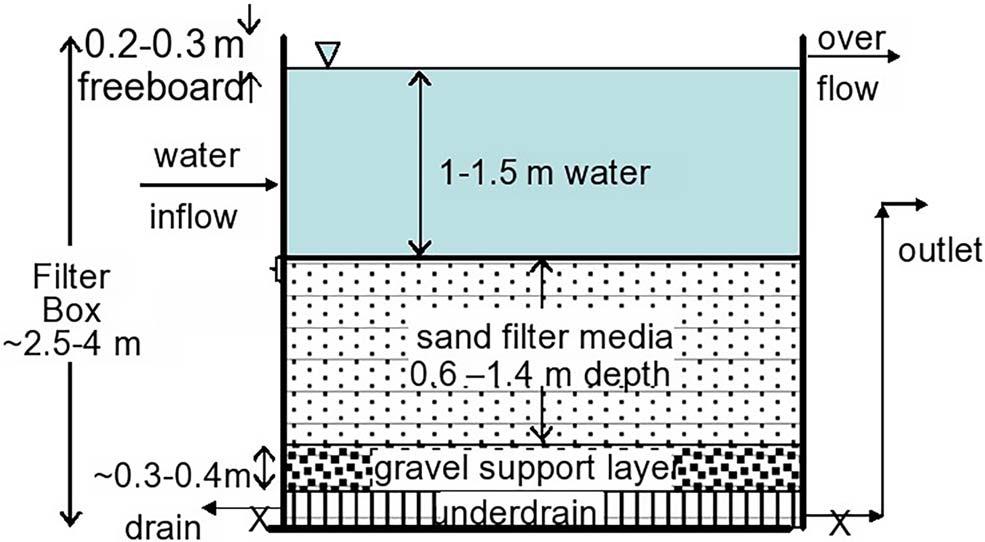
alkalinity,hardness,dissolvedoxygen(DO),biologicaloxygendemand(BOD),chemicaloxygendemand(COD),and chlorides.Thebacteriologicalqualityofwatersampleswas determinedbythetotalcoliformtest.
Physico-ChemicalCharacteristicsofRiver(Kunhar) Water
Thephysico-chemicalcharacteristicsofrawwater sampleswereanalyzedintheEnvironmentalEngineering Laboratory,COMSATSAbbottabad.Thewatersamples weredirectlytakenfromtheKunharRiver.Alltheanalyticalparametersweremeasuredbeforeperformingthejar test.TherawwatercharacteristicsaregiveninTable1.
OptimizationofDosageofNaturalCoagulants
Turbidityisanextremelyusefulandaestheticparameter affectingtheappearanceandacceptabilityofdrinking watertoconsumers.Sinceturbidwaterscontainsuspended andcolloidalparticles,theyarenormallytreatedbycoagulation-flocculationfollowedbya filtrationprocess.This
S.No.AnalyticalParametersObservedValues
Figure3.Jartestingapparatus. Figure4.Typicalconfigurationofslowsand filter(SSF). Figure2. Moringaoleifera, Cicerarietinum,and Pinusroxburghii powder. Table1. Characteristicsofrawwater.Table2. Optimizationofdosageofnaturalcoagulants.
water-qualityparameteritselfdoesnotalwaysrepresenta directrisktopublichealth;however,itcanindicatethe presenceofpathogenicmicro-organismsandbeaneffectiveindicatorofhazardouseventsthroughoutthewater supplysystem.Itcanbeusedasabasisforchoosing betweenalternativesourcewatersandforassessingthe performanceofafewcontrolmeasures,includingcoagulationandclarification, filtration,disinfection,andmanagementofdistributionsystems.Thatiswhyajartestwas performedto findtheoptimumdosageofcoagulantsfor maximumturbidityreduction.Itwasobservedthattheturbidityofrawsurfacewaterdecreasedbyincreasingthe coagulantdosageuptoacertainlimit.
Table2showsthattheresidualturbidityofwatersampleswasmeasuredatdifferentdosagesofnaturalcoagulants.Thespecificamountofcoagulantthatgavethe lowestresidualturbiditywasconsideredtobetheoptimumdosage.For MO leaves,itwasfoundtobe140 mg/L,whichresultedinthelowestresidualturbidityof 22.07 6 2.62nephelometricturbidityunits(NTU).
Similarly,theoptimumdosageof CA wasfoundtobe 305mg/Lwithresidualturbidityof30.49 6 1.94NTU; for PR,theoptimumdosagewasfoundtobe65mg/L withresidualturbidityof45.31 6 7.22NTU.Theconcentrationwasquitelowbecausetheextractwasdark brownincolor,andhigherconcentrationsinwatermay increasetheturbidityoftreatedwater.
Thetabulardataalsorevealedthatabovetheoptimum dosage,theturbidityofwatersamplestendedtoincrease progressively.Afterdeterminingtheoptimumquantityof coagulants,treatedwatersampleswereanalyzedformajor water-qualityparameters.Thesesampleswerethenpassed throughaSSF.Thequalityofthese filteredsampleswas againassessedtocomparetheefficacyofbothmethods.
EffectsofCoagulationandFiltrationonWater-Quality Parameters
InfluenceonTurbidity
Itwasobservedthattheinitialturbidityofrawwater wasfoundtobe241 6 7.81NTU.Aftertreatmentwith
plantextracts,itsvaluewasreducedto22.07 6 2.62to 45.31 6 7.22NTU.Inallthe figures,MTWrepresentsthe valuesforwatersamplestreatedwith MO,CTWrepresents thevaluesforwatersamplestreatedwith CA,andPTW showsthevaluesforwatersamplestreatedwith PR
Therawwatersamplesaswellasthesetreatedsampleswerethenpassedthroughslowsand filters.The finalturbidityvaluereachedupto1.99 6 0.76to6.99 6 0.80NTU.Thesevaluesfallwithinthepermissiblelimit ofWorldHealthOrganization(WHO)guidelines,i.e.,5 NTU.Figure5showsthedecreasingtrendofturbidityat differenttreatmentstages.Inthe figures,FRWshows thevaluesfor filteredrawwatersamples,FMTWisfor filteredwatersamplestreatedwith MO,FCTWisfor filteredwatersamplestreatedwith CA,FPTWisfor filteredwatersamplestreatedwith PR,andDFrepresents thewatersamplesobtainedthroughdirect filtration.
Coagulation-flocculationisthemostwidelyusedtechniquetoremoveturbidityandotherpollutantsfromwater. Inrawwatersamples,initialturbiditywasfoundtobe 241 6 7.81NTU,whichwasbeyondthelimitperthe requirementsofWHO.Inthecurrentstudy,thestudied naturalextractsshowedgoodefficiencyintermsofturbidityremoval.Previousstudiesindicatedthat MO was
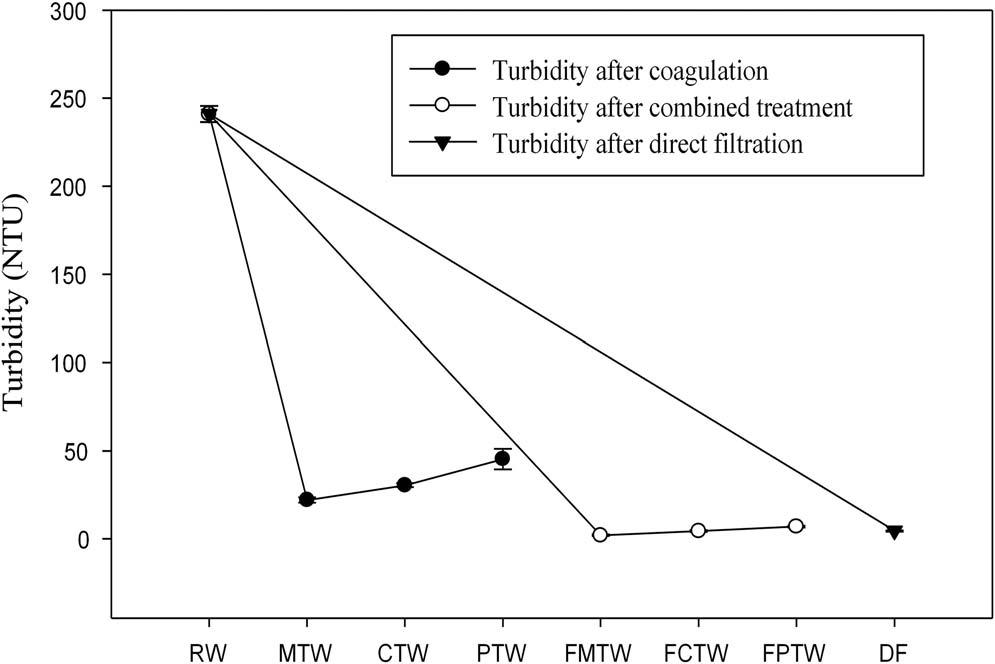
Figure5.Turbidityreductionofriverwaterbynaturalcoagulants and filtration.
foundtobehighlyeffectiveinthereductionofturbidity, havingaremovalefficiencyofabout90–99percent.It wasreportedthattheseextractsweresolubilizedinwater andremainedhighlyactiveduringthecoagulationprocess(Katayonetal.,2006).Duetotheadditionofnatural coagulants,suspendedparticleswereattractedtowardthe activecoagulatingagentbymeansofchargeneutralizationandinter-particlebridging.Flocksizewasincreased, andthesettlementofthe flocksoccurredrapidly.Overdosingofthecoagulantledtothesaturationlevel,andthe turbidityofthesamplesincreasedprogressivelythereafter asthenumberofparticleswasnotsufficienttoformmore inter-particleadsorptionsites(Mangaleetal.,2012).Inthe caseof PR,itwassuggestedthatsuspendedimpuritiesare enmeshedinthepolymericstructureofthetanninby meansofabridgingmechanism.Beltranshowedthatatannin-basedcoagulantprovidedeffectiveresultsinsurface waterclarification(Beltran-Herediaetal.,2011).
After filtration,theturbidityofthewatersampleswas furtherreduced,reachingavalueof1.99 6 0.76to6.99 6 0.80NTU.Ithasbeenreportedthatwhenwatersamples arepassedthroughaSSF,largerparticlesaretrappedin thetoplayersofsand.Smallerparticlesthatareleftin sandmediaareconsumedbymicro-organismsattached tosandgrains.Thus,cleanwaterthatpassedthrougha sand fi lterisconsideredsafeforhumanconsumption (Abudi,2011).
AslightincreaseinpHvalueswasobservedinthecase of MO and CA.Theinitialvaluewasfoundtobe7.366 6 0.135.ThepHofthewatersamplestreatedwith PR decreased,havingavalueof7.216 6 0.077.NoadditionalalkaliswererequiredtomaintainpH fluctuations. ThepHvaluesatdifferenttreatmentstagesareshownin Table3.Afteranalysis,itwasobservedthatpHvalues slightlyincreasedwhensamplesweretreatedwith MO and CA. Sinceaproteinwasfoundtobeanactivecoagulatingagentintheseextracts,itisinterpretedthatthe basicaminoacidsintheproteinsacceptedahydrogenion fromthewater,resultinginthereleaseofahydroxyl groupandturningthesolutionbasic(Mangaleetal., 2012).
Inthecaseof PR,tanninwasfoundtobeanactive coagulatingagent,whichconsistsoflargepolyphenol compounds.Polyphenolcompoundsactasgoodhydrogendonors(Yin,2010).Thus,itwassuggestedthatthe pHofthesesamplesslightlydecreasedduetothepresenceofhydrogenions.
However,apartialdecreasewasfoundinthepHof watersamplesafterbeingpassedthroughtheSSF.The pHvalueswerefoundintherangeof7.010 6 0.144to 7.281 6 0.099,whichfallswithinthepermissiblelimit
6 8.675
Table3. In fl uenceonotherwater-qualityparameters.
l S/cm)283
3Totalsolids(mg/L)480 6 13.75228 6 12.089231 6 9.88230.51 6 13.28532.59 6 8.5943.19 6 9.6848.61 6 7.59959.21 6 6.599
4Hardness(mg/LasCaCO 3 )310 6 25.49200 6 15.69245 6 13.88250 6 12.19101 6 16.01126 6 14.69129 6 18.56160 6 20.69
5Alkalinity(mg/LasCaCO 3 )110 6 13.53120 6 9.53116 6 6.88106.21 6 7.51110 6 8.33105.6 6 6.5495.21 6 6.99104.53 6 12.36
6Acidity(mg/LasCaCO 3 )248 6 8.175200 6 5.67213.23 6 5.99237 6 8.64185.48 6 4.31192.9 6 3.77216.87 6 5.01230 6 7.12
7Dissolvedoxygen(mg/L)9.65 6 0.3438.92 6 0.0599.45 6 0.2999.54 6 0.2799.38 6 0.1929.69 6 0.2549.71 6 0.2019.93 6 0.019
8COD(mg/L)25 6 6.07931.5 6 5.2329.87 6 4.9928.65 6 5.43323.625 6 6.0121.98 6 3.96720.76 6 4.97818.75 6 6.012
9Chlorides(mg/L)100 6 4.34778.01 6 4.5668.96 6 4.6893.51 6 2.9752.19 6 3.5646.56 6 2.68856.789 6 4.08965.219 6 3.154 RW ¼ rawwater;MTW/CTW/PTW ¼ watertreatedwith Moringaoleifera , Cicerarietinum ,or Pinusroxburghii extracts,respectively;FMTW/FCTW/FPTW ¼ fi lteredwatertreatedwith Moringaoleifera , Cicerarietinum ,or Pinusroxburghii extracts,respectively;DF ¼ direct fi ltration;COD ¼ chemicaloxygendemand.
ofWHOguidelines.Theefficiencyofmostcoagulants likealumisdependentuponthepHofthewater,so somealkalisareaddedtomaintainpHlevels.Inthecase ofnaturalmaterials,noadditionalalkalisarerequired. PreviousstudieshaveindicatedthatSSFhasasignificanteffectonthereductionofphysio-chemicalparameters(Nancyetal.,2014).
Fromrawwateranalysis,theinitialvalueofconductivitywasfoundtobe283 6 6.99 lS/cm.Whenextracts wereaddedtorawwatersamples,theirvaluewasslightly increasedduetothepresenceofdissolvedionsinthe water.Amongtheseextracts, PR significantlyincreased thevalueofconductivityupto345 6 6.912 lS/cm.After filtration,thesevalueswerefurtherreducedandwere observedintherangeof268.49 6 8.675to329.7 6 8.678 lS/cm,asillustratedinTable3.
Aftercoagulation,theconductivityofwatersamples slightlyincreased.Thisbasicallyrecordstheionicspecies presentinthewater.Itwasobservedthat,ononehand, chlorideionswerereduced,but,ontheotherhand,other ioniccontentwasincreased.Thisincreaseinioniccontent waslikelythecauseoftheincreasedconductivityofthe watersamples(Katayonetal.,2006).Previousstudies reportedthattheseextractsonlyslightlyaffectedtheconductivityoftreatedwater(Arnoldssonetal.,2008).However,after filtration,ioniccontentwasreducedtosome extent.So,valuesofconductivitywerealsoreduced (Nancyetal.,2014).
Turbidityinthewatersamplesismainlyduetothe presenceoftotalsuspendedsolids.Sincetotalsolidsare acombinationofbothsuspendedanddissolvedsolids, forrawwatersamples,aninitialvalueoftotalsolids wasobservedat480 6 13.752mg/L.Afterbeingtreated withplantextracts,totalsolidsconcentrationwas reducedtotherangeof228 6 12.089to230.51 6 13.285mg/L.After filtration,thesolidscontentinwater sampleswasfurtherreducedtovaluesintherangeof 32.59 6 8.59to59.21 6 6.599mg/L(Table3). MO was foundtobemoreefficient,havingasolidsremovalefficiencyof93.21percent,asillustratedinFigure8a.
Totalsuspendedsolidsinwaterareconsideredtobe themaincauseofturbidity.Aftercoagulation,thesesolidswereadsorbedonthesurfacesofnaturalpolymers. Thisimprovedthesizeofthe flocks.The flockswere removedeasilybythesedimentationprocess(Mangale etal.,2012).The flocksthatfailedtodisappearafter sedimentationwereremovedby filtration.Thevaluesof totalsolidsdidnotexceedthestandardvalueofWHO.
Theconcentrationoftotalsolidswasreducedafter filtrationasthesand filtermediaactedasastrainerinwhich solidswerecaptured.Fadaei(2015)revealedthatSSFs arefoundtobehighlyeffectiveinmakingwaterphysicallyandbiologicallysafe.
Hardnessisthepropertyofwaterthatpreventsthe leatheringactionofsoap.Itismainlyduetothepresence ofcarbonates,bicarbonates,sulfates,andchloridesin thewater.Theinitialvalueofhardnesswasfoundtobe 310 6 25.49mg/LasCaCO3 MO reducedthevalueof hardnessupto67.35percentascomparedtotheother twoextractsrepresentedinFigure8b.
Thenaturalcoagulants,beingpolyelectrolytes,reduced hardnessbyadsorptionandinter-particlebridging.Ithas beenreportedthatduringcoagulation,aprecipitationreactionconvertssolublehardness-causingionsintoinsoluble compounds,thusreducingthehardnessofwatersamples. Thehighervalueofhardnessindicatesthatitcontainsa largernumberofhardness-causingionssuchascalcium, magnesium,etc.(Mangaleetal.,2012).
Alkalinityisthetermthatreferstothebufferingcapacity ofwatersamples.IfthepHofawatersampleincreases, thenalkalinitywillalsoincrease.Fromtheexperimental work,thealkalinityofwatersamplesincreasedinthecase of MO and CA.However,aslightdecreasewasobserved inthewatersamplestreatedwith PR.Theinitialvaluewas observedas110 6 13.53mg/LasCaCO3.Afterthe final treatment,thesevalueswerefoundintherangeof95.21 6 6.99mg/LasCaCO3 to110 6 8.33mg/LasCaCO3,as showninTable3.TheWHOguidelinevalueforalkalinity is200mg/LasCaCO3.
Alkalinitywasfoundtoslightlyincreaseduetothe presenceofahydroxylgroupinwaterinthecaseof MO and CA.Inthewatersamplesbeingtreatedwith PR,this valuewasfoundtodecreaseduetothepresenceofprotonsinpolyphenolcompounds.However,after filtration, thesevalueswereslightlyreducedbecausetheions causingalkalinitywereentrappedinthestickylayer formedonthesandsurface(Nancyetal.,2014).
Acidityisduetothepresenceofhydrogenionsin water.Forrawwater,theinitialvaluewasobservedtobe 248 6 8.175mg/LasCaCO3.Ifalkalinityisincreased, aciditywillbereduced.Inthecaseofwatersamples treatedwith PR,aslightdecreasesinpHandalkalinity wereobserved,whileaciditywasfoundtoincreasei.e.,
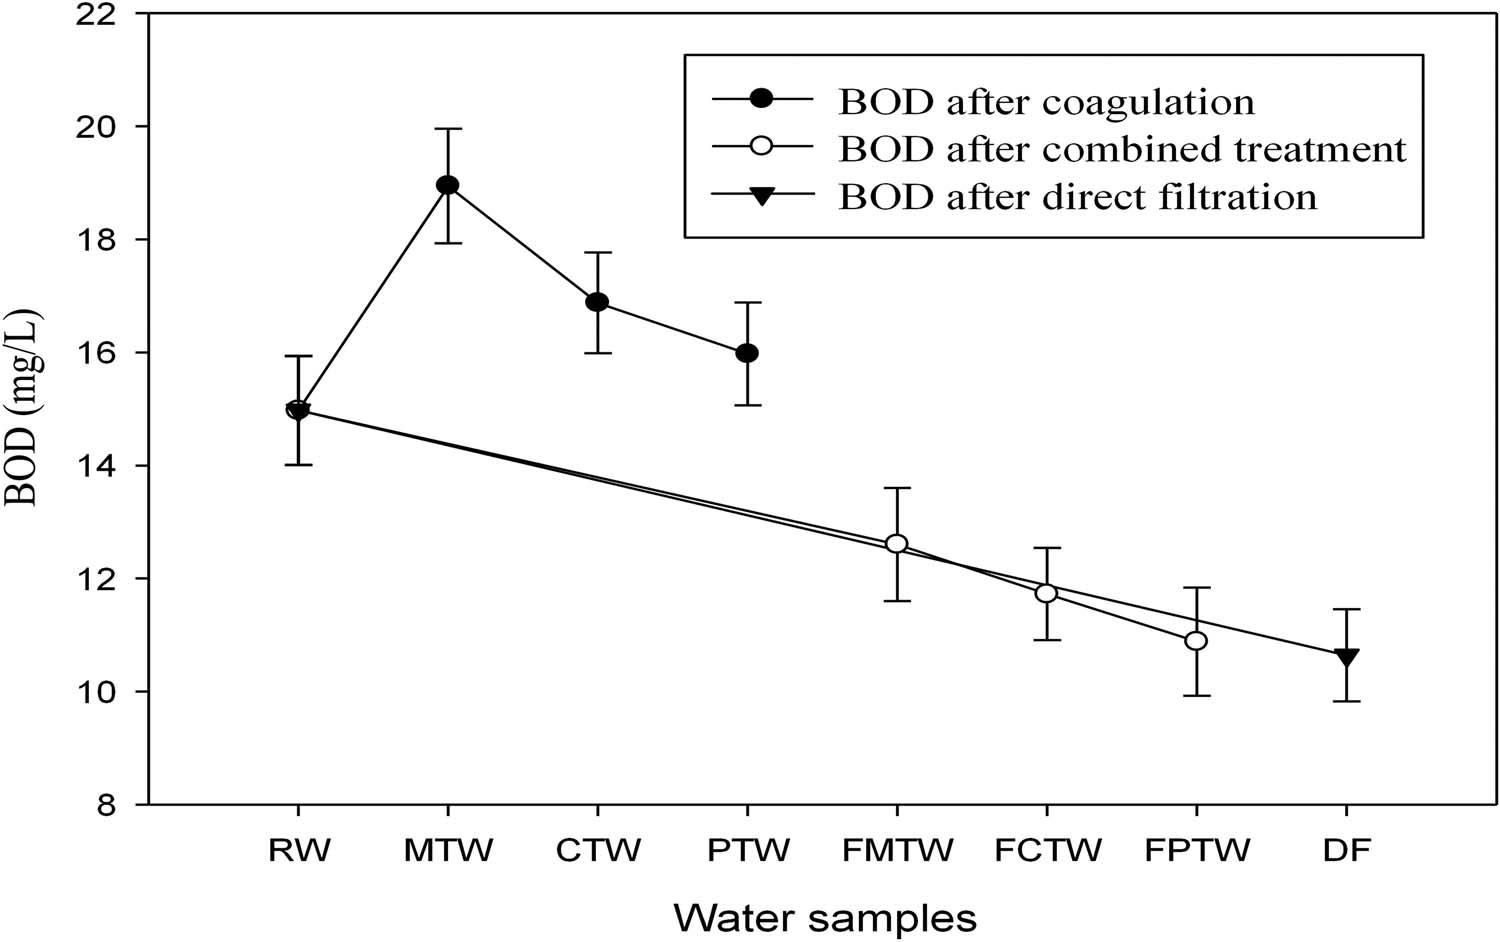
Figure6.Biologicaloxygendemandofriverwaterbeforeandaftertreatment.
237 6 8.64mg/LasCaCO3 ascomparedtoothervalues. Thesevalueswerefurtherreducedafterthe filtrationof treatedwatersamples.
Thesenaturalmaterialscontainlowerwater-soluble proteins,whichexhibitpositivecharges.Whenacrushed formof MO and CA wasaddedtothewater,theprotein contentinitproducedpositivecharges,whichattracted predominantlynegativelychargedparticlesandmaintainedtheaciditylevelofthewatersampleswithinlimits. Inthecaseof PR,phenolicgroupsintanninactedas goodhydrogendonors,whichmayhavehelpedtomaintaintheaciditylevels(Yin,2010).
After filtration,theionsresponsiblefortheacidityof thewatersampleswerecaughtintheporous filtermedia. Thus,theacidityofthewatersampleswasreduced.Previousstudieshavereportedinterestingtrendsinacidity reductionwhenwatersampleswerepassedthroughsand filtermedia(Nancyetal.,2014).
DOistheamountofoxygendissolvedinwater.The valueofDOtendstodecreaseiforganicmatterispresentinwatersources.Aftercoagulation,itwasobserved thatthevalueofDOdecreasedfrom9.65 6 0.343mg/L to8.92 6 0.059–9.54 6 0.279mg/L.Thesevalueswere slightlyincreasedwhensampleswerepassedthrougha sand filter(Table3).
Aftercoagulation,theDOvaluewasreducedasorganic matterfromthenaturalcoagulantswasreleasedintothe watersamples.However,after filtration,theDOvalue slightlyincreasedasporoussandmediaallowedmore
oxygentobedissolvedinthewatersamples.Thepassage ofwaterthroughthesandcolumnservedasasourceof aerationandtherebyincreasedtheDOofwatersamples.
InfluenceonBiologicalOxygenDemand(BOD)
BODisanindicatorofbiodegradableorganicmatter. Priortotreatment,theBODvaluewasobservedtobe 14.97 6 1.67mg/L.Asthesematerialsareorganicin nature,whenusedascoagulants,someorganicmatter wasreleasedintothewatersamples.Thatiswhythe BODvalueincreased.However,afterbeingpassed throughsand filters,thesevalueswerereducedslightly andwerefoundtobeintherangeof10.64 6 1.408–12.96 6 1.719mg/L(Figure6).
InfluenceonChemicalOxygenDemand(COD)
CODistheamountofoxygenrequiredforthedecompositionofbothbiodegradableandnon-biodegradable organicmatter.ItsvaluesarealwayshigherthanBODvalues.Fromtheexperimentalwork,itwasobservedthat MO,althoughbeingmoreefficient,causedasignificant increaseintheCODvalueascomparedto CA and PR. For rawwatersamples,theinitialCODvaluewasfoundtobe 25 6 6.079mg/L.However, MO increasedtheCODvalue upto31.5 6 5.23mg/L,whichwasfarbeyondthepermissiblevalue(lessthan5mg/L)statedbyWHO.Isolation andpurificationofactivecoagulatingagentsmayreduce thevaluesofCODindrinkingwater.Itwasfoundthat thesevaluestendedtodecreaseafterthe filtrationprocess.
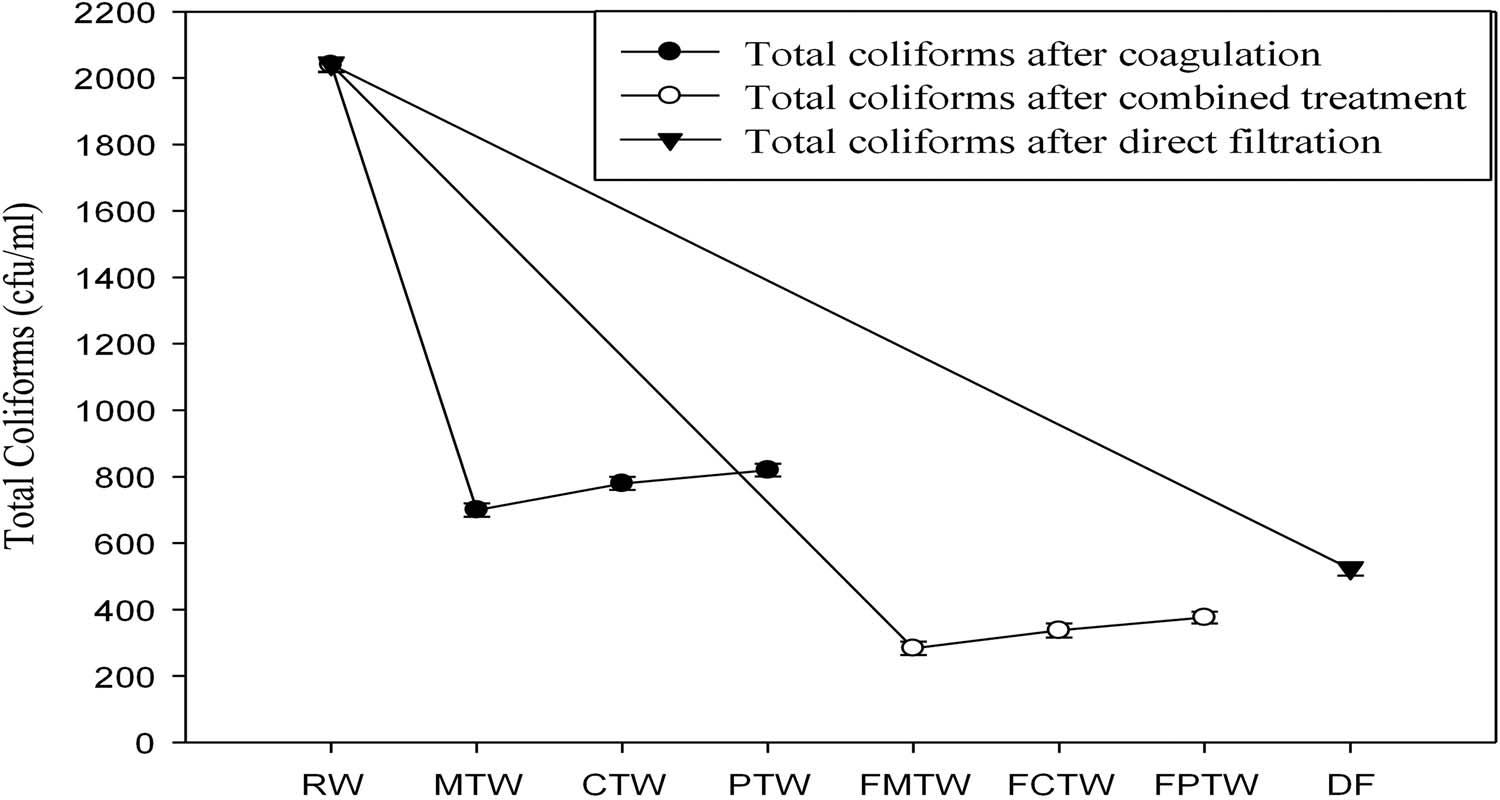
Thesenaturalextractscontainedasignificantamountof organicmatterintheformofBODandCODasreported inpreviousstudies(Blix,2011).Aftercoagulation,some oftheorganicmatterwasreleasedintothewatersample, causinganincreaseinCODandBODvalues.These parametersdonothelptoidentifythespecificorganiccompoundsfoundinthewatersamples(Katayonetal.,2006).
However,after filtration,thesevaluesweresomewhat reduced,supportingpreviouslyreportedobservations showingthatasandbedallowedmoreoxygenforthe conversionoforganicmatterintoinorganicproducts (Elbanaetal.,2012).
Priortotreatment,theinitialvalueofchloridecontent wasfoundtobe100 6 4.347mg/L.Theconcentration ofchloridesinwatersampleswasreducedaftercoagulationand filtrationprocesses.Amongthese, CA was foundtobehighlyeffective,havingachlorideremoval efficiencyof54.85percent(Figure8b).
Itwasobservedthatthevalueofchloridecontent decreasedafterbeingtreatedwiththenaturalextracts. Thiswasduetothefactthatcationsfromthenatural extractsattractedthenegativelychargedchlorideions presentinthewaterandneutralizedthem.However, filtrationfurtherimprovedthechlorideremovalefficiency. Mangaleetal.(2012)reportedthechloridereduction trendbypolyelectrolytes.
Totalcoliformsinwaterindicatefecalcontamination andthepresenceofothermicro-organismslikeviruses,
bacteria,protozoans,etc.Figure7showsthatthetotal coliformswerereducedfrom2,040 6 36.75colonyformingunits(CFU)/mLto700 6 34.97–820 6 32.98 CFU/mLaftercoagulation.However,theirnumberwas furtherreducedafterthe filtrationofthetreatedsamples. MO showedahighercoliformremovalefficiencyof 86.13percent.Theseextractsshowedstrongantimicrobialactivities,asrepresentedinFigure8d.
Thesearetheorganismsusedtoindicatefecalcontaminationinwater.Coliformsaretheleadingcauseofwaterbornediseases.Fordrinkingwater,thisvalueshouldnot begreaterthanzero.Inthecurrentstudy,theinitialvalue ofcoliformswasfoundtobe2,040 6 36.75CFU/mL, whichwasfarbeyondtherequirementsofWHO.These extracts,beingantimicrobialagents,reducedthevalueof totalcoliforms,butthisvaluestilldidnotmeetWHO guidelinevalues.In MO samples,theactiveantibacterial agentwasfoundtobeglucosidalmustardoil(Mangale etal.,2012).Somepreviousresearchstudiesrevealedthat PR alsoexhibitedantibacterialactivityagainst Escherichiacoli andsomeotherbacteria,buttheactiveagent wasstillunidentified(Pariharetal.,2006).Itwasalso reportedthat CA exhibitedstrongantibacterialactivity against Escherichiacoli, Escherichia fecalmaterial,and othermicro-organisms.Peptidesandproteinsalongwith phenoliccompoundsareresponsibleforitsantibacterial activities(Kanetal.,2010).
Filtrationhadapronouncedeffectoncoliform removal.Ithasbeensuggestedthatwhenthewateris passedthroughaSSF,themicro-organismsbecome attachedtothesandgrains,andastickylayerisformed. Theclearwaterobtainedisrecommendedforhuman consumption(Elbanaetal.,2012).Theseextractsdonot causeanyhealthhazardsasrevealedbytoxicological studies(Kouletal.,2022).
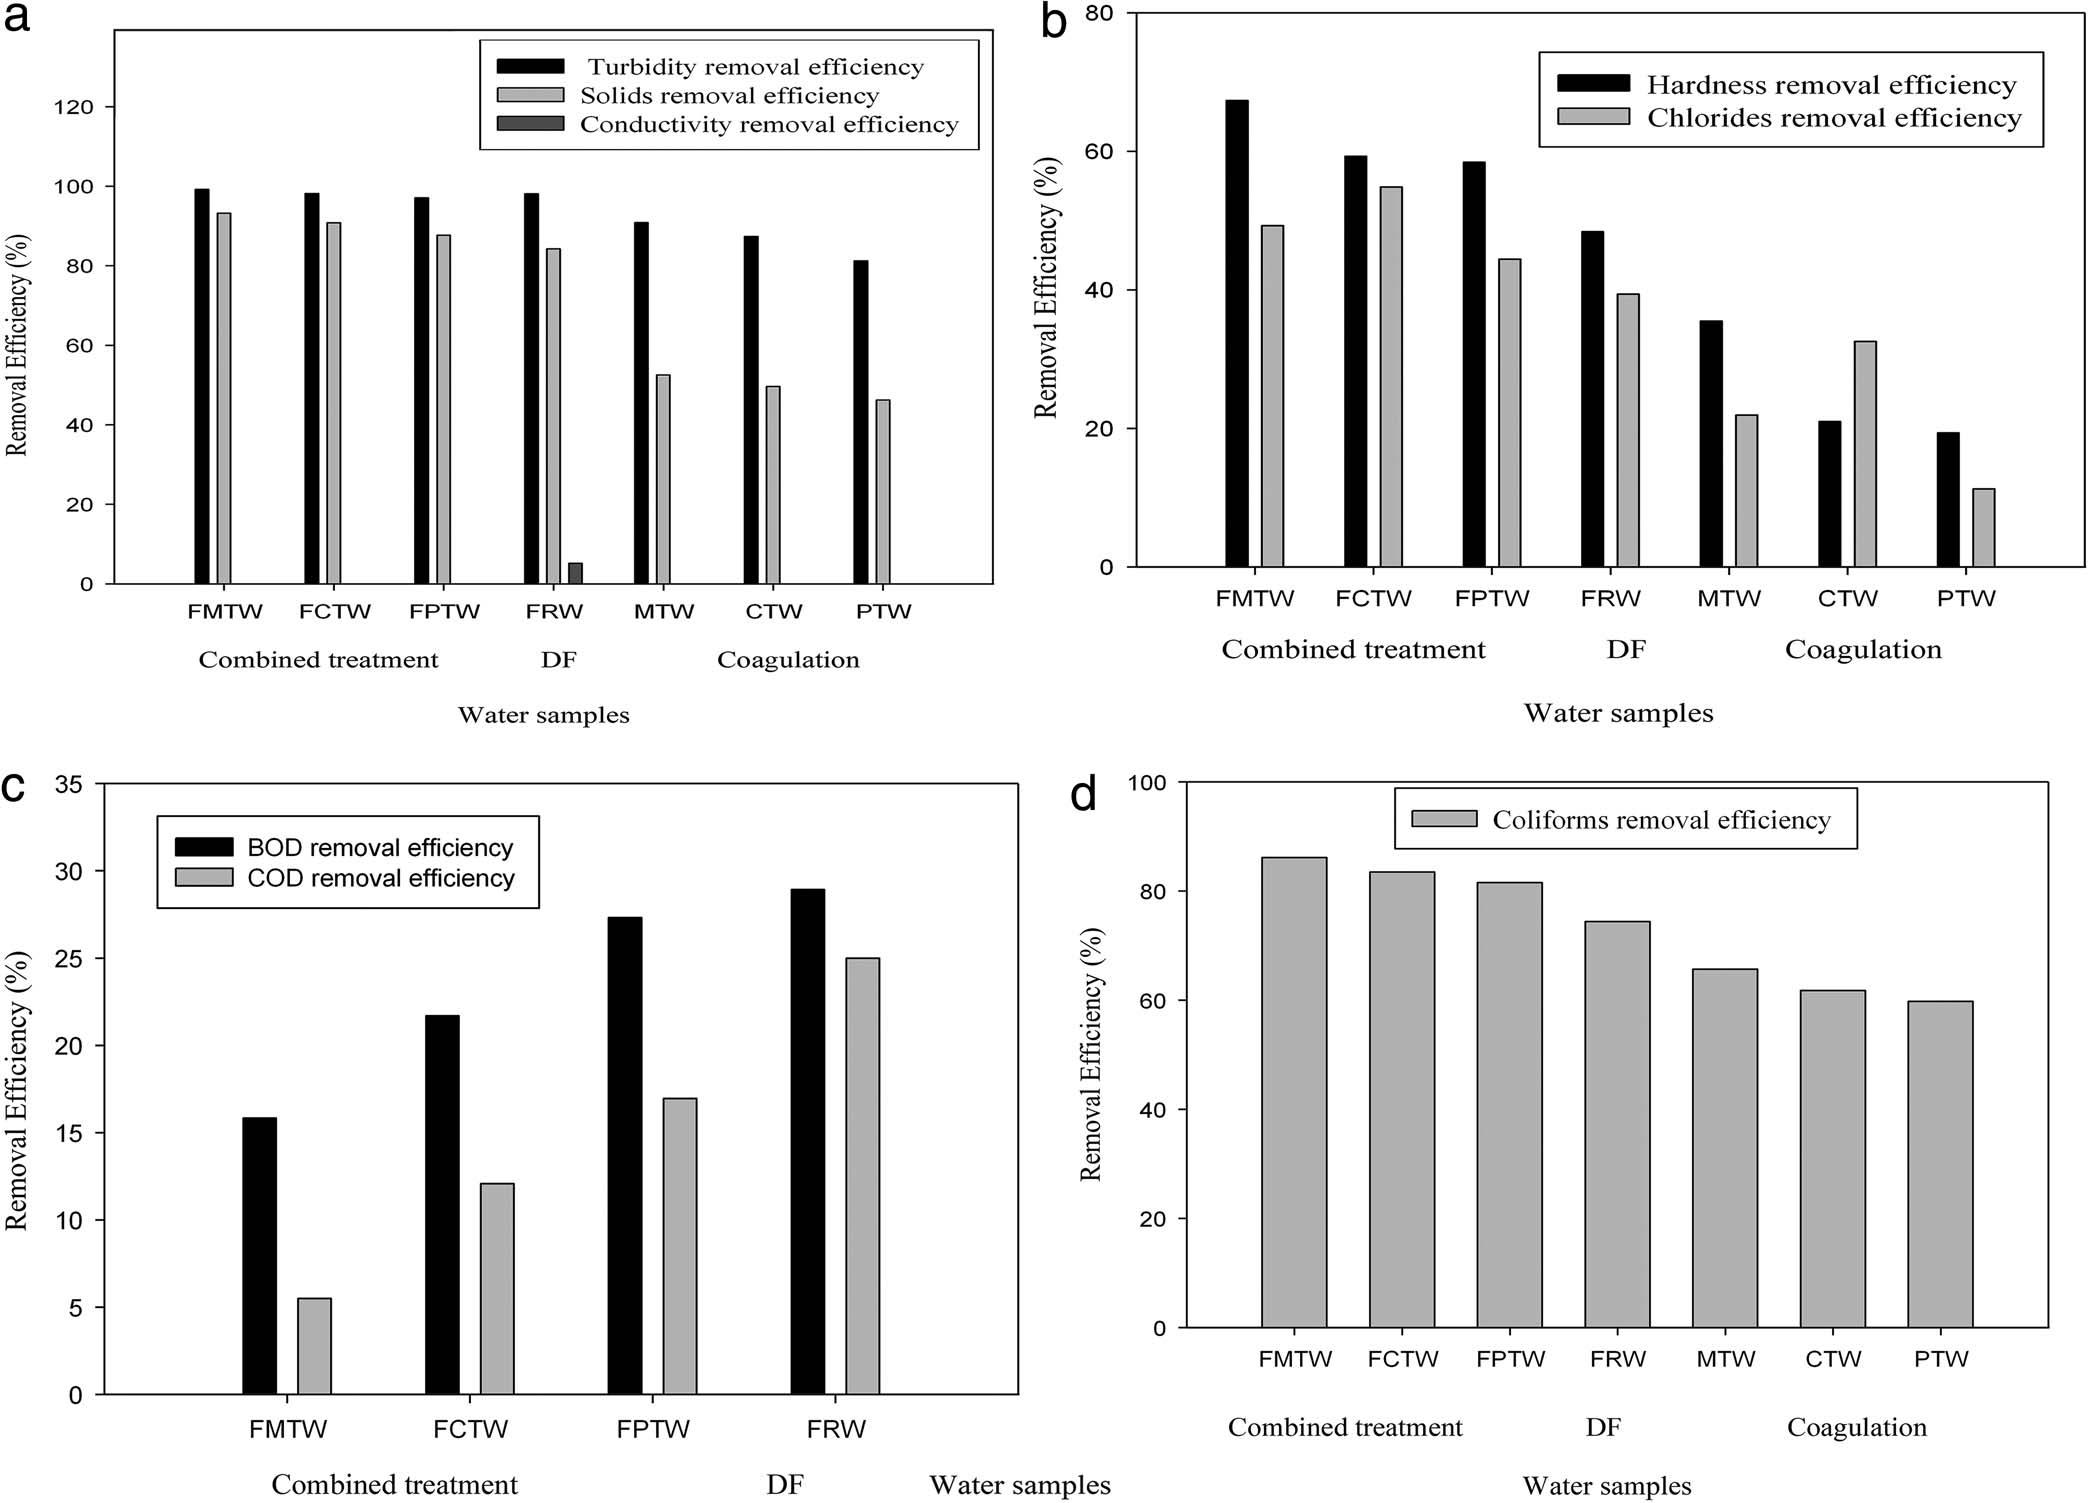
Basedonallthese findings,itwasprovedthatacombinedtreatment(coagulationand filtration)offersthe bestperformanceefficiencyfortheremovalofpollutants inwatersystems.
Physicalqualityparametersincludeturbidity,conductivity,andtotalsolids.Thevaluesofturbidityandtotalsolids werereducedaftertreatment.Mostoftheremovalwasevidentatthe filtrationstage.Valuesofconductivitywere slightlyincreased,butinthecaseofdirect filtration,its valuewasfoundtobedecreased,withapercentageremoval of5.127percent.ThistrendisdepictedinFigure8a.
ThechemicalqualityparametersincludepH,alkalinity, acidity,hardness,andchlorides.Aftercoagulation,values ofpH,alkalinity,andaciditywereslightlyincreased,but theydecreasedafterthe filtrationprocess.Nosignificant reductionwasfoundinthesevalues.TheremovalefficiencyforchemicalparametersisgiveninFigure8b.
TheorganiccharacteristicsthatareusedforthequantificationoforganiccontentincludeBODandCOD.It wasfoundthatthesevaluesincreasedaftercoagulation
butsomewhatdecreasedafter filtration.Forthesevalues, thereductionefficiencywasfoundatthe filtrationstage. ThistrendisrepresentedinFigure8c.
Totalcoliformsaretheorganismsusedtoassessthe biologicalqualityofwater.Thenumberofcoliforms wasreducedaftercoagulation.Theirnumberwasfurther reducedwhenwatersampleswerepassedthroughSSFs. Theefficiencyofcoagulationand filtrationintermsof coliformsremovalisrepresentedinFigure8d.
Finally,itisnotedthatbothwater-treatmenttechniques (conventional/combinedanddirect filtration)arehighly efficientintheproductionofdrinkingwaterwithhigh qualityfromtheviewofphysico-chemicalcharacteristics. Theconventional/combinedtreatmenttechniquebasically usesacombinationofcoagulation,sedimentation, filtration,anddisinfectiontoprovideclean,safedrinkingwater tothepublic.Worldwide,thecombinedmethodisthemost widelyappliedwater-treatmenttechnologyandhasbeen usedsincetheearly20thcentury.Ontheotherhand,direct filtrationinvolvesthe filtrationofwatersampleswithout undergoingcoagulationand flocculation.
Fida,Tanoli,Mahmood,Alamgir,andSajjad
Our findingshowedthatthecombinedtreatmentoffers thebestperformanceefficiencyintermsofturbidity,total solids,hardness,chlorides,andcoliformremovalascomparedtodirect filtration.Thus,thecombinedmethodwas proventobehighlyeffectiveandmorepotentascomparedtodirect filtrationorcoagulationalone.
Inaneraofincreasingenvironmentalissues,natural coagulantsprovideanenvironmentallyfavorablealternativeforwater-purificationpractices.
Forsurfacewatertreatment,threemethodologies havebeenemployed;theyarecoagulation,direct fi ltration,andcombinedtreatment(coagulationand fi ltration).Itwasconcludedthatthecombinedtreatmentis moreeffectiveinimprovingdrinkingwaterquality. The fi lteredwatersamplestreatedwith MO gavethe maximumturbidityreductionof99.17percent,solids reductionof93.21percent,hardnessreductionof67.35 percent,andtotalcoliformremovalof86.13percent. Mostofthepollutantremovalwasnoticeableatthe fi ltrationstage. CA providedamaximumchloridereductionof54.85percentascomparedtotheothertwo extractstested.Theseresultsarequiteencouragingfor futurework.
Amongthesenaturalextracts, MO wasfoundtocause asignificantincreaseinorganiccontentbecausethe organicmatteroriginatingfromtheleavescanbereleased intothewaterduringthetreatmentprocess.Thisorganic mattermayresultinproblemsofodor,color,andtaste andthedevelopmentofmicro-organismsuponstorage. Basedonour findings,itwasconcludedthat MO leaves showedahigherefficacythan CA and PR.Theonlyproblemistheproductionoforganicmatter.Purificationof activeproteinsbyionexchangecanreducethevalueof CODintreatedwater.Thisresearchshowstheeffectivenessof MO forsurfacewatertreatmentandalso illustratesthegreatpotentialof CA and PR aspromisingbio-coagulantsforthetreatmentofpollutedsurface watersamples.
RecommendationsforResearchers
Futureworkshouldbeplannedtofurtherexplorethis areabyundertakingextensivelaboratorystudies.More plantextractsandnaturalmaterialsneedtobetriedfor water-remediationpurposes.
MO leaves, CA seeds,and PR barkcanbeusedas coagulantaids.Itshouldalsobenotedthattheefficiency ofalummaychangeiftheseplantsareusedascoagulant
aids.Theycanalsobeusedforthetreatmentofmunicipal,industrial,andtannerywastewater.
Toremoveorganiccontentfromtreatedwater,other purificationmethodsshouldbeinvestigated.Purification andisolationofactivecoagulatingagentsshouldbe donetoreducetheorganiccontentinwater.
RecommendationsforIndustry
Indevelopingcountries,theuseofplantsascoagulatingagentscombinedwithsand filtrationcanoffersignificantimprovementstodrinkingwaterquality.
Chlorinationcangivethebestresultsifnaturalplants andchlorinemethodsarecombined,andthewaterso producedwillbefreefrompathogenicmicro-organisms. Thereisaneedtodeveloplocalizedwater-purification systemssothatruralareascanusenaturalmaterialsto improvedrinkingwaterquality.
ABUDI,Z.,2011,Theeffectofsand filtercharacteristicsonremoval efficiencyoforganicmatterfromgreywater: Al-QadisiyaJournal forEngineeringSciences,Vol.4,pp.143–155.
AHMAD,R.;RAO,R.A.K.; AND MASOOD,M.M.,2005,Removaland recoveryofCr(VI)fromsyntheticandindustrialwastewaterusing barkof Pinusroxburghii asanadsorbent: WaterQualityResearch JournalofCanada,Vol.40,pp.462–468.
AL AKEEL,K.,2013, EmpiricalInvestigationofWaterPollutionControl ThroughUseof Phragmitesaustralis:DoctoralDissertation,Brunel UniversitySchoolofEngineeringandDesign,London,U.K.,250p. ARNOLDSSON,E.;BERGMAN,M.;MATSINHE,N.; AND PERSSON,K.M., 2008,Assessmentofdrinkingwatertreatmentusing Moringaoleifera naturalcoagulant: Vatten,Vol.64,pp.137.
ASRAFUZZAMAN,M.;FAKHRUDDIN,A.; AND HOSSAIN,M.A.,2011, Reductionofturbidityofwaterusinglocallyavailablenatural coagulants: InternationalScholarlyResearchNotices,Vol.2011, pp.632189.
BASLAR,S.;DOGAN,Y.;DURKAN,N.; AND BAG,H.,2009,BiomonitoringofzincandmanganeseinbarkofTurkishredpineofwestern Anatolia: JournalofEnvironmentalBiology,Vol.30,pp.831–834. BELTRAN-HEREDIA,J.;SÁNCHEZ-MARTÍN,J.; AND DÁVILA-ACEDO,M., 2011,Optimizationofthesynthesisofanewcoagulantfromatanninextract: JournalofHazardousMaterials,Vol.186,No.2–3, pp.1704–1712.
BHUTTA,M.N.;CHAUDHRY,M.R.; AND CHAUDHRY,A.H.,2005,GroundwaterqualityandavailabilityinPakistan.In ProceedingsoftheSeminaronStrategiestoAddressthePresentandFutureWaterQuality Issues,Vol.36.
BIELEFELDT,A.R.,2011,Appropriateandsustainablewaterdisinfectionmethodsfordevelopingcommunities.InBuchanan,K.M. (Editor), WaterDisinfection:NovaSciencePublishers,NewYork, pp.45–75.
BLIX,A.,2011, EnhancingtheCapacityofSeedsasTurbidityRemoval AgentsinWaterTreatment:DegreeProject,DepartmentofLand andWaterResourcesEngineering,RoyalInstituteofTechnology (KTH),Stockholm,Sweden,34p.
CARRANZO,I.V.,2012, StandardMethodsforExaminationofWater andWastewater,22nded.InAnalesdeHidrologíaMédica,Vol.5: UniversidadComplutensedeMadrid:Madrid,Spain,pp.185–186.
CLEMETT,A.E. AND ENSINK,J.H.,2006,Farmerdrivenwastewater treatment:AcasestudyfromFaisalabad,Pakistan.In Conference Proceedingsfromthe32ndWEDCInternationalConferenceon SustainableDevelopmentofWaterResources,WaterSupplyand EnvironmentalSanitation,pp.99–104.
DAUD,M.K.;NAFEES,M.;ALI,S.;RIZWAN,M.;BAJWA,R.A.; SHAKOOR,M.B.;ARSHAD,M.U.;CHATHA,S.A.H.;DEEBA,F.; MURAD,W.;MALOOK,I.; AND ZHU,S.J.,2017,Drinkingwater qualitystatusandcontaminationinPakistan: BioMedResearch International,Vol.2017.
DEEPA,J.;KATTIMANI,D.R.; AND NITHYASHREE,K.,2021,Nutritional compositionofsunandshadedriedformofdrumstickleaves (Moringaoleifera): JournalofPharmacognosyandPhytochemistry,Vol.10,pp.2523–2525.
ELBANA,M.;DE CARTAGENA,F.R.; AND PUIG-BARGUÉS,J.,2012,Effectivenessofsandmedia filtersforremovingturbidityandrecovering dissolvedoxygenfromareclaimedeffluentusedformicro-irrigation: AgriculturalWaterManagement,Vol.111,pp.27–33.
ENSINK,J.H.;SIMMONS,R.; AND VAN DER HOEK,W.,2004,Wastewater useinPakistan:ThecasesofHaroonabadandFaisalabad.InScott, C.A.;Faruqui,N.I.;andRaschid-Sally,L.(Editors), Wastewater UseinIrrigatedAgriculture:ConfrontingtheLivelihoodandEnvironmentalRealities:CABI,Wallingford,U.K.,pp.91–99.
FADAEI,A.,2015,Comparisonoftheefficiencyofphysicalandbiologicaltreatmentofslowsand filterinKahkash(Samaan)treatment plant: ResourcesandEnvironment,Vol.5,pp.107–109.
FERGUSON,C.M.;DAVIES,C.M.;KAUCNER,C.;ASHBOLT,N.J.;KROGH, M.;RODEHUTSKORS,J.; AND DEERE,D.A.,2007,Fieldscalequantificationofmicrobialtransportfrombovinefaecesundersimulated rainfallevents: JournalofWaterandHealth,Vol.5,pp.83–95.
FOUAD,M.M.;EL-GENDY,A.S.;KHALIL,M.M.H.; AND RAZEK, T.M.A.,2021,Aluminumsulfateregenerationfromsurfacewater treatmentwasteinCairo,Egypt: EnvironmentalScienceandPollutionResearch,Vol.28,pp.61450–61459.
FUENTE,D.;ALLAIRE,M.;JEULAND,M.; AND WHITTINGTON,D.,2020, Forecastsofmortalityandeconomiclossesfrompoorwaterand sanitationinsub-SaharanAfrica: PLOSOne,Vol.15,No.3,pp. e0227611.
GHOSH,M. AND SINGH,S.,2005,Areviewonphytoremediationof heavymetalsandutilizationofitsby-products: AsianJournalon EnergyandEnvironment,Vol.6,pp.18.
KAN,A.;OZCELIK,B.;KARTAL,M.;OZDEMIR,Z.; AND OZGEN,S.,2010, Invitro antimicrobialactivitiesof Cicerarietinum L(chickpea): TropicalJournalofPharmaceuticalResearch,Vol.9,pp.475–481.
KANDIMALLA,R.;VALLAMKONDU,J.;CORGIAT,E.B.; AND GILL,K.D., 2016,UnderstandingaspectsofaluminumexposureinAlzheimer ’s diseasedevelopment: BrainPathology,Vol.26,pp.139–154.
KATAYON,S.;NOOR,M.M.M.;ASMA,M.;GHANI,L.A.;THAMER, A.M.;AZNI,I.; AND SULEYMAN,A.M.,2006,Effectsofstorage conditionsof Moringaoleifera seedsonitsperformanceincoagulation: BioresourceTechnology,Vol.97,No.13,pp.1455–1460.
KAZI,T. AND VIRUPAKSHI,A.,2013,Treatmentoftannerywastewaterusing naturalcoagulants: InternationalJournalofInnovativeResearchin Science,EngineeringandTechnology,Vol.2,pp.4061–4068.
KHAN,I.;SINGH,V.; AND CHAUDHARY,A.K.,2012,Hepatoprotective activityof Pinusroxburghii Sarg.woodoilagainstcarbontetrachlorideandethanolinducedhepatotoxicity: BangladeshJournal ofPharmacology,Vol.7,pp.94–99.
KONKOBO,F.A.;DIAO,M.;SAVADOGO,P.W.;DIARRA,J.; AND DICKO, M.H.,2021,Comparativestudyoftheeffectsofherbalandchemicalcoagulantsintheclarificationofrawwater: AfricanJournalof AgriculturalResearch,Vol.17,pp.532–541.
KONKOBO,F.A.;SAVADOGO,P.W.;DIAO,M.;DAKUYO,R.; AND DICKO, M.H.,2023,Evaluationoftheeffectivenessofsomelocalplant extractsinimprovingthequalityofunsafewaterconsumedin
developingcountries: FrontiersinEnvironmentalScience,Vol.11, pp.204.
KOUL,B.;BHAT,N.;ABUBAKAR,M.;MISHRA,M.;ARUKHA,A.P.; AND YADAV,D.,2022,Applicationofnaturalcoagulantsinwatertreatment:Asustainablealternativetochemicals: Water,Vol.14,No. 22,pp.3751.
KRUPINSKA,I.,2020,Aluminiumdrinkingwatertreatmentresiduals andtheirtoxicimpactonhumanhealth: Molecules,Vol.25,pp. 641–713.
MANGALE,S.;CHONDE,S.;JADHAV,A.; AND RAUT,P.,2012,Studyof Moringaoleifera (drumstick)seedasnaturalabsorbentandantimicrobialagentforriverwatertreatment: JournalofNaturalProduct andPlantResources,Vol.2,pp.89–100.
MCCLELLAND,P.H.;KENNEY,C.T.;PALACARDO,F.;ROBERTS,N.L.S.; LUHENDE,N.;CHUA,J.;HUANG,J.;PATEL,P.;SANCHEZ,L.A.;KIM, W.J.;KWON,J.;CHRISTOS,P.J.; AND FINKEL,M.L.,2022,Improved waterandwastemanagementpracticesreducediarrheariskinchildrenunderage fiveinruralTanzania:Acommunity-based,crosssectionalanalysis: InternationalJournalofEnvironmental ResearchandPublicHealth,Vol.19,No.7,pp.4218.
NANCY,A.B.;JOSEPHINE,M.; AND LIZZY,M.A.,2014,Slowsand filtrationofsecondarysewageeffluent:Effectofsandbeddepthon filterperformance: InternationalJournalofInnovativeResearchin Science,EngineeringandTechnology,Vol.3,pp.15090–15099.
PARIHAR,P.;PARIHAR,L.; AND BOHRA,A.,2006,Antibacterialactivity ofextractsof Pinusroxburghii Sarg: BangladeshJournalofBotany,Vol.35,pp.85–86.
QURESHI,R. AND ASHRAF,M.,2019,Watersecurityissuesofagriculture inPakistan: PakistanAcademyofSciencesIslamabad, Pakistan, Vol.1,pp.41.
SANGHI,R. AND BHATTACHARYA,B.,2005,Comparativeevaluationof naturalpolyelectrolytespsylliumandchitosanascoagulantaids fordecolourizationofdyesolutions: WaterQualityResearchJournalofCanada,Vol.40,pp.97–101.
SANGHI,R.;BHATTACHARYA,B.; AND SINGH,V.,2002, Cassiaangustifolia seedgumasaneffectivenaturalcoagulantfordecolourisation ofdyesolutions: GreenChemistry,Vol.4,pp.252–254.
SATTERFIELD,Z.,2005, TechBriefJarTesting:NationalEnvironmental ServicesCenter(NESC),Morgantown,WV,4p.
SHARMA,S.;YADAV,N.;SINGH,A.; AND KUMAR,R.,2013,Nutritional andantinutritionalprofileofnewlydevelopedchickpea(Cicer arietinum L)varieties: InternationalFoodResearchJournal,Vol. 20,pp.805–810.
SIVAKUMAR,D.,2013,Adsorptionstudyonmunicipalsolidwaste leachateusing Moringaoleifera seed: InternationalJournalof EnvironmentalScienceandTechnology,Vol.10,pp.113–124.
SOOMRO,M.;KHOKHAR,M.;HUSSAIN,W.; AND HUSSAIN,M.,2011, DrinkingWaterQualityChallengesinPakistan:PakistanCouncil ofResearchinWaterResources,Lahore,Pakistan,pp.17–28.
SULTANA,S.,2020,Nutritionalandfunctionalpropertiesof Moringa oleifera: MetabolismOpen,Vol.8,100061.
TAHIR,D. AND ASLAM,M.,2010, TechnicalAssessmentSurveyReport ofWaterSupplySchemes SindhProvince,Islamabad:Provision ofSafeDrinkingWaterProject:PakistanCouncilofResearchin WaterResources,MinistryofScienceandTechnology.
TANVIR,M.A.,2010, PerformanceofVariousTreeSpeciesasIrrigatedbyUrbanWastewater: Doctoraldissertation,Departmentof Forestry,UniversityofAgriculture,Faisalabad,Pakistan,119p.
THOMAS,T.A. AND KANI,K.M.,2016,Efficiencyofslowsand filterin wastewatertreatment: InternationalJournalofScientificandEngineeringResearch,Vol.7,No.4,pp.315–317.
VERMA,K. AND NIGAM,R.,2014,Nutritionalassessmentofdifferent partsof MoringaoleiferaLamm collectedfromcentralIndia: JournalofNaturalProductandPlantResources,Vol.4,pp.81–86.
VIJAYARAGHAVAN,G.;SIVAKUMAR,T.; AND VIMAL KUMAR,A.,2011,Applicationofplant-basedcoagulantsforwastewatertreatment: InternationalJournalofAdvancedEngineeringResearchandStudies,Vol.1, pp.88–92.
YIN,C.Y.,2010,Emergingusageofplant-basedcoagulantsfor waterandwastewatertreatment: ProcessBiochemistry,Vol.45, pp.1437 –1444.
YONGABI,K.,2010,Biocoagulantsforwaterandwastewaterpurification:Areview: InternationalReviewofChemicalEngineering, Vol.2,pp.444–458.
Z HANG ,Q.;Z HANG ,F.;N I ,Y.; AND K OKOT,S.,2019,Effectsofaluminumonamyloid-betaaggregationinthecontextofAlzheimer ’sdisease: ArabianJournalofChemistry,Vol.12,No8, pp.2897 –2904.
,Vol.XXX,No.1-2,May2024,pp.77
AProposedProcess-Landform-Material(PLM) SystemforEngineeringGeologyFieldMapping
PAULM.SANTI*ColoradoSchoolofMines,1500IllinoisStreet,Golden,CO80401
JEFFREYR.KEATON
WSPUSA,1230WWashingtonStreet,Tempe,AZ85281
KeyTerms: Mapping,Surficial,Geomorphology, Landform
SinceWilliamSmithpublishedhisfamous1815geologic mapofGreatBritain,geologicmapshavebecomeanindispensableandversatiletooltounderstandtheEarth.From these “primary” datamaps,usersareabletogenerate “derivative” maps(Dramisetal.,2011)tounderstandmineraland petroleumdeposits,topredictrockunitsandconditionsin thesubsurface,andtoestimateengineeringgeologicpropertiesinareaswheresurficialmaterialsdominate,amongother things.Arecentarticleevengoessofarastosuggestthe valueina “ properties fi rst ” mappingstyleinsteadofa “ classi fi cation first” style(Kirkwood,2022).Inparallel, primaryengineeringgeologicmapsrecordspatialdistributionsthatarethebaseforderivativemaps,suchasEarthrelatedhazards,geotechnicalmaterialsandproperties, expectedbehaviorsofshallowmaterials,andrangesof groundresponsestonaturalandhuman-inducedimpacts.
ThiswastheimplicitgoalofKeaton(1984),whointroducedtheGenesis-Lithology-Qualifier(GLQ)system,incorporatingthemappingelementsfromGalster(1977)to producemapsthataresimple,capturegeologicdatawith engineeringutility,andarebroadlyapplicableandversatile.TheGLQsystemwasrecommendedforengineering geologymappinginCompton’s(1985) GeologyintheField SincepublicationoftheGLQsystem,theauthorshaveused thissystemondozensofengineeringgeologyprojectsand taughtthesystemtonearly1,000students.Basedonthis experience,werealizetheusefulnessofengineeringgeologymapsandthebene fi tsofanupdateandrevisionto addressinconsistenciesandenhanceelementsthatmayhave beenconfusingtomappinggeologistsornon-geologistusers.
Thevalueandutilityofmapsthatdisplayprimarydata inengineeringgeologyarethattheycapturemoreinformationthanaderivativemap,withdatapresentedmore
*Correspondingauthoremail: psanti@mines.edu
objectivelyforconstituentmaterialsandkeycharacteristics.Similartoclassicgeologicmaps,thecreator inherentlyinjectsgenerallyunintendedpersonalinterpretationsandbiases:atsomepoint,adecisionneedstobe madeonthecategoryorformationatalocation,andtwo differentmappersmighthavediverseopinionsorbe guidedbyvariousmappingobjectives.However,theprimarydatamapdoesnotinterpretthesignificanceorcommentonthepropertiesofthemapunitinquestion.Primary engineeringgeologydatamaps,suchasgeology maps,donothaveoverlapinpolygons:thatis,each spotonthemap fi tsintoonlyonecategory,which wouldbeaspeci fi cgeologicformationinageology maporaspeci fi cprocess-landformcombinationina primaryengineeringgeologymap.Derivativemaps donotnecessarilyhavethisrequirement.Forexample,asinglelocationinahazardmapcouldbesubject toseveralhazardssimultaneously.
Accordingly,themainpurposesofthisTechnicalNote are(1)tobrieflyreviewexistingengineeringgeologysystems,(2)todemonstratetheneedforaconsistentand broadlyapplicableprimarymappingmethodology,and (3)topresentandexplaintheProcess-Landform-Material (PLM)mappingclassification.
Alargebodyofliteratureofmappingrelatestoengineeringgeology.Someexamplesthatcommentontheprocess includeDearman(1991),Grif fi ths(2016),andThomas (1990).ChaminéandFernandes(2023)provideadetailed citationlistofbestpracticesandexamplesofappliedgeologicmapsforengineeringpurposes,aswellasdiscussion oftechniquesformapping.Toalargedegree,thisliterature demonstratesmappingsystemsthatblendderivative elements,suchashazardanalysis,zoning,risk,andterrain characteristics,alongwithprimarydataelements,suchas surficialmaterials,landforms,andsoiltypes.
Anotherapproachtomappingengineeringgeologystarts withgeomorphologicmaps.Forexample,Hearn(2019)
Table1. Process-Landform-Material(PLM)mappingsystem.Forsoil(non-lithified)materials,theuserstartsatthetopoftheleftcolumn,indicatingthedominantprocessforanobserveddeposit,followedbydesignationofthelandformtypeandthenmaterialgrainsizesandestimateof depositthickness.Underlyingmaterialsmaybedescribedusingthesameprocedure.Forrockmaterials,theuserstartontherightcolumn,indicatingtherocktypeandthedegreeofweatheringandfracturing,alongwithanestimateofunitthickness.
UnconsolidatedMaterialsBedrockMaterials
P(l)m(t),whereMM(ww)(ff)(t),where P ¼ processsymbol;singlecapitalletterMM ¼ conventionalgeologicshorthandforbedrocktype;twocapitalletters (l) ¼ landformsymbol;oneormorelowercaselettersinparenthesesww ¼ degreeofweatheringinparentheses,ifavailable m ¼ materialsymbol;oneormorelowercaselettersff ¼ degreeoffracturinginparentheses,ifavailable (t) ¼ thickness,ifknown;includingfeetormetersymbolinparentheses(t) ¼ thickness,ifknown;includingfeetormetersymbolinparentheses
ProcessSymbols(“P” Above) (LandformSymbols; “l” Above)BedrockType(“MM” Above)
A 5 alluvial(runningwater) (f) ¼ fan (fp) ¼ present floodplain (te) ¼ terrace (p) ¼ pedimentdeposit (s) ¼ streamdeposit
R 5 residual(nomovement) (sa) ¼ saprolite (wp) ¼ weatheringprofile
C 5 colluvial(slightmovement) (sw) ¼ slopewash (cr) ¼ creepdeposit
S 5 slide(significantmovement) (fl) ¼ debris flowfan (da) ¼ debrisavalanche (sl) ¼ slump (ls) ¼ lateralspread (tr) ¼ translational (ro) ¼ rotational (to) ¼ topple (fa) ¼ fall(rockorsoil) (ta) ¼ talusconeorchute (ra) ¼ rockavalanche
G 5 glacial (ot) ¼ outwashterrace (k) ¼ kame (es) ¼ esker (em) ¼ endmoraine (gm) ¼ groundmoraine (lm) ¼ lateralmoraine (rg) ¼ rockglacier
P 5 periglacial (pg) ¼ patternedground (ge) ¼ gelifluction (so) ¼ solifluction
L 5 lacustrine
(le) ¼ lowenergy (b) ¼ beach (de) ¼ delta (ma) ¼ marsh (va) ¼ varves (pl) ¼ playa
M 5 marineandcoastal (b) ¼ beach (de) ¼ delta (et) ¼ estuary (ma) ¼ marsh (sp) ¼ swamp (ti) ¼ tidelands
E 5 eolian (d) ¼ dune (l) ¼ loess (st) ¼ strippedplains
V 5 volcanic (a) ¼ ash (la) ¼ lapilli (pu) ¼ pumice (cl) ¼ clinker (vc) ¼ volcaniclastic (lh) ¼ lahar
K 5 karst (si) ¼ sinkhole (uv) ¼ uvala (po) ¼ polje (to) ¼ towerkarst
F 5 fill(humanmade) (u) ¼ uncompacted (e) ¼ engineered
Note:A/C ¼ interbeddedalluvialandcolluvialmaterials; A-C ¼ uncertaintyofprocess.
Sedimentary
SS ¼ sandstone
SH ¼ shale
LS ¼ limestone
DO ¼ dolomite
CG ¼ conglomerate
BR ¼ breccia
ST ¼ siltstone
CH ¼ chert
CS ¼ claystone
DT ¼ diatomite
CE ¼ cementedsoils
Igneous
GR ¼ granite
BA ¼ basalt
GA ¼ gabbro
DI ¼ diorite
FE ¼ felsite
SY ¼ syenite
TU ¼ tuff
BR ¼ breccia
RH ¼ rhyolite
AN ¼ andesite
IG ¼ undifferentiated
Weathering(“ww” Above)
xw ¼ extremelyweathered (soil-like)
hw ¼ highlyweathered (weakenedthroughout)
mw ¼ moderatelyweathered (penetrativediscoloring)
sw ¼ slightlyweathered (discoloredfractures)
uw ¼ unweathered
Metamorphic
QT ¼ quartzite
AR ¼ argillite
SC ¼ schist
GN ¼ gneiss
GS ¼ greenstone
HO ¼ hornfels
PH ¼ phyllite
MA ¼ marble
SL ¼ slate
SE ¼ serpentine
ME ¼ undifferentiated
Humanmade
CC ¼ Portlandcementconcrete
AC ¼ asphaltconcrete
PA ¼ undifferentiatedpavement
FractureSpacing(“ff” Above)
nf ¼ narrow(,2cm)
nmf ¼ narrowtomoderate(2–6cm)
mwf ¼ moderatetowide(6–20cm)
wf ¼ wide(20–60cm)
vwf ¼ verywide(60–200cm)
ewf ¼ extremelywide(.200cm)
Note:Absenceofsymbolsignifieseithernonoteworthycharacteristicor undifferentiatedcharacteristics.
MaterialSymbols(“m” Above)Examples
c ¼ clay
m ¼ silt
s ¼ sand
g ¼ gravel
k ¼ cobbles
b ¼ boulders
r ¼ rockrubble
t ¼ trashordebris
e ¼ erraticblocks
p ¼ peat
o ¼ organics
d ¼ diatomaceous
Note:Mostabundantorsignificantmaterialsymbolappears first, followedbylessabundant;cm/ms ¼ interbeddedsiltyclayand sandysilt;m-b ¼ allmaterialsfromsilttobouldersarepresent.
C(sw)msg(0.6–1.3m)
L(le)ms/sm(3.3m)
R(wp)mcs(0.3–0.6m)
G(em)c-k(12m)
GR(uw)(vwf)
Colluvialslopewashdepositscomposedof gravellyandsandysilt0.6–1.3mthick,overlying3.3mofinterbeddedlacustrinelowenergydepositsofsandysiltandsiltysand
Residualweatheringprofileofsandyand clayeysilt0.3–0.6mthick,overlyingglacial endmorainecomposedofalltexturesfrom claytocobbles,possibly12mthick,over unweathered,verywidelyfracturedgranite
usesacasestudyapproachtohighlightexamplesofmaps thathaveastronggeomorphologiccomponent,suchasby superimposinggeomorphologicfeatures(e.g., “colluvium,” “mudslide,”“ rockdeposit ” )ontoageologicmaporby includingdetailedtextdescriptionsoffeaturesonthemap itself.Theauthorcitestheneedforconsistencyinincorporationofgeomorphologicinformationonmaps,hampered bythelackofawidelyacceptedmappingapproach(aproblemalsonotedbyGriffiths,2016).SmithandGriffiths (2011)offeradetailededitedvolumeoftrendsandmethodsingeomorphologicmapping,techniques,andcasestudies.ThegoalofthisTechnicalNoteistocapturemany ofthevaluableaspectsofthevariousmappingmethodsandcombinethemwithotherprimaryengineeringgeologicinformationintoasinglesystemthatcan havewidespreadapplicability.WecallthisPLM classi fi cation.
TheessenceofthePLMmappingsystemisshownin Table1.SimilartotheGLQsystem,itcanbeapplied tobothunconsolidated(soil)andconsolidated(rock) materials.Itinherentlyfocusesonsur ficialdepositsbut hasthecapabilitytoincludeinformationontheunderlyingmaterials.ThePLMsystemincorporatesseveral modifi cationsoftheGLQsystembyclarifyingsomecomponents,improvingtheintuitiveaspectsofthecategorization,andaddingquantitativeanddescriptiveinformationto theclassification.
First,wesuggestrenamingtheoriginalGLQtermswith onesthatrelatemoredirectlytogeomorphology,sousers whoaremorefamiliarwithsurficialmaterialsorgeomorphologicmappingwillseetheparallels.Inthiscase, “Genesis” becomes “Process,”“Qualifier” movesforwardinthe orderandisreplacedby “Landform,” and “Lithology” is replacedby “Material,” abroadertermthatmorereadily encompassessoilmaterial,aswellasrock.TherevisedsystembecomesPLM.
Next,wehaverevisedthealluvial,colluvial,and slidecategoriestoreduceconfusionbybetterindicatingtherateofmovementandinfl uenceofrunning water.Asageneralprinciple,weusetheterm “ alluvial, ” followingtheconventionthattheterm “ fl uvial ” (trueriverinedeposits)isasubsetof “ alluvial ” (which alsoincludesfan,terrace,andpedimentdeposits).This simpli fi cationavoidspotentialconfusionofusingboth fl uvialandalluvialterms.
Wehaveremovedthe “modifier” termforsoils,indicating “cemented,”“expansive,” andsoon,asitdoesnotseem tohavewidespreaduse.
Wehaveaddedmoreprocessandlandformcategories undertheUnconsolidatedMaterialscolumntobetterencompasstherangeofgeomorphiclandforms.Erosional
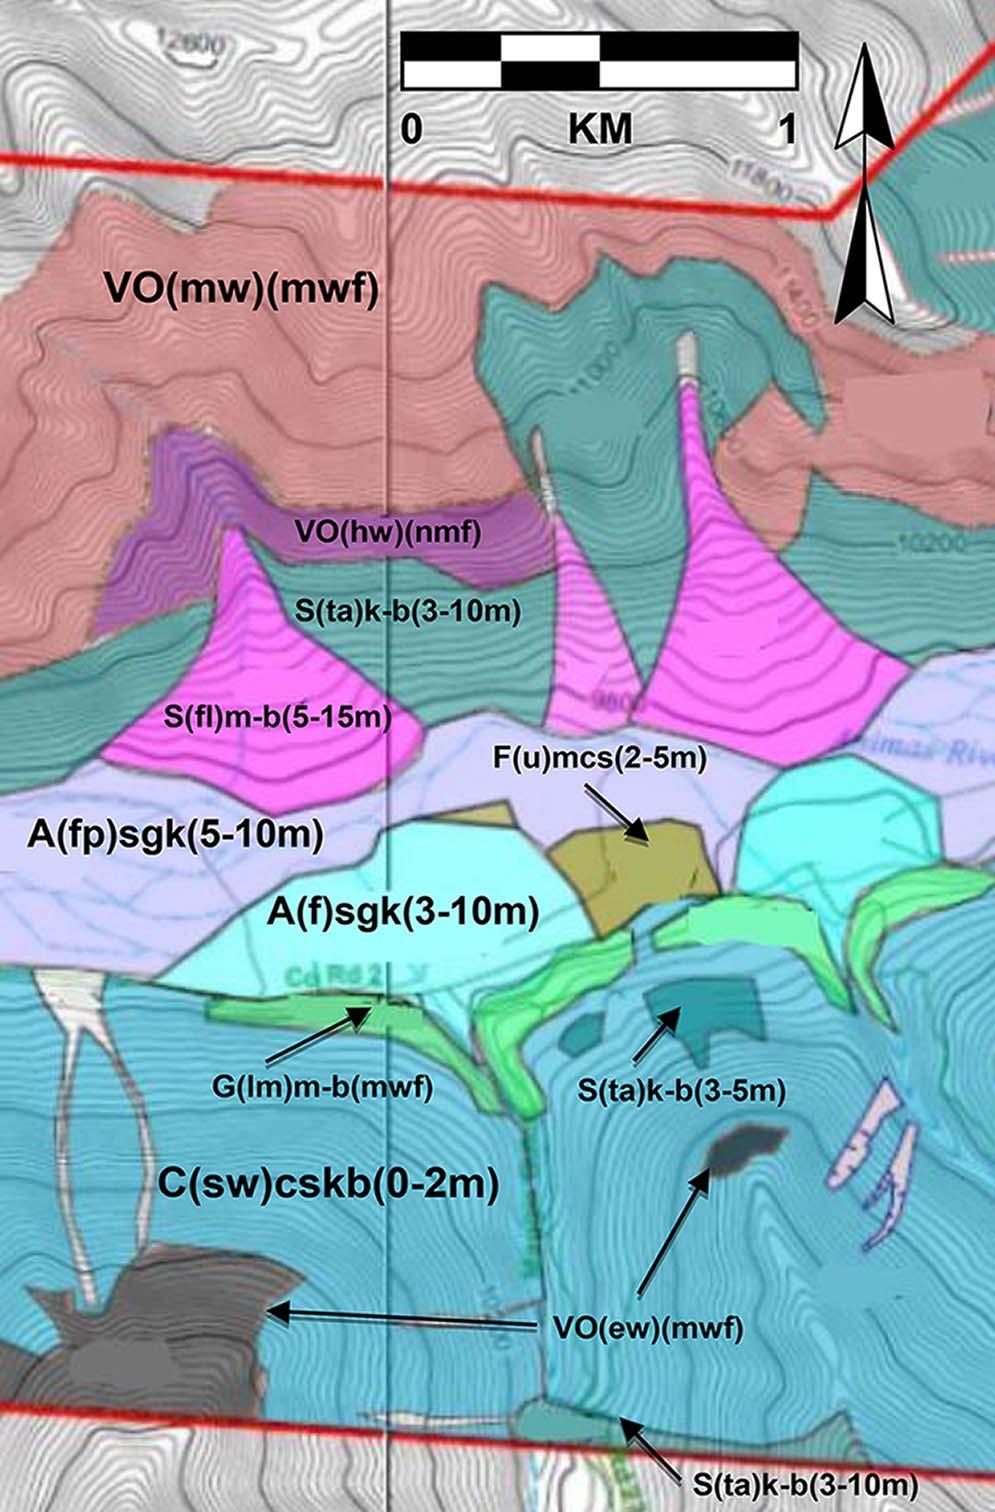
Figure1.ExampleofaPLMmapfromtheAnimasRiverValley nearSilverton,CO.BasemapcreatedbyEsch(personalcommunication,2020).Notethatunlabeledgraypolygonsrepresenteroded alluvialanddebris- flowchutes.RefertoTable1forexplanationof symbols.
landforms(e.g.,cirques,arêtes,incisedvalleys)arenot included,butasforotherfeatures,usersarefreetodevelop categoriesthatmightapplytospecificsites.
UndertheBedrockMaterialscategory,wehaveadded detailedandquantitativedescriptorstotheweathering andfracturespacingterms(fromDearman,1995)toimprove consistency.Thegeologicstrengthindex(Marinosand Hoek,2000)orotherquantitativeindexparametersfor rockcouldbeaddedasdesiredbytheuser.
Finally,wehaveorganizedthesystemintoasingletable (Table1)tobemore fieldfriendly,soausercanworkdown eithertheUnconsolidatedMaterialsorBedrockMaterials column,asneeded.
Figure1isanexamplemappedareanearSilverton, CO.Inthisexample,thereareunitlabelsforvolcanic bedrock,taluscones,debris flowfans,alluvialfans,alluvial floodplains,uncompacted fill,lateralmoraines,and colluvialslopewash.
Therearemanyexamplesinthetechnicalliteratureof geomorphicandengineeringgeologicmapping,accompaniedbystrongargumentsfortheutilityofthissortof map.However,thereisnotaconsistentsystemtoprovide primaryengineeringgeologymaps,thatis,mapsthatprovide objectiveinformationfromwhichderivativemapscanbe developedforspecificpurposessuchasEarth-relatedhazards,geotechnicalmaterialsandproperties,expectedbehaviorsofshallowmaterials,andrangesofgroundresponses. TheproposedPLMsystemisintendedto fillthisneed.The PLMsystemisanupdateandrevisiontothepreviouslypublishedGLQsystem(Keaton,1984),benefittingfromalmost 40yearsofuseandfeedback.ThePLMsystemisnowable toconsistentlyclassifyengineeringgeologyandgeomorphic informationinasingletable.Further,itisreadilyexpandable toaccommodateanyparticularuserneed;thus,itisinherentlyamenabletofuturechange.
CHAMINÉ,H.I. AND FERNANDES,I.,2023,TheroleofengineeringgeologymappingandGIS-basedtoolsingeotechnicalpractice.In Chastre,C.;Neves,J.;Ribeiro,D.;Neves,M.;Faria,P.(Editors), AdvancesonTestingandExperimentationinCivilEngineering: Geotechnics,Transportation,HydraulicsandNaturalResources: SpringerInternationalPublishing,Cham,Switzerland,pp.3–27.
COMPTON,R.R.,1985, GeologyintheField:Wiley,NewYork,412p.
DEARMAN,W.R.,1991, EngineeringGeologicalMapping:Butterworth-Heinemann,Oxford,U.K.,387p.
DEARMAN,W.R.,1995,Descriptionandclassificationofweathered rocksforengineeringpurposes:ThebackgroundtotheBS5930: 1981proposals: QuarterlyJournalEngineeringGeology,Vol.28, No.3,pp.267–276.
DRAMIS,F.;DOMENICO,G.; AND ANTONELLO,C.,2011,Natureandaims ofgeomorphologicalmapping.InSmith,M.;Paron,P.;and Grif fi ths,J.(Editors), DevelopmentsinEarthSurfaceProcesses : Elsevier,Oxford,U.K.,pp.39 –73.
ESCH,J.,2020,personalcommunication,ColoradoSchoolofMines, Golden,CO.
GALSTER,R.W.,1977,Asystemofengineeringgeologymappingsymbols: BulletinAssociationEngineeringGeologists,Vol.14,No.1,pp. 39–47.
GRIFFITHS,J.S.,2016,Incorporatinggeomorphologyinengineering geologicalgroundmodels: GeologicalSociety,London,EngineeringGeologySpecialPublications,Vol.27,No.1,pp.159–168.
HEARN,G.J.,2019,Geomorphologyinengineeringgeologicalmappingandmodelling: BulletinEngineeringGeologyEnvironment, Vol.78,No.2,pp.723–742.
KEATON,J.R.,1984,Genesis-Lithology-Qualifier(GLQ)systemof engineeringgeologymappingsymbols: BulletinAssociationEngineeringGeologists,Vol.21,No.3,pp.355–364.
KIRKWOOD,C.,2022,Geologicalmappingintheageofartificialintelligence: Geoscientist,Vol.32,No.3,pp.16–23.
MARINOS,P. AND HOEK,E.,2000,GSI:Ageologicallyfriendlytoolfor rockmassstrengthestimation.ProceedingsoftheGeoEng2000at theInternationalConferenceonGeotechnicalandGeologicalEngineering,Melbourne,19–24November2000,pp.1422–1446.
SMITH,M.J. AND GRIFFITHS,J.S.,2011, GeomorphologicalMapping MethodsandApplications,1sted.:Elsevier,Oxford,U.K.,610p.
THOMAS,P.R.,1990, GeologicalMapsandSectionsforCivilEngineers:CRCPress,BocaRaton,FL,106p.