Update on Florida’s Economy and Demographic Trends
Dr.TimChapin Dean, College ofSocial Sciences and Public Policy Professor, Department of Urban&RegionalPlanningtchapin@fsu.edu

tchapin@fsu.edu
• Florida’s rebound from the COVID recession has outpaced the US as a whole
• Unemploymentisverylow, wages are trending up, andlaborforceparticipationistrending close to pre‐pandemic levels
• Inflation remains a challenge and consumer optimism remains very low
• Muchofthestateeconomyhasrecovered,except for some rural panhandle counties and some urban counties (Broward, Escambia, Miami‐Dade, Orange)
Real GDP (annualized percent change from preceding period)
In the 2nd Quarter of 2022, Florida’s growth was ranked 2nd in the nation. The United States as a whole had a second quarter of negative growth.
According to the latest revised data, Florida’s quarterly GDP movements have generally mirrored the nation as a whole since the beginning of the pandemic. Buffeted by a series of economic shocks, the state’s GDP slumped -0.5 percent in Fiscal Year 2019-20, grew 2.5 percent in Fiscal Year 2020-21, and expanded at more than double that rate (5.2 percent) in Fiscal Year 2021-22. The Economic Estimating Conference anticipates that the state’s economy will expand only 1.0 percent this fiscal year as economic imbalances weigh down the economy, but beginning next year (Fiscal Year 2023-24), it will grow at a more characteristic 2.0 percent per year.
Normally, personal income growth is another important gauge of the state’s economic health; however, its changes have been in stark contrast to GDP, driven largely by the ebb and flow of federal dollars into Florida households and businesses. For example, in the first quarter of the 2021 calendar year, Florida’s personal income growth shot up 63.0 percent, largely due to two different federal stimulus and relief programs converging in the quarter.
As the federal support measures began to fade, the state’s personal income plummeted to an annualized loss of -18.6 percent in the second quarter of the 2021 calendar year, yet yielded a final growth rate for the 2020-21 fiscal year of 7.9 percent, the highest rate since 2015. Fiscal Year 2021-22 saw moderately lower growth of 5.5 percent as the benefit from workers returning to their jobs or leveraging the tight labor market into better paying opportunities competed with the end of federal relief measures. The Economic Estimating Conference expects growth of 6.4 percent in Fiscal Year 2022-23, largely on the continuing strength of salary growth. Thereafter, annual growth rates are expected to remain solidly at or above 4.0 percent.
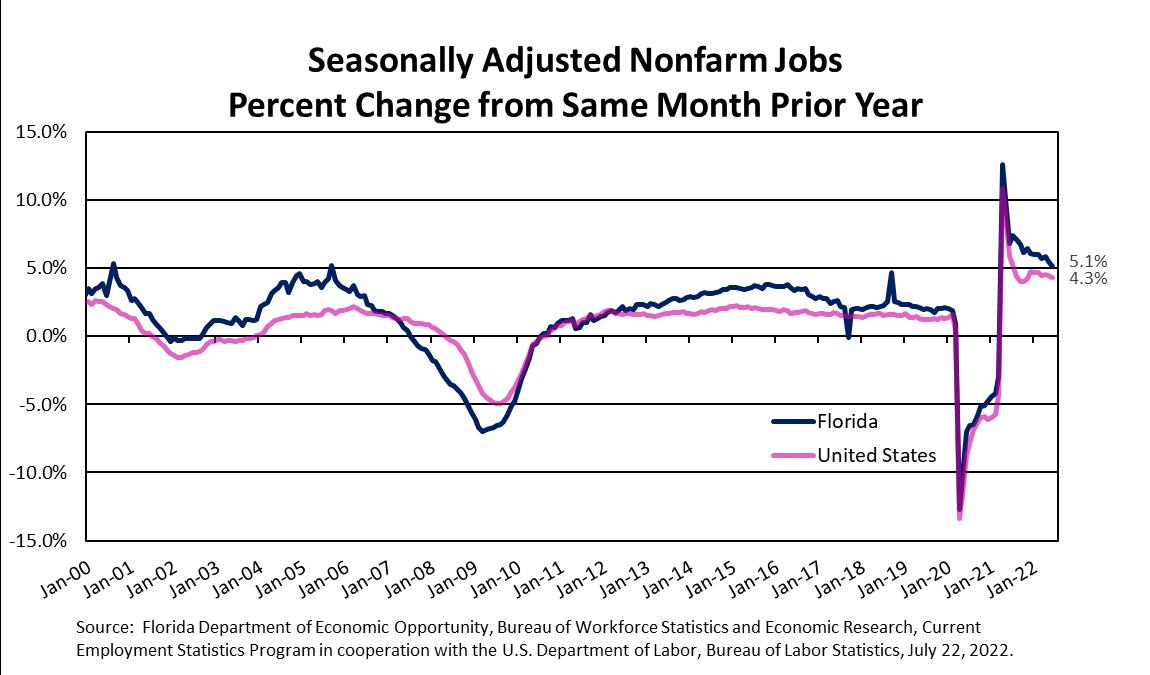
US: 4.3%
FL: 5.1%
At the onset of the COVID pandemic, employment dropped by almost 1.3 million jobs from February 2020 to April 2020, a decline of 14.1 percent. In June 2022, Florida exceeded the prepandemic level (February 2020) by 269,000 jobs, a gain of 3.0 percent.
US: 3.6%
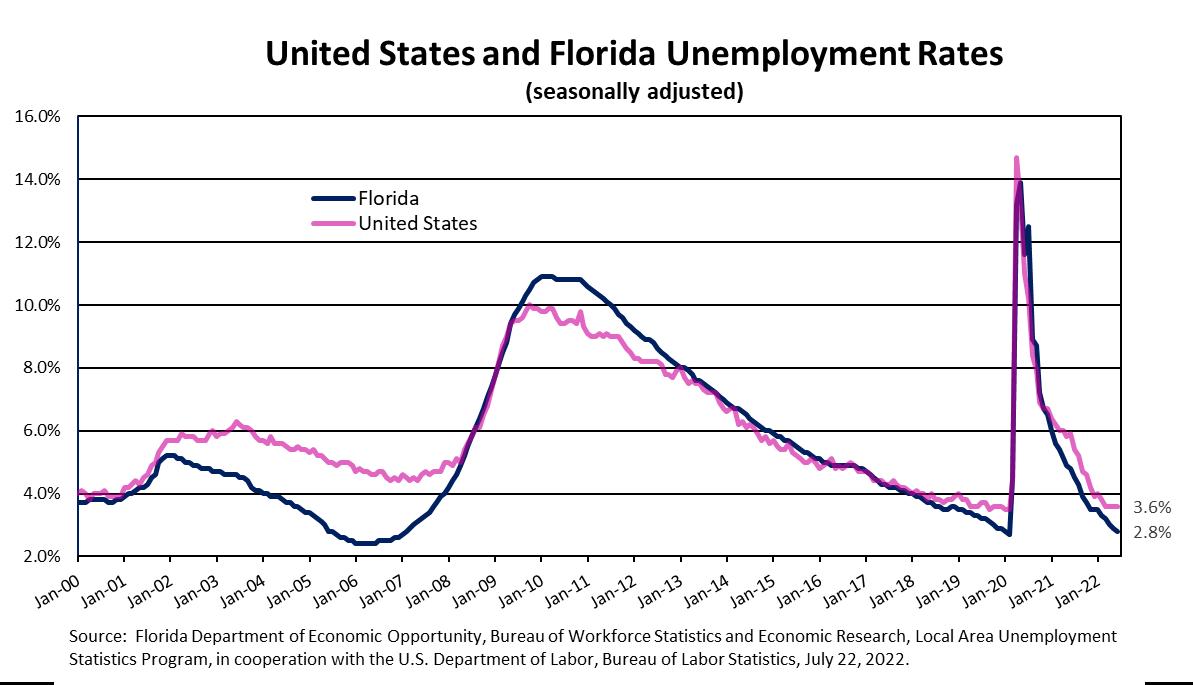
FL: 2.8% (302,900 jobless persons)
The Revenue Estimating Conference assumes the “full employment” unemployment rate is about 4 percent.
Florida’s unemployment rate had been below 4.0 percent from February 2018 through February 2020. With the onset of the pandemic, the unemployment rate spiked to 13.9 percent in May 2020, handily surpassing the prior peak rate of 10.9 percent experienced in the first four months of 2010 during the Great Recession. Florida’s unemployment rate is now approaching its lowest recorded rate in modern times: the first half of 2006 when it was 2.4 percent.
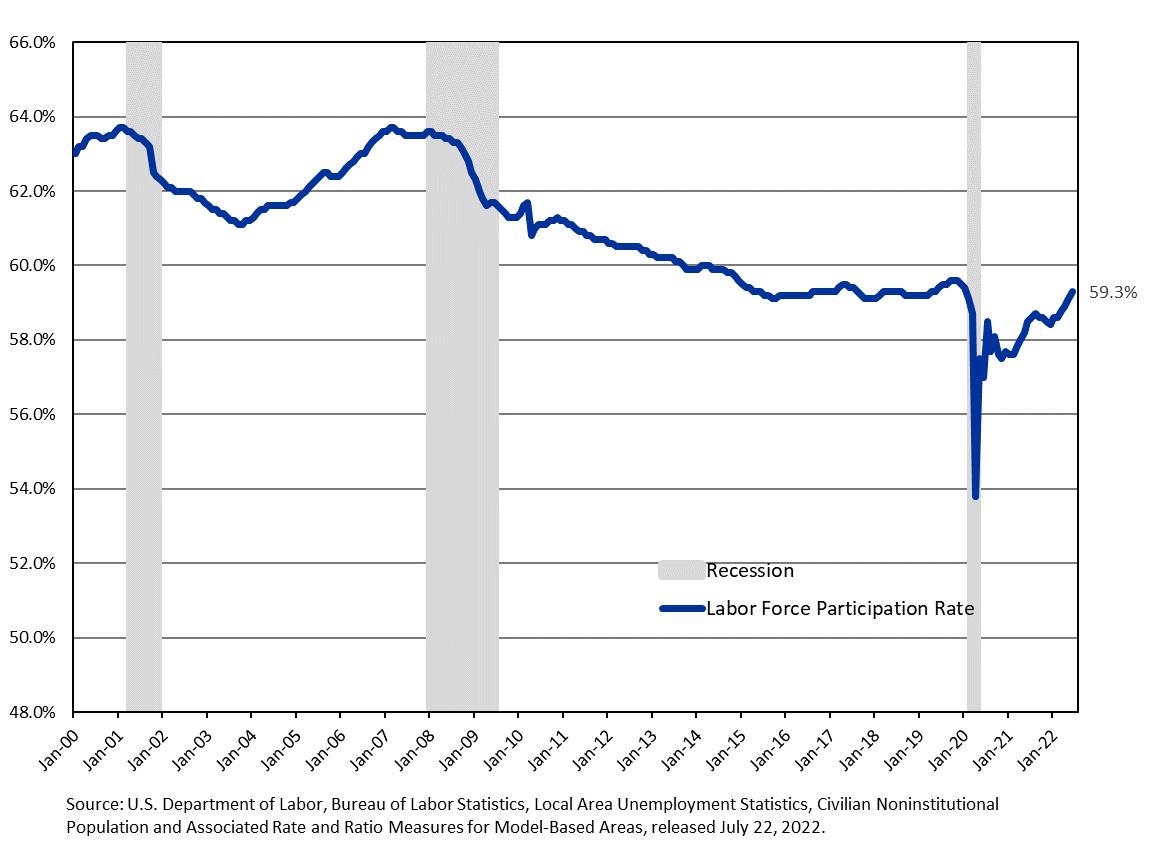
Florida’s labor force participation rate most recently peaked during the Housing Boom at 63.7% from February 2007 to March 2007. Pre-pandemic, Florida’s participation rate had been fluctuating around 59.5%; however, once the pandemic took hold, Florida’s participation rate fell to 53.8% in April 2020. Since then, Florida’s participation rate has rebounded, posting 59.3% in June 2022.
Florida’s participation rate is still lower than the US even though the US participation rate also fell substantially in April 2020 to 60.2%. The US participation rate has risen since that time, posting 62.2% in June 2022.
Going forward, Florida’s annual participation rate is expected to steadily decline from the 58.5% posted for all of FY 2021-22 to 55.5% in FY 2031-32. The last of the Baby Boomers reach age 65 in 2030.

• Prior to the pandemic, Florida’s employment peaked in February 2020.
• Based on preliminary February 2022 data, 63% (42 counties) had gained employment relative to the levels they had experienced in February 2020. Of the 25 that did not reach their February 2020 level, 4 were within 50 jobs.
Wage growth since the onset of the pandemic has been distorted by the extreme ups and downs in employment, especially among lower-wage service workers in the leisure and hospitality industry who were the hardest hit. As they came back to work in large numbers in 2021, wages appeared to grow at record levels, but the pure growth rates are somewhat misleading. Calculating Florida’s average annual wage relative to the US average cures some of these issues, providing a cleaner picture of how the state is faring. Since the beginning of this century, Florida’s average annual wage has been below the US average. Data for the 2020 calendar year showed that the state’s average percentage had fallen from 2016 when it was 87.7% to 87.3% in 2020.
This picture changed in 2021 when Florida moved above its longer run average of 88.4% to 89.2%. In that year, Florida had a 4.9% increase in the number of jobs in covered employment and a 13.2% increase in total wages. The highest annual wage ratio was in the accommodation and food services industry at 108.4% of the US average. The peak for this industry ratio occurred in 2006 at 111.8%. In 2021, the accommodation and food services workforce was 111.6% of the prior year and 90.2% of 2019 (the last year unaffected by COVID).


Inflation has had a material effect on many households. According to IHS Markit, “the personal saving rate fell to 2.3% in the latest release, the second-lowest rate ever recorded (data go back to 1959) as declining real incomes have forced some consumers to draw down on savings.” This is happening even though the Federal Reserve has been acting aggressively to combat inflation. October saw the sixth rate hike this year and the fourth consecutive 0.75 percentage point jump since June. Saying that “monetary policy affects the economy and inflation with uncertain lags” and that “the full effects of our rapid tightening so far are yet to be felt,” Chairman Powell has suggested that future rate increases—while still occurring—may moderate somewhat. Largely as a result of the Federal Reserve’s actions, most forecasters are now projecting a mild recession in early 2023. While this will slow the economy and some revenues relative to the summer forecasts, the greater effect on the Long-Range Financial Outlook will be the inflationary effects, seen as increased costs and wage pressures through the budget drivers.


• Florida has returnedtothe~300k+ annual population increase of the last several decades
• Florida’solderadultpopulationstillisthelion’s shareofthis growth
• Continueddiversification is inevitable and a powerful force to the state’s demographic mix
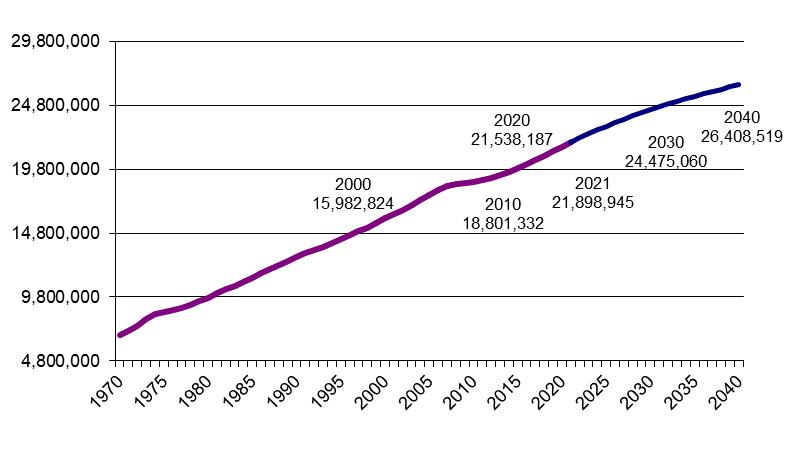
Florida’s population growth has mostly been from net migration. For the fiscal year forecast, net migration is projected to represent all of Florida’s population growth, as natural increase is expected to remain negative.
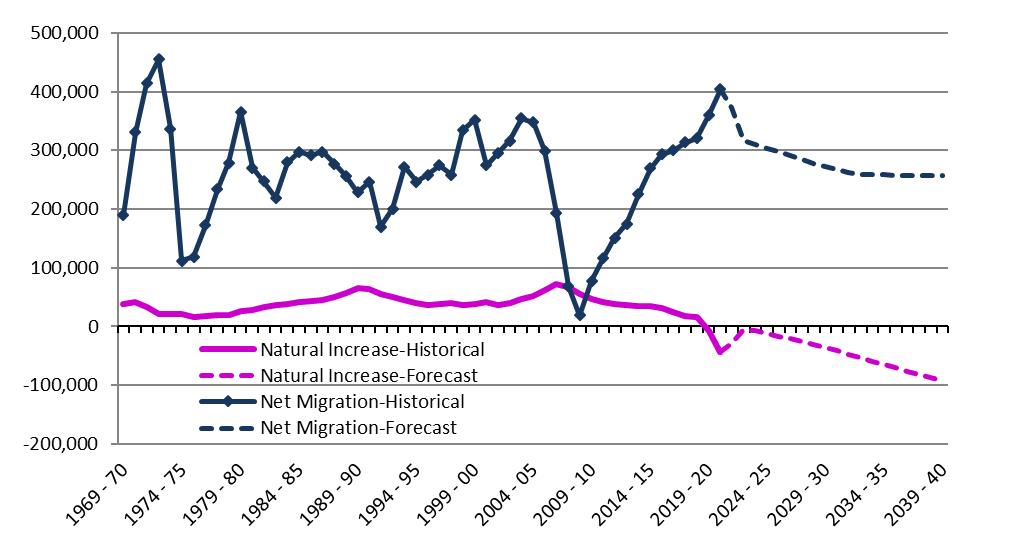
Despite the pandemic, Florida’s population growth of 360,758 between April 1, 2020 and April 1, 2021 was the strongest annual increase since 20052006, immediately prior to the collapse of the housing boom and the beginning of the Great Recession.
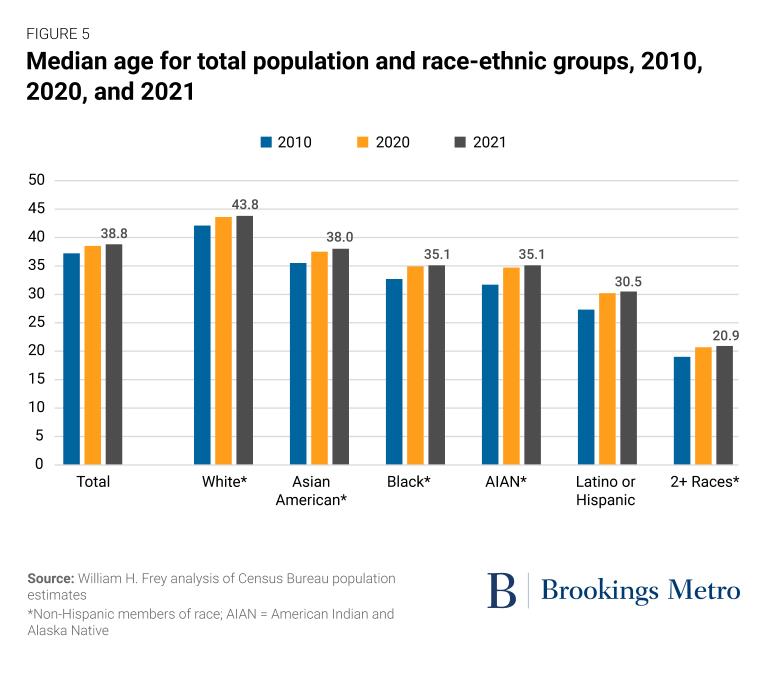
Distribution of Growth by Age Group between April 1, 2010 to April 1, 2030
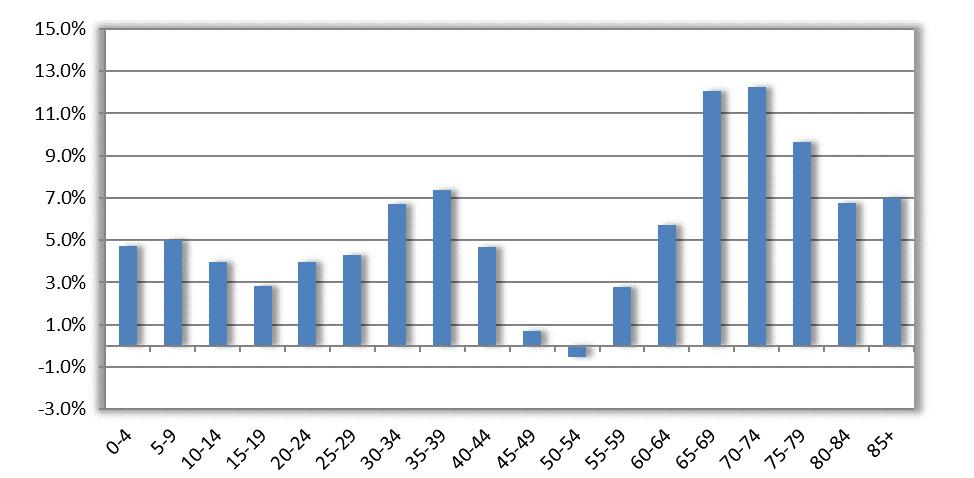
53.4%
As a result of both net migration and natural increase, Florida is forecast to grow by over 5.6 million persons between 2010 and 2030.
Growth by age group depends upon this overall growth and the aging of resident population, resulting in 53.4% of those gains occurring in the older population (age 60 and older).
Florida’s younger population (age 0-17) will account for 15.4% of the gains, while the younger working age group (25-39) will account for 18.4% of the growth.
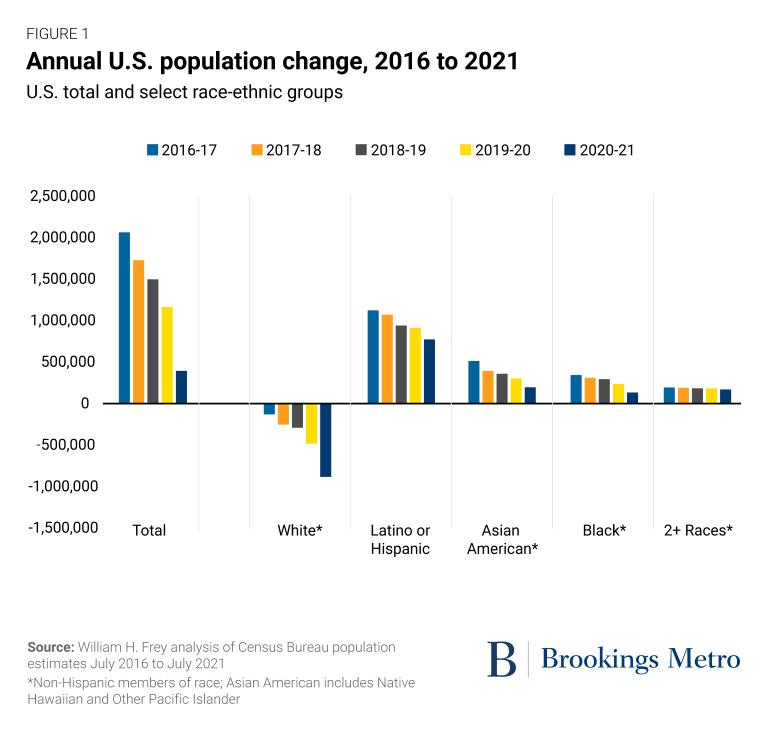
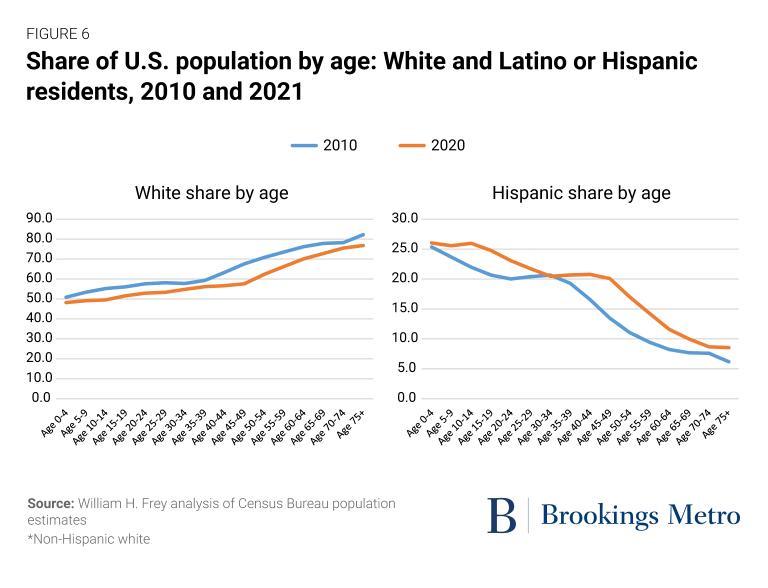
https://www.brookings.edu/research/white-and-youth-population-losses-contributedmost-to-the-nations-growth-slowdown-new-census-data-reveals/
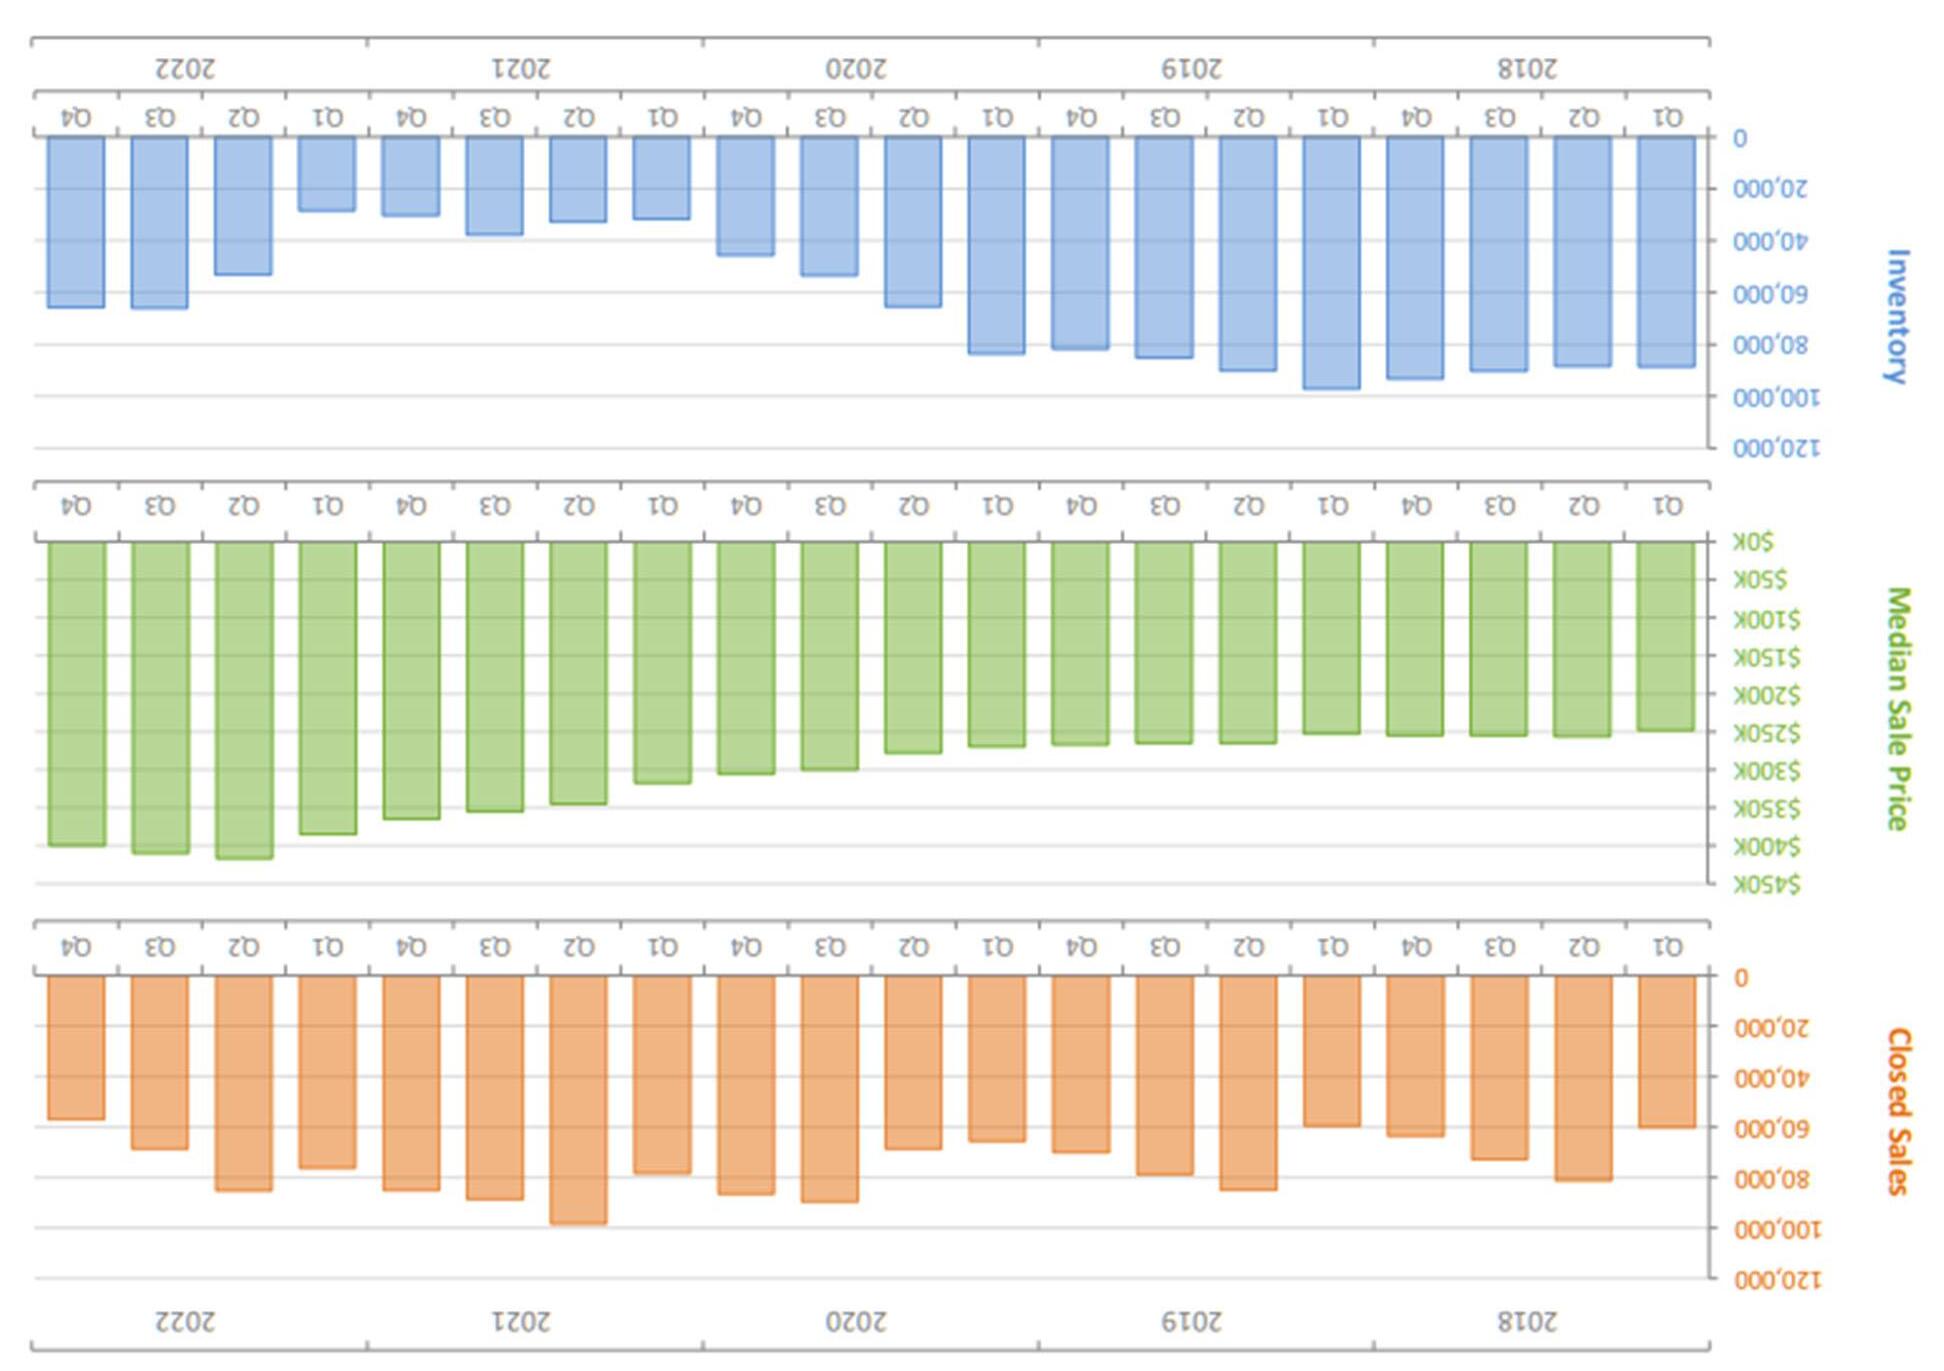
• NationalandFloridadataindicatesubstantial cooling ofaredhot residential real estate market
• Housing prices have finally flattened after historic increases, even coming down in some markets
• Newlistingsaredown,timetoclosinghas increased and the housing inventory is (slowly) starting to catch up
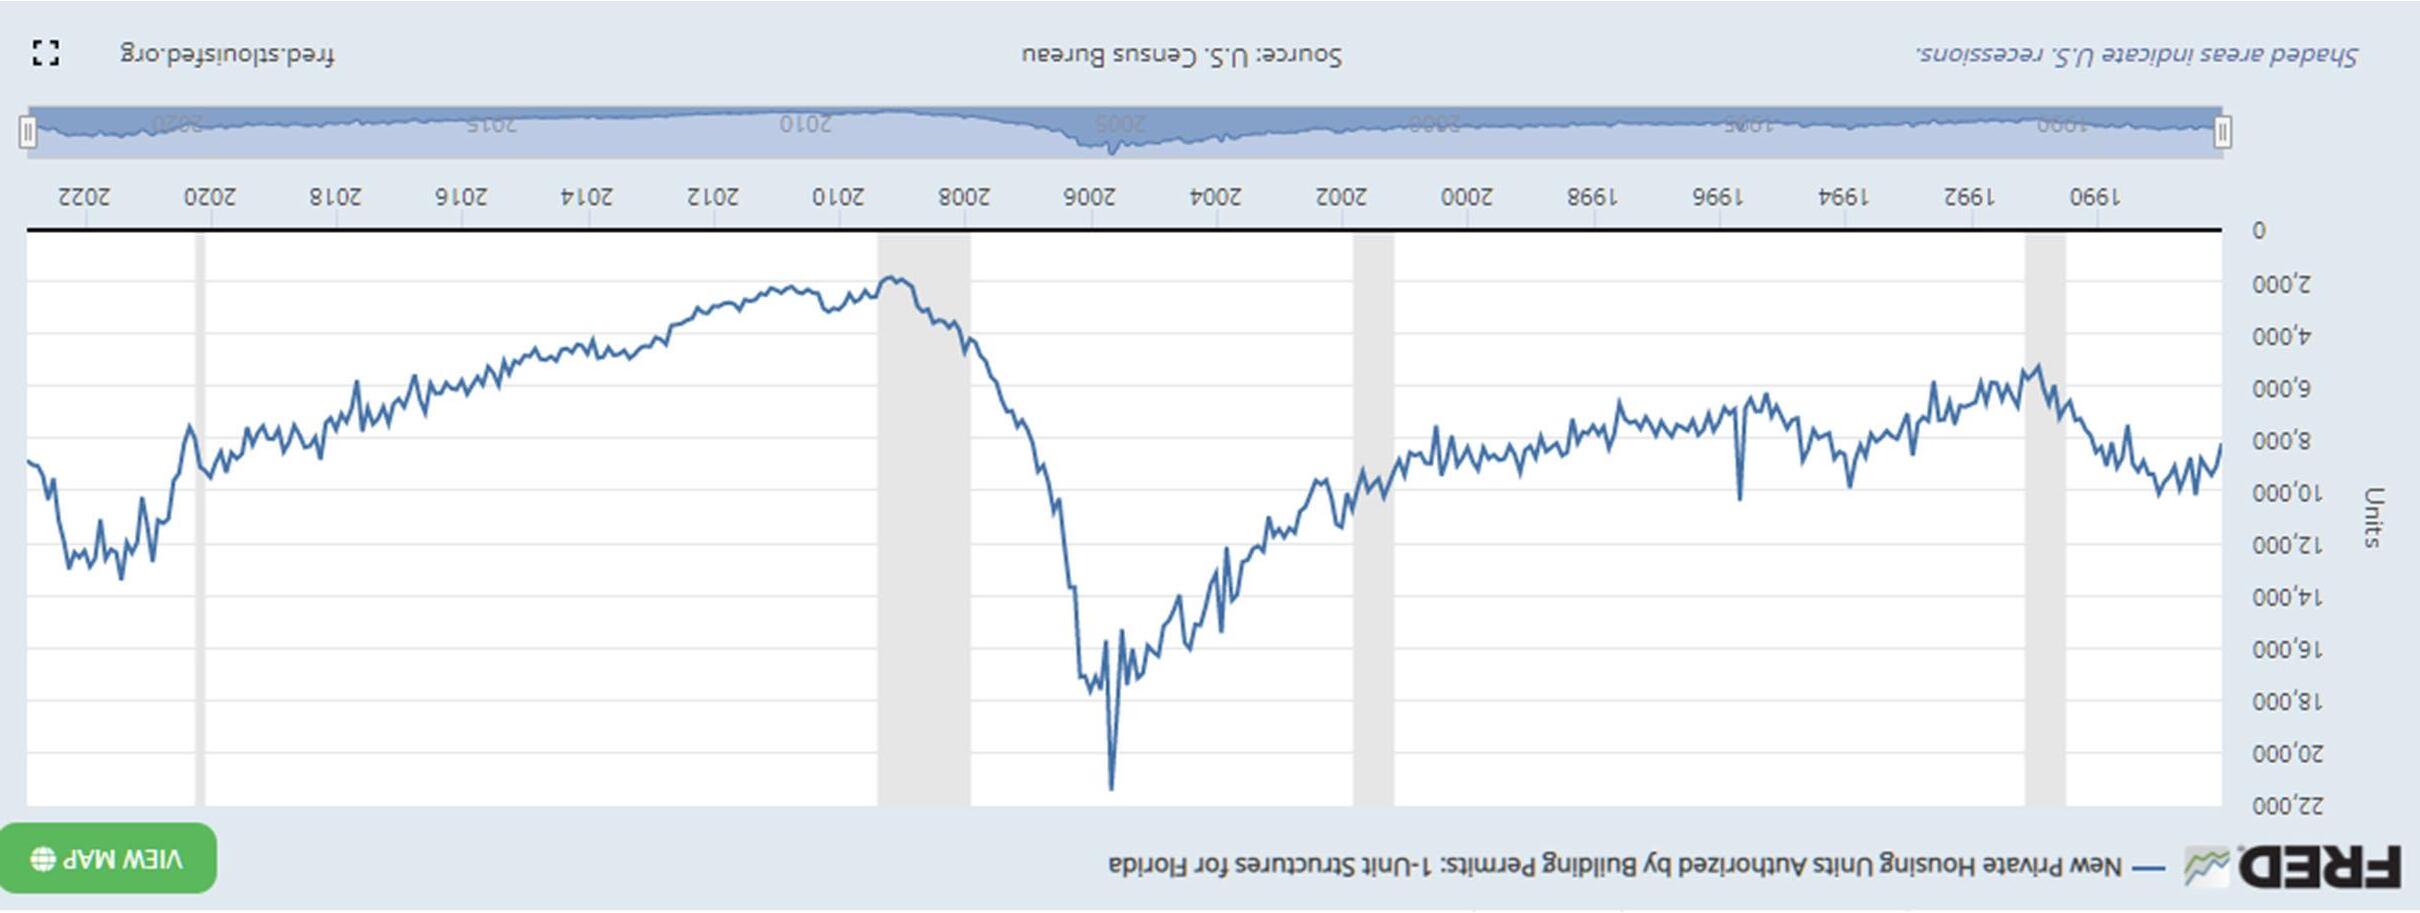
• Butpermits are still below necessary levels and inventory levels are still below historic levels
• The rentalmarket isstilltightdespiteaseveralyear boominconstruction


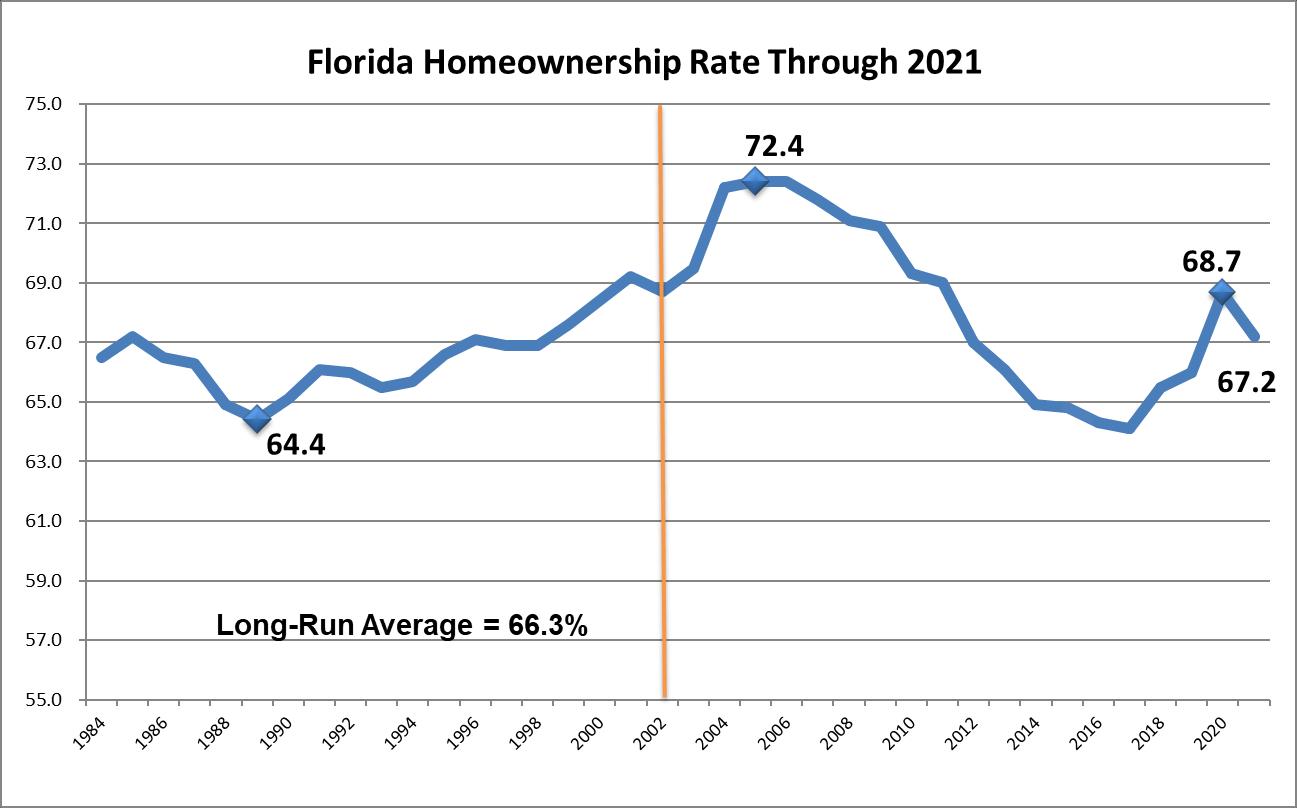
From 2013 to 2019, Florida was below its long-run average homeownership rate, although the 2019 calendar year very nearly matched it at 66.0 percent. During the 2020 calendar year, the state finally moved above the long-run average, posting 68.7 percent for the year. The most recent data for 2021 indicates that the state had notably fallen below the prior year’s level to 67.2 percent; however this percentage is still above Florida’s long-run average. The first two quarters of 2022 are showing a similar level of 67.3 percent.
https://fred.stlouisfed.org/series/FLBP1FH
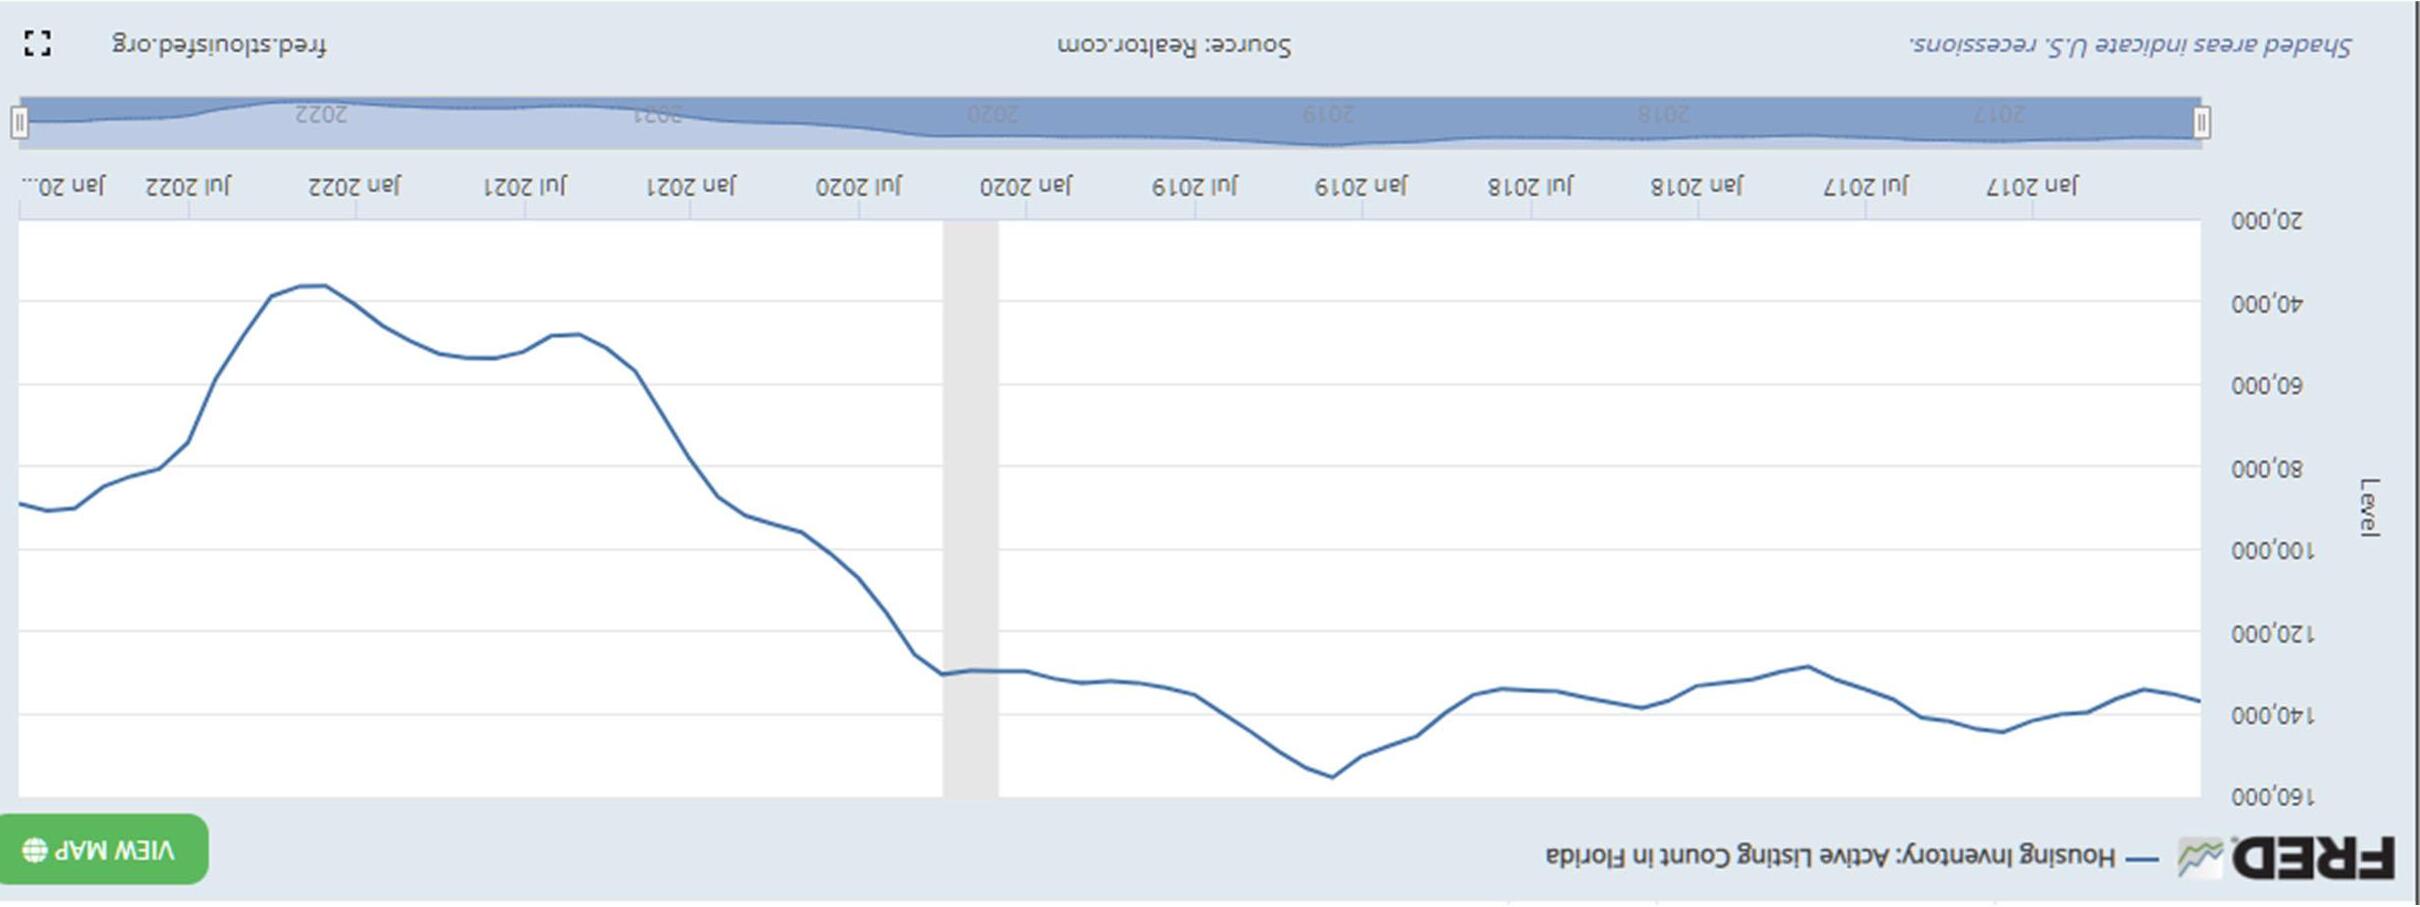
https://fred.stlouisfed.org/series/ACTLISCOUFL
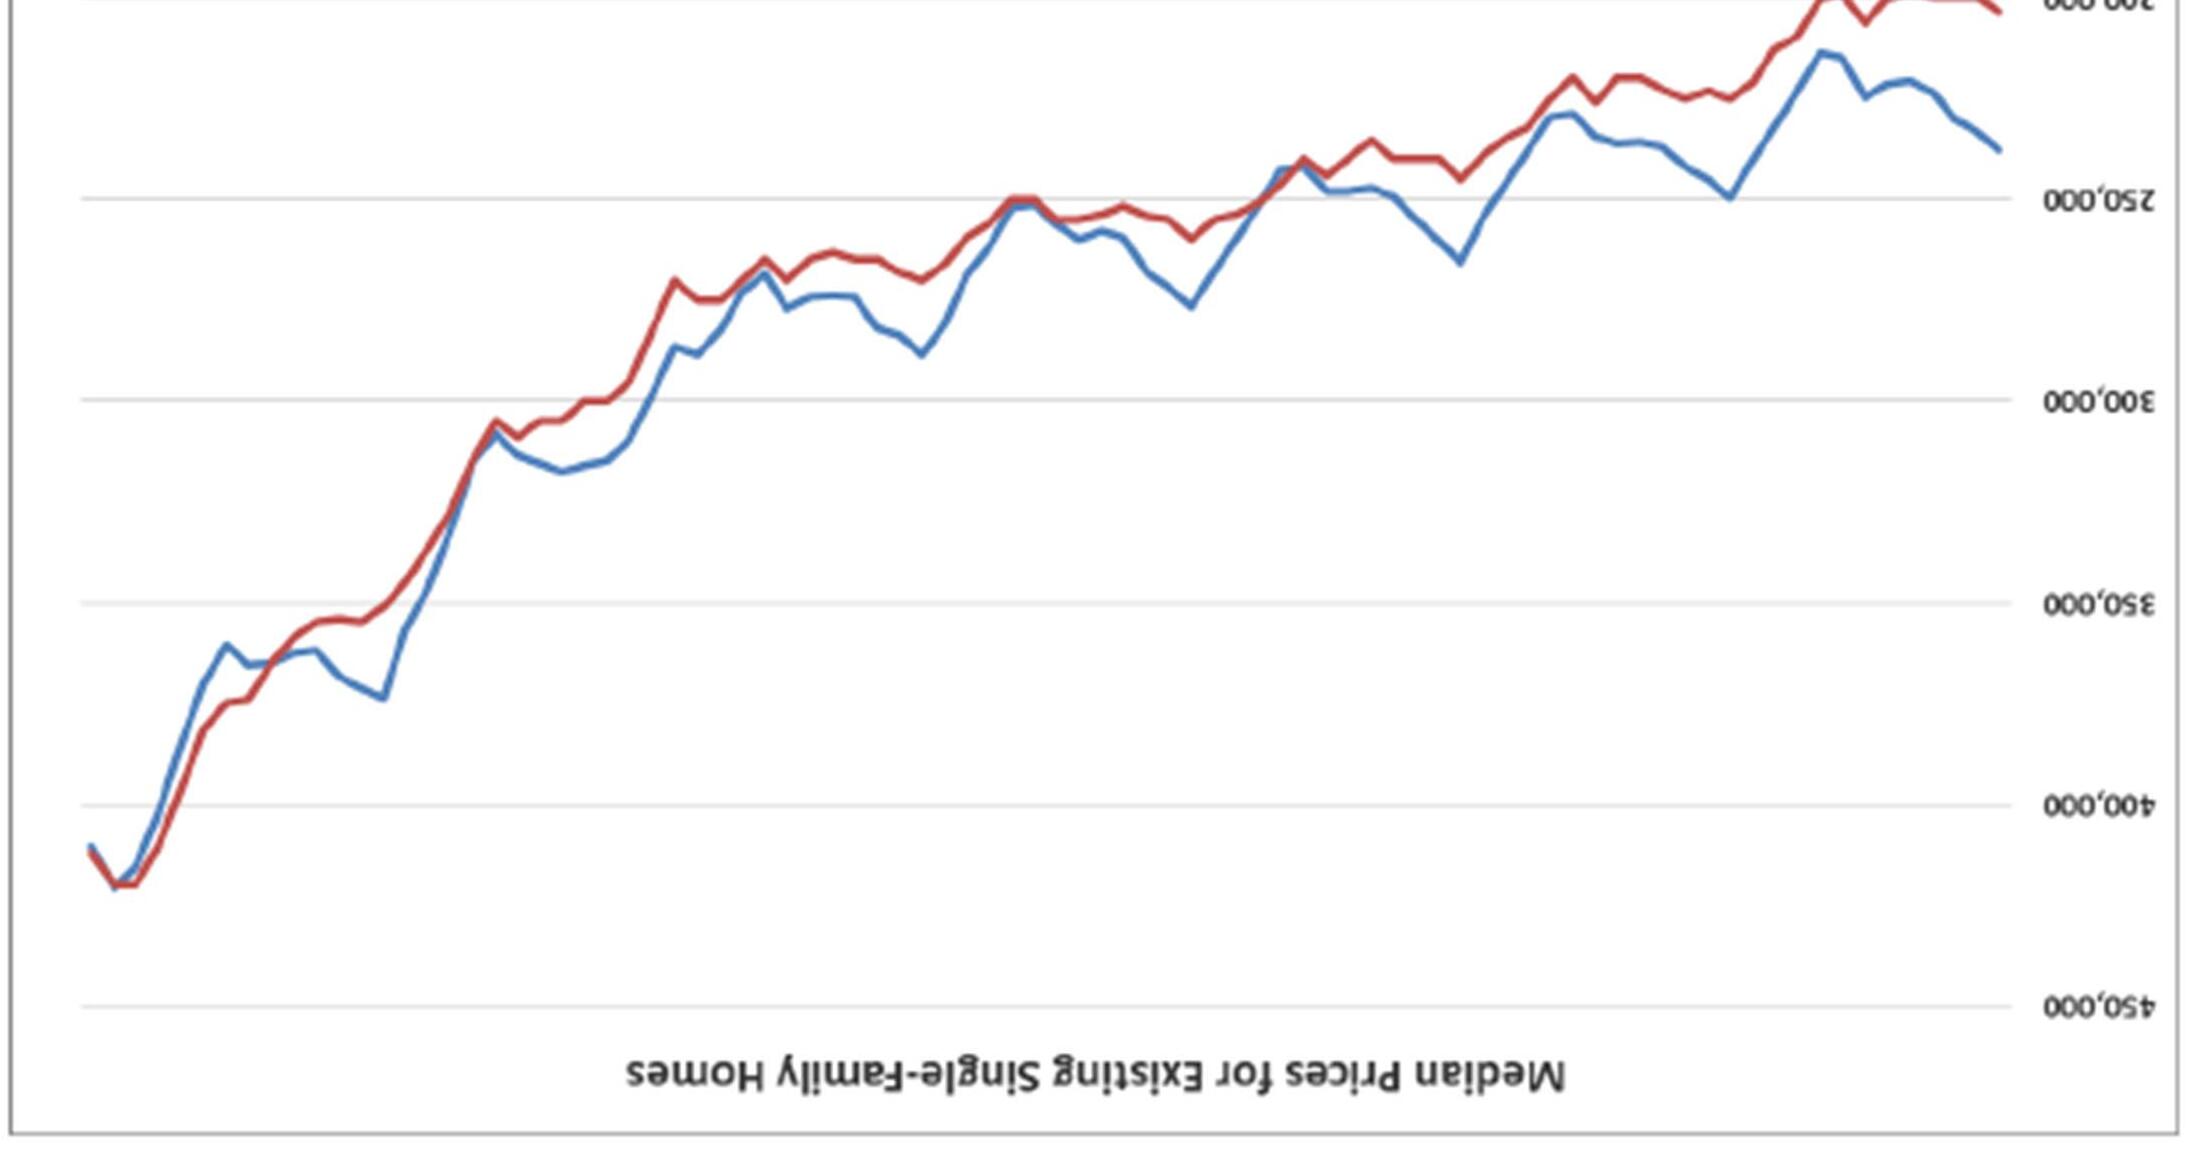
https://fred.stlouisfed.org/series/FLSTHPI


https://fred.stlouisfed.org/series/FLUCSFRCONDOSMSAMID

https://fred.stlouisfed.org/series/FLUCSFRCONDOSMSAMID


https://fred.stlouisfed.org/series/FLRVAC


• Atthestatebudgetlevel, this is generally a time of plenty in Florida
• Athrivingeconomy,shortCOVID ‐recession, booming real estate market, a return to robust tourism (plus federal stimulus dollars) have all contributed to sizable surpluses and reserves
• Thestatehas well over $15b in total reserves at this time, with expected budget surpluses in the next several years
• These funds offer great opportunity for sustainability, coastal resilience, infrastructure investment, and land conservation, but how and where these dollars are spent is unknown.
Budget Drivers Based on Estimating Conferences; Past Legislative Actions; and Three-Year Averages


Sixteenth document prepared since the constitutional requirement passed ~ nearly 100 Analysts were involved in the process over the Summer months
The new forecasts for the national and state economies adopted in July 2022 notably lowered many of the economic metrics relative to those adopted in December 2021, largely as a result of the war in Ukraine’s effects on the global economy and a significant upward shift in the level of inflation. Of note, the risk associated with the national economic forecast is skewed to the downside, with almost equal probabilities that the new forecast will unfold as predicted or fall short of expectations. Economic disruption is still evident, with challenges including the end of significant federal monetary and fiscal stimulus provided during the early years of the pandemic, the rapid drawdown of some personal savings over the past year, the elevated use of credit over the past few months, the continued normalization of spending on services and away from taxable goods, and strong inflationary pressures on households. Nonetheless, revenue collections since January 2022 far exceeded expectations and the economic fundamentals, confounding the ability to predict the impact and timing of key turning points.
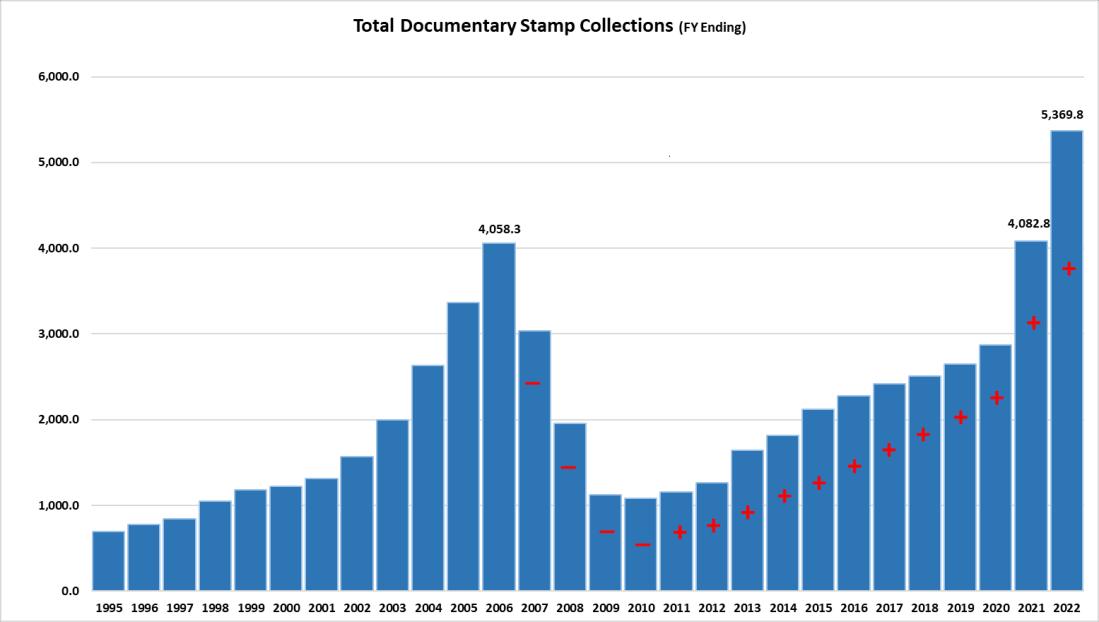
Documentary Stamp Tax collections in FY 2020-21 topped the FY 2005-06 peak reached at the height of Florida’s housing boom. This milestone was particularly remarkable considering the prior year (FY 2019-20) registered only 70.8 percent of that level after steadily increasing for ten years from a low of 26.6 percent. The results for FY 2021-22 were even more eyepopping with collections soaring to nearly $5.4 billion.
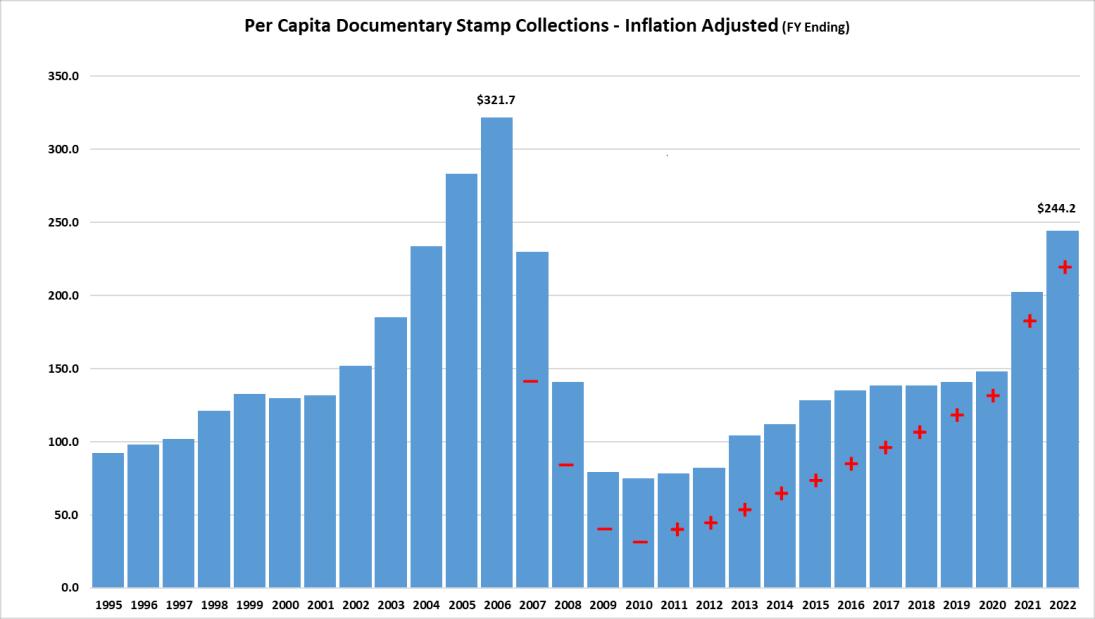
The market environment leading to this result was caused by the record low interest rates arising from the Federal Reserve’s actions to stem the severity of the pandemic’s economic disruption. While FY 2021-22 set a recordbreaking nominal level for collections, after adjusting for inflation and population growth, the shape of collections since FY 1994-95 tells a somewhat different story of the relative magnitude of the collections, with FY 2005-06 still standing out.
Unallocated General Revenue, the Budget Stabilization Fund, and the Emergency Preparedness and Response Fund are now considered to be the state’s reserves.
At the time each of the previous nine Outlooks was adopted, total state reserves ranged from 10.8% to 27.2% of the General Revenue estimate.
For the current year, total state reserves are $17,358.6 million or 41.3% of the General Revenue estimate for FY 2022-23. Both the Budget Stabilization Fund and Unallocated General Revenue are at historic levels.
The effects of the stimulus-infused economy, the benefit from the greater spending on taxable goods and the first-round impact of inflation in Fiscal Year 2022-23 provided a significantly higher balance forward for Fiscal Year 2023-24 than anticipated by the 2021 Outlook. Primarily because of this, the total funds available were 15.7 percent higher than expected—a positive effect on the bottom line.
The most significant negative effect is the unanticipated increase in base budget expenditures. With the new budget drivers for Fiscal 2023-24 nearly the same, the larger base budget brought into the year helped produce an overall 5.8 percent increase in projected expenditures. Overall, the bottom line is 64.3 percent higher than last year’s projection.
Overall, the forecasted General Revenue growth (recurring and nonrecurring) is sufficient to support anticipated spending and a minimum reserve for each year of the Outlook—the projected budget is in balance as constitutionally required and is growing more slowly than available revenues.
Within the Outlook, the projected ending balance for Fiscal Year 2023-24 is just over $13.5 billion. These funds would be available to carry forward into the next fiscal year. In the alternative, the Legislature could choose to use some or all of the balance to bolster the state’s reserves; increase discretionary spending; or provide additional tax reductions. However, the increasingly positive budget outlook each year is reliant on the projected balance forward levels being available and the minimum reserve not being used. This creates a natural limit to how much spending could occur while still remaining positive in the two subsequent years.