The A.P. Moller Group is a diversified group of industry companies. While independently run with dedicated boards and executive teams, we encourage and facilitate collaboration, networking, and sharing of best practices across our portfolio companies. A.P. Moller Holding is the parent company of the Group, investing in and building businesses with a positive impact on society – ‘nyttig virksomhed’.
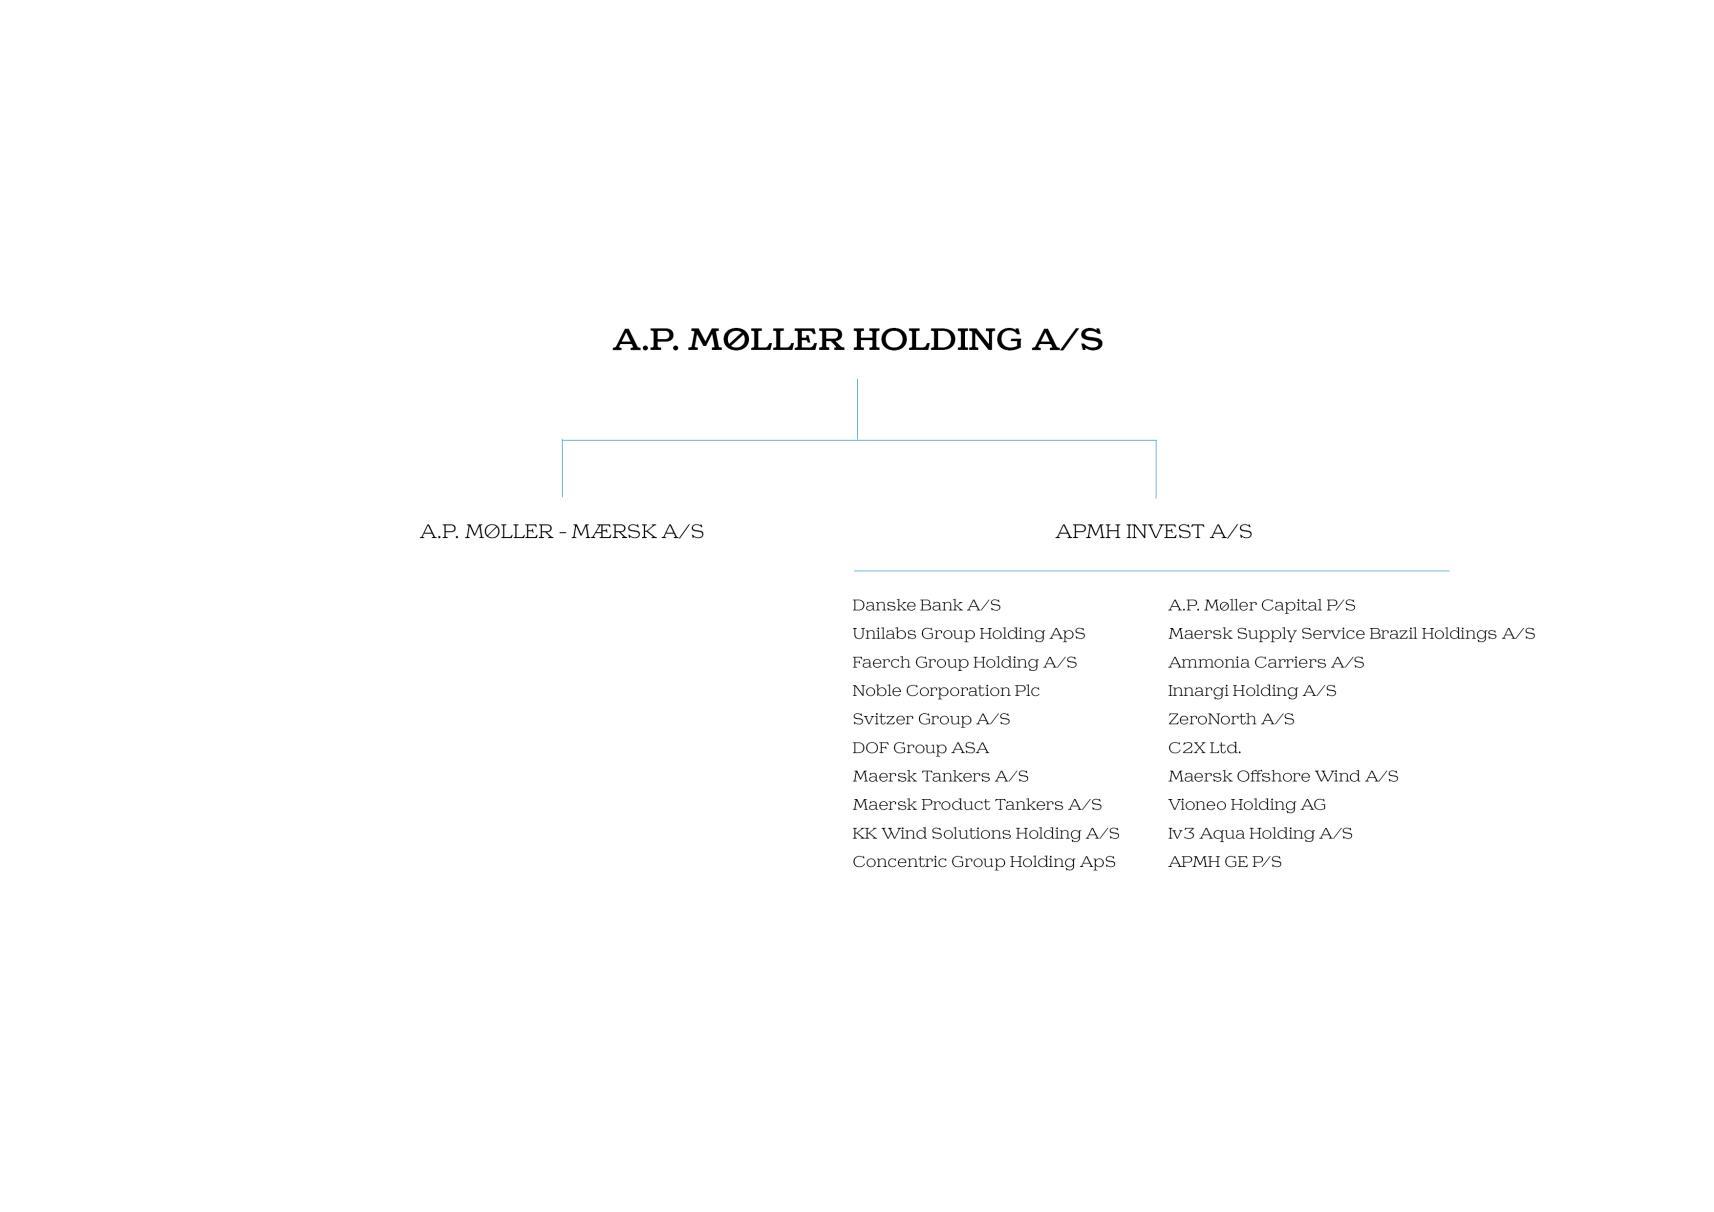
A.P. Møller Holding A/S (hereafter referred to as A.P. Moller Holding) is the parent company of the A.P. Moller Group (the Group). The Annual Report of A.P. Moller Holding includes management review, consolidated financial statements, and parent company financial statements. The term A.P. Moller Holding group (the group) is used in the Annual Report for controlled and consolidated companies. In A.P. Moller Holding’s investment activities, investments owned by APMH Invest A/S are included.
2023 comparative figures are stated in brackets, except in ‘Letter from the CEO’
Møller Holding A/S
LETTER FROM THE CEO
ROBERT M. UGGLA CEO
The A.P. Moller Group developed satisfactory in 2024, despite economic headwinds in some of its bigger markets and an increasingly complex geopolitical landscape. The Group ended the year with a revenue of DKK 425bn (USD 62bn), EBITDA of DKK 91bn (USD 13bn), a net result of DKK 49bn (USD 7bn), and total assets of DKK 831bn (USD 116bn).
During the year, the parent company of the Group, A.P. Moller Holding, pursued investments and add-on acquisitions across its segments ‘public markets’, ‘principal holdings’, ‘growth equity’, and ‘scale-ups’. The principal, scale-up, and growth equity investments remain centred around the investment themes ‘global trade’, ‘the energy transition’, ‘circularity, water & waste recovery’, and ‘demographic & societal change’.
At the end of 2024, A.P. Moller Holding remained debt free, with a full year cash inflow of DKK 17bn (USD 2bn). The net asset value increased 7% to DKK 230bn (USD 32bn) with our liquid public markets portfolio valued at DKK 44bn (USD 6bn) recording a 16% return for the year.
What stands out in 2024 is the very strong performance of two of our Group’s listed companies: Danske Bank delivered its best
financial results ever with a net profit of DKK 24bn (USD 3bn) and A.P. Moller - Maersk delivered its third best result ever with a net profit of DKK 43bn (USD 6bn).
ADDRESSING VULNERABILITIES
OF GLOBAL SUPPLY CHAINS
Trade experienced continued growth of around 7% despite underlying economic weakness in several bigger markets. The Red Sea became a focal point of disruption for ocean-based commerce, with attacks by Houthi forces resulting in unacceptable safety risks for the crews and cargoes of our container and tanker vessels in what is a critical transit area for one of the world’s most important global trade routes.
The volatile security developments and lack of safe navigation in the Red Sea and Black Sea underlined the vulnerabilities of global supply chains, which followed a series of other unexpected disruptions of magnitude in recent years, including the Covid pandemic outbreak in 2020 and drought in the Panama Canal.
By engaging closely with clients, our shipping activities enjoyed high customer satisfaction in 2024, despite the implications and added cost of rerouting vessels around the Cape of Good Hope. The strong operating performance is partly a function of the close collaboration across A.P. Moller - Maersk’s different business segments, not least its liner and terminal activities. In this respect, it is worth highlighting that six of the ten best performing container ports globally are run by APM Terminals, based on the World Bank’s study of more than 400 ports covering 182,000 vessel calls and 238 million moves.
The continuous disruptions facing global and regional supply chains call for closer commercial partnerships and new operating models. In early 2024, A.P. Moller - Maersk announced the Gemini Cooperation, which was launched on 1 February 2025. Throughout the year, the team focused on preparing for the implementation of this new modular liner shipping network designed to move customers' cargo far more reliably with reduced risk of disruptions. The network is enabled by extensive investments in efficient transhipment hub terminals operated by
APM Terminals. Once the network is fully phased in, Maersk’s liner network will reduce number of port calls per trade loop by 40% and shorten loops by around 15% in terms of sailed miles, ultimately leading to markedly higher projected reliability for customers, improved asset turnover, and lower emissions.
Also, Maersk Tankers has worked to improve its customer offerings. In February 2024, Penfield Marine became part of Maersk Tankers. The combined company manages around 240 tanker vessels and leverages its complimentary capabilities to offer a broader service offering across more tanker segments and with a stronger presence in the US market.
BUILDING A MORE DIVERSIFIED AND RESILIENT PORTFOLIO
In 2016, A.P. Moller Holding consisted of only two activities: Danske Bank and A.P. Moller - Maersk. At the time, we carried DKK 3bn (USD 0.5bn) of net debt. Also, our cash inflow was highly concentrated: approximately 60% of A.P. Moller Holding’s cash generation from 2016 to 2018 came from Danske Bank. In subsequent years, Danske Bank’s dividends and share buy-back programmes came to a standstill due to its regulatory AML-related challenges.
We have worked diligently to strengthen the resilience of A.P. Moller Holding. Today, approximately 50% (down from 100% in 2016) of the net asset value of A.P. Moller Holding is represented by our shareholdings in Danske Bank and A.P. MollerMaersk. A.P. Moller Holding no longer carries any debt and we have accumulated a sizeable liquid public markets portfolio, now valued at DKK 44bn (USD 6.2bn).
Our investment strategy is to build scalable platforms, while we strive to fulfil our Group’s long-standing purpose of ‘nyttig virksomhed’ (building and investing in businesses that have a positive impact on society). From 2019 onwards, we have developed a portfolio of principal holdings through acquisitions of mid-size to large companies, such as KK Wind Solutions, Faerch, and Unilabs. These activities have also grown through several addon acquisitions.
In 2024, Unilabs acquired kempf and pfaltz, a premier dermatopathology institute based in Zurich. By merging with Unilabs, kempf and pfaltz will gain access to one of Europe’s largest networks of pathologists, as well as Unilabs’ AI and digital pathology capabilities. With the acquisition, Unilabs will strengthen its capabilities in dermatopathology, a specialised, large, and growing market.
During the year, KK Wind Solutions also expanded its activities and customer offerings by successfully integrating the recently acquired converter activities of Vestas and the cooling solutions of Nissens.
Furthermore, A.P. Moller Holding expanded its principal holdings through the acquisition of Concentric in a public offer of DKK 6bn (USD 0.8bn). Concentric is a global industrial supplier of pump, fan, and thermal management solutions for the commercial vehicle market. The company is well positioned to support its customers through the energy transition, providing solutions for incumbent internal combustion engine technologies as well as electric drive lines. In addition, Concentric’s solutions are also positioned for expansion into new product markets, including energy storage and data centres.
A.P. Moller Holding also noted several other developments in its portfolio, including the demerger and separate listing of Svitzer, the merger of Maersk Supply Service and DOF (A.P. Moller Holding becoming the biggest shareholder of DOF), the successful closing of A.P. Moller Capital’s fundraise for its second infrastructure fund targeting emerging markets, and the continued development of our Group’s scale-ups, including the establishment of Maersk Offshore Wind and Vioneo.
Finally, A.P. Moller Holding’s growth equity team, targeting minority holdings in late stage ventures across select macro themes, recorded investments in Circtec, GetYourGuide, Revolut, Tenderd, and Zopa during 2024.
We have worked diligently to strengthen the resilience of A.P. Moller Holding.
ACKNOWLEDGING OUR COLLEAGUES ACROSS THE GROUP
Several military conflicts and attacks by paramilitary groups put many of our Group’s colleagues at risk during the year. The safety of our people is always at the forefront of our minds.
These conflicts also impact the communities of our customers, suppliers, and employees. To provide support, A.P. MollerMaersk’s special logistics team has been a significant contributor to the United Nations’ emergency logistics programme. Our team also provided critical logistics services to the World Food Programme, UNICEF, and many countries’ relief efforts for some of the worst impacted war zones globally.
As our Group looks ahead, we are acknowledging the rapid rise of economic nationalism and protectionism. During 2024, the US and EU imposed import duties on certain Chinese goods to safeguard domestic industries. In 2025, we are seeing the beginning of multiple escalating trade conflicts, which may hold profound implications for the global economy, trade, and some of our holdings.
In closing, let me express my sincere gratitude to our many colleagues and Directors across the Group for their relentless efforts to provide customers with reliable and impactful products and services. I also applaud their dedication to invest in and develop businesses that aspire to contribute to solutions for some of our generation’s greatest challenges, including economic development, demographic change, energy security, and climate change.
FIVE-YEAR SUMMARY
HIGHLIGHTS
The A.P. Moller Group delivered a strong result in 2024, despite the economic headwinds in some of our larger segments, the continued conflicts in Ukraine and Gaza, an increasingly complex geopolitical landscape, and operational challenges driven by disruptions such as attacks on vessels around the Red Sea
A.P. Moller - Maersk delivered its third best result ever, significantly above initial expectations, positively impacted by higher demand and increased freight rates
Danske Bank delivered its best result ever and reported a net profit of DKK 24bn
The demerger and separate listing of Svitzer from A.P. Moller - Maersk was completed in April 2024
The merger of Maersk Supply Service and DOF was successfully completed in Q4, leading to A P Moller Holding taking a significant holding in the combined company
We concluded the acquisition of Concentric and delisted the company from the Swedish stock exchange
We launched Vioneo, a new venture dedicated to defossilising plastics production
Our growth equity portfolio counted nine investments at the end of 2024
FINANCIAL PERFORMANCE
A.P. Moller Holding delivered a consolidated result of DKK 49bn and a return on equity of 9%. We benefited from a cash inflow of DKK 17bn and experienced an increase in net asset value of DKK 16bn to DKK 230bn as a result of strong performance in the financial markets.
A.P. Moller Holding is the parent company of the A.P. Moller Group, investing in ‘nyttig virksomhed’ – building and developing businesses that have a positive impact on society. Our focus is to build and buy platforms within our four thematic investment areas: Global trade; Energy transition; Circularity, water & waste recovery; and Demographic & societal change.
Activity levels have been high during 2024, most notably with the demerger and separate listing of Svitzer Svitzer had its first day of trading on the Danish stock exchange on 30 April 2024. A.P. Moller Holding owns 47% of Svitzer and maintains de facto control of the company.
Furthermore, A.P. Moller Holding concluded the acquisition of Concentric in Q4 and delisted the company from the Swedish stock exchange. We find Concentric’s position and its energy transition story very compelling and look forward to supporting the continued development of the company.
The merger between Maersk Supply Service and DOF was also successfully completed in Q4, leading to us becoming the
largest shareholder of the combined business, and to the creation of Maersk Offshore Wind as a separate company.
A.P. Moller Holding delivered a consolidated revenue of DKK 425bn and a net result of DKK 49bn, ending the year with a total equity of DKK 562bn. Operating profit and earnings increased compared to 2023, reflecting underlying constructive conditions for our shipping activities and related services. Our industrial businesses continued to experience organic growth and have successfully integrated companies acquired in 2023.
A.P. Moller Holding recorded a cash inflow from our portfolio companies of DKK 17bn, leading to growth in our financial portfolio, which reached DKK 44bn at year end.
Total assets and equity increased due to a stronger DKK/USD exchange rate (6% increase compared to 2023) and positive results, mainly driven by A.P. Moller - Maersk and Danske Bank as well as solid returns on our financial portfolio.
Net asset value increased by 7%, mainly driven by the increase in Danske Bank’s share price and positive shareholder distributions and a return of 16% from our financial portfolio which benefitted from the positive development in the global financial markets.
Our valuation of the privately owned portfolio companies remained fairly unchanged throughout the year, however with changes on portfolio company level.
OPERATING ACTIVITIES
Revenue for 2024 increased by 9% to DKK 425bn (DKK 389bn). Our shipping businesses have seen a positive development in revenue, while the growth within Energy transition and Circularity, water & waste recovery was more subdued.
OPERATING COSTS
Operating costs increased by 5% during 2024, mainly due to higher activity in shipping. Operating costs continued to be negatively impacted by elevated inflation levels, especially within Demographic & societal change, as well as by various costs due to several strategic acquisitions and transformation projects across the organisation.
EBITDA
Our operating profit increased from DKK 72bn in 2023 to DKK 91bn, positively impacted by higher earnings in A.P. MollerMaersk and our other shipping activities, and partly offset by lower profitability mainly in our industrial businesses.
EBIT
EBIT amounted to DKK 48bn compared to DKK 34bn in 2023, positively impacted by the positive developments across the group, including improved profitability of our associated companies, Danske Bank and Noble.
FINANCIAL ITEMS
Net financial income amounted to DKK 7bn compared to DKK 5bn last year, mainly reflecting net fair value gains from the financial portfolio, as volatility in exchange rates is still negatively impacting the financial items.
TAX
Corporate income taxes comprise taxes calculated in accordance with various countries’ tax regimes. Land-based activities, which are subject to normal corporate income tax, include terminals, logistics, services and shipping agencies, sale of industrial products, diagnostics services, and financial profit from other equity investments. The taxation of shipping income is based on tonnage tax regimes and applies to a significant part of the group’s activities. Given tonnage taxation is not impacted by financial profits and is payable even in loss making years, the effective tax rate metric can fluctuate significantly over the years.
Tax for the year amounted to DKK 5bn compared to DKK 3bn in 2023.
From 1 January 2024, A.P. Moller Holding group has been subject to the minimum tax for all jurisdictions through the implementation of Global Minimum Taxation (OECD Pillar Two).
RESULT FOR THE YEAR
Result for the year increased from DKK 35bn in 2023 to DKK 49bn, mainly reflecting solid business considerations across the shipping and offshore businesses and a record high result in Danske Bank.
Result attributable to the owner of A.P. Møller Holding A/S was DKK 22bn compared to DKK 19bn in 2023. The share of result was positively impacted by the group’s share of the result in associated companies, mainly Danske Bank.
The DKK/USD average exchange rate was more or less unchanged compared to 2023.
The result for the year is better than our initial expectations set in the Annual Report 2023, primarily due to improved conditions for shipping.
FINANCIAL RESULT FOR THE PARENT COMPANY
A.P. Moller Holding’s administrative costs have increased as we continue to add resources and capabilities within the
organisation. At the end of 2024, the organisation counted 61 employees, up from 55 the year before.
Result for the year was DKK 23bn (DKK 15bn), benefitting from higher profit from investments in subsidiaries.
Total assets as of 31 December 2024 amounted to DKK 302bn (DKK 272bn), of which DKK 300bn (DKK 271bn) were allocated to investments in subsidiaries.
Equity at year end totalled DKK 301bn (DKK 272bn), of which DKK 172bn (DKK 170bn) was distributed to retained earnings.
FINANCIAL DEVELOPMENT IN PORTFOLIO COMPANIES
2024 was impacted by supply chain disruptions due to the situation in the Red Sea. Higher demand and increased freight rates led to financial results significantly above initial expectations.
A.P. Moller - Maersk delivered a revenue of DKK 382bn, corresponding to an increase of 9%. Continued higher activities in the terminal segment also contributed to higher growth.
A.P. Moller - Maersk approved a dividend of DKK 1,120 (DKK 515) per share in line with its dividend policy, corresponding to a dividend yield of 9%. A share buy-back programme of up to DKK 14bn has been initiated to be executed over a period of 12 months. The purpose of the programme is to adjust the capital structure through the cancellation of shares repurchased.
Danske Bank reported a net profit of DKK 24bn, up 11% from 2023. 2024 marked the first year of execution of its new strategy ‘Forward ’28’. The improved financial results reflected higher income levels, improved cost/income ratio, and a higher return on equity. Net loan impairment reversals of DKK 0.5bn supported the financial result for 2024.
Danske Bank continues to have a strong capital and liquidity position with buffers above regulatory requirements. At the end of 2024, Danske Bank reported a CET1 ratio at 18%, well above the bank’s internal target of 16% and the regulatory requirement.
The dividend payment for 2024 amounted to DKK 21 50 per share. Total dividend together with the share buy-back programme are equivalent to a dividend payout of 100% of net profit for 2024 and capital release from sale of its personal customer business in Norway. The dividend policy for 2025 will remain unchanged, targeting a dividend payout of 40-60% of net profit. Danske Bank has decided to initiate a new share buyback programme of DKK 5bn.
Svitzer continued to grow, driven by solid commercial performance, tariff increases offsetting inflation, and earlier than anticipated commencement of a terminal towage contract. Revenue increased to DKK 6bn corresponding to a growth of 9% compared to 2023. The increase in revenue was partly offset by higher operating costs, including separation and listing costs. Return on equity excluding these costs increased to 9% (8%). Svitzer has proposed a dividend payment for 2024 of DKK 8.00 per share.
Revenue in Unilabs grew 4% compared to 2023, partly due to inorganic growth. However, the overall performance is still challenged by price pressure for medical diagnostic services in several countries, resulting in declining profitability. An impairment of goodwill of DKK 9bn has been recognised in 2024. The business transformation to support organic growth and improved profitability in the coming years is ongoing.
In Faerch, the overall sales performance improved slightly compared with 2023, leading to positive volume growth. The high interest rates and elevated consumer prices have continued to impact market sentiment and growth perspectives in Europe. Profitability has been negatively impacted by higher raw material prices and salary inflation. The US market development confirmed the high expectations for continued expansion with higher growth rates and solid margins. In April 2024, Faerch celebrated a landmark moment with the grand opening of the new tray recycling line in Duiven, bringing input capacity to 60,000 tonnes of household waste. The dedication to transforming the rigid food packaging industry will continue industrialising recycling technology and ensuring reuse of PET trays rather than them ending up in landfills or incineration.
In September 2024, Noble announced the closing of the acquisition of Diamond Offshore Drilling. Integration is progressing as planned and targeted synergies of approximately DKK 0.7bn are being realised.
2024 marked another year of strong progress and continued growth for KK Wind Solutions. Despite geopolitical turbulence and economic complexity, KK Wind Solutions achieved several milestones. The company integrated Nissens Cooling Solutions, and together with acquisitions from previous years, the combined business delivered a revenue of DKK 8bn, an increase of 15%, and employed more than 3,500 employees at year end. Strong commercial performance across diverse product and service offerings has been a key driver of the success. Through converters and controllers in wind turbines, KK Wind Solutions is enabling its customers to transition to green energy and electrifying the world with renewable energy. They are also leveraging their substantial footprint in the wind industry to expand into broader renewable businesses and new frontiers like Power-to-X.
Concentric is one of the world's leading players in flow control and fluid power technology for the commercial vehicle market. As the acquisition of Concentric was concluded in October 2024, the impact on the result for the year is insignificant.
Following the combination of Maersk Supply Service and DOF, Maersk Offshore Wind has been created as a separate business. Their Wind Installation Vessel concept is 30% more efficient than conventional jack-up vessels. With new technology designed for year-round installation, it uses purpose-built tugs and barges improving port accessibility. The first wind installation vessel will be delivered in 2026 and will go directly on contract.
Maersk Product Tankers delivered a revenue of DKK 4.0bn (DKK 4.4bn) and a net profit of DKK 1.6bn (DKK 1.8bn), positively impacted by the TCE earnings, where rates for all segments continued at above historical averages. During Q4 2024, the TCE earning declined and spot rates for all segments were under pressure. The market conditions were affected by the
sanctions related to the war in Ukraine, the situation in the Red Sea, and wider arbitrage on the back of changes in demand and trade flows.
On 8 January 2024, Maersk Tankers acquired Penfield Marine to create a large-scale crude and product tanker company offering pool partners and cargo customers a wider range of services. The combined company manages around 240 vessels. Maersk Tankers reported a revenue of DKK 2.6bn (DKK 3.1bn) and a net profit of DKK 0.3bn, in line with previous years. The company benefitted from the positive market conditions with high freight rates in the first nine months of the year.
As announced last year, Maersk Tankers has ordered ten Very Large Ammonia Carriers (VLACs), adding VLAC as a new segment. The first vessel will be delivered in 2026.
In our growth equity portfolio, we completed five (three) new investments during the year, adding up to a total of nine investments end of 2024. We continue to see strategic logic from investing in late-stage growth companies and expect an attractive risk adjusted financial return.
EQUITY
As of 31 December 2024, total equity amounted to DKK 562bn (DKK 504bn), reflecting an increase of 10%. The increase was mainly the result of the increase in the DKK/USD exchange rate of 6% compared to end of 2023 and the improved result for the year, partly set off against paid dividends to our shareholders and non-controlling interests. The return on equity amounted to 9% (7%) and the equity ratio to 68% (68%). A.P. Moller Holding’s share of the equity increased to DKK 310bn (DKK 281bn), impacted by the result for the year and the increase in the DKK/USD exchange rate.
DIVIDEND
Based on the financial result for 2024, the Board of Directors proposes a dividend of DKK 1.0bn to A.P. Møller og Hustru Chastine Mc-Kinney Møllers Fond til almene Formaal (A.P. Moller Foundation). In 2024, a dividend of DKK 1.0bn was paid.
INVESTMENT ACTIVITY
We were pleased to welcome Svitzer as a stand-alone company to the A.P. Moller Group. Following the demerger from A.P. Moller – Maersk in April 2024, A.P. Moller Holding is a significant shareholder of the company owning 47% and assuming de facto control.
In August 2024, A.P. Moller Holding announced a recommended public cash offer to the shareholders of Concentric AB. The offer was closed in November where 98% of the shares were acquired and the company was delisted from the Swedish stock exchange. A compulsory buy-out process has been initiated and is expected to be finalised during 2025.
The combination of Maersk Supply Service and DOF was completed in November 2024. With the completion of the agreement, A.P. Moller Holding group became the largest shareholder in the combined company.
Iv3 Aqua, our water utility platform, concluded the acquisition of Qurayyat Desalination SAOC, which operates one of the largest seawater reverse osmosis plants in Oman
Our other portfolio companies have signed and completed a number of acquisitions, including the takeover of Penfield Marine by Maersk Tankers, Alpha Ori Technologies by ZeroNorth,
and kempf and pfaltz by Unilabs Furthermore, Noble completed the acquisition of Diamond Offshore Drilling.
Cash flow used for investing activities was mainly impacted by our investments in portfolio companies as well as activity in our financial portfolio. The total capital inflow from dividends, share buy-back programmes, and our financial portfolio was DKK 17bn (DKK 43bn), positively impacted by dividends from Danske Bank and dividends and share buy-back programmes from A.P. Moller - Maersk.
At the end of 2024, the net asset value increased to DKK 230bn, up 7% from the end of 2023.
The main contributor of the value appreciation is Danske Bank with a 13% increase in share price and total shareholder return of 25%, driven by the solid financial performance.
The value of Svitzer contributed positively following the separate listing. Further, our shareholding in DOF has contributed with an increase of around 2%.
The value of our shareholding in Noble has decreased by 35% during the year as market momentum slowed significantly
A.P. Moller - Maersk’s share price decreased 3% from the end of 2023 following the normalisation of freight rates. Total shareholder return for 2024 was 6% The share price in April 2024 following the demerger of Svitzer was more or less unaffected.
The net asset value is a volatile measure, not least over a shorter period, given our significant exposure to a few main portfolio companies. The net asset value calculation is based on different valuation methods. Our listed portfolio companies are assessed using their share prices at the stock exchange. The privately held companies are assessed based on recognised valuation methods, and the financial portfolio on market capitalisation, primarily quoted prices.
FINANCIAL OUTLOOK
A.P. Moller Holding and its portfolio companies are exposed to the global economic activity levels as well as the development in the global financial markets. Based on our expectations and financial guidance for our portfolio companies, we expect EBITDA for 2025 to be in the range of DKK 20-50bn based on current exchange rates.
The above statement is, by nature, subject to several uncertainties, including but not limited to, geopolitical uncertainties that will challenge global supply chains and global economic growth, and rapid rise of economic nationalism and protectionism. This could cause actual results and performance to differ materially from our expectations. In addition, financial performance depends on several factors subject to uncertainties related to the given uncertain macroeconomic conditions as well as future development of freight rates and volumes, import duties, demographic and societal changes, demand for sustainable solutions, commodity prices, including but not limited to, oil and energy prices, inflation, and interest rates.
BUILDING A PORTFOLIO OF PLATFORMS FOR THE FUTURE
Our investment strategy is to build scalable platforms in areas where we can leverage momentum to drive long-term value and impact. We focus on long-term mega trends, and, as owners, we utilise and leverage the strengths and capabilities accumulated across our Group throughout more than 120 years. In doing this, we strive to fulfil our Group’s long-standing purpose of ‘nyttig virksomhed’ (having a positive impact on society).
Our strategy implies that we devote our time and resources to identifying and executing investments across sectors and countries, and within four themes that we believe will be relevant for multiple business cycles:
Global trade
Global trade is key to prosperity as it enables income and growth for people and societies. Our businesses enable global trade in different ways, for example by facilitating more efficient logistics across the globe and by building critical infrastructure. Financial services and the proliferation of efficient capital allocation are also drivers as well as beneficiaries of increased global trade.
Energy transition
Our societies depend on a steady and reliable supply of energy. At the same time, we need to migrate from the fossil sources that propelled the industrial revolution and drove wealth creation and consumption for many decades and move towards energy generation from non-fossil and renewable sources. Our focus is on this transition which will not happen overnight and maintaining access to energy is a necessity for our societies.
Circularity, water & waste recovery
Global consumption of resources and products is not in balance with our planet’s ability to regenerate the resources consumed nor to absorb the substantial generation of waste. Sustainable replacements are being adopted and the use and utilisation of resources must be optimised. We are committed to the development of circular rather than linear production and consumption models.
Demographic & societal change
Across both mature and emerging economies, population demographics continue to change, which is creating challenging conditions for societal welfare models. These slow-moving but largely inevitable demographic and societal factors are transforming our societies. Absent continuous improvements in efficiency and new business models, the welfare imbalance in our societies will create unsustainable levels of inequality. We invest in digital and automated ways of working to address the welfare challenges arising from demographic change.
INVESTMENT MANDATES
We leverage our knowledge, expertise, and experience across four different mandates:
Principal holdings
Large control-oriented investments in companies backed by solid long-term trends. We prefer our principal investments to be platforms where we can continue to deploy additional capital over time for organic and inorganic expansion.
Growth equity
Patient minority investments in late-stage growth businesses. In addition to generating attractive financial returns, the objective is to leverage and continue to enhance domain knowledge within our core areas of expertise and investment themes.
Scale-ups
Rooted in our entrepreneurial legacy and spirit, we selectively initiate incubation projects and actual building of new businesses. Such greenfield projects and business building are based on internally generated ideas, a few of which are, after an extensive vetting process, pushed forward and initially funded by us. Over time, we typically bring in other investors.
Public markets
We apply active concentrated global strategies across various asset classes seeking to generate financial results above or inline with external market benchmarks.
ENGAGED AND ACTIVE LONG-TERM OWNERS
In the spirit of our founder, A.P. Møller, we are engaged and active long-term owners with a point of view on key matters. Stewardship and a continued focus on the quality of interactions between management, Board of Directors, and owner(s) are therefore critical to our success. In recent years, we developed and implemented a set of principles and guidelines defining our ownership model, and how we exercise it. These principles are rooted in our legacy, and we will continue to optimise our stewardship and ownership model in the years to come.
A.P. Moller - Maersk Danske Bank Unilabs Faerch
A.P. MOLLER - MAERSK is an integrated transport and logistics company working to connect and simplify its customers’ supply chains. The company is a global leader in shipping activities.
DANSKE BANK is Denmark’s largest bank. Its core business includes private, business, institutional customer segments, and other financial services to the Nordic markets.
UNILABS is a leading diagnostics services provider in Europe, focusing on laboratory testing, pathology, and radiology. The company services both public and private healthcare providers across multiple countries.
CEO: Vincent Clerc
CFO: Patrick Jany
Representatives
• Robert M. Uggla (Chair)
Key figures end of 2024
• Market cap: DKK 183bn
• Ownership: 41.5% / 51.5% voting share
(USDm)
CEO: Carsten R. Egeriis
CFO: Cecile Hillary
Representatives
• Martin N. Larsen (Vice Chair)
• Lars-Erik Brenøe
Key figures end of 2024
• Market cap: DKK 170bn
• Ownership: 21.3%
Executive Chair: Badhri Srinivasan
CFO: Carsten Højlund
Representatives
• Jan T. Nielsen (Vice Chair)
FAERCH is a leading supplier of circular packaging solutions to the global food industry, serving leading food manufacturers and retailers around the world.
NOBLE is a leading offshore drilling company for the oil and gas industry. The company owns and operates one of the youngest and most advanced fleets in the offshore drilling industry.
(DKKm)
(EURm)
CEO: Lars G. Hansen
CFO: Tom Sand-Kristensen
Representatives
• Henrik Poulsen (Chair)
• Jan T. Nielsen (Vice Chair) REVENUE (EURm)
CEO: Robert W. Eifler
CFO: Richard B. Barker
Representatives
• Claus V. Hemmingsen
Key figures end of 2024
• Market cap: DKK 36bn
• Ownership: 19.5% REVENUE
(USDm, includes only Noble up to the merger with Maersk Drilling in 2022)
DOF Svitzer
DOF is a leading provider of global offshore marine services for the energy sector, including oil and gas companies, offshore renewable companies, and subsea contractors.
SVITZER is a global leader in sustainable marine services, providing critical towage infrastructure and maritime solutions across Europe, AMEA, Australia, and the Americas.
Maersk Product Tankers KK Wind Solutions Maersk Tankers
MAERSK PRODUCT TANKERS is an asset company, owning tankers transporting energy products worldwide for large energy companies and trading houses.
KK WIND SOLUTIONS is a leading global supplier of power electronic system solutions for the wind turbine industry, offering a wide range of products and services to wind turbines and parks.
MAERSK TANKERS is a service company providing commercial management solutions for shipowners in the tanker industry. The company operates one of the largest tanker fleets in the world.
CEO: Mons S. Aase
CFO: Martin Lundberg
Representatives
• Erik Bergöö (Vice Chair)
Key figures end of 2024
• Market cap: DKK 13bn
• Ownership: 25.0%
REVENUE
(USDm includes only DOF up to the merger with Maersk Supply Service in 2024)
CEO: Kasper Friis Nilaus
CFO: Knud Winkler
Representatives
• Robert M. Uggla (Vice Chair)
Key figures end of 2024
• Market cap: DKK 7bn
• Ownership: 47.0%
REVENUE (DKKm)
CEO: Tina Revsbech
CFO: Christian Huss
Representatives
• Martin N. Larsen (Chair)
• Birgitte Schou
• Erik Bergöö
CEO: Mauricio Quintana
CFO: Bjørn R. Mogensen
Representatives
• Simon K. Ibsen (Vice Chair)
CEO: Tina Revsbech
CFO: Christian Huss
Representatives
• Robert M. Uggla (Chair)
• Maria Pejter
• Martin N. Larsen
REVENUE (USDm)
REVENUE (DKKm)
REVENUE (USDm)
Concentric A.P. Moller Capital Innargi ZeroNorth
CONCENTRIC is a global leader in pump, fan, and thermal management solutions for the commercial vehicle market, helping customers increase fuel efficiency, reduce emissions, and improve engine control.
A.P. MOLLER CAPITAL is an infrastructure fund manager focusing on high growth markets, combining attractive risk adjusted returns with a positive societal impact.
INNARGI is a geothermal heating company aiming to heat millions of urban homes while leaving zero impact on our planet.
CEO: Martin Kunz
CFO: Marcus Whitehouse
Representatives
• Simon K. Ibsen (Vice Chair)
• Jan T. Nielsen
CEO: Kim Fejfer
CFO: Joe Nielsen
Representatives
• Robert M. Uggla (Chair)
CEO: Samir Abboud
CFO: Lars Heineke
Representatives
• Claus V. Hemmingsen (Chair)
ZERONORTH is a technology company providing a range of software solutions that enable the shipping industry to reduce its impact on the climate while maintaining commercial performance.
IV3 AQUA is a water management company owning and operating water, wastewater, reuse plants, concessions, and related water utility businesses.
CEO: Søren C. Meyer
CFO: Karsten Gregory
Representatives
• Maria Pejter
CEO: Olaf N. Krohg
CFO: Frederick Hung
Representatives
• Jan T. Nielsen (Vice Chair)
• Brighton Mudzingwa
REVENUE (USDm)
C2X Maersk Offshore Wind Vioneo
C2X is a green methanol production company aiming to develop and operate green methanol production facilities to supply both the chemical and shipping sectors.
MAERSK OFFSHORE WIND is a provider of installation services to the offshore wind market accelerating the rollout of offshore wind farms.
VIONEO was established to be the world’s first large-scale producer of fossil-free plastics based on green methanol.
CEO: Brian Davis
CFO: Alastair Maxwell
Representatives
• Jan T. Nielsen (Chair)
• Martin N. Larsen
CEO: Michael Reimer Mortensen
CFO: Jesper Høybye
Representatives
• Martin N. Larsen (Chair)
• Maria Pejter
CEO: Alex Hogan Representatives
• Simon K. Ibsen (Vice Chair)
• Jan T. Nielsen
RISK MANAGEMENT
Our risk management setup is closely related to our investment strategy and allows us to safeguard the longevity of our portfolio companies by understanding the inherent risks associated with each of them and by supporting the companies in managing these risks in a changing environment.
Risk management reporting is an integrated part of our business processes, allowing A.P. Moller Holding to respond appropriately to the changing environments our businesses are operating in. The Board of Directors receives portfolio performance reports including risk management measures on a regular basis throughout the year.
Being an investor focusing on capital risk, we continuously develop our risk framework, and we have embedded controls and operational risk mitigation processes in our critical daily operations. We have a constant focus on good governance, and we have implemented procedures to continuously assess and ensure that we follow market standards and developments. Further, in line with the purpose of the A.P. Moller Foundation, and to ensure the long-term viability and longevity of A.P. MollerMaersk, our portfolio companies are structured as visualised on page 82.
OUR PORTFOLIO COMPANIES
Having a long-term ownership horizon, our ambition for each investment is defined in a clear ownership strategy, considering sector specific market parameters and developments, as well as current and emerging risks.
Risks related to our portfolio companies include business and financial risks associated with operations and performance. The management of such risks is effectively anchored with the Board of Directors in each of the portfolio companies. Each entity has defined and implemented their own risk management framework, managing specific, defined risks. As owners, we monitor business performance in the portfolio companies closely as part of our ownership aspiration. We report on business and risk related issues to our Board of Directors as appropriate.
Our investment team focuses on large and long-term investments and brings valuable global investment expertise. As we evaluate investment opportunities, the investments will undergo committees and investment gates where thorough risk analysis, due diligence, and mitigation are natural parts of the investment
evaluation process. Our risk management framework allows us to critically evaluate such risks. Investments will be abandoned where risks/rewards are not deemed attractive and in line with our values as well as our financial and strategic beliefs.
As our investments are expected to have a long-term ownership horizon, we focus on the inherent risks related to such investments. At all times, it is part of our strategic beliefs to invest in and build businesses that have a positive impact on society. Hence, we strive to ensure that all our partners acknowledge our values and share our commitment to conduct business in an ethical, legal, and socially responsible manner.
PUBLIC MARKETS
A.P. Moller Holding has a financial portfolio primarily with exposure to global equity markets managed by our own public markets team. The overall objective of the portfolio is i) to create economic value in line with our values, ii) to ensure a part of our financial portfolio remains highly liquid, acting as a buffer for the company to be flexible and able to react as needed in relation to our portfolio companies or to significant changes in our cash flows, and iii) to deliver performance in line with a fixed benchmark.
The Board of Directors approves the investment policy and defines the acceptable risk limits including a variety of risk management factors such as single line limits, currency exposures, and asset class weights. These, in combination with internal investment principles, guide the financial investments on a daily basis. We manage the market, credit, liquidity, and currency risks related to our financial portfolio by limiting maximum exposure to individual asset classes and underlying assets. The guidelines are reviewed regularly to ensure they reflect the market situation and our financial situation at any given time.
CORPORATE SOCIAL RESPONSIBILITY
A.P. Moller Holding invests in and builds businesses with a positive impact on society – ‘nyttig virksomhed’ – as defined by our founder A.P. Møller.
‘Nyttig virksomhed’ is a key element in our investment strategy, and we are open to reconsider our ownership of a business if its business model does not have a positive impact on society. Hence, social responsibility is integrated into our purpose and is core to everything we do.
As part of good governance practice, we have implemented policies and systems to secure a solid basis for our activities as an engaged investment company. We focus on mitigating the key risks of essential compliance areas including money laundering & financing of terrorism and bribery & corruption. As reflected in our Anti-Bribery & Anti-Corruption Policy, we have zero tolerance towards fraud and bribery, which is one of the cornerstones in our overall framework for how to exercise due care to prevent bribery and corruption internally as well as in relation to third parties acting on behalf of A.P. Moller Holding. This is especially relevant in relation to our investments, where we, prior to investing, conduct thorough due diligence measures on the target and relevant counterparties such as advisors, co-investors, etc.
STATUTORY REPORT CF. SECTION 99A OF THE DANISH FINANCIAL STATEMENTS ACT
As an international investment company with a broad range of investment activities, A.P. Moller Holding has a significant influence on society. We acknowledge the responsibilities that this entails and make an effort to ensure that we are recognised as a trustworthy group of companies.
The Board of Directors of each of our portfolio companies define their own specific CSR policies and Codes of Conduct. We are represented on each board in companies where we hold a minimum of 50% of the votes, and these representatives ensure that CSR policies, including human rights, climate change, and environmental impact, are enforced. Policies are adapted to meet the circumstances in which each of the affiliates operate.
For A.P. Moller Holding’s statutory statement on CSR in accordance with section 99a of The Danish Financial Statements Act, please refer to: https://apmoller.com/wpcontent/uploads/2025/03/APMH-CSR-Report-2024.pdf
STATUTORY REPORT CF. SECTION 99D OF THE DANISH FINANCIAL STATEMENTS ACT
In line with our core values, responsible use of information and data is part of our overall aim to adhere to high ethical standards. Pursuant to the requirements and with an outset in our daily operations and activities, A.P. Moller Holding has implemented a data ethics policy based on five principles reflecting how we use and process both personal and non-personal data as well as general data and information. The policy addresses our aim to be transparent as appropriate and acting responsibly with respect and dignity both towards our employees and when working with third parties. The policy complements our policies and procedures on handling of personal data, IT-security, etc.
SUSTAINABILITY HIGHLIGHTS
The companies in the A.P. Moller Group define and execute their own sustainability initiatives. In 2024, numerous activities were launched of which a few are highlighted here. For more details, please refer to the respective sustainability reports.
Faerch’s emission reduction targets for 2030 and 2040 have been validated by the Science Based Targets initiative (SBTi), ensuring they align with the globally recognised 1.5°C pathway.
Danske Bank was the leading Nordic arranger of sustainable bonds in 2024 and the leading arranger of sustainable bonds from Nordic corporate issuers.
Maersk Tankers set out to deploy wind-assisted propulsion systems on five vessels, expecting doubledigit percentage reductions in fuel consumption and CO2 emissions per vessel by 2025 and 2026.
ZeroNorth’s acquisition of Alpha Ori Technologies led to the establishment of the maritime industry’s largest data platform, with high-frequency data from IoT sensors driving greater operational, commercial, and sustainable efficiency for its customers.
C2X partnered with SunGas to fund the Beaver Lake project in Louisiana, aiming to produce 500,000 tonnes of green methanol with over 80% lower carbon intensity compared to fossil fuels.
A.P. Moller Holding launched Vioneo to become the world's first large-scale producer of zero-emission, virgin-quality, fossil-free plastics from green methanol, achieving a 4-6 kg CO2 reduction per kg of plastic produced.
A.P. Moller Holding created Maersk Offshore Wind as a separate company to service the offshore wind market with its new Wind Installation Vessel concept, reducing wind turbine installation time by 30%, thereby lowering overall costs and speeding up grid connection.
A.P. Moller - Maersk took delivery of seven large dualfuel methanol vessels (16,000-17,000 TEU) and the world's first retrofitted dual-fuel vessel, with eleven more large dual-fuel vessels set for delivery in 2025.
ZeroNorth enhanced the operational efficiency of 72,000 voyage legs by generating 1.5 million possible routes for customer vessels, resulting in a reduction of one million metric tonnes of CO2 for their customers.
Unilabs entered a partnership with C2N Diagnostics to expand the reach of C2N’s Precivity™ blood tests, providing a less invasive test for Alzheimer’s.
APM Terminals rolled out battery-electric container handling equipment in Egypt, Jordan, and Spain as part of their USD 60m electrification pilot programme to reduce the use of fossil fuels.
Svitzer commissioned the construction of the world’s first battery-methanol electric tug, designed to enable carbon neutral towage for the majority of its operational lifecycle.
BOARD OF DIRECTORS
Ane M.M. Uggla Chair
Chair of the Board of Directors
• A.P. Møller og Hustru Chastine Mc-Kinney Møllers Fond til almene Formaal
• Den A.P. Møllerske Støttefond
Other management duties
• Estemco III ApS (CEO)
• Timer ApS (CEO)
Claus V. Hemmingsen
Chair of the Board of Directors
• DFDS A/S
• Innargi Holding A/S
• HusCompagniet A/S
• Rambøll Gruppen A/S
Member of the Board of Directors
• A.P. Møller og Hustru Chastine Mc-Kinney Møllers Fond til almene Formaal
• Den A.P. Møllerske Støttefond
• Noble Corporation PLC
• Det Forenede Dampskibs-selskabs Jubilæumsfond
• Fonden Mærsk Mc-Kinney Møller Center for Zero Carbon Shipping
• Global Maritime Forum Fonden
Other management duties
• CVH Consulting ApS (CEO)
• Committee for Corporate Governance, Denmark (member)
Jan Leschly
Member of the Board of Directors
• Universal Tennis Ranking LLC
• The Leschly Tennis Foundation
• Nightingale Veterinary Partners
Other management duties
• Adjunct Professor at Copenhagen Business School
Member of the Board of Directors
• Danske Bank A/S
• A.P. Møller og Hustru Chastine Mc-Kinney Møllers Fond til almene Formaal
• A.P. Møller og Hustru Chastine Mc-Kinney Møllers Familiefond
• Monjasa Holding A/S
• Odense Havn A/S
• Operaparkfonden
Other management duties
• LEBrenoe (personally owned law firm)
Lars-Erik Brenøe
EXECUTIVE BOARD
Robert M. Uggla Chief Executive Officer
Other management duties, etc.
• A.P. Møller - Mærsk A/S (Chair)
• A.P. Møller Capital P/S (Chair)
• Maersk Tankers A/S (Chair)
• Svitzer Group A/S (Vice Chair)
• IMD (Director of the Foundation Board)
• Agata ApS (CEO)
• Estemco XII ApS (CEO)
• International Business Leaders’ Advisory Council, IBLAC (Member)
Robert M. Uggla is appointed to the Board of Directors in a number of entities controlled by A.P. Møller Holding A/S.
Jan T. Nielsen Chief Investment Officer
Other management duties, etc.
• C2X A/S (Chair)
• Unilabs Group Holding ApS (Vice Chair)
• Faerch Group Holding A/S (Vice Chair)
• Iv3 Aqua Holding A/S (Vice Chair)
• Concentric AB (Board member)
• Vioneo Holding AG (Board member)
• LEGO A/S (Board member)
• Thorsgaard Holding ApS (CEO)
Jan T. Nielsen is appointed to the Board of Directors in a number of entities controlled by A.P. Møller Holding A/S.
Martin N. Larsen is appointed to the Executive Board and Board of Directors in a number of entities controlled by A.P. Møller Holding A/S.
FINANCIAL STATEMENTS
CONSOLIDATED INCOME STATEMENT FOR 1 JANUARY TO 31 DECEMBER CONSOLIDATED
STATEMENT OF COMPREHENSIVE INCOME
CONSOLIDATED BALANCE SHEET
AS OF 31 DECEMBER
CONSOLIDATED CASH FLOW STATEMENT
FOR 1 JANUARY TO 31 DECEMBER
Cash and bank balances include DKK 7.0bn (DKK 7.0bn) relating to cash and bank balances in countries with exchange rate control or other restrictions. These funds are not readily available for general use by the parent company or other subsidiaries.
CONSOLIDATED STATEMENT OF CHANGES IN EQUITY
BASIS OF PREPARATION
Note 1.1: General accounting policies
This note sets out general accounting policies for A.P. Møller Holding A/S that relate to the financial statements as a whole. Where an accounting policy is generally applicable to a specific note to the financial statements, the policy is described within that note.
BASIS OF PREPARATION
The consolidated financial statements for 2024 for A.P. Møller Holding A/S have been prepared on a going concern basis and in accordance with the IFRS Accounting Standards as adopted by the EU (IFRS) and additional Danish disclosure requirements for large enterprises in class C.
The consolidated financial statements are presented in DKK million (DKKm) and all values are rounded to the nearest thousand except when otherwise stated.
The accounting policies are consistent with those applied in the consolidated financial statements for 2023, except for the changes to accounting standards that were effective from 1 January 2024 and endorsed by the EU. The changes have not had a material impact on the financial statements.
CONSOLIDATION
The consolidated financial statements comprise the parent company A.P. Møller Holding A/S, its subsidiaries, and proportionate shares in joint arrangements classified as joint operations.
Subsidiaries are entities controlled by A.P. Moller Holding. Control is based on the power to direct the relevant activities of an entity and the exposure, or right, to variable returns arising from it. In that connection, relevant activities are those that significantly affect the investee’s returns. Control is usually achieved by directly or indirectly owning or in other ways controlling more than 50% of the voting rights, or by other rights, such as agreements on management control.
Joint arrangements are entities in which A.P. Moller Holding, according to contractual agreements with one or more parties, has joint control. The arrangements are classified as joint ventures, if the contracting parties’ rights are limited to net assets in separate legal entities, and as joint operations, if the parties have direct and unlimited rights to the assets and obligations for the liabilities of the arrangement.
Note 1.1:
General
accounting policies – continued
Entities in which A.P. Moller Holding exercises a significant but non-controlling influence are considered associated companies. A significant influence is usually achieved by directly or indirectly owning or controlling 20-50% of the voting rights. Agreements and other circumstances are considered when assessing the degree of influence.
Consolidation is performed by summarising the financial statements of the parent company and its subsidiaries in accordance with A.P. Moller Holding’s accounting policies. Intra-group income and expenses, shareholdings, dividends, intra-group balances, and gains on intra-group transactions are eliminated. Unrealised gains on transactions with associated companies and joint arrangements are eliminated in proportion to A.P. Moller Holding’s ownership share. Unrealised losses are eliminated in the same way, unless they indicate impairment.
When the group ceases to consolidate or applies equity accounting for an investment because of a loss of control, joint control, or significant influence, any retained interest in the entity is remeasured to its fair value, with the change in carrying amount recognised in profit or loss. This fair value becomes the initial carrying amount for the purpose of subsequently accounting for the retained interest as an associate, joint venture, or other equity investment. In addition, any amounts previously recognised in other comprehensive income in respect of that entity are accounted for as if the group had directly disposed of the related assets or liabilities. Therefore, amounts previously recognised in other comprehensive income are reclassified to profit or loss.
Non-controlling interests’ share of the result for the year and of equity in subsidiaries is included as part of A.P. Moller Holding’s result and equity, respectively, but shown as separate items.
FOREIGN CURRENCY TRANSLATION
The functional currency of the parent company is USD. DKK has been selected as the presentation currency as the ultimate owner of the group, A.P. Moller Foundation, is located in Denmark.
In the translation to the presentation currency of the parent company, subsidiaries, associated companies, or joint arrangements with functional currencies other than DKK, the total comprehensive income is translated into DKK at average exchange rates, and the balance sheet is translated at the exchange rates as of the balance sheet date. Exchange rate differences arising from such translations are recognised directly in other comprehensive income and in a separate reserve of equity (translation to the functional currency).
The functional currency varies from business area to business area. For the group’s principal shipping and other maritime activities, the functional currency is typically USD. This means, among other things, that the carrying amounts of property, plant and equipment and intangible assets and, hence, depreciation and amortisation are maintained in USD from the date of acquisition. For other activities, the functional currency is generally the local currency of the country in which such activities are performed, unless circumstances suggest that a different currency is appropriate
Transactions in currencies other than the functional currency are translated at the exchange rate prevailing on the date of the transaction. Monetary items in foreign currencies not settled by the balance sheet date are translated at the exchange rate as of the balance sheet date. Foreign exchange gains and losses are included in the income statement as financial income or expenses.
STATEMENT OF COMPREHENSIVE INCOME
Other comprehensive income consists of gains and losses not recognised in the income statement, including exchange rate adjustments arising from the translation from functional currency to presentation currency, fair value adjustments of other equity investments (at FVOCI), cash flow hedges, forward points and currency basis spread, and actuarial gains/losses on defined benefit plans, etc. The group’s share of other comprehensive income in associated companies and joint ventures is also included.
On disposal or discontinuation of an entity, the group’s share of the accumulated exchange rate adjustment relating to the relevant entity with a functional currency other USD, is reclassified to the income statement. Accumulated value adjustments of equity instruments classified as equity instruments at fair value through other comprehensive income will remain in equity upon disposal.
Other comprehensive income includes current and deferred income tax to the extent the items recognised in other comprehensive income are taxable or deductible.
Note 1.1: General accounting policies – continued
CLIMATE-RELATED RISKS
When preparing the consolidated financial statements, management considers climate-related risks, where this could potentially impact reported amounts materially. The areas in which the group has assessed climate-related risks at the end of 2024 are included in the individual notes including Note 2.2 Operating costs, Note 3.1 Intangible assets, and Note 3.2 Property, plant and equipment.
NEW FINANCIAL REPORTING REQUIREMENTS IN 2024 OR LATER
In 2024, A.P. Moller Holding adopted the amendments to IAS 1 Classification of Liabilities as current or non-current and non-current liabilities with covenants. The amendments did not have any material impact on the amounts recognised in prior periods and are not expected to significantly affect the current or future periods
A.P. Moller Holding has not yet adopted the following new or amended accounting standards and requirements that have not yet become effective.
• Amendments to IAS 21 Lack of Exchangeability
• IFRS 18 Presentation and Disclosure in Financial Statements
• IFRS 19 Subsidiaries without Public Accountability: Disclosures
Amendments to IAS 21 are effective from 1 January 2025 and are endorsed by the EU. IFRS 19 is effective from 1 January 2027, but there is some uncertainty as to its EU endorsement date. Changes from IAS 21 and IFRS 19 are not expected to have any significant impact on recognition and measurement.
IFRS 18 is also effective from 1 January 2027 and is expected to be endorsed by the EU. IFRS 18 replaces IAS 1 and introduces new requirements for presentation within the income statement, including specified totals and subtotals. Furthermore, it is required that all income and expenses within the income statement be classified into one of five categories: operating, investing, financing, income taxes, and discontinued operations, whereof the first three are new. The group is working to identify all impacts the amendments will have on the primary financial statements and notes to the financial statements.
DEFINITIONS OF FINANCIAL RATIOS
Return on equity is calculated as result for the year in proportion to the average total equity for the year.
Equity
Note 1.2: Significant accounting estimates and judgments
This note describes the significant accounting estimates and judgments that management has identified as having a potentially material impact on the group’s consolidated financial statements.
The preparation of the consolidated financial statements requires management to make estimates and judgments on an ongoing basis, and form assumptions that affect the reported amounts. Management forms its estimates and judgments based on historical experience, independent advice, external data points, in-house specialists, and on other factors believed to be reasonable under the circumstances.
In its assumption setting, management deals with various aspects of uncertainty. One aspect of uncertainty is the assessment of control over investments classified as associates, joint ventures, and subsidiaries, where the assessment forms the basis for classification. Another aspect is the measurement of uncertainty, where management makes assumptions that derive the value of recognised assets and liabilities. These assumptions concern the timing and amount of future cash flows as well as the risks inherent in these.
In certain areas, the outcome of business plans, including ongoing negotiations with external parties to execute those plans or the outcome of negotiations to settle claims that are raised against the group, is highly uncertain. Therefore, assumptions may change, or the outcome may differ in the coming years, which could require a material upward or downward adjustment to the carrying amounts of assets and liabilities.
The areas and their related impact in which the group is particularly exposed to material uncertainty over the carrying amounts as at the end of 2024 are included in the individual notes as outlined below:
Note Significant accounting estimates and judgments
Note 2.2
sharing agreements (cost-sharing arrangements)
Recognition and measurement of deferred tax assets and uncertain tax positions
Note 3.7 Provisions for legal dispute assumptions
Note 3.8 Measurement of acquired assets, liabilities, and contingent liabilities Judgment H
Note 5.4
Operations in countries with limited access to repatriating surplus cash assumptions Judgment L
Level of potential impact to the consolidated financial statements:
• L = Low • M = Medium • H = High
Note 2.1: Revenue
OPERATING PROFIT
TYPES OF REVENUE
Types of revenue have been organised according to our four investment themes:
• Global trade includes shipping activities, sale of bunker oil, integrated transportation, fulfilment and management solutions, including landside and air transportation, warehousing and supply chain management offerings, gateway terminal activities, towage and related marine activities, and trading, etc.
• Energy transition includes sale of goods and services for renewable solutions
• Circularity, water & waste recovery includes mainly sales of food packaging solutions and recycled plastic
• Demographic & societal change includes mainly diagnostic services within laboratory, imaging, and pathology specialities
CONTRACTS WITH CUSTOMERS
Set out below is the reconciliation of the revenue from contracts with customers to the amounts disclosed as total revenue
Note 2.1: Revenue – continued
CONTRACT BALANCES
Trade receivables in the balance sheet include accrued income and contract assets comprising unbilled amounts representing the group’s right to consideration for the services transferred to date. All deferred income is recognised in the income statement within 12 months.
Under the payment terms generally applicable to the group’s revenue generating activities, prepayments are only received to a limited extent. Typically, payment is due upon or after completion of the services.
Part of the deferred income presented in the balance sheet constitutes contract liabilities, which represent advance payments and billings in excess of the recognised revenue.
There were no significant changes in accrued and deferred income during the reporting period.
Impairment losses disclosed in note 4.3 relate to receivables arising from contracts with customers.
PERFORMANCE OBLIGATIONS
Performance obligations are services that are to be completed under existing customer contracts.
ACCOUNTING POLICIES
Revenue is recognised when the performance obligation has been satisfied, which happens upon the transfer of control to the customer at an amount that reflects the consideration to which the group expects to be entitled in exchange for the goods and services.
Revenue from shipping activities is recognised over time as the performance obligation is satisfied, including a share of revenue from incomplete voyages at the balance sheet date. Invoiced revenue related to an estimated proportion of remaining voyage time and activities at the destination port is deferred. The percentage of completion is calculated as the remaining number of days of a voyage, as a percentage of the total number of days a voyage is estimated to last. Detention and demurrage fees are recognised over time until the customers’ late return or pick-up of containers.
Revenue from terminal operations and towing activities is recognised upon completion of the service. In container terminals operated under certain restrictive terms of pricing and service, etc., the value of tangible assets constructed on behalf of the concession grantor is recognised as revenue during the construction.
Revenue from most freight forwarding activities is recognised over time.
Revenue from the sale of goods is recognised upon the transfer of control to the buyer.
Contract work in progress and services are included in revenue based on the stage of completion so that revenue corresponds to the selling price of the work performed and services completed in the financial year (the percentage-of-completion method).
No significant element of financing is deemed present as sales are made with credit terms which are consistent with market practice. Revenue from sales is recognised based on the price specified in the contract, net of the estimated volume discounts. Accumulated experience is used to estimate and provide for the discounts, using the expected value method, and revenue is only recognised to the extent that it is highly probable that a significant reversal will not occur.
Note 2.2: Operating costs
AND REMUNERATION TO THE EXECUTIVE BOARD AND BOARD OF DIRECTORS
The Executive Board of A.P. Moller Holding is considered key management personnel. The group has a cash-settled incentive plan to members of the Executive Board and grants have been awarded on a yearly basis. The incentive plan provides an annual bonus and long-term incentive programmes, which are determined by the development in the value creation of the underlying investments. The main parts of the long-term incentive programmes are capped.
1 Including DKK 73m related to research and development expenditures
2 Including DKK 256m (DKK 193m) related to share-based payment programmes
Customary agreements have been entered into with employees regarding compensation in connection with resignation with consideration for local legislation and collective agreements.
Please refer to note 5.1 for further information about share-based payment.
Vessel sharing agreements in shipping require that some vessels are committed to specific service routes. The committed vessel’s capacity is then shared with one or more container shipping providers in proportion to each party’s contribution to the joint service. In practice, it is not always possible to provide tonnage precisely as agreed in the sharing arrangements, therefore financial settlement often takes place on a basis of relative capacity over/under utilised on a monthly basis or other mutually agreed cycle. These capacity adjustments are settled as close as possible to actual costs incurred based on market rates applicable at that time.
SIGNIFICANT ACCOUNTING JUDGMENTS
EU Emissions Trading System (ETS) classification determination From 1 January 2024 onwards, the group’s maritime activities are subject to the new EU ETS, a cap-and-trade system to reduce emissions via a carbon market. Implementation of EU ETS requires the group to purchase EU allowances (EUAs) representing the right to emit a specific amount of greenhouse gases (GHG). The group has purchased EUAs either as spot or future contracts. EUA futures are financial instruments with delivery in December of the same year, and they satisfy the conditions for the ‘own use’ exemption and are off-balance sheet items. EUA spot contracts are classified as other current assets upon delivery of certificates. They are measured at cost of settlement and are not subject to remeasurement until surrender. The cost includes all costs of purchase, costs of conversion, and other directly attributable costs such as transaction costs. For more information on the EUAs recognised refer to note 3.5. The accrual is recognised as fuel is burnt in the group’s applicable maritime activities, measured at expected cost for the required EUAs, based on actual emissions and the price of the EUAs, which is calculated as a weighted average price of EUA spots and futures. The corresponding cost is presented as bunker cost.
ACCOUNTING POLICIES
Operating costs comprise costs incurred in generating revenue for the year, including costs for crew, labour, raw materials and consumables, repair and maintenance, and sales and administration
Note 2.3: Depreciation, amortisation and impairment losses, net
1 Including DKK 18m related to reversal of impairment regarding assets held for sale
For more information, reference is made to note 3.1, 3.2, and 3.3.
Note 2.4: Gain on sale of non-current assets, etc., net
Gains include the sale of vessels and equipment DKK 2.3bn (DKK 2.7bn), sale of businesses DKK 1.9bn (DKK 1.0bn), and sale of other non-current assets DKK 0.0bn (DKK 0.5bn).
Losses are related to the sale of vessels and equipment DKK 0.4bn (DKK 0.2bn), and sale of other non-current assets DKK 0.5bn (DKK 0.1).
Note 2.5: Tax and deferred tax
The group generates profit across multiple business sectors and countries. Corporate income taxes comprise taxes calculated in accordance with various countries’ tax regimes.
The land-based activities, which are subject to normal corporate income tax, include terminals, logistics (transportation, warehousing, and distribution including cold storage, customs services, and supply chain management services), services and shipping agencies through which the group operates one of the world’s most comprehensive port and integrated logistics service networks, sale of industrial products, diagnostics services, and financial profit from other equity investments.
The taxation of shipping income generated by vessels providing services on the high seas, calling at multiple ports across the globe, is outlined in the OECD Model Tax Convention, Article 8 (Shipping Article). Under the Shipping Article, activities are taxable in the jurisdiction where the ship owning and operating entity is resident. Within our group, this is predominantly in Denmark and Singapore.
To encourage ship registration in Europe and ensure global competitiveness of the European Maritime Industry, the EU has approved a specific shipping regime. This is normally referred to as tonnage tax which calculates corporate income tax, based on the net tonnage of the fleet. Consequently, under the tonnage tax regime, no credit is given for losses and, despite massive capital investments in containers and vessels, no tax deductions are granted for depreciation or operating expenses.
Tonnage tax regimes apply to the main part of the group’s activities within global trade and result in a stable annual tax liability. Given the liability to tonnage tax is not impacted by financial profits, and is payable even in loss making years, the effective tax rate (ETR) metric can fluctuate significantly. The group operates 750+ vessels delivering cargo to every corner of the globe, including dry cargo commodities, refrigerated cargo, and dangerous cargo, as well as transport of oil products.
Note 2.5: Tax and deferred tax – continued
Recognised
and
Unrecognised
The unrecognised deferred tax assets have no significant time limitations. There are no substantial unrecognised tax liabilities on investments in subsidiaries, associated companies, or joint ventures.
GLOBAL MINIMUM TAXATION (OECD PILLAR TWO)
In an effort to end tax avoidance and to address concerns about the erosion of the global corporate tax base, a global framework for corporate taxation has been formed by the OECD/G20 Inclusive Framework. One of the key elements is to introduce a global minimum tax rate of 15%, based on group accounting income per jurisdiction.
The minimum tax rules are designed as a hierarchy of the right to claim income tax. If the income is not subject to a minimum effective tax rate of 15% in the country where it is earned, then the remaining tax payment (top-up tax) can be picked up by another jurisdiction where the group is active. For the group, Denmark will add top-up tax if not applied locally as the ultimate parent entity of the A.P. Moller Group, A.P. Møller Holding A/S, is located in Denmark.
The Danish implementation of Council Directive (EU) 2022/2523 of 14 December 2022 is effective from 1 January 2024. This means that A.P. Moller Holding group’s income is subject to the minimum tax rules for all jurisdictions via Danish implementation for the financial year 2024 and onwards.
Because the Danish implementation covers the group’s global activities, it is not expected that other national implementations will have a significant additional impact on the global tax payments of the group. It may, however, have an impact on the location where potential top-up taxes will be paid.
Note 2.5: Tax and deferred tax – continued
Three elements are key to understanding how the rules will impact the group. First, the group does not set up artificial structures in low-tax jurisdictions for tax purposes or earn significant profits in such jurisdictions, which means that our business structure itself is not impacted significantly by the rules, but some additional tax may become payable where services are provided in low-tax jurisdictions. Second, tax incentives given to capital projects, such as critical infrastructure, will be considered less effective going forward as it will impact the effective tax rate and thereby the basis for potential top-up tax. Third, although the rules exclude ‘international shipping income’, the definition is more restrictive than the global definitions usually applied under a tax treaty following the OECD Model Tax Convention or under Danish tonnage tax.
Further, inland transportation is not a part of the international shipping income under the global minimum tax rules. This is relevant for the part of the group’s land transport linked directly to ocean transportation which is recognised as shipping income for tax treatment in the OECD Model Tax Convention. The group is awaiting further guidance on the application of the shipping income provision from the OECD Secretariat. Contrary to the purpose of the rules, top-up tax could be triggered by the shipping classification in years where shipping net income is negative. Due to the design of tonnage taxation, the group’s effective tax rate fluctuates significantly depending on the yearly results. In accordance with the Global Minimum Taxation rules, the effective tax rate is calculated on a consolidated basis, also including non-shipping activities in the individual countries.
SIGNIFICANT ACCOUNTING ESTIMATES
Deferred tax assets
Judgment has been applied with respect to the group’s ability to utilise deferred tax assets. Management considers the likelihood of utilisation based on the latest business plans and recent financial performances of the individual entities. Net deferred tax assets recognised in entities having recognised an accounting loss in either the current or preceding period amount to DKK 1.4bn (DKK 1.1bn). These assets mainly relate to unused tax losses or deductible temporary differences generated during construction of terminals, where taxable profits have been generated either in the current period or are expected within a foreseeable future.
Uncertain tax positions
The group is engaged in a number of disputes with tax authorities of varying scope. Appropriate provisions and recognition of uncertain tax positions have been made where the probability of the tax position being upheld in individual cases is considered less than 50%. Claims, for which the probability of the group’s tax position being upheld is assessed by management to be at least 50%, are not provided for. Such risks are instead evaluated on a portfolio basis by geographical area and country risk. Provisions and uncertain tax liabilities are recognised when the aggregated probability of the tax position being upheld is considered less than 50%.
ACCOUNTING POLICIES
Tax
Tax comprises an estimate of current and deferred income tax as well as adjustments to previous years’ taxes. Income tax is tax on taxable profits and consists of corporation tax, withholding tax of dividends, etc. Tax is recognised in the income statement to the extent it arises from items recognised in the income statement, including tax on gains on intragroup transactions that have been eliminated in the consolidation.
Deferred tax
Deferred tax is calculated on temporary differences between the carrying amounts and tax bases of assets and liabilities. Deferred tax is not recognised for differences on the initial recognition of assets or liabilities where, at the time of the transaction, neither accounting nor taxable profit/loss is affected, unless the differences arise in a business combination. In addition, no deferred tax is recognised for undistributed earnings in subsidiaries, when the group controls the timing of dividends. No taxable dividends are currently expected. A deferred tax asset is recognised to the extent that it is probable that it can be utilised within a foreseeable future.
The group applies the IAS 12 exception to recognising and disclosing information about deferred tax assets and liabilities related to Pillar Two income taxes.
Note 3.1: Intangible assets
INVESTED CAPITAL
Note 3.1: Intangible assets
– continued
in DKKm
The carrying amount of goodwill has been allocated to the following operating cash-generating units based on the management structure. Cash-generating unit
in DKKm
1
2 Of which DKK 1.1bn is related to software
3 Acquired in business combinations, please refer to note 3.8
IMPAIRMENT – KEY ASSUMPTIONS APPLIED
The outcome of impairment tests is subject to estimates in financial budgets, forecasts and business plans, as well as of the future development of freight rates and volumes, demographic and societal changes, demand for sustainable solutions, commodity prices, including but not limited to oil and utility prices, inflation, and the discount rates applied. Management determines these key assumptions by considering past experience as well as market analysis and future expectations based on supply and demand trends.
Further, the value in use calculation is sensitive to discount rates and the terminal growth rates. Value in use is determined based on the expected future economic growth rates and replacement CAPEX during the terminal period, which is based on management’s plans and expectations for the future.
The future development in freight rates is a significant factor impacting Ocean and the product tanker market in particular, and is influenced by regional and global economic environments, trade patterns, and by industry specific trends in respect of capacity supply and demand. Container freight rates continued to increase throughout the first half of 2024 as a result of the Red Sea situation. The rates peaked in Q3 2024, then partially normalised and stabilised with supply catching up. Product tanker spot rates have deteriorated throughout 2024 as a result of the pronounced market normalisation.
Note 3.1: Intangible
assets
– continued
The future development in oil price is also an uncertain and significant factor impacting accounting estimates, either directly on the bunker oil price, green fuel and its availability, or indirectly through its impact on market freight rates charged to customers. Bunker consumption increased throughout 2024 with re-routing south of Cape of Good Hope caused by the situation in the Red Sea/Gulf of Aden.
Logistics & Services is impacted by rates and volumes across the Logistics & Services product lines, particularly in the air and warehousing business. The future growth and productivity of the ‘Fulfilled by Maersk’ product range is also considered a key assumption, as volumes are sensitive to the development of the global economy. Management considers both the future economic outlook and expected synergies from completed acquisitions when determining the growth and productivity.
Terminals located in oil-producing countries, e.g. Nigeria and Brazil, are indirectly impacted by the development in oil prices and the consequences for the respective countries’ economies, which not only affect volumes handled in the terminals, but also foreign exchange rates. Continued economic deterioration and a lack of cash repatriation opportunities in certain oil-producing countries could also put pressure on the carrying amounts of individual terminals. The repercussions of uncertainty in trade policies and tariffs, stemming from geopolitical tensions, may impact port rates in a few strategic regions. The other key sensitivities impacting Terminals include container moves, revenue and cost per move, and local port rates, all of which are impacted by the local economic outlook and competition, as well as concession right extensions and the discount rate applied.
The future development in demand for sustainable solutions within food packaging, recycling of plastic, as well as the demand for wind energy onshore and offshore is uncertain and significantly impacting mainly Tray, Recycling PET, and Energy transition (renewable solutions). The Paris Agreement adopted in 2015, together with increased focus on sustainable value chains and sustainability reporting will also determine the extent of the demand.
The future development in demand within medical diagnostic services is dependent on demographic development and composition, including what the public authorities in individual countries decide to allocate to the healthcare budget. Demographic changes include an increasing and ageing population, increasing prevalence of chronic diseases, and higher welfare.
Inflation is also expected to continue to have a high impact on 2025, affecting both the discount rates and terminal growth rates.
IMPAIRMENT - RESULTS OF IMPAIRMENT ASSESSMENTS
Impairment losses recognised are specified as follows:
in DKKm
&
and service
1 In 2023, A.P. Møller - Mærsk A/S announced that it would move towards a singular and unified brand by integrating the A.P. Moller - Maersk brands. Existing brands were retired, resulting in the recognition of impairment losses of the full carrying amount of each respective retired brand on the balance sheet. Total impairment losses related to the retirement of brands in 2023 recognised in the income statement is DKK 2.1bn, of which DKK 2 0bn is within Ocean and DKK 14m is within Logistics & Services
In Ocean, the cash flow projection is based on forecasts as per Q3 2024, covering five-year business plans for 2025-2029. Management has applied an assumption of growth in volumes based on a calculated terminal value with growth equal to the expected economic growth of 2.1% (2.7%) p.a. In the annual impairment test carried out in November 2024, a pre-tax discount rate of 9.3% (9.8%) p.a. was applied. The impairment test was carried out considering management’s planned fleet renewal programme running until 2030. The impairment test showed headroom between the value in use and the carrying amount. The majority of the carrying amount is comprised of vessels. Management is of the opinion that the assumptions applied are sustainable.
Note 3.1: Intangible
assets
– continued
Using the discount rate as of 31 December 2024 and keeping all other assumptions constant, Ocean showed headroom of DKK 29.3bn (DKK 26.3bn) between the value in use and the carrying amount. The following changes in assumptions reflect the related impact on the value in use and thus, the headroom for Ocean. The sensitivities are prepared with all other assumptions kept constant.
In Logistics & Services, the annual impairment test is based on the estimated value in use from the five-year business plans for 2025-2029 (2024-2028), where the volume and improved margin growth assumptions, which are regionally specific, reflect the current market expectations for the relevant period. The applied terminal growth is 2.1% (2.7%). A discount rate of 8.9% (9.0%) p.a. before tax or 8.7% (8.8%) p.a. after tax was applied. The impairment test showed headroom from the value in use to the carrying amount. Management is of the opinion that the assumptions applied are sustainable.
In Terminals, management assesses indicators of impairment including decreasing volumes, and based on these indicators, estimates the recoverable amounts of the individual terminals where impairment indicators exist. Management also tests for impairment of the cash-generating units to which goodwill or indefinite life intangible assets are allocated. The cash flow projections for each terminal cover the concession period and extension options deemed likely to be exercised, the latter of which is expected to have a positive impact on the replacement volumes. The growth rates reflect current market expectations for the relevant period, and the discount rates applied are between 7.2% and 12.0% (7.4% and 12.1%) p.a. after tax. The impairment tests were considered fair value less cost of disposal compared to the carrying amount and resulted in an immaterial amount across two terminals amounting to DKK 0.3bn (impairment losses of DKK 0.9bn across multiple terminals, of which DKK 0.6bn was related to a cash-generating unit in the Mediterranean region). The fair values of individual terminals are measured at fair value less cost of disposal, where the perspective of a potential buyer is assumed. The valuations (fair value level 3) are prepared by discounting expected cash inflows and outflows for the period until concession end. This includes expected concession extensions, and costs and benefits related to restructuring and improvement projects that a potential buyer can be assumed to undertake in order to extract the best value from the terminal. Individual country-specific discount rates are applied.
In Demographic & societal change, the estimated future cash flows are based on the budget for 2025 (2024) and business plans and projections for 2026-2037 (2025-2036). The extended forecast period reflects the nature of the business, where the business is benefitting from long-term demographic trends driving predictable volume growth, and is a business underpinned by a well-diversified portfolio of long-term government contracts, long-term partnerships with insurance companies, contracts with hospitals, as well as a broad-based exposure to referring physicians combined with an extensive footprint of collection centres and clinics. The business plans and projections are based on a market by market approach, assessing the organic business potential for each of the key markets, and estimating the volume growth, sales prices, and contribution margins for each segment. Further, the capital expenditure and working capital required to maintain and organically grow the business are considered. The average revenue growth rate in the forecast period 2028-2037 (2027-2036) is 2.5% (5.0%) and while uncertainties connected to especially inflation can impact the growth rates, management considers the average growth rates realistic based on historical growth rates, expected test volumes, as well as the business plans and market analysis at hand. The long-term growth rate in the terminal period has been estimated to 2.0% (2.5%) and is supported by industry specific market analyses performed by external advisors. A discount rate p.a. pre-tax of 8.7% (9.0%) has been applied. The following changes in assumptions reflect the related impact on the value in use. The sensitivities are prepared with all other assumptions kept constant.
Note 3.1: Intangible assets
– continued
In Tray and Recycling PET, the estimated future net cash flows are based on the budgets for 2025 (2024) and business plans and projections for 2026-2029 (2025-2028). The business plans and projections are based on a market by market approach, assessing the organic business potential for each of the key markets and segments, and estimating the volume growth, sales prices, and contribution margins for each segment. The capital expenditure and working capital required to maintain and organically grow the business is also considered. The average revenue growth rates in the forecast period 2025-2029 (2024-2028) are 6.3% (1.4%) for Tray and 8.2% (2.8%) for Recycling, respectively. Management expects to gain market share due to the company’s strong product portfolio, comprehensive recycling offerings, and positive tailwind from material conversion into PET, also driven by regulatory developments, e.g. mandatory recycled content. The long-term growth rate in the terminal period has been set to equal for an expected long-term rate of inflation of 2.0% (2.0%) for the Euroregion. Discount rates p.a. pre-tax of 8.4% (9.1%) for Tray and 8.3% (9.0%) for Recycling PET have been applied. The impairment test showed headroom from the value in use to the carrying amount. The sensitivity test performed shows that there is headroom for a reasonable possible change in the key assumptions, individually.
In Energy transition (renewable solutions), the estimated future cash flows are based on the budget for 2025 (2024) and business plans and projections for 2026-2028 (2025-2027). The business plans and projections are based on a market by market approach, assessing the organic business potential for each of the key markets, and estimating the volume growth, sales prices, and contribution margins for each segment. Further, the capital expenditure and working capital required to maintain and organically grow the business are considered. The average revenue growth rate in the forecast period 2025-2028 (2024-2027) is 12.5% (18.8%) and while uncertainties connected to especially inflation can impact the short-term growth rates, management considers the average growth rates realistic based on the business and market plans at hand. The long-term growth rate in the terminal period has been set to equal for an expected longterm rate of inflation of 2.0% (2.0%). A discount rate of 10.7% (11.4%) p.a. pre-tax has been applied. The impairment test showed headroom from the value in use to the carrying amount. The sensitivity test performed shows that there is headroom for a reasonable possible change in the key assumptions, individually.
OTHER INTANGIBLE ASSETS WITH INDEFINITE USEFUL LIFE
Terminal and service concession rights include DKK 228m (DKK 229m) related to terminal rights with indefinite useful life. These terminal rights are included in the impairment test for Terminals.
Brand names with indefinite useful life of DKK 3.0bn (DKK 2.8bn) are included in the cash-generating unit Tray (food packaging) and Energy transition (other solutions), respectively. Thus, the asset is carried at cost without amortisation as it is estimated that the brand will generate net cash inflows for an indefinite period.
SIGNIFICANT ACCOUNTING ESTIMATES
Impairment tests
The recoverable amount of each cash-generating unit is determined based on the higher of its value in use and fair value less costs to sell. The estimated value in use is calculated using certain key assumptions for the expected future cash flows and applied discount factor.
Current market values for vessels, etc., are estimated using acknowledged brokers.
The cash flow projections are based on financial budgets, forecasts, and business plans. In nature, these projections are subject to judgments and estimates that are uncertain, though based on experience and external sources, where available.
The discount rates applied reflect the time value of money as well as the specific risks related to the underlying cash flows, i.e. project and/or country specific risk premiums. Further, any uncertainties reflecting past performance and possible variations in the amount or timing of the projected cash flows, are generally reflected in the discount rates.
Refer to notes 3.1 and 3.2 for information about impairment analysis, key assumptions and impairment test results.
Note 3.1: Intangible assets – continued
SIGNIFICANT ACCOUNTING JUDGMENTS
Determination of cash-generating units
Judgment is applied in the determination of cash-generating units of which goodwill is allocated for impairment testing and in the selection of methodologies and assumptions applied in impairment tests.
The determination of cash-generating units differs for various business areas.
Ocean operates its fleet of container vessels and hub terminals in an integrated network. Consequently, the Ocean activities are tested for impairment as a single cash-generating unit.
Logistics & Services, including first-mile activities, is considered one cash-generating unit. Management views the Logistics & Services products as an integrated network.
In Terminals, each terminal is considered an individual cash-generating unit for impairment tests, except when the capacity is managed as a portfolio.
Supply vessels and product tanker vessels with similar functionality and operating environment are considered as one cash-generating unit.
Towage & maritime services, Demographic & societal change, Tray, Recycling PET, and Energy transition (renewable solutions and other solutions) are each considered as one cash-generating unit.
ACCOUNTING POLICIES
Intangible assets are measured at cost less accumulated amortisation and impairment losses. Amortisation is calculated on a straight-line basis over the estimated useful lives of the assets. The fair value of any future contingent payments is included in the cost at acquisition. Subsequent adjustments are recognised in the income statement.
Goodwill, terminal rights and certain brand names have an indefinite useful life while all other intangible asset classes have definite lives.
For container terminals operated under certain restrictive price and service conditions, etc., concessional rights to collect usage charges are included under intangible assets. The cost includes the present value of minimum payments under concession agreements and the cost of property, plant and equipment constructed on behalf of a grantor of a concession. The rights are amortised from the commencement of operations over the concession period. The concession period ranges from 10 to 34 years, with an average of 17 years.
Intangible assets regarding acquired customer relationships, brand names, and technology are amortised over a useful life of 10-24 years, up to 20 years, and 5-10 years, respectively. IT software is amortised over a useful life of 3-10 years. Completed development projects are amortised on a straight-line basis over 3-5 years.
Estimated useful lives and residual values are reassessed on a regular basis.
Impairment losses are recognised when the carrying amount of an asset or a cash-generating unit exceeds the higher of the estimated value in use and fair value less costs of disposal. Goodwill is attributed to cash-generating units on acquisition and impaired before other assets.
Intangible assets and property, plant and equipment are tested for impairment, if there is an indication of impairment. However, annual impairment tests are carried out for goodwill and other intangible assets with indefinite useful lives as well as intangible assets that are not yet in use. Impairment losses are included in depreciation, amortisation and impairment losses, net, in the income statement.
Note 3.2: Property, plant and equipment
Note 3.2: Property, plant and equipment – continued
IMPAIRMENT – KEY ASSUMPTIONS APPLIED
Please refer to note 1.2 and 3.1.
RESULTS OF IMPAIRMENT ASSESSMENTS
Impairment losses recognised are specified as follows:
Cash-generating unit
The recoverable amount of each cash-generating unit is determined based on the higher of its value in use or fair value less cost of disposal. The estimated value in use is calculated using certain key assumptions for the expected future cash flows and applied discount factors. Current market values for vessels, etc., are estimated using acknowledged brokers.
Projected cash flow models are used when fair value is not obtainable or when fair value is deemed lower than value in use. The cash flow projections are based on financial budgets and business plans approved by management.
Impairment losses 2024
Impairment losses are mainly related to terminals. Reference is made to note 3.1.
Impairment reversal 2024
Reversal of impairment of vessels is related to sale of businesses.
Impairment losses 2023
Impairment losses are mainly related to terminals. Reference is made to note 3.1.
Impairment reversal 2023
Reversal of impairment of vessels is related to sale of assets.
OPERATING LEASES AS LESSOR
Property, plant and equipment includes assets (mainly vessels) which are leased out as part of the group’s activities. The amounts below comprise the calculated future minimum lease payments for the assets and exclude the estimated service elements, which are presented in note 2.1. Jointly the two elements amount to the group’s revenue backlog.
Operating lease receivables
Amounts in DKKm
PLEDGES
Property, plant and equipment with a carrying amount of DKK 3.6bn (DKK 10.8bn) has been pledged as security for loans of DKK 0.9bn (DKK 7.5bn).
Note 3.2: Property, plant and equipment – continued
SIGNIFICANT ACCOUNTING ESTIMATES
Useful lives and residual values
Useful lives are estimated annually based on experience. When an asset’s useful life changes, management revises the estimates for individual assets or groups of assets with similar characteristics due to factors such as quality of maintenance and repair, technical development, or environmental requirements. Management has also considered the impact of decarbonisation and climate-related risks on useful lives of existing assets. Such risks include new climate-related legislation restricting the use of certain assets, new technology required by climate-related legislation, and the increase in restoration costs for terminal sites due to new and/or more comprehensive policies.
In addition, the useful lives of container vessels and related assets that operate on bunker fuel have been considered in conjunction with A.P. Moller - Maersk’s net zero by 2040 target.
Residual values of container vessels are difficult to estimate given their long useful lives, the uncertainty of future economic conditions, the market for conventional fuel vessels, and the uncertainty of future steel prices, which are considered the main determinants of the residual value. Additionally, the acceleration of the development of vessels with a lower carbon footprint may generate downward pressure on the market for second-hand conventional fuel vessels. Generally, the residual values of vessels are initially estimated at 10% of the purchase price excluding dry-docking costs.
ACCOUNTING POLICIES
Property, plant and equipment are valued at cost less accumulated depreciation and impairment losses. Depreciation is charged to the income statement on a straight-line basis over the useful lives at an estimated residual value. The useful lives of assets are typically as follows:
Vessels, etc. 20-25 years
Containers, etc. 15 years
Buildings 10-75 years
Terminal infrastructure 10-30 years or concession period, if shorter
Warehouses and related infrastructure 5-25 years or lease term, if shorter Aircrafts and related components 3-30 years
Plant and machinery, cranes, and other terminal equipment 3-25 years
Other operating equipment, fixtures, etc. 3-10 years
Estimated useful lives and residual values are reassessed on a regular basis.
Cost comprises the acquisition price as well as costs directly associated with the asset until such time as the asset is ready for its intended use.
The cost of an asset is divided into separate components, which are depreciated separately if the useful lives of the individual components differ. Dry-docking costs are recognised in the carrying amount of the vessels when incurred and depreciated over the period until the next dry-docking.
The cost of assets constructed by the group includes directly attributable expenses and indirect costs related to materials, components, and payroll that directly concern the construction of assets. For assets with a long construction period, borrowing costs during the construction period from specific as well as general borrowings are attributed to the cost of the asset. In addition, the cost includes the net present value of estimated costs of removal and restoration.
Note 3.3: Right-of-use assets
Amounts in DKKm
1 Acquired in business combinations, please refer to note 3.8
As part of the group’s activities, customary leasing agreements are entered into, especially regarding the chartering of vessels, leasing of containers and other equipment, and real estate. In some cases, leasing agreements comprise purchase options exercisable by the group and options for extending the lease term. The group also enters into concession agreements that provide the right to use some existing infrastructure or land as required to carry out the terminal business.
To optimise lease costs during the contract period, the group sometimes provides residual value guarantees in relation to equipment leases. At the end of 2024, the expected residual values were reviewed to establish if these reflected the actual residual values achieved on comparable assets and expectations about future prices. As of 31 December 2024, DKK 2.0bn (DKK 2.3bn) is expected to be payable and is included in the measurement of lease liabilities.
Leases to which the group is committed, but for which the lease term has not yet commenced, have an undiscounted value of DKK 67.6bn (DKK 17.9bn). They comprise approx. 87 (43) contracts commencing between 2025 and 2029 (2024 and 2026).
Certain terminal concession agreements contain variable payment terms that are linked to future performance, i.e. number of containers handled. Such payments are recognised in the income statement in the period in which the condition that triggers those payments occurs.
Lease liabilities are disclosed in note 4.2, 4.3, 4.4, and 5.2.
Amount recognised in the income statement
Total cash outflow for leases
Note 3.3: Right-of-use assets - continued
ACCOUNTING POLICIES
Right-of-use assets are mainly leased vessels, containers, concession agreements, and real estate property. Lease contracts for vessels and containers are typically made for fixed periods of about five years but may have extension options as described together with lease liabilities. Concession agreements and real estate contracts are negotiated on an individual basis and contain a wide range of terms and conditions.
Leases are recognised as a right-of-use asset with a corresponding liability at the date at which the leased asset is available for use by the group. The right-of-use asset is depreciated over the shorter of the asset’s useful life and the lease term on a straight-line basis.
The interest element of lease payments related to leases capitalised under IFRS 16 is recognised in the income statement under financial expenses.
Payments associated with short-term leases and leases of low-value assets are recognised on a straight-line basis as an expense in the income statement under operating costs.
Note 3.4: Investments in joint ventures and associates
Summarised financial information for associates that are material for the group as of 31 December 2024 are presented below.
DANSKE BANK A/S, ASSOCIATED COMPANY
Since 1928, A.P. Moller Group has been a shareholder in Danske Bank - a Nordic universal bank offering a diversified platform across the Nordic markets. Amounts in DKKm
With effect from 1 January 2024, Danske Bank has changed the presentation in the income statement in relation to income and expenses. Accordingly, the presentation of the comparative information for 2023 has been changed.
Note 3.4: Investments in joint ventures and associates – continued
Reconciliation of the group’s share of carrying amount in Danske Bank A/S:
SIGNIFICANT ACCOUNTING ESTIMATES
Investments in associated companies
As of 31 December 2024, the carrying amount of the shares in Danske Bank amounted to DKK 38.3bn (DKK 38 3bn), including group goodwill of DKK 1.0bn, and the market value amounted to DKK 36.2bn (DKK 33.1bn).
ACCOUNTING POLICIES
Share of result in associated companies and joint ventures is recognised net of tax and corrected for the share of unrealised intra-group gains and losses. The item also comprises any impairment losses for such investments and their reversal.
Investments in associated companies and joint ventures are recognised at the group’s share of the equity value inclusive of goodwill less any impairment losses. Goodwill is an integral part of the value of associated companies and joint ventures and is therefore subject to an impairment test together with the investment as a whole. Impairment losses are reversed to the extent the original value is considered recoverable.
JOINT VENTURES AND OTHER ASSOCIATED COMPANIES
In addition to the interests in material associated companies disclosed above, the group also has interests in a number of individually immaterial joint ventures and associates.
in joint ventures
Note 3.5: Loans receivable
Loans receivable amount to DKK 113.7bn (DKK 86.8bn) and consist primarily of term deposits with a maturity of more than three months, amounting to DKK 113.7bn (DKK 86.3bn). For details on the assessment of the expected losses on term deposits, please refer to note 4.3.
Other receivables primarily consist of prepayments made for operational activities that will be utilised after twelve months amounting to DKK 13.6bn (DKK 8.8bn), and EUAs amounting to DKK 1.2bn (DKK 0bn). For details on the significant accounting judgments regarding EUAs, refer to note 2.2.
Note: 3.5: Loans receivable - continued
ACCOUNTING POLICIES
Loans receivable are initially recognised at fair value, plus any direct transaction costs and subsequently measured at amortised cost using the effective interest method. For loans and other receivables, write-downs are made for expected losses based on specific individual or group assessments.
Note 3.6: Inventories
ACCOUNTING POLICIES
Inventories mainly consist of bunker, spare parts not qualifying as property, plant and equipment, and raw materials and consumables. Inventories are measured at the lower of cost including delivery costs and indirect production costs and net realisable value, primarily according to the FIFO method. The cost of finished goods and work in progress includes direct and indirect production costs.
Note 3.7: Provisions
Restructuring includes provisions for decided and publicly announced restructurings and includes mainly staff redundancy costs. Legal disputes, etc. include, among other things, indirect tax and duty disputes. Other primarily includes provisions for warranties and onerous contracts
Reversals of provisions primarily relate to legal disputes and contractual disagreements, which are recognised in the income statement under operating costs and tax.
SIGNIFICANT ACCOUNTING ESTIMATES
Provisions for legal disputes, etc.
Management’s estimate of the provisions for legal disputes, including disputes on taxes and duties, is based on the knowledge available on the substance of the cases and a legal assessment of these. The resolution of legal disputes, through either negotiations or litigation, can take several years to be reached and the outcomes are subject to considerable uncertainty.
Note 3.7: Provision -
continued
ACCOUNTING POLICIES
Provisions are recognised when the group has a present legal or constructive obligation from past events. The item includes, among others, legal disputes, provisions for onerous contracts, and unfavourable contracts acquired as part of a business combination. Provisions are recognised based on best estimates and are discounted where the time element is significant and where the time of settlement is reasonably determinable.
Reversals of provisions primarily relate to the settlement of contractual disagreements, which are recognised in the income statement under operating costs and tax.
Note 3.8: Acquisition/sale of subsidiaries and activities
ACQUISITIONS DURING 2024
Cash flow used for acquisitions in 2024
Amounts in DKKm
Transaction related costs recognised in the income statement amounted to DKK 104m.
Note 3.8: Acquisition/sale of subsidiaries and activities - continued
Concentric (Energy transition)
On 29 August 2024, the group announced a public cash offer to the shareholders of Concentric AB. At the end of the acceptance period on 16 October 2024, the offer had been accepted by 95.4% of the shareholders. On 7 November 2024, the company was delisted and traded on Nasdaq Stockholm for the last time. The group has initiated a compulsory buy-out of the outstanding shares that will be completed in 2025.
Concentric is one of the world’s leading players in flow control and fluid power technology for the commercial vehicle market, providing customers with advanced technology pumps, thermal management, and hydraulic systems. With its products, Concentric aims to improve customer efficiency through better fuel economy, reducing emissions, and improving engine control through technical solutions and precision engineering.
The purchase price allocation resulted in goodwill of DKK 3.1bn. Acquired goodwill is not allowable for tax purposes.
The acquisition contributed revenue of DKK 0.3bn and an insignificant net profit. Had the acquisition occurred on 1 January 2024, the impact on the group’s revenue would have been DKK 2.4bn and net profit of DKK 0.1bn, including amortisation of intangibles recognised in the acquisition.
The accounting for the business combination is considered provisional as of 31 December 2024, as valuation of intangible assets is not yet finalised.
Other
During 2024, a number of other acquisitions have been completed. The acquisitions are smaller add-ons in current portfolio companies and businesses.
ACQUISITIONS DURING 2023
Cash flow used for acquisitions in 2023
Amounts in DKKm
Fair value at time of acquisition
1 Total includes minor changes in the provisional amounts of 2022 business combinations
Transaction related costs recognised in the income statement amounted to DKK 43m.
KK Wind Solutions (Energy transition)
The group has acquired an add-on to its converter & controls business. The acquisition makes KK Wind Solutions the world’s leading converter manufacturer to the wind industry. The transaction brings numerous benefits to the customers as the group gains additional momentum in maturing the industry’s supply chain and leveraging economies of scale across the group’s operations to achieve greater efficiencies. By expanding the manufacturing footprint to China, the group can better serve our customers globally. As part of the transaction, KK Wind Solutions gains exclusivity in supplying converters and controls to Vestas and will further advance the partnership by co-developing all future Vestas converters.
The purchase price allocation resulted in goodwill of DKK 304m. Acquired goodwill is not allowable for tax purposes.
Note 3.8: Acquisition/sale of subsidiaries and activities - continued
The acquisition contributed revenue of DKK 2.3bn and net profit of DKK 0.1bn. Had the acquisition occurred on 1 January 2023, the impact on the group’s revenue would have been DKK 2.8bn and net profit of DKK 0.1bn, including amortisation of intangibles recognised in the acquisition.
Martin Bencher Group (Logistics & Services)
On 2 January 2023, the group acquired 100% of the shares in Martin Bencher Group, a Denmark-based project logistics company for the purchase price of DKK 365m, which resulted in goodwill of DKK 76m. Martin Bencher Group complemented the existing A.P. Moller - Maersk project logistics services, with a specialised service offering the combination of solution design, special cargo transportation, and project management services.
Acquired goodwill is not allowable for tax purposes.
Martin Bencher Group contributed revenue of DKK 1.1bn and an insignificant net profit to the group equivalent to its entire revenue and net profit in 2023.
Grindrod Intermodal Group (Logistics & Services)
On 2 January 2023, the group completed the acquisition of Grindrod Logistics with a controlling interest of 51% for a purchase price of DKK 303m, which resulted in goodwill of DKK 103m. The group partnered with Grindrod Intermodal Group to merge the logistics activities of Grindrod Intermodal business and the ocean activities of the Ocean Africa Container Lines (OACL) with the existing A.P. Moller - Maersk Logistics & Services products in South Africa.
Acquired goodwill is not allowable for tax purposes.
Grindrod contributed revenue of DKK 0.3bn and an insignificant net profit to the group equivalent to its entire revenue and net profit in 2023.
DIVESTMENTS DURING 2024
The group completed the transaction to combine Maersk Supply Service and DOF. With the completion of the agreement, our group holds 25% of the share capital in the combined company.
Furthermore, the merger of ZeroNorth and Alpha Ori Technologies was completed during 2024 leading to A.P. Moller Holding group no longer having control of the business
No other material sales were undertaken during 2024.
DIVESTMENTS DURING 2023
An agreement was reached to divest U.S. Marine Management LLC and resulted in a net gain of DKK 0.6bn and DKK 0.5bn after tax. The net gain before tax is classified as gain on sale of noncurrent assets in the income statement.
The group completed the sale of the 26.4% shareholding in Höegh Autoliners. The net transaction price amounted to DKK 2.5bn and resulted in a gain of DKK 0.4bn.
SIGNIFICANT ACCOUNTING JUDGMENTS
Business combinations
Upon acquisition of new entities, the acquired assets, liabilities, and contingent liabilities are measured at fair value. In fair value assessments, significant judgments have been made and estimates have been applied using various valuation techniques.
Note 3.8: Acquisition/sale of subsidiaries and activities - continued
ACCOUNTING POLICIES
Upon acquisition of new entities, the acquired assets, liabilities, and contingent liabilities are measured at fair value at the date when control was achieved using the acquisition method. Identifiable intangible assets are recognised if they arise from a contractual right or can otherwise be separately identified. The difference between the fair value of the acquisition cost and the fair value of the acquired identifiable net assets is recognised as goodwill. Contingent consideration is measured at fair value and any subsequent changes to contingent consideration are recognised as financial income or financial expense in the income statement. If contingent consideration is settled by issuing a predetermined number of shares, the contingent consideration is classified as equity and is subsequently not remeasured at fair value. Transaction costs are recognised as operating costs as they are incurred.
When the group ceases to have control of a subsidiary, the value of any retained investment is remeasured at fair value, and the value adjustment is recognised in the income statement as gain (or loss) on the sale of non-current assets. The difference between sales proceeds and the carrying amount of the subsidiary is recognised in the income statement, including fair value of the contingent consideration at the time of sale. Contingent consideration is remeasured at fair value with changes recognised in the income statement.
The effect of the purchase and sale of non-controlling interests without changes in control is included directly in equity.
CAPITAL AND FINANCING
1 Of which DKK 0m (DKK 69m) relates to expenses on the prepayment of issued bonds
2 Various capitalisation rates between 6.2% - 7.4% (7 2% - 7.4%) have been used to determine the amount of borrowing costs eligible for capitalisation Please
Note 4.2: Borrowings and lease liabilities reconciliation
hedge
buildings
1 Total cash outflow from borrowings of DKK 2.6bn is decreased by cash flow from hedges of DKK 241m
2 Including business combinations
3 Other includes fair value changes and amortisation of fees
4 Of total issued bonds as of 31 December 2023, DKK 8.8bn are green bonds primarily used to finance the construction of green methanol vessels
The maturity analysis of lease liabilities is disclosed in note 4.3.
Note 4.2: Borrowings and net debt reconciliation - continued
ACCOUNTING POLICIES
Financial liabilities
Financial liabilities are initially recognised at fair value less transaction costs. Subsequently, the financial liabilities are measured at amortised cost using the effective interest method, whereby transaction costs and any premium or discount, are recognised as financial expenses, over the term of the liabilities. Fixed interest loans, subject to fair value hedge accounting, are measured at amortised cost, with an adjustment for the fair value of the hedged interest component.
Lease liabilities
Lease liabilities are measured at the present value of the lease payments over the lease term, at the interest rate implicit in the lease, or at the group’s incremental borrowing rate (IBR). The applied IBR reflects the group’s credit risk, leased amount, and contract duration, as well as the nature and quality of the asset’s security and economic environment in which the leased assets operate. To determine the IBR, where possible, A.P. Moller Holding uses recent third-party financing received by the individual lessee as a starting point, with adjustments to reflect changes in financing conditions since that financing was received. Where such financing is not available, A.P. Moller Holding uses a build-up approach that starts with a risk-free interest rate adjusted by credit risk and specific risks faced by the lessee such as asset type, geographical risks, etc.
Subsequently, the lease liability is measured at amortised cost with each lease payment allocated between the repayment of the liability and financing cost. The financing cost is charged to the income statement over the lease period using the IBR that was used to discount the lease payments.
The following lease payments are included in the net present value:
• Fixed payments (including in-substance fixed payments), less any lease incentives receivable
• Variable lease payments which are based on an index or a rate
• Amounts expected to be payable by the lessee under residual value guarantees
• The exercise price of a purchase option if the lessee is reasonably certain to exercise that option, and payments of penalties for terminating the lease if the lease term reflects the lessee exercising that option
Extension and termination options in lease contracts are included in contracts where it is reasonable that the group will exercise those options. These terms are used to maximise operational flexibility in terms of managing contracts. In determining the lease term, management considers all facts and circumstances that create an economic incentive to exercise an extension option, or not exercise a termination option. Extension options (or periods after termination options) are only included in the lease term if the lease is reasonably certain to be extended or not terminated. Most of the extension and termination options held are exercisable only by the group and not by the respective lessor.
The assessment is reviewed if a significant event or a significant change in circumstances occurs, which affects this assessment, and is within the control of the lessee. Where the group will probably exercise specific purchase options, those options are included in the measurement of the lease liability with the corresponding right-of-use asset depreciated over the asset’s useful life rather than lease term.
Note 4.3: Financial instruments and risks
Hedges comprise primarily currency and interest rate derivatives as well as oil price hedges, which are further described in the following sections.
The gains/losses of the derivatives are recognised as follows:
Derivatives accounted for as held for trading
The group’s activities expose it to a variety of financial risks:
• Market risk
• Credit risk • Liquidity risk
The group’s risk management programmes focus on the unpredictability of financial markets and seek to minimise the potential adverse effects on the group’s financial performance. The group uses derivative financial instruments to hedge certain risk exposures.
Risk management is most effectively managed by each portfolio company. Consequently, the management of risks related to our portfolio companies is anchored with the Board of Directors in each of our portfolio companies. A.P. Moller Holding monitors business performance in the portfolio companies closely as part of our ownership aspiration.
MARKET RISK
Market risk covers changes in market prices, such as foreign exchange rates, interest rates, and share prices, that will affect the group’s profit or the value of its holdings of financial instruments. The sensitivity analyses in the currency risk and interest rate risk sections below relate to the position of financial instruments as of 31 December 2024
The sensitivity analyses for currency risk and interest rate risk have been prepared on the basis that the amount of net debt, the ratio of fixed to floating interest rates of the debt, and the proportion of financial instruments in foreign currencies remain unchanged from hedge designations in place at 31 December 2024. Furthermore, it is assumed that the exchange rate and interest rate sensitivities have a symmetrical impact, i.e. an increase in rates results in the same absolute movement as a decrease in rates.
The sensitivity analyses show the effect on profit and equity of a reasonable possible change in exchange rates and interest rates.
Note 4.3: Financial instruments and risks – continued
CURRENCY RISK
The group’s currency risk relates mainly to the fact that while income from global trade is denominated mainly in USD, the related expenses are incurred in both USD and a wide range of other currencies such as CNY, DKK, and EUR. Income and expenses from the group’s other activities are primarily denominated in local currencies, thus reducing the group’s exposure to these currencies. As the net income is primarily in DKK, EUR, GBP, and USD, these are also the primary financing currencies.
The main purpose of hedging the currency risk in each portfolio company is to hedge the DKK, EUR, or USD value of the portfolio company’s net cash flow and reduce fluctuations in the net profit of the portfolio company. The group uses various financial derivatives, including forwards, option contracts, and cross-currency swaps, to hedge these risks. The key aspects of the currency hedging policy are:
• Net cash flows in significant currencies other than DKK, EUR, and USD are generally hedged using a layered model with a 12-month horizon
• Significant capital commitments or divestments in currencies other than DKK, EUR, and USD are hedged
• Majority of debt in currencies other than DKK, EUR, and USD is hedged depending on the asset-liability match and the currency of the generated cash flow
Currency derivatives hedge future revenue, operating costs, and investments/divestments, and are recognised on an ongoing basis in the income statement and the cost of property, plant and equipment, respectively. There is not any proxy hedging for the currency risk hedging, and therefore the economic relationship between the hedged exposure and the hedge is high. Effectiveness is assessed using the critical terms match approach according to IFRS 9.
Hedges of future revenue and operating costs mature within a year (mature within a year). There are no hedges of investments at the end of 2024 (mature within a year).
For hedges related to operating cash flows and investments, a loss of DKK 875m in 2024 (loss of DKK 51m) is recognised in other comprehensive income, and the cash flow hedge reserve amounts to a loss of DKK 579m as of 31 December 2024 (gain of DKK 296m). For hedges where the cost of hedging is applied, the forward points are recognised in other comprehensive income and transferred with the effective hedge when the hedged transaction occurs. The cost of hedging reserve amounts to DKK 0m (DKK 0m). There was no ineffectiveness in 2024 (no ineffectiveness).
Derivatives recognised at fair value in the balance sheet:
Hedge of operating cash flow and investment in foreign currencies:
Besides the designated cash flow hedges in the table above, the group uses derivatives to hedge currency exposures that do not qualify for hedge accounting. These derivatives are classified as fair value through profit or loss. The average FX hedge rates for swaps in cash flow hedges were EUR/USD 1.13 (1.18) and GBP/USD 1.52 (1.52). The average FX hedge rates for swaps in combined fair value hedges were EUR/USD 1.18 (1.24), GBP/USD 1.52 (1.52), USD/NOK 8.25 (8.25), and USD/JPY 119.39 (119.39).
Note 4.3: Financial instruments and risks – continued
in DKKm
The group’s sensitivity within global trade activities to an increase in the USD exchange rate of 10% against all other significant currencies to which the activities are exposed is estimated to have the following symmetrical impact: Currency sensitivity for financial instruments
before tax Equity before tax
Commodity hedges
The sensitivities are based only on the impact of financial instruments that are outstanding at the balance sheet date and are thus not an expression of the group’s total currency risk.
OIL PRICE RISK
The majority of the group’s trading of commodity products is related to inventory stocks of crude oil and bunker oil, as the products are bought in large quantities and stored for processing and resale. The oil price risk arising from the oil price exposures is mitigated by entering into commodity derivative agreements. The overall exposure limit is set in the risk policy, defining a maximum net open position. On 31 December 2024, the group has entered into oil derivative positions shown in the next table.
The group’s sensitivity to an increase in the oil price of 5% is estimated to have a symmetrical negative impact with immaterial difference on profit and equity before tax of approx. DKK 221m (DKK 162m) with an increase and decrease leading to a positive impact of the same magnitude. The sensitivities are based on the impact of financial instruments that are outstanding at the balance sheet date.
INTEREST RATE RISK
The group has most of its debt denominated in DKK, EUR, and USD, but part of the debt (e.g. issued bonds) is in other currencies such as GBP, JPY, and NOK. The group strives to maintain a combination of fixed and floating interest rates on its net debt, reflecting expectations and risks.
Interest rate risk is managed within a range set for the percentage of gross debt carrying fixed interest, net of hedging. The level as of 31 December 2024 is 53% (41%) excluding IFRS 16 leases.
A general increase in interest rates by one percentage point is estimated, all other things being equal, to affect profit before tax and equity, excluding tax effect, positively by approx. DKK 1.0bn (approx. DKK 1.0bn) and positively by approx. DKK 0.6bn (approx. DKK 0.8bn), respectively.
This analysis assumes that all other variables, in particular foreign currency rates, remain constant.
The hedging of interest rate risks is done by cross-currency swaps and interest rate swaps. The hedging is a mix of fair value hedging, combined fair value hedging, and cash flow hedging.
Combined fair value hedging is applied when cross-currency swaps are entered into to hedge the risk of debt denominated in currencies other than DKK, EUR, and USD. Each hedge relationship is split into a fair value hedge (fixed to floating interest rate swap), where value changes from the exchange rate exposure of the credit margin are recognised in other comprehensive income.
Note 4.3: Financial instruments and risks – continued
Ineffectiveness from cash flow hedges due to buy-back of issued bonds is recognised in the income statement with a cost of DKK 0m (cost of DKK 7m).
The hedges are expected to be highly effective due to the nature of the economic relationship between the exposure and the hedge. The source of ineffectiveness is the credit risk of the hedging instruments. For hedges where the cost of hedging is applied, the change in basis spread is recognised in other comprehensive income and is a time effect during the lifetime of the swap and at maturity, amounting to 0. If the hedged transaction is prepaid, the change in basis spread will be recognised in profit or loss as ineffectiveness. The cost of hedging reserve amounts to a gain of DKK 17m (gain of DKK 47m).
Borrowings by interest rate levels inclusive of interest rate swaps Next interest rate fixing
Note 4.3: Financial instruments and risks – continued
Note 4.3: Financial instruments and risks – continued
CREDIT RISK
Trade receivables
The group has exposure to financial and commercial counterparties, but has no particular concentration of customers or suppliers. To minimise the credit risk, financial vetting is undertaken for all major customers and financial institutions, adequate security is required for commercial counterparties, and credit limits are set for financial institutions and key commercial counterparties.
The group applies the simplified approach to providing the expected credit losses prescribed by IFRS 9, which permits the use of the lifetime expected loss provision for all trade receivables. To measure the expected credit losses, trade receivables have been grouped based on shared credit risk characteristics and the days past due. In accordance with IFRS 9, non-due trade receivables have also been considered for impairment.
Approx. 57% (57%) of the provision for bad debt is related to trade receivables overdue by more than one year.
Maturity analysis of trade receivables
The loss allowance provision for trade receivables reconciles to the opening loss allowance as follows:
Change in provision for bad debt Amounts in DKKm
Other financial assets at amortised cost
Other financial assets at amortised cost comprise loans receivable, finance lease receivables, and other receivables. These financial assets are considered to have a low credit risk, and thus, the impairment provision calculated based on 12 months’ expected losses is considered immaterial. The financial assets are considered to be low risk when they have a low risk of default, and the issuer has a strong capacity to meet its contractual cash flow obligations in the near term.
LIQUIDITY RISK
The capital allocation in A.P. Moller Holding is an annual process and approved by the Board of Directors. The objective of the process is to assess the overall investment capacity and investment pipeline, as well as key risks over the coming period. In addition, the liquidity profile and capital structure are managed by each portfolio company in accordance with financial policies approved by the Board of Directors in each entity. Capital is managed to meet the objective of a solid capital structure over the business cycle and to maintain an appropriate liquidity profile.
The equity share of total equity and liabilities was 67.6% as of 31 December 2024 (68.1%).
Note 4.3: Financial instruments and risks – continued
1 Liquidity reserve is defined as undrawn committed revolving facilities with more than one year to expiry, securities, term deposits, listed securities, and cash and bank balances, excluding balances in countries with exchange control or other restrictions
Deposits and bank balances are primarily held in relationship banks with a credit rating of at least A-. No individual counterparty exposure is above 10%. Some group entities have ISDA agreements for trading of derivatives, under which the group entities have a right to a net settlement in the event of certain credit events. This results in the credit risk being limited to the net position per counterparty.
For information about cash and bank balances in countries with exchange control or other restrictions, see text to the consolidated cash flow statement.
Based on the liquidity reserve, loans for the financing of specific assets, the maturity of outstanding loans, revenue back-log, and the current investment profile, the group’s financial resources are deemed satisfactory.
The average term to maturity of loan facilities in the group is around four years (around four years).
It is of great importance for the group to maintain a financial reserve to cover the group’s obligations and investment opportunities and to provide the capital necessary to offset changes in the group’s liquidity due to changes in the cash flow from operating activities.
The flexibility of the financial reserve is subject to ongoing prioritisation and optimisation, among other things, by focusing on the release of capital and following up on the development in working capital, revenue back-log, and capital commitments.
Note 4.3: Financial instruments and risks – continued
ACCOUNTING POLICIES
Derivative financial instruments are recognised on the trading date and measured at fair value using generally acknowledged valuation techniques based on relevant observable swap curves and exchange rates.
The effective portion of changes in the value of derivative financial instruments designated to hedge highly probable future transactions is recognised in other comprehensive income until the hedged transactions are realised. At that time, the accumulated gains/losses are transferred to the items under which the hedged transactions are recognised.
The effective portion of changes in the value of derivative financial instruments used to hedge the value of recognised financial assets and liabilities is recognised in the income statement, together with changes in the fair value of the hedged assets or liabilities that can be attributed to the hedging relationship. Currency basis spreads and forward points are considered a cost of hedge and recognised in other comprehensive income and deferred in equity until realisation
The ineffective portion of hedge transactions and changes in the fair value of derivative financial instruments, which do not qualify for hedge accounting, are recognised in the income statement as financial income or expenses for interest and currency-based instruments, and as other income/costs for oil price hedges and forward freight agreements.
For trade receivables, the loss allowance is measured by the simplified approach according to IFRS 9, applying a provision matrix to calculate the expected lifetime losses. The provision matrix includes impairment for non-due receivables.
Note 4.4: Financial instruments by category
Carried at fair value through other comprehensive
¹ Where no fair value is stated, the amount equals carrying amount 2 Designated at initial recognition in accordance with IFRS 9
Note 4.4: Financial instruments by category – continued
1 Where no fair value is stated, the amount equals carrying amount
FINANCIAL INSTRUMENTS MEASURED AT FAIR VALUE
Financial instruments measured at fair value can be divided into three levels:
• Level 1 Quoted prices (unadjusted) in active markets for identical assets or liabilities
• Level 2 Inputs other than quoted prices included within level 1 that are observable for the asset or liability, either directly (i.e. as prices) or indirectly (i.e. derived from prices)
• Level 3 Inputs for the asset or liability that are not based on observable market data
Fair value of listed securities is within level 1 of the fair value hierarchy. Non-listed shares and other securities are within level 3 of the fair value hierarchy.
Fair value of derivatives is mainly within level 2 of the fair value hierarchy and is calculated based on observable market data as of the end of the reporting period. A minor amount of crude oil price derivatives is within level 1 of the fair value hierarchy.
Fair value of level 3 assets and liabilities is primarily based on the present value of expected
ture cash flows, including estimates received from private equity fund managers. A reasonable possible change in the discount rate is not estimated to affect the group’s profit or equity significantly. For non-listed shares, the price of recent investments into the company is applied as the investments are mainly made in early-stage companies, unless there has been a later fundraising round.
Note 4.4: Financial instruments by category – continued
Movement during the year in level 3
Movement during the year in level 3
FINANCIAL INSTRUMENTS CARRIED AT AMORTISED COST
The fair value of short-term financial assets and other financial liabilities carried at amortised cost is not materially different from the carrying amount. In general, fair value is determined primarily based on the present value of expected future cash flows. However, where a market price was available, this was deemed to be the fair value.
Fair value of listed issued bonds is within level 1 of the fair value hierarchy. Fair value of the remaining borrowing items is within level 2 of the fair value hierarchy, and is calculated based on discounted future cash flows.
OTHER EQUITY INVESTMENTS (FVOCI)
The group has investments in equity shares in both listed and non-listed companies. The group holds non-controlling interests (between 0.1% and 15%) in these companies. These investments were irrevocably designated at fair value through OCI as the group considers these investments to be strategic in nature.
ACCOUNTING POLICIES
Other financial investments
Equity instruments, etc., including shares, bonds, and similar securities, are recognised on the trading date at fair value, and subsequently measured at the quoted market price for listed securities and at estimated fair value for non-listed securities. Fair value adjustments from equity investments are classified in the following measurement categories:
• Through other comprehensive income, or
• Through the income statement
Fair value adjustments from equity investments at fair value through other comprehensive income (FVOCI) remain in equity upon disposal.
Dividends are recognised in the income statement.
Note 4.5: Pensions and similar obligations
As an employer, the group participates in pension plans according to normal practice in the countries in which we operate. Generally, the pension plans within the group are defined contribution plans, where contributions are recognised in the income statement on an accrual basis. A number of entities have defined benefit plans, in which retirement benefits are based on length of service and salary level. To a limited extent, these defined benefit plans also include payments of medical expenses, etc.
In 2025, the group expects to pay contributions totalling DKK 168m (DKK 178m) to funded defined benefit plans.
As well as being subject to the risks of falling interest rates, which would increase the obligation, poor asset returns, and pensioners living longer than anticipated, the group is also subject to the risk of higher-than-expected inflation. This is because many pension benefits, particularly in the UK plans, increase in line with inflation although some minimum and maximum limits apply.
The majority of the group’s defined benefit liabilities are in Switzerland 13% (13%) and the UK 71% (73%). All of the plans in Switzerland and the UK are funded. Although all of the UK plans are now closed to new entrants, active members in the two largest plans continue to accrue new benefits. The smaller UK plans are all closed to new accruals, although a salary link remains in some of the plans.
Overall, the plans have an average duration of approx. 11 years (11 years), and approx. 54% (53%) of the obligation is in respect of pensioner members.
The rates of life expectancy reflect the most recent mortality investigations, and in line with market practice, an allowance is made for future improvements in life expectancy. The group assumes that future improvements will be in line with the latest projections of 1.25% for all UK plans.
The sensitivity of the liabilities and pension cost to the key assumptions are as follows: UK factors
in DKK Change in liability
by 25 basis
The liabilities are calculated using assumptions that are the group’s best estimate of future expectations bearing in mind the requirements of IAS 19.
The group’s plans are funded in accordance with applicable local legislation. In the UK, each plan has a trustee board that is required to act in the best interest of plan members. Every three years, a formal valuation of the plan’s liabilities is carried out using a prudent basis, and if the plan is in deficit, the trustees agree with the group or the sponsoring employer on a plan for recovering that deficit.
Note 4.5: Pensions and similar obligations
– continued
Around 80% of the UK liabilities are now covered by insurance policies. Therefore, movements in the liabilities due to changes in assumptions would equally impact the assets’ value related to the buy-in policies, resulting in a reduced movement in the overall balance sheet position.
No contributions to the UK plans are expected for 2025. The contributions to the UK plans for 2024 were expected to be DKK 81m which were all in respect of deficit recovery contributions, though only DKK 28m were actually paid. In most of the UK plans, any surplus remaining after the last member dies may be returned to the group. However, the Merchant Navy Ratings Pension Fund (MNRPF) and the Merchant Navy Officers Pension Fund (MNOPF) contributions paid by the group are not refundable under any circumstance and the balance sheet liability reflects an adjustment for any agreed deficit recovery contributions in excess of the deficit determined using the group’s assumptions. In 2024, an adjustment of DKK 21m (DKK 74m) was applied in this respect.
Other than the insurance contracts and a small proportion of other holdings, the plan assets held by the group are quoted investments.
Specification of plan assets 2024
Specification of plan assets 2023
Note 4.5: Pensions and similar obligations
– continued
Change in net liability
Amounts in DKKm
MULTI-EMPLOYER PLANS
Under collective agreements, certain entities in the group participate together with other employers in defined benefit pension plans as well as welfare/medical plans (multi-employer plans). In general, the contributions to the schemes are based on man hours worked or cargo tonnage handled, or a combination thereof.
For the defined benefit pension plans, the group has joint and several liabilities to fund total obligations, while the welfare/medical plans are by nature contribution plans funded on a ‘pay-asyou-go basis’. The group’s contributions to the pension and welfare/medical plans in 2024 are estimated at DKK 0.5bn (DKK 0.6bn) and DKK 1.8bn (DKK 1.8bn), respectively. The contributions to be paid in 2025 are estimated at DKK 0.5bn (DKK 0.6bn) for the pension plans and DKK 2.0bn (DKK 1.7bn) for the welfare/medical plans.
No reliable basis exists for allocation of the schemes’ obligations and plan assets to individual employer participants. For the pension plans where the group has an interest and there is a deficit, the net obligations for all employers amount to DKK 1.3bn (DKK 1.5bn). This net obligation is based on the most recent available financial data from the plan’s trustees, calculated in accordance with the rules for such actuarial calculations in US GAAP. The deficit in some of the schemes may necessitate increased contributions in the future. Welfare/medical plans are ‘payas-you-go’ and form a part of the group’s collective bargaining agreements in the US. They cover a limited part of employees’ medical costs as incurred.
ACCOUNTING POLICIES
Pension obligations are the net liabilities of defined benefit obligations and the dedicated assets adjusted for the effect of minimum funding and asset ceiling requirements. Plans with a funding surplus are presented as net assets on the balance sheet. The defined benefit obligations are measured at the present value of expected future payments to be made, in respect of services provided by employees, up to the balance sheet date. Plan assets are measured at fair value. The pension cost charged to the income statement consists of calculated amounts for vested benefits and interest in addition to settlement gains or losses, etc. Interest on plan assets is calculated with the same rates as used for discounting the obligations. Actuarial gains/losses are recognised in other comprehensive income.
Pension plans where the group, as part of collective bargaining agreements, participates together with other enterprises – so called multi-employer plans – are treated as other pension plans in the financial statements. Defined benefit multi-employer plans, where sufficient information to apply defined benefit accounting is not available, are treated as defined contribution plans.
Note 4.6: Non-controlling interests
The group’s subsidiaries with significant non-controlling interests include: Amounts in DKKm
Møller - Mærsk A/S
1 Considered to hold a controlling interest
Summarised financial information (before intercompany eliminations):
Note 4.7: Share capital
The share capital comprises 2,000 shares of DKK 1m. All shares are fully issued and paid up. No shares hold special rights.
of shares and par value
Dividend has been distributed at DKK 0.5m per share in 2024 (DKK 1.25m).
ACCOUNTING POLICIES
Equity includes total comprehensive income for the year comprising the result for the year and other comprehensive income. Proceeds on the purchase and sale of own shares and dividends from such shares are recognised in equity.
The translation reserve comprises the group’s share of accumulated exchange rate differences arising from translation from functional currency into presentation currency. Differences arising from translation to the presentation currency are recognised in other comprehensive income and will not be reclassified to the income statement.
The reserve for other equity investments is comprised of accumulated changes in the fair value of equity investments (at FVOCI), net of tax.
Reserve for hedges includes the accumulated fair value change of derivatives qualifying for cash flow hedge accounting, less amounts already reclassified to the income statement or transferred as basis adjustments, net of tax, as well as forward points and currency basis spread.
The demerger of Svitzer Group A/S from A.P. Møller – Mærsk A/S was concluded at the end of April 2024. Therefore, A.P. Møller – Mærsk A/S’ financial information for 2023 and 2024 up to the demerger includes the consolidation of Svitzer Group A/S.
OTHER DISCLOSURES
Note 5.1: Share-based payment
Programmes disclosed below are solely awarded to certain key employees and members of the Executive Board in portfolio companies. There are no share-based payment programmes introduced for neither key management personnel nor employees in A.P. Møller Holding A/S.
A.P. MØLLER - MÆRSK A/S (A.P. MOLLER - MAERSK)
Performance shares plan
1 The fair value per performance share is equal to the volume weighted average share price on the date of grant, i.e. 1 April 2024 (1 April 2023), adjusted for expected dividends during the vesting period
2 Total fair value is at the time of grant
From 2023, performance shares are granted to certain key employees and members of the Executive Board at A.P. Moller - Maersk. Each performance share granted is a right to potentially receive an existing B share of nominal DKK 1,000 in A.P. Moller - Maersk.
Transfer of B shares is contingent upon the fulfilment of certain performance criteria being met, which may include but are not limited to return on invested capital, relative share performance, revenue growth, and ESG elements. Vesting is also contingent upon the employee still being employed and not under notice of termination when three years have passed from the date of grant.
Employees are not entitled to any dividends during the vesting period. Special conditions apply regarding illness, death, and resignation as well as changes in the company’s capital structure, etc. A part of A.P. Moller - Maersk’s treasury B shares will be used to meet the obligations in connection with the performance shares plan.
The recognised remuneration expense related to the performance shares plan is DKK 41m (DKK 14m).
Note 5.1:
Share-based payment
– continued
The average remaining contractual life of the performance shares as per 31 December 2024 was 1.8 years (2.3 years).
Restricted shares plan
Outstanding restricted shares
as of 1 January 2023
The recognised remuneration expense related to the restricted shares plan was DKK 124m (DKK 110m).
The average remaining contractual life for the restricted shares as per 31 December 2024 was 1.5 years (1.6 years).
Share options plan
DKKm
as of 31 December 2023
in connection with the Svitzer demerger 1,134 12,346 14
with the Svitzer demerger
as of 31 December 2024
1 The fair value per restricted share is equal to the volume weighted average share price on the date of grant, i.e. 1 April 2024 (1 April 2023), adjusted for expected dividends during the vesting period
2 Total fair value is at the time of grant
3 The weighted average share price at the settlement date was DKK 9,045 (DKK 12,732)
Restricted shares are awarded to certain key employees and members of the Executive Board at A.P. Moller - Maersk. Each restricted share granted is a right to receive an existing B share of nominal DKK 1,000 in A.P. Møller - Mærsk A/S.
Transfer of B shares is contingent upon the employee still being employed and not being under notice of termination, and takes place when three years have passed from the date of grant. For members of the Executive Board of A.P. Moller - Maersk the vesting period is five years. Participants are not entitled to any dividends during the vesting period. Special conditions apply regarding illness, death, and resignation as well as changes in A.P. Moller - Maersk’s capital structure, etc. A part of A.P. Moller - Maersk’s treasury B shares will be used to meet the obligations in connection with the restricted shares plan.
1 The weighted average share price at the dates of exercise of share options exercised in 2024 was DKK 12,606 (DKK 12,674)
2 The weighted average exercise prices for the 2024 share option movements reflect the exercise prices after the Svitzer modification
A.P. Moller - Maersk also has a share option plan for members of the Executive Board and other key employees at A.P. Moller - Maersk. Each share option granted is a call option to buy an existing B share of nominal DKK 1,000 in A.P. Møller - Mærsk A/S.
Note 5.1: Share-based payment – continued
The share options are granted at an exercise price corresponding to 110% of the average market price on the first five trading days following the release of A.P. Møller - Mærsk A/S’ most recent Annual Report. Exercise of the share options is contingent upon the option holder still being employed at the time of vesting, which takes place when three years have passed from the date of grant. The share options can be exercised when at least three years and no more than six years (seven years for share options granted to employees who are not members of the Executive Board at A.P. Moller - Maersk) have passed from the date of grant. Special conditions apply regarding illness, death, and resignation as well as changes in A.P. Moller - Maersk’s capital structure, etc.
The share options can only be settled in shares. A part of A.P. Moller - Maersk’s holding of treasury B shares will be used to meet the obligations in respect of the share option plan.
The remuneration expense related to the share option plan was DKK 83m (DKK 69m).
The average remaining contractual life for the outstanding share options as per 31 December 2024 was 4.1 years (4.4 years), and the range of exercise prices for the outstanding share options as per 31 December 2024 was DKK 7,271 to DKK 23,994 (DKK 7,605 to DKK 25,096).
The following principal assumptions are used in the valuation:
Share price, volume weighted average at the date of grant, 1 April, DKK
price, five days volume weighted average after publication of Annual Report, DKK¹
1 The exercise price was determined based on the five-day volume weighted average share price after the Annual General Meeting
The fair value of the options granted is based on the Black-Scholes option pricing model using the assumptions in the table above.
Modification in 2024
In May 2024, as a result of the demerger of Svitzer in April 2024, A.P. Moller - Maersk reduced the exercise price of outstanding share options and increased the number of share options, restricted share units, and performance shares outstanding, in order to preserve the value of the outstanding awards. The total incremental fair value of the share options, restricted share units, and performance shares as a result of the modification is DKK 52m. For awards that were fully vested, the incremental fair value was recognised immediately and for awards not yet vested, the incremental fair value is recognised over the period from the modification date to the vesting date. The expense for the original awards will continue to be recognised as if the terms had not been modified.
The fair value of the modified awards was determined using the same models and principles as described above, with the following differences in inputs for share options:
Share price, volume weighted average at the date of modification, 15 May 2024, DKK 11,335
Exercise price, DKK
Expected volatility (based on historic volatility)
Expected term (years)
Original exercise price x adjustment factors
37%
80% of time remaining until option vesting
Expected dividend per share, DKK 2.1%
Risk-free interest rate Based on time remaining until expiry
Note 5.1: Share-based payment – continued
SVITZER GROUP A/S (SVITZER)
Restricted shares plan
Outstanding shares
Outstanding as of 1 January 2024 0
Outstanding as of 31 December 2024
237 14
1 The fair value per restricted share is equal to the volume weighted average share price on the date of grant, which is equal to the average closing price of the first 20 trading days on Nasdaq Copenhagen
2 Total fair value is at the time of grant
Restricted shares are awarded to members of the Executive Management and other key management personnel of Svitzer. Each restricted share granted is a right to receive an existing share of a nominal value of DKK 10 in Svitzer Group A/S
Transfer of restricted shares is contingent upon the employee still being employed and not being under notice of termination and takes place when three years have passed from the date of grant. During the vesting period, there is no entitlement to any dividends. Special conditions apply regarding illness, death, and resignation as well as changes in Svitzer’s capital structure, etc.
During 2024, certain key employees and members of the Executive Board at Svitzer were also awarded exceptional restricted shares to be vested in April 2027. These exceptional shares do not require continuous employment and the remuneration expense of DKK 5m has been recognised in its entirety in 2024.
The total recognised remuneration expense related to the restricted shares plan is DKK 7m.
The average remaining contractual life for the outstanding restricted shares as per 31 December 2024 is 2.3 years.
OTHER SHARE-BASED PAYMENT PROGRAMMES
The group has introduced a number of cash-settled share-based payment programmes in its non-listed portfolio companies. The programmes are for key employees as well as members of the Executive Board and Board of Directors in the respective portfolio companies.
Certain programmes include a co-investment programme, however, due to service conditions, they are defined as cash-settled share-based payment programmes. The programmes are based on fair market value. Due to a put option issued for the benefit of the co-investors, the group has an obligation to buy back the shares. The liability is recognised in the balance sheet.
ACCOUNTING POLICIES
Equity settled performance shares, restricted shares, and share options granted to certain key employees as part of the group’s long-term incentive programmes are recognised as remuneration expenses over the vesting period at estimated fair value at the grant date and result in a corresponding adjustment in equity.
Cash-settled performance awards allocated to employees as part of the group’s long-term incentive programmes are recognised as staff costs over the vesting period and result in a corresponding adjustment in other payables.
At the end of each reporting period, the group revises its estimates of the number of awards that are expected to vest based on the non-market vesting conditions and service conditions. Any impact of the revision is recognised in the income statement with a corresponding adjustment to equity or other payables.
Note 5.2:
Commitments
SHORT-TERM AND LOW-VALUE LEASES
As part of the group’s activities, customary agreements are entered into regarding charter and operating leases of vessels, containers, and port facilities. Furthermore, the group has entered into low-value lease agreements for operating leases of property, etc.
The future lease payments for short-term and low-value lease agreements are:
CAPITAL COMMITMENTS
The group has the following capital commitments: Amounts in
The increase in capital commitments is primarily related to vessel newbuilding contracts entered into during 2024. The capital commitments will be financed by cash flow from operating activities as well as existing and new loan facilities.
Newbuilding programmes as of 31 December 2024
Capital commitments to newbuilding programmes as of 31 December 2024
Note 5.3: Contingent liabilities
CONTINGENT LIABILITIES
Contingent liabilities consist of legal cases, tax issues, custom bonds, volume commitments, and other disputes.
Legal
The group is involved in several legal cases and other disputes. Some of these involve significant amounts and are subject to considerable uncertainty. The group continuously assesses the risks associated with the cases, investigations, and disputes, and their likely outcome. It is the opinion of management that, apart from items recognised in the financial statements, the outcome of these cases, investigations, and disputes are either not probable or cannot be reliably estimated in terms of amount or timing. The group does not expect these to have a material impact on the consolidated financial statements.
Tax
The group is subject to a tax audit in Germany concerning allocation of taxation rights to shipping income between Denmark and Germany as well as to a tax investigation in India concerning a deemed supply of services between Indian Goods and Services Tax (GST) registrations of A.P. Moller - Maersk in India. The group is also involved in various other tax disputes, including indirect tax disputes, some of which involve significant amounts. The group continuously assesses the risks associated with tax disputes and their likely outcome and considers the risk related to these disputes remote, and therefore a material impact on the consolidated financial statements is not expected.
Other
Custom bonds of DKK 6.1bn (DKK 5.6bn) have been provided to various port authorities in India.
The group has entered into a number of agreements with terminals and port authorities, etc. comprising volume commitments, including an extra payment, in case minimum volumes are not met.
Except for customary agreements within the group’s activities, no material agreements have been entered into that will take effect, change, or expire upon change of control of the company.
Note 5.4: Cash flow specifications
Purchase of intangible assets and property, plant and equipment
1 Additions to intangible assets amount to DKK 1.9bn (DKK 1.7bn)
Other non-cash items relate primarily to the adjustment of provisions.
Note 5.4: Cash flow specifications -
continued
SIGNIFICANT ACCOUNTING JUDGMENTS
Operations in countries with limited access to repatriating surplus cash
The group operates worldwide and, in this respect, has operations in countries where the ability to repatriate surplus cash is complicated and time consuming. In these countries, management makes judgments as to whether these cash positions can be recognised as cash or cash equivalents.
ACCOUNTING POLICIES
Cash flow from operating activities includes all cash transactions other than cash flows arising from investing and financing activities such as investments and divestments, received dividends, principal payments of loans, instalments on lease liabilities, paid and received financial expenses, and equity transactions. Capitalisation of borrowing costs is considered non-cash items, and the actual payments of these borrowing costs are included in cash flow from financing.
Cash and cash equivalents comprise cash and bank balances net of bank overdrafts where overdraft facilities form an integral part of the group’s cash management.
Note 5.5: Related parties
1 The Board of Directors and the Executive Board of A.P. Møller Holding A/S and their close relatives (including undertakings under their significant influence). Trade payables include customary business-related accounts regarding shipping activities
2 Operating costs regarding management include commission and commercial receivables to Maersk Broker K/S from chartering as well as purchase and sale of vessels
3 Including share buyback programmes
Note 5.5: Related parties - continued
A.P. Møller og Hustru Chastine Mc-Kinney Møllers Fond til almene Formaal, Denmark is the parent company and the ultimate owner.
A.P. Møller Holding A/S’ related parties comprise its owner A.P. Møller og Hustru Chastine McKinney Møllers Fond til almene Formaal as well as the Board of Directors and Executive Boards of A.P. Møller Holding A/S and A.P. Møller og Hustru Chastine Mc-Kinney Møllers Fond til almene Formaal. Related parties also comprise subsidiaries, associated companies, and joint ventures. All agreements have been negotiated on market-based terms.
Dividends distributed to A.P. Møller og Hustru Chastine Mc-Kinney Møllers Fond til almene Formaal amounted to DKK 1.0bn (DKK 2.5bn).
Note 5.6: Events after the balance sheet date
No events of importance to the Annual Report have occurred during the period from the balance sheet date until the presentation of the financial statements.
Note 5.7: Company overview – continued
A.P. Moller Holding group comprises more than 1,100 companies, of which the holding entity of each portfolio company is listed below.
Subsidiary
AIF I Sponsor Invest K/S
A more comprehensive list of companies is available at https://apmoller.com/wp-content/uploads/2025/03/APMH-Company-overview-2024.pdf.
APMH Invest XVIII ApS
- Iv3 Aqua Holding A/S
1 100% of the
INCOME STATEMENT
BALANCE
SHEET AS OF 31 DECEMBER
STATEMENT OF CHANGES IN EQUITY
1 Other adjustments primarily comprise exchange rate adjustments and disposals due to share buy-back programmes in subsidiaries
Note 1: Investments in subsidiaries
1 Disposals include share buy-back programmes in subsidiaries
COMPANY OVERVIEW AS OF 31 DECEMBER 2024
1 Percentage of total number of issued shares. The ownership share has been adjusted for A.P. Moller - Maersk’s holding of own shares as of 31 December 2024 due to the share buy-back programme that terminated on 8 February 2024. Without the adjustment, the ownership share amounts to 41.5%. Cancellation of A.P. Moller - Maersk’s own shares will be completed at a general meeting
Please refer to the company overview for A.P. Moller Holding group of companies as stated in note 5.7, which is an integrated part of this note.
Note 2: Staff costs
A.P. Moller Holding has a cash-settled incentive plan to members of the Executive Board and grants have been awarded on a yearly basis. The incentive plan provides an annual bonus and long-term incentive programmes, which are determined by the development in the value creation of the underlying investments. The main part of the long-term incentive programmes is capped. Amounts in DKKm
Note 3: Property
Note 6: Tax on result for the year
Note 7: Distribution of result for the year
Note 4: Financial income
Note 8: Deferred tax
Note 5: Financial expenses
Deferred tax is calculated based on the difference between the carrying amount and the tax base of assets and liabilities. Management expects the deferred tax asset to be utilised by the company itself or by the group of jointly taxed companies within a few years.
Note 9: Share capital
The share capital consists of 2,000 shares with a nominal value of DKK 1m and amounts to DKK 2bn as of 31 December 2024.
Note 12: Contingent liabilities
The company is included in national joint taxation with other Danish companies in the A.P. Moller Holding group. The company is jointly and severally liable for the payment of taxes and withholding tax.
Note 10: Related parties
A.P. Møller og Hustru Chastine Mc-Kinney Møllers Fond til almene Formaal (A.P. Moller Foundation) holds 100% of the company’s capital.
Related parties exercising controlling interest in the company:
The company has not entered into any transactions with related parties that were not on an arm’s length basis.
Note 13: Events after the balance sheet date
No events of importance to the Annual Report have occurred during the period from the balance sheet date until the presentation of the financial statements.
Note 11: Commitments
As part of the company’s activities, lease agreements are entered into regarding the lease of office equipment and cars. The total amount of lease commitments regarding short-term and lowvalue asset leases as of 31 December 2024 amounts to DKK 1.3m (DKK 2.3m). During 2024, the company had lease costs regarding short-term leases and low-value leases amounting to DKK 1.0m (DKK 1.2m).
Note 14: Accounting policies
The financial statements for 2024 for A.P. Møller Holding A/S have been prepared on a going concern basis and in accordance with the provisions of the Danish Financial Statements Act applying to large enterprises of reporting class C.
With reference to section 86(4) of the Danish Financial Statements Act, no cash flow statement has been prepared for the company.
With reference to section 96(3) of the Danish Financial Statements Act, the company has not presented fees to statutory auditors.
Compared to the accounting policies described for A.P. Møller Holding A/S as stated in note 1.1 to the consolidated financial statements, the company’s accounting policies differ mainly in the following areas:
• Shares in subsidiaries are measured under the equity method. The share of result after tax in the subsidiaries is recognised as a separate line item in the income statement. Goodwill and other intangible assets with indefinite useful lives are recognised as part of the investment and amortised over a maximum of 25 years
• Shares in associates that are retained shareholdings in a former subsidiary, will initially be recognised with the same carrying amounts as previously, and hence, the carrying amounts will be presented as transfers
• Dividends from subsidiaries are recognised as a receivable at the time of declaration
• Other equity investments are measured at fair value and the fair value adjustment is recognised through the income statement. Therefore, other equity investments classified at fair value through other comprehensive income in the consolidated financial statements, are recognised in the income statement in the financial statements for A.P. Møller Holding A/S
The financial statements have been prepared under the same accounting policies as last year.
The financial statements are presented in DKK million.
INCOME STATEMENT
Share of result in subsidiaries
Share of result in subsidiaries is recognised net of tax and corrected for the share of unrealised intra-group gains and losses. The line item also includes amortisation and impairment of goodwill recognised as part of the equity investment.
Other external expenses
Other external expenses comprise expenses for administration, office supplies, etc.
Other income
Other income comprises service fees.
BALANCE SHEET
Investments in subsidiaries
Investments in subsidiaries are accounted for under the equity method and the equity method is used as a consolidation method. The investments are initially recognised at cost and adjusted thereafter to recognise the company’s share of the post-acquisition profits or losses of the investee, and the company’s share of movements in equity of the investee. Accounting policies of equity accounted investees have been changed where necessary to ensure consistency with the policies adopted by the company. Dividends received are recognised as a reduction in the carrying amount of the investment.
When the company’s share of losses in an equity accounted investment equals or exceeds its interest in the entity, including any other unsecured long-term receivables, the company does not recognise further losses, unless it has incurred obligations or made payments on behalf of the other entity.
Unrealised gains on transactions between the company and its subsidiaries are eliminated in full.
Business combinations under common control are accounted for at carrying values using predecessor accounting, i.e. pooling of interests when the entity acquired has been under control of another member of the same group company before the acquisition. A difference between the carrying value and the consideration paid are recognised directly in equity.
MANAGEMENT’S STATEMENT
The Board of Directors and the Executive Board have today considered and adopted the Annual Report of A.P. Møller Holding A/S for the financial year 1 January – 31 December 2024.
The consolidated financial statements have been prepared in accordance with IFRS Accounting Standards as adopted by the EU and further requirements in the Danish Financial Statements Act, and the parent company financial statements have been prepared in accordance with the Danish Financial Statements Act. Management review has been prepared in accordance with the Danish Financial Statements Act.
In our opinion, the consolidated financial statements and the parent company financial statements give a true and fair view of the financial position at 31 December 2024 of the group and the parent company and of the results of the group and parent company operations and consolidated cash flows for the financial year 1 January – 31 December 2024
In our opinion, the management review includes a true and fair account of the development in the operations and financial circumstances of the group and the parent company, of the results for the year, and of the financial position of the group and the parent company, as well as a description of the most significant risks and elements of uncertainty facing the group and the parent company.
We recommend that the Annual Report be adopted at the Annual General Meeting.
Copenhagen, 27 March 2025
Executive Board
Robert Maersk Uggla CEO
Jan Thorsgaard Nielsen
CIO
Martin Nørkjær
Larsen CFO Board of Directors
Ane Mærsk Mc-Kinney Uggla Chair
Claus V. Hemmingsen
Jan Leschly
Lars-Erik Brenøe
INDEPENDENT AUDITOR’S REPORT
To the shareholder of A.P. Møller Holding A/S
BASIS FOR OPINION
We conducted our audit in accordance with International Standards on Auditing (ISAs) and the additional requirements applicable in Denmark. Our responsibilities under those standards and requirements are further described in the Auditor’s Responsibilities for the Audit of the Financial Statements section of our report. We are independent of the group in accordance with the International Ethics Standards Board for Accountants’ International Code of Ethics for Professional Accountants (IESBA Code) and the additional ethical requirements applicable in Denmark, and we have fulfilled our other ethical responsibilities in accordance with these requirements and the IESBA Code. We believe that the audit evidence we have obtained is sufficient and appropriate to provide a basis for our opinion.
STATEMENT ON MANAGEMENT REVIEW
Management is responsible for management review.
Our opinion on the financial statements does not cover management review, and we do not express any form of assurance conclusion thereon.
OPINION
In our opinion, the consolidated financial statements give a true and fair view of the group’s financial position as of 31 December 2024 and of the results of the group’s operations and cash flows for the financial year 1 January - 31 December 2024 in accordance with IFRS Accounting Standards as adopted by the EU and further requirements in the Danish Financial Statements Act.
Moreover, in our opinion, the parent company financial statements give a true and fair view of the parent company’s financial position as of 31 December 2024 and of the results of the parent company’s operations for the financial year 1 January - 31 December 2024 in accordance with the Danish Financial Statements Act.
We have audited the consolidated financial statements and the parent company financial statements of A.P. Møller Holding A/S for the financial year 1 January - 31 December 2024, which comprise income statement, balance sheet, statement of changes in equity, and notes, including material accounting policy information, for both the group and the parent company, as well as statement of comprehensive income and cash flow statement for the group (financial statements).
In connection with our audit of the financial statements, our responsibility is to read management review and, in doing so, consider whether management review is materially inconsistent with the financial statements or our knowledge obtained during the audit, or otherwise appears to be materially misstated.
Moreover, it is our responsibility to consider whether management review provides the information required under the Danish Financial Statements Act.
Based on the work we have performed, in our view, management review is in accordance with the consolidated financial statements and the parent company financial statements and has been prepared in accordance with the requirements of the Danish Financial Statements Act. We did not identify any material misstatement in management review.
MANAGEMENT’S RESPONSIBILITIES FOR THE FINANCIAL STATEMENTS
Management is responsible for the preparation of consolidated financial statements that give a true and fair view in accordance with IFRS Accounting Standards as adopted by the EU and further requirements in the Danish Financial Statements Act and for the preparation of the parent company financial statements that give a true and fair view in accordance with the Danish Financial Statements Act, and for such internal control as management determines is necessary to enable the preparation of financial statements that are free from material misstatement, whether due to fraud or error.
In preparing the financial statements, management is responsible for assessing the group’s and the parent company’s ability to continue as a going concern, disclosing, as applicable, matters related to going concern and using the going concern basis of accounting in preparing the financial statements unless management either intends to liquidate the group or the parent company or to cease operations, or has no realistic alternative but to do so.
AUDITOR’S RESPONSIBILITIES FOR THE AUDIT OF THE FINANCIAL STATEMENTS
Our objectives are to obtain reasonable assurance about whether the financial statements as a whole are free from material misstatement, whether due to fraud or error, and to issue an auditor’s report that includes our opinion. Reasonable assurance is a high level of assurance, but is not a guarantee that an audit conducted in accordance with ISAs and the additional requirements applicable in Denmark will always detect a material misstatement when it exists. Misstatements can arise from fraud or error and are considered material if, individually or in the aggregate, they could reasonably be expected to influence the economic decisions of users taken on the basis of these financial statements.
As part of an audit conducted in accordance with ISAs and the additional requirements applicable in Denmark, we exercise professional judgment and maintain professional scepticism throughout the audit. We also:
• Identify and assess the risks of material misstatement of the financial statements, whether due to fraud or error, design and perform audit procedures responsive to those risks, and obtain audit evidence that is sufficient and appropriate to provide a basis for our opinion. The risk of not detecting a material misstatement resulting from fraud is higher than for one resulting from error as fraud may involve collusion, forgery, intentional omissions, misrepresentations, or the override of internal control.
• Obtain an understanding of internal control relevant to the audit in order to design audit procedures that are appropriate in the circumstances, but not for the purpose of expressing an opinion on the effectiveness of the group’s and the parent company’s internal control.
• Evaluate the appropriateness of accounting policies used and the reasonableness of accounting estimates and related disclosures made by management.
• Conclude on the appropriateness of management’s use of the going concern basis of accounting in preparing the financial statements and, based on the audit evidence obtained, whether a material uncertainty exists related to events or conditions that may cast significant doubt on the group’s and the parent company’s ability to continue as a going concern. If we conclude that a material uncertainty exists, we are required to draw attention in our auditor’s report to the related disclosures in the financial statements or, if such disclosures are inadequate, to modify our opinion. Our conclusions are based on the audit evidence obtained up to the date of our auditor’s report. However, future events or conditions may cause the group and the parent company to cease to continue as a going concern.
• Evaluate the overall presentation, structure, and contents of the financial statements, including the disclosures, and whether the financial statements represent the underlying transactions and events in a manner that gives a true and fair view.
• Obtain sufficient appropriate audit evidence regarding the financial information of the entities or business activities within the group to express an opinion on the consolidated financial statements and the parent company financial statements. We are responsible for the direction, supervision and performance of the group audit. We remain solely responsible for our audit opinion.
We communicate with those charged with governance regarding, among other matters, the planned scope and timing of the audit and significant audit findings, including any significant deficiencies in internal control that we identify during our audit.
Copenhagen, 27 March 2025
PricewaterhouseCoopers
Statsautoriseret Revisionspartnerselskab CVR No 33 77 12 31