
A.P. Moller Holding’s statutory statement on CSR in accordance with section 99a of the Danish Financial Statements Act. The CSR report is part of the Annual Report for 2024.
A.P. MOLLER HOLDING
This report represents the statutory consolidated statement of A.P. Møller Holding A/S on CSR in accordance with section 99a of the Danish Financial Statements Act. It represents policies, activities, and results achieved in 2024 for entities owned and controlled by A.P. Møller Holding A/S.
A.P. Møller Holding A/S (A.P. Moller Holding) is 100% owned by A.P. Møller og Hustru Chastine Mc-Kinney Møllers Fond til almene Formaal (the A.P. Moller Foundation), one of the largest, industrial foundations in Denmark.
As the parent company of the A.P. Moller Group, our purpose is to build and develop businesses that have a positive impact on society – ‘nyttig virksomhed’. We drive long-term value and growth in our businesses. Through engaged and valued ownership, we leverage our family name, values, insights, and global networks to set our businesses up for success.
‘Nyttig virksomhed’ is a key element in our investment strategy, and we are open to reconsider ownership of a business, if its business model does not have a positive impact on society. Hence, social responsibility is integrated into our purpose and is core in everything we do.
Striving for good governance is part of our ethical culture, and we continue to update our policies and systems to secure a
solid basis for our future activities as an engaged investment company.
We focus highly on mitigating the risk of being abused by third parties that A.P. Moller Holding engages with. This is especially relevant in relation to our investments, where we always conduct proper and adequate due diligence measures on relevant counterparties such as advisors, co-investors, etc.
An example is our Anti-Bribery and Corruption policy which illustrates our zero tolerance towards fraud and bribery. This is one of the cornerstones in our overall framework for how to exercise due care to prevent bribery and corruption internally as well as in relation to third parties acting on behalf of A.P. Moller Holding. The policy provides overall guidelines in relation to procedures to be followed when investing, when interacting with other business relationships, e.g. government officials, and in relation to gifts and hospitality, etc.
As an international investment company with a broad range of investment activities, A.P. Moller Holding has a significant influence on society. We acknowledge the responsibilities that this entails and make an effort to ensure that we are recognised as a trustworthy group of companies.
The Board of Directors of each of our portfolio companies define their own specific CSR policies and Codes of Conduct. We are represented on each board, and these representatives ensure that CSR policies, including human rights, climate change, and environmental impact, are enforced. Policies are adapted to meet the circumstances in which each of the affiliates operate.
CSR POLICIES AT A.P. MOLLER HOLDING
At A.P. Moller Holding, being a good corporate citizen is an integral part of the way we do business, globally as well as locally.
We are committed to work internally and with our business relations to promote responsible practices. Our aspiration is to ensure that all our business relations acknowledge our values and share our commitment to conduct business in an ethical, legal, and socially responsible manner. Continually, we strive to improve the performance of our business relations within the areas of human rights, labour standards, and the environment, and to work against any form of corruption, fraud, and bribery.
We strongly believe that high standard governance measures will create value for all parties and contribute to establish a long-term sustainable relationship with our business partners, our employees, and the societies in which we operate.
We expect our suppliers to avoid participation in or knowingly benefit from any kind of corruption, money-laundering, market abuse, extortion, or bribery.
Furthermore, we expect our suppliers to respect all applicable laws and regulations and prevailing industry standards.
As such, we expect our suppliers to integrate environmental considerations in their activities and strive for continuous improvement by minimising any adverse effects of their activities on the environment.
We expect our suppliers to provide a safe and healthy working environment for all their employees. This includes high focus on respectful treatment, equal opportunity rights, freedom of association and collective bargaining, compliance with applicable working hours, etc.
The CSR reports of our portfolio companies – each outlining company-specific policies, activities, and results for 2023 – are enclosed in this report

WE ARE GUIDED BY OUR FIVE CORE VALUES

CONSTANT CARE
Take care of today, actively prepare for tomorrow

HUMBLENESS
Listen, learn, share, and give space to others

UPRIGHTNESS
Our word is our bond

OUR EMPLOYEES
The right environment for the right people

OUR NAME
The sum of our values: passionately striving higher
APMH INVEST
In the fully owned holding company, APMH Invest A/S, A.P. Moller Holding decides upon and includes investments’ CSR policies in the continuous assessment of which companies should be invested in.
As of 31 December 2024, the investment companies fully owned by and/or where A.P. Moller Holding controls the entity comprise:
• APMH Invest A/S
• APMH Invest V ApS
• APMH Invest IX ApS
• APMH Invest X P/S
• APMH Invest XI ApS*
• APMH Invest XIII ApS
• APMH Invest XIV ApS
• APMH Invest XVI ApS
• APMH Invest XVIII ApS
• APMH Invest XX A/S*
• APMH Invest XXI ApS
• APMH Invest XXII ApS
• APMH Invest XXIV ApS
• APMH Invest XXV ApS*
• APMH Invest XXVI A/S*
• APMH Invest XXVII A/S*
• APMH Invest XXIX ApS
• APMH Invest XXX ApS
• APMH Invest XXXIII ApS*
• APMH Invest XXXIV ApS*
• APMH Invest XXXV A/S
• APMH Invest XXXVII Aps
• APMH Invest 38 ApS*
• APMH Invest 39 ApS*
• APMH Invest 40 ApS*
• APMH Invest 41 ApS*
• APMH Invest 42 ApS*
• APMH Invest 43 ApS*
• APMH Invest 44 ApS*
• APMH Invest 45 ApS*
• APMH Invest 46 ApS*
• APMH Invest 47 ApS*
• APMH Invest 48 A/S*
• APMH Invest 49 A/S*
• APMH Invest 50 K/S
• APMH GE P/S
• APMHI GP ApS
• A.P. Møller Maritime ApS
• AIF I Sponsor Invest K/S
• C2X LTD and subsidiaries
• Iv3 Aqua Holding A/S
• Iv3 Aqua Corporation and subsidiaries
• Vioneo Holding AG and subsidiaries
* Dormant companies as of 31 December 2024.
Being owned by A.P. Moller Holding, APMH Invest A/S takes its origin in the same values and commitments towards CSR as A.P. Moller Holding. Hence, APMH Invest is committed to make investments in an ethical, legal and socially responsible manner.
A.P. MOLLER - MAERSK
The sustainability statement from A.P. Moller - Maersk’s Annual Report for 2024 is enclosed on the next pages.
Sustainability statement
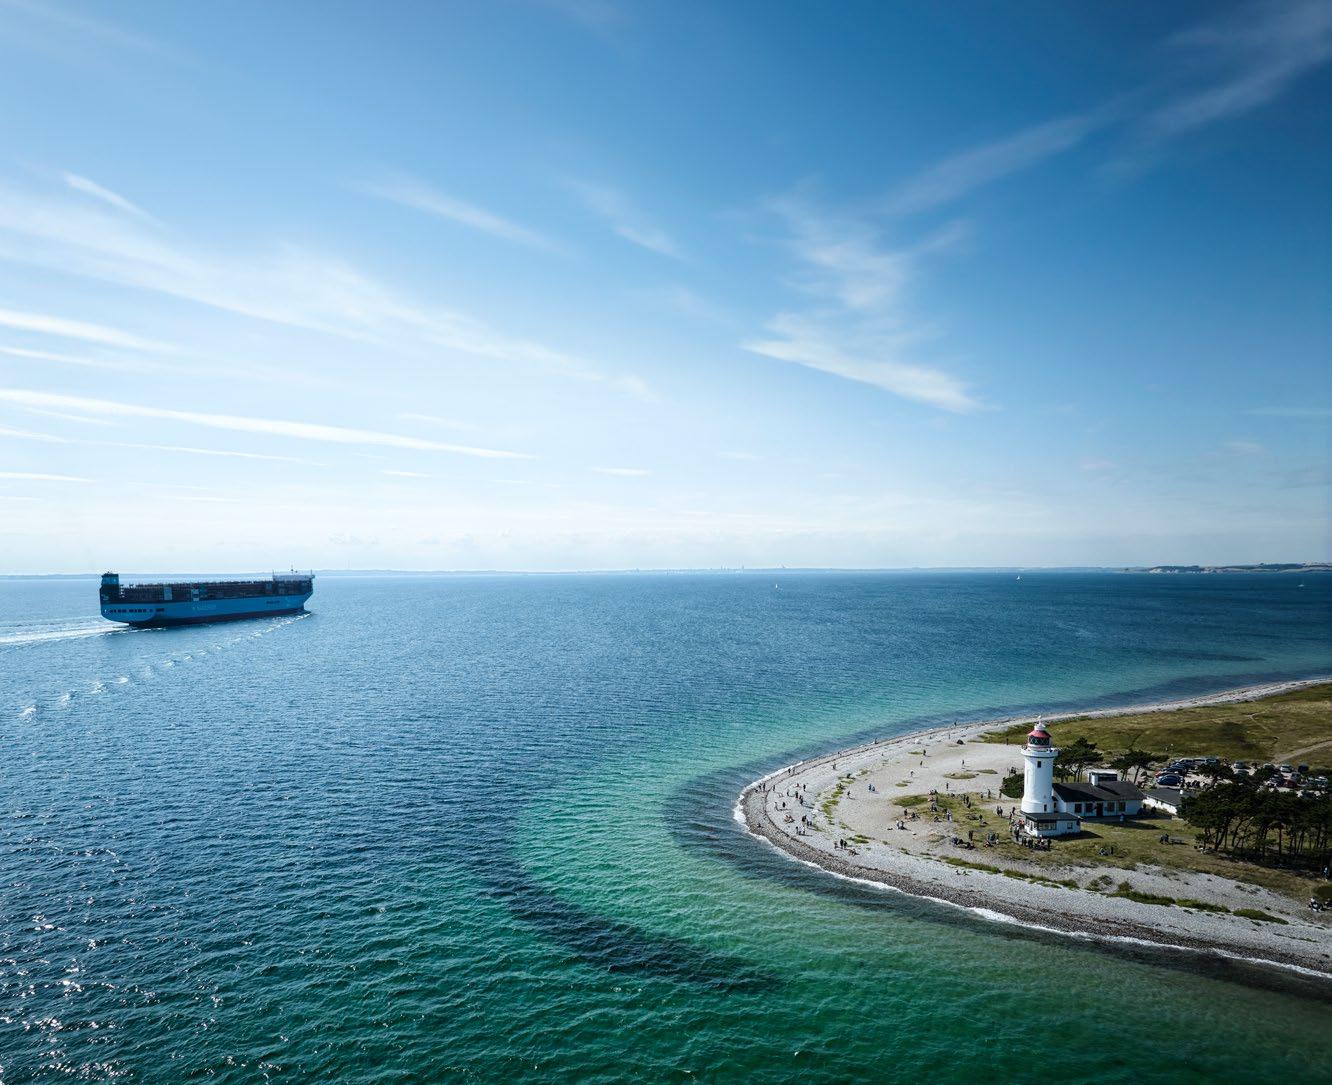
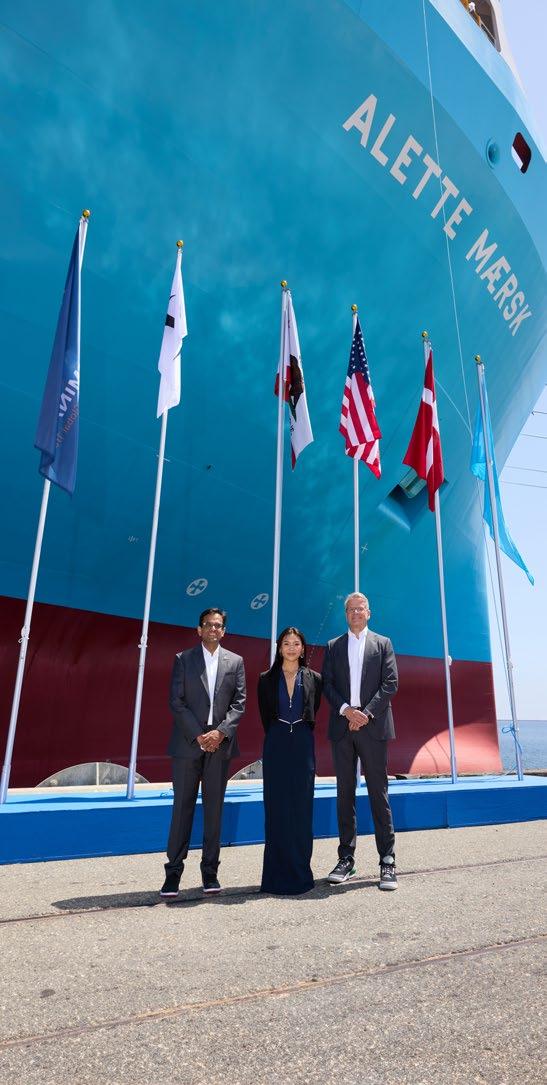
Aarhus, Denmark
Methanol-capable vessels and the fuels to sail them
In 2024, Maersk took delivery of seven new large dual-fuel methanol vessels, including Antonia Mærsk, shown here in Aarhus, Denmark. She was christened by our customer Vestas, a Danish sustainable energy solution producer.
While the vessel technology to decarbonise ocean transport is readily available, the biggest challenge is securing the green fuels for these ships. Maersk signed additional offtake agreements in 2024 and has secured more than half of the projected 2027 demand for its new vessels.
Basis of preparation
In 2024, for the first time, A.P. Moller - Maersk (Maersk) has prepared the sustainability statement in accordance with the EU Corporate Sustainability Reporting Directive (CSRD) and its underlying European Sustainability Reporting Standards (ESRS).
Maersk’s reporting on sustainability and ESG focuses on material sustainability matters and activities and encompasses areas where Maersk may have the largest impact on people and planet through our activities, or where Maersk is exposed to the most significant financial risks or opportunities. The materiality of sustainability matters and topics is determined based on the application of a double materiality assessment (DMA) principle. The results of the DMA have shaped the content of the sustainability statement.
Scope and consolidation
Unless otherwise stated, the ESG performance data and information included in the sustainability statement are reported based on the same consolidation principles as the financial statements. Thus, the ESG performance data include consolidated data from the parent company, A.P. Møller - Mærsk A/S, and subsidiaries controlled by A.P. Møller - Mærsk A/S. Similarly, unless otherwise stated, our policies apply to all Maersk entities, employees and everyone
working under Maersk’s control. Data is collected per legal entity and per activity, and the figures are consolidated line-by-line. Consolidation of ESG performance data using financial scope implies that data from the following assets are included:
• Owned assets that Maersk financially owns and that are operated by Maersk
• Long-term leased-in assets that Maersk treats as capital assets and that are treated as such on Maersk’s balance sheet in accordance with IFRS 16
• Leased-out assets that Maersk treats as wholly owned assets in financial accounting and that are treated as such on Maersk’s balance sheet (i.e. short-term leased-out assets to third parties).
For entities and assets that are under Maersk’s operational control but not consolidated under the parent company and its subsidiaries, the above financial consolidation principles differ.
Operational control is defined as the situation where Maersk or one of its subsidiaries has full authority to introduce and implement its operating policies at the entity (i.e. operationally controlled investees in e.g. associates, joint ventures or unconsolidated subsidiaries). Operational control is determined by looking at the contractual arrangements to determine whether Maersk has full authority to introduce and implement its operating policies.
Data from divestments is included until the divestment date. Data from Svitzer, which was demerged during 2024, is included up until the demerger date of 26 April 2024.
This report covers the full upstream and downstream value chain based on the outcome of the DMA.
Uncertainties and estimates
Preparation of ESG performance data requires Management to make estimates in some areas, which affect the reported data. Management forms its estimates based on historical experience, independent advice, external data points, in-house specialists and other information believed to be reasonable under the circumstances. Read more about uncertainties and estimates in the accounting policies relating to the ESG performance data. To minimise risks of reporting errors in relation to ESG performance data, including areas with uncertainty, internal controls and validation processes are established.
Changes affecting the ESG performance data in 2024
In 2024, Maersk reports for the first time in accordance with the CSRD and the disclosure requirements outlined in the ESRS. Thus, for 2024, we have, in addition to previously reported KPIs, included new ESRSrelated datapoints that have been deemed material as part of Maersk’s DMA in the relevant ESG performance data sections of the sustainability statement. This includes:
Environment
• Percentage of scope 1 greenhouse gas (GHG) emissions from regulated emissions trading schemes
• Renewable energy production
• Maersk top 5 sites at material risk of physical climate change
• Operating expenditures (OPEX) in conjunction with major incidents and deposits
• Total weight of procured steel
Social
• Average number of employees
• Number of employees by gender
• Number of employees by contract type by gender
• Number of employees by contract type by region
• Number of employees by country
• Number of employees who left the company
• Total employee turnover
• Employees by age group
• Gender pay gap
• Annual total remuneration ratio (CEO pay ratio)
• Employees paid below the applicable adequate wage benchmark
• Number of lost time incidents
Governance
• Number of convictions for violation of anti-corruption and anti-bribery laws
• Amount of fines for violation of anti-corruption and anti-bribery laws
• Number of legal proceedings outstanding for late payments
Throughout the sustainability statement, the references used in ESG performance data tables are based on the EFRAG data point list ID’s.
In 2024, we report our progress towards validated science-based targets, which are our main climate KPIs and targets towards 2030 and 2040. Consequently, we have discontinued reporting on segment-specific climate targets, including for Terminals, reduction of absolute scope 1 and 2 emissions by 2030 (2020 baseline), and for Ocean, share of freight transported on green fuels.
In 2024, we have revised our definition of operationally controlled entities and joint ventures. With the introduction of a clear definition for operational control in ESRS, which is based on whether a company has full authority to introduce and implement its operating policies at the entity as stated in the contractual agreement, Maersk has aligned its definition accordingly, which has resulted in an insignificant adjustment.
We have made a number of other restatements to the 2023 numbers owing to improvement of reporting processes and data quality. Most notably, we made a correction to scope 1 emissions, as refrigerant emissions had been overstated in 2023. The correction has led to a restatement of scope 1 emissions of 1.7m tonnes CO2e or approximately a 5% reduction of total scope 1 emissions for 2023.
Incorporation by reference
The
Disclosure requirements covered by Maersk’s Annual Report 2024
The table below provides an overview ESRS datapoints that derive from other EU legislation and where this information can be found if deemed material.
Environment
Climate change
Pollution
ESRS disclosure requirement
Biodiversity and ecosystems
E4.IRO-1
Description of processes to identify and assess material biodiversity and ecosystem-related impacts, risks and opportunities
Double materiality assessment methodology 68 Stakeholder engagement 70-74
E4.SBM-3 Material impacts, risks and opportunities and their interaction with strategy and business model Environment and ecosystems 77 101-106
Double materiality assessment 66-67
Material impacts, risks and opportunities and their
E4-1
Transition plan and consideration of biodiversity and ecosystems in strategy and business model Environment and ecosystems 101-106
E4-2 Policies related to biodiversity and ecosystems Environment and ecosystems 101-106
E4-3 Actions and resources related to biodiversity and ecosystems Environment and ecosystems 101-106
E4-4 Targets related to biodiversity and ecosystems Environment and ecosystems 101-106
E4-5 Impact metrics related to biodiversity and ecosystems change Environment and ecosystems 101-106
Resource use and circular economy
E5.IRO-1 Description of the processes to identify and assess material resource use and circular economy-related impacts, risks and
Double materiality assessment methodology 68 Stakeholder engagement 70-74
E5-1 Policies related to resource use and circular economy Environment and ecosystems 101-106
E5-2 Actions and resources related to resource use and circular economy Environment and ecosystems 101-106
E5-3 Targets related to resource use and circular economy Environment and ecosystems 101-106
E5-4 Resource inflows Environmental performance data
for engaging with own workforce and workers’ representatives about impacts
ESRS disclosure requirement
Workers in the value chain
S2.SBM-2 Interests and views of stakeholders
S2.SBM-3 Material impacts, risks and opportunities and their interaction with strategy and business model
S2-1 Policies related to value chain workers
S2-2 Processes for engaging with value chain workers about impacts
Section/report Page
Governance
Stakeholder engagement 70-74
Our workforce 110-113
Double materiality assessment 66-67 110 127
Sustainable procurement 130-131
Grievance and remedy 73-74
Stakeholder engagement 70-74
S2-3 Processes to remediate negative impacts and channels for value chain workers to raise concerns Grievance and remedy 73-74
S2-4
S2-5
Taking action on material impacts on value chain workers, and approaches to managing material risks and pursuing material opportunities related to value chain workers, and effectiveness of those actions
Targets related to managing material negative impacts, advancing positive impacts and managing material risks and opportunities
Affected communities
S3.SBM-2 Interests and views of stakeholders
Sustainable procurement 130-131
Grievance and remedy 73-74
Sustainable procurement 130-131
Business conduct G1.GOV-1
Stakeholder engagement 70-74
S3.SBM-3 Material impacts, risks and opportunities and their interaction with strategy and business model Double materiality assessment 66-67
Grievance and remedy 73-74
Approach to
S3-1 Policies related to affected communities
S3-2 Processes for engaging with affected communities about impacts Stakeholder engagement 70-74
S3-3 Processes to remediate negative impacts and channels for affected communities to raise concerns Grievance and
Disclosure requirements that derive from other EU legislation
The table below provides an overview ESRS data points that derive from other EU legislation, cf. ESRS 2 Appendix B and where this information can be found if deemed material.
SFDR,
and scope 3 emissions
GOV-1
GOV-4
SBM-1
SBM-1
E1-5
acquired electricity, heat, steam or cooling from fossil sources SFDR 94
consumption and intensity from activities in high-climate-impact sectors SFDR 94
ESRS
S1.SBM-3
(b) Geographies or commodities with risk of child labour SFDR N/A
S1-1 20 (a) General approach to human rights SFDR 112-113
S1-1 20 (b)
approach to engagement with own workforce SFDR 70-74
S1-1, S1-3 20 (c), 32 (c) Approach and availability of grievance and remedy in regards to own workforce SFDR 73-74
ESRS data point Information Regulation Page
Affected communities
S3-1 16, 17
S1-16 97 (a) - 97 (b) Gender pay gap, annual total remuneration
S1-17
S1-17
SFDR, Benchmark regulation 124
Human rights policy commitment to affected communities, whether policies are aligned with internationally recognised instruments, and general approach to human rights of communities SFDR, Benchmark regulation 112-113
S3-1 16 (b) Approach to engagement with affected communities SFDR 70-74
S3-1 16 (c) Approach to remedy in regard to human rights impacts for affected communities SFDR 73-74
S3-4 36 Severe human rights issues and incidents connected to affected communities SFDR 74
Consumers and end-users
S4-1 S4-4 16 (a) (b) (c), 17, 35 All disclosures SFDR, Benchmark regulation N/A
Governance
ESRS data point Information Regulation Page
G1-1 10 (b) (d) Statement if no policies exist in regard to anti-corruption and bribery and to protection of whistleblowers SFDR N/A
G1-4 24 (a) Number of convictions and amount of fines for violations of anti-corruption and bribery laws SFDR 134
S2.SBM-3
S2-1 17 (a), 19
Human rights policy commitments and approach related to value chain workers, aligned with internationally recognised standards SFDR 112-113
S2-1 17 (b) General approach to engagement with value chain workers SFDR 70-74
S2-1 17 (c) Approach to remedy for human rights impacts SFDR 73-74
S2-1 18, 19 Policies explicitly addressing forced labour and child labour, aligned with internationally recognised standards SFDR 112-113 118
S2-1 18 Undertaking has a supplier code of conduct SFDR 130-131
S2-4 19, 36
Severe human rights issues and incidents connected to value chain workers SFDR, Benchmark regulation 74
ESG strategy and governance
Geopolitical tensions, a heightened focus on social issues and impacts of climate-related weather events were among the key external trends 2024. In response to increasing regulatory requirements and further maturing of its strategy, A.P. Moller - Maersk (Maersk) has reviewed and streamlined its ESG priorities.
ESG in the light of emerging global trends
Geopolitical tensions continued to reshape trade and logistics in 2024 as the majority of the world’s shipping lines diverted traffic on AsiaEurope trade routes around the Cape of Good Hope in Africa to avoid attacks in the Red Sea. In addition to longer voyages, which directly increase greenhouse gas (GHG) emissions, this situation led to port congestion, cargo delays and a greater reliance on higher-emission transport modes. As geopolitical tension is slowing down the green transition, inflationary pressures and the continued price differential between fossil and green fuels continue to create challenges to our customers’ commitments and their capacity to decarbonise.
A notable climate change impact in 2024, continuing a pattern from previous years, is the sharp increase in the frequency and severity of extreme weather events including record floods, droughts, heatwaves and wildfires. This also poses disruption risks to global supply chains. It is likely that these events will continue in 2025, and therefore climate change remains both a risk and a strategic topic for Maersk. Severe weather has also created a greater need for Maersk to support communities with critical humanitarian aid during 2024.
The increase of geopolitical tensions and armed conflict is also driving a greater focus on societal issues for Maersk and its customers. This has increased the need for a heightened focus on the due diligence processes for human rights, trade controls, sanctions screening and export compliance to identify and manage risks when operating in conflict zones.
Maersk ESG strategy
ESG core commitments
Environment We will take leadership in the decarbonisation of logistics
Social
Governance
We will ensure that people thrive at work by providing a safe and inspiring workplace
We operate based on responsible business practices
Three levels of priority
Strategic categories
Climate change
Safety
Diversity, equity and inclusion
Prioritised categories
Foundational categories
Human capital
Business ethics
Sustainable procurement
Data ethics
Environment and ecosystems
Human rights
Employee relations and labour rights
Citizenship
Responsible tax
Supply chain digitalisation and increased automation is both a risk and a prerequisite for the integrated logistics strategy. Generative AI is also transforming the industry, highlighting the importance of an ethical use of data and artificial intelligence, where we are trusted in the use of our customers’ and other stakeholders’ data while automating internal processes.
In addition, it is crucial that we keep our workforce in mind in the automation of warehouses and terminals. While increasing accessibility of automation technologies creates opportunities for decarbonising our Logistics & Services and Terminals segments, we also need to invest in upskilling our workforce to maintain and attract critical talents and to ensure safe operations with new technologies.
Worker rights were particularly highlighted in 2024, as dockworker strikes in the US, Canada and the UK, some lasting only a few days, caused knock-on supply chain ripples. Maersk actively works to ensure good and fair working conditions for our workforce and focuses on engaging with our employees or their representatives on complex topics such as automation and fair wages.
The current geopolitical tensions and challenges are expected to continue into 2025. Against this complex and uncertain backdrop, Maersk will continue progressing all three of the core commitments of its ESG strategy in 2025.
ESG strategy
Building on over a decade of commitment to sustainability progress, Maersk’s ESG strategy charts an ambitious course and establishes ESG as core to our Purpose and Values, critical to the success of our integrated logistics strategy, and a differentiator in the value we create for our customers.
The strategy encompasses the material sustainability impacts, risks and opportunities for Maersk and is centred around three core commitments, each with supporting governance, KPIs and targets. These commitments represent issues where Maersk’s position, scale and reach can create the most significant impact, which in turn defines our ambition level in specific ESG categories.
In 2024, we reviewed our ESG priorities to better reflect market and business changes since the 2021 launch of our ESG strategy.
The updated strategy with a finetuning of our priorities is informed by the double materiality assessment (DMA) aligned with the EU Corporate Sustainability Reporting Directive (CSRD), our understanding of stakeholder expectations and taking inspiration from globally recognised reporting frameworks and ESG benchmarks.
As part of the review and streamlining of our ESG strategy framework and priorities, the categories relating to Governance and Sustainable and Inclusive Trade have been recategorised as an enabler and an outcome, respectively, of our ESG strategy.
The 2024 strategy update sets out a prioritisation of our material ESG categories into three levels, strategic with the highest level of focus, followed by prioritised and foundational.
For strategic categories, we set the highest ambition for Maersk’s performance being a differentiator and impact driver. These topics are also tied to executive remuneration as part of the long-term incentive programme. Read more in the Remuneration Report.
Our prioritised ESG categories represent areas which are also closely connected to the impact we have on society, the risks to our business and where we have identified a higher degree of responsibility for acting. Together, the strategic and prioritised categories correspond to our strategic ESG targets. Both have high levels of internal governance and reporting processes, with progress on targets tracked and reported to Executive Leadership Team quarterly.
Our foundational ESG categories represent topics which are essential to our business and are a license to operate. Progress is governed through the wider corporate governance framework, Commit, and accountability resides with functional teams and executive sponsors.
As external measures of progress on our ESG strategy, we engage with select ESG rating providers to help us improve and track performance across the most material ESG aspects. ESG ratings are also a source of insight on stakeholder expectations, and our submissions are valued by customers and investors. We have prioritised those that are most material to our stakeholders and aligned them with our priorities, including EcoVadis, CDP, MSCI and Sustainalytics.
ESG governance model
Responsibility for ESG and sustainability is anchored with Maersk’s Board of Directors, who endorse the overall ESG strategy.
At the Board level, three committees are responsible for ESG-related aspects as reflected in the committee charters:
The ESG Committee’s primary purpose is to oversee our strategic ESG direction, acting as a sounding board for the Executive Leadership Teams (ELT) and supporting the Board of Directors with strategy insights into specific ESG matters. The committee meets quarterly to discuss selected ESG topics throughout the year. The ESG Committee also approves the ESG KPIs that are part of the executive remuneration long-term incentive programme.
The Audit Committee oversees external ESG reporting, data quality and internal controls.
The Remuneration Committee reviews the sustainability-linked targets, proposed by the ESG Committee as part of the long-term incentive programme for the Executive Leadership Team. Read more in the Remuneration Report.
At the executive level, dedicated sponsors are allocated to Maersk’s material ESG categories. This sponsorship includes driving initiatives forward and accountability to the full ELT and the Board of Directors for the development of and delivering on targets and policies. Responsibility for executing on the ESG strategy resides with the dedicated teams within relevant functional areas reporting to the respective ELT sponsors.
Risk and Compliance Committee
The Risk and Compliance Committee (RCC) is the main executive governance forum for ESG as well as other key risk and compliance processes and topics across Maersk, including our internal Commit governance framework (description below) and the enterprise risk management (ERM) process. The RCC charter was updated during 2024 with a view to strengthening central governance across the strategic ESG categories (climate, safety and DE&I), anchored with the RCC. To facilitate oversight and support decision making for strategic dilemmas and risks through the year, ESG progress updates are compiled quarterly for strategic and prioritised targets and KPIs and biannually across all ESG categories.
ESG governance in A.P. Moller - Maersk in 2024
Board committees
ESG relevant
• ESG Committee
• Audit Committee
• Remuneration
Committee
Environment
Climate change
Rabab Boulos, Chief Operating Officer
Energy transition
Environment and ecosystems
Rabab Boulos
Safety and resilience
ELT sponsor
Responsible department
Board of Directors
Endorses ESG strategy
Executive Leadership Team
Defines ESG strategy and oversees implementation
Key corporate functions (cross-category)
Strategy Corporate sustainability | Finance
Facilitates ESG strategy and oversight, guides and enables category owners
• Risk and Compliance Committee
• Investment Committee
Category-specific governance
Social
Human capital
Susana Elvira, Chief People Officer
People function
Diversity, equity and inclusion
Susana Elvira
People function
Human rights
Caroline Pontoppidan, Chief
Corporate Affairs Officer
Sustainability
Employee relations and rights
Susana Elvira
People function
Safety and security
Rabab Boulos
Safety and resilience
Business ethics
Caroline Pontoppidan Compliance
Sustainable procurement
Rabab Boulos Asset strategy
Responsible tax
Patrick Jany, Chief Financial Officer
Tax
Citizenship
Caroline Pontoppidan Sustainability
Data ethics
Navneet Kapoor, Chief Technology and Information Officer
Technology
These updates, as well as deep dives into strategic ESG categories and regulatory developments are overseen at the quarterly meetings of the RCC and subsequently, if relevant, discussed with the full ELT.
On an operational level, cross-functional steering committees and working groups facilitate coordination, ensuring that relevant functional and business areas are included in strategic decisions and supporting implementation across business areas.
ESG integration in governance and risk frameworks
In addition to the dedicated ESG governance model outlined above, ESG topics are also integrated into other internal governance processes, including Commit, Maersk’s governance framework (see box on the right).
Maersk’s Employee Code of Conduct and Supplier Code of Conduct outline the standards for our employees and our suppliers.
ESG is integrated into Commit through the Code of Conduct and specific Commit rules in relation to health, safety, security and environment (HSSE), global employee relations, anti-corruption, sustainable procurement as well as data privacy and data ethics. Each rule has a designated owner in the organisation who is responsible for compliance. Progress oversight on implementation and compliance is performed on an ongoing basis through impact and risk assessment such as selfassessment performed for the Global Employee Relations Rule, compliance checks for the Anti-corruption Rule and site inspections for the HSSE Rule. Executive oversight of compliance with Commit is managed through the annual internal assurance process, anchored with the RCC.
In addition, the ERM process also incorporates ESG-related risks as part of the annual risk assessment covering the entire business and overseen by the RCC and the Audit Committee.
Managing inorganic changes to the organisation
Acquisitions are important to Maersk’s integrated logistics strategy, especially as we look to add capacity and expertise in areas like project logistics and e-commerce to our global portfolio and local coverage. Although we did not make any acquisitions in 2024, ESG considerations remained an active part of our due diligence processes in evaluating potential opportunities during the year.
To ensure that all inorganic growth targets are aligned with our ESG strategy and commitments, we continue strengthening due diligence processes by incorporating ESG risk assessments more systematically into our mergers and acquisitions (M&A) process. We regularly engage with and perform specific trainings for the M&A teams with a view to further embed ESG priorities and climate change impact assessments into the due diligence and investment decision processes.
In 2024, Maersk completed the demerger of Svitzer. In alignment with our accounting policies, ESG data from Svitzer for 2024 is included until the date of demerger.
The three core elements of Commit
Maersk’s internal governance framework
Our Commit governance framework sets the foundation for how we work in Maersk to ensure compliance with relevant laws, regulations and responsible business conduct, as well as having adequate risk mitigation. The framework is structured around three core elements:
Our guiding Core Values have been shaped and strengthened since our foundation in 1904. These were updated in 2022 to ensure that they are consistently interpreted, easy to apply and have a strong connection to our Purpose. Read more on Maersk.com.
Our Code of Conduct sets global standards for how we engage with colleagues, customers, suppliers, communities, authorities and other stakeholders. The Code of Conduct was updated in 2022 to align with our Purpose and ESG strategy.
21 rules of business ethics, governance and authority are included in the governance framework, providing detailed internal instructions for all employees covering high-risk areas. These are subject to internal controls and an annual internal assurance process.
Double materiality assessment
A.P. Moller - Maersk (Maersk)’s ESG strategy and reporting is grounded in a double materiality assessment (DMA) aligned with the ESRS requirements.
topics are unfolded in the Environmental, Social and Governance sections of this report. This includes 29 individual IROs. Climate change remains a key material category to Maersk from an impact and financial perspective. We have identified two major climate-related risks: transitional and physical. Climate transition risk has been part of our enterprise risks for several years. For the assessment physical impact of climate change to our assets, our double materiality assessment has been informed by an in-depth assessment of the physical impact of climate change to our assets across multiple time horizons.
In 2024, we updated our corporate-level DMA. The assessment is approved by the ELT sponsors and endorsed by the Audit Committee. In the coming years, we will continue working towards further maturing and refining our assessment in line with best practices and new guidance across our ESG topics.
The impacts, risks and opportunities (IROs) identified as material to Maersk’s operations and value chain have been mapped against the disclosure requirements listed in the topical European Sustainability Reporting Standards (ESRS) to identify material information for 2024 reporting. For material IROs already covered by a topical standard, we disclose information listed in the ESRS. For additional entity-specific topics, we have applied the minimum disclosure requirements as a foundation for reporting on policies, actions, targets and metrics. For the index of information covered by this sustainability statement, see pages 57-59.
Maersk’s material topics
The updated DMA assessment has not led to any significant change to our overall ESG categories but did result in changes to the material topics that are part of the ESG categories. For example, where we have previously been tracking and externally reporting on water use in our operations, the more in-depth assessment performed in the DMA showed that water use is important but not material to Maersk. Our material ESG topics comprise further sub-topics driven by the impacts, risks and opportunities identified. The IROs under each of the
For environment and ecosystems, in 2024 we conducted an assessment of nature-related issues using the Taskforce on Nature-related Financial Disclosures (TNFD) LEAP assessment approach, resulting in a number of changes from our 2023 assessment including a more granular overview of IROs across our operation and value chain (read more on page 77). Based on the LEAP assessment, we have identified IROs related to five material sub-topics: pollution, ecosystem health and biodiversity, waste management, responsible ship recycling and the sourcing of critical resources.
Environmental topics that are financially material to Maersk are mainly driven by a risk of non-compliance to environmental regulations or related to remediation costs towards environmental incidents. Costs related to such environmental incidents are disclosed in the Environment performance data section.
For social topics, the assessment has confirmed that human capital, diversity, equity and inclusion, employee relations and labour rights and safety and security are material categories to Maersk. Most material topics under these categories are material from an impact perspective, however, remediation costs and reputational damage is assessed as also being a material risk to Maersk. Additionally, attraction and retention of critical talents have been deemed financially material as a key enabler to delivering on our business strategy.
While human rights are included as a category in our ESG strategy, they are not called out as standalone IROs in the DMA. This is because human rights issues are integrated across the existing environmental, social and governance topics. The same is the case for impact to affected communities, where impacts on people in local communities can occur across our operations and activities. As an example,
greenhouse gases can impact people’s livelihood and wellbeing, and corruption can exacerbate inequalities in societies where we operate. On governance, the assessment also reconfirmed our existing categories on business ethics, sustainable procurement, data and AI ethics and responsible tax. The last two categories are not currently covered by the topical ESRS and are therefore entity-specific. Of the material topics, several risks related to costs of non-compliance to regulations have been deemed material to Maersk, including related to corruption laws, sanctions and transportation of illegal goods. In addition, risks related to data and AI ethics and supplier non-compliance have been assessed as material to our overall strategy.
Of the material risks, none are expected to cause material adjustments to carrying amounts of liabilities reported in the financial statements in the next annual reporting period.
Recognising our global presence and the nature of our business as an integrator of global supply chains, this is not an exhaustive list, however, it shows where Maersk may have the largest impacts on people and planet through our activities, or where Maersk is exposed to the most significant financial risks or opportunities. Many of the topics below the threshold for external reporting are still actively monitored and managed as part of internal processes. As an example, while water use was deemed below the materiality threshold and not covered by our sustainability statement, we continue to actively monitor and work to reduce consumption of water globally, particularly in water-stressed areas. The same is the case for impacts to communities in areas where we operate, where we continue to monitor potential negative impacts and regularly engage with communities as part of e.g. Environmental and Social Impact Assessments (ESIAs), and through local Corporate Social Responsibility (CSR) initiatives under our citizenship programme.
Environment Social Governance
Overview of our material categories and topics related to Environment
Overview of our material categories and topics related to Social
Overview of our material categories and topics related to Governance
Climate change Impact
Climate change mitigation
Climate change adaption
Environment and ecosystems
Pollution
Ecosystem health and biodiversity
Waste management
Responsible ship recycling
Sourcing of critical resources
Human capital Impact
Attracting and retaining critical talent
Diversity, equity and inclusion
Harassment of vulnerable groups
Discrimination in the workforce
Safety and security
Safety of our workforce
Exposure to global/local security risks
Employee relations and labour rights
Forced labour
Working hours and adequate wages
Adequate housing and sanitation
Business ethics Impact
Legal and regulatory compliance
Grievance and remedy
Sustainable procurement
Supplier relationship management
Payment practices
Data and AI ethics
Ethical use of data and AI
Responsible tax
Tax governance
Double materiality assessment methodology
Value chain mapping
As part of the DMA, we assessed material impacts across all operations and the value chain. Outlined in our integrator strategy, Maersk’s business model spans activities within ocean transportation, terminals and logistics and services to connect and simplify customers’ supply chains. In our upstream value chain, shipyards, fuel suppliers and equipment manufacturers, commercial partners such as freight forwarders and third-party logistics providers, as well as manning agencies provide essential resources and add extended workforce for our operations. Our downstream value chain includes entities and stakeholders involved in ensuring the final delivery of goods and services to end customers, including retailers and manufacturers, freight forwarders and thirdparty logistics providers, customs and regulatory authorities and port operators, terminals and distribution providers not owned by Maersk. The assessment also extends to the communities that we impact through our operations and workers who are part of our value chain, including our suppliers’ workforces, who are not part of Maersk’s own or contracted workforce, and workers of joint ventures and associates. To assess impacts in our value chain where visibility and data is limited, we use industry-specific analysis, articles, scientific research and shared knowledge from stakeholders etc., as input to identify high risk areas or operations and vulnerable groups.
No IROs were identified for consumers and end-users due to our business model of providing logistics services to customers (business to business) who are not consumers/end-users as defined in the ESRS.
Time horizons
In the assessment of IROs, we apply the time horizons as per ESRS 1 –short-term being the reporting year and medium-term covering 1-5 years. We have also identified long-term emerging impacts and risks (beyond 5 years). For emerging risks please see Risk management on page 24 In addition, we have identified emerging impacts such as the increased use of water needed for production of biofuels in our value chain. None of the emerging impacts or risks were deemed material as of this assessment. Acknowledging that materiality is a dynamic process,
these emerging impacts or risks are being monitored and tracked as the landscape evolves. Thus, the list of material IROs outlined in the topical sections encompass impacts and risks assessed to have an impact already in the short or medium term. Some of these, such as physical risks of climate change, are also material in the longer term, but since impacts are already apparent, these have been included as either short or medium term IROs.
Identification and assessment of material impacts
To assess impact materiality of ESG topics, a specific scoring sheet has been developed and validated by internal subject-matter experts for each of the 10 topical standards in the ESRS. The scoring of impacts is performed for each identified impact and across our value chain, taking into consideration particular stakeholder groups, areas or operations at higher risk of negative impact, informed by our human rights impact assessment. For example, scoring of social impacts has been performed separately for own employees, non-employee workers and workers in the value chain to best capture impact occurrence for different affected stakeholders in our operations and value chain. Where available, the scoring utilises existing methodologies and assessments such as Maersk’s most recent human rights impact assessments and relevant internal management systems. For environmental impacts, the DMA is informed by a LEAP assessment performed in 2024. As part of this assessment, we identified impacts and dependencies across our business activities, using various databases and scientific studies. Read more on pages 101-102.
Severity (based on scale, scope and the irremediable character) is assessed for each IRO using a scale of 1 to 5. For topics where Maersk has potential impacts, the likelihood of such impacts is also assessed with severity and likelihood each being assigned a 50/50 weighting. For human rights-related topics, severity has an assigned higher weighting (75%) compared to likelihood (25%) when determining impact materiality. A threshold of 3 (out of 5) is applied to capture areas where Maersk has a very significant or critical impact to the environment or people, above which the topic is included in our external reporting.
Identification and assessment of material risks and opportunities
As part of the DMA, we also assess potential sustainability-related risks that can trigger negative financial or reputational impacts to
our business. This includes a consideration of whether the identified impacts and dependencies can also trigger financial risks to Maersk, e.g. reputational damage from impacts on people, or risks from dependencies on access to environmental or human resources. For climate-related risks, we have assessed our current and future climate-related exposure of assets across different time horizons and climate scenarios. Read more on page 88
The assessment of risks to Maersk is aligned with our ERM framework and is based on an assessment of magnitude (financial and/or reputational costs) and likelihood. This year, we continued the work initiated in 2023 to quantify ESG risks using scenario-based modelling, where feasible. This includes modelling of both inherent and residual risks, where the inherent risk scores are used as part of the DMA. Application of scenario-based modelling has allowed us to understand the financial risk profile in different scenarios under different assumptions. The risk scores have been assigned based on the scenario, which results in the highest monetary impact. Work to quantify ESG risks will continue as we mature and obtain more solid data as a foundation for the assessment. In addition, we will work towards including modelling of financial opportunities as part of this process going forward. A quantitative threshold has been set to capture and report on the risks and opportunities with the highest monetary risk exposure. This threshold is lower than that of our ERM process to capture a broader range of potential ESG-related risks to our business.
Engaging with key external stakeholders
The assessment considers the perspectives of key internal and external stakeholders, as well as external experts on for example climate, nature, governance and human rights. This year, we mapped our external stakeholders considering both affected stakeholders and those who are users of the information we publish. Through various engagement channels, we continuously collect valuable insights on topics that are important to stakeholders, which inform our assessment of material impacts and risks and underpin the development of solutions and initiatives in delivering on our ESG commitments and KPIs. During 2025, we will work towards further strengthening our processes for documenting and incorporating external stakeholder perspectives into the double materiality process to ensure that stakeholder perspectives are continuously reflected in our ESG priorities. Read more on pages 70-74.
Approach to due diligence
Increasing regulatory requirements are broadening the scope of corporate responsibility, extending beyond a company’s own operations to include due diligence and greater transparency across the value chain.
The increasing complexity of regulatory requirements is challenging for many companies with global supply chains, and it will be a journey for A.P. Moller - Maersk (Maersk) to further mature our own processes over the coming years to ensure that human rights and environmental considerations are fully integrated into our due diligence processes and ESG governance mechanisms. We also recognise the opportunities of further embedding due diligence and transparency to support customers across their logistics supply chains and strengthening stakeholders’ trust in our brand.
To continue navigating increased expectations, we support regulatory measures that strengthen requirements for responsible business conduct and contribute to a level playing field globally.
Due diligence in Maersk is integrated into multiple internal processes and programmes to identify, prevent and mitigate negative impacts arising from our operations and value chain. Examples of our human rights and environmental due diligence processes include our supplier management approach, mergers and acquisitions (M&A) processes and requirements embedded in the Commit governance framework.
Our long-standing human rights due diligence approach is founded in our Purpose and Core Values and based on the UN Guiding Principles on Business and Human Rights, which serve as a north star in navigating global trade’s often complex impacts on people. Human rights impacts may occur in different business areas, and we take a risk-based approach to our activities and work to strengthen key due diligence processes that allow us to identify and act upon actual and potential human rights risks for rightsholders. Please see the illustration for more information on specific parts of our processes related to due diligence.
5
Communicate how impacts are addressed
We communicate progress across ESG categories as part of the Annual Report, on our website, and through participation in selected ESG ratings.
1
Embed responsible business conduct in operations
Our guiding documents - the Employee Code of Conduct and Supplier Code of Conduct, outline our Core Values and policies. See ESG governance
2
Identify and assess adverse impacts
Material impacts are identified through the DMA, informed by, e.g. our corporate human rights assessment, and engagement with external stakeholders. See double materiality assessment
See stakeholder engagement 6
Providing for remediation when appropriate
We are committed to ensuring our stakeholders have access to grievance and remedy. Access to remedy is a salient human rights issue and focus area for Maersk. See grievance and remedy
4
Track implementation and results
Across ESG categories, we measure progress and track performance against our strategic targets. See relevant ESG chapters
Internally, we track progress as part of e.g. quarterly ESG updates to the Executive Leadership Team, and annual compliance assessment for Commit rules. See ESG governance
3
Cease, prevent or mitigate impact
Material impacts are managed through our ESG categories, and through various cross-topical processes and programmes such as supplier management, the Commit governance framework, and M&A processes.
See relevant ESG chapters
See ESG governance
Stakeholder engagement
Engagement with key stakeholders provides valuable insights into their perspectives, both from those who might be directly impacted by our activities and those who are users of the information that A.P. Moller - Maersk (Maersk) publishes.
Key external stakeholders and how we engage with them
Stakeholder expectations of Maersk Key engagement channels
How stakeholder input is used
Stakeholder engagement supports us in identifying existing or emerging impacts or risks as part of the double materiality assessment (DMA). Their insights provide valuable input to our ESG programmes, helping us to shape our strategy, targets and decisions towards delivering on ESG commitments and KPIs.
The table on the right shows seven prioritised stakeholder groups. Colleagues and teams across Maersk regularly engage with stakeholder groups through various channels, gathering valuable insights on topics that are important to them. Stakeholder engagement with key external stakeholders such as own workforce and value chain workers is anchored with the relevant business functions across Maersk, depending on the stakeholder group or topic: labour-rights focused engagement is anchored with the Employee Relations and Labour Rights team headed by the Chief People Officer, whereas engagement related to safety is anchored with the Safety and Resilience team headed by the Chief Operating Officer. Management receives regular updates on topics raised by stakeholders and their perspectives. As an example, perspectives raised by e.g. investors and customers are presented to the Executive Leadership Team.
We proactively seek stakeholder opinions through, for example, annual employee and supplier surveys, and with customers through a voice-of-customer process and our annual Strategic Customer Council, as well as dialogues with civil society organisations and unions to gain insights on key industry risks and impacts to workers and communities.
Employees, contingent workers and value chain workers
Meaningful work, fair treatment and wages, safe working conditions, a sense of belonging for all, and good development opportunities.
Customers Solutions that can ensure responsible business practices and lower supply chain emissions.
• Daily manager/colleague interactions
• Engagement and inclusion surveys
• Grievance mechanisms
• Engagement with unions and interest groups
• Supplier audits
• Regular business interactions and ongoing supplier assessment
• Strategic Customer Council and customer satisfaction surveys
• Partnerships and collective action alliances
Authorities, regulators and standard setters
Compliance with regulation and industry leadership on the transformation to net-zero.
Suppliers and business partners
Investors and analysts
Fair and transparent business opportunities and partnerships on strategic issues.
• Engagement with local, national and international agencies and authorities
• Standard-setter collaboration on topic-specific research, pilots and implementations
• Industry associations, collective action alliances and strategic partnerships
• Contract management
• Supplier relationship management framework
• Supplier surveys, workshops and capabilitybuilding programmes
• Industry forums and associations
Strategies, plans and actions to mitigate short and long-term risk to the business model.
• Regular engagement through e.g. earnings calls, conferences, events, roadshows and meetings, including the Annual General Meeting
• Investor surveys and ESG ratings
• Collective action alliances
Local communities and nature
Responsibility and accountability towards material issues in areas of highest impact.
Civil society organisations Responsibility and accountability towards material issues and positive contributions in areas of highest impact and leverage.
• Environmental and Social Impact Assessments, Corporate Social Responsibility initiatives
• Engagement with community representatives and employees
• Collective action alliances and partnerships
• Scientific studies
• Bilateral engagement with local, national and international agencies
• Collective action alliances
Provide valuable input to ESG programmes and shape actions and improvement plans to address any issues.
Informs product development and shapes solutions. Customer feedback on providing greater value is directly linked to our integrator strategy.
Ensure we adhere to regulations. Help us identify opportunities for collaboration and initiatives across the ESG agenda and to push for regulations towards industry-wide decarbonisation.
Build understanding of the effectiveness of supplier practices and engagement. Enhance value chain visibility, including fair working conditions and supplier ethical business conduct.
Helps us understand how the company is perceived in comparison to other investment opportunities. ESG ratings additionally help identify gaps in ESG management and emerging trends.
Local communities help us better understand the needs and constraints of nature where we operate, informing decisions to invest and procure resources and to mitigate negative impacts in operations and the value chain.
Access to valuable insights, expertise and best practices which help us identify potential risks or opportunities and shape ambitions and actions.
ESG ratings are also a source of stakeholder expectation insights, and our submissions are valued by customers and investors. We prioritise those that are most material to our stakeholders and align with our priorities, including EcoVadis, CDP, MSCI and Sustainalytics. We actively use these questionnaires to identify gaps in current processes or ambitions and thus inform action plans across ESG topics.
We proactively engage in cross-industry partnerships and coalitions to set standards, develop solutions and drive common agendas across the ESG agenda such as the UN Global Compact, Smart Freight Centre, SteelZero initiative, the World Business Council for Sustainable Development, and the Zero Emission Port Alliance. Such proactive engagement is core to our ESG strategy, and in recent years we have seen significant growth in engagement requests.
We welcome perspectives raised by stakeholders, and have regular dialogues on topics raised by customers, civil society organisations and investors, etc. These perspectives provide valuable insight into how our ambitions and decisions are received, and enable us to engage in constructive dialogue with our stakeholders.
During 2024, we worked to strengthen the format for directly collecting and incorporating external stakeholder perspectives into the double materiality process, ensuring that these perspectives are continuously reflected in our ESG priorities. This work began with an in-depth mapping of the current approach to engagement, to assess whether it effectively captures our stakeholders’ perspectives. Based on this mapping, we identified a need for a more structured approach to the collection and documentation of the input received from our stakeholders, ensuring that we leverage existing channels to raise the right questions and document the inputs received.
We regularly perform more targeted engagement towards specific groups or on specific topics. For example, we conducted an Inclusion Survey in 2024 to gain perspectives from vulnerable or underrepresented groups in our workforce on potential negative impacts related to diversity, equity and inclusion. In 2025, we will continue this work with the aim of conducting more in-depth engagements on specific ESG topics to help shape future ambitions. In 2024, we also held highlevel talks with the International Transport Workers’ Federation, to discuss collaboration opportunities for 2025, focused on contracted labour. The collaboration will focus on two key topics: future of work and diversity, equity and inclusion.
Engagement with local communities
Our operations can impact people in local communities and their natural surroundings, highlighting a responsibility to proactively engage with communities or their representatives. This engagement is crucial as a license to operate and to understand the needs and conditions in the areas, informing decisions to invest and make meaningful contributions to the societies where we operate.
As part of new infrastructure projects, landside projects are reviewed under the Environmental and Social Impact Assessment (ESIA) screening process to understand the environmental and social sensitivities of new projects and existing operations. The ESIA process is based on legal requirements and international standards around conducting such assessments. It provides location-specific context on environmental and social impacts and is the first step towards managing the impacts of our operations and growth projects. For each ESIA screening, the scope of the project is reviewed against ten environmental criteria using global and regional data sources. Local and indigenous knowledge, as well as nature-based solutions and restoration initiatives, have yet to be widely incorporated into broader commitments and actions addressing biodiversity and ecosystems. Currently, they are confined to specific local projects. For example, APM Terminals supports a local conservation initiative in the Monarch Butterfly Biosphere Reserve in Mexico, where scientists observed a significant decrease in the eastern migratory populations in 2024, as habitat loss remains a significant threat. Local and indigenous knowledge is essential for this project as it provides practical insights into local ecosystems and effective conservation methods used by local communities.
Political engagement and responsible lobbying
Maersk is actively involved in shaping policy and regulatory discussions at both global and regional levels to accelerate the decarbonisation of the maritime and logistics industries. Decarbonising our operations is a core ESG commitment and to achieve our targets, we are dependent on the implementation of supporting regulation. We work actively with
political engagement and lobbying as opportunities to support our climate ambitions and to positively impact the industry’s transition to net-zero.
Maersk’s climate policy outreach is conducted in line with the goals of the Paris Agreement. At the International Maritime Organization (IMO) level, Maersk is actively working for the adoption of ambitious, proportional and enforceable mid-term measures, including a greenhouse gas (GHG) price and a global fuel standard or a combination hereof. Moreover, Maersk calls for any IMO measure to take into consideration just and equitable transition and secure that the collection of revenue benefits developing nations in their energy transition.
2025 marks a crucial milestone for the IMO, as a global carbon pricing mechanism and a global fuel standard are expected to be approved. These initiatives are essential for closing the cost gap between fossil and green fuels, to drive the shipping industry’s energy transition and to align with Maersk’s broader goal of achieving netzero emissions by 2040.
Maersk actively participated in key global meetings during the year, including for example the New York Climate Week and COP29, emphasising the need for stronger global commitments to maritime decarbonisation. Maersk’s CEO, Vincent Clerc, was one of over 100 CEOs and senior executives to call on world leaders ahead of COP29 to enact policies that support the scaling-up of green fuel production and renewable energy infrastructure, while ensuring a just and equitable transition.
At the EU level, Maersk has called for the full implementation of the ‘Fit for 55’ legislative package, which includes the EU Emissions Trading System (ETS) and the FuelEU Maritime Regulation. Maersk has pushed for the inclusion of container terminals in the ETS and advocated for an end-date for fossil fuel-only newbuild vessels. These measures aim to bridge the cost gap between green and fossil fuels and accelerate the energy transition across the shipping sector.
On landside transportation, Maersk is working for robust EU regulation to promote electrification of road transportation.
Maersk adheres to policies and procedures to ensure responsible lobbying. The company is part of the EU Transparency Register (registration number 680443918500-51), in relation to policies on climate, tax, customs, competition, trade, company law and corporate governance and general industry-related policies.
“We have bold, ambitious targets for decarbonising our value chain and know that we can’t do it alone. We need the right partners to help us get there. Maersk shares Nike’s commitment to building a responsible supply chain and recognises the importance of long-term partnerships for driving scale and true global impact.”
Venkatesh Alagirisamy Chief Supply Chain Officer, NIKE
Engaging with customers
Customers are at the centre of our business and ESG strategy, and we actively collaborate with them also on sustainability and ESG issues to shape solutions, enhance our practices and achieve shared goals. The core focus of our engagement with customers relates to decarbonisation. Adapting our solutions to meet the unique decarbonisation needs of different customer segments is key to our customer engagement. For example, customer feedback has led to the development of a blended green and fossil fuel product in ECO Delivery Ocean, through the use of different levels of lower-emission and fossil fuel-based fuels, to meet different customer needs and price sensitivities while still supporting decarbonisation.
We perform risk-based management integrity screenings of thirdparties who interact with government officials on Maersk’s behalf or procure business for Maersk. Additionally, hiring managers may not offer employment, directorships or internships to anyone employed or formerly employed (in the last three years) by the government or being a close relative to such a person without approval from Compliance. This is outlined in our Commit Business Ethics Rule.
In general, Maersk does not provide any financial or in-kind donations to politicians, regulators or political parties. In Denmark, Maersk is a member of large trade associations such as Danish Shipping and Danish Industry, which may allocate political contributions on behalf of their member organisations and sectors. These contributions are determined and distributed directly by the associations. In the US, Maersk has established a Political Action Committee (PAC) where donations are voluntary contributions made by individuals, corporations or unions to support candidates, parties or issues, and are subject to strict limits and reporting requirements to ensure full compliance with federal and state regulations. In 2024, the amount donated through the PAC was USD 15k, and no other financial or in-kind political donations were provided by Maersk.
Across many segments, customers have an appetite for logistics partners that are at least as ambitious on decarbonisation as themselves and offer credible solutions to make those ambitions a reality. As an example, Primark ships most of its products by ocean, and through our partnership, Maersk is now moving some of Primark’s ocean cargo on lower-emission fuels such as biodiesel and biomethanol. In addition, the first large dual-fuel methanol vessels joined our fleet in 2024, and our customers Nissan, Vestas, Nike and Primark joined us as godparents for vessel-naming events, emphasising the importance of partnerships.
Customers’ demand for end-to-end decarbonised logistics has prompted Maersk to develop more inland solutions, including electric trucks and rail options in multiple countries. For example, in the US, Maersk is collaborating with Microsoft and Pepsi, the Smart Freight Centre and other partners to launch a shipper-carrier coalition to accelerate heavy-duty EV deployment, including a long-haul EV testing corridor between California and Texas.
The majority of logistics GHG emissions in some industries (i.e. automotive and chemical companies) come from ocean transportation, whereas others have emission hotspots from their air and inland logistics, i.e. fashion, consumer goods and tech companies. Nevertheless, we see a trend of fashion and fast-moving consumer goods leading the engagement of ocean decarbonisation, highlighting their maturity in this field. These segments are closer to end consumers, and their logistics are more visible and therefore more attractive to decarbonise.
Cutting air freight GHG emissions is one of the most challenging tasks in decarbonising logistics. Air freight is also a vital and integrated part of many automotive, technology and lifestyle supply chains. Customers in these segments have partnered with us on ECO Delivery Air, using sustainable aviation fuel to reduce emissions for their air freight shipments.
Like Maersk, many customers are looking at emissions in their value chains and aim to incorporate ESG metrics as part of their procurement processes and science-based target setting. To support these needs, Maersk has developed an emissions dashboard solution.
Maersk’s annual Strategic Customer Council is a key engagement channel and platform for collaborating with our customers’ executive leadership, taking a joint problem-solving approach to decarbonisation at a systemic level, including joint lobbying towards IMO member states to balance the price gap of lower-emission and fossil fuels.
We see a positive trend in the maturity of our customers’ sustainability approach – moving from a transactional procurement activity, towards partnerships and collaboration with strategic suppliers. Customer dialogues in 2024 spanned across several topics of interest for future collaborations, including regulatory engagements, circularity, simplifying the complexity of decarbonisation data visibility and comparability, challenges to the execution of decarbonisation strategies and the overall resilience of supply chains.
Citizenship
Maersk’s corporate citizenship is rooted in meaningful engagement with our partners and communities, and aligned with our Purpose, Core Values and stakeholder expectations. We assume an active responsibility to support the societies where we operate by partnering with local communities, non-profit organisations and customers on social and environmental causes. Leveraging our global reach, expertise and resources, we aim to co-deliver impactful solutions and achieve shared goals effectively.
Donations and social investments
Maersk supports select stakeholder initiatives through donations and investments in social and environmental well-being, guided by corporate guidelines. Our in-kind and financial support aims to address
critical needs connected to five priority causes: disaster relief and preparedness, empowering people to trade, protecting the natural environment and oceans, education and health and safety.
Maersk collaborated with a diverse range of organisations in 2024, supporting local initiatives in over 30 countries. Our efforts are designed to create sustainable and positive change, enhancing community well-being and contributing to better futures.
2024 was marked by record flooding across many regions. During the year, Maersk supported flood relief efforts in Vietnam, Guatemala, Brazil, Kenya and the US through a mix of delivering water and relief supplies, and by donating essential supplies and relief item storage containers. Our support of education and training programmes in 2024 included improving educational infrastructure and supporting skills development and capacity-building activities, from providing technical learning scholarships in Peru to a container library project in Vietnam.
Corporate partnerships
Maersk engages in strategic partnerships that demonstrate effective multi-stakeholder cooperation between the private and public sectors. These leverage our expertise and resources to address global challenges connected to our industry, but also enhance our knowledge, capabilities and stakeholder relationships. Partnerships further support our prioritised causes of disaster response and trade empowerment. Maersk is a member of the United Nations-led Logistics Emergency Teams (LET) along with logistics peers, who join forces to provide pro bono support and consultation services during humanitarian crises and natural disasters. Working under UN auspices and in collaboration with other key stakeholders allows us to put our experience, network and assets to the best use and reach those in need in a coordinated and efficient way. In 2024, the LET actively coordinated regional aid and relief efforts in response to the ongoing conflict and resulting humanitarian emergency in Gaza. Maersk established a 5,000 m² logistics hub in Amman, Jordan, which serves as a consolidation centre to assist over 50 UN partner and humanitarian NGOs and governments delivering cargo to Gaza. This in-kind donation is ongoing and will extend through 2025. Since 2018, Maersk has partnered with the International Trade Centre’s SheTrades initiative to advance women’s economic empowerment through trade. This year’s collaboration focused on fostering sustainable and inclusive trade practices and advocating for public-private
partnerships to promote gender inclusivity. For example, Maersk participated in a panel at a World Trade Organization - International Trade Centre event aimed at inspiring governments and the private sector to take bolder actions in supporting women’s economic empowerment, particularly around issues impacting the supply chains of women-led businesses in developing countries. We also took part in a webinar series to support women- and youth-led micro, small, and mediumsized enterprises (MSMEs) in building resilient supply chains. This involved sharing knowledge on sustainable business practices, including human rights considerations and managing increasingly complex ESG due diligence and trade.
Engaging our own workforce
Our annual internal Go Green campaign was maintained in 2024. It aims to engage colleagues on environmental stewardship topics, raise awareness and create a platform for collective action across Maersk and with the communities where we operate. This year’s theme, ‘Nothing goes to waste’, focused on waste management best practices and how they tie into our ESG goals. Employees in over 35 locations participated in local learning events on waste, recycling and other sustainability topics, and a number of local on- and off-site volunteer events took place including trash clean-ups and recycling competitions.
Grievance and remedy
Maersk fosters a ‘speak up’ up culture where anyone is encouraged to voice concerns. This is enshrined in our Code of Conduct along with a zero-tolerance, non-retaliation policy. Multiple channels are available for employees and other stakeholders to raise concerns. As a key process anchored in the Commit framework, the whistleblower programme has been available for decades and aims to create a safe and secure environment for anyone to speak up and report violations without fear of retaliation. Whistleblower reporting is independently managed on a third-party platform, and complete confidentiality is maintained along with the option of anonymous reporting. This is supported by effective investigations led by independent, objective and impartial investigators and by ensuring appropriate follow-up action to address violations and implement controls to avoid repetition of undesirable behaviour.
The investigators follow a standard investigation procedure, outlined in our misconduct reports and investigation process. This includes complying with local laws and data privacy considerations.
Considering the global nature of our business, the whistleblower site is accessible in all countries where Maersk operates, and phone lines are available in 75 languages. The channel is publicly available on Maersk.com and integral in both our Employee Code of Conduct and Supplier Code of Conduct. It is open to everyone, including employees, suppliers and other external affected stakeholders.
In addition to the whistleblower channel, other internal channels are available for our employees to ask questions or raise concerns – such as direct management or leaders, our Compliance, People or Ombuds functions and an employee assistance programme.
Maersk’s internal Ombuds function acts as a neutral, independent, informal and confidential function providing another voice for employees who do not feel comfortable with other channels. The Ombuds function offers a voluntary safe place for employees to seek guidance, voice concerns or discuss options for any work-related matter.
Speaking up
We actively monitor the number of cases raised across stakeholder groups, including from our workforce, workers in the value chain, affected communities and consumers as this gives us an indication of the level of awareness and trust of our whistleblower channel and the strength of our speak up culture. In addition, our 2024 inclusion survey included questions around employees’ trust in the grievance mechanisms available. Several improvement areas were identified and are being addressed through initiatives by the Compliance function.
Periodic campaigns like Speak Up are carried out for all Maersk employees, and training projects are rolled out for investigators. Considering the distinct nature of our seafaring workforce, awareness programmes are ongoing as part of the larger cultural transformation for our crews and prevention of unique risks at sea. In 2024, the Speak Up campaign also focused on warehouse and terminal workers and covered 300 entities.
In 2024, Maersk saw a significant rise in whistleblower reports, receiving 1,387 cases – a 20% increase from the 1,154 cases in 2023. This surge reflects the success of our awareness initiatives and underscores the critical role of reporting in maintaining transparency and
accountability. By encouraging and facilitating whistleblower reports, we ensure that issues are promptly addressed, fostering a culture of integrity and trust within our organisation. 84% of the cases received in 2024 have been closed. In particular, we have seen an increase in cases related to HR-related matters. As part of this category, two cases of discrimination on protected grounds were substantiated and resulted in respectively disciplinary action and policy/process review, respectively. In 2024, we also started tracking human rights incidents which are inherently severe, including cases related to e.g. forced labour, human trafficking or child labour. No such cases were recorded for 2024.
Ensuring access to remedy
Maersk is committed to providing remedy in cases that have caused or contributed to an adverse negative impact, including related to human rights. We continue working towards strengthening processes for providing remedy to affected stakeholders, including our own workforce, workers in the value chain and affected communities. We collaborate with both judicial and non-judicial mechanisms to provide access to remedy if allegations are reported externally. Where Maersk is directly linked to impacts through our business relationships, we are committed to using our leverage to provide remedy. Issues raised are addressed and documented and feedback is shared with key stakeholders, including the annual submission of a comprehensive whistleblower report to the Audit Committee and the Risk and Compliance Committee. This includes key performance measures such as the number of cases reported, number of cases closed, type of cases, case outcome, actions taken and benchmark analysis. For own employees, Maersk ensures a 24-hour availability to the employee assistance programme which offers psychological, legal and financial support to employees.
Environment Social Governance
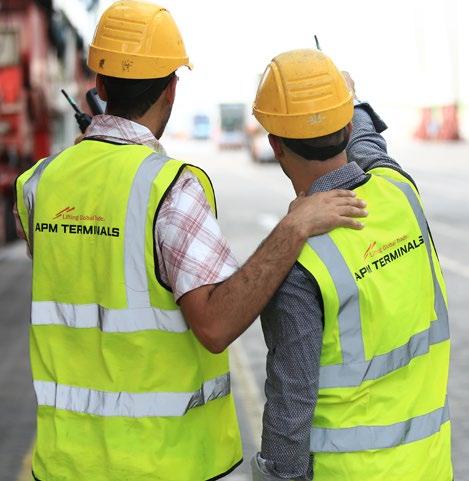
A.P. Moller - Maersk is taking a leading role in decarbonising logistics and in providing green solutions to assist our customers reach their climate goals.
A.P. Moller - Maersk strives to provide a safe and inspiring environment for our people to grow, develop and thrive as a diverse and global team.
At A.P. Moller - Maersk, high standards of responsible business practices are foundational for the services we deliver to customers and the value we create for the communities where we operate.
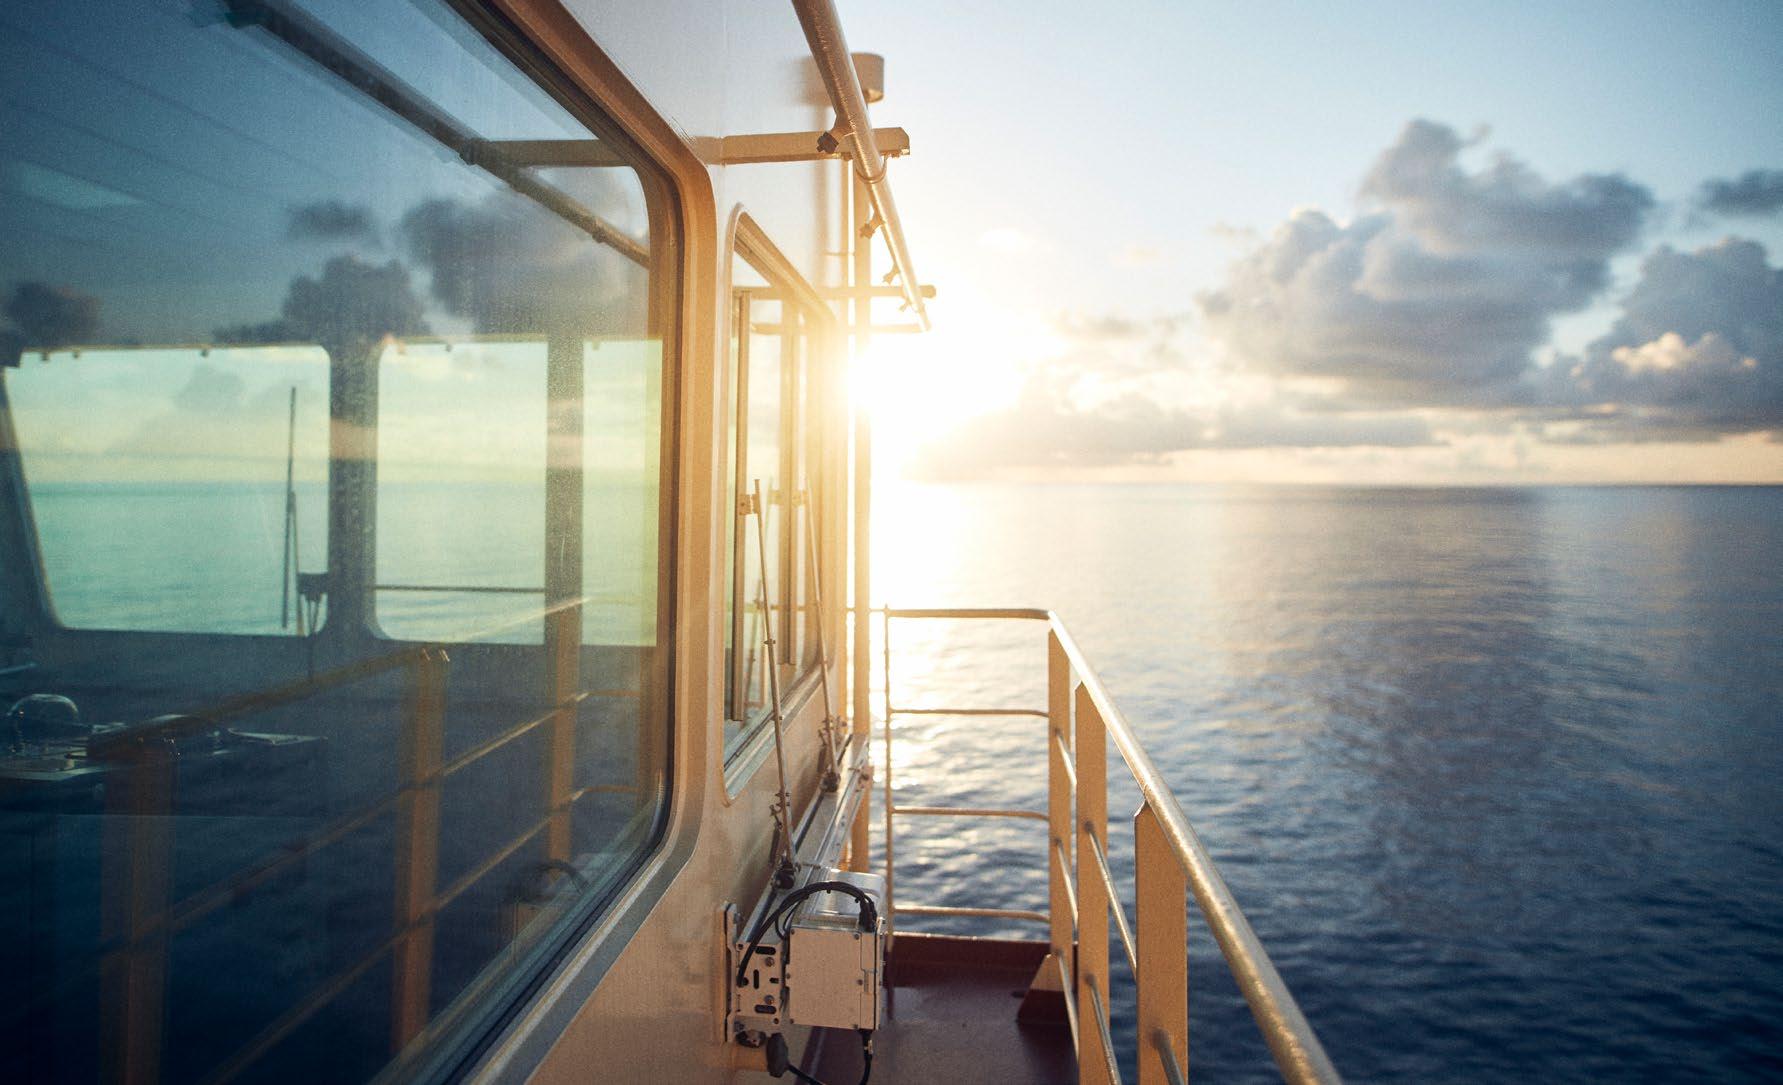
Environment
A.P. Moller - Maersk (Maersk) is taking a leading role in decarbonising logistics and in providing solutions to assist our customers reach their climate goals. Learn more about our progress, including newly validated science-based targets for 2030 and 2040, and how we minimise our impact on the natural environment.
CLIMATE CHANGE
Targets by 2030
• 35% absolute reduction in total scope 1 emissions
• 100% renewable electricity sourcing
• 22% absolute reduction in total scope 3 emissions
Net-zero targets by 2040
• 96% absolute reduction in total scope 1 and 2 emissions
• 90% absolute reduction in total scope 3 emissions
ENVIRONMENT AND ECOSYSTEMS
Ongoing ambition Maersk takes constant care to ensure our operations and value chain minimise and prevent impacts to the environment and to people, and we align our operations with local laws and regulations to ensure compliance with environmental requirements. Our overall objective is to do as little harm as possible while safeguarding the environment, including protecting the ecosystems and habitats where we operate.
Environment
Overview of our material impacts, risks and opportunities related to Environment.
Climate change adaptation
Financial risks due to physical impacts of climate change to assets and operations
Financial exposure of our assets towards climate-related physical risks/hazards and disruption of operations and networks.
Environment and ecosystems
Pollution
Air pollutants from vessels and landside/air transportation
Adverse impacts on air quality due to emissions of NOx, SOx, PM, BC, CO and NMVOCs, primarily from our vessels.
Climate change
Climate change mitigation
Greenhouse gases emitted from our operations, suppliers and business partners in the value chain
Our operations and value chain activities result in direct and indirect emissions of greenhouse gases (GHG) impacting the environment. Climate change caused by emission of GHGs may also have adverse negative impacts on people’s livelihoods and well-being and on nature/biodiversity.
Transition risks related to policies and market demand for decarbonisation of the shipping industry
Lack of political and market support for decarbonisation of the shipping industry present a reputational risk to Maersk of not being able to transition fast enough to meet our sciencebased targets.
Climate advocacy/lobbying for policy interventions on energy transition in shipping and logistics
Financial opportunity related to stricter and more ambitious regulation towards industry-wide decarbonisation and a just and equitable transition to support our decarbonisation commitments.
Pollution from hydrocarbon spills from vessels and landside operations and from containers lost at sea Adverse impacts to the environment and people related to hydrocarbon spills to the ocean, aquifers and soil from vessels and at our land-based facilities, and impacts from the loss of containers at sea, resulting in the release of pollutants into the ocean and accompanying costs for Maersk to clean up polluting materials.
Discharged wastewater to the sea
(e.g. scrubber, bilge, sewage and grey water)
Adverse impacts arising from the discharge of wastewater from vessels, including scrubber water, bilge water, cargo bilge water, wash water, grey water, treated and untreated sewage and boiler water.
Ecosystem health and biodiversity
Disturbance of species due to vessel traffic and underwater radiated noise
Vessel speed, underwater noise and disturbances from concentrated ship traffic can disrupt ecosystems and species, negatively affecting the development and reproduction of marine species. These impacts may lead to biodiversity loss and direct harm to species, such as whales.
Ecosystem degradation and biodiversity loss caused by land use and habitat disruption resulting from construction and operation of land-based assets
The construction and operations of warehouses and terminals can harm biodiversity and ecosystems, particularly when these are located in biodiversity-sensitive areas.
Spread of invasive species
Adverse impact of vessels transporting organisms (via biofouling) spread across large areas. The spread of invasive alien species can lead to the disruption of coastal ecosystems and contribute to the spread of disease.
Waste management
Waste generation during operations
Adverse impact related to waste generation and disposal from operations, particularly in locations with inadequate waste management infrastructure.
Responsible ship recycling
Environmental impacts during decommissioning of vessels
Adverse impacts related to breaking and recycling of own vessels, including waste generation and pollution as well as worker safety. Inability to recycle ships due to regulatory changes or increased number of vessels in the pipeline can also pose a financial risk to Maersk through increased cost of recycling.
Sourcing of critical resources
Environmental impacts resulting from the steel value chain
Actual and potential adverse impact from the procurement of non-recycled steel for production of containers and vessels. The impacts are related to pollution, water use, ecosystem degradation, disturbance of species and potential biodiversity loss.
Environmental impacts resulting from the fossil fuel and biofuel value chain
Actual and potential adverse impact from the procurement of fossil-based fuels and biofuels. The impacts are related to pollution, water use, ecosystem degradation, disturbance of species and potential biodiversity loss.

Climate change
In early 2024, A.P. Moller - Maersk (Maersk) reached an important milestone with validated science-based targets. A major focus this year has been on further refine the transition plan and driving the investments and actions needed to take us from where we are today to where we need to be in 2030 and 2040 to meet those targets.
Much like the preceding year, 2024 brought ample evidence that the world is facing a climate emergency, impacting not only the environment and broader nature, but also people’s health and economic prosperity. As an industry leader, we consider it our obligation to take decisive action to reach net-zero greenhouse gas (GHG) emissions across our operations, to the benefit of our customers and society at large, and to our shareholders and our business by mitigating transition risks. This is the core of our environmental commitment, ‘we will take leadership in the decarbonisation of logistics’.
2024 was a year marked by headwinds from externalities that had a significant impact on the entire transportation and logistics sector including Maersk and our ability to reduce GHG emissions during the year. We remain optimistic about our ability to decarbonise and the path ahead, but we are also realistic that we will face many hurdles along the way in meeting our science-based targets.
Commercial shipping attacks in the Red Sea and Gulf of Aden continued re-routing Asia-Europe trade around the Cape of Good Hope to ensure the safety of people, vessels and cargo. This led to longer voyages, capacity shortages and port congestion, all of which contributed to higher fuel consumption and GHG emissions.
In addition, the year’s overall geopolitical climate – including increased protectionism and election cycles in countries with high GHG emissions – created uncertainty and, in some cases, headwinds for climate action. Rising raw material costs, higher shipping expenses and increasing interest rates further challenged our customers’ decarbonisation action in 2024.
Regulatory debates also continue to impact our sector, as consensus and action on several topics critical to the energy transition remain elusive. While there has been promising regional progress such as Fuel EU Maritime starting in 2025 and the US Inflation Reduction Act, more ambitious and impactful policies are urgently needed at a global level, with the support of the International Maritime Organization (IMO) and its member states. 2025 is a pivotal year for IMO policy setting, and the outcomes of IMO Marine Environment Protection Committee meetings in April and October will have a significant impact on the decarbonisation progress of Maersk, our customers and the industry as a whole in the coming years.
In 2024, we made progress in the areas of our operations that to a greater extent are within our control, while focusing on stakeholder engagement and advocacy for areas with greater external dependencies. These are unfolded in detail in our transition plan.
Climate transition plan towards 2030
Climate transition plan
Maersk’s climate transition plan outlines the key levers and scenarios to reach our science-based commitments for 2030 taking into consideration key uncertainties and complexities. The plan encompasses GHG emissions from our own operations and value chain, covering our end-to-end logistics customer offerings across ocean, land and air. Our approach is focused on business integration and investments in levers where we have higher control, and stakeholder engagement and lobbying for levers more dependent on externalities, including regulatory progress and our customers’ willingness to buy, as well as local standards, technology and infrastructure.
Our transition plan, illustrated on the previous page, encompasses two fundamental decarbonisation drivers – efficiency measures and energy shifts. The first two levers relate to the energy efficiency of our network and assets, which combined represent our biggest reduction potential and areas where we have higher degree of control over actions needed to decarbonise. As we mature on our journey and enhance our assessments, we have seen that the efficiency of our network and assets can play a much more prominent role in meeting our near-term targets towards 2030. Our focus in the coming years will therefore include a higher emphasis on efficiency measures that can deliver tangible reductions towards our 2030 targets. Efficiency, however, will not in itself take us all the way to our net-zero greenhouse gas target, and fuel shifts will play an important role, in particular from 2030 to 2040. Looking beyond 2030, Maersk will continue to apply key levers related to efficiency measures and energy shifts to deliver our 2040 long-term targets. However, uncertainty remains in regard to e.g. further developments of international policies and standards, developments in the fuel market, and advancement of new technologies, all of which are key dependencies for Maersk to deliver on its long-term targets.
Network efficiency relates to Maersk’s Ocean network including the Gemini network, and asset efficiency includes our owned and timechartered vessels and our ongoing fleet renewal plan.
The three energy shift-related levers focus on the transition from fossil fuels to lower emissions energy solutions such as alternative marine fuels or electrified solutions.
Aligning our roadmap to the Science Based Targets initiative pathway
The Science Based Targets initiative (SBTi) is a widely adopted framework for setting corporate climate targets in line with the 2015 Paris Agreement’s pathway limiting global temperature rising to 1.5°C.
In 2024, Maersk announced the validation of our climate targets by the SBTi as the first in the shipping industry in alignment with a 1.5°C pathway for 2030 and the 2040 net-zero standard.
For the first time, we are this year reporting progress against these targets consisting of absolute reduction targets for scope 1, 2 and 3 emissions across Maersk, with required sub-targets for certain operations and GHG sources – in particular related to ocean activities as we follow the maritime sector framework. The sub-targets for maritime operations cover well-to-wake emissions, including emissions relating to the entire process from fuel production and delivery to the actual combustion onboard the vessels.
We continue to internally track and externally report on strategic KPIs on efficiency in our Ocean business and the commercial uptake of the ECO Delivery Ocean product, as these metrics are indicators towards our intended outcomes and closely tied to operational and financial planning.
The SBTi framework poses some challenges which Maersk is raising in external dialogues, including directly with the SBTi, in particular relating to accounting for growth and applying Book & Claim mechanisms.
The current methodology allows for recalculation of the baseline if a company grows as a result of acquisitions, but this is not allowed when growth happens organically as a result of growing market share.
Maersk’s view is that further nuances should be introduced in the treatment of organic growth in methodologies by distinguishing between increased market activity owing to market growth versus the capture of market share with no increase in market activity. This is because the capture of market share by a company will result in the decrease in market share for another if market activity is unchanged, leading to marginal effects on GHG emissions emitted into the atmosphere for the same activity depending on individual efficiencies of companies.
SBTi currently lacks recognition for Book and Claim/market-based mechanisms. In a rapidly evolving market with exponential demand for green fuels, we see a need to rapidly address the lack of guidance and consideration of such mechanisms. Regulatory frameworks already use this to operationalise fuel policy (e.g. the Renewable Fuel Standard in the US), and it is widely used and accepted in regulated and voluntary electricity markets, such as the EU, US and India. SBTi has started a call for evidence in 2023/2024 and we look forward to more clear guidance on this topic in 2025.
To meet our net-zero target by 2040, we plan to neutralise unabated emissions. According to our transition plan, we expect to have 6.2m tonnes of residual GHG emissions annually by 2040 that we will need to neutralise in accordance with SBTi Net-Zero criteria. The SBTi Corporate Net-Zero Standard is currently undergoing revision. While we await clearer guidance on beyond value chain mitigation and the neutralisation of residual emissions, we continue to evaluate opportunities for the use of carbon credits and Natural Climate Solutions (NCS).
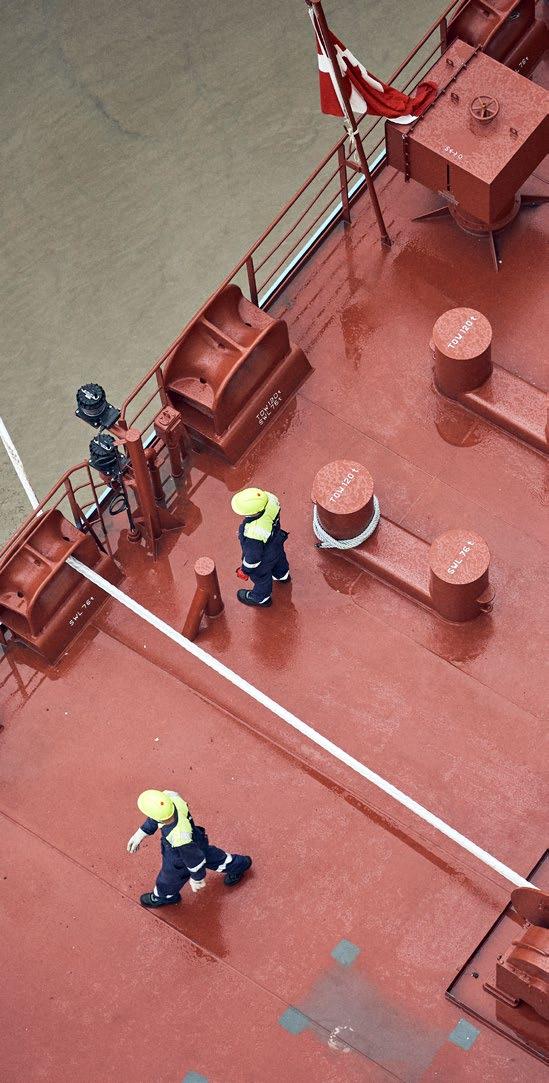
While electrification of owned assets has a relatively lower contribution to the transition plan, it is the core lever to reducing scope 1 emissions in our logistics and terminal operations, as well as scope 2 emissions when renewable electricity is available from local grids. In Logistics & Services and APM Terminals businesses, we have direct control over the electrification of sites and owned assets; however, we need to work across a fragmented landscape with different technologies, infrastructure, partners and policies that often require site or country-specific roadmaps.
The electrification of non-owned assets includes all of our landside transportation solutions, but in particular vehicles of third-party trucking partners. Our ability to decarbonise is highly dependent on the readiness of local grids to support increased electrification demand and their degree of renewable integration.
Lastly, the fuel shift lever has a prime focus on reducing scope 1 emissions from our vessels. The shift to alternative marine fuels like biodiesel, green methanol and biomethane is especially dependent on externalities which are currently slowing the scaling of infrastructure and capacity. Most notably, global regulations are needed through the IMO for green fuel standards, fossil fuel phase-out timelines and the implementation of effective mid-term measures to close the significant cost gap between fossil fuels and green fuels.
In 2025, the IMO aims to reach agreements on these topics. The outcomes of those decisions will significantly impact the industry,
Incorporating social impacts into the transition plan
Maersk’s transition plan is underpinned by policies and governance to address the social implications of our decarbonisation activities. These include, for example, the impact of electrification on our workforce, and the risks of adverse effects from green fuel market development on local communities. Our sustainability due diligence focuses on environmental and social impacts, including human rights and social safeguards, and Maersk has reserved rights for independent audits as part of offtake agreements during construction and production of methanol facilities.
our customers’ ability to pay for decarbonisation and the pace of the energy transition. Our transition plan considers three possible scenarios of ascending ambition, pessimistic, base case and optimistic, each with different implications for green fuel scaling and demand and therefore a corresponding need to adapt our transition plan.
The levers and the current actions supporting our progress are unfolded in the respective sections of this chapter, with greater details on our impacts, risks and opportunities.
Unallocated opportunities pertain to emission reduction measures that rely on consensus in international policies and standards such as SBTi for their successful implementation. Maersk endeavours to continue engaging with policymakers and standard setters in 2025 to unlock unallocated opportunities for our climate transition plan.
Embedding the transition plan into business strategy and financial planning
Reaching our climate ambitions is core to our ESG strategy and part of the annual business planning process. As such, the required capital and operational expenditures (CAPEX and OPEX) to pursue our climate targets and roadmap is allocated as part of the business strategy and financial planning for the relevant business segments, e.g. the financing of our new fleet of green methanol dual-fuel vessels, ongoing fleet renewal activities and investments in battery-electric container handling equipment. For more information about CAPEX and OPEX allocated to the transition plan, please see the respective sections on the decarbonisation levers.
Progress towards our strategic KPIs is reviewed quarterly by the Executive Leadership Team (ELT) and the Board of Directors. Responsibility for the transition plan and execution resides with the Chief Operating Officer as outlined in our ESG governance model. The ELT and the Board of Directors are involved in discussions around current and upcoming key trends and market developments, progress against our science-based targets and the potential impact of different IMO agreement scenarios to further integrate our energy transition into business planning.
Since 2021, Maersk has had in place an internal shadow price of USD 75 per tonne of GHG for investment decisions. The price was determined in 2021 based on an analysis of the existing abatement costs and expectations towards future carbon taxes. This internal price is not
applied to actual emissions but is used for projections to ensure that future regulations and carbon costs are considered in all investment committee decisions.
Our Green Finance Framework is essential to ensuring that our transition plan is properly funded. The Framework allows Maersk to use a variety of financial instruments to fund projects that deliver positive impact to the environment and progress towards our targets. The Framework aligns closely with the EU Taxonomy, covering categories such as new build vessels, retrofitted vessels, warehouses, terminals and electrified equipment, and it includes both CAPEX and OPEX. Read more on the 2024 Green Finance Framework. In addition to supporting our transition and business plans, the Framework also builds investor trust through its alignment with recognised criteria by showing our commitment to sustainable investments.
EU Taxonomy reporting
The EU Taxonomy is a classification system for which economic activities can be considered environmentally sustainable. It is a cornerstone of the EU’s sustainable finance framework and an important market transparency tool, defining criteria for economic activities that are aligned with a trajectory of net-zero GHG emissions by 2050 and broader environmental goals beyond climate. Since 2021, Maersk has provided EU Taxonomy reporting, and from 2024, Maersk is required to disclose its EU Taxonomy reporting as part of CSRD reporting in relation to our climate transition plan. As a transport and logistics company, we are engaged in the activities under the EU Taxonomy that are listed on this page.
The full overview of the results of Maersk’s taxonomy screening for 2024, which can be found on pages 96-100, confirms that the company has a significant opportunity to substantially contribute towards climate change mitigation. Although taxonomy-aligned activities continue to increase, Maersk is still in the early stages of its journey to decarbonise the end-to-end value chain. We therefore, see a high share of eligible revenue, CAPEX and OPEX, but a significantly lower share of revenue, CAPEX and OPEX, related to taxonomyaligned activities. As aligned assets come into operation, we see a modest, gradual increase of taxonomy-aligned revenue and a continued, steady increase in the taxonomy-aligned CAPEX in line with our decarbonisation strategy and transition plan going forward.
Activities included in Maersk's EU Taxonomy reporting Revenue CAPEX OPEX
6.10 Sea and coastal freight water transport
Aligned revenue in the Ocean segment is related to 40 conventional vessels as well as our first eight dual-fuel vessels that meet the technical screening criteria. Aligned CAPEX relates to 1) capital expenses in relation to existing vessels; and 2) milestone payments for the ordered dual-fuel vessels incurred during the year. Aligned OPEX is the repair and maintenance expenditures in relation to aligned vessels incurred during the year.
6.12 Retrofitting of sea and coastal freight and passenger water transport
Aligned CAPEX represents efforts to improve our existing fleet with regards to efficiency and dual-fuel capabilities.
Logistics & Services
6.2 Freight rail transport
6.6 Freight transport services by road
6.19 Passenger and freight air transport
Freight transport by rail, road and air are anchored within Maersk’s Logistics & Services segment. Only freight done by electrified assets is considered aligned in relation to rail and road transport. Non-eligible activities within the Logistics & Services segment relate to supply chain management and e-commerce.
Terminals
6.16 Infrastructure enabling low-carbon water transport
Aligned revenue, CAPEX and OPEX in the Terminals segment represents efforts to decarbonise port infrastructure, supporting ocean-based transportation, and are linked to electrical equipment used to operate the terminals, including cranes, trucks and lifts, charging stations as well as onsite renewable electricity installations. Non-eligible activities relate to terminal concession rights and operational software.
Cross segments
7.7 Acquisition and ownership of buildings
7.6 Installation, maintenance and repair of renewable energy technologies
Aligned CAPEX represents investments into on-site renewable electricity installations across all business segments
7.4 Installation, maintenance and repair of charging stations
Aligned CAPEX represents investments into charging stations across all business segments
EU Taxonomy reporting 2024
Taxonomy-aligned
Taxonomy-eligible but not aligned
Non-eligible
Efficiency-driven decarbonisation
The first and most impactful component of our transition plan towards 2030 is the efficiency of our Ocean network and assets, which directly reduces fuel consumption. Efficiency of the network addresses the operational excellence of our Ocean network including our new Gemini network in 2025. Efficiency of assets in the network relates to the design, technology and composition of the global fleet of 700+ owned and timechartered vessels.
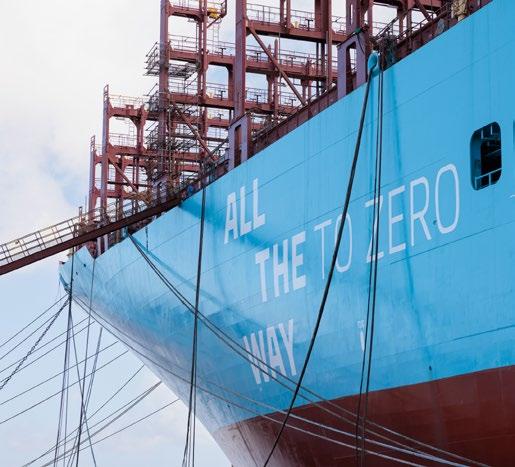
The Energy Efficiency Operational Indicator (EEOI) is a key measure of efficiency in Ocean operations. The EEOI is an expression of emissions of CO2e per unit of transport work (tonne cargo times nautical mile). In 2024, we improved the EEOI to 11.1 gCO2e/t nm, compared to 11.7 in 2023, marking a record low for the second consecutive year.
In 2024, the EEOI benefited from increased transport volumes due to the Red Sea situation, as higher capacity utilisation enhanced the energy efficiency of our vessel operations. Our science-based target commitments, however, focus on reducing our absolute scope 1 emissions, not on energy efficiency per transported container, and longer voyages and faster sailings in 2024 resulted in a net increase of absolute greenhouse gas (GHG) emissions of 8%, compared to 2023.
Maersk's Fleet Management and Technology policy statement, anchored in our Code of Conduct, outlines our commitments to reduce negative impacts to the environment and society from our fleet, including environmental commitments such as improving energy efficiency and preserving ecological balance and biodioverisy as well as commitments around health and safety, fair employment practices and human rights and business ethics.
Network efficiency
Optimising sailing speed and routing, while taking factors such as vessel safety and environmental protection into consideration, allows us to meet customer delivery promises while optimising fuel consumption and thereby reducing GHG emissions. In addition, network efficiency will have the largest contribution to scope 1 emission reductions in our transition plan towards 2030.
Network efficiency is supported by StarConnect, Maersk’s AI-powered fleet energy efficiency platform that processes 2.5bn data points annually from more than 700 vessels. This advanced system uses machine learning to forecast and optimise fuel consumption and safety, taking into account environmental conditions including ocean currents and weather.
Along with optimising our current network efficiency, significant planning efforts in 2024 went into the Gemini Cooperation with Hapag-Lloyd, which went live on 1 February 2025. The new East-West trade network is built on a fundamentally different design and includes 29 ocean mainliner services and an extensive network of interregional
shuttle services making transhipments to strategically selected hubs (ports). Gemini will use leaner, single operator mainliner loops and have almost half the number of port calls per service rotation compared to today. This means that the average number of stops a container makes between origin and final destination will decrease significantly.
In addition to increased reliability and speed, Gemini will also improve network utilisation and fuel efficiencies. Gemini opened for bookings in December 2024; we will deepen our understanding of how the network supports our science-based targets and customers’ decarbonisation journeys under actual operating conditions starting in 2025.
Asset efficiency
Asset efficiency includes the overall design, technology and composition of our fleet, including a mix of owned and time-chartered vessels, and the operational flexibility this provides in reducing GHG emissions while also meeting network demand. Our fleet renewal strategy is also a key factor as Maersk works at a pace of roughly 160k TEU a year to ensure a gradual and continuous upgrade of our shipping capacity to new fuels. In 2024, Maersk made significant progress in decarbonising its fleet by deploying seven large dual-fuel green methanol vessels, with additional orders in the pipeline (see figure on page 85). These investments reinforce Maersk’s commitment to advancing sustainable shipping and driving the maritime industry’s energy transition.
Alongside the fleet renewal, Maersk continued implementing new and improved propellers and bulbous bows as well as retrofits and is also working with shore power enablement to reduce the need for vessels to consume fuels while in port. The establishment of a robust global regulatory framework this year by the International Maritime Organization (IMO) remains critical to a successful energy transition. To increase asset efficiency in terms of investing in new, dual-fuel vessels as well as retrofitting our existing fleet, Maersk has invested USD 1.2bn in 2024, out of which USD 1.2bn is EU Taxonomy aligned under activity 6.10 and 6.12 (read more on page 97). Until 2030, we expect to invest an additional USD 10.9bn into new and existing assets.
In an industry first, the Maersk Halifax was retrofitted as a dual-fuel methanol vessel at the Zhoushan Xinya Shipyard, China in 2024.
Energy shift-driven decarbonisation
The second fundamental part of our transition plan is a shift to powering our business activities using energy with a lower climate impact. In our Ocean business, this includes switching to new fuels like biodiesel, green methanol and liquefied biomethane, and our approach to securing these fuels, as the market mature and scale across multiple pathways. In Logistics & Services and Terminals, it includes the electrification of previously fossil fuel-powered trucks, warehouse vehicles and terminal container handling equipment. It also includes the use of renewable electricity to reduce scope 2 emissions.
Fuel shifts
Our shift away from fossil fuels, contributing to reducing Ocean emissions across 700 owned and time-chartered vessels, is particularly influenced by externalities. This includes customers’ willingness to cover part of the cost gap between conventional and green fuels, which in turn is dependent on regulators setting industry standards and creating supportive policies. In addition, we are dependent on innovation and external investments to scale green fuel production, infrastructure and renewable electricity to responsibly produce green fuel. As our transition plan matures, we see network and asset efficiency levers playing a greater role in reaching our science-based targets, as outlined on the previous pages. A.P. Moller - Maersk (Maersk) therefore now anticipates a need for between 10-20% green fuels by 2030 to reach our Ocean targets (depending on growth), which de-risks our plan compared to the 25% green fuels expectation communicated in 2021. Maersk’s actions relating to shifting to green fuels are twofold: In areas where we have higher control and influence, such as our fleet renewal and green fuel offtake agreements, we have a strong
executional focus. For areas with significant external dependencies, such as customer willingness and industry-level policy, we take a strong engagement and advocacy focus.
Shifting to green fuels is a balancing act between various, sometimes conflicting demands, including market viability, customer requirements, current and emerging regulations and our own science-based targets. We follow a diversified, fuel-agnostic portfolio strategy to ensure we can cut emissions now and over the mid-term as multiple pathways to netzero emissions mature and, in the case of fossil fuels, start to wind down.
Securing green fuels for current and future operations
Maersk’s long-term commitments to green fuels, including methanol, biomethane and the biodiesel, currently used in our ECO Delivery Ocean offering, help us to reduce greenhouse gas (GHG) emissions and to meet customer demands today. They also send important demand signals to the industry, which incentivises more production scaling. We also continue exploring promising future green energy sources such as ammonia.
Successfully transitioning to green fuels is not, however, limited to securing fuel supplies and investing in vessels that can sail on them. It also requires increasing the industry’s knowledge on how to safely operate low-emissions transport, establishing the needed policies, procedures and permitting, and developing the infrastructure required for a global transformation to net-zero supply chains.
Maersk progressed along its methanol fuel pathway with the launch of seven large dual-fuel methanol vessels during 2024. This included six name-giving events in various strategic cities, including Aarhus, Singapore and Los Angeles. These name-giving events are important opportunities to engage with our customers, regulators, employees and business partners in welcoming the additions to our fleet and celebrating progress in the industry’s green transition.
Maersk has 11 large (16,000-17,000 TEU capacity) dual-fuel vessels scheduled for delivery in 2025 as well as six smaller (9,000 TEU) dualfuel vessels coming in 2026-2027. In November, we successfully took delivery of the Maersk Halifax – the world’s first retrofitted dual-fuel methanol vessel.
To secure green methanol for these vessels, we have made important offtake agreements, including an October 2024 long-term biomethanol offtake agreement with LONGi Green Energy Technology Co., Ltd.
Maersk’s requirements for green fuels
Our approach to green fuels is guided by requirements across three pillars.
1) All green fuels must be certified by a third party to ensure credibility and have a proof of sustainability.
2) We look at lifecycle GHG savings; all fuels must meet the minimum reductions of the EU Renewable Energy Directive which is 65% for biofuels and 70% for e-fuels compared to referenced fossil fuel.
3) Maersk only accepts second-generation feedstocks such as wastes and residues, i.e. we do not accept any first-generation food and feed crops.
In addition to climate impacts, when assessing the lifecycle impact of new fuels, we consider a broad range of environmental indicators such as biodiversity, ecosystems, resources and materials depletion, human health and ecotoxicity, air and water quality. We use lifecycle assessment and also consider indirect effects of fuel use such as indirect land use and other marginal effects to avoid shifting the burden of GHG emissions and impacts from one stakeholder to another.
Our lifecycle analysis of prioritised current and possible future green fuels for ocean shipping is governed by three policies, which are available online:
Maersk green fuel requirements
Maersk biofuel sustainability requirements
Maersk methanol sustainability requirements
Laura Mærsk, the world’s first methanol-capable container vessel
Maersk’s combined methanol offtake agreements now meet more than 50% of the expected dual-fuel methanol fleet demand in 2027. In 2024, Maersk sourced green fuels valued at above USD 250m towards our ECO Delivery solutions sold to customers. Until 2030, we anticipate spendings in the range of USD 2-8bn on green fuels depending on growth, outcomes of the IMO and other uncertainties that will impact our transition plan towards 2030. As OPEX for fuels is not included in the scope of the OPEX KPI under the EU Taxonomy, these expenses are not included in Maersk’s EU Taxonomy reporting.
Maersk is taking steps to diversify its fuel pathways, with our energy transition plan and fleet renewal strategy built around an expectation for a multi-fuel future. In August 2024, we announced our intention to add 50-60 newbuild dual-fuel vessels to our fleet as part of our ongoing fleet renewal programme. In December, Maersk executed on the fleet renewal plan, with the ordering of 20 owned vessels for our fleet. With these orders, Maersk concluded the intended owned newbuilding orders announced in the August update of the fleet renewal plan. In addition to these new dual fuel vessels, our fleet renewal plan also includes retrofitting existing vessels. This year, Halifax became the industry's first retrofitted dual-fuel methanol vessel.
Time-chartered vessels represent approx. half our fleet of 700+ vessels and are also part of these renewal orders to support scope 1 emissions reduction targets from subcontracted ocean shipping. These vessels will be a combination of dual-fuel methanol and dualfuel liquified methane vessels.
20 vessels
Bio and e-methanol are likely to be the most competitive and scalable pathways to decarbonisation in this decade. Liquefied bio and e-methane also meet Maersk’s green fuel requirements for emission reductions, and we are now engaging the market to seek a scalable supply of these fuels. At the same time, there is a risk of methane slippage linked to the production of methane that impacts upstream scope 3 value chain GHG emissions. Therefore, more focus is needed on feedstock procurement and upstream processing. Methane slip is also a risk on vessels, and Maersk is committed to using engine types with the lowest methane slip. We also continue to explore other promising fuel pathways like ammonia, which is scalable but poses safety concerns due to its toxicity.
Maersk is further engaging with ports in many regions to establish safe methanol bunkering procedures and permitting, building on progress in 2023 from early adopters such as Singapore and Rotterdam.
In 2025, Maersk will continue defining a roadmap for the right asset mix to move, store, blend and bunker new fuels like methanol, and the right policy support to get those fuels onto our vessels.
Fuels for air transportation
Customer demand for integrated supply chains that include air freight remains high, especially for cargo of high value or with demanding delivery schedules. Yet reducing airfreight GHG emissions is one of the most challenging tasks in decarbonising logistics due to the high abatement costs of sustainable aviation fuel (SAF) and the lack of production or distribution scalability.
Whereas there are effective short-term solutions to decarbonise ocean and landside operations, air cargo presents a long-term challenge due to its significant dependency on technology developments and industry and government-level regulation.
In 2024, we added two new Boeing 777Fs to our fleet, one of the most fuel-efficient freighters available today, especially for longhaul operations.
Regulatory and customer impacts on our fuel transition
The regulatory landscape and its impact on our customers’ transport choices has a profound importance for our ability to shift to green fuels. 2024 saw the inclusion of shipping in the EU Emissions Trading System (ETS), a market-based mechanism designed to reduce European Economic Area emissions. An even stronger driver in the coming years will be the new FuelEU Maritime legislation, which comes into force in January 2025 and introduces increasingly stricter limits on GHG intensity for ships calling on European ports. It favourably includes a wellto-wake approach which Maersk already uses and advocates for, as well as looking beyond carbon to include other GHG such as methane and nitrous oxide.
At the same time, FuelEU Maritime is complex, with numerous unresolved issues around definitions, compliance and financial mechanisms that require resolution. Implementing a regional standard for fuels which are purchased and consumed in international trade creates challenges and inconsistencies. Maersk therefore advocates for a global industry standard through the IMO to create a level playing field for all nations.
The IMO Carbon Intensity Indicator (CII) is to be reviewed by 2026. Depending on the outcome of this review, the CII could also have an impact on the energy transition towards 2030. Closing the price gap between fossil fuels and green fuels is one of the most critical IMO policy needs. The IMO’s Marine Environment Protection Committee MEPC 83 meeting in April 2025 will be crucial for refining and approving mid-term measures, including marine fuel standards and a pricing mechanism, which will be formally adopted at an extraordinary MEPC session in October 2025. Maersk actively supports effective mid-term measures and works towards measures that secure a multi-fuel future for shipping, and a just and equitable transition for all countries.
The ambition level and regulatory clarity of these agreements will have an impact on the pace and scale of the global shipping industry’s energy transition, as well as Maersk’s fuel strategy. In a pessimistic scenario, a low ambition level of IMO regulations would result in a patchwork of regional and country regulations that would make decarbonisation compliance more complex, maintain the cost gap between green and fossil fuels and decrease financial investments needed for scaling due to their higher risk.
In a more optimistic scenario for an IMO agreement with high ambition and regulatory clarity, effective finance mechanisms would be enacted that result in green and fossil fuels reaching price parity. This would make green fuels the obvious choice for shipping customers and the need for additional funding of the green fuel transition would go down. This would also derisk and further catalyse further capacity and infrastructure investments to accelerate the green energy transition.
Between these two extremes is a ‘base case’ scenario which would secure some supportive measures but with less ambition and clarity of the optimistic scenario. This could create the need for shipping customers to cover additional costs in the medium term, so the industry’s transition speed would be affected by a lower willingness to pay in the market . The biggest question under this scenario therefore is whether it will be sufficient to drive the industry to commit and act on reducing GHG emissions in time.
The outcomes of the eventual IMO agreement will naturally have a significant impact on our customers’ capacity to act on commitments for decarbonisation.
Many Maersk customers, including almost 60% of our top 200 customers, share our recognition of the urgency of acting on climate change and have set or committed to science-based targets. At the same time, they had to navigate higher raw materials, fuel and freight costs and higher interest rates, all in 2024, as well as prioritising resilience in the face of many global supply chain disruptions and uncertainties.
As the affordability of decarbonisation is challenged, this may lead some companies to pull back on their SBTi commitments. Under pessimistic or base case IMO scenarios, the business case for companies to increase the maturity of their decarbonisation commitments will be more difficult.
In 2024, absolute volume rate increases for Maersk ECO Delivery product offerings were lower than previous years, under high fuel price pressures. However, we optimistically see continued customer interest in building long-term volume commitments in ECO Delivery Ocean, the most mature of our ECO Delivery products.
Electrification of owned assets
Electrification of owned assets, while being a relatively low contributor to the transition plan, is a vital decarbonisation lever for APM Terminals and Logistics & Services. It includes replacing diesel terminal container handling equipment with electric versions, connecting existing and newbuild warehouses and terminals with renewable electricity and adding supportive infrastructure to these sites such as EV charging stations for electric equipment and vehicles.
These ambitions are highly dependent on local renewable electricity capacity, grid reliability and market, for example, our ability to enter into power purchasing agreements with state-owned utilities. Therefore, in less mature renewable electricity markets, our approach focuses on advocacy and engagement with local officials to drive policy change and infrastructure investments, as well as joint planning with governments and utility companies to upgrade grids.
Electrification of terminals
For APM Terminals, shifting from fossil-fuelled equipment in our ports to battery-electric container handling equipment is the main lever for reducing scope 1 GHG emissions. During 2024, we rolled out such equipment in Egypt, Jordan and Spain as part of our USD 60m electrification pilot programme.
In 2023, APM Terminals and DP World jointly announced the Zero Emission Port Alliance (ZEPA), an industry-wide strategic coalition aiming to accelerate the adoption of battery-electric container handling equipment in ports. In December 2024, ZEPA published its first annual findings. It expects demand to rapidly accelerate in the coming years but notes the need for standardisation to ensure widespread adoption as well as the importance of grid and infrastructure updates to support increased terminal power demand.
While some electric equipment prices have fallen and reached cost parity with fossil fuel alternatives from a total cost of ownership perspective, many electric container handling equipment categories still have a large price gap to diesel-powered alternatives. This is largely driven by a lack of scale or standardisation – for example the wide divergence in battery sizes, charging infrastructure and software for battery-electric equipment.
To meet science-based scope 1 targets, APM Terminals is committed to electrifying assets at the time of their scheduled replacement.
This transition is expected to require an overall CAPEX of USD 1.1bn to 1.2bn until 2030, which includes investments in battery-electric container handling equipment and infrastructure needed for electrification. Investments into the electrification of Terminals is included in Maersk’s EU Taxonomy reporting of CAPEX, amounting to USD 513m in 2024. Read more on page 97
Despite higher initial investments, the long-term operational benefits from electrification are expected to offset a portion of the cost. These savings come from reduced diesel consumption and the positive financial impact of long-term power purchase agreements (PPAs) and onsite solar projects. Ultimately, the investment in the electrification of our assets will support both sustainability objectives and financial performance.
For scope 2 emissions, the ambition is to transition to 100% renewable energy by 2030. In 2024, approx. 45% of APM Terminals’ electricity was powered through renewable sources. These initiatives have resulted
in more than 8% reduction in absolute scope 1 and 2 emissions in our Terminals in 2024 compared to our 2022 baseline.
Our USD 2bn investments in two newbuild terminals in Suape, Brazil, and Rijeka, Croatia, and the expansion of the MV II terminal in the Netherlands include all the infrastructure that is needed for electrified operations, which will run on renewable electricity. The investment includes infrastructure for charging of battery-electric equipment and solar panels.
In addition to the improvements in air quality that electrified container handling equipment provides for local communities, APM Terminals also focuses on the social impact to our workforce and communities. This includes upskilling opportunities for our workforce to operate battery electric equipment, and a more pleasant work environment with reduced noise and odours, and lower equipment vibrations.
Electrification of our warehouses
In warehouse operations, we focused in 2024 on energy efficiency retrofits, upskilling our frontline teams in energy management at our 500+ facilities and on building a data foundation to provide emission visibility to customers at a warehouse level. We also continue to ensure that all newbuild facilities are green building certified to the highest efficiency standards. In June 2024, Maersk opened a BREEAM Excellent certified warehouse in Taulov Dry Port, Denmark. The warehouse has zero direct emissions from operations and all indoor and outdoor equipment is electrified.
Certified buildings and electrification of equipment in our warehouses are important levers to Maersk and part of our Green Finance Framework, which also saw allocation to green bonds issued earlier in 2024.
Energy shifts of business partners
Landside logistics are often the largest source of GHG emissions in our customers’ supply chains, and there is strong demand for both landside decarbonisation solutions and integrated logistics solutions across ocean, land and air. In addition, it represents a large share of scope 3 emission reductions in our transition plan. Our emission reduction solutions currently rely on a mix of EVs and transitional fuels like biofuels, as well as modal shift to more efficient transport modes within our
landside network such as rail. Our aim is to provide emission visibility while offering lower emission solutions across inland modes.
Maersk owns some landside transport assets, such as our fleet of 100+ Volvo VNR electric trucks in North America. However, most of our landside logistics services are delivered through third party partnerships with trucking companies across our operational footprint. Therefore, our ability to decarbonise landside logistics depends on their willingness and ability to invest in replacing fossil fuel powered road vehicles such as heavy and light delivery trucks with EVs. It also depends on local energy providers and infrastructure to ensure sufficient power grid capacity, reliability and charging station availability.
Maersk’s ECO Delivery Inland product is our main offering for truck, rail and barge logistics decarbonisation, together with the Emissions Studio product, which offers increased visibility over transportation emissions. Improving ECO Delivery Inland availability and scalability are key focus areas for 2025, as both are key customer value drivers. We have already started EV-powered truck operations with partners in Spain, China, Sweden, Denmark, UK, Thailand and Brazil, with more in development. We are also working on ECO Delivery Inland for rail, with pilots for barges underway.
To address investment barriers for our suppliers, our focus is on cost reduction through scaling and demand certainty for both EV manufacturers and grid owners, encouraging them to invest and scale, which will further drive down costs for our customers.
Physical climate risks exposure
The past decade has been the warmest on record globally with 2024 becoming the first year to exceed 1.5°C above pre-industrial levels, coupled with increased frequency and intensity of extreme weather events.
In 2022, in collaboration with external consultants, we performed an in-depth assessment of the physical impact of climate change on Maersk’s business. 107 assets were selected for analysis, including terminals, warehouses, data centres and third-party operated property. The assets were mapped against prevailing climate hazards such as heatwaves, flooding, windstorms, water stress etc, and modelled across multiple time horizons and climate scenarios. Estimated loss values were determined based on losses to impacted assets (property damage and disruption costs) but excludes the resulting effect on the network.
The illustration to the right shows our top five assets at risk by 2050 in a “middle of the road” SSP2-4.5 scenario (+2.5°C by 2100), representing a future based on stated policies. In the assessment, we have also considered risks under SSP5-8.5 (+3.0°C by 2100) and SSP1-1.9 (+2°C by 2100) scenarios, with the former showing a higher level of extreme climate impacts, and the latter where risks are mitigated. Most of the financial impact from weather disruption and damage is concentrated around the five terminals presented to the right. The financial impact is driven by their exposure to temperate windstorms, coastal flood, drought/water stress, heatwave, and hurricane and storm.
As a response to the physical risk to our assets, all our majority owned terminals and large warehouse locations are part of a loss prevention programme entailing an assessment of climate change related exposure. In addition, we conduct risk engineering reports for selected exposed assets that inform mitigative actions at site level. For example, in APM Terminals Maasvlakte we have implemented actions such as elevating critical electrical infrastructure above ground level to mitigate impacts of flooding and tying down equipment to be able to withstand storms and floods. We have currently not developed a corporate policy or overall measurable targets, but we continue to assess the need for mitigative actions at site level.
Top 5 assets exposed to physical climate risks
APM Terminals Maasvlakte II
Rotterdam, the Netherlands
The Suez Canal Container Terminal Suez Canal, Egypt APM Terminals Elizabeth
APM Terminals
Maasvlakte II
Rotterdam, the Netherlands
Terminals Pier 400 Los Angeles, USA
Terminals Elizabeth New Jersey, USA
Suez Canal, Egypt
Aqaba Container Terminal
Aqaba, Jordan
Performance data
Gross scopes 1, 2, 3 and total GHG emissions
Retrospective Milestones and target years
E1-6_01
E1-6_02
E1-6_04 E1-6_07
E1-6_08 E1-6_09 E1-6_10 E1-6_11
E1-6_12 E1-6_13 E1-6_14 E1-6_27
MDR-T_13
Scope 2 GHG emissions
Significant scope 3 GHG emissions
For 2024, Maersk’s total emissions increased by 8% compared to 2023. This was mainly driven by an increase of 5% in scope 1 emissions and an increase of 10% in scope 3 emissions. The increases in both scope 1 and scope 3 to a large extend relate to increased emissions from the additional fuel consumption needed for the extended re-routing around the Cape of Good Hope, caused by the Red Sea situation, from both our own vessels and chartered vessels, and from vessel-sharing agreements and supply chain partners.
ACCOUNTING POLICIES
Scope and consolidation
The consolidation of greenhouse gas (GHG) emissions data is based on the financial consolidation approach and stated in accordance with the GHG Protocol: direct emissions from owned and long-term leased-in assets as defined by IFRS 16 (scope 1), indirect emissions from purchased electricity and district heating (scope 2), and value chain emissions (scope 3), which also includes emissions related to leased out assets as defined by IFRS 16. For more information, see the sustainability statement basis of preparation.
Emissions reporting for entities under operations
In 2024, it has been assessed that Maersk does not have operationally controlled investees in e.g. associates, joint ventures, or unconsolidated subsidiaries. This implies that the scope and treatment of entities under financial control and operation control do not differ for 2024. Thus, no separate disclosures are provided for Maersk’s GHG emissions, including operationally controlled investees in e.g. associates, joint ventures, or unconsolidated subsidiaries. Maersk is annually reviewing its contractual arrangements in line with CSRD requirements.
Emission conversions and calculations
GHG emissions are calculated using conversion factors for energy consumption and other GHG gases. Primary
schemes used for activity-based calculations are Sixth Assessment Report (AR6, 2022), European Monitoring and Evaluation Programme/European Economic Area (EMEP/EEA air pollutants database, 2023), International Energy Agency (IEA, 2024), Global Logistics Emissions Council (GLEC) framework, (updated 2023), and Department for Environment, Food and Rural Affairs (UK) (2024). The Comprehensive Environmental Data Archive 6 (CEDA 6) (2022) is used for spend-based estimates. Relevant spend is adjusted to 2018 levels using the latest data from Oxford Economics (Q3 2024) to ensure comparability with the base year of the spend-based emissions factors. The principles for choosing among the schemes for default conversion factors are:
• The most recent and internationally recognised schemes are preferred
• Specific industry schemes can be included when not in conflict with the above.
Gross scope 1 GHG emissions
Gross scope 1 GHG emissions is the sum of all UNFCCC/ Kyoto gases converted to CO₂ equivalents. UNFCCC/Kyoto gases comprise: CO₂, CH₄ and N₂O, which are calculated based on amount of direct energy (i.e. the fuels stated under ‘Energy consumption’) that are consumed/combusted, and HFCs, PFCs, SF₆ and NF₃, which are based on direct consumption at entities/vessels controlled by Maersk.
Percentage of scope 1 GHG emissions from regulated emission trading schemes
Percentage of scope 1 GHG emissions from regulated emission trading schemes is the share of Maersk’s gross scope 1 GHG emissions covered by the EU ETS.
Gross location-based scope 2 GHG emissions
Gross location-based scope 2 GHG emissions is the CO₂ equivalents’ converted sum of CO₂, CH₄ and N₂O, calculated based on consumed electricity and district heating bought from a third party and using location-based IEA emission factors.
Gross market-based scope 2 emissions
Gross market-based scope 2 GHG emissions is the CO₂ equivalents’ converted sum of CO₂, CH₄ and N₂O, calculated based on consumed electricity and district heating bought from a third party and using country-specific market-based factors for EU countries and the US and IEA factors for other countries. In markets where Maersk procures renewable electricity, this is used as part calculating the gross market-based scope GHG emissions, provided appropriate EAC documentation is available.
Significant scope 3 GHG emissions
Value chain GHG emissions (scope 3 GHG) are the CO₂ equivalents’ converted sum of CO₂, CH₄ and N₂O from Maersk’s value chain activities. Of the 15 scope 3 categories in the GHG Protocol, 12 categories are currently determined as applicable to Maersk’s business model and activities. The excluded categories are:
• Category 9 – downstream transportation and distribution, since we do not produce products that we need transportation for.
• Category 10 – processing of sold products, since our business model is transport and logistics services for our customers’ goods.
• Category 14 – franchises, since we do not have franchises.
Thus, value chain GHG emissions comprise of emissions relating to:
• Category 1 – purchased goods and services, which are reported based on financial data and includes goods for our operations.
• Category 2 – capital goods, which is reported based on life cycle assessments and reported capital expenditure. This category covers capital investments such as new asset purchases, retrofit of vessels and dry docking. We include the full scope 3 impact in the year of investment.
• Category 3 – fuel and energy-related activities, which is reported based on actual fuel procured and consumed.
• Category 4 – upstream transportation and distribution, which is reported based on transportation data recorded in operational systems. The resulting emissions are estimated following the Global Logistics Emissions Council (GLEC) methodology per transport type. For supporting logistics-related activities like towage services, financial data is multiplied by relevant emission factors.
• Category 5 – waste generated in operations, which is reported based on amounts and types of waste.
• Category 6 – business travel, which is reported based on activity-data for our direct air travel and procurement data for other business travel related activities.
• Category 7 – employee commuting, which is reported based on employee headcounts per location, estimated commuting distance and transportation modes.
• Category 8 – upstream leased assets, which is a spendbased estimate of emissions from leased assets that is not reported in scope 1 and 2.
• Category 11 – use of sold products, is based on activity data for fossil fuels distributed by Maersk to third parties, estimated fuel use of liners calling APM Terminals, and estimated emissions from the use of refrigerated containers produced by Maersk Container Industry.
• Category 12 – end-of-life treatment of sold products, which is reported based on activity data for end of life and retreatment of sold new and second-hand reefers.
• Category 13 – downstream leased assets, which is reported based on fuel consumption from vessels, tugs and planes leased to third parties.
• Category 15 – investments, emissions are calculated to the extent of the equity share in non-controlled joint ventures and associates using financial data and corresponding factors. Total gross scope 3 emissions is the emissions related to the 12 significant scope 3 categories outlined above.
Total GHG emissions
Total GHG emissions have been stated as both the sum of scope 1, scope 2 – location-based and scope 3 emissions as well as scope 1, scope 2 – market-based and scope 3 emissions.
Annual % target /base year
The annual % target/base year is the percent average annual emission reduction per year required to meet Maersk’s 2030 target. The annual % target/base year is calculated using the following formula:
1emissions in target year emissions in target base year target year – base year
Uncertainties and estimates
GHG emissions from upstream transportation and distribution activities are modelled using the EcoTransIT World (ETW) online tool. In cases, where Maersk does not have access to information of the actual fuel consumption and/or route information of third-party transportation activities, we use the ETW and its worldwide transportation route network and vehicle model data set to estimate the emissions from such activities. Maersk uses actual activity data from its transport management systems for the GHG modelling in ETW. The actual data from Maersk’s systems that are used for the modelling are:
• Origin and destination details.
• Carrier mode to be considered for segregation of transport mode. Presently it can contain ocean, air, trucks, rail and vans.
• Carrier actual weight.
The share of Maersk’s total scope 3 emissions for 2024 that have been modelled using the ETW tool is 28.44%.
Progress towards Maersk’s 2030 and 2040 targets
reduction in scope 3 emissions from Use of sold products covering distributed fossil fuels
1 Not covered by the Independent Auditor’s limited assurance report.
2 Numbers restated due to improved reporting processes.
3 Maersk has validated targets to reduce emissions from other operations than maritime operations by 90% in 2040. In addition, Maersk has near-term (2030) sub-targets in relation to other operations than maritime operations that relate to significant emissions categories, which support the delivery of the overall 90% reduction target for 2040. This is in line with the SBTi Net-Zero Standard, accounting for the ongoing updates in global frameworks regarding the applicability of market instruments in meeting net-zero emissions targets.
4 Outside the near-term (2030) target boundary. Work to reduce the scope 3 emissions from all other sources in other operations will be performed in the 2030 to 2040 time period.
For 2024, our absolute scope 1, scope 2 and scope 3 emissions increased by 5%, 6%, and 10%, respectively, compared to 2023, and thus trending in the wrong direction. The absolute emissions were significantly negatively impacted by the re-routing of vessels around the Cape of Good Hope, which resulted in longer distances and increased fuel consumption throughout 2024. Compared to Maersk’s baseline in 2022, we have reduced our absolute scope 1 emissions by 1% and scope 2 emissions by 15%. Our scope 3 emissions have increased by 3% in the same period. In addition to the impacts of the re-routing, we took delivery of more dual-fuel vessels during 2024 compared to previous years. This has also increased our scope 3 emissions.
ACCOUNTING POLICIES
Main targets
Absolute reduction in total scope 1 emissions
The absolute reduction in total scope 1 emissions is stated as a percentage reduction of scope 1 in the reporting year (2024) compared to the base year (2022) and previous year.
Absolute reduction in scope 2 emissions
The absolute reduction in scope 2 emissions is stated as the percentage reduction of scope 2 (market-based) in the reporting year (2024) compared to the base year (2022) and previous year.
Absolute reduction in total scope 3 emissions
The absolute reduction in total scope 3 emissions is stated as a percentage reduction of scope 3 in the reporting year (2024) compared to the base year (2022) and previous year.
Uncertainties
and estimates
When preparing the reporting of emissions related to short-term charter vessels, Management applies judgement in the categorisation of such emissions as to whether they should be categorised as own (scope 1) or value chain (scope 3 category 4 upstream transportation and distribution) emissions. For 2024, we have included emissions from short-term charter vessels in scope 3. This is a change compared to previous years, where emissions from shortterm charter vessels have been included in scope 1. Recategorisation of emissions between scopes for comparison years before application of ESRS has not been done.
Total emissions reported for all years are complete. Had we restated comparative numbers to align with the approach for classification of emissions from short-term charters applied for 2024, Maersk’s scope 1 emissions would have increased by 11% in 2024, while Maersk’s scope 3 emissions would have increased by 6% compared to 2023.
Equally, Maersk’s absolute reduction in scope 1 and scope 3 well-to-wake emissions from own container shipping operations, would have increased to 11% in 2024 compared to 2023.
Sub-targets – Marine operations
Absolute reduction in scope 1 and scope 3 well-to-wake emissions from own container shipping operations
The absolute reduction in scope 1 and scope 3 well-towake emissions from own container shipping operations is stated as the percentage reduction of scope 1 and scope 3 well-to-wake emissions from own container shipping operations in the reporting year (2024) compared to the base year (2022) and previous year.
Absolute reduction in scope 3 well-to-wake emissions from subcontracted container shipping operations
The absolute reduction in scope 3 well-to-wake emissions from subcontracted container shipping operations is stated as the percentage reduction of scope 3 well-towake emissions from subcontracted container shipping operations in the reporting year (2024) compared to the base year (2022) and previous year.
Sub-targets – Other operations
Absolute reduction in scope 1 and scope 2 emissions from all other sources
The absolute reduction in scope 1 and scope 2 emissions from all other sources is stated as the percentage reduction of scope 1 and scope 2 emissions for all other (non-maritime) operations, including emissions from terminals, landside logistics and air freight operations in the reporting year (2024) compared to the base year (2022).
Absolute reduction in scope 3 Fuel and energyrelated activities and upstream transportation
The absolute reduction in scope 3 Fuel and energyrelated activities and Upstream transportation emissions is stated as the percentage reduction of scope 3 Fuel and energy related activities (Category 3) and Upstream transportation (Category 4) for all other (non-maritime) operations in the reporting year (2024) compared to the base year (2022) and previous year.
Absolute reduction in scope 3 emissions from the use of sold products covering distributed fossil fuels
The absolute reduction in scope 3 Use of sold products covering distributed fossil fuels is stated as the percentage reduction of scope 3 Use of sold products (Category 11) relating to distributed fossil fuels in the reporting year (2024) compared to the base year (2022) and previous year.
Absolute reduction in scope 3 emissions from all other sources
Absolute reduction in scope 3 emissions from all other sources is stated as the percentage reduction of scope 3 emissions for all other (non-maritime) operations in the reporting year (2024) compared to the base year (2022) and previous year.
Annual % target/base year
The annual % target/base year is the percent average annual emission reduction per year required to meet Maersk’s 2030 target. The annual % target/base year is calculated using the following formula:
1emissions in target year emissions in target base year target year – base year
How Maersk ensures consistency of GHG emission reduction targets with GHG inventory boundaries
Maersk has validated near-term and net-zero climate targets by Science Based Targets initiative (SBTi), a widely recognised global standard for corporate target setting. Maersk’s climate inventory follows the requirements of the Greenhouse Gas Protocol, covering all greenhouse gas emissions.
Maersk’s climate inventory follows the financial control approach for target setting, which translates to a 100% inclusion of emissions from activities by subsidiaries and an equity share of emissions for joint ventures and associates included under scope 3.15 Investments.
Maersk currently has near-term and net-zero climate targets for scope 1, 2, and 3, and complementary sub targets in line with the requirements of SBTi’s maritime sector decarbonisation guidance. Maersk’s near-term target covers >95% of scope 1 and 2 and >66% of scope 3; the net-zero coverage is >95% and >90% respectively. These thresholds are in line with SBTi requirements. The emissions reduction targets are gross targets, meaning that GHG removals, carbon credits or avoided emissions are not currently considered as means of achieving the GHG emission reductions.
Maersk ensures its climate targets are relevant and follow the latest climate standards by means of a recalculation policy of climate inventories and targets. The recalculation policy is publicly available and follows the latest requirements of the Greenhouse Gas Protocol and Science Based Targets initiative (SBTi), outlining the types of changes and thresholds that trigger a recalculation and restatement of previously reported greenhouse gas emissions. Please see the Maersk recalculation policy. Maersk endeavours to ensure consistency, accuracy, completeness and comparability in public reporting of emissions and externally committed greenhouse gas reduction targets.
GHG emission intensity
EFRAG ID Indicator
The GHG emission intensity for 2024 is 1.51k CO2e/USDm both when calculating based on location- and market-based scope 2 emissions.
ACCOUNTING POLICIES
GHG emission intensity GHG emission intensity is the GHG emissions expressed per unit of revenue (million) – based on total GHG emissions (sum of reported scope 1, scope 2 – location-based and scope 3 emissions) and revenue as stated in the income statement of the consolidated financial statements.
Efficiency in Ocean
1 Not covered by the Independent Auditor’s limited assurance report.
In 2024, Maersk continued increasing the energy efficiency of our fleet, despite the negative impact on fuel consumption of the network diversion around the Cape of Good Hope. The Red Sea situation has resulted in longer routes and increased fuel consumption. To address these challenges, Maersk has continuously focused on network optimisation and maintained a relentless focus on vessel utilisation within our operations, resulting in year-on-year improvement in our efficiency in CO2 emitted per tonne mile. Maersk has also continued to invest in and expand proven initiatives, increasing the adaption of StarConnect and successfully rolling out new features. Efficiency retrofits in both owned and time-chartered vessels have also continued, with shore power enablement and the first large container vessel conversion to the dual-fuel methanol engine of Maersk Halifax. The use of second-generation biodiesel remains an important lever and has been complemented by the steady increase in biomethanol, with the delivery of seven dual-fuel methanol vessels.
These initiatives have delivered efficiencies at a scale to significantly reduce the impact of increased fuel consumption caused by longer routes and has enabled us to continue driving down the EEOI, achieving a record of 11.1, down from 11.7 in 2023.
Biogenic emissions
EFRAG ID Indicator Unit 2024
E1-6_17 Biogenic emissions not included in scope 1
For 2024, Maersk recorded 828k tonnes CO2e biogenic emissions not included in its scope 1 inventory. Biogenic emissions are primarily related to the combustion of biofuels in Maersk’s Ocean operations.
ACCOUNTING POLICIES
Biogenic emissions not included in scope 1
Biogenic CO2 emissions result from the combustion or biodegradation of biomass. Biomass is defined as any material or fuel produced by biological processes of living organisms, including organic non-fossil material of biological origin (such as plant material), biofuels (such as liquid fuels produced from biomass feedstocks), biogenic gas (such as landfill gas) and biogenic waste (such as municipal solid waste from biogenic sources).
In Maersk’s current inventory, the calculation of biogenic CO2 is limited to the combustion of fuels based on biogenic feedstock in Maersk’s scope 1 GHG emissions. This may expand based on evolving international standards detailing the treatment of biogenic emissions in corporate inventories.
ACCOUNTING POLICIES
Energy efficiency operational indicator (EEOI)
The energy efficiency operational indicator (EEOI) covers container vessels under Maersk’s operation. EEOI is defined by IMO in MEPC.1/Circ.684 and is calculated as gCO₂/(Tonne cargo x Nm). In practice, we calculate EEOI on voyage level and aggregate it in the following way:
(g CO2 voy 'n' +
'n' +
voy 'n') ((Tonne cargo x Nm)voy 'n' + (Tonne cargo x Nm)voy 'n' + (Tonne cargo x Nm)voy 'n')
The data sources are:
• g CO₂ – Based on fuel consumption, from departure voyage 1, to departure voyage 2, multiplied with relevant CO₂ factor (3.114 for HFO, 3.206 for MDO and 0 for biofuels).
• Tonne cargo – Calculated via draft and displacement tables, subtracting vessel weight and ballast water and fuel stock.
• Nm – GPS distance from departure voyage 'n', to departure voyage 'n'.
Energy consumption
1 Not covered by the Independent Auditor’s limited assurance report.
2 Numbers restated due to improved reporting processes.
3 Previously reported numbers for green fuels have been restated as a result of an improved reporting practice. In previous years, the amount of green fuels was based on invoiced amounts. With the roll-out of StarConnect to the entire fleet, the actual amount of green fuels consumed on the vessels are now collected and used for reporting. The numbers for consumption of green fuels have been restated accordingly.
For 2024, the total energy consumption increased by 4% compared to 2023. The increase was mainly related to an increase in fuel oils consumption related to the Red Sea situation and re-routing of vessels around the Cape of Good Hope. While relatively smaller, the consumption of renewable energy increased by 37% in 2024 compared to 2023. The increase was mainly driven by an increase in green fuels consumption and more terminals procuring renewable electricity.
ACCOUNTING POLICIES
Scope and consolidation
Energy consumption data is collected per legal entity per energy type, and the figures are consolidated line by line. To ensure completeness in reported data from our offices within legal entities, office standards have been developed, which can be used for offices with no production or warehouses. The office standards define average consumption values per FTE and are only used if other more accurate information is not available.
Total energy consumption
Total energy consumption is the sum of fossil energy consumption and renewable energy consumption.
Fossil energy consumption
Fossil energy consumption encompasses all fossil-based energy consumption that is consumed/combusted at Maersk controlled entities/vessels. Fossil energy consumption includes the following:
• Fuel oil, including heavy fuel oil, marine diesel oil, gasoline, diesel and kerosene
• Gas fuels, including liquified petroleum gas (LPG), liquefied natural gas (LNG) and natural gas
• Other fuels, including heating oil and cylinder oil
• Electricity and heating
Renewable energy consumption
Renewable energy consumption encompasses all renewable energy consumption, including renewable electricity, heating and green fuels that are consumed at Maersk-controlled entities/vessels. Renewable electricity includes electricity from solar panels, wind turbines and batteries, covering on-site self-generated and purchased renewable electricity from the grid. Green fuels include biofuels and green methanol. Thus, renewable energy consumption is reported as:
• Renewable electricity
• Green fuels
• Self-generated non-fuel renewable energy
Energy intensity and mix
1 Not covered by the Independent Auditor’s limited assurance report.
For 2024, the energy intensity was 2.18 GWh/USDm, a decrease from 2.28 compared to 2023. This was driven by a relatively higher increase in revenue compared to energy consumption for the year. We recorded a minor increase in the share of renewable energy consumption from 2023 to 2024, however 97% of Maersk’s total energy consumption was derived from fossil fuel sources in 2024.
ACCOUNTING POLICIES
Energy intensity (based on revenue)
Energy intensity is the total energy consumption in high climate impacts sectors per unit of revenue (USDm), as stated in the income statement of the consolidated financial statements. All of Maersk's energy consumption is considered as related to high climate impact sectors.
Share of renewable energy consumption
The share of renewable energy is the percentage of total energy consumption that is derived from renewable energy sources.
Share of fossil fuel sources in energy consumption
The share of fossil fuel sources in energy consumption is the percentage of total energy consumption that is derived from fossil-based energy sources
Renewable energy production
E1-5_17
Maersk’s renewable energy production is related to on-site solar installations that produce electricity and/ or heating, which is used on-site. Electrification of assets and investments in on-site renewable energy installations are part of Maersk’s transitions.
ACCOUNTING POLICIES
Renewable energy production
Renewable energy production is the total amount of renewable energy produced in Maersk’s operations during the reporting year. The total reported production comprises of the consumption, storage and sale of renewable electricity to the grid.
A.2. Taxonomy-eligible but not environmentally sustainable activities (not Taxonomy-aligned activities)
Taxonomy-non-eligible activities
1 Eight of the vessels – Laura, Ane, Astrid, Antonia, Alette, Alexandra, Angelica, and A.P. Møller – contributing USD 460m to the aligned revenue under section 6.10, have been partially financed (54%) via green bonds. The total aligned revenue under section 6.10, excluding the revenue from the vessels partially financed via green bonds, would therefore be adjusted by USD 248m to USD 1,993m (3.59%). Consequently, the adjusted share of aligned revenue would decrease to 6.72%.
Proportion of CAPEX from products or services associated with Taxonomy-aligned economic activities 2024 1
Proportion of OPEX from products or services associated with Taxonomy-aligned economic activities 2024
Nuclear and fossil gas-related activities for revenue, CAPEX and OPEX
Nuclear energy-related activities Yes/No
The undertaking carries out, funds or has exposures to research, development, demonstration and deployment of innovative electricity generation facilities that produce energy from nuclear processes with minimal waste from the fuel cycle.
The undertaking carries out, funds or has exposures to construction and safe operation of new nuclear installations to produce electricity or process heat, including for the purposes of district heating or industrial processes such as hydrogen production, as well as their safety upgrades, using best available technologies.
The undertaking carries out, funds or has exposures to safe operation of existing nuclear installations that produce electricity or process heat, including for the purposes of district heating or industrial processes such as hydrogen production from nuclear energy, as well as their safety upgrades.
No
EU Taxonomy accounting policies
No
Maersk has in 2024 continued to apply the climate change mitigation (CCM) technical screening criteria as our primary screening lens when assessing our economic activities. This is because our assessment shows that Maersk does not currently have eligible or aligned activities relating to the remaining five environmental objectives. As the EU Taxonomy regulation matures and evolves, we will change and expand our reporting accordingly, which may also impact the taxonomy KPIs previously reported. Key changes from 2023 are mainly rooted in the improvement of data availability and quality as well as refinement of our approach of how to evaluate KPIs. Main changes include:
• The addition of eligible and aligned activities CCM 7.4 Installation, Maintenance and Repair of Charging Stations as well as CCM 7.6 Installation, Maintenance and Repair of renewable energy technologies, especially applicable to our land-based business segments.
No
Fossil gas-related activities No
The undertaking carries out, funds or has exposures to construction or operation of electricity generation facilities that produce electricity using fossil gaseous fuels. No
The undertaking carries out, funds or has exposures to construction, refurbishment and operation of combined heat/cool and power generation facilities using fossil gaseous fuels. No
The undertaking carries out, funds or has exposures to construction, refurbishment and operation of heat generation facilities that produce heat/cool using fossil gaseous fuels.
No
• The expansion of eligible activity CCM 7.7 Acquisition and ownership of buildings across all segments.
• The inclusion of more aligned vessels in Ocean due to data quality improvements.
• Change in allocation key for revenue in Terminals, as we have excluded assets under construction from the base of assets generating revenue.
Where changes affect the numbers we have reported in 2023, these numbers have been restated.
The taxonomy-eligible KPIs have been calculated as:
• Taxonomy-eligible revenue KPI = eligible revenue/total revenue
• Taxonomy-eligible CAPEX KPI (additions) = eligible CAPEX/total CAPEX
• Taxonomy-eligible OPEX KPI (repair and maintenance) = eligible OPEX/total OPEX
Maersk’s process for determining taxonomy-eligible activities (the numerator of the taxonomy-eligibility KPIs) has followed a three-step approach:
1. Defining the economic activities that Maersk is engaged in within each of the segments across the Group
2. Assessing whether said activities are covered by the economic activity descriptions included in the EU Taxonomy Climate Delegated Act
3. Allocating revenue, CAPEX (additions) and OPEX (repair and maintenance) according to the company’s overall assessment of whether an economic activity is eligible or not.
First, determination of the share of economic activities in Maersk that are taxonomy eligible is based on activity codes in the financial consolidation system, which also forms the basis for Maersk’s external financial reporting. As such, activity codes have been defined as an economic activity.
Second, based on the descriptions of what is registered on Maersk’s activity codes, an assessment has been made of whether these activities are covered by the activity descriptions that are included in the EU Taxonomy Climate Delegated Act.
Third, depending on whether the registrations are related to assets or processes associated with taxonomy-eligible economic activities, the revenue, CAPEX and OPEX registered on these activity codes are assessed to be eligible or non-eligible and allocated accordingly.
The denominator for the eligibility KPIs has been defined as:
• Total revenue as stated in note 2.1 segment information of the consolidated financial statements.
• Total CAPEX (additions) as stated in note 3.1 intangible assets, note 3.2 property, plant and equipment and note 3.3 right-of-use assets of the consolidated financial statements. Additions related to goodwill, customer relationship, concessions rights and concession leases are excluded from total CAPEX.
• Total OPEX related to repair and maintenance of eligible and non-eligible assets.
The taxonomy-aligned KPIs have been calculated as:
• Taxonomy-aligned revenue KPI = aligned revenue/total revenue
• Taxonomy-aligned CAPEX KPI (additions) = aligned CAPEX/total CAPEX
• Taxonomy-aligned OPEX KPI (repair and maintenance) = aligned OPEX/ total OPEX
Maersk’s process for determining taxonomy-aligned activities (the numerator of the taxonomy KPIs) has been based on screening the identified eligible activities within each of the segments against the technical screening criteria for climate change mitigation.
For Ocean, revenue from aligned vessels has been prepared by applying an allocation key to total Ocean revenue. The allocation key is based on transport work from aligned vessels out of the total transport work during the year. CAPEX additions in relation to existing aligned vessels; 2) expenditures for existing vessels undergone retrofitting that meet the technical screening criteria and 3) milestone payments for ordered dual-fuel vessels incurred during the year. Aligned OPEX is the repair and maintenance expenditures in relation to aligned vessels incurred during the year.
For Terminals, revenue from aligned electrified equipment has been prepared by applying an allocation key to total terminal revenue. The allocation key is based on the carrying amount of aligned electrified equipment out of the total carrying amount of terminal assets (excluding assets under construction). Aligned CAPEX (additions) is the CAPEX additions in relation to electrified equipment, solar panels and charging stations incurred during the year. Aligned OPEX is the repair and maintenance expenditures in relation to aligned electrified terminal equipment incurred during the year.
For Logistics & Services, revenue from aligned activities, which includes electrical trucking and rail freight, has been prepared based on the following approaches:
• Trains: Maersk does not currently own or lease trains, which means that there is no related CAPEX or OPEX. The allocation of revenue is based on the revenue generated on electrified corridors and operated by vendors that have documented alignment with the EU Taxonomy criteria.
• Trucks: The preparation of the revenue, CAPEX and OPEX KPIs are based on the separate accounting that is kept for the electric trucks.
• Solar panels: CAPEX is identified based on regional accounting registrations. This activity is not relevant for revenue or OPEX.
For Svitzer, there are no aligned activities. Svitzer data is included until the day of divestment in 2024.
Do no significant harm (DNSH)
We have assessed and documented compliance with the DNSH criteria relating to the eligible activities in scope for Maersk’s Taxonomy reporting. Since we only screen for substantial contribution for ‘Climate change mitigation’, we have screened our eligible activities for DNSH compliance with ‘Climate change adaptation’, ‘Sustainable use and protection of water and marine resources’, ‘Transition to a circular economy’, ‘Pollution prevention and control’ and ‘Protection and restoration of biodiversity and ecosystems’. Only when we have been able to document compliance with all applicable DNSH criteria, we have assessed an activity to be aligned. Consequently, if an activity fails to meet one or more of the DNSH criteria, we have assessed that activity to be eligible but not aligned.
Minimum safeguards
Maersk and its subsidiaries are committed to conducting business in a responsible and upright manner and to respect human rights across our activities, in line with the Maersk Values. We endorse the principles of the UN Guiding Principles on Business and Human Rights (UNGPs) and the OECD Guidelines for Multinational Enterprises. We commit to respect all internationally recognised human rights referenced in the International Bill of Human Rights and the ILO Declaration on Fundamental Principles and Rights at Work. These rights include core labour rights such as the rights of freedom of association and collective bargaining, the rights to not be subjected to forced labour, child labour or discrimination in respect of employment and occupation and standards on working hours and the safety and health of workers. We implement our commitment to these via our Code of Conduct and other internal policies and procedures. Maersk’s compliance with the Minimum Safeguards as outlined in the EU Taxonomy regulation has been performed at a Group level and is based on the following assessment:
Human rights: The company is committed to conducting human rights due diligence (HRDD) as outlined in the UN Guiding Principles (UNGPs) and OECD Guidelines for Multinational Enterprises (MNEs). Please refer to Maersk’s Human Rights Policy. Maersk continuously identifies and assesses human rights risks via relevant due diligence processes. In 2021, the company conducted a corporate-wide human rights assessment, please refer to the 2021 Sustainability Report and the human rights information in this report for more. Further, there
is no indication that Maersk does not adequately implement HRDD resulting in human rights abuses, as the company has not been finally convicted in court cases on labour law or on human rights. Moreover, Maersk is committed to engaging with stakeholders through the mechanisms stated in the EU Taxonomy regulation, including OECD National Contact Points or the Business and Human Rights Resource Centre (BHRRC) and there are no signals that Maersk does not engage.
Corruption: Maersk has in place an anti-corruption policy and adequate internal controls, ethics and compliance programmes and measures for preventing and detecting bribery. Please refer to the governance and business ethics sections of this report. In addition, none of Maersk’s senior management, including the senior management of its subsidiaries, have been convicted in a court of corruption.
Taxation: Tax is treated as an important topic of oversight, anchored with the highest governing bodies in Maersk, and the company has put in place adequate tax risk management strategies and processes as outlined in OECD MNE Guidelines covering tax. Furthermore, the company has not been found guilty of tax evasion.
Fair competition: The company promotes employee awareness of the importance of compliance with all applicable competition laws and regulations and trains senior management in relation to competition issues. Compliance with competition laws and regulations is a core part of Maersk’s Code of Conduct, which Maersk employees are training in every year. Moreover, none of Maersk’s senior management, including the senior management of its subsidiaries, have been found in breach of competition laws.
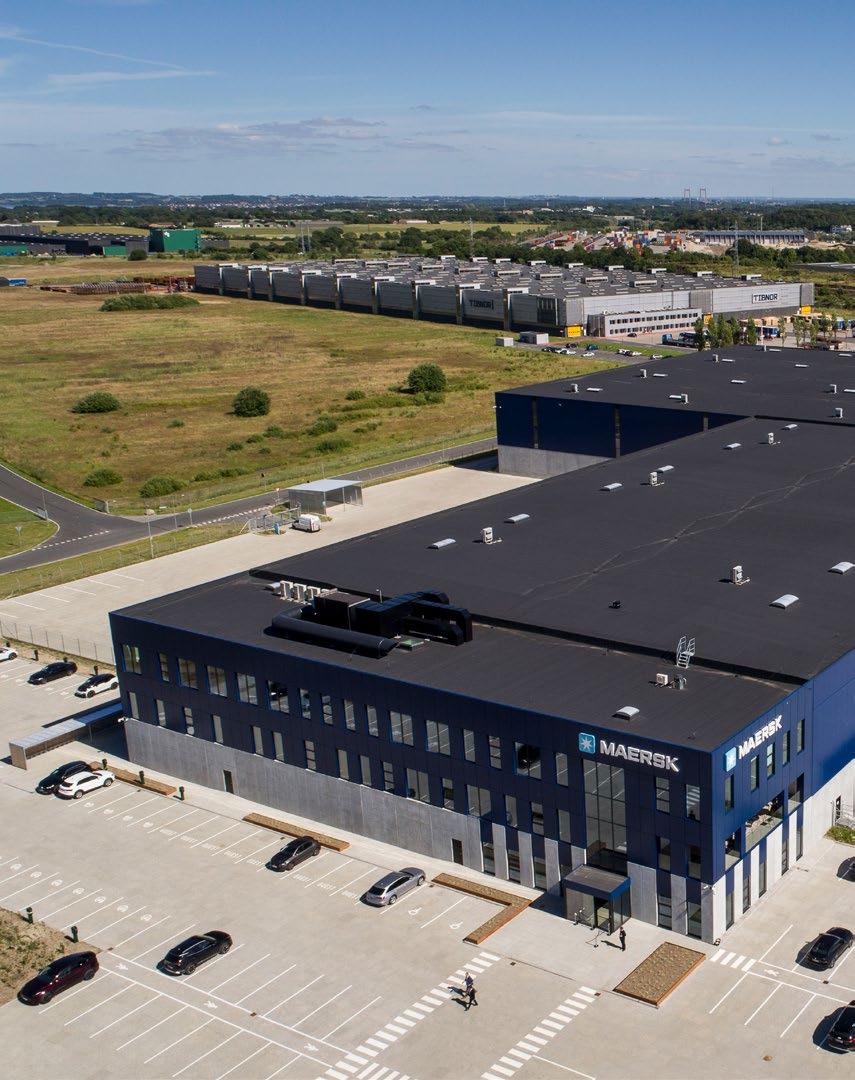
Environment and ecosystems
A.P. Moller - Maersk (Maersk) is committed to carrying out its business activities safely and securely with minimal impact to the environment. This includes the responsible use of natural resources such as land, water and natural materials for our operations, and managing risks to biodiversity and ecosystems as well as specific activities in our value chain, namely responsible ship recycling and sourcing of critical resources.
Since the adoption of the United Nations Kunming-Montreal Global Biodiversity Framework, we have seen new standards and initiatives emerging to guide corporate actions and disclosures related to nature and biodiversity. In 2024, Maersk performed an initial assessment using the LEAP (Locate, Evaluate, Assess and Prepare) framework created by the Taskforce on Nature-related Financial Disclosures (TNFD) to identify and assess our main nature-related issues, aiming to strengthen the foundation for environmental initiatives across our global operations and align commitments and actions with global standards.
Environmental and ecosystem management spans a range of topics handled by different functions and business segments, each supported by dedicated teams responsible for regulatory compliance and initiatives of varying scope. These efforts include initiatives such as the newly established landside environmental roadmap (see page 103), global standards such as our environmental and social impact assessment procedure, and other health, safety, security and environment (HSSE) procedures across our landside, terminal and ocean operations, often addressing multiple interconnected environmental topics. There are further significant synergies between our activities to drive energy transition, ensure social responsibility and mitigating nature-related impacts, not least related to responsible ship recycling and the sourcing of critical resources, including steel and fuels.
The LEAP assessment helped inform our double materiality assessment (DMA) (see page 66), enabling us to identify and understand key impacts to the environment, both actual and potential. As part of the DMA, we also identified material financial risks to our business related to hydrocarbon spills, lost containers and challenges associated with ship recycling. When it comes to physical and transition risks, more broadly related to nature and systemic risks of ecosystem collapse, an emerging risk looking beyond five years is an increased dependency on water in our supply chain for production of e-fuels. Additionally, we foresee transition risks driven by increased regulatory focus on ocean health, particularly in biodiversity-sensitive areas, and stricter regulations concerning for example, the use of scrubbers. Such emerging risks are being monitored and tracked as the landscape evolves.
The material environmental and ecosystem impacts, risks and opportunities in our own operations, identified as part of the 2024 DMA, centre around pollution, ecosystem health and biodiversity and waste management. We have further identified specific material activities in our value chain, including responsible ship recycling and the sourcing of critical resources, including steel and fuels.
These topics are explained in the sections below with regard to policies and approaches, actions and targets, with pollution, waste and ecosystem health and biodiversity combined in one section as these issues share a common approach and policies across Maersk operations. Maersk’s environment and ecosystems policy architecture document outlines all key commitments and principles as a comprehensive overview to employees and other stakeholders of efforts to avoid and minimise nature-related impacts, dependencies and risks across all five topics. The document is supported by internal business and issue-specific standards, requirements and policies, and is made available to relevant stakeholders via our intranet. Suppliers are required to adhere to the environmental standards outlined in our Supplier Code of Conduct. This includes demonstrating a commitment towards environmental protection by striving to minimise environmental impacts and, where material, proactively contribute positively to shared environmental ambitions.
Environmental impacts of our operations and our value chain
Air, land and sea transport air pollutants
Construction and operation of land-based assets Waste generation and disposal
and sea hydrocarbon spills
Spread of invasive species Vessel decommissioning (value chain)
and biofuel sourcing (value chain)
sourcing (value chain)
Species disturbance from traffic and underwater noise
Operational discharges to the sea
Containers lost at sea
Environmental impacts from our operations
As a global logistics company operating across ocean, land and air, we recognise our responsibility to manage impacts from our daily activities in terms of pollution, ecosystem health and biodiversity and waste management.
We are committed to avoiding and reducing pollution to air, land and sea across our operations. Maersk also strives to protect habitats and biodiversity, and actively participates in restoring ocean and land health in critical habitats. Waste management focuses on the need to reduce our waste footprint across our operations and to contribute to a circular economy. Across these topics, Maersk takes constant care to ensure our operations minimise and prevent impacts to the environment and people, and we align our operations with local laws and regulations to ensure compliance with environmental requirements.
Approach and policies
Maersk’s Environment & Ecosystems Policy Architecture is a crosstopic document that guides our employees on minimising our material impacts by adhering to the principles set out by our environmental management systems and global policies, including on pollution, ecosystems health and biodiversity and waste management.
Approach to pollution
Maersk continues to address pollution impacts by adhering to our management framework and guidelines for preventing and responding to pollution across our daily land and sea operations. This includes air quality management measures, chemical handling protocols, spill prevention standards and detailed emergency response manuals. Maersk collaborates with key industry stakeholders to tackle air pollution impacts, such as the Alliance for Clean Air. Through this partnership, we aim to reduce air pollution across the value chain by looking into innovative solutions, increasing transparency in reporting, and investigating target setting methodologies.
In our Ocean business, pollution is regulated through the International Convention for the Prevention of Pollution from Ships (MARPOL) and International Maritime Organization (IMO) regulations. Maersk uses a combination of low sulfur fuel oil and open-loop scrubbers to comply with mandatory IMO 2020 sulfur emission regulations. Open-loop scrubbers reduce sulfur oxide (SOx) emissions into the air, however, they transfer effluents to the marine environment, which may increase seawater acidity. Maersk recognises the ongoing environmental challenges that open-loop scrubbers present, and we continue working together with the World Shipping Council and the IMO to find industry-level solutions to this complex challenge.
Pollution risks from container losses at sea are directly attributed to severe weather and sea conditions. Maersk takes a technology-based approach to managing this risk through innovative new container lashing techniques, the installation of larger bilge keels to enhance stability and advanced weather and rolling monitoring solutions.
Approach to ecosystem health and biodiversity
Environmental and social impact assessments are performed for all new Logistics & Services and APM Terminals projects, to proactively identify environmental risks and impacts, extending beyond biodiversity and ecosystem concerns. We use defined screening criteria, including global and regional data sources, to predict and mitigate biodiversity and ecosystems risks and assess community impacts. Our work going forward will include integrating a more structured approach to consult with affected communities as part of environment and social screenings and assessments.
In marine contexts, we adhere to relevant standards and regulations, strive to minimise disturbances to marine wildlife, and continue to enhance our understanding of impacts and risks to ocean health through research projects and collaborative engagements with civil society and academics. Maersk does not currently use biodiversity offsets as a way to address our impacts.
We have a zero-tolerance policy towards transporting illegal wildlife and timber (available on Maersk.com), zero tolerance for transporting any products of shark and whale origin, and we are committed to enforcing stringent internal controls to prevent the misdeclaration and unauthorised transboundary movement of hazardous waste including plastic scrap, battery waste and industrial waste.
Approach to waste management
Maersk’s waste management requirements establish critical controls to reduce risks associated with waste generation and disposal, and guidance to fulfil these requirements to minimise environmental impact. We ensure compliance with environmental requirements by aligning our practices with local laws and regulations.
In our Ocean operations, Maersk fully complies with MARPOL Annex V regulations for waste and garbage management and maintains a strict zero-dumping policy. In line with these regulations, we are dedicated to reducing overall waste generation and have set a clear goal to minimise plastic waste across our fleet.
Targets and progress
In relation to pollution, Maersk does not have measurable targets in place. However, we strive to prevent spills through operational controls and monitor and respond immediately to mitigate impacts of spills. In 2024, Maersk had no significant (above 10 m3) hydrocarbon spills. We also strive to avoid the loss of any containers at sea. In 2024, five containers were lost overboard from the time-chartered vessel Celsius Brickell near the port of Mombasa, Kenya. The containers were all empty and the incident resulted in no pollution or injuries.
At present, Maersk also does not have group-wide targets specifically addressing waste management or ecosystem health and biodiversity. However, we continuously monitor our performance across both landside and ocean operations to gain a clearer understanding of our impacts. With regard to waste, we are currently working to enhance the granularity of data on waste generation and disposal across both land and sea, including establishing accurate baselines. This groundwork will position us to set meaningful commitments for the future.
Key actions
In 2024, Maersk finalised a landside environmental roadmap to define a strategy and critical focus areas for 2024-2026. This includes developing a stronger set of digital tools for tracking compliance and increasing incident and spills reporting, which will drive future transparency and target-setting. Updated environmental and social screening guidance will align our growth opportunities with corporate policy and ambitions. Maersk also made a significant USD 2m investment to improve HSSE performance, as part of our final integration process across

220+ warehouse sites. These projects include installation of spill kits, updated waste containers and signage, water infrastructure improvements, refrigerant retrofits and environmental site assessments.
Actions addressing pollution impacts
• To mitigate the risk of lost containers at sea and improve safety on our vessels, in 2024, Maersk introduced a heavy weather monitoring and alert technology solution that allows shore-based support teams to provide real-time notifications to vessels at risk of encountering extreme weather. Maersk also introduced a parametric roll risk management solution that enables crews to optimise route planning by incorporating real-time weather forecasts, thereby avoiding adverse seas that could cause dangerous rolling conditions.
• Maersk actively engages with the TopTier Joint Industry Project to scientifically address lost containers at sea and conducted our own technical research and model testing to identify the key contributing factors for container loss. We shared these findings through the IMO.
Actions addressing ecosystem health and biodiversity impacts
• As part of the LEAP assessment, in 2024, we identified critical business segments across our operations and value chain, analysing impact drivers and dependencies in relation to specific business activities and their potential effect on nature and ecosystem services. To evaluate our presence in biodiversity-sensitive areas, we utilised data from the World Databases of Protected Areas and Key Biodiversity Areas. Initial findings based on the geolocations of our sites per 31 October 2024, indicate that 48 terminals, 471 inland logistics facilities, and 269 offices are in potential biodiversity-sensitive sites. Further analysis in coming years will confirm whether these sites and assets negatively impact such areas or significantly depend on local ecosystem services. Our objective for the coming 1-2 years is to further refine our understanding of these links, enabling prioritisation, target-setting and action plans as well as overall transition planning and resilience analysis. Ocean transportation was excluded from the 2024 analysis, as our vessel navigation platforms do not currently include sensitivity layers enabling the assessment. We expect to be able to include impacts from vessels into the analysis in the coming years.
• Maersk complies with international conventions to perform pest control and as of 2024, we reached the target of 100% of our vessels having ballast water treatment systems installed, well in line with the deadline set by the Ballast Water Management Convention.
• We are improving our StarConnect AI-powered fleet energy efficiency platform to include capabilities to monitor our presence in marine protected areas and particularly sensitive sea areas, as well as adding additional whale zones based on updates to the World Shipping Council (WSC) Whale Chart. Implementation of this data will take place in 2025.
• Maersk actively engaged with regulators, state entities, shipping associations and NGOs in the development of revised guidelines on Underwater Radiated Noise (URN) Management, in line with IMO guidelines. This includes participation in awareness campaigns and workshops across the industry, URN measurements of fleet vessels to develop a baseline and conduct data analysis, and development of an action plan based on the guidelines.
Actions addressing waste impacts
• In 2024, Maersk started a pilot for a fleet-wide solution to create better visibility into different waste categories and landing and disposal requirements. When fully implemented, it will provide full tracking of garbage landed at end destinations and enable precise reporting for waste regulatory requirements.
• A global waste assessment was completed across Logistics & Services and APM Terminals in 2024, developing a baseline understanding of waste generation and management across our organisation. In Logistics & Services, an updated global waste standard, paired with compliance tools and updated training, will enable the setting of future targets around waste management and landfill diversion.
• Maersk continued its employee and community engagement around offshore and landside waste management through its annual Go Green Week in June 2024. The week included virtual and onsite events in all operational regions to raise environmental awareness and introduce colleagues and external stakeholders to waste management best practices.
• Maersk continued its recycled mooring rope pilot with C-Loop. In 2024 we had the first landing of recycled ropes in Europe, and exploration continues on several promising repurposing or recycling solutions with the hope of scaling more in 2025.
Responsible ship recycling
As a responsible ship owner, Maersk’s ambition is to ensure safe and responsible recycling of our vessels at end-of-life, benefiting workers, the environment, responsible yards and shipowners. Globally, there is an urgent need for financially viable, responsible recycling practices to meet the growing demand for large vessel recycling. By leveraging these retiring assets, the shipping industry can also contribute to decarbonising the global steel value chain. As an industry leader and a significant owner of steel assets, we recognise our responsibility to drive positive impact.
Approach and policies
Maersk’s responsible ship recycling standards outline stringent requirements to ensure that ship recycling processes are conducted safely and responsibly. These standards are established to prevent, reduce, minimise and, to the extent practicable, eliminate accidents, injuries and other adverse impacts on human health and the environment caused by ship recycling operations.
Maersk actively collaborates with stakeholders to foster a supportive regulatory environment, addressing the critical capacity challenges required to meet growing demands for responsible ship recycling. Advocating for effective policies to accelerate responsible ship recycling remains a key priority for Maersk, and we are positive about new 2024 regulations, which should clear the way for more EU-flagged vessels to be recycled at approved facilities outside of the EU.
This global consensus should be based on the rules of the IMO’s Hong Kong Convention for the Safe and Environmentally Sound Recycling of Ships.
Our CSR projects in the Alang, India area continue to make a meaningful contributions in the lives of the ship recycling workers. The mobile health unit (MHU) project provides complementary health care access, addressing skin and muscular-skeletal ailments, diabetes and oral cancer screening and providing health training.
Targets and progress
Maersk actively monitors the effectiveness of its policies and actions towards our qualitative target to increase global capacity for the responsible recycling of post-Panamax vessels.
Key actions
• Maersk successfully completed the recycling of Maersk Patras in May 2024 at Alang, India, and Jeppesen Maersk and Alexander Maersk at Aliaga, Turkey, in October 2024 with zero safety or environmental incidents.
• To create further global opportunities for recycling post-Panamax vessels, Maersk signed a memorandum of understanding in July 2024 with Kingdom of Bahrain ministries that aims to develop local post-Panamax recycling capacity and lower steel ecosystem GHG emissions through government and industry collaboration.
• As part of our commitment to the broader development of the Alang area, the mobile health unit in Alang provided 15,000 out-patient department services in 2024.
We also work to create global opportunities for responsible post-Panamax ship recycling, where recycling capacity shortfalls can only be addressed through global consensus on the approval of more yards with appropriate safety and environmental standards. Alang impact assessment
We continue monitoring the impact of Maersk’s ship recycling activities in Alang, India. The data below covers the period 2017-2024, during which 17 vessels were responsibly recycled at six yards, engaging more than 1,200 workers. Please see the full assessment on maersk.com
17 vessels responsibly recycled
Sourcing of critical resources
Effective resource management and reducing the impact of our sourcing activities across the value chain are foundational to our ESG priorities. We strive to use resources efficiently across the company, with a focus on avoiding and reducing impacts throughout the upstream supply chain, particularly for critical resources which Maersk is dependent on such as steel and fuels.
Approach and policies
Maersk’s policies relevant for sourcing of steel and green fuel are outlined in the Environment & Ecosystems Policy Architecture. They include our specific green fuel sustainability requirements and our approach to deepening our understanding of the steel value chain and mitigating its negative impacts.
Shipbuilding and large infrastructure projects across our operations rely heavily on steel, a material associated with significant environmental impacts. Maersk is committed to increasing the use of lower GHG emissions steel by collaborating with key industry stakeholders. One particular challenge in developing an ecosystem around lower emissions steel is the lack of standards across the value chain. Maersk is working with the Climate Group (under the SteelZero initiative) and industry partners to develop criteria for responsible steel sourcing practices and to create alignment around low GHG emissions steel standards and certifications.
As part of our energy transition, we are shifting from fossil fuels towards the use of green fuels. To ensure these fuels are sourced and assessed responsibly, Maersk has established environmental sourcing requirements for biofuels and methanol across all company operations. Read more under climate change
Targets and progress
Beyond GHG emissions, we do not currently have targets to address the wider environmental impacts from the steel and fuel value chains.
Key actions
• As part of our commitment through the SteelZero initiative to transition to using 50% lower emission steel by 2030 and setting a clear pathway to using 100% net-zero steel by 2040, in 2024, Maersk continued the collaboration with the Climate Group to define environmental standards for lower emission steel.
• As part of our science-based climate targets, we are committed to adhering to our green fuel standards to ensure responsible sourcing throughout the transition. In new offtake agreements with Goldwind and LONGi, we are in continued dialogue with production partners to ensure alignment with our green fuel requirements in the development and production phases of the agreements.
Performance data
Environmental incidents
E2-6_04
Operating expenditures (OPEX) in conjunction with major incidents and deposits
1 Not covered by the Independent Auditor’s limited assurance report.
During 2024, we recorded no oil spills above 10 m3, making 2024 the third consecutive year without a significant oil spill from our operations. In February 2024, we lost five empty containers following a vessel collision near Mombasa, Kenya. No pollution or people injuries were caused from the incident but both vessels suffered damage. The number of containers lost at sea has decreased over the last three years, indicating that our efforts to improve the handling of containers are working. The operational expenditures incurred during 2024 in relation to major environmental incidents are linked to the clean-up and salvage operation undertaken following the loss of 46 containers in the North Sea in December 2023. The operational expenditures relate to the additional costs that are not covered by insurance.
Air pollutants
ACCOUNTING POLICIES
Hydrocarbon spills > 10 m3
Spills are reported as the number of uncontained hydrocarbon liquids spills greater than 10 m3, resulting from any unintended, irreversible release associated with current operations.
Containers lost at sea
Containers lost at sea is based on the recorded number of containers (independent of size) lost at sea during the year. This includes containers lost at sea from own and time-chartered vessels, but does not include containers falling overboard in ports and other cases where containers will be picked up.
Operating expenditures (OPEX) in conjunction with major incidents and deposits
The operational expenditures (OPEX) related to major environmental incidents include the clean-up and salvage operation costs that are not covered by insurance in conjunction with significant oil spills (> 10 m3) and containers lost at sea from Maersk-owned vessels incurred during the financial year.
1 Not covered by the Independent Auditor’s limited assurance report.
For 2024, Maersk’s air pollutant emissions increased as a result of and generally in line with the increased fuel oils consumption caused by the extended distance linked to the Red Sea situation and re-routing of vessels around the Cape of Good Hope throughout 2024. Black Carbon emissions remained on par with 2023, which was a result of a general higher engine load contributing to more efficient combustion.
ACCOUNTING POLICIES
Air pollution
Air pollution is the amount of air pollutants emitted in relation to Maersk’s operations, besides GHG emissions. The air pollutants included are SOx NOx, Non-Methane Volatile Organic Compounds (NMVOCs), carbon monoxide (CO), Particulate Matter (PM10 and PM2.5, and Black Carbon (BC)). By default, PM10 also includes smaller particles (hereunder PM2.5 and BC), which are also reported separately because these fractions of particulate matters have differing impacts on environment and health than the coarser fractions.
Air pollutants have been prepared and stated based on the first version of the Stockholm Environment Institute’s (SEI) reporting guide, except for BC and PM10 reporting from the fleet of Maersk, which is based on the methods outlined by IMO in MEPC 75/7/15 as our data availability allows for IMO’s more accurate assessment. In case of scrubber use, SOx pollutants are reported based on Clean Cargo guidelines, where SOx output is assumed to be maximum for the operating area in which the vessel spends 80% of time.
Waste generated
E5-5_15
1 Not covered by the Independent Auditor’s limited assurance report.
2 Restated from 533k tonnes and 315k tonnes for ‘waste’, and ‘non-hazardous waste’, respectively, due to the application of an incorrect unit conversion from a reporting entity in 2023.
For 2024, Maersk recorded an increase of approximately 8% in total waste generated across its operations compared to 2023. The increase is mainly driven by an increased number of vessels in Maersk’s operations.
Resource inflows
EFRAG ID Indicator
E5-4_02
Total weight of steel consumed Tonnes 73,394
Maersk procures and uses steel for manufacturing containers. In addition, significant amounts of steel are used by suppliers and partners in the value chain to produce vessels, cranes and other heavy assets that Maersk uses in its operation. We only report on the weight of the steel we directly procure and use to manufacture containers.
ACCOUNTING POLICIES
Total weight of steel consumed
ACCOUNTING POLICIES
Waste
Waste is reported as the sum of all waste types generated, with further bifurcation in hazardous and non-hazardous waste types. Non-hazardous waste primarily consists of municipal and industrial waste, such as food waste, pallets, cardboard, general trash and metal and wood scrap.
Uncertainties and estimates
Waste data is reported by entities and is based on a combination of actual numbers and estimates.
For land-based operations, waste data is sourced from billing and accounting systems or from the procurement/ supply management department. For some offices and minor sites, where it is challenging to obtain actual waste data, estimates based on FTE counts are used to ensure completeness in waste reporting.
For waste from vessel, conversion factors for all MARPOL Annex V garbage categories have been developed and used on the actual waste generated by 10 vessels within three different vessel size groups (sample of 30 vessels in total). The average waste generated by vessels within each of vessel size groups has been used to extrapolate waste numbers for the entire fleet.
Total weight of steel consumed is the weight of steel used for producing containers during the year. The weight is calculated based on the number of containers produced and the bill of materials related to those containers.
Social
A.P. Moller - Maersk (Maersk) strives to provide a safe and inspiring environment for our people to grow, develop and thrive as a diverse and global team. Our actions are guided by our Purpose and Core Values, international standards and the expectations of our key stakeholders.
HUMAN CAPITAL
Target by 2025 Employee engagement survey score in the 75th percentile of global norm
SAFETY AND SECURITY
Target by 2024 (recurring)
100% of learning teams completed following high potential incidents
DIVERSITY, EQUITY AND INCLUSION
Targets by 2025 • >40% women in management
• >30% diverse nationality (non-OECD) of executives
EMPLOYEE RELATIONS AND LABOUR RIGHTS
Target by 2024 (recurring)
100% of employees (in scope) trained in employee relations and labour rights
Social
Overview of Maersk’s material impacts, risks and opportunities related to Social
impact
Human capital
Attracting and retaining critical talent
Inability to retain and attract the right workforce for key critical capabilities
Inability to retain and attract key critical capabilities could impact the ambition to deliver on the integrator strategy. Where
Diversity, equity and inclusion
Harassment of vulnerable groups
Risk of harassment creating an unsafe working environment for underrepresented or vulnerable groups in our workforce
Underrepresented and vulnerable groups are at increased risk of harassment and violence. This can take place in office environments, warehouses or on ships, the risk being higher for frontline workers and in highly male-dominated environments. This can pose a financial risk to Maersk in terms of costs of remediation and reputational damage.
Discrimination in the workforce
Risk of discrimination based on ethnicity, gender, nationality or disabilities
Potential discrimination within our workforce, based on ethnicity and nationality given a large global workforce and the variety of office environments, and on the basis of gender in traditionally male-dominated parts of the business. Underrepresented and vulnerable groups (such as persons with disabilities) may also be at increased risk of discrimination.
Safety
and security
Safety of our workforce
Risks of work-related injuries, life-altering incidents and fatalities
Risks of work-related injuries, life-altering incidents and fatalities for workers given the nature of the transport and logistics sectors. This can pose a financial risk to Maersk in terms of costs of remediation and reputational damage.
Exposure to global/local security risks
Exposure to global/local security risks
Global and local geopolitical instability and conflicts result in security risks where criminals, terrorists and/or others with ill intent expose our employees to health and safety risks, e.g. piracy and terrorism. Financially, this can cause disruptions to our operations, which may also impact our ability to decarbonise, and costs related to safety incidents.
Where
Where
Employee relations and labour rights
Forced labour
Forced labour such as debt bondage and withholding of passports
Risk of debt bondage and withholding of passports for contracted workforce and value chain workers. This risk is higher for large infrastructure projects with a migrant workforce.
Working hours and adequate wages
Excessive hours worked for contracted frontline workers Impacts related to working hours and overtime for contracted frontline workers, such as truck drivers, seafarers and migrant workers.
Ensuring that workers are paid an adequate wage
In some supplier categories, there is a potential risk of inadequate wages being paid for contracted labour.
Adequate housing and sanitation
Adequate housing and sanitation facilities for own and contracted workforce
For contracted workers and in the broader value chain, on-site housing is provided to workers at e.g. terminal constructions, warehousing, shipyards and shipbreaking yards. These spaces can potentially be substandard, crowded and not adequately hygienic – aggravated in some contexts by the lack of gender segregation.

Our workforce
The people of A.P. Moller - Maersk (Maersk) are the foundation of our success and the ones who deliver on our customer promises, including Environmental, Social and Governance commitments. Our ambition is to ensure that our people thrive at work by providing a safe and inspiring workplace. This is driven by efforts within human capital, diversity, equity and inclusion (DE&I), safety and security and employee relations and labour rights, and underpinned by a commitment to respecting human rights.
We employ 100,000+ people across almost 130 countries in the world. Our team includes office-based professionals and technology experts who develop and bring Ocean, Logistics & Services and Terminals offerings to life. We also employ frontline workers who fulfil our customers’ logistics needs, such as warehouse staff, truck drivers, terminal operators and aircraft maintenance teams, as well as the 12,000+ dedicated seafaring colleagues sailing our vessels.
In addition to own employees, we also rely on a large extended workforce of third-party contracted labour (non-employee workers) who are not directly employed by Maersk, but work on our premises with us and for us in our customers’ value chain, especially in Logistics & Services and Terminals. Our business model also includes impacts and risks to workers in our value chain. These include workers on chartered/ leased assets and workers of our suppliers that are not part of our contracted workforce.
The complexity of our operations and workforce, combined with diverse local labour regulations, standards and practices across our global footprint, creates potential people-related impacts and risks. Whether our people have office-based or frontline roles, or whether they are employees or contracted labour in the value chain, we strive to safeguard fair and safe working conditions and the ability to make meaningful contributions through growth and learning. Doing this requires active management of several impacts and risks.
An inability to retain and attract employees could impact Maersk’s ambition to deliver on our integrated logistics business model, especially for specialised experts in technology and logistics.
Given the nature of the transport and logistics sectors, Maersk employees and non-employee workers under our duty of care are exposed to health and safety risks, including work-related injuries, life-altering incidents and fatalities. Maersk’s broad footprint also exposes our assets and employees to security risks, especially with the current increase in geopolitical instability such as the Red Sea situation.
Our workforce may be exposed to the risk of harassment, discrimination or violence that could create a physically or psychologically unsafe working environment. This risk is especially higher for underrepresented or vulnerable groups in our workforce.
We actively manage the risks and impacts of our operations on labour rights. Frontline employees and contracted workers face risks related to excessive working hours and overtime. Contracted workers might also face demands to work excessive hours, or risks of forced labour where workers may face restrictions on their freedom of movement due to the retention of their passports. Ensuring that workers are paid an adequate wage is also a labour rights risk, as is securing adequate housing and sanitation facilities for own and contracted workers. Both risks are generally higher for contracted workers and are present in all high-risk supplier categories. Across all of Maersk’s workforce risk categories, there is also a risk of limited visibility across the value chain, especially tier 2 or 3 suppliers and parts of the downstream value chain.
Maersk’s People strategy
Our People strategy outlines the people principles which are our north star for all people practices and policies. It includes employee attraction, development and engagement activities to ensure workforce continuity and stability, while unleashing employees’ energy, focus and commitment to executing our strategy.
The priorities of Maersk’s People strategy for 2024, a multi-year effort launched in 2021, are:
• Enable teams that collaborate, to deliver with passion towards goals, maximise individual and team results and pursue continuous learning and growth.
• Lead with intent, embodying our leadership commitments.
• Scale frontline capability to drive growth, create competitive advantage and great workplaces for all.
• Drive a culture of empathy, care and compassion which empowers everyone to perform, lead and deliver.
Every year, the people priorities, with specific focus areas, are set and communicated to the entire organisation. Employees and Constant Care are both Core Values to Maersk and fully aligned with our People strategy. We carefully monitor and analyse the impact of our People strategy through the biannual employee engagement survey (EES), which helps us shape our programmes and targets. In 2024, we performed a second organisation-wide inclusion survey to gain valuable insights from employees and lessons for improvement on DE&I performance.
Maersk’s
approach to human rights
Many aspects of our business touch on human rights, including employees’ working conditions, health and safety, how vessels are recycled, how we use digital data and technologies and suppliers’ business practices. Our conduct within our own business and through business relationships can have a significant impact on people, communities and society, both positive and negative. Human rights perspectives inform and guide several categories in our ESG strategy and governance approach.
Approach to human rights
Recognising the potential for global trade and supply chains to make positive contributions to society and socio-economic development, Maersk is committed to respecting human rights in its own operations and entire value chain. Maersk’s approach to human rights is founded in our Purpose and Core Values and based on a long standing commitment to the UN Guiding Principles (UNGPs) on Business and Human Rights and the OECD Guidelines for Responsible Business Conduct, helping us navigate the often complex impacts of global trade on people. These commitments and this approach are formalised in Maersk’s Human Rights Policy Statement, available on Maersk.com
Human rights are anchored in Corporate Sustainability, headed by the Chief Corporate Affairs Officer. The department collaborates with several key functions such as Legal, Compliance, Employee Relations, Safety and Resilience, the People function and Sustainable Procurement to ensure that human rights considerations are integrated throughout the business and value chain. Maersk’s ambition is to continue aligning our business practices with the UNGP and ensure that human rights considerations are integrated into due diligence processes and ESG governance mechanisms.
In 2024, a key focus has been to initiate preparations for compliance with the EU’s Corporate Sustainability Due Diligence Directive (CSDDD), which will be mandatory for Maersk from 2027. As part of this, we continued engaging and training key functions and human rights
issue owners to support and equip them with the knowledge and tools to handle dilemmas in a manner sensitive to potential human rights impacts.
We engage regularly with key stakeholders, such as customers and investors, as well as external experts on human rights topics, as we see increasing regulation and growing expectations from stakeholders. We continued to mature key internal due diligence processes, and we are also addressing emerging risks from new business activities, such as the development of the green fuel supply chain and the continued expansion of logistics operations. As a consequence of increasing geopolitical tensions across the world, we recognise the need for enhancing our approach to human rights risk assessments when operating in conflict-affected areas.
As a global company with a footprint all over the world, we serve all types of customers, both companies and states. In line with our commitment to ensuring responsible business practices aligned with international standards, we perform risk assessments and heightened due diligence on certain transactions, including in relation to armed conflicts and military cargo. This is also to ensure we comply with arms embargoes.
In May 2024, NCP Denmark (the Danish Mediation and Complaints Handling Institution for Responsible Business Conduct) concluded on a case raised against Maersk relating to the operations of the joint venture Douala International Terminal in Cameroon, following a two-and-a-half year investigation process. While the vast majority of raised complaints were dismissed, including complaints related to the specific joint venture, we acknowledge the recommendations by NCP Denmark related to our joint venture framework and promoting responsible business conduct in entities where we do not have full control, as well as exercising due diligence with regards to documentation and follow-up on policy implementation. We have already undertaken updating our joint venture framework, as well as expanded our training for APM Terminals-nominated board members and representatives for joint venture entities.
We actively engaged with NCP Denmark throughout the course of the investigation over two-and-a-half years, with the intent to demonstrate and explain how we implement our commitment to respecting the OECD Guidelines for Multinational Enterprises. We valued the opportunity to reflect upon and review how we implement and document
our respect for international standards and have taken a variety of learnings from the process, including codifying initiatives that we had underway into our governance frameworks and due diligence processes, ensuring our commitment and approach to respecting the OECD Guidelines are unequivocally documented.
Maersk’s salient human rights issues
In 2021, we conducted a corporate-level human rights impact assessment founded in the OECD guidelines. The result of this exercise was five prioritised salient human rights issues that we continuously address. This assessment has also informed the 2024 double materiality assessment (DMA), reconfirming the materiality of the human rights issues.
These include health and safety in the supply chain, violence and harassment at work, impacts of climate change and decarbonisation (just transition), access to remedy and working conditions in the supply chain. Read more about these issues in the relevant topical sections of this report.
Human capital
Maersk’s ability to deliver on customer needs and our business strategy ambitions depends on highly engaged employees and internal capabilities in critical areas. To ensure that we attract and retain the right talent, our aspiration is to create an engaging environment for all colleagues and to be a company where employees can develop and have thriving careers.
Policies and approach
Our People strategy outlines our vision, core principles and capabilities. It includes engagement as an outcome of excellent leadership, clear direction and workspaces that are inclusive. Therefore, engagement is included in all people practices.
Maersk’s approach to human capital as an ESG priority includes three focus areas: employee engagement, employee attrition and talent development. These speak to our continuous efforts to attract, engage and retain employees and ensure continuity and stability of, and for our workforce.
We work towards minimising negative impacts arising from our operations through careful monitoring and analysis of employee engagement and attrition. In particular, our employee engagement survey (EES) provides valuable insights into performance and helps us pinpoint areas of improvement. Both functional and operational leaders receive the results of the EES and are responsible for developing action plans to address survey findings, with the support of dedicated resources in the People function. In response to the survey results, we conduct listening sessions, refine processes and policies as needed and invest continuously in leadership and overall capabilities.
Biannual progress updates take place, supplemented by internal campaigns on performance management tools and training programmes, as part of the People strategy. Multiple training and development resources are available to employees through our internal talent development (MPACT) framework to maximise talent performance and ensure alignment and career growth.
Targets and progress
In support of our ambition to attract and retain the right talent and create an engaging environment for all colleagues to develop and thrive, we evaluate progress against our strategic target to achieve an EES score in the 75th percentile of Gallup’s global norm. The EES is performed twice a year.
The result of the second EES of 2024 showed an increase in engagement to the 65th percentile compared to a 60th percentile score at the end of 2023. Another noteworthy positive trend is that 92% of colleagues consistently participated in both of the 2024 surveys compared to 85% in 2023. The survey also highlighted consistent strengths and opportunities compared to the previous two surveys, notably in the areas of recognition and development, attributed to the continued adoption of MPACT and the embedding of a performance culture. These improvements suggest that more leaders are dedicating time to review performance, recognise good work and encourage development. Along with the EES, we track employee turnover with the aim to sustain a healthy attrition rate aligned with the industry performers. In October 2024, the employee turnover rate was 11%.
Key actions
In 2024, we progressed across our People strategy’s main focus areas:
• The MPACT framework continued to strengthen our performance culture by driving objective setting and performance conversations, with adoption rates reaching 87% and 82% across Maersk, respectively.
• Employee development solutions were strengthened with the launch of the Maersk Academy framework attracting over 750,000 visits, an expanded mentoring solution with 2,400 participants and the introduction of a coaching programme.
• Leadership solutions were consistently promoted to support leaders in empowering employees in their daily work. Each people leader is expected to create an action plan based on the EES results and leverage the MPACT talent and development framework alongside other targeted leadership initiatives, including specialised programmes and leadership development solutions. Additionally, we elevated the succession management process to a global level, enhancing visibility for leaders and fostering the growth and development of talent.
The result of the second employee engagement survey of 2024 showed an increase in engagement to the 65th percentile compared to a 60th percentile score at the end of 2023. While this is a solid result, more work is needed to reach the 75th percentile target by 2025.
Diversity, equity and inclusion
At Maersk, we aspire to facilitate diversity of thought and create a more diverse, equitable and inclusive workplace, where our employees feel able to bring their whole selves to work and contribute to their fullest. This is a Core Value of Maersk and essential to supporting our customers’ evolving logistics needs and growing our business. By facilitating a culture where everyone feels respected and is treated fairly, we gain access to a larger, more diverse pool of talent.
Policies and approach
Two main policies anchor our diversity, equity and inclusion (DE&I) approach: a diversity, equity and inclusion policy and an anti-discrimination, harassment, bullying and violence policy. These policies are publicly available on Maersk.com and accessible on our internal intranet site along with training materials.
Our diversity, equity and inclusion policy outlines our holistic view on diversity, grounded in our Core Values, as well as our targets and approach to underrepresented groups in our workforce. In 2023, we introduced a diverse abilities policy to provide even stronger support for this specific, underrepresented group. We call disabilities ‘diverse abilities’ to focus on our colleagues’ skills and capabilities, rather than their perceived limitations.
Maersk’s anti-discrimination, harassment, bullying and violence policy articulates that discrimination, harassment, and bullying of employees are not tolerated in any country where we operate. This is further codified in our Commit governance rules, through our Code of Conduct, and in our commitment to the UNGP Global Compact and UNGP on Business and Human Rights. These policies are developed with an inclusion perspective, going beyond minimising harm.
As a core strategic topic for Maersk, DE&I is anchored in the Executive Leadership Team and is driven by a dedicated global diversity, equity and inclusion team as well as by employees across the organisation.
Beyond diversity targets, we prioritise inclusion as a catalyst for behavioural change, shifting mindsets from passive allyship to active advocates. To foster an inclusive culture, we conduct an organisation-wide inclusion survey to guide functional team action plans so we can take a targeted approach to embed equity, bring inclusion to life and continuously measure progress. In addition, we gain valuable insights from our employees and lessons for improvement from feedback during our annual global diversity, equity and inclusion week, diverse abilities week, pride celebration, black history month and other campaigns.
A new employee resource network (ERN) in Oceania brings the total to 42 ERNs, all dedicated to integrating our Global DE&I strategy across regions. Twice a year, the ERNs join forces with the Global DE&I Team to discuss best practices and collaborate to strengthen collective efforts.
Targets and progress
To create a more diverse, equitable and inclusive workplace, we have set a range of strategic targets:
We set a gender diversity target of above 40% women in management by the end of 2025. In 2024, the number remained on par with 2023 at 35% with continued impact from the 2023 reorganisations. With slower progress due to reorganisations and new hire restrictions, we took steps to maintain representation – especially at leadership levels – and to improve gender balances in hiring in 2024. These included adding a DE&I statement to all job advertisements, hiring manager trainings, launching a social media advocacy programme and mandating the use of gender language tools.
Taking into account broader diversity aspects, we also set a target of having above 30% of diverse nationalities (non-OECD) of executives. In 2024, the number increased by 1 percentage point, slightly reducing the gap towards our 2025 target. In 2024, we expanded the original scope of our talent sponsorship programme for women in leadership to also include talent of underrepresented racial and ethnic groups.
To address some of the remaining challenges in our diversity targets and the inherent limitations of count-based targets, we introduced a new ‘diversity in teams’ metric, which looks at gender and nationality in our leadership pipeline. In 2024, our score was 58% on gender and 85% on nationality. Measured at the team level, diversity in teams builds systemic equal opportunity across different roles at leadership levels.
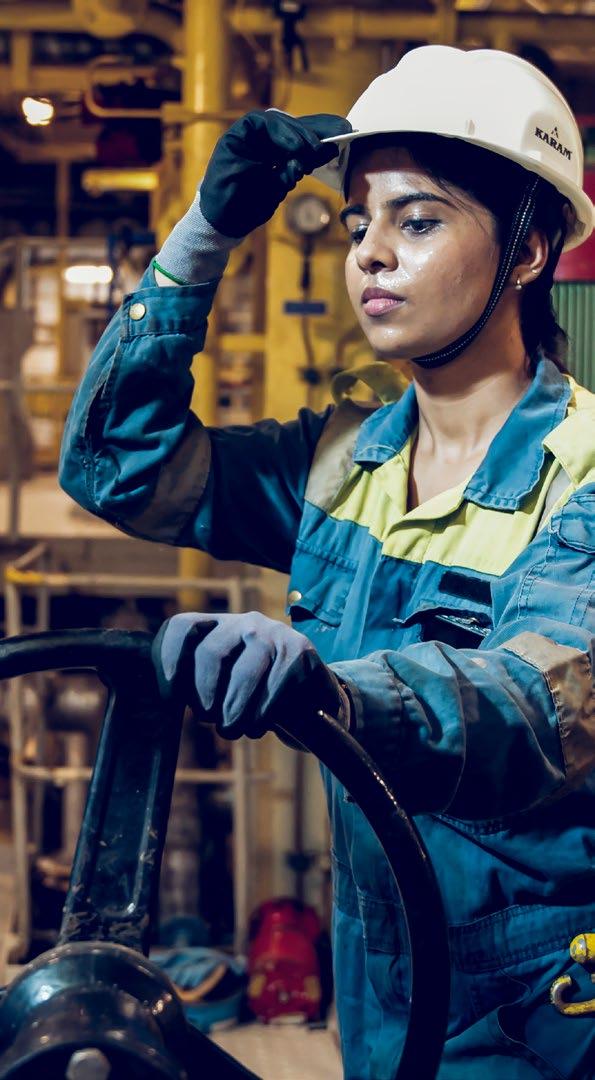
Following a successful 2024 test, we will roll out team-wide tailored plans in 2025, with targeted actions intended to have greater impact than generic diversity programmes and trainings.
Key actions
Maersk progressed in many DE&I engagement initiatives during 2024:
• Our second inclusion survey was launched across 126 countries. The results showed a shared pride in working at Maersk and its overall culture of inclusion. 88% of respondents agreed that Maersk hires from a variety of backgrounds. The results also highlighted equal opportunity as a focus area for improvement in 2025.
• Over 5,000 colleagues were identified as having diverse abilities in the inclusion survey and recorded a positive inclusion experience. A dedicated programme was developed in 2024 to support our colleagues’ and wider teams on hiring and onboarding, in line with our diverse ability policy introduced in 2023.
• Targeted efforts in developing and hiring underrepresented genders included expanding our talent sponsorship programme to North America and improving gender balance in our hiring process through e.g. social media advocacy, inclusive language, DE&I statement in job ads and training of hiring managers.
• In 2024, Maersk reached the important milestone of employing almost 6% of female seafarers across the fleet. According to the International Maritime Organization (IMO), the industry average is 2%. We actively promote gender diversity at sea through special training programmes for young women in select markets, positioning Maersk as a maritime employer with career opportunities, and collaborating with schools and universities.
• A series of initiatives under our One team together programme to transform the working culture at sea continued to progress in 2024, including actively attracting, onboarding, training and developing colleagues at all levels, with a strong focus on extensive leadership development for senior officers.
Safety and security
Safety and security at work is a basic human right, and Maersk has a duty of care to ensure the health, safety and security of everyone who works with us.
Policies and approach
Our commitment towards health, safety, security and environment (HSSE) is anchored in our company values and codified in Maersk’s HSSE Policy. The policy, publicly available on Maersk.com, clearly sets our obligation , clearly sets our obligation for healthy, safe, secure and environmentally responsible business practices and applies globally to all Maersk entities, employees and everyone working under Maersk’s supervision. This means that all workers on our sites, including both own employees and contracted workers that work under Maersk’s supervision, are covered by Maersk’s safety management systems. The HSSE Policy is supported by and unfolded in detail in our HSSE Commit Rule and the Maersk HSSE Management Framework. Our Supplier Code of Conduct further set expectations for our suppliers to uphold responsible business practices including on safety (see Sustainable Procurement pages 130-131).
These commitments are well reflected in our legacy operations. Since embarking on our integrated logistics strategy, Maersk has added hundreds of warehouses and thousands of new logistics colleagues to complement ocean and terminal operations. The speed of this growth, as well as expansion into new locations with diverse practices and safety cultures, has transformed and expanded our HSSE risk profile. To meet this challenge, we are working fast on a global scale to bring the landside asset portfolio up to our global HSSE standards and to build the capacity, capabilities and work culture required to work safely and securely everywhere that we operate. In these efforts, we draw on and benefit from the experience and solid safety culture we have developed over decades in our Ocean and Terminals businesses. Our efforts are guided by four principles equally anchored in safety theory and operational experience. First, ‘we lead with care’ – leaders engage, listen and respond to what frontline colleagues need to do their work safely. Second, ‘we learn and adapt’ by building capacities
to manage serious risks through controls and safeguards that protect people while improving business efficiency, using innovation and safetyby-design principles. Third, we insist that ‘our people are the experts’ –inspiring a culture of learning and engagement by promoting employee voices, elevating engagement and sharing learning across our business. Fourth, we make sure ‘we are resilient’ by planning for and monitoring supply chain disruptions and ensuring we have the backup capabilities for key resources to keep customer cargo moving.
We continuously monitor and manage evolving safety and security risks. For example, the introduction of new dual-fuel capable vessels as part of our energy transition brings new technologies, equipment and fuels that have different safety characteristics. Maersk has robust procedures and training in place to ensure that the crew on these vessels are well equipped for safe operations. In our Terminals business, we are ensuring that the electrification of container-handling equipment is safe and inclusive to frontline terminal colleagues with upskilling and specialised training and procedures in topics like electric battery maintenance and fire prevention.
As part of our security and business resilience (continuity planning and crisis management) framework, we focus on protecting people, assets, cargo and the Maersk brand. Our threat intelligence team (forecasting) collects, analyses and prioritises security or continuity risks, which are then presented for discussion with the regional security and business resilience managers. This supports informed risk decision-making and mitigation strategies on topics such as people-related risks, cargo theft and severe weather disruptions. Our approach is to leverage technology and data to understand customer and legislative expectations and the local environment, and to standardise controls and risk management.
Targets and progress
To support capacity building to manage critical risks and identify improvement areas, we have set strategic targets of ensuring that 100% of learning teams are completed following a high potential incident. In 2024, we conducted focused training towards learning teams across our portfolio, aiming to address all high potential incidents, ending the year at 99% completion. Following a Terminals high potential incident review, Terminals identified traffic management as a key risk and conducted a Kaizen activity to drive improvements and standardise practices across terminals.
100% of learning teams completed following a high potential incident (by 2024) (2023: 99%)
Key actions
2024 was marked by heightened geopolitical threats, conflicts and instability. Protecting cargo from security-related disruptions, while ensuring reliable and resilient supply chains is critical to our growth and reputation. We are also moving with speed and resolve to bring every logistics site up to Maersk’s global standards and provide everyone with HSSE responsibilities with the tools, training and support needed to fulfil their roles. In 2024, this included:
• 15,000 safety and security Gemba walks conducted across Ocean, Logistics & Services and Terminals operations.
• Completion of a one-time HSSE assessment of 354 logistics sites, closing 95% of the HSSE and business resilience improvement actions, including new safeguards, security equipment and training. The findings also laid the foundation for a capability study to build an HSSE learning academy to upskill our workforce in 2025.
• Launch of a three-year global campaign to help every Maersk warehouse and depot implement our HSSE management framework.
• A new global HSSE assurance team to provide regular validation of our HSSE performance and improvement journey.
• Successfully managed more than 19 crisis management teams across a variety of crises from the Red Sea situation to vessel fires.
• Reviewed resilience maturity for third-party terminals (+20) linking to the Gemini network. In 2025, we will continue supplier resilience evaluations and assessments with procurement to understand vulnerabilities and develop improvement plans.
• Development of a global resilience intelligence tool to standardise and better enable site-level business continuity planning.
• Training of 191 employees as business resilience coordinators at the site level, enabling them to develop and implement business continuity plans.
• New in-house capability to identify security and resilience-related threats, enabling pre-emptive risk mitigation. This included refining our data landscape to ensure internal metrics and external threats are properly identified and assessed as well as improved data aggregation across Security and Resilience functions.
Fatalities in 2024
Regrettably, we had one fatal incident involving a contracted colleague in a warehouse in the Philippines on 26 December 2024. While we have seen a significant reduction in the number of fatalities since 2022, the loss of a colleague underscores that we still have much work to do on understanding and staying ahead of our risks and on building the right safety culture. In addition to the fatalities recorded for employees and contractors under Maersk's responsibility, we recorded one fatality involving a value chain worker on a construction site within our premises. This individual was employed by the construction company and not working under Maersk's responsibility.
Employee relations and labour rights
The way we treat employees and their representatives is fundamental to responsible business practices and grounded in respect for internationally recognised labour rights in all of our workplaces. Respect for fundamental labour rights is an essential part of Maersk’s social commitments, which include offering decent, fair and equitable working conditions for all employees. We assess potential risks affecting both own employees and contracted/third-party labour and take proactive and corrective measures to ensure our operations and growth align with our commitments on social responsibility.
Policies and approach
Maersk has two main employee relations and labour rights policies. The Commit Rule on Global Employees and Labour Relations is applicable to own employees, while the Maersk global standards on thirdparty labour applies to contract/third-party labour.
The Commit Rule, which is part of the broader Maersk Commit governance framework, describes the fundamental rights of employees and colleagues as foundational to a positive working environment. When it comes to workers of our suppliers, starting with our Supplier Code of Conduct as a base, we further clarify labour expectations with the global third-party labour standards (please see Sustainable Procurement page 130-131).
These policies are aligned with international standards such as the UN International Labour Organisation core conventions and the UN Global Compact and cover all fundamental labour rights, including guidelines on forced and child labour, adequate housing and sanitation, wages and working hours. They are further supported by internal guidelines for flexible working, a global principle of rewards policy, a global employee benefits and rewards policy and other topic-specific policies on e.g. safety and DE&I, which all apply to the working conditions for employees of Maersk.
Maersk has three main employee relations and labour rights focus areas. The first is how we manage the risks of violation of employee
rights for third-party labour. This is particularly material to our strategic business focus of driving growth in the Logistic & Services segment, which depends on third-party relationships, and where we operate in regions with higher risk of violations of employee rights.
The second is technology and business growth – how we secure the ethical use of technologies in our operations to ensure labour standards are respected and implemented as we grow our business. The final focus is on wages – employees should as a minimum be paid an adequate wage. A 2024 assessment of adequate wages across own employees, based on the guidance from the CSRD and available benchmarks, showed that no employees are paid below the applicable adequate wage benchmark. We are currently developing a framework for assessing local adequate wage levels for contracted employees.
As part of our human rights due diligence processes, potential negative impacts and risks are monitored on an ongoing basis via joint business reviews, site audits and a biannual self-assessment for compliance with the Commit Rule. These processes allow us to identify emerging risks within our operations and develop targeted action plans to mitigate such risks.
Targets and progress
We have set the strategic target of training 100% of our in-scope employees on employee relations and labour rights. At the end of 2024, 94% of Maersk employees have completed the mandatory employee and labour relations e-learning. While this is an improvement compared to 2023, more work is needed to address challenges in reaching all employee groups. We maintain the rigour of a 100% target also for 2025, with a particular focus on ensuring that all new employees are trained as part of their onboarding process.
100% of employees (in scope) trained in employee relations and labour rights (by 2024) (2023: 90%)
Key actions
• During 2024, we broadened the rollout of the global standards on third-party labour through targeted training for leaders, addressing unique risks across APM Terminals and Logistics & Services. APM Terminals achieved 85% compliance, while Logistics & Services
reached 42%. To further close identified gaps and achieve full compliance in 2025, we have identified a need to further strengthen internal capabilities within employee and labour relations. As a result, APM Terminals created a labour excellence organisation and regional focus leads were appointed in Maersk’s frontline Logistics & Services.
• We launched a tracking app in 2024 to monitor training progress, supplier performance and compliance risks, providing a consolidated dashboard across the People function, procurement and operations. This effort is supported by steering committees consisting of senior executive management for APM Terminals and Logistics & Services, to oversee progress and to ensure full compliance. In 2025, we plan to expand the tracking app use across the business as a single source of truth for documenting compliance.
• In 2024, our Supplier Code of Conduct and Commit Rule were updated to align with the new global standards on third-party labour.
• Maersk’s global labour rights council completed a company-wide labour rights assessment as part of our due diligence, with action plans for 2025 focusing on areas such as working hours and overtime payment.
• We performed an assessment of adequate wages across own employees in 2024, based on the guidance from European Sustainability Reporting Standards and available benchmarks. The results showed that none of our employees are paid below the applicable adequate wage benchmark.
Performance data
Number of employees
EFRAG ID
S1-06_01
SBM-1_03
SBM-1_04
S1-6_09
S1-6_10
S1-6_03 Total number of employees
S1-6_03 Average number of employees
1 Refer also to the most representative average number of employees (FTEs) number in note 2.2 operating costs of the consolidated financial statements. Average number of employees (headcount) is the average number of individual employees during the year while FTEs (as stated in note 2.2 operating costs of the consolidated financial statements) is calculated based on working hours and reported as an average for the full-year.
At year-end 2024, Maersk employed 108,160 employees, and the average number of employees during the year was 106,626.
ACCOUNTING POLICIES
Total number of employees
Total number of employees is the headcount of employees with an employment contract with Maersk, who are on payroll regardless of the type of contract at year end.
Excluded are employees on garden leave and unpaid leave, contractors and third-party workers. The number of employees is based on registrations in Maersk’s HR systems.
Average number of employees
The average number of employees is calculated as average number of employees (headcount) per month during the year.
Number of employees by gender
EFRAG
S1-06_01
S1-06_01
S1-06_01
At year-end 2024, of the 108,160 employees employed by Maersk, 70,100 were recorded as male, 37,459 were recorded as female, 3 were recorded as other and 598 were recorded as not disclosed.
ACCOUNTING POLICIES
Number of employees by gender
The number of employees by gender is the number of males, females, other and not disclosed in the total number of employees at 31 December in the reporting year. The gender categorisation is based on registrations in Maersk’s HR systems.
Number of employees by contract type by gender
S1-6_07
S1-6_07
S1-6_07 Number of non-guaranteed hours employees (headcount)
Maersk does not employ any employees on non-guaranteed hours contracts, and the majority of Maersk’s workforce is on permanent contracts.
ACCOUNTING POLICIES
Number of employees (headcount) by contract type
The number of employees (headcount) by contract type by gender is the number of permanent, temporary and non-guaranteed hours employees in the total number of employees at 31 December in the reporting year. The contract type and gender categorisation are based on registrations in Maersk’s HR systems.
Number of employees by country
EFRAG ID Country
S1-6_04
S1-6_05 India
S1-6_04
S1-6_05 Denmark 15,820
S1-6_04
S1-6_05 China 11,908
S1-6_04
S1-6_05 USA 11,126
For 2024, Maersk had more than 10% of its total workforce employed in each of the countries of India, China and the USA. Denmark has been included in the list as Maersk’s seafarer population is employed by a Danish legal entity and thus has been allocated to Denmark. The seafarer population totals more than 12,000 employees.
ACCOUNTING POLICIES
Number of employees by country
The number of employees by country is the number of employees in countries where Maersk has more than 50 employees, representing at least 10% of the total number of employees at 31 December in the reporting year. The employees by country specification is based on registrations in Maersk’s HR systems.
Number of employees by contract type by region
S1-6_07
S1-6_08
S1-6_07
S1-6_08
S1-6_07
S1-6_08
S1-6_07
of employees (headcount)
of temporary employees (headcount)
S1-6_08 Number of non-guaranteed hours employees (headcount) 0
At year-end 2024, the share of employees in Maersk’s regions of Asia Pacific, Europe and the Indian subcontinent - Middle East and Africa were 25%, 30% and 22%, respectively, with the Latin America and North America regions combined accounting for 22% of the employees in Maersk.
ACCOUNTING POLICIES
Number of employees (headcount) by contract type by region
The number of employees (headcount) by contract type by region is the number of employees by contract type by region at 31 December in the reporting year. The employee contract type and region specifications are based on registrations in Maersk’s HR systems.
Employee attraction and retention
S1-6_11 Number of employees who left the company Number 11,835
1 Not covered by the Independent Auditor’s limited assurance report.
In 2024, our employee engagement survey (EES) results improved as engagement scored at the 65th percentile. We have narrowed the gap to our 2025 target (75th percentile). The progress recorded for 2024 is driven by an improvement across all questions included in the EES. For 2024, the employee turnover rate was 11%.
ACCOUNTING POLICIES
Employee engagement survey score
The employee engagement survey score is calculated as Maersk’s aggregated ranking of employee engagement relative to Maersk’s survey vendors’ global organisational employee engagement norm.
Number of employees who left the company
The number of employees who left the company is the number of employees who left the organisation voluntarily or due to dismissal, retirement or death while employed by Maersk during the year. The number of employees who left during the year is based on registrations in Maersk’s HR systems.
Total employee turnover rate
The total employee turnover is calculated based on the average number of employees and the number of employees who left the company during the year.
Diversity of our workforce
S1-9_01
S1-9_02 Women in leadership (job level 6+)
Entityspecific Women in management (job level 4+)
Entityspecific Target nationalities in executive leadership (job levels 8 and 9) % (headcount) 21 20 16 15 12
Entityspecific Diversity in teams (gender)
Entityspecific Diversity in teams (nationality)
S1-9_03 Employees under 30 years old
S1-9_04 Employees between 30-50 years old
S1-9_05 Employee over 50 years old
1 Not covered by the Independent Auditor’s limited assurance report.
For 2024, the share of women in leadership and the share of women in management are on par with 2023. This is the result of efforts made in 2024 to continue the progress in the face of significant and necessary reorganisations that impacted Maersk’s workforce in late 2023. We also recorded a relatively higher level of gender diversity in teams of leaders in CEO -1 and CEO -2 layers. Through focused efforts, our target nationalities in executive leadership saw an overall improvement. Concerted efforts are required in 2025 to reach the targets of 30% and 40% for women in leadership and management, respectively, and to meet the target of 30% target nationalities.
ACCOUNTING POLICIES
Women in leadership
Women in leadership is the percentage of women at job levels 6, 7, 8 and 9, corresponding to leaders, senior leaders and executives, compared to the total headcount at the same levels. Seafarers are not included in the calculation of women in leadership since seafarers do not have the same job level categories as our other employee groups.
Women in management
Women in management is the percentage of women at job levels 4, 5, 6, 7, 8 and 9, corresponding to managers, senior managers, leaders, senior leaders and executives, compared to the total headcount at the same levels. Seafarers are not included in the calculation of women in management since seafarers do not have the same job level categories as our other employee groups.
Target nationalities in executive leadership
Target nationalities in leadership is the percentage of leaders with non-OECD country nationalities at job levels 8 and 9, corresponding to executives, compared to the total headcount at the same levels.
Diversity in teams
Diversity in teams expresses the percentage of leaders with diverse teams based on 1) gender and 2) nationality at year-end. A team is defined as the direct reports to the leader (hierarchical view), excluding executive assistants and other administrative staff. The scope of diversity in teams is leaders at the CEO-1 and CEO-2 layers. Team diversity is assessed and calculated per leader based on two parameters: gender and nationality. The assessments are binary: either the team is diverse or non-diverse for that parameter. For a team to be considered gender diverse, the percentage of one gender must not surpass 70% of the team headcount, excluding executive assistants and other administrative staff. Similarly, for a team to be considered nationality diverse, the percentage of one nationality must not surpass 70% of the team headcount, excluding executive assistants and other administrative staff.
Employee age diversity
The employee age diversity is the number and share of employees that are under 30 years old, between 30 and 50 years old (30 and 50 included), and over 50 years old. Age is defined as the chronological age, i.e. the total period in years a person/employee has existed. Age distribution of employees is based on registrations in Maersk’s HR systems.
Gender diversity of our seafarers 2024
In 2024, Maersk reached an important milestone by employing almost 6% of female seafarers across the fleet. According to the IMO, the industry average is 2%. Attracting more female colleagues remains a priority across our key sourcing areas where we continue to build, grow and promote career paths for women. Key initiatives include special training programmes for young women in select markets, proactively positioning Maersk as maritime employer with career opportunities, and collaborating with schools and universities.
ACCOUNTING POLICIES
Gender diversity of our seafarers
Gender diversity of our seafarers is the number and share of females within Maersk’s seafarer population at year-end. The gender diversity of seafarers is based on registrations in Maersk’s HR systems. For 2024, we have applied the gender categories of male and female, which is currently in our HR system for seafarers, and all seafarers have a gender category according to this. In 2025, we will work towards including all four gender categories.
Employee relations and labour rights training
1 Not covered by the Independent Auditor’s limited assurance report.
For 2024, we recorded a 4 percentage point improvement in the completion rate for the employee relations and labour rights training compared to 2023. We continue to strive for an 100% completion rate for the employees in scope for the employee relations and labour rights training.
ACCOUNTING POLICIES
Employee relations and labour rights training
Employee relations and labour rights training is the completion rate of employees in scope for the employee relations and labour rights e-learning out of the total employee population in scope. The employees in scope for the e-learning in 2024 are active office-based Maersk employees. This excludes office-based employees on long-term leave, consultants and employees that have joined Maersk after 31 October in the reporting year. The completion rate is based on registrations in Maersk’s Learning Management system. The employees in scope of the training cover 58% of the total employees in Maersk during 2024.
Compensation metrics
EFRAG ID Unit 2024
S1-16_01 Gender pay gap % 5
S1-16_02
For 2024, our first company-wide gender pay gap analysis showed a 5% difference of average pay between female and male employees. The annual total remuneration ratio result for 2024 landed at 205. In the coming years, we will continue to refine our approach, which may also impact the outcome of the KPIs.
ACCOUNTING POLICIES
Gender pay gap
The gender pay gap is calculated as the difference of average annual total remuneration between female and male employees, expressed as a percentage of the average annual total remuneration of male employees. The annual total remuneration for all own employees is calculated using the fully loaded cost index. Fully loaded cost is calculated per job level and country, and is an estimation of the benefits, guaranteed allowances, employer liabilities, on-target short-term incentives, on-target long-term incentives and recognition costs for 2024. The calculation is based on headcount and the estimated annual total remuneration at 31 December in the reporting year. Excluded from the calculation are learners, interns, graduates, students, cadets, long-term assignees and inactive employees on unpaid or garden leave.
Annual total remuneration ratio
The annual total remuneration ratio is calculated by comparing the annual total remuneration of the highest paid employee in Maersk with the annual median total remuneration of the rest of the own employees in Maersk. The annual total remuneration for all own employees is calculated using the fully loaded cost index. Fully loaded cost is calculated per job level and country, and is an estimation of the benefits, guaranteed allowances, employer liabilities, on-target short-term incentives, on-target long-term incentives and recognition costs for 2024.
The calculation is based on headcount and the estimated annual total remuneration at 31 December in the reporting year. Excluded from the calculation are learners, interns, graduates, students, cadets, long-term assignees and inactive employees on unpaid or garden leave.
Uncertainties and estimates
When preparing the gender pay gap, employees with annual salaries and part-time salaries are converted to full-time equivalents as part of the calculation methodology. In order to ensure cross-country comparability, we apply a standard formula to calculate the hourly rate for all employees. The calculation is based on a 40-hour work week or 2,080 hours per year for all employees. This is an estimate since actual and contractual working hours vary from country to country.
When preparing the annual total remuneration ratio and the gender pay gap, the fully loaded cost index is used as the basis of calculation. The fully loaded cost includes benefits, guaranteed allowances, employer liabilities, ontarget short-term incentives, on-target long-term incentives and recognition costs for Maersk’s own employees for 2024. The on-target costs for short and long-term incentives/bonus are estimates as the actual costs are dependent on various factors not fully known at the time of reporting.
Employees paid below the applicable adequate wage benchmark for 2024
EFRAG ID Country % of employees
S1-10_03 N/A 0
For 2024, our assessment shows that we have no employees in any country that are paid below the applicable adequate wage benchmark.
ACCOUNTING POLICIES
Percentage of employees paid below the applicable adequate wage benchmark
The percentage of employees paid below the applicable adequate wage benchmark is prepared and reported as the percentage of employees in any country where not all Maersk employees are paid an adequate wage, and is based on the total number of employees at 31 December in the reporting year. Adequate wages is determined as:
In the European Economic Area (EEA):
The minimum wage set in accordance with Directive (EU) 2022/2041 of the European Parliament and of the Council on adequate minimum wages in the European Union. In the period until Directive (EU) 2022/2041 enters into force, where there is no applicable minimum wage determined by legislation or collective bargaining in an EEA country, Maersk uses an adequate wage benchmark from a neighbouring country with a similar socio-economic status or not lower than a commonly referenced international norm such as 60% of the country’s median wage and 50% of the gross average wage.
Outside of the EEA:
i. The wage level established in any existing international, national or sub-national legislation, official norms or collective agreements, based on an assessment of a wage level needed for a decent standard of living;
ii. If none of the instruments identified in (i) exist, any national or sub-national minimum wage established by legislation or collective bargaining; or iii. Living Wage benchmark (typical family law) as provided by Wage Indicator.
Excluded from the calculation are learners, interns, graduates, students, cadets, long-term assignees and inactive employees on unpaid or garden leave.
Safety and security
S1-14_05
Entityspecific Learning teams
1 Not covered by the Independent Auditor’s limited assurance report.
2 The Lost time incidents (LTIs) and Lost time incident frequency (LTIf) include both own- and non-employee workers (contracted workers) working under our responsibility.
3 Restated from previously reported figure of 1.11 to align with the updated operational control definition as outlined in the sustainability statement basis of preparation. Consequently, two terminals that were previously considered under operational control have been excluded from the reporting for 2023 and 2024. The reported numbers for 2021 and 2020 have not been restated.
Regrettably, we had one fatal incident involving a contracted colleague in a warehouse in the Philippines on 26 December 2024. While we have seen a significant reduction in the number of fatalities since 2022, the loss of a colleague underscores that we still have much work to do on understanding and staying ahead of our risks and building the right safety culture.
The lost time incident frequency (LTIf) increased to 1.53 compared to 1.14 in 2023. This is driven by increased lost time incidents (LTIs) in Logistics & Services and in APM Terminals. In Logistics & Services, an approximately 50% year-over-year increase in recorded LTIs reflected an improved safety reporting culture, which is expected to be further strengthened in the upcoming years. APM Terminals experienced more incidents during vessel lashing, prompting work on standardising best practices in close collaboration with stevedores. Fleet LTIs, mainly involving slips, trips, falls and pinching injuries among newcomers are being addressed through enhanced safety training.
For 2024, the share of learning teams completed following a high potential incident remained on par with 2023, standing at a 99% completion rate. We remain committed to reaching 100% of learning teams completed following a high potential incident.
ACCOUNTING POLICIES
Scope and consolidation:
The consolidation of safety data differs from the financial principles used across the sustainability statement. Safety data is consolidated using an operational control approach. Operational control is defined as the situation where Maersk or one of its subsidiaries has full authority to introduce and implement its operating policies at the entity, i.e. an operationally controlled investee (such as associates, joint ventures or unconsolidated subsidiaries). In such cases, Maersk is responsible for the health, safety and environmental (HSE) management of the people, processes and facility and is liable to report 100% of the ESG data for the entity in question. Operational control is determined by looking at the contractual arrangements to determine whether Maersk has the full authority to introduce and implement its operating policies at the operation. In 2024, it has been assessed that Maersk does not have operationally controlled investees in e.g. associates, joint ventures, or unconsolidated subsidiaries. This implies that the scope and treatment of entities under financial control and operation control do not differ for 2024.
Mobile assets are included when operated by Maersk. For vessels, the International Safety Management Code Document of Compliance must be held by Maersk to be included in the safety data.
Fatalities
Fatalities is the headcount of work-related accidents leading to the death of the employee regardless of time between injury and death.
Lost time incidents (LTIs)
A lost time incident is a work-related injury, which results in an individual being unable to return to work and carry out any of his/her duties within 24 hours following the injury, unless caused by delays in getting medical treatment. Excluded from LTIs are suicide or attempted suicide, ‘natural causes’, incidents during the commute to and from the regular place of work and incidents which occur off the ship, but where the consequences appear onboard at a later point in time.
Lost time incident frequency (LTIf)
Lost time incident frequency is the number of lost time incidents per million exposure hours. LTIs used to calculate the LTIf follows the definition for LTIs. Exposure hours are the total number of work hours in which an employee is exposed to work-related hazards and risks. Leave and non-work-related sickness are excluded from exposure hours.
Uncertainties and estimates
When preparing the lost time incident frequency, the exposure hours performed by Maersk’s own and nonemployees (contractors) are used as the basis for calculating the frequency. Since actual exposure hours are not registered for all employees across Maersk’s operations, Maersk applies estimates where actual exposure hours are not available. The estimates are based on the type of work and employee contracts, e.g. certain number of exposure hours for seafarers aboard a vessel and certain number of exposure hours for office-based employees.
Learning teams completed following a high potential incident
Learning teams completed following a high potential incident is calculated as the share of learning teams completed following a high potential incident has been recorded. The number of high potential incidents and learning teams completed is based on reporting by brands and maintained and quality-assured by the Group Safety & Resilience team of Maersk. To give the organisation sufficient time to complete a learning team and maintain completeness in our reporting, the reporting period runs from 31 October in the previous year to 31 October in the reporting year, i.e. for 2024 the reporting period is 1 November 2023 to 31 October 2024. A high potential incident may be exempted from conducting a learning team in cases where a full-scale investigation has been carried out by internal or external parties, or the involved parties are outside of Maersk's operational control, or legal circumstances does not allow us to engage due to a legal investigation, or due to a recurrence of an incident for which a learning team has been previously completed.
Governance
At A.P. Moller - Maersk (Maersk), high standards of responsible business practices are foundational for the services we deliver to customers and the value we create for the communities where we operate.
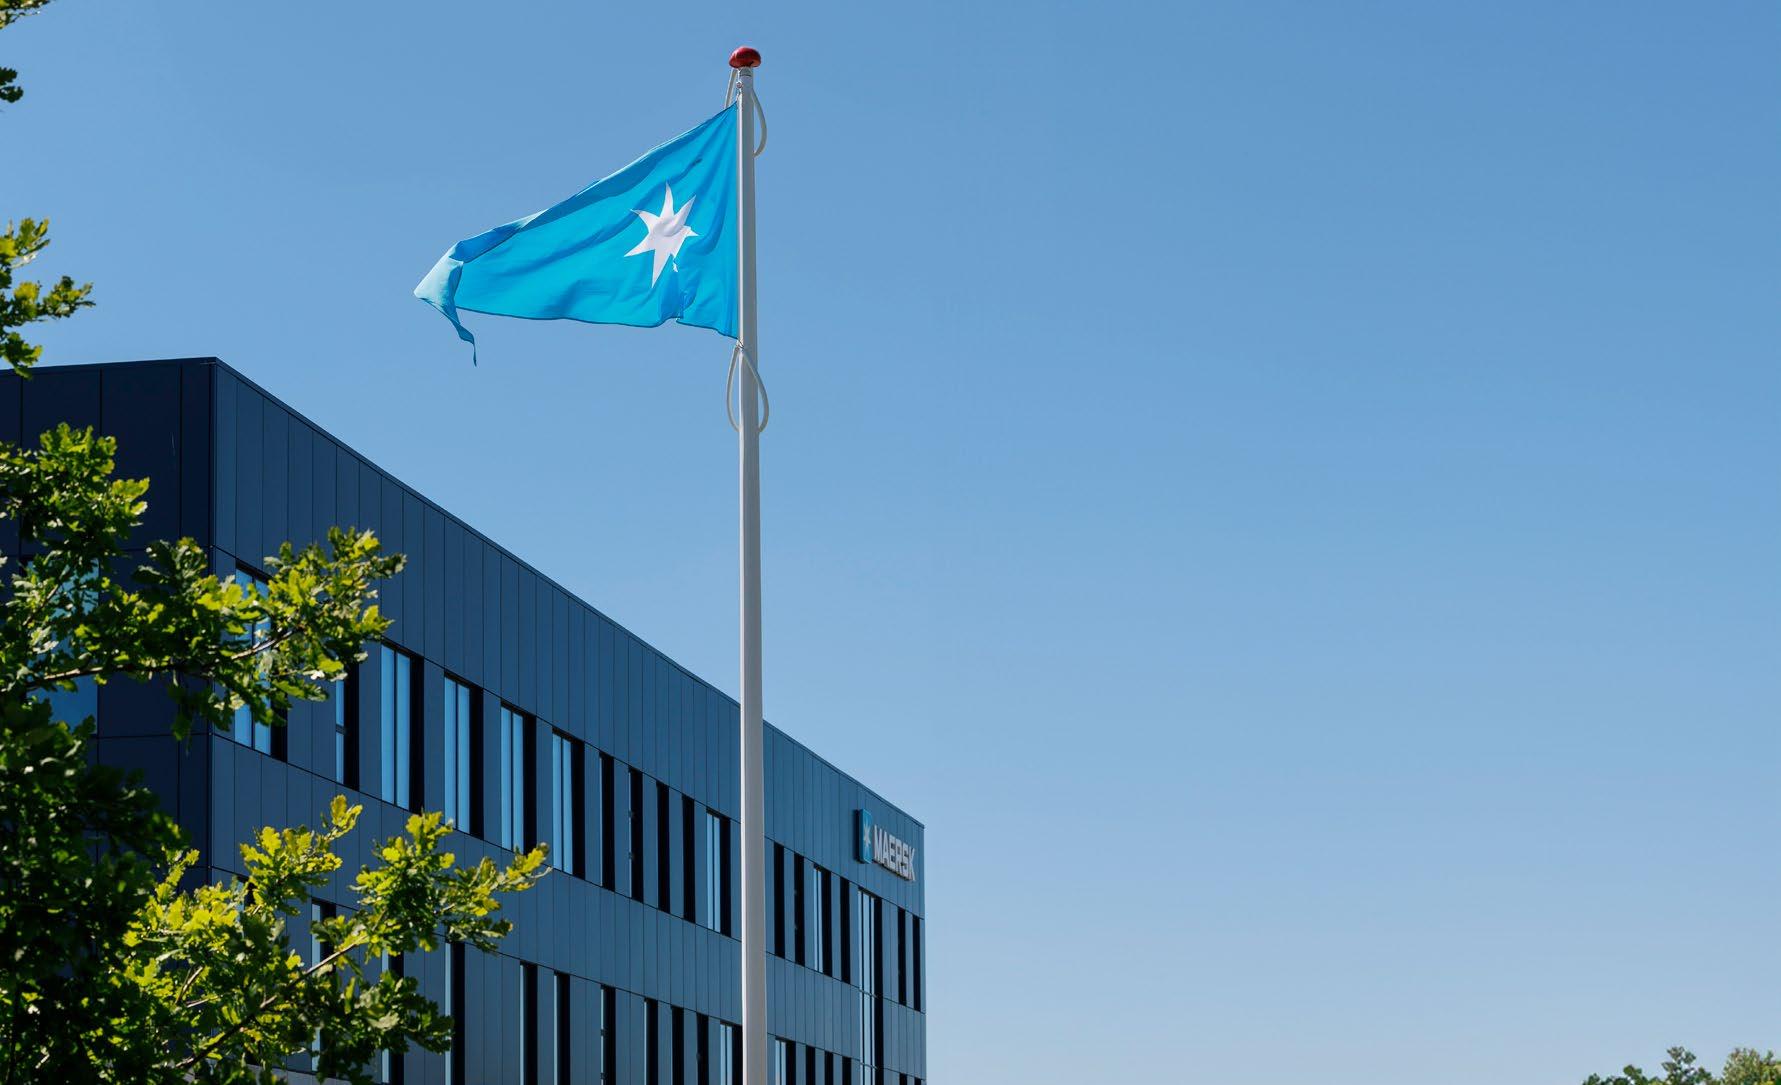
BUSINESS ETHICS
Target by 2024 (recurring)
100% of employees (in scope) trained in business ethics
SUSTAINABLE PROCUREMENT
Targets by 2024 (recurring)
• 100% of suppliers (in scope) committed to the Supplier Code of Conduct
• >85% of strategic/high-risk suppliers undergoing ESG assessments
• >80% of high-risk category suppliers with Improvement Plan successfully closed
• 100% procurement staff trained in Sustainable Procurement
DATA AND AI ETHICS
Target by 2024 (recurring)
100% of employees (in scope) trained on data ethics
RESPONSIBLE TAX
Ongoing ambition Ensure full compliance with tax regulations in all countries where we operate
PERFORMANCE DATA
Governance
Overview of Maersk’s material impacts, risks and opportunities related to Governance
Business ethics
Legal and regulatory compliance
Impact and risk of cases of noncompliance on anti-corruption laws, international sanctions or transport of illegal goods
The legal and regulatory landscape in which Maersk operates is complex, and Maersk could be subject to compliance cases in connection with violations of anti-corruption laws, international sanctions, transportation of illegal goods, competition law and/or data privacy. Corruption can negatively impact company culture and society, eroding trust and exacerbating inequality in societies.
Grievance and remedy
Access to grievance and remedy for affected stakeholders
Potential barriers to access grievance mechanisms for our stakeholders (e.g. language, fear of retaliation, psychological or physical barriers) could result in violations of rights and lack of access to remedy. The risk is heightened in the value chain.
Sustainable procurement
Supplier relationship management
Risks of noncompliance with Maersk’s standards by our suppliers
Risks of suppliers not complying with Maersk’s standards, including the Supplier Code of Conduct, could lead to Maersk being subject to cases and incidents that negatively impact Maersk’s reputation and trust with customers and/or direct financial costs.
Payment practices
Ensuring timely and fair payment practices to suppliers
Potential impact on suppliers’ working capital and cash flow affecting their financial and operational stability. Especially with regard to late payments for small and medium-sized undertakings.
Data and AI ethics
Ethical use of data and AI
Ethical use of our stakeholders’ data and protection of individuals’ right to privacy
Potential risk of undue influence, mishandling and abuse of data and artificial intelligence can have negative implications to the customers and business partners whose data has been handled unethically. This erodes trust in Maersk as a business partner. Potential violation of employees’ and consumers’ right to privacy if their personal data is not handled responsibly.
Responsible tax
Tax governance
Risk of different interpretations and tax controversy
Tax regulations are complex and differences in interpretation is considered a key risk, with impacts depending on the specific situation.
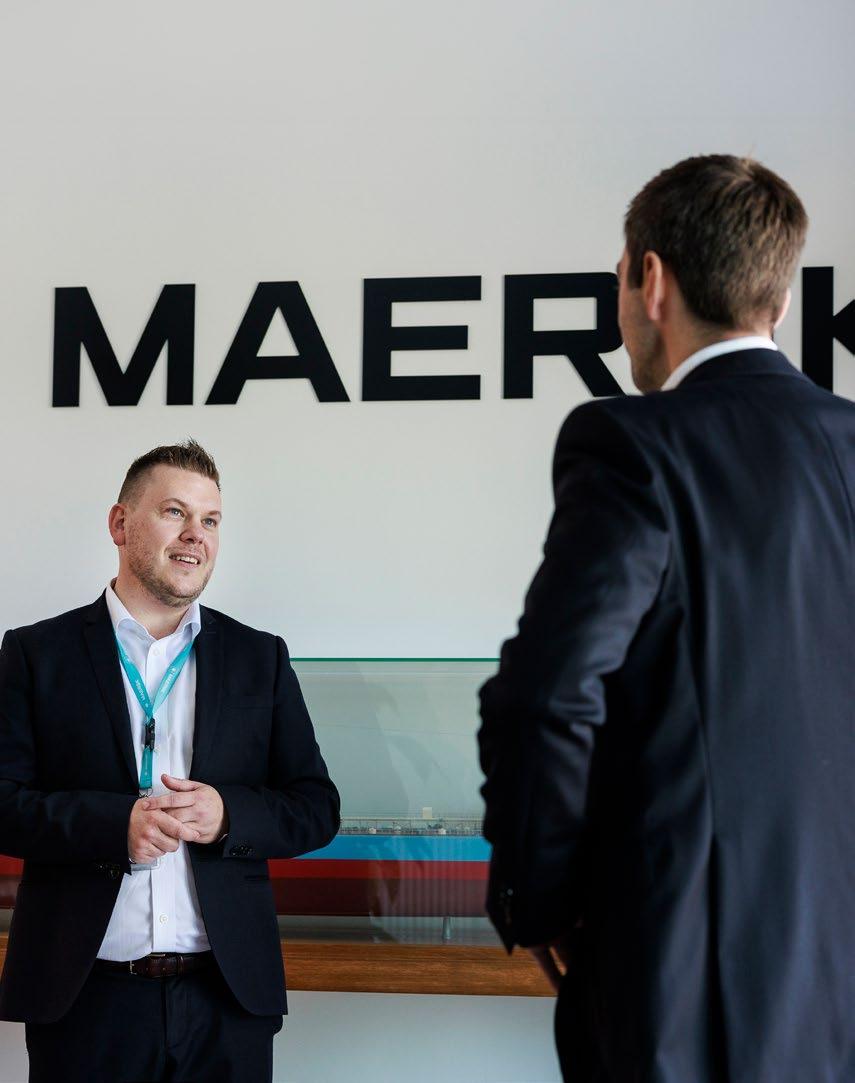
Responsible business conduct
A.P. Moller - Maersk (Maersk) is a purpose-driven company operating in a complex environment that relies on integrated global supply chains. “We operate based on responsible business practices” is a core commitment of our ESG strategy, underpinning efforts to ensure compliance with relevant laws, regulations and responsible business conduct, as well as having adequate risk mitigation.
As a global leader in logistics services, Maersk serves 100,000+ customers and operates in almost 130 countries with a complex footprint across our business segments and value chain. We work to ensure that we have the right corporate culture to live up to our Purpose and Core Values. Our approach to this commitment is driven by our Commit governance framework and ESG categories on business ethics, sustainable procurement, data ethics and AI and responsible tax.
Corruption undermines social and economic development, destabilises the business environment and adds to the cost of doing business and participating in global trade. Sanctions and export controls have grown exponentially over the last three years, and with growing geopolitical tensions, they are impacting global trade more than ever. Anti-competitive behaviour distorts fair market conditions, impacting global supply chains.
In this dynamic business environment and complex legal and regulatory landscape, it is imperative for Maersk to continuously enhance our compliance programme to adapt to evolving regulatory requirements, market conditions and geopolitical events. Increasing regulation on value chain due diligence, including the EU Corporate Sustainability Due Diligence Directive is also raising the importance of ensuring that Maersk’s suppliers meet our global standards and local laws around business ethics, human and labour rights, working conditions and employment practices and environmental responsibility.
Maersk also sees a sharp rise in contraband, from narcotics to illegal wildlife and timber trafficking, and stolen and counterfeit goods. These criminal activities continue to affect our supply chain and require ongoing, proactive management to mitigate the risks of threats to people, bribery attempts and operational disruptions that are often associated with contraband trafficking.
Finally, as the digitalisation of supply chains continues to accelerate, including the rapid adoption of generative AI, responsibly managing data from business partners and customers has never been more relevant to maintaining their trust in Maersk.
Business ethics
Corruption, sanctions and export controls, competition law violations and data privacy and ethics are the most material business ethics risks of Maersk. Failing to live up to our business ethics commitment could subject Maersk to legal or reputational risks and negatively impact company culture and societies where we operate. Our policies, approach and governance of business ethics focus on high standards for responsible business practices everywhere we operate, aligned with international requirements and with a heightened focus in jurisdictions with greater exposure to these risks and human rights abuses.
Policies and approach
The Maersk Code of Conduct sets global standards for how we engage with colleagues, customers, suppliers, communities, authorities and other stakeholders. As a global company, we take an active responsibility for the society and environment where we operate and are guided by international standards such as the Universal Declaration of Human Rights and the principles of the UN Global Compact. The Code is publicly available on Maersk.com in 17 languages.
The standards in our Code are supported by and explained in more detail in the Commit Business Ethics Rules. These rules are to be adhered to by all employees regardless of business association or geographic location, including contracted staff who act on behalf of Maersk and employees in controlled joint ventures.
Employees are required to take Code of Conduct trainings (onboarding and yearly refreshers). We conduct ongoing campaigns and activities linked to international awareness events such as Business Ethics Day, Anti-Corruption Day and Illegal Wildlife Day. Other communication activities include our Speak-Up and No Retaliation campaign, Sanctions and Export Controls awareness, Dawn Raid Preparedness and Data Privacy Due Diligence Check campaign.
We are committed to investigating allegations of business misconduct promptly, independently and objectively. Depending on the type of case, investigations are carried out by independent and objective
investigators from relevant teams in Maersk or by external advisors. Protocols are in place for internal investigations and disciplinary actions to ensure a swift and effective response to compliance violations. Cases of non-compliance are reported to the Board of Directors and Executive Leadership Team through the Risk and Compliance Committee.
The Commit Rules covering anti-corruption, sanctions and export controls, competition law violations and data privacy set out the measures to identify, mitigate and manage compliance risks in jurisdictions where we operate. The efforts are carried out through dedicated teams of 70+ compliance professionals and a comprehensive Business Compliance Ambassadors’ network. These experts, represented in all regional offices and many high-risk locations, partner with colleagues in the business to detect, assess and mitigate risks.
Maersk is an active and founding member of the Maritime AntiCorruption Network (MACN), working to eliminate corruption in the maritime and port industries. In 2024, Maersk partnered with MACN and USAID for a two-year project under the headline “Doing Business with Integrity”. This collaboration is part of USAID’s Countering Transnational Corruption Grand Challenge for Development, which is set to strengthen the fight against transnational maritime sector corruption.
Targets and progress
We have set the strategic target that 100% of our employees in scope complete our Code of Conduct training each year. This year, 94% of Maersk employees in scope completed the mandatory Code of Conduct training. Challenges in reaching all employee groups remain, particularly due to organisational changes, however, we are working to close this gap to 100% completion in 2025.
100% of employees (in scope) trained in the Maersk Code of Conduct (2023: 92%)
A risk assessment is performed at least every two years, with the most recent in 2023, to identify high risk areas, functions and business activities. This is tracked through the percentage of operations covered by a risk assessment on compliance and business ethics targeting 100%.
Key actions
As we continue to advance on our business ethics ambitions, we completed the following key actions in 2024:
• Introduction of the ‘Minerva’ cargo screening platform, to automate compliance and adapt screening processes to evolving trade regulations, with an initial focus on sanctions screening.
• Reporting of the bi-annual 2023 risk assessment to business leaders and functional heads and implementation of mitigating measures. A next-generation risk assessment is under development for 2025 deployment, with the goal of anchoring compliance risk ownership in the appropriate businesses and functions.
• Working with sustainable procurement and vendor data management to integrate third-party management screening and assessment at the process level during vendor onboarding.
• Digitalisation of key compliance approvals and processes to provide insights into operational and compliance risk trends and patterns within the business.
• Completion of 87 compliance spot checks on selected entities and processes, covering critical risks within the areas of anti-corruption, sanctions compliance, competition law and data privacy.

Sustainable procurement
Management of ESG risks in our supply chain network enhances stakeholder trust in our brand and equips us to meet current and upcoming supply chain due diligence regulations. Maersk’s operations and procurement choices influence the social, environmental and economic conditions within our industry, global supply chains and the communities we serve. We are continuously enhancing the process of embedding ESG as a strategic priority throughout the supplier lifecycle. We promote supplier collaboration and engagement, driving co-development and innovation towards sustainable outcomes.
Policies and approach
Our updated 2024 Supplier Code of Conduct is aligned with the UN Guiding Principles and OECD Guidelines for Multinational Enterprises on Responsible Business Conduct. It reflects Maersk’s values of ethical conduct, environmental stewardship and social responsibility. Enforced through the Commit Sustainable Procurement Rule, the Code sets expectations for suppliers to uphold responsible practices in areas such as ethics, human rights, working conditions and environmental standards, and in compliance with all applicable laws and regulations. The Code also outlines the expectation for our suppliers to implement the Code or similar requirements with their sub-suppliers. It is communicated through several internal channels and is publicly available on Maersk.com in 12 different languages. Our approach to sustainable procurement is founded in our commitment to proactively manage supply chain risks as our “licence to operate” and to comply with an evolving regulatory landscape, including the upcoming Corporate Sustainability Due Diligence Directive (CSDDD). ESG due diligence is therefore an integral part of our supplier selection process. We also focus on continuously building the capacity of our procurement team and business functions who interact with suppliers to fully integrate ESG principles and ensure compliance with our standards.
Our approach to procurement emphasises ESG integration through three key priorities: value chain decarbonisation, human and labour rights and safety and resilience.
Supporting Maersk’s science-based targets, we focus on reducing scope 3 emissions, targeting key hotspots using data-driven insights and initiatives like supplier maturity assessments and abatement models.
The Sustainable Procurement programme contributes to the effective development, deployment and monitoring of our global standards on third-party labour and safety across our supply chain, to promote fair working conditions. Human rights and labour rights are integrated into our due diligence processes for suppliers. To address emerging risks from new business activities such as the development of green fuel supply chains, we are developing a green fuel sourcing due diligence framework. Site visits and workshops are conducted to raise awareness, with the aim that suppliers adhere to Maersk’s standards in all aspects of their operations. This is supported by dedicated safety superintendents who oversee and conduct periodic on-site safety training sessions. We promote a speak-up culture and actively monitor whistleblower cases to ensure transparency and accountability on identified value chain issues. Suppliers are required to communicate the Whistleblower channel’s existence, and to ensure that their employees and subcontractors are made aware of it. Each reported issue is investigated and, where necessary, appropriate remedies are provided.
Furthermore, we are piloting business resilience requirements with selected suppliers to strengthen Maersk’s business continuity management framework, identifying learnings and scaling it for global application across our supplier base.
We recognise that ensuring fair and timely compensation for suppliers is part of responsible supplier engagement. Our standard payment terms vary based on the service/spend category. We strive to align payments with these terms and continuously monitor payment practices to ensure compliance and improve supplier’s experience. We are building visibility on supplier-related payment impacts, especially regarding late payments to small and medium-sized businesses through internal processes and tools, minimising the impact of delayed payments by prioritising prompt and equitable payment processes, aligned with local and national requirements. We are also actively engaging with suppliers on effective arbitration on late-payment related issues.
Targets and progress
We have set an annual target for all of our suppliers in scope to sign and comply with our Supplier Code of Conduct, supported by a mandatory Sustainable Procurement Clause. Currently, 87% have signed the Code. The decrease from 2023 is a result of integration of additional supplier contracts into the compliance framework and improvements to our calculation methods for the KPI.
We evaluate supplier compliance towards our Code across key areas such as anti-corruption, health and safety, labour and human rights and environmental practices. Our evaluation process includes pre-screening, desktop assessments, on-site audits and improvement plans to address identified gaps. During 2024, we digitised our reporting structure, which resulted in an expanded addressable baseline for the supplier assessment metric, causing a 24 percentage point decrease compared to 2023. To close the gap to the target, we are refining our processes and deploying advanced digital tools. Throughout the year, our assessment focus remained on categories including terminals, outsourced labour, shipyards and drydocks, covering over USD 2.5bn of spend within high-risk suppliers. We are committed to assessing the vast majority of suppliers, including prospects, within high-risk areas against Supplier Code of Conduct.
We continue to work closely with our suppliers to address the gaps identified as part of the improvement plans, resulting from assessments. A majority of the improvement plans have successfully been completed, tracking above our target and showing year-onyear improvement. To build on this progress and further sustain performance, we are integrating ESG more deeply into our end-to-end supplier lifecycle processes. We enable this through the development of a digital ESG solution and are investing in capability-building across the procurement community. Our procurement team has now achieved 99% completion of the mandatory Sustainable Procurement training.
Key actions
In 2024, we continued working towards our Sustainable Procurement commitments through key actions including:
• Update of our Supplier Code of Conduct, in preparation for evolving regulatory and market expectations.
• Prepare for embedding ESG considerations into Maersk’s Sourceto-Pay process to ensure ESG criteria are fully integrated into procurement decisions and supplier evaluations.
• Development of a risk-based framework that incorporates geographic and industry ESG risk lenses, combined with supplier ESG performance and business criticality to prioritise supplier ESG engagements. Deployment is planned for 2025.
• Implementation of our Third-Party Labour Standards across the contracted labour supplier category, ensuring consistent adherence to its requirements.
• Development of safety standards for suppliers and planned pilot programmes with select suppliers to test and implement these standards in 2025.
• Establishing the supply chain emissions baseline for hotspot identification and setting targets for supply chain categories aligned with our science-based targets. This will enable development of category-specific emission roadmaps.
ENTITY SPECIFIC
Data and AI ethics
Responsibly managing data from customers, business partners and employees is a critical issue in today’s society. AI has a transformational impact on logistics and requires effective governance in place to responsibly unlock future innovation. Through strong governance and ethical use of data and AI, we mitigate risks and position Maersk as a digital frontrunner in our industry, in alignment with our Purpose and Core Values. This is essential to our customers, partners and our business strategy.
Policies and approach
Maersk’s data ethics policy articulates our leadership aspirations based on four key principles: transparency, respect, security and innovation. Our ability to offer innovative logistics services relies on optimising customers’ supply chains with data-powered technology. We maintain
the trust of our customers, business partners and employees by continuously improving how we safeguard this data and respectfully use it in our innovations.
The policy is anchored within Maersk’s Commit governance framework, which includes touchpoints from data privacy, competition law and cyber security related polices, and is supported by awareness campaigns, standard operating procedures and controls embedded in processes and technology. Maersk’s data ethics strategy balances impacts, opportunities and risks as we develop new products and services while implementing proper compliance measures.
The Risk and Compliance Committee provides strategic alignment and execution oversight. In addition, subcategory committees operationally drive the outcomes and roadmaps supported by accountable teams across corporate and business functions, coordinated by a dedicated data ethics team. The policy is publicly available on Maersk.com and embedded in our Code of Conduct.
Targets and progress
To ensure that our employees are well-equipped to navigate risks related to data, we have set a strategic target of 100% of employees in scope being trained on data ethics by year end. By the end of 2024, 93% of Maersk employees in scope completed our mandatory data ethics e-learning.
100% of employees (in scope) trained on data and AI ethics (2023: 91%) 93%
While challenges in reaching all employee groups remain, we maintain the rigour of a 100% target for 2025, with a particular focus on ensuring that all new employees are trained.
Key actions
In 2024, Maersk further matured its approach to data and AI ethics, improving and anchoring technology processes with clear organisational accountability. Key activities included:
• Implementation of a modern data privacy tool for process and application mapping and risk assessment and mitigation.
• Implementation of automated data access management to ensure commercially confidential data is accessed only by allowed employees.
• Implementation of a standardised process and tool for risk identification and management.
• Development of governance effectiveness, measuring and implementing standard tools (registries, risks, reporting and dashboards).
For 2025, the focus is on stabilising our implemented processes with continuous improvements and further leveraging technology to increase automation and accuracy of data and AI ethics governance. Second, we will scale our governance approach for AI in support of regulatory readiness and our AI strategy.
ENTITY SPECIFIC
Responsible tax
Maersk strives to act responsibly and with integrity in all tax matters. We work closely with tax authorities to ensure that we fully disclose relevant information and pay the correct amount of taxes while balancing obligations towards our shareholders.
Policies and approach
The Maersk Responsible Tax approach is incorporated in the Maersk Code of Conduct and applies to the entire group (entities and employees). The Maersk Tax Principles and Strategy are approved by the Audit Committee on behalf of the Board of Directors.
We conduct and manage tax affairs in accordance with our Tax Principles, outlined in our 2024 Tax Report. These principles are reviewed annually and closely align with our Core Values and business strategy. We strive to be a compliant and accountable taxpayer in all countries where we operate. This includes:
• Managing tax risk and reputation with a responsible and transparent tax practice, e.g. instructions on the timely involvement of the global tax team.
• We do not engage in artificial structures or other tax-driven engagements.
• Accurate data provision required per law or upon request from authorities.
• Reporting of violations of group tax principles in line with internal procedures.
Our approach to tax risk management aligns with Maersk’s enterprise risk management and internal control framework, which includes tax controls. We constantly identify and manage tax risks to ensure adherence to our tax principles, including compliance with the letter and the spirit of the law. A clear procedure is in place for the assessment, management and reporting of identified tax risks, including quarterly updates to the Executive Leadership Team on both tax risks and tax strategy.
Our tax conduct is an ongoing effort with an ever-moving target as business and legal requirements continue evolving. We allocate significant resources to secure our adaptation to continuously emerging compliance requirements and governance, including the digitalisation of work where feasible, thus ensuring a continued, robust and efficient in-house tax function.
Targets and progress
We have not set measurable targets in regard to responsible tax. We aspire to act responsibly and with integrity in all tax matters and strive to be compliant in every jurisdiction across the world, considering both the letter and the spirit of the law.
Our key actions
A high focus this year has been on preparing reporting for compliance with the Global Minimum Taxation rules due to the Danish implementation of the Council Directive (EU) 2022/2523 of 14 December 2022.
Performance data
Code of Conduct training
1 Not covered by the Independent Auditor’s limited assurance report.
For 2024, we recorded a 2 percentage point improvement in the completion rate for the Code of Conduct training compared to 2023. We continue to strive for a 100% completion rate for the employees in scope for the Code of Conduct training.
ACCOUNTING POLICIES
Code of Conduct training
Code of Conduct training is the completion rate of employees in scope for the Maersk Code of Conduct e-learning out of the total employee population in scope. The employees in scope for the e-learning are active office-based Maersk employees. This excludes office-based employees on long-term leave, consultants and employees that have joined Maersk after 31 October in the reporting year.
The employees in scope of the Code of Conduct training cover 58% of the total employees in Maersk during 2024. The completion rate is based on registrations in Maersk’s learning management system.
Operations covered by a risk assessment on compliance and business ethics
1 Not covered by the Independent Auditor’s limited assurance report.
Maersk completes a group-wide risk assessment on compliance and business ethics risks every second year. The most recent assessment was completed in 2023. This result has been carried forward for 2024. In addition to the group-wide risk assessments, we also perform specific risk assessments throughout the year.
ACCOUNTING POLICIES
% of operations covered by a risk assessment on compliance and business ethics risks
% of operations covered by a risk assessment on compliance and business ethics risks is the percentage of entities that have completed the risk assessment survey on compliance and business ethics risks during the year when the assessment is rolled out. The group-wide risk assessment is carried out every second year with the latest one completed in 2023.
Thus, the 2023 result is carried forward for 2024. The % of operations covered by a risk assessment on compliance and business ethics risks is based on the records from Maersk’s Global Entity Management System, considering owned or controlled operational entities.
Incidents of corruption and bribery
G1-4_01
G1-4_02
G1-6_04
Number of convictions for violation of anti-corruption and anti-bribery laws # Nil
Amount of fines for violation of anti-corruption and anti-bribery laws USD Nil
Number of legal proceedings outstanding for late payments # Nil
Maersk has not been convicted for violation of anti-corruption or anti-bribery laws during 2024 and thus no fines have been paid in relation to such cases. Likewise, no legal proceedings for late payments are outstanding per year-end 2024.
ACCOUNTING POLICIES
Number of convictions for violation of anti-corruption and anti-bribery laws
The number of convictions for violation of anti-corruption and anti-bribery laws includes all convictions as a result of legal proceedings against A.P. Møller - Mærsk A/S and/or any of its subsidiaries in the reporting year.
Amount of fines for violation of anti-corruption and anti-bribery laws
The amount of fines paid for violation of anticorruption and anti-bribery laws includes fines paid as a result of legal proceedings on these matters against A.P. Møller - Mærsk A/S and/or any of its subsidiaries in the reporting year.
Number of legal proceedings outstanding for late payments
The number of legal proceedings outstanding for late payments includes all legal proceedings against A.P. Møller - Mærsk A/S and/or any of its subsidiaries relating to late payments of business partners that are outstanding at year end.
Data and AI ethics
EFRAG ID Indicator Unit 2024 2023 1 2022 1 2021 2020 Entity specific Data and AI ethics training Completion rate 93 91 67 - -
1 Not covered by the Independent Auditor’s limited assurance report.
For 2024, we recorded a 2 percentage point improvement in the completion rate for the Data and AI ethics training compared to 2023. In 2024, focused efforts to roll out the training to office-based new joiners took place to drive up completion for outstanding employees. We continue to strive for a 100% completion rate for the employees in scope for the Data and AI ethics training.
ACCOUNTING POLICIES
Data ethics training
Data ethics training is the completion rate of employees in scope for the data and AI ethics e-learning out of the total employee population in scope. Employees must complete the training once. The employees in scope for the e-learning are active office-based Maersk employees that were employed at the time of launch of the e-learning in November 2022 and employees that have
since joined. This excludes office-based employees on long-term leave, consultants and employees that have joined Maersk after 31 October in the reporting year. The employees in scope of the data and AI ethics training cover 57% of the total employees in Maersk during 2024. The completion rate is based on registrations in Maersk’s learning management system.
Sustainable procurement
category/strategic suppliers assessed with improvement plans successfully
Not covered by the Independent Auditor’s limited assurance report.
For 2024, we recorded a decrease of 8 percentage points in the share of suppliers in scope that have committed to Maersk’s Supplier Code of Conduct compared to 2023. The decrease is a result of integration of additional supplier contracts from recently acquired entities into the compliance framework and improvements made in our KPI calculation methodology. Our goal remains to have all suppliers committed to the Supplier Code of Conduct.
Compared to 2023, we recorded a significant decrease of 24 percentage points in the share of tier 1 high-risk category/strategic suppliers undergoing ESG assessments. The decrease is a result of digitisation of our reporting structure leading to an expanded metric baseline. The gap to the target of 85% will be addressed through an improved process and deployment of digital tools going forward.
The share of high-risk category/strategic suppliers assessed with improvement plans successfully closed increased by 8 percentage points in 2024 compared to 2023, and exceeded Maersk’s target of 80%. This reflects our ongoing commitment to address gaps identified during supplier assessments. By the end of 2024, 99% of procurement employees have completed our mandatory Sustainable Procurement training. This is a significant improvement compared to 2023, and we remain committed to driving awareness on ESG topics within our procurement community.
ACCOUNTING POLICIES
Suppliers committing to Maersk’s Supplier Code of Conduct
Suppliers committing to Maersk’s Supplier Code of Conduct (CoC) is the percentage of existing valid contracts with active suppliers which include a sustainable procurement clause, a reference to Supplier CoC in the contract or a CoC acknowledgment document out of the total number of valid active supplier contracts. The suppliers committing to Maersk’s Supplier CoC is based on registrations in Maersk’s sustainable procurement database, DocuSign Insights.
Tier 1 high-risk category/strategic suppliers undergoing ESG assessments
Tier 1 high-risk category/strategic suppliers undergoing ESG assessments is the share of Tier 1 high-risk and strategic suppliers that have undergone an ESG assessment out of the total number of tier 1 high-risk category and strategic suppliers with valid contracts. The suppliers undergoing ESG assessments is based on registrations in database maintained by the sustainable procurement team.
High-risk category/strategic suppliers assessed with Improvement Plan successfully closed
High-risk category/strategic suppliers assessed with improvement plans successfully closed is the percentage of active high-risk category/ strategic suppliers with valid contracts that have successfully closed gaps observed within the agreed timelines through an improvement plan implementation out of the total high-risk category/ strategic suppliers with improvement plans. The suppliers assessed with Improvement Plan successfully closed is based on registrations made in database maintained by the sustainable procurement team.
Procurement staff trained in Sustainable Procurement (SP)
Procurement staff trained in Sustainable Procurement is the completion rate of procurement employees in scope for the SP e-learning out of the total employee population in scope. The employees in scope for the e-learning in 2024 are procurement employees in Maersk. This excludes procurement employees on long-term leave and procurement employees that have joined Maersk after 31 October in the reporting year. The completion rate is based on registrations in Maersk’s learning management system.
UNILABS
The CSR statement from Unilabs’ Annual Report for 2024 is enclosed on the next pages.

Statement of corporate social responsibility according to the Danish Financial Statements Act, sections 99a and 99d
Statutory statement on CSR in accordance with section 99a of the Danish Financial Statements Act
Business Model
For the Unilabs business model, refer to the key activities as mentioned above.
Corporate Social Responsibility
Unilabs’ mission for a healthier tomorrow underpins our aspiration to help millions of people to maximise their lives by empowering them to manage their health, delivered through socially and environmentally responsible laboratory, imaging and pathology diagnostic services. Unilabs is future proofing for the changing environment with growing sustainability concerns and shifting market and patient preferences.
In the following paragraphs, Unilabs presents a summary of its Corporate Social Responsibility (CSR) activities and ambitions undertaken in 2024, serving as the foundation for the development of an ESG strategy and fulfilling the ESG reporting requirements mandatory for the Financial Year 2025. Unilabs Management is fully committed to continuously work towards reducing its environmental footprint from operations, promoting a socially responsible business culture, and ensuring a sustainable growth path for the company.
Risk Assessment and Policies
Environment and Climate Change: Unilabs’ impact on environmental issues and climate change continued to be assessed by the external Carbon Footprint Assessment. The outcome, based on 2023-data together with the results from the previous carbon assessment, resulted in a continued Greenhouse Gas Emissions inventory (GHG Inventory) to strengthen the baseline and to further understand Unilabs’ emissions divided by scope.
Management has assessed that about 7% of emissions were under Unilabs’ operational control (Scope 1 and 2), and 93% are due to all other indirect emissions, as purchase of goods and services, waste disposal, employee commuting, business travel, among others (Scope 3).
Emissions directly connected to operations, were mainly arising from own facilities, including laboratories, collection centres, and offices and emissions resulting from the transportation of samples for testing. Further emissions were related to generation of biohazardous waste from laboratories and those associated with pure water utilization from medical devices. Unilabs is committed to develop and implement a plan that will reduce the overall footprint over time, aiming for a net-zero impact in the long run. Maintaining a focus on these impacts is critical from a strategic perspective to ensure sustainable growth and deliver low-carbon products and services to customers.
At the end of 2024, the share of electric cars was 5.3 %, and we plan a significant increase in the next 3 years. Unilabs is preparing the implementation of renewable electricity starting in 2025. Both initiatives will achieve a significant reduction of scope 1 and 2 GHG emissions under Unilabs’ control.
Social and Employee Conditions: Unilabs strives to foster an inclusive corporate culture with equal opportunities, sponsoring respect and appreciation for diversity in a setting where every viewpoint counts. E.g. Unilabs is proud to have gender parity with 60% women and 40% men in management positions.
Unilabs takes responsibility for employees’ health by adopting controls to reduce occupational risks at the facilities, thereby mitigating the risk of injuries and cases of illness by:
Assessing workplace risks and developing action plans to address non-conformities found.
Providing visibility of injuries and illnesses to the leadership teams, raising awareness of health and safety performance, and systematically addressing learning from events.
It is important to stress that local laws play a key role in health and safety matters, and one of Unilabs’ primary objectives and priorities is to ensure local compliance with each respective country’s applicable legislation.
Unilabs continually strives to enhance employee engagement. Key initiatives include:
Acting upon insights gained from the yearly Global People Survey to enhance overall engagement across the business.
Enhancing Unilabs’ culture through activities such as organization of local team events and team-building activities.
Upskill Unilabs employees and job satisfaction with improved processes, organization, and tools enabled by the multiyear system implementation initiatives in HR, Procurement and Finance. This has been further complimented by offering a curriculum for skills needed to excel and realize their potential.
Support senior managers with targeted training and development initiatives that enhance their effectiveness in navigating the challenges of a fast-paced organization and managing their teams with an approach that focuses on foster close engagement and growth.
Continuously improving communication through leadership forums, townhalls and publications.
In 2024, Unilabs introduced in partnership with GoodHabitz an online learning platform for all employees as well as a pilot program for people managers to strengthen leadership and people management skills to improve engagement. The focus on employee wellbeing and development will continue in the years to come and progress on engagement will be measured through an annual Global People Survey that is planned to be conducted in the first half of 2025.
Human Rights: Although Unilabs has not implemented a bespoke Human Rights policy, respect of Human Rights is embedded in our culture and operations, integrated in our new Code of Business Principles. Management considers the risk in relation to Human Rights low, and therefore to date no Human rights policy has been implemented.
Anti-corruption: Unilabs has a zero-tolerance towards bribery and corruption. Unilabs has an anti-bribery and anti-corruption policy along with guidelines that outline the company’s standards of behaviour. Unilabs has enhanced its specific practices to manage conflict of interests, gifts, hospitality and entertainment, sponsorships and donations and is enhancing guidance around managing the risks related to third parties, including implementing due diligence checks with business partners and improving record-keeping. Unilabs has developed an internal compliance academy to further progress the network of compliance officers (LDPCs) across all regions. The anti-bribery and anti-corruption policy aims to inform employees about bribery and corruption risks to prevent any misconduct. Our reporting and audit/investigation process has not identified any material risks.
In 2024, key employees and functions completed anti-corruption training to ensure full integration of Unilabs’ policy into its daily business and strategy. Unilabs has a whistleblowing hotline, which has been operational throughout 2024. No breaches of legislation or Unilabs policies on anti-corruption with material effects on the company have been identified. Unilabs launched a new Code of Business Principles and implemented strengthened management procedures for investigations of serious concerns reported to the whistleblower system. Additionally, all employees participated in online training for Whistleblowing, Data Protection and Cybersecurity awareness. Unilabs continues to improve its recruitment processes to effectively screen for potential conflicts of interests and embedding training and awareness in the onboarding processes.
Statutory Statement on Data Ethics in Accordance with Section 99d of the Danish Financial Statements Act
For Unilabs, data ethics is essentially about maintaining the trust of different stakeholders, including users, patients, consumers, customers, employees, and partners. Currently initiatives are mainly focused on advancing General Data Protection Regulation (GDPR) practices. This represents the starting point of our journey towards comprehensive data ethics practices across all Group entities to be prepared for compliance with evolving data ethics regulations.
FAERCH
Faerch’s sustainability report for 2024 is enclosed on the next pages.
Sustainability report

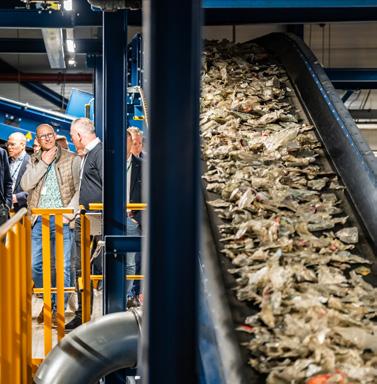
Integrated reporting on our
This provides our stakeholders with a holistic view on Faerch’s value creation, strategic aspirations and performance, while demonstrating our objective to conduct our activities in a financially, environmentally and socially responsible way.


60,000 +21,000
Product designs available
The Faerch Circularity Ratio See page 30 for more information
3 21 +5,000
Recycling capacity in tonnes of PET household waste Dedicated employees
28 +4,400
Production sites
Countries with sales presence
27,250,000 62% +85
Food trays produced for circularity - every day
Average amount of post-consumer recycled content in our PET products
Valued customers globally
Highlights of the Corporate Strategy
VISION
Be the global leader in sustainable rigid food packaging and recycling solutions for the most demanding direct contact applications in a truly circular environment
OPTIMISING OUR EUROPEAN CORE
Continued focus on organic growth, winning with innovation and maintaining cost leadership in everything we do
RECYCLING
Evolving our technology to increase breadth of applications for circular rPET and lay groundwork for expansion
KEY STRATEGIC PRIORITIES
GROWING IN THE US
Customer growth supported by new investments in capacity expansion
SUSTAINABILITY LEADERSHIP
Leading the way on material conversion, scaling of recycling, and higher standards for renewable energy.
Evolving the way we work through continued focus on harmonisation and standardisation of our processes
ENABLER
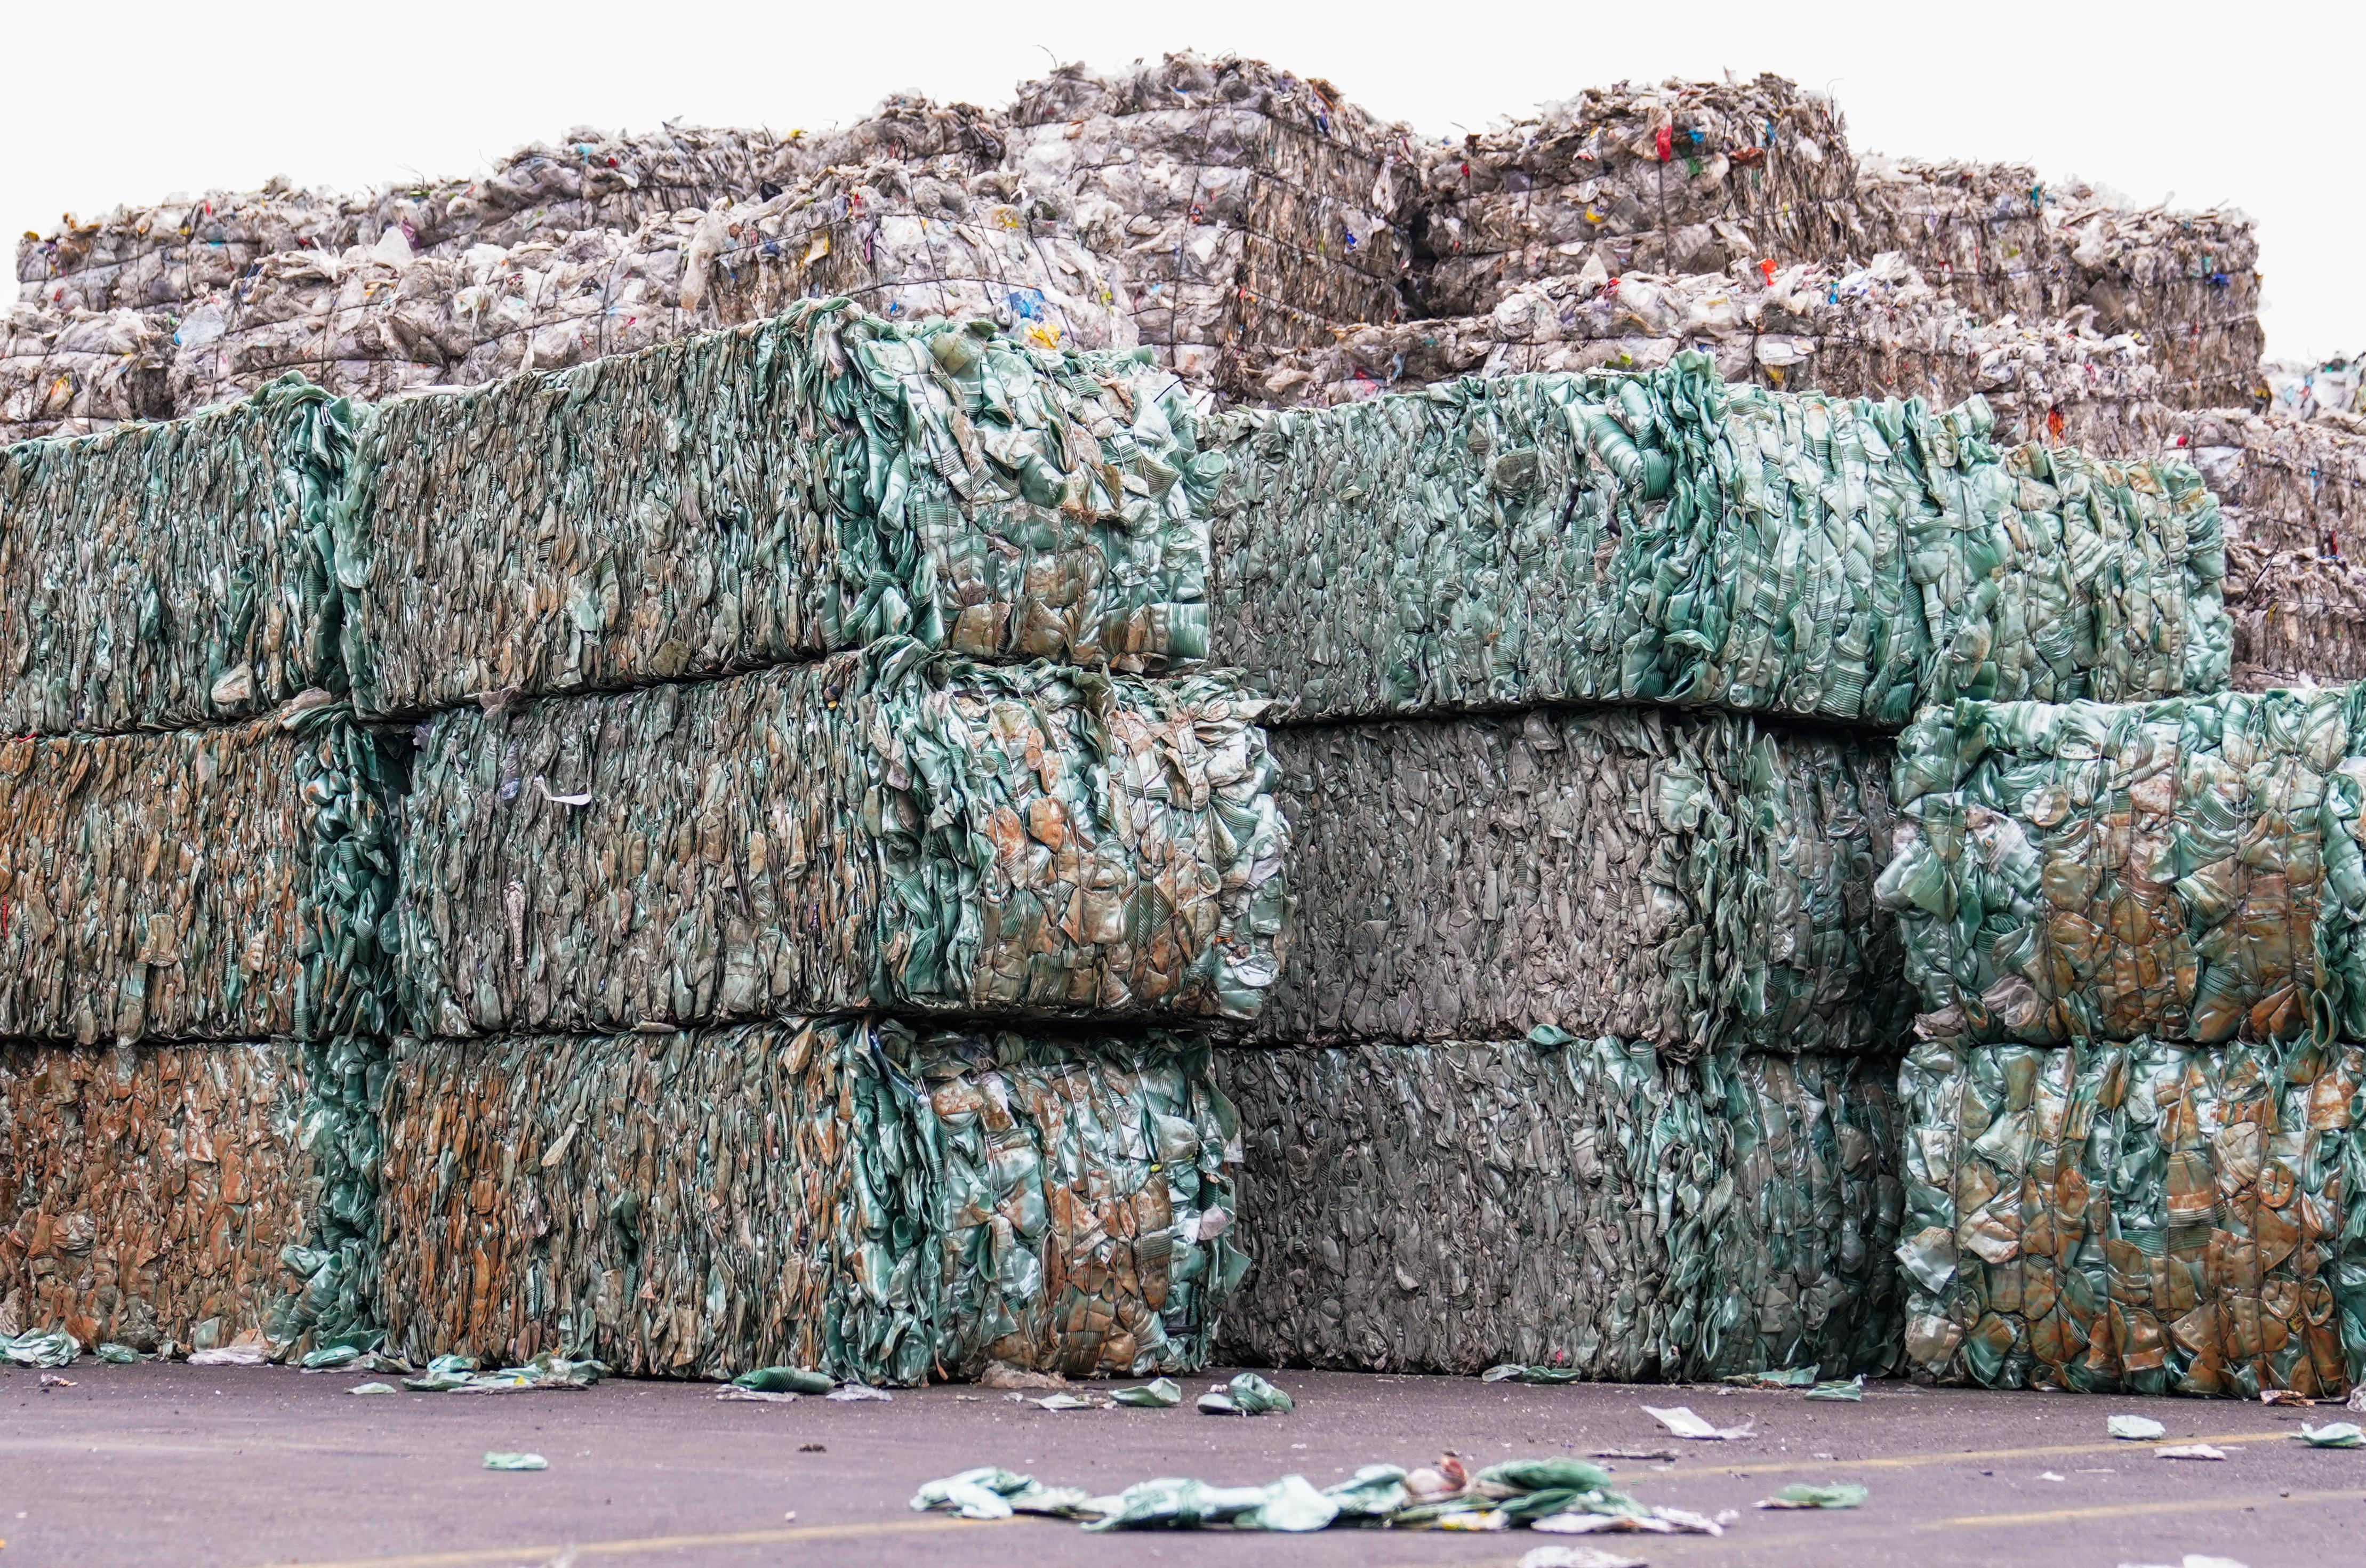
Letter from the CEO
At Faerch, we are driven by a commitment to innovation and sustainability, recognising that transforming the packaging industry’s value chain is crucial for creating a circular economy. In 2024, this was strongly reinforced as we more than doubled our recycling capacity of food packaging at our recycling site, Cirrec, with the introduction of Tray Line 2 – our second tray recycling line.
2024 proved to be a challenging year. The ongoing geopolitical situation, coupled with high interest rates and record high food prices, impacted market sentiment and growth prospects. In the context of this challenging market environment, Faerch delivered a solid performance and continued to reinforce its market position and competitiveness.
At the heart of our strategy is our dedication to circularity, a key enabler for our climate action. Faerch is committed to reaching net-zero greenhouse gas (GHG) emissions across the value chain by 2040, and to reduce absolute scope 1, 2, and 3 GHG emissions 50% by 2030 from a 2022 base year.
In early 2024, Faerch's GHG reduction targets were validated by the Science Based Targets initiative (SBTi), ensuring alignment with the 1.5°C pathway of the Paris Agreement and ranking among the most ambitious in the food packaging industry.
Doubled recycling capacity
In April, Faerch celebrated a landmark moment with the Grand Opening of our state-ofthe-art Cirrec plant in Duiven. Representing a significant investment, the Cirrec plant marks a significant milestone in our dedication to transforming the rigid food packaging industry. Faerch has industrialised its innovative Cirrec technology to manage recyclable PET plastic packaging materials more effectively, ensuring they are given a circular life rather than ending up in landfills or incineration. With an input capacity of 60,000 tonnes, the Cirrec plant will process used PET trays from household waste across the region,
Lars Gade Hansen Group CEO
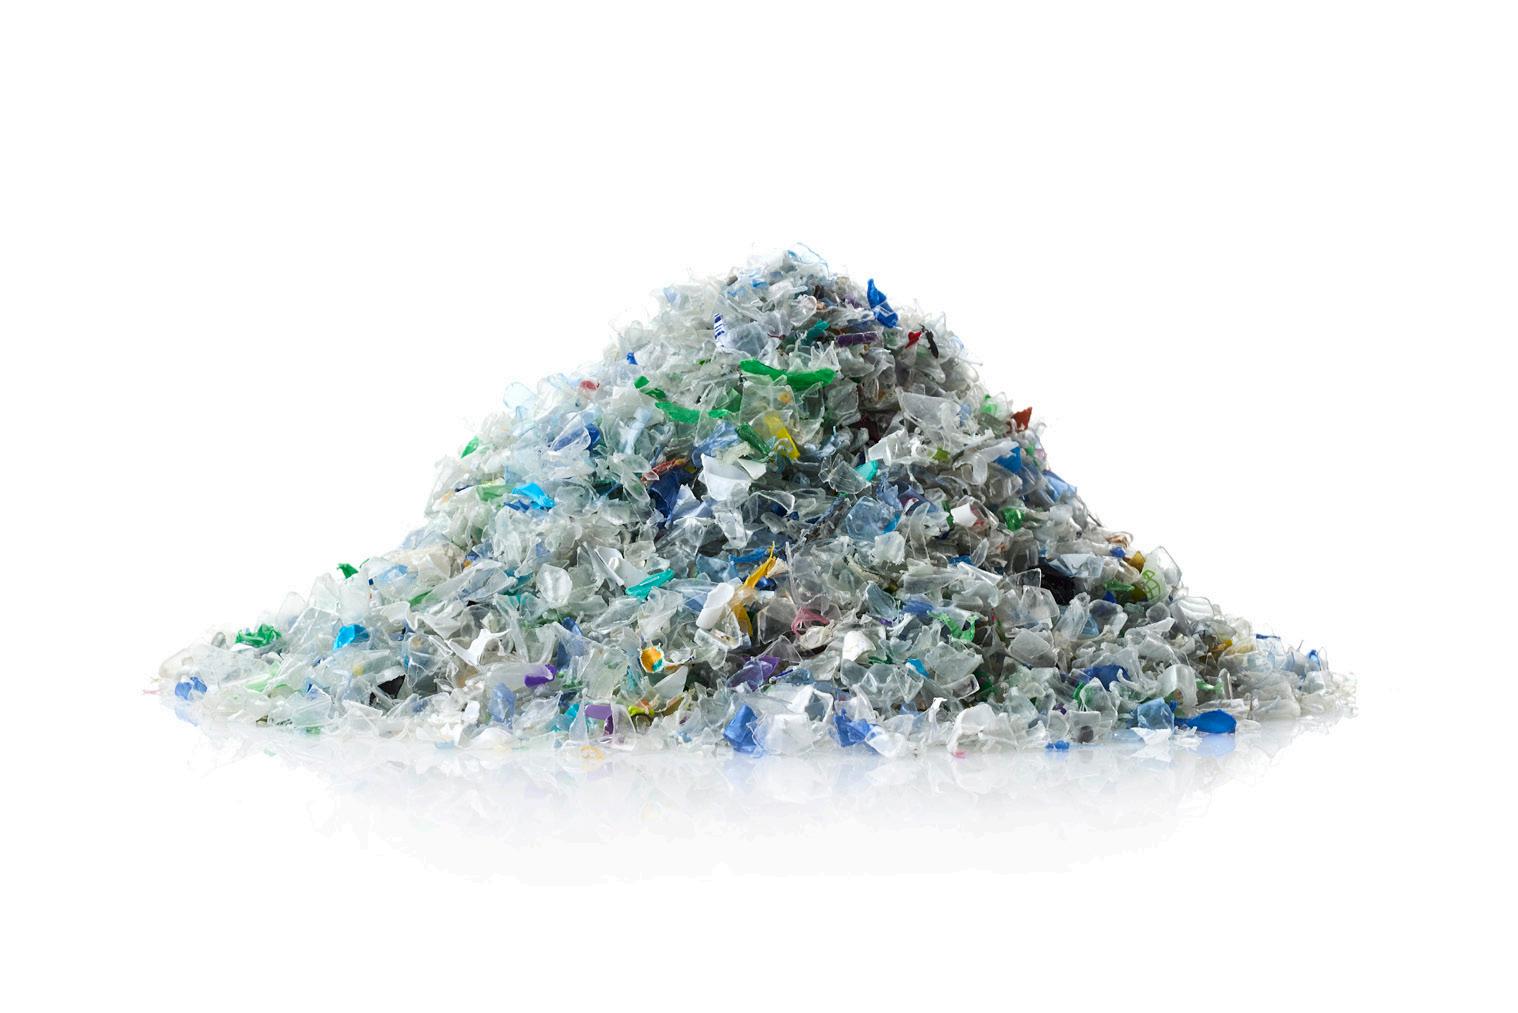
The Cirrec plant marks a significant milestone in Faerch’s dedication to transforming the rigid food packaging industry. With an input capacity of 60,000 tonnes, the Cirrec plant will process used PET trays from household waste across the region, reinforcing our commitment to a circular economy.
reinforcing our commitment to a circular economy.
Faerch remains committed to emission reduction efforts to ensure we achieve our science-based targets. From 2023 to 2024, we more than doubled our capacity of recycled tray PET from our Cirrec site with the introduction of our new Tray Line 2. In 2024, we also signed renewable Power Purchase Agreements in Finland and Hungary, underscoring our continued commitment to sustainability.
We are pleased with the progress achieved in 2024 including a reduction in our carbon emissions of 6%, and a reduction of 14.5% against our 2022 baseline. While some reductions are temporarily due to challenging market conditions, we remain confident in our ability to achieve
permanent emissions reductions, which ensure we are on track towards our nearterm target in 2030.
Empowering growth through our people
Our success is dependent on the strong dedication and values embodied by our team. It goes beyond mere operations; it is a testament to the Faerch commitment, skills, and shared values that form the foundation of our business. We want to build a business with an engaging and collaborative culture that promotes diversity, equity, and inclusion. In 2024, we conducted an employee engagement survey, which revealed several areas where we, as an organisation, are performing strongly such as job content, immediate manager and values. These results reflect the hard work and dedication all our teams
put into creating a healthy and positive work environment. While we take pride in positive feedback, we recognise the need for continuous improvement, particularly in enhancing employee safety and reducing incidents. This remains a priority for 2025.
Looking ahead
As we move into 2025, we anticipate continued subdued growth in the European market. Meanwhile, we see significant potential in the US where we are witnessing strong growth and have high expectations for continued expansion, driven by focused investments in local production and customer development.
The packaging landscape is evolving with the upcoming Packaging and Packaging Waste Regulation (PPWR), which aims to harmonise packaging regulations across
the European Union. Faerch welcomes this and stands ready to lead the circular agenda forward in collaboration with like-minded customers and partners. We also acknowledge the impact of various plastic levies, the single-use plastic directive (SUPD) and the Extended Producer Responsibility (EPR), which will shape our strategic approaches in the coming year.
Thank you
I extend my sincere gratitude to our colleagues for their continued hard work, perseverance, and loyalty and to our customers for the collaboration and trust we have developed over the years.
Lars Gade Hansen Group CEO
Consolidated statement of sustainability performance
6.4

Faerch – how we create value
Faerch helps food producers, distributors, and retailers in the transition to circular rigid food packaging. Our ambition is to make circular food packaging commonplace, and our business model is designed to support our vision and to deliver outstanding food safety, maximum consumer convenience and superior performance to our customers.
We grow by supporting our customers’ growth. We partner with customers, suppliers, and organisations to help innovate our products and support mutual, sustainable growth.
Our people bring our values to life and generate our business results. The commitment, innovation and potential they bring to our business and to our customers are vital to our success and growth.
Our business relies on the ability to source the necessary volumes of the right raw material. Our focus is to secure the necessary input material through our integrated recycling facility and partnerships with external suppliers.
Integrated recycling is key to delivering enhanced performance across the Group and to supply circular packaging solutions that benefit our customers and society. We scale for the future by implementing strategies that support circularity as well as investing in technologies and processes to clean up and utilise waste streams.
With A.P. Møller Holding and our funding partners, we are backed by strong and long-term oriented owners and partners. A strong financial position allows us to invest and scale for the future.
We serve food manufacturers and retailers globally with our network of production facilities across Europe and the US The Faerch platform provides strong material expertise and process capability, setting us apart and allowing us to push the boundaries of our food packaging attributes, for the overall benefit of our customers.


Who we create value for
Our people bring key skills and capabilities to our business and in return, we must keep them safe and engaged while offering interesting career paths and competitive compensation.
Our People
Transitioning to a circular economy is a precondition to make food packaging more sustainable, utilising the resources already available in our economy. By turning waste into a valuable resource, we take responsibility, helping to combat climate change and protect the environment around us.
Our planet
Our customers Faerch supplies high-quality food packaging to more than 4,400 customers every year, enabling them to grow in a world where the demands for sustainable and circular food packaging are increasing, as well as other attributes like shelf life and food safety.
Our society
By investing in recycling that cleans up and utilises waste streams, we are bringing value to the circular economy and the surrounding society. Through our high quality material, we are ensuring food safety to the end-user and prolonged shelf life to minimise food waste.
Highlights and strategic aspirations
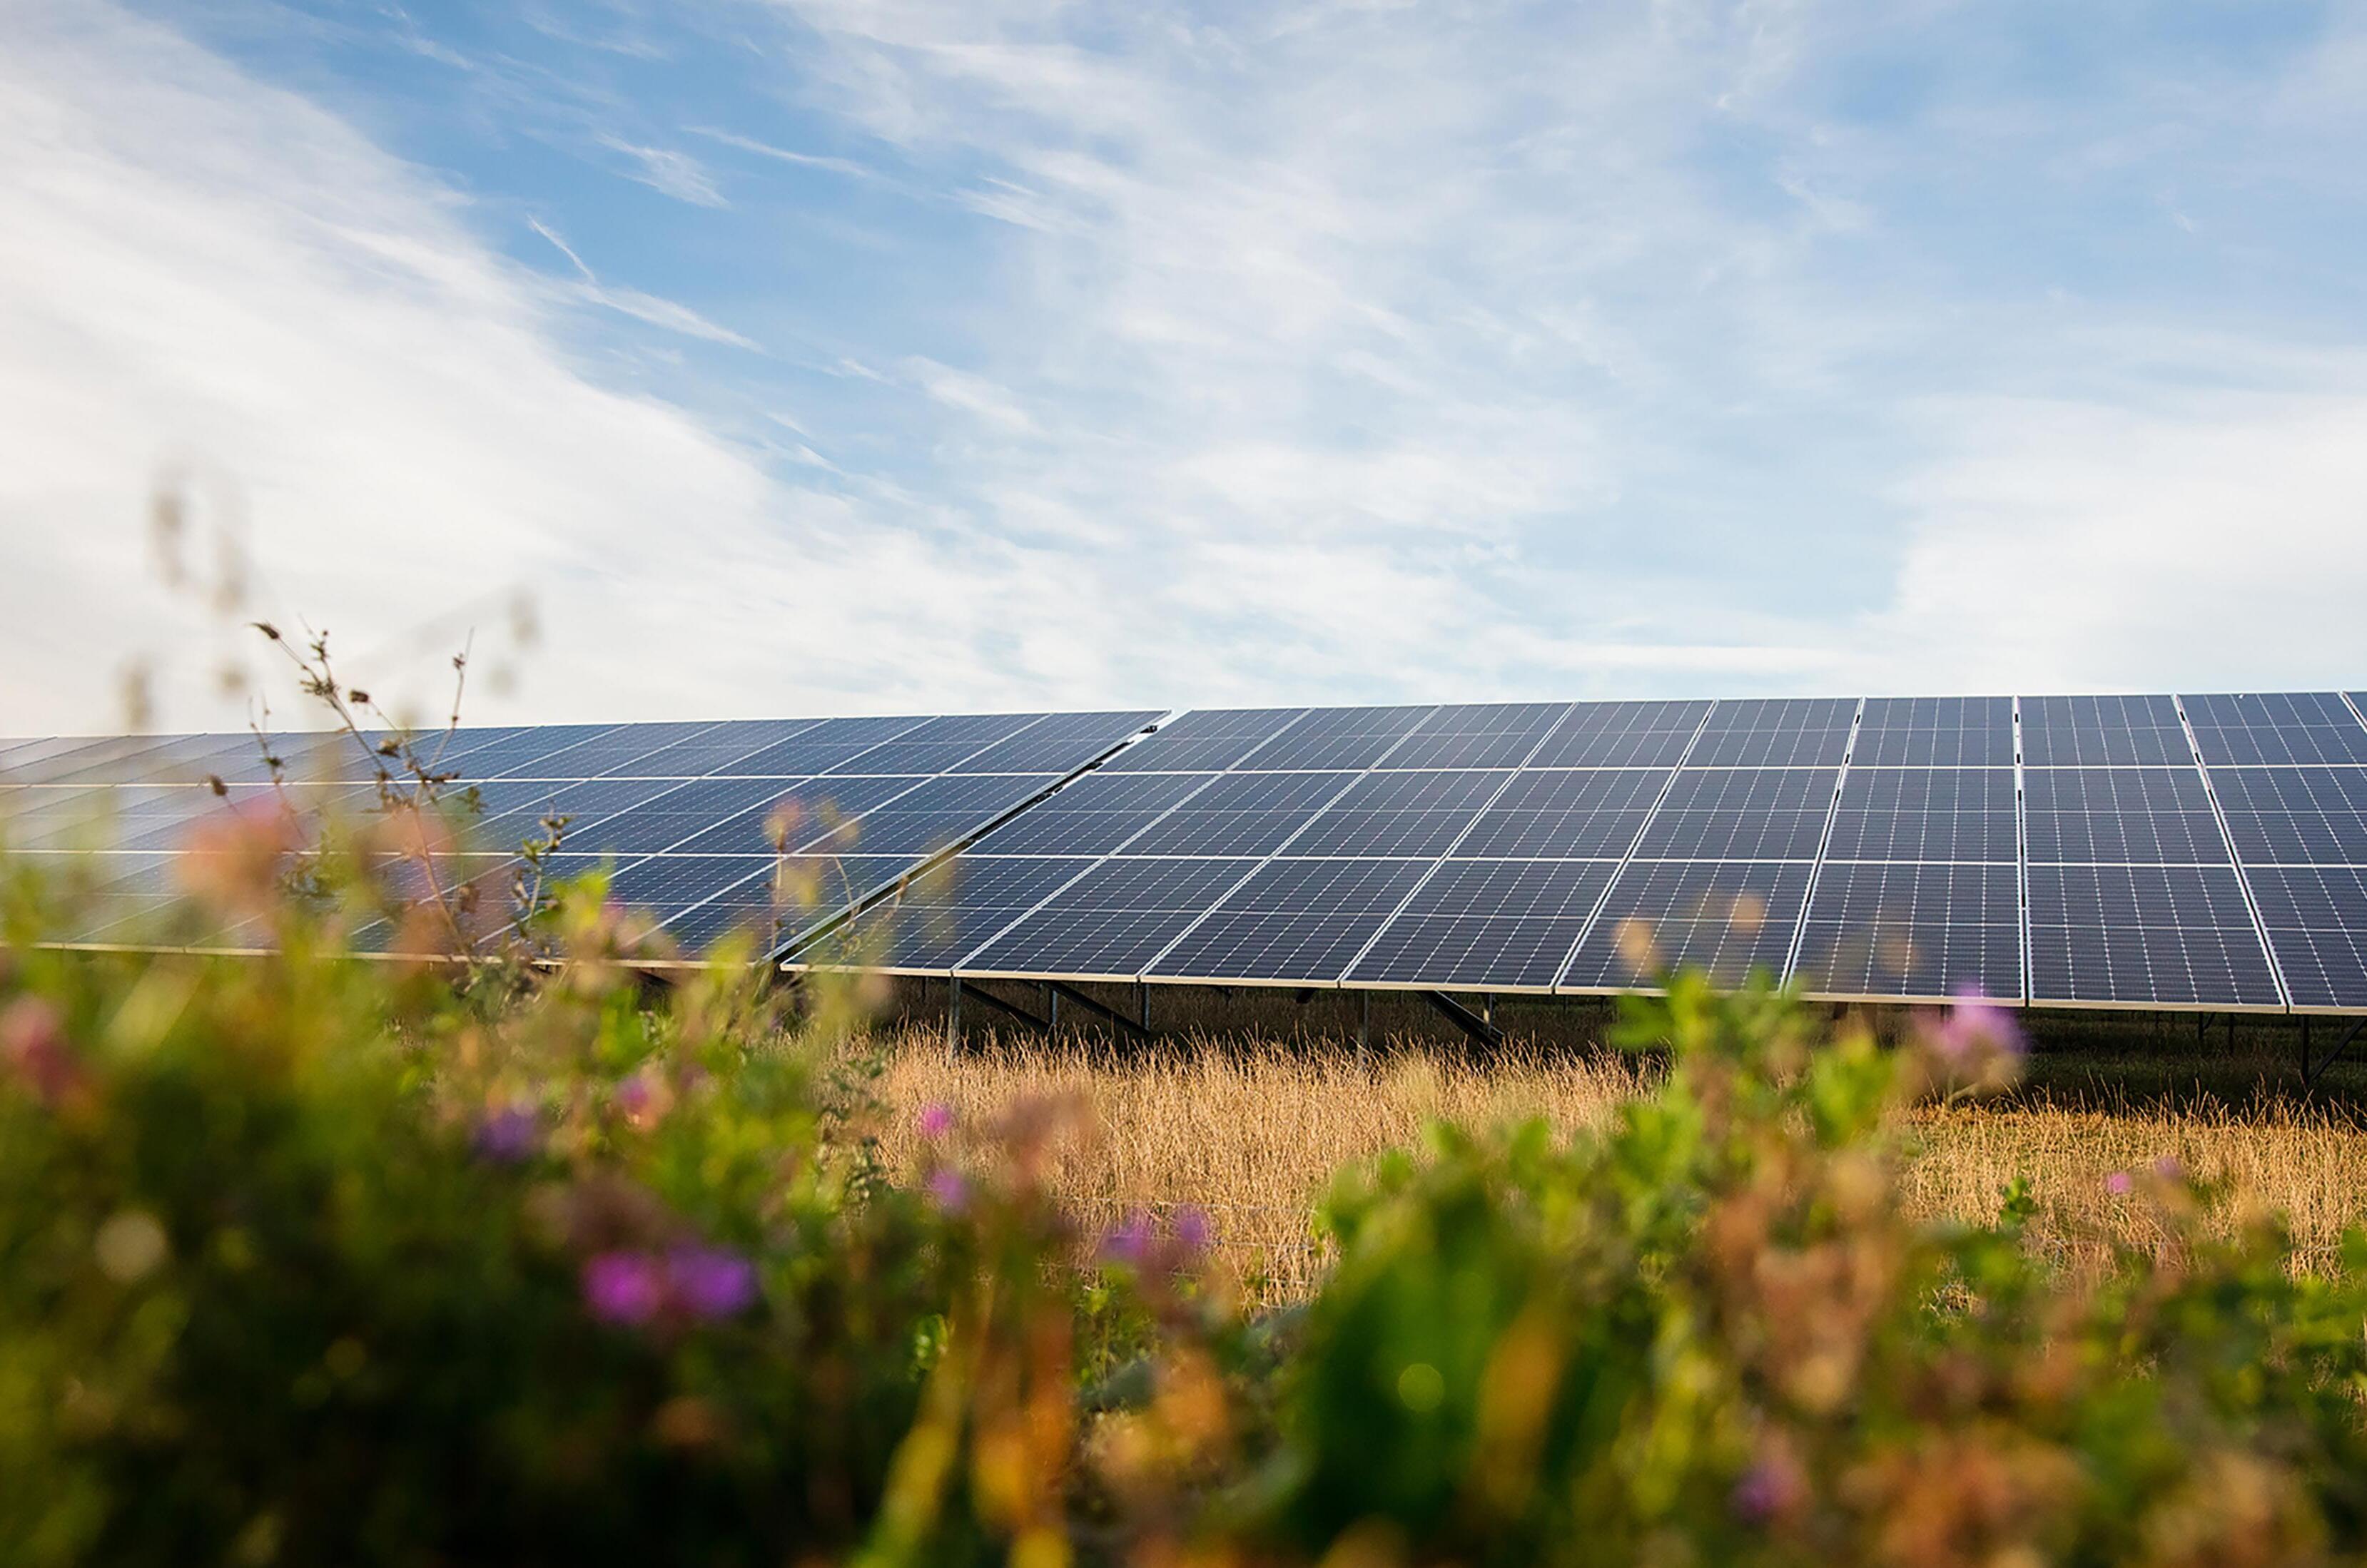
Introducing higher standards for renewable energy sources going forward - moving into off-site and on-site Power Purchase Agreements
RIGID FOOD PACKAGING - BUSINESS
- European markets remained challenging in 2024 with cautious consumers who increased savings, leading to depressed grocery sales.
Our volume growth is below short-term ambitions but acceptable compared to the market development and competition.
- Faerch focused on pricing due to continued cost pressure, positively expanding our commercial position, which is expected to benefit us in 2025.
- The US market continues to perform moderately, especially in ready meals, with significant interest in our PET products.
- The integration of PACCOR and Faerch progressed well in 2024, with cost synergies realised.
SCALING RECYCLING AND ESTABLISHING LEADERSHIP
- We advanced our recycling operations and solidified our leadership in circularity. A key achievement was launching our second tray line in Duiven, which now produces app. 20,000 tonnes of Tray rPET flakes annually, supporting our goal to be an integrated producer and recycler.
- We increased the use of Cirrec materials, with dedicated PET recipes now containing over 70% "tray" rPET , and introduced Circular recipes, shifting our portfolio towards circularity.
- Our recycling business was established as a distinct Division with a dedicated CEO, highlighting Cirrec's importance to our circularity goals and we completed a comprehensive recycling strategy for future growth.
SUSTAINABILITY LEADERSHIP
- Faerch’s greenhouse gas (GHG) emission reduction targets have been validated by the Science Based Targets initiative (SBTi), aligning with the 1.5°C pathway of the Paris Agreement. Faerch aims for net-zero emissions by 2040, and a 50% reduction by 2030 from a 2022 base year, both targets cover scope 1, 2, and 3 emissions.
- Signed two new Power Purchase Agreements (PPAs). These additions bring our total signed off-site PPAs to five, collectively covering approximately 28% of our total electricity consumption once operational.
PEOPLE & CULTURE
- We launched our first company-wide Employee Engagement Survey to understand and address employee needs, creating a workplace, where everyone feels valued, heard, and empowered.
- The ongoing integration provided an opportunitiy to optimise HR operations with clear, structured processes supporting business goals and employee development e.g. by initiating a new HRIT system.
- We also continued the implementation of the People Factor - with uniform standards and a consistent employee experience for our workforce. Achieving 96% site adoption and 70% completion, reinforcing Faerch Group as the employer of choice.
- In Europe, we aim for organic growth in PET and PP by launching new, differentiated products to achieve double market growth, while optimising cost leadership.
- In the US, we will expand our presence through investments.
- Finalise the cultural and brand integration of Faerch and Paccor into one unified Faerch.
- We aim to scale our recycling capabilities to meet growing demand and enhance circularity. Key to this is collaborating across the value chain with waste management partners, technology owners, and retailers to drive innovation and expand capacity.
- By 2026, we plan to access future post-consumer waste streams through new partnerships and begin constructing a third tray line, reinforcing our leadership in PET tray-to-tray recycling.
- We aim to have entered PPAs for all our sites and installed on-site solar panels, where it makes sense, to support our path towards net zero emissions.
- In addition, we want all sites to take the Operation Clean Sweep Pledge to ensure we take all necessary measures to prevent the leakage of plastic pellets, powder and flakes into the environment.
- Develop a comprehensive waste management strategy for our operations with Group wide reduction targets
- We will establish clear organisational structures, build critical skills, and develop a strong successor pipeline.
- Implement the global HRIT system which will streamline processes and strengthen people data.
- We remain committed to fostering an equitable and inclusive culture by raising awareness and emphasising equity.
- Our company will be enhanced even more through a strong and compelling employer brand that emphasises circularity, culture and purpose.
Raising the bar for sustainability
At Faerch, our commitment to sustainable value creation is at the core of our operations. We use the United Nations’ Sustainable Development Goals (SDGs) as our roadmap, aligning our company objectives to promote the long-term growth of society. This involves striking a balance between shortterm and long-term business priorities.
Our environmental, social, and governance (ESG) performance is intrinsically linked to our financial performance, reflected in our Four Ps framework: Planet, People, Principles of Governance, and Prosperity. We consistently integrate these Four Ps into of our business, striving for continual improvement to elevate sustainable value creation.
The following sections on sustainability include reporting in accordance with the Danish Financial Statements Act § 99(a).
Future-Proofing our business
We are proactively preparing for the anticipated Corporate Sustainability Reporting Directive (CSRD). A crucial component is the Double Materiality Assessment (DMA), which we conducted for the first time this year to capture learnings that will help us improve our methodology for next year.
Our initial step involved an impact assessment (inside-out) of Faerch’s impacts on the environment and society, building on our existing evaluations of sustainabilityrelated impacts across our operations and value chain. Additionally, we performed a financial assessment (outside-in) to understand the sustainability-related risks and opportunities facing our business.
Given the extensive requirements of the ESRS principles on double materiality assessment, we chose to focus on internal subject matter experts to evaluate our sustainability impacts, risks, and
opportunities. In 2025, we will further refine our DMA process and methodology.
To identify material topics, we conducted interviews and workshops with internal experts, gathered both quantitative and qualitative data, and engaged in comprehensive discussions to evaluate the significance of various ESG topics. We identified 12 subtopics from a total of five topical standards in the ESRS framework as material and have through our Four P's framework prioritised programmes to ensure continuous improvements in these material areas.
While there is still some uncertainty around the final reporting requirements, we remain committed to continuing our push to raise the bar for sustainability, as part of our strategic objective of showing sustainability leadership in the food packaging industry.
Leading a true circular transition
Sustainability governance is firmly rooted in our Board of Directors and the Executive Management Team. Responsibility for driving actions within various categories is integrated into the business, ensuring alignment with priorities and a longterm focus on sustainability. In 2024, we appointed sponsors from the Executive Management Team for each material category identified in our Double Materiality Assessment, in preparation for the CSRD, ensuring strong leadership to drive progress.
A central Steering Committee (SteerCo), representing key corporate functions, will provide direction, coordination, and subject matter expertise across all categories.
To underscore our commitment to an integrated sustainable strategy, from 2025, all employee bonus schemes will be linked to key sustainability targets.
As external expectations on sustainability evolve and our initiatives advance, we acknowledge that our priorities, targetsetting, and reporting will also develop.
Sustainability oversight
Executive Management Defines an integrated strategy and oversees implementation.
CAPEX Committee
The Board of Directors Endorses sustainability as an integrated part of strategy review. Nomination & Remuneration Committee

AMBITION
We all have an obligation to accelerate climate action. As a fast-growing, global company, the impact of our decarbonisation initiatives become even more effective. Faerch is committed to being a frontrunner within the food packaging industry to reach net zero emissions as fast as possible. Race to Zero
Our ambition is to take climate action and reach net zero emissions by creating circular loops, to ensure low-carbon rigid food packaging, and prolong shelf-life through high quality materials lowering emissions by minimising food waste. We want our operations to be powered by 100% renewable energy obtained through Power Purchase Agreements and on-site solar panels to provide additional renewable energy to the electricity grid.
POLICIES
· Climate, Circularity and Environmental Policy Travel & Expense Policy
TARGETS
2025 Signed Power Purchase Agreements (PPAs) for all sites, where possible
2030 Reduced absolute scope 1, 2 and 3 GHG emissions 50% from a 2022 base year Powered by 100% renewable energy through off-site PPAs and on-site solar panels
2040
· Reduced absolute scope 1, 2 and 3 GHG emissions 90% from a 2022 base year.*
ENDORSEMENTS
· Science Based Targets initiative (SBTi)


Race to Zero


Our commitments
In 2024, the Science Based Targets initiative (SBTi) validated Faerch’s emission reduction targets. This includes our near-term (2030) target aligned with the 1.5°C pathway, and longterm (2040) science-based net-zero target.


This sets our commitment to the ambitious 1.5°C pathway from the Paris Agreement and setting a higher ambition level for climate action in the rigid food packaging industry. Knowing that our scaling of mechanical recycling is crucial for reducing greenhouse gas emissions in food packaging, it stands at the core of our strategy to achieve net zero emissions. We always strive to be an industry leader in sustainability, which is reflected in our decision to set more ambitious targets than required.


Faerch has committed to reach net-zero greenhouse gas emissions across the value chain by 2040 and committed to reduce absolute scope 1, 2 and 3 GHG emissions 50% by 2030 from a 2022 base year.*

Our road to net zero
To fulfil our net zero commitment, a complete transition to circular, low carbon input materials is required. This is a path we have been following for quite some time with recycled PET from pots, tubs and trays, from our own Recycling Division, and it aligns seamlessly with our existing business model as an integrated recycler. We have taken the next significant step on this journey by the establishment of an additional recycling line at Cirrec, effectively tripling our recycling capacity to 60,000 tonnes of post-consumer input material.


GHG emissions across our value chain


of our carbon emissions are tied to our purchased goods

Besides recycled input material, renewable energy is our other must-win battle. In 2024, we signed additional PPA’s covering some of our electricity in Hungary and Finland respectively. This brings us even closer to our goal of powering all of our sites with renewable energy by 2030. In 2025 we will have 4/5 of our off-site PPA's operational, meaning approximately 26% of our energy will be renewable. We anticipate signing at least 4-6 PPA's in the upcoming year that will cover an additional 100 GWh, bringing our total renewable coverage to 47%.
Energy efficiency in the Group Platform
To Faerch, the best energy is the energy saved, delivering not only emission reductions but also cost savings. We will continue our work to use energy efficient technologies and to reduce our energy consumption. Based on our pilot projects run in 2024 at selected sites done in collaboration with external partners, we will evaluate the possibility of extending these solutions to the wider Group, in alignment with our Group Platform mindset. Together with other initiatives, this will allow us to set clear guidelines on how Faerch sites can enhance energy and cost efficiency. It is essential to acknowledge that sites should have the flexibility to choose solutions that best suit their specific needs.
Supplier engagement and transport packaging
Over 63% of our carbon emissions are tied to our purchased goods. In line with our business strategy, we will scale our recycling business to ensure that we are able to provide low carbon input material. In addition, we will work with our suppliers to reach our goals and ambitions. In 2025, we will work further with developing a comprehensive Supplier Engagement Programme. We will assess our suppliers and split them into two groups: High emitters and low emitters. Initially, our focus will be on engaging with high emitters, primarily being our resin suppliers, given the substantial quantities they provide. Our aim is to secure their commitment to support our targets and to encourage them to set their own Science Based Targets with the SBTi. Subsequently, we will proceed to engage with the low emitters, while also sharing our own experience with the SBTi validation process to accelerate theirs. We will place special emphasis on our transport packaging, as we believe there is much to be gained from optimisation and prioritising recycled and reused transport packaging both in terms of reducing emissions and minimising unnecessary packaging waste.
Carbon footprint on products
In 2025, we will continue our efforts to further enhance transparency, addressing the growing customer requests concerning the carbon footprint and other environmental impacts of our products. By helping our customers decarbonise and assisting them in achieving their environmental targets, we will move closer to realising our ambition to transition the industry into a circular environment.
We want to unlock low carbon and circular solutions for our customers. Mono-PET from recycled material is currently the material of choice, if possible, by being designed for true circularity and naturally lower in carbon emissions compared to virgin material. Furthermore, we expect that emissions for recycled PET (rPET) will approach zero in the coming years, driven by greener and improved waste collection, sorting processes and recycling of PET material.
In 2024, we commissioned an external company to conduct a carbon footprint study of PET resin feedstock for packaging, including the tray rPET material being produced at our recycling plant, Cirrec. The report stated not surprisingly that there are significant reductions in the carbon footprint of using recycled food packaging versus virgin material, indicating reductions between 57-71% dependent on methodology used for robustness check. Going forward, we will persistently strive to further reduce the environmental impact of this tray rPET material. Furthermore, in planning new recycling facilities, we will integrate the lessons learned, ensuring that each new facility contributes to minimising the environmental impact of mechanical recycling as much as possible.
Our roadmap to net zero emissions
SCOPE 1 & 2
Own Operations
All sites powered by 100% renewable energy through PPAs and on-site solar panels
Initiate continuous energy efficiency and reduction in consumption
Transition to electrical car fleets
Convert all forklift trucks and other equipment from fossil fuels to electrical/ renewable fuel
SCOPE 3 Value Chain Focus
Convert to low carbon input material by scaling our recycling business and engaging with suppliers
Begin transition to low carbon transportation using electrical trucks and vans or renewable fuels
Focus on increasing recyclable or reusable external packaging
Waste reduction and segregation for reuse and recycling
Delivering Net Zero
Together with our partners and customers, we will support and further develop a net zero food packaging sector of the future, with a wide array of low carbon and circular products. Active partnerships supporting circularity are essential to lower carbon footprint, and to measure and manage the sustainability impacts of our value chain. We will balance any remaining emissions through trusted third party verified climate solutions that benefit society as a whole.
By 2040 we want to reach
Faerch expands recycling capacity to 3 billion food trays annually

In April 2024, Faerch reached a significant milestone in its mission in making rigid food packaging circular. We celebrated the Grand Opening of a second tray line at our state-of-the-art recycling facility, Cirrec, in the Netherlands, joined by over 100 customers, regulators, and industry experts. The event attracted strong interest, with over 600 viewers tuning in live and 740 more watching the recorded version.
With two fully operational tray lines, Faerch is now set to process and recycle an impressive 3 billion food trays annually, reinforcing its leadership in circular food packaging solutions.
This vision is echoed by Jan Thorsgaard Nielsen, CIO of A.P. Møller Holding (owners of Faerch), who emphasised the importance of true circularity:
“Plastics is an effective solution for food packaging, but it must be part of a fully circular system. This means using the same packaging material again and again and again. Faerch exemplifies this approach through Cirrec, where used rPET food trays are transformed into raw material for new food trays, closing the loop on food packaging.”
To drive this transformation, Lars Gade Hansen, CEO at Faerch, emphasised the importance of collaboration across the entire plastic value chain: “Inviting our stakeholders was not just about marking the occasion, but also about building partnerships to shape the path forward.”
Cirrec – leading the way in circular PET recycling
For years, Cirrec has been a pioneer in PET recycling innovation, leading the way in transforming European household waste into valuable raw materials for rigid food packaging. By regenerating discarded materials, the facility ensures that resources are kept within the economy rather than becoming environmental waste – reducing emissions and lowering reliance on virgin material production. Through its production of high-quality rPET flakes and pellets, Cirrec supports both the thermoforming and bottle industries, supplying circular solutions to markets across Europe.
13.8%
The 2024 output from Cirrec accounts for 13.8% of Faerch´s total PET products put on the market.
With Cirrec at the forefront of Faerch’s recycling efforts, the company continues to push industry boundaries, driving innovation and scaling capacity to lead the transition to fully circular food packaging solution.
Case | Race to Zero

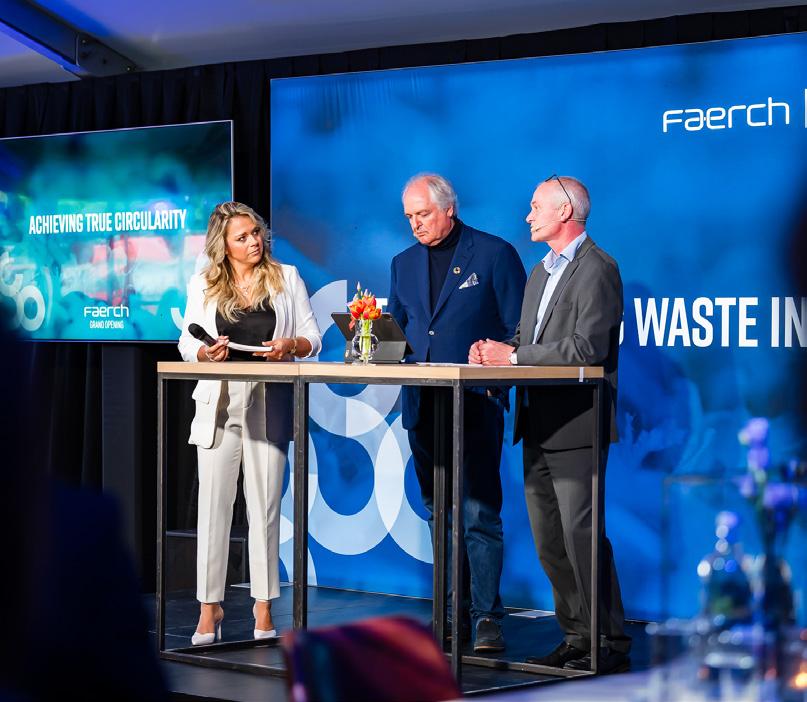
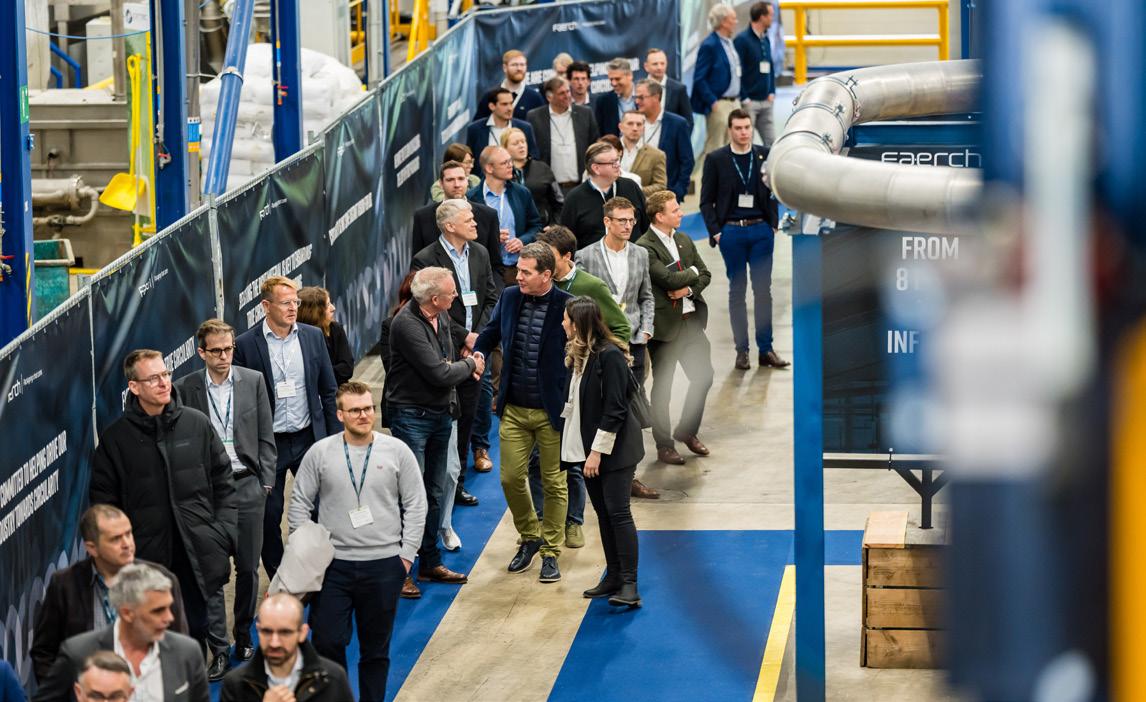
“The grand opening at Cirrec was more than just a celebration for Faerch – it symbolised our dedication to transforming a broken system and leading the shift from linear to circular business practices.”
– Lars Gade Hansen, Group CEO at Faerch
Progressing towards 100% renewable energy consumption
Faerch is making significant progress towards achieving 100% renewable energy across its global operations. Through a series of Power Purchase Agreements (PPAs) with renewable energy providers, the company is ensuring that its production sites are powered by green energy, reducing its carbon footprint and contributing to the global energy transition.
In 2024, Faerch signed one of Hungary’s largest PPAs with GoldenPeaks Capital, securing an annual supply of 15 GWh of green electricity. This agreement will reduce CO2e emissions by approximately 2,300 metric tonnes each year. As Thomas Peter Vikkelsø Tranders, Faerch’s Group Director of Risk, Energy & Insurance, explains: “This PPA is a major milestone in our renewable energy strategy, ensuring reliable and cost-effective green energy for our Hungarian facilities and contributing to our vision of powering all our sites with renewable energy.”
In Finland, Faerch further strengthened its renewable energy commitment by partnering with Better Energy through a 10-year PPA. This agreement will cover around 70% of the company’s energy consumption in Finland, with energy from a new solar park in Hankoniemi.
“By securing renewable energy for our business in Hungary and Finland, we are making our operations more sustainable and ensuring more green energy in the Hungarian and Finnish grids.”
With PPAs already signed in countries such as Poland, the UK and Denmark, and additional agreements in progress in Spain, Italy, France, Germany and a wind PPA for Poland, Faerch is on track to achieve its ambitious goal of securing PPAs for all sites by the end of 2025. This aligns with the 1.5° C target of the Paris Agreement and addresses the Group’s scope 2 emissions. These initiatives highlight Faerch’s commitment to sustainability and its leadership in advancing circular, food packaging solutions produced by renewable energy.
Today, Faerch’s energy consumption is spread across 28 locations in 19 countries, and the annual consumption is reaching over 530 GWh. By continuing to expand its renewable energy portfolio, Faerch is paving the way for a more sustainable future, benefitting both the company and the wider world.
– Tom Sand-Kristensen, Group CFO at Faerch
Case | Race to Zero
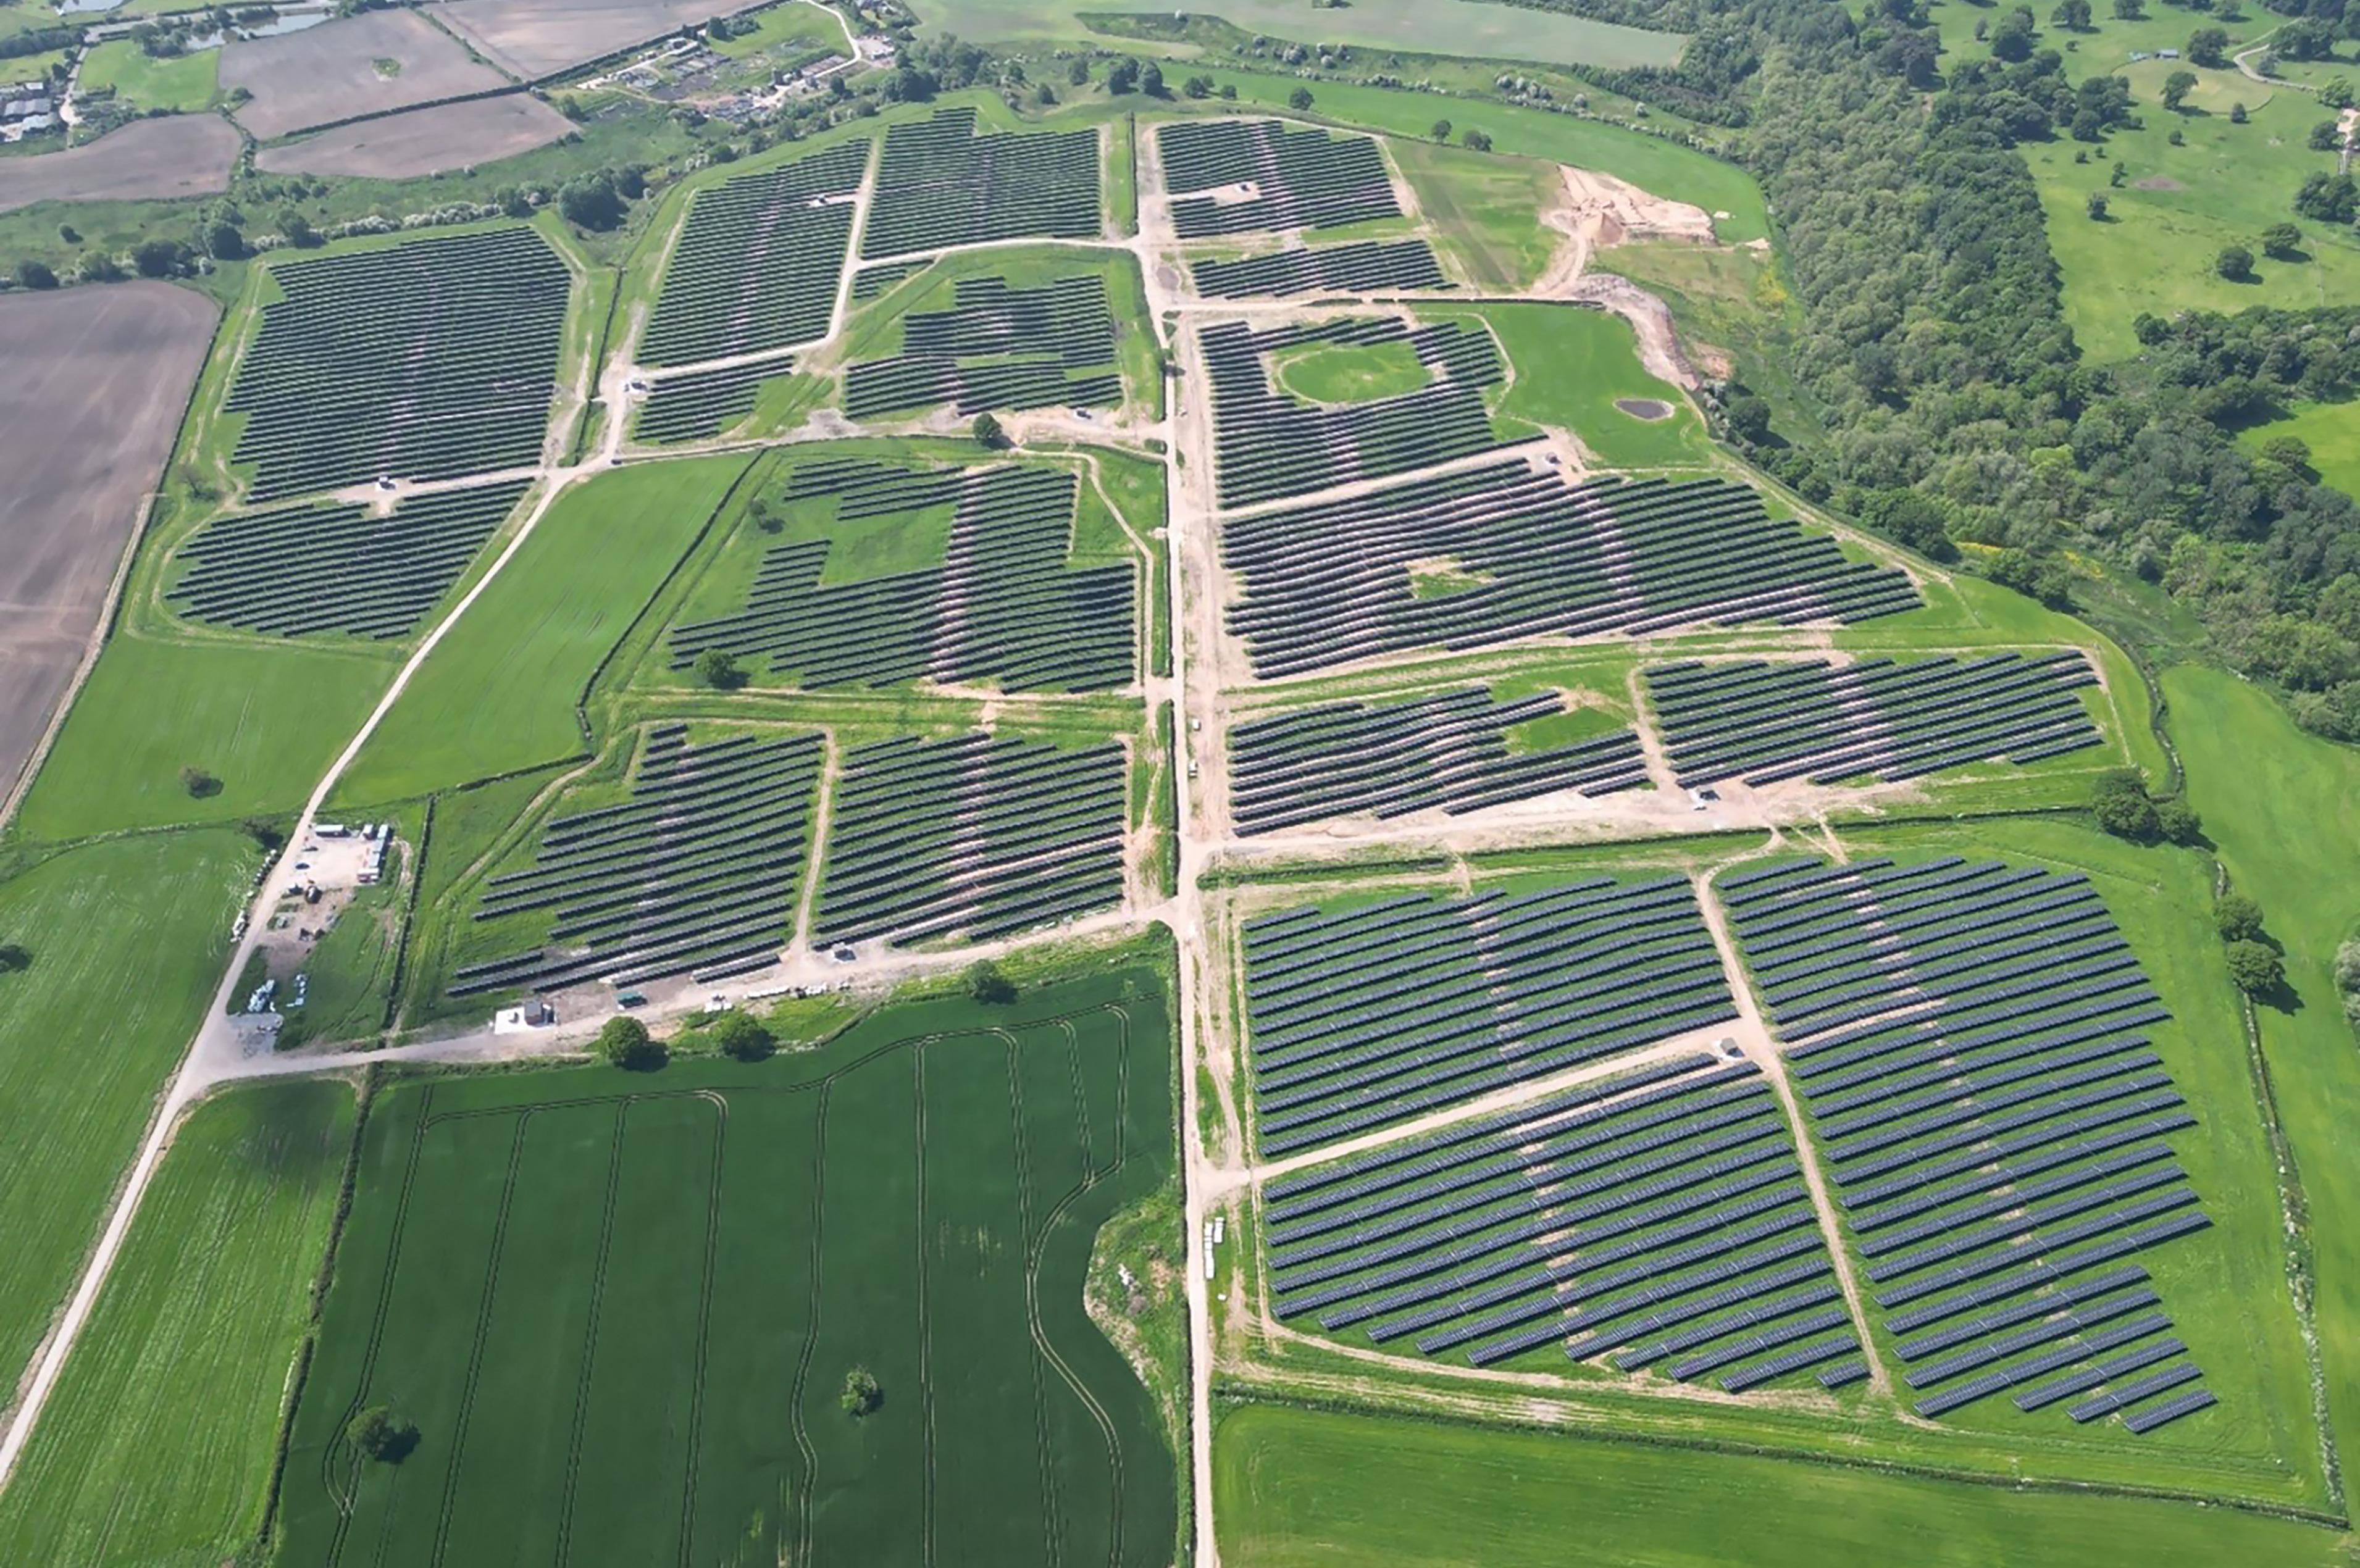
The Bubney solar site in the United Kingdom
Support our Planet
AMBITION
Our ambition is to support our planet by minimising waste and create circular loops to decouple natural resource use from economic growth, reduce carbon emissions and protect our ecosystems, as no waste should ever end up in our water or nature regardless of material. We want to turn waste into a valuable resource.
POLICIES
· Climate, Circularity and Environmental Policy
TARGETS
2025
· All sites to take the Operation Clean Sweep Pledge
2030
· All packaging solutions designed for circularity
Recycle more PET than we sell
· No production waste is sent to landfill or incineration
Prevent pollution from production sites into air, water and soil
Minimise waste of water through less consumption and more reuse
Improving energy efficiency and reducing power consumption across all production facilities
· Support conservation efforts and responsible sourcing to protect ecosystems and reduce the risk of deforestation
ENDORSEMENTS
UK Plastic Pact
· Polish Plastic Pact
US Plastic Pact

60,000
With our newly installed recycling line, our recycling business enables recycling of around 60,000 tonnes of PET household waste. The capacity is expected to grow in coming years in accordance with our business plan to scale up tray recycling of food packaging.
Support our Planet
Waste, regardless of material, should never end up in nature or oceans. We aim to transform food packaging waste into new food packaging, creating a circular loop that turns waste into a valuable resource. However, enhancing the eco-design of packaging, refining waste infrastructure, and fostering responsible waste handling globally are essential steps to ensure this.
Eco-design and harmonised regulations is fundamental for circularity Securing a stable supply of high-quality post-consumer household waste is crucial for transitioning to a circular economy in food packaging. Despite rising demand for recycled materials, plastic packaging collection rates are lagging. Consistent implementation of eco-design principles and harmonised regulations remains a challenge. Encouragingly, regulatory momentum is shifting in favour of circularity, with upcoming legislation e.g. the Packaging and Packaging Waste Regulation (PPWR) and Extended Producer Responsibility (EPR) schemes together with taxes and other levies incentivise circular materials in packaging design. Alongside the regulatory drivers, our own efforts to scale recycling, are supporting a long-term, circular raw material supply.
To accelerate circularity and improve the availability of food packaging waste eligible for recycling, it is important that we engage directly with key stakeholders across the value chain e.g., customers, retailers, Producer Responsibility Organisations (PRO’s) and recyclers to create circularity within food packaging. We also trust that the EU Single Market Strategy will drive harmonisation across markets where Faerch operates, ensuring that our circular products are treated consistently in terms of taxes and fees, regardless of the market in which they are sold.

Faerch’s commitment to circularity
At Faerch, our long term vision is to lead the packaging industry towards circular business practices. Our dedication to sustainability is embodied in our use of recycled PET, when used as a mono-material it is the gold standard in circular packaging, due to its superior recyclability and ability to be repurposed into food-grade products.
While PET is our preferred material, we recognise the importance of versatility and adaptability to offer PP solutions, especially where PET alternatives do not exist. With a significant portion of our portfolio consisting of PP - a durable, heat resistant, and clear material with established recycling pathways – we remain open to innovations, which advances PP into circularity at scale and at a commercially viable cost.
Scaling recycling and innovation
Short-term, we expect increasing demand for post-consumer recycled PET, as the material meets circularity criteria and complies with the upcoming PPWR. Furthermore, as these circularity and regulatory requirements evolve, Faerch aims to be a trusted advisor to customers, guiding them through this transition.
Faerch is actively participating in the development of new standards that will form the foundation of future requirements set by the European Commission. We are directly involved in the standardisation efforts coordinated within European Committee for Standardization (CEN) groups. Faerch is also committed to developing and promoting future Design Guidelines for Recycling to its partners, in collaboration with recognised and influential professional organizations such as RecyClass and PETCORE.
At Cirrec, we recycle tray rPET at scale, collecting post-consumer PET trays in all forms, including transparent, opaque, mono-layer, and multi-layer structures. By avoiding selective sorting, we maximise resource efficiency and minimise waste. Our sorting and recycling processes produce two distinct output streams: one for coloured and one for clear rPET, ensuring both high functionality and compliance with food safety regulations.
Faerch’s tray rPET is hence well-positioned to meet and exceed the targets set by the PPWR for 2030 and beyond, underscoring our dedication to a circular future. Our commitment is further reinforced by key product innovations through the years, designed to enhance the sustainability of our packaging solutions.
Key innovation highlights
- Development of new ‘In-Built Absorber’ which allows the packers to remove the absorber pad leading to trays more suitable for recycling, as no pad is glued to the trays.
- Launch of new initiatives that guarantees a minimum 40% tray rPET in selected recipes in the UK and Ireland.
- Continued focus to phase out multi-
material APET as it reduces the quality of the post-consumer waste stream.
- Continued development of the new RecycleDuo solution that allows mechanical separation of the sleeve and pot for our DuoSmart products, ensuring compliance with latest regulations and no contamination in recycling processes.
- Launch of the from ‘Clear to Circular’ initiative which promotes products with a high content of Tray rPET resulting in a slightly hazier appearance compared with bottle rPET, indicating it comes from food packaging, being of high interest for responsible customers, who want to close the loop in food packaging.
Cleaner and more uniform waste streams in the future
Not all materials entering our recycling plant meet the quality standards required for Faerch’s products, with some being unsuitable as recycled content due to their non-PET composition. These input waste bales reflect the current state of household waste sorting, which is hindered by multimaterials that cannot be separated during recycling, thus impeding system circularity.
The Chilled Ready Meals trays for the UK market which guarantees minimum 40% Tray rPET.
The Faerch Circularity Ratio

Looking only at our PET volumes of 9 bn pieces sold, it corresponds to 1/3 of our PET products being truly circular 3 9
Currently, our installed recycling capacity will enable us to have an estimated 3 bn pieces of Faerch’s products being truly circular out of our total 21 bn pieces sold on the European market.
platform 3 21 3/106 increase the Market Circularity Ratio
In Europe, around 106 bn pieces of rigid food packaging are produced annually. We need to increase the Circularity Ratio in the market. This is why we open up our recycling platform for competitors to establish rPET from food packaging as a global commodity.
Upcoming EU regulations aim to create cleaner future waste streams through improved sorting practices, stringent eco-design requirements, and harmonised product development. This will significantly reduce the output waste stream from our recycling operations. However, while we await these regulations, we are taking proactive steps by partnering with others to ensure that all recyclable materials are recycled.
Our ambition extends to developing innovative technologies and process steps with partners to achieve our zero-waste goal through “smart loops.” These smart, efficient recycling loops handle challenging “wasteof-waste” materials. We are increasing efforts to convert these streams into valuable products like plastic pallets. When product recycling is not feasible, chemical recycling is the next option, followed by using materials as alternative energy sources to reduce fossil fuel consumption. By focusing on these smart loops, we are reinforcing our dedication to turning waste into a valuable resource for all materials.
Environmental management
Our commitment to product circularity which enables climate action, is part of our core strategy. However, our focus goes broader as we continuously aim to have operations which minimise the environmental impact. All efforts are guided by our new Circularity, Climate, and Environmental Policy.
We are dedicated to adopting circular practices across our operations, ensuring that no production waste is sent for disposal to landfill or incinerated. Comprehensive recycling programs are being expanded into 2025, and we collaborate with several partners to ensure materials are properly processed and reintegrated into the supply chain. By working closely with suppliers, customers, and other stakeholders, we aim to create closed-loop systems for continuous material reuse.

Operation Clean Sweep
We are dedicated to adopting circular practices across our operations, ensuring that no production waste is sent for disposal to landfill or incinerated.
Our focus on reducing our environmental footprint also includes preventing pollution from entering the air, soil, or water e.g., we implement measures to control emissions and have initiated a more structured approach to the tracking and reporting of our VOC emissions this year. Furthermore, all sites from 2025 will be obliged to follow the procedures in Operation Clean Sweep to prevent lost of plastic into the environment.
We are furthermore improving our water management practices. The majority of our water supply is connected to our Recycling Division, and we continuously invest in water-efficient technologies and optimize our processes to minimize water use. Additionally, we implement systems to capture, treat, and reuse water.
In alignment with our environmental goals, Faerch joined Operation Clean Sweep (OCS) in 2019, a dedicated program aimed at preventing plastic resin loss in resin handling operations. We are committed to ensuring that all our sites actively participate in and promptly implement this initiative. This effort is crucial for preventing the loss of plastic pellets, powder, and flakes into the environment.
Currently, 23 (82%) of our sites are signed up for Operation Clean Sweep (OCS). All European sites will be signed up for OCS end of 2025, and our US sites will follow the same requirements set out in OCS. This includes the following actions at all sites:
• Installing filters on external rainwater drainage systems to stop pellets and flakes from entering rivers and seas.
• Fitting filters on internal drainage systems.
• Positioning extra cleaning stations around the sites to clean up any material spills, including industrial vacuum cleaners.
• Conducting regular internal site audits to reduce the possibility of material spills.
Setting new circularity standards: Launch of chilled ready meal trays with a minimum of 40% Tray rPET
Case | Support our Planet
For years, Faerch has been at the forefront of advancing circularity in the food packaging industry. In 2024, we launched CPET trays for chilled ready meals in the UK and Ireland, containing a minimum of 40% Tray rPET and setting new standards for circularity in rigid food packaging.
Since introducing Evolve by Faerch in 2019, Faerch has been a leader in transforming food packaging. Designed specifically for the ready meals market, Evolve by Faerch incorporated up to 70% post-consumer recycled content, including the use of mixed colour “jazz” bottle flakes. This bold move not only set new industry benchmarks for the use of recycled materials but also demonstrated Faerch’s commitment to
circularity by ensuring that Faerch products could be fully recycled into high-quality food-grade packaging.
With the significant expansion of our Cirrec recycling facility in 2024, we have taken another major step toward circularity. Starting January 1, 2025, we will introduce CPET trays for chilled ready meals with a minimum of 40% Tray rPET content, while maintaining the essential CPET properties required for food safety and functionality. The inclusion of Tray rPET will not only ensure high levels of post-consumer recycled content but also a significant amount of circular content, enabling customers to partner with Faerch in taking responsibility and closing the loop on food packaging.

“We have built on our success of Evolve by Faerch, and our ambitions continue to grow. By strengthening our recycling capabilities and integrating advanced technologies, we reinforce our position as a leader in circular packaging. The launch of the new CPET trays marks a significant milestone in our journey toward a more sustainable and circular packaging system,” says Lars Gade Hansen, Group CEO at Faerch.
Driving true circularity
Just as bottles are transformed into new bottles, trays must be recycled into new trays without downgrading the material or diverting it to other waste streams.
Using Tray rPET reduces emissions and reliance on virgin fossil fuels, contributing to a...
“By incorporating a high percentage of Tray rPET in our CPET trays, we are taking an important step towards circularity in our industry.”
Future ambitions
As part of our ongoing commitment to advancing circularity in global food packaging solutions, we plan to expand the launch of our chilled ready meal trays with Tray rPET to new markets and further increase the proportion of recycled content in our products.

Lars Gade Hansen, Group CEO at Faerch
Smukfest 2024: Introducing circular festival cups
Case
“This collaboration demonstrates the importance of innovative partnerships in creating meaningful change. Through these efforts, Smukfest and its partners are setting a powerful example of how festivals can embrace circular solutions to reduce their environmental impact”
– Jesper Emil Jensen, Regional CEO at Faerch
In 2024, Smukfest in Denmark set an ambitious goal to collect 75% of its festival cups for recycling. Partnering with Royal Unibrew, Dansk Retursystem, and Faerch, the festival not only met but exceeded expectations, achieving an impressive 95% collection rate of over one million cups used during the festival week. These collected cups were then successfully recycled into new cups at Faerch's recycling site Cirrec, closing the loop.
From single-use to circular cups
Summer 2024 marked a new era for festival and concert cups, thanks to Royal Unibrew, Denmark’s second-largest brewery. At Smukfest, the brewery introduced an innovative circular cup made from recycled materials, developed in collaboration with Faerch.
The cups were collected through Dansk Retursystem, Denmark’s deposit system, and recycled into new food-grade cups, creating a closed loop system that reduces the need for virgin material and minimises waste. This initiative demonstrates the value of circularity in driving sustainability and keeping valuable resources in use.
To ensure the cups circularity, Smukfest implemented several initiatives:
- A green fee of 5 DKK for new cups
- A “Swap for new” system allowing attendees to exchange used cups for new ones free of charge
- Increased deposit refunds at return stations
- Enhanced sorting bins and extra staff for waste management
These efforts ensured that cups didn’t end up in residual waste but were instead collected for recycling.
Positive results across festivals
In addition to Smukfest, 36 other festivals and concert events in Denmark tested the new cups, all reporting positive outcomes.
A lifecycle analysis assessment (LCA) conducted by Force Technology for Royal Unibrew showed that the cups have a significantly lower environmental impact compared to single-use cups. The LCA also demonstrated that these recyclable cups rival washable cups when the latter aren’t reused sufficiently before breaking.
“Even if the cups break during use, they can still be recycled. This isn’t the case for washable cups used in high-stress environments like festivals,” says Jesper Emil Jensen, Regional CEO at Faerch.
Closing the loop
The new festival cups are made with 87% recycled PET and are recyclable, making them a great alternative to traditional single-use cups. In 2024, 95% of all cups at Smukfest were collected and recycled into pellets used for creating new cups, a significant improvement from 2023, when only 30% were collected and turned into plant pots.
| Support our Planet

2023
- 100% virgin plastic
- 30% of cups collected and recycled into non-food-grade products like plant pots

2024
- 87% recycled content
- 95% of cups collected and recycled into new food-grade cups
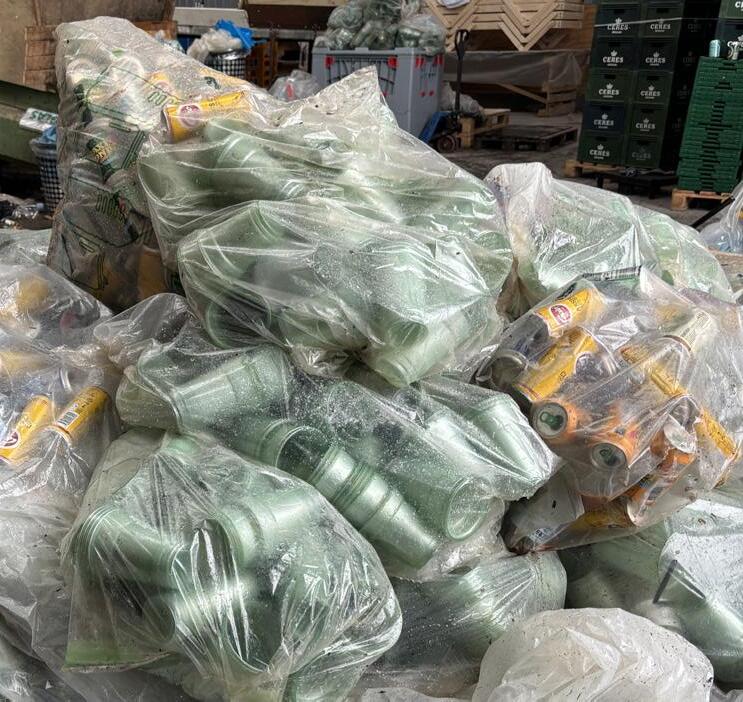
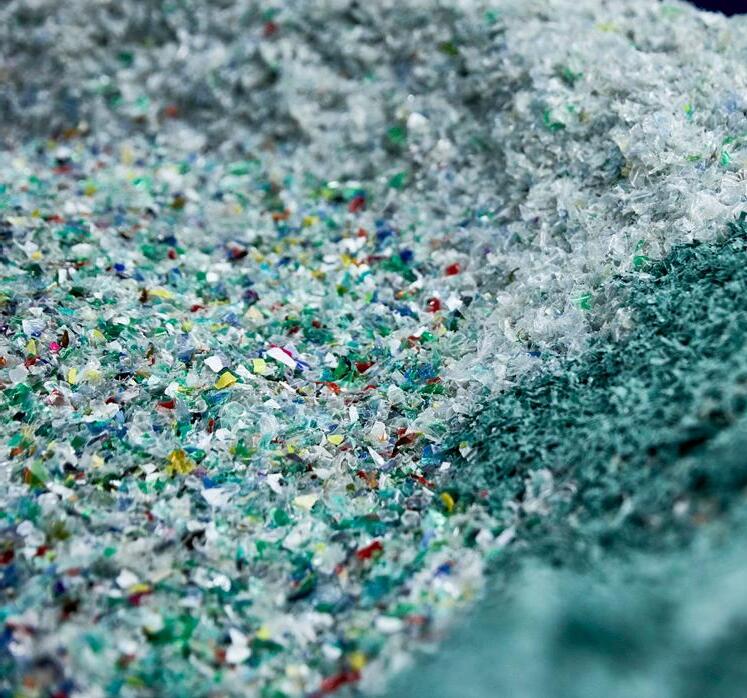

Less waste, more recycling: Danish Crown embraces circularity with green meat trays
Case | Support our Planet
In 2024, global meat producer Danish Crown began replacing 55 million black meat trays in Denmark with green Evolve by Faerch trays. Made from at least 90% recycled content, these trays are fully recyclable and compatible with existing recycling systems – an important milestone in achieving circular packaging.
“At Danish Crown, we have been actively working to address the challenges associated with the black plastic tray for a long time. As a modern food producer, we cannot accept that our packaging is not recycled on a large scale. In 2019, we transitioned to PET plastic, which should be recyclable. However, we must acknowledge that the current technology in sorting facilities present challenges. As a consequence, we have decided to phase out
our black trays,” says Tim Ørting Jørgensen, member of the Executive Management at Danish Crown, adding: “To fulfil Danish Crown’s sustainability ambitions, it is essential that we reduce the amount of our packaging, and that the packaging we use is recyclable. While the majority of our emissions come from the farms, we simply cannot achieve our sustainability goals without also reducing our packaging.”
Black trays are often undetectable by Near-Infrared (NIR) sensors in recycling facilities and therefore end up being incinerated. The green Evolve by Faerch trays address this issue, enabling used trays to be recycled into new ones. Their often green colour
enhances detectability during sorting, allowing more recycled household plastics –not just bottles – to be used.
“The solution chosen by Danish Crown is a strong example of a highly circular system, combining a high content of recycled plastic with the ability to sort and recycle trays into new ones,” says Group CSO at Faerch, Elisabet Sandnes.
The switch to green Evolve by Faerch trays will apply to all Danish Crown products previously packed in black meat trays in Denmark, including minced meat, sausages, and pork cuts. By 2025, Danish Crown aims for 90% of its packaging to be recyclable, moving towards their 2030 goal of fully recyclable packaging.
“We truly believe that consumers will embrace the idea. It may require some adjustments, especially considering that, for so many years, people have been accustomed to meat packed in a black
meat tray. However, we know from organic products, which are already presented in the green Evolve by Faerch tray that it is possible,” says Director of global strategies at Danish Crown, Malene Eriksen Vestergaard.
Danish Crown’s shift in packaging demonstrates how innovative solutions can drive circularity, reduce waste and support sustainability.
“The solution chosen by Danish Crown is a strong example of a highly circular system, combining a high content of recycled plastic with the ability to sort and recycle trays into new ones”
– Elisabet Sandnes, Group CSO at Faerch
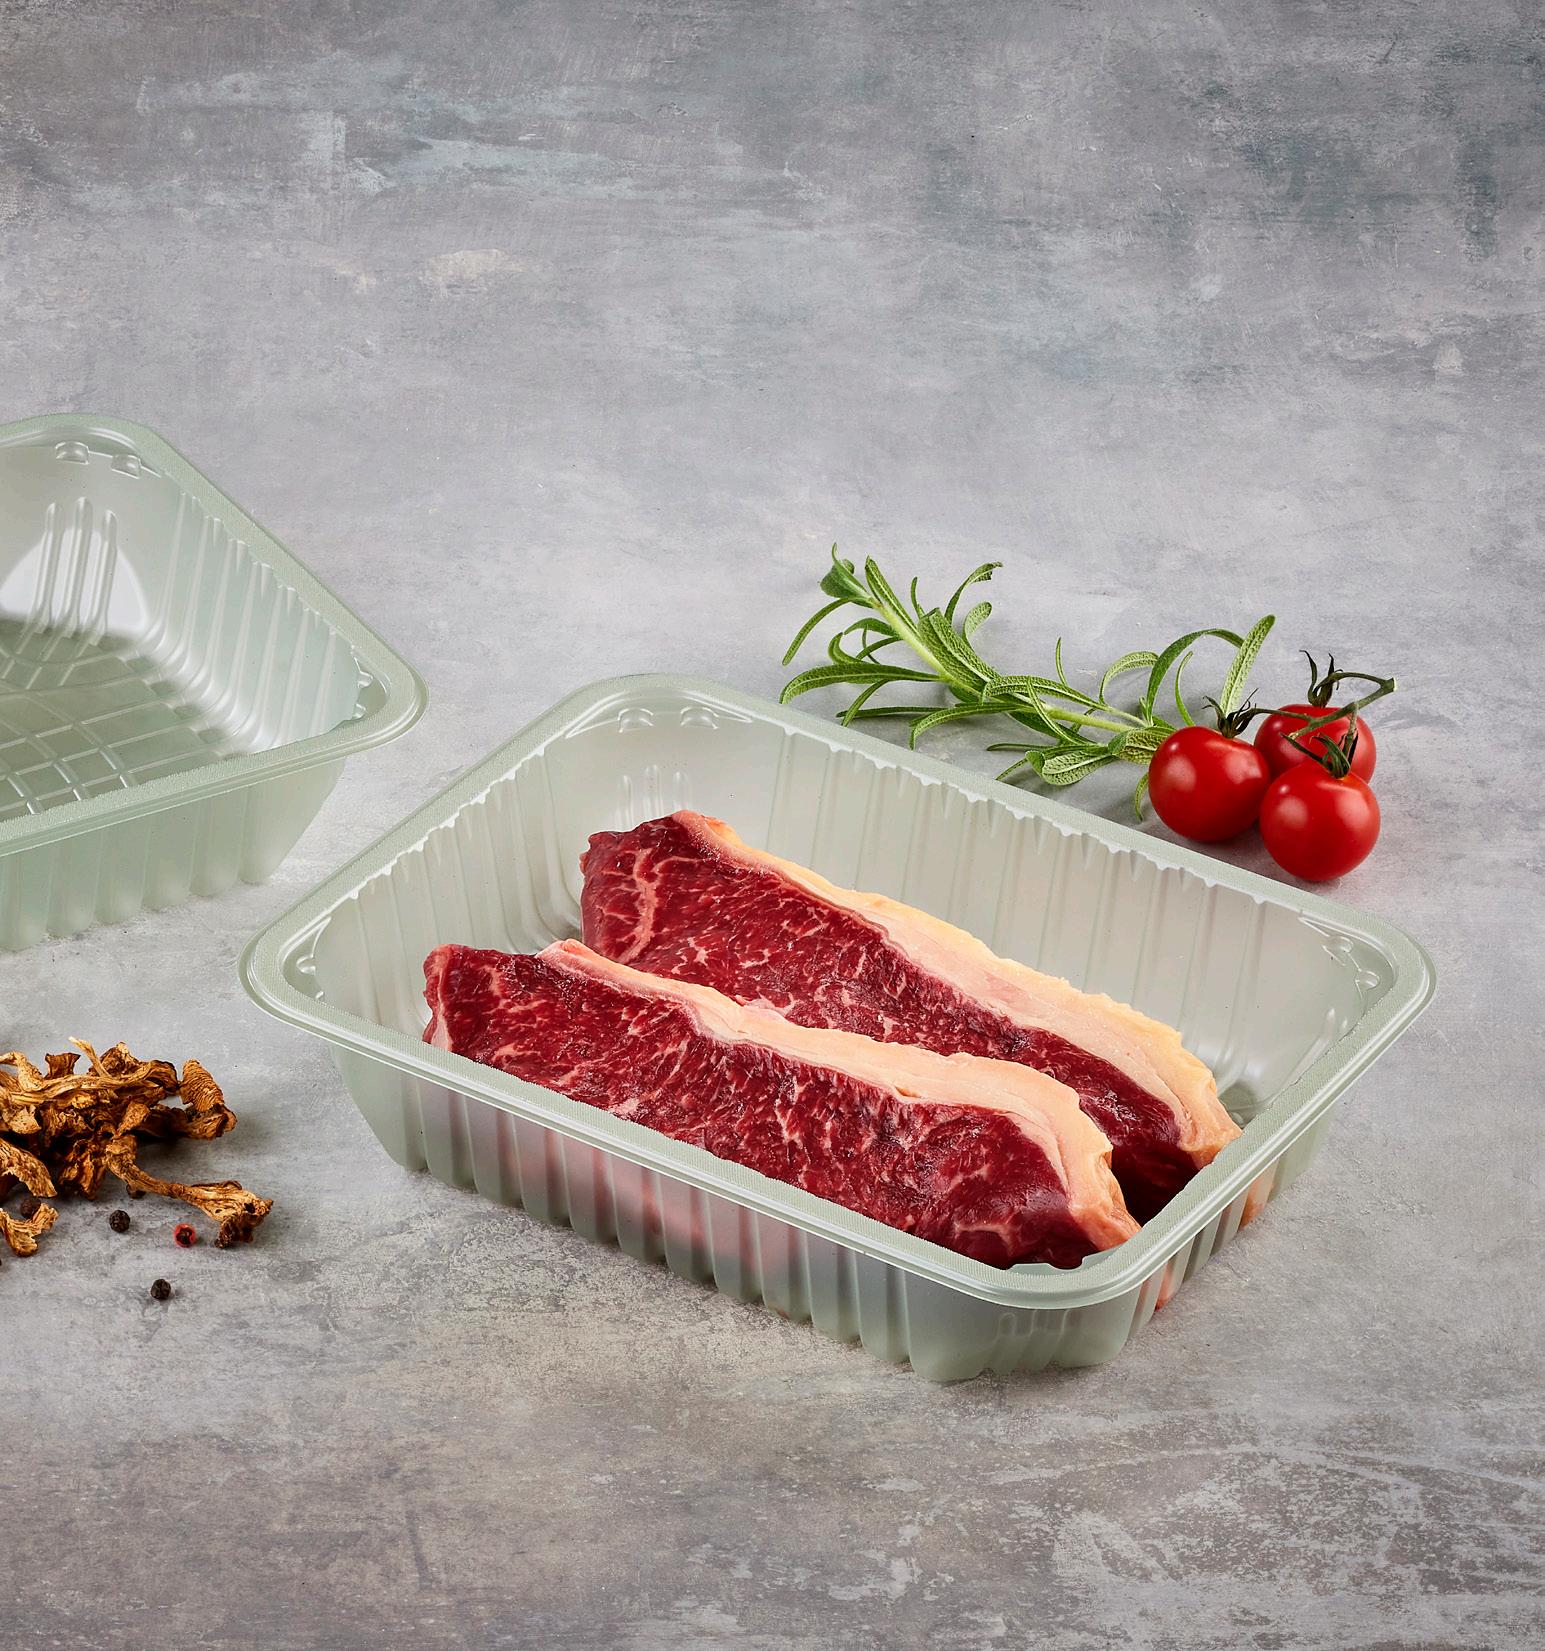
Agromousquetaires transitions to fully recyclable APET trays for fresh meat packaging
Case | Support our Planet
For several years, Agromousquetaires, leading manufacturer of private labels and the fifth largest agri-food group in France, has worked with Faerch to transition its food packaging trays from XPS, EVOH and PE trays to mono-material APET. In 2024, they took the last step in the material conversion by moving its fresh meat trays from its beef and pork production subsidiaries to fully recyclable APET trays.
As the industrial branch of the Les Mousquetaires Group, which operates the supermarket chains Intermarché and Netto, Agromousquetaires supplies 2,000 stores and generates a turnover of EUR 4.7 billion. The material conversion is a key initiative in the Group’s ongoing sustainability efforts.
“At Agromousquetaires, reducing our environmental impact is a priority and sustainable packaging is key to this. By switching to APET, our fresh meat trays now contain a minimum of 70% recycled content and can fully be recycled into new food-grade trays without compromising the quality or safety of our products. We are pleased to be collaborating with Faerch on this important step in our material conversion journey,” says Nicolas Pinchaud, Procurement Director at Agromousquetaires.


Making the right choice matters
Choosing the right material is essential for ensuring food safety, durability and circularity. Mono-material PET is the only food packaging material that offers true circularity, while meeting all these requirements.
“Agromousquetaires’ transition to recyclable PET packaging material is an important step toward reducing environmental impact. This commitment not only supports their sustainability goals but also aligns with consumer expectation for responsible practices. We’re proud to support Agromousquetaires on this important journey”, says Audrey Wendling, Key Account Manager, France at Faerch.
By incorporating a minimum of 70% recycled content, APET trays reduce the need for virgin plastic. Unlike multi-layer materials like XPS, EVOH and PE, APET offers improved recyclability and reduces the amount of hard-to-recycle materials in waste streams. At the same time, it maintains excellent barrier properties, preserving foods freshness and quality.
Unlock the Potential AMBITION
We aim to build and activate a compelling employer brand, emphasising circularity, culture and purpose. On top, we will expand our HRIT system to streamline all core HR processes and address employee feedback with targeted initiatives to enhance engagement and well-being. Inclusive leadership remains a priority to foster trust, collaboration, and innovation across all levels. By aligning global policies and fostering a culture of learning, equity, and inclusivity, we will empower our workforce to achieve their full potential and drive organisational success.
POLICIES
· Remuneration Policy
Company Car Policy
· Travel & Expense Policy
Global Mobility Policy
· Diversity, Equity & Inclusion Policy
Preventing Harassment & Discrimination Policy
Flexible Working Policy
Health & Well-being Policy
Communication Policy
TARGETS
2027
· Share of Women in Group Senior Management (GSM): 24%
· Completion Rate of People Factor Platform through all sites: 90%
Unlock the Potential
2024 was a transformative year for HR in Faerch Group as we navigated the complexities of post-acquisition integration. It was a year of change, growth, and renewed focus on our people. Through structured processes, a robust HRIT implementation, and targeted initiatives in leadership, people development, and policy alignment, we have laid the groundwork for a thriving, inclusive, and forward-looking organisation. Our first global Employee Engagement Survey marks a turning point in our ability to listen, respond, and evolve based on what matters most: Our employees.
Building new structures and processes
The integration, following the acquisitions, provided us with an opportunity to review and optimise our HR operations. Throughout the year, we focused on establishing clear, structured processes that support both business goals, and employee development. This year marked the beginning of our journey towards a more integrated and efficient HR operations framework with the initiation of a new HRIT system. The implementation process has been carefully planned to ensure minimal disruption to our ongoing operations. Key milestones achieved so far include the establishment of an internal project team comprising Group HR, BU HR, local HR, and Group IT to ensure that the implementation is anchored in the wider organisation from the start. Training for the HRIT system has commenced, ensuring that HR can maximise its capabilities to streamline processes, and enable data-driven decision-making. The initiation of implementation for the Core HR and Talent modules is planned to go-live at the start of Q1 2025. Additionally, we have started mapping compensation structures across all countries to align global processes.
Looking ahead to 2025, we will focus on implementing solutions for learning and recruitment while finalising the implementation of the compensation module. Our ultimate goal is to establish one global platform for core HR processes, streamlining operations and ensuring consistency across the entire organisation.
Policies for a unified, global organisation
As part of our integration journey, we revised and defined a corporate governance structure, including group-wide policies, entailing roles, responsibilities and the "Faerch Way of Working". This is to establish consistency and fairness across the organisation. This effort brought policies to a global level, ensuring they reflect our commitment to creating a workplace where all employees feel physically and psychologically safe, supporting growth opportunities that enable employees to thrive, and encouraging employees to be their authentic selves while contributing fully to the organisation’s success.
To ensure clear communication of expectations and responsibilities regarding psychological safety at all levels, we have introduced training programmes dedicated to preventing harassment and discrimination. These programmes are delivered through various formats, including instructor-led sessions, virtual Teams meetings, in-person gatherings, one-on-one discussions, shift briefings, and e-learning modules. Participants are expected to understand their own responsibilities and those of others, familiarise themselves with support networks, actively engage in the learning process, and assist HR BU in collecting training sign-offs to reinforce accountability and ensure compliance.
As part of this commitment, all employees will receive diversity, discrimination, and harassment training between January and May 2025, ensuring a shared understanding of these critical topics across the organisation.

To further enhance operational alignment, we issued a new governance process for our recruitment and appointment processes. This ensures consistency across the organisation and mandates that all key decisions are reviewed by the relevant stakeholders.
Job architecture and benchmarking
In 2025, we plan to implement a global job architecture framework. In preparation for this implementation, our team has made significant strides during 2024 in laying the groundwork necessary for this transformative initiative. We have developed a clear roadmap and timeline for the phased implementation of the job architecture. This framework will provide a structured approach to job classification, career progression, and talent management, supporting our long-
term strategic objectives and reinforcing our commitment to employee development. The job architecture implementation is also pivotal for our ongoing preparation for the upcoming Pay Transparency regulation in the EU.
Furthermore, we have implemented a new global approach to benchmarking and granted our local HR teams access to relevant data across all our core markets. This is a key step towards ensuring fair and competitive remuneration, and to make sure that our salary-setting processes are fair, transparent and unbiased. In 2025, we will continue to develop a unified approach and link this to our job architecture.
response rate in our first companywide Employee Engagement Survey
Strengthening people development and talent processes
Continuous improvement in people development has been a key focus during 2024, and we will continue improving during 2025 to support the needs of our growing organisation and workforce. In early 2024, we introduced a new process to define critical positions and review talent within acquired companies, ensuring all talents are incorporated into our talent framework.
We conduct an annual Employee development Review (EDR) process for all white-collar employees where managers and employees collaborate to assess strengths, identify areas for improvement, and set performance targets for the year ahead. A key aspect of the EDR is a focused conversation on the employee’s career aspirations, ensuring we are not only supporting their personal growth but also nurturing a strong talent pipeline for the future. Development actions – whether formal training, participation in projects, or exposure to management – are tailored to align with both the individual’s goals and the evolving needs of the business (see section Unlocking internal potential). In 2025 , we will digitalize the EDR process, making it more agile and further create links to our new job architecture framework with the purpose of creating a more structured approach to career planning, ensuring employees have clearer vision of development opportunities in Faerch. For bluecollar employees, these processes will in 2025 remain managed locally, following sitespecific processes that align with operational needs.
In early 2024, we integrated a new process to define critical positions and review talent within acquired companies, ensuring all talents are incorporated into our talent framework.
To further support structured learning and development tracking, we will in 2025 also introduce a Learning Management System (LMS), ensuring visibility of training opportunities across all employee groups. We will update our talent review processes to enhance clarity and alignment across regions, supporting succession planning and individual career growth. By identifying and managing critical positions, we ensure business continuity and leadership readiness.
To foster the growth of both our employees and our business, we have this year developed the Faerch Way of Selling Sales Programme. The programme aims to enhance the skills of our sales team through a combination of internal and external training sessions. It will focus not only on personal development but also on refining key sales skills. The rollout of the programme is scheduled for 2025.
Unlocking internal potential
Closely connected to our People Development and Talent Processes is unlocking our internal potential. Internal recruiting is a vital component of our talent strategy, offering opportunities for employees to advance within the organisation while strengthening retention and engagement. We are dedicated to significantly increasing our internal fill rate over the next three years. Reaching this goal will enable us to fully leverage our existing workforce, foster a stronger culture of growth, and minimise the costs and disruptions linked to external hiring.
Building a future pipeline
Building a strong talent pipeline through internships, graduate programs, and student engagement is crucial for Faerchs long-term business success. By actively involving interns and students, we not only gain access to fresh, innovative ideas but also cultivate a pool of potential future employees who are already familiar with our company culture. This proactive approach helps in branding the organization as an attractive place to work, fostering loyalty and reducing recruitment costs. Investing in young talent also strengthens the company’s reputation, positioning it as an industry leader dedicated to nurturing the next generation of professionals. An example is in our location in Holstebro where we in 2024 have had two trainees and three interns and 100% retention of our Graduates after finishing their programme. This will continue to be a focus in 2025.
The People Factor Platform: Our commitment to a unified workplace
Launched in 2022, the People Factor Platform reflects Faerch Group’s core values and commitment to creating a unified, supportive, and engaging work environment across all locations. It is more than a framework, it is the heartbeat of our workplace culture, ensuring every employee feels valued, motivated, and connected. Employee experience at Faerch embodies a genuine sense of care and connection, evident in every interaction across offices and production floors. This is brought to life through joyful celebrations, personal growth opportunities, open communication, and supportive leadership that foster a positive and engaging workplace culture.
With eight categories and 51 key items, the People Factor Platform sets clear standards for employee experience, focusing on retention, talent attraction, safety, and inclusion. Accessible to senior managers, the platform helps cascade our vision, with local leadership and key teams driving its implementation. Achieving 96% site adoption and 70% completion to date, we are well on our way to embedding this initiative into daily life, reinforcing Faerch Group as the employer of choice. Innovation does not stop here, with a target of a 90% completion rate by 2027, this platform is designed to evolve to meet global needs, fostering ownership and engagement across the company in 2025.
People Factor Platform Categories:
- Working conditions
- Working environment
- Onboarding manufacturing
- Communication
- Leaver analysis
- Compensation & benefits
- Training
- Being part of the team
The voice of our organisation: Global Employee Engagement Survey
At Faerch, we believe our people are our greatest asset. Having motivated and engaged employees are critical to our business
success. In 2024, a key focus was the launch of our first companywide Employee Engagement Survey. This initiative reflects our commitment to genuinely listening to our employees, understanding their needs, and fostering a workplace where everyone feels valued, heard, and empowered.
With an impressive 79% response rate in its first year and more than 1,200 employee comments, the survey has provided invaluable insights, feedback, and ideas to help us improve Faerch as a workplace. The survey explored key aspects of our employees’ daily experiences, including overall job satisfaction, working conditions, communication, and leadership. The thoughtful input from our employees has laid the groundwork for meaningful actions, both at the organisational level and within individual teams. All teams go through their own survey reports for insights to create local action plans. To ensure inclusivity and accessibility, the survey was made available in all local languages where we are present, enabling every employee to share their voice confidently.

Strengthening internal communication
We are committed to not only hearing the voices of our employees but also creating opportunities for global exchange, transparent information sharing, and greater access to knowledge. To achieve this, we are increasing our focus on employee communications, fostering collaboration across regions, and encouraging the sharing of insights and expertise. A key initiative in this effort is the development of a digital communication platform. The project has already started, with the site structure in place. We will begin building it in early 2025 in close collaboration with Marketing, Internal Communications, and IT teams.
Building inclusive leadership
Leadership has remained a cornerstone of our HR strategy. This year, we focused on inclusive leadership training at the Executive Management level to drive cultural change from the top. This training has built awareness and skills to foster trust, collaboration, and psychological safety while equipping leaders to create diverse, inclusive environments. By empowering executives with these tools, we set the tone for a dynamic organisation where all employees can contribute authentically.
96%
site adoption of the People Factor Platform 70% ... and 70% completion to date
Looking ahead, we aim to cultivate a unified understanding of Faerch’s Leadership across the Group by defining a clear leadership model with expected behaviours, enhancing communication, delivering tailored training programmes aligned with leadership levels, and driving continuous improvement through ongoing monitoring and follow-up.
Gender balance in management
Achieving gender balance in management remains a critical goal for our organisation. Currently women represent only 18% of Group Senior Managament (GSM) roles, falling short of last years 20% and our target to reach at least 24% of women in GSM by 2027. We are aware that further efforts are needed to close the gap. To address this, we are actively building robust talent pipelines that prioritise diversity and inclusivity, ensuring that our future leadership reflects the diversity of our workforce. Through targeted development programmes and proactive succession planning, we are committed to achieving our goal of gender balance in management over the coming years.
Shaping the future of Faerch with our people
Case | Unlock the Potential

What makes Faerch a great place to work? And what can make it even better? In 2024, we set out to answer these questions through a comprehensive employee engagement survey. With 79% participation from more than 3,670 employees across 11 languages, the survey gave us valuable insights into what we’re doing well – and where we can grow.
The results: Strengths and opportunities
“Every response matters because it helps us to take meaningful steps toward creating an even better workplace” says Helle Glintborg, Senior Director of Organisational Development at Faerch.
Over 1,200 employees commented and shared their valuable insights, highlighting key areas where Faerch is thriving:
- Strong leadership and job content received high marks, reflecting positive relationships between employees and their immediate manager.
- Safety, Strategy and Values also stood out, demonstrating a shared commitment to a culture that prioritises both well-being and clarity in direction.
But Helle Glintborg acknowledges there is more to do:
“While the positive feedback is encouraging, we also value the honest insights into areas for improvement. These reflections are essential for our ongoing growth.”
Turning insights into action
The feedback provided through the survey is more than just data – it’s a call to action. Our teams are already collaborating to turn the insights into meaningful improvements.
- Transparent communication: We have shared the survey results with all employees to foster an open dialogue and identify solutions together.
- Action plans: Both global and local initiatives are being developed to address areas for improvement, ensuring all departments benefit from the efforts.
“We’re committed to keeping everyone informed about the progress of the initiatives,” Helle Glintborg adds. “This is an important part of our journey to create a workplace were every employee feels empowered to thrive and perform at their best. We encourage everyone at Faerch to continue sharing their thoughts, ideas and experiences as we move forward together.”
Protect the People
AMBITION
For our workforce, we remain dedicated to promoting a culture of safe behaviour that reaches beyond compliance. We work systematically to prevent work-related injuries and monitor our health and safety performance through safety reporting and third-party certification.
POLICIES
Health and Safety Policy
Human Rights Policy
· Health & Wellbeing Policy
TARGETS
2025
· Reduce Lost Time Injury Frequency Rate (LTIFR) to 7.0
• Increase our proactive efforts in managing Health & Safety by exceeding;
- 6000 Hazard observations
- 150 Leadership Safety Walks
- 700 Health & Safety Inspections
- 25 Emergency drills
• All sites to implement Health & Safety Core Requirements
• 100% Lessons Learned reports issued
• All sites to complete Leadership Safety Walks
• 90% Safety Inspections completion rate
• 70% On-time Corrective Actions completion
• All operational leaders participating completing Faerch Safety Leadership training
2028
· All sites certified according to ISO45001
We have had good initiatives, but an average LTIFR of 8.9 across 28 sites is not satisfactory.
Protect the People
Our commitment involves transitioning from a reactive to a proactive approach to enhance safety. The primary purpose is to intensify our efforts in identifying and mitigating potential risks associated with unsafe conditions, behaviours, and activities. This proactive stance aims to reduce the likelihood of associated risks, contributing to a safer and more secure working environment.
Fostering a strong safety culture is essential to improving our safety performance. In this respect, both individual and collective responsibilities are necessary. We focus on implementing engaging safety activities that proactively identify and prevent potential risks. Our commitment involves continuously refining safeguards and fostering a safety-oriented culture through ongoing iteration and improvement.
Launching our Health & Safety business plan 2025-2028
Our Health & Safety (H&S) business plan is centered around three strategic themes aimed at creating an accident-free workplace. The success will depend on our focus and commitment.
Safety Leadership
Safety Leadership is not just the responsibility of managers of our organisation, it is an individual objective for all Faerch employees and partners. When it comes to safety, we are all leaders, and we must lead through our next action.
For us, safety is more than a priority – it’s a value that defines who we are and how we operate. We are committed to the well-being of every employee, and this commitment is reflected in every decision we make and every action we take. Our leaders are not just managers; they are champions of safety, which is exemplified through their proactive approach to identifying risks and implementing measures to prevent incidents before they occur. They lead by example, demonstrating a personal dedication to safety that inspires everyone around them.
Health & Safety Steering Committee with six executive members
Publishing H&S Policy
Implementing new compliance tool
We believe in the power of open communication. Here, every voice matters, and employees are encouraged to speak up about safety concerns without fear. This openness ensures that potential hazards are addressed promptly and effectively. Safety is a journey of continuous improvement, and we are always learning and evolving. We regularly review our procedures, learn from incidents, and welcome best practices to continuously enhance our safety measures.
Training and capability
There is both a need and a desire to elevate our collective health and safety competencies. This applies not only to shopfloor workers but across all functions at both local and group levels. We will assign clear responsibilities for health and safety, ensure resources are allocated, and provide training to equip all individuals with competencies necessary to achieve a future incident-free workplace. Our training programmes are anchored in Safety Leadership, as we aim to have an organisation capable of preventing negative outcomes, not just responding effectively if an injury occurs.
Tools and processes
Today, we have a few fundamental tools in place that we will focus on implementing across all sites. We are expanding our management system to standardise the way we work, with an emphasis on valueadding content and communication, rather than the IT tools themselves. In 2025, we will complete an update of our Incident Management system, Assure, to enable operational leaders to manage safety more effectively. Additionally, we will implement a new legal compliance tool across all sites, providing better insight into how statutory requirements are met throughout our global organisation.
2026
80% of processes integrated into leadership
2028
Multi-site certification covering all sites
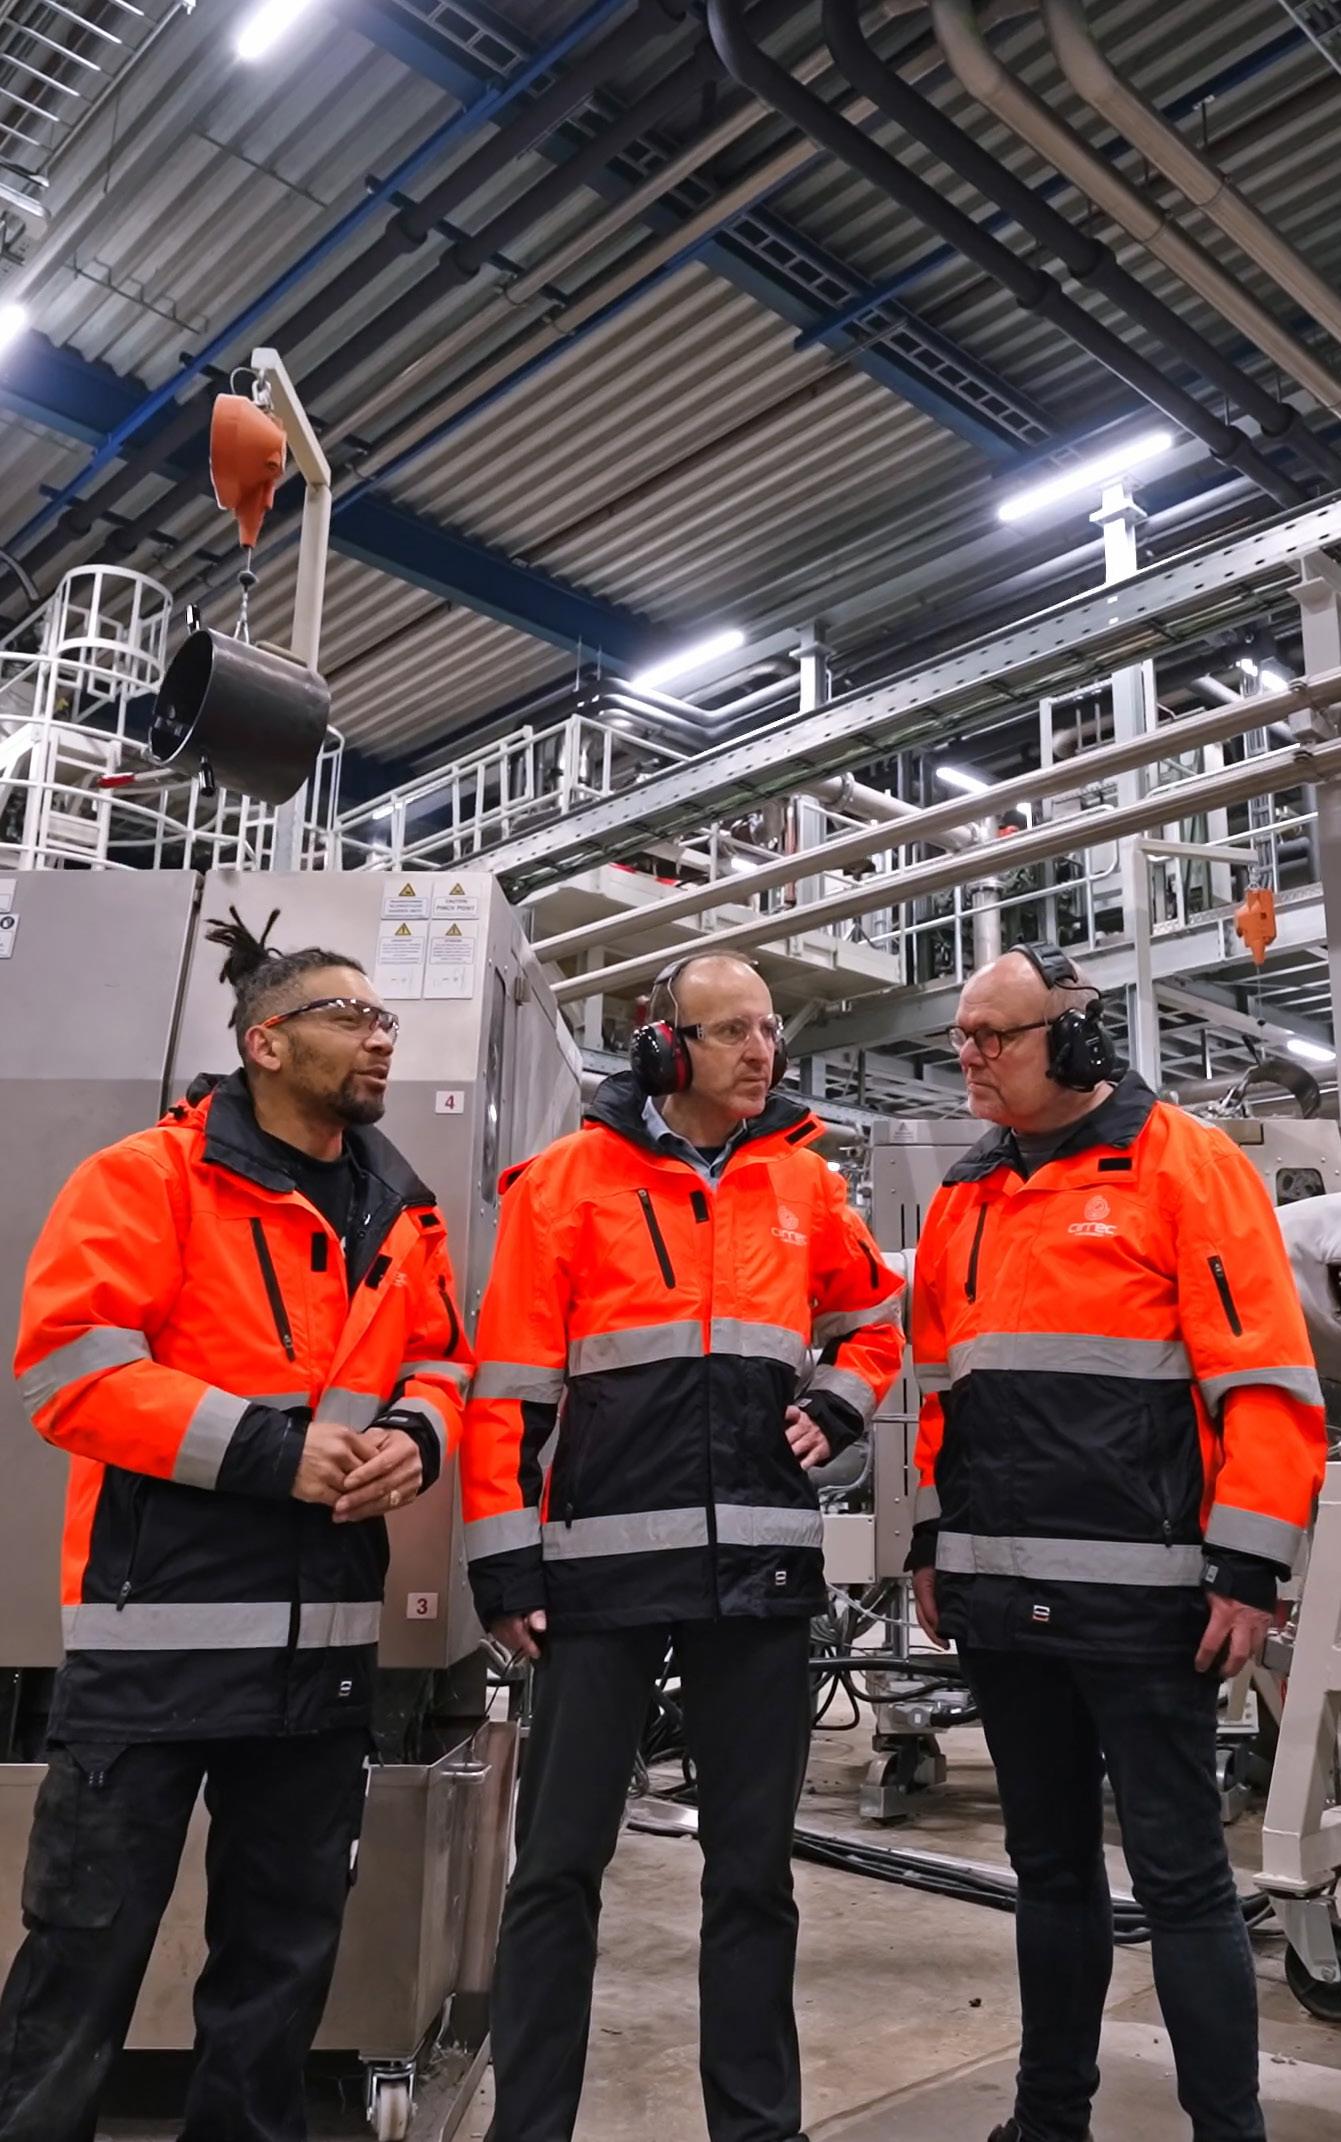
New Group Health & Safety Policy
Our health and safety management system aims to support our ambitions and guide our organisational behaviour in pursuit of our ambition. Our new H&S Policy outlines specific elements that will serve as a platform for improvement, while also defining clear responsibilities and obligations for all Faerch leaders to ensure a systematic approach to protecting the health and safety of our employees.
Throughout 2025, we will continue to refine our health and safety management system. We acknowledge that health and safety cannot be managed separately from daily operation, thus our aspiration is to have 80% of our processes owned by leaders and experts not employed in dedicated QHSE functions. Once this project concludes in Q4 2026, we will start replacing our current certificates with a group-wide multisite certificate.
Safety performance
We apply the Lost Time Injury Frequency Rate (LTIFR) as one metric to evaluate our safety performance. Last year, we set a goal to reduce the rate to 6.6. Despite good local initiatives, the LTIFR frequency rate increased from 8.5 to 8.9. This increase serves as a thorough reminder that we need to act differently, and that we cannot achieve our next goal if we are not willing to accept full responsibility for health and safety. The 2024 performance does not change our long-term commitment or our belief that we achieve an accident-free workplace. Our 2025 target will be a 20% reduction of incidents leading to lost time. To support this, we are introducing several new leading indicators to measure our contribution to Faerch’s health and safety ambitions.
Empowering every employee to speak up is key to a strong health and safety culture
Case | Protect the people
In the coastal town of Poole, located in Dorset, England, Faerch’s local site stands as a testament to the value of empowering employees to speak up. When it comes to delivering great safety performance, the Poole site ranks among the best across the Group.
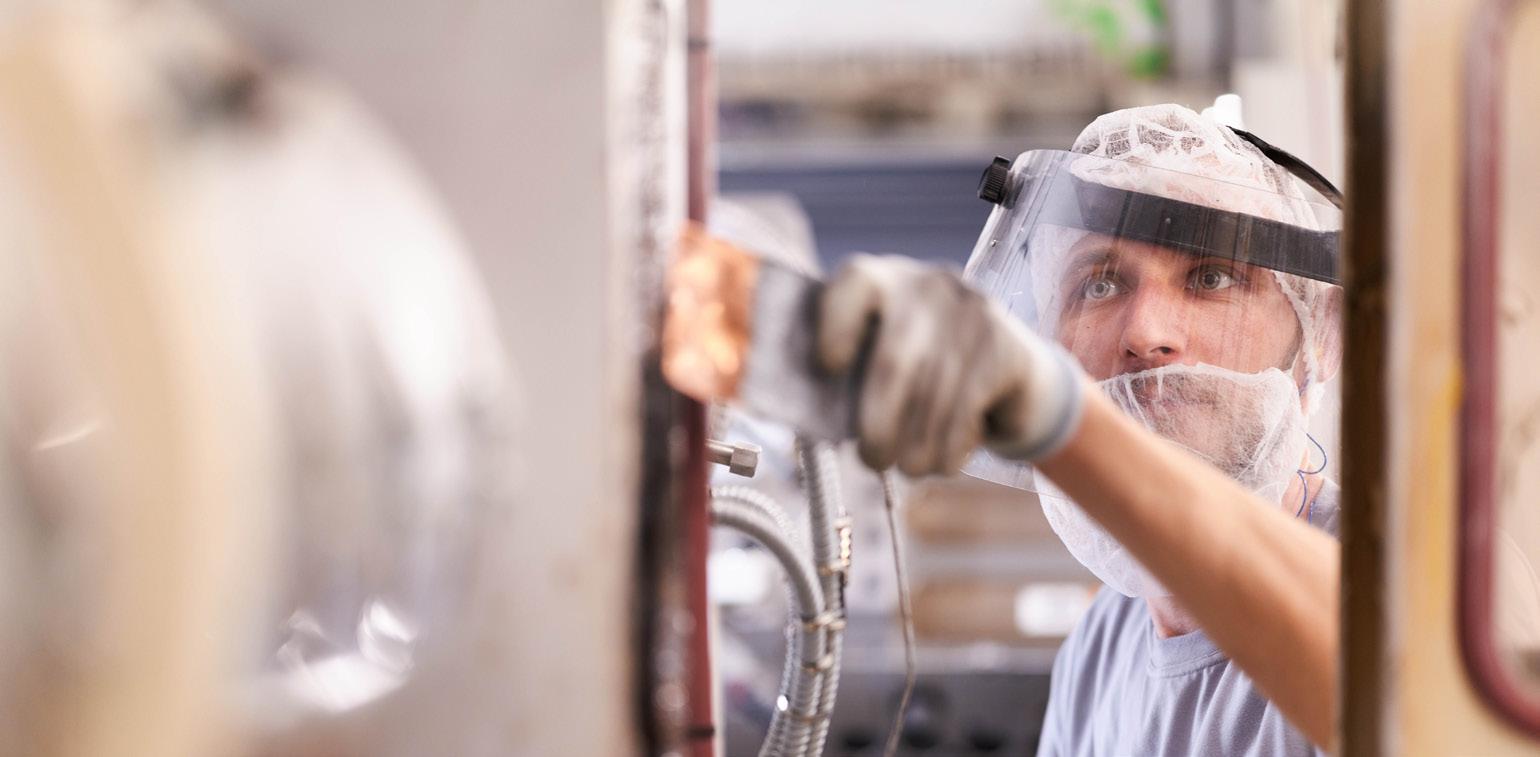
According to Site Director Simon Jordan, who joined in 2016, the site’s success isn’t rooted in advanced equipment or costly investments, but in the people. "Empowering every employee to speak up is key to a strong health and safety culture. We have built a strong sense of community where everyone looks out for one another and is not afraid to speak up when something is not safe," Simon shares. “When an incident occurs, we actively involve those directly affected. Together, we investigate what happened and ensure follow-up actions are implemented. We do this because keeping everyone safe is our top priority.”
A culture of care
At Poole, safety goes beyond policies – it’s ingrained in the mindset. With approximately 125 employees on site, a strong sense of community drives a culture where everyone genuinely cares for one another. This shared responsibility creates an environment focused on collective well-being. “Our goal is simple,” Simon explains. “Everyone should go home at the end of the day just as they arrived – only a little more tired.”
Empowering employees to take ownership of safety is at the heart of this culture. Everyone is encouraged to identify hazards, raise issues, and support their colleagues. Engagement and involvement are key drivers of this approach, ensuring that each team member feels responsible for maintaining a safe workspace. Safety is always the first topic in daily, weekly and monthly meetings. But safety isn’t just discussed in meetings; it’s practiced on the shop floor every day. “We don’t just talk the talk, we walk the walk and reinforce and recognise positive safety behaviour,” Simon adds. Small reminders are placed around the factory, supporting this message – like on every mirror: “You are looking at the person most responsible for your safety”. Inside the toilet doors, a poem encourages everyone to speak up without fear of looking foolish or causing an argument over safety rules. These daily reminders help make involvement and engagement a natural part of safety practices.
Turning serious incidents into a catalyst for safety awareness
After a serious hand injury on site a few years ago, Simon invited the injured employee to join safety briefings, sharing how the accident had affected his daily life and highlighting the importance of safety awareness. “Hearing firsthand how he couldn’t even make himself a cup of tea or dress himself really struck a chord with everyone. It was a turning point in how we approach safety,” Simon says. By openly addressing the accident and discussing its consequences, we all gained a deeper understanding of safety practices. This experience has had a lasting impact, helping to prevent future accidents and strengthening the safety culture at our site. “Accidents are terrible, and we must do everything possible to prevent them. But when they do occur, they provide valuable lessons we can learn from.”
The secret to success
Frank Nørgaard, Senior Group Director of Health and Safety at Faerch, experienced the Poole site’s unique culture during his first visit in 2024. “To be honest, when I first arrived, I
expected the safety culture to mirror the state of the facilities. But as I started speaking with the employees, I realised I was wrong,” Frank admits. He recalls one moment that stood out:
“During a conversation with an employee, we were interrupted by a colleague who wanted to check in on the employee’s spouse, who had been unwell. That small act spoke volumes about the deep care that’s ingrained in this team.”
At Poole, every voice matters. The site’s flat structure ensures inclusivity where both long-serving employees and new hires are empowered to contribute. This openness enables swift action when safety concerns arise, without waiting for management to intervene. For Frank, Poole’s achievements serve as a powerful reminder that culture triumphs circumstances. “Their success isn’t about advanced equipment or complex strategies. It’s about people who care for each other and a leadership style that fosters trust and responsibility,” he notes.
The data supports this. Poole’s safety performance stands out as one of the best across Faerch’s global organisation,
“During a conversation with an employee, we were interrupted by a colleague who wanted to check in on the employee’s spouse, who had been unwell. That small act spoke volumes about the deep care that’s ingrained in this team.”
– Frank Nørgaard, Senior Director Group of Health & Safety at Faerch
demonstrating that strong relationships and a positive culture can drive great results. As Simon puts it, “Success isn’t always about massive investments – it’s about putting people first, involving them, and empowering them to speak up. The staff have the answers, and by trusting and supporting them, we’ve built a culture that achieves great results, even in challenging circumstances. That’s something we are extremely proud of,” Simon concludes.
New employees always go through a thorough induction process, with safety as a key focus. They are provided with a detailed health and safety handbook, assigned a ’buddy’ from within the team and participate in a 12-week induction programme to ensure that they are fully equipped to understand and maintain a safe working environment for all.
1,061 days without a lost-time accident, a record set from October 2017 to September 2020 at the Poole site.
As of 31st of January 2025, the site is at 645 days without a lost time accident.
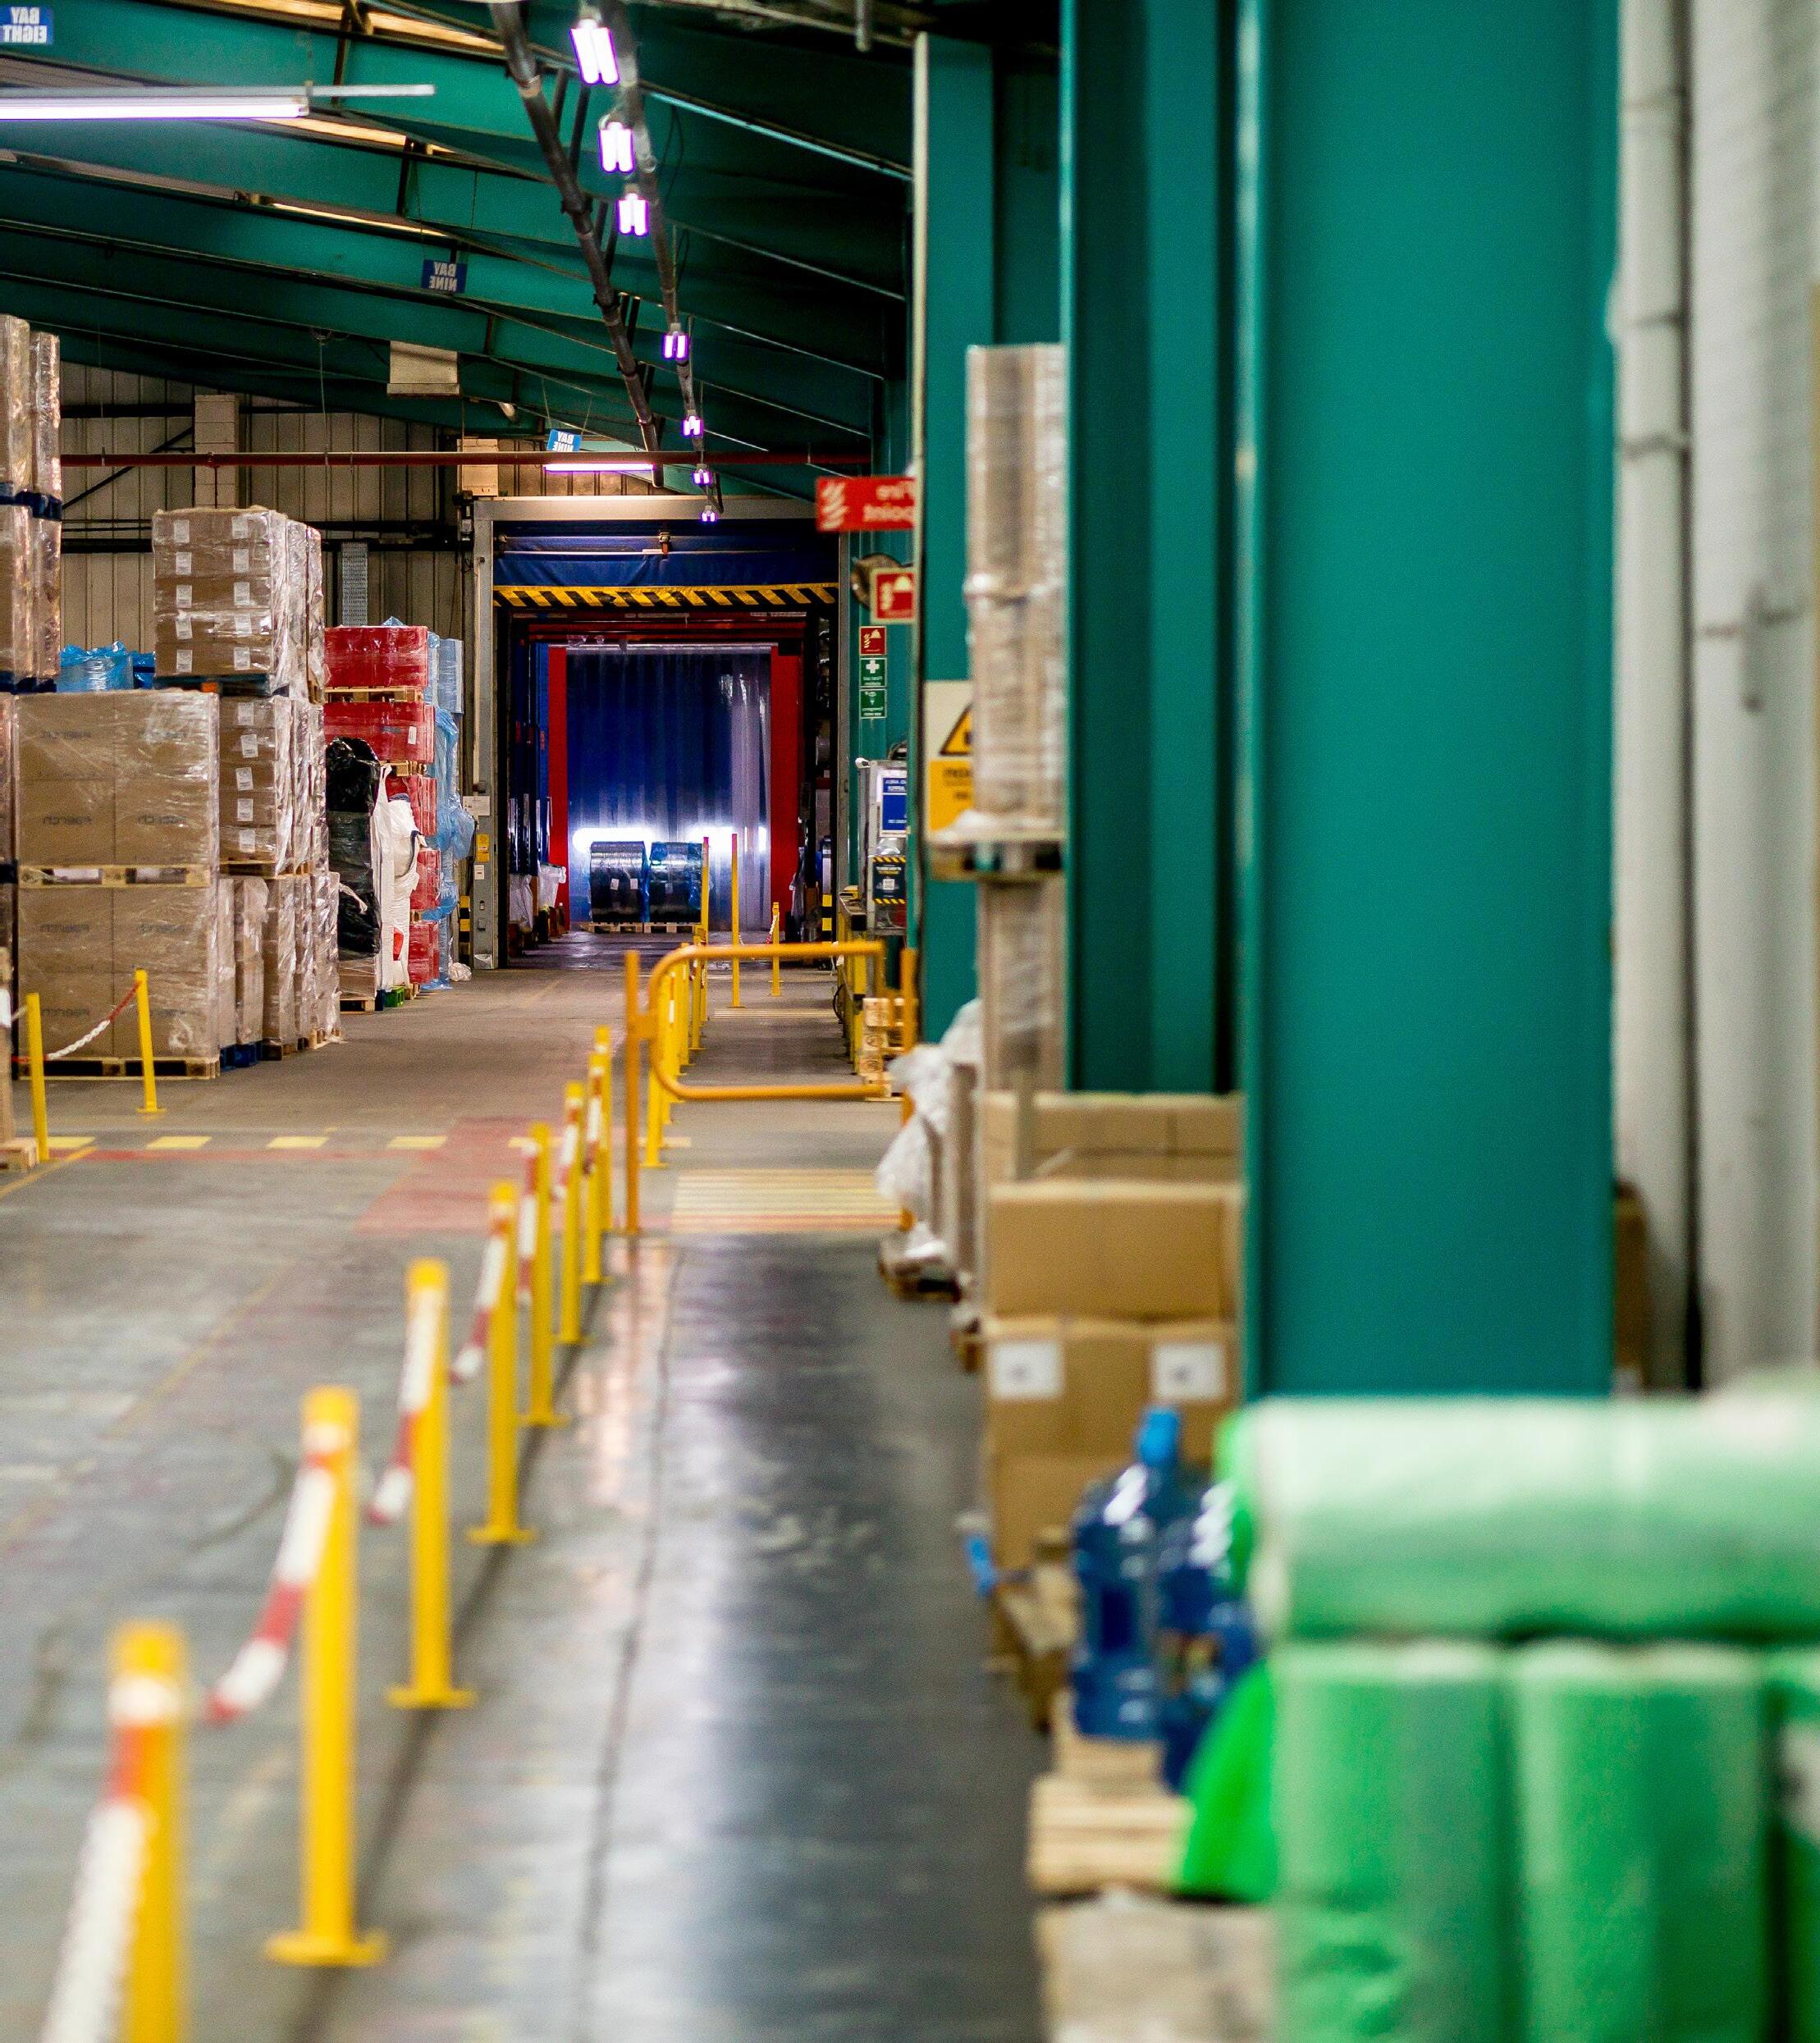
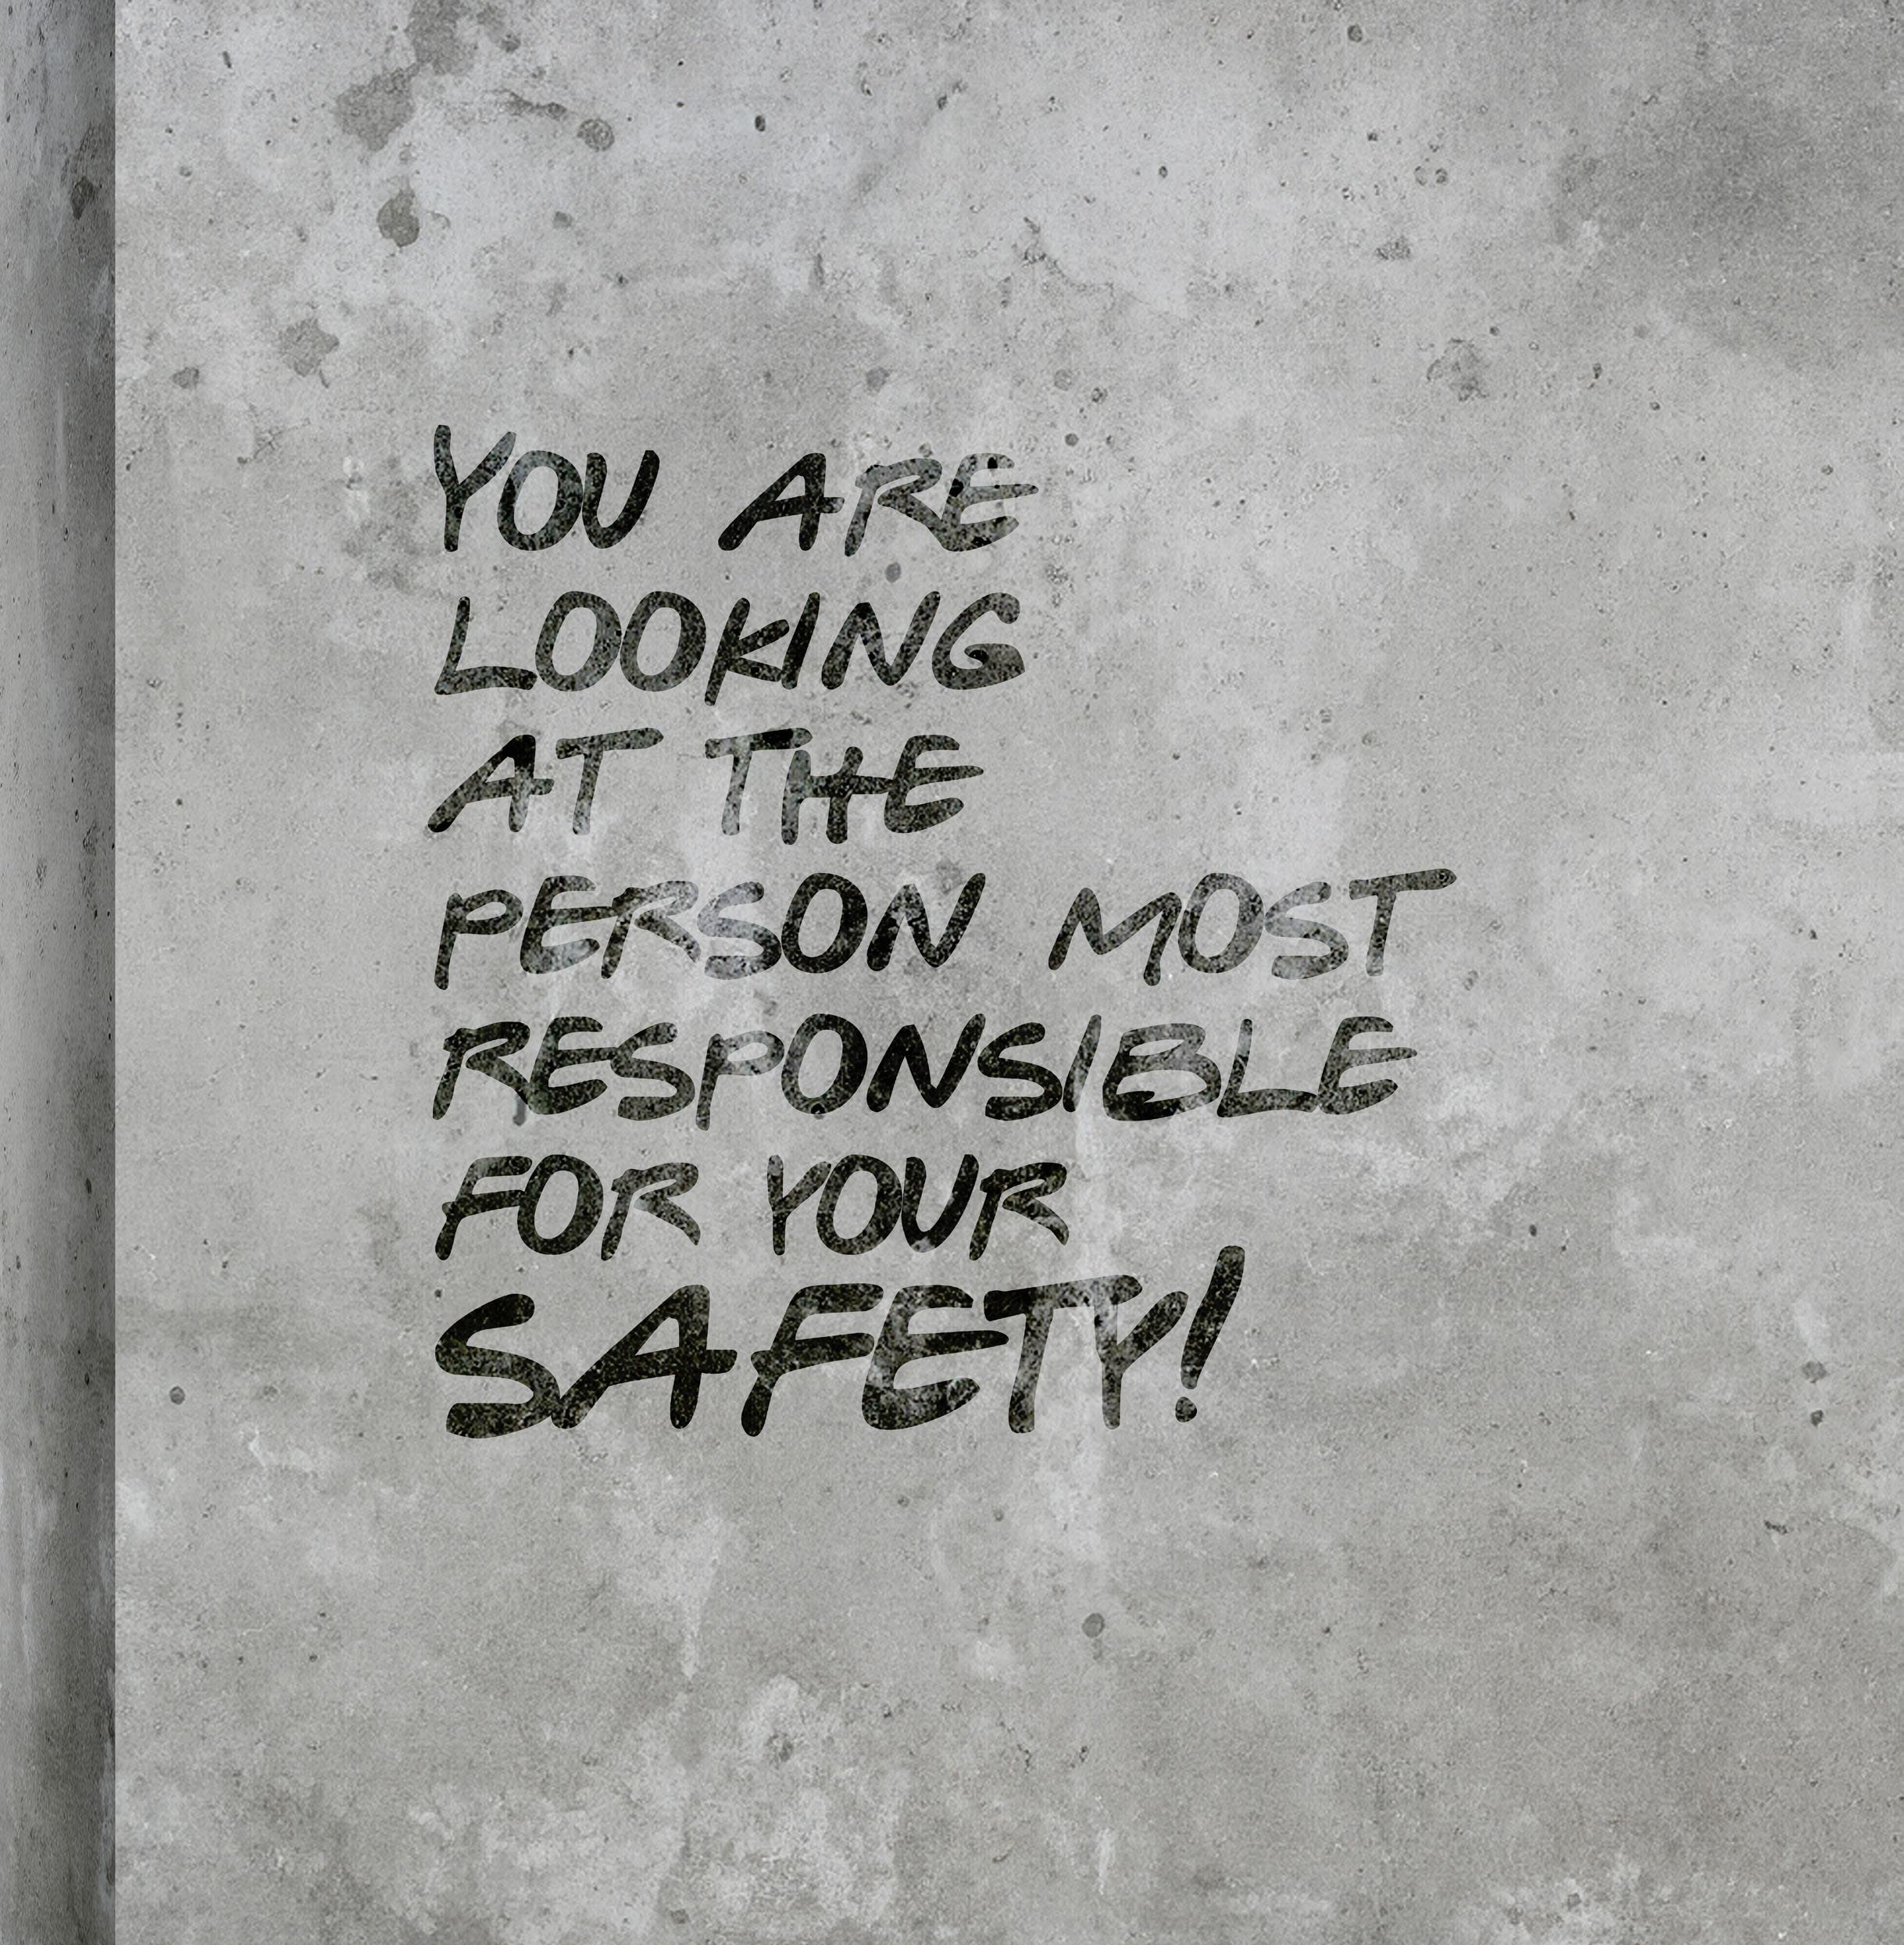
Act with Responsibility
AMBITION
We are committed to acting as a diligent and responsible Group at all times and conducting our activities in a financially, environmentally, and socially responsible way, with transparent business practices and high ethical standards.
This means imposing strict requirements on ourselves, as well as our business partners, through internal and external policies, procedures and guidelines.
POLICIES
TARGETS
2025
Implement procedures to ensure compliance with the EU Corporate Sustainability Reporting Directive and prepare for the EU Corporate Sustainability Due Diligence requirements
Update the employee privacy policies to ensure alignment with current regulation Renew e-learning compliance training to enhance awareness and emphasise the importance of compliance training in areas such as anti-corruption, GDPR and fair competition, while also increasing participation in the training
Establish an Integrity Committee to strengthen ethical governance and oversight
Finalise the implementation of a monitoring system to track and ensure compliance with relevant local legislation
employees have completed an e-learning training course in anti-corruption law
Act with Responsibility
Fair competition and anti-corruption
We fully support both international and national efforts to combat corruption and promote fair competition, and we are dedicated to upholding the highest standards of integrity and business ethics among our employees and business partners, with a zero-tolerance policy against any form of corruption and anti-competitive behaviour.
By implementing guidelines, policies and compliance procedures, complemented by e-learning courses and on-site training for officers and employees, Faerch actively fights inappropriate business conduct.
In 2024, 63 employees participated in on-site training in anti-corruption and fair competition. Over the past years, a total of 564 employees have completed such training, including most of our officers, directors, managers, and personnel in sales and procurement. The on-site training is typically conducted in smaller groups of 5-15 employees to facilitate productive discussions.
Additionally, over the past years, a total of 726 employees have completed an e-learning training course in anti-corruption law, and 638 employees have completed an e-learning training course in competition law. The training enables employees to e.g. execute business negotiations, attend meetings and social events, with knowledge and understanding of basic competition and anti-corruption law, to protect both themselves and Faerch against prosecution and contribute to a fair and healthy market.
During 2024, Faerch updated its compliance policies focusing on gifts, anti-corruption, and fair competition measures.
Data ethics
The following section includes reporting on data ethics as per Section 99(d) of the Danish Financial Statements Act.
The responsible use of data is an enabler for Faerch’s business model. In line with our core values, we strive to ethically manage and use data in our relationship with business relations, employees, and others, trusting that we use their data appropriately. To avoid abuse and privacy infringement issues, and to safeguard Faerch from legal, business and reputational risks, it is vital to manage and control the storage and use of employees’ and business relations’ data ethically correct.
At Faerch, we process personal data in different areas. To support our officers’ and employees’ understanding of personal data and how to deal with such, Group Legal has implemented a GDPR e-learning course. A total of 969 employees have completed the GDPR e-learning course.
Furthermore, Group Legal has several GDPR procedures to ensure basic data subject rights, e.g., the right to access personal data, to rectify personal data, and to erase personal data. Any such requests from data subjects will be handled and answered by Group Legal.
Faerch has policies as well as technical and organisational measures to ensure i) that personal data is not accidentally or illegally destroyed, lost or changed, ii) that unauthorised persons do not get access to personal data and (iii) that personal data is not processed in breach of GDPR in any other way.
Overall, personal data is deleted when storage of such is no longer needed for the intended and legitimate purposes. In 2025, Group Legal will continue to focus on overseeing and improving Faerch’s compliance programme, including harmonisation of policies and internal guidelines.
Our comprehensive e-learning course in cyber and information security also trains employees on the proper handling of data and enhancing information security.
Together with our Least Privilege Access principle, which ensures that users and devices are granted only the minimum level of access necessary to perform their tasks (mitigating risks such as insider threats, unauthorised access and lateral movement within the network). Additionally, the growing global focus and use of AI prompted Faerch to issue guidelines on AI usage in 2024, helping employees better navigate and integrate these technologies into their daily operations.
Whistleblower scheme
Faerch’s governance programme is designed to identify and prevent serious offences
employees have completed the GDPR e-learning course
AI
guidelines introduced in 2024, helping employees better navigate and integrate these technologies into their daily operations
and criminal acts. However, even the most effective compliance procedures cannot fully protect against every conceivable situation.
Consequently, we have implemented a whistleblower scheme in cooperation with a renowned Danish top-tier law firm, enabling employees and business partners to report suspicions or knowledge of unethical and/or criminal conduct, anonymously if preferred. The scheme includes whistleblower units on entity level with the purpose of investigating any whistleblower filings. It is ensured that investigators in whistleblower units are – and remain - impartial. If, during the investigations and assessments performed by the law firm and the first level of the whistleblower unit, it is ascertained that a whistleblower filing should be further dealt with, such filing will be reported to impartial members of management for further assessment and action, constituting level 2 of the whistleblower unit.
The whistleblower scheme was extensively updated in 2023 and 2024 due to (i) various implementations in the EU member states

and (ii) onboarding of the Paccor entities to Faerch’s whistleblower scheme. The whistleblower scheme is accessible through Faerch’s websites. Employees have been informed of the scheme and where to find it during compliance training and in internal announcements. Additionally, in 2024, an awareness campaign was launched, which have increased the filings from six in 2023 to twelve for 2024.
During 2024, twelve whistleblower filings have been made. Three of these filings where substantiated and actions were consequently taken in response.
Supplier Code of Conduct and CSDDD
Faerch conducts business in a conscious way and follows the UN Guiding Principles on Business and Human Rights and OECD Guidelines for Multinational Enterprises. To ensure that our suppliers adhere to the same standards as us, Faerch has
Access the whistleblower scheme here
whistleblower filings have been made during 2024 3 filings were substantiated and actions were taken in response
updated the groupwide Supplier Code of Conduct which reflects these principles covering human rights, labour rights, the environment, and anti-corruption. Each Site Director and Procurement employee of Faerch is responsible for ensuring that new suppliers sign the Faerch’s Supplier Code of Conduct, while also ensuring that all signed Code of Conducts are stored properly. To anchor sustainability topics within procurement, 13 out of 14 Faerch Group buyers (92%) have so far undergone training on sustainable procurement and environmental topics and we will continue the training into 2025 to increase their capabilities.
In addition to the Supplier Code of Conduct, Faerch is updating the Supplier Onboarding Process across the Group starting in 2024 with implementation in 2025. This process aims to gather additional relevant information for the

due diligence of suppliers. By doing so, Faerch seeks to secure fundamental human rights and labor rights, thereby protecting workers throughout the value chain. Furthermore in 2024, Faerch enhanced our efforts by hiring expert capabilities around human rights who will continuously collaborate with key Group functions to develop a concise Human Rights framework, set for full implementation in 2025. The implementation is thus further preparing Faerch for the expected upcoming requirements from EU on due diligence in the supply chain.
We recognise our responsibility to continuously improve the quality and effectiveness of human rights, labour rights, environmental and anti-corruption due diligence across operations and business relationships.
Other matters
In 2024, additional compliance initiatives included, e.g., the procurement of a monitoring system to track relevant local legislations across all legal entities within the Group. This measure will help to further systematise local compliance. The final implementation of this will be performed during 2025.
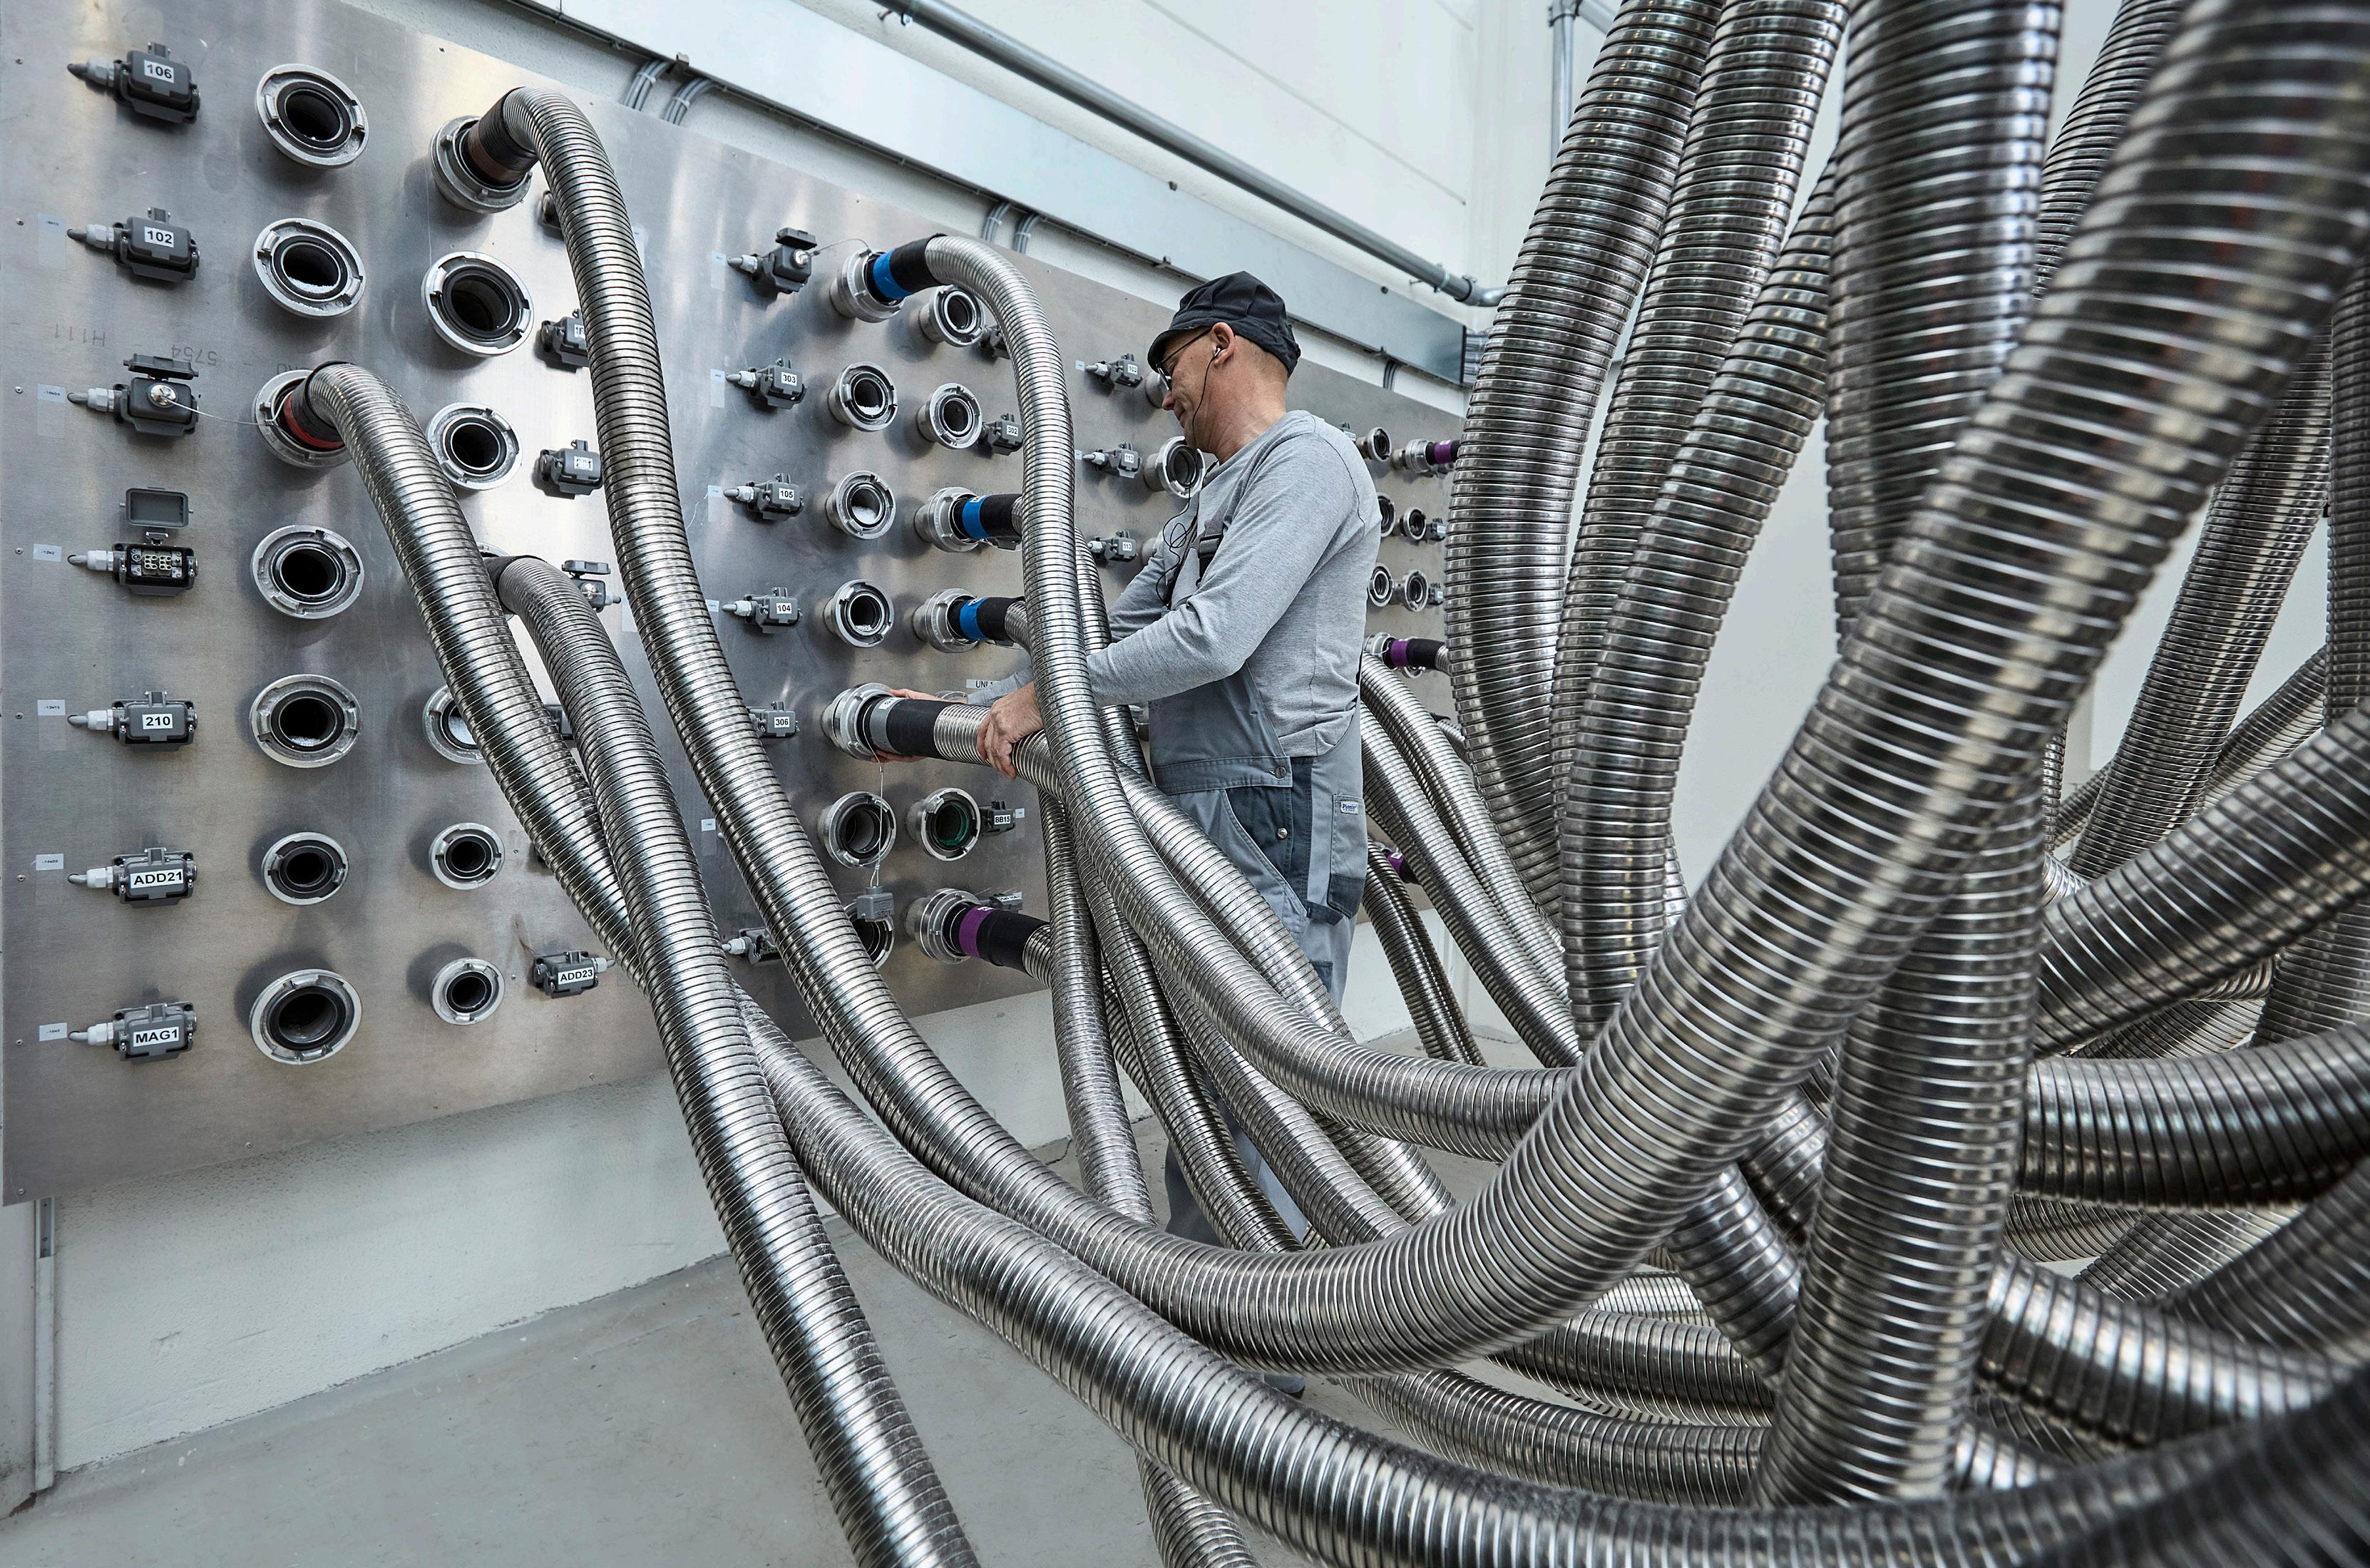
We recognise our responsibility to continuously improve the quality and effectiveness of human rights, labour rights, environmental and anti-corruption due diligence across operations and business relationships.


Consolidated sustainability statements
Note 5.0 // Basis of preparation
Reporting period
Faerch A/S sustainability performance data reporting covers the period from 1 January to 31 December 2024.
General reporting standards and principles
Faerch does not apply a specific overall reporting framework, but is inspired by the Integrated Reporting Framework and adheres to the AA1000AP (2018), which states that reporting must provide a complete, accurate, relevant and balanced picture of the organisation’s approach to and impact on stakeholders and society.
Inclusivity
As a producer of rigid food packaging with international reach, Faerch is committed to being accountable to those stakeholders, who are impacted by the organisation. From the perspective of social responsibility, the key stakeholder groups are customers and consumers who rely on the Faerch products for food quality and safety, employees at Faerch, and throughout the Group’s value chain, business partners, shareholders and local communities. Faerch maps its stakeholders and has processes in place to ensure inclusion of stakeholder concerns and expectations.
Materiality
When assessing whether a disclosure is to be included in the consolidated statement of sustainability performance, Management considers whether the matter is of such relevance and importance that it is deemed material through our double materiality assessment (DMA). The DMA involved an impact assessment (inside-out) of Faerch’s impacts on the environment and society, building on our existing evaluations of sustainability-related impacts across our operations and value chain. Additionally, we performed a financial assessment (outsidein) to understand the sustainability-related risks and opportunities facing our business. Given the extensive requirements of the ESRS principles on double materiality assessment, we chose to focus on internal subject matter experts to evaluate our sustainability impacts, risks, and opportunities. Furthermore, additional disclosures can be included although deemed non-material through the DMA to meet specific customer requirements, various sustainability rating schemes etc.
Responsiveness
The report reflects how the company is managing operations in ways that consider and respond to stakeholder concerns and interests. The report reaches out to a wide range of stakeholders. To all Faerch stakeholders, the report is just one element in the interaction and communication with the company
Impact
Understanding, measuring and communicating the positive and negative impacts on society and the planet of Faerch’s activities is important and remains a priority for Faerch.
Principles of consolidation
The sustainability performance data includes consolidated data from the parent company, Faerch A/S and entities controlled by Faerch. Data is collected per legal entity per activity and the figures are consolidated line-by-line.
The disclosures of energy consumption, greenhouse gas (GHG) emissions and water consumption covers operations. The disclosure of waste, circularity inflow and circularity outflow covers production sites, where recycled PET output from our Recycling Division only applies to our recycling plant Cirrec in the Netherlands.
The consolidation of the GHG emission data is based on the operational consolidation approach and stated in accordance with the GHG Protocol. Consolidation of GHG emission data using the operational control approach implies that:
- Everything where Faerch A/S or one of its subsidiaries has complete authority to create and apply operating policies is included.
The social-related disclosures covers Faerch A/S and entities controlled by Faerch A/S.
Note 6.1 // Energy consumption
ACCOUNTING POLICIES
Energy consumption for operations (production sites and offices) are measured as consumption of power, steam, heat, cooling and fuels except fuels used in mobile combustion e.g. fuel for company cars. Energy consumption is based on meter readings and invoices.
Note 6.2 // Waste from production sites
Waste Management Overview
Across all sites, the production of waste is carefully managed and continuously monitored. In 2024, the total volume of waste generated increased compared to the previous year by 43%, maily due to opening of a second tray line at recycling facility - Cirrec, in the Netherlands.
However, we made significant progress in waste management by increasing the share of waste directed to recycling and recovery while reducing landfill disposal. This year, 93% of waste was sent for recovery, compared to 90% in 2023, while disposal decreased from 10% to 7%. The main types of waste generated included plastics, oil, paper, cardboard, wood, metal, and mixed packaging. Additionally, 79% of the waste in 2024 was classified as non-hazardous, compared to 83% in 2023. Hazardous waste accounted for 21% of the total, primarily consisting of oils and absorbents. At the same time, we remain committed to progressively reducing the amount of waste sent to landfill by prioritizing recovery, recycling, and waste-to-energy processing through proper sorting.
The key metric we monitor is the ratio of landfill waste to total waste generated. In 2024, this ratio improved significantly compared to 2023, decreasing from 8% to 3%, reflecting our continued efforts to enhance waste management and sustainability. Our ongoing efforts to enhance waste management align with our commitment to sustainability, focusing on increasing recycling rates and minimizing environmental impact.
ACCOUNTING POLICIES
Waste is measured as the sum of all the waste (except waste water) disposed of at production sites based on weight receipts. Waste related activities are classed as recovery (R) or disposal (D) as defined in the EU Waste Framework Directive 2008/98. ‘Recovery’ means any operation the principal result of which is waste serving a useful purpose by replacing other materials which would otherwise have been used to fulfil a particular function, or waste being prepared to fulfil that function, in the plant or in the wider economy. ‘Disposal’ means any operation which is not recovery even where the operation has as a secondary consequence the reclamation of substances or energy. Recycling covers various kinds of waste, the waste which is plastic is being downcycled and used for other purposes than food packaging. Energy recovery is waste disposed of at waste-to-energy plants. Storage of waste pending recovery is waste that is stored before being subjected to a recovery operation (such as recycling, energy recovery). Waste being incinerated with no energy recovery may cover waste not suitable for other disposal methods, such as hazardous waste for incineration and various other types of waste. All other waste is being landfilled.
Ratio of own waste recovered vs. sent for disposal:
The ratio of own waste recovered vs. sent for disposal has been calculated as the proportion of waste classified under Recovery (R) to waste classified under Disposal (D). Recovery (R) includes primarily Recycling and Incineration with Energy Recovery, while Disposal (D) consists of Incineration without Energy Recovery and Landfill.
Note 6.3 // Water consumption for production sites
Production sites in Spain and Turkey are located in areas of high risk of water scarcity (WWF Water Risk Filter). They account for 4% of Faerch’s total water consumption. A significant part of the water consumption comes from Cirrec, our mechanical recycling division, that focuses on recycling of household food packaging turning waste into a valuable resource.
ACCOUNTING POLICIES
Water consumption is measured based on meter readings and invoices and covers both production sites and offices.
Note 6.4 // Scope 1, 2 and 3 emissions
Direct GHG emissions (scope 1)
Scope 1 emissions comprise of direct CO2e emissions from sources that are owned or controlled by Faerch A/S. It is calculated based on the amount of direct energy used for stationary combustion from meter readings and invoices. For mobile combustion it is based on fuel consumption, kilometre readings or, if not available, the maximum annual kilometres in the leasing contract. The scope also includes fugitive emissions coming primarily from recharging of cooling systems. The emission factors used are sourced mainly from DESNZ.
Indirect GHG emissions (scope 2) - location-based
Scope 2 GHG emissions (location-based) are the CO2e calculated based on consumed electricity, steam and district heating bought from a third party and using the total IEA emission factor based on location.
Scope 2 GHG emissions (scope 2) – market-based
Scope 2 GHG emissions (market-based) are the CO2e, calculated based on consumed electricity, steam and district heating bought from a third party and using the supplier specific grid mix stated at the latest invoice using IEA emission factors. If specific grid mix is unavailable the total IEA emission factor is used based on location.
Note 6.4 // Scope 1, 2 and 3 emissions (continued)
Scope 3 GHG emissions
Scope 3 GHG emissions are the CO2e emissions from value chain activities. Of the 15 scope 3 categories in the GHG Protocol, 11 categories are determined as applicable to Faerch’s business model and activities. The excluded categories are category 10: processing of sold products, category 11: use of sold products, category 14: franchises and category 15: investment. The scope 3 GHG emissions comprise emissions related to:
3.1 Purchased goods and services
Purchased goods and services include emissions related to all purchases from external suppliers except for investments and travel categories. Purchased goods and services within the “Bill of Material” (BOM) includes emissions related to the purchased weight from the supplier using Ecoinvent for emission factors supplemented by DESNZ. For the purchased goods and services outside BOM (not directly related to the product e.g. IT equipment), a spend-based approach is applied, when no weight can be obtained.
3.2 Capital goods
Capital goods include emissions related to all indirect investment spend from external suppliers, specifically production utilities and equipment. Indirect spend is converted via the average spend-based method into CO2e emissions using emission factors from EPA. We include the full scope 3 impact in the first year of the CAPEX investment in line with the GHG protocol.
3.3 Fuel and energy related activities
Fuel and energy related activities include all upstream CO2e emissions of purchased fuels, electricity, steam and district heating (beyond scope 1 and 2 emissions). The energy consumption is converted to kWh and multiplied with DESNZ relevant Well-to-Tank (WTT) emission factor to assess CO2e emissions. The category also covers the upstream emissions from transportation and distribution of electricity, steam and district heating using relevant emission factors from IEA and DESNZ.
3.4 Upstream transportation and distribution
Upstream transportation and distribution includes CO2e emissions from product distribution and transportation from tier 1 suppliers to Faerch facilities, between Faerch facilities and from Faerch facilities to customers, where Faerch pays the freight. Only emissions connected to transportation are calculated.
CO2e emissions from inbound transportation are based on the calculated distance from supplier addresses and the purchased weight. Assumptions are made on inbound transportation mode.
CO2e emissions from intercompany and outbound transportation are based on the calculated distance between locations and the sold weight. For water transportation with unknown distance, an average ship distance has been applied. Calculations are based on actual transportation mode reported. All emission factors, for inbound, intercompany and outbound are based on specific transportation mode type. DESNZ emission factors have been applied.
3.5 Waste generated in operations
Waste generated in own operations include CO2e emissions associated with third-party disposal and treatment of
waste, which is reported based on waste amounts, type of waste and disposal method. In most cases either EPA or DESNZ is used as emission factor dependent on type of waste and disposal method. For wastewater Ecoinvent is used.
3.6
Business travel
CO2e emissions from business travel are calculated using both, activity-based and spend-based methodologies. Activity-based method is used for detailed activities sourced by the group travel agency, focusing on business flights and hotel accommodation. Spend-based method is used for the remaining business travel costs, which are sourced directly from financial system. DESNZ emission factors have been applied.
CO2e emissions from business flights are calculated based on distance between airports multiplied by emission factors for short- and long-haul flights. For hotel stays, the emission calculations are based on the number of nights spent in each country together with their relevant DESNZ emission factor. For the remaining travel not covered by the above, the spend-based method is used for completeness.
3.7
Employee commuting
Employee commuting includes CO2e emissions associated with commuting by all employees except the amount of employees having company cars, since these emissions are already reported as scope 1 emissions. The CO2e emissions are based on the distance to work using employee addresses, and making assumptions on transportation mode and working days while using DESNZ for emission factors.
3.8
Upstream leased assets
Upstream leased assets are reported based on operation of assets that are leased by Faerch (acting as lessee) and not reported in scope 1 and 2. CO2e emissions have been calculated using spend-based emission factors from EPA.
3.9 Downstream transportation and distribution
Downstream transportation and distribution includes CO2e emissions that occur from transportation and distribution of sold products in vehicles and facilities not owned or controlled by Faerch, where the customer pays for freight. Only transportation emissions are included in the calculations, specifically from the first receiving warehouse to customers. CO2e emissions from downstream transportation are based on the calculated distance between locations and the sold weight. For water transportation with unknown distance, an average ship distance has been applied. Emission factors are based on actual transportation mode type reported. DESNZ emission factors have been applied.
3.12
End-of-life treatment of sold products
End-of-life treatment of sold products include CO2e emissions from end-of-life treatment of our sold products on the markets and by-products from our production which we sell to others. The amount of sold products is based on actual sales data. It is assumed that the products are discarded in the countries, where they are sold. The end-of-life treatment for EU27+3 countries follows the post-consumer plastic waste treatment per country covering the vast majority of sold amounts. The end-of-life waste treatment for the remaining countries follows the end-of-life fates for plastic waste on the corresponding regional level from the OECD database. DESNZ or EPA are used as emission factor dependent on the disposal method for both products and by-products.
3.13 Downstream leased assets
Downstream leased assets are reported based on operation of assets that are owned by Faerch (acting as lessor) and leased to other entities, and are not reported in scope 1 and 2. CO2e emissions have been calculated using spend-based emission factors from EPA.
Total GHG Emissions – location-based
Total GHG emissions is the sum of reported scope 1, scope 2 – location-based and scope 3 emissions.
Total GHG Emissions – market-based
Total GHG emissions is the sum of reported scope 1, scope 2 – market-based and scope 3 emissions
Note 6.5 // Volatile Organic Compound (VOC)
The Group’s Volatile Organic Compound (VOC) emissions are calculated utilizing various measurement methods across multiple production sites. Direct measurements from certain sites are used to extrapolate emissions data for the entire Group due to similar processes across. The machine production output is determined based on the average output per hour. For thermoforming processes, an additional factor is applied as proxy to account for regrind. It should be noted that emissions from injection and blow molding processes are excluded from the VOC calculations due to lack of quality data at the moment.
Note 6.7 // Share of products designed for circularity
ACCOUNTING POLICIES
The share of products designed for circularity means the weight of products, where the recycled material can feed a closed-loop scheme to be used in the same quality applications (e.g. tray-to-tray). Currently, it is only mono-PET products that are accepted as products designed for circularity. This is taken relatively to the total weight sold by Faerch.
Note 6.8 // The Faerch Circularity Ratio
ACCOUNTING POLICIES
The “Faerch Circularity Ratio” is the estimated output from our installed recycling capability of “tray” rPET from our Recycling Division. This amount is converted into pieces of average weighting APET trays – assuming the trays only contain “tray” rPET.
This is taken relatively to Faerch’s total pieces sold within rigid food packaging in Europe.
Note 6.9 // The Market Circularity Ratio
Note 6.6 // Output from tray recycled PET from our Recycling Division
ACCOUNTING POLICIES
It is the volume of tray recycled PET (rPET) output material derived from Faerch’s Recycling Division. The output material “tray rPET” is derived from post-consumer PET packaging collected from European kerbside collection and closed-loop systems (ISO 14021:2016) excluding input material from the deposit system of bottles.
ACCOUNTING POLICIES
The “Market Circularity Ratio” is the estimated output from our installed recycling capability of “tray” rPET from our Recycling Division. This amount is converted into pieces of average weighting APET trays – assuming the trays only contain “tray” rPET.
This is taken relatively to the total pieces sold on the European market within rigid food packaging (source: internal market study with external support).
Note 7.1 // Employees
ACCOUNTING POLICIES
The number of employees is recorded as all employees in headcount end of the year.
Note 7.2 // Gender on the Board of Directors
ACCOUNTING POLICIES
The share of female board members is calculated as the number of shareholder-elected female Board members taken relatively to the total number of shareholder-elected Board members.
Note 7.3 // Gender at the two management layers below the Board
ACCOUNTING POLICIES
The share of females at the two management layers below the Board is calculated as the number of females on the first and secondary management level, meaning our Executive Management Team and people with personnel responsibilities who report directly to the first management level, respectively. This is taken relatively to the total number of people at the two management layers below the Board.
Note 7.4 // Health & Safety
ACCOUNTING POLICIES
Lost Time Injury Frequency Rate (LTIFR)
The Lost Time Injury Frequency Rate is measured as the reported number of accidents with absence per million nominal working hours. A lost-time injury is any work-related accident causing at least one day of absence in addition to the day of the accident.
Our 2025 Health & Safety proactive targets are site oriented and scaled to size and improvement potential of each individual site.
Leadership Safety Walks
Leadership Safety Walks is comparable to Genba walks, where we aim to have senior leaders observing work where it happens and talking with employee about potential safety improvement.
EMT members, Country MD, Group Senior Directors, Site Directors and the local senior management team is the intended audience in scope.
Safety Inspection
Safety Inspections is a formal verification that the workplace or work activities are as intended. The inspections are documented checklists in our Incident Management system and the target is scaled based on number of employees per site (as of January 1, 2025).
Emergency Drills
Each operating site is required to perform at least one drill to test the emergency preparedness and arrangements annually.
Independent limited assurance report on Selected ESG data in the consolidated statement of sustainability performance
To the Stakeholders of Faerch A/S
Faerch A/S (“Faerch”) engaged us to provide limited assurance on selected ESG data in the consolidated statement of sustainability performance for the period 1 January 2024 - 31 December 2024 (the “Selected ESG data”)
Our conclusion
Based on the procedures we performed and the evidence we obtained, nothing came to our attention that causes us not to believe that the Selected ESG data for the period 1 January 2024 - 31 December 2024 stated on page 10 in the 2024 Sustainability Report are prepared, in all material respects, in accordance with the accounting policies developed by Faerch as stated on pages 58-61 of the 2024 Sustainability Report (“accounting policies”). This conclusion is to be read in the context of what we state in the remainder of our report.
What we are assuring
The scope of our work was limited to assurance over the Selected ESG data for the period 1 January – 31 December 2024 stated on page 10 in the 2024 Sustainability Report of Faerch:
- Scope 1 (CO2e)
- Scope 2 (location-based) (CO2e)
- Scope 2 (market-based) (CO2e)
- Scope 3 (CO2e)
- Output of tray recycled PET from Recycling Division (ktonnes)
- Share of products designed for circularity (%)
We express limited assurance in our conclusion.
Professional standards applied and level of assurance
We performed a limited assurance engagement in accordance with International Standard on Assurance Engagements 3000 (Revised) ‘Assurance Engagements
other than Audits and Reviews of Historical Financial Information’ and, in respect of the greenhouse gas emissions, in accordance with International Standard on Assurance Engagements 3410 ‘Assurance engagements on greenhouse gas statements’. The quantification of greenhouse gas emissions is subject to inherent uncertainty because of incomplete scientific knowledge used to determine the emissions factors and the values needed to combine emissions of different gasses.
A limited assurance engagement is substantially less in scope than a reasonable assurance engagement in relation to both the risk assessment procedures, including an understanding of internal control, and the procedures performed in response to the assessed risks; consequently, the level of assurance obtained in a limited assurance engagement is substantially lower than the assurance that would have been obtained had a reasonable assurance engagement been performed.
Our independence and quality control
We have complied with the independence requirements and other ethical requirements in the International Ethics Standards Board for Accountants’ International Code of Ethics for Professional Accountants (IESBA Code), which is founded on fundamental principles of integrity, objectivity, professional competence and due care, confidentiality and professional behaviour and ethical requirements applicable in Denmark.
PricewaterhouseCoopers applies International Standard on Quality Management 1, ISQM 1, which requires the firm to design, implement and operate a system of quality management including policies or procedures regarding compliance with ethical requirements, professional standards and applicable legal and regulatory requirements.
Our work was carried out by an independent
multidisciplinary team with experience in sustainability reporting and assurance.
Understanding reporting and measurement methodologies
The Selected ESG data need to be read and understood together with the accounting policies. The accounting policies used for the preparation of the Selected ESG data are the accounting policies developed by Faerch, which Management is solely responsible for selecting and applying.
The absence of a significant body of established practice on which to draw to evaluate and measure sustainability data allows for different, but acceptable, measurement techniques and can affect comparability between entities and over time.
Work performed
We are required to plan and perform our work in order to consider the risk of material misstatement of the Selected ESG data for the period 1 January – 31 December 2024. In doing so and based on our professional judgement, we:
- Evaluated the appropriateness of the accounting policies used and their consistent application in the Selected ESG data;
- Made inquiries and conducted interviews with management with responsibility for management and reporting of the Selected ESG data to assess reporting and consolidation process, use of company-wide systems and controls performed;
- Checked the Selected ESG data on a sample basis to underlying documentation and evaluated the appropriateness of quantification methods and compliance with the accounting policies used for preparing the Selected ESG data;
- Performed analytical review and trend explanation of the Selected ESG data; and
- Evaluated the obtained evidence.
Management’s responsibilities
Management of Faerch is responsible for:
- Designing, implementing and maintaining internal control over information relevant to the preparation of the Selected ESG data that are free from material misstatement, whether due to fraud or error;
- Establishing objective accounting policies for preparing the Selected ESG data;
- Measuring and reporting the information in the Selected ESG data based on the accounting policies; and
- The content of the Selected ESG data
Our responsibility We are responsible for:
- Planning and performing the engagement to obtain limited assurance about whether the Selected ESG data for the period 1 January – 31 December 2024 are prepared, in all material respects, in accordance with the accounting policies; Forming an independent conclusion, based on the procedures performed and the evidence obtained;


About this report
This provides our stakeholders with a holistic view on Faerch’s value creation, strategic aspirations and performance, while demonstrating our objective to conduct our activities in a financially, environmentally and socially responsible way.
Faerch A/S
Rasmus Færchs Vej 1
7500 Holstebro
Denmark
CVR no. 13723540
We value a sustainable feedback
We welcome questions, comments or suggestions you might have to this report’s ESG topics and performance. Please send your feedback to:
sustainability@faerch.com www.faerch.com/sustainability
Responsible editor
Elisabet V. Sandnes
Editors
Jesper Skovlund
Krestina Magdal
Camilla Fangel
Varinia Pauli
Frank Nørgaard
Sofie Kirstine Ravn Jensen
ESG data and reporting
Camilla Fangel
Katarzyna Kempińska
Ceren Vihtonen
Amani Hassan
Magdalena Biśta-Bordoszewska
Creative editor, design, planning and layout
Morten Sigh
Kathleen Arenz
Suzi Barber
Lucy Anne Parish
Photographs
Ole Mortensen Shutterstock
Moment Studio
Jake Hughes
Full Moon, Germany
Steen Brogaard
The Event Company
We welcome questions, comments or suggestions you might have to this report´s ESG topics and performance.
Please send to sustainability@faerch.com
Headquarters
Faerch A/S
Rasmus Færchs Vej 1
7500 Holstebro
Denmark
Tel.: +45 99 10 10 10
dk@faerch.com
SVITZER
The sustainability statement from Svitzer’s Annual Report for 2024 is enclosed on the next pages.
Introduction to Sustainability Reporting
CSRD and ESRS aligned Sustainability Statement
Svitzer is pleased to present its Sustainability Statement aligned with the new EU Corporate Sustainability Reporting Directive (CSRD) and the underlying European Sustainability Reporting Standards (ESRS).
Svitzer’s Sustainability Statement is prepared in accordance with ESRS, utilising the ‘incorporation by reference’ option.
A detailed overview of the ESRS structure and disclosure requirements is provided in the section ‘Disclosure requirements and incorporation by reference’.
Strategy
Svitzer’s strategy includes a strong foundation of environmental, social, and governance priorities, enabling us to lead the towage industry while continuously innovating for the benefit of people, customers, and communities.
These areas define where Svitzer deploys resources. Svitzer’s integrated approach ensures that the entire organisation aligns with these priorities.
Refer to page 20-21 for more details on Svitzer’s strategy, which incorporates its sustainability strategy.

ESG Governance
Governance
Svitzer has a governance structure in place, in alignement with CSRD and ESRS requirements, to ensure proper oversight and responsibility for the Company’s double materiality assessement (DMA) and the sustainability reporting process.
In 2023, Svitzer established a Management Sustainability Committee and an ESG Working Group. The purpose was to appoint dedicated leads from various functions (topical and functional owners), to prepare for the new EU reporting requirements under the CSRD and to ensure the integrity of the Company’s ESG reporting through the required limited assurance process.
The Management Sustainability Committee is chaired by the CFO and the ESG Working Group is chaired by Head of Group Reporting and Finance Operations.
In 2024, the responsibility for sustainability accounting and reporting was anchored with Svitzer’s Finance Department, ensuring that the Company’s financial and sustainability accounting, controlling, and reporting will be aligned over time.
The Finance Department collaborates closely with the ESG Working Group to conduct the DMA and to oversee and manage the reporting process. Topical owners capture, monitor, and control the data ensuring it aligns with Svitzer’s policies and targets.
Svitzer Group A/S governance structure
Executive Management Team and Executive Leadership Team
Management Sustainability Committee
ESG Working Group
Board of Directors
Executive Management Team and Executive Leadership Team
Management Sustainability Committee
ESG Working Group
Integration of sustainability-related performance in incentive schemes
The Board of Directors at Svitzer consists of 50% independent Board members. Members of the Board of Directors do not participate in any form of incentive schemes but are responsible for approving all incentive scheme designs, KPIs and targets based on recommendations from the Remuneration Committee. Executive Management remuneration is partly linked to ESG performance through KPIs.
The Remuneration Committee reviews performance throughout the year, with full disclosure provided in the Annual Remuneration Report.
Refer to page 89 of the Sustainability Statement for more details of ESG KPIs in incentive remuneration.
The Executive Leadership Team comprises 11 members and their responsibilities. In addition to the Executive Management, the Executive Leadership Team includes the Chief Commercial Officer, Chief People Officer, General Counsel, Chief Information Officer, Chief Operating Officer, Managing Director of AMEA, Managing Director of Europe, Managing Director of Americas, and Managing Director of Australia.
The Executive Leadership Team jointly owns the execution of Svitzer’s strategy and is composed in a way that provides strong alignment across Svitzer’s global organisation, as well as clear ownership and accountability for the Company’s strategy, including its sustainability strategy.
The Management Sustainability Committee consists of the Chief Executive Officer, Chief Financial Officer, Chief People Officer, Chief Commercial Officer, Group General Counsel, and Chief Operating Officer. This group has been selected due to their extensive knowledge of and experience in the marine service industry, along with their oversigt of the Company’s global operations in various geographical locations. In addition, they cover different areas of Svitzer’s business and material impacts, risks, and opportunities, e.g., from a focus on decarbonisation strategy to people and customers. To ensure the Management Sustainability Committee stays updated on the sustainability landscape, they leverage information from the ESG Working Group.
The Management Sustainability Committee is chaired by the CFO and is responsible for steering the Company’s sustainability agenda and approving the material impacts, risks and opportunities, including Svitzer’s policies, actions and targets. Formalised in an annual cycle, the committee meets at least four times a year, approving the dataset and the results, along with reviewing effectiveness of policies, actions, metrics, and targets adopted to address material sustainability matters. They report to the Audit and Risk Committee at each committee meeting any material updates and results of the DMA, and where necessary, seek approval. Furthermore, they consider and evaluate ESG in due diligence process of M&A or other key transactions.
The ESG Working Group includes representatives from Decarbonisation, Finance, Procurement, Legal and Compliance, People and Culture, Commercial and Safety, and is chaired by the Head of Group Reporting and Finance Operations. Members of the ESG Working Group have been selected due to their experience in different areas relevant to the sustainability matters prescribed in the ESRS and their representation of external stakeholders.
Each ESG Working Group member has skills and expertise relevant to specific impacts, risks, and opportunities. The ESG Working Group is responsible for coordinating sustainability reporting activities in collaboration with Group Finance. Group Finance acts as the overall owner of sustainability reporting, establishing the internal control framework over sustainability reporting is in place and aligned with the financial reporting and enterprise risk management. The ESG Working Group regularly updates the Management Sustainability Committee on relevant matters and ensures the monitoring of progress, along with the use of internal and external stakeholder perspectives as proxies.
General basis for preparation
The Sustainability Statement is structured in accordance with the ESRS 1 General requirements and ESRS 2 General disclosures set forth by the European Financial Reporting Advisory Group (EFRAG). The process for disclosing information and determining material impacts adheres to the Double Materiality principle, as outlined in the ESRS 1 General requirements and ESRS 2 General Disclosures and EFRAG guidance on implementing the Double Materiality Assessment (DMA). Qualitative and Quantitative material information is categorised into three main sections: 1. Environment, 2. Social and 3. Governance. The following sections provide a detailed account of how Svitzer has identified and assessed impacts, risks, and opportunities (IROs) and a methodological approach throughout the DMA process across the entire value chain’s upstream, own operations and downstream activities as illustrated on page 56.
Basis of preparation (according to ESRS 2)
Svitzer’s basis of preparation is aligned with the ESRS topical standards and is detailed alongside each reported metric in the subsequent chapters. Since this is the first year of reporting, comparative figures are not available. Calculation factors and references to reported data points can be found in section accounting policies.
Consolidation
The Sustainability statement has been prepared on a consolidated basis. The consolidation approach mirrors the principles used in Svitzer’s Consolidated Financial Statements and the consolidated ESG data includes the parent company Svitzer Group A/S and its controlled subsidiaries.
Joint ventures and associated companies are not included in the consolidated data.
For entities where Svitzer has operational control, defined as having full authority to introduce and implement operating policies based on contractual arrangements, we also report scope 1 and 2 GHG emissions for such entities independent of ownership share.
Consolidation of all ESG data follows the principles above, unless otherwise detailed in in the accounting policies described in each chapter.
Key accounting estimates and judgements
As this is the Company’s inaugural year of reporting under the CSRD and as a publicly listed company, Svitzer has utilised estimates and assumptions. These estimates are based on industry standards and other relevant factors such as a spendbased method for the Scope 3 reporting, and proxies for calculating the percentage of gender pay gap and the annual total
remuneration ratio. As the use of estimates is subject to a high level of uncertainty in terms of measurement, Svitzer will refine estimates as the data quality improves over time.
Judgements have been essential in shaping the disclosures within the ESRS reporting, ensuring that the context of our sustainability data has been defined and scoped under each topical standards e.g., defining our own workforce. Refer to other sections of the Sustainability Statement for more details on the judgements.
Limited assurance
All disclosures requirements related to 2024 ESRS and CSRD disclosure requirements are subject to limited assurance conducted by the Company’s auditor, PwC. The auditor’s limited assurance report is available on page 178-180.
Statement on sustainability due diligence
Presented below, Svitzer has mapped the core elements of its due diligence.
Core elements of due diligence
a) Embedding due diligence in governance, strategy and business model
b) Engaging with affected stakeholders in all key steps of the due diligence process
Paragraphs in the Sustainability Statement Page(s)
Introduction to Sustainability Reporting, ESG Governance, Svitzer’s value chain and business model 48-50, 56
Stakeholder identification and engagement 59
c) Identifying and assessing adverse impacts Double Materiality Assessment, Svitzer’s value chain and business model 53-58
d) Taking actions to address those adverse impacts Own workforce, Workers in the value chain, Consumers and end users, Business conduct 81-102
e) Tracking the effectiveness of these efforts and communicating Own workforce, Workers in the value chain, Consumers and end users, Business conduct 81-102
Risk management and internal controls for sustainability reporting
Svitzer has identified key risks associated with each sustainability matter and is in the process of identifying, initiating and implementing targeted mitigation actions. The governance structure supports these efforts with comprehensive accounting and reporting manuals. Svitzer continuously monitors and refines the sustainability reporting processes and controls, ensuring they evolve as the Company’s reporting practices mature.
Use of phase-ins
The phase-in specified in the ESRS 1 has been applied for E1 Climate Change, E2 Pollution and E5 Resource use & Circular Economy under the Environmental reporting section. Futhermore, Svitzer has applied the phase-in approach for S1 Own Workforce for areas such as Characteristics of nonemployees, Collective bargaining coverage and social dialogue, social protection, Training and skills development, and Health & Safety.
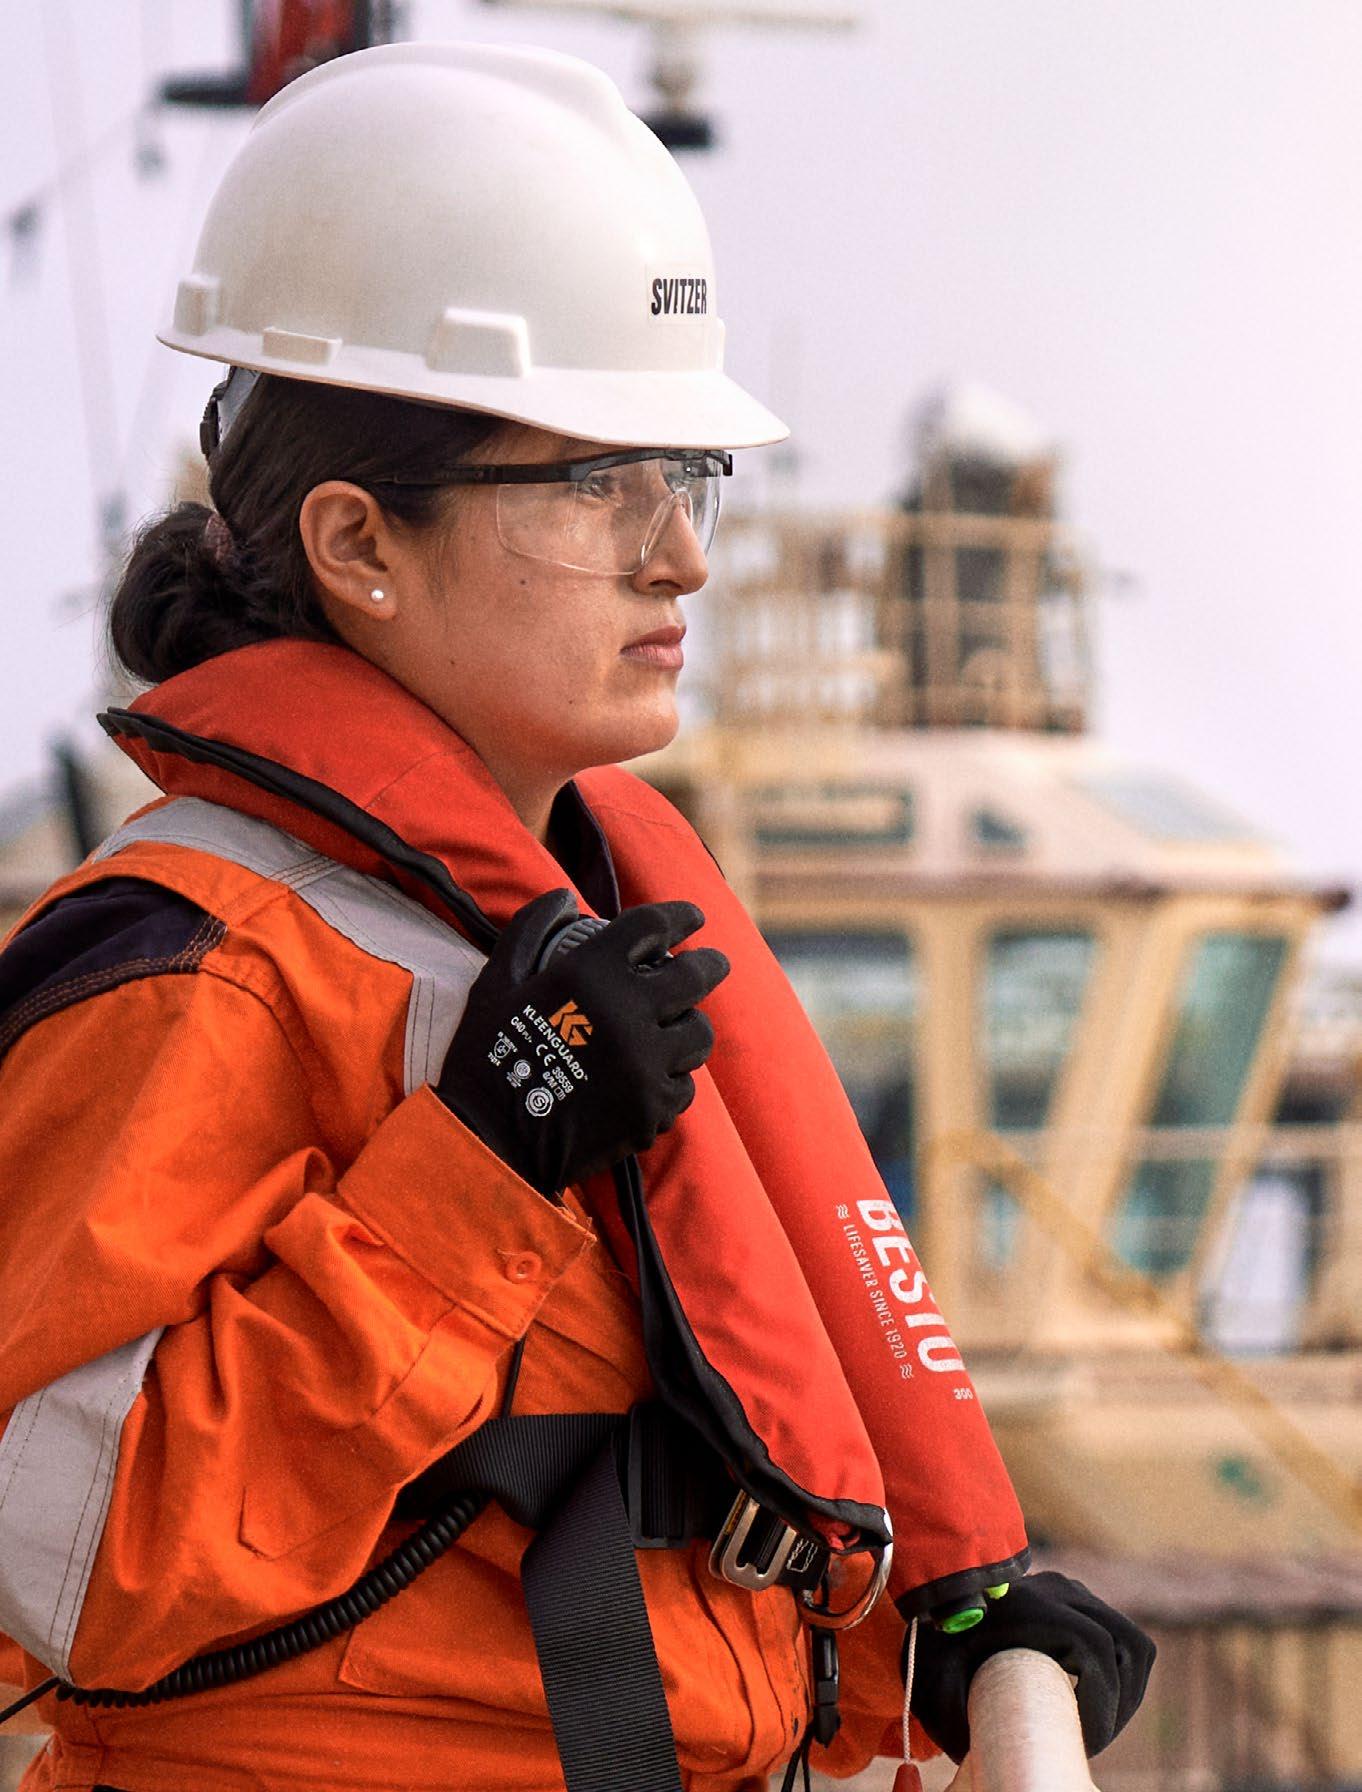
Double Materiality Assessment introduction
In 2023, Svitzer conducted a Double Materiality Assessment (DMA) to thoroughly understand our most material impacts, risks, and opportunities. The DMA serves as the foundational principle on which Svitzer selects material sustainability topics, shaping our Sustainability Statement, and integrating both impact materiality and financial materiality.
The impact materiality assesses the potential and actual effects, both positive and negative, on people and the environment, considering short and medium to long-term horizons.
The financial materiality evaluates how the societal and environmental factors could pose risks or opportunities for Svitzer, focusing on their potential magnitude and likelihood of potential financial consequences.
These dual assessments are vital for identifying the impacts, risks, and opportunities (IROs) pertinent to Svitzer. The insights gained from this evaluation have led to the development of a prioritised list of the most material sustainability topics. This list will guide our CSRD reporting and will be reviewed annually to ensure it remains aligned with our value chain activities and business model.
Svitzer Double Materiality Assessment
Double Materiality Assessment methodology
Our Double Materiality Assessment (DMA) methodology aligns with the EFRAG Implementation Guideline 1 and 2, incorporating DMA principles into our value chain mapping and assessment processes.
Scope and boundaries
Svitzer has identified and assessed impacts on people and the environment, as well as potential business risks and opportunities to our business. Additionally, Svitzer assessed the impacts, risks, and opportunities within our value chain, emphasising our upstream and downstream activities. Our value chain assessment is grounded in internal knowledge with the use of proxies, international frameworks and publicly available information, with a particular focus on suppliers and customers. This focus is critical for identifying and assessing impacts related to our upstream, own operations and downstream activities.
Where available, we have made use of information from our internal due diligence
Mobilise project team by creating the ESG Working Group appointing members with relevant sustainability expertise and representation of specific stakeholder groups
Map business model, document value chain(s) focusing on key activities, business relationships, resources, geographies etc, and mapping our internal and external stakeholders based on value chain mapping
Identification of key impacts, risks and opportunities (IROs) focusing on key aspects of our business whilst considering factors that may give rise to increased risk (e.g. geographical location)
Defining materiality and scoring levels based on the set criteria in the ESRS along with assessment of materiality for the identified impacts, risks and opportunities.
Assess gaps in current reporting based on material and entity-specific ESRS Disclosure Requirements
processes such as supplier screenings and relevant internal management systems.
For the environmental identification and assessment, the DMA is e.g., informed by life cycle assessment performed for our vessels to assess resource use and taken into account physical and transitional risks that may impact our business activities in different sites.
Scoring criteria
Impact materiality
Impact materiality is evaluated based on the scale of impact, scope of impact, irremediability of impact, and likelihood of occurrence. The assessment of scale, scope and irremediability is rated on a scale
from 1 to 5, where 1 represents almost no impact and 5 represents a high impact. Likelihood of occurrence is also rated on a scale from 1 to 5, with 1 indicating almost no likelihood of occurrence and 5 indicating a secured likelihood of occurrence. The impact materiality score is calculated by summing the scale, scope, and, if negative, irremediability
scores and dividing by 3. This result is then placed on the scale from 1 to 5. A sub-topic is deemed material if its highest-rated impact materiality score for any value chain activity fall within the darker shaded area of our materiality matrix as included on page 58. Additionally, time horizons for each IRO are considered, as detailed on pages 60 to 62.
Financial materiality
In assessing financial materiality, the impact of nature, social, and human risks that may affect Svitzer operations, such as pricing, margins, supply, and regulation, were considered. Financial materiality is assessed based on the likelihood of occurrence and the size of the financial impact, also rated on a scale from 1 to 5, where 1 represents minimal impact or likelihood and 5 represents maximum impact or certainty. Further, Svitzer, has also considered the criteria in the ESRS such as impact on cash flow, development, performance, financial position, cost of capital, access to finance, ability to obtain natural resources, reliance on relationships and time horizons.
Time horizons
In accordance with the ESRS General Requirements, Svitzer defines time horizons as follows:
• Short-term: The current reporting period as defined in Svitzer financial statements.
• Medium-term: Extending from the end of the short-term reporting period up to five years.
• Long-term: Beyond five years.
Threshold setting
Our Management Sustainability Committee has established materiality thresholds in alignment with EFRAG’s DMA guidelines. Impacts, risks and opportunities are evaluated using a matrix. Items scoring above the threshold line (darker coloured shade as shown on page 58) are considered material. Each dimension, Environmental, Social and Governance, was assessed separately, resulting in distinct thresholds for social sustainability topics to ensure that severity takes precedence over likelihood. The IROs within the same sub-topic have been assessed independently of each other and if one of the IROs has been deemed material the whole sub-topic has been assessed as material. Further, we have ensured to assess both impact and financial materiality together for each sub and sub-sub-topics. For human rights impacts, we have followed the guidelines from Organisation for Economic Co-operation and Development (OECD) in respect of severity taking precedence over likelihood. The Audit and Risk Committee reviewed and approved the final DMA results.
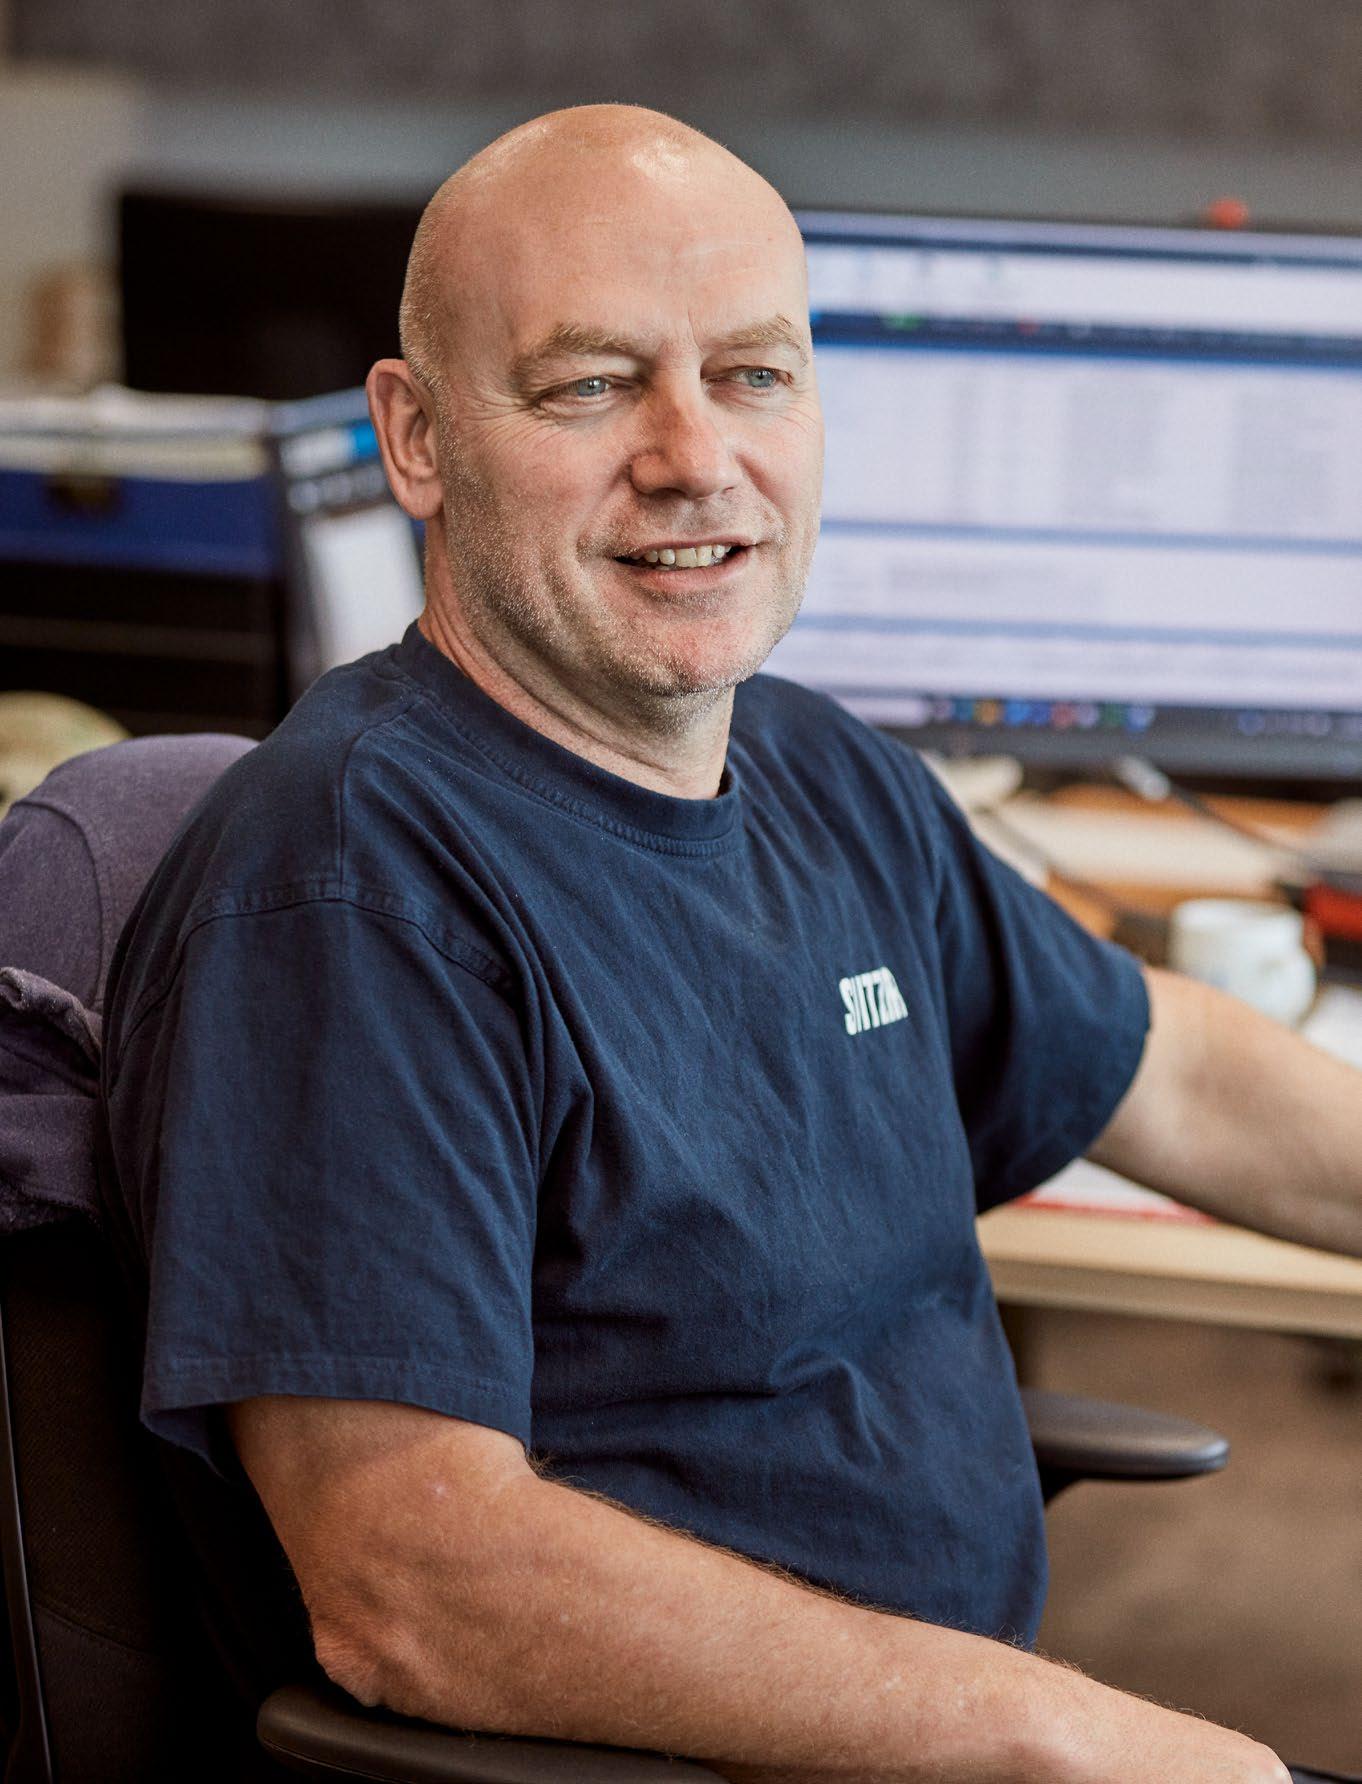
Svitzer’s value chain and business model
For this Double Materiality Assessment, Svitzer mapped a single value chain that spans our activities from upstream to downstream operations. This approach focuses on our key activities – providing towage services – to ensure the analysis accurately reflects the most relevant aspects of our operations
extraction and refining for marine fuel (e.g., drilling of crude oil, storage etc.) Transport of materials
Docking service (e.g. yards for periodical maintenance of vessels)
Bunkering and energy supply (e.g., to vessels and offices) Transport of marine fuel Delivery of newbuild and relocation between regions (e.g. vessel transfers or suppliers of mobilisation crew)
Crew and service functions (e.g., Marine Standards, Finance, People and Culture)
authorities and owners (local port authorities or port owners in charge of regulating safety)
and Terminal towage (assisting seaborne vessels in manoeuvring in and out of ports and terminals) Harbour and Terminal towage customers (operators and owners of seaborne vessels or terminals) Related marine services (e.g., line handling, fire fighting and emergency response) Manufacturing of vessels and marine equipment (e.g. shipyards and original equipment manufacturers) Resource extraction and processing for vessels and marine equipment (e.g., mining of iron ores for steel) End-of-life management (e.g., sale of assets, scrapping and waste management
Double Materiality Assessment results
Svitzer has conducted a Double Materiality Assessment to identify our environmental and social impacts, alongside a financial materiality assessment to evaluate sustainability-related risks and opportunities. The results, organised by ESRS topics, identify E1, E2, E5, S1, S2, S4 and G1 as our material sustainability matters (DMA results).
These findings align closely with our business strategy, which focuses on leading sustainable marine services, innovating with and for people, customers and communities. As a global company with significant impacts on both society and the environment, our DMA results highlight the need to address environmental impacts (E1, E2 and E5) and social impacts (S1, S2 and S4). To mitigate these, Svitzer has shaped its strategy around decarbonisation and thriving people.
All identified impacts, risks, and opportunities have been mapped to their relevant topical ESRS standard, with each topic’s importance determined by the highest scoring impact, risk, or opportunity in the matrix on page 58.
Further, all material IROs are presented on page 60-62 at a topic, sub-topic and subsub-topic level.
Topics deemed not material
Svitzer has assessed its activities along with assets in order to identify actual and potential IROs along upstream, own operations and downstream activities. Svitzer has applied the presented DMA methodology, using internal experts and desk research for identification and assessment. Based on the DMA, Water and marine resources have been deemed not material, as the current water discharges such as toilets, sinks, wash basins, showers, dispensary, bilge water, exhaust gas cleaning,
deck washing as well as shore-based activities linked to our operations as a marine transportation provider, were below our threshold. Svitzer recognises that in some of the regions where upstream activities are in mining and fuel production, there is increased risk of water depletion areas, and Svitzer will, therefore, ensure to revisit this area in the coming years. Informing this assessment, Svitzer has consulted with internal experts as described in the stakeholder engagement section.
For Biodiversity and ecosystems, Svitzer has identified and assessed both actual and potential impacts primarily located in the value chain rather than at its own locations in ports. For this year’s DMA, Svitzer has not identified dependencies on biodiversity nor any systemic risks. Svitzer has identified physical risks and opportunities related to
biodiversity and ecosystems; but following our DMA process, the IROs have been deemed not material. Svitzer recognises some of its services in ports are located in sensitive areas. For example, in Western Australia, the risk of impacting the biodiversity is higher in the waters surrounding the ports. The majority of biodiversity impacts on Svitzer have come from indirect effects i.e., GHG emission, which are covered under climate change and pollution. This will be revaluated as part of the annual DMA process.
Affected communities have been deemed not material in our DMA process, primarily because Svitzer is not building new ports or vessels that directly affect local communities. Although these impacts were assessed as below the materiality threshold, IROs within the CSRD and ESRS frameworks have identified that some
communities are indirectly affected by our operations. Recognising our broader impact on communities through our customers and suppliers, Svitzer views community engagement as an important aspect of our approach. Svitzer remains committed to supporting these communities through employment and local training programmes, as required by our customers and national laws.
Material ESRS Topics
E1 – Climate change:
• Climate change mitigation
• Energy
E2 – Pollution:
• Pollution of air
• Substances of concern
E5 – Resource use and circular economy:
• Resource inflows, including resource use
• Resource outflows related to products and services
S1 – Own workforce:
• Secure employment
• Working time
• Social dialogue
• Freedom of association
• Collective bargaining
• Health and safety
• Gender equality
• Training and skills development
• Measures against violence and harassment
• Diversity
• Privacy
S2 – Workers in the value chain:
• Secure employment
• Health and safety
• Gender equality
• Diversity
S4 – Consumers and end users:
• Access to quality information
G1 – Business Conduct
• Corporate culture
• Protection of whistleblowers
• Corruption and bribery – Prevention and detection
• Corruption and bribery – Incidents
Non-Material ESRS Topics
E3 – Water and
Interests and views of stakeholders
Stakeholder identification and engagement
In our Double Materiality Assessment (DMA) process, Svitzer adhered to EFRAG guidelines, starting with a comprehensive mapping of our entire value chain. This enabled us to identify both internal and external stakeholders, as well as those impacted by key activities within the value chain. Svitzer began the process by engaging directly with internal stakeholders from various business areas, addressing environmental, social and governance topics. These internal stakeholders were also selected as proxies, selected for their ability to represent crucial perspectives and offer insights from their ongoing dialogue with key external and affected stakeholders. Proxies were selected based on criteria such as their position, expertise, and most importantly, their relationship with specific stakeholder groups and roles.
These proxies represented the interests and views of affected stakeholders, supported by a detailed analysis of the industry, peers, and customers. The primary stakeholders identified include employees, our terminal
and towage customers, suppliers of tugs, marine equipment and marine fuel, as well as nature, considered a silent stakeholder. Our stakeholder engagement was conducted through a combination of interviews, workshops, and desk research. All information gathered was utilised to inform the identification and assessment of the IROs. Stakeholders were not engaged in the setting of the various targets.

Workshops
Interviews
Industry / Peer analyses
List of material IROs
The following tables include a summary of our material Impacts, Risks and Opportunities we identified as part of our Double Materiality Assessment process. The table states whether the impacts are actual or potential and the time horizon from when the IRO's are expected to have effect. More information on those sustainability matters is included in the relevant individual sustainability sections.
ESRS E1 – Climate change
Negative impacts
Greenhouse gas (GHG) emissions in own operation and value chain (actual) (short-term):
Our fleet powered by combustion engines, contributes to GHG emissions, alongside energy use in onshore operations. Additionally, emissions from our value chain, such as purchased goods and services, are a major factor.
Energy demand and consumption in own operation and value chain (actual) (short-term):
Energy is consumed across our value chain, especially in the production of vessels and marine equipment together with consumption stemming from our fleet and office operations.
Financial risks
Climate regulation risk (long-term):
Financial risks associated with Scope 1-2 and 3 GHG emissions arise from carbon taxation (for example, through IMO and ETS), which could impose costs on every tonne of CO2 emitted. Failure to adapt to climate change may lead to customer loss to greener operators, impacting revenue.
Raw materials with high associated emissions risks (long-term):
The extraction and processing of raw materials, particularly steel, are energy-intensive and subject to price volatility, posing financial risks.
Svitzer allocates resources to effectively address its environmental, social and governance material sustainability matters, which not only facilitate their comprehensive management, but also ensures that Svitzer’s response is aligned with best practices and organisational goals.
The Code of Conduct is ultimately approved by the Executive Management. Svitzer’s Code of Conduct (available on the Company’s website) together with specific policies referred to in other sections, cover all of the material IROs. Relevant members of the Executive Leadership Team are responsible for preparing, monitoring and implementing their functions, underlying policies that Svitzer’s Code of Conduct is built upon, supported by both the Global Compliance and Global Learning teams. The Board also approves the policies available on the Company’s website.
Financial opportunities
Business opportunities through decarbonisation (medium-term):
Our decarbonisation efforts offer opportunities, such as selling Scope 3 reduction certificates through EcoTow, and reducing exposure to carbon taxes and regulatory fines by lowering Scope 1, 2 and 3 emissions.
Negative impacts
Air pollutants in own operation and upstream (actual) (short-term):
Svitzer’s operations emit air pollutants such as sulphur oxides, nitrogen oxides, and particulate matter, which negatively impact both the environment and the health of employees working near exhausts. The production of raw materials and vessels also contributes significantly to air pollution.
Substances of concern from oil spills (actual) (short-term):
We find potential negative impacts through the spill of marine diesel oil, which include chemicals of concern. Actual negative impacts related to marine pollution, acidification of the seas, disturbance of ecosystems, negative influence on the development and reproductivity of marine species, killing of species and loss of biodiversity could occur from the oil spills.
Financial risks
Financial risk through reduction of air pollutants (medium-term):
Regulatory changes, customer demand, and rising fuel costs may require increased operational expenses or fleet modernisation to meet pollution reduction standards. Stricter operational requirements (for example Tier III engines) and new fuel standards could further raise costs.
Negative impacts
Securing employment for employees (actual) (short-term):
Temporary contracts and agency workers may face less favourable employment conditions compared to regular employees.
Happy and qualified employees (actual) (short-term):
A lack of training and skill development can negatively impact safety certifications, jeopardising operational compliance and career growth.
Negative effects of overtime (potential) (long-term):
Long working hours, particularly in offshore operations, can adversely impact employee health, especially in regions with weak labour protections.
Freedom of association, collective bargaining and social dialogue (potential) (long-term):
A lack of support for collective bargaining or weak union representation can negatively affect employee conditions, particularly in regions with limited freedom of association.
Negative impacts
Recycling of steel through decommissioning of vessels (actual) (short-term):
While vessel design can optimise steel reuse, Svitzer lacks direct control over this process, as decommissioning occurs further down the value chain when tugs or other vessels are sold to other operators.
Fuel oil use across value chain (actual) (short-term):
Significant indirect impacts stem from fuel oil consumption during vessel operation, construction of vessels and marine equipment, and the production of materials like steel.
Financial opportunities
Financial opportunities through lifespan expansion (medium-term):
Extending the lifespan of equipment reduces the need for new vessels, lowering both investment costs and life-cycle emissions.
Opportunities for the reduction of virgin steel use (long-term):
Replacing virgin steel with recycled steel in vessel construction can lower Scope 3 emissions, which is favourable to investors.
Right to equality (actual) (short-term):
The male-dominated history of the marine industry can contribute to wage inequality between men and women, perpetuating gender-biased disparities.
Lack of diversity (actual) (short-term):
Underrepresented and vulnerable groups may experience unequal treatment in the shipping / marine service industry, which could negatively affects Svitzer’s goal of fostering an inclusive environment and supporting innovation.
Safe working environment for employees (actual) (short-term):
Employees working on tugs and offshore vessels face health and safety risks, such as collisions, man overboard, fires and engine room accidents, and equipment malfunctions due to the dynamic marine environment and vessel operations.
Harassment and abuse (actual) (short-term):
Vulnerable and underrepresented groups (for example women, migrant workers, the LGBTQ+ individuals, etc.) face increased risks of harassment and violence in male-dominated sectors like shipping and marine, exacerbated by systemic discrimination and weak legal protections in some regions.
Risk due to digitalisation (actual) (short-term):
Increased data collection in the workplace can compromise employee privacy, particularly in regions with limited awareness of data protection laws.
Financial risks
Risks related to safety (short-term):
Inadequate safety management systems may result in increased insurance costs, medical expenses, and higher staff turnover.
Financial impact from breaches of privacy (medium-term):
Breaches in employee data protection, such as violations of GDPR regulation, could lead to fines up to 4% of the business’s total annual turnover or temporary or definitive bans on data processing.
ESRS S1 – Own workforce
Negative impacts
Employment security (potential) (long-term):
As a global operator, Svitzer operates and procures services in regions where there is an increased risk of labour rights violations, as indicated by international labour organisations. In those locations, workers in the upstream value chain are at a higher risk of job instability, lack of benefits, wage insecurity, limited career growth, increased stress, and vulnerability to exploitation.
Dangers in the value chain (potential) (long-term):
Workers in industries such as oil and gas extraction, shipbuilding, mining, and transportation are exposed to significant health and safety risks, including accidents with heavy machinery.
Equal pay and diversity (potential) (long-term):
Workers in our value chain may experience wage disparities based on gender, race, type of contract or ethnicity, along with lack of representation for marginalised groups e.g. women, migrant workers etc.
ESRS G1 – Business Conduct
Negative impacts
Being a leader comes with responsibilities (potential) (long-term):
As a major player in the towage industry, Svitzer influences corporate culture across its global operations and value chain. If values and beliefs are not effectively communicated, this could negatively impact business conduct and Svitzer’s licence to operate.
What happens without Speak Up (potential) (long-term):
A lack of whistleblower protection and reporting mechanisms could prevent individuals from feeling safe to voice concerns, undermining a safe and inclusive work environment. Failure to maintain a Speak Up-culture could harm both internal and external stakeholders.
High-risk geographies in own operations (potential) (long-term):
Financial risks
The risk of corruption in ports and terminals (short-term):
Corruption risks are heightened in ports and terminals, especially in some regions where Svitzer operates. Failure to prevent bribery could potentially result in economic losses, job cuts and instability.
Financial opportunities
The benefits of interactions with suppliers (medium-term):
Svitzer has the opportunity to strengthen its supplier relationships by upholding the Supplier Code of Conduct through audits and ensuring payment practices. Encouraging suppliers to adopt higher environmental and social sustainability standards can enhance Svitzer’s brand reputation and open new business opportunities, partnerships and investments.
Positive impacts
Customer dialogue (actual) (short-term):
Svitzer actively engages with its approximately 2,000 customers across 37 countries, gathering insights and encouraging feedback through dialogue and listening in each customer visit and meeting, online surveys and whistleblower system. This proactive communication helps improve the customer experience and ensures that services are tailored to customer’s needs, creating positive impact on information for end users.
Svitzer operates in several high-risk countries. In these regions, there is a increased risk of corruption and bribery, such as facilitation payments within the marine transportation and tugs value chain. Ports, acting as administrative monopolies over essential public services, can create a breeding ground for ‘coercive’ corruption. In these environments, government officials may extract bribes from companies for performing routine processes, such as vessel clearance.
incidents of corruption and bribery (potential) (long-term):
A potential negative impact has been identified in Svitzer’s value chain, where employees may be involved in corruption and bribery cases. This includes facilitation payments made during interactions with public authorities, particularly concerning licenses and permits for importation of tugs or spare parts.
Environment
75 ESRS E2 Pollution
77 ESRS E5 Resource use and circular economy
Our ESRS data reporting is based on the same principle as the financial statements in terms of scope and boundary setting. Hence, our quantitative data includes consolidated data from Svitzer Group A/S and subsidiaries. Data is collected per legal entity per activity, and the figures are consolidated line-by-line. This approach includes all quantitative reporting requirements in ESRS E1 Climate change, E2 Pollution and E5 Resource use and Circular Economy. ESG data for our joint ventures and associated companies are not reported, unless we have concluded to have operational control over the individual entity. Further, the phase-in specified in the ESRS 1 has been applied for Climate change, Pollution and Resource use & Circular Economy. Meaning that policies, actions, engagement and targets along with metrics may be omitted to various extent dependent on the specific area regardless of having identified an IRO.
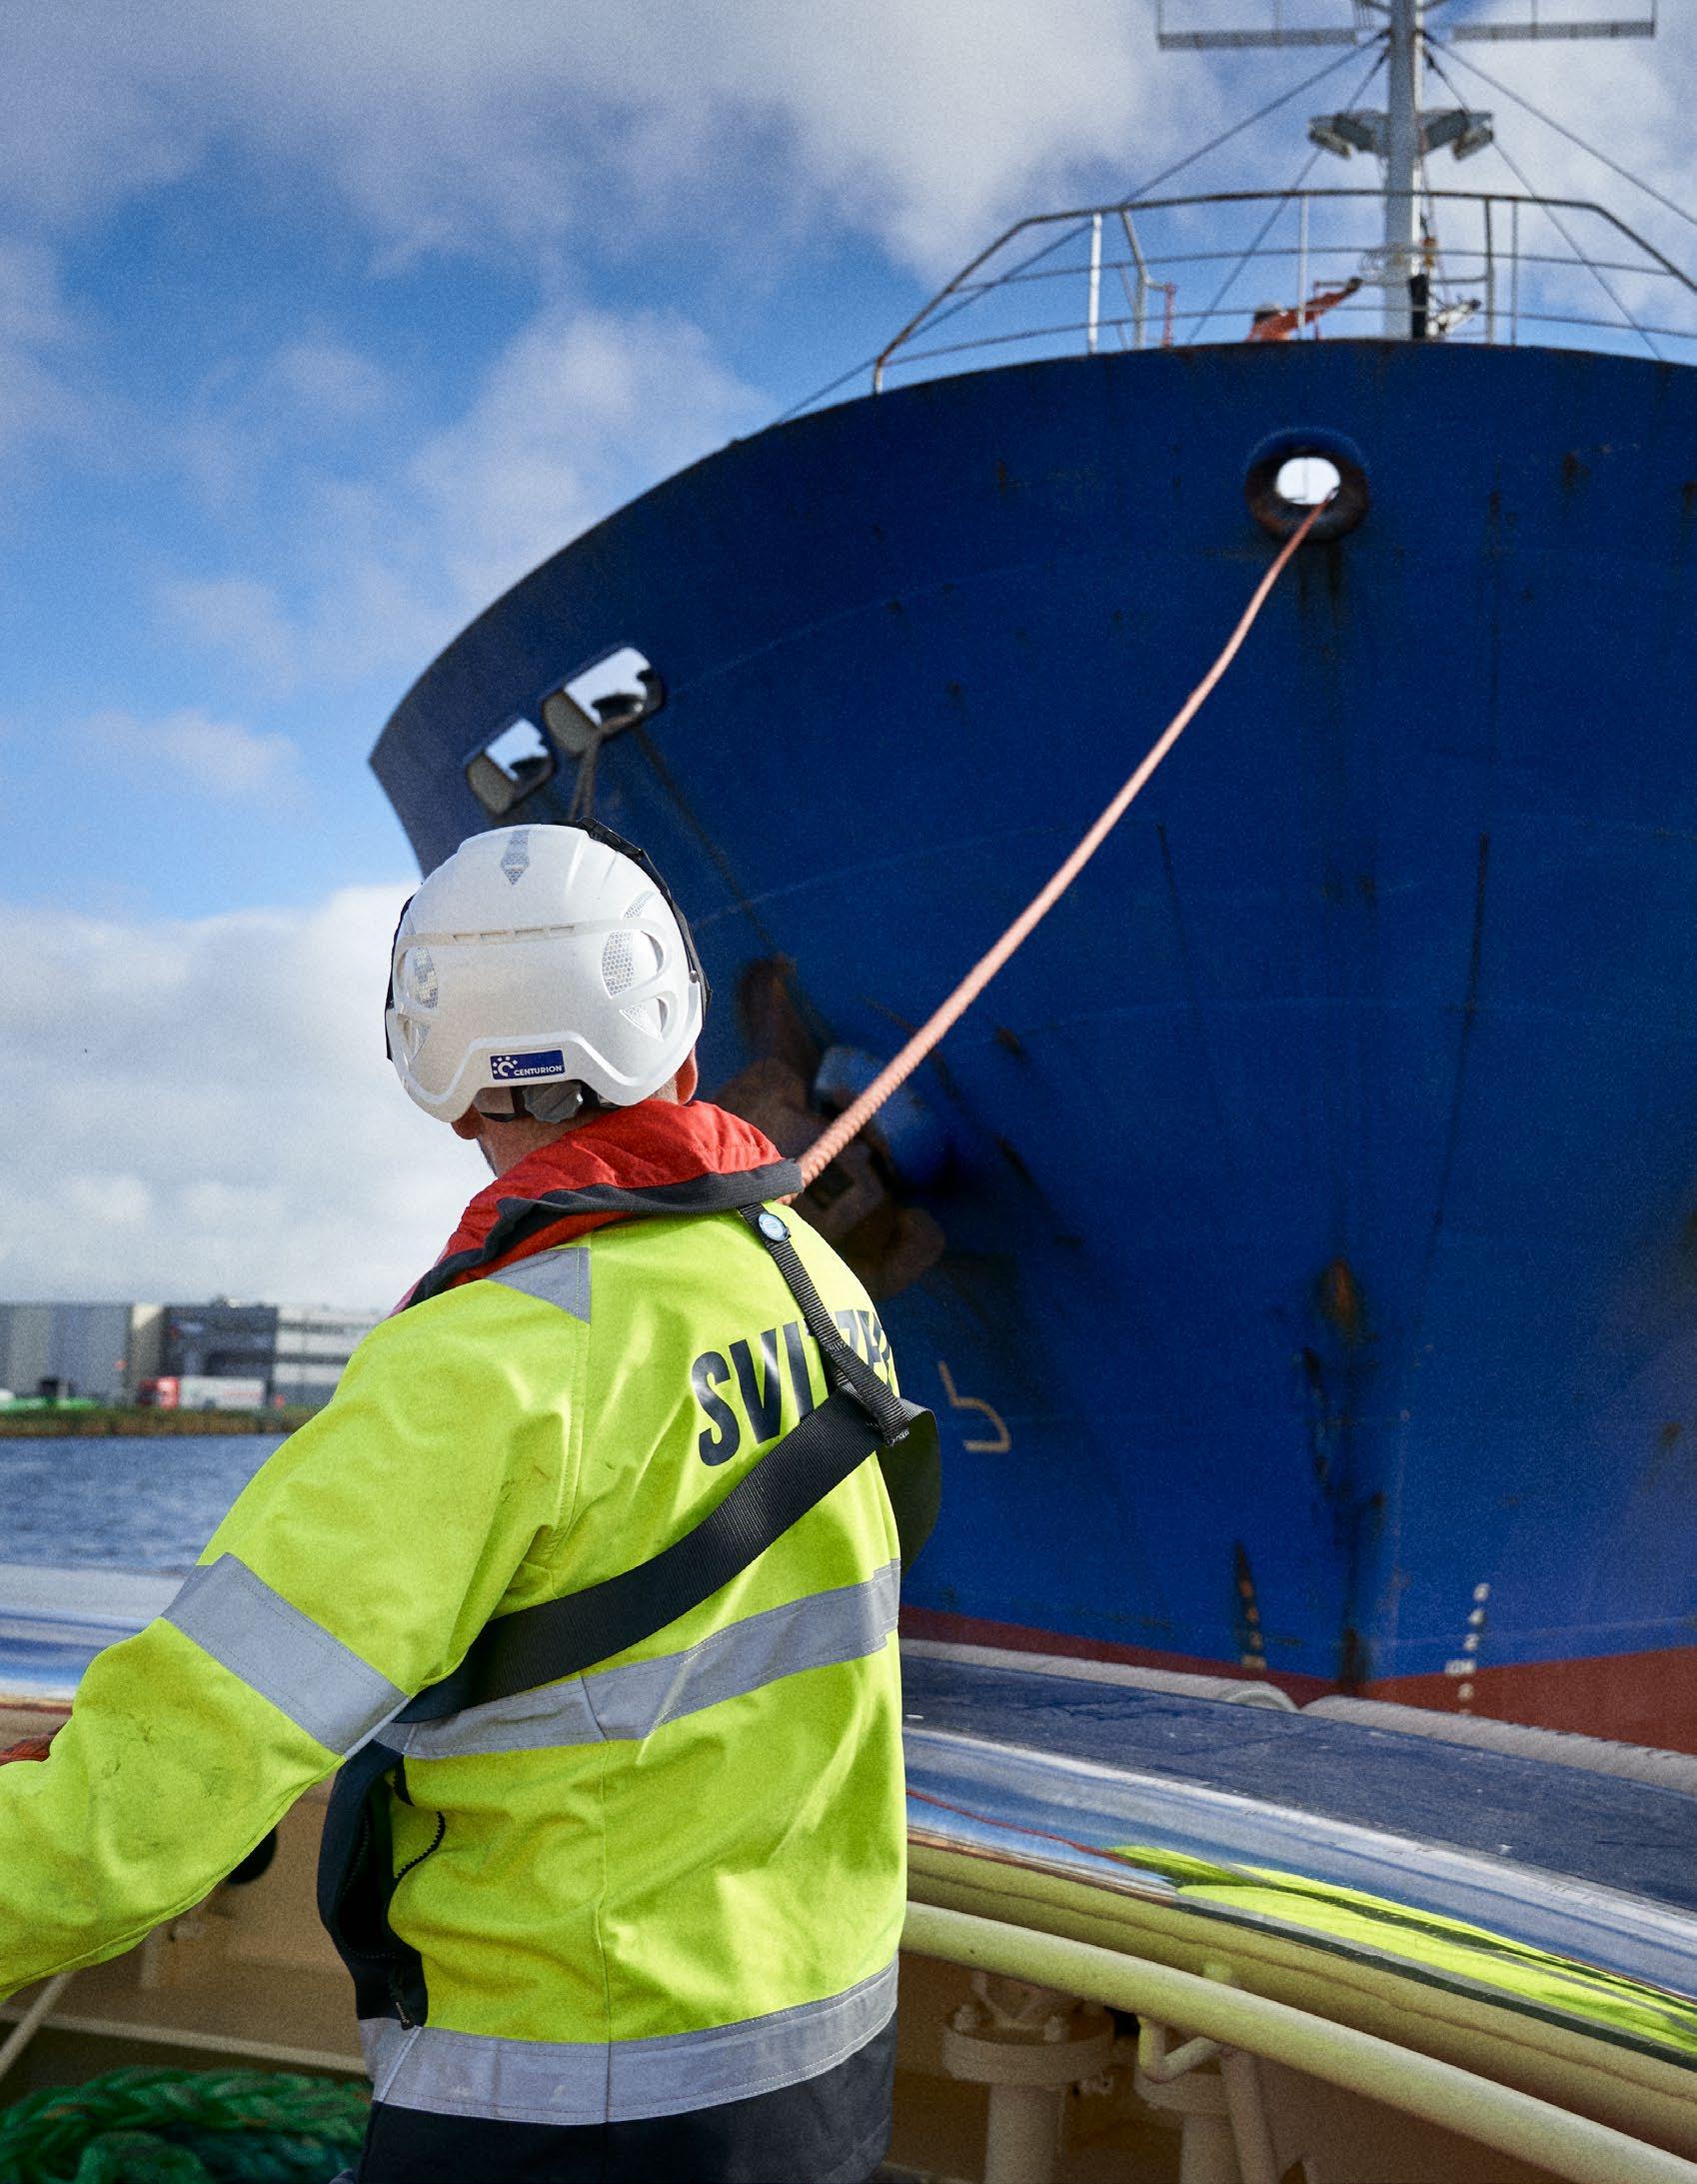
EU Taxonomy Reporting
As per Article 8 of the Delegated Act related to reporting under the EU Taxonomy regulation, as a non-financial listed company, Svitzer is subject to assessing the eligibility and alignment of its economic activities with the EU Taxonomy. This assessment was based on the activities outlined in the Annexes to the Climate and Environmental Delegated acts.
The European Union’s Taxonomy Regulation (EU) 2020/852 sets out a shared definition of “sustainability” with defined rules and criteria on which economic activities have the potential to be considered sustainable (Taxonomy-eligible) and which activities fulfill the requirements to be considered sustainable (Taxonomy-aligned).
In compliance with the EU Taxonomy and its supplementary delegated acts, in 2024, Svitzer has undertaken a complete assessment of our economic activities to determine their eligibility and alignment with the established sustainability criteria. We have evaluating our revenue, capital expenditure (CAPEX), and operating expenses (OPEX) associated with Taxonomy-eligible activities.
In general, we have executed a three-phase process for assessing compliance with the EU Taxonomy.
Taxonomy-eligible activities
First, Svitzer has performed a full screening of our economic activities against the eligible activities listed in the technical annexes of
the Delegated Acts. Subsequently, we have assessed how each identified economic activitiy matches with Svitzer’s operations. The result is a list of three activities in the Climate Delegated Act identified as eligible for Svitzer:
1. Transport by motorbikes, passenger cars, and light commercial vehicles (6.5): This refers to any CAPEX spend on leased passenger cars across Svitzer.
2. Sea and coastal passenger water transport, vessels for port operations and auxiliary activities (6.10): This refers to Svitzer’s business centred around the use and operation of tugboats to assist large seaborne vessels in manoeuvering in
and out of ports and terminals to berth and unberth. This activity is our primary source of Turnover, CAPEX and OPEX contributing to the numerator of the KPIs.
3. Data-driven solutions for GHG emissions reductions (8.2): Svitzer’s AI-based tracking tool Port Monitor has been active for driving our operational efficiency, and contributes partly to our OPEX plan.
To fulfill our reporting obligations, we have allocated the appropriate revenue, CAPEX and OPEX that are linked with the identified three activities.
Taxonomy-aligned activities
Finally, Svitzer has assessed the practicality of the data for our identified key areas where our activities contribute significantly to environmental objectives. However, due to challenges in ensuring adequate documentation to meet the stringent technical criteria, we have taken the conservative approach and assessed that, while certain activities are eligible, they do not fully align with the Taxonomy requirements at this time, particularly with the technical screening criteria, namely Substantial Contribution, Do No Significant Harm, and Minimum Social Safeguards. Consequently, we have reported no Taxonomy alignment for these activities for this reporting period. However, we remain focused and committed to working towards greater alignment as a part of critical port infrastructure with the EU Taxonomy in future assessments.
§ Accounting policies
Taxonomy eligibility is expressed with three KPIs, calculated as the part of turnover, CAPEX and OPEX that are Taxonomy-eligible.
• Turnover KPI: The proportion of Taxonomyeligible activities has been calculated as net turnover from products and services associated with Taxonomy-eligible activities, divided by total net turnover. The numerator refers to turnover generated from towage operations. The total turnover represents Svitzer’s total revenue, which can be reconciled with our consolidated financial statement, as shown in the income statement on page 115. The numerator is derived from our operations of vessels (6.10).
• CAPEX KPI 1: Eligible CAPEX is defined as Taxonomy-eligible CAPEX divided by total CAPEX. Total CAPEX includes additions to tangible and intangible fixed assets before depreciation, amortisation, and any re-measurements. It encompasses acquisitions of property, plant, and equipment, intangible assets, and leases. The related line items in the financial statements can be found in note 3.1 and 3.2. The numerator refers to eligible CAPEX plans that are primarily dedicated to purchasing, and leasing of vessels and secondarily related to leased cars.
• OPEX KPI 1: OPEX is defined as Taxonomyeligible OPEX divided by the total OPEX. Total OPEX includes short term lease agreements, repair and maintenance/costs and repairs, and any other direct expenditures related to the routine maintenance of tangible assets by the company or outsourced third parties necessary to ensure the continued and effective functioning of such assets. The numerator refers primarily to all short term lease costs and maintenance and repair of vessels and secondarily to data driven solutions for GHG (Green house gas) emissions which Svitzer has implemented.
Given that we have assessed all of our economic activities may have the potential to contribute to climate change mitigation, we have ensured that none of our identified economic activities contribute to multiple environmental objectives.
Double counting
Turnover: As part of consolidation process for financial reporting, intercompany accounts within Svitzer Group are eliminated in the consolidation system, which are reviewed on a monthly basis to ensure that the Group turnover reported is correct and complies with the IFRS accounting standards.
CAPEX: Svitzer does have internal sales between entities of vessels which can lead to sale of a vessel in an entity and capex from a different entity. Such transactions are eliminated on the group level, in line with IFRS requirements where for Svitzer Group, there is no sale/purchase of an asset. As these transactions are eliminated, such additions are also not considered as part of CAPEX reported. Asset categories for the CAPEX KPIs are distinctly different, there is no other risk of double counting CAPEX between the activities.
OPEX: None of the activities contribute to multiple objectives. Vessel-related OPEX is reported on other main accounts than the rest of the activities, thus reducing the risk of double counting.
1 The EU taxonomy uses a narrow definition of CAPEX and OPEX. Hence when referring to CAPEX, this only refers to CAPEX additions, and not all capital expenses, and when referring to OPEX, this refers to research and development, building innovation measures, short- term lease, maintenance and repair, and any other direct expenditures relating to the day-to-day servicing of assets of property, plant, and equipment; and not all operational expenses. For Svitzer, OPEX is defined as the short-term lease expenses , repair and maintenance expenses in relation to eligible and non-eligible activities.
Proportion of turnover from products or services associated with Taxonomy-aligned economic activities
A. TAXONOMY-ELIGIBLE ACTIVITIES
A.1.
A.2 Taxonomy-eligible, but not environmentally sustainable activities (Not Taxonomy-aligned activities)
and coastal passenger water transport, vessels for port operations and auxiliary activities
A. Turnover of Taxonomy-eligible activities (A.1+A.2)
B. TAXONOMY-NON-ELIGIBLE ACTIVITIES
of Taxonomy-non-eligible activities
The Code constitutes the abbreviation of the relevant objective to which the economic activity is eligible to make a substantial contribution, as well as the section number of the activity in the relevant Annex covering the objective, i.e.:
CCM Climate Change Mitigation
CCA Climate Change Adaptation
WTR Water and Marine Resources
CE Circular Economy
PPC Pollution Prevention and Control
BIO Biodiversity and ecosystems
For example, the Activity “Afforestation” would have the Code: CCM 1.1. Where activities are eligible to make a substantial contribution to more than one objective, the codes for all objectives should be indicated.
For example, if the operator reports that the activity “Construction of new buildings” makes a substantial contribution to climate change mitigation and circular economy, the code would be: CCM 7.1. / CE 3.1.
The same codes should be used in Sections A.1 and A.2 of this template.
Y Yes, Taxonomy-eligible and Taxonomy-aligned activity with the relevant environmental objective
N No, Taxonomy-eligible but not Taxonomy-aligned activity with the relevant environmental objective
N/EL Not eligible, Taxonomy-non-eligible activity for the relevant environmental objective.
Proportion of CAPEX from products or services associated with Taxonomy-aligned economic activities
A. TAXONOMY-ELIGIBLE ACTIVITIES
A.1. Environmentally sustainable
(Taxonomy-aligned)
A.2 Taxonomy-eligible but not environmentally sustainable activities (Not Taxonomy-aligned activities)
and costal passenger water transport, vessels for port operations and auxiliary activities
CAPEX of Taxonomy-eligible
B. TAXONOMY-NON-ELIGIBLE ACTIVITIES
of Taxonomy-non-eligible
The Code constitutes the abbreviation of the relevant objective to which the economic activity is eligible to make a substantial contribution, as well as the section number of the activity in the relevant Annex covering the objective, i.e.:
CCM Climate Change Mitigation
CCA Climate Change Adaptation
WTR Water and Marine Resources
CE Circular Economy
PPC Pollution Prevention and Control
BIO Biodiversity and ecosystems
For example, the Activity “Afforestation” would have the Code: CCM 1.1. Where activities are eligible to make a substantial contribution to more than one objective, the codes for all objectives should be indicated.
For example, if the operator reports that the activity “Construction of new buildings” makes a substantial contribution to climate change mitigation and circular economy, the code would be: CCM 7.1. / CE 3.1.
The same codes should be used in Sections A.1 and A.2 of this template.
Y Yes, Taxonomy-eligible and Taxonomy-aligned activity with the relevant environmental objective
N No, Taxonomy-eligible but not Taxonomy-aligned activity with the relevant environmental objective
N/EL Not eligible, Taxonomy-non-eligible activity for the relevant environmental objective.
Proportion of OPEX from products or services associated with Taxonomy-aligned economic activities
A. TAXONOMY-ELIGIBLE ACTIVITIES
A.1. Environmentally
(Taxonomy-aligned)
A.2 Taxonomy-eligible but not environmentally sustainable activities (Not Taxonomy-aligned activities)
and coastal passenger water transport, vessels for port operations and auxiliary activities
B. TAXONOMY-NON-ELIGIBLE ACTIVITIES
of Taxonomy-non-eligible activites
The Code constitutes the abbreviation of the relevant objective to which the economic activity is eligible to make a substantial contribution, as well as the section number of the activity in the relevant Annex covering the objective, i.e.:
CCM Climate Change Mitigation
CCA Climate Change Adaptation
WTR Water and Marine Resources
CE Circular Economy
PPC Pollution Prevention and Control
BIO Biodiversity and ecosystems
For example, the Activity “Afforestation” would have the Code: CCM 1.1. Where activities are eligible to make a substantial contribution to more than one objective, the codes for all objectives should be indicated.
For example, if the operator reports that the activity “Construction of new buildings” makes a substantial contribution to climate change mitigation and circular economy, the code would be: CCM 7.1. / CE 3.1.
The same codes should be used in Sections A.1 and A.2 of this template.
Y Yes, Taxonomy-eligible and Taxonomy-aligned activity with the relevant environmental objective
N No, Taxonomy-eligible but not Taxonomy-aligned activity with the relevant environmental objective
N/EL Not eligible, Taxonomy-non-eligible activity for the relevant environmental objective.
Svitzer takes a practical approach to decarbonisation, recognising that many necessary technologies are not yet widely available and will vary depending on fleet locations in the mid-to-long term. Our main objective is to manage the current and future fleet to reduce CO2e emissions in the most costeffective way. For existing vessels, Svitzer balances investments in upgrades and retrofits with the use of alternative fuels.
ESRS E1 – Climate change
Climate change
Climate change mitigation and energy consumption
Svitzer also focuses on improving the design of new vessels to incorporate advanced technologies and future-proof them for alternative fuels and electrification. This helps avoid stranded assets and maximises the use of the lowest costs, and lowest CO2 impact fuel throughout the vessel’s lifetime.
Svitzer operates in a high-climate-impact sector which makes climate a key material issue for the Company. Whilst climate change adaptation is not directly material to the business, Svitzer believes that the actions it takes to mitigate Climate Change impacts will have a cascading effect in preventing further challenges in the future. Svitzer allocates resources to effectively address its environmental material sustainability matters, which not only facilitate their comprehensive management, but also ensure that Svitzer’s response is aligned with best practices and organisational goals. Svitzer does not have internal carbon pricing and does not use GHG removal or carbon certificates.
Svitzer has not yet identified climate hazards, due to Svitzer not conducting consultations with its value chain and not performing climate scenario analysis focusing on high emissions or in line with limiting global warming to 1.5 celcius. This will be updated and addressed when Svitzer completes its climate transition plan, which is expected to be by 2026.
A detailed description of the DMA process identifying environmental material IROs is included in the General section.
Our approach and policies
Svitzer’s decarbonisation strategy, launched in 2022, aims to achieve decarbonisation targets through safe, innovative, and continuous improvements to its operations. This is further emphasised in the following policies.
• Environmental Policy: This policy provides the framework for the decarbonisation strategy and how Svitzer manages climate change impacts. The policy covers Svitzer’s focus areas for change: Improving behaviour to maximise efficiency, enhancing equipment and technical solutions, and transitioning to low-carbon fuels. The main objective of this policy is to propel Svitzer’s shift towards reduced (GHG) emissions and enhanced energy efficiency. Svitzer acknowledges the current policy does not include the deployment of renewable energy. However, there is a commitment to refine the policy in 2025 to address this aspect. The policy addresses the following IROs: GHG emissions in own operations and value chain, energy demand and consumption in own operations and value chain, and business opportunities through decarbonisation.
• Svitzer’s Sustainable Procurement Policy: This policy reflects our commitment to incorporating environmental considerations into our procurement processes as we continuously strive to improve. We aim to work collaboratively with our suppliers to encourage responsible practices, particularly in managing GHG emissions and protecting the environment. We expect suppliers to acknowledge and align with the principles outlined in our Supplier Code of Conduct. As part of this, we focus on fostering partnerships and encouraging mutual progress, recognising that challenges may arise along the way. Suppliers in higher-risk categories undergo targeted assessments, and where areas for improvement are identified, we will work together on practical and timely improvement plans. The policy addresses the following IROs: Raw Materials with high associated emissions risks and Climate regulation risk.
The policies are applicable to Svitzer and all subsidiaries and entities under Svitzer’s operational control, including their respective officers, board members, directors, and employees. The Executive Leadership Team approves and monitors the implementation of the policies.
Strategy
Svitzer’s decarbonisation strategy lays out the roadmap for addressing its principal impacts, opportunities and risks and provides
the foundation for the development of a Transition Plan. Svitzer expects to finalise a Transition Plan by 2026. The Transition Plan will include a climate risk, scenario risk and resilience analysis. Refer to page 20-21 for more details on Svitzer’s strategy, which incorperates its sustainability strategy.
Over the past three years, the priority has been to reduce Scope 1 emissions while Svitzer develops the tools and approaches needed to address Scope 2 and 3 emissions. Emissions linked directly to fuel consumption on board our vessels present the critical material risk to our business in terms of absolute impacts on the climate, and potential compliance risks expected through international or countrylevel regulation in the near future.
The following core principles are adopted as part of Svitzer’s decarbonisation strategy:
• Focus on three key areas for change –Behaviour, Equipment, and Fuel – allowing us to find immediate solutions while developing novel concepts and approaches enabling greater improvements in the future.
• Integrated approach following normal business procedures, e.g., business cases are developed for solutions to ensure they are sustainable. This includes accounting for potential carbon taxation where relevant.
Key Actions
Svitzer has taken the following steps in 2024, which it also plans to continue in the medium term:
• Scaling up and utilising biofuels across our fleet, including the use of HVO and Fatty Acid Methyl Esters (FAME) products directly reducing our CO2e emissions from a tank-to-wake perspective (Scope 1).
• Commercialisation of EcoTow and EcoBAF – our first green products to customers, providing tangible Scope 3 reductions for their GHG accounting.
• Development of the TRAnsverse tug design, anticipated to reduce fuel consumption of our fleet in the long term, with more compact designs expected to reduce material consumption for construction.
• Global roll-out of ‘Aim for 8’, a Svitzer global program to reduce the vessel speed to maximum 8 kn, to optimise mobilisation speeds to maximise efficiency and cut fuel consumption.
• Design and construction of the batterymethanol vessel, building our expertise to work with electrified vessels and methanol fuels to develop new low emission propulsion options.
The specific decarbonisation levers and the GHG emissions savings associated for Scope 1, 2 and 3 for each action will be included upon the finalisation of the transition plan. Our actions are part of fulfilling our ambitions in the policies and the target we have set for GHG reductions, energy efficiency and renewable energy. Svitzer is committing resources to its environmental GHG transformation. Svitzer realises that achieving these targets and completing these actions, will require significant capital and operational investments which will be considered by management, provided there is a sustainable business case. In 2024, Svitzer has spent DKK 981m in CAPEX and DKK 4,571m for OPEX.
Targets
In 2023, Svitzer independently established a baseline year in 2020 for reporting on our Carbon Intensity targets. Following the CSRD, Svitzer established a baseline year in 2023 for reporting on absolute GHG emission targets. Svitzer aims to achieve a significant reduction in emissions across all scopes by 2040, aligning with science-based net-zero objectives. To ensure continued progress and transparency in our decarbonisation journey, Svitzer has formulated a set of short-term targets for 2030, using the same KPIs to guide our 2040 ambitions.
The targets Svitzer has set are key to reducing the impact of our IROs and cover our full value chain. Svitzer’s decarbonisation
ESRS E1 – Climate change
strategy aims to reduce the Company’s carbon footprint and contribute to global efforts against climate change.
The targets for 2030 are:
• A 50% reduction in vessel carbon intensity (per gCO2e/kWh) by 2030, with 2020 as the base year.
• A total GHG emissions reduction of 33% for scope 1, 2 and 3 (against baseline 2023).
While our 2040 target is to achieve fully climate-neutral operations.
Svitzer expects to reduce its gross Scope 1 emissions by 100%, gross scope 2 by 100% and gross scope 3 by 95% from its baseline by 2040. For the remaining GHG emissions, Svitzer plans to offset them using carbon credits. The annual targets are set in a linear fashion to monitor progress towards the 2030
The strategy rests on two ambitious targets
Strong progress with a reduction of 17% by 2024
and 2040 goals, ensuring steady development through effective project management. Svitzer’s presented targets are provisional, formulated on the basis of a linear reduction framework. These targets are subject to a comprehensive reassessment following the finalisation of Svitzer’s climate transition plan by 2026.
Svitzer continues to advance its decarbonization strategy, prioritising aligning our operational achievements with value propositions which support our customers demand for Scope 3 reductions. We achieved a 17% reduction in carbon intensity, falling short of our ambitious 2024 target of 18%.
Svitzer remains committed to achieving its 2030 target of a 50% reduction in carbon intensity through embedding cost effective decarbonisation solutions in our organisation and aligning with cost competitive products and services for our customers.
E1-5
E1-5
E1-5
E1-5
consumption
E1-5
E1-5
§ Accounting policies
Carbon Intensity: Vessel efficiency metric measured in gCO2e / kWh, determined for each vessel under Svitzer’s Operational Control, based on the total fuel consumption and running hours for all engines installed on board. Total kW power installed is the sum of all engines Maximum Continuous Rating values for the vessels. GHG emissions are calculated using DEFRA emissions factors.
Bunker consumption: Total bunker or fuel consumption for all vessels that are under Svitzer Operational Control converted from liters to metric tons(mt) using DEFRA and ISO8217:2017.
Total energy consumption (MWh): The total energy consumption is calculated by adding the energy consumption from fossil fuel, converted into MWh using DEFRA factors, to the total energy consumption from fossil sources and the total renewable energy consumption, all measured in megawatt-hours (MWh).
Total energy consumption from fossil sources (MWh): All fossil-based energy consumption that is consumed/combusted for all assets and entities that are under Svitzer Operational Control reported in MWh. Includes (but not limited to) the following: a. Fuel Oil, incl, marine diesel oil, and petrol b. Electricity and heating from fossil sources, e.g. coal or natural gas (methane) using DEFRA factors.
Consumption and share from nuclear sources: All nuclear energy consumption that is consumed/ combusted for all assets and entities that are under Svitzer Operational Control reported in MWh and its share compared to Svitzer’s total energy consumption, based on local grid specifications.
Total from renewable sources (MWh): This encompasses all renewable energy consumption, including renewable electricity, heating and green fuels consumed on Svitzer-controlled vessels and/or shoreside installations and offices. Renewable energy consumption is split into: a. Renewable electricity including electricity from solar panels, wind turbines covering on-site self-generation and purchased electricity from the grid through RECs) b. Renewable heating which refers to heating energy sourced from renewable sources. c. Green fuels: Biofuel consumption.
Share of renewables (%): The share of renewable energy is the total MWh of energy produced or consumed through either solar installation or contractual commitment to source green energy via local grid mix (e.g. through PPA etc) divided by the total energy consumption in MWh.
Gross Scope 1 GHG emissions: Direct emissions reported based on the GHG protocol from Svitzer’s fuel consumption in liters of all vessels under its operational control, with direct GHG emissions converted to CO₂ equivalents using DEFRA emission factors.
Gross Scope 2 GHG emissions: Indirect emissions from purchased electricity and district heating are calculated by converting actual or estimated usage into emissions using national averages and location/ market-based IEA conversion factors.
� Location-based: Emissions calculated without considering renewable energy certificates (RECs) or power purchase agreements (PPAs), based on the national average emissions per location.
� Market-based: GHG emissions determined by the RECs or PPAs selected by Svitzer, or the residual mix for the remaining electricity emissions. For countries which do not disclose ‘residual-mixes’ Svitzer uses IEA location-based emissions factors to calculate emissions.
Scope 3: Value chain GHG emissions (scope 3 GHG) are the CO₂ equivalents from Svitzer’s value chain activities. Of the 15 scope 3 categories in the GHG Protocol, eight upstream categories and one downstream category are currently determined as applicable to Svitzer’s business model and activities. Value chain GHG emissions are in all reported categories based on financial spend data converted to CO2e emissions using CEDA emissions factors for the following scope 3 categories (except Category 3):
Category 1 – Purchased goods and services: Includes emissions from operational goods and services, such as overhead, administration, port costs, and vessel-related expenses.
Category 2 – Capital Goods: Emissions from capital expenditures, including new purchases, retrofits, and dry-docking costs, fully recognised in the year of investment.
GHG emissions
Due to current data
and limitations, it is not feasible for Svitzer to calculate indirect and value-chain biogenic
However, Svitzer is committed to enhancing data quality in the future to enable more accurate calculations and reporting of these emissions.
1 Scope 1 emissions consist of 592 tCO2e related to joint ventures.
2 Scope 2 emissions consist of 15 tCO2e as Gross location-based and 15tCO2e related to joint ventures.
Category 3 – Upstream Fuel- and energy-related activities (not included in Scope 1 or Scope 2): Upstream emissions from well-to-tank of the procured bunker converted from tonnes to CO2e using DEFRA emissions factors.
Category 4 – Upstream Transportation and distribution: Covers emissions from logistics and transportation of operational supplies, such as bunker fees, spare parts, port fees, and warehousing.
Category 5 – Waste generated in operations: Emissions from waste handling, including bilge water and general waste from offices and vessels.
Category 6 – Business Travel: Emissions from business travel, including crew and staff accommodation, flights, and other travel expenses
Category 7 – Employee commuting: Includes emissions for employee commuting based on expenses (e.g., car or train).
Category 8 – Upstream leased assets: Emissions from leased assets, such as external charters and replacement vessels.
Category 13 – Downstream leased assets: Emissions from assets leased to downstream entities.
The excluded categories are: Category 9: Downstream transportation and distribution, Category 10: Processing of sold products, Category 11: Use of sold products, Category 12: End-of-life treatment of sold products, Category 14: Franchises, and Category 15: Investments which have been excluded based on Svitzer not identifying business activities within them.
Direct biogenic carbon emissions: Following to the GHG Protocol, CO2 emissions from biomass are considered net-zero because the carbon absorbed during the growth phase equals the carbon released during combustion. The direct biogenic carbon emissions in CO2e are calculated using the total biodiesel consumption for all vessels that are under Svitzer Operational Control in liters and converting to CO2e using DEFRA biogenic emissions factors.
1 The
§ Accounting policies
GHG intensity: Svitzer follows ESRS E1-6, using net revenue as stated in the income statement of the annual report to calculate GHG intensity.
Location-based: Total scope 1, 2 and 3 (location-based) emissions, per unit of revenue.
Market-based: Total scope 1, 2 and 3 (marketbased) emissions, per unit of revenue.
Energy intensity: Svitzer considers all of its revenue and emissions as stemming from highimpact sectors including transportation and energy production and utilities, therefore the energy intensity is calculated as: the total energy consumption, per unit of revenue (in DKK), as stated in the income statement of the annual report.
Total non-renewable energy production (MWh): All fossil-based energy production that is produced/combusted for all assets and entities that are under Svitzer Operational Control reported in MWh.
Total renewable energy production (MWh): This encompasses all renewable energy production, incl. renewable electricity and heating which are produced by Svitzer PV’s.
Pollution
Pollution of air and substances of concern
In daily operations, Svitzer takes constant care to ensure operational practices minimise, reduce, and prevent negative environmental impacts. Svitzer aligns operations with local laws and regulations to ensure compliance with environmental requirements, as well as following relevant practices and guidelines to minimise impact on ecosystem health and biodiversity.
Despite this, Svitzer is mindful that our operations can have harmful effects on the environment, and we are careful to ensure that this area is recognised and treated as one where continuous improvement should be taken as standard practice.
Our approach and policies
Material air pollutants for Svitzer are fundamentally linked to the combustion of fuel in our vessels. This means that tracking fuel consumption and calculating Scope 1 emissions are intrinsically connected to the quantity of air pollutants generated. Svitzer pursues its pollution reduction goals through safe, innovative, and continuous
improvements to our operations as outlined in our environmental strategy. The approach is captured in the following policies:
• Environmental Policy: Covers how Svitzer measures, manages and prevents accidents related to substances of concern, such as oil spills. Furthermore, in daily operations, Svitzer takes constant care to ensure that its operational practices limit the risks of incidents that could impact the environment. This policy addresses the following IROs: Air Pollutants in our own operation and upstream, substances of concern from oil spills, and aims to reduce the financial risk associated with the reduction of air pollutants.
• Supplier Code of Conduct: Sets the minimum standards expected from our suppliers for managing their environmental issues.
• Sustainable Procurement Policy: Implements auditing procedures for suppliers and evaluates against the Supplier Code of Conduct.
• Svitzer procedures: Includes the Ship Recycling Governance Framework, Chemicals and Paint, and Inventory of Hazardous Materials. These procedures mandate expected practices and controls to prevent the misuse and loss of harmful substances into the environment.
The policies apply to Svitzer and all subsidiaries and entities under Svitzer’s operational control, including their respective officers, board members, directors, and employees. The Executive Leadership Team approves and monitors the implementation of these policies. Additionally, the Board of Directors also approves policies that are publicly available on the Company’s website.
Key Actions
Svitzer has taken the following steps in 2024, which it also plans to continue in the long term:
• Adhere to and comply with IMO Tier 1-3 emission control regulations, which include utilising IMO Tier 3 compliant engines for eligible vessels operating in ECA and
SECA zones. Furthermore, ensure Tier 3 ready vessels for retrofit optionality within the vessel’s lifetime, thereby reducing overall pollution.
• Collaborate with engine suppliers to develop next-generation fuel engines powered by methanol.
• Introduce battery-operated vessels into the fleet and identify battery and shore power opportunities to reduce fuel use, thereby reducing pollution from fossil fuel.
These actions will contribute to a reduction in fossil fuel consumption, leading to lower air pollution. Svitzer is committing substantial resources to its environmental pollution transformation. Svitzer recognises that achieving these targets and completing these actions will require significant capital and operational investments. These investments will be considered by management, provided there is a sustainable business case.
Strategy
Air pollutants are intrinsically linked to the combustion of fossil fuels. Therefore Svitzer’s decarbonisation strategy will directly impact total air pollutant emissions throughout the lifetime of a vessel. We will continue collaborating with suppliers and extend our consultations to include stakeholders within the value chain to develop effective solutions to mitigate air pollutants. Over the coming years, supplier engagement and the development of a Scope 3 and procurement strategy, alongside Svitzer’s existing sustainable procurement policies and Supplier Code of Conduct, will be essential tools for driving improvement in this area.
Targets
• Align with those stated for GHG pollutants.
• Svitzer is in the process of mapping consumables and other procured products which potentially contain or are associated with the emission of pollutants according to EC No 166/200 . While establishing clear targets, we are currently focused on ensuring full compliance with all relevant local regulations concerning environmental health and safety. Svitzer plans to have a target in place by 2026.
Even though Svitzer does not have specific targets relating to pollution, Svitzer monitors and tracks the emissions of SOx, NOx, PM10, PM2.5 and oil spills. By doing so, Svitzer directly addresses its IROs and tracks the effectiveness of its actions in reducing those pollutants.
Pollution metrics
§ Accounting policies
Pollutants: Amount of air pollutants emitted in relation to Svitzer’s operations, besides GHG emissions in kg[pollutant]/tonne fuel. The pollutants included are:
NOx: Calculated based on the fuel consumption for all vessels that are under Svitzer Operational Control multiplied by the relevant EMEP/EEA emission factor.
SOx: Calculated based on the fuel consumption for all vessels that are under Svitzer Operational Control multiplied by the relevant EMEP/EEA emission factor.
Particulate Matter (PM10): Calculated based on the fuel consumption for all vessels that are under Svitzer Operational Control multiplied by the relevant EMEP/EEA emission factor.
Particulate Matter (PM2.5): Calculated based on the fuel consumption for all vessels that are under Svitzer Operational Control multiplied by the relevant EMEP/EEA emission factor.
Substances of concern (Spills): Svitzer reports environmentally significant spills from our fleet. Each incident is recorded and conveyed by the technical manager assigned to the respective Svitzer operation, upholding our pledge to transparency and ecological responsibility of the vessel multiplied by the relevant EMEP/EEA emission factor. It is mandatory for our crews to report all oil spills according to our Incident Reporting and pollution response procedures.
Resource use and circular economy
Resource use and circular economy
Resource
input and resource output
At Svitzer, we recognise the critical importance of sustainable resource use and are committed to advancing circularity within our operations.
As a leading towage marine company, our extensive use of steel is a key focus area for our environmental initiatives.
Resource used by Svitzer’s suppliers is steel, which is essential for the production and replacement of parts for the vessels operated by Svitzer. As steel is the only resource deemed material by Svitzer, we are committed to reporting both the aggregate quantity and the proportion of steel dispatched for scrapping, providing transparent data on the total amount of steel utilised and the relative share of this key resource.
Our approach and policies
Svitzer manages assets according to the 4R Principle – Reduce, Retrofit, Redeploy and Recycle – to maximise vessel lifetime and minimise resource consumption across the fleet. Through this approach the aim is to:
• Maximise the life of the vessel while meeting customers’ operational needs by ensuring Svitzer has the right vessel design and age for the port requirements.
• Identify opportunities to utilise remanufactured equipment.
• Drive carbon cost of ownership down through smart procurement practices.
• Minimise waste through vessel optimisation.
• Responsible sale and purchase of ships and recycling of retired vessels. Additionally, we are enhancing our end-of-life vessel recycling programme, ensuring that our retired tugboats are dismantled responsibly and their materials repurposed effectively.
This ensures that Svitzer continues to provide safe and efficient marine services to customers, making the best use of our resources.
• Environmental Policy: Provides the framework for managing waste and resource consumption to minimise emissions. This policy focuses on increasing the incorporation of recycled steel into our new vessels and reducing reliance on virgin materials. This policy addresses the following IROs: opportunities for reducing virgin steel use and fuel oil consumption across the value chain.
• Supplier Code of Conduct: Sets minimum standards expected from our suppliers for the management of environmental issues.
• Sustainable Procurement Policy: Defines sustainability standards and establishes processes to ensure suppliers comply with the Supplier Code of Conduct and broader sustainability goals.
• Svitzer procedures: The Ship Recycling Governance Framework establishes minimum requirements for vessel recycling. This policy covers the following IROs: Recycling of steel through decommissioning of vessels and financial opportunities through lifespan expansion.
These policies apply to Svitzer and all subsidiaries and entities under Svitzer’s operational control, including their respective officers, board members, directors, and employees. The Executive Leadership Team approves and monitors the implementation of the policies. The Board of Directors also approves policies, which are publicly available on the Company’s website.
Key Actions
Svitzer has taken the following steps in 2024, which it also plans to continue in the long term:
• We are establishing close partnerships with suppliers and customers to deliver low-carbon solutions and bring future technologies closer to our fleet.
• A Life Cycle Analysis (LCA) on a representative tugboat from Svitzer’s fleet has been conducted. These environmental impacts across its lifecycle, from construction to operation and decommissioning. This LCA serves as the foundation for our environmental impact baseline and provides a reference point for validating emission estimates derived from financial data. The LCA is expected to be continually reviewed and updated.
• Svitzer is engaged in ongoing dialogue and cooperation with shipyards and material suppliers to explore the integration of recycled materials into our vessel procurement process. Additionally, we are collaborating with equipment suppliers, shipyards and naval architects to develop and optimise electrified solutions and methanol-fuelled high-speed engines. This approach is also adopted with customers, ensuring that our existing fleet is progressively updated and that new vessels tendered for business benefit from decarbonisation from day one.
• Svitzer has initiated the development of Scope 3 procurement guidelines aimed at reducing CO2 emissions by increasing the use of recycled materials in our purchased goods and services. We expect to scale up these efforts in 2025 following the success of our initiatives in working with remanufactured parts and recycling waste oil products over the past few years.
Svitzer is committing resources to its environmental circularity transformation. Svitzer recognises that achieving these targets and completing these actions, will require significant capital and operational investments. Management will evaluate these investments to identify sustainable business cases.
Strategy
Svitzer is committed to providing sustainable marine services through the responsible use of resources and the adoption of circular economy principles. Our strategy is centred on leveraging data-driven insights and fostering collaborative partnerships to drive environmental advancements. By focusing on key materials such as steel, we aim to significantly reduce our ecological footprint, decrease the use of virgin resources, and lead the way in sustainable maritime practices.
• Utilising the insights from the LCA and financial analyses to establish a robust baseline, identifying key areas for environmental improvement.
• Establishing strategic partnerships with critical suppliers, especially those providing critical goods and materials, to explore opportunities for increasing the recycled content.
• Prioritising steel as a focal material, with the goal of enhancing the sustainability of its production process and reducing its overall environmental footprint.
Targets
Svitzer has not yet defined targets regarding resource use. However, our approach involves purchasing vessels with the intention of operating them for at least 25 years. We will implement resource use and circular economy targets in 2026, following the identification of decarbonisation levers in the transition plan.
VD
E5-4
E5-4
E5-4
VD
1 VD – Voluntary disclosure. Resource use
Inflow
§ Accounting policies
Resource use Inflow
Total weight of products and technical and biological materials used in the reporting period: As steel is the only material deemed material by Svitzer, Svitzer is to report on the total amount of steel used in vessels under operation control which were added to the fleet in the reporting period.
Percentage of biological materials used in the reporting period: Sum of all biological materials including biofuels for non-energy as a percentage of total weight of products and technical and biological materials used in the reporting period.
Total weight of secondary reused and recycled material Total amount of recycled steel used by Svitzer and its suppliers for the production and spare parts for its vessel fleet.
Total share of secondary reused and recycled material: Share of recycled steel used by Svitzer and its suppliers for the production and spare parts for its vessel fleet.
Resources use outflow
Total amount of materials that have left the fleet in the reporting period: As steel is the only material deemed material by Svitzer, Svitzer is to report on the total amount of steel used in vessels which left the fleet in the reporting period, either by being sold to other companies or by scrapping.
Total amount and share of steel sent for scrapping: As steel is the only material deemed material by Svitzer, Svitzer is to report on the total amount of steel used in vessels which left the fleet in the reporting period and was sent to scrapping, as share and as total amount.
Social
81 ESRS S1 Own workforce 96 ESRS S2 Workers in the value chain 98 ESRS S4 Consumers and end users
Our ESRS data reporting follows the same principles as financial statements regarding scope and boundaries. Therefore, our quantitative data includes consolidated figures from Svitzer Group A/S, and its controlled subsidiaries.
Data is collected by legal entity per activity, then consolidated line-by-line. This approach covers all quantitative ESRS
S1 reporting requirements for Own Workforce, except for Health & Safety. Health & Safety data includes fatalities from both Own Workforce and Workers in the Value Chain, ensuring compliance with ESRS standards. However, for work-related injuries, Svitzer voluntarily reports on joint ventures under Workers in the Value Chain if the workers are covered by Svitzer’s health and safety management system. Additionally, we have applied the phase-in approach specified in ESRS 1 for areas such as Characteristics of non-employees, Collective bargaining coverage and social dialogue, Social protection, Training and skills development, and Health & Safety. This means that policies, actions, engagement, and targets, along with related metrics, may be partially omitted depending on the specific area, even if an IRO has been identified.
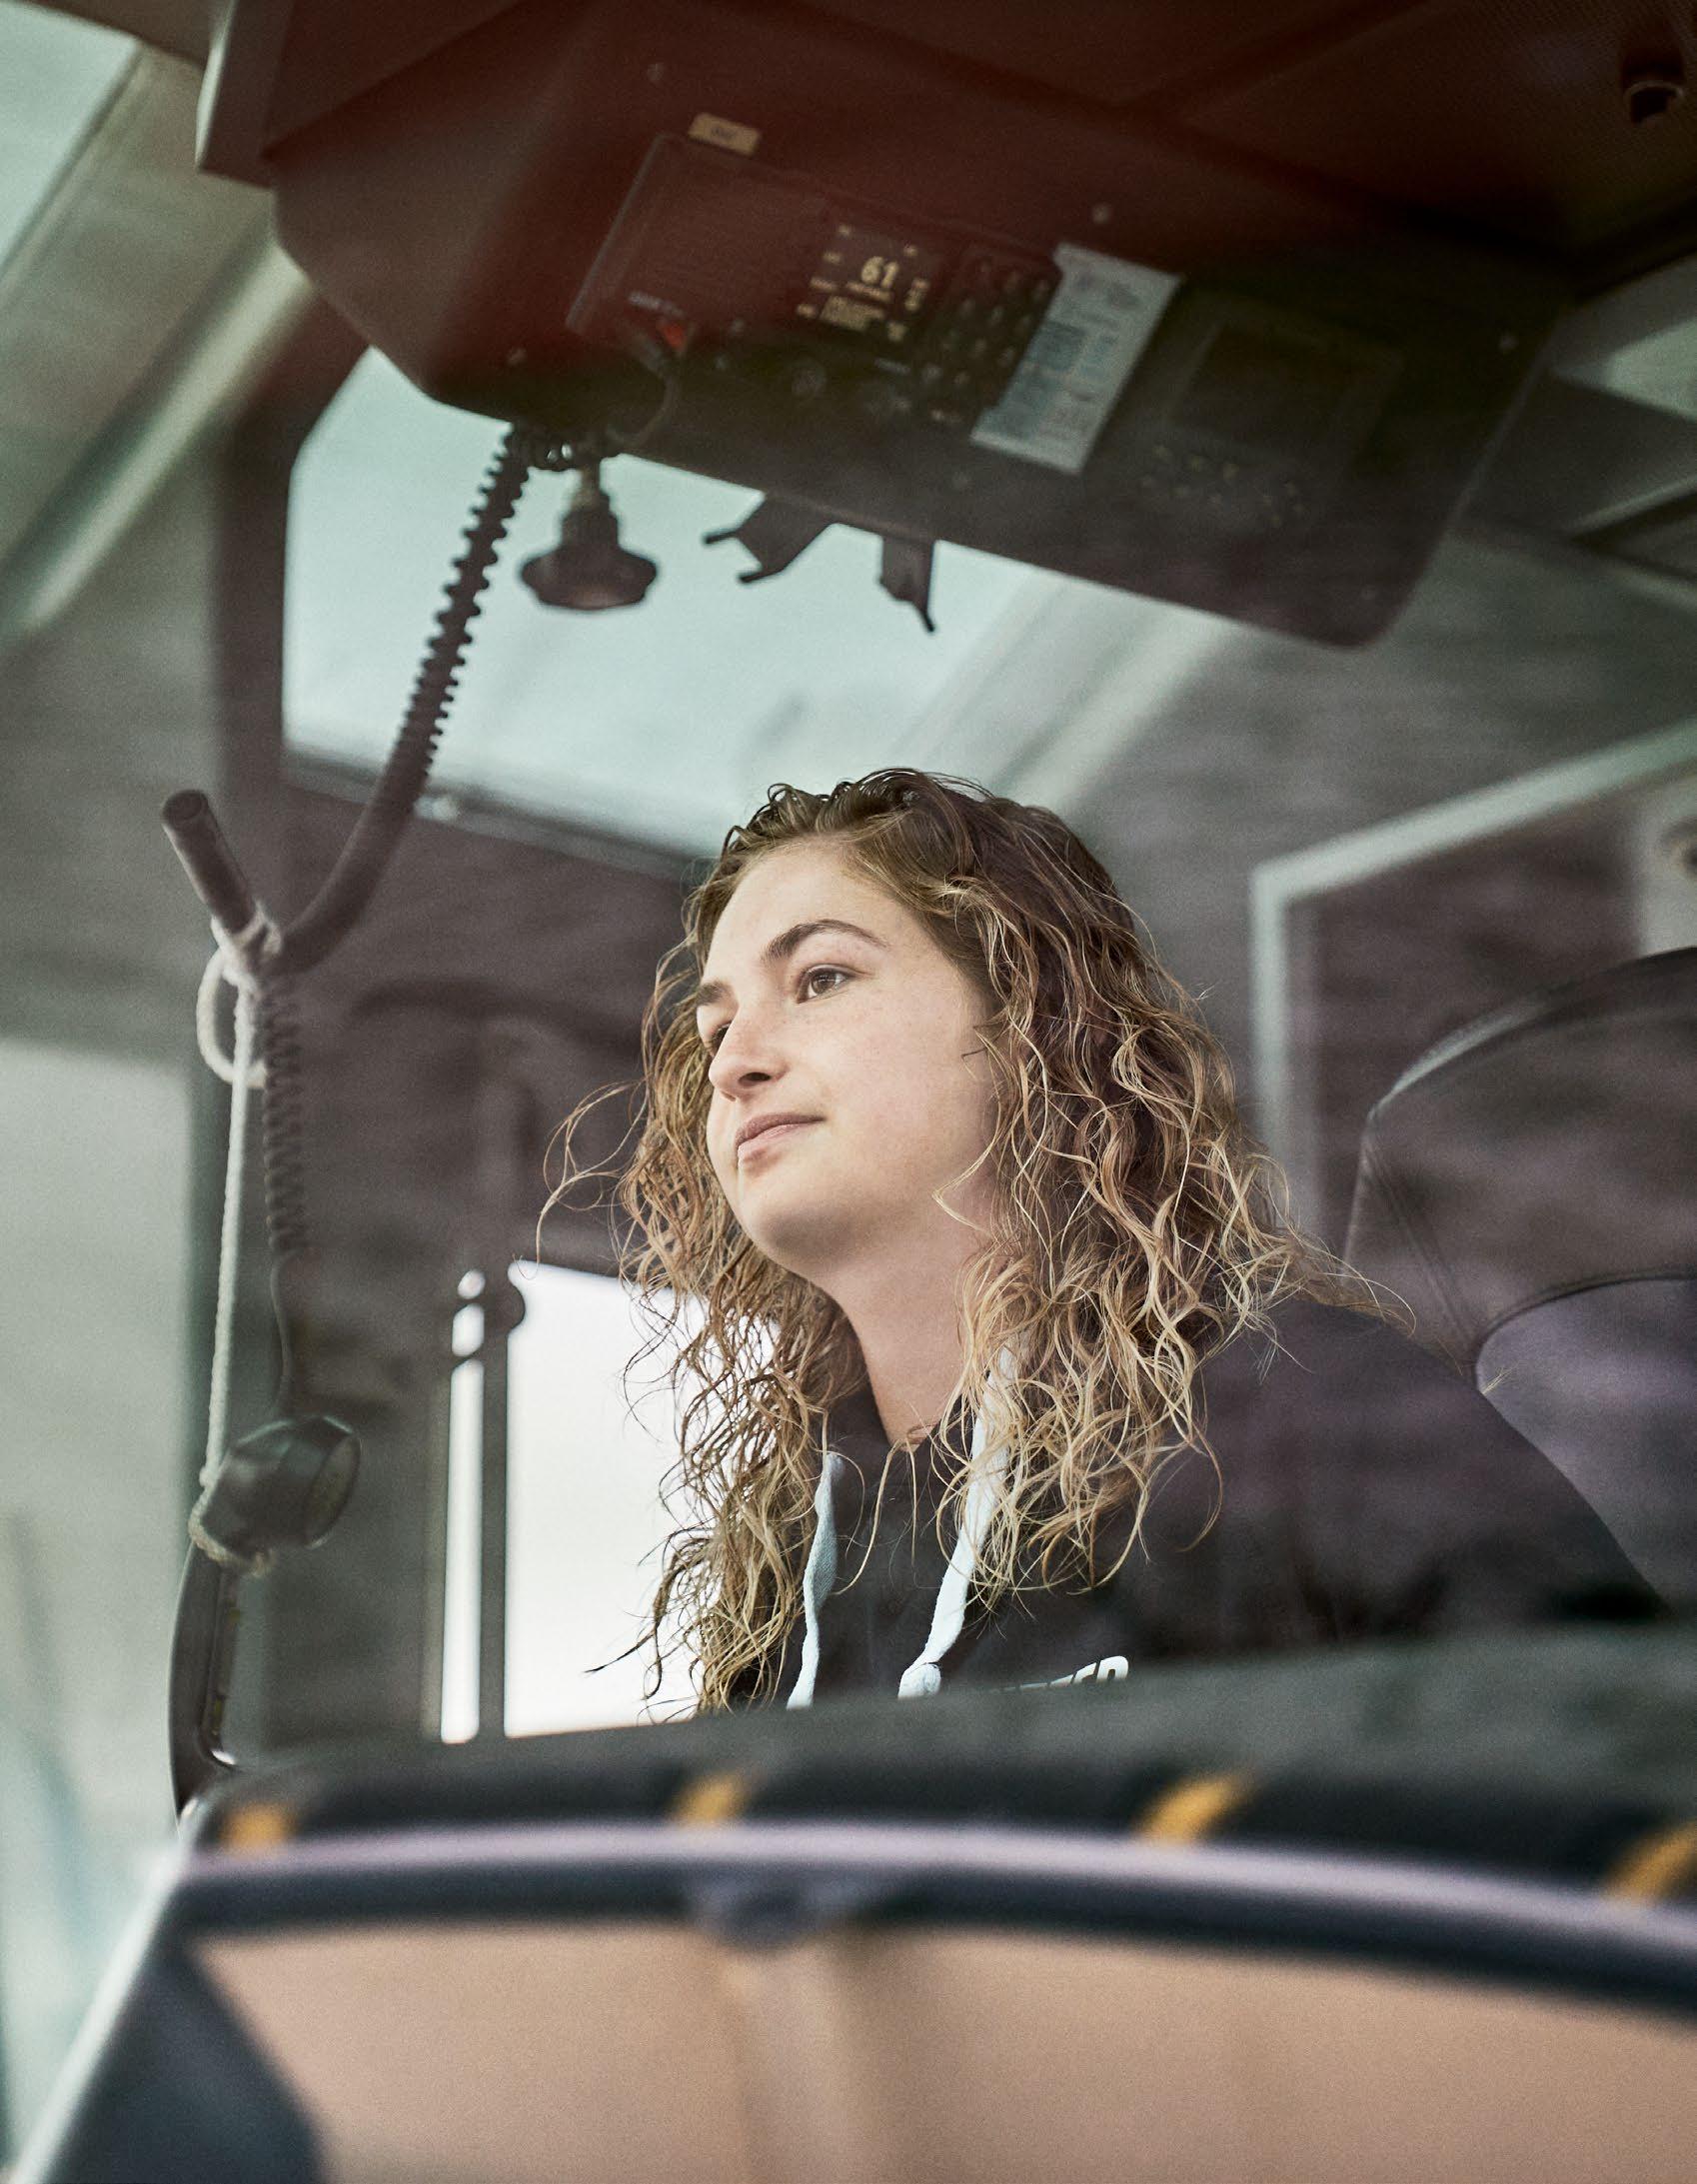
Own Workforce
Our people
Thriving People is integral to Svitzer’s strategy, reflecting our commitment to fostering an inclusive, diverse, and safe workplace where individuals can perform, grow, and thrive.
People are at the centre of everything Svitzer does, and both our employees and nonemployee workers (Our Workforce) are impacted daily by our key activities. Svitzer defines employees as those who have a direct employment contract with a Svitzer entity and are on its payroll, regardless of their employment type (permanent, full time, part-time, fixed-term, casual, or temporary). Non-employee workers, on the other hand, are workers who perform tasks that our employees would otherwise undertake but are not directly employed by us. This category includes labour-hire crew, agency workers, self-employed individuals, and subcontractors providing similar services on our vessels.
As a global operator, Svitzer recognises that non-employees may experience less favourable employment conditions than regular employees, particularly in countries with weaker contractual protections. This issue is amplified in the marine and transportation sector, where long working hours and overtime can adversely affect the workers physical and mental health, especially those working offshore.
Svitzer acknowledges these potential and actual issues within our sector and strives to foster a culture that promotes secure employment for all members of Our Workforce. Svitzer is committed to ensuring that working hours align with national legislation. Additionally, Svitzer actively engages with employee representatives and recruitment agencies to better understand the challenges Svitzer faces, particularly in towage operations, which can entail risks.
Our approach and policies
To achieve its strategic and ESG priorities, Svitzer depends on its ability to attract and develop people with the expertise and mindset that align with its business goals. Maintaining engagement through a positive experience at Svitzer is essential. Svitzer believes that enhancing the people experience directly contributes to improved performance and, ultimately, leads to a better customer experience. Our aim is to create an engaging workplace where our people thrive and feel a deep sense of belonging.
The Chief People Officer represents Svitzer’s most senior role with operational control responsibility for ensuring employee engagement.
In 2024, as Svitzer became a standalone company, we maintained a strong focus on people and culture. Svitzer remains focused on ensuring appropriate working conditions, secure employment, and suitable working
hours. Our Code of Conduct includes provisions for secure employment and appropriate working hours in accordance with local legislation and various collective bargaining agreements. Together with other specific policies referred to in different sections, the Code of Conduct addresses all IROs related to employees.
Key Actions
Svitzer engages with its people regularly and takes actions throughout the year to improve conditions for members of Our Workforce. Our annual engagement initiatives are designed to address identified negative impacts within our sector. Svitzer tracks and assesses all implemented actions throughout the year to ensure it achieves specific results, supporting its ambition to foster Thriving People.
ESRS S1 – Own Workforce
Svitzer has taken the following steps in 2024, which it also plans to continue in the medium term:
• A biannual employee engagement survey directed to employees, selected non-employee workers and selected workers in the value chain (People Pulse) complemented by other qualitative data to gain actionable insights for improving engagement. The People Pulse survey is an integral part of our operations, as Svitzer equally values people and customer feedback. Our Net Promoter Score (eNPS 1) for 2024 is 38 which is in the top quartile across global companies.
• People Performance Management (covering employees, selected non-employee workers and selected workers in the value chain) to support and document people performance and growth implemented and supported by our global People IT system.
• Leadership development programme for both formal and informal leaders across the organisation, initiated and progressed across Svitzer’s four regions and head office.
• Monitoring of employee turnover, talent reviews, promotions, and succession planning to ensure transparency, accountability, awareness of biases, and to identify areas for improvement.
• Exit interviews and tracking of reasons for leaving through our People IT system to continuously improve our position as an employer.
Targets
We embrace our ambition of Thriving People. Svitzer aims to foster a working culture that meets or exceeds national requirements and achieves positive results in employee engagement surveys. While Svitzer does not currently set specific targets for its employee engagement surveys, we closely monitor survey responses, exit interviews and general feedback for any indications that further attention may be required, and for consideration in future target setting. Results of the engagement survey also help us identify learnings and areas for improvement.
Once a target is set, the responses will also be used to track and assess performance against target.
1 This score is calculated by substracting the percentage of detractors (employees that responded between 0 and 6 to the question ‘How likely are you to recommend Svitzer as a place to work?’) from the percentage of promoters (employees that responded 9 or 10). For 2024, the results include responses from employees, select non-employee workers and select workers in the value chain.
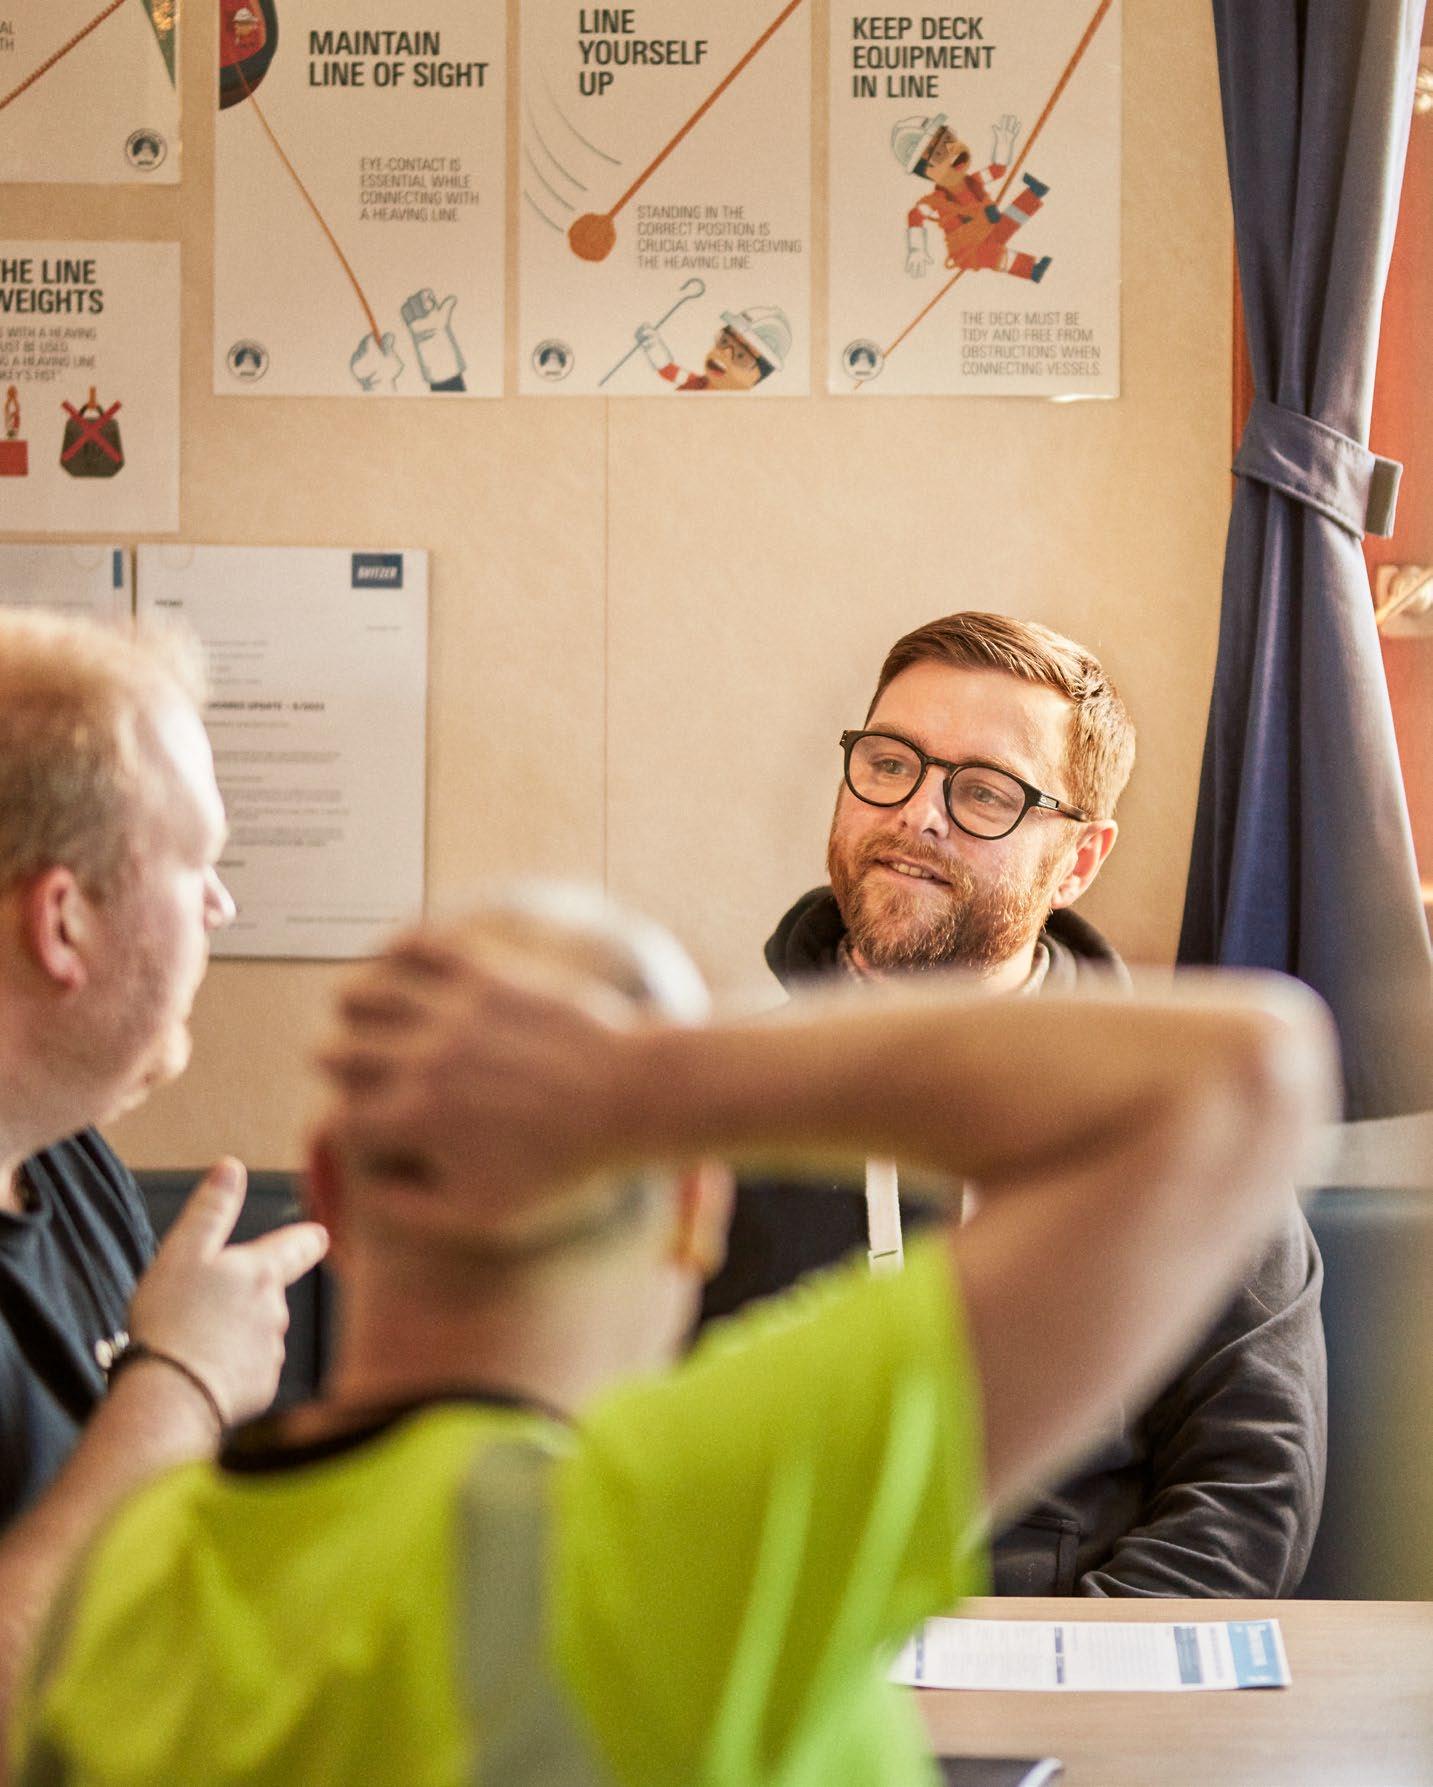
ESRS S1 – Own Workforce
Employee headcount by gender
Employee headcount in countries where Svitzer has at least 50 employees representing at least 10% of its total number of employees
§ Accounting policies
Total number of employees (headcount) is determined as of 31 December. This includes those on garden leave or unpaid leave. This also includes employees who have been made redundant or whose employment has been terminated until the expiry of their notice of termination period (even if they have left the Company). It also includes casual employees even if they are inactive.
Average employee headcount is calculated as the average number for each legal entity throughout the year. These averages are derived from measurements taken at the end of each month.
Employee headcount by employment type (e.g., full time, part time, casual, fixed term, etc.), broken down by gender. The definitions are to be used as per the national legislation of the countries where the employees are based to calculate country-level data.
Total number of turnover: the number of employee headcount that have left the Company throughout the reporting year (as at 31 December), consisting of employees who have for example left voluntarily or involuntarily (e.g. termination).
Turnover rate: the number calculated by taking the number of employees that have left the Company throughout the year, divided by the Average employee headcount.
S1-6
1
Workers representation and open dialogue
With operations across 33 countries in the marine services sector, collective/enterprise bargaining agreements are vital for many of our people. Labour unions, social dialogue, and freedom of association play crucial roles in representing Svitzer workers’ interests and negotiating wages and working conditions.
Our approach and policies
At Svitzer, we respect the right of Our Workforce to freely associate, form or join organisations of their choice, and engage in collective bargaining. They also have the right to abstain from such activities. Svitzer recognises the importance of conducting collective bargaining with representatives from legally recognised trade unions. Our Code of Conduct emphasises that freedom of association, social dialogue, and collective bargaining are key for a secure work environment. Svitzer regularly engages with employee representatives to identify potential issues and high-risk locations. This covers the IRO: Freedom of association, collective bargaining and social dialogue.
Key Actions
Svitzer has taken the following steps in 2024, which it also plans to continue in the long term:
• Regular engagement with local unions and global union associations on key labour issues.
• Processes in place to ensure potential members of Our Workforce are not pressured regarding their rights to association, particularly in interviews where union delegates may be present.
Target
Svitzer does not set a specific target regarding freedom of association, as that would contradict our policy of promoting this right. Svitzer cannot encourage or discourage employees from exercising this right.
For 2024, 58% of our employees are covered by collective bargaining agreements at a global level.
§ Accounting policies
Collective bargaining coverage is based on the number of employees covered by a collective bargaining agreement as of 31 December as a percentage.
1 Svitzer does not have significant employment in the European Economic Area (EEA).
Diversity
In the marine and transportation industry, underrepresented and vulnerable groups are at risk of negative impacts if not addressed. These groups often face unequal treatment, especially in historically male-dominated environments like Svitzer’s sector. Diversity, Equity, and Inclusion (DEI) are essential to us, and Svitzer is committed to fostering an inclusive atmosphere that reflects the diverse society Svitzer serves, supports innovation, and protects the well-being of underrepresented groups.
Our approach and policies (Diversity in accordance to 107d)
To advance our commitment to diversity and inclusion, Svitzer’s Diversity and Inclusion Policy is built on four key pillars: Engaging the organisation; building capabilities; reinforcing diversity throughout the employee experience; and measuring progress for transparency and accountability. This policy covers all Svitzer employees globally and the following IROs: Right of equality and lack of diversity. The policy is approved by the Board of Directors and Svitzer’s Chief People Officer monitors and ensures its implementation.
Svitzer is dedicated to creating a diverse and inclusive workplace where every individual feels valued, regardless of gender, age, nationality, sexual orientation, or other dimensions of diversity. Svitzer actively
monitors gender representation across all employee processes, from recruitment to performance reviews, to promote greater gender balance, especially in senior leadership roles. Svitzer is also committed to treating all employees equally, ensuring employment conditions that comply with local legislation and regulations and prevent gender-biased discrimination.
Key Actions
Svitzer has taken the following steps in 2024, which it also plans to continue in the medium term:
• Ensuring job ads reflect our diversity and inclusion commitment by screening for non-inclusive language.
• Collaborating with educational institutions across regions to promote opportunities and attract more diverse candidates.
• Mandatory anti-bullying and harassment training as part of our Code of Conduct
• Unconscious bias training.
• Tracking the perception of equal opportunities in our People Pulse survey.
• Launching a Female Leadership Development Programme Pilot in collaboration with Women’s International Shipping and Trading Association (WISTA).
• Promoting women in leadership and female talent internally and externally through platforms like LinkedIn and Women in Shipping (WIS).
Targets
Svitzer has set ambitious gender diversity targets to ensure accountability in our diversity, equity and inclusion agenda. By 2025, Svitzer aims for 40% representation of the underrepresented gender at both the Executive Leadership and Senior Leadership levels. For 2024, Svitzer has achieved a 32% gender diversity in the global leadership team, which is a positive progress towards the 40% target.
Additionally, Svitzer targets a 10% year-onyear increase in the share of underrepresented gender among crew employees.
No internal stakeholders were consulted on these targets. We committed to these targets which were set by A.P. Moller - Maersk prior to the demerger and we have subsequently obtained commitment with all regions. ESRS S1 –
• Engaging all regions to enforce global diversity policies and encouraging local initiatives.
Progress for the 40% target is monitored on a quarterly basis. The progress on the 10% target is tracked annually in percentage using data from our People IT system.
Increasing gender diversity in maritime roles presents unique challenges due to the physical demands, long shifts at sea, and a historically male-dominated workforce. Cultural norms and the absence of female role models also deter women from entering the field. Despite these barriers, Svitzer has made great progress on its 10% year-onyear growth target for crew, with female representation exceeding the target with +6% to a 16% growth in 2024.
Gender representation in Svitzer Group
in Svitzer Group A/S
Board of Directors
S1-9
1 This is considered equal representation according to the Danish Business Authority’s applicable guidelines.
2 Target set by the Danish authorities for Executive leadership team and Senior leadership team.
3 The Target is for both Global Executive Leadership Team and Svitzer Global Senior Leadership Team collectively.
§ Accounting policies
Employee headcount total at Executive Leadership Team: Total employee headcount as of 31 December. Svitzer Executive Leadership Team includes the Executive Management (currently the CEO and CFO), and other members of Svitzer’s Executive Leadership Team.
Employee headcount total for Senior Leadership: Total employee headcount as of 31 December. Svitzer Senior Leadership means the direct reports of Executive Leadership who have direct reports themselves.
Percentage of gender distribution in Executive Leadership Team: Gender distribution based on the Total Employee head count as of 31 December as a percentage. Executive Leadership Team includes the Executive Management (currently the CEO and CFO), and other members of Svitzer’s Executive Leadership team. Underrepresented gender in Executive Leadership Team /employee headcount in Executive Leadership Team x100
Percentage of gender distribution in Senior Leadership: Gender distribution based on the Total Employee head count as of 31 December as a percentage. Underrepresented gender in Senior Leadership / employee headcount in Senior Leadership x100
Age distribution: Age distribution is based on the number of employees head count of 31 December
Crew gender diversity includes diversity of all of crew employed directly by Svitzer or any of its subsidiaries globally. It is calculated as follows: [(FY 2024 Female Crew number – FY 2023 Female Crew number)/ FY 2023 Female Crew number*100].
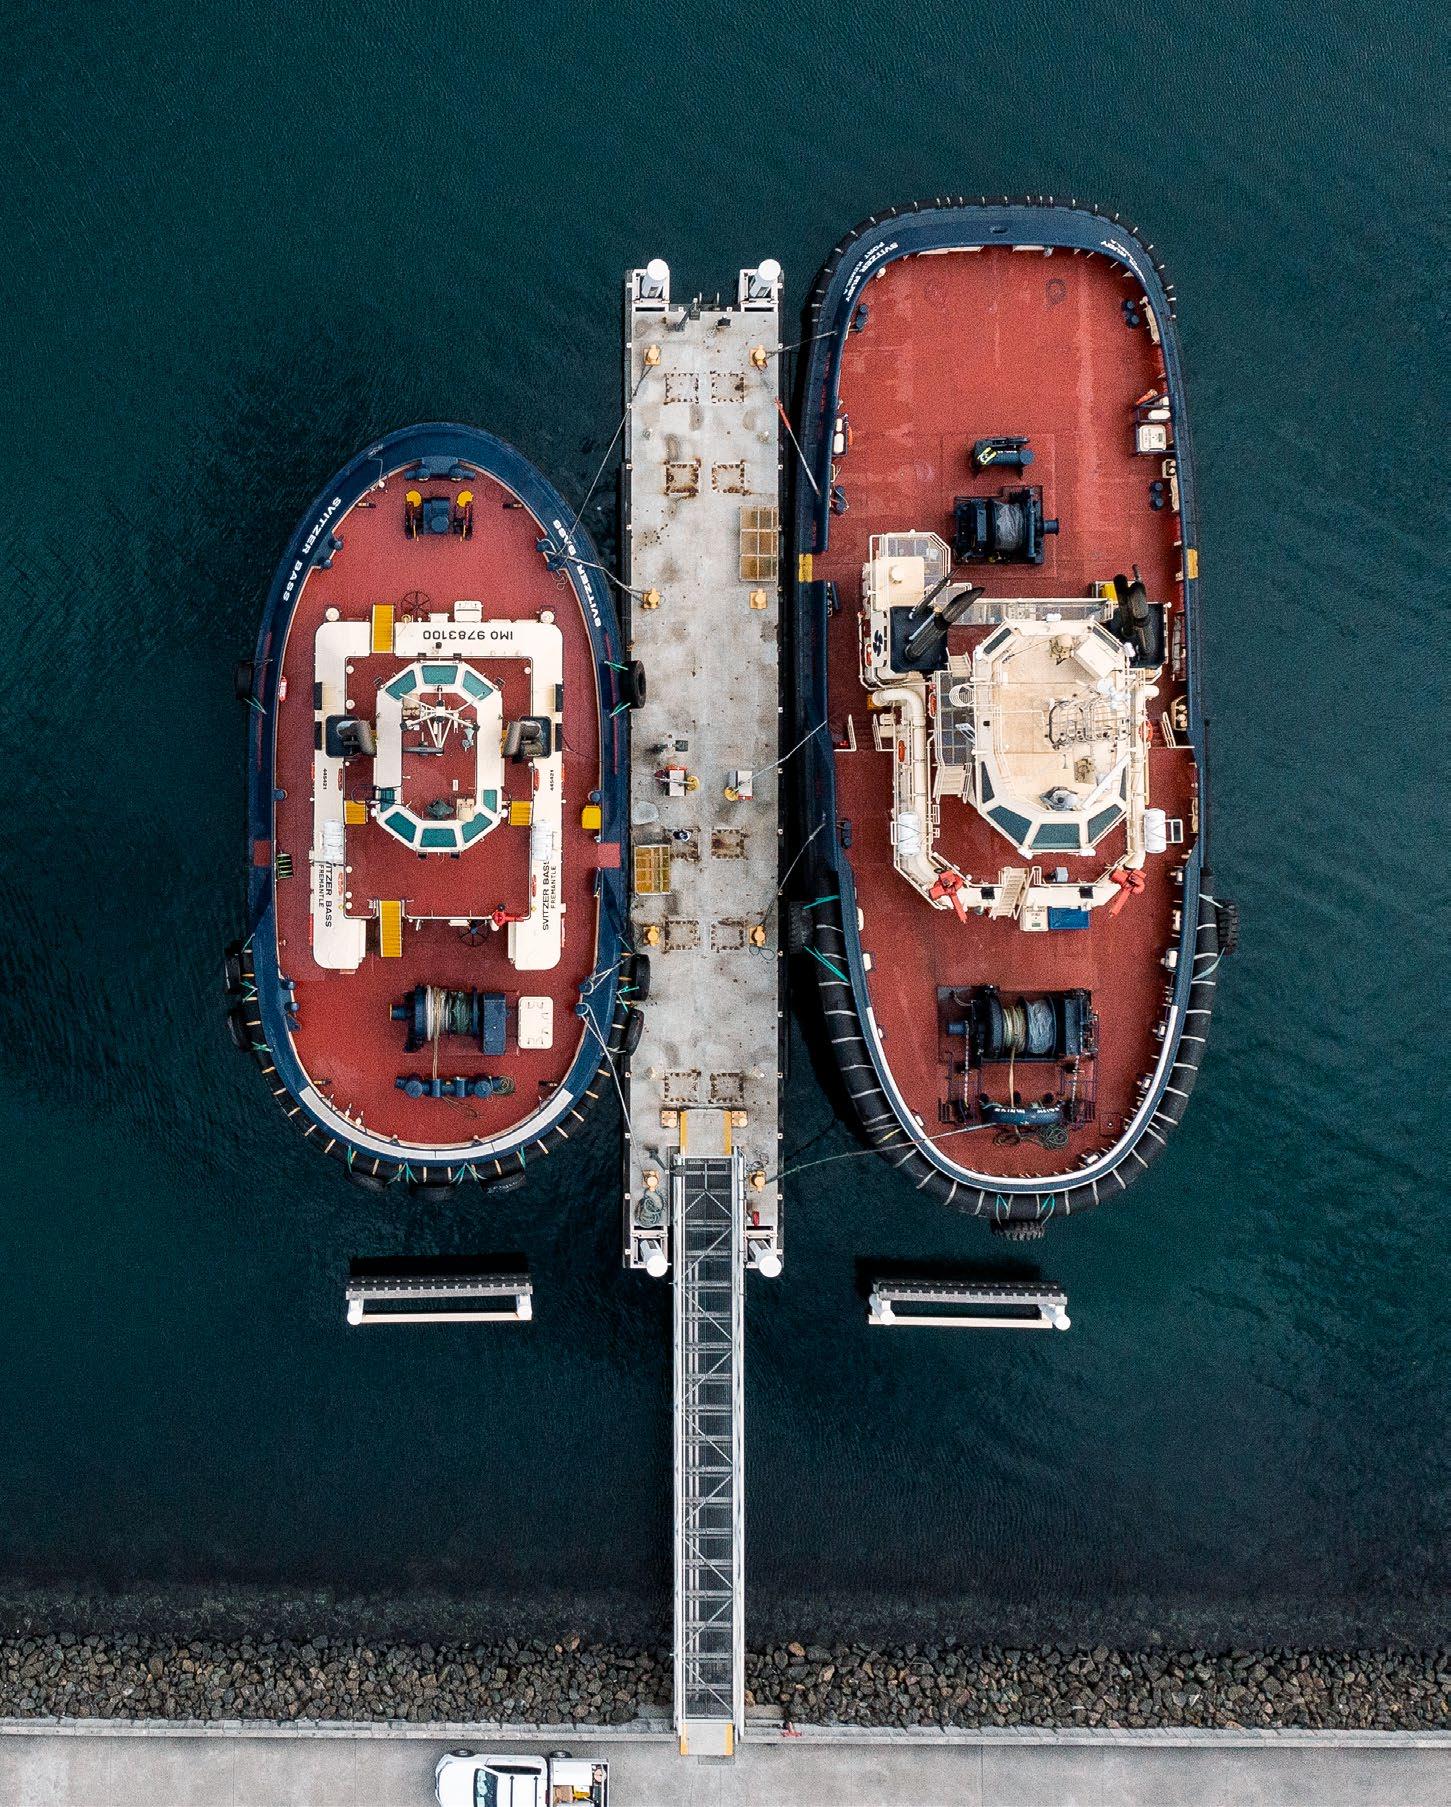
Remuneration
Our approach and policies
At Svitzer, we are committed to attracting and retaining the right talent for each role, promoting fair, equitable, and transparent hiring and compensation practices. We believe that a diverse and inclusive workforce enhances our ability to innovate, serve customers, and succeed as a business.
Aligned with our Code of Conduct and Diversity and Inclusion Policy, we focus on providing equal opportunities for all employees. Pay decisions are grounded in skills, experience, and performance, and our policies are regularly reviewed to promote a workplace where everyone can thrive. These policies cover the IRO: Right to equality.
Under our onshore remuneration framework, we have established salary bands based on Svitzer’s job structure. Each job level and corresponding location has a designated salary band that reflects the competitive market for talent in which Svitzer operates. During the hiring process, no distinction is made between male and female candidates; salary bands are applied uniformly across genders. For our crew, the vast majority are covered by Collective Bargaining Agreements (CBAs), which govern their compensation.
ESG KPIs in incentive remuneration
In 2024, 20% of the short-term incentive for Executive Management and our onshore bonus eligible employees was linked to ESG KPIs:
• 7.5% linked to decarbonisation measured through both developing business models to fund the decarbonisation journey and reaching certain decarbonisation targets (measured as a reduction of CO2 emissions reductions vs 2020 baseline).
• 3.75% for making progress on our Thriving People strategy, which is evaluated based on a holistic assessment of our progress within the following areas – eNPS, retention and DEI.
• 3.75% is linked to our passion for customers ambition, which is measured through NPS.
• 5% for progress on safety targets specifically being linked to our learning teams ambitions and management vessel visits. For more details on our safety targets please refer to the Health and Safety section of this Sustainability Statement.
The Remuneration Committee reviews once a year the performance against these metrics. Any proposed changes to KPIs or other adjustment to the short-term incentive
plan are based on recommendations from the Remuneration Committee and are ultimately approved by the Board of Directors. The members of the Board of Directors are not eligible for incentive pay.
Full disclosure of remuneration, including incentive plans and KPIs for Executive Management, is provided in our 2024 Annual Remuneration Report on the Company’s website.
2024 Remuneration metrics – gender pay gap and remuneration ratio
A key strategic priority for 2025 is to strengthen our global data foundation, particularly in people data, as current systems and processes are not fully optimised. Presently, data collection remains a largely manual process, requiring significant organisational resources. With this in mind, for this initial year of CSRD-aligned remuneration analysis, we have adopted an estimation approach based on regional proxies.
To represent broader regional trends, we selected four sites from our core business regions – Europe, Americas, Australia, and AMEA. Each site was chosen based on the following criteria:
• Employee representation aligns with Svitzer’s regional standard, with a predominance of crew over onshore employees.
• Both male and female employees are represented.
• Crew personnel of all levels are part of the sample.
• Onshore personnel reflect local operations and management from the sample.
The analysis used a simple average to calculate the percentage of gender pay and a median to assess the annual total remuneration ratio, without adjusting for variables such as geographic pay level differences, tenure, job levels, or other individual factors that might explain pay disparities. To calculate a meaningful total remuneration ratio, the highest paid individual has been identified as the CEO, though not included in the sample data.
Given the estimate approach, the data points for 2024 serve as an initial proxy and should be interpreted with caution, as they do not account for all factors that may influence pay levels. We aim to enhance the accuracy and increased transparency of future analyses by expanding the data scope and improving data quality over time.
Key Actions
Svitzer has taken the following steps in 2024, which it also plans to continue in the medium term:
• Create awareness through unconscious bias training.
• Tracking equal opportunities through our People Pulse survey.
• Reinforcing our Code of Conduct and relevant policies across all regions.
• Outlining plans for continuous improvement in future years. These plans include expanding the scope to incorporate additional data points (moving away from proxies) and factors, with the aim of conducting a more accurate and meaningful assessment of the gender pay gap and total remuneration ratio.
Targets
At this stage, Svitzer has not set specific targets for gender pay and pay ratio, due to current data limitations. This will be developed in future years, once the data foundation has been strengthened.
1 Normalised annual total remuneration ratio level is at 39x, excludes the extraordinary one-off bonus granted to management as part of the demerger and a short-term incentive payout based on the Company’s annual target performance.
§ Accounting policies
Percentage of gender pay gap: The gender pay gap is defined as the percentage difference between the average hourly pay levels of female and male employees. It is calculated based on employees’ gross hourly pay and is extracted from various sources, including local payroll systems, using sample data from four sites as a proxy. (Average gross hourly pay level of male employees – average gross hourly pay level of female employees) / Average gross hourly pay level of male employees x100.
Annual total remuneration ratio: The ratio of the highest-paid individual’s annual total remuneration compared to the median for all employees (excluding the highest-paid individual) is based on sample data from four sites, representing one site per region. This proxy includes employees’ annual remuneration components such as salary, cash-based benefits, and long-term incentives. The data is extracted from various sources, including local payroll systems.
Health and Safety
Safety has always been central to Svitzer’s mission, driven by a commitment to safeguarding our people. Our key objectives in all Health, Safety, Security and Environment (HSSE) efforts are to mitigate risks, ensure the well-being of our workforce, and prevent fatalities and life-altering injuries through a culture of safety, collaboration and open risk dialogue. Our towage operations require specific skills and training, to minimise risk of harm to our people. We ensure our crew have the required certification to meet local requirements, as well as an onboarding, training, and familiarisation programme.
Svitzer actively engages with our people to foster learning and ensure proper tracking methods are in place. Insight dashboards continuously capture activities and compliance. Monthly reports track progress against targets, while improvement actions identified are monitored through the HMS system and reviewed at board, global, and regional levels.
Our approach and policies
To achieve our safety objectives, Svitzer has moved beyond traditional health and safety approaches by developing a novel safety framework that has evolved since 2019.
The approach is based on three guiding strategic principles, which are embedded
in the Global Health and Safety Policy, with clear commitments and responsibilities:
1. Learning and adapting to risks,
2. Leading with care, and
3. Recognising our people as the experts to identify improvement needs relating to their work.
This employee-centric model emphasises continuous improvement, using frontline insights to enhance risk management and improve safeguards for critical risk activities. Svitzer focuses on top-down standards, audits, and assurance, while emphasising workforce engagement and supportive leadership.
This approach not only enhances employee well-being by empowering them but also improves efficiency by reducing risks and minimising disruptions. Svitzer’s safety metrics include both lagging indicators, such as incident frequency rates, and leading indicators that proactively address serious risks and prevent harm.
Svitzer’s leading indicators include compliance with Global Offshore Vessel Management and Self-Assessment (OVMSA) standards and proactive HSE management practices, including emergency drills, leadership vessel visits, learning from high potential incidents and action closure. These leading indicators ensure a proactive approach to risk
management, focusing on prevention rather than reaction. Svitzer remains committed to safety excellence by prioritising incident reporting, data quality, and leveraging leading indicators.
The Global Health and Safety Policy is approved and monitored by the Chief Operating Officer and covers all Svitzer employees, non-employee workers and workers in the value chain who are covered by Svitzer’s heath and safety management system. This policy covers the following IROs: Safe working environment for employees and Risks related to safety.
Key Actions
Svitzer has taken the following steps in 2024, which it also plans to continue in the long term:
• A frontline learning team process is activated for high potential incidents to proactively learn and improve work processes with crew involvement. This is regularly monitored and enforced through the company scorecard by senior leadership.
• OVMSA audits and internal audits (SOVIQ, which stands for Svitzer Offshore Vessel Inspection Questionnaire) are conducted annually.
• Monthly safety meetings are held on vessels, alongside leadership visits to engage crew on safety matters. These are monitored through Marine Standards dashboard on Svitzer Insight (updated daily) and enforced through monthly reviews at global and regional levels.
• Monthly emergency drills are conducted on all vessels according to a drill matrix. These are monitored through Marine Standards dashboard on Svitzer Insight (updated daily) and enforced through monthly reviews at global and regional levels.
• Leadership vessel visits are monitored through Marine Standards dashboard on Svitzer Insight (updated daily) and enforced through monthly reviews at global and regional levels.
• Internal audit plan adherence is monitored through Marine Standards dashboard on Svitzer Insight (updated daily) and enforced through monthly reviews at global and regional levels. Additionally, an internal audit calendar is maintained at regional level to track audit due dates and facilitate completion.
• Incident reviews are integrated into the HMS system, and monthly KPI reports and lessons learned are shared at all organisational levels.
Targets
Svitzer does not set specific targets for recordable accidents, fatalities, or injuries. Instead, the goal is to proactively address risks that could cause incidents, by strengthening safeguards to prevent fatalities and life-altering injuries. Svitzer runs an annual programme based on data and insights. To drive continuous improvement and raise awareness, Svitzer tracks activities and outcomes, setting and monitoring the following targets:
• Learning team completion within eight weeks of a High Potential Incident.
• Leadership Visits (one per vessel per month) with a 90% global target.
• Emergency Drills (per Svitzer’s drill plan in HMS, which defines when and which drills should be performed) with a 100% global target.
• Internal Audit plan adherence with a 95% global target per year.
• Vessel Safety Meetings (one per vessel per month) with a 95% global target.
These targets are set annually, in consultation with regional Marine Standards and safety teams. All vessels covered by HMS are within scope of these targets. Progress against these targets is monitored and reviewed monthly.
Health and Safety metrics
Health and Safety metrics (Own Workforce – Employees and Non-Employee Workers)
Health and Safety metrics (Workers in the value chain JV Workers who have access to HMS) Voluntary Disclosure
Safety Leading Indicators
S1-14
S1-14
S1-14
S1-14
S1-14
§ Accounting policies
Employees covered by HMS:
Percentage of Employees who are covered by Svitzer’s health and safety management system based on legal requirements and (or) recognised standards or guidelines as of 31 December.
Accounting policies for Health and Safety Metrics for Own Workforce
Total recordable accidents for Own Workforce:
Number of recordable cases are the sum of fatalities, life-altering injuries (LAI), lost workday cases (LWC), restricted work cases (RWC) and medical treatment cases (MTC) for Own Workforce.
Lost-time injuries for Own Workforce:
LTI is a work-related injury, which is classified as a fatality, life-altering injury (LAI) or lost workday case (LWC) that results in a member of Own Workforce being unfit for work on the day after or shift after the day of injury occurrence. This ‘day’ includes rest days, weekends, leave days, public holidays or days after ceasing employment.
Exposure hours for Own Workforce:
Exposure Hours are the work hours for members of Own Workforce recorded within HMS which is used as the basis for calculating this metric. This includes exposure hours as an estimation from local operations.
Rate of total recordable work-related accidents for Own Workforce:
Total Recordable Accident Case rate is the sum of fatalities, life-altering injuries (LAI), lost workday cases (LWC), restricted work cases (RWC) and medical treatment cases (MTC) for Own Workforce divided by exposure hours, and normalised by multiplying by 1 million hours.
Lost-time injury rate for Own Workforce:
The sum of lost time injuries resulting from fatality, life-altering injury (LAI) or lost workdays (LWC) for Own Workforce divided by exposure hours and normalised by multiplying by 1 million hours.
Fatalities (Employees, Non-employee Workers and other workers in the value chain):
Fatalities is the number of work-related injuries or ill health leading to the death of any Employee, Non-Employee Worker, or any worker in the value chain regardless of time between injury and death and regardless of whether those are covered by Svitzer’s health and safety management system (HMS). This includes work performed contractually for Svitzer at Svitzer’s sites and workers of joint ventures and associates.
Voluntary Disclosure: Accounting policies for health and safety metrics for workers in the value chain, being JV workers who are covered by HMS.
Total recordable accidents:
Number of recordable cases are the sum of fatalities, life-altering injuries (LAI), lost workday cases (LWC), restricted work cases (RWC) and medical treatment cases (MTC) for joint venture (JV) workers who are covered by HMS.
Lost-time injuries:
LTI is a work-related injury, which is classified as a fatality, life-altering injury (LAI) or lost workday case (LWC) that results in a JV worker covered by HMS being unfit for work on the day after or shift after the day of injury occurrence. This ‘day’ includes rest days, weekends, leave days, public holidays or days after ceasing employment.
Exposure hours:
Exposure hours are the work hours for members of JV workers who are covered by HMS recorded within HMS which is used as the basis for calculating this metric. This includes exposure hours as an estimation from local operations.
Rate of total recordable work-related accidents:
Total Recordable Accident Case rate is the sum of fatalities, life-altering injuries (LAI), lost workday cases (LWC), restricted work cases (RWC) and medical treatment cases (MTC) for JV workers who are covered by HMS divided by exposure hours, and normalised by multiplying by 1 million hours.
Lost-time injury rate:
The sum of lost-time injuries resulting from fatality, life-altering injury (LAI) or lost workdays (LWC) for JV workers who are covered by HMS divided by exposure hours and normalised by multiplying by 1 million hours.
A High Potential is an Incident or Near Miss that under different circumstances could have resulted in a life-altering Injury or Fatality.
All types of incidents are assessed for actual and potential severity. This is done by considering what reasonably could have led to a more severe outcome:
� Any slightly different circumstances that could normally and reasonably be present.
� Whether there was only one or limited safeguards to prevent a more serious outcome.
� Whether existing safeguards were effective in preventing a more serious outcome or if it based on luck.
High Potential incidents are reportable and trigger a frontline learning team event as part of investigation regardless of actual severity classification.
Respecting human rights
Svitzer is fully committed to upholding human rights across all aspects of its operations, in line with its core values, and as formalised in its Human Rights Statement, approved by the Board of Directors. Svitzer works diligently to prevent adverse impacts on individuals, whether its within the Company, its supply chain, or in the communities where Svitzer operates. As a towage service provider, our operations are not at a significant risk of forced or child labour due to the specific requirements of operating our vessels.
Our approach and policies
Svitzer’s commitment to human rights is enshrined in the Code of Conduct and reinforced by internal policies and procedures. Svitzer adheres to internationally recognised human rights principles, including those outlined in the International Bill of Human Rights and the ILO Declaration on Fundamental Principles and Rights at Work. These include core labour rights, such as freedom of association and collective bargaining; the right not to be subjected to forced or child labour and standards on working hours and the safety and health of workers. In cases where local regulations may be less stringent than international human rights standards, Svitzer strives to uphold higher international standards, and where conflicts arise, Svitzer seeks ways to honour the higher international standards.
Human Rights Statement
Svitzer strives to avoid causing or contributing to adverse impacts on people through its own operations, business partners, or in the communities, where Svitzer operates. Svitzer endorses the principles of the UN Guiding Principles on Business and Human Rights (“UNGPs”) and the OECD Guidelines for Multinational Enterprises, implementing these principles through its Code of Conduct and related policies.
Svitzer’s focus includes health and safety, subcontractor labour conditions, access to remedy, and emerging issues like data ethics and supporting a just energy transition. When human rights issues are identified, Svitzer manages, mitigates, and remediates them accordingly.
Svitzer has grievance mechanisms available, including a global whistleblower system, which anyone can use to report human rights concerns safely. In cases where Svitzer is directly linked to adverse impacts, the Company works with the involved parties to provide remedies. Human rights due diligence is a dynamic process at Svitzer, and Svitzer regularly assesses its impacts, reviews due diligence procedures, monitors their effectiveness, and communicates efforts made.
Global Anti-bullying, Harassment,
Violence and Discrimination
Policy
Svitzer has zero tolerance for bullying, discrimination, harassment, or violence based on gender, race, colour, religion, disability, political opinion, sexual orientation, national origin, trade union membership, or any other status protected by international law.
Svitzer’s policy outlines the minimum standards of behaviour expected from its employees to maintain a respectful environment free from discrimination, bullying, harassment, and retaliation. Employees are encouraged to report breaches of this policy to their manager, their HR partner, or through the Whistleblower system. Refer to page 101 for more details about the Whistleblower system.
Svitzer ensures that breaches of the policy are taken seriously, handled promptly, fairly, and confidentially, with appropriate disciplinary actions taken when necessary and with care. The policy covers the following IRO: Harassment and Abuse. The Chief People Officer approves this policy and is responsible for monitoring its implementation supported by the global HR and Compliance teams.
Data Ethics Policy (In accordance with 99d)
As digitalisation grows and data collection in the workplace increases, worker privacy is at risk, particularly in areas with low awareness of data protection. Even well-intentioned
technologies like safety sensors or employee feedback applications can impact privacy and other rights. Svitzer ensures that any implementation of software or artificial intelligence is accompanied by strong data ethics guidance to protect employees’ privacy, covering the following IRO: Risk due to digitalisation and financial impact from breaches of privacy. The Data Ethics Policy covers all Svitzer employees and is approved by the Board of Directors.
Key Actions
Svitzer has taken the following steps in 2024, which it also plans to continue in the long term:
• Regularly assessing human rights impacts, particularly concerning key issues such as health and safety, data ethics, and labour conditions.
• Bringing awareness of Whistleblower system.
• Speak Up campaigns.
Targets
Svitzer has set clear goals for training completion of its Code of Conduct. Refer to Governance Section on page 101 for more details on governance training.
Workforce
Incidents, Complaints and Human Rights
S1-17 Discrimination, complaints, and severe human rights incidents
S1-17 Number of incidents of discrimination, incl. harassment 2
S1-17 Number of complaints 13
S1-17 Number of complaints filed to National Contact Points for OECD Multinational Enterprises 0
S1-17 Number of severe human rights incidents and incidents connected to own workforce that are cases for non-respect of UN guiding principles and OECD Guidelines for Multinational Enterprises 1 0
S1-17 Number of fines, penalties, and compensation 0
S1-17 Amount of fines, penalties, and compensation for damages as result of incidents of discrimination, including harassment complaints 0
S1-17 Amount of fines, penalties, and compensation for severe human rights issues and incidents connected to own workforce 0
S1-17 Total amount of fines, penalties, and compensation in DKK 0
1 During the 2024 reporting period, no severe human rights issues and incidents connected to Svitzer’s own workforce have occurred.
§ Accounting policies
Reconciliation of fines, penalties and compensation:
� Total number of incidents of discrimination, including harassment: Number of discrimination incidents reported to Svitzer using the whistleblower system, other reporting channels or any external complaints outside of the systems e.g., report to a local manager. Cases are classified at group level, when formally reported and confirmed to Svitzer’s People and Culture and/or Legal Department.
� The number of complaints filed including FaceUp: Number of complaints filed with Svitzer using the whistleblower system, other reporting channels or any external complaints outside of the systems e.g., report to a local manager. Cases are classified at group level, when formally reported and confirmed in writing to Svitzer People and Culture and/or Legal Department. The complaints relate to harassment, HR related breach of laws, rules or company rules, conflict of interest, bribery and corruption, gifts and entertainment and international trade.
� Number of fines related to incidents: Number of fines, penalties, and compensations involving Svitzer in the reporting year.
� Fines related to incidents (DKK): Sum of fines, penalties, and compensations paid by Svitzer in the reporting year.
� Number of severe human rights incidents: Number of severe human rights incidents reported to Svitzer using the whistleblower system or other reporting channels.
� Fines related to severe human rights incidents (DKK): Sum of fines, penalties, and compensations paid by Svitzer in the reporting year relating to human rights incidents.
� Total amount of fines, penalties and compensation for damages as a result of violations regarding work-related discrimination and harassment is reconciled with the most relevant amount presented in the financial statements (reported as part of operating costs, refer to page 129 of the financial statements).
� Total amount of fines, penalties, and compensation for severe human rights issues and incidents connected to own workforce is reconciled with most relevant amount presented in the financial statements (reported as part of operating costs, refer to page 129 of the financial statements).
Workers in the value chain
Sustainable procurement
Being a global service provider in the towage and marine services industry, Svitzer recognises its impact on people across all of its global operations, along with its social responsibility through its value chain. Being a global business creates a social responsibility to uphold both national and global standards, which is anchored in our license to operate and how we run our business. Svitzer expects all business partners to commit to upholding human and labour rights to reduce the risk in our value chain.
To safeguard workers’ rights and well-being, Svitzer conducts thorough assessments and engages with stakeholders, including suppliers, workers, and their representatives. Our value chain as visualised on page 56, includes our key activities both upstream and downstream such as mining and manufacturing. This collaborative approach reflects actual working conditions and supports Svitzer’s goal of promoting a responsible value chain. This commitment is embedded in Svitzer’s values and reinforced by its Supplier Code of Conduct, which aligns
with the United Nations’ Universal Declaration of Human Rights, ISO standards on Health, Safety, and Environment, and the core labour conventions of the International Labour Organisation (ILO). This is further detailed in the Governance section.
Our approach and policies
Svitzer integrates sustainability into its global supply chain through its Sustainable Procurement Programme, outlined in the Supplier Code of Conduct, which covers all related IROs as well as child and forced labour. This code covers all material S2 negative impacts, as no risks and opportunities were deemed material in the DMA. The Chief Operating Officer is ultimately responsible for this code and oversees its implementation, supported by the Procurement Team.
Key Actions
Svitzer has taken the following steps in 2024, which it also plans to continue in the long term:
• Mandating all new suppliers to acknowledge the Supplier Code of Conduct during onboarding.
• Completing Sustainable Procurement Assessments for high-risk suppliers based on internal guidelines.
• Improving the quality of supplier data, including updating our global supplier database.
• Recognising the importance of secure employment and diversity in its value chain, Svitzer is currently reviewing its approach to these areas, both in terms of policies, actions and targets. Svitzer will engage stakeholders, assess current practices, and increasingly collaborate across the value chain to develop those supplier guidelines.
• Regularly reviewing and monitoring supplier commitments during registration and contract renewals, and taking corrective action with non-compliant suppliers to ensure adherence.
Svitzer Group Procurement develops the overall engagement strategy and framework, while regional Procurement teams execute the process through direct engagement with suppliers. Svitzer reviews supplier commitments during contract renewals and take corrective action with non-compliant suppliers to ensure adherence. Through highrisk category assessments, Svitzer engages directly with suppliers on key issues such as anti-corruption, health and safety, labour and human rights, and environmental impact. These assessments also include onsite audits and interviews with supplier personnel, including workers. Findings are reviewed, communicated to relevant stakeholders, and gaps are addressed through Improvement Plans. Svitzer aims to work with suppliers to close gaps in Improvements plans within six months (unless the gap is urgent, in which case Svitzer aims to complete within a shorter period). Completed Assessments and completed Improvement Plans remain valid for two to five years depending on the category. If Svitzer continues or plans to do business with the supplier, Svitzer reinitiates the assessment process to ensure ongoing adherence.
ESRS S2 – Workers in the value chain
ESRS S2 – Workers in the value chain
Svitzer is committed to creating an open, transparent, and safe working environment. For that reason, a whistleblower system is in place for people to speak up and report concerns on wrongdoing. This includes our value chain workers, who have access through our website to raise concerns in a structured and anonymous approach communicated via our supplier engagement. Suppliers registered in our global supplier database are required to uphold this commitment by adhering to our Supplier Code of Conduct.
Targets
Svitzer sets time-bound, outcome-oriented targets to drive positive impacts across its value chain and support its policies. Those targets are defined and developed via risk assessments, industry benchmarks,
and internal guidelines, with a focus on improving working conditions and reducing supply chain risks. Svitzer engages with stakeholders, suppliers, and workers to ensure its targets are relevant, achievable, and aligned with best practices.
These targets were developed to support the actions taken by Svitzer by utilising its policies including addressing high-risk suppliers. The targets have been adopted from A.P. MollerMaersk prior to the demerger, and since then, Svitzer has remained committed to them. These targets were not set with any internal stakeholders but have been communicated to and supported by all regional procurement teams. The targets are set on a yearly basis, cover all suppliers in the global supplier database and progress is monitored monthly.
Supplier Targets
S2-5 Supplier 1 commitment to Svitzer Supplier Code of Conduct
S2-5 Completing
1 Supplier refers to all suppliers registered in Svitzer’s global supplier database.
2 High-risk suppliers are those are recorded in Svitzer’s global supplier database as high-risk based on associated potential high-risk of severe social or environmental impact taking place when sourcing, producing, or delivering the product or service, directly or through another party in its supply chain.
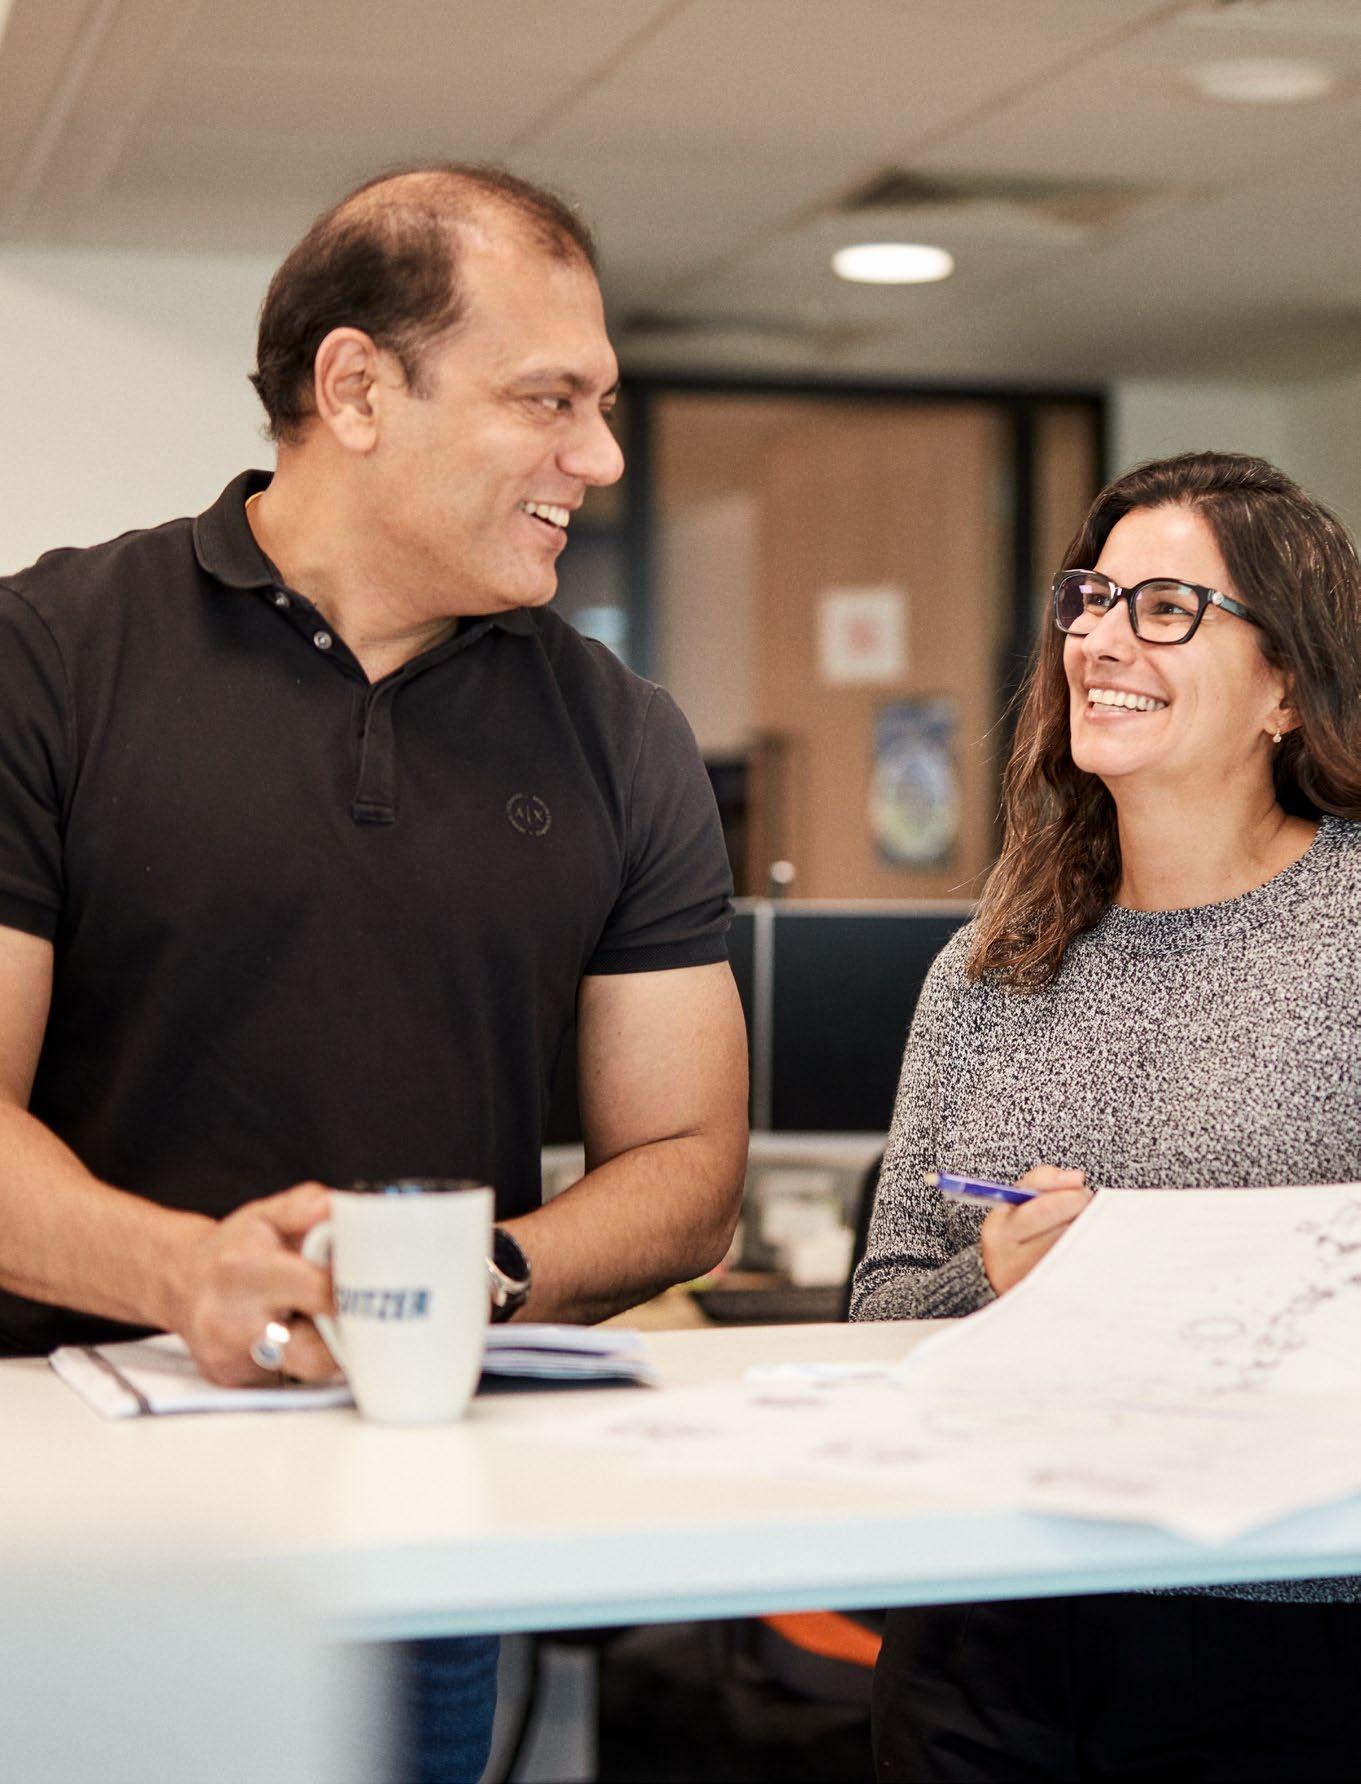
Consumers and end users
Passion for Customers
Svitzer’s Passion for Customers is one of our strategic differentiators – centred around deep customer understanding, uncovering needs and measuring performance accordingly to deliver superior services. Our value chain as visualised on page 56, includes key players across our downstream activities such as customers and port authorities. We support our customers on a daily basis with our towage services.
Our approach and policies
Our commercial approach involves listening to customer feedback and enhancing service delivery as captured in Svitzer’s Code of Conduct. This code covers our positive impact, as no risk and opportunities were deemed material in the DMA.
Several commercial initiatives have been launched to better understand customer needs and ensure Svitzer remains at the forefront of their needs, covering our Customer Dialogue IRO.
Customer Engagement is reinforced in the standard commercial actions throughout the customer journey, such as integrating deep listening skills into customer meetings
and calls. Operationally, this ensures Service Delivery levels around on-time reliability and availability of tugs. The same customer centric approach is taken also in our business development activities, where we strive to fully understand the customer and their needs, to offer tailor-made solutions and value propositions. The Chief Commercial Officer is ultimately responsible for overseeing the implemention of the customer strategy.
Key Actions
Svitzer has taken the following steps in 2024, which it also plans to continue in the medium term:
• Annual Customer Loyalty survey (“NPS Survey”): Conducting annual survey capturing feedback from an average of 200 customers. Follow-up actions are taken regionally based on customer feedback.
• Transactional Customer Satisfaction Pilot: Gathering frequent feedback by attaching short survey links to customer invoices and booking coordination emails.
• Service Delivery Leap: Aligning processes and enhancing current systems to enable
measurement of on-time delivery and increased availability across Svitzer ports.
Targets
Svitzer measures customer satisfaction through annual Customer Loyalty Survey (Net Promoter Score™, NPS), capturing the feedback of how customers feel about the services rendered and also providing an opportunity for voicing concerns. Svitzer has set an NPS target score of 34 for 2025 to focus efforts on continuing to support our customer centricity strategy. The NPS target is set annually by the Executive Leadership Team. The target is communicated to the regional commercial teams. Progress towards the target is evaluated annually after the survey is completed and results are received. In 2024, Svitzer received an NPS score of 46
No cases of non-respect of the UN Guiding Principles on Business and Human Rights, the ILO Declaration on Fundamental Principles and Rights at Work or OECD Guidelines for Multinational Enterprises involving consumers and/or end users, nor severe human rights issues or incidents, have been identified in 2024.
§ Accounting policies
NPS calculation: The NPS is measured by asking customers how likely they are to recommend a product on a scale of 0 to 10. They are then classified as Promoters (9-10), Passives (7-8), or Detractors (0-6). We then subtract the percentage of Detractors from Promoters, yielding a score between -100 and 100.
Governance
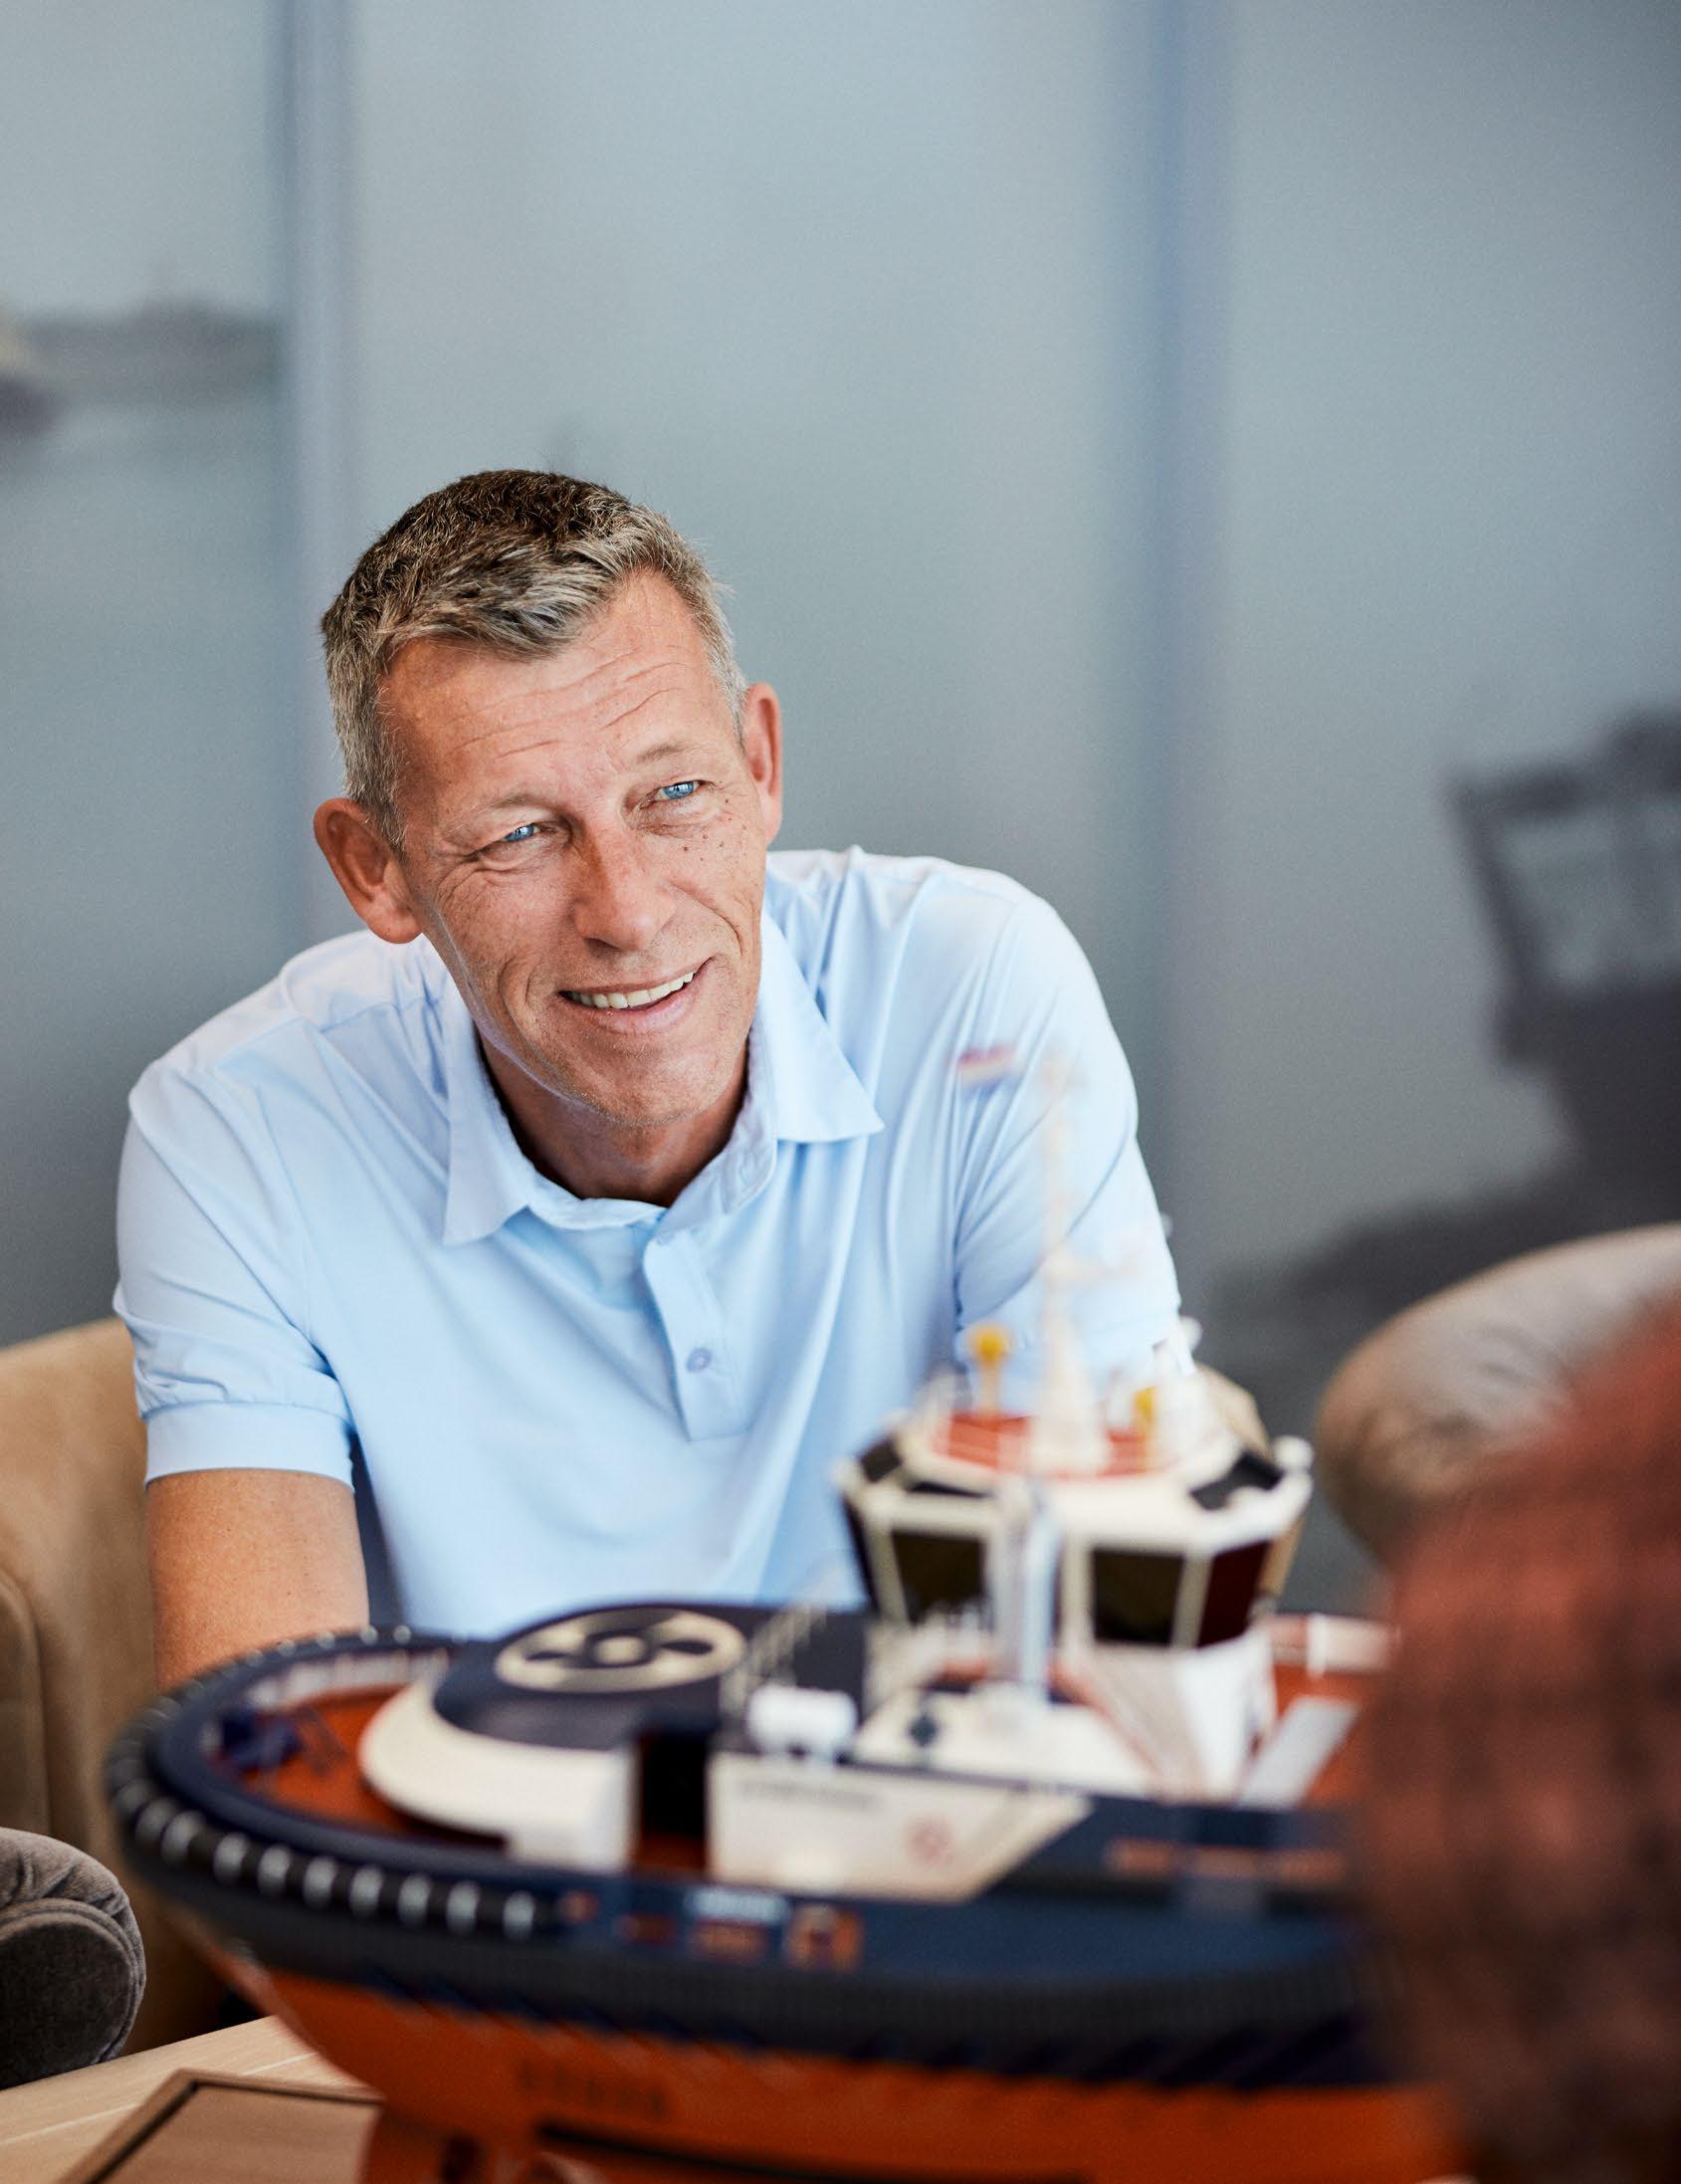
Business conduct
While Svitzer is now separated from A.P. Moller - Maersk to become a stand-alone listed company, our commitment to ethical business conduct, and to prioritising safety in every decision, remains as uncompromising as ever.
All Svitzer employees, including the Executive Leadership Team, complete compulsory anti-corruption training and a yearly refresher covering the Code of Conduct. The Board of Directors brings expertise in business conduct from its members’ significant experience in executive roles and board memberships within listed and regulated environments. While Svitzer has not yet rolled out its Code of Conduct training to Board members, they have completed governance, anti-corruption, and anti-bribery training. The IROs in the governance section were
identified through a thorough assessment of publicly available sources to identify impacts, risks, and opportunities, alongside several identification workshops. The identified IROs have been validated and supplemented with entity-specific knowledge from Svitzer.
Corporate Culture
Building on a strong set of values inherited from A.P. Moller - Maersk, Svitzer continues to focus on its corporate culture and uphold ethical business conduct, positioning itself as a leader in the towage industry. Svitzer understands the responsibility of being a global leader and recognises the social and environmental impact of its operation.
Our approach and policies
Svitzer’s corporate conduct culture is supported by its Code of Conduct and core values, particularly the value of Uprightness. The Code of Conduct clearly outlines the minimum requirements we are all expected to follow when engaging with colleagues, customers, suppliers, communities, authorities, and other key stakeholders to Svitzer. It applies even if local legislation sets a lower standard. In line with our values, international principles, and standards, our Code of Conduct serves as the guiding principle for our actions to ensure that we maintain the highest standards of integrity and responsible business practices. The Executive Leadership Team adopts and oversees implementation of Svitzer’s values within the organisation. The Code of Conduct applies apply to all of us, whether at sea or
on shore, to all contracted staff acting on our behalf, and to employees working in joint ventures.
Key Actions
Svitzer has taken the following steps in 2024, which it also plans to continue in the long term:
• Rolling out Code of Conduct refresher training for all employees in scope.
• Integrating sustainability into procurement through our Sustainable Procurement Programme, taking the opportunity to strengthen our relationship with suppliers while encouraging environmental and social standards. These requirements are outlined in the Supplier Code of Conduct, enforced contractually, and monitored for
ESRS G1 – Business conduct
ESRS G1 – Business conduct
compliance. Suppliers recorded in Svitzer’s global supplier database are, at a minimum, required to follow the Supplier Code of Conduct, the supplier’s own equivalent or United Nations Global Compact principles, by monitoring and ensuring compliance with these standards. We require these suppliers to commit to proactively undertaking initiatives to protect the environment, increase efficiency, and reduce waste. Regarding social criteria, Svitzer requires suppliers to provide a safe, secure, and healthy working environment for their workforce.
• Continuous promotion of good corporate culture through awareness campaigns.
• Face-to-face training conducted at various Svitzer locations, covering both general compliance and targeted training on anticorruption and competition law.
Targets
For our sustainable procurement, Svitzer has set targets as referred to on page 97 of the Sustainability Statements.
Svitzer has also set a target for completion of Code of Conduct refresher training of 100%. This target was adopted from A.P. MollerMaersk prior to the demerger and Svitzer has committed to it. All onshore employees are in scope for this training. The target is set on
an annual basis and progress is monitored in the third quarter with reminders sent to those who have not completed it prior to year-end.
Whistleblower
At Svitzer, business integrity is key, and the Company encourages and promotes a Speak Up culture. A key aspect of this campaign is our Whistleblower system. Having a Whistleblower system is Svitzer’s commitment to creating an open, transparent, and safe working environment.
Our approach and policies
Our whistleblower solution allows anonymous reporting of concerns and possible violations of laws and regulations, internal policies, and procedures. Svitzer has established a Whistleblower Committee responsible for overseeing investigations and determining appropriate outcomes, such as disciplinary steps and other remedial actions, which are then implemented and monitored by the relevant corporate functions. Our Whistleblower Policy outlines our zerotolerance for retaliation.
The Whistleblower Committee consist of two permanent members: The General Counsel and the Chief People Officer. For cases related to fraud and safety, the Chief Financial
Officer and Chief Operating Officer are invited to join the Whistleblower Committee.
Cases are assigned to Heads in Svitzer by the Whistleblower administrator(s). However, if the case reported involves a member of the Board of Directors, it will be handled by external advisors. If it involves a member of the Executive Leadership Team, other than the General Counsel (GC) or the Chief People Officer (CPO), it will be handled by either GC or CPO. If there is any conflict of interest, complaints are handled by external advisors, and if it involves a member of the Compliance Team, it is handled by the GC.
The Whistleblower hotline is available on both internal and external Svitzer sites to ensure that employees as well as anyone Svitzer does business with have the opportunity to report any unethical behaviour that is not aligned with Svitzer values. The General Counsel is responsible for approval and implementation of the policy supported by the Compliance Team.
Key Actions
Svitzer has taken the following steps in 2024, which it also plans to continue in the long term:
• Establishing an annual Compliance Wheel.
• Implementing a new Whistleblower system solution.
• Monitoring and capturing trends that may require more targeted training on compliance.
• Campaigns to remind our people of the Whistleblower system.
• Speak Up campaigns.
Targets
Refer to the target for Code of Conduct refresher training.
Corruption and
Bribery
Svitzer is committed to conducting its business free from corruption and has a zerotolerance for corruption and bribery. However, the risk of corruption and bribery is present due to the nature of our industry and the global scope of our operations, particularly in high-risk countries.
The Compliance Officer regularly produces a report/summary of whistleblower cases and open/closed investigations, including those related to corruption and bribery, for Svitzer’s CEO and the Whistleblower Committee. Additionally, the Audit and Risk Committee receives an quaterly update on enterprise
ESRS G1 – Business conduct
risk management. Compliance updates, including whistleblower reporting is received on a annual basis.
Our approach and policies
Svitzer upholds high ethical standards and is committed to fighting corruption. As a member of the Maritime Anti-corruption Network (MACN), Svitzer adheres strictly to a zero-tolerance policy on corruption, bribery, and facilitation payments, as outlined in our Anti-Corruption Policy. This policy covers all Svitzer employees and anyone acting on Svitzer’s behalf and includes procedures to counter unethical behaviour, including incidents of anti-corruption and bribery. The General Counsel is responsible for the approval and implementation of the policy supported by the Compliance Team.
The management involved in prevention and detection of corruption and bribery is separate from the investigating committee.
Actions
Svitzer has an established process to carry out the following activities in 2024, which it also plans to continue in the long term:
• Due diligence processes are performed when liaising with government officials on Svitzer’s behalf with public officials, and service suppliers interfacing with governments in carrying out works for Svitzer.
• Processes for reporting and approval of gifts, donations, and sponsorships for all employees.
• Training: Onboarding of all new employees, Code of Conduct onboarding and refresher training for onshore employees, and targeted training on an ad-hoc basis, depending on identified needs.
• Risk-based assessment of knowledge gaps and training needs.
• Speak Up campaign to increase awareness of our channels for raising concerns.
Targets
Refer to the Code of Conduct refresher training target.
§ Accounting policies
Functions-at-risk: Functions deemed by Legal and Compliance Department to be at risk of corruption and bribery as a result of its tasks and responsibilities (currently all onshore employees) who are required to complete anti-bribery and anti-corruption training.
Convictions: Concluded convictions as entered or recorded by a regulatory authority or court against Svitzer.
Fines: Amount of fines as captured in Svitzer’s consolidated accounts in relation to the number of convictions.
Code of Conduct refresher training: Completion rate of all employees in the Functions-at-risk as at 31 December (other than those on long-term absence and who have joined after 31 October of the reporting period). The completion rate is based on registrations in the Workday Learning.
ESRS Disclosure requirements and incorporation by reference
ESRS Disclosure requirements and incorporation by reference
This table presents the list of our ESRS disclosure requirements in ESRS 2 and the seven topical standards E1, E2, E5, S1, S2, S4 and G1 deemed material. Thus, this table does not include the non-material topical standards E3, E4 and S3. The table presents where the disclosure requirement is covered in the Sustainability Statements or is ‘incorporated by reference’ to either the Management’s Review or the Financial Statements.
DMA Double Materiality Assessment
End Users Consumers and end users
Intro Introduction to sustainability reporting
IROs List of material IROs
RUCE Resource Use and circular economy
SH Interests and views of stakeholders
VCBM Value chain & Business model
WVC Workers in the Value Chain
Cross-cutting standards
Disclosure requirements
ESRS 2 – General disclosures
BP-1 General basis for preparation of the Sustainability Statement General Basis for preperation 51-52
BP-2 Disclosure in relation to specific circumstances General Basis for preperation 51-52
GOV-1 The role of the administrative, management and supervisory bodies ESG Governance 49-50
GOV-2 Information provided to and sustainability matters addressed by the undertaking’s administrative, management and supervisory bodies ESG Governance 49-50
GOV-3 Integration of sustainability-related performance in incentive schemes ESG Governance Remuneration 50, 89
GOV-4 Statement on sustainability due diligence General Basis for preperation 52
GOV-5 Risk management and internal controls over sustainability reporting ESG Governance General Basis for preperation 49, 51
SBM-1 Strategy, business model and value chain (key activities, locations and stakeholders) Intro, proportion of turnover, VCBM, DMA Own workforce 48, 56-57, 66, 84
SBM-2 Interests and views of stakeholders SH 59
Strategy and business (p. 21), Note 2.1 Segment information (p. 126-128)
SBM-3 Material impacts, risks and opportunities and their interaction with strategy and business model Intro, VCBM, DMA, IRO 48, 5457, 60-63 Strategy and business (p. 21)
IRO-1 Description of the process to identify and assess material impacts, risks and opportunities DMA, VCBM, SH 53-59
IRO-2 Disclosure requirements in ESRS covered by the undertaking’s Sustainability Statement Governance 104-107
Environmental standards
ESRS E1 – Climate change
ESRS 2, GOV-3 Climate change Integration of sustainability-related performance in incentive schemes Own workforce 89
E1-1 Transition plan for climate change mitigation Climate Change 69
ESRS 2, SBM-3 Material impacts, risks and opportunities, and their interaction with strategy and business model IROs, Climate Change 60, 69-70
ESRS 2, IRO-1 Description of the processes to identify and assess material climate-related impacts, risks and opportunities DMA, VCBM, SH 53-59
E1-2 Policies related to climate change mitigation and adaptation IROs, EU Taxonomy, Climate Change 60-70
E1-3 Actions and resources in relation to climate change policies Climate Change 70
E1-4 Targets related to climate change mitigation and adaptation Climate Change 70-71
E1-5 Energy consumption and mix Climate Change 72, 74
E1-6 Gross Scopes 1, 2, 3 and total GHG emissions Climate Change 73
E1-7 GHG removals and GHG mitigation projects financed through carbon credits Climate Change 69
E1-8 Internal carbon pricing Climate Change 69
E1-9 Anticipated financial effects from material physical and transition risks and potential climate-related opportunities
ESRS E2 – Pollution
ESRS 2, IRO-1 Description of the processes to identify and assess material pollution-related impacts, risks and opportunities DMA, VCBM, SH 53-59
E2-1 Policies related to pollution
E2-2 Actions and resources
E2-6 Anticipated financial effects from pollution-related impacts, risks and opportunities
ESRS E5 – Resource use and circular economy
ESRS 2, IRO-1 Description of the processes to identify and assess material resource use and circular economy-related impacts, risks and opportunities
E5-1
E5-2
E5-3
SH 53-59
and circular
E5-5 Resource outflows
E5-6 Anticipated financial effects from resource use and circular economyrelated impacts, risks and opportunities
Social standards
ESRS S1 – Own workforce
ESRS 2, SBM-2 Interests and views of stakeholders SH 59
ESRS 2, SBM-3 Material impacts, risks and opportunities and their interaction with strategy and business model IROs 61
S1-1 Policies related to own workforce Own Workforce 81, 85-86, 89, 91, 94
S1-2 Processes for engaging with own workers and workers’ representatives about impacts Own Workforce 81
S1-3 Processes to remediate negative impacts and channels for own workers to raise concerns
S1-4 Taking action on material impacts on own workforce, and approaches to mitigating material risks and pursuing material opportunities related to own workforce, and effectiveness of those actions Own Workforce 81-82, 85-86, 90-91, 94
S1-5 Targets related to managing material negative impacts, advancing positive impacts, and managing material risks and opportunities Own Workforce 82, 85-87, 90, 92, 94
S1-6 Characteristics of the undertaking’s employees Own Workforce 83-84
S1-7 Characteristics of non-employee workers in the undertaking’s own workforce
S1-8 Collective bargaining coverage and social dialogue Own Workforce 85
S1-9 Diversity metrics Own Workforce 87
S1-10 Adequate wages
S1-11 Social protection
S1-12 Persons with disabilities
Not material
Phase-in
Not material
ESRS S1 – Own workforce
S1-13 Training and skills development metrics
Compensation metrics (pay gap and total compensation)
Incidents, complaints and severe human rights
ESRS S2 – Workers in the value chain
ESRS 2, SBM-3 Material impacts, risks and opportunities and their interaction with strategy and
S2-1
S2-3 Processes to remediate negative impacts and channels for value chain workers to raise concerns
S2-4 Taking action on material impacts on value chain workers, and approaches to managing material risks and pursuing material opportunities related to value chain workers, and effectiveness of those actions
S2-5 Targets related to managing material negative impacts, advancing positive impacts, and managing material risks and opportunities
Social standards
ESRS S4 – Consumers and end users
ESRS 2,
SBM-2 Interests and views of stakeholders SH 59
ESRS 2, SBM-3 Material impacts, risks and opportunities and their interaction with strategy and business model IROs 62
S4-1 Policies related to consumers and end users End users 98
S4-2 Processes for engaging with consumers and end users about impacts End users 98
S4-3 Processes to remediate negative impacts and channels for consumers and end users to raise concerns End users 98
S4-4 Taking action on material impacts on consumers and end users, and approaches to managing material risks and pursuing material opportunities related to consumers and end users, and effectiveness of those actions End users 98
S4-5 Targets related to managing material negative impacts, advancing positive impacts, and managing material risks and opportunities End users 98
Governance standards
ESRS G1 – Business conduct
ESRS 2, GOV-1 The role of the administrative, supervisory and management bodies ESG Governance 49-50
ESRS 2, IRO-1 Description of the processes to identify and assess material impacts, risks and opportunities DMA, VCBM, SH 53-59
G1-1 Business conduct policies and corporate culture Business Conduct 100
G1-2 Management of relationships with suppliers - - Not material
G1-3 Prevention and detection of corruption and bribery Business Conduct 101-102
G1-4 Incidents of corruption or bribery Business Conduct 102
G1-5 Political influence and lobbying activities - - Not material
G1-6 Payment practices - - Not material
ESRS data points from other EU legislation
ESRS 2 GOV-1 Board’s gender diversity paragraph 21 (d) Indicator number 13 of Table #1 of Annex I
ESRS 2 GOV-1 Percentage of board members who are independent paragraph 21 (e)
ESRS 2 GOV-4 Statement on due diligence paragraph 30 Indicator number 10 Table #3 of Annex I
ESRS 2 SBM-1 Involvement in activities related to fossil fuel activities paragraph 40 (d) i Indicators number 4 Table #1 of Annex I
Article 449a Regulation (EU) No 575/2013; Commission Implementing Regulation (EU)
In alignment with ESRS 2 appendix B, the table below presents the datapoints that derive from other EU legislation.
Commission Delegated Regulation (EU) 2020/181627, Annex II
Delegated Regulation (EU) 2020/1816, Annex II
Delegated Regulation (EU) 2020/1816, Annex II
2022/245328 Table 1: Qualitative information on Environmental risk and Table 2: Qualitative information on Social risk
ESRS 2 SBM-1 Involvement in activities related to chemical production paragraph 40 (d) ii Indicator number 9 Table #2 of Annex I
ESRS 2 SBM-1 Involvement in activities related to controversial weapons paragraph 40 (d) iii Indicator number 14 Table #1 of Annex I
ESRS 2 SBM-1 Involvement in activities related to cultivation and production of tobacco paragraph 40 (d) iv
ESRS E1-1 Transition plan to reach climate neutrality by 2050 paragraph 14
ESRS E1-1 Undertakings excluded from Paris-aligned Benchmarks paragraph 16 (g)
ESRS E1-4 GHG emission reduction targets paragraph 34
ESRS E1-5 Energy consumption from fossil sources disaggregated by sources (only high climate impact sectors) paragraph 38
Indicator number 4
Table #2 of Annex I
Indicator number 5
Table #1 and Indicator number 5
Table #2 of Annex I
Article 449a Regulation (EU) No 575/2013; Commission Implementing Regulation (EU) 2022/2453 Template 1: Banking book Climate Change transition risk: Credit quality of exposures by sector, emissions and residual maturity
Article 449a Regulation (EU) No 575/2013; Commission Implementing Regulation (EU) 2022/2453 Template 3: Banking book – Climate change transition risk: alignment metrics
Delegated Regulation (EU) 2020/1816, Annex II N/A
Delegated Regulation (EU)
2020/181829, Article 12(1) Delegated Regulation (EU) 2020/1816, Annex II
Delegated Regulation (EU) 2020/1818, Article 12(1) Delegated Regulation (EU) 2020/1816, Annex II
Regulation (EU) 2021/1119, Article 2(1)
Delegated Regulation (EU) 2020/1818, Article12.1 (d) to (g), and Article 12.2
Delegated Regulation (EU) 2020/1818, Article 6
N/A
ESRS data points from other EU legislation
ESRS E1-5 Energy consumption and mix paragraph 37
ESRS E1-5 Energy intensity associated with activities in high climate impact sectors paragraphs 40 to 43
ESRS E1-6 Gross Scope 1, 2, 3 and total GHG emissions paragraph 44
Indicator number 5 Table #1 of Annex I
Indicator number 6 Table #1 of Annex I
Indicators number 1 and 2 Table #1 of Annex I
Article 449a; Regulation (EU) No 575/2013; Commission Implementing Regulation (EU)
2022/2453 Template 1: Banking book – Climate change transition risk: Credit quality of exposures by sector, emissions and residual maturity
ESRS E1-6 Gross GHG emissions intensity paragraphs 53 to 55
ESRS E1-7 GHG removals and carbon credits paragraph 56
ESRS E1-9 Exposure of the benchmark portfolio to climate-related physical risks paragraph 66
ESRS E1-9 Disaggregation of monetary amounts by acute and chronic physical risk paragraph 66 (a) ESRS E1-9 Location of significant assets at material physical risk paragraph 66 (c).
ESRS E1-9 Breakdown of the carrying value of its real estate assets by energy-efficiency classes paragraph 67 (c).
Indicators number 3 Table #1 of Annex I
Article 449a Regulation (EU) No 575/2013; Commission Implementing Regulation (EU) 2022/2453 Template 3: Banking book – Climate change transition risk: alignment metrics
Delegated Regulation (EU) 2020/1818, Article 5(1), 6 and 8(1)
ESRS E1-9 Degree of exposure of the portfolio to climate related opportunities paragraph 69
Article 449a Regulation (EU) No 575/2013; Commission Implementing Regulation (EU)
2022/2453 paragraphs 46 and 47; Template 5: Banking book – Climate change physical risk: Exposures subject to physical risk.
Article 449a Regulation (EU) No 575/2013; Commission Implementing Regulation (EU)
2022/2453 paragraph 34; Template 2: Banking book – Climate change transition risk: Loans collateralised by immovable property – Energy efficiency of the collateral
Delegated Regulation (EU) 2020/1818, Article 8(1)
Delegated Regulation (EU) 2020/1818, Annex II Delegated Regulation (EU) 2020/1816, Annex II
Regulation (EU) 2021/1119, Article 2(1) N/A
Delegated Regulation (EU) 2020/1818, Annex II
ESRS data points from other EU legislation
ESRS E2-4 Amount of each pollutant listed in Annex II of the EPRTR Regulation (European Pollutant Release and Transfer Register) emitted to air, water and soil, paragraph 28
Indicator number 8
Table #1 of Annex I
Indicator number 2
Table #2 of Annex I
Indicator number 1
Table #2 of Annex I
Indicator number 3
Table #2 of Annex I
ESRS E3-1 Water and marine resources paragraph 9 Indicator number 7
#2 of Annex I
ESRS E3-1 Dedicated policy paragraph 13 Indicator number 8
2 of Annex I
ESRS E3-1 Sustainable oceans and seas paragraph 14 Indicator number 12 Table #2 of Annex I
ESRS E3-4 Total water recycled and reused paragraph 28 (c) Indicator number 6.2
ESRS E3-4 Total water consumption in m3 per net revenue on own operations paragraph 29
Table #2 of Annex I
number 6.1
#2 of Annex I
ESRS 2- IRO 1 – E4 paragraph 16 (a) i Indicator number 7
#1 of Annex I
ESRS 2- IRO 1 – E4 paragraph 16 (b) Indicator number 10
#2 of Annex I
ESRS 2- IRO 1 – E4 paragraph 16 (c) Indicator number 14
Table #2 of Annex I
ESRS E4-2 Sustainable land / agriculture practices or policies paragraph 24 (b)
Indicator number 11 Table #2 of Annex I
ESRS E4-2 Sustainable oceans / seas practices or policies paragraph 24 (c) Indicator number 12 Table #2 of Annex I
ESRS E4-2 Policies to address deforestation paragraph 24 (d) Indicator number 15
Table #2 of Annex I
ESRS E5-5 Non-recycled waste paragraph 37 (d) Indicator number 13
ESRS E5-5 Hazardous waste and radioactive waste paragraph 39
Table #2 of Annex I
Indicator number 9
Table #1 of Annex I
ESRS data points from other EU legislation
ESRS 2- SBM3 – S1 Risk of incidents of forced labour paragraph 14 (f)
ESRS 2- SBM3 – S1 Risk of incidents of child labour paragraph 14 (g)
ESRS S1-1 Human rights policy commitments paragraph 20
ESRS S1-1 Due diligence policies on issues addressed by the fundamental International Labor Organisation Conventions 1 to 8, paragraph 21
ESRS S1-1 Processes and measures for preventing trafficking in human beings paragraph 22
ESRS S1-1 Workplace accident prevention policy or management system paragraph 23
ESRS S1-3 Grievance/complaints handling mechanisms paragraph 32 (c)
ESRS S1-14 Number of fatalities and number and rate of work-related accidents paragraph 88 (b) and (c)
ESRS S1-14 Number of days lost to injuries, accidents, fatalities or illness paragraph 88 (e)
ESRS S1-16 Unadjusted gender pay gap paragraph 97 (a)
ESRS S1-16 Excessive CEO pay ratio paragraph 97 (b)
ESRS S1-17 Incidents of discrimination paragraph 103 (a)
ESRS S1-17 Non-respect of UNGPs on Business and Human Rights and OECD paragraph 104 (a)
Indicator number 13
Table #3 of Annex I
Indicator number 12
Table #3 of Annex I
Indicator number 9
Table #3 and
Indicator number 11
Table #1 of Annex I
Delegated Regulation (EU) 2020/1816, Annex II
Indicator number 11
Table #3 of Annex I
Indicator number 1
Table #3 of Annex I
number 5 Table #3 of Annex I
Indicator number 2
Table #3 of Annex I
Indicator number 3
Table #3 of Annex I
Indicator number 12
Table #1 of Annex I
Indicator number 8
Table #3 of Annex I
Indicator number 7
Table #3 of Annex I
Indicator number 10
Table #1 and Indicator number 14
Table #3 of Annex I
Delegated Regulation (EU) 2020/1816, Annex II
Delegated Regulation (EU) 2020/1816, Annex II
Delegated Regulation (EU)
2020/1816, Annex II Delegated Regulation (EU) 2020/1818 Art 12 (1)
ESRS data points from other EU legislation
ESRS 2- SBM3 – S2 Significant risk of child labour or forced labour in the value chain paragraph 11 (b)
ESRS S2-1 Human rights policy commitments paragraph 17
ESRS S2-1 Policies related to value chain workers paragraph 18
SRS S2-1 Non-respect of UNGPs on Business and Human Rights principles and OECD guidelines paragraph 19
ESRS S2-1 Due diligence policies on issues addressed by the fundamental International Labor Organisation Conventions 1 to 8, paragraph 19
ESRS S2-4 Human rights issues and incidents connected to its upstream and downstream value chain paragraph 36
Indicators number 12 and 13
Table #3 of Annex I
Indicator number 9
Table #3 and Indicator number 11
Table #1 of Annex I
Indicator number 11 and 4
Table #3 of Annex I
Indicator number 10
Table #1 of Annex I
Delegated Regulation (EU) 2020/1816, Annex II Delegated Regulation (EU) 2020/1818, Art 12 (1)
Delegated Regulation (EU) 2020/1816, Annex II
Indicator number 14
Table #3 of Annex I
ESRS S3-1 Human rights policy commitments paragraph 16 Indicator number 9
Table #3 and Indicator number 11
Table #1 of Annex I
ESRS S3-1 non-respect of UNGPs on Business and Human Rights, ILO principles or and OECD guidelines paragraph 17
Indicator number 10
Table #1 of Annex I
Delegated Regulation (EU) 2020/1816, Annex II Delegated Regulation (EU) 2020/1818, Art 12 (1)
ESRS S3-4 Human rights issues and incidents paragraph 36 Indicator number 14
ESRS S4-1 Policies related to consumers and end users paragraph 16
Table #3 of Annex I
Indicator number 9
Table #3 and Indicator number 11
Table #1 of Annex I
ESRS data points from other EU legislation
ESRS S4-1 Non-respect of UNGPs on Business and Human Rights and OECD guidelines paragraph 17
Indicator number 10
Table #1 of Annex I
ESRS S4-4 Human rights issues and incidents paragraph 35 Indicator number 14 Table #3 of Annex I
ESRS G1-1 United Nations Convention against Corruption paragraph 10 (b)
ESRS G1-1 Protection of whistleblowers paragraph 10 (d)
ESRS G1-4 Fines for violation of anti-corruption and anti-bribery laws paragraph 24 (a)
ESRS G1-4 Standards of anticorruption and anti- bribery paragraph 24 (b)
number 15
#3 of Annex I
number 6
#3 of Annex I
Indicator number 17
Table #3 of Annex I
number 16
#3 of Annex I
Delegated Regulation (EU) 2020/1816, Annex II Delegated Regulation (EU) 2020/1818, Art 12 (1)
Regulation (EU) 2020/1816, Annex II)
MAERSK PRODUCT TANKERS
The sustainability chapter from Maersk Product Tanker’s Annual Report for 2024 is enclosed on the next pages.
MAERSK TANKERS
The sustainability chapter from Maersk Tanker’s Annual Report for 2024 is enclosed on the next pages.
Extract from Management review from the Annual Report of Maersk Tankers AS for year ended 31 December 2024
Management review
(deleted paragraphs)
Sustainability
The shipping industry plays a critical role in providing the world with a reliable supply of energy. It is an efficient and dependable mode of transportation that enables people and economies to thrive.
The industry, by its very nature, is global with multiple stakeholders in its supply chain. Its impact on people and the planet comes with a responsibility to consider and promote the integration of economic, social and environmental activities into core business practices.
Maersk Tankers’ business model is focused on the commercial management of tanker vessels on behalf of shipowners. As a values-led company that is guided by its purpose, we are committed to the United Nations Global Compact (UNGC) principles on human rights, labour, anti-corruption and the environment. We expect our stakeholders to focus their efforts on important issues such as fighting corruption, climate change, the fair treatment of workers, and diversity, equity and inclusion. The health and safety of employees, as well as the safety of the vessels and cargoes, continue to be of the highest priority.
Climate
Tackling climate change is a pressing issue. Shipping transports about 90% of world trade and accounts for nearly 3% of the world’s CO2 emissions. While there is substantial work ahead of the industry to decarbonise, it is encouraging to see the industry increasingly mobilising and taking action to reduce its environmental impact.
As the manager of a sizeable fleet, we are committed to the United Nations Sustainable Development Goal 13 that seeks to combat climate change and its impact. In action, this means we are investing, developing and deploying solutions that help shipowners cut vessel emissions.
During 2024, we have successfully implemented the European Union Emission Trading Scheme (ETS) regulations and have been preparing for the implementation of the Fuel EU Maritime regulation that will be introduced in 2025. We engaged proactively with our pool partners to manage the introduction of EU Allowances (EUAs) effectively. This includes commercial, reporting and compliance related aspects of the regulation.
For the year 2024, our commitment towards fuel optimisation was undeterred resulting in fuel savings amounting to 7 775 MT baselined to 2023 consumptions which relates to 0.55 MTCO2 per vessel per day. This has also resulted in a total accumulated fuel savings of 101.978 MT with 2017 baseline enhancing our commitment to all aspects of decarbonisation through optimum operational efficiency and collaboration with our pool partners.
As part of our strategy to reduce our environmental footprint and advance sustainable solutions in maritime transportation, we are set to deploy eSAIL® suction sail technology on five of our Maersk Product Tanker’s MR vessels. The eSAIL® works by dragging air across its aerodynamic surface to generate lift and propulsive efficiency, which significantly reduce fuel use and CO2 emissions. Each vessel will be equipped with four 26-meter autonomous eSAIL® systems, which automatically adjust to wind conditions for optimal performance. The technology will be installed on the vessels Maersk Tacoma, Maersk Tampa, Maersk Tangier, Maersk Teesport, and Maersk Tokyo during dry dock periods in 2025 and 2026.
In line with previous years, our initiatives in 2024 have been focused on not just adhering to existing regulations but also proactively preparing for future challenges. Our concerted efforts reflect a blend of operational efficiency, regulatory adherence, and environmental responsibility. As we continue to embrace technology and innovation, we remain committed to driving positive, sustainable change within the shipping industry.
Responsible business
Conducting business in a responsible manner is imperative for Maersk Tankers. We are committed to eliminating corruption, including facilitation payments, safeguarding human rights, and ensuring compliance with sanctions, and other relevant laws.
We monitor geopolitical developments, and we respond quickly when sanctions are introduced or changed. The industry has seen 15 new sanctions packages introduced by the EU (the latest in December 2024) since Russia’s invasion of Ukraine. We work to ensure compliance in our operations by following procedures and using screening tools. We continuously review and update our processes to ensure that they reflect current regulations. As a result of our work, we continued trading our fleet in compliance with the constantly changing complex sanctions landscape in 2024.
We are committed to providing a safe, healthy, and supportive work environment that promotes the physical, mental, and emotional wellbeing of our employees.
We believe that employee wellbeing is essential to the success of our business, and we are dedicated to fostering a culture of wellbeing that supports our employees in achieving their full potential.
That is why we, among other things, offer flexible working opportunities allowing employees to better balance the commitments of work and private life, a balanced set of social activities focused on physical and mental health driven by local employee committees, and a holistic development approach for employees to proactively voice and work on how they contribute, grow, and thrive.
We will continue to take measures and support our employees in addition to the policies and systems already in place as outlined in the employee handbooks.
As a company that operates globally, we have a large network of suppliers which implies a risk of human rights violations in the value chain that could have negative repercussions on Maersk Tankers. We work with our strategic partners to ensure suppliers conduct business responsibly in accordance with international and own company standards. Maersk Tankers has, for example, in its Third-Party Code of Conduct set out minimum requirements for the Maersk Tankers business and all direct counterparties, including but not limited to customers, partners, suppliers, and all parties acting on behalf of Maersk Tankers in connection with vessels managed by Maersk Tankers. Maersk Tankers requires that all counterparties operate in accordance with responsible business principles detailed in the Third-Party Code of Conduct and in full compliance with all applicable laws and regulations. The Third-Party Code of Conduct deals with business ethics, health and safety, environment, working conditions and employment practices, including human rights, and diversity, equity and inclusion. Periodic reviews and follow-up audits as per our internal risk procedures are conducted to monitor the compliance levels. In addition, Maersk Tankers offers a Whistleblower hotline where internal and external parties can report misconduct.
The maritime industry poses an inherent risk of corruption due to the prevalence of administrative monopolies over services such as seaports We have strict policies to ensure that we do not engage in corruption of any kind. We are a member of the Maritime Anti-Corruption Network (MACN), which works towards eliminating corruption and enabling fair trade, and we strictly adhere to our Zero Facilitation Payment Policy. Our stance and expectations on anti-corruption and bribery are also stressed in our Third-Party Code of Conduct. We will proceed with our work in this important area, taking our part in driving positive change in shipping.
There have been zero bribery cases in 2024 in line with our ambitions.
We will continue our work on eliminating corruption as a member of MACN and following our Zero Facilitation Payment Policy in 2025 as it enables to achieve our anti-corruption objectives.
We have an unwavering commitment to sustainability and will continue to work to create a positive impact for society and the planet.
You can read about our sustainability work at:
https://maersktankers.com/strategy/sustainability
Diversity, equity, and inclusion
Maersk Tankers is dedicated to advancing Diversity, Equity, and Inclusion (DEI) by integrating DEI into our culture, mindsets, processes, and daily collaboration.
We are committed to creating a diverse, equitable, and inclusive workplace where everyone regardless of their gender, ethnicity, experience, religion, sexual orientation, disability, and age feels valued, respected, and can thrive. We employ a workforce of various nationalities, ages, cultures, and experiences in an effort to mirror the diverse and global world we operate in.
In 2024, we developed a new reward philosophy and model to promote enhanced fairness and equity. Our structured, standardized, and aligned approach to rewards enables a fair, consistent, sustainable, and scalable framework, reinforcing our commitment to DEI, and our dedication to eliminating biases. We incentivize what shapes our culture and drives our business.
Throughout 2024, our integration efforts have demonstrated the value of combining diverse perspectives and mindsets. By leveraging the strengths of the two companies, we have identified other ways to improve performance and deliver greater value to our customers, partners, and stakeholders. This experience has reinforced that DEI should be an integral part of our daily work and processes, driven by our commitment to being one team, second to none, founded on a strong culture where we share perspectives, are diverse and inclusive, and enhance the way we think and act every day.
In accordance with the guidelines from the Danish Business Authority, there is equal representation in the Board of Directors and other management levels of Maersk Tankers. Management
As we advance in the years to come, leadership will play an important role in our ongoing commitment to DEI too. While we all cultivate an inclusive culture that values diverse perspectives and promotes equity, our leader’s proactive engagement will continue to drive impactful change and fostering a vibrant workplace where everyone can thrive and excel/achieving their full potential.
(deleted paragraphs)
KK WIND SOLUTIONS
KK Wind Solutions’ sustainability report for 2024 is enclosed on the next pages.
Part of the energy evolution


Sustainability Report 2024
Letter From the Chair and the CEO
2024 marked another year of strong progress and continued growth for KK Group. As we journey forward, enabling electrification through renewable energy remains at the core of our business.
In a year characterized by geopolitical turbulence and economic complexity, our company has achieved several significant milestones in 2024. We surpassed the 1 billion euro revenue mark while continuing to integrate acquisitions from previous years. Our strong commercial performance across our diverse product and service offerings has been a key driver of our success.
Through our core business – power converters and controls in wind turbines – we enable our customers and society to transition towards electrifying the world with renewable energy. We are focused on maintaining a strong position in the wind industry while building a strong bridge into other sectors and industries to harness solutions and technologies beyond wind.
Our financial achievements in 2024 were accompanied by several transformational steps. We maintained a strict focus on our customers and the delivery of our products and solutions. This year also saw the acquisition of Nissens Cooling Solutions Group, bringing new colleagues, customers and solutions accelerating our expansion into related industries.
We are leveraging our substantial footprint in the wind industry to expand into other renewable businesses and
new frontiers like Power-to-X. Building on our acquisition of Nissens Cooling Solutions Group, we can complement our current business setup by impacting more industries in their journey towards electrification, improved energy efficiency and reducing reliance on fossil fuels. Our advanced cooling systems, as well as our monitoring and sensing solutions, will be cornerstones of our growth journey and our expansion into other sectors.
Looking forward, we expect our legacy in wind to continue at a strong level; however, the growth rate in our wind business will be slightly lower compared to previous driven by an expected general slow down in the global wind market during 2025. Going forward, we will continue to focus on productivity and safety for our people while demonstrating scale and efficiency in our
operations through the acquisitions we have made over the recent years. This will enable continuously improving the profitability for our company while putting us in the best position to enjoy future growth and expansion.
As we continue to navigate the challenges posed by geopolitical and economic uncertainties, our commitment serving our customers, to sustainability and to innovation will remain unwavering. Together, we will build on this years’ achievements and drive further success in the years to come.
We would like to sincerely thank our customers and dedicated employees for their cooperation and contribution throughout the year. We are looking forward to continue working together.
Pernille Erenbjerg Chair
CEO
Mauricio Quintana
IN BRIEF
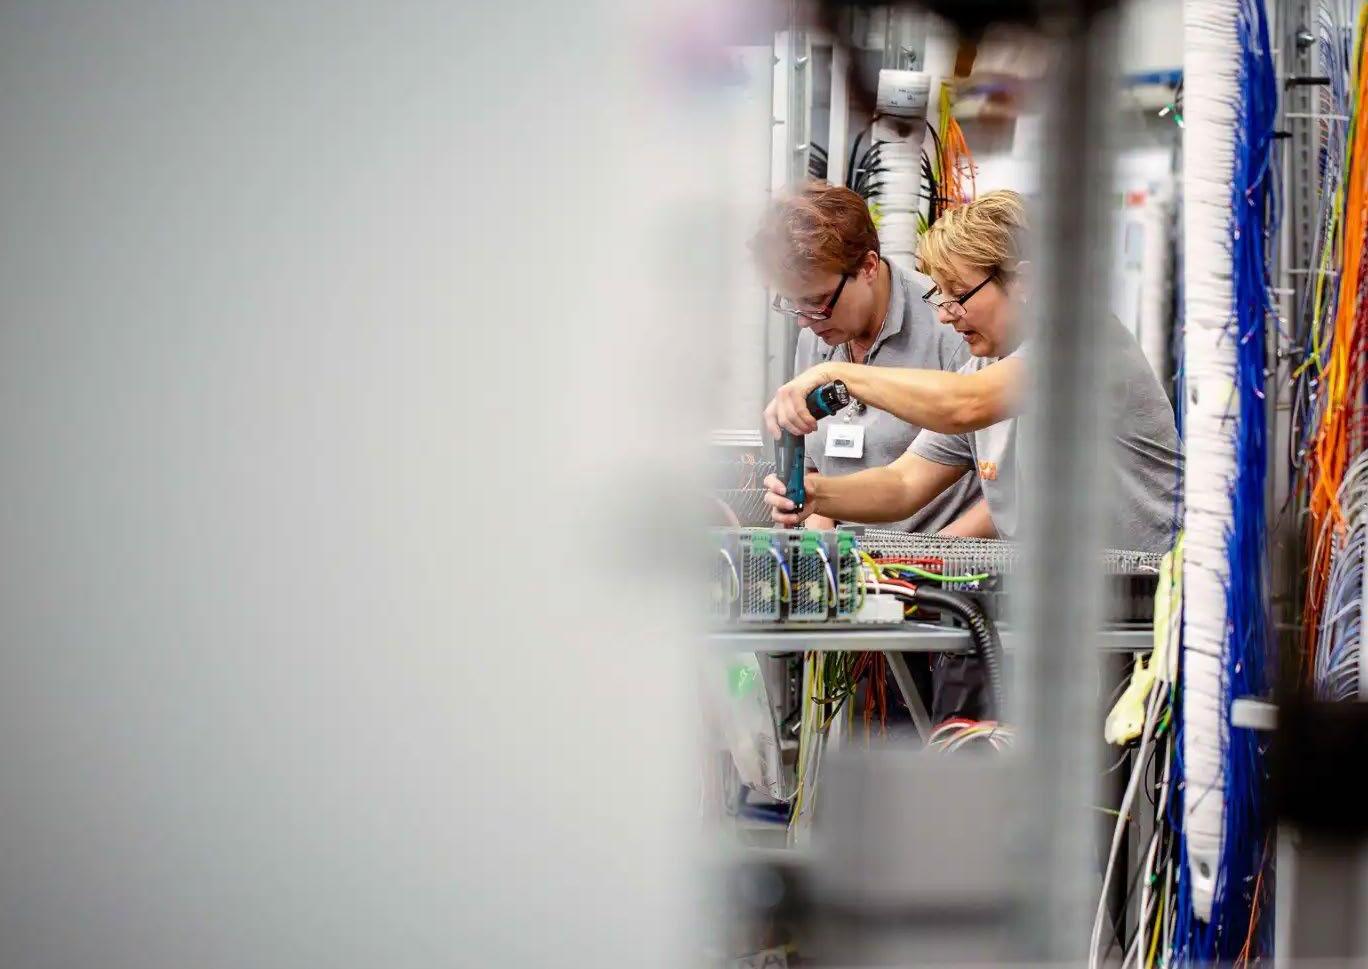
The facts and figures behind our story
Sustainability Report 2024 I N B RIEF
Our History
Innovation and collaboration have defined our approach for over 40 years. Every day, we continue to uphold the legacy of our founders, who were part of developing one of the world’s first gridconnected wind turbines.
As the wind power industry has grown, we have continued to innovate, developing new and more advanced electrical systems to meet the evolving needs of our customers. With our collaborative approach, we have been able to adapt our expertise to expand beyond wind turbines and build a global profile across other industrial applications and growing renewable sectors like Power-to-X (PtX).
KK-Electronic is established and a factory is built in Herning, Denmark.
We partner with Bonus Energy, later to become Siemens Wind Power, becoming sole supplier of control systems.
We launch a new control system, WTC3, which becomes a key product.
New headquarters and production facilities in Ikast, Denmark.
We enter into large customer partnerships and become a systems supplier.
A.P. Møller
Holding steps in as new owner.
We acquire PCH Engineering and advance with vibration monitors. We establish a new production facility in Taichung, Taiwan.
We acquire the converters and controls business from Vestas, including production facilities in Hammel, Denmark, Chennai, India and Tianjin, China.
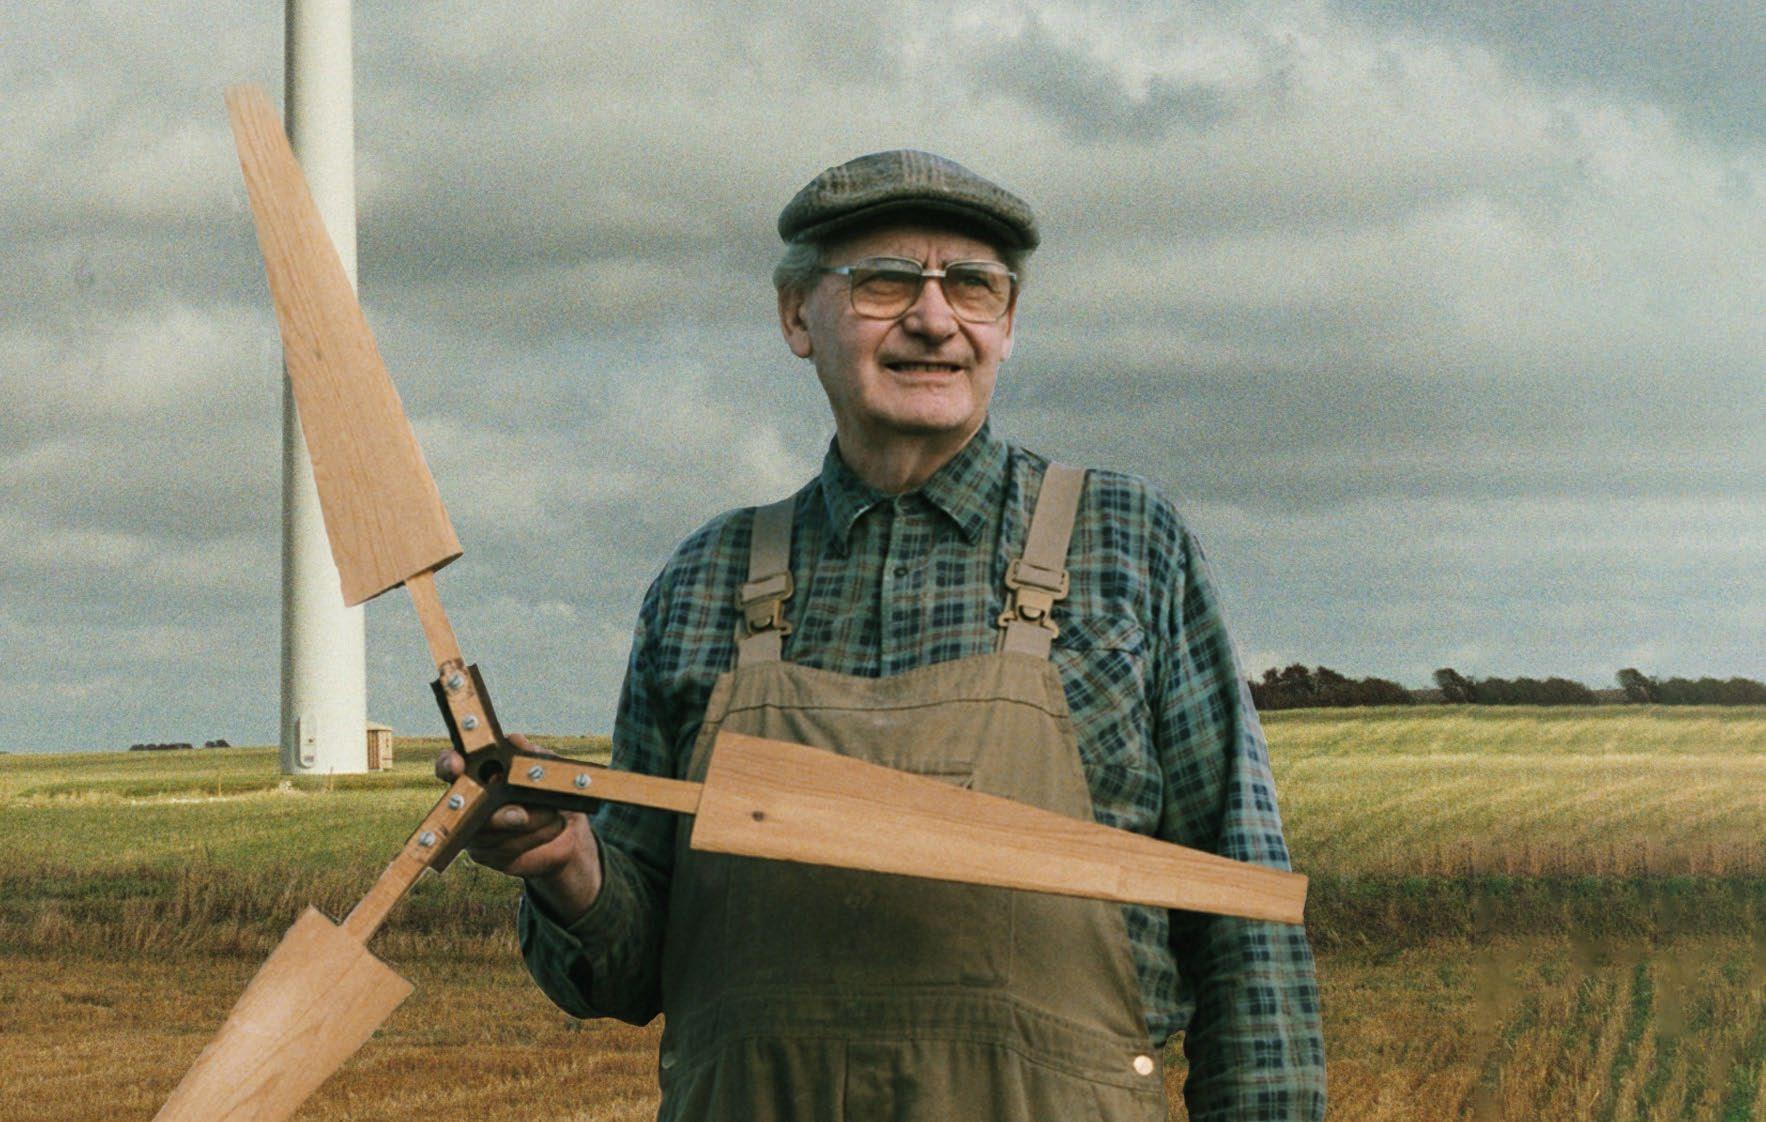
Our founders develop one of the first electrical control systems for a wind turbine, the 22kW Riisager.
We launch the industry’s first SCADA system.
The world’s first offshore wind farm is built at Vindeby, Denmark, equipped with our control and surveillance systems. New production facilities in Szczecin, Poland.
To better represent what we do, KK-Electronic is renamed KK Wind Solutions. An office and distribution centre is also opened in Kansas, USA.
New production facilities in Bangalore, India. New office in Madrid, Spain and Shanghai, China.
We acquire Gram & Juhl and advance our capabilities within Turbine Condition Monitoring (TCM ®).
We acquire ConverterTec’s R&D department and IP portfolio and strengthen our offerings within power conversion.
We acquire Nissens Cooling Solutions Group which has a footprint in Denmark, Czechia, Slovakia and China.
Highlights
Power & Controls
Cooling Solutions
Monitoring Solutions
Global Service
Ownership
Key customers across product offerings
Product offerings Wind Turbines equipped with KK Group systems 70% of the global offshore capacity is equipped with KK Group systems
Global Footprint
Total manufacturing footprint of 241,000 m2 of which 97.000 m2 is designated for Cooling Solutions.
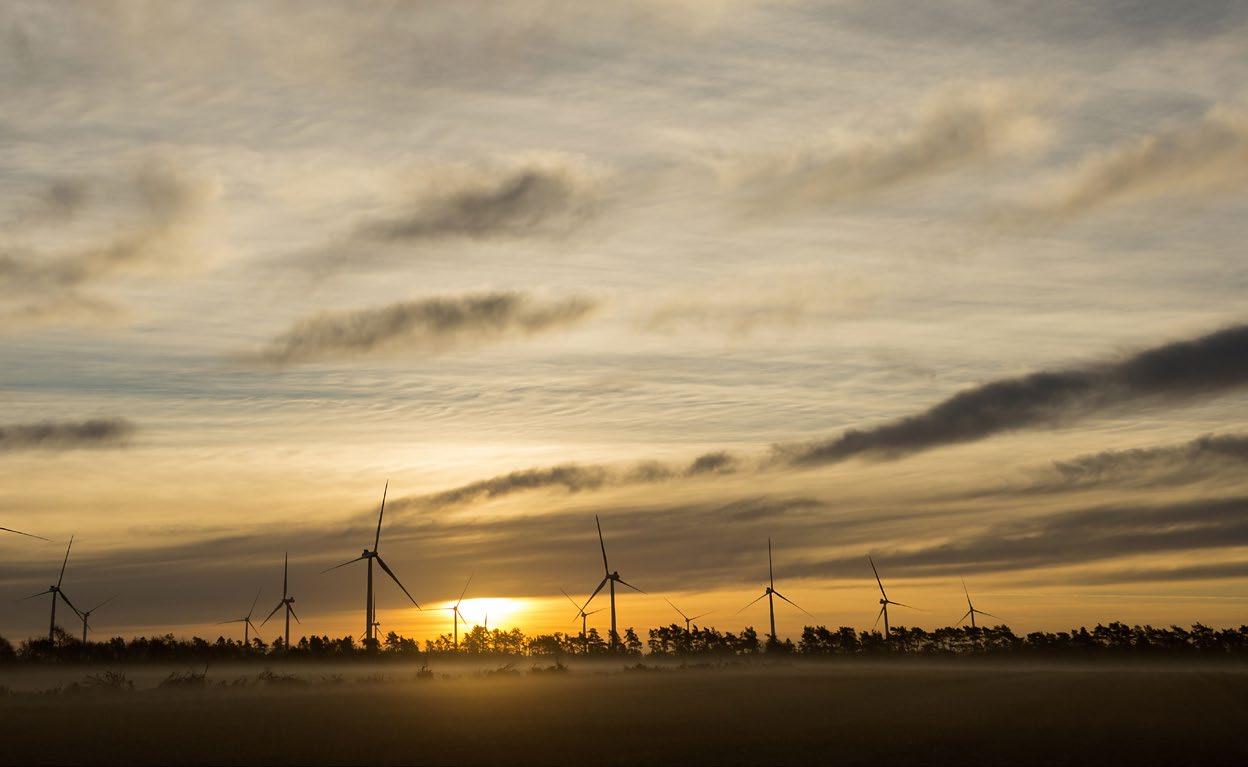
Patent families +50 years of experience in cooling solutions for industrial applications +40 years of experience in the wind industry

Sustainability Review
In 2024, the sustainable business transformation continued and thereby contributing to avoided GHG emissions of 490 Mt, up from 432 Mt in 2023. Following the acquisition of Nissens Cooling Solutions, the environmental and social numbers have increased.
Environment
The energy consumption at KK Group has increasingly shifted towards renewable energy, with 58% of the energy consumption in 2024 coming from renewable sources. This is mainly driven by sourcing 100% of our electricity from renewable sources. Thereby, also succeeding in meeting customer requirements one year ahead of plan. The GHG emissions from scope 1 and 2 were positively impacted by this, leading to a 25% reduction from 2023.
Social
The number of employees increased following the acquisition of Nissens Cooling Solutions and additional hiring in response to business expansion needs. At year-end 2024, KK Group had 3,682 employees. The restructuring of Nissens Cooling Solutions in 2024 impacted the employee turnover rate which at 27% was significantly higher than the 10% in 2023. The gender diversity in Senior Management improved to reach 15% with a target of 20% in 2027.
The KK Group’s focus on health and safety continued with no fatalities in 2024 and a lost time injury frequency rate of 1.68 negatively impacted by the acquisition of Nissens Cooling Solutions and above the set target of 1.
Governance
The Board of Directors achieved the ambition of securing 40% female representation in the Board of Directors up from 20% in 2023.
No incidents of corruption or bribery were recorded in 2024.
Sustainability data summary
ENVIRONMENT
GOVERNANCE
Share
STRATEGY

Our plan is to always be part of the next chapter
Corporate Strategy
Through our strategy, we deliver a positive climate impact
Building upon our legacy of more than 40 years within the wind industry, we leverage our knowledge and expertise to drive transformative change through innovation and a steadfast commitment to sustainability. We recognize our unique responsibility and opportunity to deliver solutions that empower industries and communities, all while maintaining a healthy business – for people, profit, and planet.
Our Corporate Strategy is the foundation of our commitment to delivering a positive impact. Our strategy aims to influence our customers, employees, and the communities we serve, while optimizing the value of KK Group by expanding and balancing our operating segments and reducing business risks to create a company that will withstand the test of time.
Our strategic goals toward 2030 include continuing the diversification of our business organically and inorganically, driving digital transformation, and delivering competitive and sustainable electro-mechanical and cooling system supplies. Our strategic goal is to more than double our turnover by 2030.
In 2024, we initiated a strategy revision to better reflect our market position and future aspirations. This involves
exploring strategic opportunities within four differentiated business segments: Power & Controls, Cooling Systems, Monitoring Solutions, and Global Service. By evolving our current strategy, we aim to better match our products, footprint and end markets, creating opportunities for future scaling and efficiencies. We strive to design and sell solutions that we support throughout the total lifetime of the products.
As we move forward, our strategy will continue evolving in response to market demands and trends.
Collaborating for success
At KK Group, we do not only work for our customers, we work with them. Our mission is to create a meaningful climate impact, and we believe the best way to achieve this is through genuine partnerships.
These partnerships are built on trust, shared goals, and an unwavering commitment to innovation.
To us, collaboration is about getting to the heart of our customers’ challenges. By working side-by-side, we gain deep insights that allow us to design solutions tailored to their unique needs.
“Partnership is commitment, and commitment thrives on mutual trust. Trust is cultivated through dedicated time, transparency, and close collaboration, and it is reinforced by reliability and consistently honouring our commitments. KK Group is one of
our Strategic Partners at Vestas and we strongly value this partnership, and our mutual reliance is the cornerstone of a sustainable and long-term business relationship.”
— Oliver Dreier, Senior Vice President, Direct Material Procurement at Vestas
One of the secrets to our success lies in co-creation. Together with our partners, we develop cutting-edge solutions that keep pace with the dynamic demands of the renewable energy market. This two-way exchange fosters a culture of constant learning, enabling us to stay ahead of the curve while empowering our customers to do the same. In 2024, Siemens Gamesa granted us the title of official strategic partner.
“KK Group is a technically competent development partner for Siemens Gamesa Renewable Energy and is well integrated with our teams. With KK Group’s investment in product cost-out, you have developed positively in means of competitiveness, while keeping a high quality. We appreciate this path for the mutual benefit of both parties.”
— Anders Helbo Mortensen, Head of Nacelle Module Technology at Siemens Gamesa Renewable Energy
Looking ahead, we are more committed than ever to deepening our collaborations, whether by exploring uncharted challenges or expanding our reach.
Our Business Model
We simplify complexity for our customers by delivering innovative engineering solutions on time and with the highest quality standards. Over the last decade, our customers entrusted us with a larger share of their design work, moving from mainly delivering Build-to-Print (BtP) to having a large share of of Build-to-Spec (BtS) and design projects.
We constantly challenge ourselves to innovate and develop our own proprietary products, which benefits our customers and helps optimize the costs and improve the competitiveness of the renewable industry.
Our solutions include a wide range of products, software and services, from development to installation, monitoring and maintenance. This enables KK Group to offer customers a single source for all their electrical, wind turbine, and renewable energy system needs.
In 2024, we diversified our business further by adding a new product offering “Cooling Solutions”, serving as a single source for electro-mechanical and cooling solutions supplying to multiple industrial segments such as: Wind, PtX, construction, mining, rail, defense, and engines.
Our focus on the wind industry will continue. As wind turbines keep growing in size and power output, it becomes increasingly important to develop modular and standardized solutions that are easy to transport, install, operate and service. Our products are critical for wind
turbines, while our services and monitoring solutions help extend their lifespan.
The already installed fleet of turbines is aging. Therefore, it requires continuous monitoring and service to ensure lifetime extension. As both onshore and offshore turbines are increasing in energy density and size, the demand for digital and monitoring solutions and service agreements become essential for both Original Equipment Manufacturers (OEMs) and Asset Owners.
In addition, we are working towards expanding our PtX product portfolio.
Our flexible and globally mobile workforce, which consists of highly skilled engineers and technicians, takes a proactive approach to turbine operations and maintenance. Our teams can support the entire lifetime of a wind turbine from prototype testing, pre-commissioning and High Voltage services for installation to predictive maintenance, supply and repair of spare parts, retrofit, and upgrade solutions.
Our key customers are served directly through account management teams. In addition, we also sell to channel partners allowing us to reach geographies and end segments that we do not directly serve.
A global presence with operations in Europe, Asia, and North America enables us to serve our customers around the world. We aim to establish a regional manufacturing presence to ensure proximity to our customers and provide them with the necessary support where they need it.

Product Area Strategy and Progress
Our product area strategy is highly aligned with our corporate strategy, ensuring that our product lines are innovative, sustainable, and competitive. We aim to meet customer needs and stay ahead of market trends by focusing on the following four key areas:
Our Power Converters have advanced standardization and modularization, designed to meet the diverse needs of various industries, including Wind and PtX; these converters deliver flexibility and reliability. Our Power Backup Systems continue to be a core part of our product offerings, focusing on utilizing standard building blocks to serve a broad range of renewable applications.
innovations without the constraints of maintaining legacy products.
Operationally, the closure of our Horsens production site has been a pivotal step in streamlining our footprint. By consolidating into three core production sites, we have optimized our capacity and improved our efficiency. This transition positions us to deliver more effectively while reducing our environmental impact.
Power and Controls: Within our Power and Controls, we focus on the development and supply of power converters, control systems, energy storage systems, and integrated systems for wind turbines and other applications. We provide cost-effective, reliable, and compact solutions that meet our customers’ specific requirements, including Build-to-Spec and Build-to-Print products. In addition, we have designed our own PtX solutions and energy storage products.
Our Power and Control area has made 2024 a year of transformative progress. With a focus on next-generation advanced control systems, we have introduced new features like Blade Deflection and Feed Forward Control powered by Blade Load Sensors. These technologies promise to set new benchmarks for precision and performance.
Cooling Solutions: In Cooling Solutions, we design and supply cooling systems for wind turbines and various industrial applications. This includes full system supplies, cooling solutions, and individual coolers. We provide high-quality, efficient cooling systems that meet customers’ specific needs in sectors such as wind energy, construction, mining, rail and defense.
In 2024, we introduced our cooling solutions by acquiring Nissens Cooling Solutions. During the year, we have focused on enhancing our product portfolio and operational efficiency, setting the stage for continued innovation and excellence.
As part of our complexity reduction initiative, we have refined our customer base to focus on key partnerships, phasing out outdated technologies. This shift allows us to prioritize advancements in our production facilities, ensuring that our customers benefit from the latest
One of this year’s highlights is the introduction of a powerful new calculation model tool, enabling precise and optimal design for the coolers in our product range.
Monitoring Solutions: Monitoring Solutions offers hardware, software, and services to monitor wind turbines’ and industrial machinery’s health and performance. This includes condition monitoring systems (CMS) and vibration monitoring systems (VMS) that help customers reduce maintenance costs, extend asset lifespan, and prevent complete loss of assets. The business model is based on hardware sales, software licenses, and recurring revenue from monitoring services.
In 2024, Monitoring Solutions continued their efforts in providing advanced technological solutions for our customers.
We have put forward a new strategy, including covering the basics and enhancing data access and analysis. Our aim is to maintain focus on core competencies within Monitoring Solutions while expanding our scope to other KK Group business areas.
With the organizational changes implemented in 2024, we have better alignment between our products, footprint, and end markets. The aim is to have a scalable organization where we can support new customers. All our monitoring solutions are now being produced from our facility in Hammel, while sales and product development activities were moved to a new office in Copenhagen.
To prepare for sustainable growth, we have implemented a transformative new structure in our Service Operations. This reorganization supports our expansion and facilitates the integration of acquired factories from Vestas’ converters and controls business. These efforts ensure that our customers benefit from a more comprehensive and aligned service portfolio.
We improved our repair and warranty business to enhance customer support and deliver faster, more tailored solutions. Throughout the process, we have remained committed to evolving our services to deliver value and elevate customer satisfaction.
Global Service: Global Service provides a range of services to support the operation and maintenance of wind turbines. This includes supplying electromechanical spare parts, high voltage services, field service technicians, repair services, and engineering support. The goal is to help customers reduce downtime, extend the lifespan of their assets, and optimize performance. The business model includes both one-off sales and long-term service agreements, focusing on creating customer loyalty through value-added services.
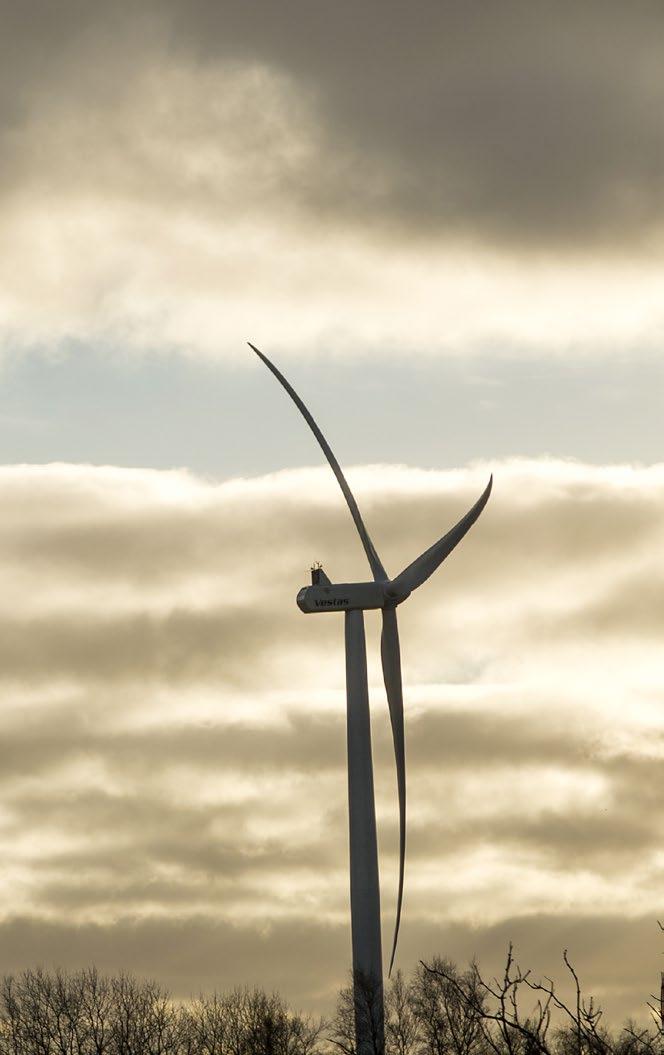
Market Outlook
As a mid-tier manufacturing company in the renewable energy industry, KK Group remains humble yet determined to make a significant impact in the green transition. While 90% of our business is within the wind industry, our ambition is to leverage our knowledge and expertise in areas beyond the wind industry to include PtX and selected industrial segments through our Cooling Solutions.
In the global market, we see three megatrends where we can contribute in a significant way: 1) geopolitical fragmentation, 2) climate change acceleration, 3) digitization, AI, and cyber security.
The current geopolitical turbulence and economic complexity present both challenges and opportunities for KK Group. The foreseen growth in the wind industry stems from the need to have energy security, increase strategic industries competitiveness, and take action against climate change. Market dynamics are changing due to an increased focus on having domestic industries, local content requirements and enhanced sustainability standards. Policies like the Net-Zero Industry Act and increased governmental funds for innovation are supporting new growth opportunities.
At the same time, climate change is accelerating, and in 2024, we were around 1.6ºC¹ above the global average temperatures of the preindustrial period, making our
contributions more critical than ever. Major trends show that the global electricity demand is expected to double by 2050, while the global capacity of renewable energy is set to nearly triple by 2030. Investments in energy efficiency are also projected to rise from 575 bEUR annually to 1,725 bEUR by 2030².
We aim to lead in digital transformation. AI advancement and cyber security are areas where we can contribute as we continue to advance our monitoring solutions and vibration detection, working intently with data to improve the service we provide to our customers and prolong the lifespan of both onshore and offshore turbines and in other sectors.
By understanding and leveraging these megatrends, KK Group aims to play a pivotal role in the global effort to combat climate change and drive sustainable development.
Despite the long-term upward trend in the global wind industry, driven by green transformation and the electrification of major industries, we anticipate continued volatility in the global wind energy market. We remain optimistic about the prospects of the US onshore market as a driver for the growth of KK Group going forward.
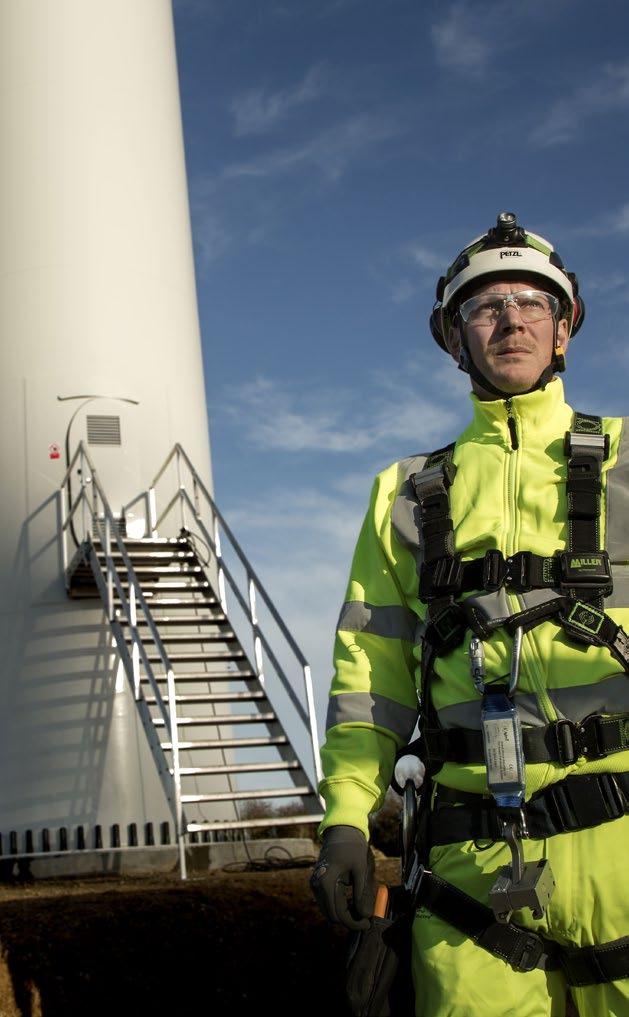
¹https://www.reuters.com/business/environment/2024-was-first-year-above-15c-global-warming-scientists-say-2025-01-10/ ²https://www.iea.org/news/doubling-global-pace-of-energy-efficiency-progress-by-2030-is-key-step-in-efforts-to-reach-net-zero-emissions
GOVERNANCE

The strength of being part of an owner group that cares
Governance Framework
KK Group and its operating companies have been owned by A.P. Møller Holding A/S since 2019. Our governance structure is based on close coordination between the Board of Directors and Executive Management.
Shareholders and general meetings
The shareholders of KK Group exercise their right to vote at the Annual General Meeting which includes the appointment of the Board of Directors, who, together with the Executive Board appointed by the board, are responsible for the management of KK Group.
Board of Directors
The Board of Directors is responsible for the overall strategic management of KK Group, setting our strategy and making decisions concerning major investments and divestments, the capital base, key policies, control and audit matters, risk management, and significant operational issues.
The Board of Directors oversees the integration of sustainability into the business strategy and monitors progress.
Executive Management
The Board of Directors appoints the Executive Board to conduct the day-to-day management of KK Group in cooperation with KK Leadership Team “Executive Management”.
The Executive Management holds regular formal meetings and focuses on strong ownership, execution of strategy and performance, and managing the day-to-day operations.
People Committee
In 2024, the Board of Directors established the People Committee. The committee is elected by the Board of Directors and consists of two board members, Pernille Lyngvold Erenbjerg as the Chair of the committee and Simon Krogsgaard Ibsen as a member. The committee meets at least four times a year, and when circumstances dictate.
The main responsibilities of the Committee are to support the Board of Directors with oversight of the compensation strategy and structure, remuneration and salaries, organizational review and talent acquisition.
Audit Committee
The Audit Committee is a committee of the Board of Directors and consists of two members. The Chair of the Audit Committee is Jesper Ridder Olsen. The committee’s main responsibilities are to oversee KK Group financial and non-financial reporting processes, as well as risk management, tax governance and audit related matters.
Further, the Audit Committee is to provide input and support to our Financial, Legal and IT organization to ensure continuous improvements and alignments.
Group Sustainability
Group Sustainability reports directly to Executive Management and is focused on three major tasks:
• Setting, agreeing and updating the sustainability strategy.
• Deploying the strategy based on the agreed road-map and linked sustainability program.
• Reporting and communicating on progress.
Data ethics
KK Group policies handle data related to customers and employees in accordance with the GDPR legislation, EU Data Boundary, our privacy policy and procedures for classification and management of documents and data.
Data privacy is ensured through secure storage. Data ethics are embedded within our existing policies, aligning with the Group IT and People and Culture policies.
Our policies on data ethics comply with the Danish Financial Statements Act, section 99d.
In 2024, we have approved the utilisation of one tool for Artificial Intelligence (AI) data processing and developed a policy for processing data using AI that complies with our internal policies and relevant legislation. Using other AI tools requires explicit approval from the Global IT department.
Board of Directors*

Pernille
Lyngvold Erenbjerg Chair
Pernille Lyngvold Erenbjerg joined our Board of Directors in 2024, having previously served as Chair of Nissens Cooling Solutions. She brings extensive experience from her roles at Genmab, Millicom, and RTL Group. She is well-versed in governance and ESG initiatives. Her leadership focuses on advancing sustainable energy and corporate responsibility.
Simon Krogsgaard Ibsen Vice Chair
Simon Krogsgaard Ibsen joined our Board of Directors in 2019 and was elected to Vice Chair in 2024. He brings experience within financial governance and corporate strategy, contributing to KK Group’s fiscal stability and growth strategies. His expertise supports the board’s long-term vision, particularly in integrating sustainability in financial operations and ensuring compliance with evolving regulatory frameworks.

Elke Elfriede Eckstein Board Member
Joining our Board of Directors in 2020, with a background in manufacturing, engineering and general management, Elke Elfriede Eckstein supports KK Group’s operational efficiency and supply chain. Her efforts contribute to ensuring sustainable sourcing practices aligned with KK Group’s sustainability targets.
Fabrice Roger Daniel Bregier Board Member
Fabrice Roger Daniel Bregier joined our Board of Directors in 2020, bringing a wealth of corporate development experience from aerospace and software companies and a deep understanding of sustainable energy solutions. As a Board Member, he supports KK Group international expansion.
Jesper Ridder Olsen Board Member
Jesper Ridder Olsen became part of our Board of Directors in 2019. He brings extensive experience wihtin finance, M&A, strategy, sustainability, and governance from his current role as CFO in KIRKBI A/S and previous roles in Maersk Drilling and A.P. Moller – Maersk as well as audit/advisory partnerships at Ey and KPMG. As a Board member he supports KK Groups continued growth and value creation.
Anita Vrou
Board Member –Employee Elected Representative
Anita Vrou became part of KK Group with the acquisition from Vestas in 2023. She was elected to the Board of Directors in KK Group in 2024. Anita Vrou has worked in the electronics industry since 2007, at Flextronics, Vestas and now KK Group.

Edin Dizdarevic
Board Member –
Employee Elected Representative
Edin Dizdarevic joined KK Group through the acquisition of Nissens Cooling Solutions in 2024 and was elected to the Board of Directors in 2024. Currently, as Senior Manager at Nissens Cooling Solutions, he leads key account strategies and drives business growth in the cooling division.
Møller Board Member –
Employee Elected Representative
Troels Møller became part of KK Group in connection with the acquisition from Vestas in 2023. He was elected to the Board of Directors in KK Group in 2024. He has functioned as a union representative for the past 11 years, focusing on areas including favorable salary and working conditions for our employees.
Troels
Executive Management

Mauricio Quintana Chief Executive Officer

Mauricio Quintana became the CEO of KK Group in January 2022. With a career spanning three decades in the energy and engineering sectors, Mauricio brings significant experience in energy transition. Before joining KK Group, he held key positions at renowned organizations such as ABB, Clipper Windpower, and United Technoligies in roles of increasing responsibility, driving growth and operational excellence.
Bjørn Reinhardt Mogensen Chief Financial Officer
Bjørn Reinhardt Mogensen joined KK Group as CFO in 2023. He has extensive financial management experience, having previously served as VP/ CVP at Novo Nordisk and SVP at Lundbeck. His background provides a robust foundation in financial strategy, business partnering, cost management, LEAN and corporate governance.

Birgitte Ladefoged Chief Human Ressource Officer
Birgitte Ladefoged joined KK Group as CHRO in 2023. With 12 years of experience as Divisional CHRO at Danfoss, she excels in HR leadership and organizational development. She is dedicated to building sustainable, peoplecentered HR practices, focusing on talent acquisition, leadership development, and fostering an inclusive work environment aligned with KK Group’s sustainability goals.
Johnny Nymann Stephansen Chief Technology Officer
Johnny Nymann
Stephansen joined KK Group in 2021 and was appointed CTO in 2023. With over 25 years of experience in the wind industry, including various senior leadership roles at Vestas within Service and R&D, he oversees KK Group’s Global R&D and product offerings, ensuring that our technology portfolio delivers competitive and sustainable energy solutions to our customers.
Kasper Vestergaard Larsen Chief Procurement Officer
Kasper Vestergaard Larsen joined KK Group as CPO in 2020 bringing extensive sourcing management experience from roles at Vestas and Energinet. He oversees Global Sourcing including Direct and Indirect Sourcing, Project and Service Sourcing and Sourcing Quality. In his role, he supports KK Group’s profitable growth and sustainable journey through strategic partnerships and process excellence in sourcing.
Kenneth Svinth Chief Commercial Officer
Kenneth Svinth joined KK Group as CCO in 2019, bringing extensive experience from the energy sector, including roles at Siemens Wind Power. In his role, he aligns commercial strategies with sustainable practices, reinforcing our commitment to long-term value creation in green energy solutions. Kenneth is also responsible for the recently acquired cooling solutions business.
Michael Dallala Chief Corporate Development Officer
Michael Dallala joined KK Group in 2022 to lead Strategy and M&A and was appointed CCO and Head of Corporate Development in 2023. He has extensive experience in strategy, sales, business development and M&A from his previous roles at Schneider Electric and United Technologies. In his current role, he is responsible for the Corporate Strategy, public affairs, sales excellence, M&A and post-merger integration.
René Balle Chief Commercial Officer
René Balle joined KK Group in 2013 as CTO and was appointed CCO in 2015. With extensive experience in the wind industry, including leadership roles at Vestas and AREVA Wind, he focuses on driving sales and customer engagement strategies, contributing to KK Group’s commercial success and strategic alignment with sustainable energy solutions. René has led the integration of the Vestas converters & controls business acquisition.
Thomas R. Olsen Chief Operations Officer
Thomas R. Olsen joined KK Group in 2016 and has served as COO since 2017. He brings significant experience in global supply chain management, operations management, global procurement and operational excellence, having previously held various positions within organizations such as MAN B&W, Flextronics, and Johnson Controls.
Executive Board
KK Leadership Team
Memberships and Ratings
To support and advance our business principles and climate vision, we seek to join industry and stakeholder associations that align with our values and strategy. We take pride in the ratings that validate our efforts.
Memberships
• Wind Europe: As the industry association for the European wind sector, Wind Europe works to promote wind energy in Europe by developing policy positions on behalf of the industry, coordinating analysis and research activities, and facilitating members networks. The association represents over 600 companies across the entire wind energy value chain. In 2024, KK Group applied to be a member in Wind Europe and became a member in 2025.
• American Clean Power (ACP): Formed in 2021 through the merger of leading green energy trade organizations, including the American Wind Energy Association, ACP represents a diverse array of clean energy industries such as wind, solar, clean hydrogen, energy storage, and transmission. ACP works to accelerate adoption of reliable, low-cost renewable energy across the United States.
In 2024, KK Group applied to be a member in Wind Europe and became a member in 2025.
• APQP4Wind: A method for Advanced Product Quality Planning in the global wind industry, with the goal of enhancing collaboration between manufacturers and suppliers and ensuring that parties at all levels speak on equal terms about quality assurance processes. KK Group joined in 2018 and is part of the board of directors together with representatives from GE Renewable Energy, LM Wind Power, Siemens Gamesa Renewable Energy, Vestas Wind Systems, and Green Power Denmark.
• Dansk Industri (DI): The biggest business and employers’ organization in Denmark with more than 20,000 members from sectors such as manufacturing, trade, and service industries. DI supports its members both domestically and internationally, providing services, advice, networks, and representation on issues such as collective bargaining, industry-specific advice, global competitiveness, and political representation. KK Group has been part of DI since 2008.
• Green Power Denmark: A non-commercial business organization empowering companies to influence policy, gain exclusive insights, network strategically, access expert advice, and contribute to Denmark’s green future. KK Group has been a proud member of Green Power Denmark for more than 20 years.
• Engineer the Future: A technological alliance of tech companies, educational institutions, and organizations, with the aim of promoting Danish
engineers and technology experts and creating a foundation for future knowledge workers and specialists in technological development. KK Group joined Engineer the Future in 2020, with the aim of inspiring a new generation of Green Power experts and supporting the longevity of industries that depend on strong engineering capabilities.
Ratings
• EcoVadis: A platform for assessing companies’ sustainability across environment, labor, ethics, and supply chains – providing ratings to showcase improvement and drive responsible business practices. As the standards rise every year, achieving a good score remains challenging. In 2024, KK Group was ranked in the top 25 percent of companies assessed by EcoVadis, with a score of 63/100.
KK Group is a long-standing participant of the UN Global Compact, and we appreciate this initiative.
We adhere to the ten principles that the UN Global Compact established, which include topics such as human rights, labor rights, environment, and anti-corruption, demonstrating our dedication to sustainability.
Sustainability Governance and Program
The long-term success of our sustainability strategy is reliant upon a transparent and effective structure that promotes ingenuity and facilitates results. Simple, scalable, and agile sustainability governance is vital.
To create a more sustainable and resilient KK Group, we constantly assess our approach and make changes when required to maximise our ability to turn sustainability risks and impacts into opportunities.
Harvesting more sustainable opportunities requires clearly defined responsibilities for our sustainable business transformation. This responsibility lies with our Group Sustainability function, which has been formed within the People and Culture organization for this purpose.
Sustainability Program
To provide strategic direction for our entire organization, KK Group Sustainability Program is split into three transformational tracks:
• Smart Product & Supplier Innovation: With a focus on designing for sustainability, this track
looks to align our Customer Value Proposition with product benefits that speak directly to customers’ sustainability pain-points, aiming to facilitate net-zero and circular design through innovation. Furthermore, we must improve our knowledge of our supply chain’s impact on people and the environment to support supplier engagement and innovation.
• Equality & Culture: With the aim of improving employee well-being and sense of belonging, this track will drive our Diversity, Equity & Inclusion (DE&I) efforts. This will include our focus on gender pay gap and living wages, as well as build on our proud Health & Safety record. This helps us in attracting the best employees and create the right conditions for employees to achieve their full potential.
• Security & Business Ethics: With growing global concerns regarding cyber and energy security, this track will reinforce our business ethics setup and training to ensure that we stay compliant and build the necessary trust in the market. Additionally, we will focus on data protection – both for our customers’ sake and that of wider society – so that we are known as drivers of smart solutions to electrify the world in a secure and stable way.
Each track is headed by two Executive Management members and two members from the Senior Leadership Group.

Double Materiality Assessment
We have taken fundamental steps to identify and prioritise sustainability matters affecting KK Group. We have completed an initial Double Materiality Assessment (DMA) based on the process described below:
Stakeholder engagement
The process is based on a combination of internal documents and workshops with internal stakeholders across the organization who can represent both the business as well as external stakeholders such as suppliers, investors, customers, partners, and employees.
Documentation and scoring
Each identified Impact, Risk, and Opportunity (IRO) is documented including their scoring. The scoring parameters are based on the European Sustainability Reporting Standards (ESRS):
• Impact materiality: Scale, scope, irremediability, likelihood (based on if an impact is positive/negative and actual/potential).
• Financial materiality: Financial magnitude of risk/ oppor tunity, likelihood, and the nature of the financial effect.
Impact and Financial effect were defined in two separate charts with respective scale and likelihood. A threshold was chosen for Impact and Financial charts. The thresholds set prioritised severity over likelihood.
Sustainability matters and materiality decisions
IROs have been identified on the lowest possible level of the ESRS topology. A sustainability matter is deemed material if at least one of the IROs is above the threshold.
In addition to assessing the ESRS sustainability matter list, we identified a need to assess the following matters to better reflect the industry and our business:
• Sub-topics “Cyber Security” and “Responsible Tax” were introduced to capture the nature of entity-specific risk.
• Topics from the Sustainability Accounting Standards Board (SASB) Electrical and Electronic Equipment standard were included in the interviews only to cover the following entity-specific topics: materials sourcing, product safety, and energy efficiency. Any IROs identified related to these topics during interviews were placed under the relevant matching ESRS topics.
From the additional matters assessed, only Cyber Security was deemed material.
DMA methodology
• Step 1 – Mobilisation: Identification of internal stakeholders deemed to have the best knowledge on respective sustainability matters, while ensuring that all sustainability matters were addressed. Identification of sustainability matters that are irrelevant considering our business model.
• Step 2 – Establish hypothesis: Collection of stakeholder insights to identify IROs through interviews facilitated by an external company. All sustainability matters were reviewed with a focus to identify significant IROs.
• Step 3 – IRO Analysis: Scoring IROs identified based on the information collected from the interviews and the thresholds set.
• Step 4 – Workshop: Workshop held with KK Group Executive Management to review and assess preliminary scoring from Step 3, which was split into material, potentially material and non-material topics. Culminating in an overall assessment regarding the set thresholds and validity check of the outcome of material and non-material sustainability matters.
• Step 5 – Documentation: Any changes following the above procedures were incorporated into relevant documentation.
As this is the first DMA prepared by KK Group, we have not established a due diligence process to identify, assess, prioritise, and monitor potential and actual impacts on people and the environment, or risks and opportunities that have or may have financial effect on KK Group. A process to embed and manage IROs as part of our overall risk management process is yet to be established.
The DMA covered the KK Group value chain. The identification focused on upstream and downstream activities which are, based on industry perception, more likely to include material impacts, risks and opportunities.
Upstream value chain
Own operations
Downstream value chain
SUSTAINABILITY PERFORMANCE
Doing our part in sustainable change for the long run

Our Business Model on page 11, the Sustainability performance on pages 23-34 and the Consolidated Sustainability Statement on pages 35-45 fulfill the Danish Financial Statements Act 99a requirements.
Environmental Information
Climate
Reducing carbon impact
KK Group strategy is centered around providing sustainable energy solutions that support the renewable energy transition by continuously innovating products and services for more efficient energy production.
This is linked to the production of renewable electricity via wind turbines and to the distribution of renewable electricity, such as methanol created through PtX technology. Furthermore, our solutions can be used to electrify industrial processes and clear up CO2e emissions with Carbon Capture plants.
Key policies define our starting point
Our CSR and Quality, Health, Safety and Environment (QHSE) policies guide our journey to better understand and improve our environmental impact. The policies state that compliance with ISO 9001 and ISO 14001 around quality and environmental management is a key starting point for minimizing our environmental impact when delivering high quality products that support the green transition.
KK Group has played a significant role in the growth of wind power over the past 40 years, with a proud record of contributing to the reduction global greenhouse gas (GHG) emissions. To maintain this profile, we continue to optimize our portfolio and reduce the impact of our production and locations.
Since the foundation of KK Group, we have enabled more than 164 GW of installed wind turbine capacity, of which more than 19 GW were installed during 2024. With a capacity factor of 35%, 500 TWh of renewable energy was enabled in 2024 by our decades of dedication and development.
In this way, we helped save 490 million tonnes of CO2e emissions in 20241, as most of our installations are replacing coal-powered electricity. This equals the yearly emissions of around 142 million EU households².
Towards net-zero
Although we are proud of our solutions that support the green transition, we fully understand that producing these solutions also contributes to climate change. In 2024, we have calculated our full climate impact to 460,120 tonnes of CO2e with a direct and indirect (scope 1+2) market-based impact of 3,634 tonnes of CO2e.
For the scope 1 and 2 climate emissions, we have set a net-zero target for 2030. During 2024, we have committed to the Science Based Targets initiative (SBTi) and plan to have targets approved by SBTi no later than the end of 2025.
Our transition plan already states that we will increase our focus on energy optimization at our sites. Reducing our energy and electricity use will have a positive impact on both the environment and KK Group bottom line. In addition to energy optimisation efforts, we are considering installing solar cells on roofs and electrification or introduction of biogas for gas-driven heating and production processes wherever possible. In 2024, our electricity consumed has been from renewable sources only.
Raw reality
When it comes to the indirect scope 3 climate emissions, our focus is on category 1 – the purchase of goods and services – or more specifically, the mining and processing of raw materials, particularly copper, aluminum, and steel.
During 2024, we have mapped our total scope 3 impact to create a new baseline incorporating new activities and companies that have been added to KK Group in recent years. Currently, on average, we emit 60 tonnes of CO2e per million DKK of turnover we create. If we were to pay a 750 DKK tax per ton of CO2e on the full impact of this, it would lower our net margin by 3.6% points indicating a relatively high impact on our overall profitability due to the high energy needs in our supply chain.
To stimulate our sustainable business transformation, we are considering an internal shadow price on carbon among other initiatives. Even without this tool, we see
a substantial potential for innovation in future products like our newly launched Bionic Busbar™. Outlining further initiatives are needed to secure a long-term 2050 scope 3 category 1 transition plan and is a key focus for 2025.
Climate uncertainty
When it comes to climate adaptation, the uncertainty of climate change can expose KK Group to physical risks –chronic as well as acute. As climate change intensifies, the likelihood of supply chain uncertainties or constraints is set to increase. From lack of raw materials to delayed product delivery.
Supply chain mapping and risk assessments will be key in developing a focused dialogue regarding consistency planning with suppliers, who are at risk of adverse nature phenomena, such as flooding, extreme lightning or tornados.

GHG emissions across our value chain
Better performance with less than half the material
It is estimated that the world will need 1.4 billion tonnes of copper to achieve electrification at the scale required to reach net-zero emissions by 2050. That is around double the amount of copper produced over the past 3,000 years*. Copper is used in a wide variety of electrical solutions, including in technology such as wind turbines, solar panels and electric cars. As such, with every gram of copper that we can save in our solutions, we will support society’s ongoing green transition.
With the increasing cost and scarcity of copper, KK Group’s new Bionic Busbar™ is a much-needed innovation for achieving more with less.
Using innovative technologies, the Bionic Busbar™ has achieved more than 50% material reduction, while maintaining high performance. Its 3D-optimized design creates an exact custom fit while reducing weight, volume, and electrical connections.

*https://energyminute.ca/infographics/the-volume-of-2050-net-zero-copper-demarnd/
Circular Economy
The circular economy is about transforming how resources are used, moving away from the wasteful “take-make-waste” model, and seeing waste as not just trash but a valuable resource.
Design for circularity is still new to the KK Group. For many years, the focus has been on securing the production waste to be re-purposed. That has resulted in 91% of our waste being re-purposed. Based on this, the next step is to look into the design of our products and learn how we design for circularity.
To enable the renewable energy transition, KK Group purchases high amounts of resource intensive materials such as copper, aluminium and steel that are all important parts of the many components needed for the production of converters, coolers and sensors. In addition, our production of batteries is increasing. The production of these materials and components could have negative environmental impacts.
For KK Group, adopting circularity is not just a sustainability goal, it is a competitive advantage given the reliance on rare materials where resource recovery is challenging and complex due to product design needs.
Our cooling technologies
Our cooling product offerings are at the forefront of innovation, introducing alternative cooling technologies that surpass the well-known plate and bar technology. These advancements have significantly improved material and energy consumption, as well as labor time in production processes.
One of our preferred water cooling solutions utilizes the AluXstream technology, a proprietary and patented innovation. This technological shift alone results in a weight reduction of approximately 20%. When considering cooling efficiency as a function of weight, AluXstream is about 30% more efficient than the traditional plate and bar technology.
The benefits of these advancements extend beyond cost savings. They have also led to a substantial reduction in the carbon footprint and resources used in our products. For every kilogram of aluminum we reduce, we achieve an approximate reduction of 9 kg of CO2e. This is a significant
achievement in our ongoing efforts to create more sustainable solutions.
All cooling solutions and heat exchangers are made of aluminum. However, it is important to note that mining aluminum, and particularly extracting it from bauxite, comes with a high energy cost. By optimizing our technologies and reducing the amount of aluminum used,
Social Information Own Workforce
People are what determines our success, and a positive corporate culture is critical to bringing out the best in our people. We have a holistic approach to supporting and improving our corporate culture.
We emphasize the importance of developing and maintaining a corporate culture that provides psychological safety, allowing all employees to achieve their full potential every day at work, while also securing the employees’ physical safety.
In terms of Equality and Culture, KK Group’s Sustainability Program is focused on promoting the benefits of inclusion.
As a signatory of the UN Global Compact’s 10 principles since 2010, we continue to promote and support human and labor rights in our own organization, as well as among our customers and our business partners –including our value chain.
Our Winning Behaviors
At KK Group, we have four Winning Behaviors. In 2024, these have been included in the yearly review process for all employees. The Winning Behaviors are not just ideals
but practical actions that will help us achieve our goals and create an inclusive and successful culture. We have outlined our Winning Behaviors below:
• We are Energy Wizards: As Energy Wizards, we use creativity, innovation, and enthusiasm as the driving force of our company. We are always looking for new ideas, facing challenges with a positive attitude, and inspiring others with our passion.
• We Empower Each Other: Empowerment is at the heart of a collaborative and thriving workplace. It ensures that everyone feels valued and motivated. This involves providing our colleagues with the resources and support they need to excel, as well as recognising and celebrating each other’s strengths and accomplishments.
• We Promote Integrity: Integrity is the foundation of trust and credibility within our organization. It means being honest, transparent, and ethical in all our actions and decisions. This behavior fosters a culture of reliability and respect where everyone feels confident in the fairness and integrity of our processes.
• We Lead with Empathy: Leading with empathy is essential for creating an inclusive and successful workplace. By understanding and addressing the needs and concerns of others and showing genuine care and consideration, we build a supportive community where everyone feels heard and valued.
Employee Engagement Survey
To measure the overall working atmosphere at KK Group, we conducted an annual Employee Engagement Survey in September 2024 involving employees with a tenure of three months or more. Management strongly encourages participation in the survey, which is anonymous and conducted by an independent third party. We are developing actions based on the survey insights, to reinforce aspects of our organizational culture.
Each manager conducts follow-up meetings with their teams to share results, discuss insights, and gather additional feedback. This is also the basis for managers and their teams to create a targeted action plan, which is reviewed on a quarterly basis to track progress.
An impressive 94% of eligible employees completed the survey, providing a solid foundation for identifying focus areas that sustain our strengths and highlight opportunities for improvement within our corporate culture.
The overall result seen in this year’s survey indicates an overall improvement. The employee engagement percentage improved reaching 77% (2023: 74%). A proud moment for our company and a strong indication of our employees’ engagement in the ongoing development of KK Group’s corporate culture.
Learning and development
To reinforce our strategic workforce planning, we proactively develop future competencies through a comprehensive talent identification and development process.
To support personal development, our ‘60% Ready’ rule means that people who are considered 60% ready for the next step in their KK Group career are included in overall evaluations for upcoming opportunities.
Our Talent Development journey was revamped in 2024 to provide employees with even more opportunities for continuous learning and growth:
• LinkedIn Learning: Available to all employees, supporting the development of new competencies and deepening expertise in relevant areas.
• Training Needs Identification: Helps create a roadmap for targeted competency development aligned with strategic goals.
• Mentorship Program: Leveraging internal expertise to strengthen organizational capacity and build a robust internal pipeline for critical positions.
LinkedIn Learning and the Mentorship Program were both introduced in the second half of 2024. Over 400 employees globally took part in our LinkedIn Learning pilot program at an above LinkedIn statistics benchmark of engagement rate. More than 21,000 training videos have been watched. The Mentorship Program created detailed development for 35 selected employees to learn
what it will take to scale the program and provide many more employees with guided individual development.
Our review process
During 2024, 90% of our employees took part in the yearly development review and dialogue process between managers and employees.
Our People Review process includes evaluating critical positions and succession planning to ensure continuity in our leadership. We are reactivating our Leadership Program to develop future leaders and enhance our current managers’ competencies.
All new employees at KK Group are required to sign the Employee Code of Conduct to confirm that they are aware of and will adhere to its contents before starting their employment. The Employee Code of Conduct is focused on meeting human rights, labor rights, and business ethics featured in the UN Global Compact principles.
Gender diversity
To obtain a more even gender split and a more welcoming and inclusive workplace, KK Group created a Diversity and Inclusion policy in 2023 that features a number of actions. The policy is active for all subsidiaries of KK Group and sets out a more inclusive hiring process, mentorship and career support programs, cultural sensitivity, leadership engagement, and setting and reporting goals.
In 2024, the Board of Directors has worked towards the ambition of having a more diverse gender composition
Partnering with Polish technical schools
KK Group has established a cooperative agreement in Poland with two esteemed technical schools that specialize in the fields of electrical engineering, mechatronics, and automation.
The partnership is designed to promote practical education and industry collaboration with the aim of strengthening our talent pipeline. Students will gain practical experience through career training opportunities with KK Group, exposing them to the latest technology and fostering the acquisition of essential skills and knowledge in their respective fields.
In addition to practical training, the company plans to conduct educational sessions and workshops, allowing students to network with industry professionals and gain insight into real-world challenges and opportunities which they may encounter in their future careers.
and achieved the target of 40% female representation. As the ambition for gender representation for the Board of Directors is now achieved, no further targets were set. The target of 20% female representation for Senior Management by 2027 still stands. In 2024, our efforts led to getting one step closer by reaching 15% (2023: 12%).
Having made First Aid and CPR training mandatory for all employees in 2023, 90% of our staff have now completed the three to five hours CPR training.
We are committed to working with our own workforce by the continuous implementation of the before mentioned actions and improving them in the coming years. Sustainability Report 2024
Our Safety Walk concept continues to create and sustain a strong safety culture by providing a proactive open forum for one or more employees to discuss Health,
Safety first
Our commitment to safety first has seen positive developments across several areas in 2024. Due to the potentially serious health and safety hazards our workers can be exposed to from machinery and electricity, it is critical that we stay vigilant in these efforts.
KK Group is certified according to the standards of ISO 45001:2018 Occupational health and safety management systems demonstrating our dedication to constantly applying and enhancing how we handle health and safety.
Our progress
We made significant progress on the Total Recordable Incidents Rate (TRIR) and Lost Time Injury Frequency Rate (LTIFR) over the past three years as they improved from 7.94 and 2.89 in 2021 to 3.51 and 1.68 in 2024, respectively.
In 2024, TRIR continued to improve compared to the previous year 3.51 (2023: 4.40), while our already low LTIFR increased to 1.68 (2023: 0.88). Thereby, the targets for TRIR and LTIFR of 3.5 and 1 for 2024, respectively, have not been met. Health and safety will remain a top priority in 2025.
The absence ratio among our blue-collar and white-collar employees remained within our acceptable levels of 4.5% and 1.5% (2023: 4.1% and 2.2%), respectively.
Safety and Wellbeing. In 2024, we completed 2,390 walks up from 2,067 walks in 2023.
What is it like to work at KK Group?
“Since day one, I’ve felt part of something bigger” shares Tamas Toth, a Project Manager at KK Group. Joining the company in April 2021, Tamas has been part of our rapid growth journey. “What makes me most proud is contributing to a transformative industry, building processes from scratch, and collaborating in ways that matter”.
Pointing at the work culture, Tamas highlights trust as a vital part. “Trust is the foundation here”. Flexibility and empowerment define the environment, allowing employees to take ownership of their tasks. “We’re treated as CEOs of our projects, with the autonomy to make decisions and the accountability to follow through”.
Our commitment and efforts within professional development stand out for Tamas: “I’ve grown immensely since joining. Leadership programs, mentorship opportunities, and a culture that values effort over experience have been pivotal. It’s a place where hard work is recognized, and opportunities are endless”.
Asked if he would recommend KK Group, Tamas said: “yes, if you’re ready to make an impact, you’ll find unmatched support and endless possibilities here. It’s the best decision I’ve made”.
Senior Project Manager Tamas Toth

Workers in the Value Chain
Supplier innovation is a high priority in our Sustainability Program, not just to understand our value chain better in terms of price and potential new suppliers, but also with regard to environmental and social impacts.
Identifying risk
While we will continue our focus on securing supplier agreements on our Supplier Code of Conduct, we aim to utilise our suppliers’ detailed knowledge on the products that they supply to gain more insights on environmental and social impacts at our tier-one suppliers.
When the fundamentals are in order, we see significant potential for supplier innovation input and the possibility of increasing the level of engagement.
Our long-standing supplier audit program will continue and we encourage the wind industry to create a platform for sharing audits and audit criteria, as this is seen as a part of the industrialisation of delivering components into the wind industry.
Avoiding conflict minerals
Following our DMA, we will be extra vigilant with regard to raw material extraction. Our initial focus will be on
establishing a conflict material assessment, which involves regular compliancy checks of our suppliers.
Minerals such as gold, tantalum, tungsten, and tin have been linked to funding violence in the Democratic Republic of Congo and its neighbouring countries (DRC region). KK Group follows the U.S. Dodd-Frank Act and other related laws to avoid using these minerals in the supply chain and supports the Conflict-Free Smelter Program (CFSP), a voluntary initiative aimed at identifying and verifying smelters and refiners of conflict minerals that source responsibly.
Governance Information Business Conduct
Corporate culture is a fundamental pillar in ensuring good business conduct and fostering sustainable growth. It fosters our position as a trusted partner in the green transition and is supported by various policies and principles designed to prevent anti-competitive behavior.
Code of conduct
All new employees at KK Group are required to sign the Employee Code of Conduct to confirm that they are aware of and will adhere to its contents before starting their employment. Potential non-compliance with our Employee Code of Conduct can be reported through our whistleblowing system described below.
All direct suppliers are required to sign the Supplier Code˙of Conduct, which is included as an appendix to their contract and/or have their own equivalent Code of Conduct implemented in their management system. Overall, more than 90% of KK Group’s direct spend is with suppliers who have signed our Supplier Code of Conduct. In 2024, 30 more suppliers committed to our Supplier Code of Conduct.
Suppliers are subject to combined quality and sustainability audits to verify compliance. In 2024, we have conducted 85 supplier audits, covering 80% of our direct spend. The audits resulted in planned corrective actions with some of these suppliers, and one supplier being rejected.
Whistleblowing Policy
Our Whistleblowing Policy allows employees and external partners to report violations. Reported incidents are anonymous by default unless local legislation prohibits anonymous reports. Access to the whistleblowing system is publicly available on KK Group’s website and our intranet. you can also access it using the QR code below.
We have a standard operating procedure to ensure that reported incidents are promptly, independently, and objectively processed. Each reported case is investigated by an independent panel of three individuals, consisting of the GVP of Legal, the Head of People Operations & Business Partnering, and the GVP of Finance Reporting and Compliance. If a reported incident involves one of these three individuals, the remaining two individuals will exclusively investigate it. If an incident involves the CEO, the Board of Directors will investigate it. The outcome of the investigation determines the disciplinary action and/or remediation implemented as necessary. The Whistleblowing Policy does not tolerate retaliation or vengeful action taken against an employee who reported an incident. A summary of reported cases and
investigation results is presented to the audit committee, which oversees and assesses the effectiveness of the implementation of the Whistleblower Policy.
In 2024, three cases were reported in the group Whistleblower platform. We fully investigated two cases and concluded that neither was substantiated. As the panel did not receive a response on the third case over the past 10 months from the person who filed it, the case was closed.
In 2025, we will focus on setting up and delivering training sessions in anti-bribery, anti-corruption, and business conduct.

Cyber Security
Protecting our proprietary intellectual property, customer information, and other data is essential. Cyber Security is highly emphasized within KK Group.
Maturity assessment
KK Group has been annually assessing Cyber Security maturity over the past three years using the Center for Internet Security’s 18 critical security controls (CIS 18). The group score improved in 2024, and is considered well above the benchmark for similar companies.
Network and Information System Directive (NIS2)
NIS2 is a new directive established by the EU, with a primary goal to enhance the level of cyber security in the EU, by setting stricter standards for the protection of critical infrastructure including more robust cyber security measures.
With the increasing reliance on digital systems to monitor and control wind turbines, the risk of cyber-attacks has grown. The wind turbine industry is significantly affected by NIS2.
KK Group aims to meet NIS2 compliance requirements by the deadline of 1 July 2025, as set in the directive.
Other actions
Employees are requested to remain attentive, ask questions, and report any suspicious activity, e-mails, etc. All employees are provided with a GDPR and Cyber Security training upon joining KK Group. In addition, test phishing emails are sent to employees on a regular basis for continuous training and raising awareness.
To better secure our IT environment, in 2024, we have implemented a Security Operation Center (SOC) solution, which monitors and acts if any of our computers are compromised or infected.
Furthermore, we are in the process of implementing a Data Loss Prevention system, securing and preventing loss of confidential data even further than what we have today.

CONSOLIDATED SUSTAINABILITY STATEMENT
Our sustainability journey in numbers
Sustainability Data Overview and Notes
GOVERNANCE
These datapoints are covered for 2024 by an auditor’s independent limited assurance report.
Note 1 – General Information
Basis of preparation
The consolidated sustainability statement for the period from 1 January to 31 December, 2024 comprise consolidated data from the parent company (KK Wind Solutions Holdings A/S) and entities controlled by KK Group. The same principles as in the financial statements are applied in the consolidation except for where specified in the accounting policy. The consolidated sustainability statement and the accompanying notes are prepared based on the accounting principles described in the notes.
Newly established and acquired companies are included at the date of acquisition, and companies are excluded from the reporting at the date of disposal.
Changes in accounting policies and disclosures
The sustainability accounting principles set out in the notes have been applied consistently in the preparation of the consolidated sustainability statement for all the years presented, unless stated otherwise.
Key accounting estimates and judgements
We use assessments and estimates for the reporting of certain data points (e.g. scope 3 emissions). We regularly reassess our use of estimates and judgements based on experience, the data available and other factors. Changes in estimates are recognised in the period in which the estimate in question is revised. Details on the key estimates, judgements, and assumptions applied are mentioned in the accounting principles of the specific topics.
External review
We have obtained our first limited assurance report for a selection of the data reported in 2024.
Sustainability governance
Further details regarding the role of the administrative, management, and supervisory bodies, including information provided to and sustainability matters addressed by them are presented in the Governance section of this report.
DMA
We conducted our initial DMA and included further details regarding the materiality assessment process as part of the Double Materiality Assessment subsection of this report.
Note 2 – Energy Consumption
Accounting principles
Energy consumption
We report the total fossil and renewable energy consumption disaggregated by energy type for the reporting period in megawatt hours (MWh).
The consumption is based on monthly reported consumption data with links to invoices. All locations have been included in the reporting. The energy intensity is based on net turnover reconciled with the financial statements.
Energy intensity ratio
Energy intensity ratio represents total energy consumption in MWh divided by total revenue in kDKK.
Energy intensity ratio
Notes
KK Group’s revenue is included in the statistical Nomenclature of economic Activities in the European Community (NACE) section C and therefore, in relation to this reporting, seen as a high climate impact sector.
KK group did not consume energy from nuclear sources in 2024 or 2023.
The increase in our energy intensity ratio is mainly linked to our recent acquisition of Nissens Cooling Solutions, whose production process consumes more energy.
Note 3 – GHG Emissions
Accounting principles
GHG emissions
We report the total GHG emissions in metric tonnes and with reference to the Greenhouse Gas Protocol, calculated based on both the location-based and the marketbased approach. The consolidation of GHG emissions follows the operational control approach.
Gross scope 1 and 2 emissions are reported based on the monthly energy reporting converted into tonnes CO2e according the Greenhouse Gas Protocol. Calculations of GHG emissions are based on emission factors from invoices from energy suppliers. Otherwise, the most recent available emission factors from IEA are applied. All GHG emissions are converted to CO2e equivalents (CO2e).
Primary data on scope 1 and 2 GHG emissions constitutes the largest proportion of the data collected. This includes data from digital and manual meter readings and consumption data from invoices. For the remaining locations where no consumption and emissions data are available, average consumption values per m2 have been applied to estimate energy consumption and GHG emissions.
Scope 1 GHG emissions
Scope 1 GHG emissions include direct emissions from combustion of gas and oil, refrigerants, and mileage in KK Group-owned or controlled vehicles.
Scope 1 GHG emissions from regulated emission trading schemes Represent emission allowances under European Union Emission Trading Scheme (EU ETS).
Scope 2 GHG emissions (market-based and location-based)
Scope 2 GHG emissions include indirect emissions from purchased heating and electricity. For market-based emissions, market-based emissions factors were applied, implying that energy certificates and other renewable sourcing of energy influences the
calculation. For location-based emissions, location-based emissions factors from IEA for 2023 have been applied.
Scope
3 GHG emissions
A comprehensive Scope 3 GHG inventory has been completed in accordance with the Greenhouse Gas Protocol Corporate Value Chain (Scope 3) Standard. We have selected the following priority Scope 3 categories (C) – C1, C4, C6, and C9 – which collectively represent over 90% of our total Scope 3 emissions. This approach aligns with the emissions coverage requirements set forth by the SBTi.
Priority categories
C1 Purchased goods and services: Accounts for GHG emissions from direct and indirect purchases. Direct purchases calculation is based on the weight of our different purchase categories in combination with extrapolation, where necessary. Indirect purchases calculation is based on monetary spend value.
C4 Upstream transportation and distribution: Accounts for GHG emissions from intercompany, supplier, and customer flows paid for by KK Group. The calculation is based on weight, distances and transport modes from supplier and transport system reports, where available, and direct spend reports for the remainder combined with extrapolation and use of estimates, where necessary.
C6 Business travel: The calculation is based on the business travel booking system combined with extrapolation. Emissions are based on UK BEIS with RF and with WTT kg CO2e.
C9 Downstream transportation and distribution: Accounts for GHG emissions from transportation of our products after the point of sale that are not paid for by KK Group. The calculation is based on weight, distances and transport modes from supplier and transport system reports, where available, combined with extrapolation and use of estimates, where necessary.
GHG emissions intensity ratio
GHG emissions intensity ratio represents total Scope 1+2+3 market or location-based emissions in CO2e tonnes divided by total revenue in kDKK.
Sustainability Report 2024 C ONSOLIDATED S USTAINABILIT
Notes
The Gross GHG, Scope 2, market-based emissions were updated from the previously reported number in our 2023 Sustainability Report of 1,867 Tonnes to 3,357 Tonnes as the previously reported number did not include all sites.
Scope 3 GHG emissions split on main categories
Main scope 3 categories*
GHG emissions intensity ratio Net
* In 2023, KK Group focused on calculating Scope 3 (C1) inventory as it represents the most significant scope of GHG emissions. In 2024, we reported the top 90% of our GHG inventory according to SBTi.
Note 4 – Waste
Accounting principles
Waste
We report the total amount of solid waste in tonnes, split by hazardous waste and non-hazardous waste, as reported internally on a monthly basis based on invoices from the external waste handlers for all locations except for offices with less than 50 employees.
Hazardous waste includes batteries, chemicals, combustion waste, electronic waste, mixed hazardous packaging, as well as solvents and detergents. Non-hazardous waste includes bio waste, metals mix, non-hazardous packaging, paper, plastic, and wood.
The waste is reported on recovery operation types. Waste treatment types according to the standard and the total amount and percentage of non-recycled waste are reported as well.
Waste
Notes
The increase in our total waste generated is due to our recent acquisition of Nissens Cooling Solutions. It mainly represents recycled metals and wood. This resulted in a positive development in the total percentage of not recovered waste, that is now at a low level of 9%.
Note 5 – Employees
Accounting principles
Number of employees
We report employee characteristics, including total number of employees by head count at the end of the reporting period broken down by gender, countries of operations with more than 50 employees, employment type and age.
Employee
turnover
We report the total number of employees who have left KK Group during the reporting period. This number includes all employees and is calculated based on the total number of retirements, voluntary or involuntary resginations, etc.
Employee
turnover rate
We report the total rate of employee turnover rate based on the total employee turnover divided by the average number of employees on the payroll during the year.
Share of underrepresented gender in Senior Management
We report the share of underrepresented gender in senior management based on headcount at the end of the reporting period. Senior management is defined as the Executive Management team and their direct reports, where these reports manage reports in the same legal entity.
Number of employees – Headcount at year-end
Number and % of employees by age
Notes
KK Group’s number of employees grew to 3,682 by the end of 2024, up by 49% from the previous year. This change reflects the integration of the acquisitions mentioned and additional hiring in response to business expansion needs.
Note 6 – Health and Safety
Accounting principles
Employees covered by health and safety management systems
We report the percentage of employees in own workforce covered by the health and safety management system. The number is calculated based on headcount at the end of the reporting period.
Fatalities linked to work-related injuries or illness
We report the number of work-related fatalities in our own workforce and workers working at our sites. The numbers reported are based on fatalities reported via the health and safety management system during the reporting period.
Total Recordable Incidents (TRI)
We report the total recordable work-related incidents, which include fatalities, lost time cases, medical treatment cases, and restricted work cases, with one or more days of absence in our own workforce. The numbers reported are based on incidents reported via the health and safety management system during the reporting period.
Total Recordable Incident Rate (TRIR)
We report the rate of TRI per million working hours. The working hours are calculated based on own workforce hours registered in the system or standard working hours excluding holidays, sick leave, maternity leave, etc. The calculation method differs based on the information available in the system used for each country.
Lost Time Injury Frequency Rate (LTIFR)
LTIFR is the total of fatalities and lost time cases that have caused at least one day of absence divided by the total number of working hours that is calculated in the same way as for the total rate of recordable work-related incidents per million working hours.
Total number of recordable work-related illness
We report the number of recordable work-related illnesses according to the International Labour Organization (ILO) list of Occupational Diseases. The numbers reported are based on illnesses reported via the health and safety management system during the reporting period.
Notes
The total recordable incidents rate previously reported in our 2023 Sustainability Report for 2023 was updated from 3.96 to 4.4, as the number previously reported did not include restricted work cases.
Note 7 – Governance
Accounting principles
Share of underrepresented gender in Board of Directors
We report the share of underrepresented gender on our Board of Directors defined as the Board of Directors for KK-Group A/S (CVR: 66821110) at the end of the reporting period. Information has been sourced from the Central Business Register (CVR) and employee-elected members have been excluded from the calculation.
Incidents of corruption or bribery
We report the number of incidents of corruption or bribery discovered by our legal department in the reporting period. Incidents are counted when they lead to dismissal or discipline of own workers or when they relate to terminating/not renewing contracts with business partners due to violations related to corruption or bribery.
Number of convictions related to anti-corruption and anti-bribery laws
We report the number of convictions related to anti-corruption and anti-bribery laws in the reporting period.
Amount of fines related to anti-corruption and anti-bribery laws
We report the amount of fines in kDKK from convictions related to anti-corruption and anti-bribery laws in the reporting period.
Other Sustainability Disclosures
SASB
Data overview
For further transparency on our sustainability data, we have included selected indicators from the IFRS sustainability disclosures issued by the Sustainability Accounting Standard Board (SASB) for Electrical and Electronic Equipment.
Energy Management
Hazardous Waste Management
Business Ethics
Total amount of monetray losses as a result of legal proceedings associated with bribery or corruption
Sustainable Development Goals

Where we can influence society at large
Our products and services play a crucial role in the global shift towards renewable energy, contributing to cost-effective energy options with low or zero GHG emissions. We will focus on increasing energy efficiency, electrification, and advancing clean energy technologies, solutions, and services.

Where we can create positive impacts
Our products are central to the generation of efficient renewable energy and feature in 51,000+ wind turbines around the globe. This helped save around 490 million tonnes of CO2e in 2024.


Where we can reduce the negative impact of our operations
We seek to become a company that operates with responsibility and consideration for the environment throughout all aspects of our supply chain and understands the importance of mitigating any adverse effects on people and the environment including focus on the reduction of material utilised in our products and waste generated. We innovate clean energy and energy efficient solutions and integrate them, influencing society and positively impacting the environment. We recognise the significance of promoting equal opportunities for all, enhancing diversity, and eradicating all forms of discrimination by focusing on equality from multiple perspectives.
CONCENTRIC
Concentric’s sustainability report for 2024 is enclosed on the next pages.

Focused on innovations that create sustainable value
Sustainability is central to the technological advancement and continuous innovation that has defined Concentric for many years, and it will continue to carry our business strongly into the future.
Sustainability underscores our commitment to engineering positive impacts and creating real value for our customers and the world. It is central to all that we do. It drives our people to harness the best of their knowledge and expertise to create the most far-reaching, responsible solutions for customers.
True to Concentric’s ethos, Technology, Innovation and Sustainability, we work closely and proactively with our customers to help them reduce their emissions and preserve our planet’s natural resources. This driving force has never been more relevant than it is today, and we focus on those areas where we can make the biggest impact.
Concentric values its ability to adapt efficiently to current and emerging industry needs.
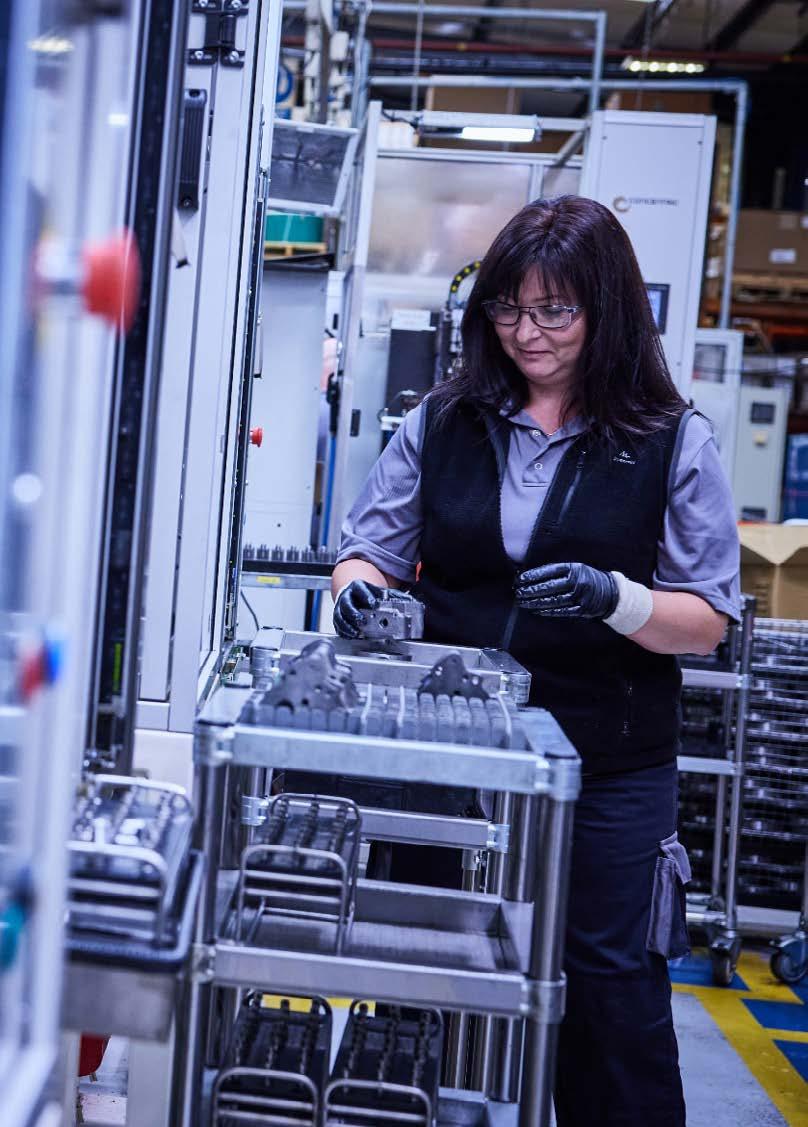
Moving forward, we remain committed to develop and produce sustainable products and solutions and contribute to the sustainable development of our customers, partners and communities in which we serve.
The majority of Concentric’s facilities are ISO14001 (environmental management) certified, and some achieved ISO45001 (health and safety management) status.
The group’s environmental programmes are characterised by continuous improvement, technical development and resource efficiency.
Concentric has adopted a social human rights policy based on the UN’s Universal Declaration of Human Rights, the UN Global Compact initiative, the International Labour Organisation’s (ILO) basic principles on labour law and the OECD guidelines for multinational companies.
This report represents the period January 1st to December 31st, 2024.
Letter from the CEO
Sustainability is a journey, and we remain steadfast in our commitment to integrating it into every aspect of our business. Whether focused on our products, people, or operational practices, sustainability is a fundamental part of our innovation strategy and day-to-day operations.
I am pleased to share an update on our sustainability efforts over the past year, highlighting key initiatives and progress in this vital and ever-evolving area of our business. Since 2022, Concentric has focused on three key areas: Our People, Our Planet, and Innovative Products and Partnerships. This is based on the philosophy of our Board of Directors and Group Management, which is that Concentric’s principal contribution to a sustainable world takes place through empowering our people, ethical growth that is kind to the planet, and delivering innovative products whilst cultivating partnerships that enable our customers to reduce their environmental impact. In this report, we share some of these stories with you, with many of these efforts driven by our employees and our cross functional Sustainability Committee, which is shaping our culture of sustainability.
During 2024, Concentric faced a weaker trading environment in its end markets, as well as some significant milestones. Notably, these included:
• Acquisition of Concentric by A.P. Møller Holding: This year marked a significant transition as Concentric delisted from the stock exchange and became part of A.P. Møller Holding, an organization dedicated to investing in businesses with a positive impact on society.
• Acquisition of G.O. Engineering: Our recent acquisition of G.O. Engineering, a company specializing in high-quality electronics design and manufacturing, has strengthened our electronics manufacturing capabilities and introduced a state-of-the-art sustainable facility in Bühl, Germany, further advancing our commitment to innovation, sustainability and an expanded footprint for our customers.
Our Vision and Mission Concentric remains committed to its vison and mis sion which are our driving forces.
• Our Vision
Concentric’s vision is to deliver sustainable growth for every application in the markets we serve.
Since 2022, Concentric has focused on three key areas: Our People, Our Planet, and Innovative Products and Partnerships.
• Our Mission
Concentric’s purpose is to design, develop, manufacture, and sell high quality, customer-focused solutions for hydraulic, engine, and thermal management applications within its global end markets.
Looking ahead
Sustainability is a journey, and we remain steadfast in our commitment to integrating it into every aspect of our business. Whether focused on our products, people, or operational practices, sustainability is a fundamental part of our innovation strategy and day-to-day operations. During 2024, we have expanded into new sectors and achieved strategic wins with our evolving product portfolio. The growing shift of our customers towards electrification continues to present opportunities for Concentric to play a pivotal role in their sustainability roadmaps, whilst continued demand for our mechanical products drives us to innovate more sustainable products and solutions in these markets too.During 2025, Concentric will work with our expanded footprint and our new colleagues in G.O. Engineering, together with our Board and AP Møller Holdings, to support the low carbon transition.
We will strive to achieve greater improvements in sustainable product design to improve our facilities through investment to drive safe, sustainable and efficient workplaces. Additionally, in 2025, we plan to better understand our emissions footprint whilst
“The growing shift of our customers towards electrification continues to present opportunities for Concentric to play a pivotal role in their sustainability roadmaps, whilst continued demand for our mechanical products drives us to innovate more sustainable products and solutions in these markets.
maintaining focus on circular design to address global challenges including climate change, biodiversity loss, waste and pollution and energy recovery.
As we continue to strengthen our approach, we look forward to collaborating with our stakeholders to drive meaningful impact and move towards a carbon-neutral future.
Thank you for taking this journey with us.
Martin Kunz President and CEO
Our business
Concentric focuses on its core ethos of Technology, Innovation and Sustainability to be a global leader across all our primary end-markets, providing solutions in which Concentric can add value to our customer’s products.
Over the past 100 years, Concentric has engineered high-quality, robust engine products, encompassing lubricant, coolant and mechanical fuel transfer pumps for major OEMs and Tier 1 diesel engine manufacturers. Our growing electric products, include Concentric & EMP branded coolant and oil pumps, and EMP branded mini-hybrid cooling systems, fans and thermal management solutions. Our state-of-the-art hydraulic products, include gear pumps, power packs, Allied branded transmission pumps, internal gear pumps and an ever-growing range of Electro Hydraulic Steering pumps.
The addition of G.O. Engineering’s product portfolio and competency in hardware and software design combined with PCBA manufacturing supports our product portfolio.
Our on- and off-highway end-markets, include the construction, agriculture, truck & bus, and industrial application. Our typical customers are the major OEMs in these markets, and regional distributors.
Our strengths
Concentric’s strengths include our global presence, from where our 1224 employees support our customers locally. Our well-established brands, boast over 100
Our values
Social and Human rights
• Fair employment conditions
• No form of child or forced labour
• Freedom of association and the right to organize
• Women’s rights
• Rights of minorities, indigenous peoples and communities.
Health and safety
• Health and safety of our employees and suppliers throughout the supply chain.
years’ experience in our strategic markets, where we deliver a wide range of hydraulic gear products, valve, motor, power packs, and thermal management solutions.
Our services
We work in partnership with our customers to design, develop, manufacture and sell, high quality, customer-focused solutions. Our business model is to supply technology and innovation throughout our customers’ product life cycle, not just at the evaluation and design phase. As such we work in close partnership with our customers to supply industry leading solutions.
Value added service we offer to our customers, include:
• Automated machining & robotics
• Automated high volume assembly consumer products
• Full cooling & auxiliary systems
• In-house engineering & development
• Patented software & hardware
• Electric cooling components
• Full-service project lifecycle
• Analysis & prototyping
• Software & design integration
• Hardware design
• Design & development testing Validation testing
Business Ethics
• Anti-corruption and Anti-bribery
• Conflict of Interests, competition and antitrust law
• Product quality, export control and international sanctions
• Accurate books and records
• Whistle blowing and grievance system.
Environment
• Water and waste management
• Energy conservation and hazardous material
• Air and soil quality
• Protection and conservation of biodiversity
• Responsible land use practices and prevention of deforestation
• Animal protection
• Conflict minerals.
Suppliers must adopt adequate internal policies covering their obligations to Concentric’s standards. Concentric monitors adherence, including requesting relevant information and documentation from suppliers and conducting audits.
In 2024, 100% of Concentric’s material suppliers were screened against our environmental and human rights requirements.
2024 Highlights
G.O. Engineering, Buhl, Germany
The acquisition of G.O. Engineering supports several strategic pillars of Concentric’s growth strategy. G.O. Engineering brings electronic design, development and manufacturing capabilities to Concentric, strengthening its integrated business model, which is key to accelerate electrification and develop new business for
Our history
The history of the Concentric began in 1920, with a three-man partnership who founded Concentric Manufacturing Company Limited, on January 4, 1922, in Aston, UK.
Over the next century, Concentric has made great strides in developing state-of-the-art products to major OEMs, as the business acquired Licos Truck Tec in Germany in 2013, Allied Enterprises in the US in 2020, EMP during 2021, and its latest acquisition, G.O. Engineering, in Germany.
2024 marked a significant transition for our business as Concentric delisted from the Swedish Nasdaq stock exchange and became part of A.P. Møller Holding.
electric products in both established and new markets. G.O. Engineering’s state of the art facility includes many sustainable features and employee-driven initiatives such as heat recovery, groundwater heating/ cooling system and charging stations for electric vehicles.

G.O. Engineering’s state of the art facility in Bühl, Germany
Global Footprint
North America
Escanaba, Michigan, USA
Manufacturing, R&D, Sales
Greenfield, Indiana, USA
Manufacturing, Sales
Muncie, Indiana, USA
Manufacturing, Sales
Rockford, Illinois, USA
Manufacturing, R&D, Sales
Europe
Birmingham, UK
Manufacturing, R&D, Sales, Group functions
Bühl, Germany
Manufacturing, R&D, Sales
Hof, Germany
Manufacturing, R&D, Sales
Landskrona, Sweden
Alfdex, JV with Alfa Laval
Markdorf, Germany
Manufacturing, R&D, Sales
Monza, Italy
Administration office
Redditch, UK
Headquarters
Stockholm, Sweden
Registered office
Strasbourg, France
Sales office
Asia
Kunshan, China
Alfdex, JV with Alfa Laval
Pune, India
Manufacturing, R&D, Sales
Suzhou, China
Manufacturing, Sales
Global Footprint
Concentric’s global manufacturing presence includes factories in Sweden, Germany, UK, North America, India and China, backed by central support and development functions from its headquarters in Redditch, UK. Our far-reaching global footprint enables the group to sell locally to our global customers.
2024 Highlights
Concentric’s Global and Local approach
Concentric’s Hydraulics division, recently obtained a sizable order for the production of 3,000 hydraulic units, from a UK based construction vehicle and equipment manufacturer. These hydraulic components are generally produced from our Rockford plant in the U.S.
To better support the customer and to minimize the environmental impact of shipping such a large quantity of heavy components, production was moved to our Hof facility, in Germany.
Global perspective, Local presence
We maintain a global perspective with a local presence. In partnership with our stakeholders, this enables shorter lead times, local adaptations, economies of scale, faster innovation and a reduced impact on the planet.
This strategic move lowered the distance traveled for each component from 6,115 kms (3,800 miles) to just 1,448 kms (900 miles). Each product’s shipping distance was 4, 667 kms (2,900 miles) shorter, saving approximately 14 million kms (8.7 million miles) in travel. The 14 million kilometers in savings were far exceeded by optimizing the source of raw materials locally, thereby supporting our customers to achieve their sustainability efforts and minimizing the environmental impact caused by sea or air freight.
Stakeholders
Concentric has a wide network of stakeholders across its value chain comprising of customers, suppliers, employees, financial institutions, shareholders, the State and communities.
Concentric aims to maintain an open dialogue with all of its stakeholders whilst delivering societal and monetary value through its engagements as shown below. Stakeholder
Customers Sales of engine and hydraulic products
Suppliers Procurement of goods and services as well as depreciation, amortisation
Employees Wages, social expenses and skills development
Financial Institutions Interest
More sustainable products
Long lasting partnerships
Great place to work
Financial stability
The State Taxes Taxes paid
A number of mechanisms are currently used by Concentric to engage its stakeholders, all of which help to define which topics should be considered the most material for the business on an ongoing basis:
• Stakeholder ssessment
• Customer feedback and surveys
• Customer accreditation programmes
• Customer factory tours
• Industry accreditation programmes
• Supplier days
• Employee surveys & two-way communication meetings
• Investor perception studies
• Customer technology roadshows
• Pulse surveys
• Sustainability committee
Concentric’s vision is to deliver sustainable growth for every application in the markets they serve.
Concentric’s purpose is to design, develop, manufacture and sell high quality, customerfocused solutions for engine and hydraulic applications within its global end-markets.
The following sustainability aspects are regarded as the some of the most material topics for Concentric’s stakeholders.
Stakeholder group How we work Primary areas
Customers
• Customer surveys
• Customer accreditation programmes
• Technology roadshows
Suppliers
• Regular supplier days & workshops
• Factory inspections & on-site supplier audits
• Code of conduct for suppliers
Employees
Shareholders, analysts & financial institutions
• Annual employee surveys
• Personal development discussions
• Training & education
• Code of conduct
• Regular perceptions studies
• Investor roadshows & seminars
• One-to-one meetings in person/by telephone
• Analysts presentation & capital markets days
The state & local community
• Ongoing dialogue with emissions legislators
• Participation in government initiatives, e.g. US SuperTruck
• Ongoing dialogues with local community representation
• Overall customer satisfaction
• Product quality
• On time fulfilment of orders & continuity of supply
• Technology & innovation
• Product quality & warranty claims record
• On time fulfilment of orders & continuity of supply
• Technology & innovation
• Environmental programme
• Health & Safety
• Recruitment & employer branding
• Ethics & values
• Skills development
• Succession planning
• Health & safety
• Remuneration
• Corporate update
Examples of identified aspects for stakeholders
• Customer service & relationship
• PPM & warranty claims record Delivery (OTIF%)
• Product development to support changes in emissions legislation
• PPM & warranty claims record
• Delivery (OTIF%)
• Product Development Waste Management
• Human Rights
• Anti-corruption
• Risk Management
• Co-operation
• Company culture Environmental compliance
• Skills development
• Equal opportunity
• Health & Safety
• Reward & benefits
• Value drivers
• Product development
• Debt servicing capabilities
• Sustainability
• Human rights
• Anti-corruption
• Risk management
• Operating leverage
• Product development
• Energy efficiency & climate impact
• Involvement in the local community
• Environmental programme
• Long-term financial strength of employer
• Social sustainability
• Climate & energy
• Environmental compliance
• Domestic supply chain
• Waste Management Human Rights
Link to Concentric’s material sustainability aspects
• Low carbon transition
• Sustainable product design
• Resource efficiency
Supplier management
• Responsible sourcing
• Cyber security and Privacy
• Supplier management
Responsible sourcing
• Ethics & value creation
• Resource efficiency Sustainable product design
• Cyber security and Privacy
• Employee Health & Safety
• Employee Value Proposition
• Ethics & value creation
• Equality & diversity
• Responsible sourcing
• Low carbon transition
• Employee Health & safety
• Ethics & value creation
• Supplier Management
• Resource efficiency
• Cyber security and Privacy
• Responsible sourcing
• Low carbon transition
• Supplier management
• Equality & diversity
• Resource efficiency
• Ethics & value creation
• Human Rights
Sustainability Governance
During the past two years Concentric has strengthened its sustainability governance model, operationalised its Sustainability Committee, commenced reporting of valuable business metrics as well as increased engagement of its employees around sustainability.
The Board of Directors has ultimate oversight of sustainability, setting policy and direction. The Board have established several principles which underpin all business activities outlined across recently updated policy documents including the revised and updated Code of Conduct, Code of Conduct for Suppliers, Information Policy, Insider Policy, Social Human Rights Policy, Environmental Policy, Anti-Bribery & Corruption Policy, Anti-Harassment, Sexual Harassment and Retaliation Policy, Business Ethics Policy, Work Environment & Health and Safety Policy, and Whistleblowing Policy. These documents are regularly reviewed to ensure that Concentric complies with legislation and market expectations on the topic of sustainability. Based on stakeholder feedback, in 2024 Concentric also decided to strengthen its governance approach in the areas of supplier management and cyber security.
Concentric’s CEO and Group Management oversee the sustainability approach. Group Management are responsible for delivery of the sustainability strategy in
line with policies set out by the Board. Group Management define Concentric’s approach to sustainability including its strategy and, track progress towards plans and goals. The CEO and SVPs are responsible for strategic implications of sustainability for the business. The CFO is responsible for sustainability reporting. The Vice President of Human Resources & Sustainability is responsible for the sustainability strategy and to ensure intersectional oversight across business functions supported by the Sustainability Committee.
The Sustainability Committee supplements the traditional chain of command to facilitate robust bottom-up and top-down collaboration and dialogues about the company’s material ESG topics. Committee members have site responsibilities as well as responsibilities for specific areas of expertise which align to CSRD reporting guidelines. The committee focuses on the business’s priority sustainability areas and includes a diverse mix of employees.
Since 2023, the company incorporated an ESG metric into its incentive plans for senior leaders, to motivate and encourage employees to consider sustainability as a core business imperative which is both visible and rewarded.
Sustainability Roadmap
Building on a solid foundation of innovative products, ISO and other internationally recognised accreditations at many sites, and an engaged and diverse global workforce, Concentric commits to continue taking action to ensure the business is set up for ESG success. Acting upon outcomes of the Double Materiality Survey conducted last year, and implementing EU regulatory changes, its focus is on defining and communicating a clear ESG strategy, informed by holistic stakeholder insights and underpinned with the right metrics, targets and a robust approach to managing risks. Investment in technology for innovation and production of quality products is also key.
Following on from last year Concentric continued to strengthen its approach include increasing its impact across the value chain, namely, supporting the climate transition and contributing to the low carbon economy as a point of differentiation, shifting more towards the circular economy through product design and sourcing activities, and elevating supplier management practices further by setting clearer standards around topics
such as human rights and environmental standards. Throughout 2024, Concentric leveraged best practices from the Business Excellence programme to support its sustainability activities and culture.
Concentric commits to leveraging its Business Excellence programme to share best practices across sites and foster a culture of innovation and continuous improvement with regard to sustainability.
2024 Progress update against sustainability goals
Material aspects of
Ethics & value
creation General
Long-term financially strong and ethically correct for all our end-markets where we are present as an engine and hydraulic component supplier
UN’s sustainable development goals: No.8: Promote sustainable economic growth
Responsible suppliers General Ensure the application of labour law, human rights, anti-corruption and environmental responsibility in the supply chains for both on- and off-highway vehicles
UN’s sustainable development goals: No.8: Promote sustainable economic growth
Equality & diversity General A workplace that offers diversity and equal opportunity
UN’s sustainable development goals: No.5: Achieve equal opportunity
1) Sweden’s financial supervisory authority.
Concentric achieves longterm financial growth in an ethical manner that contributes to the improved welfare of society
Concentric promotes social responsibility in its operations and value chain
No. of ethical breaches based on Concentric’s values
No. of insider trading violations investigated by Finansinspektionen 1)
of acts of fraudulent behaviour identified
Concentric is an equal opportunities organisation that has an even gender distribution amongst its salaried employees and managers
Procedure
Concentric evaluates and approves all material suppliers from a sustainability perspective, including environmental and human rights criteria
Increase the number of female salaried employees and managers to 33% by 2025
Increase the number of female wage earners to 22% by 2025
No. of human rights claims brought against Concentric
People
Concentric strongly believes that its people can make a meaningful difference in the world. They are given opportunities to feedback their ideas and suggest improvements to their work, in both structured and informal ways. Concentric’s Core Values of Customer focused, Achievement through our people, and Business excellence in all that we do describe the way colleagues work together across all areas of the company’s operations to achieve challenging goals.
Concentric commits to improving diversity and inclusion - this includes continuing to increase the number of apprenticeships and internships, collaborating with both local schools and technology colleges as well as strengthening our talent management approach across the group with improved succession planning and mentoring programs.
We offer hybrid working conditions to office staff and the health and wellness of our staff is celebrated across many of our facilities in the form of health check-ups, posture and mental health presentations and yoga classes. Equal pay, and life & health insurance benefits are just some of the key value-add incentives offered to our employees. Employees are rewarded for bringing new, talented employees into the group through our referral scheme. Long service awards are celebrated across many of our global facilities.
Concentric’s structured talent & succession planning approach gives employees access to training, development and mentoring. As we navigate a complex business environment, cross-functional project teams are created to use the best talents of the group in a collaborative and developmental way to solve real business challenges.
Concentric sites are encouraged to contribute to CSR activities that are relevant to their local communities and interests. Each year, employees within our company’s two EMP Plants based in Escanaba are involved in a schools competition called ‘First Robotics’. This programme involves employees mentoring and educating children from the local community who compete in robotic games and is designed to promote and encourage development within the STEM sector. Our employees in Rockford also support the Rockford Robotics initiative. These programs are designed to encourage interest and mentoring in STEM activities and careers.
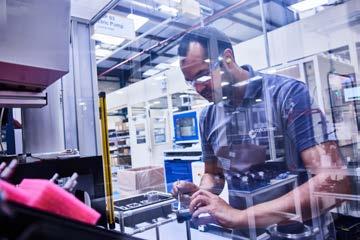
It’s not just about the products we sell or the profits we make, it is also about the impact we leave on society. “
2024 Highlights
Company wide Health & Safety
In 2024 Concentric continued on its journey to embrace a safer work culture by measuring and analysing leading indicators for safety as well as building on a flexible work scheme with wellbeing initiatives for employees. Each large site has a health and safety committee which is a diverse mix of managers and employees who meet regularly to discuss ideas on how to improve safety. The committee is involved in safety observations as well as communication, consultation and providing input into safety training plans.
Critical to the organisation is the health and safety of Concentric’s workforce, with specific sites having received International Standardisation Organisation (ISO) 45001 certifications regarding management systems of occupational health and safety.
Concentric’s approach to safety is one of continuous
Rockford, Illinois creates safety task force
Following a number of lost time incidents in 2023 due to hands/ fingers, a cross functional team was selected to help improve hand safety in Rockford. The team works with employees on the shop floor to improve awareness of hand hazards and to share best practices across cells.
The hand safety team meets once per week, cell by cell, throughout the building to look for potential pinch points, hazards and ergonomic concerns.
Hof, Germany supports local youth development
As part of the Concentric Employee Value Proposition, staff undergo valuable, professional and on-the-job mentorship. Some plants are invested in apprentice& internship opportunities, and on-site training.
In 2024 at our site in Hof, Germany, our employees attended several career days at the Hof university to
improvement as we aim to achieve our vision of Zero Harm – providing a workplace free from harm for all employees and all our other stakeholders, too.
Concentric reduced the number of lost time injuries, recordable injuries, total workdays lost due to injury and above all, improved its LTIFR from 8.31 in 2023 to 6.87 in 2024. LTIFR is a measure of the frequency with which the company is having lost time injuries.
LTIFR = (Number of lost time injuries in the reporting period) x 1,000,000 / (Total hours worked in the reporting period).
Concentric will continue to understand and assess the causes of its most severe and most frequent injuries in order to improve the workplace for its employees and achieve its goal of zero harm.
The program complements other improvements at site to help build an improved safety culture at all levels, including better communication and a more diverse safety committee. The site has vastly improved its safety record in 2024 and for the full year recorded zero lost time injuries involving hands. This initiative will be rolled out across other Concentric sites in 2025.
connect with future talents, offer insights into our current projects and exciting discussions about future technologies, and career opportunities with Concentric. The enthusiasm and interest of the students was overwhelming and reinforces our commitment to innovation and talent development.
2024 Highlights
Pune, India supports local hospital
Our facility in Pune, India recently expanded its CSR programme supporting Ruby Hall, the largest hospital group in Western Maharashtra. Ruby Hall Clinic Hospital in Pune provides accessible healthcare by operating 24 peripheral hospital centers across the state of Maharashtra, ensuring that quality medical care is available to residents of Pune and its neighboring regions.
EMP Plant 1, Escanaba wins award
Concentric’s EMP business in Escanaba was awarded last year with the prestigious title of ‘Veteran Business of the Year’ by Upper Peninsula Michigan Works for its dedication to providing veterans with work opportunities. The Award is an important recognition for EMP, which recognizes businesses in the Upper Peninsula who are dedicated to helping veterans reach their professional goals.
Concentric addressing online security
In recent years, Concentric rolled out its Cyber Security readiness program, assessed using the ‘NIST Cybersecurity Framework’. The program consists of the following elements:
• Identify: Understand business context, resources, and risks
Protect: Implement safeguards to ensure critical infrastructure services
• Detect: Develop activities to identify cybersecurity events
• Respond: Take action regarding a detected cybersecurity incident
• Recover: Maintain plans for resilience and restore capabilities after an incident
Concentric was thanked for its support with the unveiling of a plaque at the Gastroenterology and GI Endoscopy department. The clinic has previously acknowledged that organizations like Concentric play a critical role in enhancing healthcare accessibility so they can continue to invest in state-of-the-art equipment and offer advanced treatments to patients.
EMP has been helping veterans find jobs for years and plans to continue this rewarding activity. Approximately 10% of the site’s employees are veterans.
‘Whilst the award is greatly appreciated, the true reward is the privilege of working and connecting with veterans every day’ says Chad Leiter, Plant Director EMP.
• Implementation Tiers: These tiers help organizations understand their current cybersecurity posture and guide them in improving
• Profiles: Customized alignments of the framework core to the business requirements, risk tolerance, and resources of the organization.
During the past year, Concentric has added additional measures on top of these, to further enhance its level of cyber security. Concentric is committed to continue to roll-out additional training and to make further enhancements to its cyber security improvement program in 2025 and beyond.
Planet
At Concentric, environmental activities are integrated in all our operations and are the subject of continuous improvement through the Business Excellence programme. The Business Excellence programme underpins the Group’s approach to sustainability across all its activities. Whilst the focus of the company is to develop world class technology and innovative solutions to meet the sustainability needs of its customers, Concentric also pursues improvements with regards to its own environmental footprint.
Concentric’s products and processes are designed in such a way that energy, natural resources and raw materials are used efficiently, and that waste and residual products are minimised, in line with Concentric’s Environmental Policy. Many of Concentric’s sites have been certified in accordance with ISO accreditations and comply with ISO 14001 environmental management systems. Our sites consistently work to improve environmental impact, reduce emissions and to engage employee ideas via continuous improvement activities and suggestion schemes.
Environmental screening is a key component of Concentric’s supplier selection and validation process to ensure adherence to human rights, environmental and other standards. Specific environmental criteria have been in place since 2016 to ensure the business procures from ethical and sustainable suppliers. Concentric expect its suppliers to commit to reducing the environmental impact of their own operations through utilising an environmental resource management and adopting environmental management systems such as ISO 14001.
In addition to providing reliable and quality components, Concentric’s products offer customers various environmental benefits, including energy efficiency improvements and associated reductions in GHG emissions. Concentric’s variable flow water pumps can provide fuel savings of at least 2% on standard drive cycles as well as reductions of up to 15% in carbon monoxide, hydrocarbon, carbon dioxide, diesel particulate and nitrogen oxide emissions.
Concentric commits to leveraging its Business Excellence programme to share best practices across sites and foster a culture of innovation and continuous improvement with regard to sustainability
2024 Highlights
Birmingham, UK
With dedicated employee driven cross functional teams, Concentric Birmingham have been successfully working on several sustainability initiatives across the facility as part of their sustainability commitment and support of environmental legislation.
With rising energy costs one of the site’s employee teams working on this specific project became even more critical to support business performance during 2024. The cross functional task force harnessed
Advanced Products, Escanaba, US
With Sustainability being a high priority at our Advanced Products facility in Escanaba, Michigan, US, important projects have been implemented across three key areas, energy efficiency, water usage and land management.
Flourescent lighting has been replaced with energy-efficient LED lights in key areas, these LED upgrades have been extended from the shop floor to office spaces, reducing energy consumption and carbon footprint.
Circular products and packaging, Escanaba, US
Our Advanced Products site in Escanaba is embracing the circular economy with a variety of initiatives, moving away from soldering as a joining option to mechanical connections on some product lines, increasing reparability so parts can be broken down more easily to allow access for repairs when required and increase the lifetime of our products.
At the same time, the plant is driving a major push to utilise recycled packaging where appropriate, including repurposing waste cardboard into perforated pack-
employee ideas to accelerate the project, eventually rolling out e-stop vs idle states for machines which significantly reduced energy usage at the plant, increased employee ownership of energy reduction and resulted in 13% reduction in electricity usage.
The site has also initiated supplier returnable packaging which will remove approx. 50,000 single use plastics bags.
In an effort to reduce water usage across the site, touch-free faucets have been installed, improving hygiene whilst reducing water wastage. Additionally water filling stations have been created to encourage reusable water bottles, reducing plastic waste.
Across the site areas of turf grass have been converted to native grassland, with the potential to save over 70,000 gallons of water and $2,050 in costs over five years, with the added benefit of improved carbon sequestration with the potential to sequester 51.4 kg CO2e, and reduce CO2 emissions by 913 kg over that time.
aging material and using returnable dunnage to re duce the reliance on single-use plastic bubble wrap.
These initiatives are complimented by the plants efforts throughout 2024 to train 110 on site technicians and maintenance staff across 12 locations to improve troubleshooting and diagnosis of potential faults on equipment. Reducing the need for unnecessary replacement products, swaps and returns, and supporting the customer to have as little downtime as possible when problems arise.
Innovative Products and Partnerships
In 2024, Concentric identified opportunities to strengthen its approach by shifting more towards the circular economy through product design and sourcing activities, and elevating supplier management practices further by setting clearer standards around topics such as human rights and environmental standards.
Product engineering is not just about producing cutting-edge technology, it is about the critical responsibility that we, as engineers and manufacturers, bear towards the environment. Sustainable product engineering has become imperative. It is the responsibility of our engineers to design sustainable products, to meet the performance standards of the UN’s 2030 Sustainable Development Goals (SDGs). From the sourcing of materials and components, to assembling of products, delivery, their use, its energy consumption, environmental footprint, and end-of-life, must be considered.
Our suppliers are a vital part of our wider value chain and are therefore a key component of our commitment to quality and ways of working. Concentric recently
updated its Supplier Code of Conduct, with increased sustainability expectation and accountabilities, which all suppliers throughout our supply chain must comply with. Our Supplier Code of Conduct is the foundation of the work we do in the interaction with our partners. It defines our Values in Action – what we stand for and how we conduct ourselves with our customers, suppliers, and one another. While we conduct business within the framework of applicable laws and regulations, we also recognize we must set clear expectations, beyond the law, for ourselves and our business partners.
Concentric plans to continue to improve its supplier management practices through the following activities: Localisation and optimisation strategies to ensure that products are sourced and created as close to the market as possible to reduce cost and environmental impact; Continue to embed stronger supplier management processes and expectations; and by leveraging its Business Excellence programme to share best practices across sites with regard to supplier management and governance.

2024 Highlights
Concentric and the circular economy
With a focus on electrification, manufacturing of electric water and oil pumps, high-voltage fans and thermal management systems for reduced carbon emissions and energy efficiency Concentric AB helps to support the decarbonisation journeys of our customers. Additionally the production of our high-voltage fans and cooling pumps eliminate the need for inefficient and expensive DC-DC convertors on a fuel cell or battery-electric application and EMP has identified and tested a new fan blade technology that reduces noise and improves energy efficiency.
Concentric’s EMP brand is a leading producer of Mini-Hybrid® electric fan thermal management systems. The features and benefits of these systems are what made the EMP 12V Mini-Hybrid® system the obvious choice for a major Agriculture equipment OEM application. The bespoke 8-fan system is one of the largest EMP-branded fan systems ever made, standing at 56 inches tall (1.4m), and over 400 lbs, with no heat exchangers.
EMP, Escanaba, Michigan, US
Concentric’s EMP brand recently received a prestigious Gold Supplier Performance Award. A large OEM Customer recently conducted a comprehensive Production Readiness Review (PRR), and upon its findings, awarded EMP the prestigious Supplier Performance Award of gold for the 6th consecutive year. This accolade recognizes EMP’s exceptional performance in delivery, qual-
Hof, Germany
After receiving the news of a potential supplier bankruptcy last year, Concentric created a truly cross functional team to secure business continuity of its products for customers with an alternate sourcing strategy introduced and the matter resolved without downtime. Some products were sourced from an alternative sup -
Most hydraulic or clutch-based mechanical fans in similar applications consume 30+ mechanical horsepower from the engine. Even factoring in a 70% alternator efficiency, the EMP fan system consumes less than 7 mechanical horsepower from the engine.
This translates directly to fuel savings and more power to the wheels by reducing parasitic engine load from the cooling fan. Furthermore, the EMP variable-speed reversible fans solve the problem in the field where heat exchangers would frequently get plugged with hay chaff, requiring manual cleanout and downtime. The variable-speed fans prevent clogging by only running as hard as needed for engine cooling. The fan reverse feature is effective at backflushing hay chaff out of the radiators for self-cleaning, at the click of a button.
ity, and cost efficiency, alongside their outstanding support in engineering, service, and the aftermarket. It also recognises the company’s collaboration with our suppliers, enabling Concentric to keep its promise to achieving delivery promise and reaching or exceeding expectations for OEM customers.
plier in China, some parts were built internally at our facility in Hof. Moving forward, to ensure supplier financial security, additional controls have now been put in place with suppliers before any new award is granted.
Sustainability reporting – GRI
Concentric describes its work with sustainability, and reports on fulfilment of financial, environment and social goals and indicators, in the Sustainability Report. This report has been produced with reference to the GRI Standards. The aim is to measure, report and take responsibility for what we have achieved in our work toward sustainability with respect to both our internal and our external stakeholders.
Scope of the report
The Sustainability Report refers to the 2024 financial year and encompasses the operations of the entire Group, including subsidiaries. Concentric’s ambition is to provide a comprehensive account of its sustainability work and clearly present both negative and positive developments. The sustainability work draws on the policies and guidelines governing the manner in which the business is conducted based on the commitments made, for example, to the Global Compact. The materiality assessment performed in 2023 helped Concentric to determine the issues that are the most important to the business and its stakeholders and which should therefore be prioritised in its Sustainability Report. The 2024 GRI Index page references can be found on pages 26–28 of this report.
Materiality analysis
Materiality analysis is a method used to identify the topics which should be considered as priority areas of focus for an organisation. The materiality analysis involved capturing numerous stakeholder insights from within and outside of the organisation. This included in-depth interviews with key staff members, survey responses from identified stakeholders, internal investigations and standards, de facto-standards and legislative requirement in the area of sustainability. The information was evaluated based upon the opportunities and risks of different aspects related to Concentric’s operations - for long-term value creation both within the Group and the wider society. The results of this evaluation identified a number of themes which have helped inform Concentric’s approach to sustainability thus far and what should be reported on.
• Noise pollution
• CO2 and other harmful emissions
• Compliance and reporting irregularities
• Procurement practices
• Effluents and waste
• Hazardous goods and processes
• Training and organisation culture
• Creation of wealth
• Product and supplier responsibility
• Ethics and value creation
• Resource efficiency
• Climate impact
• Equality and diversity
• Job creation and skills development
• Transparent communication
• Occupational H&S
• Contribution to local society
Concentric’s management approach to sustainability
Material aspects of sustainability Key risks and why material Governance
Ethics and Value Creation (DMA Economic Performance & Procurement Practices)
Product Responsibility, Climate Impact (DMA Product and Service Labelling and Emissions) and Resource Efficiency (DMA Materials and Energy)
• Reputational loss Legal cost of breaches
• Reduced shareholder value
Concentric’s long-term profitability is fundamental to value creation.
• Long-term viability of organisation Impact on society
• Legal cost of breaches
• Reduced shareholder value
Concentric develops innovative engine and hydraulic pumps which increase efficiency and reduce emissions, thereby reducing the impact on the climate of Trucks and Off-highway mobile equipment is strategically important to the business.
• Ethical guidelines Code of Conduct
• Reporting of violations based upon Concentric’s values and policies
• Whistle-blowing policy
• Financial targets
• Monthly business reviews
• Risk management process
• Environmental policy
• ISO/TS 16949 Quality Control Systems
• Customer surveys
• Product design tollgate process
• FMEA
• Durability and performance testing
• Emissions legislation testing both for On- and Off-highway vehicles
ISO 14001 Environmental Management System
• Continuous improvement and Lean manufacturing methodologies driven by the Business Excellence programme
Follow-up through GRI indicator aspects for stakeholders
204-1 Proportion of spending on local suppliers
301-2 Recycled input materials used
302-3 Energy intensity
Responsible Suppliers (DMA Supplier Environmental and Human Rights Assessment)
• Reputational loss
• Impact on society Continuity of supply
It is strategically important that the large quantities of materials purchased for Concentric’s pumps are manufactured under responsible conditions.
Work Environment (DMA Occupational Health and Safety)
Diversity and Equal Opportunity (DMA Diversity and Equal Opportunity)
• Safety of employees
• Legal cost of breaches
Reduced shareholder value from lower productivity
The work environment within Concentric’s manufacturing operations is exposed to many different risks for accidents and other work-related injuries.
• Reputational loss (employer brand)
• Lack of innovation
• Unfair treatment of employees
Legal costs from breaches in human rights.
We believe that a long-term employment policy should offer a workplace that is both characterised by, and protects equality and diversity.
• Social policy
• Code of Conduct for suppliers ISO/TS 16949 Quality Control Systems
• ISO 14001 Environmental Management System
• Supplier selection and assessment procedures
• Supplier days/visits and on-site audits
• Accident and injury statistics
• Clock card records Skills matrices
• Training and development plans Preventative healthcare and Employee Wellness programmes
• 6S methodology
• OHSAS 18001
• Internal and external audits
• Code of Conduct Employee handbook
• Recruitment procedures
• Equality targets Nomination committee
308-1 New suppliers that were screened using environmental criteria
414-1 New suppliers that were screened using environmental criteria
403-9 Work related injuries
2-7 Employees
405-1 Diversity of governance bodies and employees
Facts and key performance indicators for sustainability
& value creation
Procurement practices, 204-1 Suppliers Proportion of expenditure with local suppliers 1)
Responsible suppliers
New suppliers that were screened using environmental critera, 308-1
New suppliers that were screened using social criteria, 414-1
Suppliers
Percentage of new suppliers that were screened using environmental criteria
Suppliers Percentage of new suppliers that were screened using human rights criteria
Work-related injuries, 403-9 Employees
Lost days, 403-9 Employees
Work-related injuries that caused at least one day of absence expressed as the number of incidents relative to the total days worked for all employees
Total number of absence days due to work-related injuries as a percentage of the total days worked for all employees
Absenteeism, 403-9 Employees Total number of all absence days as a percentage of total days worked for all employees
Work-related fatalities, 403-9 Employees Total number
1) Definition of local supplier based upon ability to deliver from the supplier’s manufacturing premises to Concentric’s facility using road transportation only.
Facts and key performance indicators for sustainability
2-7 and 405-1
1) Age and gender distribution excludes any part-time/temporary workers employed through agencies.
2) Calculated as actual head count at year end.
reference
2024 GRI Index
Concentric has reported the information cited in this GRI Content Index for the period 1st January 2024 to 31st December 2024 with reference to the GRI Standards.
The intention is for the GRI Index to be used as a cross-reference list to find where in the annual report the information is located. In some cases supplementary or complete answers to a question are provided in the comment field of the index table. The information in the Sustainability Report has not been reviewed by a third party. Other calculations of indicators and key performance indicators have not been reviewed by an external party.
2-6 Organisation’s
2-6 Significant changes during the reporting period regarding size, structure, ownership or supply chain
2-7 Total workforce by employment type, employment contract and gender Concentric employees by country (FTEs) Facts and key performance indicators for sustainability
3-3 Description of how the Company addresses the precautionary principle
Stakeholder engagement
2-29 Identifying and selecting stakeholders Stakeholders 10-11
2-30 Percentage of employees covered by collective bargaining agreements 41% of employees in the group are covered by collective agreements
2-29 Approaches to stakeholder engagement
Identified material aspects and boundaries
2-2 Operational structure, units, business areas, subsidiaries and joint ventures
3-1 Process to determine material topics
3-2 List of material topics
3-3 Disclosure on management approach
Sustainability Report Scope of the GRI report
Concentric’s group-wide aspects and targets in sustainability
Concentric’s management approach to sustainability
A high level description of how material topics have been determined is included in the Sustainability Report.
As for 3-1, a high level description of how material topics have been determined, as well as reference to indicators and progress towards targets, is included in the Sustainability Report. The upcoming double materiality assessment will inform Concentric’s ESG strategy going forwards and enable Concentric to better define, and report on, indicators, targets and lessons learned.
GRI
Report profile
2-3 Reporting period, frequency and contact point
2-5 Policy and current practice for external assurance
Economic performance indicators
204-1 Procurement practices
Society
205-1 Number and percentage of operations assessed for risks related to corruption
206-1 Number of pending/completed legal actions brought for anticompetitive behaviour, anti-trust and/or monopoly practices
Environmental performance indicators
301-2 Recycled input materials used
302-1 Energy consumption within organisation
308-1 Percentage of new suppliers that were screened using environmental criteria
Employment conditions and work conditions
403-9 Rates of injuries, lost days, absenteeism, and number of work related fatalities
405-1 Composition of governance bodies and breakdown of other employee types according to gender and age group
Supplier human rights
414-1 Percentage of new suppliers that were screened using human rights criteria
Product responsibility
416-2 Number of incidence of non-compliance with regulations concerning the health and safety impacts of products provided to customers during their life cycle
GRI index
performance
100% of the group’s operations were assessed and no significant risks related to corruption were identified
performance indicators for
indicators for
Global Compact
Although Concentric has not signed the UN’s Global Compact, the social and environmental policies adopted by Concentric are based upon the founding ten princi -
Ten principles of the UN’s Global Compact
ples, thereby clearly demonstrating the group’s position on issues related to human rights, labour law, accountability for the environment and anti-corruption.
Human rights Reference Page
1. Support and respect the protection of internationally proclaimed human rights in the spheres the Company can influence Sustainability Report 6-14
2. Make sure that the Company is not complicit in human rights abuses Sustainability Report 6-14
Labour law
3. Uphold freedom of association and the effective recognition of the right to collective bargaining Sustainability Report 6-17
4. Elimination of all forms of forced and compulsory labour Sustainability Report 6-17
5. Effective abolition of child labour Sustainability Report 6-17
6. Elimination of discrimination in respect of employment and occupation Sustainability Report 6-17
Environment
7. Support a precautionary approach to environmental challenges Sustainability Report 18-21
8. Undertake initiatives to promote greater environmental responsibility Sustainability Report 18-21
9. Encourage the development and diffusion of environmentally friendly technologies Sustainability Report 18-21
Anti-corruption
10. Work against corruption in all its forms, including extortion and bribery Sustainability Report 6-14

A.P. MOLLER CAPITAL
A.P. Moller Capital’s impact report for 2024 is enclosed on the next pages.
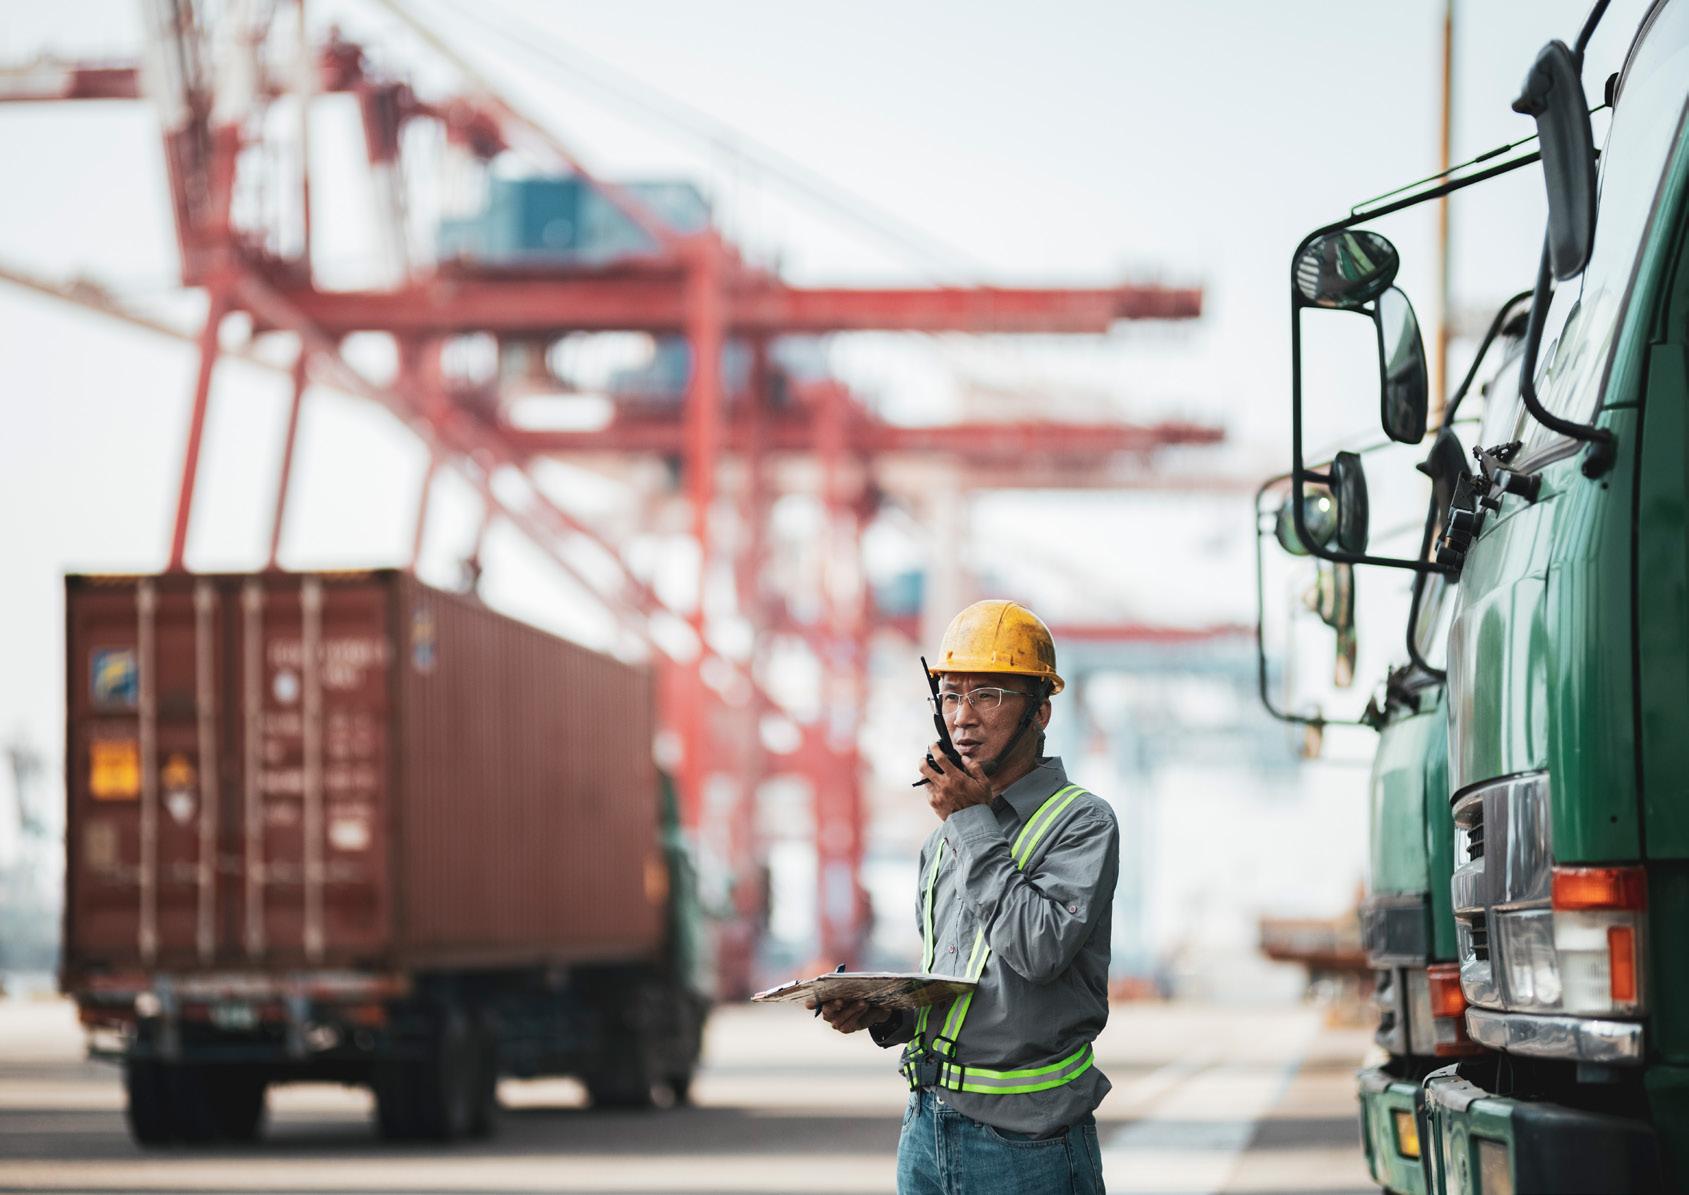
ANNUAL IMPACT REPORT 2024
WE ARE GUIDED BY OUR FIVE CORE VALUES
CONSTANT CARE
Take care of today, actively prepare for tomorrow
HUMBLENESS
Listen, learn, share, give space to others
Portfolio
Unlocking Southeast Asia’s renewable energy potential
Portfolio companies on the road to net zero
Advancing Morocco’s green hydrogen economy

Cabeolica
MESSAGE FROM THE CEO
I am pleased to present our Annual Impact Report 2024, which provides a comprehensive overview of A.P. Moller Capital’s sustainability efforts and impact.
In 2024, we stayed true to our mission of ‘doing well while doing good’. This principle has always been at the heart of A.P. Moller Capital’s operations, and over the past year, it has been more important than ever. Amid shifting technological and geopolitical dynamics, evolving policies and energy security concerns, we saw both challenges and opportunities shaping the transport and energy sectors. Economic uncertainty, partly driven by geopolitical change, increased market volatility and made long-term planning less predictable. On the other hand, advances in AI and the accelerating transition to renewable energy opened new avenues for growth. A prime example is our portfolio company Terra Firma Solutions, part of Lumika Renewables, which leveraged AI to enhance operational efficiency by improving weather forecasting and predictive maintenance.
Our second fund, A.P. Moller Capital – Emerging Markets Infrastructure Fund II (EMIF II), continued to invest in critical infrastructure in select high-growth markets where funding gaps are most significant. Launched in 2022 as an Article 9 fund, EMIF II expanded its regional footprint in 2024 with the establishment of Verdant Energy, a platform dedicated to developing renewable energy in Southeast Asia. This investment – our first in Asia – is helping to meet rising energy demand while supporting the transition to low-carbon power in some of the world’s fastest-growing economies.
Continuing our commitment to safety
Ensuring that every worker returns home safely remains a top priority at A.P. Moller Capital. We take pride in upholding some of the highest safety standards in the industry, responding swiftly and decisively when incidents occur, and constantly striving to do better. In 2024, we revised our Safety Framework to enhance safety performance and further foster a culture of safety across our portfolio. Key initiatives included tailored training, more rigorous risk assessments, increased board-level engagement and regular visits to portfolio companies where severe accidents occurred.
As part of a targeted safety effort, we supported Eranove, one of our portfolio companies in the Africa Infrastructure Fund I (AIF I), in appointing a senior health and safety specialist and strengthening the assessment of serious incidents to prevent them from happening again.
Despite these measures, we experienced several tragic fatalities within AIF I in 2024. As an investor in energy and infrastructure –sectors that are inherently high risk – we acknowledge our responsibility to the 18,195 employees across our portfolio and remain committed to improving workplace safety.
Scaling decarbonisation
Beyond portfolio expansion and safety, decarbonisation was a focus area across all investments. In EMIF II specifically, Vector Logistics in South Africa and CACC Cargolinx, which is part of HAU Logistics in Egypt, took important steps to reduce emissions in their operations and value chains. Both companies set carbon reduction targets aligned with the latest climate science and have started implementing decarbonisation road maps to achieve the targets. These efforts not only help mitigate climate-related risks but also build resilience in the transport and logistics sector, where emissions remain hard to abate.
Impact priorities for the year ahead
Economic uncertainty and geopolitical change look set to persist in 2025. These forces will likely influence investment decisions, underlining the need for agility, scenario planning and local market knowledge. A.P. Moller Capital’s adaptability and proximity to our markets have historically enabled us to navigate uncertainty, and I am confident this will continue to be the case in the year ahead.
We will maintain our focus on upholding the highest safety standards by working closely with our portfolio companies, their leadership, employees and all other relevant stakeholders. Our pursuit of safety excellence means proactively identifying and addressing risks while improving practices when necessary. This is more than a goal – it is a cornerstone of our duty to create safety-first workplaces that ensure the wellbeing of all employees.
At the same time, accelerating decarbonisation and the energy transition will remain core to our impact approach as our portfolio expands. By maintaining a disciplined and responsible investment strategy, we will continue addressing critical infrastructure needs while delivering competitive, consistent returns.
At A.P. Moller Capital, we believe that impact and profitability go hand in hand in building sustainable businesses, which is what we mean when we say, ‘doing well while doing good’. In the global context facing us, responsible investment is not just a necessity but, increasingly, a competitive advantage. In 2025, I look forward to continuing to collaborate with like-minded partners to amplify our impact through investing in sound and sustainable businesses.
Kim Fejfer, Managing Partner and CEO
A.P. MOLLER CAPITAL AT A GLANCE
A.P. Moller Capital is a fund manager committed to investing in critical infrastructure within the transport and energy sectors across select growth markets where infrastructure gaps are most significant. Rooted in the A.P. Moller Group's overall purpose of 'Nyttig virksomhed', A.P. Moller Capital’s mission is to focus on 'doing well while doing good'. Our industrial heritage, financial expertise and global network of local partners enable us to access and efficiently execute unique investment opportunities.
2017 2
Year founded
Total funds
12 c. USD 2 BN
Portfolio companies Assets under managment (AUM)
18,195 Direct jobs 41%
Share of female total employment supported
204,036 Estimated total supported jobs
1,910 M
Estimated total supported GDP contribution (in USD)
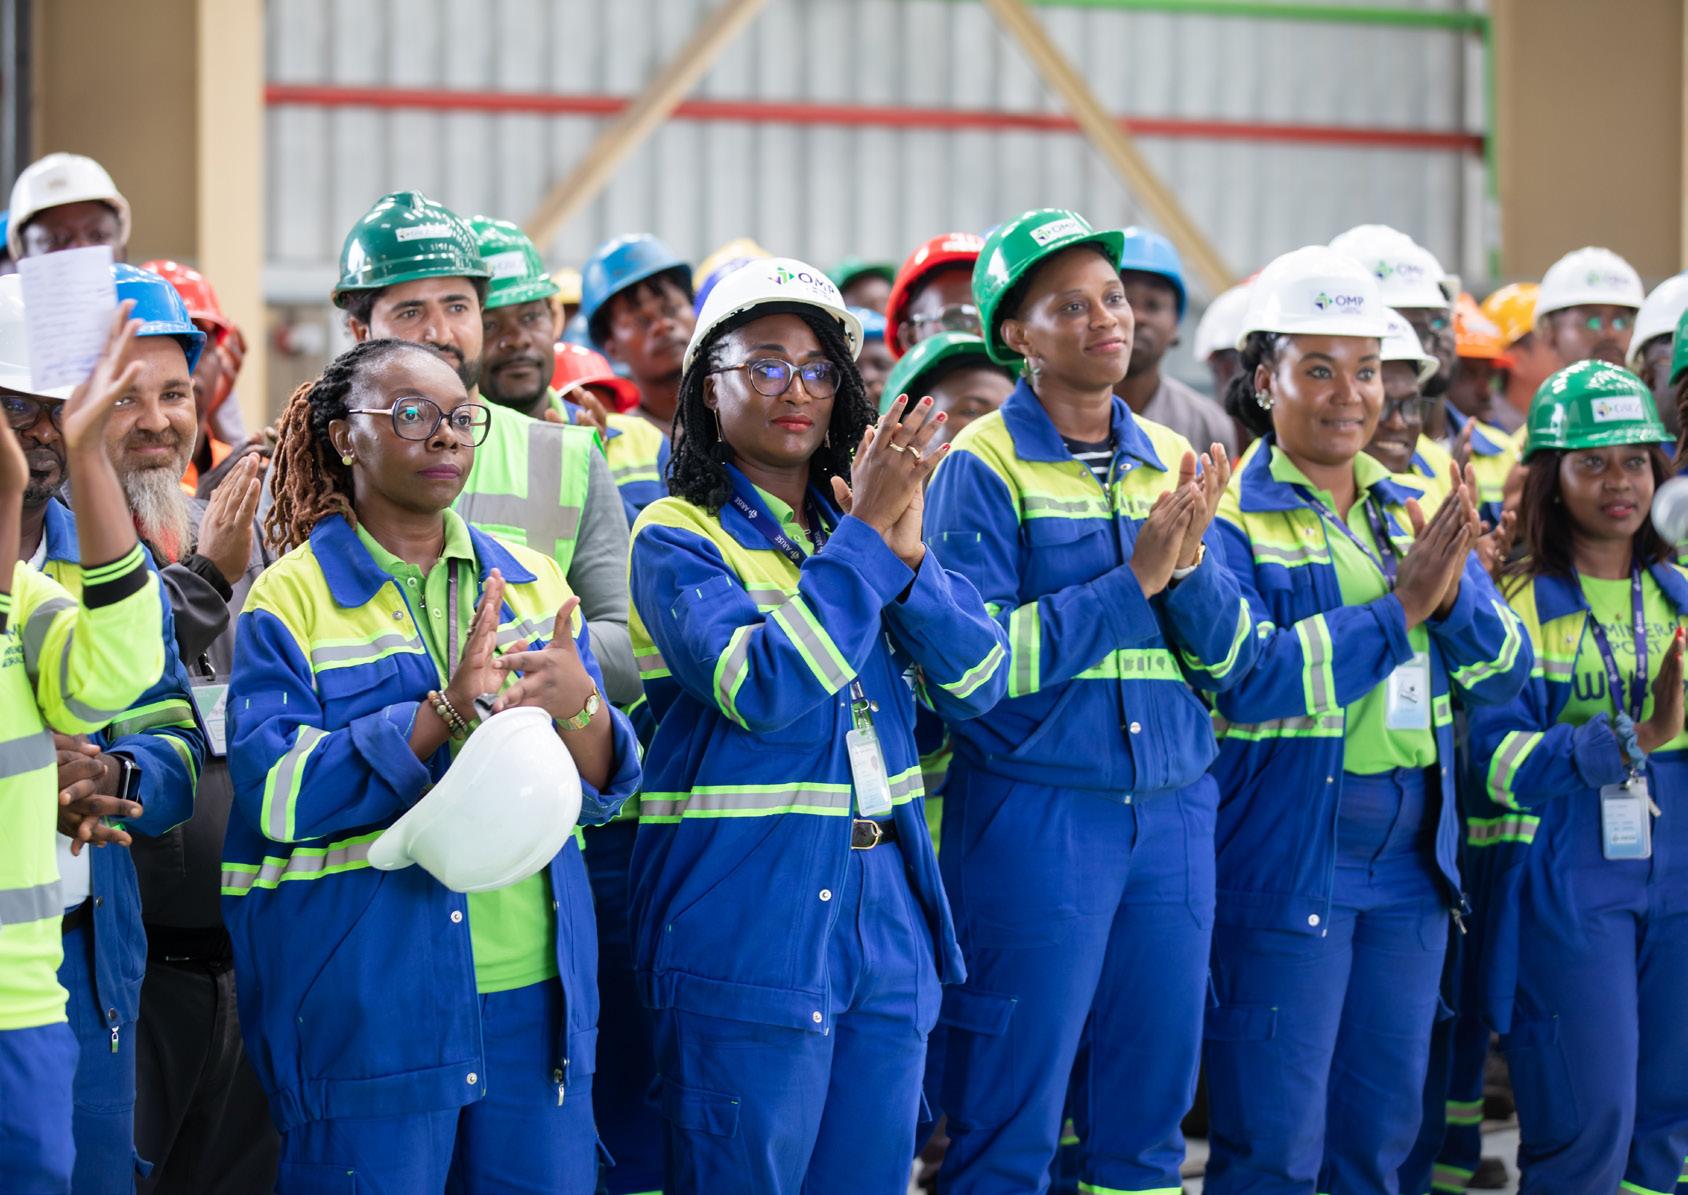
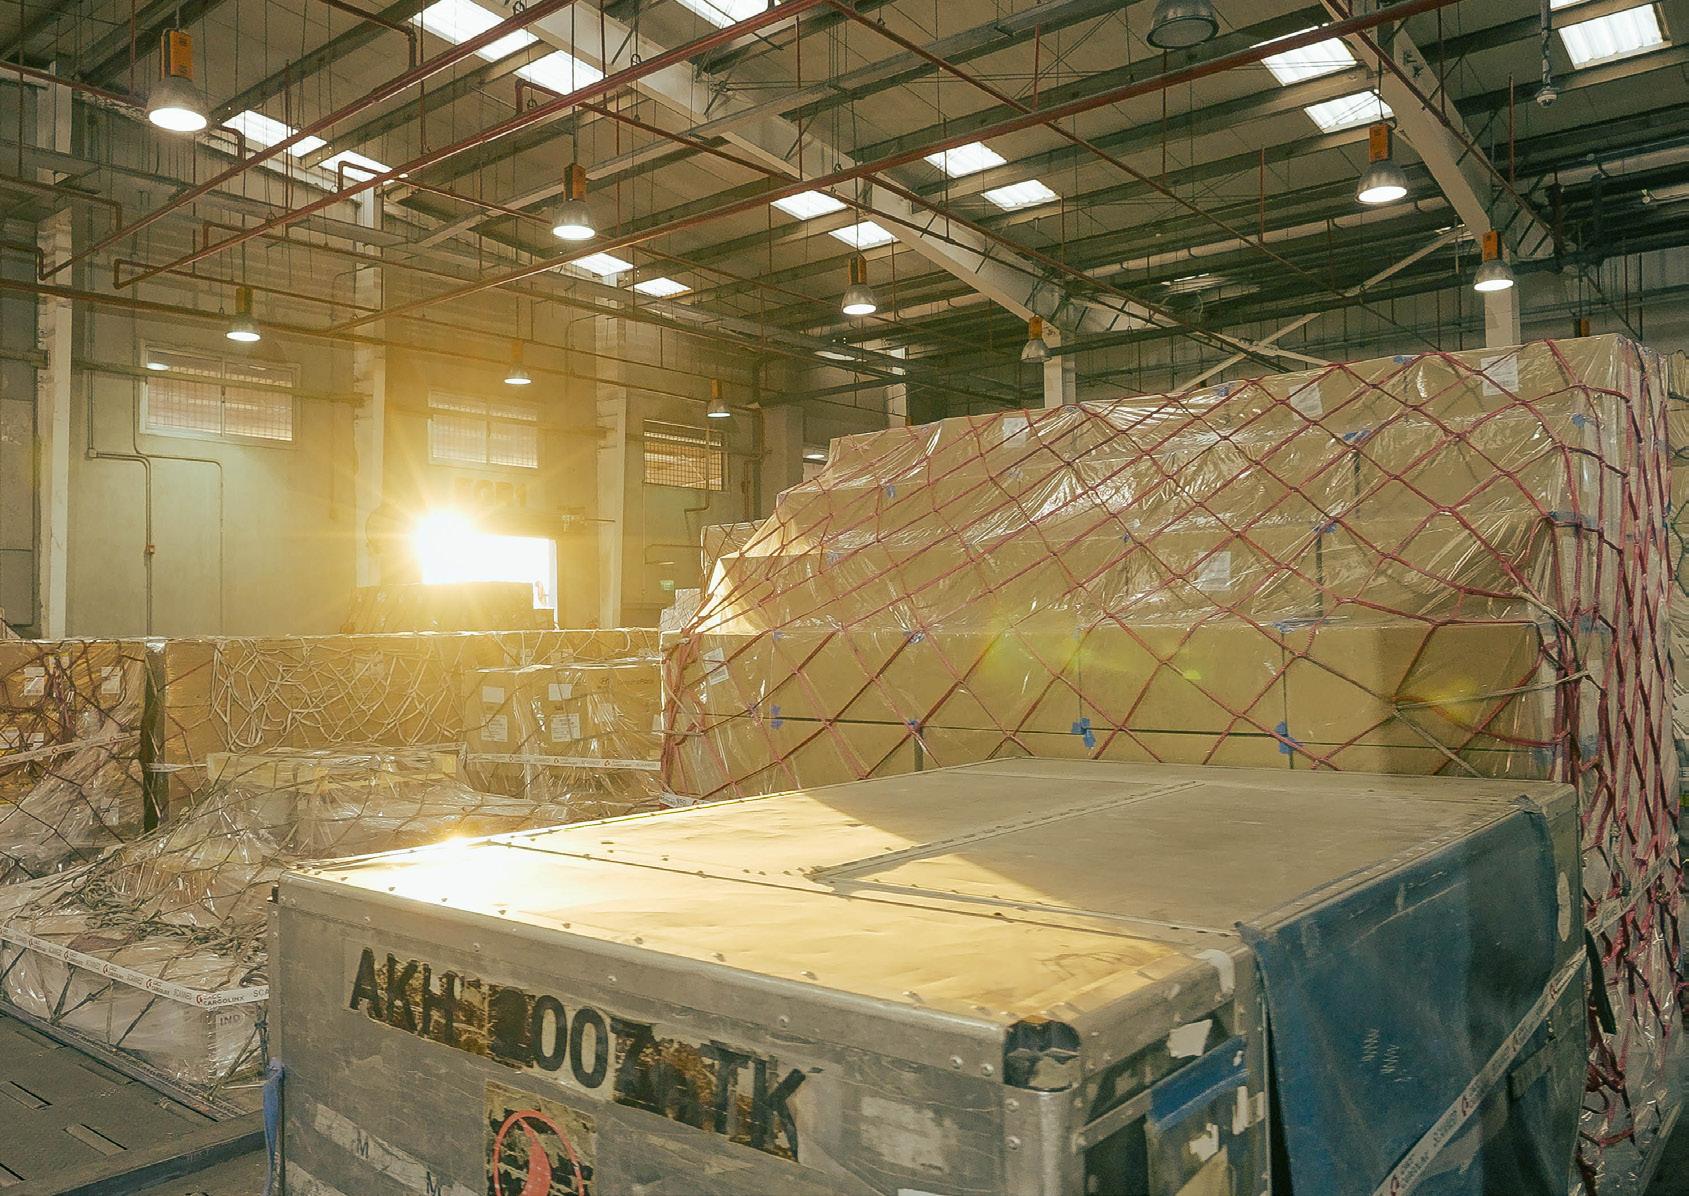
OVERVIEW OF OUR PORTFOLIO
Africa Infrastructure Fund I K/S (AIF I)
AUM: c. USD 1 bn
Portfolio companies: 8
Transport and logistics Energy
Arise Ports & Logistics
Côte d’Ivoire | Gabon
Mineral and general cargo
port terminals
Mass Céréales Al Maghreb
Morocco
Grain terminals
KEG Holdings
Kenya
LPG import and distribution
Cabeolica
Cabo Verde
Wind power
Lumika Renewables
South Africa
Solar captive power
Eranove
Côte d’Ivoire | Togo
Thermal power, hydropower and water distribution
Impala Energy Holdings
Nigeria
Captive power (flared gas)
East Africa Infrastructure Platform
Kenya
Thermal power
A.P. Møller Capital – Emerging Markets Infrastructure Fund II (EMIF II)
AUM: c. USD 1 bn
Portfolio companies*: 4
Transport and logistics Energy
HAU Logistics
Egypt
Warehousing & logistics
Vector Logistics
South Africa | Zambia | Botswana | Namibia
Warehousing & logistics
* Please note that Chbika project is currently under development.
Verdant Energy
Singapore
Renewable energy platform
Chbika project
Morocco
Green ammonia port infrastructure
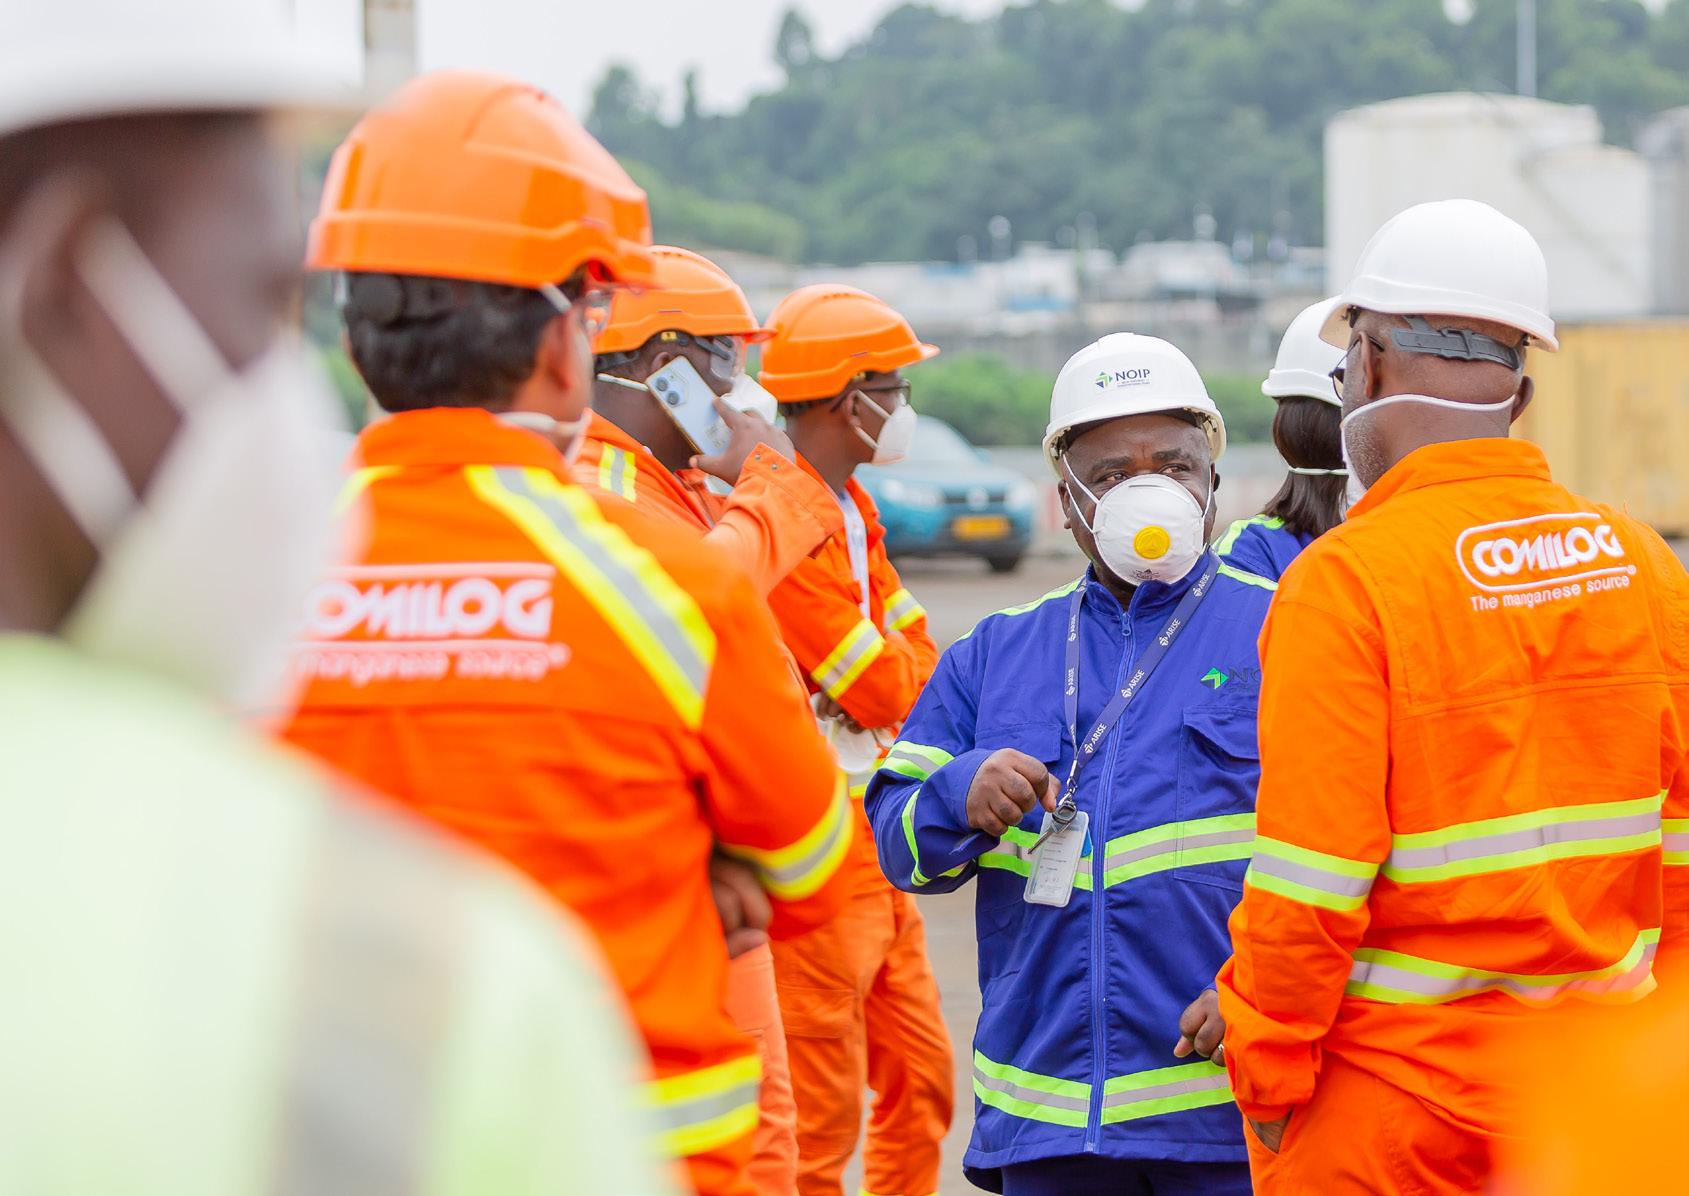
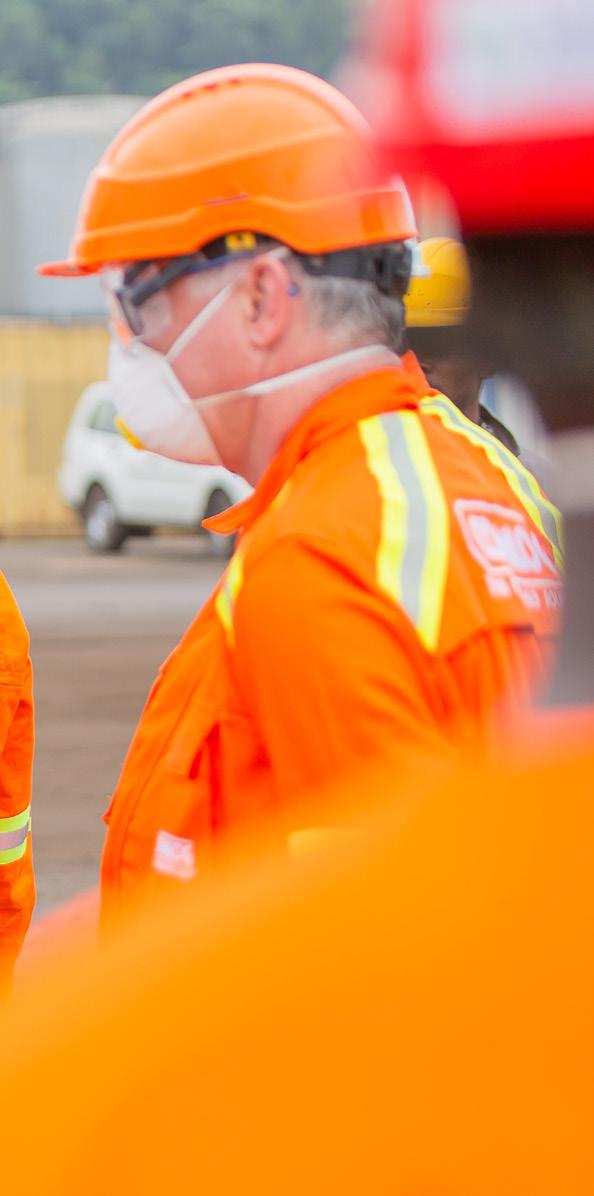
RESPONSIBLE INVESTMENT FRAMEWORK
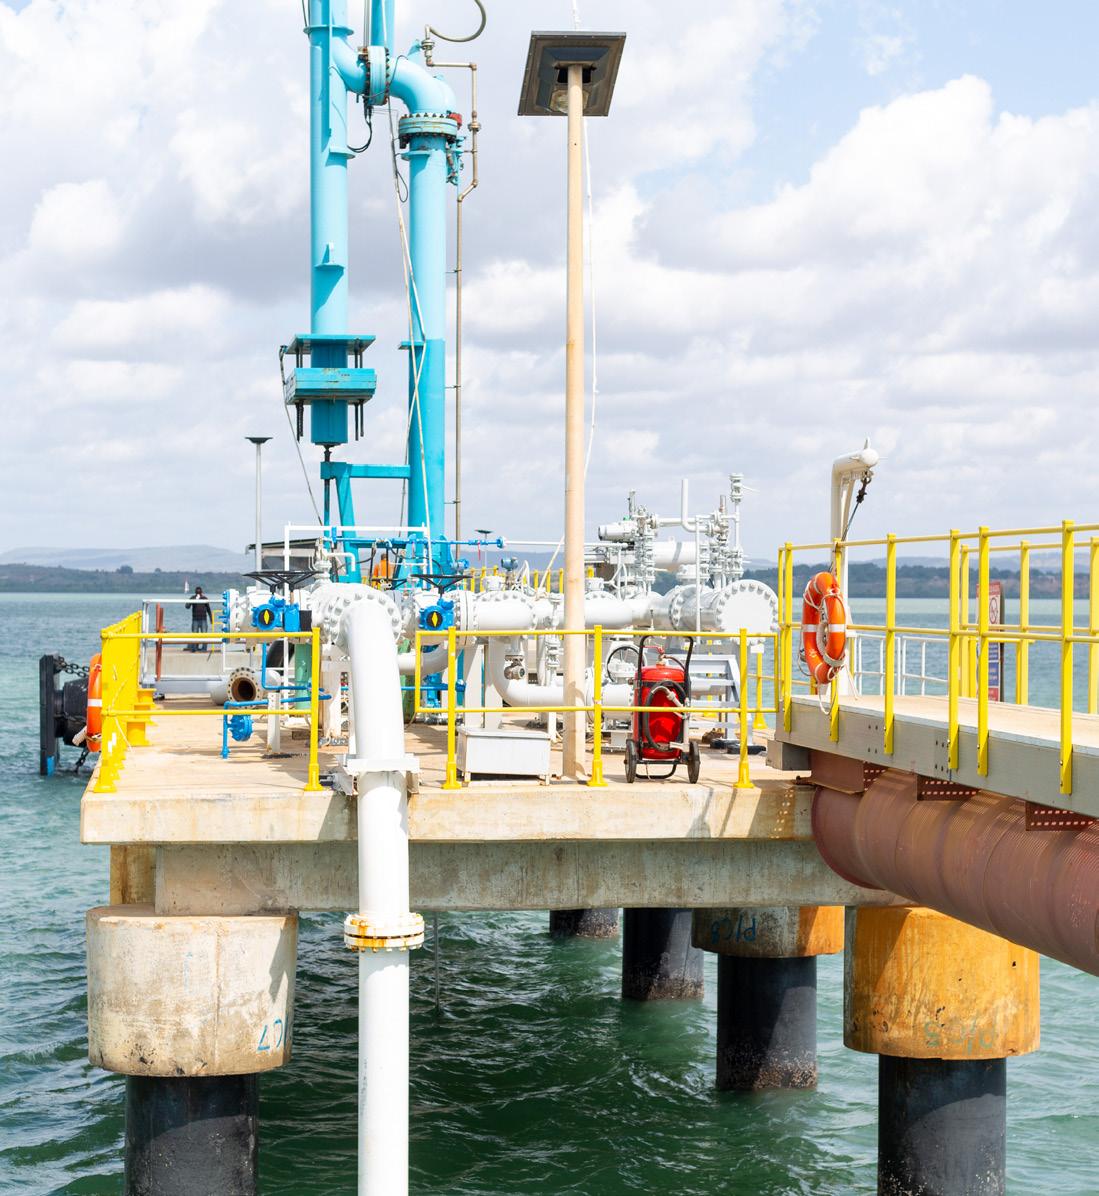
RESPONSIBLE INVESTMENT FRAMEWORK
We view responsible investment as a strategic approach that not only mitigates risks but also unlocks opportunities for long-term value creation. By integrating environmental, social and governance (ESG) considerations into every step of our investment process, we are able to contribute meaningfully to sustainable development while effectively managing environmental and social risks and minimising adverse impacts.
Our Responsible Investment Framework (RIF), guided by our Ethical Policy, establishes the sustainability commitments that determine how we identify, assess and manage risks within our portfolio companies. These commitments have guided the development of our Environmental and Social Management System (ESMS), ensuring ESG integration throughout our investment process.
In 2024, we updated our ESMS to reflect changes in our portfolio and the evolving ESG landscape. These updates include a revised Safety Framework, a refined incident reporting procedure and a sustainable procurement policy, all of which are discussed in more detail later in the report. Additionally, we introduced updated monitoring guidelines that emphasise environmental and social (E&S) site visits along with a publicly accessible grievance mechanism to maintain close engagement with stakeholders. We also developed a risk categorisation screening tool to assist the Investment team in the early stages of the investment process. This tool helps identify high-risk projects that require greater oversight due to their potentially significant ESG impact or their exposure to higher-risk countries and sectors.
Photo: KEG Holdings
ESG governance
To support the effective implementation of the RIF and the integration of ESG considerations throughout the investment process, A.P. Moller Capital has established a clear governance structure. Key functions across the organisation – including the Investment, Legal and Management teams – work together to embed ESG principles in decision-making.
ESG governance structure
BOARD OF DIRECTORS is responsible for ensuring compliance with our Ethical Policy.
THE INVESTMENT COMMITTEE evaluates environmental and social due diligence ndings and ensures that ESG considerations are taken into account in each phase of the pre-investment process.
THE INVESTMENT TEAM is responsible for integrating ESG in accordance with internal policies and procedures, with the support of internal ESG specialists and third-party advisers.
THE ESG TEAM is responsible for implementing the Environmental and Social Management System, providing capacity building, and supporting the Investment team during due diligence and portfolio management.
THE RISK & COMPLIANCE FUNCTIONS provide support to the ESG and Investment teams, ensuring compliance with risk procedures and internal policies.
THE RISK & ESG COMMITTEE oversees and monitors risk and ESG compliance across the organisation. The committee meets quarterly to discuss risk and ESG matters related to the fund manager and the portfolio.

Photo: Eranove
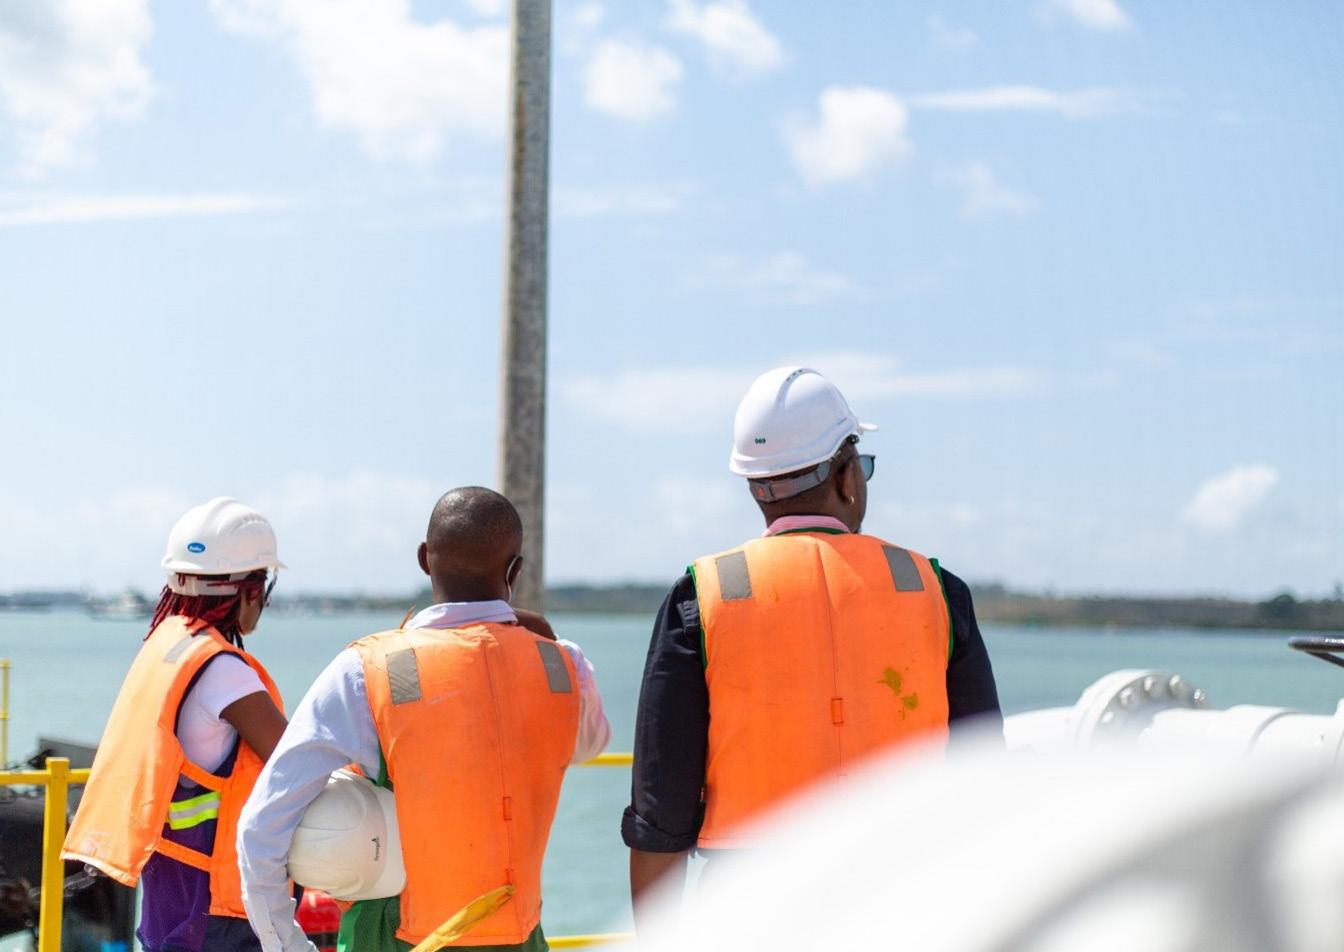
ESG in our investment cycle
To manage risks effectively, we first need to understand what they are and whether we can mitigate them. That is why we assess risks from the screening stage, allowing us to withdraw from investments that do not align with our sustainability standards.
During the initial screening phase, we evaluate investment opportunities against A.P. Moller Capital’s Exclusion List and any applicable fund-specific criteria. In 2024, we developed a screening questionnaire to help us carry out high-level risk assessments. We also assign a preliminary risk categorisation to potential new portfolio companies, which helps to define the scope of due diligence.
Projects that pass the initial screening and receive investment committee approval undergo comprehensive environmental and social due diligence (ESDD). This process aligns with the requirements of the IFC Performance Standards, Environmental, Health and Safety (EHS) Guidelines, and any relevant industry-specific standards. It includes detailed document reviews, site visits and stakeholder interviews.
Based on the outcome, the preliminary risk category is confirmed. Any identified gaps or value-creation opportunities are incorporated into an Environmental and Social Action Plan (ESAP), which is a binding element of the investment agreement.
Prior to signing an investment, we formalise the portfolio company’s commitment to our ESG requirements through the shareholders’ agreement (SHA). This includes the ESAP, which mandates the development of an ESMS with policies and procedures for risk management, as well as adequate organisational capacity to oversee ESG performance.
Following integration into our portfolio, A.P. Moller Capital actively monitors each company’s ESG performance with support from nominated board representatives. Company-specific key performance indicators (KPIs) are assessed quarterly. In 2024, we developed monitoring guidelines to standardise E&S reviews. These include tracking progress on ESAP implementation and conducting site visits.
Upon exiting an investment, A.P. Moller Capital ensures a smooth transition of E&S management by providing potential buyers with historical ESG data and addressing any queries related to ESG performance.
Promoting supply chain transparency and accountability
While central to the global green transition, companies in the renewable energy sector, particularly those active in the solar photovoltaic (PV) industry, are facing increasing scrutiny. Concerns have grown over unethical sourcing of raw materials, forced and child labour, labour rights violations and environmental impacts. The complexity of solar PV supply chains often makes it difficult to trace materials to their source, increasing the risk of human rights abuses going undetected.
To align with our ESG objectives and ensure that the transition to clean energy respects human rights, A.P. Moller Capital developed a Solar Supply Chain Policy in 2024 as part of our updated ESMS. This policy, which our portfolio companies are required to align with, emphasises compliance with international human rights standards and promotes transparency.
Policy purpose and requirements
The policy establishes a framework for the ethical sourcing of materials for solar PV projects. Its goal is to ensure that all materials come from reputable and reliable suppliers while preventing forced and child labour throughout the supply chain. To achieve this, it defines several requirements:
• Supplier management: Portfolio companies must implement systems to evaluate supplier risks, enforce adherence to ethical supplier codes and conduct traceability assessments for key materials.
• Compliance with international standards: The policy aligns with the UN Guiding Principles on Business and Human Rights, International Labour Organization Conventions, and Due Diligence Guidance for Responsible Supply Chains set out by the Organisation for Economic Co-operation and Development.
• Monitoring and improvement: Annual reviews, third-party audits (where feasible) and reporting mechanisms ensure compliance and continuous improvement.
A good example of how supply chain challenges can be effectively addressed in practice is Terra Firma Solutions, a clean energy company that is part of Lumika Renewables. We spoke to Dean James, Terra Firma Solutions’ Head of Procurement and Supply Chain. He outlined the key components of the company’s sustainable procurement policy and shared insights into their future priorities.
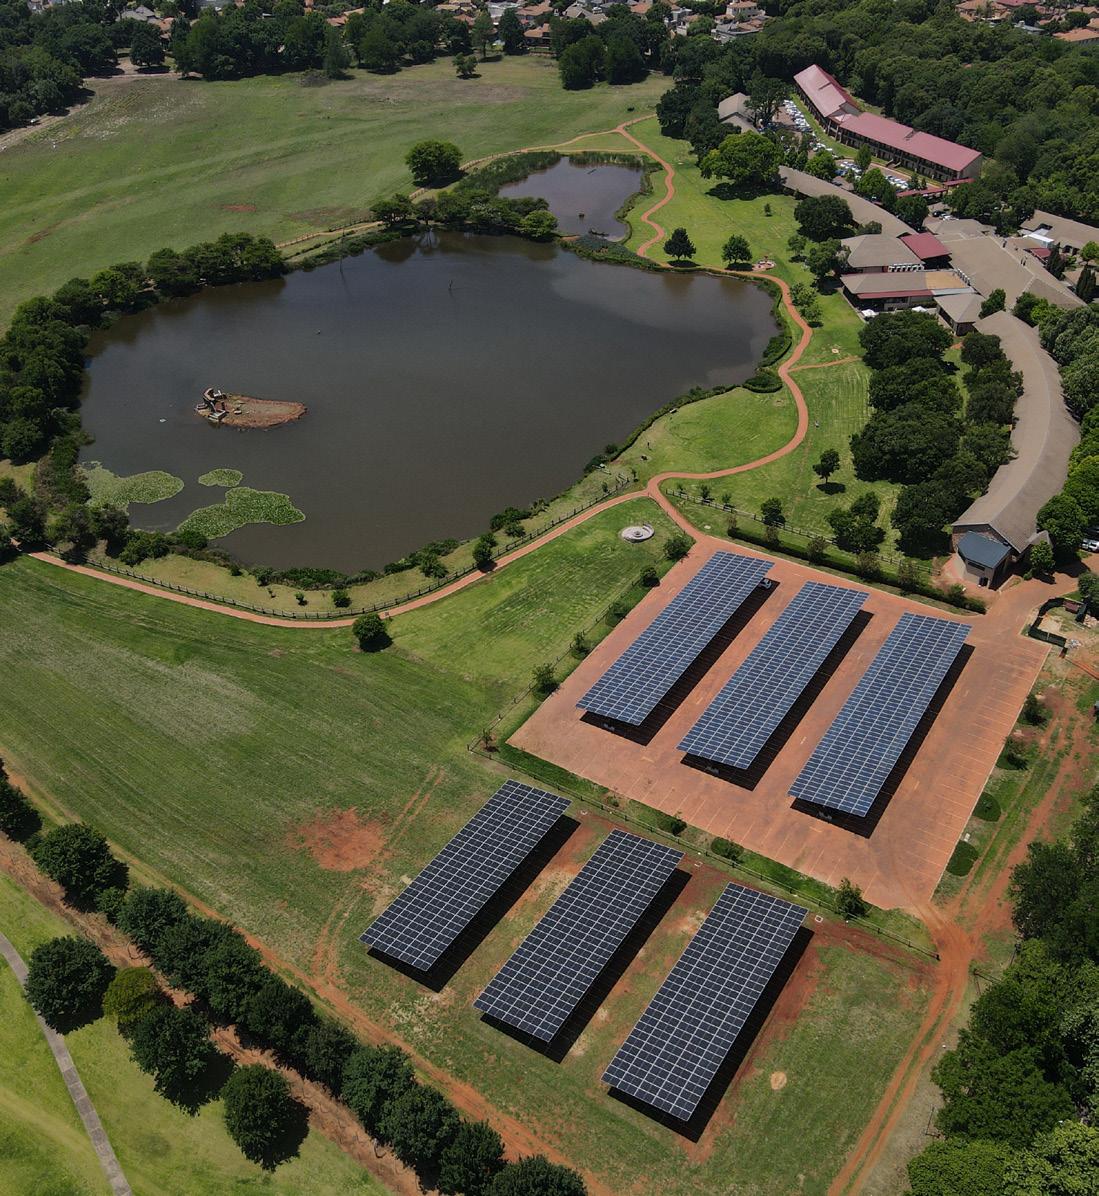
Sustainable procurement in Southern Africa
Dean James joined Terra Firma Solutions in late 2024 as Head of Procurement and Supply Chain. The position was created to help the company, a South Africabased solar PV and energy storage provider, accelerate its procurement organisation journey with a vision to incorporate sustainable procurement and ESG goals. In this Q&A, he details the progress that has been made.
Q: In recent years, Terra Firma Solutions has developed a sustainable procurement policy. What are some key elements of the policy?
Dean: The policy has two main components: sustainable procurement principles and a supplier code of conduct. We are navigating the procurement journey and maturing sustainable procurement principles that will, in the future, govern the actions and activities of everyone engaged in procurement for Terra Firma Solutions. These actions and activities include transparency, accountability, adherence to applicable laws and regulations, diversity and local procurement. The supplier code of conduct extends these principles to our suppliers, as well as laying out additional standards with which suppliers are expected to comply. The standards cover the entire supply chain, from material sourcing and labour practices to human rights and waste management.
Q: You mentioned local procurement as a key element of the policy. How will that be applied?
Dean: In South Africa, we are driven by Broad-Based Black Economic Empowerment (BBBEE), a government policy to advance economic transformation and inclusion. A system of ratings and levels reflects a business’s approach to this policy. Whenever possible, our aim is to source from BBBEE-compliant businesses. Directing our local procurable spend to those businesses not only benefits the businesses themselves but also drives social development, a key component of BBBEE.
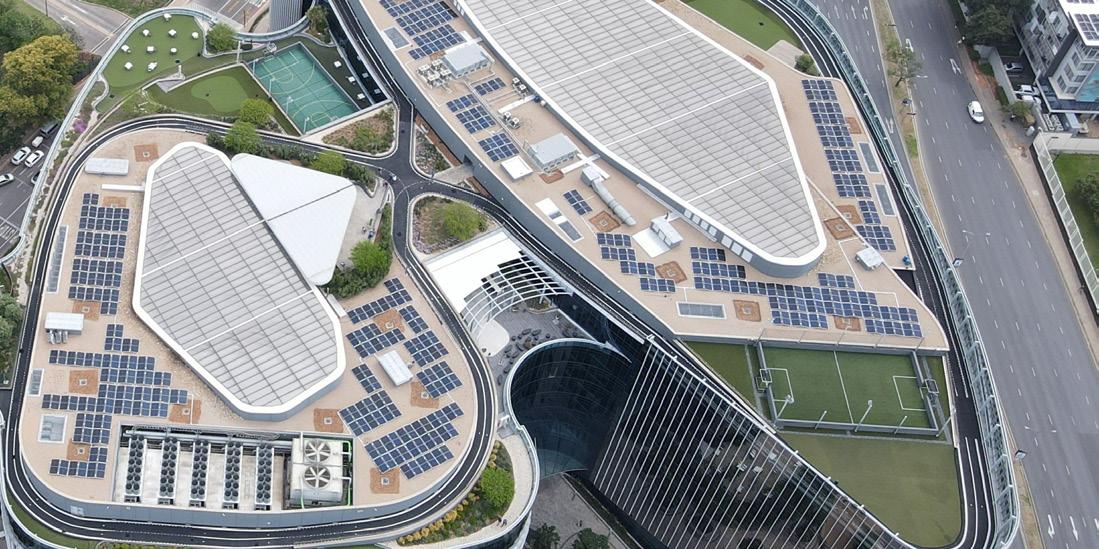
Q: How is compliance with the supplier code of conduct monitored?
Dean: Through the procurement journey and category strategies, we will be guided on selection criteria by recognised standards and certifications, both locally and internationally. We will require suppliers to provide evidence of these at the start of our procurement process and category strategies. If suppliers lack direct influence, where possible we will ask suppliers to trace and disclose their material sources.
Q: What happens if you identify non-compliance?
Dean: Where non-compliance is identified in supplier relationships where our procurement has matured, we will provide guidance to support suppliers in meeting local social development criteria and complying with local standards. In extreme cases, we will remove a supplier until they can prove that they are compliant. This happened recently after we identified that a supplier was using child labour to manufacture its products. We are in the early stages of our sustainable procurement journey, and the removal of that supplier was a big win for our policy and processes.
Q: What are your priorities heading into 2025?
Dean: The top priority for now is to mature our procurement organisation to establish robust category management and sourcing waves. Category management takes a strategic approach to procurement by grouping related products or services into categories and managing each one separately. Sourcing waves address these categories in phases, prioritising areas that create the most value for the company. From a business perspective, both approaches streamline procurement and optimise spending. From an ESG perspective, structured procurement that integrates ESG considerations into every stage of the process can favour suppliers with sustainable and ethical practices. By implementing these approaches in tandem with the sustainable procurement policy, we aim to make sustainability a shared commitment across our supply chain.
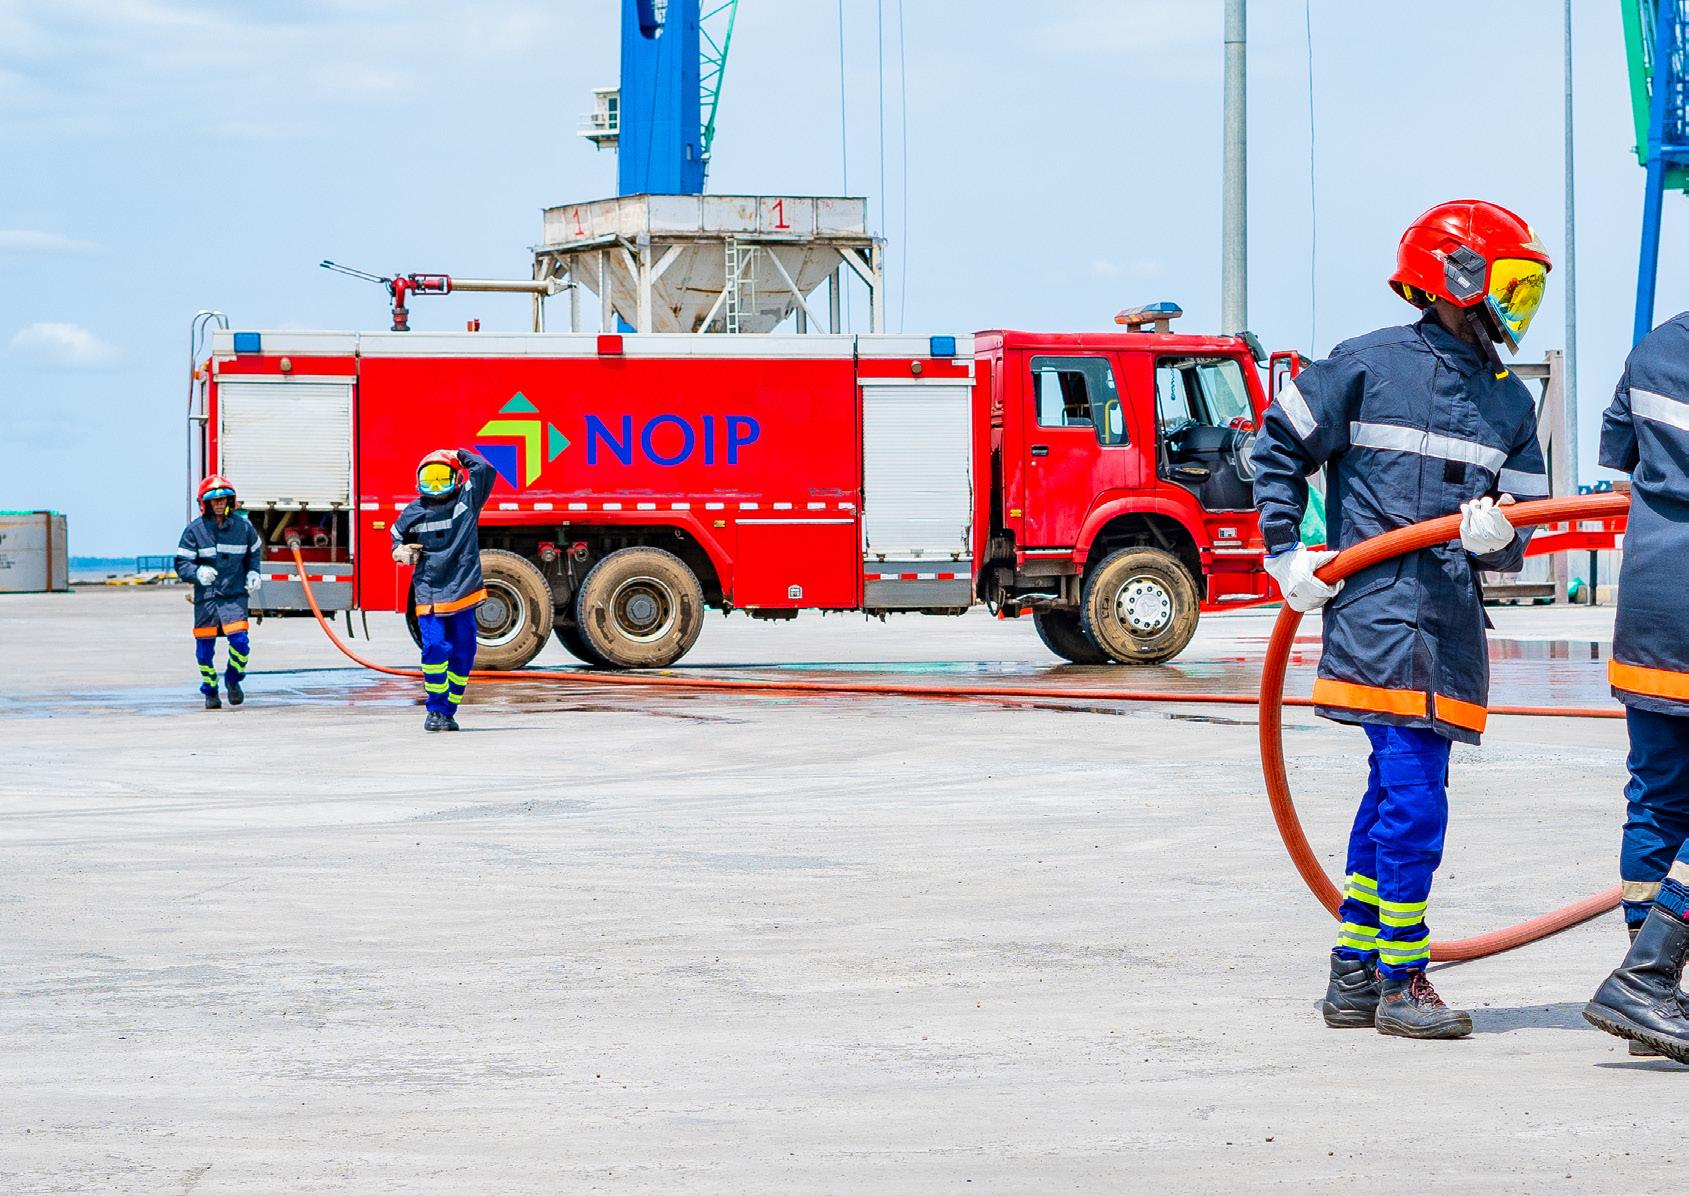
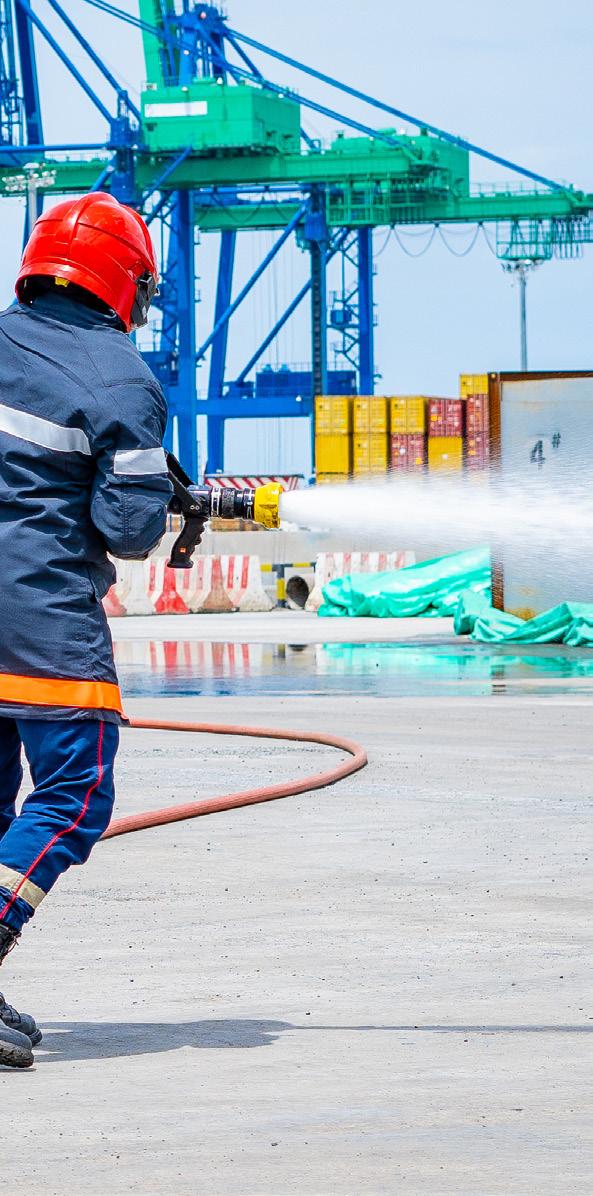
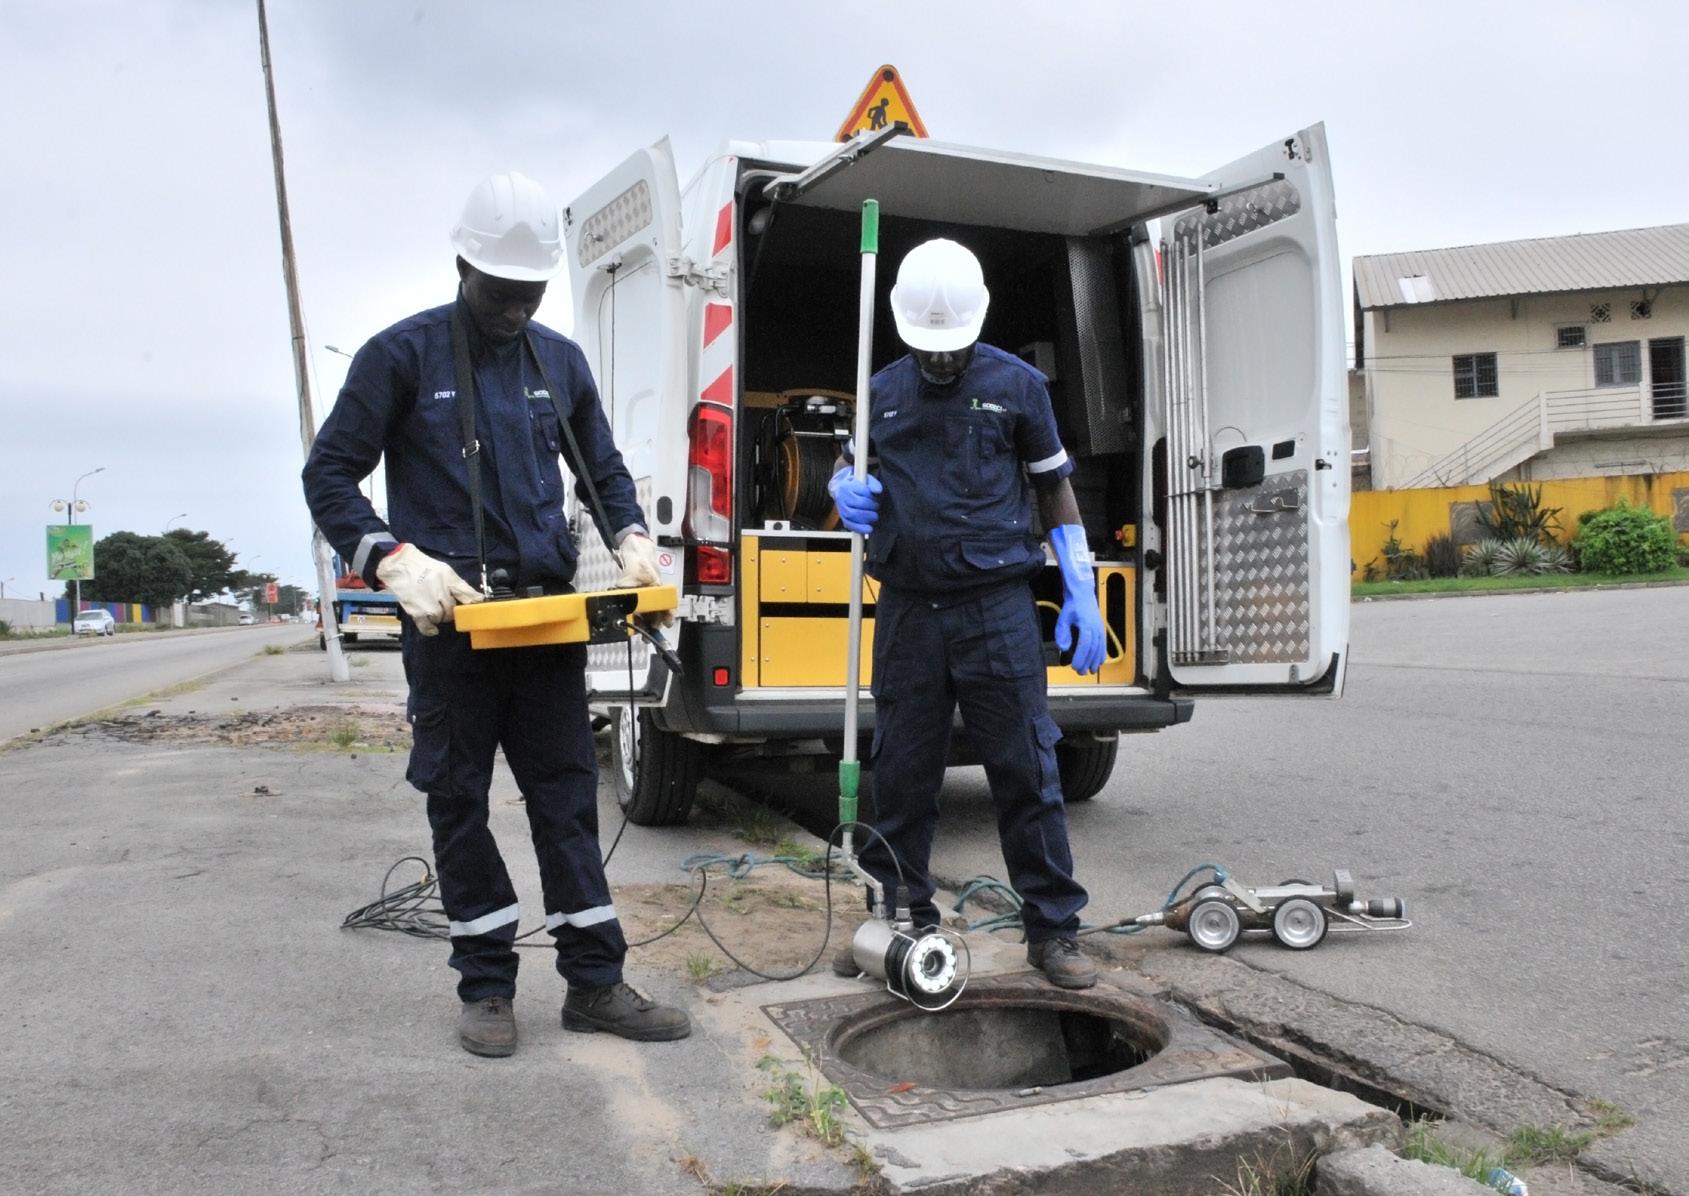
Our Safety Framework
We strive to set the standard for safety excellence in our industry. We continuously strengthen our health and safety practices to make sure these remain adequate and continue to foster a culture of safety that minimises risks for workers.
According to the International Labour Organization, workplace accidents and diseases cause nearly 3 million deaths annually. A large proportion of these deaths are reported in emerging markets, where health and safety standards may be lacking or enforcement mechanisms are limited. Workplace accidents not only result in human tragedy but also impose substantial economic costs. In emerging markets, the social impact of a workplace fatality is especially severe. One worker typically supports four or five dependents, meaning that an accident can have far-reaching consequences for families and communities.
Safety established as a separate focal area
Recognising this, A.P. Moller Capital’s safety initiative aims to integrate strong health and safety practices into all our business operations. The initiative focuses on building capacity, led by senior health and safety staff, refining communication from senior management, creating understanding and ownership of safety at all levels, and improving reporting of incidents and near misses. We have also seen value in sharing lessons learned across portfolio companies. In June 2024, the ESG team finalised A.P. Moller Capital’s revised Safety Framework. While our ultimate objective of achieving zero fatalities remains unchanged, the framework reinforces this goal by establishing safety as a separate focal area with distinct actions and outcomes.
In revising the Safety Framework, the team reviewed existing safety processes and procedures at A.P. Moller Capital, along with the health, safety and environment (HSE) documents of all portfolio companies. This review established a baseline of safety performance and identified opportunities for improvement.
The primary gaps identified relate to oversight of the number of near misses and lost time injuries (LTIs) along with incident response time. LTIs are work-related injuries or illnesses that result in an employee’s prolonged absence from work, usually for a day or more. They are a key metric for measuring occupational health and safety. As such, a comprehensive overview of near misses and LTIs as well as in-depth root cause analyses of fatalities would help companies to implement remedial measures that prevent serious or fatal incidents in the future. Moreover, stronger controls are needed to improve portfolio companies’ monitoring of overall safety performance and effective follow-up on remedial measures. To address these gaps, companies with higher safety risks will receive additional assistance, such as help with safety audits and targeted safety training programmes. The review of our portfolio showed that the areas where most of our portfolio companies experience challenges are electrical safety, road traffic accidents and working at height.
Proactively investing in safety
Over the coming year, the ESG team will continue to work closely with portfolio companies to promote robust safety practices. In addition to regular on-site monitoring visits, the team will review and oversee the implementation of effective safety policies and procedures across all companies. The revised incident reporting procedure, finalised in December 2024, is designed to support continuous safety improvements by providing greater insight into the types of accidents and incidents and identifying where better procedures are needed. Furthermore, safety will now be a standard agenda item at board meetings, facilitating ongoing monitoring of and accountability for safety improvements.
We remain fully committed to enhancing our practices and fostering a safer working environment for all. By proactively investing in safety, we can mitigate risks, protect workers and support long-term success in the dynamic economies where we operate.
Strengthening health and safety in Côte d’Ivoire
In Côte d'Ivoire, A.P. Moller Capital engaged a senior environmental and social advisor to work with Eranove Group to strengthen management of health and safety measures at its subsidiaries. This followed actions taken in 2023 in response to fatalities reported in two of the Group companies, including enhanced Group policies on health and safety and reporting to Eranove’s board.
Tragically, two* fatalities occurred at Eranove’s subsidiaries in 2024, underscoring the need for ongoing efforts to enhance safety performance. Eranove operates multiple subsidiaries with diverse roles in energy and water generation and distribution. Over the past year, the priority has been to better understand the specific health and safety risks across these entities as well as the capacity at Eranove and its subsidiaries to manage the risks, including by undertaking more extensive root cause analyses (RCA). RCA investigates the root cause of an incident so that corrective actions can be taken to prevent an incident from happening again.
Eranove’s appointment of a senior health and safety specialist, who joined the company in April 2024, was an important step in closing the capacity gap. An additional senior health and safety expert will be hired at CIE, one of the subsidiaries with the highest number of incidents. This new position will be supported by Eranove’s specialist, who has developed a work plan for 2025 at A.P. Moller Capital’s request and will report on progress at quarterly board meetings. Also significant was a three-day health and safety workshop that Eranove organised for senior management of key subsidiaries, led by the Group CEO. Evidence from other portfolio companies has shown that placing qualified professionals in key safety roles that are supported from the top can create rapid and positive change.
* The number of fatalities deemed to be the responsibility of the company may change after the completion of outstanding root cause analyses based on pending police reports.
SOCIAL IMPACT
Supporting employment across our portfolio
Informal employment remains widespread in emerging economies, with over 80% of Africa’s workforce engaged in informal jobs.1 These roles often lack job security, social protections and safe working conditions, leaving workers vulnerable to exploitation and financial instability.
Sub-Saharan Africa is projected to account for half of all new global workforce entrants by 2030, meaning an estimated 15 million new jobs per year will be needed to meet labour demand.2 Facilitating the transition from informal to formal employment – while improving job quality – is essential for long-term economic resilience and social equity.
Although this challenge is global, at A.P. Moller Capital we are committed to supporting stable, high-quality employment through our investments. At the end of 2024, our portfolio companies collectively provided 18,195 direct jobs, including 4,395 held by women. In addition, company operations supported 185,841 indirect jobs across supply chains and related industries.
Infrastructure, in particular, plays a key role in enabling employment and economic growth. In 2024, our port investments in Gabon and Côte d’Ivoire facilitated trade flows that supported an estimated 78,631 enabled jobs through cargo volumes handled at these ports.
Contributing to economic growth through our portfolio
Beyond job creation, energy and infrastructure investments are key enablers of economic growth and development in emerging markets. Reliable energy, transport and logistics networks facilitate trade, boost productivity and enhance market connectivity, all of which directly contribute to gross domestic product (GDP).
In 2024, our portfolio companies generated USD 524 million in direct value added, reflecting their contribution to economic activity in key sectors such as transport, logistics and energy. Additionally, our investments enabled an estimated USD 1,387 million in further economic activity through supply chain interactions and consumer spending.
In 2024, our port investments in Gabon and Côte d’Ivoire handled 8,737 kilotonnes of cargo. These port investments together enabled an estimated total of USD 1,557 million added value in economic activity, of which USD 947 million was direct value-added through wages, savings and taxes.
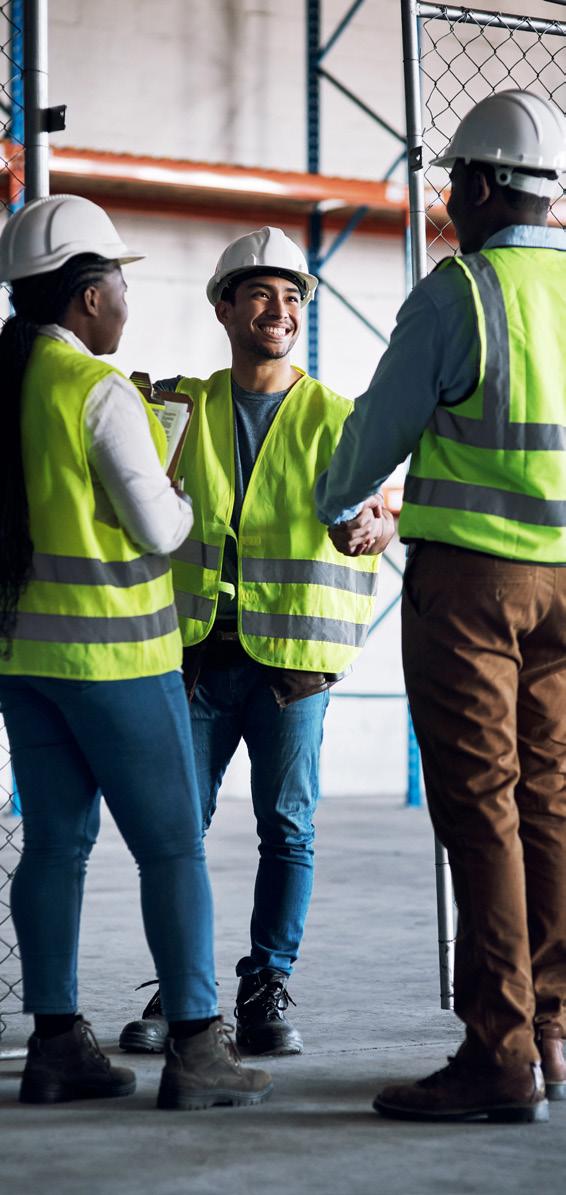
Our impact in numbers*
IN
How we measure and report impact
To assess the economic impact of our investments, we use the Joint Impact Model (JIM), a tool that allows us to estimate the number of direct and indirect jobs supported as well as contributions to GDP by modelling the ripple effects of our activities across supply chains, local economies and consumer spending.3
The JIM defines employment impacts as follows:
• Direct jobs: Employment within portfolio companies directly supported by our investments.
• Supply chain jobs: Jobs created or sustained through the procurement of goods and services by our portfolio companies.
• Induced jobs: Employment generated as wages paid to direct and supply chain workers are spent in the local economy.
• Power enabling jobs: Employment indirectly supported through improved electricity access, where our investments in power infrastructure contribute to broader economic activity.
In addition to employment impact, the JIM estimates value added (contribution to GDP) as the sum of salaries and wages, taxes paid, and operating profits generated by portfolio companies and their supply chains.
3 See jointimpactmodel.org for more information on the methodology.
Case study:
Quantifying social impact beyond our portfolio
Vector Logistics is a leading frozen logistics provider in Southern Africa. Its value chain activities support multiple industries, fostering regional economic growth and development. To quantify this impact, A.P. Moller Capital commissioned a socio-economic study to assess the company’s contributions to employment and GDP through salaries, profits and taxes.
With 22 locations in South Africa and Namibia, Vector Logistics ensures an efficient cold chain for food products across a large area, helping to extend shelf life and minimise food waste. The company employs 5,400 people, as well as supporting over 10,000 jobs in its facilities and supply chain. However, its impact extends beyond employment opportunities. See the next page for details on how this impact is quantified.
Vector Logistics sources goods and services almost exclusively from local suppliers. As a result, most of its economic impact accrues in South Africa and Namibia. In fact, almost 85% of its net revenue ends up as GDP contributions in these countries. For example, when Vector Logistics needs a new truck, it purchases from a local supplier, allowing that supplier to grow, hire more staff and pay taxes. In turn, that supplier sources its own goods and services, supporting yet other businesses.
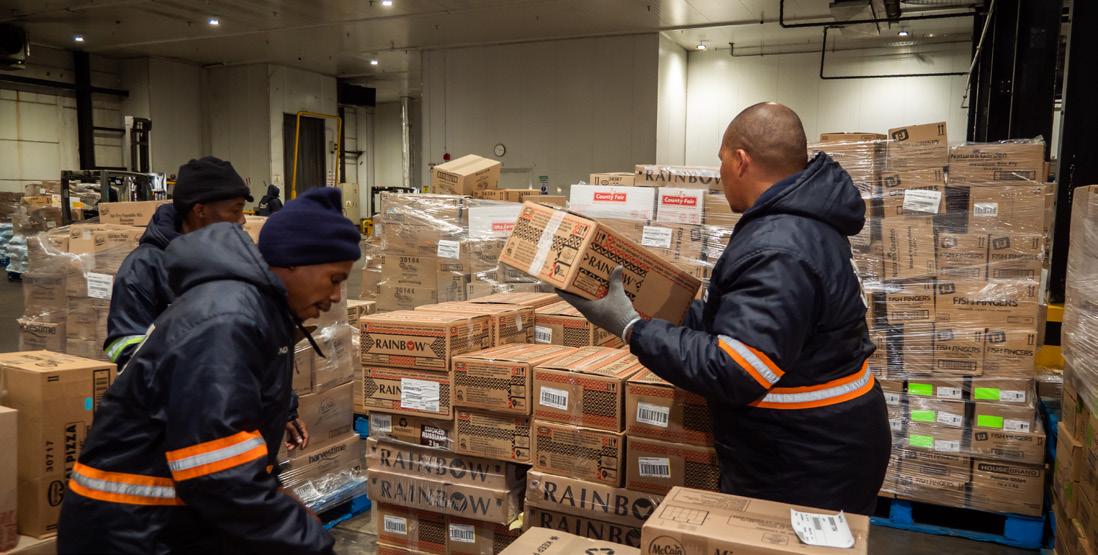
Enabled impacts of Vector Logistics’ operations
Even more significant are the so-called enabled impacts of Vector Logistics’ operations. Clients rely on the company’s services to run and grow their businesses. For instance, when Vector Logistics delivers a shipment of frozen pizzas, the pizza manufacturer benefits from reliable logistics, allowing it to maintain operations, retain employees and sustain its supply chain relationships.
This cycle creates enabled impacts that far exceed supply chain impacts. By transporting around USD 1.8 billion in goods for its principals, 4 Vector Logistics enables almost 80,000 jobs and more than USD 1.5 billion in GDP contributions in South Africa and Namibia 5 This is equivalent to about 0.4% of the countries’ combined GDP and 0.5% of all formal employment.
Vector Logistics’ impact is especially significant in the agricultural sector, where it indirectly enables over 23,000 jobs through ingredients sourced by its principals from local farmers and agri-businesses. This number represents more than 2% of all agricultural employment in South Africa and Namibia. By prioritising local sourcing, Vector Logistics strengthens local economies and supports meaningful employment, demonstrating how efficient supply chains and intelligent supply chain management can drive lasting socio-economic benefits.
4 Principals are clients for whom Vector Logistics provides a full distribution service including transport, storage and invoicing.
5 This figure reflects the impact of all goods transported by Vector Logistics. It differs from the enabled impacts reported for ports, which cover only the goods that could not have been imported or exported without that port.
Vector Logistics
How impact is quantified
The impact study quantifies Vector Logistics’ contribution to the South African and Namibian economies by measuring value added (the sum of salaries, profits and taxes) and employment generation across the value chain. Using an input-output (IO) modelling methodology based on the social accounting matrix, the study tracks how Vector Logistics’ earnings and expenditures flow through these economies. It assesses direct impacts (salaries, profits, taxes paid and jobs created at Vector Logistics), supply chain impacts (driven by local procurement) and enabled impacts (resulting from the transport of goods). The analysis integrates Vector Logistics’ operational and financial data, combined with macroeconomic statistics.
REVENUES FOR VECTOR LOGISTICS
Data from Vector Logistics
GOODS TRANSPORTED BY VECTOR LOGISTICS
Data from Vector Logistics
Vector Logistics reported data
Vector Logistics reported data
REVENUES FOR SUPPLIERS
REVENUES FOR SUPPLIERS’ SUPPLIERS
REVENUES FOR PRINCIPALS
REVENUES FOR PRINCIPALS’ SUPPLIERS
Refers to data which is reported by Vector Logistics Symbolise a combination of Vector Logistics data and input-output modelling
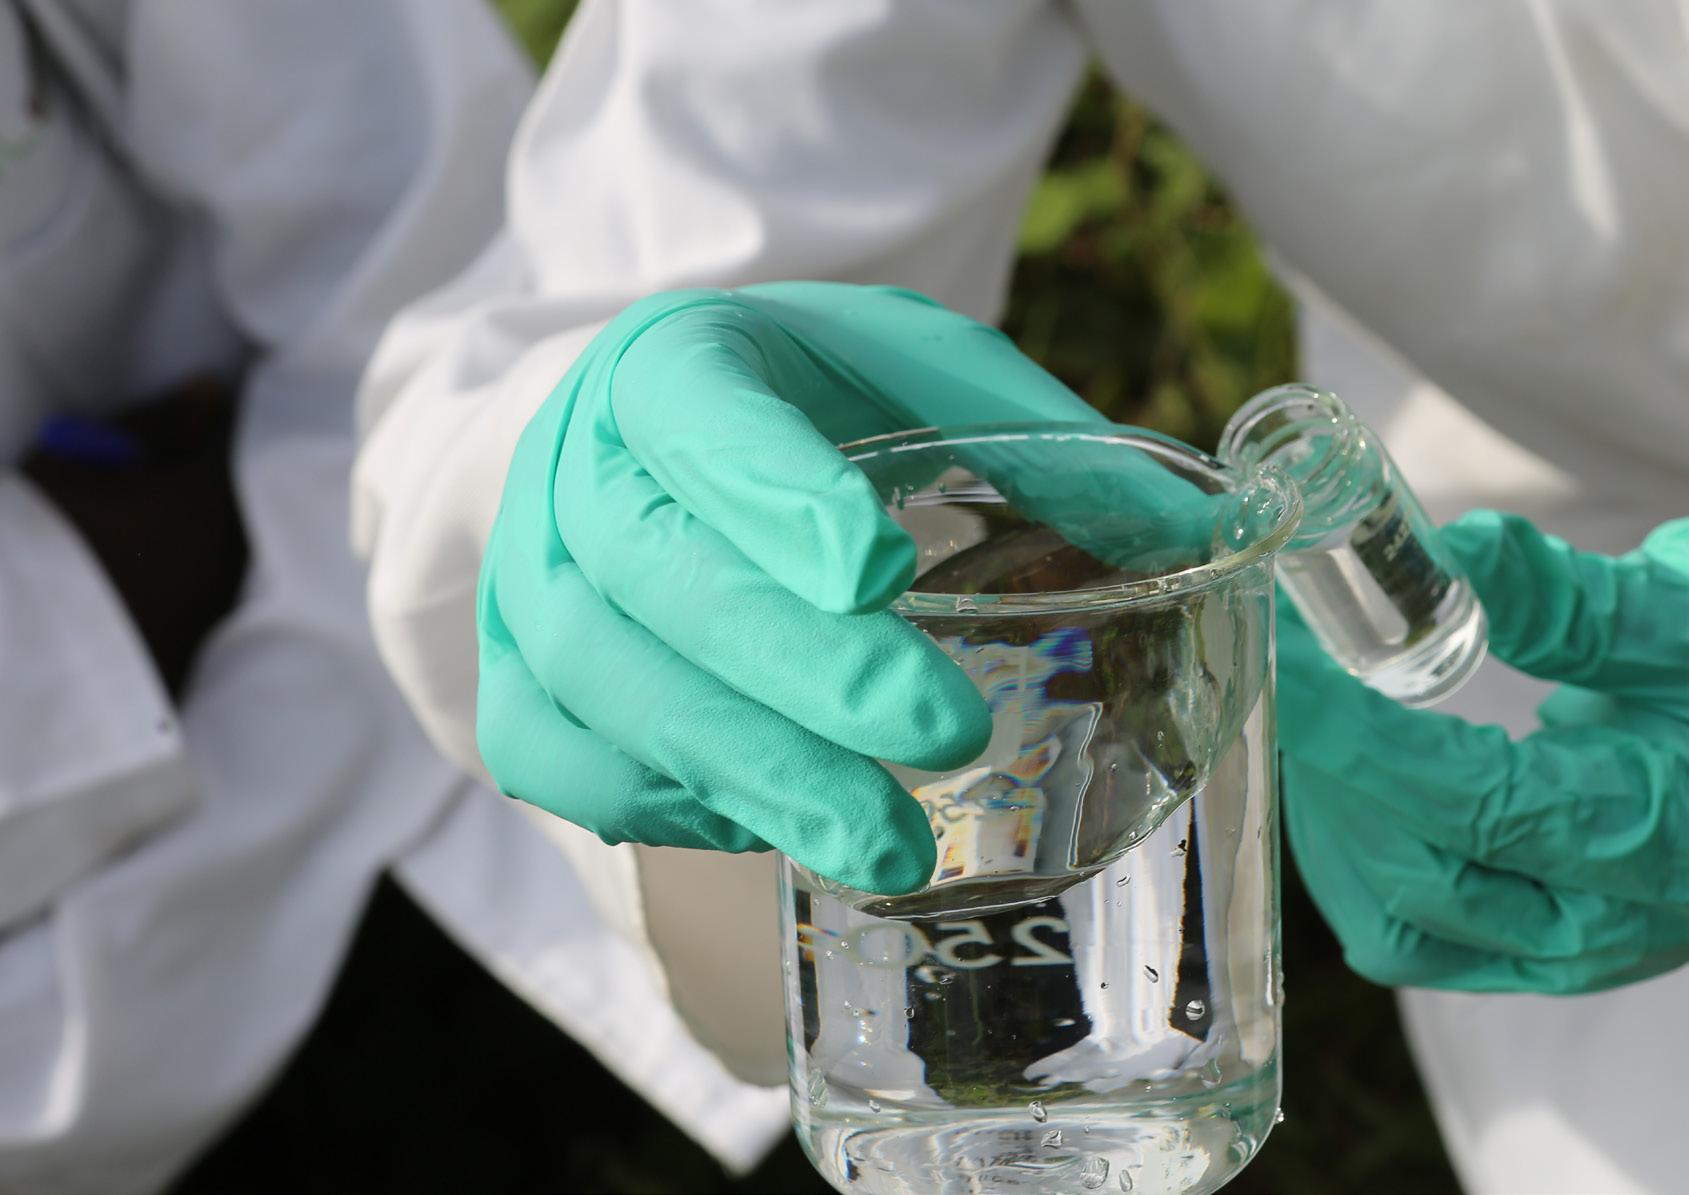

Portfolio companies’ GHG emissions in 2024
In 2024, both funds recorded an increase in scope 1 and 2 greenhouse gas (GHG) emissions, primarily driven by increased activity at our power-producing assets To meet growing energy demand, particularly in Côte d'Ivoire, these assets significantly increased power production. While this led to higher emissions, the assets play a vital role in enhancing energy security, reducing reliance on energy imports and supporting economic development.
Simultaneously, we continued to expand our portfolio into renewable energy. Through our second fund, EMIF II, we established Verdant Energy, a dedicated renewable energy platform in Southeast Asia (page 31). Meanwhile, in Morocco, the Chbika project (referred to as Sand Cat in A.P. Moller Capital’s 2023 ESG Report) is set to become a major green ammonia production hub (page 34).
We recognise the importance of decarbonisation in hard-to-abate sectors and have continued to implement strong decarbonisation strategies aligned with the latest climate science. In 2024, we supported two portfolio companies on their journey to net zero, both of which have now set science-based net-zero targets. The following pages provide further details on their decarbonisation road maps and the steps they are taking to achieve their commitments.
Our methodology
Consistent with last year’s reporting, we continue to follow the guidelines of the GHG Protocol for reporting scope 1 and 2 emissions. Scope 1 emissions are direct emissions from sources owned or controlled by a company. Scope 2 emissions are indirect emissions from the generation of purchased energy. Emissions are calculated using a third-party carbon accounting software, which applies globally recognised emission factors. Scope 3 emissions, which represent all other indirect emissions in a company’s value chain, are estimated using the JIM. Further details on the methodology can be found on page 25 of this report.
The table below provides an overview of absolute emissions and financed emissions, offering a comprehensive view of our climate impact. Absolute emissions represent the total GHG emissions generated by our portfolio companies, while financed emissions reflect the portion of those emissions allocated to A.P. Moller Capital based on our investment share in each company.
Unlocking Southeast Asia’s renewable energy potential
As the global push for net-zero carbon emissions gains momentum, Southeast Asia is emerging as a pivotal player in the fight against climate change. Verdant Energy, a Singapore-based renewable energy platform, was established to help bridge the gap between ambition and action in the region’s renewable energy landscape.
With rapidly growing economies and a heavy reliance on fossil fuels, Southeast Asia represents both a challenge and an opportunity in the transition to clean energy. Although regional energy demand is projected to double by 2040,6 outdated grid infrastructure, regulatory hurdles and financial constraints continue to hinder progress.
This is particularly relevant in Vietnam. With power consumption expected to grow by 10-12% annually until 2030, energy demand is already outstripping supply in some areas.7 This, coupled with a planned reduction in coal-fired power, leaves the country vulnerable to energy shortfalls and the economic and social consequences this entails. In response, the Government of Vietnam laid out renewable energy goals in its National Energy Master Plan. The plan targets 15-20% renewable energy in the total primary energy supply by 2030 and 80-85% by 2050.8
Supporting the energy transition
Verdant Energy, which became part of A.P. Moller Capital’s portfolio in 2024 under EMIF II, is positioning itself as a key contributor to these renewable energy goals. The company is building a portfolio of rooftop and utility-scale solar, wind and hybrid projects in Vietnam and the Philippines, its initial focal markets. By addressing gaps in grid infrastructure and expanding access to reliable and affordable clean energy, Verdant Energy not only supports national sustainability targets but also helps to mitigate risks related to energy shortages and climate-related disruptions.
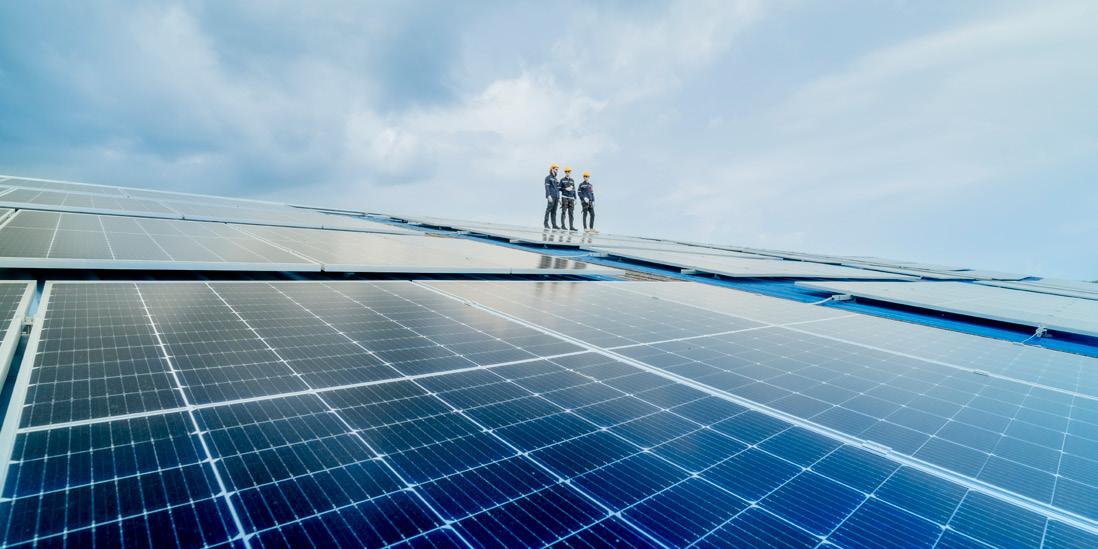
In Vietnam, the company has 25 megawatts (MW) of rooftop solar currently under construction and a strong pipeline of ongoing and exclusive projects which the team will develop from scratch. Verdant Energy is also in the final stages of securing exclusivity on two utility-scale projects in the country.
Meanwhile, in the Philippines, Verdant Energy is expanding its portfolio with additional solar and wind projects in various stages of development or acquisition. A notable example is an existing hybrid wind and battery project. Its acquisition could help pave the way for future hybrid developments that provide cleaner energy alternatives for off-grid communities currently reliant on diesel generators.
Scaling in new markets
Verdant Energy plans to expand into at least two new markets in the next year, focusing on infrastructure that supports long-term national and community benefits. This approach helps strengthen project viability, de-risk investments and ensure alignment with government climate agendas and grassroots needs as the company’s pipeline matures.
“Our projects are designed to endure for decades, so securing a social license to operate is non-negotiable. We work closely with governments and local stakeholders to ensure
our initiatives create shared value – generating jobs, improving infrastructure and supporting sustainable
growth.”
Alan Yau, CEO of Verdant Energy.
6 IEA (2019). Southeast Asia Energy Outlook.
7 International Trade Administration (2024). Vietnam - Country Commercial Guide.
8 Vietnamese Ministry of Construction (2023). National energy master plan for 2021-2030 approved.
Case study:
Portfolio companies on the road to net zero
A.P. Moller Capital’s commitment to climate change mitigation took an important step forward in 2024 when two portfolio companies, Vector Logistics and CACC Cargolinx, finalised their decarbonisation road maps and began addressing priority areas.
Tackling climate change requires urgent and systemic action across all sectors, including transport and logistics, which accounts for approximately 7% of global emissions.9 Despite the sector’s potential to contribute to emissions reductions, decarbonisation has been slow. This is especially apparent in emerging markets, where limited regulatory and financial incentives, slower renewable energy adoption and infrastructure gaps add to the complexity of reducing emissions.
To address some of these challenges, A.P. Moller Capital integrates decarbonisation into its transport and logistics investments through EMIF II. We work with portfolio companies to ensure they undertake several actions that support decarbonisation. These include creating a verified GHG inventory covering scope 1, 2 and 3 emissions, setting science-based emissions reduction targets and developing a decarbonisation road map aligned with global climate goals. With support from qualified third parties, Vector Logistics and CACC Cargolinx completed these actions in 2024.
CACC Cargolinx
Based in Egypt, CACC Cargolinx is part of HAU Logistics, a joint venture between A.P. Moller Capital and Hassan Allam Utilities. It is the leading independent air cargo handling facility at Cairo International Airport. The company’s GHG inventory assessment identified refrigerants and purchased electricity as the primary sources of GHG emissions, accounting for 93.57% of scope 1 and 2 emissions. The largest contributors to scope 3 emissions are fuel- and energy-related activities (38.43%), followed by downstream leased assets (22.64%).
The subsequent decarbonisation road map that was developed includes near-term and long-term reduction targets, with a specific focus on addressing emissions hotspots. A key priority is reducing refrigerant emissions by investing in energy-efficient cool dollies with significantly lower leakage rates. In 2024, eight older units were decommissioned and replaced with four new ones. This change alone cut related scope 1 emissions by 52% compared to 2023. A further four cool dollies will be delivered in early 2025. In the longer term, the company plans to install solar PV panels to reduce reliance on the grid and complement the decarbonisation of other emissions hotspots. These include fuel- and energy-related activities and downstream leased assets.
“Implementing a decarbonisation road map in a market like Egypt, where science-based targets are not yet widespread, requires dedication. At the same time, we anticipate that the learnings and optimisation scenarios resulting from the road map development process will give us a competitive advantage, which we aim to promote locally and internationally.”
Hatem Sherif, CACC Cargolinx’s Health, Safety and Environment Manager.
Vector Logistics
In South Africa, Vector Logistics, one of the largest frozen logistics providers, has prioritised both direct and indirect emissions in its decarbonisation strategy. A key initiative has been expanding solar PV systems at its warehouses, which are expected to supply 1530% of the facilities' energy needs. Scaling these projects to other facilities, especially in regions with high grid emissions, is a crucial step in achieving the company’s science-based targets. As mobile fuel accounts for approximately 60% of Vector Logistics’ scope 1 emissions, the company is also pursuing a dual strategy for fleet decarbonisation. This combines optimising route planning and transitioning to low-carbon and zero-emission vehicles.
Beyond its direct operations, Vector Logistics has been engaging with its primary suppliers to encourage sustainable procurement practices. These focus on emissions-intensive purchased goods and services, which make up 42% of Vector Logistics’ scope 3 emissions. It is also collaborating with transportation partners to optimise routes, integrate alternative fuels and implement co-loading and route consolidation strategies to reduce the 9% of scope 3 emissions linked to upstream transportation and distribution.
“The potential impact of these engagements extends far beyond our own operations. By influencing suppliers, transportation providers and employees, we create a multiplier effect – driving innovation, setting new industry benchmarks and encouraging sustainable practices across Southern Africa’s logistics sector. These efforts not only accelerate decarbonisation in our own value chain but also contribute to the broader transition to a low-carbon economy.”
Annelie Govender, Vector Logistics’ ESG Lead.
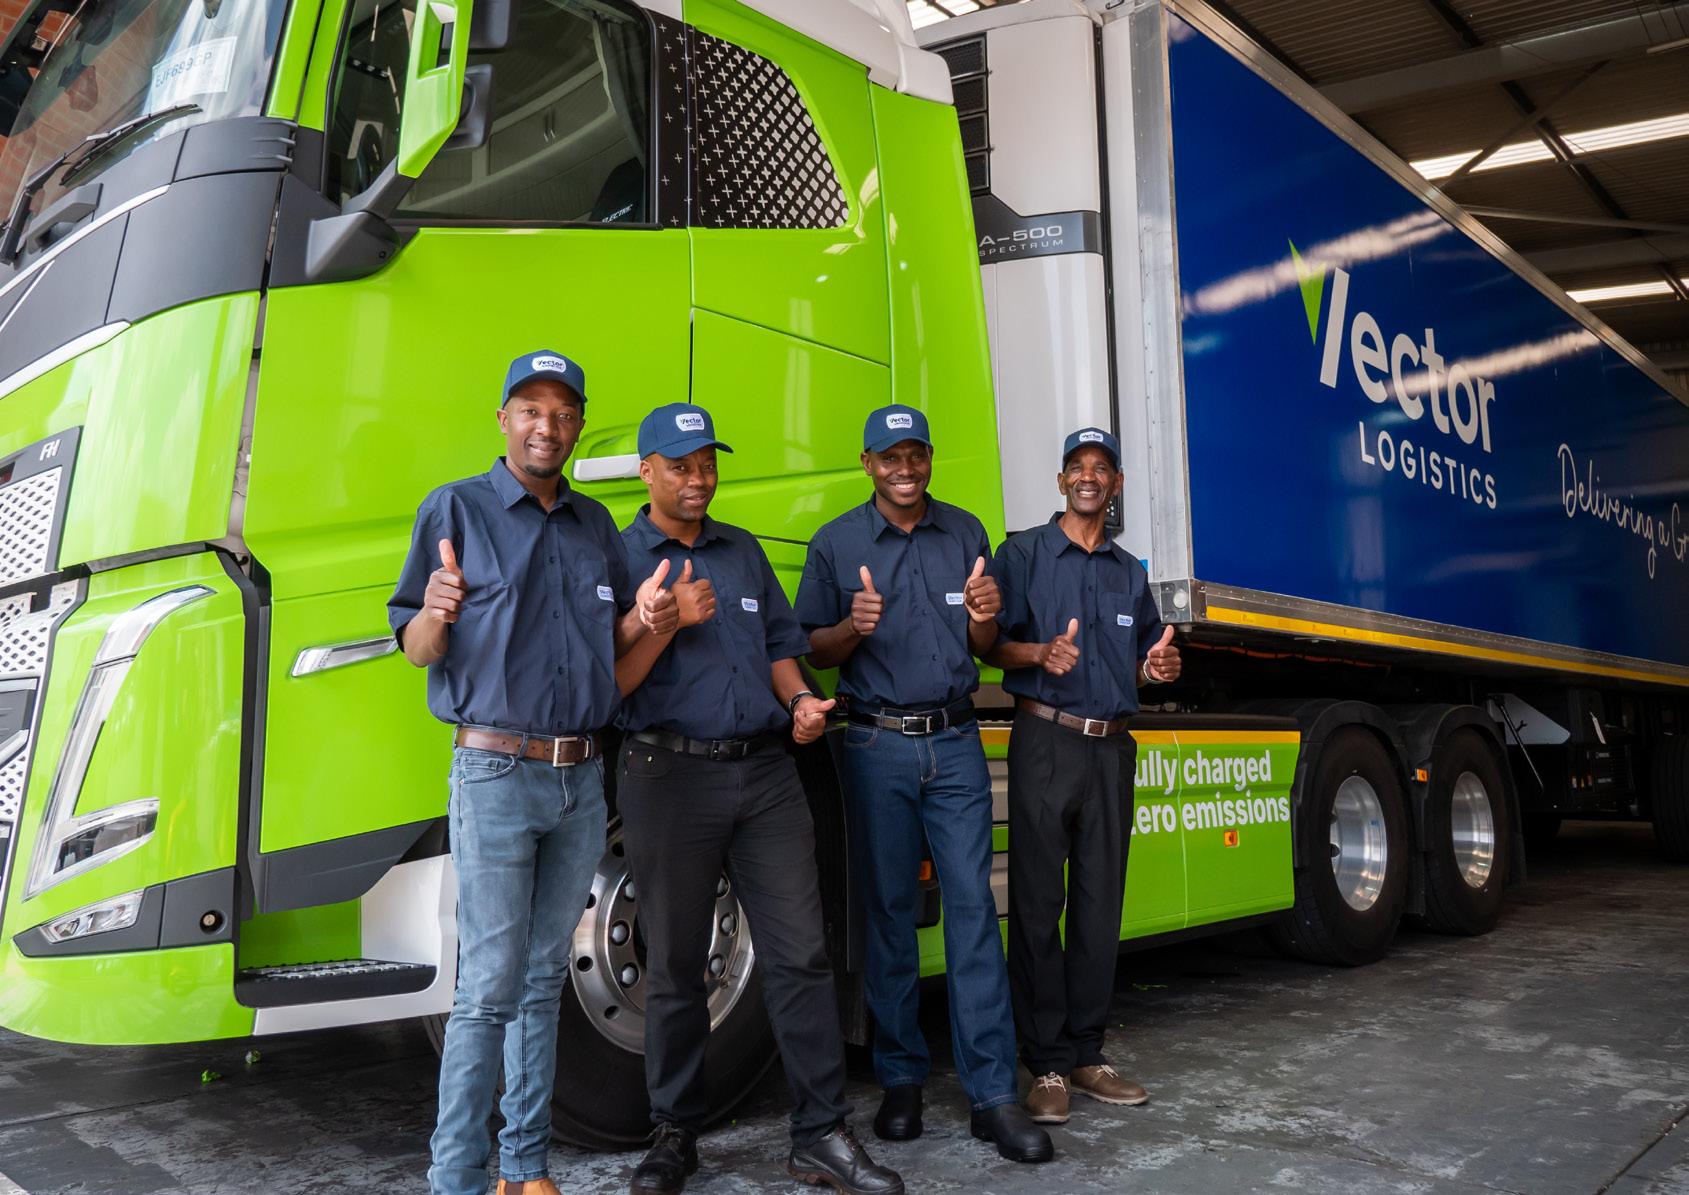
Case study: Advancing Morocco’s green hydrogen economy
A.P. Moller Capital is part of a consortium developing a major green ammonia project in Morocco. The Chbika project (previously referred to as Sand Cat) marks the first phase of a broader strategy to establish a green hydrogen hub, leveraging Morocco’s abundant renewable resources and strategic location to support the energy transition.
The global green hydrogen market is expected to grow steadily until 2030, then expand rapidly as planned and under-construction infrastructure comes online.10 This growth is primarily driven by increasing demand for clean energy and more stringent emissions regulations. In Europe, for example, green hydrogen is a core component of the European Green Deal, which aims to shift energy consumption away from fossil fuels towards renewable gases, including hydrogen. Specifically, renewable hydrogen is to cover around 10% of the European Union’s energy needs by 2050, significantly decarbonising hard-to-abate sectors such as concrete, steel and shipping.11
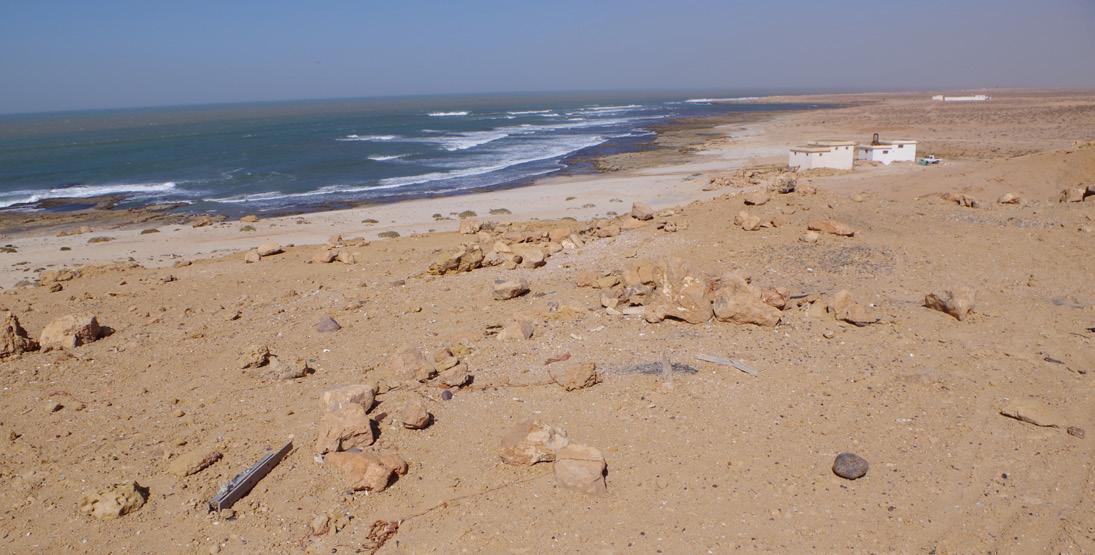
Economic and environmental benefits
The Chbika project is a collaboration with TotalEnergies H2 (TE H2) and Copenhagen Infrastructure Partners (CIP). It will be located near the Atlantic coast in Morocco’s Guelmim Oued-Noun region. TE H2 and CIP will focus on building 1 gigawatt (GW) of solar PV and wind capacity to power the production of green hydrogen and its conversion into 200,000 tons of green ammonia for the European market.
A.P. Moller Capital is leading the development of the port and associated infrastructure. The investment underscores our portfolio strategy, through EMIF II, of targeting middle-income, high-growth countries where infrastructure can play a transformative role in unlocking economic and environmental benefits. Morocco, with its vast renewable resources and proximity to Europe, is poised to become a key contributor to international net-zero targets through the supply of green hydrogen and its derivatives. At the same time, we expect the Chbika project to support Morocco’s own goals of decarbonised development through significant foreign direct investment and job creation in a new, sustainable industry.
Stakeholder engagement
In October 2024, the Moroccan government awarded the consortium a preliminary contract for land reservation, allocating an initial area of 11,500 hectares for construction of the solar and wind facilities. The contract also allows for the start of pre-FEED (frontend engineering design) studies. These will evaluate the project’s technical and economic feasibility, identify potential risks and define the overall timeline and costs. In December, the consortium secured land access approval from the Wali (regional governor) and Ministry of Interior. Both these milestones pave the way for stakeholder engagement, which started in early 2025.
In this process, the consortium will adhere to national requirements and the IFC Performance Standards, including adequate engagement of all stakeholders. The first site visit by the environmental and social consultant, ERM, took place in January 2025. During this visit, ERM gathered data on local environmental and socio-economic conditions, identified the different stakeholders and shared details of the proposed project with local communities. These details included an overview of the projected environmental and social impacts, for which further data collection is planned.
By engaging communities early and consistently, and aligning with the IFC Performance Standards, the consortium aims to understand community concerns and needs in a way that proactively addresses the project’s risks and enhances its positive outcomes for all involved.
Chbika project
Managing climate risk for long-term resilience
At A.P. Moller Capital, we acknowledge that climate change poses potential financial risks to our investments, both now and in the future. To identify, assess and price these climate-related risks effectively, we evaluate our portfolio companies for exposure to physical risks stemming from increasing average temperatures, as well as transition risks resulting from shifts in technology, markets, policy, regulation and consumer sentiment. Our approach aligns with the recommendations set forth by the Task Force on Climate-Related Financial Disclosures (see side bar).
To monitor climate risks, we use an external climate risk provider that models estimated financial losses from both transition and physical risks. Our assessments consider appropriate timeframes and evaluate climate change risks for two decadal periods, including 2020 and 2030, using various climate change scenarios. Throughout 2024, climate-related risks were monitored using Representative Concentration Pathways (RCPs), ranging from high climate change scenarios, such as RCP 8.5 (3.3–5.7°C), to more moderate scenarios like RCP 4.5 (2.1–3.5°C).
Across both the 2020 and 2030 decadal periods, under RCP 4.5 and RCP 8.5 climate change scenarios, the physical risks to our portfolio – including pluvial flooding, temperature extremes, water stress and landslides – remain consistently low. While minor variations in risk levels exist between the two periods and scenarios, these differences do not materially affect the portfolio’s overall risk profile. This stability is attributed to the projected physical hazards at asset locations and the inherent resilience of the asset types to these risks.
For the periods assessed, transition risks12 appear minimal. For example, the policy scenarios used in the analysis do not assume carbon pricing during these timeframes that would materially impact our portfolio. However, as climate policies evolve and market-driven pressures for lower emissions grow, we will, as with physical risks, continue to monitor our portfolio to ensure resilience against emerging transition risks.
Integrating climate risk into risk management
A.P. Moller Capital incorporates climate-related risk into its broader risk governance structure. Climate-related risks are assessed prior to investment decisions and throughout an asset’s life cycle, alongside other areas of risk. Material risks undergo in-depth analysis with support from external experts where needed. The Risk Management team reviews these assessments to ensure a clear understanding of potential exposures. Where needed, mitigation measures are incorporated into legal agreements as part of the ESAP.
To ensure ongoing oversight, portfolio companies are reviewed quarterly, with risk updates discussed among the Investment team, ESG function and Risk Management. Additionally, annual board reviews help maintain continuous risk oversight. In this way, we actively engage with portfolio companies to support their climate strategies and carbon-reduction efforts. By maintaining a proactive approach, we ensure long-term resilience and sustainability across our investments.
Aligning our disclosures with global sustainability standards
The Task Force on Climate-Related Financial Disclosures (TCFD) was established by the Financial Stability Board (FSB) in December 2015 to develop consistent, comparable and decision-useful climate-related disclosures for stakeholders, including investors and lenders. Its recommendations, published in 2017, provide a framework for organisations to disclose the financial impacts of climate-related risks and opportunities.
In 2023, the TCFD fulfilled its mandate and was officially disbanded, with responsibility for monitoring climate-related disclosures transferred to the International Sustainability Standards Board (ISSB) under the IFRS Foundation. The ISSB has since incorporated the TCFD framework into its global sustainability disclosure standards, ensuring continuity and alignment.
Source: Recommendations of the Task Force on Climate-Related
Portfolio KPIs
DISCLAIMER
A.P. Møller Capital P/S (“A.P. Moller Capital”) is a limited liability partnership with registered office at Tuborg Havnevej 15, 2900 Hellerup, Denmark. A.P. Moller Capital is authorised by the Danish Financial Supervisory Authority as a manager of alternative investment funds. Its branch office, A.P. Møller Capital P/S (DIFC Branch), is regulated by the Dubai Financial Services Authority to provide advice on and arrange deals in investments and credit, with registered office at Al Fattan Currency House Tower 2, 15th Floor, Units 1502-1503, P.O. Box 507271, Dubai International Financial Centre, Dubai, United Arab Emirates. Its subsidiary in the Abu Dhabi Global Market ("ADGM"), A.P. Møller Capital (ME) Ltd, is regulated by the ADGM Financial Services Regulatory Authority to provide advice on and arrange deals in investments and credit, with registered office address at Al Maryah Tower, 7th Floor, Unit 03, ADGM Square, ADGM, Abu Dhabi, United Arab Emirates. Its subsidiary in Singapore, A.P. Moller Capital (Singapore) Pte. Ltd., is exempt from licensing to provide advice on investments to its shareholder, with registered office at #14-04 Marina Bay Financial Centre, Singapore 018981, Singapore.
A.P. Moller Capital, its branch, subsidiaries, affiliates, and related entities, their respective members, directors, officers and employees (hereafter “A.P. Moller Capital Group”) accept no responsibility, obligation or duty of care for any loss or damage whether direct or indirect and however caused, that you may suffer or incur in connection with or as a result of your use of, or reliance on, any information contained or referred to in this report. The information contained or referred to within this report is provided on the basis and subject to the explanations, qualifications, assumptions and warnings set out in this disclaimer.
The information contained or referred to in this report has not been verified by the A.P. Moller Capital Group and may be incomplete or condensed. No member of the A.P. Moller Group:
(i) makes any representation, warranty, undertaking or other assurance, expressed or implied, as to the fairness, adequacy, accuracy, completeness or correctness of any information or referred to or contained in (or omitted from) this report, or the reasonableness of any assumptions used or the validity of any such information; or (ii) assumes any obligation, responsibility, liability or duty of care for the fairness, adequacy, accuracy, completeness or correctness of any information obtained from (or not provided by) any third party. In particular, no representation or warranty is made that any projection, forecast, calculation, forward-looking statement, assumption or estimate contained in this report should or will be achieved or materialise. There is a substantial likelihood that at least some, if
not all, of the forward-looking statements included in this report will prove to be inaccurate, possibly to a significant degree. In considering any performance data contained herein, each recipient of this report should bear in mind that past performance is not indicative of future results, and there can be no assurance that any future fund managed or sponsored by A.P. Moller Capital will achieve comparable results. Nothing contained herein should be deemed to be a prediction or projection of future performance of any alternative investment fund managed by A.P. Moller Capital (“Fund”).
Certain information contained in this report is based on or derived from information provided by independent third-party sources considered by A.P. Moller Capital Group to be reliable. They do not necessarily reflect the opinions of A.P. Moller Capital Group. A.P. Moller Capital Group cannot guarantee the accuracy of such information and has not independently verified the assumptions on which such information is based. A.P. Moller Capital Group has no obligation to update, modify or amend this report or other media, or to otherwise notify a recipient thereof, in the event that any matter stated herein, or any opinion, projection, forecast or estimate set forth herein, changes or subsequently becomes inaccurate. A.P. Moller Capital Group disclaims any responsibility for any errors or omissions in such information, including the financial calculations, projections, and forecasts in this report. Recipients acknowledge that circumstances may change and the contents of this report may become outdated as a result.
This report contains proprietary and confidential information about A.P. Moller Capital Group, the Funds, and their respective affiliates and/or portfolio investments and is furnished in confidence solely to the Limited Partners of the Funds for the specific purpose of reporting on ESG matters. Any reproduction, distribution or disclosure of any information contained or referred to in this report, without the prior written consent of A.P. Moller Capital, is strictly prohibited.
By attending any delivery of this report or by accepting a copy of this report, you will be deemed to have represented, warranted and undertaken that: (i) you have read and agreed to comply with and be legally bound by the contents of this disclaimer; (ii) you will treat and safeguard as strictly private and confidential all information contained or referred to in this report and will preserve its confidentiality; and (iii) without the prior written consent of A.P. Moller Capital, you shall not copy, distribute, make available or otherwise disclose any information in this report to any other party.