1 minute read
2.2 Project analysis according to Cuenca’s Planning Regulations
Figure 2.3a
Figure 2.3b
Advertisement
Figure 2.3c
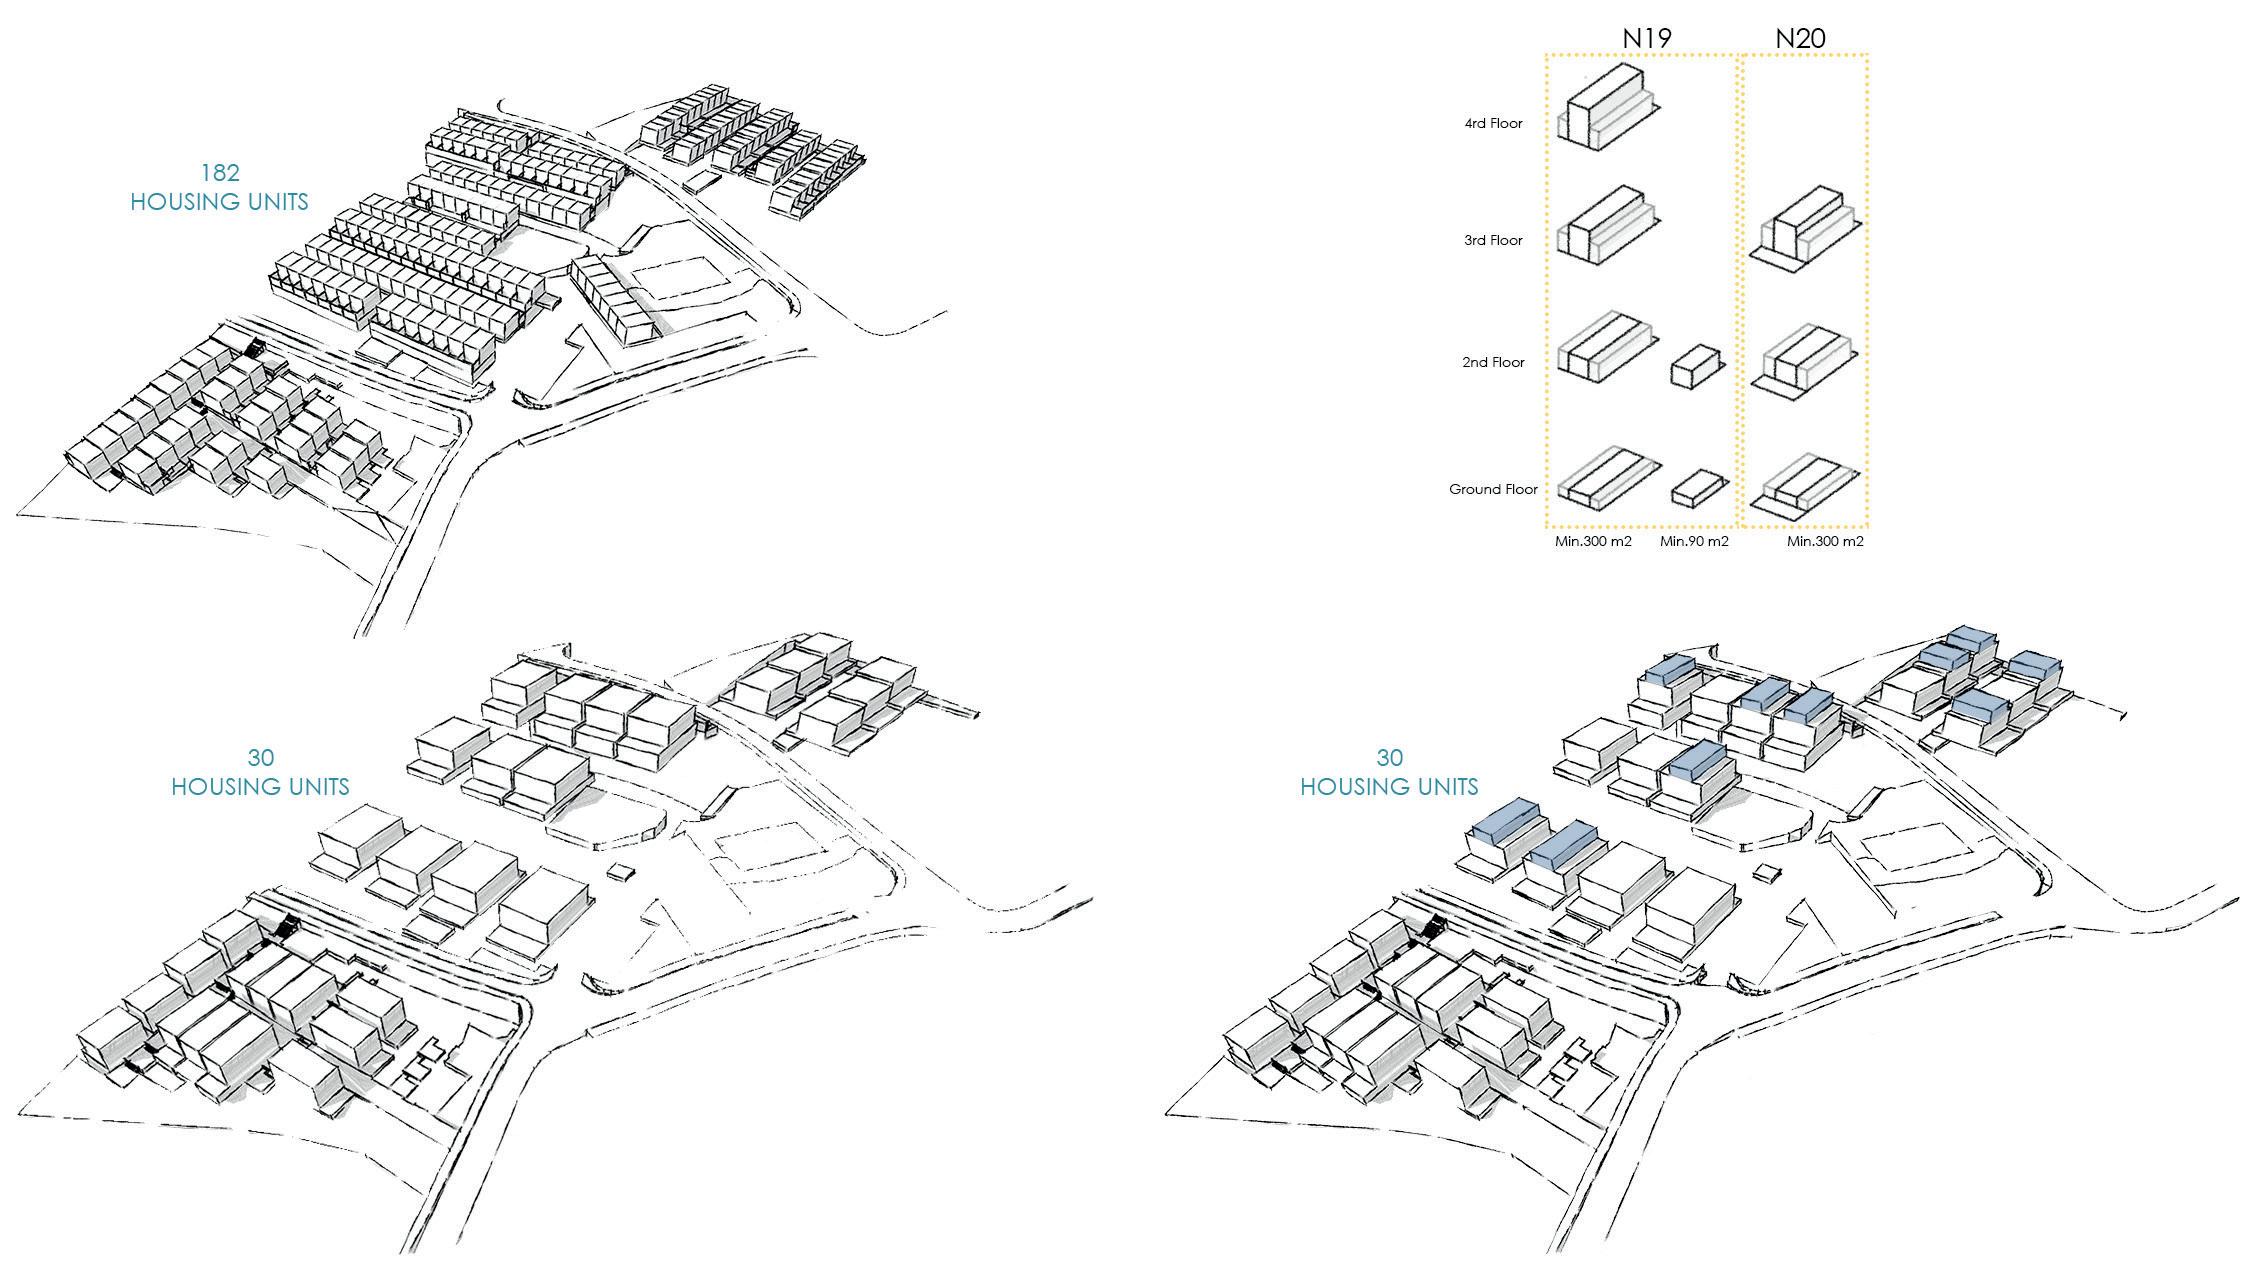
Figure 2.3. Miraflores current condition and the ways it should have been if it followed regulations. By Author
Figure 2.4. Exercise showing the areas that could be generated. By Author

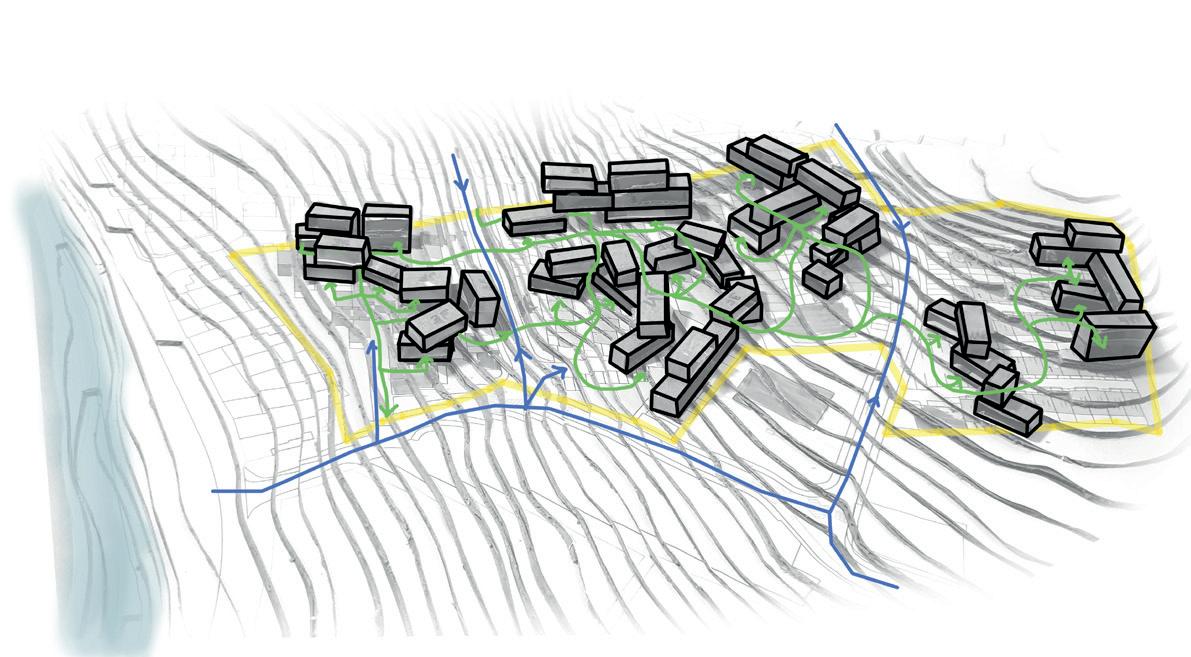
As mentioned before, Miraflores is placed in 2 regulations zones, N19 and N20. And as an exercise, a comparison was made between Miraflores’ current condition (Figure 2.3a) and the different regulations zones (Figures 2.3b and 2.3c), to understand the residential density that Miraflores has; and as the figures show, in a plot of land where 30 houses should have been placed, 182 were built. The difference between 2.3b and 2.3c, is the height of the buildings, in one zone there are different regulations depending the size of the plot and the mandatory distance of the built facade and the plot frontal limit. Another exercise was to, in a physical model (Figures 2.4, 2.5 and 2.6), experiment the different ways Miraflores could have been placed, meeting the regulations and changing the type of building that could hold the same amount of housing units. Creating leisure (orange) and community areas (purple) as seen in Figure 2.4, was evident that more green area could be generated, increasing the quality of life for a social housing project. Meaning that Miraflores is a development with overutilization of the soil and enhancing the overpopulation by building houses that need future expansions because they do not give enough living space. Manchester School of Architecture | Andrea Estefanía Calle Bustamante Figure 2.5. Circulation possibilities, unifying different parts of the project. By Author

Figure 2.6. High rise buildings as a social housing possibility. By Author


