Bus Transit Oriented Design for a more Equitable Trinity Metro System in Fort Worth, Texas
Ayushi Mavuduru, 1001697492
PLAN 4395-001
June 13, 2023
Abstract
In the past decade, Fort Worth’s Trinity Metro has seen declining bus ridership, with transportation planning efforts directed towards car-centric and commuter rail-based development. This paper explores how Bus Transit Oriented Design (BTOD) can improve quality of life for low income and minority transit-dependent riders, while also attracting choice ridership to displace car usage. The literature review highlights best practices to overcome challenges of suburban BTOD implementation in Fort Worth. The mobility assessment evaluates eight Trinity Metro locations using quantitative and qualitative analysis of performance and built environment attributes in relation to demographic characteristics. This mobility assessment reveals greater deficiencies in the bus-supporting infrastructure of low-ridership locations but suggests that both affluent and impoverished neighborhoods face unfavorable built environment conditions for buses. Design recommendations apply existing Fort Worth TOD and complete street proposals to four underperforming locations, while policy solutions call for improved public engagement and an expanded funding strategy.
1. Introduction
Transit-oriented design (TOD) is an urban planning and design approach that creates compact, walkable communities centered around high-quality public transit systems. Reduced dependence on cars for access to essential resources and opportunities not only results in safer, less congested roads and reduced carbon emissions; but can potentially improve the quality of life of low-income, minority, disabled, youth, and elderly residents- all of whom have reduced access to private transportation (Cervero 2013).
Though the Trinity Metro’s bus lines outperform all other modes, overall public transit ridership has been declining in the greater Fort Worth area (Department of Planning and Development 2022). Fort Worth’s prioritization of commuter rail in medical research and highend residential areas in the face of declining ridership is illustrative of the pattern of many United States TODs catering to affluent “choice riders,” with a lost potential for applying transitoriented development principles to better serve marginalized and transit-dependent riders (Sandoval & Herrera 2015). The very affordability and widespread availability of bus lines to low income and minority riders that makes buses the “backbone” of the Trinity Metro also contributes to negative perceptions of public bus stations as rife with crime and urban blight (Department of Planning and Development 2022). Thoughtful design of bus stops, stations, and surrounding streetscapes is central to the dual goals of encouraging choice ridership and improving the quality of public transit experiences for transit dependent riders. Successful BTODs in Fort Worth can thus function as safe, well-connected public spaces that facilitate
greater community identity and social cohesion, while also displacing car usage due to more equitable access to healthcare, education, grocery stores, jobs, and recreation.
2. Literature Review
2.1 Benefits of Bus Transit Oriented Design (BTOD)
Compared to rail-based systems, bus transit can be redesigned to account for changes in demand along routes. Because bus systems can better mimic the “many to many” character of suburban transit patterns, they are suitable for a medium density city like Fort Worth (Currie 2006). These benefits speak to bus lines having the most widespread routes, highest annual ridership and greatest revenue generated out of all nine transit modes the Trinity Metro offers (Department of Planning and Development 2022). Likewise, implementation of bus systems is cost effective compared to light rail, especially in low density regions (Currie 2006). The low operating costs of bus lines relative to rail keep fares lower, making buses more accessible to high-poverty communities than light rail.
2.2 Addressing the Challenges of Bus-Transit Oriented Design in Fort Worth
2.2.1 Prioritization of Commuter Rail over Public Bus
The negative perception of bus-based transportation systems in favor of commuter rail is a frequently cited challenge in amassing the funding, political will, and public support needed to implement transit-oriented design through bus systems (Currie 2006). Local bus systems are typically associated with transit-dependent riders, who are low-income and disproportionately racial minorities, whereas investment in light rail caters to upper- and middle-class choice riders
(Spieler 2020). Moreover, there is reluctance to invest in bus transit as it is perceived to be impermanent, less enduring, and by extension, not economically viable (Currie 2006; Reyes et. al. 2023).

2.1: Map of Trinity Metro Selected Services and Fort Worth Poverty Rates
As of 2022, the Trinity Metro has been prioritizing future rail investment, despite the higher ridership and demand for improved bus services (Transit Moves Fort Worth 2019). Plans for a TexRail expansion into a neighborhood south of downtown Fort Worth housing biomedical
Figureresearch and health education; and further expansion near the TCU campus suggests commuter rail investment caters to educated, high income, working professionals. Likewise, the Trinity Metro is prioritizing ride share and bike share growth in the same affluent recreational and educational areas with proposed rail expansion, namely the TCU campus, Southside, and the Stockyards district (Department of Planning and Development 2022). Meanwhile, a proposed bus rapid transit (BRT) corridor on East Lancaster Avenue has struggled to gain traction due to extensive opposition from business groups in Fort Worth (Sadek 2023).
2.2.2 Urban Design Strategies to Improve Public Perception of Buses
Currently, Trinity Metro bus stops lack basic amenities- with 90% of bus stops lacking shelters, 78% without benches, and 76% with no lighting (Transit Moves Fort Worth 2019). Design interventions like improved lighting, shade structures, and traffic calming devices to improve the walkability, bikeability, and perception of safety of the Trinity Metro’s bus system (Jacobson and Forsyth 2008). Multiple sources have examined how a broader range of urban design elements like setbacks, vegetation, windows, and street furniture influence perceptual characteristics such as enclosure, complexity, transparency, and human scale (Basurto 2020; Ewing and Handy 2009). Such qualities can make a walking trip seem shorter, safer, and more appealing, which in turn improves the connectivity of buses to the broader neighborhood (Ewing and Handy 2009).
Likewise, due to public hesitation to board transit in spaces without activity, the Trinity Metro’s bus transfer centers, many of which are currently isolated from their surroundings by parking and vehicular traffic, would benefit from the programming of the large open spaces around them, and
gradual increases in retail density and diversity (Stojanovski 2019; Transit Moves Fort Worth 2019).
Lastly, a study examining low and high social vulnerability neighborhoods in Pittsburg underscores the need to consider design and land use planning characteristics as part of their social context, as neighborhoods with high social vulnerabilities often lacked pedestrian-friendly design interventions but had higher rates of walking. The distinction between modes of choice and modes of last resort demonstrated by these findings suggests that elevated levels of walking or bus ridership alone in low-income and minority neighborhoods do not necessarily mean that the transit system and supporting infrastructure is safe and appealing (Bereitschaft 2017). For bus transit to result in meaningful reductions in private car use, it is equally important to strategize for pedestrian and bike safety enhancements both in neighborhoods with a high propensity for transit use even if walking, biking, and bus ridership is already high; and in low-ridership neighborhoods where economic, design and infrastructure resources are present, but not well integrated with bus infrastructure.
2.2.3 Multimodal Strategies to Support BTOD in Low Density Regions
Except East Lancaster, most neighborhoods in Fort Worth are not dense enough to support a BRT system (Transit Moves Fort Worth 2019). While BRT is competitive with both private cars and light rail in terms of frequency, local suburban bus systems can be challenging to implement TOD around (Currie 2006). Integrating electric bikes and scooters with bus transit is one strategy to improve first and last mile connections to bus lines in low density regions of Fort Worth (Transit Moves Fort Worth 2019).
The Trinity Metro offers an app-based bike share program which has seen gradual growth, particularly in electric bike usage, since its incorporation into the Trinity Metro in 2020 (Department of Planning and Development 2022). However, bike share docks appear concentrated in the entertainment district and Stockyards area (B-Cycle LLC 2023). As these areas attract biking for leisure and recreation, bike share docks in these locations are not effectively displacing car use. Moreover, bike sharing can only result in meaningful reductions in car use when adequate bike infrastructure is present, with bike share users more inclined to begin a bike trip in a safe and appealing environment (Guo et. al. 2022). Currently, the underlying spatial inequities in Fort Worth limit the Trinity Metro bike share’s ability to serve transit dependent groups. Super-majority-minority neighborhoods in Fort Worth have 40% of the city’s poor condition streets, 47% of poor condition sidewalks, and 41% fatal pedestrian and bicycle crashes (City of Fort Worth 2022).
 Figure 2.2: Floating Transit Stop Identified as Ideal Configuration by City of Fort Worth (City of Fort Worth 2019)
In recent years, the City of Fort Worth has been developing design strategies to address inequities in pedestrian and bike infrastructure as part of the 2019 Active Transportation Plan. The Bicycle Facility Selection Guide and Design Toolbox section of the 2019 ATP underscores the need for physical separation between cyclists and vehicular traffic, as well as traffic calming interventions like bulb outs, chicanes, and roundabouts. In this plan, the city of Fort Worth also presents the floating transit stop as the ideal solution to reduce bus and bike conflicts and transit stops (City of Fort Worth 2019).

 Figure 2.3: Series of curved projections called a chicane reduces vehicle speeds (City of Fort Worth 2019)
Figure 2.4: Neighborhood roundabout minimizes pedestrian, bike, and car conflicts (City of Fort Worth 2019)
The 2019 ATP also recognizes the danger that moving traffic and parked vehicles pose to cyclists. The large surface parking lots that are currently the norm in Fort Worth must be reconfigured and redesigned to make walking and biking safer (City of Fort Worth 2019). Changes to parking that can facilitate BTOD include moving surface lots a short distance away to make room for services and public space next to the bus station. Other strategies that require long term planning and investment include underground or above ground parking structures, and “wrapping” the exterior of parking lots with retail and active uses (Dunphy et al 2004).
The City of Fort Worth is considering additional micro mobility solutions to provide access to public transportation where high frequency fixed-route buses are not feasible. Two of the potential solutions the city has identified include flexible route buses that can deviate up to a quarter of a mile of the route by passenger request, and transportation management authoritieswhich are shuttle services that run on public private partnerships to serve commuters for a specific employer (Transit Moves Fort Worth 2019). Rideshare solutions have already been implemented as part of the Trinity Metro through Zipzone, which is sponsored by Lyft, and provides free first and last mile connections through access codes associated with bus and rail passes (Department of Planning and Transportation 2022).
2.3 Examples of Successful Bus Based Transit Oriented Design
Bus based transit-oriented design ranges from small scale urban design interventions like outdoor plazas and stops that prioritize connectivity between buses and pedestrians, to large scale mixed-use “transit villages” containing retail, housing, and additional community resources. Scholarship covering previous BTOD solutions examines various aspects- such as funding and
decision-making processes- and impacts of the transit systems in terms of parking demand, congestion, walkability, accessibility, and overall health and quality of life.
2.3.1 Redmond, Washington


Figure 2.5: Collage of urban design details in Redmond, Washington (Basurto 2020)
Redmond, Washington, a suburban city near Seattle that has an extensive bus network which is well-integrated with the urban form. The city of Redmond, King County, and the regional Sound Transit organization collaborated to plan and design the Redmond Downtown
Center and the adjacent mixed use Veloce Building. (Shelton and Lo 2003; Tian et. al. 2016).
This development replaced a cramped set of bus stops, not unlike those comprising transfer centers in Fort Worth, with bus bays, passenger shelters, and additional bus layover space (Transit Moves Fort Worth 2019; Tian et. al. 2016).
Though providing large park and ride parking lots is the default approach to designing bus transfer centers, the transit-oriented development in Redmond challenges the assumption that transit oriented developments require the same amount of parking as conventional park and ride stations. Parking supply and occupancy surveys indicate that the Redmond TOD saw only 37% of the vehicle trips projected for the site by the Institute of Transportation Engineers Parking and Trip Generation Manuals. Likewise, peak residential demand is 65% of the expected ITE value, and commercial uses see 27% of expected peak period demand (Tian et. al. 2016). As both commercial and residential demands peak in the evening, while transit parking demand peaks in the morning, the Redmond TOD case reaffirms the feasibility of sharing parking among different uses. While even larger reductions in space allocated to parking due to sharing of parking will facilitate greater densities and pedestrian access, it has not been realized due to security challenges (Jacobson and Forsyth 2008).
Redmond’s thriving bus network is supported by strong pedestrian and bicycle infrastructure throughout the city (Shelton and Lo 2003). Some of the successful strategies in connecting non-motorized transit to mass transit include the use of on street parking next to moving traffic as a protective barrier for cyclists and pedestrians, universally designed bus shelters with low-height signage, and engaging urban design features like public art and bike
racks in the shape of bicycles. Despite these successes, Redmond’s transit-oriented development strategy has failed to serve marginalized communities due to the over policing of new development and a top-down engagement strategy targeting educated professionals through events like engineering open houses (Basurto 2020). Moreover, consequences of the urban design investment in Redmond reflect a frequently observed pattern of price increases resulting in displacement of high-poverty Black and Latino communities when transit development occurs without the input of these groups (Sandoval and Hererra 2015).
2.3.2 Fruitvale, California
Though the Fruitvale Transit Village in Oakland employs many of the same design strategies as Redmond, the Unity Council, a community-based organization driving development in Fruitvale engaged with and uplifted its surrounding low-income, predominantly Latino immigrant community, preventing displacement by making use of capital within the community. Previously, due to economic disinvestment in the 1980s and 1990s, Fruitvale had the second highest crime rate in the BART system, a 50% retail vacancy, and in 2000, 49% of households lived on less than $30,000 annually, with 34% of residents needing state welfare assistance (Sandoval and Herrera 2015). With funding from 30 different public sources and support from the BART and City of Oakland, the Unity Council planned and designed mixed-income housing, retail, and community services such as a clinic, charter high school, childcare, and senior facilities in place of the proposed multistory BART parking garage (Jacobson and Forsyth 2008). Financial and political support from multiple public organizations was essential to the success of Fruitvale transit village, as the city of Oakland designated Fruitvale as a Tax-Increment-Finance
Zone (TIF) to collect funding and changed zoning laws to allow for mixed use development and traffic calming devices in Fruitvale (Basurto 2020).

Figure 2.6: Pedestrian Way in Fruitvale Transit Village, Oakland, California (Sandoval and Herrera 2015).
The Fruitvale Transit village creates inviting public spaces through a consistent use of bright colors across the buildings, detail and complexity of storefront design, and street furniture that reinforces a human scale in the space. Initially, Fruitvale was limited by the placement of bus bays and parking on the opposite side of the commercial zone of the Transit village, which reduced the amount of pedestrian traffic routed through retail (Jacobson and Forsyth 2008).
Currently, some of the surface parking at Fruitvale is being redeveloped into affordable housing,
which illustrates the possibility of use space allocated for parking as a “land bank” for future increases in density (Basurto 2020; Jacobson and Forsyth 2008).
2.3.3 Mexico City


Figure 2.7: pre and post intervention street geometry in Mexico City (Chang et. al. 2017)
Supported by a “complete streets” program that prioritizes connectivity between buses, bikes, and pedestrians, Mexico City’s Metrobús BRT system highlights how small-scale interventions can help mass transit displace cars. By providing dedicated lanes to buses, reclaiming sidewalks, creating signaled pedestrian crossings, ensuring walkability and wheelchair accessibility of bus stops; the Metrobús and complete streets have reduced travel time by thirty percent road accidents by forty percent, and have prevented 150,000 car trips every day (Harvard Graduate School of Design 2016; World Resource Institute 2015). The increased
walkability of BRT corridors has resulted in low-income commuters shifting from private vehicles to Metrobús, with low-income women seeing the highest increase in walking to use transit (Chang et. Al. 2008). The positive impacts of BRT corridors coupled with pedestrian and bike infrastructure, as well as reclaimed greenspace reaffirm the potential for small- scale traffic and design interventions to facilitate access to bus transit, and thus validate the City of Fort Worth’s plans to establish bike and pedestrian friendly “blue zones” as part of the broader public transit strategy (Transit Moves Fort Worth 2019).
2.4 Lessons and Best Practices
To capitalize on the lower construction costs and long-term flexibility that bus-transit oriented design offers, the Trinity Metro will have to overcome spatial challenges due to low density and suburban sprawl, as well as negative perceptions of bus transit as unsafe, less economically viable, and unappealing to affluent choice riders compared to commuter rail.
Successful use of transit amenities, urban design elements and broader land use and transportation strategies can help overcome many of the biases against bus systems. Making the neighborhoods in which bus stops are located more walkable and bikeable will also encourage bus ridership, thus displacing car usage and further reducing the parking demands that hinder increases in density.
Thriving BTODs are characterized by bus stops and transit centers close to public spaces and services. These stops are made highly visible and user-friendly through shelters, shade structures, pedestrian scale lighting, benches, and route information. Efforts to redesign parking in more pedestrian and transit friendly ways are also central to successful BTODs. Some
potential solutions include sharing parking between uses, moving lots some distance away from the transit center, or investing in underground or above ground parking structures. The reclamation of public space from roadways themselves is an essential aspect of making bus stops efficient and accessible for pedestrians and cyclists of all ability levels. Traffic calming interventions, physically separated bike lanes, and intersections that prioritize pedestrians and bikes can help support neighborhood bus transit.
3. Mobility Assessment
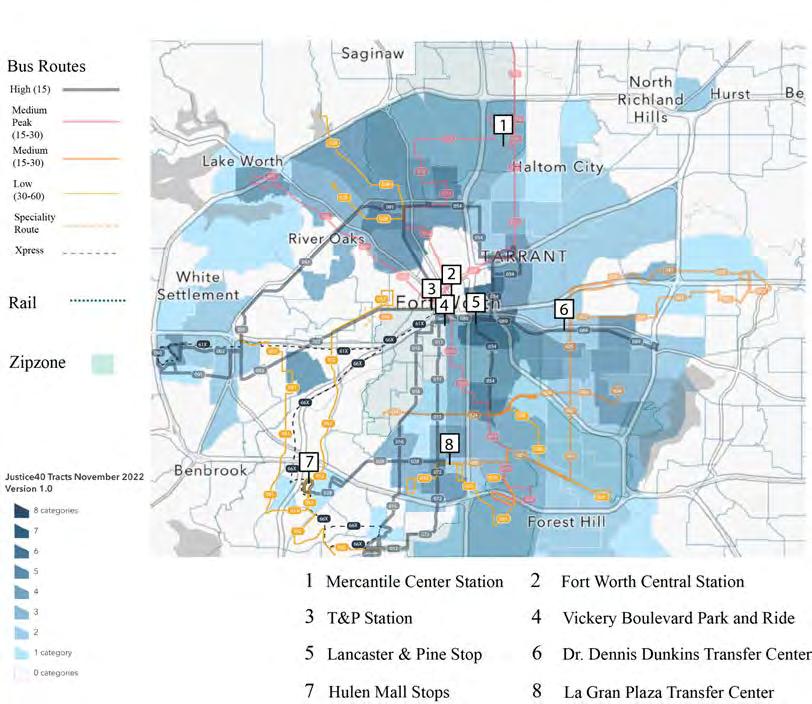
This mobility assessment evaluates the performance of bus lines and the current infrastructure available to support BTOD at eight locations within the Trinity Metro system.
By relating quantitative measures including ridership, poverty rates, transit affordability, and dominant race or ethnicity to qualitative analysis of the built environment of each location, this assessment illustrates patterns in the design and demographic characteristics of high ridership locations, and further identifies limitations in the pedestrian safety and connectivity of bus stops to their surroundings.

3.1 Performance and Social Inequality Indicators
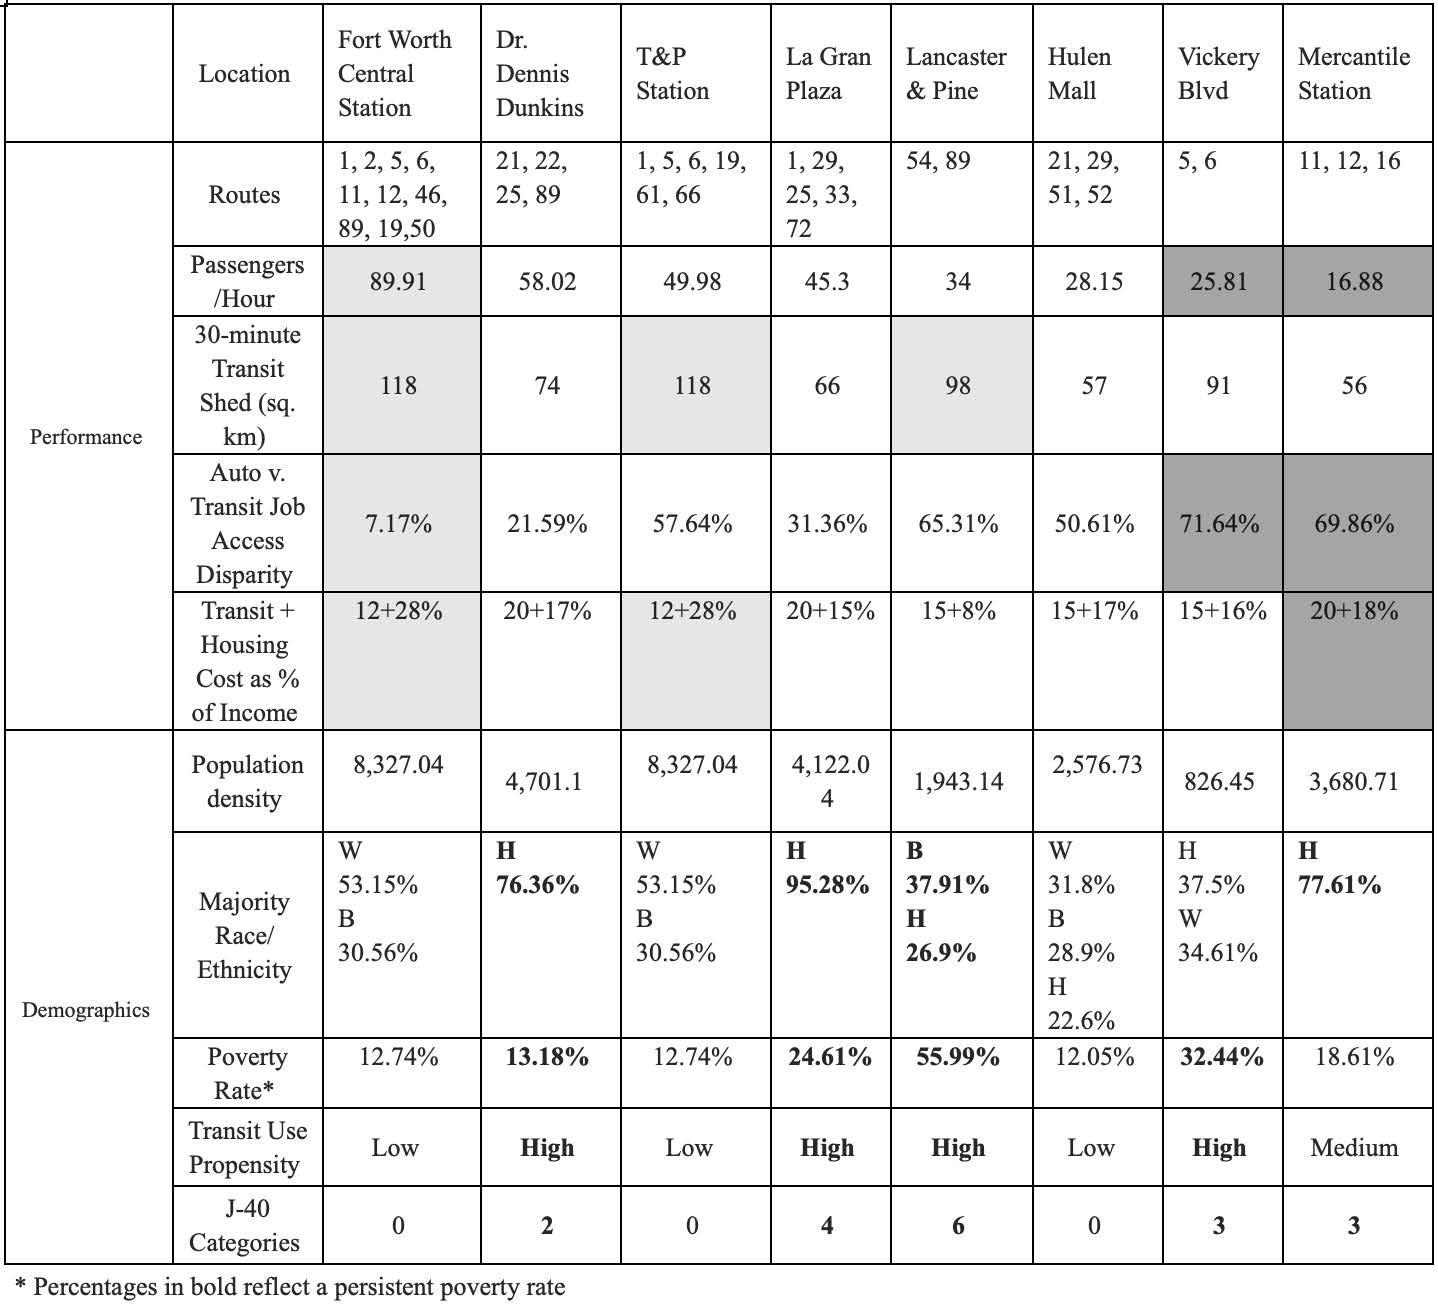
Ridership is the primary indicator of the performance of each of the eight selected Trinity Metro locations. The level of activity at each of the eight locations was estimated by adding the Trinity Metro’s 2023-2026 Title VI Report’s measurement of average passengers per hour of each bus route passing through the location. Additional performance and demographic characteristics were collected based on the 2020 census tract of each transit location. The Trinity Metro’s ability to serve low-income and minority groups dependent on transit was assessed by considering housing and transit costs as a percentage of income, and the disparity between jobs accessible by car and those reached by transit. The job access disparity was accounted for based
Figure 3.1: Map of Selected Trinity Metro Locations and Serviceson 2022 census data for jobs within a 45-minute transit commute, and jobs within a 45-minute car ride, using the following formula:
When the disparity between jobs accessible by car and transit is high, transit dependent commuters lose economic opportunities, and there is also little incentive for wealthier commuters who can afford cars to switch to transit.
The City of Fort Worth’s transit use propensity index, and the US department of Transportation’s Justice 40 categories provide further insight into which neighborhoods of Fort Worth are especially marginalized and reliant on public transportation. The transit use propensity ranks Fort Worth census tracts based on resident poverty, private vehicle access and race to predict which regions of the city exhibit high demand for transportation services. The Justice 40 initiative maps the historical effects of racial marginalization and disinvestment across eight categories: climate change, energy, transit, housing, workforce, legacy pollution, health, and water (Council on Environmental Quality 2022).
Based on the performance and demographic characteristics, the eight selected locations are organized into four pairs for analysis: Fort Worth Central Station with Mercantile Station, La Gran Plaza with Hulen Mall, T&P Station and Vickery Boulevard Park and Ride, and Dr. Dennis Dunkins with Lancaster& Pine. The locations were paired together due to similar land use or service characteristics but contrasting ridership, or geographic proximity but significant demographic and built environment disparities.
Table 3.1 Characteristics of
Trinity Metro Stops

3.1.1 Fort Worth Central Station and Mercantile Station
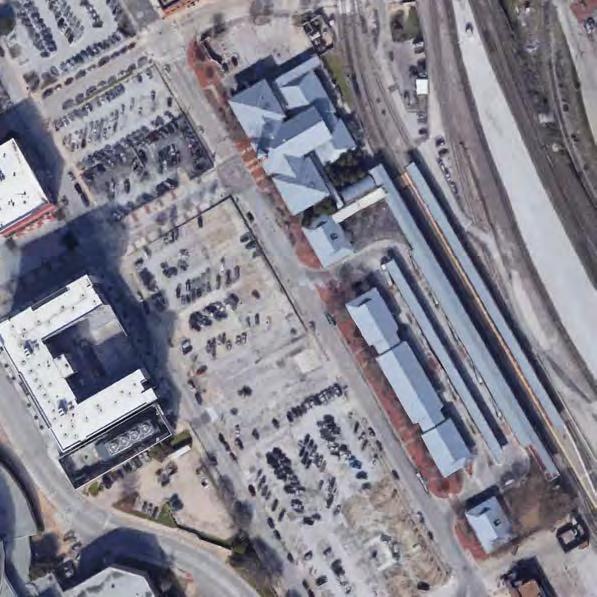

Fort Worth Central Station and Mercantile Center Station provide access to bus and rail.
Located in the heart of downtown, Fort Worth Central has the largest number of bus transfers, the highest number of bus passengers per hour- 89.91. A newer station, Mercantile Center, is on the
Figure 3.2 Satellite Views of Fort Worth Central And Mercantile Center Stationsnortheast edge of Fort Worth and only contains two bus routes, seeing the lowest bus activity level: 16.88 passengers per hour. Routes are concentrated through the low-transit use propensity Fort Worth Central station despite Mercantile Center station’s medium transit use propensity, higher poverty rate of 18.64 compared to FWCS’s 12.74%, and classification under three J-40 designations.
3.1.2

Though T&P Station and the Vickery Boulevard Park and Ride are connected through shared parking and a tunnel under I-30, the two locations are in different census tracts with sharply contrasting characteristics: the Vickery Boulevard tract has a high persistent poverty rate of 32.44 percent, a high transit use propensity, and falls under three J-40 categories as opposed to
T&P Station and Vickery Boulevard Park and Ride Figure 3.2: Satellite View of T&P Station and Vickery Boulevard Park and Ridea low poverty rate of 12.74 percent in the T&P Station Tract. While the T&P tract has the highest population density- 8,327.04 people per square mile- Vickery Boulevard has the lowest- 826.42.
3.1.3

 La Gran Plaza Transfer Center and Hulen Mall
Figure 3.3: Satellite Images of La Gran Plaza Transfer Center and Hulen Mall Bus Stops
Though La Gran Plaza Transfer Center and the Hulen Mall stops are adjacent to suburban malls, their demographic characteristics and bus ridership differ. La Gran Plaza falls in four J-40 categories and has a high transit use propensity. While Hulen Mall has a poverty rate of 12.05 percent, the lowest of all Trinity Metro locations, La Gran Plaza has a high persistent poverty rate of 24.61 percent. Before its 2004 rebranding, La Gran Plaza, formerly Seminary Shopping Center and Fort Worth Town Center, was losing stores to Hulen Mall, which was designated as a transfer center (Robert 2023). Since Latino investor Jose de Jesus Legaspi redeveloped the mall to cater to an overwhelming majority Latino neighborhood, La Gran Plaza has outpaced Hulen mall, seeing nearly double the bus traffic- 45.13 passengers per hour as compared to 28.15 (Frizell 2014).
3.1.4 Dr. Dennis Dunkins Transfer Center and Lancaster & Pine Stop
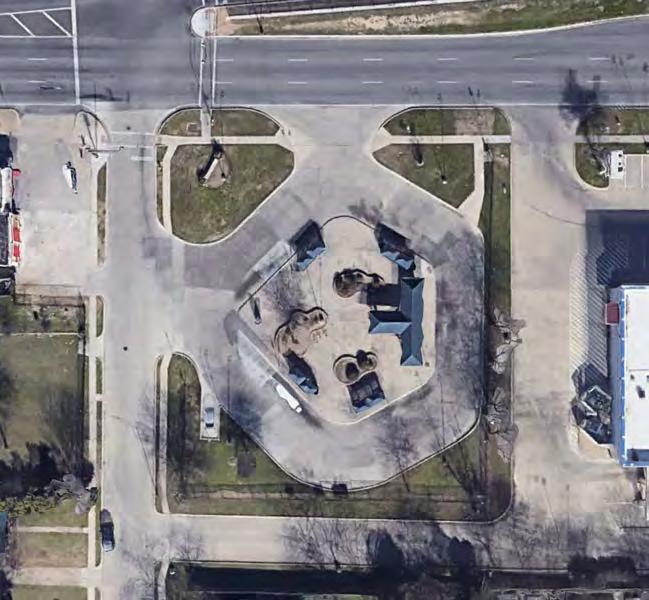

Figure 3.4: Satellite views of Dr. Dennis Dunkins Transfer Center and Lancaster & Pine
Dr. Dennis Dunkins Transfer Center sees the greatest number of passengers per hour across bus routes for a bus-only transfer center. Both the transfer center and the Lancaster & Pine bus stop are located along route 89, the highest demand route and the only with a potential for a light BRT system (Trinity Metro 2022). However, the census tract in which Lancaster& Pine is located has some of the greatest social vulnerabilities in Fort Worth, falling under 6 J-40 categories, and experiencing an overwhelming poverty rate of 55.99%. On average, residents here spend only 8% of their income on housing compared to 15% on transit, which implies that many residents may be unhoused or living in very low-quality housing.
3.2 Built Environment Analysis of Trinity Metro Locations
Satellite imagery from Google Earth Pro, and Google Earth Street views were used to conduct a qualitative analysis of the built environment based on four major categories: transit supporting amenities, urban design elements, right of way, and urban form. These categories
each contain six observable attributes based on evaluated on the three-point scale ranging from good (3 points) to poor (1 point). Previous analyses of streetscapes have grouped attributes based on perceptual qualities like imageability, human scale, and enclosure (Basurto 2020; Bereitschaft 2017). In such analyses, a single attribute is often associated with more than one quality; for example, in an analysis of Redmond streetscapes, Basurto describes the similar characteristics of street vendors, active uses/occupied storefronts, and street entertainment as separately contributing to human scale, transparency, and complexity; as well as the equity-based categories of opportunity, enjoyment and community (2020).
Because overlapping attributes contribute to multiple perception and equity-based outcomes, this assessment combines similar elements into one attribute- such as the grouping of street vendors, active uses, street entertainment, and street dining into a single “street life” characteristic. The reduction in redundant attributes was desired as additional small- and largescale transit-focused attributes including road condition, traffic calming, traffic signals, and bus stop quality were introduced. Condensing the total number of observable traits and categorizing them based on the scale of the intervention and the type of planning: transportation versus urban design also allows for greater focus on how such solutions can be implemented and improved.
 Table 3.3: Built Environment Attributes by Category
3.2.1 Fort Worth Central Station and Mercantile Center Station


Rail is more visually prominent at both locations than bus, but the separation between the two modes is more pronounced at Mercantile Center. Fort Worth Central Station consists of a main service building, train shed, and bus terminal. The two-story main service building and smaller bus terminal structure aligned along Jones Street and are unified by a red-and-white brick design that continues in surrounding sidewalks. An interstitial gravel courtyard between the two
Figure 3.5 Visual Comparison of Fort Worth Central and Mercantile Center Stationstructures provides a semi-public waiting area to connect the two modes. In contrast, Mercantile Center station has individual bus shelters spread apart on a large bus loop next to parking, all of which is separated from the train platforms by a high wall.
An expansive surface parking lot makes Mercantile Center Station difficult to navigate, but a pedestrian bridge connects the parking lot and bus loop area to the north to a corporate office south of the tracks. Although Fort Worth Central Station is surrounded by commercial uses as opposed to the undeveloped and industrial context of Mercantile center, the former is separated from higher activity regions of downtown by three large surface parking lots. At Fort Worth Central, first floor windows, pedestrian-scale lighting and place signs on the main façade enhance perceptions of safety and wayfinding. In contrast, Mercantile Center Station has tall, vehicle-oriented light posts that make navigating the large parking lot and bus loop unsafe at night. Poor sidewalk conditions contrast the wide, brick paved sidewalk in front of Fort Worth Central and the absence of bike lanes and safe crosswalks in the station's surroundings further hinder the Mercantile Center bus ridership.
Though Fort Worth Central station has a greater concentration of services and betterquality design elements, the Mercantile Center neighborhood exhibits more transit use propensity than Fort Worth Central Station, suggesting that the lack of supporting services and poor design choices prevent Mercantile Center Station bus routes from better serving its surrounding transitdependent populations. Although Fort Worth Central Station’s strong urban design qualities contribute to higher ridership among affluent choice riders, the concentration of routes through the city center is also a key factor in higher activity levels despite lower transit dependency.
Because the peripheral neighborhood of Mercantile Center Station sees more transit use propensity and poverty, the strategy of routing buses through the city center may no longer be appropriate to serve future growth and expansion in Fort Worth.
 Table 3.4: Condition of Built Environment- Fort Worth Central v Mercantile Center
3.2.2 Texas & Pacific Station and Vickery Boulevard Stop


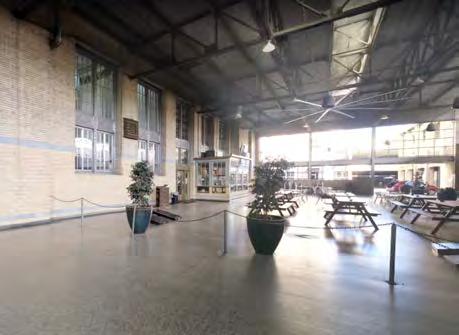
 Figure 3.6: Visual Comparison of T&P Station and Vickery Boulevard Park and Ride
T&P station is surrounded by a diversity of building types, including a tavern, real estate office, and a postal service building, but parking lots obstruct access to the station from West Lancaster Avenue. Nevertheless, the surroundings of T&P station exhibit strong urban form characteristics like contiguous street walls consisting of first floor storefronts, historical buildings, and unique facades. Although bus stops consist of single posts on West Lancaster Avenue, high quality pedestrian-scale lighting, wide brick sidewalks, and unique place signs further facilitate walking from the station to the stops and nearby public uses like the Haynes Memorial Triangle Park.
South of I-30, the streetscape of Vickery Boulevard is of much lower quality than that of T&P station. Sidewalks are damaged and narrow, and bike lanes lack buffers from vehicular traffic, and there is a high-conflict area between the bike lane and bus stop. Facades are deteriorated and lack street-facing windows, reducing the perception of safety. Wayfinding and protection for pedestrians navigating the large Vickery Boulevard surface lot is inadequate. There is a red brick shade structure with seating and waiting areas in the center of the lot, but the streetfacing bus stops consist of a single post.
The interior of the T&P station contains extensive waiting areas and public spaces with an opulent historical style. The historical style and design language of the T&P station and its surroundings does not extend into the tunnel connecting the station to Vickery Boulevard. Instead of red brick walls, ornate light fixtures, and concrete flooring, the tunnel has bare white walls, linoleum floors, and overly bright fluorescent lights. The lighting is especially poor at the tunnel entrance leading to parking under I-30. The way the tunnel entrance is sunken down
several steps below the parking lot creates an unsafe situation for riders trying to navigate from their cars to the T&P building.
Though the Vickery Boulevard area exhibits higher transit use propensity, there is less investment in pedestrian infrastructure needed to connect residences on the south side of I-30 to park, ride and train station. Even when designed as part of a unified system, extensive efforts are made to separate bus from rail, with the lack of a cohesive design language across modes disrupting wayfinding and comfort with using public buses. This is a particular area of concern given that the population density on the Vickery Boulevard side is one tenth of that of the T&P Station area, which means that bus riders will need to walk or bike longer distances in currently unsafe conditions to access stops.
Table 3.5 : Condition of Built environment- T&P Station v Vickery Boulevard Park and Ride

3.2.3 La Gran Plaza Transfer Center and Hulen Mall Stops


Given their use as suburban malls, both La Gran Plaza and Hulen Mall are isolated from main roads with extensive surface parking lots. However, the stops at La Gran Plaza are organized into a cluster of five bus shelters around a fenced loop. A wide, paved pedestrian crosswalk connects the bus shelters directly to the mall storefronts. At Hulen Mall, the presence
Figure 3.7: Visual Comparison of La Gran Plaza and Hulen Mallof buses is minimized, with stops comprising a post and bench on the outer perimeter of the extensive parking lot. Sidewalks are narrow and circle the perimeter of the parking lots with no safe path leading from bus stops directly to the mall. Though there are single family residential neighborhoods near both malls, these housing areas are separated from the malls by tall walls and hedges, as opposed to being connected to them through sidewalks or public parks and plazas.
The La Gran Plaza Mall displays many successful urban design qualities that contribute to its appeal and generate traffic for the transit center. The unique, brightly colored façade designs continue on all sides of the mall, creating the effect of a continuous street wall even as the mall is separated from main roads by parking. Wide pedestrian walkways, entry plazas, and colonnaded storefronts facilitate wayfinding between the interior and exterior spaces of the mall. In contrast, Hulen Mall has deeply setback, concealed entrances, with the façade and storefront of Dillard's fully obscured by a parking structure. Vegetation further obscures the outer facades of Hulen Mall.
Public art and murals, such as one describing the mall as “a piece of Mexico in Fort Worth, Texas” differentiate La Gran Plaza from Hulen Mall and contribute to a unique community identity. Likewise, a wide range of business types, from chain stores to small Latinoowned business, and public event programming in and around the mall contributes to its appeal to a wide range of age and income groups.
The greater visual prominence and connectivity of the bus transit center directly to storefronts in the lower income, Hispanic majority La Gran Plaza neighborhood compared to the
lack of visibility and connectivity of bus stops to the shops at Hulen Mall communicates the reluctance of affluent, white majority communities to embrace bus usage.
3.6:
 Table
Condition of Built Environment- La Gran Plaza v Hulen Mall
3.2.4 Dr. Dennis Dunkins Transfer Center and Lancaster & Pine Stop


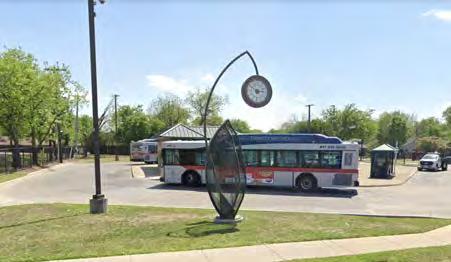


Despite their geographic proximity, the streetscapes of both locations vary widely. There is a modest diversity of generic suburban businesses like CVS and McDonalds, as well as residences surrounding the Dr. Dennis Dunkins Transfer Center. The Lancaster & Pine stop, however, is opposite vacant lot, fenced in lot. The limited transparency of surrounding buildings, many of which have murals instead of street-facing windows further reduces the perception of
Figure 3.8: Visual Comparison of Dr. Dennis Dunkins Transfer Center and Lancaster & Pinesafety at Lancaster & Pine, with the only building containing first-floor windows being set back Trinity Metro Operations building.
Road and sidewalk conditions are inadequate at both locations, but Lancaster& Pine sees a high frequency of obstructions including damaged trashcans. There is extensive evidence of homeless camps near the Lancaster & Pine stop, and the continuous fences enclosing lots suggests concerns of crime in this area. Through bike share is present near the Trinity Metro Operations building, bike lanes lack continuity and have no buffer from moving vehicles.
At Lancaster& Pine, the seating in bus shelters is small and uncomfortable, likely to discourage homeless individuals from sleeping or congregating near the stop. However, this reduces the comfort and appeal of the stop to all transit users. In contrast, Dr. Dennis Dunkins Transfer Center has a large main shade structure for buses and several smaller ones with benches and signage arranged around a loop. The middle of the loop contains deliberately designed vegetation, and a street-facing clock in the shape of a plant gives the location a unique identity.
The Lancaster & Pine stop reflects the use of buses in underserved minority-majority neighborhoods as a mode of last resort. The location of a transfer center further east along route 89 where there is less evidence of poverty, disrepair and homelessness highlights the challenge of disinvestment in highly vulnerable areas due to concerns about crime and safety.
 Table 3.7: Condition of Built Environment - Dr. Dennis Dunkins v Lancaster & Pine
3.3 Findings and Analysis
Table 3.8:
Overall Built Environment Conditions by Category

All eight locations have deficiencies in their built environment that hinder bus ridership. Fort Worth Central Station and La Gran Plaza Transfer Center have the most favorable supporting infrastructure and design elements of the eight locations; however, the two locations only have good conditions in a single category each- supporting amenities and urban design, respectively. The Lancaster & Pine stop, and Hulen Mall stops have poor conditions across all four built environment categories, but the former has the highest poverty rate, and the latter has the lowest. This indicates that the underlying patterns resulting in disparities in the streetscape quality are more complex than simply disinvestment in low-income and minority regions. This is further supported by the contrasting social context of Fort Worth Central Station and La Gran Plaza.
Overall, bus stop amenities have better visibility and design in some of the more socially vulnerable locations like La Gran Plaza, and Dr. Dennis Dunkins Transfer center, while the presence of bus is minimized in the affluent Hulen Mall neighborhood. where bus ridership remains low. When rail and bus are located at a single station, the presence of bus is minimized through physical separation and lack of continuity of design elements. Efforts to increase bus ridership must prioritize complete streets and enhanced protection for bikes and pedestrians in lower income and minority areas. The Trinity Metro must also invest in the visibility and connectivity of bus stops to rail, biking, and walking in more affluent neighborhoods to sway negative public perceptions of public bus that preclude choice ridership.
4. Conceptual BTOD Design Solutions
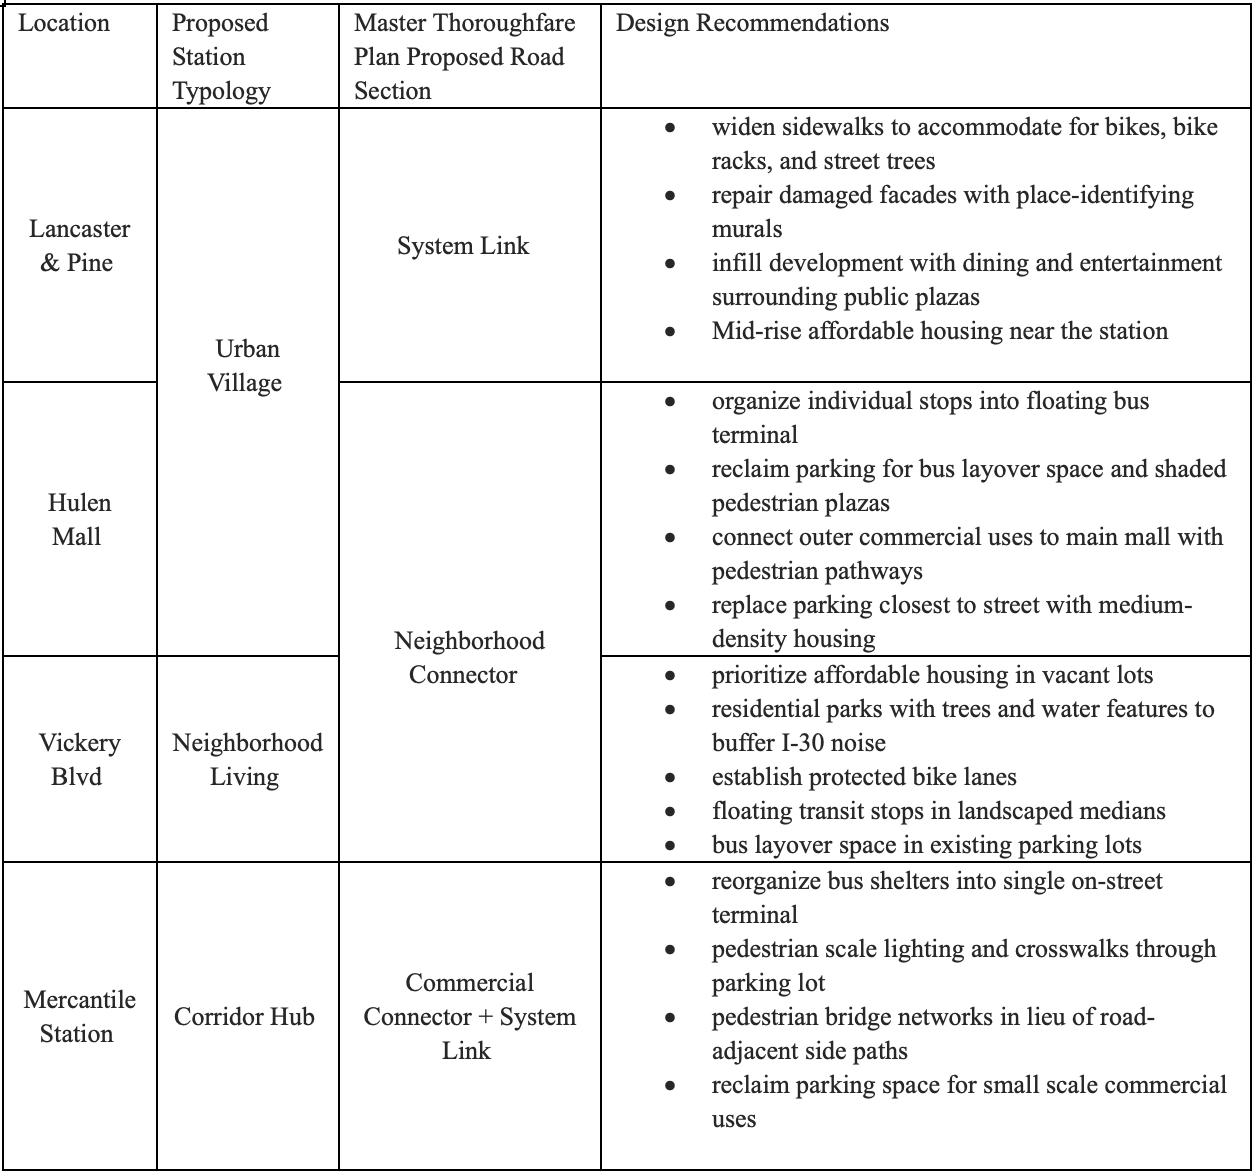
The City of Fort Worth’s 2016 Master Thoroughfare Plan and the third-party Advancing East Lancaster BRT proposal provide conceptual guidelines on the design of bus-transit supporting roads, and appropriate land use planning for a full range of neighborhood and urban contexts. Together, these two proposals are applied to four severely underperforming Trinity Metro locations.
4.1 Fort Worth Master Thoroughfare Plan
The Fort Worth Master Thoroughfare Plan identifies major street categories based on surrounding land uses, and the function of the street in the city’s overall transportation network. A strong departure from existing car-oriented road conditions, most of the six thoroughfare types involve street parking, wider sidewalks, and off-street bike lanes. Each street type has a road section detailing appropriate lane widths and organization (City of Fort Worth 2016).
4.2.1 Activity Street

4.1:
The least common street type, activity streets are sporadically identified near the city center. Lanes are narrow, and space is reclaimed for wide sidewalks and on-street dining. Parking is usually on-street in these retail-oriented locations, and building facades have no setback, forming contiguous street walls. South Main Street is the activity street that links the historic T&P station to downtown attractions like the Fort Worth Water Gardens.
4.2.2 Commerce/ Mixed-Use Street

Figure 4.2: Cross Section of Commerce/ Mixed Use Street (City of Fort Worth 2016).
These business-oriented thoroughfares are concentrated downtown. These streets are flanked by multistory buildings and parking structures, although on-street parking is also provided. A key challenge of commerce streets is that cars frequently turn in and out of the street to access parking structures, so efforts must be made to provide adequate sight lines for drivers
Figure Cross-section of Activity Street (City of Fort Worth 2016).and keep car speeds low. Wide sidewalks are busy during morning rush hours and lunch hours, so separate bike lanes are provided.
4.2.3 Neighborhood Connector

Figure 4.3: Cross Section of Neighborhood Connector (City of Fort Worth 2016).
The most prevalent road type, neighborhood connectors link residential zones to essential neighborhood uses like doctors' offices, schools, and grocery stores. Car speeds are higher on these streets, so multi-use side paths are separated from main roads with landscaping. In these areas, buildings typically have a significant setback containing parking and additional landscape elements. In contrast to the pedestrian oriented activity streets just north of it, the Vickery Boulevard Park and Ride is situated along a neighborhood connector.
4.2.4 Commercial Connector

Figure 4.4: Cross Section of Commercial Connector (City of Fort Worth 2016).
A consistent network of commercial connectors, which provide access to retail and industrial complexes, branches outward from the city center. Currently, surface parking lots
separate commercial connectors from buildings, as seen at major transfer centers like La Gran Plaza and Dr. Dennis Dunkins. Due to the high density of driveways, protected intersections and bike lane design is a priority for improving roads under this category.
4.2.5
System Link

Figure 4.5: Cross Section of System Link (City of Fort Worth 2016).
System links constitute limited stretches on the periphery of the city and emphasize long distance vehicle movement. For this reason, pedestrians and cyclists are buffered from the roadway as much as possible. Raised medians, and by extension, pedestrian refuge islands are a focal point in the design of these roads. East Lancaster is a notable system link connecting downtown Fort Worth to the rest of the Dallas Fort Worth metroplex.
4.2 Advancing East Lancaster
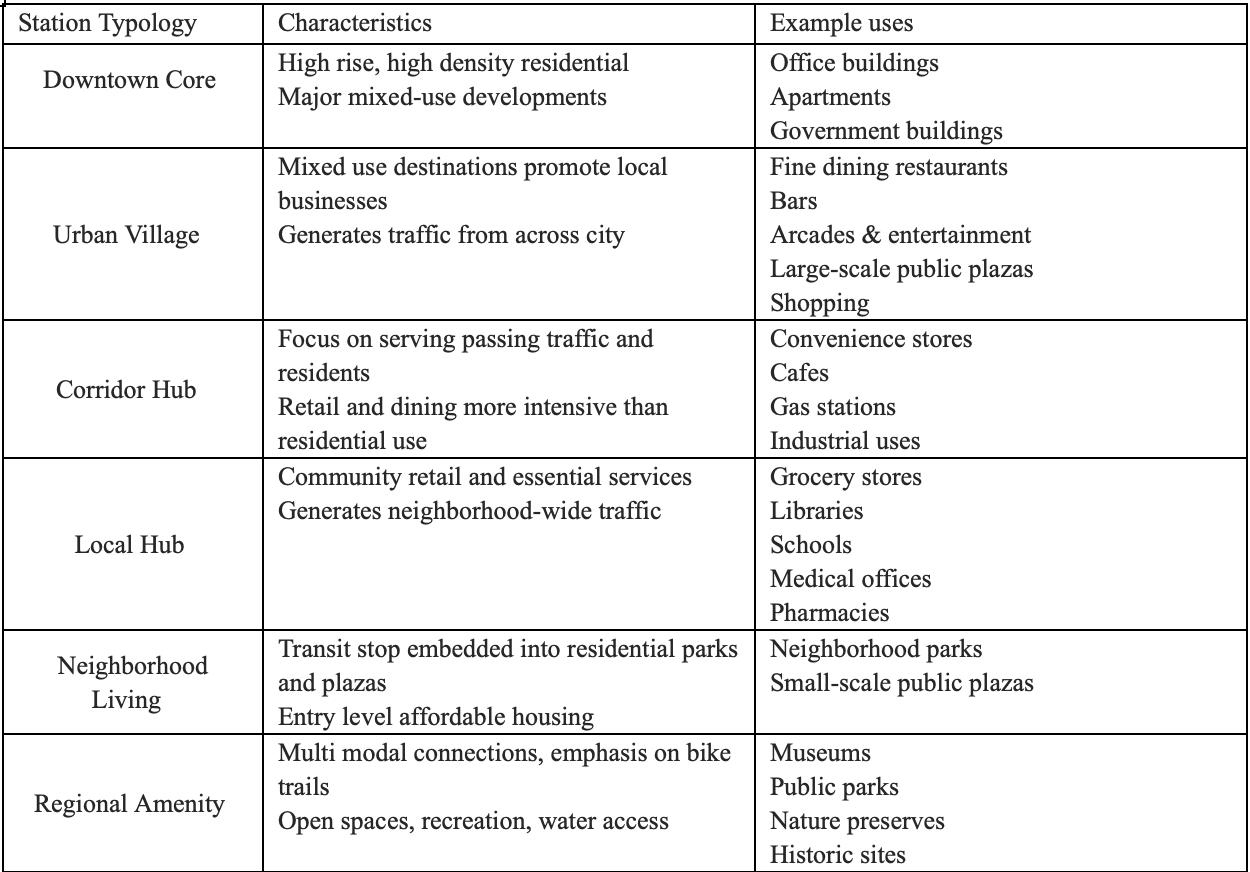
Following the publication of Transit Moves Fort Worth’s State of the System Report, which identified East Lancaster Avenue as a potential site for a high frequency bus route, three planning and design firms proposed a conceptual design for a 13 station BRT corridor along Trinity Metro’s high-demand route 089. Based on site contexts of the stations, six conceptual station typologies- downtown core, urban village, were developed with distinct sets of associated land uses and design characteristics.

