The Greater Toronto Area’s Top Luxury Markets
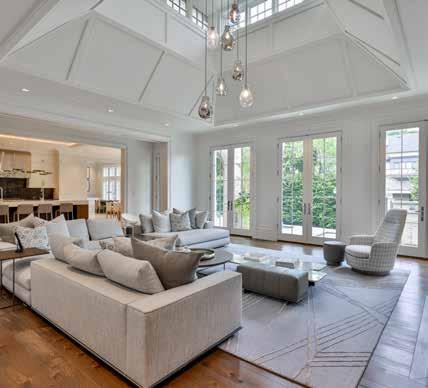
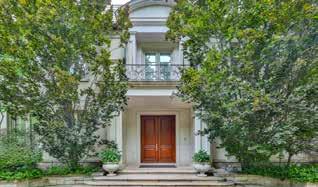
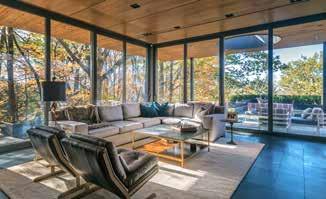
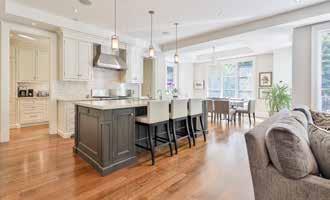
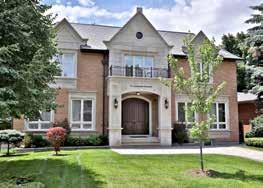
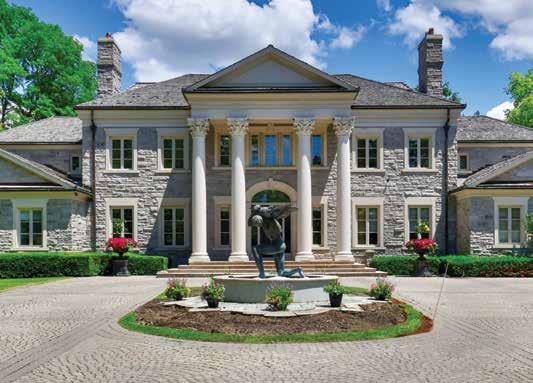
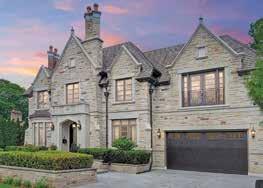
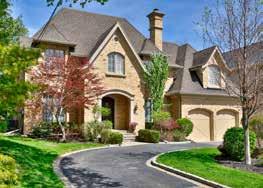
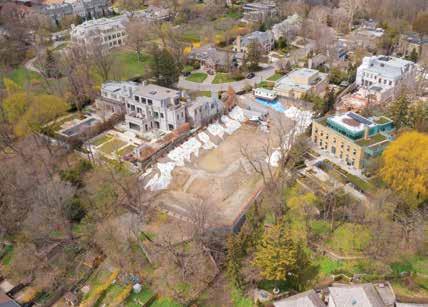
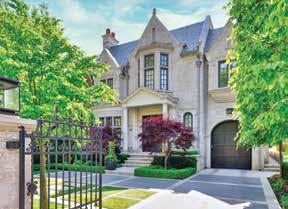
Bridle Path-Sunnybrook-York Mills, St. Andrews-Windfields-Hoggs Hollow (C12)
More than 150 freehold properties sold over $2 million in the Toronto Regional Real Estate Board’s C12 district comprised of the Bridle Path-Sunnybrook-York Mills and St. Andrew-Windfields-Hoggs Hollow in 2022, 56 of which moved for more than $5 million.
While the number of homes sold in the areas have declined year-over-year, prices have held up exceptionally well. In the St. Andrew-Windfields-Hoggs Hollow neighbourhoods, the 2022 average price over the $2 million price point sat at $4,202,941, up 10 per cent over the $3,803,987 reported in 2021. Sales over the $5 million price point were on par with year ago levels.
In the Bridle Path-Sunnybrook- York Mills area, average price over the $2 million mark has risen to $5,879,586 in 2022, an uptick of four per cent over the $5,680,087 reported in 2021.
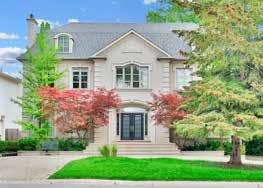
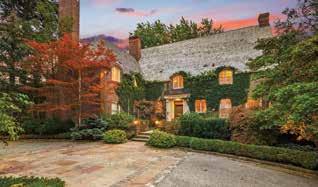
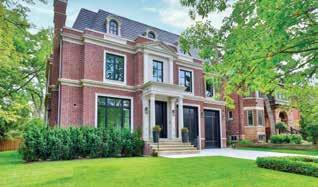
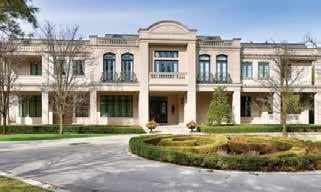
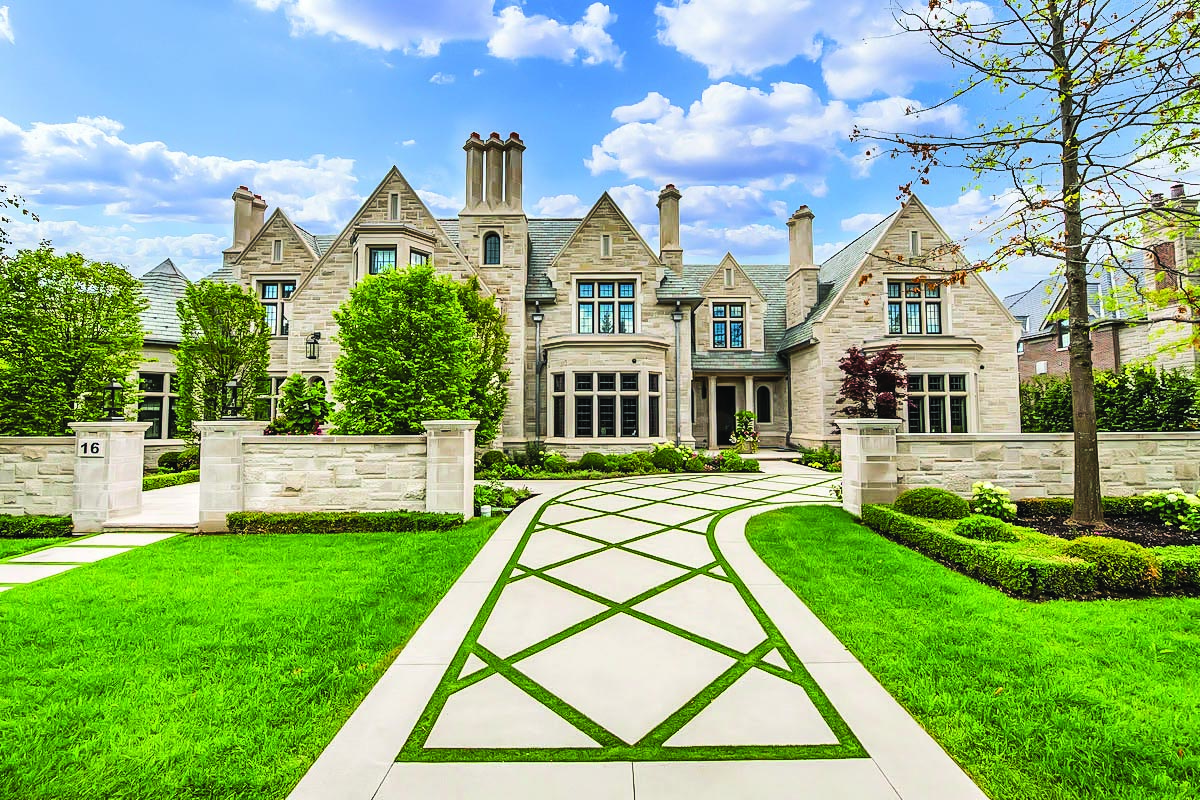
Not surprisingly, the area, which boasts some of the most spectacular properties in the Greater Toronto Area is the most expensive in the 416-area code. Many of the homes and estates that are found in the prestigious Bridle Path area are valued at well over $20 million.
Estate properties, larger homes, and generous lot sizes continue to attract buyers to the area. A good selection of properties can be found within C12 boundaries. Between the Bridle Path-Sunnybrook-York Mills and St. AndrewWindfields-Hoggs Hollow areas, there are 73 homes currently listed for sale over the $2 million price point. Of these, almost 35 per cent are listed under the $5 million price point.
10
ONE-OF-A-KIND
ST.
SOLD
RAVINE ESTATE WITH ENTERTAINER’S DREAM BACKYARD Offered at $17,500,000
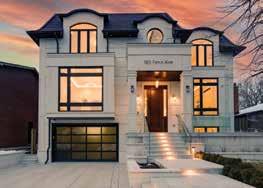
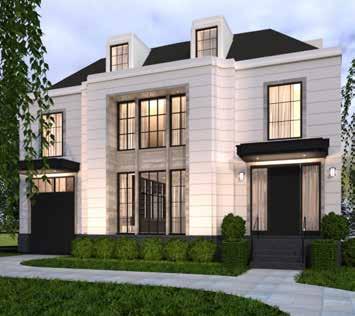
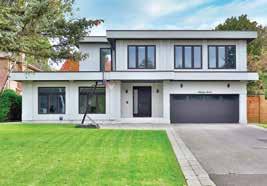
ANDREWS TRANSITIONAL Offered at $5,780,000
| 37 Rollscourt Drive Sold in five days!
Bridle Path-Sunnybrook-York Mills
Average Sold Price 2022 $5,879,586
Average Sold Price 2021 $5,680,087 4% Year-over-year
St.
Hollow
Average Sold Price 2022 $4,202,941
Average Sold Price 2021 $3,803,987 10% Year-over-year
11
January 1st - December 31st, 2022 vs. same period in 2021 2022 2021 % Change $2 million plus 58 101 -42.6% $3 million plus 51 83 -38.6% $5 million plus 33 49 -32.7% $7.5 million plus 8 15 -46.7%
Andrews-Windfields-Hoggs
January 1st - December 31st, 2022 vs. same period in 2021 2022 2021 % Change $2 million plus 94 131 -28.2% $3 million plus 63 84 -25.0% $5 million plus 23 23 0% $7.5 million plus 5 2 150.0%
SOLD | 2 Carnwath Crescent SOLD | 73 Fifeshire Road SOLD | 29 Berkindale Drive
SQ.FT. BRIDLE PATH MANSION WITH COACH HOUSE Offered at $27,000,000 SOLD | 69 Harrison Road Represented both the seller & buyer SOLD | 54 Heathcote Avenue Sold for asking price in one week!
GATED 18,276
Forest Hill South, Humewood-Cedarvale (C03)
Strong demand continues to exist for freehold properties within Forest Hill South and Humewood-Cedarvale, just two of the neighbourhoods located within the Toronto Regional Real Estate Board’s C03 district. The area offers up a good selection of freehold properties at virtually every price point, from starter homes in the Humewood-Cedarvale area to extravagant estates in the heart of Forest Hill.
Fifty-six homes sold over the $2 million price point in Forest Hill South in 2022, 24 of which sold for at or over $5 million and 6 were priced over $7.5 million. Average price (over $2 million) has remained relatively stable, despite the inflationary environment. Values in Forest Hill South in 2022 hovered at $4,792,162, a modest increase over the $4,682,484 reported in 2021.
Although young families continue to be drawn to the HumewoodCedarvale neighbourhood, just 25 homes sold over $2 million in 22, down from 32 one year ago. Sales over $3 million, however, were up 29 per cent in the area, with 9 properties changing hands in 2022, up from 7 in 2021, indicating some move-up activity.
Inventory levels remain a challenge in Humewood-Cedarvale, with just five properties currently listed for sale over the $2 million price point. Approximately 20 homes are available at $2 million plus in Forest Hill South.
Hill South
12
Forest
January 1st - December 31st, 2022 vs. same period in 2021 2022 2021 % Change $2 million plus 56 64 -12.5% $3 million plus 41 47 -12.8% $5 million plus 24 27 -11.1% $7.5 million plus 6 6 0% Average Sold Price 2022 $4,792,162 Average Sold Price 2021 $4,682,484 2% Year-over-year Humewood-Cedarvale January 1st - December 31st, 2022 vs. same period in 2021 2022 2021 % Change $2 million plus 25 32 -21.9% $3 million plus 9 7 28.6% $5 million plus 0 1 -100% $7.5 million plus 0 1 -100% Average Sold Price 2022 $2,879,130 Average Sold Price 2021 $3,033,341 -5% Year-over-year NEW FOREST HILL CONSTRUCTION Offered at $16,900,000
Rosedale, Moore Park (C09)
In 2022, sales over $2 million in the prestigious Rosedale-Moore Park area have softened by just over 30 per cent, compared to year-ago levels. Ninety-four homes over $2 million changed hands in 2022, down from the 136 sold during 2021.
With just 11 properties currently listed for sale over $2 million, many would-be buyers are hampered by lack of product, especially at the top end of the market. Sales of homes priced over $7.5 million are down by over 83 per cent from yearago levels, with just two homes sold at that price point in 2022, compared to twelve in 2021.
A dearth of sales at the top end of the market has likely contributed to softer values in Rosedale-Moore Park, with the average price over the $2 million price point now hovering at just over $3.95 million, down from close to $4.3 million one year ago. Just 11 properties are currently listed for sale over the $2 million price point.
Rosedale, Moore Park
January 1st - December 31st, 2022 vs. same period in 2021
Average Sold Price 2022 $3,950,650
Average Sold Price 2021 $4,317,584
-8% Year-over-year
13
2022 2021 % Change $2 million plus 94 136 -30.9% $3 million plus 66 87 -24.1% $5 million plus 18 43 -58.1% $7.5 million plus 2 12 -83.3%
SOLD | 11 Ormsby Crescent Represented the buyer
CHAPLIN ESTATES CONTEMPORARY Offered at $3,880,000
SOLD | 247 Forest Hill Road Represented the buyer
Yonge-St. Clair, Casa Loma, Annex (C02)
While sales over the $2 million price point have faltered year-over-year in the Toronto Regional Real Estate Board’s C02 district, the number of homes sold at higher price points, particularly in the soughtafter Annex area, have proven resilient.
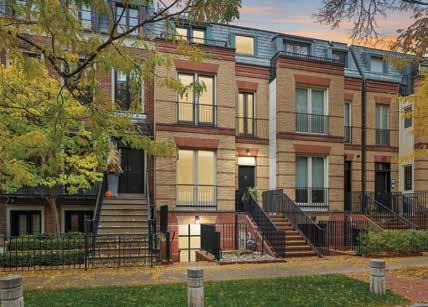
Thirty-eight freehold properties over $3 million changed hands in the Annex in 2022, an increase of just over 22 per cent from year-ago levels, while sales over $5 million have climbed steady. Revitalization of the area’s spectacular historic properties, especially in the area west of Avenue Rd. and north of Bloor St., has attracted many a buyer to this neighbourhood last year. Average price (over $2 million) has climbed four per cent over year-ago levels, rising to $3,419,236.
Higher-end properties in the Yonge-St. Clair area have also gained momentum, registering a nearly 17 per cent increase in the number of sales over $5 million in 2022 vs the year prior. Seven properties sold over the $5 million price point, an increase over the six sales in 2021. Average price is up one per cent to $3,251,393, rising slightly from $3,232,985 one year ago.
The number of properties sold over $2 million in the Casa Loma area have declined year-over-year, but the sale of three homes over $7.5 million have helped support average price. In 2022 values (over $2 million) hovered at just under $4.2 million. Listings remain scarce in the neighbourhood, with just 11 properties currently listed for sale over $2 million.
14
Yonge-St.
January 1st - December 31st, 2022 vs. same period in 2021 2022 2021 % Change $2 million plus 46 67 -31.3% $3 million plus 24 34 -29.4% $5 million plus 7 6 16.7% $7.5 million plus 0 0Average Sold Price 2022 $3,251,393 Average Sold Price 2021 $3,232,985 1% Year-over-year
Clair
SOLD | 114 Hazelton Avenue Represented both the seller & buyer
3/4 ACRES IN CASA LOMA ENCLAVE Offered at $25,000,000
January
Casa Loma
January 1st - December 31st, 2022 vs. same period in 2021
Average Sold Price 2022 $3,419,236
Average Sold Price 2021 $3,280,969
4% Year-over-year
Average Sold Price 2022 $4,172,778
Average Sold Price 2021 $3,475,526 20% Year-over-year
Leaside (C11)
Despite the current housing slowdown, Leaside continues to experience strong demand for properties priced over $3 million. Thirty-seven homes sold in 2022, up almost 20 per cent over the 31 sales posted one year ago. Three homes moved over the $5 million price point.
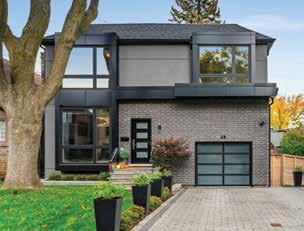
Average price (over $2 million) has followed in lockstep, with an eight per cent increase reported in 2022, bringing values to $3,087,312, up from just over $2.8 million one year ago.
Given solid demand for homes in the area and a shortage of available listings (just 4 currently available over $2 million), values should remain steady for the foreseeable future.
Leaside
January
Average Sold Price 2022 $3,087,312
Average Sold Price 2021 $2,854,663 8%
15
2021 % Change $2 million plus 80 94 -14.9% $3 million plus 37 31 19.4% $5 million plus 3 2 50.0% $7.5 million plus 0 0 -
1st - December 31st, 2022 vs. same period in 2021 2022
Year-over-year Annex
1st
2022 2021 % Change $2 million plus 75 82 -8.5% $3 million plus 38 31 22.6% $5 million plus 10 10 0% $7.5 million plus 1 2 -50%
- December 31st, 2022 vs. same period in 2021
SOLD | 48 Sharron Drive
2022 2021 % Change $2 million plus 27 64 -57.8% $3 million plus 20 28 -28.6% $5 million plus 6 9 -33.3% $7.5 million plus 3 3 0%
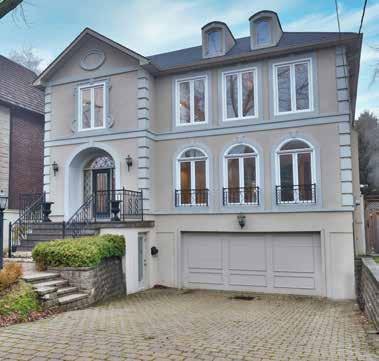
Bedford Park, Lawrence Park, Lytton Park, Forest Hill North (C04)
The highest number of sales over the $2 million threshold can be found within the boundaries of TRREB’s C04 district -- Bedford Park-Nortown, Lawrence Park North and South, and Forest Hill North. Collectively, more than 300 freehold properties changed in 2022, with most sales (137) occurring in Bedford Park-Nortown (where we saw one sale over $7.5 million in 2022, up from zero the year prior). Average price (over $2 million) in this area was up four per cent over 2021, now hovering at close to $3.2 million.
Homebuying activity in the upscale Lawrence Park (North and South) neighbourhoods have fallen short of year ago levels at most price points in 2022, yet average prices continue to hold relatively steady. Lawrence Park South reported a modest three per cent increase in the average price over $2 million, rising to just over $3.6 million while Lawrence Park North saw a two per cent uptick, bringing values close to $2.8 million. There are 22 properties currently listed for sale in Lawrence Park.
Tight inventory levels in Forest Hill North brought sales over $2 million down by 35 per cent in 2022. The decline in sales lead to a three per cent decline in average price, which now sits at approximately $2.85 million. There are 5 properties available for sale in the neighbourhood at present.
Bedford Park-Nortown
January 1st - December 31st, 2022 vs. same period in 2021
Lawrence Park North
January 1st - December 31st, 2022 vs. same period in 2021
16
2022 2021 % Change $2 million plus 137 199 -31.2% $3 million plus 63 80 -21.3% $5 million plus 9 9 0% $7.5 million plus 1 0 100% Average Sold Price 2022 $3,225,678 Average Sold Price 2021 3,091,475 4% Year-over-year
2022 2021 % Change $2 million plus 74 100 -26.0% $3 million plus 17 21 -19.0% $5 million plus 2 3 -33.3% $7.5 million plus 1 0 100% Average Sold Price 2022 $2,765,950 Average Sold Price 2021 $2,717,316 2% Year-over-year
Avenue
SOLD | 468 Cranbrooke
Park South
Average Sold Price 2022 $3,613,935
Average Sold Price 2021 $3,516,956 3% Year-over-year
Forest Hill North
Average Sold Price 2022 $2,853,725
Average Sold Price 2021 $2,946,914 -3% Year-over-year
17 Lawrence
January 1st - December 31st, 2022 vs. same period in 2021 2022 2021 % Change $2 million plus 89 149 -40.3% $3 million plus 51 76 -32.9% $5 million plus 11 21 -47.6% $7.5 million plus 2 2 0%
January 1st - December 31st, 2022 vs. same period in 2021 2022 2021 % Change $2 million plus 26 40 -35.0% $3 million plus 9 12 -25.0% $5 million plus 0 1 -100.0% $7.5 million plus 0 0 -
SOLD | 574 Deloraine Avenue
TEDDINGTON PARK STONE MANOR Offered at $4,680,000
SOLD | 176 Briar Hill Avenue
SOLD | 39 Chudleigh Avenue Represented the buyer
Banbury-Don Mills (C13)
Homebuying activity within the coveted Banbury-Don Mills neighbourhood has diminished year-over-year, with just 61 houses changing hands in 2022 over $2 million. Sales at the $2, $3 and $5 million price points fell short of year ago levels, but average price over $2 million in 2022 held stable at $3,303,183, up three per cent in comparison with the $3.2 million posted in 2021.
Banbury-Don Mills has traditionally provided younger buyers with more affordable detached housing options -- typically homes with more square footage and larger lot sizes --close to schools and amenities. With interest rates rising so rapidly in 2022, both buyers and sellers find themselves at a stalemate. Buyers are keeping their eyes open, but with just 21 properties listed for sale, it has been a real challenge.
Banbury-Don Mills
Average Sold Price 2022 $3,303,183
Average Sold Price 2021 $3,218,765 3% Year-over-year

18
December
period
2022 2021 % Change $2 million plus 61 85 -28.2% $3 million plus 29 38 -23.7% $5 million plus 5 6 -16.7% $7.5 million plus 1 0 100%
January 1st -
31st, 2022 vs. same
in 2021
SOLD | 15 Purling Place
DESIGNER BANBURY HOME Offered at $4,980,000
SOLD | 25 Denlow Boulevard
Luxury Condominiums (GTA)
The Greater Toronto Area’s condominium sector continues to demonstrate exceptional resilience considering current market conditions. Luxury sales were off last year’s breakneck pace by about 21 per cent, yet nearly 250 apartment and townhouse condominiums changed hands over the $2 million price point in the GTA in 2022, with most of those sales occurring the Toronto’s downtown core.
Empty nesters and retirees downsizing from large, detached homes contributed to sales over the $3 million threshold, with 83 properties reported sold in 2022, down approximately 19 per cent from year ago levels. At $5 million plus, there were 13 homes that changed hands, down from the 21 sales in 2021. The most soughtafter areas for luxury condominiums over $3 million remain constant -- the Annex/Yorkville (22), the Bay St. Corridor (11), Yonge-St. Clair (10), and Rosedale-Moore Park (6).
Average price of luxury condominiums has also held up well year-to-date, with values edging close to $3 million in 2022, down two per cent over values for the same period in 2021.
Luxury Condominiums
January 1st - December 31st, 2022 vs. same period in 2021
Average Sold Price 2022
$2,954,333
Average Sold Price 2021 $3,000,203
19
-2%
2022 2021 % Change $2 million plus 247 314 -21.3% $3 million plus 83 103 -19.4% $5 million plus 13 21 -38.1% $7.5 million plus 1 3 -66.7%
Year-over-year
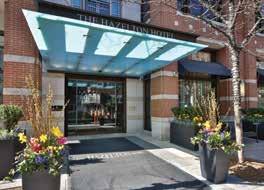
STUNNING HAZELTON HOTEL CONDO Offered at $9,990,000
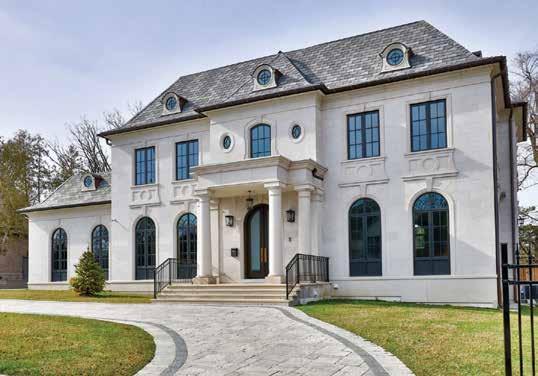
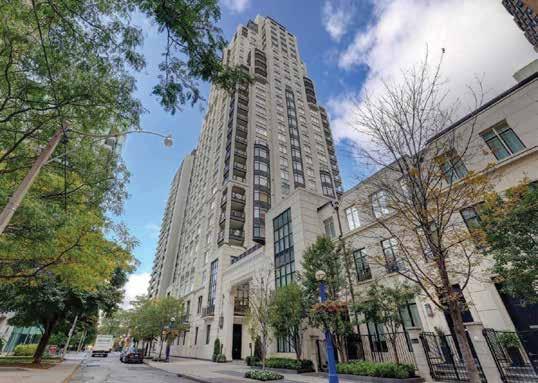
SPECTACULAR 1 ST THOMAS STREET Offered at $7,995,000
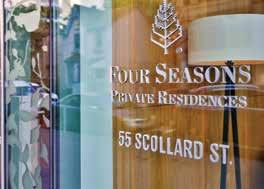
FAMED FOUR SEASONS RESIDENCES Offered at $3,995,000
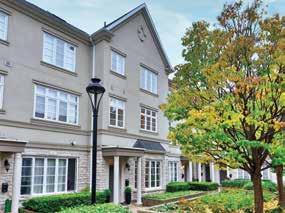
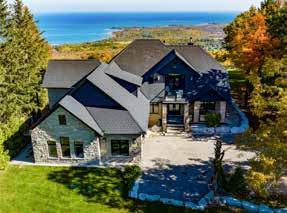
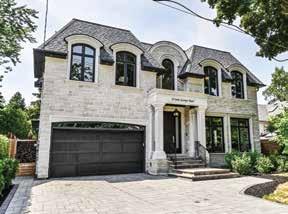
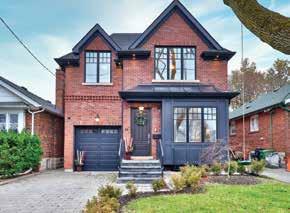
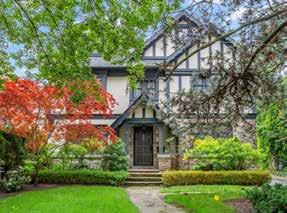
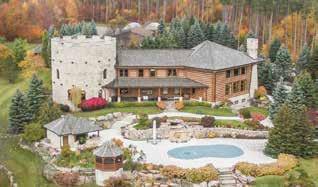
YORK MILLS CONTEMPORARY Offered at $4,875,000 ARCHITECTURALLY SIGNIFICANT HOME Offered at $3,000,000 Featured Homes PERFECTION IN LYTTON PARK Offered at $5,499,000 WINDFIELDS DESIGNER RESIDENCE Offered at $6,180,000 FOREST HILL MASTERPIECE Offered at $13,990,000 SPECTACULAR ROLLSCOURT CUSTOM Offered at $5,680,000 10 ACRE BLUE MOUNTAIN ESTATE Offered at $10,200,000 AVENUE ROAD OPPORTUNITY Offered at $3,298,000 UNRIVALLED IN HUMBER VALLEY Offered at $4,829,000 LUXURY HOGGS HOLLOW TOWNHOME Offered at $3,500,000 ST. ANDREWS EURO-INSPIRED Offered at $4,480,000 20 TIMELESS LEASIDE RESIDENCE Offered at $3,199,000
RE/MAX Dominates Luxury
When it comes to luxury listings, RE/MAX’s network, dedicated platforms, and marketing reach find exactly the right buyer – no matter where they reside.
Our Global Presence
110+ Countries | 8,629 Offices | 40+ Languages
V.S.
THE NEXT LARGEST INTERNATIONAL LUXURY REAL ESTATE COMPANIES
2 nd LARGEST 70 Countries 880 Offices
3 rd LARGEST 60 Countries 4,000 Offices
4 th LARGEST 45 Countries 1,200 Offices
Positioned as the only real estate company with true global reach, the Global RE/MAX portal, global.remax.net, facilitates listing marketing in nearly 100 countries and 40+ languages, from coast to coast and beyond.
#1 On Google: Barry Cohen & RE/MAX
RE/MAX’s online advantage, across the planet, is miles ahead of the competition, due to a marketing budget that is bigger than all other competitors combined. Additionally, Barry Cohen Homes is organically found at the top of Google for Toronto Luxury Real Estate key search words, allowing us the ability to reach the most amount of buyers for your home.
Real Estate Brokerage Google Search Trends Comparison 2021 - WORLD WIDE
T.O.’s TOP 5
21
Brokerage
RE/MAX Brokerage #2 Brokerage #3 Brokerage #4
2022 June 2022
2022
2023 100 75 50 25 0
#5
February
October
January
HOMES & ESTATES
#1 I n Toronto for Luxury Homes, since 2008
Sales Higher Than $10,000,000 (January 01, 2017 to December 31, 2022) Cohen Homes & Estates $275,795,900 28 $113,956,668 $99,740,000 $22,700,000 5 9 5 $90,003,681 $24,550,000 $46,048,000 $203,960,349 $124,290,000 $68,748,000 $120,705,900 $396,501,800 Competitor A Competitor B Competitor C Listings Volume Total Units Buyer Volume Total Volume Sales Higher Than $7.500,000 (January 01, 2017 to December 31, 2022) Cohen Homes & Estates $442,197,400 58 $113,956,668 $134,340,000 $72,393,800 6 15 14 $99,003,681 $41,950,000 $71,194,800 $212,960,349 $176,290,000 $143,588,600 $217,362,400 $659,559,800 Competitor A Competitor B Competitor C Listings Volume Total Units Buyer Volume Total Volume Sales Higher Than $5,000,000 (January 01, 2017 to December 31, 2022) Cohen Homes & Estates $856,878,998 149 $208,504,000 $219,893,800 $171,481,688 58 35 36 $157,326,000 $78,650,000 $100,194,800 $365,830,000 $298,543,800 $271,676,488 $356,367,400 $1,213,246,398 Competitor A Competitor B Competitor C Listings Volume Total Units Buyer Volume Total Volume Sales Higher Than $3,000,000 (January 01, 2017 to December 31, 2022) Cohen Homes & Estates $1,322,317,566 325 $672,000,518 $387,553,000 $381,250,090 248 153 112 $394,295,720 $214,116,888 $121,203,018 $1,066,296,238 $601,669,888 $502,453,108 $560,564,200 $1,882,881,766 Competitor A Competitor B Competitor C Listings Volume Total Units Buyer Volume Total Volume 22
Source: Data complied from The Toronto Real Estate Board, by REDATUM.
COHEN


23 Why More Sellers Choose Us? Most importantly, we represent More Sellers than any competitor which allows us to generate More Buyers, more offers, higher prices, and ultimately More Sales! Barry’s Market Insight Price Validation from Brand Reputation Custom & Effective Marketing Strategies 11 Magazine Publications Client Concierge for Staging & Repairs Multicultural Team Forbes Global Reach Exclusive to BCH Unrivalled Negotiation Strategies #1 Team & Individual in Central Toronto Unparalleled Service Our Team Farzad
Sales Representative Sasha
Sales Representative Nima
Sales Representative Simone
Tyler
Sales Representative
Sales Representative Justin
Barry Cohen President & Broker Nigel
Lance
Of Record Patricia
Sales Representative Natasha
Sales Representative Diana
Aaron
Sales
Evelyn
Ghazi
Firestone
Hafezian
Chen Broker
Cohen
Olga Donchenko
Cohen Broker
Wain Broker
Stoute Broker
Sun
Omrin
Mendonca Broker
Luftspring
Representative
Adam
Sajjadian Broker
Li Broker
Toronto’s Leader in Luxury
No one has sold more luxury real estate in this decade than Cohen Homes & Estates. * The reason is obvious. In addition to our unmatched negotiation skills, we provide the greatest exposure for your home. By utilizing the very latest in print and online marketing strategies enhanced by our exclusive international affiliations, more local and foreign buyers see our homes. Simply put, we do more for our clients than our competition. The proof is in the numbers. #1
*
309 York Mills Road, Unit 7 Toronto ON M2L 1L3 | Trademark Barry Cohen Homes. Each office independently owned and operated. *Based on Barry Cohen Homes Sales on TRREB. Not intended to solicit buyers or sellers currently under contract with another brokerage. REALTRON BARRY COHEN HOMES INC., BROKERAGE 416.223.1818 View our collection of fine homes virtually at www. BARRYCOHENHOMES .com HOMES & ESTATES COHEN
in Toronto For Homes Sold $3,000,000 - 35,000,000, since 2008