8 minute read
B. The Subsidized and Public Rental Markets


B. The Subsidized and Public Rental Markets
This section will demonstrate that there is a segment of the population that does not have the income to purchase or rent housing at current market prices. This segment of the population relies upon either subsidized private housing or public housing to have a place to live. The need for subsidized or public housing is frequently thought of as an “urban” problem, but there is a significant need throughout the entire region as we will show shortly.
We begin this analysis with a focus on housing affordability. More specifically, we compare the all-in cost of owning or renting to household income. Table III.8 reports that as of 2022 the average “C” grade apartment in the Charlotte area rents for $1,149/month. The U.S. Census Bureau reports average household utilities in the region in 2022 as being $376 (when adjusted for one year of inflation).10 This means the total housing cost for the household renting the average “C” unit would be $1,525/month. To meet the normal definition of being affordable, the homeowner must be able to pay their rent and utilities with no more than 30% of their gross income. This implies a monthly household income of $5,083/month, or $60,992 annually for the average “C” level apartment for it to be considered affordable.
There are large segments of the regional population who cannot meet this financial hurdle. Recall that Figure II.8 shows that for the entire eight-county Charlotte region in 2022, approximately 360,667 households (34% of all households) had incomes less than $50,000. Every one of those households would be considered cost-burdened renting the average “C” level apartment. Consider that Figure II.10 also shows that nearly 81,779 households (7.8% of all households) in the region have annual household income of less than $15,000. Essentially, renting a “C” grade apartment and paying utilities would use up their entire income.
Therefore, a substantial number of households need some type of housing assistance. But before beginning our discussion of subsidized or public housing, it is worth clarifying a few terms. Every year the U.S. Department of Housing and Urban Development works in conjunction with the U.S. Census Bureau to determine the area median income, otherwise known as AMI, for a family of four in the region. When a household applies for housing assistance, the level of
10 Utilities rates are from the U.S. Census Bureau Table 1800. Region of residence: Annual expenditure means, shares, standard errors and coefficients of variation, Consumer Expenditure Surveys, 2021 PDF (bls.gov) for the southern United States in 2021. The State of Housing in Charlotte Report 2022
assistance for which they are eligible is a function of the number of people in the household and the household income relative to the AMI. Typically, families become eligible for some assistance at the 80% of AMI level, but the largest levels of assistance occur at the low-income (50% of AMI) and very low-income (30% of AMI) levels. Table IV.2 reports the Charlotte region AMI and the 50% and 30% AMI levels for 2005 through 2022.
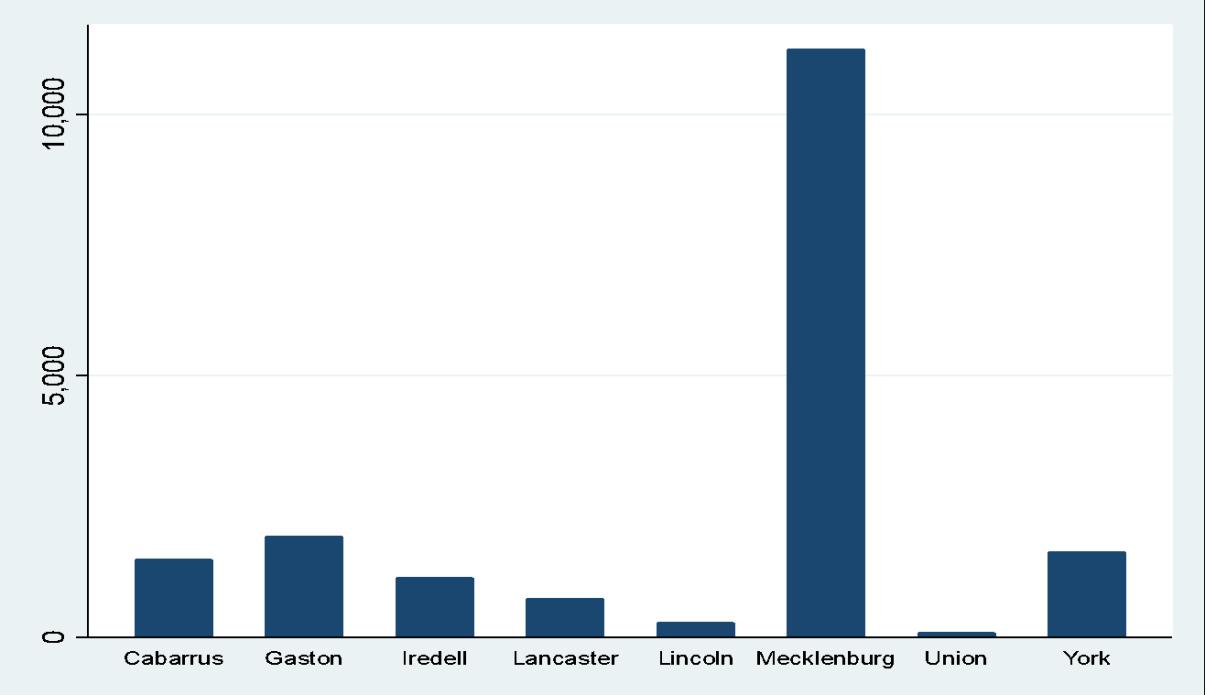
Figure IV.8 LIHTC Units by County 2022
The State of Housing in Charlotte Report 2022
Table IV.2. Annual Incomes and Maximum Amount Household Can Devote to Housing Without
Being Cost-Burdened for Various Percentages of the Charlotte AMI by Year 2005-2022. Data are from U.S. Department of Housing and Urban Development website at http://huduser.gov. 100% of Charlotte Region AMI 50% of Charlotte Region AMI 30% of Charlotte Region AMI Annual Income Monthly Housing Annual Income Monthly Housing Annual Income Monthly Housing 2005 $61,800 $1,545 $30,900 $773 $18,540 $464 2006 $64,400 $1,610 $32,200 $805 $19,320 $483 2007 $60,200 $1,505 $30,100 $753 $18,060 $452 2008 $64,300 $1,608 $32,150 $804 $19,290 $482 2009 $66,500 $1,663 $33,250 $831 $19,950 $499 2010 $67,200 $1,680 $33,600 $840 $20,160 $504 2011 $67,500 $1,688 $33,750 $844 $20,250 $506 2012 $68,500 $1,713 $34,250 $856 $20,550 $514 2013 $64,100 $1,603 $32,050 $801 $19,230 $481 2014 $64,200 $1,605 $32,100 $803 $19,260 $482 2015 $67,200 $1,680 $33,600 $840 $20,160 $504 2016 $67,000 $1,675 $33,500 $838 $20,100 $503 2017 $70,700 $1,768 $35,350 $884 $21,210 $530 2018 $74,100 $1,853 $37,050 $926 $22,230 $556 2019 $79,000 $1,975 $39,500 $988 $23,700 $593 2020 $83,500 $2,088 $41,750 $1,044 $25,050 $626 2021 $84,200 $2,105 $42,100 $1,053 $25,260 $632 2022 $96,300 $2,408 $48,150 $1,204 $28,890 $722
Recall that the amounts in the “Monthly Housing” column include both the actual housing payment and utilities. Therefore, a household at 100% of AMI for the Charlotte region could afford to pay $2,408 for rent and utilities in 2022. Again, assuming an average utility burden of $376, this means the household could pay as much as $2,032 in rent. This places the household well into the private rental market. Unfortunately, utilities do not scale with rent or income, so a person at 50% of AMI would likely still spend around $376 for utilities. This leaves them with $828 with which to pay rent. This places them approximately 39% below the average to rent a “C” class apartment in the region. This will make it very difficult for them to afford private apartments in the Charlotte region. For people at 30% of AMI, they can devote $722/month toward all housing costs, which would be split $376 toward utilities and $346 per month toward rent. There are virtually no units available in the private marketplace at that price level. Households at the 50% and 30% levels will have to rely upon either subsidies to find private apartments or public housing.
The State of Housing in Charlotte Report 2022
Within the subsidized and public housing markets there are three main programs: the Low Income Housing Tax Credit program, the Section 8 rental assistance program and publicly owned housing units. The following sections briefly discuss and analyze the first two of these programs within the Charlotte region.
The Low Income Housing Tax Credit is a federal program designed to encourage private investment in affordable rental housing for low-income households. The tax credits are created through the IRS and allocated to state housing credit agencies based on the population of the state. Project sponsors (i.e. developers) are given a tax credit in exchange for making a certain percentage of the units in the development available to low income renters.11 These tax credits can be transferred to investors and are typically used to attract equity financing for the deal. These affordable units are rent-restricted in that the maximum amount of rent that can be charged is equal to 30% of the relevant AMI, less utilities. The rent restrictions are required to be kept in place for 30 years (although owners can leave the program after the first 15 years if granted regulatory relief), and the tax credits can be recaptured if the restrictions are not honored during the first 15 years. The U.S. Department of Housing and Urban Development is involved in determining the AMI on an annual basis and for adjusting it based on the number of people in each household.
The LIHTC program has been used extensively throughout the country, including in the Charlotte region. Figure IV.8 shows the distribution of LIHTC units by county.12 We note that while the vast majority of LIHTC units are in Mecklenburg County, some counties have a higher proportion of LIHTC units than they do of general apartments. For example, Gaston County has 1,937 LIHTC units, which is 17.2% of the 11,251 LIHTC units that Mecklenburg has. As shown in Figure IV.2, CoStar reports that Gaston County has 12,852 total apartment units, or only 8% of the 160,600 units that Mecklenburg has. A similar result holds in Cabarrus County.
11 Sponsors must agree to devote, at a minimum, at least 40% of the units to people earning 60% of AMI or less, or 20% of their units to people earning 30% of AMI or less. 12 As of the date of this report, LIHTC data are available only for projects placed in service through 2020. Per the HUD website, data for properties placed in service during 2021 will be added to the database in the spring of 2023. The State of Housing in Charlotte Report 2022
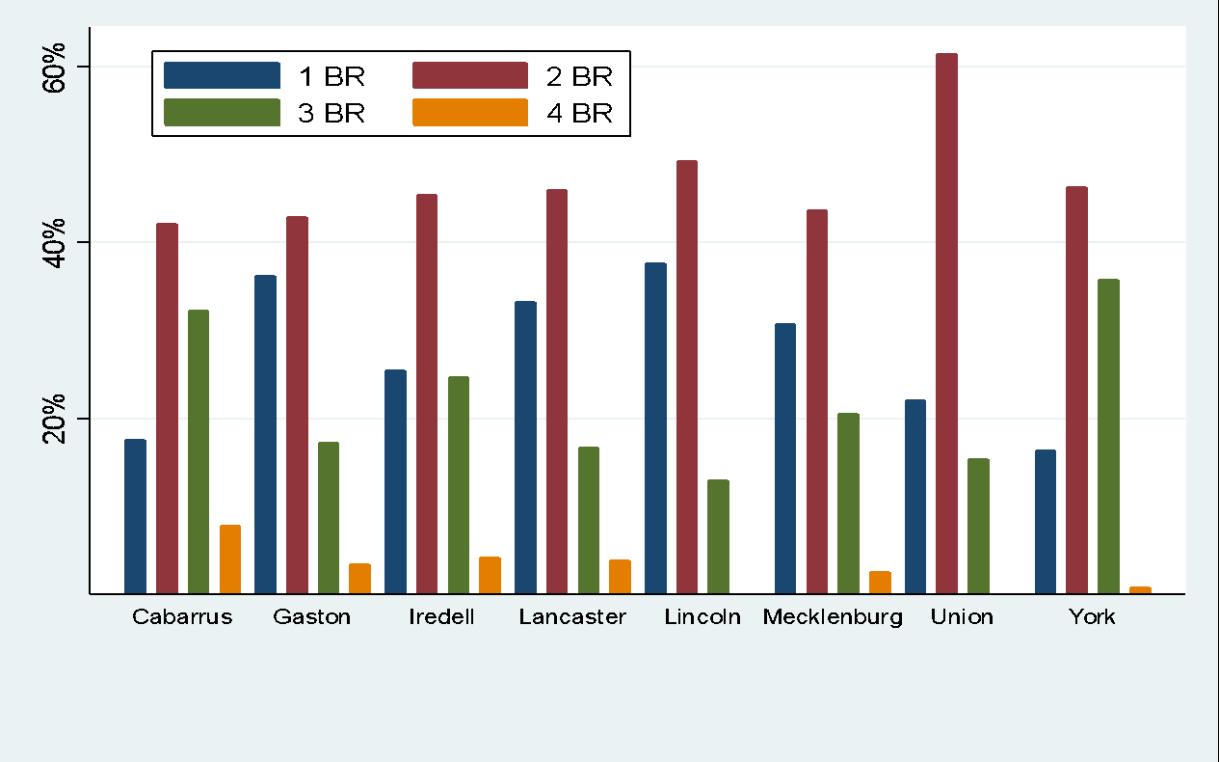
Figure IV.9 shows the distribution of unit sizes across each county. This distribution is essentially the same as the distribution CoStar reports for non-subsidized units, although the subsidized market is skewed toward having more bedrooms, as it has 9.7% fewer one-bedroom units while having 11.3% more three-bedroom units on average.
Figure IV.9 Distribution LIHTC Units by Size 2022
The Section 8 program is another program that seeks to leverage the private market to provide affordable housing to low-income residents. Section 8 is a federal housing assistance program that provides direct assistance to certain low-income tenants. Although ultimately funded through HUD, Section 8 programs are administered at the local level by public housing authorities. The aid is given to the tenant in the form of a voucher, which the landlord then redeems for cash. The amount of aid is enough to allow the tenant to spend no more than 30% of their income on rent plus utilities. Vouchers may be based on the individual tenant, in which case their voucher follows them should they move. These are known as Housing Choice Vouchers. Alternatively, vouchers may be tied to the property and not to the tenant. This essentially means the voucher does not follow the tenant should they leave. These are referred to as Project-Based Vouchers. HUD
The State of Housing in Charlotte Report 2022
maintains a database of projects across the entire country that have contracts with HUD or with public housing authorities for project-based vouchers.
Figure IV.10 shows the distribution of those projects within the Charlotte region. This distribution shows again that the need for low-income housing is spread throughout the region. Even though Mecklenburg County has the highest absolute number of these project-based voucher contracts, all the other counties such as Cabarrus, Gaston, Iredell and York have significant inventory as well.
b.
Figure IV.10 Charlotte Region Housing Voucher Contracts by County 2022

The State of Housing in Charlotte Report 2022


