3 minute read
F. Cost Burdens


indicating that, in those MSAs, buying is more favorable as compared to Charlotte. However, Charlotte has a modest growth rate of the Price-to-Rent Ratio of 4.78%.
At the national level, the results are more dramatic. Figure V.10 plots these ratios for each of the national competitor MSAs. The Denver, Portland and Sacramento MSAs have much higher ratios than Charlotte, indicating that renting is significantly more favorable, relative to purchasing a home, in those locations than in Charlotte. In contrast, San Antonio and Tampa have ratios lower than Charlotte, indicating a more favorable environment for home buying there than in Charlotte. Again, keep in mind that these are just relative measures. As shown in Figures V.4 and V.8, both median home prices and median rents are more expensive in Denver, for example, than in Charlotte. The Price-to-Rent Ratio tells us that given rents and prices in both Charlotte and Denver, the environment for renting in Denver is more favorable than in Charlotte.
c. F. Cost Burdens
One of the challenges facing any region is the degree to which its residents are cost-burdened when obtaining housing. As discussed in Section III, the standard definition of being costburdened is spending more than 30% of one’s gross income on housing costs, including utilities.
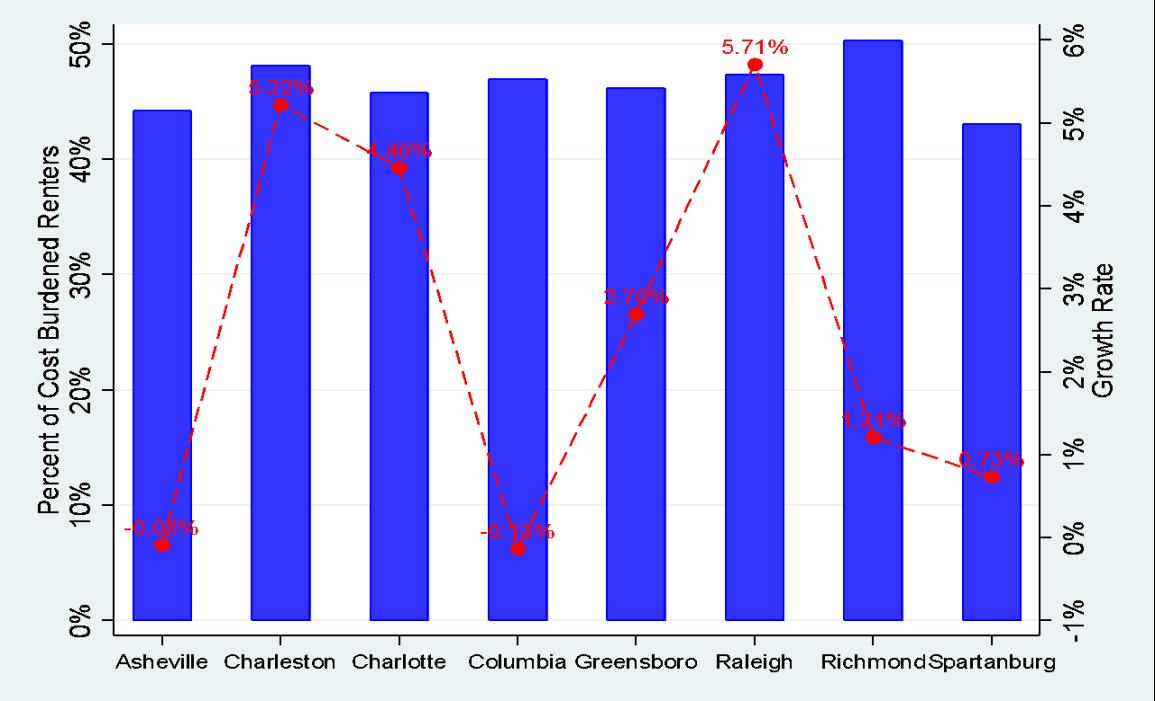
We begin by considering the proportion of renters in each region that are cost-burdened. Figure V.11 shows the percentage of cost-burdened renters for regional competitor MSAs. For the Charlotte MSA, about 45.8% of all renters are cost-burdened. Perhaps more surprising is that this is the third-best ratio in the data set, with only Asheville and Spartanburg having lower percentages of cost-burdened renters. However, Charlotte has one of the highest growth rates in the percentage of cost-burdened renters.
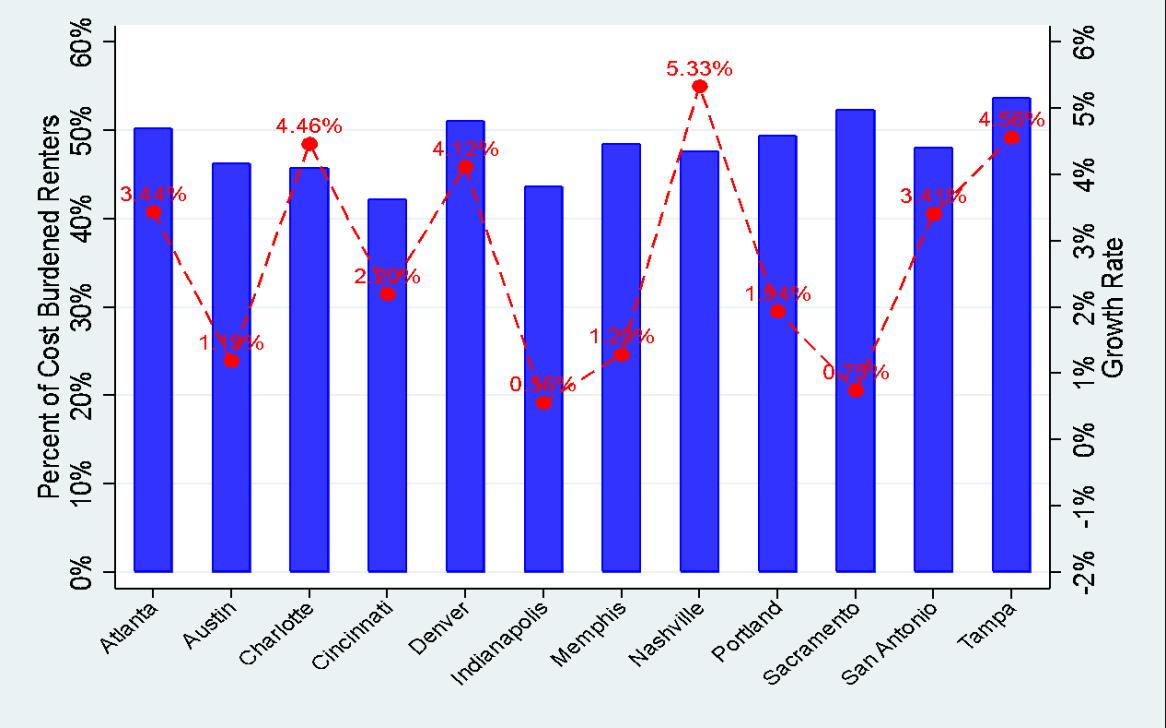
Figure V.12 shows the same measure for the national MSA competitor set. Again, relative to most of its peer cities, the Charlotte MSA has one of the lower cost-burdened rates, although it is still high in absolute terms. Atlanta, Denver, Sacramento and Tampa have more than 50% of their renters meeting the definition of being cost-burdened. Only Cincinnati has a lower percentage of cost-burdened renters than the Charlotte MSA.
The State of Housing in Charlotte Report 2022
It is also possible to construct a similar measure for homeowners, that is, to determine what percentage of homeowners pay more than 30% of their gross income toward housing expenses. One would expect this number to be relatively low because most lenders will not originate mortgages where the monthly payment is more than 28% of the borrower’s income. Still, conditions can change over time, especially with respect to income. Additionally, a household could take on a second mortgage after the origination of the first loan, increasing their total housing expense above the 30% cost-burdened level.
Figure V.13 presents the percentage of cost-burdened homeowners for the regional competitor MSAs. The percentages are much lower than renters. The Charlotte MSA has the second-lowest percentage of cost-burdened homeowners, with only Spartanburg having a lower rate.
Figure V.11 Regional Competitor MSAs Cost-Burdened Renters 2021 and Growth 2019 to 2021
The State of Housing in Charlotte Report 2022
Figure V.12 National Competitor MSAs Cost-Burdened Renters 2021 and Growth 2019 to 2021
Figure V.13 Regional Competitor MSAs Cost-Burdened Homeowners 2021 and Growth 2019 to 2021
The State of Housing in Charlotte Report 2022
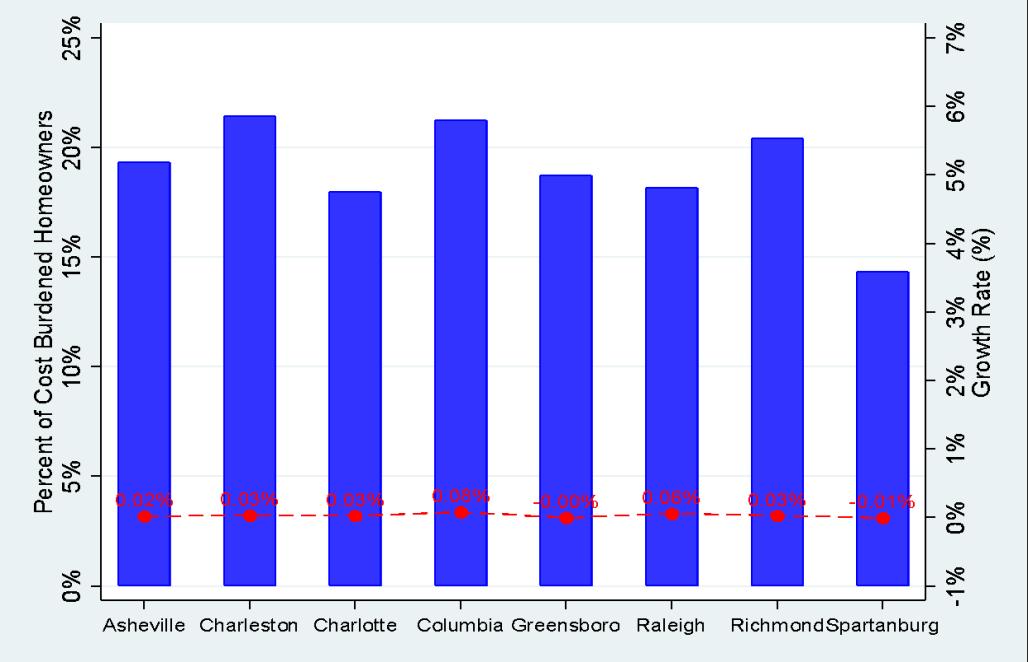
Figure V.14 National Competitor MSAs Cost-Burdened Homeowners 2021 and Growth 2019 to 2021
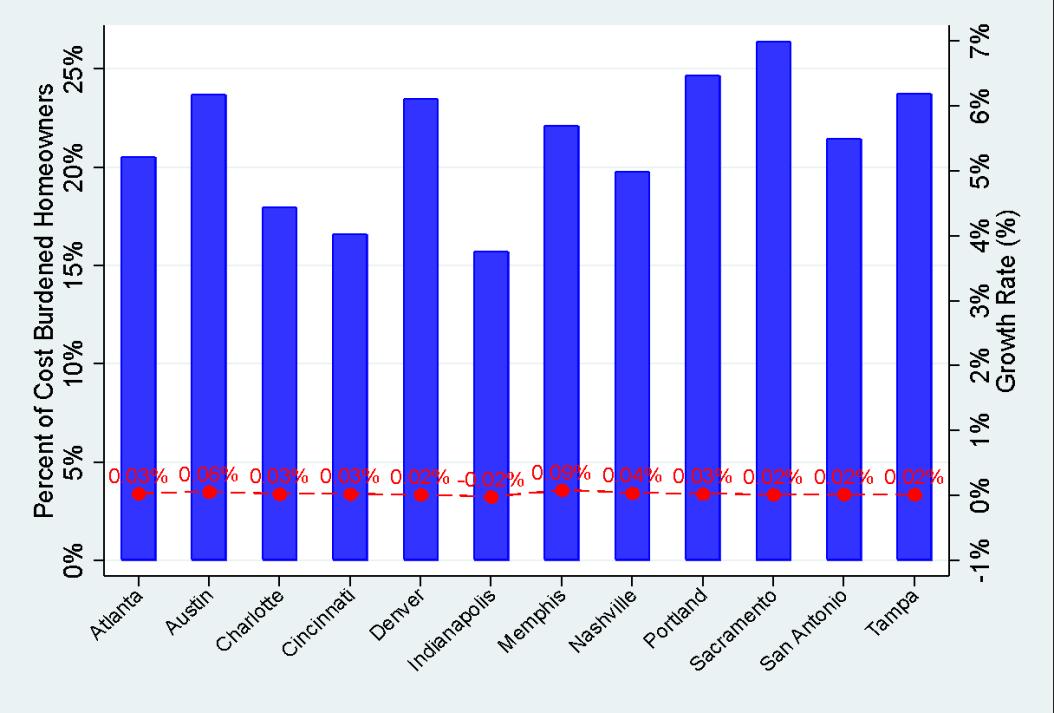
Figure V.14 presents the same metric for national competitor cities. As was the case with the regional competitor MSAs, the percentage of cost-burdened homeowners is lower in every other
The State of Housing in Charlotte Report 2022


