Hotel SA August 2020

Page 1

T H E O F F I C I A L P U B L I C AT I O N O F T H E A U S T R A L I A N H O T E L S A S S O C I AT I O N ( S A B R A N C H ) A U G U S T 2 0 2 0

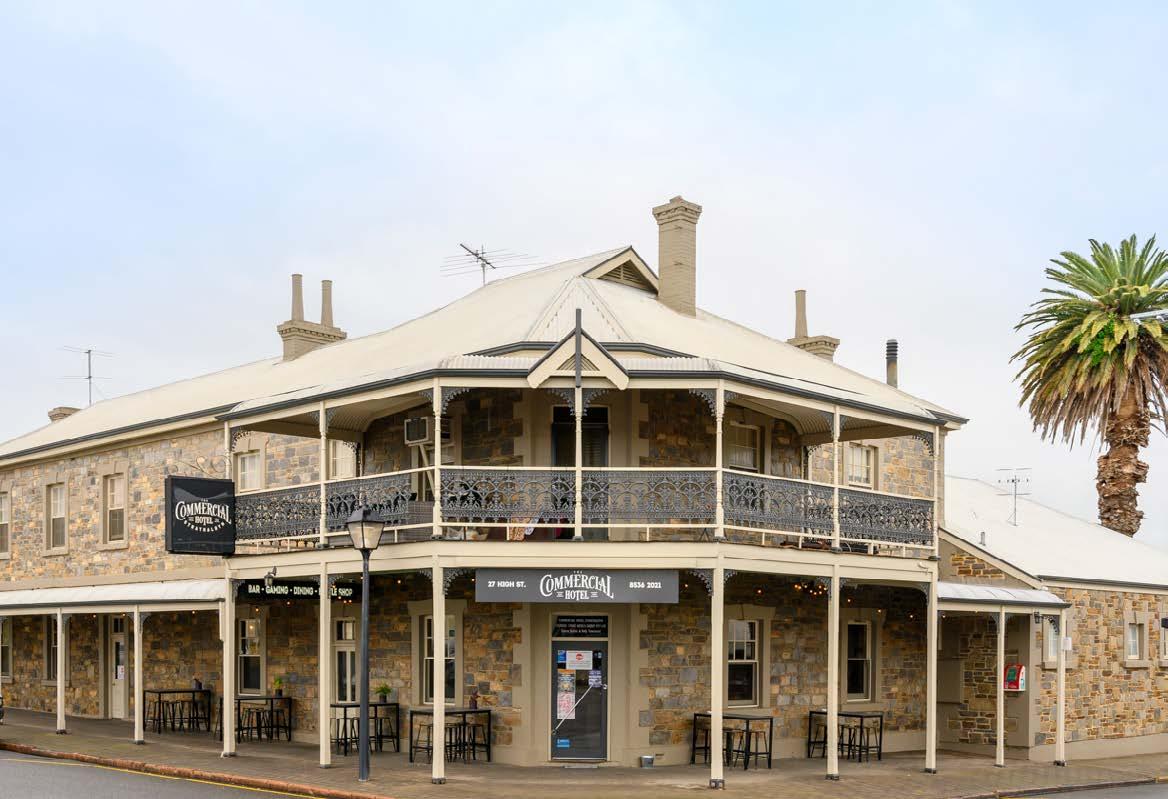
THE PLAYFORD I N S I D E A Q UA R A N T I N E H OT E L THE COMMERCIAL N E G OT I AT I N G T H E COV I D -1 9 C R I S I S

WWW.BOYLEN.COM.AU

WWW.AH ASA.ASN.AU


We’re Here for You

Our industry faces an unprecedented challenge in COVID-19. We’ve developed a central Resource Hub to help our communities navigate the sea of information and find the critical resources that can help them to weather this storm. The Hub is for everyone – it’s free and you don’t need to sign up for anything to access it. perks.com.au/covid19 (08) 8273 9300 2 | Hotel SA | W W W . A H A S A . A S N . A U

Back to Contents


AUGUST 2020 C O N T E N T S

09 Inside a Quarantine Hotel

The Playford on North Terrace was home to more than 400 returned international travellers undergoing strict quarantine.

19 The Commercial’s Foresight and Flexibility a Game-Changer

One thing we have learned from Covid-19 is that sometimes a pub doesn’t have to be open for the community to feel welcomed. That’s the mantra Commercial Hotel publican Stacey Butler took with her into the pandemic shutdown. I N

T H I S

Generosity of Corporate Partners

I S S U E

04 From the President 06 From the General Manager

29 It’s Time to Act - 2020 Hotel Industry Awards for Excellence

09 The Playford: Inside a Quarantine Hotel

30 Annual Wage Review Decision 2019-2020

13 Matthews Family Acquires Hotels for Next Generations

33 AHA|SA Corporate Partner News

14 Knowledge is Power

36 Winners and Losers During the Great Recession

16 One for the Road with Vaughany

47 AHA|SA Events 2020

19 The Commerical’s Foresight and Flexibility a Game-Changer

48 Gaming Care

22 Discounting with Dignity - and a Plan 24 Report Proves Benefit of Government Stimulus for Hospitality and Accommodation 25 Generosity of Corporate Partners Will Not Be Forgotten

25

49 AHA|SA Corporate Partner Directory 50 AHA|SA Corporate Partners 2020-2021 51 AHA|SA Licensee Transfers, New Members, Office Holders and Publisher Details

Many corporate partners went “above and beyond” to help hotels during restrictions.

30 Annual Wage Review

On 19 June 2020, the Fair Work Commission’s Annual Wage Review Panel handed down their decision in the 2019-20 Annual Wage Review.

W W W . A H A S A . A S N . A U

| Hotel SA | 3


From the President DAVID BASHEER – AHA|SA PRESIDENT

STOP PRESS 3/8/2020: The AHA|SA understands the rationale behind Monday’s announcement to ban stand-up drinking in hotels. We don’t want to head down the path of Victoria, where health concerns are massive and our colleagues are under great financial and emotional pressure. On that basis, we are happy to throw our support behind the SA Government’s cautious approach.

JOBKEEPER 2.0 NEEDS FINE TUNING There was a collective sense of relief in the business community when JobKeeper 2.0 was announced. The Federal Government initiative will provide a lifeline for many of our members, in particular for the accommodation sector which has been brought to its knees by the closure of borders and international shutdowns. However, some adjustments are required for it to be fair, equitable and effective for the much-need economic rebound. The AHA|SA is concerned that the eligibility strictures for JobKeeper 2.0 will not provide the intended help for hotels suffering long-term shutdowns, which is something we are witnessing in Victoria. Given the length of forced shutdowns and the nature of our highly casualised, mobile and often seasonal workforce - we are seeing the continuity of employment starting to break down.

It is a far more palatable measure than a blanket reduction in hotel capacities. However, this restriction will put another dent in industry confidence and certainty. It fuels concerns as to what may happen next and highlights how vulnerable we are to circumstances beyond our control. A precedent has been clearly set, in which closing or curtailing a business is a solution to health concerns. It affects people, families and livelihoods.

Consider the following: • Reset Provision: As JobKeeper 2.0 is only payable for those employees who were with the employer on 1 March 2020, this would decrease the assistance to those businesses that have been shut down the longest as they are trying to re-open. There is a real concern that when those businesses do re-open, their JobKeeper-eligible staff may have already moved on. We are requesting the Government to provide a “re-set provision” of JobKeeper employee eligibility for businesses which have endured extended periods of shutdown • Head Count Incentive: As we lose staff, the best mechanism to incentivise businesses to employ more staff is to base JobKeeper around a head count. Under this scenario, if we lose an employee, we can employ a new person under JobKeeper rules – and our headcount stays the same • Qualifying Period: A further refinement

4 | Hotel SA | W W W . A H A S A . A S N . A U

The 26,000 people our industry employs in SA will once again be the innocent economic victims of this health crisis. Staff who were booked to work at cocktail functions, wedding receptions, birthday parties and many other gatherings will now have this work cancelled. So for the sake of our business models and the people we employ, hotels need to understand how quickly this decision will be reviewed and the criteria for review.

would be the 12-month qualification period, from March 1 2019, for casuals. If we are fair dinkum about reducing Australia’s burgeoning unemployment numbers, casuals who have now completed 12 months should be included in JobKeeper. • JobKeeper 2.1? What happens to a business that no longer meets the reduction in turnover test and is taken off JobKeeper, only to suffer another enforced lockdown? This business will not qualify for JobKeeper 2.0 and will have to stand down its entire staff

SKILLS SHORTAGES REQUIRE CHANGE OF THINKING When hoteliers are asked to identify the five toughest issues they face, most would nominate skills shortages in their list. It is a major issue for metropolitan venues and a an even greater impediment for country venues. While the issue covers most jobs in our industry, it is chefs and cooks that are the critical trades. Back to Contents


“...we are happy to throw our support behind the SA Government’s cautious approach.”

To the credit of current State and Federal Governments, they have made it a focus by investing more into training and encouraging employers to hire more apprentices and trainees. However, the brutal reality is that these initiatives are not achieving the required results. A critical problem is that the cooking apprenticeship no longer meets the needs of Gen Y (and many from Gen X as well). We are operating within an archaic arrangement; it is essentially the same structure we used when we first saw apprentices in our venues in the early 1980’s.

FOUR YEARS IS TOO LONG A four-year apprenticeship is too long. It’s one of the reasons why we have such a high dropout rate and so we don’t have enough qualified chefs coming into the industry. As a sector, we need to agree on suitable training that can be achieved in a shorter period to ensure we have retention of young chefs to advance our fabulous food culture. If these individuals are talented enough, they need to be signed off early, regardless of age. By way of comparison, they didn’t take Boris Becker’s first Wimbledon Crown off him because at age 17 he was too young! Let’s reward talent and get them in our kitchens filling the skills shortage Back to Contents

APPRENTICE WAGES Other issue is apprentice wages. During their first and second year, employing an apprentice chef is cost effective. As they progress, it becomes very expensive, especially when you realise that an employer’s training obligations remain. The system is also effectively shutting the door on ‘older’ people who could come to us with life experience and real passion. There is little opportunity for a 20-to-21year-old who seeks a career change and starts a ‘late’ apprentice. But as adults, they become too expensive to employ and good people lost to our kitchens.

AFL GRAND FINAL…. LET’S GO HARD FOR IT! Putting my Port Adelaide allegiance aside, shouldn’t SA be fighting tooth and nail to host the AFL Grand Final this year? All states are manoeuvring for this glittering prize. Adelaide Oval has much to offer but Qld has done the heavy lifting, NSW has the biggest stadium outside Victoria and WA has both a bigger stadium than Adelaide and greater corporate facilities. SA needs to massively boost the funds available to capture what is Australia’s greatest sporting event. It will bring much-needed cash into the local economy and would be a huge benefit for CBD accommodation venues that continue to haemorrhage.

However, the argument to fund a supercharged bid goes well beyond economics. Snaring the rights to the prestigious AFL Grand Final would give the entire State a mental boost. Presumably our events budget is under-spent at the moment due to the restrictions, so let’s spend big to seize one of the few big-ticket opportunities on the horizon.

STAY WELL In closing, please take care of yourselves. As business owners you are shouldering huge responsibilities in the most uncertain period of a lifetime. The pressure is enormous, the uncertainty is colossal and ‘we’re only human’. The AHA|SA is here to help you with your business – but organisations like Beyond Blue, which we have supported for so many years, are the “go to” option when you start struggling mentally. Reaching out like this can take courage but each and everyone one of you has shown that you have this in spades. So if you need someone to talk to, act now and call 1300 22 4636.

David Basheer, AHA|SA President

W W W . A H A S A . A S N . A U

| Hotel SA | 5


From the General Manager August 1, 2020

IAN HORNE – AHA|SA GENERAL MANAGER

Light at the End of the Tunnel? As far as South Australia is concerned, the management of the Covid-19 pandemic has been exemplary.

begun the road to recovery with no negative impacts. It has been a win-win.

A mixture of a quick, focussed health response, including leading edge virus testing strategies, client tracing that sets international standards and a common sense approach by police to engage and educate, has been most welcome and allows South Australia to lead Australia in terms of case and fatality minimisation.

“That is not to say South Australia can remain safely quarantined due to what we see happening in Victoria in particular.”

As I write this, hotels and hospitality complete their 5th week of trading under more relaxed conditions that include the one person per 2 sq m. This concession has been vital to restoring some level of viability to our sector, that combined with JobKeeper arrangements has avoided a catastrophe amongst our members. It is of interest to note that according to media reports, the decision to move to one in two (50% capacity) from one in four (25% capacity) was not supported by Professor Nicola Spurrier. The media reports suggest that despite that opposition SAPOL and other members of the Transition Committee said: “…taking into account the current understanding of the existence of Covid-19 in the South Australian community, the restrictions that we had in place for cross-border travel and the economic impact of retaining those distancing requirement led to an agreement within the Transition Committee that we should move to a one person in two square metres to free up business to be able to trade more effectively”.

That is not to say South Australia can remain safely quarantined due to what we see happening in Victoria in particular. What it does say is that the right policy, the co-operation of industry and the support of the community remains an attractive formula for continued success and that the benefits have flowed to so many. Let’s hope the common sense South Australia formula can remain, even when facing the risk across the border. N.B. In light of the decision of government to reintroduce sitdown drinking and the threat of returning to one in four square metres, we hope common sense prevails and not “collective punishment” that simply damages business and jobs.

In the same report, the CEO of SA Health said that keeping the social distancing requirement of ‘one in four’ had ‘massive’ economic and social implications. Some five weeks after the decision, the reality is that hotels, hospitality, gym operators, staff, landlords and suppliers have 6 | Hotel SA | W W W . A H A S A . A S N . A U

Ian Horne AHA|SA General Manager Back to Contents


“Let’s hope the common sense South Australia formula can remain, even when facing the risk across the border.”

Back to Contents

W W W . A H A S A . A S N . A U

| Hotel SA | 7


E D O M E U V E N R R I V E D! A S A S H N O I T O M O R P T R PO S D N A G RACIN

r u o y w Sho o t w o h s r e m o t s u c e v i s u l c x e s s e c c a d n a s n o i promot -venue, n i s t e k r ma w e n e h t with . p p A B TA

Venue Mode available on the TAB app in TAB Venues and selected Racecourses only. Think! About your choices. Call Gambler’s Help, Gambling Help or the ACT Gambling Counselling & Support Service on 1800 858 858 www.gamblinghelp.nsw.gov.au or www.gamblinghelponline.org.au. Think of the people who need your support. Gamble Responsibly.


The Playford INSIDE A QUARANTINE HOTEL WORDS: JOSH TEAKLE

Back to Contents

W W W . A H A S A . A S N . A U

| Hotel SA | 9


The Playford on North Terrace was home to more than 400 returned international travellers undergoing strict quarantine during the Covid-19 pandemic. When SA Health approached local hotels with the proposition of hosting the 14-day isolation periods for Australian nationals reentering the country, Playford management joined the application process and were successful. The Playford has since welcomed two separate groups to the hotel. About 300 Australian nationals with an Indian background entered Adelaide Airport on April 21, before being transported to The Playford Hotel for their quarantine period. The second group landed from Kuala Lumpur on July 4 carrying returned Australians with varying backgrounds, including European, Malaysian and Chinese.

ALLAYING ANXIETIES Hotel General Manager, Maurits de Graeff, said the last three months had been incredibly different to anything he had experienced in his more than 20 years in hotel management. “It was a completely different way of handling guests, but it was a real team effort with the whole Playford team trying to deliver the best service we can,” he said. “It’s a big responsibility to host these guests because they cannot leave their rooms. 10 | Hotel SA | W W W . A H A S A . A S N . A U

“They arrived quite exhausted because the process and travel to return to Australia took a long time, which included sharing a plane with a lot of others – not knowing what they may potentially carry with them. “Quite a few of them were very anxious once they finally arrived at The Playford. However, we have quality food, world class cleaning standards and all the rooms have fresh air, sliding doors and a balcony which has put a lot of them at ease in a difficult situation.”

“It was a completely different way of handling guests.” The Playford Hotel is one of Adelaide’s premier five-star accommodation hot spots. Its rooms are spacious and elegant, the food is first class and the service goes above and beyond. While the hotel’s most recent guests enjoyed the view of North Terrace from their balconies, not only was the city “out of bounds”, guests weren’t even allowed to venture into the hallway outside their room. Back to Contents


HUMAN TOUCH While the hotel provided three meals a day, normal room service menus, security on every utilised floor, self-cleaning room kits and linen changes to its guests throughout the entire experience, Maurits said his staff had made it a priority to take into account the “human side” of quarantine. He said the entire process was challenging but rewarding. “Of course, 14 days in a room by yourself or with your family is a long time so we have a lot of entertainment going on,” he said. “A couple of hours a day at least, which varies from digital yoga and mindfulness classes to games, books, music, quizzes and drawing for the kids. “We set up an internal PC channel that allowed us to live broadcast from our boardroom into the rooms with streams of entertainment and live podcasts. “We organised several streamed classes, including one with Masterchef’s Callum Hann. Callum ran a live cooking demonstration from our boardroom, before serving his dishes to the guests who also received his recipes. “The guests really appreciated the effort that we put in. We even set up a dedicated Facebook group which we constantly monitored to see feedback, how the guests were doing and understand their moods because 14 days is a long time to spend in a room, but we have received amazing feedback.” Back to Contents

W W W . A H A S A . A S N . A U

| Hotel SA | 11


MANAGER’S ROLE Maurits said a major part of his role over the past three months has been communication with guests, staff and chefs. He had to take into account the range of backgrounds, dietary requirements, preferences and needs presented by the guests specifically, as well as the lockdown situation in general. “The Government chose us because of the quality of food, we make everything in house and ensure everything is fresh and healthy,” he said.

“14 days in a room by yourself or with your family is a long time so we have a lot of entertainment going on.” “The first group we really catered to Indian nationals because 90% were from an Indian background, which meant a lot of vegetarian dishes.

guidelines remained once guests had checked out. Cleaning contractors left the rooms idle for a period before performing a deep clean - all of which has ensured a record of no positive Covid-19 cases within the hotel. “Guests enter quarantine and it is pure quarantine,” said Maurits. “It’s a busy role to have at the moment but it’s very rewarding because it is an amazing service that we are able to provide and that’s what we are doing it for.” With every room utilised during the first quarantine stint and four floors on the second occasion, Maurits said he, the hotel and guests had received great support from SA Health and SA Police with daily checks and calls.

JOBS While it made for long hours and seven-day working weeks, for Maurits it provided an opportunity to give his staff work hours and welcome people back through the doors, despite not being open to the public. “Like every hotel we needed to close down in March,” he said.

“We were then able to cater to the others in a different, more personalised way.

“Hosting the returned travellers was a good opportunity for us because it gave us a chance to get most of our employees back into the hotel and give them shifts.

“The second lot of guests was a real mixed bag and we mixed it up quite a bit – for example, being July 14 (Bastille Day) the other night we prepared a French-themed dinner.”

“We were still less staffed compared to before Covid-19, but this allowed us to have a lot more staff back at work to take care of them.

STRICT PROTOCOLS Maurits said a range of strict safety measures had been implemented. Staff members were not allowed to enter rooms at any stage during quarantine, guests went through two periods of testing and at meal time staff placed takeaway food containers at each door, knocking and stepping away. The unique safety 12 | Hotel SA | W W W . A H A S A . A S N . A U

“Of course, there was a little bit of anxiety amongst the staff so we did our best to make sure everyone felt safe, and if they wanted to deliver food they could, but there were also roles back of house. “If anyone felt unsafe they didn’t have to come to work. “Overall it was an amazing experience.” Back to Contents


Matthews Family Acquires Hotels for Next Generations One of South Australia’s largest family-owned hotel groups, Matthews Hospitality, has finalised a succession plan that will strengthen the future of its hotels for the next generations. Third-generation siblings and directors Lisa, Scott and Ward Matthews are acquiring seven of the nine venues owned by Matthews Hospitality and will retain the company name and brand. Group General Manager Andrew Kemp is now CEO. The following venues will remain part of the Matthews Hospitality group: the Feathers, Maylands, Buckingham Arms, Eyre, Mount Gambier, Park and South Eastern Hotels, as well as Colhurst House B&B and Witches Brew Liquor. Their uncle Guy and cousins Shaun, Brett and William are acquiring the Flagstaff and Mansfield Park Hotels. Guy, Brett and Shaun will resign as directors of Matthews Hospitality. Matthews Hospitality was established during World War II by Seymour and Doris (Dossie) Matthews with the Bayview Hotel lease in Whyalla. The group has owned, operated and sold many iconic South Australian venues over the years totalling some 36 hotel licences and freeholds.

Andrew Kemp CEO.

The family has a legacy of pioneering innovation, establishing Australia’s first drive-thru bottle shop, smorgasbord and counter meal. They also paved the way for night-time entertainment in hotels as the original home of world-famous bands and artists including AC/DC, Jimmy Barnes and Cold Chisel.

“Our family is supported by fantastic staff who share our commitment to providing great customer experiences and we have been blown away by the support of our community during Covid-19.” Seymour and Dossie had two sons, Tony and Guy. Lisa, Scott and Ward are the children of Tony, who passed away in March 2019. Lisa has two sons aged in their 20s and Scott has two children under the age of 10. Lisa, Scott and Ward said: “Every business needs a succession plan, and the timing was right to work with our family to achieve this. “Matthews Hospitality has a proud family history, legacy and values, and our succession plan is designed to preserve and honour these qualities for future generations. “We remain focused on providing the same enjoyment and happiness to people who come into our hotels that our parents and grandparents did. Back to Contents

Scott, Ward and Lisa Matthews.

“Our family is supported by fantastic staff who share our commitment to providing great customer experiences and we have been blown away by the support of our community during Covid-19. “We are deeply rooted in our communities and we are passionate about the industry and the diversity of our hotels. We look forward to continuing to build and nurture these relationships with our communities who support us. “From a customer perspective it remains business as usual within our hotels. “This succession plan will strengthen our family business so that we can continue to provide welcoming spaces and great customer experiences for decades to come.” W W W . A H A S A . A S N . A U

| Hotel SA | 13


Knowledge is Power Off the back of our article Preparing for a Post-JobKeeper Reality last month, we’ve had a number of Publicans contact us regarding a review of their current bookkeeping practices and how they can leverage their increased turnover to further grow their business. In several cases, this means taking advantage of the Federal Government’s extension of the $150K instant asset write-off scheme until the end of December 2020. Whilst every venue has its own unique circumstances, a common thread that we have seen in resilient operations is that they have maintained efficient bookkeeping processes throughout the crisis, to ensure that their business is best positioned to not only survive unexpected events, but is now in a position to emerge stronger on the other side. Let’s take a look at some of the top common practices…

KEEP YOUR FINGER ON THE PULSE As every business owner would know, success depends on many things – a sound business strategy, strong cashflow, good supplier relationships and a loyal customer base. Bookkeeping should be seen as the way you bring all these areas together behind the scenes to give a live view of your operation, providing your business a solid foundation to work off of. The key to building and most importantly, maintaining, this solid bookkeeping foundation relies on efficient processes and personnel for accuracy of information and timeliness of data. “Immediate access to insights, like having a clear picture of your business’ inflows and outflows, is critical to knowing where your operation is at and what economic levers are available to you to maximise your gross profit. Access to real-time data ensures that you have all the right information at hand that enables you to optimise opportunity and minimise risks,” explains Elizabeth Elliot, our Director of Bookkeeping at Perks.

KEEP YOUR EYES ON THE ROAD AHEAD When you have real-time vision of your finances, you can pinpoint key areas to cut or scale in accordance with your strategic business plan.

owner to measure the effectiveness of their strategy over a defined time frame. It can quantify how well the business has capitalised on opportunities and withstood any downturns,” states Elizabeth. So, for those that now find themselves in the fortunate position of benefiting from the sudden influx of patrons, their robust bookkeeping practices should allow them to see beyond the increase of turnover and project into a postJobKeeper scenario.

“The keys to building and maintaining a solid bookkeeping foundation rely on efficient processes and personnel for accuracy of information and timeliness of data.” LOCKDOWN YOUR COSTS Whilst many Hospitality suppliers have really come to the party in regards to stock returns, credits and the like, juggling variable costs can be difficult when faced with unforeseen circumstances. Just like locking down your monthly rent with your landlord also establishes an expectation of what they will be responsible for in terms of your premises, you can also consider locking down other suppliers so that you establish an expected scope of work that they will deliver whilst minimising any variable “surprises.” Even services like Bookkeeping, Training and Development and Human Resources can be outsourced and locked to fixed fees.

• Sudden increases/ decreases in your customer base

“We’ve found that amongst our client base, the fact that our Bookkeeping team works year-round and on a fixed fee, is highly appreciated. For many business owners, the ability to know exactly what work will be done by our team and how much it will cost ensures that there are no unwelcome surprises that affect their bottom line,” shares Elizabeth.

• The impacts of varying relief measures

TIME TO GET TECHNICAL

Real-time data allows you to adapt quickly to variations in inflows and outflows, such as: • Increased operating costs

• JobKeeper impact on Gross Profit • Forecasting wage costs based on your roster • Annual wage increases/ changes to Award Rates Accurate, timely data is the key to feeling confident in making timely decisions as challenges arise. Agility in the face of change ultimately allows you to protect your bottom line and ultimately positioning your business for stability over time. “Accurate and up-to-date bookkeeping data enables the business 14 | Hotel SA | W W W . A H A S A . A S N . A U

Getting the most out of your bookkeeping processes necessitates the integration of technology for both efficiency and clarity. By using systems that help to streamline your day-today bookkeeping, processing time and errors can be cut down significantly, enabling you to easily keep your books up to date and accurate. Efficient bookkeeping practices are also critical to the ongoing smooth operation, organisation and transparency of your business. Back to Contents


They ensure you: • Have the ability to cost your roster in advance, so that you can apply it against new sales forecasts and take appropriate actions to reduce wage costs, if necessary; • Have safeguards ready, in case of an audit; • Can readily catch any potentially suspicious activity; • Cut-down on the time your Accountant needs to translate your books for compliance purposes; • Have the documentation on-hand that you need to apply for finance or assistance packages, such as those we’ve seen rolled out due to COVID-19 and bushfires.

Pat Hodby

In summary, building and maintaining strong operational practices, and gleaning insights from those practices in realtime are key to resilience in the face of turbluent times, and also staying on the path when the pendulum swings the other way.

“Bookkeeping and Human Resources can be outsourced and locked to fixed fees.”

Pat Hodby and Tom Paine are Directors at Perks, South Australia’s leading privatelyowned accounting and private wealth firm. They are the driving force behind the Perks Hospitality specialisation team and have both provided key advisory and operational support to a number of owner-operators in the sector, ranging from the structuring of their business, to back-of-house bookkeeping, to the streamlining and digitization of their support systems. Pat is also an active industry advocate for publicans and the hospitality industry and owns a successful pub in the Adelaide Hills.

Tom Paine

CHEAP RELIABLE EFFECTIVE COLD STORAGE REFRIGERATED CONTAINERS

• 6 foot – 10 foot – 20 foot – 40 foot • Hire short term and long term

1300 4 TITAN or 08 8447 8800 www.TITANcontainers.com.au

Back to Contents

W W W . A H A S A . A S N . A U

| Hotel SA | 15


O N E

F O R

T H E

R O A D

W I T H

V A U G H A N Y

Scott’s Spot ON THE ROAD AGAIN Finally, the time has come where I can get out back out into the community. It’s great to see members adhering to Covid-19 restrictions which have changed at a rapid pace over the last couple of months. My only advice is that you continue to check updates that the AHA|SA sends, as they’re all important.

REGIONALS RETURN Regionals meetings are back! Starting on the 18 August at the Taminga, followed closely by the Murray Bridge Hotel on 25 August. Feels like forever and I’m sure both members and corporate partners are looking forward to socialising and sharing stories, which will enhance the sense of normality.

THE SINGING CEO In the absence of regional meetings, Zoom meetings for all members and Corporate partners commenced a couple of months back, due to what felt like daily changes to rules and regulations. We have had an enormous response with fantastic feedback and will continue these moving into the future. The meetings are professionally run, with Ian Horne up front and professionally presenting, while Lucy Randall and her production team doing a wonderful job behind the scenes. However, like all productions, not everything has run smoothly every time. There was a “Forrest Gump” moment for Ian when the volume was breaking up at the end of a meeting a few weeks back. It only lasted for up to a minute, with Ian’s sign off clear as the volume came back, although the audience couldn’t understand a thing he was saying for the preceding minute.

Katherine Taylor and Lucy Randall have a bit of fun with Ian Horne and Anna Moeller prior to their Zoom meeting.

ISLANDER NEWS I had the pleasure of heading across to KI to meet with our members The Penneshaw Hotel, Mercure Kangaroo Island Lodge, Parndana Hotel, Queenscliff Hotel and the Aurora Ozone hotel. It was confronting to hear firsthand about the double whammy of bushfires and Covid-19, as well as the way back for tourism. I came back from the trip with even more admiration for the community and venues that played a major role during the fires in feeding, co-ordinating, providing bedding and so much more. The conditions that were described to me and shown in photos taken by Mary-Lou at the Ozone, were completely unimaginable to me. Some six months later, here are photos taken at the various venues and their beautiful surrounds.

In another meeting where guests came online before the meeting started, the ON AIR button was activated by mistake, unbeknown to Ian who was singing and whistling away to an audience in excess of 100. Very amusing!

Parndana Hotel, Kangaroo Island

Ian Horne, Anna Moeller, Katherine Taylor and Lucy Randall take part in the AHA|SA Zoom meeting.

16 | Hotel SA | W W W . A H A S A . A S N . A U

Penneshaw Hotel, Kangaroo Island

Back to Contents


on the road The Rezz redevelopment

KI Lodge, Kangaroo Island

THE CLOVERCREST I also caught up with Nick Rogers at the Clovercrest, where there are various stages of renovations being completed. The gaming room looks spectacular and a new function room for over 400 people is due for completion over the coming weeks. If there are any renovations or works in progress, please let me know as it would be great to have before and after shots.

THE GREENMAN, MT COMPASS… AND A FAREWELL I took a quick shot on a beautiful winter’s day after calling into new member, The Greenman Inn at Ashbourne. The final pic is from the back of the Mount Compass Tavern. Finally, I wanted to farewell Mark and Andrea Davies at Ian’s Western hotel (at least for now). Members and corporate partners will all agree they will be sadly missed, however I am sure they will be looking forward to slowing down, at least for the next few months.

Queenscliffe Family Hotel Aurora Ozone Hotel

THE REZZ Back in Adelaide, Didier Vollerin and I ducked out to the Rezz the other day and caught up with Richard Hamood. As you can see from these photos, a major development is about to begin, with the guys standing on foundation pad. I will look forward to reading the feature story in Hotel SA when this project is completed in April/May next year.

Farewell to Mark and Andrea Davies

The Greenman Inn

The Rezz redevelopment

Back to Contents

View from the back of the Mount Compass Tavern

W W W . A H A S A . A S N . A U

| Hotel SA | 17


18 | Hotel SA | W W W . A H A S A . A S N . A U

Back to Contents


“I had to sit there with a smile on my face and tell them it was going to be OK, but for me I would go to bed at night thinking ‘Are we ever going to open again?’.”

The Commercial ’s FORESIGHT AND FLEXIBILITY A GAME-CHANGER WORDS: JOSH TEAKLE

One thing we have learned from Covid-19 is that sometimes a pub doesn’t have to be open for the community to feel welcomed. That’s the mantra Commercial Hotel publican Stacey Butler took with her into the pandemic shutdown.

“They would come into the bottle shop drive-thru every day to have a chat and maybe buy a beer which was good because what worried us the most was knowing that these people might feel a bit lonely.

It was a time when hotels had no idea when they would be allowed to open again and for some, an extended lockdown would put them out of business.

“It was important for people to know that while we may not be open and things aren’t the way they were, we are still here. We wanted them to come through and say ‘hi’.”

Stacey’s popular Strathalbyn pub joined the mass of SA hotels closing their doors in March, and while she acted swiftly to put survival plans in place, the welfare of her staff and rusted-on locals remained at the forefront of her mind.

Strathalbyn is a picturesque town of approximately 6500 people, located 57 km southeast of Adelaide on the Fleurieu Peninsula. It has a thriving local and regional community and is a favourite for people travelling from Adelaide to Victor Harbor and Goolwa.

“For us, country pubs are where people come to celebrate, grieve or have some company,” she said. So having that shut, we were really worried about how our customers were going.

“We are a small town and I couldn’t do what I do without the community support,” said Stacey.

“There was a lot of checking on people that live on their own, work odd hours or don’t have a big friendship group. Back to Contents

“We have always been involved with sponsoring the sporting clubs, individuals and quiz nights and I can’t believe how many people stood up to come and help us in return.” W W W . A H A S A . A S N . A U

| Hotel SA | 19


Stacey Butler and her nephew Mikey on their day of re-opening.

Amber Richards, Assistant Manager.

FORESIGHT While nobody could completely prepare for the unprecedented changes and ultimate closures that faced the hospitality industry, Stacey said she did all she could to at least brace for the impact. “I changed my whole business model when I saw what was happening overseas,” she said. “I watched the pandemic start to move towards Australia and I began putting things in place, like my takeaway menu and reducing different things like life without the salad and veg bar. “I felt I was on the front foot more than some people may have been because when those doors shut, I already had a plan in place.” Plans on paper were immediately put into motion when the seemingly inevitable closures were announced. The Commercial’s kitchen and bar staff were already equipped to serve takeaway meals through the bottle shop. “We were lucky enough to have a drive-though bottle shop and a couple of years ago I started promoting takeaway meals through that service. Being in a country town and not having a drive-through food option, I thought it could give people that convenience factor,” she said. “When the Covid-19 restrictions hit us, our customers already knew about our drive-through takeaway option so we didn’t have to let the world know about that.” During those dark hours, the close-knit Strathalbyn community showed its big heart. A pub that had given so much to community groups now found that same community coming to its aid.

20 | Hotel SA | W W W . A H A S A . A S N . A U

“A pub that had given so much to community groups now found that same community coming to its aid.” “A huge amount of our customer base during this time were people that really only ordered meals to support me and my staff,” Stacey said. “It was overwhelming on a Thursday schnitzel night to see the amount of people ring up and place an order.” The hotel couldn’t afford to be complacent. It “pivoted” once again, introducing a free home delivery service, which Stacey personally facilitated.

REOPENING ANXIETIES Finally, after months of offering takeaway meals through the bottle shop and doing her best imitation of an Uber drive by delivering food around the neighbourhood, it was a relief when the government gave the green light to welcome patrons back into the restaurant. Even still, it was no ‘walk in the park’. “It was a bit awkward,” said the proactive country publican. “The first few weeks back open wasn’t a relaxing experience – it was actually really hard because there were still a lot of restrictions. Back to Contents


Staff members Lachie and Tom in the bottleshop.

Stacey and Amber with pub dogs Maverick and Micro.

Staff member Trista Piskorz behind the bar.

“As staff we had to think ‘Am I doing this right?’ and ‘Are we were doing everything we can to protect our customers?’ “People couldn’t sit at the bar, I couldn’t shake their hands and all of it was pretty much the opposite of what you learn in hospitality, which is to welcome people into a safe and comfortable space.”

“…it’s a whole different feeling for customers to be able to walk to the bar and talk with the staff about their terrible days, great days, grandkids and families.” Looking back, Stacey estimates that it took at least two weeks before pub-life returned to a sense of normality.

to be able to walk to the bar, pull up a stool, eat a bag of chips and talk with the staff about their terrible days, great days, grandkids and families. “All of those things are so important because it’s such a face-toface industry.” After working in country and metropolitan hotels “since she could pour a beer”, Stacey has owned and operated the Commercial Hotel for the past four years.

LEADERSHIP IN ADVERTISTY Despite a lifetime in hospitality, she said everything she knew about the industry had been flipped on its head when it came the time to close the doors. One of the most difficult aspects of the ongoing pandemic has been the need to keep fronting up with a brave face for her staff and community, without knowing what twist or turn was coming next. “I had to sit there with a smile on my face and tell them it was going to be OK, but for me I would go to bed at night thinking ‘Are we ever going to open again?’,” she said.

“The tourist trade was still pretty quiet but our locals were very keen to come back,” she said.

“I am in hospitality for a reason, we come to work and leave our own stuff at the door to make sure that everyone else is having a great day, that’s what it’s about.

“As soon as we were allowed to have people seated at the bar again or stand up while they were having their beer, that was when it felt a little bit normal again.

“My staff stood up hugely, and I know some of them were really struggling, mentally as well as financially but they would come in, stand in that bottle shop and put on the bravest face.

“There were still restrictions in place and social distancing – and there still are - but now it’s a whole different feeling for customers

“I’m super proud, I couldn’t do it without my team and certainly not without my community.”

Back to Contents

W W W . A H A S A . A S N . A U

| Hotel SA | 21


Discounting with Dignity – and a Plan When your potential market shrinks and revenue is falling, some businesses instinctively opt for discounting to get ‘dollars through the door’. However, discounting is fraught with danger. The following is a series of tips on how to approach this complicated area of pricing strategy. Before you start discounting, have you done everything you can to reduce your operating costs and boost productivity? Have you made the tough decisions? Is your accountant or hospitality advisor happy that you have done everything you can? • View discounting as short term. • Prolonged discounting will alter patron expectations. For example, Skift reports that “New Orleans hoteliers deeply discounted rooms to lure travellers back to the Crescent City following the Hurricane Katrina disaster in 2005. Revenue per room, the hotel industry’s key performance metric, didn’t surpass 2005 levels until six years later, according to STR.” • Structure price points as opportunities to upsell. For example, think about the price points of your rooms. Discounted budget priced rooms should be budget rooms, while the next level up should have more benefits so that you are inducing people to choose the higher-priced option. Airlines do this very well (think baggage allowance, seat choice, ability to change etc). • Always remember that discounts invariably come straight out of profit. • So setting price should be a well-thought-out strategy. Don’t “wing it”. • When you discount, your competitors are likely to follow. This leads to a price war – and there are few winners when this takes hold.

that’s really important because once you set a low price, it’s very hard to recover when demand eventually does come back. “And so, a couple of ways that you can sort of discount with this dignity is, for instance, require a charitable donation. You’ll get a lower price if you donate to a charity. “And what you’re clearly psychologically communicating to customers is that this is a one-off. This is unique. Don’t expect this for the long term, or require bulk purchase. You have to buy four movie tickets, but you get a low price. And in the customer’s mind, they can justify that price decrease because they’re saying—oh, they’re giving me a volume discount. “Or changing the terms … you can impose more stringent terms. It could be cash only, you know, no delivery, no returns. And what that does is once again, reinforce that this is a one-off deal. “And finally, what I’ve seen is that sometimes businesses will discount prices because they want to show a client that they’re a partner, that they’re in it with them during this, during the long run. “But it’s really important to set a metric about when your price is going to go back up.” • If you aren’t going to join in a “race to the bottom”, then you need to promote the overall value of your offering. • What else can you offer? Perhaps you can work with other local businesses to offer a package? For a regional pub, this might be bike hire, lunch at a nearby winery and a round of golf. • Uniqueness also has a value. So what is your unique story? Are you telling it, especially via your website and social media?

• Rafi Mohammed is author of The 1 Percent Windfall: How Successful Companies Use Price To Profit and Grow. He recommended the following on a podcast with HBR:

• Key to your story will be the experiences people can expect. People will pay more for great experiences – and happy patrons will then go on to promote this experience through their own social networks. This is exactly what you want.

“Clearly, in the short-run, you have to offer a discount. And what I would be focused on is what I call discounting with dignity in a manner that doesn’t devalue your product in the long run. And so,

• Some people will also support hotels that care about their community. So your storytelling (think “publicity”) should highlight what you are doing to help others. Are you assisting

22 | Hotel SA | W W W . A H A S A . A S N . A U

Back to Contents


bushfire and Covid-affected wineries in your local area? Do proceeds from a raffle go to a charity? • Part of your value story must be “health”. People have different levels of concern about Covid-19 but the vast majority will appreciate your efforts in showing what you are doing to keep them safe. • Make sure that your messaging in this regard is far superior to your competitors’. • Discount conservatively, at least to start with. A small discount may be enough to attract the numbers you need, without having to cut too deep. • Offer volume discounts. For example, pay for three nights but only pay for two. • Make your cancellation policy a major feature. With the possibility that travel restrictions could be reimposed, people are cautious about making bookings. Rather than promote massive discounts, heavily publicise your refund policy. • Have a profile of your ideal patron in mind. Price with the aim of attracting the right guest for the right price. • Also remember that digital advertising allows you to set up campaign parameters that closely match the demographics of your local target audience. For example, are you promoting a Sunday Recovery Session to millennials living in the Adelaide CBD, or a Tuesday lunchtime roast to Gen Xers living in Mount Barker? • Have a plan of how you are going to act when competitors

Back to Contents

start discounting. This way you don’t rush into a kneejerk reaction. For example, if you are competing on room rates, your plan might be to wait to see if your competitor’s discounted offering has any impact on your occupancy levels. At the same time, you might test market two or three email promotional ideas to a small segments of your database of previous customers. That way you will have data about what promotion is working best and you can employ it if your competitors’ actions are having an impact. • As a follow on from the previous point, if you are using email campaigns to reach former customers, run tests first. See what gains traction and what doesn’t. If you are sending offers to your loyal patrons that they don’t value, it’s no better than unsolicited spam. • Hard data counts. What was your experience during previous downturns, including the GFC? Yes, it was a different scenario but we often forget what actually occurred and how we acted during those historic times. • Speak with your friends in the industry. Share your past experiences as a group. It brings the power of several minds to a problem and invariably you will be better off for it. • Consider a loss leader to get ‘bums on seats’. You could discount accommodation as an inducement to get people spending in other areas of your hotel. Or ramp up your Happy Hour activities (your Happy Hour is a strategy, right?) This point is worth repeating: have a plan for when you will stop discounting. There is a real danger that you are ‘training’ your patrons to expect discounts.

W W W . A H A S A . A S N . A U

| Hotel SA | 23


Report Proves Benefit of Government Stimulus for Hospitality and Accommodation

$

$

$

$

x3.88

x3.81

84%

50%

EXTENDING JOBKEEPER FOR HOSP/ACCOMM RETURNS UP TO 3.38 TIMES INITIAL COST TO GOVERNMENT

SUSPENDING FBT FOR SECTOR HAS LOW IMPACT ON GOVT BUT RETURNS UP TO 3.81 TIMES THE DIRECT COST

HOSP/ACCOMM AMONG WORST AFFECTED AREAS OF ECONOMY: 84% REPORTED DECREASED REVENUE

OVER 50% IN SECTOR REPORT REVENUE DECLINES OF MORE THAN HALF

The AHA and Tourism Accommodation Australia (TAA) have released exclusive modelling that outlines the economic benefit of providing assistance to Australia’s hospitality and accommodation sector in response to the impact of COVID-19. A draft report from Ernst & Young (EY) focused on two policies to support the hospitality and accommodation sector: • the extension of JobKeeper until March 2021 • the suspension of Fringe Benefits Tax (FBT) on accommodation, meal, beverage and entertainment expenses for three years. AHA National CEO Stephen Ferguson said the report was critical to building the evidence base for continued economic support, which has been a key requirement of Treasury and Government. “The draft report shows that depending upon final Government policy settings, three of the four JobKeeper scenarios examined indicate economic returns range from 1.42 to 3.38 times the initial cost to Government,” he said. “In regard to suspending FBT, EY found that accommodation, meal and beverage entertainment only forms a relatively small portion of the total fringe benefits tax collected by the Government, but suspending FBT for our sector would produce economic returns ranging from 3.25 to 3.81 times the direct cost to Government.” 24 | Hotel SA | W W W . A H A S A . A S N . A U

TAA CEO Michael Johnson said the need for additional assistance is clear, particularly as several states deal with a second wave of COVID-19. “The EY report noted that 84 per cent of businesses reported decreased revenue, with more than half (53 per cent) reporting revenue decreases of 50 per cent or greater - this is the highest proportion of any industry to report revenue decreases in this range,” he said. “The report also showed that female workforce participation in our sector is well above the national average with 60 per cent of workers being female, as well as high levels of employment for younger Australians, with 47 per cent of workers being under the age of 25.” “AHA and TAA research also shows that 15 per cent of businesses reported that their operations could be supported for less than a month with current available cash at hand.” “Worryingly, it also showed a national average fall in accommodation hotel room revenue of 77 per cent and a plunge in occupancy rates of 66 per cent.” “Forward looking data shows occupancy rates below 50 per cent of capacity based on current bookings over the 90-day period from 15 June to 12 September.” The report is entitled Economic impacts of stimulus for the Accommodation and Food Services Sector. Back to Contents


Generosity of Corporate Partners Will Not Be Forgotten MANY CORPORATE PARTNERS WENT “ABOVE AND BEYOND” TO HELP HOTELS DURING THE CRIPPLING RESTRICTIONS IMPOSED ON HOTELS AS A CONSEQUENCE OF COVID-19.

From refunds to cancellation of fees, there were many stories of generosity.

“Content to come content to come. “Content to come content to come. “Content to come content to come

As AHA|SA President David Basheer has stated in previous issues of Hotel SA: “Without a shadow of doubt, this has been the most difficult time for our members in their business life.

“Content to come content to come. “Content to come content to come. “Content to come content to come.” Here are just a few examples of that generosity.

NOVATECH FEES WAIVED AND EQUIPMENT UPGRADED When hotel shut down, Novatech immediately enacted a sixmonth waiver on all hire fees. The company supports over 35 venues throughout SA and the NT via a long-term hire model of installed audio, lighting and vision systems. When the COVID-19 crisis hit in mid-march, it was clear that live event work the venues Novatech supported were in a state of crisis. Novatech supplies installed audio, lighting and vision systems across the pubs and nightclubs. As venues closed, it decided to roll out a comprehensive review of all installations and, with the cooperation of the venue, decided to upgrade all of the current systems free of charge to enable improved service offerings when the venues could reopen as restrictions were eased. Since 2001, the audio-visual production company has supported the local industry and this COVID-19 era is no different. “As long term supporters of the AHA SA, we’re committed to only ensuring the annual awards are held in style but also that the overall success of the industry is the best it can be.”

COOPERS BREWERY FREE BEER AND KEG REFUNDS After refunding the return of some 13,000 kegs, Coopers Brewery is ‘picking up the bill’ for more than 15,000 beers to encourage people to support Australian pubs on the road to recovery. It is shouting rounds of Pale Ale at 335 metropolitan and country venues, including a large number of South Australian pubs. “We’re hoping that through our pub tabs we can encourage more people to drop into their local for a social drink,” Coopers Managing Director Dr Tim Cooper said. “The whole industry has suffered from the impacts of Covid-19. We’ve gone through this together and we’re coming out of it together. “As a community, we’ve all missed heading to the local pub. It’s one of our most popular past-times. Pubs are back open again, so let’s have a beer and celebrate.” Back to Contents

W W W . A H A S A . A S N . A U

| Hotel SA | 25


ACCOLADE WINES WINE REPLACEMENT AND LARGER DISCOUNTS

To assist the Australian hospitality industry get back on its feet during these unprecedented times, Accolade Wines launched Your Venue, Our Shout – an on-premise support package that will see Accolade Wines replace, as complimentary stock, their portfolio of wines sold across venues in the first month from re-opening. It is accessible to both existing and new customers, and available now until 31st August 2020 across its extended portfolio of quality wines, including brands such as Grant Burge, Croser, Stonier, Hardys, Petaluma and House of Arras. In addition to the stock replacement offer in the first month of re-opening, the Your Venue, Our Shout package offers on-premise venues increased discounts on Accolade Wines’ most recent wholesale list price for the first six months after re-opening.

STODDART STODDART “QUICK CHANGE” ASSISTS MATTHEWS GROUP PIVOT

Stoddart assisted The Matthews Hospitality Group, which operates a number of large pubs in South Australia, to offer takeaway food and alcohol options to customers during the Covid-19 lockdown. Stoddart was able to quickly supply equipment to allow these traditional sit-down foodservice venues to move to a takeaway model. Having products available to make this change allowed these venues to keep operating in some capacity. Equipment supplied included Culinaire vertical hot cupboards, Anets fryers, Metro MightyLite pan carriers and Adande under counter refrigeration. As the industry moves forward, the company has Sanipure hand sanitiser refills and hand sanitiser dispensers available in online store at www.stoddart.shop Contact the Stoddart South Australia office on (08) 8187 4502, email adelaide@stoddart.com.au, or visit www.stoddart.com.au Images: Anets and Adande units installed at The Stirling Hotel, one of the venues managed by The Matthews Hospitality Group

THE CARD NETWORK NEW CARD LAUNCHED TO HELP BOOST SALES During Covid-19, The Card Network partnered with hotel associations to launch the first gift card of its kind dedicated to the pub and bar industry. The aim of the Pub & Bar Gift Card is to drive new customers and incremental spend to venues, and encouraged people to show their support and get back to their local pub or bar. With no fees and no setup required, customers simply swipe the card or tap and pay using their mobile wallet via a payment terminal - and the venue receives 100% of the funds. Available online and at Woolworths, it can be used at any of the 10,000 venues throughout Australia that accept eftpos. The launch coincides with the easing of restrictions and at a time where many businesses are getting back on their feet. 26 | Hotel SA | W W W . A H A S A . A S N . A U

Back to Contents


GALIPO FOODS

MAXIMA GROUP

GALIPO FINANCE ASSISTANCE

M&G HOTEL GROUP THANKFUL FOR EXTRA HELP

The Galipo Foods finance team worked with individual businesses to help manage their cash flow during this difficult time. In addition, Galipo kept up its high level of service during the lockdown, providing a five-day per week delivery schedule to best serve hotels and other businesses that were able to trade for takeaway.

TRANS TASMAN ENERGY GROUP TTEG NEW FREE SERVICE

Trans Tasman Energy Group (TTEG) is currently offering complimentary invoice validation services for all AHA|SA members - regardless of your energy broker - to remove risk and receive value for money during uncertain times,. TTEG understands that large market electricity invoices can appear complicated and congested with technical jargon. And it says in its experience, one in twenty electricity invoices contain billing errors, network tariff mis-allocations and unfair direct metering agreement charges. Often, billing errors and overcharging can go unnoticed, leaving hoteliers with bill shock.

SOCIAL MEDIA AOK SOCIAL MEDIA EMPOWERMENT During lockdown, Social Media AOK’s CEO Simone Douglas facilitated a number of free workshops for the AHA|SA designed to support its members through one of the most harrowing periods of their businesses. Many hoteliers who attended the online sessions left feeling empowered with the knowledge to craft their content in a new way and to maintain and strengthen the connections with both staff and patrons alike through the power of their digital and social platforms. Her tips and tricks were rapidly implemented by many and we have seen a new flavour of content and connection in the South Australian landscape as a result which supported many businesses in pivoting their offerings or simply creating a sense of comfort and safety for their patrons who swiftly returned as restrictions eased. Back to Contents

In what has been an incredibly tough period for hotels and their staff, Maxima Group Training reached out to support M&G Hotel Group. Michelle Davis, Business Development Manager of M&G, was one of many hospitality professionals affected by the restrictions placed on the industry. However, she has used the down-time to keep her team busy, including, Hayden Longdon, who commenced in February as a Maxima Group Training Trainee. “The biggest challenge has been trying to keep staff motivated, so I have been using the down-time to focus on development. Overall, it has been a challenging time for us having to adapt to the new environment and making sure we are compliant. We tried to remain fully operational and keep as many staff on as possible,” Michelle said. “Unfortunately, we had to suspend Hayden’s traineeship for a period due to COVID-19. Although this was difficult, we were grateful to have Maxima there to make sure we had our ducks in a row, and to help bring Hayden back when restrictions eased. We were also really supported by Maxima with the various COVID-19 related audits and it was a huge help.” For someone as passionate about his job as Hayden, the suspension period was a real challenge and he was, in his own words, ‘over the moon’ when he could finally return. “Coming back to work post COVID-19 has been great and I can already see an improvement in my mental health. I love everything about my job!” W W W . A H A S A . A S N . A U

| Hotel SA | 27


DNA GUARDIAN FINANCIAL HELP AND A NEW SERVICE DNA Security Solutions has over 12 years’ working with hospitality venues, and over 1,100 installed DNA systems. “We are pleased to have been able to look after those customers who reached out to us when they needed a little extra assistance with their payment terms – our priority has always been people first,” Tania Jolley says. “During Covid-19, we put a lot of thought into our new Technology as a Service (TaaS) model. Available from as low as $50 a week, allowing us to onboard our new customers with a very low monthly payment program. This doesn’t impact significantly on cashflow – and allows our customers to fully benefit from DNA Guardian immediately. She said the introduction of protective face masks has highlighted important issues that venues should be aware of and thinking about. “As a community, we can no longer rely solely on CCTV cameras as identification and evidence. We encourage venues to be proactive in assessing the risk of robbery which remains high in gaming venues in particular. The impact and costs on the business is always much higher than anticipated, often by hundreds of thousands of dollars. DNA Guardian technology uses a patented solution to mark the

criminal exactly to the scene and time of the crime. The electronic system can be triggered by a staff member or by an existing alarm system. It operates silently and invisibly, so the criminal does not know he or she has been tagged.

DIAGEO DIAGEO’S $11.5 MILLION FUND Bundaberg Rum has created an $11.5 million fund to support Australia’s hospitality industry. Called ‘Raising the Bar’, the fund will support the recovery of bars, pubs, and clubs as they welcome back patrons Any licensed venue in Australia, whether they’re regional or metro, and regardless if they’re a Bundaberg Rum or Diageo stockist, can apply for support through the ‘Raising the Bar’ initiative that will fund a two-year programme rolling out from July 2020. Both Government and industry have come out in support of the fund and how it will help this critical industry that accounts for 8 per cent of Australian jobs, get back on its feet. This announcement is part of a broader commitment by Diageo to invest US$100 million globally in ‘Raising the Bar’ programmes that will support venues as they recover from the impact of COVID-19.

20/20 Vision Fulfilled for Vintage Ale What can you expect from the latest Coopers Vintage Ale, the 20th to be released? Starting with the grist, the essence of any good brew, the Coopers brewing team capitalised on having an on-site malting plant. A special barley grown on the eastern slopes of the Adelaide Hills was chosen for the pale malt, to which they added crystal and wheat malt. The barley variety is Leabrook, the latest, and sadly, the last barley variety to be released by the University of Adelaide. In a tribute to the long involvement and support that Coopers has provided to the barley development program, the barley was named Leabrook after the former site of Coopers Brewery for 120 years. The result of is a finely balanced, but robust brew of a delightful copper hue. The beer has a full malt flavour, combined with hints of nut and maple. The combination with crystal and wheat malt provide for a smooth mouthfeel and a fine creamy head. With the experience gained since 1998 and the 19 previous brews of Vintage Ale, along with the challenge of delivering a 20/20 result, an exhaustive testing regime resulted in six varieties of hops being used. The selection paid tribute to some past favourites, whilst embracing some New World hops. The hops were added in five stages in the brewing process, 28 | Hotel SA | W W W . A H A S A . A S N . A U

Coopers - Leabrook Brewery (C1948).

including late and dry hopping. Unleashing the unique Coopers ale yeast to work its magic has resulted in a finely balanced and enticing ale. The combination of Astra, Cascade, Centennial, Denali, Enigma and Simcoe delivers a stunning burst of fruit-filled flavours, with hints of peach, pineapple, fennel, spice and pine. Stats include: 7.5% ABV, 70 IBU, and 200kg of hops in every brew. Vintage 2020 will be available from August 6. Back to Contents


The annual AHA|SA Awards for Excellence provides a prime opportunity to showcase your venues and be proud of your achievements. For the winners, it also brings fabulous marketing, advertising and endorsement opportunities that are invaluable to your hotel.

HOTEL INDUSTRY

IT’S TIME TO ACT NOMINATION DEADLINE EXTENDED TO 14 AUGUST

Winners of the AHA|SA Awards for Excellence will be announced at the annual Gala Dinner being held at the Adelaide Entertainment Centre on Tuesday 27 October 2020. Those successful in specific categories will automatically become a finalist in the AHA National Hotel Awards to be announced. NEW 2020 CATEGORIES

AWARDS FOR EXCELLENCE

• Chef of the Year • Front of House Employee of the Year – Accommodation Division • Front of House Employee of the Year – General Division • Employee Excellence in Service – Accommodation Division

To be eligible for the Hotel Industry Awards you must be a full 2020 financial member at time of nomination.

• Employee Excellence in Service – General Division

WHAT YOU NEED TO ENTER:

CLICK HERE FOR MORE INFO

✓ Nomination form

For all awards queries contact Lucy Randall 8100 2441 or lrandall@ahasa.asn.au.

✓ Submission adressing judging criteria (clear and concise)

Back to Contents

✓ Hero image of your venue W W W . A H A S A . A S N . A U

| Hotel SA | 29


Annual Wage Review Decision 2019-20 BY OWEN WEBB, AHA|SA WORKPLACE RELATIONS MANAGER

On 19 June 2020, the Fair Work Commission’s Annual Wage Review Panel (‘Panel’) handed down their decision in the 2019-20 Annual Wage Review (‘Review’).

The Group 1 Awards cover those industries that have been less affected by the COVID-19 pandemic such as health care, aged care, social and disability services, childcare and education.2

This year’s Review was the subject of much debate given the impacts on employers and employees across Australia from the COVID-19 pandemic. The Panel noted in the summary of their decision that “the proposals in respect of the adjustment of the modern award minimum wages were sharply polarized”.1

The Group 2 Awards cover industries such as building and construction, manufacturing and the maritime industry amongst others3.

In this article we look at the outcome of the Review and how the Panel’s decision impacts Members.

WHAT WAS THE INCREASE THAT WAS AWARDED? In a majority decision, the Panel determined that the National Minimum Wage and all modern award minimum wages will be increased by 1.75%.

The Group 3 Awards are of most relevance to our Members as they cover industries such as the hospitality, tourism and retail sectors. The Panel acknowledged that Awards in this group cover industries which “…have been most adversely affected by the pandemic…”.4 Accordingly, the 1.75% increase will apply to the following Group 3 awards from the first full pay period starting on or after 1 February 2021: • Hospitality Industry General Award 2020

WHEN DOES THE INCREASE TAKE EFFECT FROM?

• Restaurant Industry Award 2020

In previous year’s the increases to Modern Award wages would take effect in July, however in this year’s Review the Panel decided upon a staggered approach to the operation of the increases based on the differing levels of impact to industry sectors from the COVID-19 Pandemic.

• General Retail Industry Award 2010

The Panel decided to group the Modern Awards into three different groups with different operative dates for each group. The groupings and operative dates of the increase are as follows: Group 1 Awards – 1 July 2020 Group 2 Awards – 1 November 2020 Group 3 Awards – 1 February 2021 30 | Hotel SA | W W W . A H A S A . A S N . A U

• Amusement, Events and Recreation Award 2020 • Registered and Licensed Clubs Award 2010 Allowances in these Group 3 Modern Awards will also increase from the first full pay period starting on or after 1 February 2021.

WILL THE AHA|SA PROVIDE WAGE SCHEDULES? New wage schedules will be made available to Members prior to February 2021. Members will be able to access the schedules from the Members Section of the AHA|SA website and will be advised by Member Update when they are available. Back to Contents


“Members will be able to access the schedules from the Members Section of the AHA|SA website and will be advised by Member Update when they are available. ” HOW DOES THE DECISION AFFECT ENTERPRISE AGREEMENTS AND COLLECTIVE AGREEMENTS? Members will need to check the terms of their individual Enterprise Agreement or Collective Agreement to determine the impact of the Panel’s decision. Members who have an Enterprise Agreement or Collective Agreement in place will be affected if the wages in their agreement are less than the minimum rates in the relevant modern award as at the first full pay period commencing on or after the applicable commencement date of the increase to the modern award rates. Section 206 of the Fair Work Act 2009 (Cth) requires that the base rate of pay under an enterprise agreement must not be less than the modern award rate or the national minimum wage order rate. Back to Contents

For those Members under the AHA|SA/LHMU Collective Agreement (nominal expiry May 2011) the base rates of pay under that Collective Agreement will increase from the first full pay period starting on or after 1 February 2021.

IFA’S AND SALARIES Members are reminded that when the increase to rates in the relevant Modern Award (e.g. Hospitality Industry (General) Award 2020) takes place it is also a good time to review salaries which have been calculated in accordance with one of the salary arrangements within the Awards/Agreements to ensure the salary is sufficient in line with the relevant Award/Agreement provisions. If an Individual Flexibility Agreement (‘IFA’) is in place, the IFA should also be reviewed, in order to ascertain whether any increase may be applicable. If Members have any questions in relation to this year’s Annual Wage Review and it’s impact, they can contact Owen, Didier or Gary at the AHA|SA office.

Endnotes 1 Summary of Decision, Annual Wage Review 2019-20, [2020] FWCFB 3501, see para [3] 2 Ibid, see Attachment 1 – Group 1 Awards: 1 July 2020 3 Ibid, see Attachment 2 – Group 2 Awards: 1 November 2020 4 Ibid, see para [52] W W W . A H A S A . A S N . A U

| Hotel SA | 31


David&Will 6–9am Weekdays

Informing Adelaide 32 | Hotel SA | W W W . A H A S A . A S N . A U

Back to Contents


AHA|SA Corporate Partner News THE KEY TO ADAPTING With the opening of the South Australian market, hoteliers across the state are opening to some uncertainty and an operating future that will look different in several ways. Fixed and variable costs are in focus as venues look to correct some inefficiencies, not only in gaming, but across their whole business. In gaming, many venues in other states are questioning the value of in-house links and removing them to claw back some hold, while staff costs are being realised through operational efficiencies. The long-awaited move to Bank Note Acceptors (BNAs) which will see efficiencies never experienced in this market with less money handling and reduced operational costs. Tied to gaining the most out of your gaming operation is effective product positioning and understanding what role each game plays on your floor. To get a ‘Game Entertainment Rating’ completed for your venue, contact Mark Keeley, Aristocrat State Manager SA & WA.

LIVE DEMO CRT NOW ON DISPLAY Innovations such as note acceptors, TITO (ticket in / ticket out) and other changes are getting loser to being introduced into SA pubs. A critical element of TITO is to install a Cash Redemption Terminal or CRT. CRTs act as note breakers and also allow players to cash out their winning tickets in a discrete and secure manner. Banktech has shipped a CRT across from NSW and have it installed in a venue in full “demo mode” for a limited time. “With AGE (Australian Gaming Expo) cancelled for 2020 and other trade events under doubt this presents a great opportunity for AHA members and key gaming staff to see our CRT in action,” says Banktech’s Michael Queale. “Plus we are offering some very keen early bird specials for those keen on making a commitment and locking in a deal.”

BIG SCREEN BRANDING NEWS Big Screen Video has refined, evolved and released new branding. Operating since 2011, the company has seen good growth over time and solidified its position in the industries it operates in. “Understanding what our clients look for when they come to us and what we deliver, it was clear the end result in any industry we work with is that ultimately we “bring spaces to life”.” A new video can be viewed on the company’s website.

Back to Contents

To view a full list of the AHA|SA’s valued Corporate Partners CLICK HERE 

BUNNINGS OFFERS HYGIENE RANGE Bunnings Trade provides easy access to essential supplies such as hand sanitiser, face masks and cleaning products to AHA|SA members to keep them trading safely. Hand sanitiser and KN95 Face Masks are now available throughout the Bunnings store network for collection or delivery, and large commercial orders are also available on application to organisationsSA@ bunnings.com.au The company can also arrange collection of pre-prepared orders through its store network, and deliveries can also be arranged at a small cost to save time.

ENERGY ASSISTANCE FROM CLASS A If you need advice regarding solar, power factor correction, LED lighting, generators or battery storage without a hard sell, local SA solar company Class A Energy Solutions is here to help. “We have helped some of the biggest and smallest hotels in SA and we treat them as family,” says Trevor Schiller.

CLEAN LIFE HYGIENE SOLUTIONS Clean Life Australia has a range of Australian-made hygiene solutions, ensuring business protect their staff, clients and stakeholders by being clean, safe and responsible in the future world where hygiene is front of mind. As well as special offers for AHA|SA members, it offers a Priority List Supply , an online platform that enables orders to be placed that can be delivered anywhere across Australia, including regional areas. The Clean Life range includes wipes, sanitisers, antibacterial soap and food grade disinfectant. All sanitising products tested by independent laboratories and a claim set within the constraints of TGA guidance.

SWEET NEWS FROM CCA The Zero Sugar category is continuing to grow, with 36% of consumers claiming to actively look for alcoholic drinks that are ‘better for you’ rather than not drinking all together (Source: Canadian Club Better For You Concept Test, TLE, 2018). Introducing Jim Beam and Canadian Club Zero Sugar which are the #1 and #2 zero sugar brands. Since launching, CC has been the leading contributor to zero sugar growth. If Jim Beam White Zero was a standalone brand it would be in the top 10 of all RTD.

W W W . A H A S A . A S N . A U

| Hotel SA | 33


To view a full list of the AHA|SA’s valued Corporate Partners CLICK HERE 

AHA|SA Corporate Partner News DIAGEO’S $11.5 MILLION FUND

FINANCIAL HELP AND A NEW SERVICE

Bundaberg Rum has created an $11.5 million fund to support Australia’s hospitality industry.

DNA Security Solutions has over 12 years’ working with hospitality venues, and over 1,100 installed DNA systems.

Called ‘Raising the Bar’, the fund will support the recovery of bars, pubs, and clubs as they welcome back patrons

“We are pleased to have been able to look after those customers who reached out to us when they needed a little extra assistance with their payment terms – our priority has always been people first,” Tania Jolley says.

Any licensed venue in Australia, whether they’re regional or metro, and regardless if they’re a Bundaberg Rum or Diageo stockist, can apply for support through the ‘Raising the Bar’ initiative that will fund a two-year programme rolling out from July 2020. Both Government and industry have come out in support of the fund and how it will help this critical industry that accounts for 8 per cent of Australian jobs, get back on its feet. This announcement is part of a broader commitment by Diageo to invest US$100 million globally in ‘Raising the Bar’ programmes that will support venues as they recover from the impact of COVID-19.

EMPIRE LIQUOR INCREASES PORTFOLIO Amongst all of the craziness of recent months, Empire Liquor has added two new brands to its portfolio. Firstly, Crabtree Wine’s divine range of estate grown Watervale wines has something to offer everyone, including the Watervale Riesling, as well as the Grand Muscat, which is perfect for winter evenings. Also added to the portfolio is 2 Accents Gin from McLaren Vale, which has been “flying out of the warehouse”. The range includes a Dry Gin, their flagship Shiraz Gin, a Siren Gin, and a delectable Barrel-Aged Shiraz Gin.

“During Covid-19, we put a lot of thought into our new Technology as a Service (TaaS) model. Available from as low as $50 a week, allowing us to onboard our new customers with a very low monthly payment program. This doesn’t impact significantly on cashflow – and allows our customers to fully benefit from DNA Guardian immediately. She said the introduction of protective face masks has highlighted important issues that venues should be aware of and thinking about. “As a community, we can no longer rely solely on CCTV cameras as identification and evidence. We encourage venues to be proactive in assessing the risk of robbery which remains high in gaming venues in particular. The impact and costs on the business is always much higher than anticipated, often by hundreds of thousands of dollars. DNA Guardian technology uses a patented solution to mark the criminal exactly to the scene and time of the crime. The electronic system can be triggered by a staff member or by an existing alarm system. It operates silently and invisibly, so the criminal does not know he or she has been tagged.

FIVEAA FIVEaa is Adelaide’s only commercial talkback station, and it has special advertising offers for AHA|SA members, including for “live reads”. The station has an active and engaged audience who tune in on-air and online for the most up to date information in current affairs as well as a loyal commercial client base who know that FIVEaa provide them with creative and commercial solutions that benefit their business.

PROTECT YOUR CUSTOMERS AND STAFF!

Frontline Hygiene

Various options to suit your premises. Manual and automatic dispensers available. Flexible servicing options. High impact signage engages customers. We offer the following services:

Publican Shayne White of the Arab Steed Hotel with their current Wines of the Month from Crabtree Wines, supplied by Empire Liquor.

34 | Hotel SA | W W W . A H A S A . A S N . A U

• Carpet Cleaning • Pressure Cleaning • Window Cleaning

• Test and Tag • Pest Control

Contact Us (08) 8121 9316 or info@frontlinehygiene.com.au

Back to Contents


AHA|SA Corporate Partner News GALIPO FINANCE ASSISTANCE The Galipo Foods finance team worked with individual businesses to help manage their cash flow during this difficult time. In addition, Galipo kept up its high level of service during the lockdown, providing a five-day per week delivery schedule to best serve hotels and other businesses that were able to trade for takeaway.

HOSTPLUS SUPPORTING BUSINESS AND EMPLOYEES As pubs and clubs are having to adapt to the ongoing COVID-19 pandemic restrictions placed on their daily operations to continue to service their customers, it’s imperative that employees are also supported during this time. Hostplus has also had to make changes in terms of the way it works and services its members. That includes keeping employers updated on how the unfolding situation might affect their business and offering support wherever possible. It also understands the impact COVID-19 has had in terms of financial stress for hotel employees. While the longer-term purpose of superannuation is to plan for their retirement, Hostplus recognises that for some people there are more immediate needs and requirements. Hostplus Superannuation Advisers licensed by Link Advice Pty Limited and Hostplus Financial Planners licensed by Industry Fund Services Limited are here to help when it comes to: • Budgeting advice including fixed and flexible expenses • Options for deferral or temporary relief, including loans and utilities • Services Australia (Centrelink) eligibility, including JobKeeper, JobSeeker benefit • Financial product advice recommendations, including eligibility for special COVID-19 related early access to super.

LIQUOR LEGENDS The impact of COVID-19 on the retail side of our business has been enormous. Looking at March through to May, our sales grew +21%, transactions +6% and average spend +14% like for like. Rewards Members played a key part in driving businesses by shopping 38% more frequently this year compared to year ago. Currently we have over 567,000 rewards members and recruiting +10,500 each month. Our mission is to ensure we are providing industry leading solutions to our members in this unpredictable market. This includes accelerating the launch of our digital commerce strategy. We have designed an intense National Digital Strategy utilising local area marketing technology, tailored to amplify our online platform and support our outlets with best practice YouTube, Facebook and Instagram advertising, Search Engine Marketing, and real time analytics. Back to Contents

To view a full list of the AHA|SA’s valued Corporate Partners CLICK HERE 

The tool will raise awareness of our brand and current catalogue offers, to keep our stores top-of- mind and provide a new channel to drive sales.

TTEG NEW FREE SERVICE Trans Tasman Energy Group (TTEG) is currently offering complimentary invoice validation services for all AHA|SA members - regardless of your energy broker - to remove risk and receive value for money during uncertain times. TTEG understands that large market electricity invoices can appear complicated and congested with technical jargon. And it says in its experience, one in twenty electricity invoices contain billing errors, network tariff misallocations and unfair direct metering agreement charges. Often, billing errors and overcharging can go unnoticed, leaving hoteliers with bill shock.

EMPLOYMENT LAW IN HOSPITALITY: TIPS Employment law specialist Michael Kay of Wallmans Lawyers has provided some valuable tips for hotels. JobKeeper Directions: An Update The Fair Work Commission recently overturned an employer’s “JobKeeper” direction, on the basis the employer “overplayed its hand” and went too far with a reduction in working hours. In Jones v Live Events Australia Pty Ltd [2020] FWC 3469 (3 July 2020), the FWC found that a 50% reduction in hours was disproportionate to the down-turn in work, it found that a 20% reduction in hours was appropriate. Tip: If issuing a JobKeeper direction, don’t go further than you have to. Be sure that you can justify the reduction you’re proposing. Unpaid Work Trials – Proceed with Caution Unpaid work trials continue to be controversial. Whether they are lawful depends on a number of factors, including the duration and nature of the work. Unpaid work has recently been on the radar of the Fair Work Ombudsman. Tip: Asking a potential bartender to make a cocktail during an unpaid job interview is probably appropriate; working an entire shift (unpaid) is probably not. If you regularly do unpaid work trials, exercise caution. Get advice. First Port of Call AHA (SA) members are fortunate to have access to the AHA|SA IR/HR team. However, if you require further advice or assistance in relation to legal issues, Wallmans Lawyers has a First Port of Call service which means that your first 15 minute phone call is free.

W W W . A H A S A . A S N . A U

| Hotel SA | 35


Winners and Losers During the Great Recession THE POSITIVE IMPACT OF MARKETING EXPENDITURES BY CORNELL UNIVERSITY. SINGH, A., & DEV, C. S. (2015). Cornell Hospitality Quarterly, 56(4), 383-396. doi:10.1177/1938965514564214 Reprinted with permission. All rights reserved.

Businesses learn from experience - and past downturns provide valuable insights for today's Covid-19 crisis and how to manage your way out of it. This study from Cornell University is intended as an in-depth read for members wanting to take a sophisticated approach to future marketing investment. The U.S. lodging industry suffered one of its worst declines in financial performance in 2009, a direct result of the global financial crisis and ensuing economic recession. In that year, data from PKF Hospitality Research (2010) recorded an overall 18.5 percent decline in average daily rate and a painful 37.4 percent drop in net operating income (NOI) for all hotels. Similarly, Smith Travel Research’s (STR) Host Study observed a 16.6 percent decline in revenue per available room (RevPAR), which led to a 19.5 percent drop in gross operating profit (GOP), as well as a 38 percent decline in pre-tax income (Smith Travel Research [STR] 2010). Although the pain was felt industry-wide, the luxury segment exhibited the industry’s worst performance in percentage terms with a 23.6 percent decline in RevPAR and a 37 percent decline in GOP (Wilson 2010).

PURPOSE OF THE STUDY Although the entire industry felt the effects of the recession, clearly some hotels performed better than others. In this study, we examine the differences in financial performance between matched sets of winners and losers. This analysis extends and complements the literature on hotel financial performance, as it intentionally focuses on a narrowly defined time period to better understand the effects of recession on financial performance.

RESEARCH ON HOTEL REVENUE The well of data on hotel performance is deep but not broad, as most data are provided by two comprehensive sources: PKF Hospitality Research and STR. However, operating data are otherwise difficult to acquire. Among the studies that have utilized STR data, Enz and Canina (2002) showed variations in performance across regions, states, and cities, as well as across chainscale segments. In that regard, Mattila, O’Neill, and Hanson (2009) found that hotels in upper quartiles of NOI were significantly more likely to be lower priced, midscale, limited-service properties, while high-price upscale and luxury hotels resided in the lower NOI quartiles. Several studies have attempted to parse the relative strength of occupancy and daily rate in driving income measures. O’Neill and Mattila (2006a), for instance, concluded that occupancy was the larger contributor to a hotel’s NOI and that hotels with higher occupancy rates were more profitable during recessionary periods while the effect of ADR depended on the state of the economy. In a subsequent study, however, O’Neill and Mattila (2006b) observed a lower effect of occupancy on NOI when NOI was measured in raw dollars. Then again, when NOI was measured as a ratio to revenue, both ADR and room revenues were found to be insignificant predictors of NOI. Other studies have examined the effect of brand affiliation on financial ratios. While NOI for branded and independent hotels show no significant differences during periods of economic 36 | Hotel SA | W W W . A H A S A . A S N . A U

expansion, research by O’Neill and Carlback (2011) reveals that branded hotels with higher occupancy levels achieved significantly higher NOIs when compared with independent hotels during an economic recession. Furthermore, branded hotels were found to be more valuable and profitable than independent hotels because of their lower variability in profit. Moreover, some brands generated higher NOI than others (O’Neill and Mattila 2006a, 2006b). Guest satisfaction is another factor with a positive influence on both occupancy and ADR, especially for brands with higher levels of guest satisfaction (O’Neill and Mattila 2004). A study by Love, Walker, and Sutton (2012) evaluated a brand’s contribution to hotel performance by measuring the change in revenue when a hotel switched brands. Their case study of nine hotels illustrated the use of a RevPAR index as a tool for estimating the amount of intangible value that could be attributed to a hotel’s brand affiliation. Based on an analysis of six brands, Love, Walker, and Sutton (2012) concluded that some hotels performed significantly better when operating under an upper-tier brand as opposed to operating as independent hotels or marginally branded hotels. The link between hotel financial performance and market value has also been well documented (O’Neill 2004; O’Neill and LloydJones 2002; O’Neill and Xiao 2006). For example, following the events of 9/11, declines in RevPAR performance led to a drop in hotel values stemming from the limited availability of financing and widespread market uncertainty that depressed hotel sales transactions (O’Neill and Lloyd-Jones 2002). Although a hotel’s brand contributes significantly to its market value, the effects of brand vary across chainscale segments (O’Neill and Xiao 2006). Highlighting factors that influence hotel performance, a study by Xiao, O’Neill, and Mattila (2012) found that the best performing hotels were located in particular areas of the country within specific segments, affiliated with certain brands, and managed by a select group of operators. In that vein, O’Neill and Xiao (2006) suggested that superior management helps owners maximize financial performance. Despite research linking occupancy to income, lodging demand studies have also provided strong evidence pertaining to the effect of pricing strategies on hotel performance. Perhaps the most consistent thread in this line of research involves hotels’ relatively low-price elasticity and the related finding that discounting relative to competitors results in relatively lower performance (see, for example, Canina and Carvell 2005; Canina and Enz 2006; Enz, Canina, and Lomanno 2004, 2009). Of particular interest to our recession-driven study, Enz, Canina, and Lomanno (2009) suggest that price discounting does not always work during recessionary periods because of demand Back to Contents


inelasticity. Thus, revenues will decline when prices are reduced and price promotions are insufficient to stimulate demand to generate higher revenues. Enz, Canina, and Lomanno’s (2004, 2009) advice to hotel owners and managers: maintain rate integrity during a recession even when competitors do not.

Going beyond the studies by Enz, Canina, and Lomanno (2009) and Love, Walker, and Sutton (2012), we also link revenue metrics with profitability measures. Again, we are unaware of studies other than those two that specifically account for the relative difference in RevPAR between a hotel and its competitive set.

A particular element of interest in our study is the effect of expenses on revenues and profits. Needless to say, operating expenditures generally reduce net income, but research has also indicated that marketing expenditures significantly influence hotel performance. Based on a 2005 exploratory study of 2,815 hotels in the period following 9/11, for instance, O’Neill, Hanson, and Mattila (2008) provided evidence that higher marketing expenditures translated into higher room revenues and NOI. Not surprisingly, however, this effect differed by chainscale and by type of marketing expenditure. In particular, franchise fees yielded mixed findings. In this study, we answer the call by O’Neill, Hanson, and Mattila (2008) for further research to provide hotel operators with relevant and useful information about the relationship between marketing expenditures and hotel performance.

Our goal in analyzing the financial performance of winners and losers was to find out what makes a hotel a winner or loser in a tough economic environment. In addressing this question, we particularly analyze the effects of marketing expenditures, which had noticeably diverse effects between winning and losing hotels. We note that our approach to classifying hotels by revenue index is consistent with approaches adopted in other research that has provided useful insights into hotel characteristics and financial performance when hotels are grouped by various financial outcomes (Mattila, O’Neill, and Hanson 2009; Xiao, O’Neill, and Mattila 2012). In short, we identify the marketing expenditure categories that created the most and least value for hotel managers and owners during the recession.

STUDY OBJECTIVES AND SCOPE Our study’s primary objective is to compare the financial ratios of the high and low performers at the nadir of the great recession in 2009 based on occupancy, ADR, and RevPAR and also on GOP and NOI. Of greater interest, we examine the relationship between marketing expenditures and profitability at the property level within the two groups of hotels to determine whether changes in marketing expenditures had any effect on hotel profitability. To the best of our knowledge, ours is only the second study to analyze the link between marketing expenditures and financial performance in this way. Having said that, we must note that our study differs from O’Neill, Hanson, and Mattila (2008), in that our data come from a period of economic recession while their study was performed during a period of economic expansion. There are four other differences between the O’Neill et al. study and the one we describe in this article. In addition to using absolute levels to measure variables, we perform our analysis using percentage changes in both operating and financial metrics to capture the effects of managerial strategies on various revenue, expense, and income-related items during the recession. Measuring changes over time using percentages rather than absolute dollar figures to quantify financial performance is more useful when economic or market conditions change (Love, Walker, and Sutton 2012), and it also allows comparison between hotels of different sizes. Because third-party managers derive some of their incentive fees from gross operating profit, we include GOP as an explanatory variable. In addition, we noted that O’Neill, Hanson, and Mattila (2008) separated franchise and loyalty-program fees, which may be why they observed mixed findings regarding the franchise fees. Thus, we aggregate all franchise-related and loyalty expenses into a single line item, in accordance with the Uniform System of Accounts for the Lodging Industry (Hotel Association of New York City 2006). Finally, drawing on the study by Love, Walker, and Sutton (2012), we use a RevPAR index to capture the performance of each hotel relative to its competitive set, thereby allowing us to make a direct comparison (Enz, Canina, and Lomanno 2009). This competitive set approach differs from the common approach of computing a RevPAR average for a segment of hotels located across the country. Back to Contents

STUDY METHODS AND PROCEDURES To develop our sample of 416 hotels, we applied several filters to a set of 1,581 U.S. hotels drawn from the PKF Hospitality Research Trends® database. Eligible hotels had at least three years of detailed operating and financial data from 2007 through 2009 on revenue and expense measures such as room revenue, total revenue, occupancy, ADR, GOP, and NOI, as well as other characteristics, such as management company, brand, chainscale, property type, and markets (MSA). To create competitive sets using STR’s definitions of markets and submarket hotel locations, we manually matched each hotel to a similar set of competitive and comparable hotels using submarket location, size, and the established STR chainscale segments. We excluded hotels for which we were unable to find matches, and we also excluded 867 economy hotels, because they all belonged to the same brand and would have biased the sample. Our competitive sets were made up of three to five hotels within a chainscale segment in a submarket. One limitation we faced in the matching process was the inability to add more hotels to a competitive set in a segment if we found too few hotels competing in a particular submarket. In many submarkets, we were able to match only two properties, which is why we were forced to exclude so many hotels. In practice, managers would typically add hotels that are one notch above or below their chainscale segments to create a competitive set of a minimum of four but preferably five hotels (including their own hotel) so that they could participate in and obtain STR reports.1 Hence, our final sample of 416 hotels represented a mix of hotels with a variety of branded and third-party management and franchise combinations. Of these, we were able to compare 206 winning and losing properties. To develop the RevPAR index, we first calculated the average RevPAR for each competitive set and divided each hotel’s individual RevPAR by the competitive set’s RevPAR average. To classify hotels as winners or losers, we adapted the approach of Love, Walker, and Sutton (2012), who used an index score of 80 percent and 120 percent as cutoff points to classify hotels as performing below average or above average. Our adaptation was to use a RevPAR index of 90 percent and below for the losers and 110 percent and above for the winners, based on the benchmark commonly used in performance clauses found in hotel W W W . A H A S A . A S N . A U

| Hotel SA | 37


management agreements. Typically, these agreements consider the management company to be in default if the RevPAR index drops below 90 percent of competitive set average. Logically, if one is in default at the 90 percent level, then a hotel would be a high performer at 110 percent. We considered hotels with RevPAR between 90 percent and 110 percent to be average performers and set them aside. In our sensitivity analysis, we replicated Love, Walker, and Sutton (2012) cutoff of 80 percent and 120 percent to test the robustness of our results, as shown later. We classified the hotels as winners or losers using 2007 financial data, just before the recession. Our final sample comprised 100 highperforming hotels and 106 low-performing hotels.

minimize the loss of observations, we consolidated marketing expenses into four main categories, as shown in Exhibit 1. These categories are marketing labor (payroll and related expenses), franchise expenses, advertising-related expenses, and other sales expenses. Marketing labor included salaries, wages, and benefits; franchise expenses included franchise and royalty fees, franchise assessments and affiliation advertising fees, and cost of loyalty programs; advertising related expenses comprised e-commerce, media and outdoor advertising, and other marketing expenses; and other sales expenses comprised costs associated with personal sales efforts, trade shows, familiarization tours, and outside sales representatives.

Exhibit 1: Breakdown of Sales and Marketing Expenses.

We performed our analysis on hotel performance from 2007 through 2009 in terms of dollar amounts per available room, percentage changes, and a common-size ratio analysis (ratio to sales) for all our measures. Despite smaller sample sizes, we also compared differences in franchise related expenses. In the interest of parsimony, we present only results that indicated differences between winners and losers and provided relevant and useful insights into financial performance.

VARIABLE

DEFINITION

Marketing labor

Salaries and wages, Employee benefits, Total payroll and related expenses

Franchise expenses

Franchise and royalty fees, Franchise assessments and affiliation advertising, Loyalty programs and affiliation fees, Total franchise expenses

Advertising related

Marketing e-commerce, Media/outdoor advertising, Other marketing expenses, Total advertising and related expenses

Other sales expenses

Other sales expenses including family trips, outside sales reps, trade shows, local promotions, complimentary gifts and services, training, travel

Sales and marketing

Total sales and marketing dept. expenses

For all hotels in the study, we computed occupancy, ADR, and RevPAR. To control for hotel size, we also scaled all our profitability measures by the number of available rooms during the year. Thus, the bottom-line measures we derived were GOP per available room (GOPPAR) and NOI per available room (NOIPAR). Our analysis included the following four key expense categories because of their magnitude and importance in controlling operations: room department expenses, administrative and general expenses (A&G), property operations and maintenance (POM) expenses, and utilities expenses. PKF’s Trends report (PKF Hospitality Research 2010) showed that room department expenses absorbed 27 percent of total room revenues, while total undistributed operating expenses equaled 27 percent of total revenues for full-service hotels and 30 percent for limitedservice properties. We ignored other departmental expenses such as food and beverage due to missing observations for many limited-service hotels and extreme variability in classifying these expenses. For our analysis of the relationship between marketing expenditures and profitability, we gathered data on each hotel’s marketing expenses, which average 8 percent of total revenues industry-wide. Marketing expenditures represent the second largest undistributed operating expenses incurred by a hotel after A&G expenses (PKF Hospitality Research 2010). We found some variation in our data and many missing observations for specific accounts, largely because full-service hotels typically had marketing departments that kept track of specific expenses while limited service hotels often did not have separate marketing departments or record those expenses. Consequently, to 38 | Hotel SA | W W W . A H A S A . A S N . A U

RESULTS - Descriptive Statistics The dataset comprised performance data for 416 hotels (1,248 observations) from 2007 through 2009 representing largely branded hotels. Of the 416 hotels, only twenty-three were independent and the rest (393) were branded or chain affiliated, a makeup that is generally consistent with that observed in other studies (Mattila, O’Neill, and Hanson 2009; O’Neill and Mattila 2006a). As indicated by the data shown in Exhibit 2, despite having fewer properties in the luxury and midscale with food and beverage segments, we observe two groups of similar size—100 winners and 106 losers. All segments are well represented in these two groups, although there is a slightly greater number of luxury and upper upscale hotels in the loser group than in the winner group. Exhibit 2: Hotel Frequency Statistics.

NO. OF HOTELS

OBSERVATIONS

%

Independent

23

69

5.3

Branded

393

1179

94.7

Total

416

1248

Luxury

26

78

6.3

Upper upscale

137

411

32.9

Upscale

96

288

23.1

Midscale with F&B

3

9

0.7

Midscale without F&B

65

195

15.6

Extended stay

89

267

21.4

416

1248

High performers

100

300

24

Average Performers

210

630

50.5

Low performers

106

318

25.5

416

1248

AFFILIATION

Chainscale

Total Performers

Total

Back to Contents


Low admin fees Strong long-term returns More super for you

Hostplus. We go with you. Issued by Host-Plus Pty Limited ABN 79 008 634 704, AFSL 244392 as trustee for the Hostplus Superannuation Fund (the Fund) ABN 68 657 495 890, MySuper No 68 657 495 890 198. This information is general advice only and does not take into account your personal objectives, financial situation or needs. You should consider if this information is appropriate for you in light of your circumstances before acting on it. Please read the relevant Hostplus Product Disclosure Statement (PDS), available at www.hostplus.com. au before making a decision about Hostplus. Past performance is not a reliable indicator of future performance and should never be the sole factor considered when selecting a superannuation fund. INH 1217 0720


As shown in Exhibit 3, the descriptive statistics show that, on an absolute dollar basis, winners (by definition) enjoyed higher ADRs, RevPARs, and TRevPAR than losers, as well as higher overall occupancy rates. In terms of median values, winners outperformed losers by 7 percent in occupancy, $27 in ADR, and $30 in RevPAR. So, each $1 of ADR difference translated into an approximately $1 RevPAR premium. Exhibit 3: Descriptive Statistics (2007-2009). (See table below) Although winners incurred greater expenses relative to losers for room expenses and all undistributed operating expenses, they also achieved higher revenues and profits. For example, winners spent on average $12 per available room on A&G expenses compared with $8 for losers. When the expenses are compared on a ratio-to-sales basis, it appears that losers expended more

as a proportion of sales in all major expense categories, except for sales and marketing expenses. Looking at our measure of interest, winners, on average, spent about eight cents out of every dollar of revenue on sales and marketing efforts while losers spent only six cents. Regardless of whether they were measured on an absolute dollar basis or as a percentage of sales, winners were more profitable than losers with respect to GOPPAR and NOIPAR. Winners generated a mean of $23 in net operating income per available room compared with losers (median, $17), four percentage points higher when measured as a ratio to sales. Thus, winners generated thirty-six cents in NOI out of every dollar of revenue compared with thirty one cents for losers. Looking at overall marketing expenditures, we find that winners incurred a higher overall level of marketing expenditures than

WINNERS TOP-LINE MEASURES Number of rooms

LOSERS

M

MEDIAN

SD

M

MEDIAN

SD

247

146

311

268

143

254

Occupancy (%)

72.3

72.8

8.5

65.2

65.5

10.7

ADR

149.1

116.8

86.1

97.3

89.5

47.5

RevPAR

108.7

86.8

65.0

65.5

57.4

39.8

TRevPAR

147.3

92.6

128.6

86.3

65.4

63.5

Room department expenses

25.37

20.26

16.37

16.74

12.88

11.73

Room expenses/room revenues (%)

23.31

23.24

4.79

25.04

24.62

7.10

Admin and general

12.36

8.38

11.21

8.27

6.02

5.42

A&G/Total Revenues (%)

8.68

8.62

1.72

10.45

10.06

2.71

Sales and marketing

11.47

9.58

8.64

6.06

4.51

5.70

Sales and marketing/total revenues (%)

8.31

7.49

2.90

6.02

6.09

3.88

Property, operations, maintenance

6.70

4.70

5.78

4.50

3.28

2.92

POM/total revenues (%)

4.77

4.58

1.25

5.84

5.64

1.82

Utilities

5.65

4.28

3.80

4.02

3.32

2.17

Utilities/total revenues (%)

4.51

4.21

1.63

5.79

5.26

2.53

GOPPAR

58.8

44.1

43.7

32.3

26.7

23.6

GOPPAR/TRevPAR (%)

43.4

43.2

9.4

40.3

39.9

14.1

NOIPAR 47.6

37.2

35.7

24.9

20.7

18.8

NOIPAR/TRevPAR (%)

35.6

35.7

9.9

31.4

32.4

14.5

Marketing labor

3.30

2.36

3.50

2.52

2.08

2.34

Marketing labor/total revenue (%)

1.97

2.00

1.15

2.10

2.00

1.76

Franchise expenses

6.00

4.26

5.01

3.17

2.12

3.00

Franchise expenses/total revenue (%)

4.92

3.66

3.00

3.50

3.32

1.85

Advertising related

0.93

0.42

2.23

0.57

0.31

0.73

Advertising/total revenue (%)

0.51

0.45

0.72

0.60

0.43

0.67

1.65

0.83

2.18

1.01

0.36

0.22

1.14

0.71

1.14

0.99

0.50

1.16

Major operating expenses ($PAR)

Profitability measures ($PAR)

Marketing expenditures ($PAR)

Other sales expenses Other sales/total revenue (%)

Note. All figures are expressed as $PAR. With the exception of occupancy, italicized figures represent ratios (percentage) to sales. RevPAR = revenue per available room; TRevPAR = total revenue per available room; $PAR = Dollar per available room; POM = Property Operations and Maintenance; GOPPAR = gross operating profit per available room; NOIPAR = NOI per available room. 40 | Hotel SA | W W W . A H A S A . A S N . A U

Back to Contents


losers. Winners spent an average of $11.50 per available room on total marketing expenditures (median, $9.60) compared with $6.10 per available room for losers (median, $4.50), a difference of more than $5 per available room. Looking at the four categories of marketing expenditures, the amounts spent on marketing labor, franchise expenses, advertising, and other sales expenses were greater for winners than for losers. However, in terms of ratio to sales revenue, winners incurred a greater proportion of franchise expenses and other sales expenses compared with losers. On average, winners spent almost 5 cents out of every dollar on franchise-related expenses compared with 3.5 cents for losers. However, the proportion of marketing labor costs and advertising expenses appear to show few if any differences between the two groups. In our assessment of the category of franchise-related expenses, we find, on average, winners spent $4.45 per available room on franchise royalty fees, $2.51 on franchise marketing assessment fees, and $1.78 on loyalty-program fees. In contrast, losers incurred only $2.47 for royalties, $1.50 for marketing, and $1.02 for loyalty programs. Similarly, as a ratio to sales, each of this above-mentioned franchise-related expense is also greater for winners when compared with losers. Winners spent, on average, 3.5 cents out of every dollar on royalty fees, 2.2 cents on marketing assessment fees, and 1.5 cents on loyalty fees. However, losers spent 2.6 cents on royalties, 1.8 cents on marketing assessments, and 1 cent on loyalty fees.

UNIVARIATE ANALYSIS Given our concerns over the presence of outliers in the data, we employed both parametric (unequal variance t tests) and nonparametric tests (Wilcoxon Rank-Sum tests) of differences. We first performed a levels analysis by comparing the two groups based on absolute dollar amounts per available room. In this analysis, we found significant differences between winners and losers by all the top-line measures, operating expenses, and profitability measures. Having noted these significant findings, we move on because they yielded few insights into how winners and losers responded to recessionary effects. Instead, our focus shifts to evaluating percentage changes in topline measures, operating expenses, and profitability to determine whether there were any differences between the two groups that would capture managerial behavior during the recession. The results of these tests of differences are presented in Exhibit 4. Exhibit 4: Parametric and Nonparametric Tests of Differences between Winners and Losers. (See table below) What is striking about the results is the lack of any significant differences between the winners and the losers at the 5 percent significance level by all measures from 2007 through 2008, followed by a substantial change in 2009. Holding all else constant, if winners and losers employed similar strategies in response to the recession, we would have observed no significant differences in 2009. Instead, their responses differed

2007-2008 % CHANGE MEASURES

2008-2009 % CHANGE

DIFFERENCE

T STAT

Z STAT

DIFFERENCE

T STAT

Z STAT

Occupancy

0

0.02

−0.60

−.020

−1.49

−2.09**

ADR

0

−0.06

−0.03

−.019

−2.05**

−2.16**

RevPAR

−.01

−0.07

−0.92

−.039

−3.34***

−2.96***

TRevPAR

0

−0.02

−0.66

−.041

−3.54***

−3.02***

Rooms expenses

−.025

−1.01

−0.63

−.007

−0.28

−0.90

Admin and general

−.042

−1.46

−0.73

.033

1.03

1.20

Sales and marketing

−.029

−0.97

−0.63

−.068

−2.07**

−1.95**

Top-Line

Operating Expenses

POM

−.045

−1.57

−0.18

.009

0.32

−0.17

Utilities

−.045

−1.55

−0.87

.019

0.68

0.48

GOPPAR

.002

0.09

−0.42

−.102

−4.69***

−4.08***

GOPPAR/TrevPAR

−.021

−1.38

−1.36

−.056

−3.20***

−2.83***

NOIPAR

−.014

−0.48

−0.69

−.156

−4.84***

−4.62***

NOIPAR/TrevPAR

−.029

−1.86

−1.74

−.072

−4.04***

−3.44***

Marketing labor

−.235

−0.18

1.61

−.046

−0.33

0.04

Franchise expenses

−.057

−1.85

−0.78

.003

0.07

−0.77

Profitability

Sales and Marketing

Advertising related

−.448

−0.36

−1.42

−.039

−0.18

−0.03

Other sales expenses

−.074

−1.01

−0.93

−.200

−2.75***

−2.80***

Note. RevPAR = revenue per available room; TRevPAR = total revenue per available room; POM = Property Operations and Maintenance; GOPPAR = gross operating profit per available room; NOIPAR = NOI per available room. **Significant at the 5% level. ***Significant at the 1% level. Back to Contents

W W W . A H A S A . A S N . A U

| Hotel SA | 41


significantly in 2009, which suggests that hotel managers employed divergent strategies in response to the recession. To begin with, both groups of hotels saw revenue and occupancy declines between 2008 and 2009. So, for example, losers’ occupancy rates declined from a mean of 66.4 percent in 2008 to 60.7 percent in 2009, a 5.7 percent decline. At the same time, the winners’ occupancy loss was slightly less dramatic, from 73.1 percent to 68.4 percent. Even though the percentage decline was greater for winners (6.4 percent vs. 5.7 percent for losers), the winners increased their occupancy premium over losers by one percentage point in 2009. Note that the percentage change in occupancy between the two groups between 2008 and 2009 is not significantly different based on the parametric tests of differences. However, the percentage change in ADR is significantly different between the two groups, although it is clear that both groups attempted to use rate discounts to stem occupancy losses. Average daily rates for losers declined by a mean of 13.3 percent between 2008 and 2009 (median, 14.8%) compared with an 11.6 percent decline for winners (median, 11.0%). This greater decline in losers’ room rates translated into a greater revenue loss for losers, although both groups saw lesser percentage changes in RevPAR and TrevPAR. Losers’ RevPAR declined by 21.1 percent in 2009 (TRevPAR, by 20.8%), compared with a decline of 17.2 percent for winners (TRevPAR, by 16.6%). Both groups of hotel managers responded to the revenue loss with expense reductions, but it appears that not all of them could slash expenses to the same extent, and we see a difference in the two groups. Expense reductions ranged from 4 to 12 percent, far less than the drop in revenues. Managers in both groups

of hotels reduced room department expenses, A&G expenses, marketing expenses, maintenance expenses, and utilities expenses. With the exception of room expenses, the reductions in A&G, maintenance, and utilities expenses was greater for winners than for losers. With the exception of marketing expenses, we find no statistically significant differences between winners and losers in reducing room expenses and other undistributed operating expenses. Looking more closely at reductions in marketing expenses, we see a significant difference between winners and losers. Losers reduced marketing expenses to a greater extent (17.5%) than winners did (10.6%). Perhaps most surprising, we found that losers reduced other sales expenses by 10.5 percent, while winners increased spending for those activities by 9.5 percent. As we indicated above, this category includes items related to personal sales efforts such as complimentary gifts and services, familiarization trips, local promotions, outside sales reps, training, travel, and trade shows (Hotel Association of New York City 2006). To provide further information on franchise-related expenses, we also analyzed differences between winners and losers in the amounts (per available room) incurred for royalty fees, marketing assessment fees, and loyalty program fees. Compared with losers, winners incurred significantly greater amounts of royalty fees, marketing assessment fees, and loyalty-program fees. These differences were significant at the 1 percent level over the three year period from 2007 through 2009. Similarly, the differences in these three specific franchise-related expenses, as a ratio to sales, were also significantly higher for winners than for losers.

Keep your business performing at its peak with MAX Technical Services.

Help Desk

Workshops

24x7 Help Desk staffed by experienced and technically proficient operators

Extensive workshop facilities around Australia with full online pre-staging, configuration and testing services.

Field Technicians

Logistics

Every level of technical support, quickly and efficiently allocated on demand.

Our logistics systems are capable of managing and tracking millions of transactions and movements annually.

Contact us today max@tabcorp.com.au max.com.au /maxcomau © 2020 Tabcorp Holdings Limited. This document contains confidential information belonging to Tabcorp Holdings Limited and its subsidiaries (MAX) and is being shared for the purpose of providing information in relation to MAX’s product and service offerings. MAX does not warrant or guarantee the future performance of the venue and accepts no liability for any loss or damage incurred as a result of any reliance on the information. It is recommended that the venue undertake its own due diligence and seek independent professional advice about the content of this document, as required.

42 | Hotel SA | W W W . A H A S A . A S N . A U

Back to Contents


Our data demonstrate the staggering overall effect of the economic recession on hotel profitability. But it is clear that this effect differs significantly between winners and losers. Losers suffered a 34.1 percent decline in GOPPAR and a 43.1 percent NOIPAR drop in 2009, compared with a 23.9 percent GOPPAR decline and a NOIPAR drop of 27.5 percent for the winners. The results were similar when we computed GOP and NOI as a percentage of total revenue. Once again profitability declined for both groups of hotels, but the decline was significantly greater for losers than for winners. For losers, GOP as a percentage of total revenue declined from 42.3 percent in 2008 to 34.7 percent in 2009. Their NOI drop was similar, from 34.0 percent to 24.7 percent. For winners, those figures were 2008 GOP, 44.4 percent; 2009 GOP 40.3 percent; winners’ 2008 NOI, 36.9 percent; and 2009 NOI, 31.9 percent. The difficulty hotel managers experienced in quickly reducing expenses to match revenue declines further magnified the negative effect on profitability, as indicated by the flow-through ratio. Dividing the changes in GOP and NOI by changes in RevPAR, we found the overall mean flowthrough ratios for winners (1.41 for GOP and 1.61 for NOI) were lower than those for losers (1.65 for GOP and 2.30 for NOI) indicating that, despite drops in absolute revenues and profits, winners were able to translate more of their revenue into profit compared with the losers.

ADDITIONAL DESCRIPTIVE FINDINGS To provide further information on the effects of top-line measures on profitability, we sorted the sample data into four quartiles based on occupancy, ADR, RevPAR, GOPAR, NOIPAR, and additionally GOP and NOI as a ratio to total revenue, yielding the following observations: • Hotels with high occupancy rates, high ADRs, or high RevPARs also had high GOP and NOIPAR but lower GOP and NOI ratios to total revenue. Typically, these were large full-service hotels within the luxury and upper upscale segments located in urban areas. These findings are consistent with those of O’Neill and Mattila (2006a) on the basis of absolute dollar levels. Similar results are obtained if hotels are sorted on the basis of GOPPAR and NOIPAR. • Hotels with a high GOP and NOI ratio to sales also had lower occupancy rates, ADR, and RevPAR. These hotels were largely midscale limited-service hotels without food and beverage facilities and middle- or upper-tier extended stay properties. These results are consistent with those of Mattila, O’Neill, and Hanson (2009) as well as data reported in annual profitability

MEASURES

REVPAR

GOPPAR

NOIPAR

LABOR

reports produced by STR and PKF that show limited-service hotels enjoy higher profitability ratios largely because of their operating cost and scale efficiencies. • Among winners, extended stay properties and those in the luxury segment exhibited the lowest percentage change in all top-line and profitability measures, implying greater success on the part of management in these hotels to minimize the effect of the recession. • We also computed changes in the ADR and occupancy indexes based on a hotel’s performance relative to its competitive set, following Enz, Canina, and Lomanno (2009). The results of this analysis reveal that losers’ RevPAR performance deteriorated relative to that of their competitive set in 2009, driven largely by greater drops in ADR relative to occupancy changes. However, winners improved their RevPAR performance relative to that of their competitive set in 2009, driven by increases in occupancy. For example, a less than 1 percent (0.04) drop in the ADR index coupled with a 1.54 percent increase in the occupancy index led to a 1.29 percent improvement in the RevPAR index for winners in 2009. However, a 1.37 percent decline in the ADR index combined with a 1.04 percent decline in the occupancy index resulted in a 2.68-point decline in the RevPAR index for losers. This percentage change in RevPAR index between winners and losers is statistically significant (t = −4.28, p ≤ .01). Hence, unlike losers, winners improved their RevPAR performance relative to their competitive sets during the recession by dropping relative rates to enhance relative occupancy.

MULTIVARIATE ANALYSIS Our final set of analyses examined the relationship between, on one hand, marketing expenditures and revenue, and, on the other hand, profitability. Although research has shown the varying effects of marketing expenditures on room revenue and net income, the effects vary by chainscale and type of marketing expenditure (O’Neill, Hanson, and Mattila 2008). Unlike other studies, we compare hotel performance during a recession, and we analyze percentage changes in the performance measures to provide additional insights into the relationship between marketing expenditures and revenue and profit. Exhibit 5: Correlations between Top-Line Metrics and Bottom-Line Profitability. (See table below) We first examine the correlation coefficients between the revenue, profitability, and marketing measures to provide some preliminary insights, and then employ regression analysis to further test the relationships. Because we found some extreme outliers driving

FRANCHISE

ADVERTISING

OTHER

RevPAR

1.000

GOPPAR

.921*

1.000

NOIPAR

.854*

.900*

1.000

Labor

.039

.003

.014

1.000

Franchise

.357*

.298*

.289*

.011

1.000

Advertising

.059

.048

.047

.015

.048

1.000

Other

.033

.052

−.006

−.011

.058

.029

1.000

Total Mkt.

.320*

.241*

.227*

.084

.690*

.140

.336*

TOTAL MARKET

1.000

Note. Percent changes between 2007 and 2009; Pearson’s correlation *p < .01. RevPAR = revenue per available room; GOPPAR = gross operating profit per available room; NOIPAR = NOI per available room. Back to Contents

W W W . A H A S A . A S N . A U

| Hotel SA | 43


some of our results, we Winsorized the profitability and marketing measures at 1 percent of the high and low extremes of each variable’s distribution. Instead of dropping these observations, however, we replaced the extreme values with values equal to the high and low 1 percent of the variable’s distribution to mitigate the undue influence of these outliers. Furthermore, we also found that many hotels in our sample do not report marketing expenditures in all categories. Again we particularly refer to limited-service hotels that do not have separate marketing departments. Therefore, we also performed our regression analysis using only absolute dollar amounts and percentage changes for total marketing expenditures as an independent variable. As shown in Exhibit 5, based on percentage changes in the measures, total marketing expenditures are significantly and positively correlated with RevPAR, GOPPAR, and NOIPAR. This finding implies that an increase in marketing expenditures has a positive effect on revenue and profit. Furthermore, franchise expenses are also significantly and positively correlated with RevPAR, GOPPAR, and NOIPAR, indicating the importance of franchise expenses in influencing the performance measures. The relationship between both the levels of and changes in total marketing expenditures and RevPAR, GOPPAR, and NOIPAR are presented in Panels A and B in Exhibit 6. In each of these regressions, total marketing expenditures are regressed on top-line and bottom-line measures. A dummy variable equal to one represented the winners, while losers were the omitted or reference group. In addition, we included an interaction of the dummy variable with total marketing expenses to capture differences between the two groups of hotels. As shown in Panel A, total marketing expenditures are significantly and positively related to RevPAR, GOPPAR, and NOIPAR at the 5 percent significance level, explaining between 57 percent and 75 percent of the variation in those three

PANEL A: ABSOLUTE LEVELS

variables. This demonstrates that an increase in marketing expenditures has a positive effect on both the top line and the bottom line. More important, the interaction between total marketing expenditures and group performance is also positively significant at the 5 percent level. The effect of marketing expenditures on RevPAR, GOPPAR, and NOIPAR is significantly and positively greater for winners than losers. Winners spent more on marketing, and this additional expense had a positive effect on performance. The percentage changes shown in Panel B are similar, but the explained variation is much less than those in Panel A. Once again, the change in total marketing expense is also significantly and positively related to the top-line and bottom- line measures. We also ran the regression using only data from 2009 with similar results. Exhibit 6: Relationship between Total Marketing Expenditures and Top-Line and Bottom-Line Measures (2007-2009). (See table below) Seeking to identify which category of marketing expenditure had the greatest effect, we replaced total marketing expenditures with the four individual expenditure categories. We also included a dummy variable for 2009 to capture the effect of the recession, whereby first the year 2007 and then the year 2008 was omitted. We conducted a levels analysis (shown in Panel A of Exhibit 7) and a percentage change analysis presented in Panel B. Consistent with the findings of O’Neill, Hanson, and the margin, if additional marketing expenditures bring in lower margin business, revenue will increase by a greater percentage than profit. This would be the case, for instance, if the hotel lowers rates to drive occupancy. Revenues rise, but profits are diminished by the incremental costs associated with “filling beds” with low-yield guests. Mattila (2008), the levels analysis findings (reported in Exhibit 6, Panel A) indicate a

REVPAR

GOPPAR

NOIPAR

Constant

31.50 (16.95)***

15.58 (14.05)***

13.01 (14.44)***

Performer

−.057 (−0.01)

−4.852 (−1.45)

3.504 (1.83)*

5.617 (14.31)***

2.752 (11.92)***

1.968 (11.09)***

1.188 (2.05)**

1.479 (3.48)***

0.573 (2.28)**

618

618

618

283***

178***

189***

.754

.642

.573

REVPAR

GOPPAR

NOIPAR

Constant

−.106 (−10.90)***

−.180 (−10.48)***

−.234 (−9.88)***

Performer

.021 (1.78)*

.053 (2.63)***

.089 (3.27)***

Marketing expenses

.114 (3.29)***

.130 (2.24)**

.159 (1.88)*

Performer × Marketing expenses

.151 (2.71)***

.222 (2.54)**

.274 (2.34)**

412

412

412

F value

18***

15***

16***

R

.124

.081

.082

Marketing expenses Performer × Marketing expenses N F value R2

PANEL B: PERCENT CHANGES

N 2

Note. Dependent variables are RevPAR, GOPPAR, and NOIPAR. Performer is measured as equal to 1 for Winner and 0 otherwise. Marketing expenditures is measured as the sum of all marketing expenditures. With the exception of the dummy variable, all independent variables are scaled by the number of available rooms. Heteroskedasticity-robust t-stats in parentheses. RevPAR = revenue per available room; GOPPAR = gross operating profit per available room; NOIPAR = NOI per available room. *Significant at the 10% level. **Significant at the 5% level. ***Significant at the 1% level. 44 | Hotel SA | W W W . A H A S A . A S N . A U

Back to Contents


significant and positive relationship between all four marketing expenditure types and performance. Moreover, separating the marketing expenditure components certainly increased the explained variation in the performance measures. The explained variation in the performance measures is highest for RevPAR (71%) and lowest for NOIPAR (56%), implying that increasing marketing expenditures has a greater effect on revenues than on profit. One possible explanation for this finding is that, at the margin, if additional marketing expenditures bring in lower margin business, revenue will increase by a greater percentage than profit. This would be the case, for instance, if the hotel lowers rates to drive occupancy. Revenues rise, but profits are diminished by the incremental costs associated with “filling beds” with low-yield guests. The results of the relative analysis of percentage changes in the variables (Exhibit 7, Panel B) confirm our findings in Panel A by providing the empirical support to show that franchise expenses and other sales expenses are significantly and positively related to RevPAR, GOPPAR, and NOIPAR. Once again, the explained variation is higher when marketing expenditures are disaggregated into categories. For example, the explained variation ranges in value from 39 percent for NOIPAR to 60 percent for RevPAR. These findings extend O’Neill, Hanson, and Mattila’s (2008) dollar amount findings. The beta coefficients for our regressions showed that franchise expenses had the greatest relative strength among the marketing expenses, followed by other sales expenses, as shown in both Panels A and B. Note that the beta values for franchise expenses and other sales expenses shown in Panel A (between 0.34 and 0.43) are higher than those shown in Panel B (between 0.09 and 0.22). These values are also higher for RevPAR than for NOIPAR. These ratios indicate that a 1 SD increase in franchise expenses leads to a 0.43 SD increase in predicted RevPAR, with other variables in the model held constant. These results suggest that franchise expenses have greater effect on RevPAR and bottom-line profitability than other sales expenses, although both are important. Our analysis shows a mixed outcome for marketing labor cost and advertising, in that they are significantly and positively related to the absolute-dollar performance measures shown in Panel A but not to the percentage-change measures shown in Panel B. As noted by O’Neill, Hanson, and Mattila (2008), marketing labor cost may be correlated with higher revenues, but hoteliers should evaluate these payroll expenditures to ensure that these investments produce the desired incremental profits. The insignificant and negative relationship between changes in advertising expenditures and performance measures shown in Panel B suggests that hotel managers’ increases in advertising expenditures could not stem the dramatic declines in performance measures during the depths of the recession. Finally, our sensitivity analysis using the 80 percent and 120 percent RevPAR index cutoff points to classify losers and winners yielded similar results to those of our existing approach.

SUMMARY AND CONCLUSION In 2009, during the worst year of the great recession, both the winners and losers in our sample suffered declines in occupancy and ADR (as did all hotels) with greater changes in ADR relative to changes in occupancy rates. Compared with the winners, losers were unable to maintain occupancy and ADR, despite their best efforts. Although occupancy changes are important, of course, it was the significantly different percentage changes Back to Contents

in ADR that hurt losers’ revenue. Thus, losers saw significantly greater declines in RevPAR than winners. Exhibit 7: Relationship between Marketing Expenditures and Top-Line and Bottom-Line Measures (2007-2009). (See table on the next page) Although both groups of hotels suffered declines in profitability, we again find that winners experienced significantly lower negative year-to-year changes in GOP and NOI when compared with losers. Similarly, when profitability is measured as a ratio to total revenue, the results indicate that winners had a higher ratio of profit relative to total revenue sales for both GOP and NOI. Furthermore, the year-to-year decline in these profitability ratios is also lower for winners than for losers. We found no significant percentage changes in room expenses, administrative and general expenses, maintenance expenses, and utilities expenses between winners and losers. However, losers did make one noticeable expense reduction, and our analysis indicates that this may have been a false economy. Both groups perforce reduced overall marketing expenses, but losers made a significantly greater reduction in total marketing expenses than winners. This is a key finding of this study. Of particular interest is the category of other sales expenses. Losers reduced those expenses during the recession, while winners actually increased this expense category. Both in terms of absolute levels and percentage changes, total marketing expenses are significantly and positively related to RevPAR, GOPPAR, and NOIPAR. In this regard, we found a greater positive effect for winners than for losers. Although we found that an increase in marketing expenses will likely increase revenues and bottom-line profitability, further analysis found that franchise expenses and other sales expenses had the greatest influence on RevPAR and profitability. Of the two, franchise expenses exhibited a stronger effect on the performance measures than did other sales expenses. Moreover, the effect of these two expenditure categories is also higher for RevPAR than for profitability. Future research could expand on this study by using a larger sample size and larger competitive sets of hotels to investigate the performance of similar hotels in the recovery period following the recession as well as to further investigate the change in marketing expenses for these hotels. Our research also revealed the need to further study the effect of advertising, promotion, and e-commerce activities on revenue generation. Even though advertising expenditures account for the smallest amount and proportion of all marketing activities, they constitute one of the most important activities undertaken by any hotel. The expectation is that these expenditures contribute to the financial performance of the hotel, and the effect of increasing or decreasing them is expected to be of a longer duration (Graham and Frankenburger 2000).

LIMITATIONS This study is limited by the small sample sizes of the two groups of winners and losers, selection bias in matching hotels within a submarket, the small number of hotels within a competitive set, and the narrow time period under examination. In any submarket, one is likely to find many more hotels in practice that would permit the creation of larger competitive sets, but this study is limited to hotels that voluntarily participate in PKF’s Trends® program. Having a larger sample size that also W W W . A H A S A . A S N . A U

| Hotel SA | 45


included economy hotels and more midscale hotels with food and beverage would have allowed us to further analyze the data by chainscale to provide more informative insights. Similarly, some of our competitive sets comprised only three hotels, which could be considered too small a sample to draw any meaningful conclusions. Having fewer hotels within a competitive set could also lead to greater variations in performance indices. We were also unable to discuss or provide any information on specific brands due to confidentiality requirements imposed by the data provider. In addition, such descriptive variables as the age of the hotel and facility type would have allowed us to draw further insights into differences between winners and losers. Obtaining more specific and detailed information on “other” marketing expenses would also have been useful. Finally, our results could also be driven by the lack of changes we observed in our measure of the RevPAR index that was used to classify hotels into the two groups. That is, winners remained winners and losers remained thus over the three-year period.

MANAGERIAL IMPLICATIONS Our study provides evidence of dramatic declines in topline and profitability measures during the depths of the recession. From our data we can discern two responses undertaken by both winners and losers to mitigate the effect of the recession. Because losers suffered significantly greater declines in top-line measures in 2009, we can infer that they implemented greater levels of discounting than did the winners, and thus saw more substantial losses in

profitability. Neither group could reduce expenses as much or as quickly as they might have wished, but the losers’ failure to reduce expenses speedily compounded the drop in profitability. Furthermore, losers reduced expenses across the board—including marketing expenses—which seems to have cost them both in revenue and profitability. We also note that losers spent less per available room on operating expenses than winners, but these expenses accounted for a higher proportion per dollar of revenue, which indicates a failure of effective resource use. However, winners’ willingness to stay the course on marketing expenses returned worthwhile results compared with the losers. Although winners spent more on operating expenses per available room, these expenses accounted for a lower amount per dollar of revenue. Before engaging in any action to reduce such expenses during an economic downturn, hotel managers should assess whether these investments are producing incremental revenues or profits. A breakeven or return on marketing investment analysis can be a useful tool for determining the incremental revenue or profits that need to be generated in this regard. If marketing expenditures produce the desired positive effects, then hotel managers should direct these investments into those activities that produce the desired profits. Treating marketing expenses as investments, especially in a downturn, can be an opportunity for hotel managers to gain market share. Looking specifically at the positive payoff from franchise fees, using these fees as a proxy for the brand equity of the underlying

Exhibit 7: Relationship between Marketing Expenditures and Top-Line and Bottom-Line Measures (2007-2009).

PANEL A: ABSOLUTE LEVELS

REVPAR

GOPPAR

NOIPAR

Constant

29.71 (7.67)***

15.86 (6.91)***

14.60 (7.01)***

Marketing labor cost

5.27 (4.46)***

2.98 (4.22)***

1.77 (2.74)***

Franchise expenses

6.08 (11.19)***

3.07 (12.16)***

2.53 (11.69)***

Advertising-related expenses

7.09 (2.78)***

3.34 (2.86)***

2.42 (2.34)**

12.911 (8.34)***

7.07 (9.14)***

5.81 (8.61)***

Y2008

−0.26 (−0.07)

−1.61 (−0.68)

−1.68 (−0.83)

Y2009

−12.08 (−3.62)***

−11.84 (−5.11)***

−11.93 (−5.71)***

463

463

463

F value

68***

97***

80***

R

.712

.625

.558

REVPAR

GOPPAR

NOIPAR

−.013 (−2.02)**

−.032 (−2.65)***

−.037 (−2.48)**

Marketing labor cost

−.001 (−0.70)

−.002 (−1.05)

−.002 (−0.84)

Franchise expenses

.089 (4.53)***

.119 (2.98)***

.159 (2.70)***

Advertising-related expenses

−.005 (−1.10)

−.013 (−1.44)

−.017 (−1.34)

Other sales expenses

.004 (5.65)***

.006 (4.95)***

.008 (5.00)***

−.171 (−18.58)***

−.243 (−13.37)***

−.300 (−11.72)***

293

293

293

F value

83***

48***

38***

R

.597

.441

.386

Other sales expenses

N 2

PANEL B: PERCENT CHANGES Constant

Y2009 N 2

Note. Dependent variables are RevPAR, GOPPAR, and NOIPAR. In panel A, Year is a dummy variable that is measured as equal to 1 for Y2008 and zero otherwise. Y2009 is equal to 1 for 2009 or zero otherwise. In panel B, Year is measured as equal to 1 for 2009 or zero otherwise. With the exception of the dummy variable, all independent variables are scaled by the number of available rooms. Heteroskedasticity-robust t-stats in parentheses. RevPAR = revenue per available room; GOPPAR = gross operating profit per available room; NOIPAR = NOI per available room. * Significant at the 10% level. ** Significant at the 5% level. *** Significant at the 1% level. 46 | Hotel SA | W W W . A H A S A . A S N . A U

Back to Contents


brands, we can infer that during a recession the support a brand provides to a hotel can help stem occupancy and rate declines. This needs further exploration by comparing a large sample of a variety of branded hotels to independent hotels, something we could not do with our small sample of independent hotels. As our findings indicate, the cost to be affiliated with a brand can be a significant expense for a hotel but the benefits can also be substantial. As loyalty-program fees are correlated with occupancy (r = .35, p < .01), it appears that winners took greater advantage of loyalty programs than losers. Although winners were, on average, affiliated with brands that charge a higher royalty fee, our findings also suggest that these winning brands delivered value by contributing more to their hotels than the lower priced brands. Hotel management that is focused on building strong brand equity through greater investments in sales and marketing activities can expect to generate higher revenues and achieve greater customer satisfaction and loyalty in addition to a positive price-value relationship, which should translate to higher profitability (Prasad and Dev 2000). Personal advertising and marketing expenses is one area where the winning hotels took matters into their own hands, to good effect. Our study also reveals the importance of other sales expenses as a determinant of revenue and profitability. We observed that winners increased other sales expenses while losers decreased these expenses during the recession. Given the

positive effect on revenues and profitability from these activities, we believe hotel managers would be wise to avoid reducing these expenses in response to a negative situation without first assessing their incremental costs and benefits. It is worth repeating here that other sales expenses include such important activities as promotions, familiarization trips, trade shows and the training of sales personnel, personal sales visits to clients, and use of outside sales representatives. These appear to be effective techniques in the midst of a recession, when customers are also seeking to control costs. Personal contact and negotiation clearly brought in business. These sales expenses may be costly for full-service properties or group-oriented hotels and less so at limited-service hotels, but hotel managers must realize that these expenses are crucial in establishing and maintaining a long-term relationship with the guest. Finally, our finding pertaining to marketing labor and advertisingrelated expenses is inconclusive. Even though the amounts spent on marketing labor and advertising were positively related to financial performance, the changes in these expenses were unrelated to changes in performance. Hotel managers should ensure that these expenses are under control and aligned with budgets or standards. As marketing labor cost is the second largest expense within the marketing department, hotel managers should also ensure that any reduction in these expenses does not compromise service quality or standards for potential clients and guests.

AHA|SA Events 2020 As we have some sense of normality in trade we have scheduled the remainder of 2020 as follows; Notice of these specific events will be forwarded to AHA|SA Corporate Partners in the weeks prior to the event. REGIONAL MEETING NETWORKS

Tuesday 18th August

Lower/Mid/Upper North East

TAMINGA HOTEL, CLARE

Tuesday 25th August

South Coast Hills

MURRAY BRIDGE HOTEL

Tuesday 15th September

South East

BORDERTOWN HOTEL

Wednesday 23rd September

Gawler & Barossa

VINE INN BAROSSA

Wednesday 14th October

Yorke Peninsula

PORT BROUGHTON HOTEL

Tuesday 20th October

Metropolitan

MARION HOTEL

Tuesday 24th November

Eyre Peninsula

TASMAN HOTEL

SA HOTEL INDUSTRY AWARDS FOR EXCELLENCE GALA DINNER

Tuesday 27th October

ADELAIDE ENTERTAINMENT CENTRE

WOMEN IN HOTELS NETWORKS

Tuesday 22nd September Tuesday 17th November As per normal we will be issuing the details of each event direct to Corporate Partners approximately four weeks prior to each date. We look forward to seeing you in person! Back to Contents

W W W . A H A S A . A S N . A U

| Hotel SA | 47


Our Purpose - To provide the hotel industry the capacity to respond to community concerns related to the harm associated with gambling by contributing to early intervention and support for problem gamblers and their families. Our Goal - A compliant and proactive hotel industry that works with regulators, gambling help services, and players to limit the harm caused by gambling. Gaming Care is the hotels responsible gambling early intervention agency, and is an initiative of the AHA|SA. Gaming Care’s role to assist venues to minimise the harm caused by problematic gambling behaviour in all South Australian hotels with gaming machines by working directly with venue staff, Gambling Help Services, other relevant organisations and stakeholders.

For any assistance or support please contact your local Gaming Care Officer, or our office for information on how Gaming Care can assist your venue.

SOME OF OUR DUTIES INCLUDE:

Assisting hotel staff in the early identification and support of patrons and staff who may be experiencing difficulty with their gaming behaviour. Developing and promoting initiatives, programs and policies designed to facilitate the early identification of problematic gambling behaviour. Assisting hotel staff in providing responsible gambling service,

 on or with the capacity to influence the service, by training

in responsible service of gambling. This helps reduce harm through the creation of a responsible gambling culture within the venue. Gaming Care has developed a Responsible Gambling Document for venues which details the ways in which staff training and measures for intervention with problem gamblers are implemented, and the roles of staff in the implementation of the code. 48 | Hotel SA | W W W . A H A S A . A S N . A U

T: 0 8 8 1 0 0 2 4 9 9 F : 0 8 8 2 3 2 4 9 7 9 E: INFO@GAMINGCARE.ORG.AU 4TH FLOOR AHA|SA HOUSE 60 HINDMARSH SQUARE, ADELAIDE SA 5000

Back to Contents


A C C O U N TA N C Y S E R V I C E S

ENERGY

Bentleys SA 8372 7900 LK Accounting Services 08 8395 4870 Perks Accountants & Wealth Advisors 08 8273 9300 Winnall & Co. 8379 3159

Choice Energy 1300 304 448 Class A Energy Solutions 8391 4853 Energy Action 1300 553 551 Power Maintenance 1300 700 500 Trans Tasman Energy Group 1300118 834

AT M S

FINANCIAL PLANNING

Banktech 1800 08 09 10 Cardtronics 03 9574 4878 ARCHITECTS & INTERIOR DESIGNERS

Studio Nine Architects 8132 3999 AUDIO VISUAL

Big Screen Video 1300 244 727 Nightlife Music Video 1800 679 748 Novatech Creative Event Technology 8352 0300 BACKGROUND MUSIC

Foxtel Music 1300 148 729 Moov Music 1300 139 913 Nightlife Music Video 1800 679 748 Zoo Business Media 07 5587 7222 BANKING & FINANCE

Bank SA 8424 5536 Perks Accountants & Wealth Advisors 08 8273 9300

Perks Accountants & Wealth Advisors 08 8273 9300 Winnall & Co. 8379 3159

BEER DISPENSE EQUIPMENT

Andale Hotel Services 8234 0388 Lancer Beverage Systems 8268 1388 BEVERAGE GASES

BOC Limited 0424 647 568 Supagas 8252 7472 BEVERAGES

Accolade Wines 8392 2238 Asahi Premium Beverages 8276 4888 Australian Liquor Marketers 8405 7744 Carlton & United Breweries 8416 7819 Coca-Cola Amatil 8416 9547 Coopers Brewery 8440 1800 Diageo Australia 8245 9300 Empire Liquor 8371 0088 Lion 8354 8888 Liquor Marketing Group 8416 7575 Options Craft Liquor Merchants 8346 9111 Pernod Ricard Australia 8208 2400 Samuel Smith & Son 8112 4200 Treasury Wine Estates 8301 5400 BOOKKEEPING

Liquor Legends 0429 825 072 LK Accounting Services 08 8395 4870 Perks Accountants & Wealth Advisors 08 8273 9300 Winnall & Co. 8379 3159 BUILDING EQUIPMENT/SUPPLIES/ HARDWARE

Bunnings Group 0435 630 660 CLEANING SERVICES

Agile Group 1300 964 007 Smart Cleaning Services 1300664647 CLEANING SUPPLIES

Bunzl Hospitality Supplies 8245 6200 Clean Life 08 8124 7380 Frontline Hygiene 8121 9315

Back to Contents

LEGAL SERVICES

Clelands Lawyers 8177 5888 Duncan Basheer Hannon 8216 3389 Ryan & Durey Solicitors 6166 9000 Wallmans Lawyers 8235 3000 L O YA LT Y & R E W A R D S Y S T E M S

F I R S T- A I D

Liquor Legends 0429 825 072

St John 1300 360 455

M A R K E T I N G & C O M M U N I C AT I O N S

FOOD SERVICES

Galipo Foods 8168 2000 Holco Fine Meat Suppliers 8162 8400 International Oyster & Seafoods 8231 6441 PFD Foodservice 8114 2300 Wills and Daniel 8260 7776 FURNISHINGS

Concept Collections 1300 269 800 G A M I N G A N A LY S I S

Independant Gaming Analysis 8376 6966 LK Accounting Services 08 8395 4870 Winnall & Co 8379 3159 G A M I N G L O YA LT Y

BEDDING

Elite Bedding 8243 1911

Bunnings Group 0435 630 660 Bunzl Hospitality Supplies 8245 6200 Lancer Beverage Systems 8268 1388 Stoddart Manufacturing & Food Service Equipment 0427 106 103

Bluize 1300 557 587 GAMING MACHINE SERVICES

insworth Game Technology 0409 171 616 A Aristocrat Technologies Australia 8273 9900 Global Gaming / Maxetag 0408 462 321 IGT 8231 8430 Independant Gaming Analysis 8376 6966 Konami Australia Pty Ltd 0409 047 899 Macmont Gaming Supplies 8340 1322 MAX 8275 9700

Social Media AOK 0413 469 938 MEDIA

Boylen 8233 9433 FIVEaa 8419 1395 Foxtel 1300 138 898 InDaily 8224 1600 MUSIC LICENSING

OneMusic 8331 5800 ONHOLD/MESSAGING

Adelaide's 1800 ON HOLD 8125 9370 PAY R O L L & H R R E S O U R C E S

Liquor Legends 0429 825072 LK Accounting Services 08 8395 4870 Winnall & Co. 8379 3159 POS SYSTEMS

Bluize 1300 557 587 Cloud Apps Technology 8463 1000 Liquor Legends 0429 825 072 H&L Australia 1800 778 340 P R O M OT I O N A L P R O D U CT S

The Banner Crew 8240 0242 P R O P E R T Y V A L U AT I O N S

Knight Frank Valuations & Advisory SA 8233 5222

GAMBLING SERVICES

The Lott 132 315 UBET 8354 7300

R E F R I G E R AT I O N

Lancer Beverage Systems 8268 1388

GIFT CARDS

The Pub & Bar Card 1300 375 346

R E TA I L L I Q U O R M A R K E T I N G

H OT E L B R O K E R S

McGees Property Hotel Brokers 8414 7800 H OT E L M A N AG E M E NT

Liquor Legends 0429 825 072 Liquor Marketing Group 8416 7575 Urban Cellars 0429 825 072 SECURITY SERVICES & PRODUCTS

Liquor Legends 0429 825 072 H&L Australia Pty Ltd 8291 9555 HYGIENE PRODUCTS & SERVICES

Clean Life 08 8124 7380 Frontline Hygiene 8121 9315

Agile Group 1300 964 007 DNA Security Solutions 1300 667 688 Lima One Protection Group 0415 405 764 S P O R T S & E N T E R TA I N M E N T M E D I A

Foxtel 1300 138 898

ICE MAKERS

Bunzl Hospitality Supplies 8245 6200 Lancer Beverage Systems 8268 1388 I N F O R M AT I O N S Y S T E M S / S I T E P R E P

Max Systems 8275 9700 INSURANCE

Aon Risk Solutions 8301 1111

S TA F F T R A I N I N G & R E C R U I T M E N T

Career Employment Group 8338 1492 Maxima 8340 7766 Migration Solutions 8210 9800 Perks Accountants & Wealth Advisors 08 8273 9300 St John 1300 360 455 S TA G I N G

I . T. P R O D U C T S & S E R V I C E S

Boylen 8233 9433 Cloud Apps Technology 8463 1000 Vintek 1300 001 337

Nexstage 7070 8191 S U P E R A N N U AT I O N

Host­Plus 8205 4965

KITCHEN & BAR EQUIPMENT

WEBSITES

Andale Hotel Services 8234 0388

Boylen 8233 9433 W W W . A H A S A . A S N . A U

| Hotel SA | 49


Corporate Partners 2020/21 D I A M O N D

P L A T I N U M

G O L D

131 733 S I L V E R

pfdfoods.com.au

Accolade Wines

Boylen

InDaily

Agile Group

Bunnings Group

Independant Gaming Analysis

Ainsworth Game Technology

Bunzl

Konami Australia Pty Ltd

Australian Liquor Marketers

Duncan Basheer Hannon

BankSA

Energy Action

Novatech Creative Event Technology

Big Screen Video

Foxtel

OneMusic

Winnall & Co

Bluize

IGT

Options Wine Merchants

For full product range and details of your nearest branch

PFD063 Hotel SA Advert (1/4 Page).indd 1

Samuel Smith & Son Scientific Games

18/05/09 11:47 AM

Liquor Marketing Group

Social Media AOK Stoddart Food Equipment

B R O N Z E

Adelaide's 1800 ON HOLD

Cloud Apps Technology

Liquor Legends

Smart Cleaning Solutions

Andale Hotel Services

Concept Collections

LK Accounting Services

Studio Nine Architects

Banktech

DNA Security Solutions

Maxima Training Group

St John

Bentleys Accountants

Elite Bedding

McGees Property Hotel Brokers

Supagas

BOC Limited

Empire Liquor

Migration Solutions

The Banner Crew

Cardtronics

Frontline Hygiene

Nexstage

The Pub & Bar Card

Career Employment Group

International Oyster & Seafoods

Trans Tasman Energy Group

Choice Energy

Knight Frank Valuations & Advisory SA

Perks Accountants & Wealth Advisers

Class A Energy Solutions Clean Life H O T E L

Lancer Beverage Systems

I N D U S T R Y

PowerMaintenance

Wallmans Lawyers

Ryan & Durey Solicitors

ills and Daniel Produce W Merchants

Clelands Lawyers

Vintek

S U P P O R T E R

50 | Hotel SA | W W W . A H A S A . A S N . A U

Back to Contents


L I C E N S E E

JUNE 2020

T R A N S F E R S

H OT E L

L O C AT I O N

D AT E G R A N T E D

NEW LICENSEE

Western Hotel

Port Augusta

11.06.20

Australian Leisure & Hospitality Group Pty Ltd

Portland Hotel

Port Adelaide

12.06.20

EDP Portland Hotel Pty Ltd

Terminus Hotel

Balaklava

16.06.20

Termo Beach Pty Ltd

Victor Resort Hotel

Victor Harbor

26.06.20

Australian Leisure & Hospitality Group Pty Ltd

Middlebrook Estate

McLaren Vale

01.07.20

Vine Control Pty Ltd

WELCOME TO OUR NEW MEMBERS

EOS By Skycity

The Greenman Inn

Oyster Bar Glenelg

Maitland Hotel

O F F I C E

Thevenard Hotel

H O L D E R S

C O N TA C T

A D M I N I S T R AT I O N

EXECUTIVE COUNCIL

Level 4, 60 Hindmarsh Square, Adelaide SA 5000

IAN HORNE

General Manager

DAVID BASHEER

AHA|SA President

POSTAL

PO Box 3092, Rundle Mall SA 5000

OWEN WEBB

Workplace Relations

MATTHEW BINNS

AHA|SA Vice President

PHONE

(08) 8232 4525

GARY COPPOLA

Legal and Advocacy

ANDREW BULLOCK AHA|SA Deputy Vice President

TOLL FREE 1800 814 525

SCOTT VAUGHAN Membership & Business Services

RICHARD LOVELL

FAX

KATHERINE TAYLOR Communications and TAA (SA)

Matthew Brien, Matt Rogers, Sam McInnes

(08) 8232 4979

EMAIL information@ahasa.asn.au

LUCY RANDALL

WEB

BRONTE MCCARTHY Finance & Administration

www.ahasa.asn.au

Views expressed in Hotel SA are not necessarily those of the AHA|SA or the publisher and neither can accept, and therefore disclaims any liability, to any party for loss or damage caused by errors or omissions resulting from negligence, accident or any other cause. We do not endorse any advertising materials, services offered within advertisements or products, special offers or goods promoted therein.

Events & Sponsorship

DIDIER VOLLERIN

Liquor & Gaming

LIZ TURLEY

Training Coordinator

ANNA MOELLER

Executive Director Gaming Care

COUNCIL

Andrew Gunn Andrew Plush Brad Barreau Darren Steele Elise Fassina Guy Matthews

+

AHA|SA Secretary/Treasurer

James Franzon Jason Fahey Jason Kelly Jeff Ellis John Giannitto Karen Milesi

Luke Donaldson Tim Gregg Tony Franzon Trent Fahey Trevor Evans

+

P U B L I S H E R P (08) 8233 9433 W www.boylen.com.au TIM BOYLEN Managing Director tboylen@boylen.com.au

MADELAINE RASCHELLA Studio Manager Graphic Designer

JAMIE RICHARDSON Advertising sales@boylen.com.au

HENRY RIVERA Graphic Designer

SHOP ONLINE NOW www.liquorlegends.com.au LET’S HAVE A CONFIDENTIAL CHAT ABOUT YOUR BUSINESS CENTRAL AND SOUTHERN SA CALL JOHN MARCH ON 0429 825 072

CENTRAL AND NORTHERN SA CALL SCOTT HOSKING ON 0429 593 554

or e-mail membership@liquorlegends.com.au Back to Contents

W W W . A H A S A . A S N . A U

| Hotel SA | 51


Growth through digital and traditional marketing. boylen.com.au

08 8233 9433


Turn static files into dynamic content formats.

Create a flipbook
Issuu converts static files into: digital portfolios, online yearbooks, online catalogs, digital photo albums and more. Sign up and create your flipbook.