


REALTY DIGEST January 2023 / Circulation 17,500 Monthly / www.ScotCampbell.com Downtown HB | Seacliff | Edwards Hill | Huntington Harbour | Sunset Beach | Brightwater “Huntington Pacific Condominium” | 711 PCH #315 | Huntington Beach | List: $1,125,000 Townhouse Style | 2 Bedrooms | 1.5 Baths | Guard Gated Community | Pool/Spa | Guest Parking | BBQ Area Join the “on the sand” lifestyle offered by Huntington Pacific, the one & only resdential development on the beach side of Pacific Coast Highway in Downtown Huntington Beach! Details & 3D tour: www.711PCH315.com SCOT CAMPBELL, Global Luxury Specialist COLDWELL BANKER-Campbell Realtors 714.336.0394 Mobile scot@campbellrealtors.com www.scotcampbell.com DRE #00943759
Happiness is Knowing that Homes are Still Selling!
In the 4th Quarter of 2022, even while mortgage rates were peaking at over 7%, and people were busy enjoying the holidays… about 3 to 3.5 homes per day SOLD in Huntington Beach.
The New Year has arrived, and people will begin putting homes on the market for potential buyers to consider. Just like last year, the pace of home sales will increase as we head into the late winter and spring.
Spring of 2022 was the peak of the market in Huntington Beach. The peak prices were the result of “once-in-a-lifetime” pandemic subsidized mortgage rates in the 2.75-3.0% range. The Average price per square foot hit $795 and average sale price reached $1,776,000. Buyers paid more for homes because they could… but now they cannot (because mortgage rates have more than doubled).
Today is a good time to put your home on the market because it will still sell for ridiculously more than it would have before the pandemic.
Just know the “panic buy” is over. Your home is not going to bring the “same price as that home” which sold in your neighborhood a year ago which you labeled “crazy” at the time.
If you are having thoughts of selling, let’s talk. I can help you get to where you want to go.

www.HBneighborhoodNews.com

SCOT CAMPBELL | Global Luxury Specialist | COLDWELL BANKER-Campbell Realtors 714.336.0394 Mobile / scot@campbellrealtors.com / www.scotcampbell.com / DRE #00943759
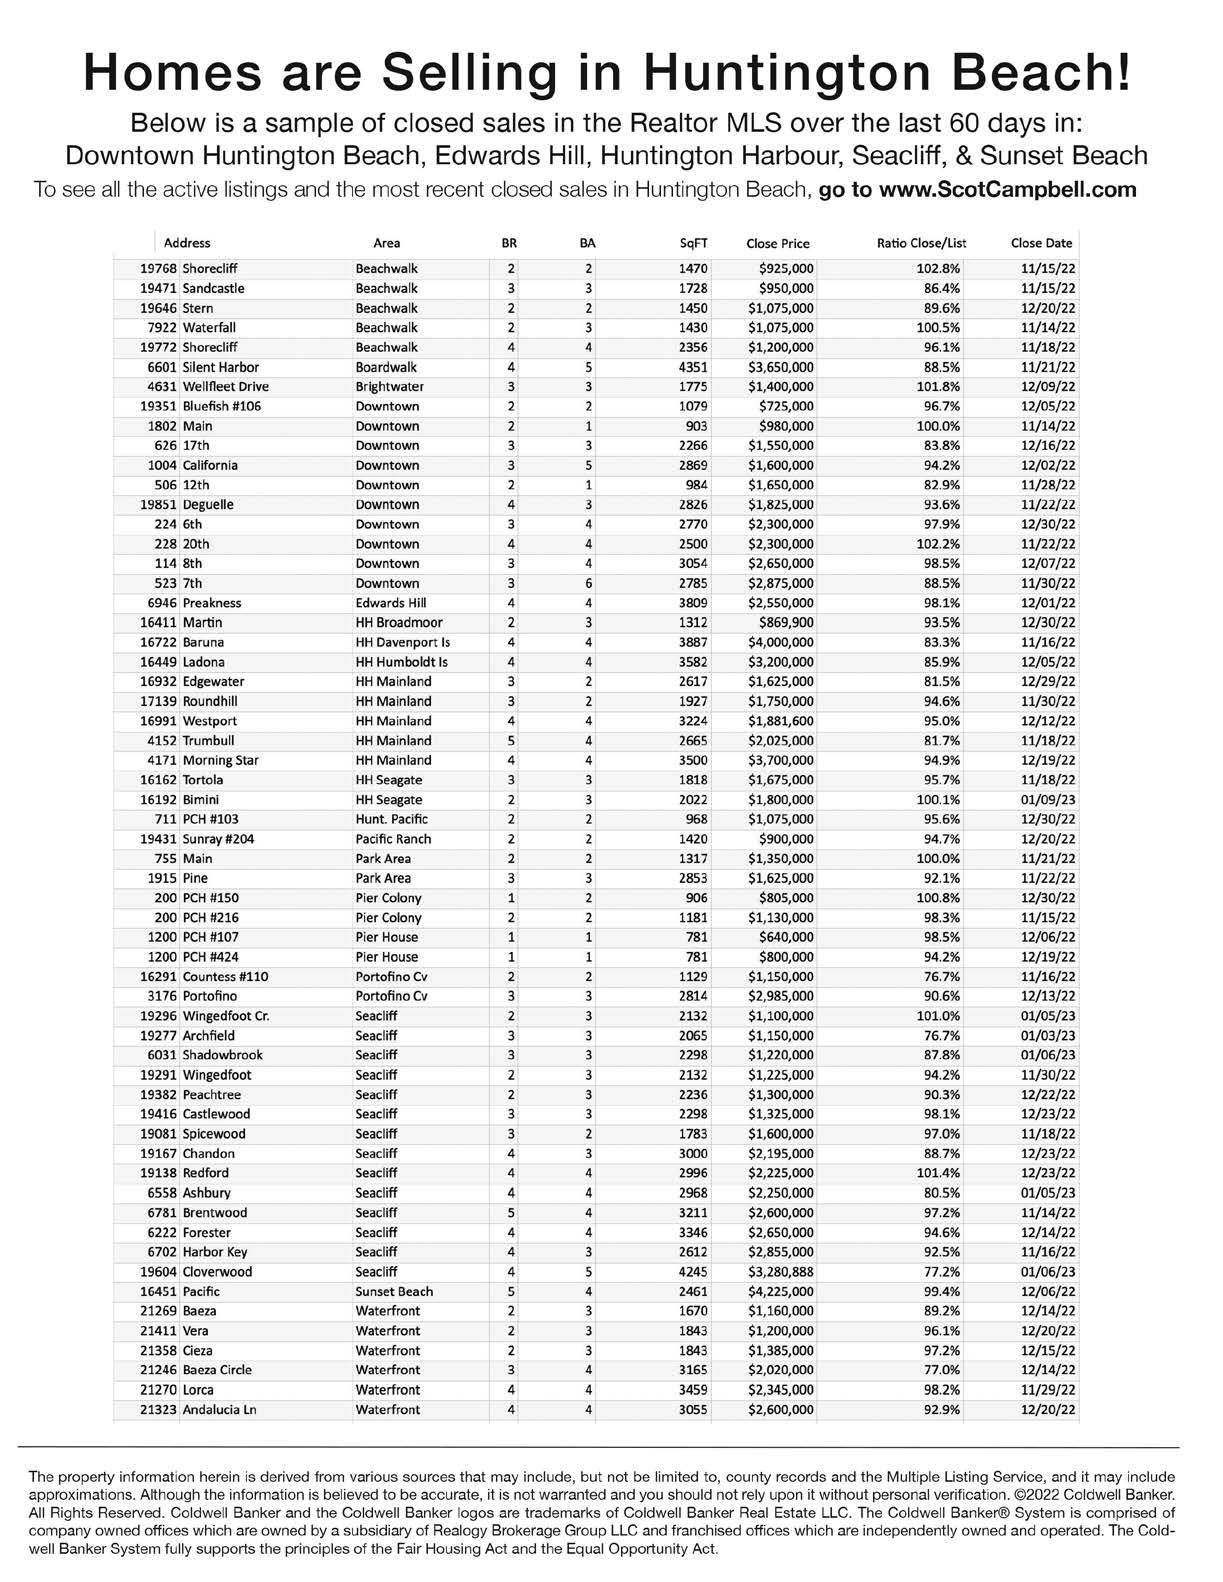
See which homes have recently SOLD in your neighborhood!
How’s the Huntington Beach Market?
The “Days of Supply” is the best indicator of market conditions. It is defined as the number of days to sell all homes on the market at the present rate of home sales.
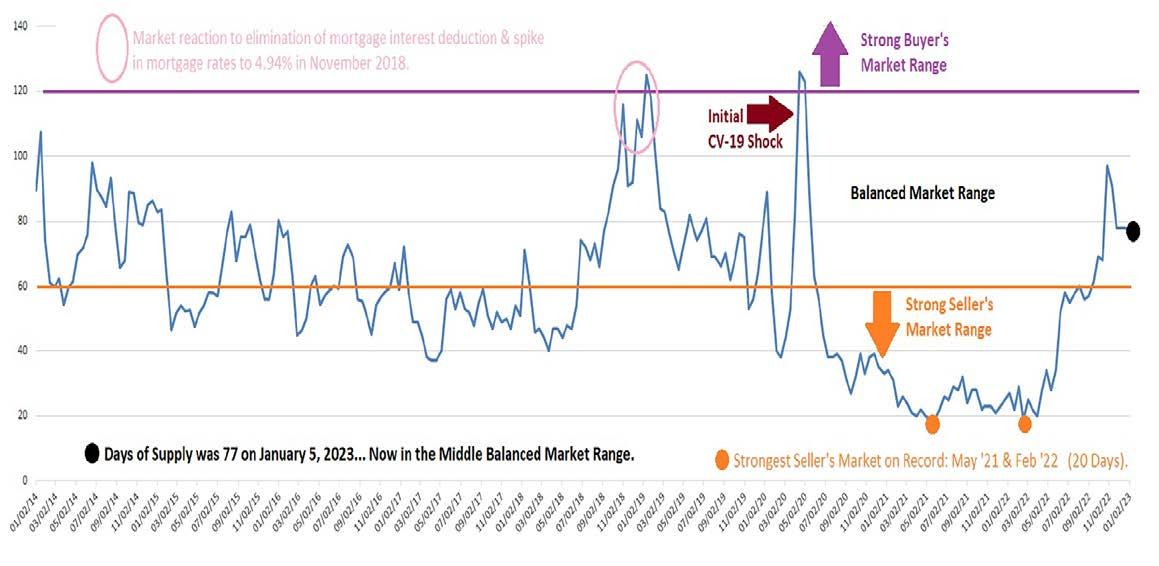
The Days of Supply reading jumped from a record low of 20 days in February 2022 up to a peak of 97 days on October 27th 2022 indicating a rapid shift from strong “Seller’s Market” conditions to a level approaching a “Buyers Market” as mortgage rates spiked to 7.08% in October 2022. The level has since dropped back to 77 on January 5, 2023 indicating “Balanced Market Conditions” as we started 2023.
The below Days of Supply graph illustrates market conditions over the last eight years. In pink, the reaction to rising mortgage rates and the elimination of the mortgage interest deduction can be seen in Q4 2018 and Q1 2019. The immediate “CV-19 Shock” is visible in April-May 2020…followed by the Strongest Seller’s Market conditions ever seen due to once-in-a-lifetime low mortgage rates. Expect to see Days of Supply to remain in the balanced market range in 2023 as decreasing inflation allows mortgage rates to fall.
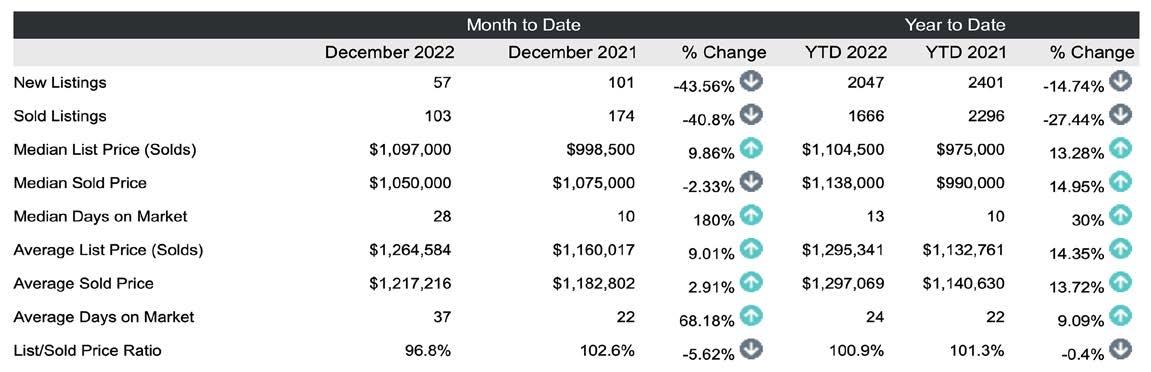
For an Instant Home Value Report For your home, go to: www.HBneighborhoodNews.com Full Huntington Beach Market Summary | All Property Types | December 2022

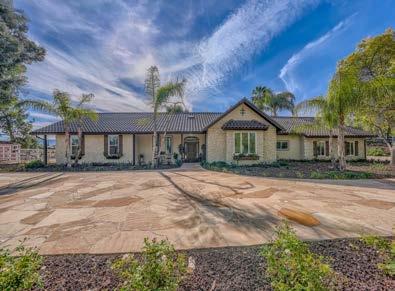
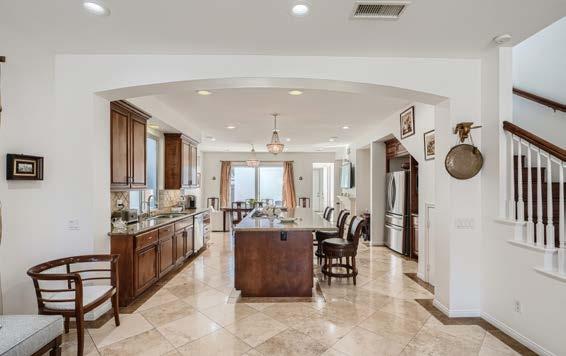
1814 Main St, “Park Area” Huntington Bch | Custom-Built Estate | Constructed in 2014 For 3D Tour & Details: www.1814Main.info Guest House Arrangement | Close to schools | 6 Bedrooms | 5 Baths | 2 Half Baths 5,563 Asqft | 7,625 SF Lot | 4 Car Garage | Spa/Outdoor Kitchen REDUCED TO SELL | List Price $3,350,000 The quaint “Park Area” of Downtown Huntington Beach is “beach close” but more quiet with fewer tourists than the “resort areas”. This spacious custom built home, with guest house arrangement, offers the opportunity for all members of multi-generational households to participate in the Beach Lifestyle!
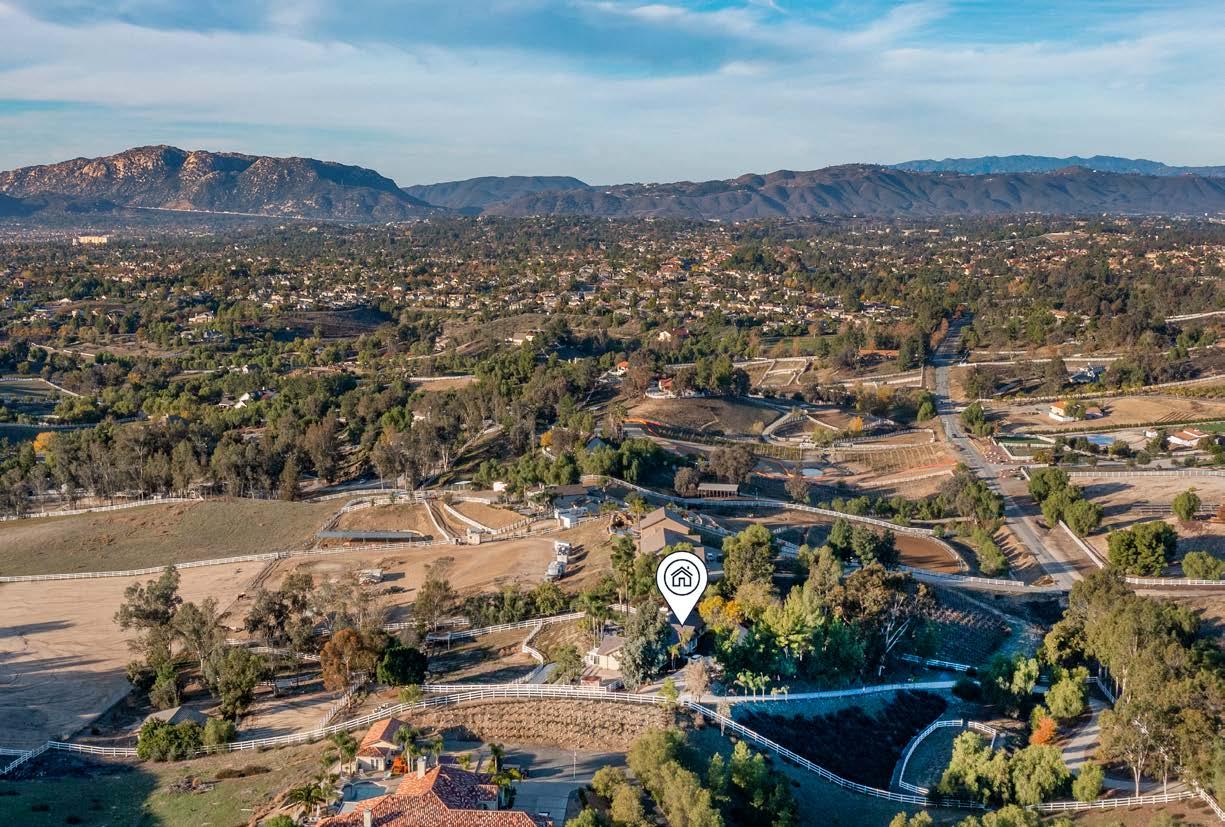
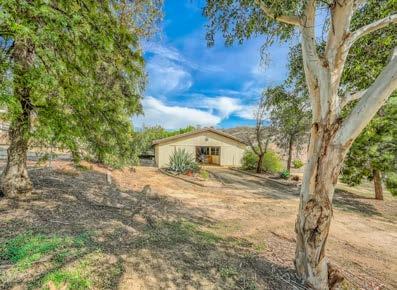

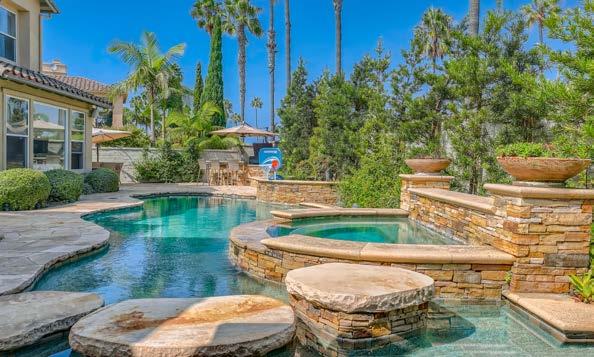
HILLTOP EQUESTRIAN ESTATE ON 4.75 ACRES IN THE WINE COUNTRY For 3D Tour & Details: www.33905PaubaRoad.com Single Story | 3136 SqFt | 4 Bedrooms | 3.5 Baths | 3 Car Garage | Private Gate Pool & Spa | Leased Solar | 4 Horse Barn | Arena | Round Exercise Pen AVAILABLE | List Price $1,799,900 Fantastic location near award-winning wineries, shopping, schools, restaurants, and Old Town. This estate is located justminutes from town, in a very peaceful and quiet setting with ultimate privacy. Seller will consider carrying financing with 25% down, 3.95% interest fixed for 5 years, 30 year amortization, (balance due 5 years) for qualified buyers.


16871 Airport Cir #103 | Huntington Beach “Coastal Walk Community” Former “Model” Townhouse built in 2015 with $80,000+ in Builder Upgrades Development is a nice stroll to Shopping, Beach, Bolsa Chica Wetlands, & Harbour. 3 Bedrooms | Tech/Office Area | 2 Full Baths | 2 Half Baths | 1,963 Asqft | 2 Car Garage | Large Balcony for BBQ & Outdoor Dining | Covered Front Porch with Fountain | “Move-in” ready Home that has been refreshed to look like new! www.16871Airport.com REDUCED TO SELL | PRICED AT: $1,100,000 6671 Silent Harbor | Huntington Beach “Boardwalk Community” Guard gated Boardwalk Development located just a few blocks from the soft sands of Huntington Beach. The home is located on a quiet cul-de-sac street and has a back yard designed for entertaining. Guard Gated Community | Remodeled | 4 Bedrooms + Retreat | 4.5 Baths | Bonus Room | 4,417 SqFt 3 Car Garage + Gated Parking Court | Pool & Spa Outdoor Fireplace | Built-in BBQ | 8,584 SqFt Lot www.6671SilentHarbor.com AVAILABLE | PRICED AT: $3,899,900
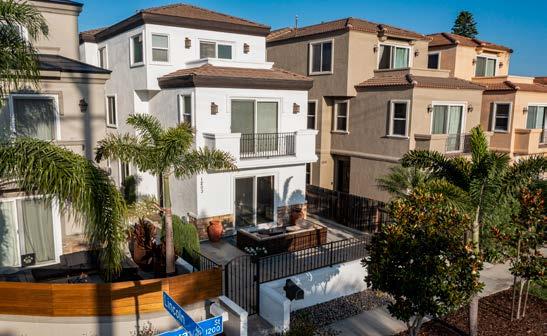

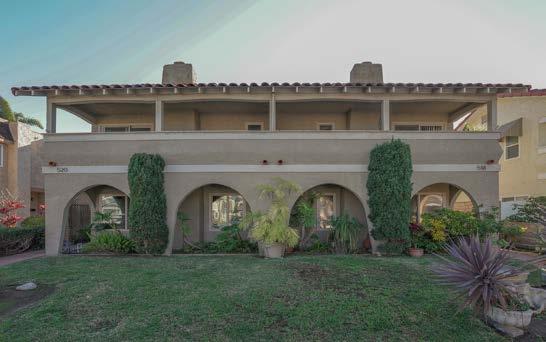
1203 Delaware Street, Huntington Beach “Downtown Huntington Beach” 3-Story Beach House | Open Floorplan | Approximately 3,000 SqFt | Recently updated & move-in ready | Nice stroll or bike ride to Pacific City, Beach, Parks, etc 3 Bedroom + Bonus Room & Sundeck | 3.5 Baths | Gourmet Island Kitchen | Upstairs Laundry | Front & Rear Patios | Middle Level Family Room | 2 Car Garage | Larger 27’ X 120’ lot | Loaded with luxury quality upgrades & finishes! www.1203Delaware.com AVAILABLE | PRICED AT: $1,799,000 OCEANFRONT PIER COLONY PENTHOUSE SOLD by SCOT | $2,120,000 | REPRESENTED SELLER 2 Bdrms + Loft | 2.5 Ba | 1,500 SqFt | 2 Parking Spaces Luxury Quality 3 level Penthouse in Pier Colony where you can surfor take a sunrise stroll on the pier in the morning, come back for a swim in the resort quality pool/spa or work-out in the oceanview association exercise room. www.200PCH332.com 518 & 520 18th Street, Huntington Beach SOLD by SCOT | $2,025,000 | REPRESENTED BUYER DOUBLET LOT DOWNTOWN DUPLEX BUILT IN 1973 518: 3 BR | 2.5 BA | 1774 SqFt | 2 Car Garage 520: 5 BR | 3.0 BA | 1910 SqFt | 2 Car Garage www.18thstDuplex.com
List with Scot to get “Best in the Industry” imagery for your property
• Professional Photographer with years of experience
• High Dynamic Range Enhancement for all Still Photos
• Dramatic Aerials captured with 4K drone camera
• Lifelike Walk-Thru 3D Tour with “Live Scot” option & upgrade links
• Detailed 2D Floorplan Drawing to illustrate the layout of the home
• YouTube Video with an assortment of “moving still” photographs
Coastal Orange County is a desirable second home destination for international buyers and others who live in Los Angeles County, Nevada, Arizona, and Northern California.
Many of the prospective purchasers in today’s market live outside of the immediate area or they are frequently traveling. And, there are many potential buyers who are very busy in their day-to-day even though they live nearby.
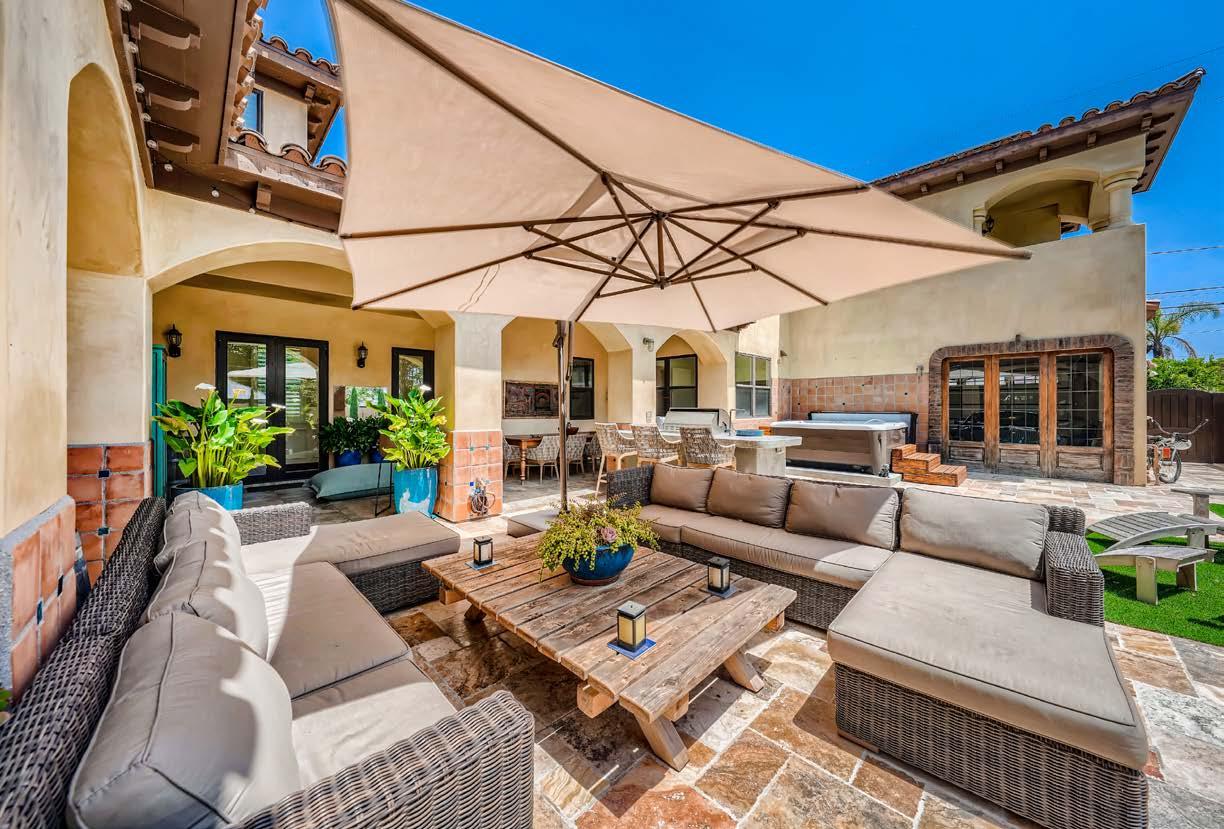
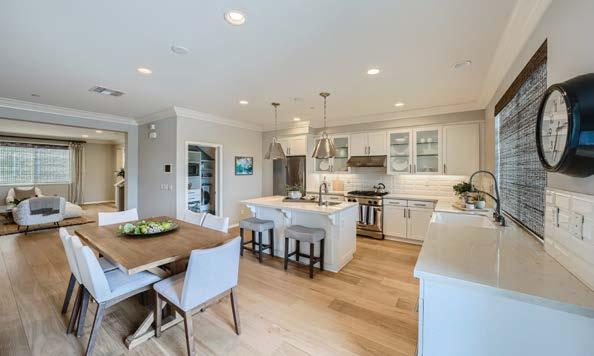
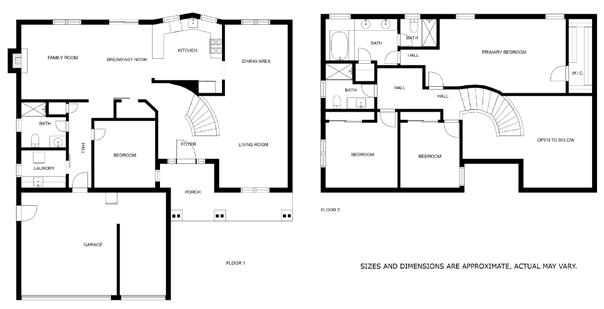
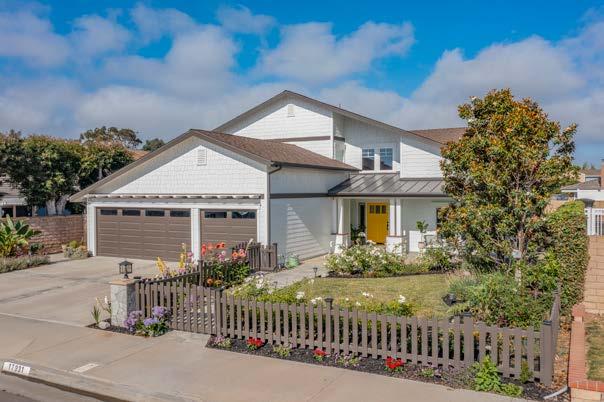
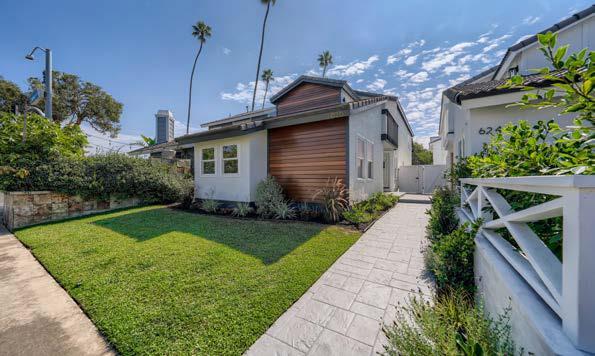
The home at 17931 Wellbank Lane shows how a powerful listing image package can produce the results that seller’s want most: “A quick, full price sale… with a nice smooth escrow”.
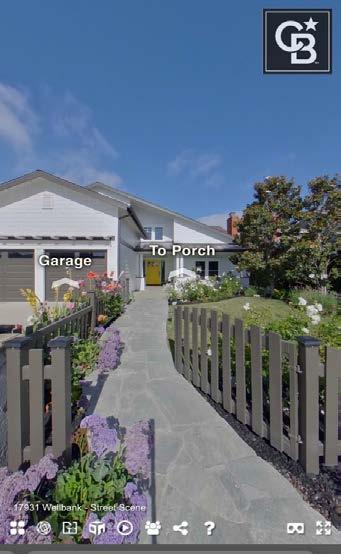
The image package was available for the property the moment it was published in the Realtor MLS. Immediately buyers & agents began viewing the imagery and requesting appointments. There were 159 “views” of the walk-through 3D tour, and 20 “in person” showings to qualified buyers.
The seller received multiple written bids, and selected a full price cash offer. The escrow was smooth, and all parties were very pleased with the outcome.
Whether out of area or just very busy… buyers get excited when one of Scot Campbell’s listings meets their needs.
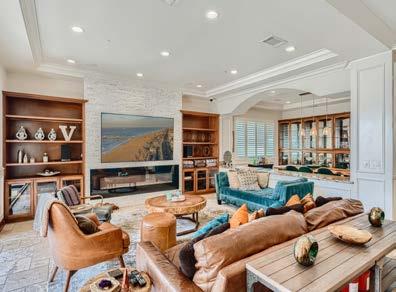
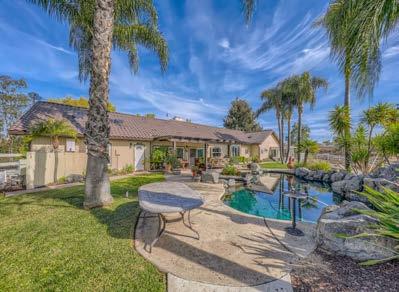
They can see the general layout thanks to the 2D Floorplan, the Aerial Drone Photos illustrate the location, and the HDRI Enhanced Still photos & walkthrough 3D tour allow buyers to immerse themselves in the experience offered by the home.
Buyers can decide quickly if it would be “worth while” to schedule an “in person” viewing, and then either make the drive or book their flight to see the property. These extra showing count because it takes just one “good buyer” to sell a home… and, if a buyer takes time from their busy schedule to see a home, often there is a good chance for a sale.
Clearly, there is a difference when you list your home… choose Scot Campbell and get all the showings your property deserves!
To see more of Scot’s Listings with HDRi Photography, 3D Tour, & 2D Floorplans
Visit: www.MyCurrentListings.com
Orange County Sales Volume Expected to Increase as Mortgage Rates Fall
January 9, 2023 – Source: Steven
Thomas/Reports on Housing
Days of Supply (the number of days to sell all Orange County listings at the current buying pace) increased from 76 to 84 days in the past couple of weeks. But, it remains in the “Balance Market Range”
• Last year the Expected Market Time was at 25 days… the “panic buy was on”.
• The 3-year average prior to COVID was 104 days, a slightly slower pace compared to today.
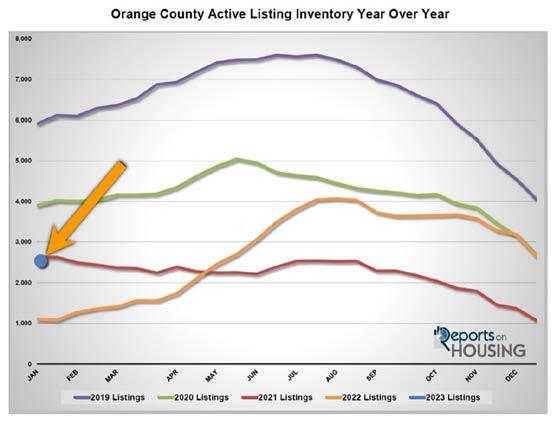
Active Listing Inventory in the past couple of weeks decreased by 112 homes, down 4%, and now sits at 2,530 homes. Typically, In January the number of homes listed doubles from December. It remains elevated in February and then ramps up again from March through July with May being the peak for new listings. This year will likely be no different.
• Last year, the inventory was at 1,100, 57% lower, or 1,430 fewer.
• The 3-year average prior to COVID (2017 to 2019) is 4,506, an extra 1,976 homes, or 78% more. There were a lot more choices back then.
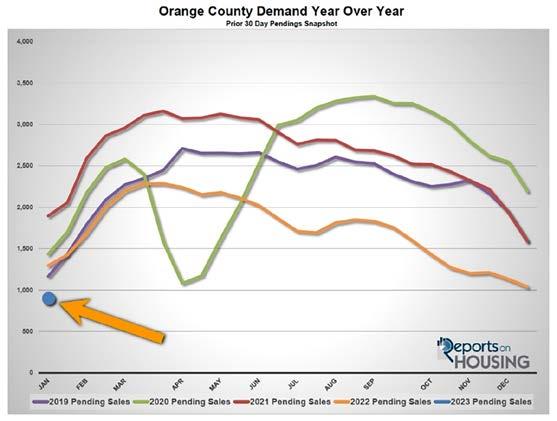
Demand the number of pending sales decreased from 1,038 to 900 in the past couple of weeks, down 13%. This low demand reading is due to the combination of bad weather, high mortgage rates, and very few homes available on the market. As more homes come on the market, expect demand levels to climb. It will dramatically improve over the course of the next two months and will continue to climb until peaking in late spring.
• Last year, demand was at 1,295, 44% more than today, or an extra 395.
• The 3-year average prior to COVID (2017 to 2019) was at 1,349 pending sales, 50% more than today, or an extra 49. Inflation has been falling, and as rates fall below 6%, the demand for homes will improve. There is plenty of latent demand… buyers who want to purchase. The lower rates go, the more demand will recover.
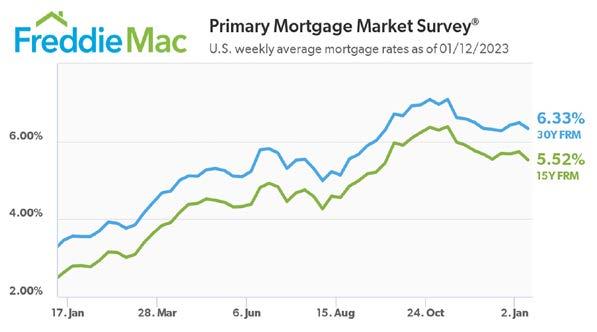
Mortgage Rates Decline
January 12, 2023
While mortgage rates have resumed their decline, the market remains hypersensitive to rate movements, with purchase demand experiencing large swings relative to small changes in rates.
Over the last few weeks latent demand has been on display with buyers jumping in and out of the market as rates move.
A Success Story for Today’s Market

SOLD for $1,550,000 with Seller Financing
3.95% Interest Rate | 15-Year Amortization
48% Down | Balloon Payment End of Year 5
Attached | 3 BR | 2.5 BA | 2266 SqFt | Built 1980
Problem: The seller of this Downtown Huntington Beach rental property owned it for over 30 years and was no longer interested in being a landlord. The basis was extremely low, so a standard sale with pr oceeds received at closing would have resulted in a very big capital gain tax liability. However, he did not know a safer place to invest (secure) the funds than the property itself
Solution: The seller sold the property using an installment sale. With a $750,000 down payment received from the buyer. The seller was able to pay off the existing mortgage and capital gains taxes due, plus he put cash in the bank for a rainy day.
The principal & interest payments received over the next five years spreads out the taxable gain, which offers a nice income to supplement retirement and lowers the tax rate on the funds. Until the loan is paid off, the seller earns interest on money which would have been paid in taxes at year one… this effectively boosts the seller’s yield well above the interest rate being paid by banks.
Safe & Secure: What investment is more comfortable than holding a mortgage on a house in Huntington Beach with 48% down payment, highly qualified buyer, and fully documented loan which meets government standards?
Is an Installment Sale something you should consider? If you
The
Use the
Questions? Contact me or visit my
SCOT CAMPBELL | Global Luxury Specialist | COLDWELL BANKER-Campbell Realtors 714.336.0394 Mobile / Scot@CampbellRealtors.com / www.ScotCampbell.com / DRE #00943759 Important - This article is Not Intended to be specific advice: Receiving rent or installment payments t ends to be more beneficial under the tax code when
income is low
when people are retired). Do NOT sell
highly appreciated property without advice
Advice
who are
are a homeowner with a highly appreciated personal residence (well above the $250,000 per spouse IRS section121 limit), or if you are a long term “Worn-Out Landlord”, an Installment Sale might be an interesting option to consider.
capital gains tax liability due on the sale of the property will likely be reduced, and you can begin earning “hassle free” interest on your equity.
proceeds & income to travel, purchase an RV, buy/rent a more suitable residence, move closer to friends/family, or even help your kids or grandkids with college.
website: www.InstallmentSaleInfo.com
ordinary
(often
a
from a CPA or Tax/Legal Expert who understands your complete situation.
and counsel of a Realtor and Qualified Mortgage Broker
familiar with the IRS rules, lending regulations, & best practices are an absolute necessity prior to entering into a purchase contract involving an Installment Sale.
COLDWELL BANKER Campbell Realtors

1720 Pacific Coast Hwy, Suite 101 Huntington Beach, CA 92648
Having Thoughts of Selling your Home?
Read Monthly HB Market Report at: www.HowisTheHBmarket.com
My New Website Has Amazing Features for Sellers & Buyers
In addition to Neighborhood News & Market Reports, you can now search all current listings in the Realtor MLS for most areas of Southern California.
For your convenience, I created listings by neighborhood in the “For Sale in HB Menu”. You are one click away from seeing what is for sale in several Huntington Beach areas: Downtown Huntington Beach, Seacliff, Edwards Hill, Huntington Harbour, Brightwater, Surfside/Sunset Beach, Beachwalk, Summerlane, Pacific Ranch, The Waterfront, Bolsa Landmark, Pacific Shores, Huntington Court/Place, Meredith Gardens, & Huntington Landmark (Age 55+).
In the OC Homes menu, there are saved “Lifestyle Category” listing searches including: Homes with Boat Docks, Golf Course View, On-the-Sand, Horse Property, Single Stories, Homes with Pools, Starter Homes, New Construction, and more!
It has never been easier to get the real estate information you want, take a look at www.ScotCampbell.com
 Local Postal Customers
SCOT CAMPBELL | Global Luxury Specialist | COLDWELL BANKER-Campbell Realtors 714.336.0394 Mobile / scot@campbellrealtors.com / www.scotcampbell.com / DRE #00943759
