LOW SUPPLY AND MULTIPLE BIDS
In-N-Out has arguably the best cheeseburger. What started in Los Angeles has spread to nearly 400 locations in five states. They are also known for their long drive-thru lines. To avoid the long wait, many hungry, wise hamburger connoisseurs head over at a more favorable time, like 3 p.m. Unfortunately, to their surprise, they are greeted by an unexpected mile-long line.
Many buyers have a similar experience as they dive into today’s housing market. After hearing about falling home prices due to sky-high mortgage rates, they expect housing to be slow so they can take their time and not compete in purchasing a home. Instead, they are experiencing long lines of buyers at open houses and multiple offers on homes priced right and in reasonably good condition. Home buyers are frustrated once again.
Ever since mortgage rates climbed above 6% in June, there has been a tug-of-war taking place between buyers and sellers: low demand, which favors buyers, pit against a low supply, which favors sellers. Last year, inventory kept growing until it peaked in August, while demand continued to drop after peaking in March with rising rates. Market times rose from 19 days in March to 45 days in June to 72 days in July. By November, the market time reached 89 days, drastically different than the first five months of the year. As market times grew, buyers had the upper hand. The pool of buyers evaporated due to affordability constraints. The remaining buyers were not tripping over each other to purchase, they were unwilling to overpay for a home, and the few houses on the market took longer to sell. The sense of urgency that characterized the market from June 2020 through May 2022 had vanished. According to the Freddie Mac House Price Index, as of


M a r k e t T i m e s h a v e d r o p p e d l i k e a r o c k s i n c e t h e s t a r t o f t h e y e a r , s q u e e z e d b y n o t e n o u g h s e l l e r s .
ORANGE COUNTY LISTING INVENTORY VERSUS DEMAND (DEMAND IS A 30 DAY SNAPSHOT OF PENDING SALES)
January, the Los Angeles/Orange County region has dropped 8% since May and was down 2% year-over-year.
In January 2022, there were 1,100 homes available, and demand, the last 30 days of pending sales activity, was at 1,295. Demand was higher than the supply of available homes, and the market time was less than 30 days for all of Orange County. It was insanely hot, with way too much buyer competition, multiple offers, and sales prices way above the asking prices. With rising rates, the supply increased rapidly while demand was falling. In May, demand was less than the supply, which is normal. The difference between supply and demand grew. At the end of July 2022, demand dropped to 1,693 pending sales, and the inventory had reached 4,041. Supply was 2,348 higher than demand, the largest gap in 2022.
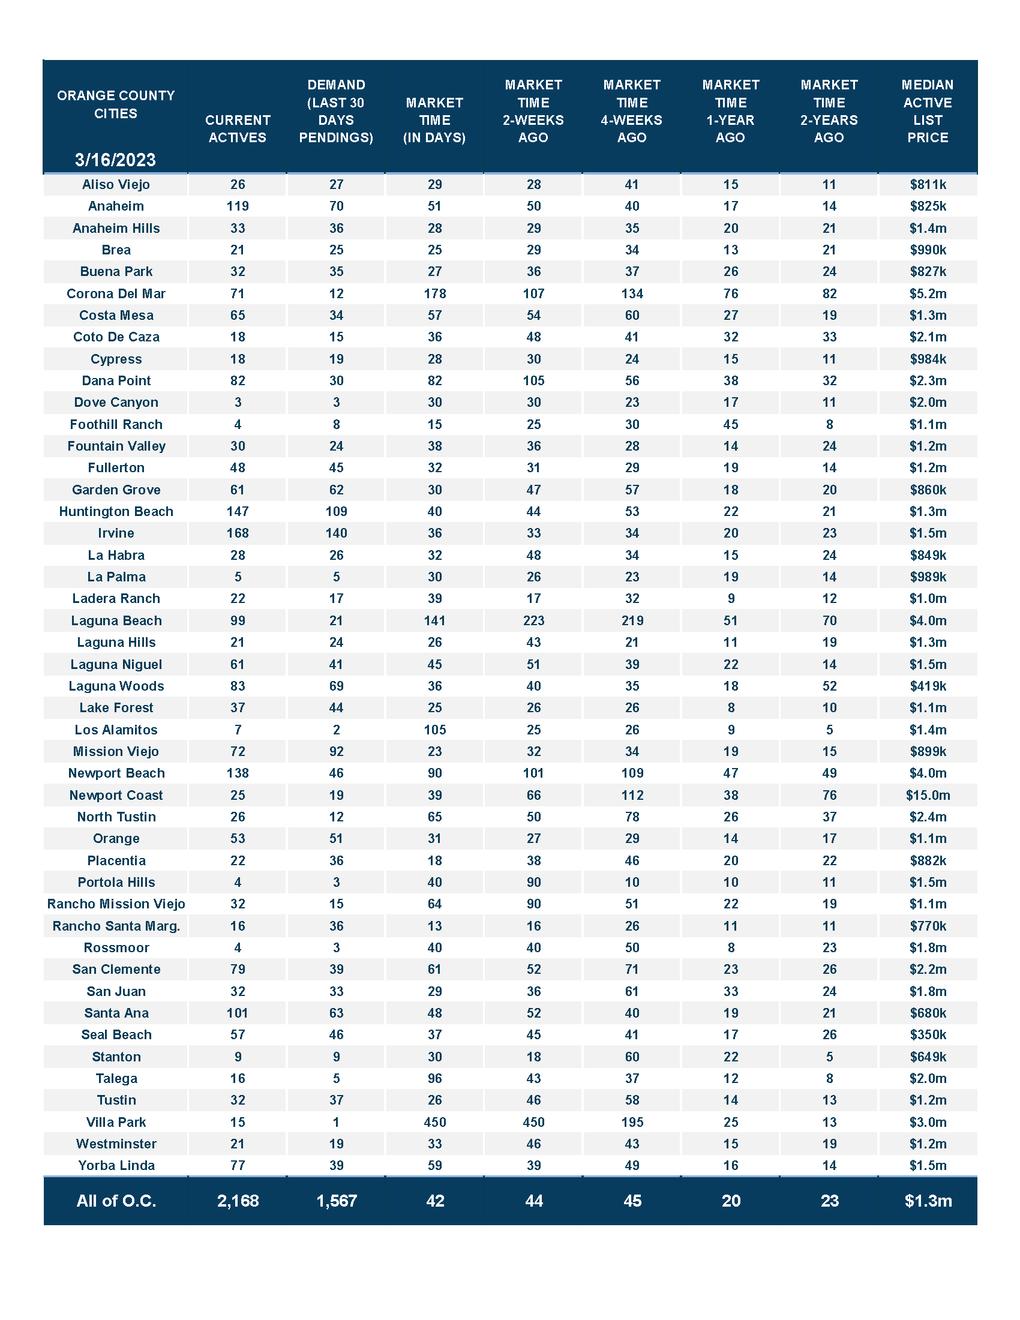
The housing market has evolved yet again in 2023. The supply of available homes has been dropping while buyer demand has risen. The inventory declined from 2,530 homes in January to 2,168 today, a drop of 14%. On the other hand, demand has grown from 900 pending sales in January to 1,567 today. The difference between supply and demand has diminished from 1,630 in January to 601 today, its smallest difference since May last year. The market time dropped from 84 days in January to 42 days today, its lowest level since May 2022. Anything below 50 days indicates that not enough homes are available to purchase.
Two-thirds of Orange County cities have an Expected Market Time of less than 50 days. Rancho Santa Margarita has the lowest market time at 13 days, with only 16 available homes and demand at 36 pending sales. All homes below $1.5 million have a market time below 40 days. The fastest price range is homes between $500,000 and $1 million, with a market time of only 28 days.
At 42 days, Orange County buyers are once again experiencing long lines of buyers at open houses, multiple offer situations, and sales prices above the asking price. This is not due to heightened demand. High mortgage rates are inhibiting demand. Instead, it is a result of not enough new sellers and a muted inventory. So far this year, in January through February, there have been 2,793 missing FOR-SALE signs compared to the 3-year average before COVID (2017 to 2019), down 45%. Today’s buyers cannot buy what is not for sale, so buyers in today’s marketplace are waiting for homes to be placed on the market. As soon as a home becomes available, if it is in decent shape and priced right, it will be greeted with plenty of buyer traffic and interest.
A WARNING FOR SELLERS: This is NOT the insane market from June 2020 to May 2022, where values were screaming higher. Sellers may have the advantage, but overpricing a home is futile. Homes with deferred maintenance or a poor location will be extremely challenging to sell without adjusting the price. Price a home according to its Fair Market Value based on condition, location, upgrades, amenities, and age. Multiple offers may be back, but sellers should not get overzealous.
ORANGE COUNTY HOUSING REPORT | Multiple Offers Again?!?
The active listing inventory decreased by 50 homes in the past two weeks, down 2%, and now sits at 2,168 homes, its lowest level since April last year. Typically at this time of year, the inventory rises by 3.3%. The Spring Market has arrived. The Spring Market is characterized by an increasing inventory. The 3-year average rise before COVID (2017 to 2019) was 21% from now through the end of May. But this year is far from average, with 45% fewer sellers so far this year compared to the 3-year average. Based on the first 11 weeks of the year, the inventory will have a tough time rising, similar to what occurred in 2021.

Last year, the inventory was 1,556, 28% lower, or 612 fewer. The 3-year average before COVID (2017 through 2019) is 5,286, an additional 3,118 homes, or 144% extra, more than double today.
Homeowners continue to “hunker down” in their homes, unwilling to move due to their current underlying, locked-in, low fixed-rate mortgage. The difference between their underlying rate and today’s prevailing rate is significant and precludes many homeowners from listing their homes for sale and moving to another house. This will continue until mortgage rates drop. For February, 1,719 new sellers entered the market in Orange County, 1,413 fewer than the 3-year average before COVID (2017 to 2019), 45% less. These missing signs counter any potential rise in the inventory.
A C T I V E L I S T I N G S T h e a c t i v e i n v e n t o r y c o n t i n u e d t o f a l l , d e c l i n i n g b y 2 % i n t h e p a s t c o u p l e o f w e e k s ORANGE COUNTY ACTIVE LISTINGS YEAR OVER YEAR (2019-2023)
With increased demand and a falling supply, the Expected Market Time (the number of days to sell all Orange County listings at the current buying pace) decreased from 44 to 42 days in the past couple of weeks, its lowest level since May 2022. At 42 days, the market is hotter than the 84-day level to start the year, but this is more of a function of a lack of supply and not record-breaking demand. Last year the Expected Market Time was 20 days, substantially faster than today, and home values were screaming higher. The 3year average before COVID was 63 days, a slower pace than today.


D E M A N D D e m a n d i n c r e a s e d b y 4 % i n t h e p a s t c o u p l e o f w e e k s .
ORANGE COUNTY DEMAND YEAR OVER YEAR (LAST 30 DAYS PENDING)
In the past couple of weeks, the luxury inventory of homes priced above $2 million increased from 614 to 624 homes, up ten homes, or 2%. Luxury demand increased by seven pending sales, up 4%, and now sits at 184, its highest level since the start of September 2022. With a slightly larger increase in demand compared to the rise in supply, the Expected Market Time for luxury homes priced above $2 million decreased from 104 to 102 days, its strongest level since last June. Luxury is a bit more lethargic than the lower ranges, especially above $4 million.
Year over year, luxury demand is down by 74 pending sales or 29%, and the active luxury listing inventory is up by 204 homes or 49%. Last year’s Expected Market Time was 49 days, extremely hot for luxury and faster than today.
For homes priced between $2 million and $4 million, the Expected Market Time in the past two weeks decreased from 73 to 72 days. For homes priced between $4 million and $6 million, the Expected Market Time increased from 128 to 151 days. For homes priced above $6 million, the Expected Market Time decreased from 312 to 254 days. At 254 days, a seller would be looking at placing their home into escrow around November 2023

LUXURY END T h e l u x u r y m a r k e t d i d n o t c h a n g e m u c h i n t h e p a s t c o u p l e o f w e e k s .
ORANGE COUNTY HOUSING REPORT | Multiple Offers Again?!?
ORANGE COUNTY HOUSING SUMMARY
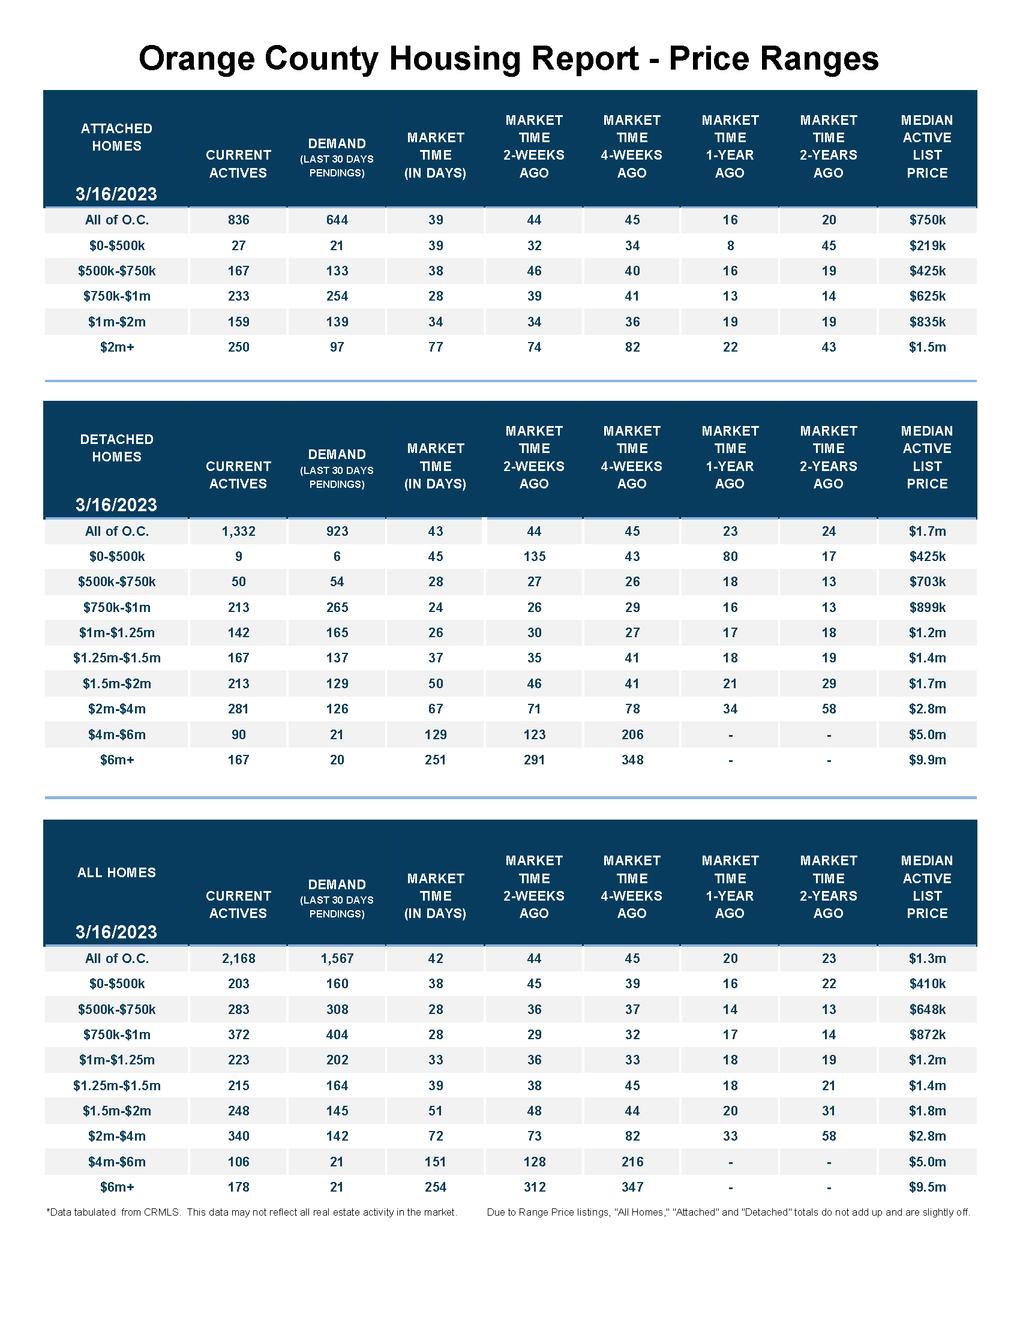
For homes priced below $750,000, the Expected Market Time decreased from 39 to 31 days. This range represents 22% of the active inventory and 30% of demand.
For homes priced between $750,000 and $1 million, the Expected Market Time decreased from 29 to 28 days. This range represents 17% of the active inventory and 26% of demand.
For homes priced between $1 million to $1.25 million, the Expected Market Time decreased from 36 to 33 days. This range represents 10% of the active inventory and 13% of demand.
For homes priced between $1 25 million to $1 5 million, the Expected Market Time increased from 38 to 39 days This range represents 10% of the active inventory and 10% of demand
For homes priced between $1 5 million to $2 million, the Expected Market Time increased from 48 to 51 days This range represents 11% of the active inventory and 9% of demand
For homes priced between $2 million and $4 million, the Expected Market Time in the past two weeks decreased from 73 to 72 days For homes priced between $4 million and $6 million, the Expected Market Time increased from 128 to 151 days For homes priced above $6 million, the Expected Market Time decreased from 312 to 254 days
The luxury end, all homes above $2 million, account for 29% of the inventory and 11% of demand.
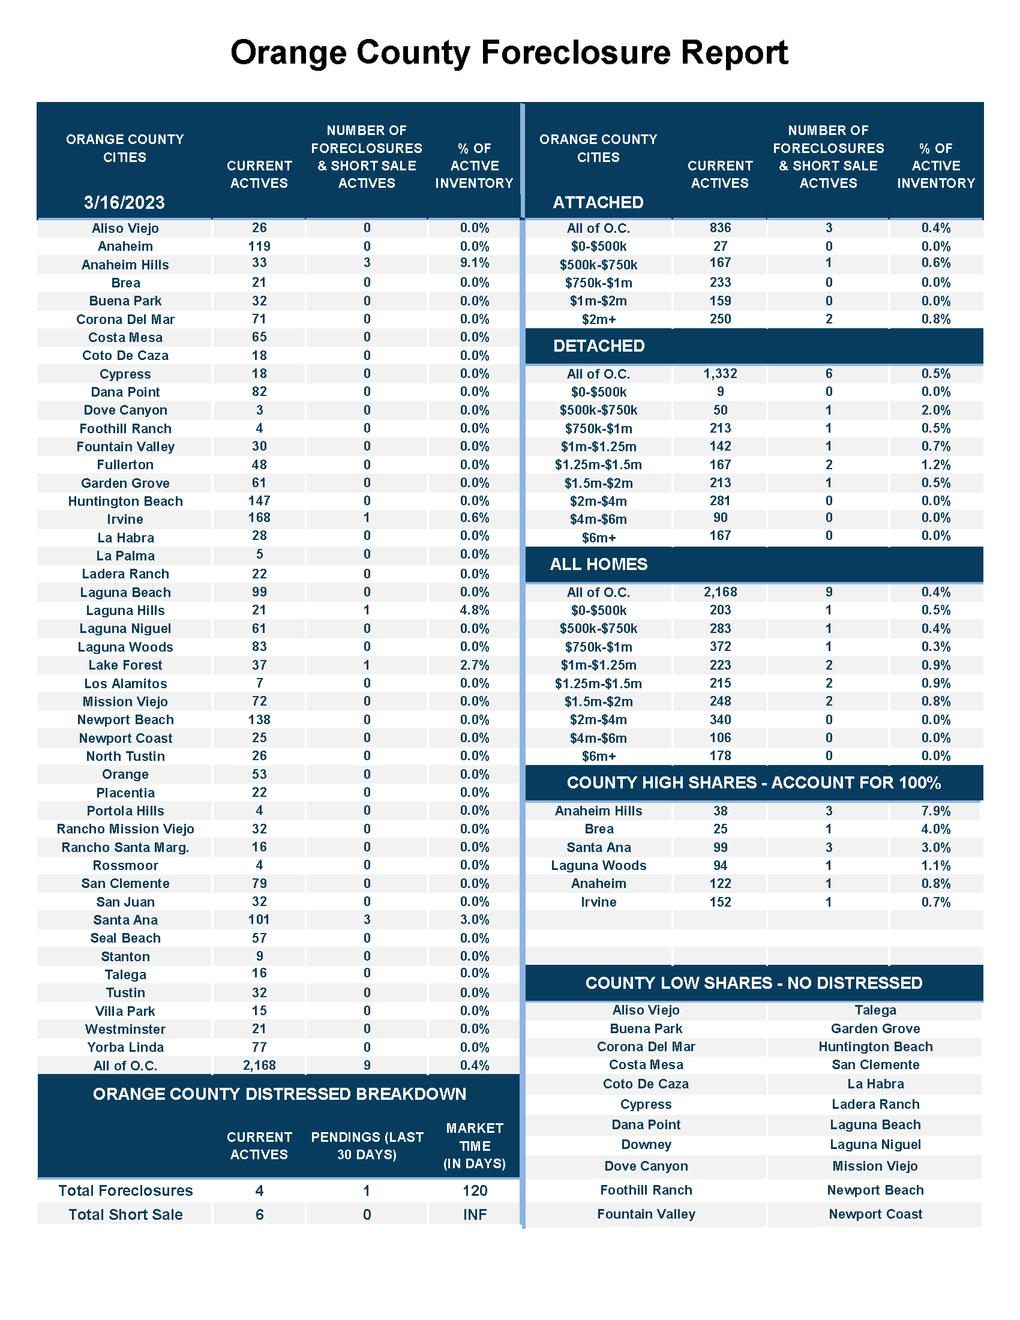
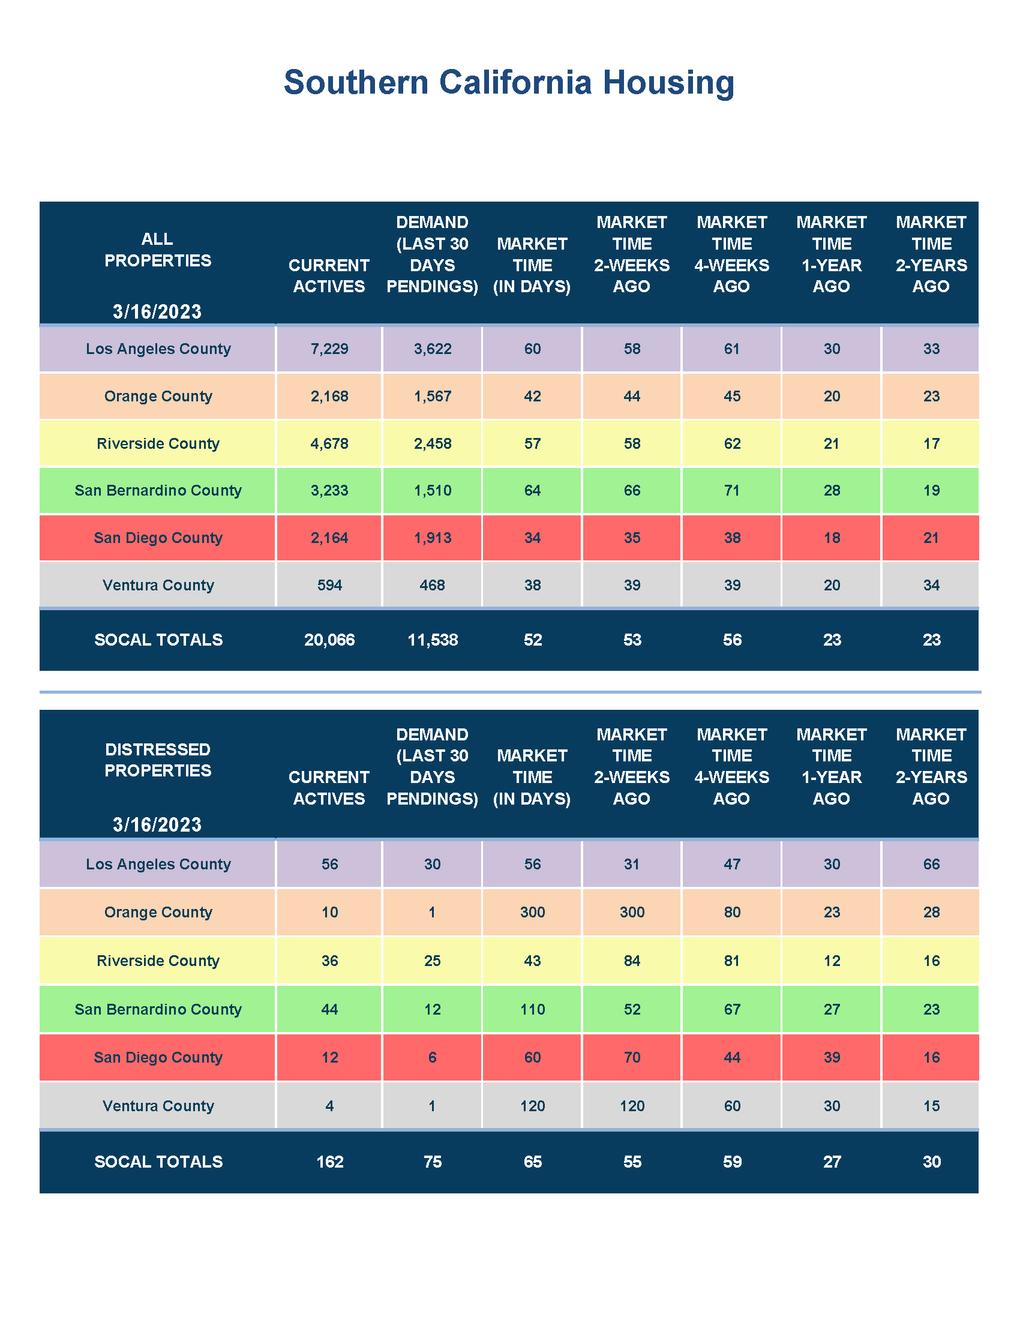
Distressed homes, both short sales and foreclosures combined, comprised only 0.5% of all listings and 0.1% of demand. Only four foreclosures and six short sales are available today in all of Orange County, with ten total distressed homes on the active market, unchanged from two weeks ago. Last year there were three total distressed homes on the market, similar to today.
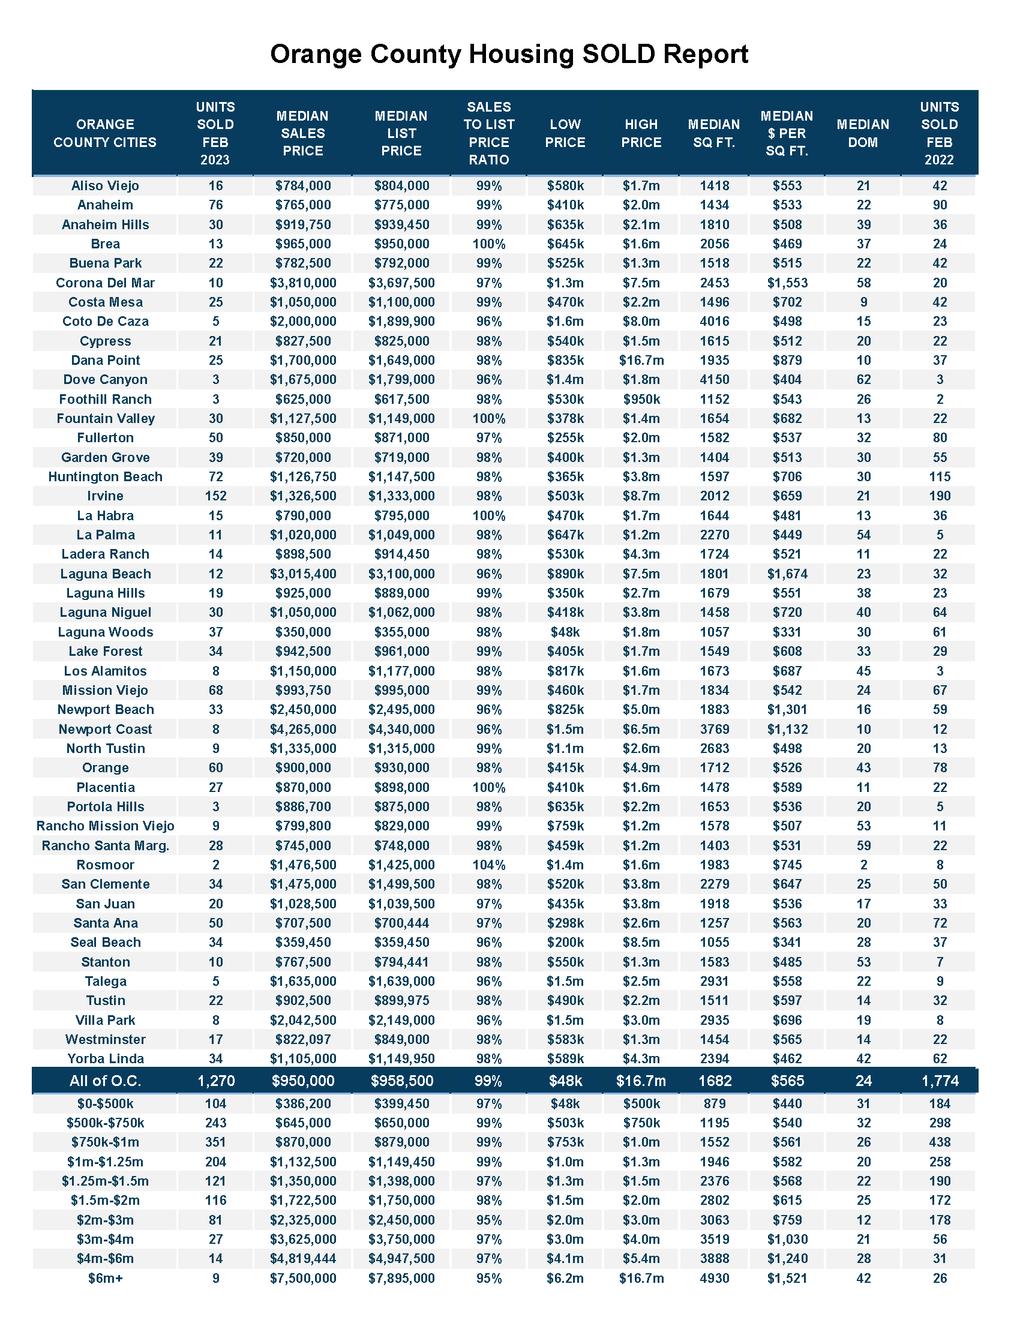
There were 1,270 closed residential resales in February, 28% less than February 2022’s 1,774 closed sales. February marked a 12% increase compared to January 2023. The sales-to-list price ratio was 99.1% for all of Orange County. Foreclosures accounted for 0.1% of all closed sales, and there were no closed short sales That means that 99 9% of all sales were good ol’ fashioned sellers with equity