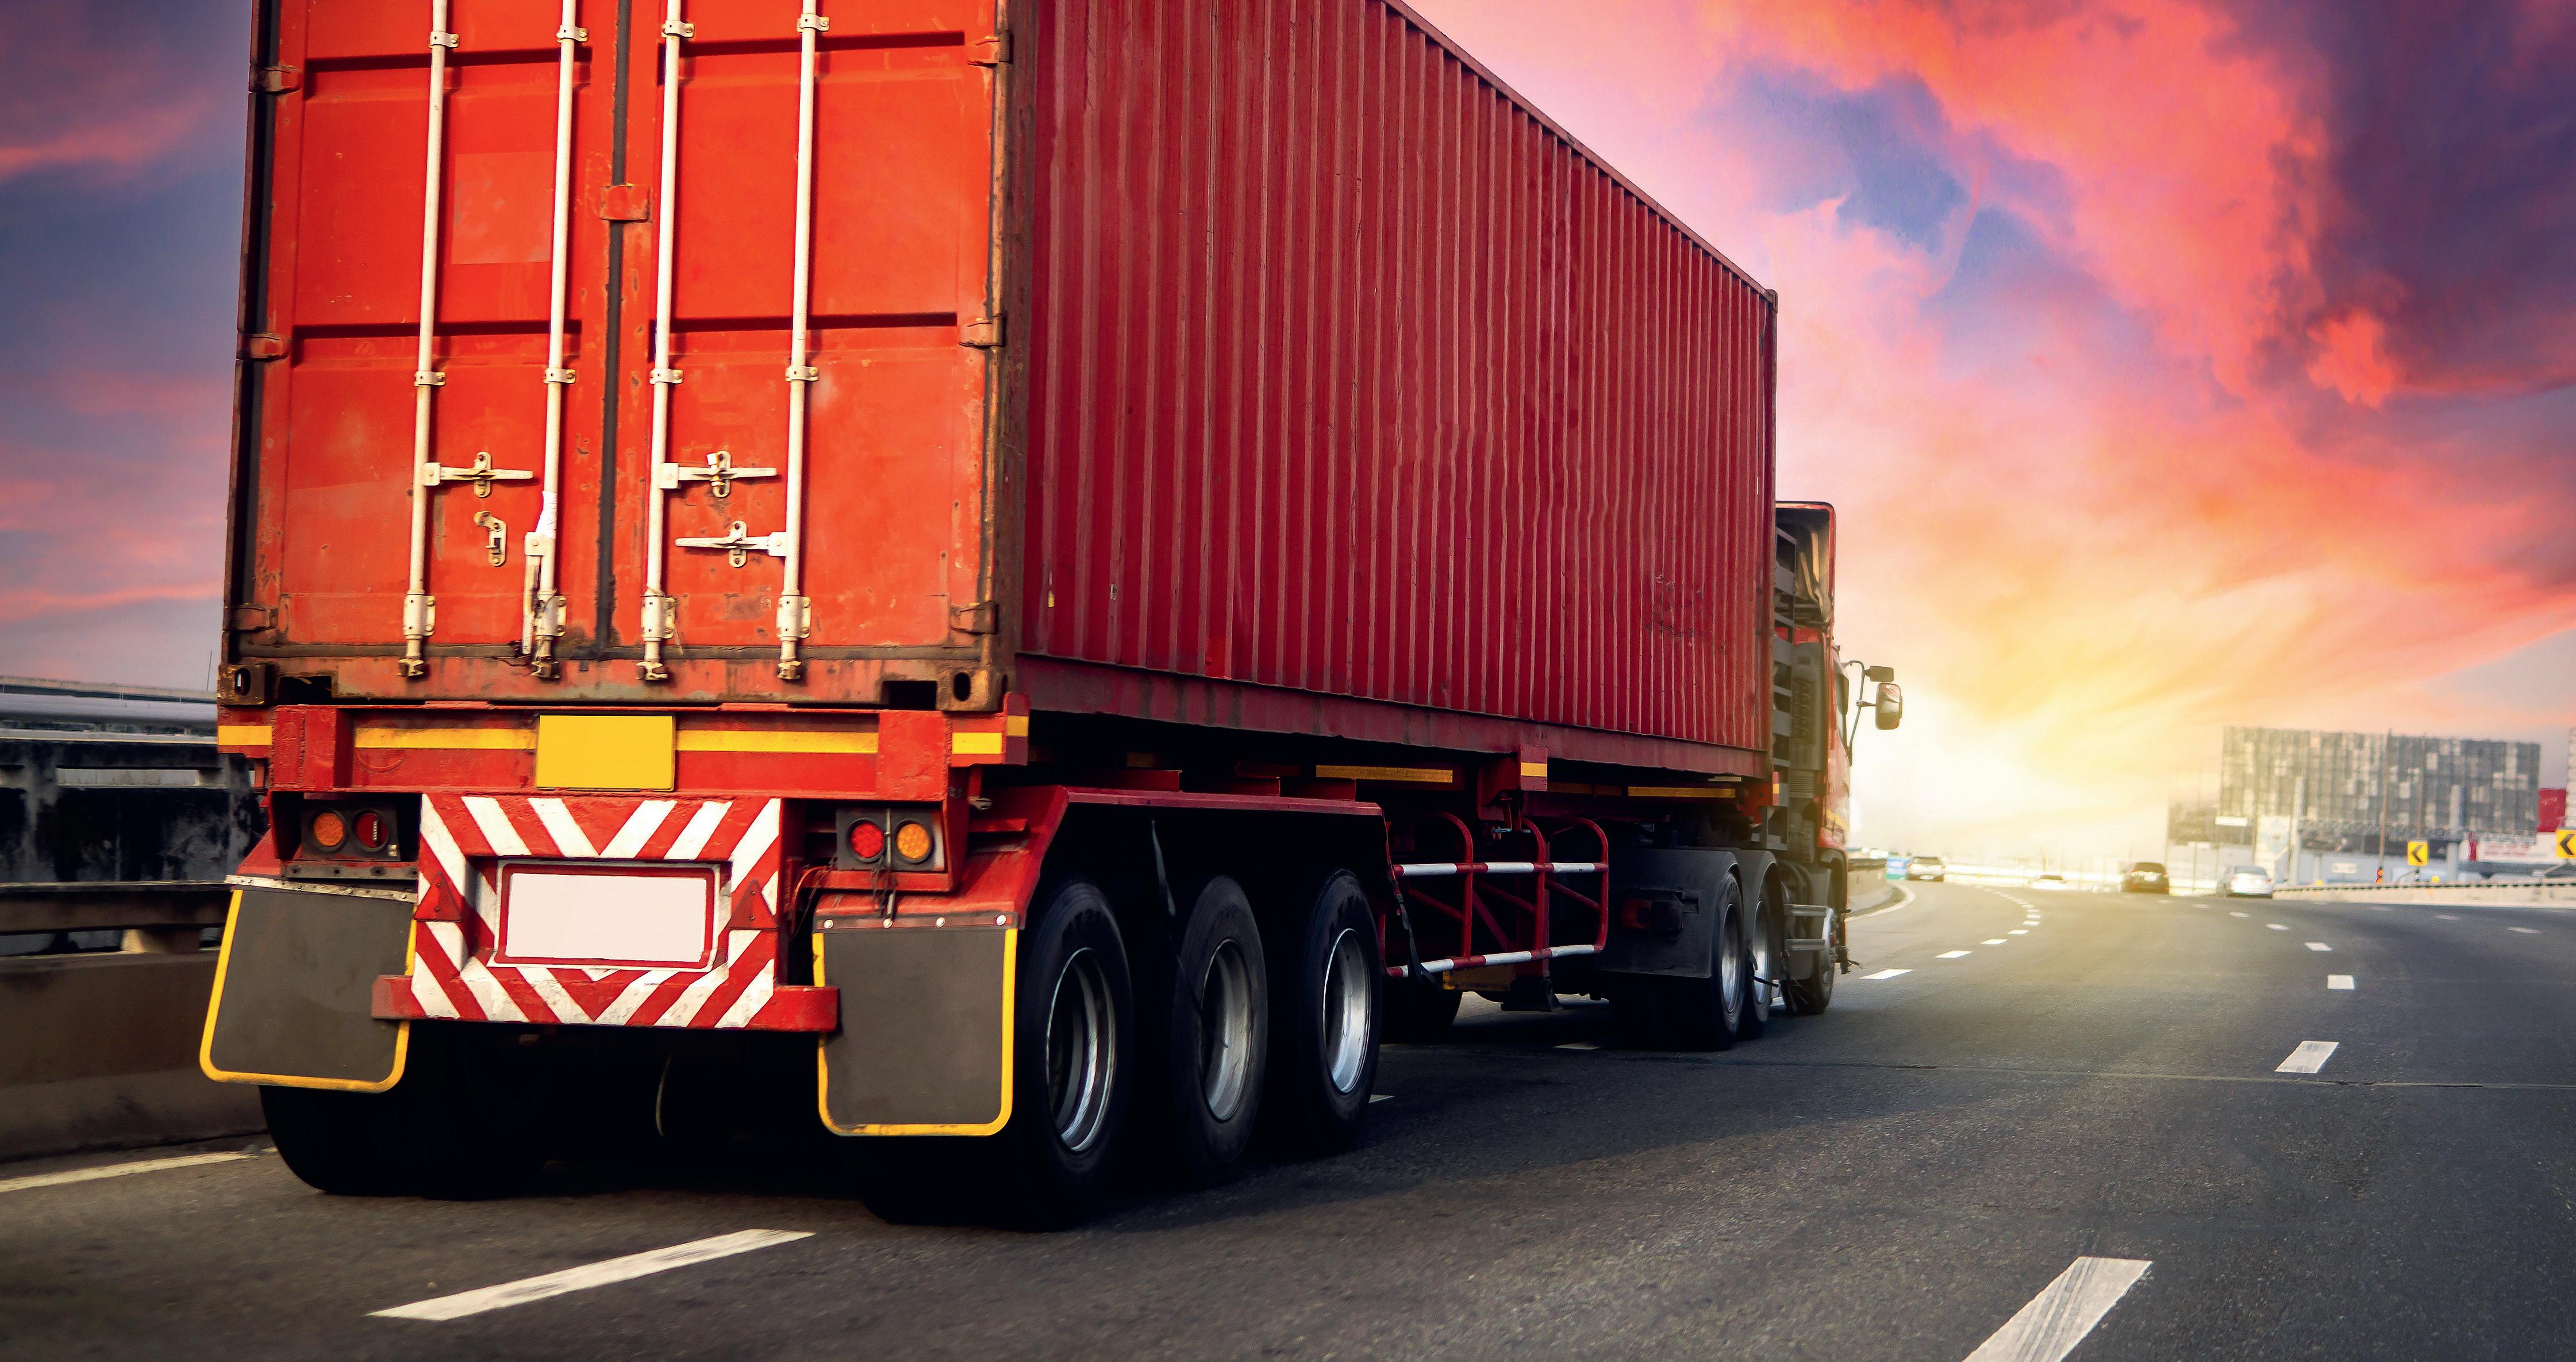
INTRODUCCIÓN
La Cámara Nacional del Autotransporte de Carga, CANACAR, presenta la “Agenda Económica del Autotransporte de Carga”, edición 2022.
El contenido de este documento está estructurado en tres capítulos:
Indicadores Económicos Nacionales, conformado por información de las principales variables que reflejan el comportamiento de la economía; la inflación, tasas de interés, tipo de cambio, así como la variación anual de precios de los insumos que son utilizados por el sector, entre otros.
Indicadores Económicos Internacionales, se observan datos de comercio de México con distintos países y la movilización de mercancías con la frontera norte y sur de nuestro país que se efectúa por el autotransporte de carga mediante cruces transfronterizos, así como: Información del intercambio comercial con diversos países e indicadores internacionales.
Indicadores del Sector Autotransporte de Carga, conformado por cuatro subtemas: Flota vehicular; Transporte doméstico de carga; Infraestructura carretera e Inversión en el sector transporte.
Esperamos que el documento coadyuve a entender la importancia del autotransporte de carga como sector estratégico en el desarrollo económico del país.
Cabe mencionar que, las diferentes fuentes de información son citadas en cada caso.
4
INDICADORES ECONÓMICOS NACIONALES
PRODUCTO INTERNO BRUTO (PIB)
Valores constantes
Producto Interno Bruto 14,947,795 15,495,334 16,059,724 16,277,187 16,741,050 17,292,358 17,747,239 18,122,261 18,520,044 18,483,180 16,993,932 17,806,663 17,697,943 18,041,001
Impuestos sobre los productos, netos 595,394 619,537 628,731 634,567 673,892 712,945 764,689 792,452 818,779 817,121 709,955 752,411 716,889 768,826
Valor agregado bruto 14,352,401 14,875,797 15,430,993 15,642,620 16,067,158 16,579,414 16,982,550 17,329,809 17,701,265 17,666,059 16,283,976 17,054,253 16,981,055 17,272,175
Transportes, correos y almacenamiento 912,749 948,312 986,350 1,011,496 1,047,953 1,090,496 1,122,730 1,164,324 1,201,529 1,200,337 958,709 1,102,696 1,061,223 1,224,592
Transporte aéreo 22,085 22,122 23,497 25,335 27,427 29,833 32,623 36,469 40,013 43,234 22,051 36,474 31,774 48,460
Transporte por ferrocarril 19,808 20,036 19,859 19,630 20,180 20,765 21,120 21,426 22,087 22,397 21,665 23,318 23,290 21,830
Transporte por agua 13,427 13,717 13,510 13,868 13,994 13,081 12,962 12,616 12,522 12,085 10,179 11,139 10,760 11,212
Autotransporte de carga 428,283 454,606 488,788 502,167 529,765 555,170 567,153 596,843 618,320 617,822 555,687 609,007 600,918 625,640
Transporte terrestre de pasajeros, excepto por ferrocarril 325,839 331,895 333,146 342,042 344,806 354,923 367,319 371,392 378,312 377,013 233,135 286,556 268,377 370,055
Transporte por ductos, transporte turístico y servicios relaciona dos con el transporte 72,935 75,963 76,931 77,609 80,034 82,861 85,267 86,985 89,962 87,722 70,348 86,777 80,550 97,089
Servicios postales, servicios de mensajería y paquetería 18,614 18,324 18,895 18,708 18,900 20,425 22,415 24,461 26,821 26,793 31,930 35,216 33,390 36,661
Servicios de almacenamiento 11,758 11,649 11,724 12,137 12,164 13,643
Estructura Porcentual
Producto Interno
Impuestos agregado 96.1 96.1 96.0 95.9 95.7 95.6 95.6 95.6 95.8 95.8 95.9 95.7
Transportes, correos y almacenamiento 6.1 6.1 6.1 6.2 6.3 6.3 6.3 6.4 6.5 6.5 5.6 6.2 6.0 6.8
Transporte aéreo 0.1 0.1 0.1 0.2 0.2 0.2 0.2 0.2 0.2 0.2 0.1 0.2 0.2 0.3
Transporte por ferrocarril 0.1 0.1 0.1 0.1 0.1 0.1 0.1 0.1 0.1 0.1 0.1 0.1 0.1 0.1
Transporte por agua 0.1 0.1 0.1 0.1 0.1 0.1 0.1 0.1 0.1 0.1 0.1 0.1 0.1 0.1
Autotransporte de carga 2.9 2.9 3.0 3.1 3.2 3.2 3.2 3.3 3.3 3.3 3.3 3.4 3.4 3.5
Transporte terrestre de pasajeros, excepto por ferrocarril 2.2 2.1 2.1 2.1 2.1 2.1 2.1 2.0 2.0 2.0 1.4 1.6 1.5 2.1
Transporte por ductos, transporte turístico y servicios relaciona dos con el transporte 0.5 0.5 0.5 0.5 0.5 0.5
Servicios postales, servicios de mensajería y paquetería
Servicios de almacenamiento 0.2 6.2 7.8 8.3 8.8 9.4 11.8 9.7 8.0 -49.0 65.4 35.1 52.5
Transporte por ferrocarril 15.0 1.1 -0.9 -1.2 2.8 2.9 1.7 1.4 3.1 1.4 -3.3 7.6 10.4 -6.3
Transporte por agua 11.6 2.2 -1.5 2.6 0.9 -6.5 -0.9 -2.7 -0.7 -3.5 -15.8 9.4 3.4 4.2
Autotransporte de carga 14.8 6.1 7.5 2.7 5.5 4.8 2.2 5.2 3.6 -0.1 -10.1 9.6 14.4 4.1
Transporte terrestre de pasajeros, excepto por ferrocarril 1.9 1.9 0.4 2.7 0.8 2.9 3.5 1.1 1.9 -0.3 -38.2 22.9 7.1 37.9
Transporte por ductos, transporte turístico y servicios relaciona dos con el transporte 5.6 4.2 1.3 0.9 3.1 3.5 2.9 2.0 3.4 -2.5 -19.8 23.4 17.9 20.5
Servicios postales, servicios de mensajería y paquetería -5.3 -1.6 3.1 -1.0 1.0 8.1 9.7 9.1 9.6 -0.1 19.2 10.3 21.7 9.8
Servicios de almacenamiento 6.4 -0.9 0.6 3.5 5.8 4.6 3.2 1.9 -4.5 -1.6 3.4 3.6 -1.6 12.2
Fuente: INEGI. Sistema de Cuentas Nacionales de México.
*2021 -*2022 Primer Semestre.
AGENDA ECONÓMICA DEL AUTOTRANSPORTE DE CARGA 6
(Millones de pesos a precios de 2013) Año 2010 2011 2012 2013 2014 2015 2016 2017 2018 2019 2020 2021 2021* 2022*
en millones de pesos
12,847 13,439 13,871 14,133 13,493 13,271 13,715 14,209
Bruto 100 100 100 100 100 100 100 100 100 100 100 100 100 100
sobre los productos, netos 4.0 4.0 3.9 3.9 4.0 4.1 4.3 4.4 4.4 4.4 4.2 4.2 4.1 4.3 Valor
bruto 96.0 96.0
0.5 0.5 0.5 0.5 0.5 0.5 0.5 0.4
0.1 0.1 0.1 0.1 0.1 0.1 0.1 0.1 0.1 0.1 0.2 0.2 0.2 0.2
0.1 0.1 0.1 0.1 0.1 0.1 0.1 0.1 0.1 0.1 0.1 0.1 0.1 0.1 Variación porcentual anual (%) Producto Interno Bruto 5.1 3.7 3.6 1.4 2.8 3.3 2.6 2.1 2.2 -0.2 -8.1 4.8 6.9 1.9 Impuestos sobre los productos, netos 4.2 4.1 1.5 0.9 6.2 5.8 7.3 3.6 3.3 -0.2 -13.1 6.0 3.7 7.2 Valor gregado bruto 5.2 3.6 3.7 1.4 2.7 3.2 2.4 2.0 2.1 -0.2 -7.8 4.7 7.1 1.7 Transportes, correos y almacenamiento 8.1 3.9 4.0 2.5 3.6 4.1 3.0 3.7 3.2 -0.1 -20.1 15.0 13.0 15.4 Transporte aéreo -2.0
AGENDA ECONÓMICA DEL AUTOTRANSPORTE DE CARGA 7 ÍNDICE NACIONAL DE PRECIOS AL CONSUMIDOR (INPC) INFLACIÓN AL CONSUMIDOR (Variación Porcentual Anual) Año 2010 2011 2012 2013 2014 2015 2016 2017 2018 2019 2020 2021 2021* 2022* Variación Anual 4.40 3.82 3.57 3.97 4.08 2.13 3.36 6.77 4.83 2.83 3.15 7.36 5.81 8.15 Fuente: INEGI. *2021-*2022 julio. INFLACIÓN AL CONSUMIDOR (VARIACIÓN PORCENTUAL ANUAL) 2010 2011 2012 2013 2014 2015 2016 2017 2018 2019 2020 2021 2021* 2022* 4.40 3.82 3.57 3.97 4.08 2.13 3.36 6.77 4.83 2.83 3.15 7.36 5.81 8.15
AGENDA ECONÓMICA DEL AUTOTRANSPORTE DE CARGA 8 TIPO DE CAMBIO PESOS POR DÓLAR (FIN DE PERIODO) 2010 12.38 2011 13.98 2012 12.99 2013 13.06 2014 14.73 2015 17.34 2016 20.66 2017 19.74 2018 19.66 2019 18.87 2020 2021 19.94 20.46 ENE 20.63 FEB 20.42 MAR 19.91 ABR 20.37 MAY 19.69 JUN JUL 20.13 20.34 2022 TIPO DE CAMBIO PESOS POR DÓLAR PARA SOLVENTAR OBLIGACIONES EN MONEDA EXTRANJERA (Fin de periodo) Año 2010 2011 2012 2013 2014 2015 2016 2017 2018 2019 2020 2021 2022 Ene Feb Mar Abr May Jun Jul Tipo de cambio 12.38 13.98 12.99 13.06 14.73 17.34 20.66 19.66 19.65 18.86 19.90 20.46 20.63 20.42 19.91 20.37 19.69 20.13 20.34 Fuente: BANXICO. Sistema Financiero. Mercado Cambiario. Tipos de Cambio.
RESERVAS INTERNACIONALES DE MÉXICO (Millones de dólares)
Año Dic
2010 92,555 94,470 95,682 97,402 97,994 100,363 105,622 106,239 108,030 110,658 110,544 113,597 102,763
2011 118,459 121,754 121,885 125,794 127,982 129,566 134,011 136,820 137,962 140,487 139,612 142,476 131,401
2012 147,381 147,968 150,264 154,304 154,284 157,337 158,918 161,319 161,882 160,952 163,117 163,592 156,776
2013 163,433 164,715 166,962 167,136 167,129 166,530 168,247 170,709 172,032 174,262 176,152 176,579 169,490
2014 179,570 180,855 182,742 184,013 188,266 190,277 190,192 191,513 190,688 191,717 192,718 193,045 187,966
2015 196,011 195,739 195,375 195,340 193,901 192,403 190,759 185,785 181,040 175,565 171,882 176,735 187,545
2016 175,387 176,047 177,688 177,969 176,960 177,409 177,389 176,243 175,831 175,081 173,994 176,542 176,378
2017 174,972 175,031 174,931 175,011 174,944 174,246 173,347 173,199 173,031 172,887 172,483 172,802 173,907
2018 173,205 172,890 173,232 173,115 173,311 173,211 173,283 173,606 173,566 173,462 173,775 174,793 173,470
2019 175,156 175,694 176,649 176,661 177,856 178,868 178,921 180,377 180,213 180,433 180,597 180,750 178,514
2020 182,796 184,250 185,509 186,655 187,316 188,942 192,606 193,267 193,883 194,351 194,288 195,667 189,961
2021 195,946 195,270 194,774 195,268 194,169 192,886 193,424 205,391 198,216 198,850 199,310 202,399 197,159
2022* 201,583 201,399 200,530 199,175 199,558 198,507 199,480 200,033
Fuente: BANXICO. *2022 enero-julio.
RESERVAS INTERNACIONALES DE MÉXICO (MILLONES DE DÓLARES) 173,470 178,514 189,961 194,719 200,033
AGENDA ECONÓMICA DEL AUTOTRANSPORTE DE CARGA 9
2010 102,763 2011 131,401 2012 156,776 2013 169,490 2014 187,966 2015 187,545 2016 176,378 2017 173,907 2018
2019
2020
2021 2022*
Ene Feb Mar Abr May Jun Jul Ago Sep Oct Nov
Promedio
TASAS DE INTERÉS
TASAS DE INTERÉS INTERBANCARIA DE EQUILIBRIO (TIIE) A 28 DÍAS
Tasa de interés promedio menusal, en % anual.
Año
2010 4.87 4.79 4.80 4.80 4.82 4.84 4.84 3.98 3.79 3.79 3.29 3.29 3.32 3.33 3.31 3.32 3.42 5.34
CERTIFICADOS DE LA TESORERÍA DE LA FEDERACIÓN (CETES) A 28 DÍAS
AGENDA ECONÓMICA DEL AUTOTRANSPORTE DE CARGA 10
Ene Feb Mar Abr May Jun Jul Ago Sep Oct Nov Dic
4.91 4.92 4.92 4.94 4.94 4.94 4.92 4.90 4.90 4.87
4.89 2011 4.86 4.84 4.84 4.85 4.85 4.85 4.82 4.81 4.78
4.80 2012 4.79 4.78 4.77 4.74 4.76 4.76 4.78 4.79
2013 4.84 4.82 4.48 4.33 4.32 4.30 4.32 4.31 4.10
2014 3.78 3.79 3.80 3.81 3.80 3.43 3.30 3.30 3.29
3.30 2015 3.30 3.30 3.30 3.30 3.30 3.30 3.30
2016 3.56 3.75 4.06 4.06 4.08 4.10 4.56 4.59 4.61 5.11
5.84 2017 6.13 6.44 6.63 6.87 6.98 7.21 7.37 7.38 7.38 7.38 7.38 7.51 2018 7.64 7.78 7.83 7.84 7.85 7.93 8.10 8.11 8.11 8.12 8.25 8.41 2019 8.59 8.56 8.52 8.50 8.51 8.51 8.48 8.37 8.20 8.00 7.87 7.70 2020 7.53 7.39 7.10 6.54 6.00 5.65 5.23 4.97 4.72 4.53 4.50 4.49 2021 4.47 4.36 4.28 4.28 4.28 4.31 4.52 4.65 4.75 4.98 5.13 5.44 2022 5.72 6.02 6.33 6.73 7.01 7.42 8.03
Tasa de rendimiento promedio mensual, en % anual. Año Ene Feb Mar Abr May Jun Jul Ago Sep Oct Nov Dic 2010 4.49 4.49 4.45 4.44 4.52 4.59 4.60 4.52 4.43 4.03 3.97 4.30 2011 4.14 4.04 4.27 4.28 4.31 4.37 4.14 4.05 4.23 4.36 4.35 4.34 2012 4.27 4.32 4.24 4.29 4.39 4.34 4.15 4.13 4.17 4.21 4.29 4.05 2013 4.15 4.19 3.98 3.82 3.72 3.78 3.85 3.84 3.64 3.39 3.39 3.29 2014 3.14 3.16 3.17 3.23 3.28 3.02 2.83 2.77 2.83 2.90 2.85 2.81 2015 2.67 2.81 3.04 2.97 2.98 2.96 2.99 3.04 3.10 3.02 3.02 3.14 2016 3.08 3.36 3.80 3.74 3.81 3.81 4.21 4.24 4.28 4.69 5.15 5.61 2017 5.83 6.06 6.32 6.50 6.56 6.82 6.99 6.94 6.99 7.03 7.02 7.17 2018 7.25 7.40 7.47 7.46 7.51 7.64 7.73 7.69 7.69 7.69 7.83 8.02 2019 7.95 7.93 8.02 7.78 8.07 8.25 8.14 8.01 7.72 7.66 7.47 7.12 2020 7.12 6.96 6.81 6.09 5.47 5.06 4.82 4.49 4.38 4.20 4.23 4.27 2021 4.22 4.02 4.08 4.06 4.07 4.03 4.35 4.49 4.69 4.93 5.05 5.49 2022 5.50 5.94 6.52 6.68 6.90 7.56 7.76 Fuente: BANXICO.
SALARIOS
Salarios mínimos grales. 57.46 59.82 62.33 64.76 67.29 70.10 73.04 80.04 88.36 102.68 123.22 141.70 172.87 200.85%
Chofer camión carga gral. 85.69 89.20 92.95 96.58 100.35 104.55 108.94 113.19 117.60 123.48 145.06 166.82 203.52 137.51%
Chofer camioneta carga gral. 82.99 86.39 90.02 93.53 97.18 101.25 105.50 109.61 113.88 119.57 140.95 162.09 197.75 138.28%
Chofer operador veh. en grúa 79.43 82.69 86.16 89.52 93.01 96.90 100.97 104.91 109.00 114.45 135.58 155.92 190.22 139.48%
Incrementos salarios mínimos y chofer camión carga general
Salarios mínimos grales. % 4.85 4.11 4.20 3.90 3.91 4.18 4.19 9.58 10.39 16.21 20.00 15.00 22.00 122.52
Salarios mínimos grales. $2.66 $2.36 $2.51 $2.43 $2.53 $2.81 $2.94 $7.00 $8.32 $14.32 $20.54 $18.48 $31.17 118.07
Chofer camión carga gral. % 4.84 4.10 4.20 3.91 3.90 4.19 4.20 3.90 3.90 5.00 17.48 15.00 22.00 96.62
Chofer camión carga gral. $3.96 $3.51 $3.75 $3.63 $3.77 $4.20 $4.39 $4.25 $4.41 $5.88 $21.58 $21.76 $36.70 121.79
Fuente: Comisión Nacional de Salarios Mínimos.
Notas: 2010-2015 área geográfica A Vigentes a partir del 01 enero de cada año. 2016-2018 área geográfica única
2019* 2020* 2021* 2022* Salarios mínimos generales
AGENDA ECONÓMICA DEL AUTOTRANSPORTE DE CARGA 11 SALARIOS MÍNIMOS PARA OPERADORES DE CAMIONES DE CARGA 2022 (PESOS DIARIOS) 203.52 CHOFER CAMIÓN CARGA GRAL. CHOFER CAMIONETA CARGA GRAL. CHOFER OPERADOR VEHÍCULO EN GRÚA. 197.75 190.22
MÍNIMOS GENERALES Y PARA OPERADORES DE VEHÍCULOS DE CARGA (Pesos diarios) Año 2010 2011 2012 2013 2014 2015 2016 2017 2018 2019* 2020* 2021* 2022* Acumulado en el periodo
INFLACIÓN Y CANASTA BÁSICA DEL AUTOTRANSPORTE DE CARGA
Inflación 6.91 1.84 1.63 3.34 2.78 8.51 4.65 6.42 0.84 4.14 9.30 5.30 9.06
Gasolina 11.08 11.54 9.77 11.23 6.29 1.91 5.56 18.12 18.81 0.40 -6.14 13.78 10.72 22.63 9.70 10.73 9.80 11.85 11.46 2.00 3.03 18.81 19.24 4.59 -7.41 4.70 13.81 19.96
Aceites y lubricantes 6.48 3.74 3.14 0.12 2.07 3.56 7.84 4.91 6.29 0.80 4.34 6.95 2.87 8.07
Neumáticos para camión 3.84 6.36 2.26 0.44 0.86 2.41 6.49 6.05 5.18 2.50 6.43 13.06 9.71 21.62
Bandas de hule 1.24 3.64 6.67 1.48 1.91 6.47 1.00 5.50 4.68 14.59 2.39 3.40 -5.22 2.03
Tractocamiones -1.92 12.52 -6.34 0.86 10.65 9.47 18.61 -4.09 3.72 -1.66 2.59 2.56 -3.28 1.46
Camiones -1.82 9.62 -4.22 1.88 8.30 13.52 14.69 -1.94 4.75 0.27 5.07 4.97 -5.13 4.81
Motores automotrices 2.02 3.17 5.18 1.18 9.12 14.04 13.82 -5.40 5.98 -3.69 2.54 5.26 -7.76 3.48
Alternadores 11.82 3.83 0.00 5.97 4.17 7.19 12.27 0.94 1.53 -1.29 1.30 3.02 -2.82 4.08
Bujías 7.28 3.44 1.04 0.97 1.90 7.06 10.63 3.36 3.84 -1.48 7.79 5.25 -4.13 6.92
Muelles 0.00 9.54 4.75 0.00 1.68 5.57 13.08 -1.46 17.39 5.10 10.28 10.21 1.88 6.92
Amortiguadores 6.24 2.72 2.93 4.69 3.50 2.24 8.43 6.93 4.96 7.34 0.08 1.55 -0.40 0.95
Sistema de frenos 0.00 1.47 0.50 0.65 2.88 6.19 15.29 0.61 1.90 0.96 3.97 9.41 8.40 14.40
Transmisiones -2.62 9.05 -4.93 0.50 5.30 6.11 6.74 13.90 5.13 1.03 6.08 2.77 -0.42 2.23
Radiadores -1.31 5.45 0.00 0.83 1.32 10.22 5.30 11.34 1.99 -1.78 2.90 0.67 -0.98 2.22
Rines -1.89 0.40 -5.17 0.02 9.24 13.16 14.36 0.38 3.92 -0.36 2.47 5.65 0.04 2.69
Electricidad comercial -0.21 17.17 -0.28 2.55 1.68 -12.79 25.04 7.92 3.83 3.05 2.39 3.39 3.18 2.67
Electricidad residencial 3.06 6.51 -2.26 3.63 3.09 -3.68 1.14 1.38 0.90 1.76 3.43 5.92 4.63 11.82
Peaje de camiones 1.05 2.47 6.03 1.81 -0.68 1.96 5.73 3.80 6.33 5.58 2.76 2.56 2.56 0.00
Servicio telefónico local -1.85 -0.26 -5.57 0.00 -0.05 -4.05 0.15 -1.09 0.91 0.74 0.25 0.16 0.35 -0.18
Verificación vehicular 0.00 0.00 0.00 3.85 3.91 -3.41 11.40 6.15 2.95 4.54 3.79 1.96 1.95 5.91
Carrocerías -0.30 2.11 0.00 0.00 3.13 7.09 5.94 2.26 3.36 2.13 3.31 11.79 5.06 9.40
Piezas para carrocerías y remolques -0.38 3.36 3.78 6.51 0.92 3.02 1.20 1.69 9.00 3.13 4.97
Partes para motores 6.82 3.26 2.32 0.23 10.70 16.65 19.58 -6.47 6.65 -4.74 3.53 8.26 -8.61 6.27
Almacenamiento de carga -1.43 5.52 2.22 1.78 7.32 4.90 2.00 3.22 6.69 1.12 10.20
AGENDA ECONÓMICA DEL AUTOTRANSPORTE DE CARGA 12
(Variación porcentual anual y acumulada de precios de los productos que utiliza el autotransporte de carga) Año 2010 2011 2012 2013 2014 2015 2016 2017 2018 2019 2020 2021 2021* 2022*
(Indice Nacional de Precios al Productor - INPP -) 4.23
Productos
Diesel
Fuente: INEGI. *2021 *2022 julio, variación anual.
PRECIO PROMEDIO MENSUAL DE LOS COMBUSTIBLES EN ESTACIONES DE 12.13 12.69 12.49 13.31 14.11 13.94 13.57 14.38 14.20 13.98 14.81 14.63 15.80 17.63 16.86
Ene 16.00 16.71 18.82 19.52 18.92 20.65 17.82 18.46 20.20 20.83 19.44 22.74 17.07 17.78 20.58 21.28 19.87 22.16
Feb 15.85 17.35 19.24 19.40 19.75 20.85 17.72 19.00 20.19 20.51 20.42 22.95 17.07 18.45 21.42 21.02 20.75 22.33
Mar 15.78 17.58 19.74 17.89 20.11 21.28 17.64 19.16 20.84 19.11 21.59 23.25 16.95 18.69 21.53 20.18 21.43 22.73
Abr 15.78 17.68 19.52 15.10 20.19 21.47 17.60 19.23 20.94 16.44 21.88 23.42 16.88 18.78 21.33 19.03 21.55 23.14
May 15.68 17.89 19.44 16.25 20.22 21.66 17.53 19.39 20.95 17.06 22.02 23.69 16.77 18.94 21.25 18.57 21.69 23.29
Jun 15.57 18.10 19.33 17.65 20.27 21.86 17.40 19.61 20.95 18.16 22.13 23.85 16.59 19.17 21.04 19.13 21.73 23.38
Jul 15.48 18.45 19.40 18.60 20.28 21.83 17.30 19.97 20.97 19.08 22.21 23.88 16.46 19.53 21.13 19.70 21.74 23.46
Ago 15.56 18.97 19.28 18.60 20.30 17.39 20.47 20.94 19.09 22.29 16.52 20.05 21.10 19.70 21.79
Sep 15.79 19.23 19.37 18.54 20.19 17.64 20.70 20.94 19.05 22.30 16.77 20.32 21.15 19.40 21.73
Oct 15.92 19.43 19.33 18.39 20.13 17.74 20.94 20.89 18.93 22.36 16.96 20.61 21.08 19.06 21.71
Nov 16.02 19.40 19.32 17.72 20.06 17.85 20.94 20.73 18.35 22.28 17.08 20.78 21.07 18.80 21.64
Dic 16.16 19.10 17.98 20.65 20.78 18.48 22.45 17.24 20.66 21.21 19.15 21.82
1/ Precios promedio de venta al público calculados a partir de los precios reportados por los permisionarios de Estaciones de Servicio en línea de conformidad con la obligación establecida en la Ley de Ingresos de la Federación para el Ejercicio Fiscal de 2017, en el artículo 25, fracción I, inciso a).
2/ Precios promedio de venta al público calculados a partir de los precios reportados por los permisionarios de Estaciones de Servicio en línea de conformidad con la obligación establecida en la Ley de Ingresos de la Federación para el Ejercicio Fiscal de 2018, en el artículo 26, fracción I, inciso a).
Fuente: Comisión Reguladora de Energía 2017-2022. 2013-2016 PEMEX.
AGENDA ECONÓMICA DEL AUTOTRANSPORTE DE CARGA 13
SERVICIO DE EXPENDIO AL PÚBLICO 1/ 2/ (Pesos por litro) Año Regular Premium Diésel 2013
2014
2015
2016
2017
Regular Premium Diésel 2017 2018 2019 2020 2021 2022 2017 2018 2019 2020 2021 2022 2017 2018 2019 2020 2021 2022
19.44 17.91 20.28
INCREMENTO DE
Mes
Ene - 3.39 -1.51 0.39 5.64 1.85 - 2.68 -2.18 0.24 5.18 1.30 - 3.15 -0.38 0.31 3.75 1.57
Feb -0.96 3.86 2.24 -0.58 4.37 0.98 -0.56 2.94 -0.07 -1.54 5.05 0.93 -0.05 3.73 4.05 -1.21 4.40 0.75
Mar -0.42 1.32 2.61 -7.83 1.80 2.03 -0.44 0.82 3.24 -6.82 5.74 1.28 -0.68 1.32 0.53 -4.01 3.29 1.78
Abr -0.04 0.58 -1.11 -15.56 0.40 0.93 -0.21 0.40 0.50 -13.94 1.36 0.76 -0.39 0.48 -0.91 -5.71 0.57 1.80
May -0.64 1.17 -0.41 7.63 0.18 0.87 -0.40 0.84 0.02 3.75 0.60 1.14 -0.70 0.84 -0.41 -2.41 0.63 0.68
Jun -0.66 1.15 -0.58 8.61 0.22 0.90 -0.73 1.13 0.03 6.45 0.53 0.67 -1.05 1.24 -0.96 3.01 0.22 0.39
Jul -0.58 1.96 0.36 5.37 0.07 -0.12 -0.58 1.80 0.07 5.04 0.35 0.12 -0.77 1.87 0.40 2.98 0.01 0.33
Ago 0.49 2.82 -0.59 0.00 0.09 0.50 2.52 -0.11 0.05 0.38 0.32 2.63 -0.13 0.04 0.24
Sep 1.45 1.36 0.43 -0.35 -0.56 1.43 1.13 -0.00 -0.22 0.05 1.53 1.38 0.24 -1.54 -0.28
Oct 0.84 1.05 -0.21 -0.77 -0.30 0.57 1.16 -0.24 -0.61 0.25 1.14 1.42 -0.32 -1.75 -0.08
Nov 0.63 -0.13 -0.04 -3.65 -0.31 0.64 0.02 -0.78 -3.06 -0.34 0.73 0.83 -0.07 -1.35 -0.30
Dic 0.88 -1.55 0.63 1.08 1.05 0.68 -1.40 0.22 0.71 0.75 0.93 -0.58 0.68 1.86 0.82
Fuente: Comisión Reguladora de Energía 2017-2022.
INCREMENTO PRECIO DEL DIÉSEL (VARIACIÓN PORCENTUAL RESPECTO AL MES ANTERIOR)
AGENDA ECONÓMICA DEL AUTOTRANSPORTE DE CARGA 14
LOS COMBUSTIBLES 2017-2022 (Variación porcentual con respecto al mes anterior)
Regular Premium Diésel 2017 2018 2019 2020 2021 2022 2017 2018 2019 2020 2021 2022 2017 2018 2019 2020 2021 2022
17 F M A M J J A S O N D 18 F M A M J J A S O N D 19 F M A M J J A S O N D 20 F M A M J J A S O N D 21 F M A M J J A S O N D 22 F M A M J J 6 4 2 0 -2 -4 -6 -8
INDICADORES ECONÓMICOS INTERNACIONALES
NÚMERO DE CRUCES TRANSFRONTERIZOS DEL AUTOTRANSPORTE DE CARGA FRONTERA NORTE Y SUR POR ADUANA MEXICANA
Aduana 2010 2011 2012 2013 2014 2015 2016 2017 2018 2019 2020 2021 2021* 2022*
Agua Prieta, Son. 31,461 37,017 39,014 41,663 42,633 38,365 36,924 36,144 33,445 32,938 29,691 31,589 15,740 16,503
Cd. Acuña, Coah. 81,641 91,988 94,026 99,563 103,241 103,734 106,111 106,823 108,638 105,867 92,297 97,778 50,539 51,869
Cd. Camargo, Tamps. 27,010 28,415 33,489 31,977 36,911 35,376 41,270 43,297 45,497 47,701 45,409 51,792 24,186 27,058
Cd. Juárez, Chih. 1,052,513 1,064,615 1,080,726 1,159,294 1,145,729 1,107,165 1,138,342 1,155,254 1,198,582 1,194,059 1,095,772 1,242,381 618,141 614,298
Cd. Miguel Alemán, Tamps. 7,193 6,668 6,230 5,711 6,498 5,803 5,107 5,112 5,298 8,202 18,130 28,071 12,871 15,633
Cd. Reynosa, Tamps. 648,509 661,821 685,007 709,963 719,815 714,936 741,810 796,831 824,729 824,569 787,072 896,136 439,479 432,051 Colombia, N.L. 459,817 503,406 499,690 485,635 491,427 467,535 523,689 560,699 547,475 543,279 476,869 493,058 249,103 252,101 Matamoros, Tamps. 351,448 348,876 357,097 356,884 355,781 333,553 350,153 358,593 380,763 366,696 328,004 399,874 189,114 192,482 Mexicali, B.C. 396,923 423,429 422,210 422,653 423,726 424,629 432,553 427,158 440,915 449,184 438,031 482,036 243,943 247,922 Naco, Son. 2,963 3,801 3,734 3,429 4,112 2,988 3,177 2,837 2,250 2,492 2,204 2,430 1,274 1,198 Nogales, Son. 424,734 417,668 433,650 467,223 459,248 429,502 445,716 435,502 435,022 443,712 420,946 456,335 264,796 268,366
Nuevo Laredo, Tamps. 1,968,419 2,109,922 2,210,476 2,290,535 2,447,377 2,538,381 2,564,317 2,662,623 2,846,411 2,764,813 2,635,971 3,095,737 1,528,362 1,597,109 Ojinaga, Chih. 11,486 11,493 13,243 20,271 20,866 9,289 9,011 9,915 10,471 12,714 12,188 14,038 7,118 7,073
Piedras Negras, Coah. 235,499 258,207 235,267 244,465 296,178 297,846 339,667 338,639 367,130 345,038 319,416 352,749 166,940 176,557
Puerto Palomas, Chih. 7,890 8,732 9,842 12,201 14,806 13,214 15,034 14,037 14,530 13,055 15,370 17,556 5,568 6,293
San Luis Río Colorado, Son. 66,093 37,917 58,085 29,912 30,337 Sonoyta, Son. 1,029 357 302 327 361 413 218 226
Tecate, B.C.
AGENDA ECONÓMICA DEL AUTOTRANSPORTE DE CARGA 16
61,666 70,968 72,030 58,313 41,607
37,820 33,545 42,896 47,967
2,122 1,453
892
442 520 543
58,111 57,604 47,892 60,240 55,142 48,483 51,565 52,584 52,196 54,107 55,733 60,734 28,980 30,579 Tijuana, B.C. 947,734 986,903 1,024,452 1,064,624 1,105,210 1,109,003 1,151,098 1,181,684 1,235,560 1,231,624 1,167,028 1,292,049 629,861 632,904 Total Frontera Norte 6,781,566 7,083,684 7,268,042 7,549,253 7,787,370 7,721,711 7,993,788 8,225,913 8,582,870 8,483,388 7,988,618 9,072,971 4,506,145 4,600,559 CD. Hidalgo 105,224 112,417 121,807 124,716 124,087 127,959 128,158 125,009 125,722 126,152 128,036 160,556 76,407 82,207 Subte Lopez 6,797 7,300 7,983 8,382 7,962 8,340 7,829 8,281 8,584 9,527 7,508 9,319 4,652 4,595 Total Frontera Sur 112,021 119,717 129,790 133,098 132,049 136,299 135,987 133,290 134,306 135,679 135,544 169,875 81,059 86,802 Fuente: Administración General de Aduanas, SAT. *2021-*2022 acumulado enero-junio.
IMPORTACIÓN DE MERCANCÍAS
SEGÚN MODO DE TRANSPORTE (Millones de dólares)
Periodo Total Modo de
Aéreo
2010 301,482 24,821 161,536 24,639 78,034 12,453
2011 350,843 28,261 178,366 30,635 101,893 11,687
2012 370,752 29,079 190,456 32,936 107,262 11,018
2013 381,210 31,325 195,773 33,172 109,377 11,563
2014 399,977 34,131 205,972 34,462 115,895 9,517
2015 395,232 35,507 202,382 31,866 119,648 5,829
2016 387,065 34,838 196,611 31,489 117,805 6,321
2017 420,369 38,093 203,866 32,409 137,524 8,476
2018 464,276 43,134 219,042 35,096 156,810 10,192
2019 455,295 42,425 220,980 32,652 151,523 7,715
2020 383,194 36,110 195,212 26,757 119,300 5,815
2021 505,703 46,296 235,687 37,243 172,650 13,828
2021* 234,999 21,007 111,920 17,916 77,069 7,088
2022* 293,715 26,604 129,263 21,402 108,231 8,216
IMPORTACIÓN DE MERCANCÍAS
POR MODO DE TRANSPORTE 2021
EXPORTACIÓN DE MERCANCÍAS SEGÚN MODO DE TRANSPORTE (Millones de dólares)
Periodo Total Modo de Transporte
Aéreo
2010 298,473 12,897 173,493 30,103 72,798 9,183
2011 349,433 13,533 193,038 36,470 98,110 8,283
2012 370,770 15,002 208,605 41,082 97,707 8,374
2013 380,015 15,008 213,077 49,542 93,902 8,486
2014 396,912 16,321 233,050 53,156 88,394 5,990
2015 380,550 17,424 243,133 52,883 66,038 1,072
2016 373,947 17,570 242,227 49,715 63,389 1,045
2017 409,401 20,363 254,719 53,525 79,814 980
2018 450,572 20,539 275,712 60,162 92,819 1,337
2019 461,116 20,056 288,041 60,563 90,907 1,549
2020 417,841 20,331 267,050 51,450 77,295 1,714
2021 494,765 22,235 313,359 57,745 99,685 1,741
2021* 236,369 11,424 147,683 27,769 48,610 882
2022* 280,771 11,538 176,520 33,820 57,737 1,155
EXPORTACIÓN DE MERCANCÍAS
POR MODO DE TRANSPORTE 2021
AGENDA ECONÓMICA DEL AUTOTRANSPORTE DE CARGA
17
Transporte
Carretero Ferroviario Marítimo Otros
Carretero Ferroviario Marítimo Otros
Fuente: INEGI. *2021-*2022 acumulado enero-junio. OTROS OTROS 3% ÁERE O ÁERE O 9% FERROVIARIO FERROVIARIO 7% MARÍTIMO MARÍTIMO 34% CARRETER O CARRETER O 47% 0%5% 12%20%63%
Tipo transporte
INTERCAMBIO COMERCIAL MÉXICO - EUA
Mercancías Transportadas Vía Terrestre (Millones de dólares)
2014 2015 2016 2017 2018 2019 2020 2021 2022R/*
Importaciones país de origen EUA
Carretero 124,347 124,292 118,518 123,535 131,920 132,447 113,982 139,745 77,682
Ferroviario 30,492 28,137 27,784 28,867 30,584 29,148 23,865 31,486 18,057
Total 154,839 152,429 146,302 152,402 162,504 161,595 137,848 171,231 95,738
Exportaciones país de destino EUA
Carretero 220,030 230,058 228,440 239,832 260,721 270,836 253,859 297,932 167,095
Ferroviario 49,053 48,553 46,012 49,909 55,442 56,693 47,873 53,333 31,093
Total 269,083 278,611 274,452 289,741 316,163 327,528 301,732 351,266 198,189
Flujo comercial México-EUA
Carretero 344,377 354,350 346,958 363,367 392,641 403,283 367,841 437,678 244,777
Ferroviario 79,545 76,690 73,796 78,776 86,026 85,840 71,739 84,819 49,150
Total 423,922 431,040 420,754 442,143 478,667 489,124 439,579 522,497 293,927
Participación porcentual del total
Carretero 82.2% 82.5% 82.2% 82.0% 82.5% 83.7% 83.8% 83.3%
Ferroviario 18.0% 17.5% 16.3% 16.2% 16.7%
Total 100% 100% 100% 100% 100% 100% 100% 100% 100%
INTERCAMBIO COMERCIAL MÉXICO- EUA 2022* (PARTICIPACIÓN)
AGENDA ECONÓMICA DEL AUTOTRANSPORTE DE CARGA 18
81.2%
18.8% 17.8% 17.5% 17.8%
Fuente: INEGI con base en SAT, SE, Banco de México, INEGI. Balanza Comercial de Mercancías de México. 2014-2022. SNIEG. Información de Interés Nacional. R/ Cifras revisadas * 2022 acumulado enero-junio. 83.3% 16.7% CARRETERFERROVIARIO O
Unión Europea 47,044 56,909 62,990 62,707 64,715 61,972 61,571 72,044 78,359 75,460 62,641 71,855
Asociación Europea de Libre Comercio 2,644 2,969 2,595 3,089 3,735 3,715 2,790 2,738 2,892 2,754 2,778 3,726
Japón 16,940 18,746 20,266 19,320 20,153 20,386 21,530 22,224 22,060 22,064 17,569 21,267
Panamá 915 1,144 1,219 1,064 1,009 1,163 949 1,026 1,267 1,291 1,198 1,399 China 58,212 62,657 67,790 72,221 74,861 74,933 80,863 90,939 90,189 81,579 110,270 Israel 658 852 728 776 842 905 942 956 951 851 1,051
Resto del mundo 62,804 71,863 75,763 78,445 78,796 79,392 80,151 90,443 101,212 104,988 92,411 123,903
Fuente: Secretaría de Economía.
AGENDA ECONÓMICA DEL AUTOTRANSPORTE DE CARGA COMERCIO TOTAL DE MÉXICO (MILLONES DE DÓLARES) 2010 599,955 2011 700,277 2012 741,521 2013 761,225 2014 796,898 2015 775,784 2016 761,018 2017 829,827 2018 915,016 2019 915,999 2020 2021 800,864 1´000,468 19 COMERCIO TOTAL DE MÉXICO POR PAÍS/REGIÓN Millones de dólares 2010 2011 2012 2013 2014 2015 2016 2017 2018 2019 2020 2021 TOTAL 599,955 700,277 741,521 761,225 796,898 775,784 761,018 829,827 915,016 915,999 800,864 1,000,468 Norteamérica 402,985 469,123 493,779 507,001 534,408 516,160 502,150 542,571 598,962 600,683 526,487 645,646 Alianza del Pacífico 9,679 12,499 12,191 11,526 12,051 10,264 9,205 10,204 11,188 10,364 7,974 11,307 Centroamérica 6,555 8,152 9,210 9,555 9,033 7,029 6,832 6,772 7,181 7,255 7,377 10,044
49,790
599
COMERCIO TOTAL DE MÉXICO EN EL TLCAN - TMEC
Año
2010 383,692 402,985 599,955 29.3%
2011 448,783 469,123 700,276 16.7%
2012 472,952 20,827 493,779 741,521 5.9%
2013 486,701 20,300 507,001 761,225 2.7%
2014 513,649 20,759 534,408 796,898 4.7%
2015 495,668 20,493 516,160 775,784 -2.6%
2016 482,087 20,064 502,150 761,019 -1.9%
2017 521,423 21,148 542,571 829,827 9.0%
2018 574,110 24,852 598,962 915,015 10.3%
2019 576,522 24,161 600,683 915,999 0.1%
2020 506,994 19,493 526,487 800,864 -12.6% 621,337 24,309 645,646 1,000,468 24.9%
COMERCIO TOTAL DE MÉXICO EN EL TLCAN - TMEC DE DÓLARES)
AGENDA ECONÓMICA DEL AUTOTRANSPORTE DE CARGA 20
(MILLONES
2010 19,293 2011 20,340 2012 20,827 2013 CANADÁESTADOS UNIDOS 2014 20,759 2015 20,493 2016 20,064 2017 21,148 2018 24,852 2019 24,161 2020 2021 19,493 24,309 20,300 383,692 448,783 472,952 513,649 495,668 482,087 521,423 574,110 576,522 506,994 621,337 486,701
(Millones de dólares)
Estados Unidos Canadá Total TLCAN-TMEC Todo el mundo Var. %
19,293
20,340
2021
Fuente: Secretaría de Economía.
BALANZA COMERCIAL DE MÉXICO CON EL MUNDO de dólares)
Año Exportaciones Total Saldo Variación %
2010 298,473 301,482 599,955 -3,009 29.3%
2011 349,433 350,843 700,276 -1,409 16.7%
2012 370,770 370,752 741,521 18 5.9%
2013 380,015 381,210 761,225 -1,195 2.7%
2014 396,914 399,984 796,898 -3,071 4.7%
2015 380,550 395,234 775,784 -14,684 -2.7%
2016 373,948 387,070 761,019 -13,122 -1.9%
2017 409,433 420,395 829,827 -10,962 9.0%
2018 450,713 464,302 915,015 -13,589 10.3%
2019 460,704 455,295 915,999 5,409 0.1%
2020 417,670 383,194 800,864 34,476 -12.6%
2021 494,765 505,703 1,000,468 -10,939 24.9%
BALANZA COMERCIAL DE MÉXICO CON EL MUNDO (MILLONES DE DÓLARES) 796,898 775,784 761,019 829,827 915,015 915,999 2021 800,864 1,000,468
AGENDA ECONÓMICA DEL AUTOTRANSPORTE DE CARGA 21
2010 599,955 2011 700,276 2012 741,521 2013 761,225 2014
2015
2016
2017
2018
2019
2020
(Millones
Importaciones Comercio
Fuente: Secretaría de Economía.
TIPO DE CAMBIO EN PAÍSES SELECCIONADOS 0.15 16.56 0.18 17.09 0.15 17.14 0.12 18.03 0.12 17.84 0.18 21.75 0.17 23.61 0.17 22.46 0.17 21.17 0.19 24.36 0.18 23.28
TIPO DE CAMBIO EN PAÍSES SELECCIONADOS MEXICANOS POR LA MONEDA CORRESPONDIENTE)
AGENDA ECONÓMICA DEL AUTOTRANSPORTE DE CARGA 22
(PESOS
Estados Unidos Reino Unido Japón Unión Europea 2010 2011 2012 2013 2014 2015 2016 2017 2018 2019 2020 2021 20.46 16.11 27.72 23.28
(Pesos mexicanos por la moneda correspondiente) Año Estados Unidos Canadá Reino Unido Japón Unión Europea Dólar Americano Dólar Canadiense Libra Esterlina Yen Euro 2010 12.36 12.43 19.33
2011 13.99 13.68 21.42
2012 13.01 13.02 21.07
2013 13.08 12.31 21.67
2014 14.72 12.73 22.98
2015 17.21 12.42 25.44 0.14 18.75 2016 20.66 15.37 25.48
2017 19.74 15.69 26.60
2018 19.66 14.40 25.04
2019 18.86 14.54 24.98
2020 19.90 15.62 27.20
2021 20.46 16.11 27.72
Fuente: BANXICO. Fin de periodo.
INFLACIÓN EN PAÍSES SELECCIONADOS 1.8 3.5 2.5 6.5 2.5 1.3 5.8 1.7 1.9 0.8 5.9 2.4 0.7 0.0 6.4 0.1 0.5 0.2 10.7 1.7 0.3 1.8 0.7 6.3 1.7 1.1 2.7 1.1 3.0 0.5 2.6 1.0 3.4 0.5 1.7 1.1 3.7 1.7 0.5 2.7 1.2 3.4 -0.2 2.5 1.6 8.3
AGENDA ECONÓMICA DEL AUTOTRANSPORTE DE CARGA 23 INFLACIÓN EN PAÍSES SELECCIONADOS 2021 (VARIACIÓN PORCENTUAL ANUAL) MÉXICO 7.3 E.U.A. 4.7 CANADÁ 3.4 ALEMANIA 3.1 -0.2JAPÓN 2.5REINO UNIDO 1.6FRANCIA 8.3BRASIL
(Variación Porcentual Anual) Año México EUA Canadá Alemania Japón Reino Unido Francia Brasil 2010 4.4 1.5 2.3 1.3 -0.3 3.1
5.9 2011 3.8 3.0 2.3 2.0 -0.2
2012 3.6 1.7 0.9 2.0 -0.3
2013 4.0 1.5 1.2 1.4
2014 4.1 0.7 1.4 0.2
2015 2.1 0.7 1.6 0.3
2016 3.4 2.0 1.5
2017 6.8 2.2 1.9
2018 4.8 2.1 1.6 1.5
2019 2.8 1.8 1.9 1.4
2020 3.1 2.1 1.6
2021 7.3 4.7 3.4 3.1
Fuente: Banco Mundial.
AGENDA ECONÓMICA DEL AUTOTRANSPORTE DE CARGA MÉXICO EUA 5.5 CANADÁ 7.5 REINO UNIDO 4.5 FRANCIA 8.1 ALEMANIA 3.5 JAPÓN 2.8 4.4 TASA DE DESOCUPACIÓN EN PAÍSES SELECCIONADOS 2021 (PORCENTAJE) 24 TASA DE DESOCUPACIÓN EN PAÍSES SELECCIONADOS (Variación Porcentual anual) Año México EUA Canadá Reino Unido Francia Alemania Japón 2010 5.5 9.3 7.6 7.9 9.1 6.5 4.9 2011 5.0 8.5 7.4 8.3 9.5 5.5 4.5 2012 4.9 7.9 7.2 7.8 10.2 5.3 4.3 2013 4.7 6.7 7.2 7.1 10.2 5.1 3.7 2014 4.1 5.6 6.7 5.6 10.4 4.9 3.4 2015 4.3 5.0 7.1 5.0 10.2 4.4 3.3 2016 3.7 4.7 6.9 4.6 9.9 3.9 3.1 2017 3.4 4.1 5.8 4.2 9.1 3.5 2.7 2018 3.3 3.9 5.9 4.0 9.2 3.4 2.4 2019 3.4 3.7 5.6 3.9 8.4 3.0 2.3 2020 4.7 8.3 9.5 4.3 8.6 4.3 3.0 2021 4.4 5.5 7.5 4.5 8.1 3.5 2.8 Fuente: Banco Mundial.
PRECIO DEL DIÉSEL EN PAÍSES SELECCIONADOS EN ESTACIONES DE SERVICIO (Dólares EUA, por litro)
Países 2010 2012 2014 2016 2018 2020 2022*
Reino Unido 1.98 2.27 1.99 1.49 1.72 1.23 2.35
Francia 1.72 1.78 1.63 1.20 1.69 1.34 1.95
Costa Rica 0.97 1.36 1.21 0.79 1.55 0.81 1.30
Alemania 1.68 1.88 1.58 1.20 1.44 1.51 1.95
España 1.47 1.75 1.55 1.13 1.41 1.34 1.91
Corea del Sur 1.35 1.63 1.37 1.05 1.23 1.11 1.63
Sudáfrica 1.14 1.42 1.17 0.90 1.19 1.06 1.61
Japón 1.37 1.61 1.10 0.88 1.11 1.06 1.05
México 0.72 0.85 1.02 0.72 1.04 1.01 1.14
India 0.82 0.86 0.91 0.81 1.03 1.09 1.17
China 1.04 1.28 1.09 0.81 0.99 0.90 1.25
Canadá 1.08 1.23 1.16 0.73 0.98 0.93 1.52
Argentina 1.05 1.33 1.33 1.00 0.92 0.78 0.92
Brasil 1.14 1.02 1.02 0.95 0.90 0.71 1.39
Estados Unidos 0.84 1.05 0.97 0.65 0.81 0.70 1.39
Colombia 0.95 1.18 1.04 0.64 0.75 0.57 0.55
Emiratos Árabes Unidos 0.71 0.64 0.64 0.52 0.72 0.55 1.29
Rusia 0.72 1.00 0.75 0.55 0.69 0.64 0.88
Kuwait 0.21 0.20 0.19 0.31 0.38 0.38 0.37
Egipto 0.19 0.18 0.25 0.15 0.31 0.43 0.38
Arabia Saudita 0.07 0.07 0.07 0.12 0.13 0.14 0.16
AGENDA ECONÓMICA DEL AUTOTRANSPORTE DE CARGA 25
Fuente: TheGlobalEconomy.com 2010-2018. GlobalPetroPrices.com 2018-2020. *2022 a junio. PRECIO DIÉSEL EN MÉXICO (DÓLARES EUA, POR LITRO) 2010 0.72 2012 0.85 2014 1.02 2016 0.72 2018 1.04 2020 2022 1.01 1.14
2013 3,055 2,380 11,066 3,714 1,598 5,718 1,740 22,117 9,630 2,184 3,898 4,521
2014 3,368 2,394 11,661 3,152 1,599 5,908 1,821 23,732 9,775 1,887 3,845 4,525
2015 3,565 2,283 12,106 2,428 1,682 6,033 1,972 24,567 9,278 1,378 4,161 4,556
2016 3,616 2,371 12,180 2,177 1,817 5,747 2,090 28,119 9,205 1,304 4,519 4,229
2017 4,095 2,194 11,190 2,737 1,749 5,646 2,226 29,015 9,691 1,552 4,792 4,115
2018 4,101 2,021 11,315 2,881 1,604 5,120 2,270 27,809 9,729 1,768 5,175 4,029
2019 3,987 1,917 10,880 2,945 1,381 4,661 2,202 25,721 9,684 1,720 5,416 3,951
2020 3,176 1,376 8,822 2,014 987 3,742 1,316 25,225 8,067 1,435 3,394 3,506
2021 3,145 1,115 9,167 2,248 932 3,308 1,351 26,082 7,846 1,566 4,399 3,462
Fuente: OICA
AGENDA ECONÓMICA DEL AUTOTRANSPORTE DE CARGA PRODUCCIÓN DE VEHÍCULOS AUTOMOTORES EN PAÍSES SELECCIONADOS 2021 (MILES DE UNIDADES) MÉXICO E.U.A. CANADÁ ALEMANIA JAPÓN RUSIA INDIA COREA DEL SUR CHINA REINO UNIDO FRANCIA 3,308 932 1,351 26,082 1,566 7,846 3,462 4,399 BRASIL 2,248 9,167 1,115 3,145 26 PRODUCCIÓN DE VEHÍCULOS AUTOMOTORES EN PAÍSES SELECCIONADOS (Miles de unidades) Año México Canadá Estados Unidos Brasil Reino Unido Alemania Francia China Japón Rusia India Corea del Sur 2010 2,342 2,068 7,763 3,382 1,393 5,906 2,229 18,265 9,629 1,403 3,557 4,272 2011 2,681 2,135 8,662 3,418 1,464 6,147 2,243 18,419 8,399 1,990 3,927 4,657 2012 3,002 2,463 10,333 3,404 1,577 5,649 1,968 19,272 9,943 2,232 4,175 4,562
INDICADORES DEL SECTOR AUTOTRANSPORTE DE CARGA
El autotransporte de carga aportó al PIB Nacional el 3.4% en el año 2021, en este sentido, el sector se posiciona como estratégico, el impacto que tiene en la competitividad nacional permite que millones de consumidores accedan a productos y servicios de toda índole.
En ese mismo año, el autotransporte de carga movilizó 534.5 millones de toneladas de productos y mercancías, lo que equivale al 80.4% de la carga terrestre y 56.2% de la carga doméstica total.
La flota vehicular alcanzó un total de 1,201,053 conformada por 50.5% (606,090) de unidades motrices y 49.5% (594,443) unidades de arrastre y 520 grúas industriales.

La antigüedad de la flota es de 21.1 años en promedio tienen las unidades motrices, mientras que la edad promedio de las unidades de arrastre fue de 20 años, datos que reflejan la necesidad de la modernización del parque vehicular.
Destacando que este sector, esta conformado mayormente por micro y pequeños transportistas que representan el 97.3% del total de permisionarios.
A continuación, se observa la estructura empresarial:

Micro Transportista Número de permisionarios: 155,476 (81.2%)
1 a 5 vehículos Número de unidades: 285,054 (23.7%)
Pequeño Transportista Número de permisionarios: 30,843 (16.1%)
6 a 30 vehículos Número de unidades: 355,839 (29.6%)
Mediano Transportista Número de permisionarios: 4,009 (2.1%)
31 a 100 vehículos Número de unidades: 203,712 (17.0%)
Gran Transportista Número de permisionarios: 1,222 (0.6%)
Más de 100 vehículos Número de unidades: 356,448 (29.7%)
TOTAL 191,550 permisionarios 1,201,053 unidades motrices y de arrastre
AGENDA ECONÓMICA DEL AUTOTRANSPORTE DE CARGA Movimiento de la Carga Nacional por Modo de Transpor te 2021 (M illones de toneladas) M odalid a d Tonela da s Po rce nt aj e Autotranspor te 534.5 56.17% Marítimo 129.9 13.65% Ferroviario 286.1 30.07% Aéreo 1.0 0.11% Total Nacional 951.5 100.0 29
2011 103,787 191,387 18,427 207,068 2,202 112,318 603 147,987 125,019 9.1 658,760 3.7
2012 110,385 203,219 19,544 220,676 2,373 121,583 693 170,205 132,995 6.4 715,683 8.6
2013 104,429 194,369 19,862 225,518 2,380 122,750 720 186,409 127,391 -4.2 729,046 1.9
2014 106,762 199,475 20,574 234,538 2,493 127,234 776 202,233 130,605 2.5 763,480 4.7
2015 109,890 206,416 21,389 245,066 2,610 132,571 837 222,352 134,726 3.2 806,405 5.6
2016 114,308 215,163 22,793 260,455 2,826 142,953 903 246,264 140,830 4.5 864,835 7.2
2017 117,598 221,284 23,721 272,665 2,976 151,592 970 271,840 145,265 3.1 917,381 6.1
2018 123,073 231,956 25,189 290,265 3,183 161,520 1,042 299,115 152,487 5.0 982,856 7.1
2019 147,966 269,411 28,318 325,938 3,601 181,405 1,146 322,617 181,031 18.7 1,099,371 11.9
2020 150,512 274,937 29,328 339,106 3,753 190,602 1,181 339,295 184,774 2.1 1,143,940 4.1
2021 155,476 285,054 30,843 355,839 4,009 203,712 1,222 356,448 191,550 3.7 1,201,053 5.0
Fuente: Estadística Básica del Autotransporte Federal 2021, DGAF, SICT. HC. Hombre camión.
AGENDA ECONÓMICA DEL AUTOTRANSPORTE DE CARGA 30 4 .1 3 .7 8 .6 1 .9 4 .7 5 .6 7 .2 6 .1 7 .1 11.9 3 .7 9 .1 6 .4 4.2 2 .5 3 .2 4 .5 3 .1 5 .0 201 0 20 11 20 12 201 3 20 14 20 15 2 016 2 017 2 018 2 019 2 0206 .0 4 .0 2 .0 0 .0 2 .0 4 .0 6 .0 8 .0 10 .0 15 .0 20 .0 Unidades Empresas 18.7 4.1 2.1 2 021 5.0 3.7 ESTRUCTURA EMPRESARIAL DEL AUTOTRANSPORTE DE CARGA (VARIACIÓN % ANUAL) ESTRUCTURA EMPRESARIAL DEL AUTOTRANSPORTE DE CARGA Empresas y unidades Año Micro 1 a 5 (HC) Pequeña 6 a 30 Mediana 31 a 100 Grande + de 100 Total Empresas Var. % Anual Total Unidades Var. % AnualEmpresas Unidades Vehiculares Empresas Unidades Vehiculares Empresas Unidades Vehiculares Empresas Unidades Vehiculares 2010 94,020 176,476 17,810 200,861 2,104 107,826 607 150,305 114,541 3.7 635,468 4.1
Unidades
Semirremolque
Semirremolque
Semirremolque
Semirremolque
AGENDA ECONÓMICA DEL AUTOTRANSPORTE DE CARGA FLOTA VEHICULAR DEL AUTOTRANSPORTE DE CARGA POR CLASE DE VEHÍCULO (UNIDADES) 202 1 505 594,443 606,090 Grúas industriales Unidades de arrastre Unidades motrices 201 0 35 1 293 ,05 3 342 ,06 4 201 1 35 5 306 ,70 0 351 ,70 5 201 2 48 3 334 ,85 8 380 ,34 2 201 3 68 4 347 11 2 381 25 0 201 4 87 7 367 05 1 395 55 2 201 5 1 ,05 2 390 56 3 414 79 0 201 6 1 22 4 420 55 3 443 05 8 201 7 44 9 453 ,91 6 463 ,01 6 201 8 46 4 486 ,33 5 496 ,05 7 201 9 497 537,813 561,061 202 0 505 563,400 580,035 0 100000 200000 300000 400000 500000 600000 31 FLOTA VEHICULAR DEL AUTOTRANSPORTE DE CARGA POR CLASE DE VEHÍCULO (Unidades) Año 2010 2011 2012 2013 2014 2015 2016 2017 2018 2019 2020 2021 Total 635,468 658,760 715,683 729,046 763,480 806,405 864,835 917,381 982,856 1,099,371 1,143,940 1,201,053 Unidades motrices Clase 342,064 351,705 380,342 381,250 395,552 414,790 443,058 463,016 496,057 561,061 580,035 606,090 Camión de dos ejes C2 67,012 70,469 76,667 75,293 78,111 82,036 87,197 84,226 90,038 115,058 117,589 121,897 Camión de tres ejes C3 61,858 60,333 64,784 64,582 65,173 67,048 70,256 73,909 78,844 89,294 91,078 93,754 Tractocamión de dos ejes T2 1,963 2,021 2,246 2,276 2,427 2,576 2,840 2,968 3,149 3,524 3,632 3,747 Tractocamión de tres ejes T3 210,786 218,332 235,993 238,390 249,029 262,222 281,509 301,088 322,979 351,959 366,461 385,250 Otros 445 550 652 709 812 908 986 825 1,047 1,226 1,275 1,442
de arrastre Clase 293,053 306,700 334,858 347,112 367,051 390,563 420,553 453,916 486,335 537,813 563,400 594,443
de un eje S1 2,143 2,327 2,572 2,685 2,789 3,015 3,368 3,643 3,815 4,498 4,763 4,788
de dos ejes S2 223,350 236,198 258,348 268,948 285,861 306,067 331,195 358,813 386,568 428,206 450,178 475,631
de tres ejes S3 64,113 64,541 70,058 71,565 74,455 77,493 81,782 87,04 91,393 100,495 103,770 109,208
de cuatro ejes S4 226 235 261 298 342 394 495 585 637 679 705 739 Semirremolque de cinco ejes S5 21 26 26 33 37 49 56 60 67 84 88 91 Semirremolque de seis ejes S6 49 52 57 66 72 75 83 96 115 131 134 145 Remolque de dos ejes R2 2,418 2,586 2,753 2,750 2,720 2,694 2,747 2,832 2,881 2,815 2,845 2,907 Remolque de tres ejes R3 632 635 671 635 648 645 650 656 664 689 700 725 Remolque de cuatro ejes R4 91 89 93 104 95 93 112 120 120 136 137 136 Remolque de cinco ejes R5 2 2 2 8 11 12 15 15 15 18 18 17 Remolque de seis ejes R6 8 9 17 20 21 26 50 56 60 62 62 56 Grúas industriales GI 351 355 483 684 877 1,052 1,224 449 464 497 505 520 Fuente: Estadística Básica del Autotransporte Federal 2021, DGAF, SICT. FLOTA VEHICULAR
AGENDA ECONÓMICA DEL AUTOTRANSPORTE DE CARGA 2013201220112010 2014 2015 2016 2017 2018 2019 2020 2021 86,889 568,740 90,020 616,079 99,604 623,439 105,607 650,798 112,682 685,109 121,296 733,345 131,490 786,876 130,505 841,403 141,453 954,402 144,969 990,458 1,037,279 153,482 163,774 FLOTA VEHICULAR DEL AUTOTRANSPORTE DE CARGA POR CLASE DE SERVICIO (UNIDADES) 548,579 CARGA ESPECIALIZADA CARGA GENERAL 32 FLOTA VEHICULAR DEL AUTOTRANSPORTE DE CARGA POR CLASE DE SERVICIO (Unidades) Año 2010 2011 2012 2013 2014 2015 2016 2017 2018 2019 2020 2021 Total 635,468 658,760 715,683 729,046 763,480 806,405 864,835 917,381 982,856 1,099,371 1,143,940 1,201,053 Carga general 548,579 568,740 616,079 623,439 650,798 685,109 733,345 786,876 841,403 954,402 990,458 1,037,279 Carga especializada 86,889 90,020 99,604 105,607 112,682 121,296 131,490 130,505 141,453 144,969 153,482 163,774 Materiales peligrosos 70,669 73,170 80,689 83,099 87,685 93,141 99,226 105,842 114,424 116,327 124,164 132,942 Automóviles sin rodar 3,577 3,651 4,137 4,292 4,507 5,213 6,203 7,105 7,399 7,480 7,424 7,554 Fondos y valores 2,047 2,099 2,553 2,986 3,229 3,360 3,544 3,930 4,295 4,615 4,761 5,094 Grúas para arrastre 4,710 4,899 8,852 5,168 5,341 5,491 5,763 ND ND ND ND ND Grúas, arrastre y salvamento 4,035 4,044 705 4,348 4,467 4,667 5,002 ND ND ND ND ND Vehículos voluminosos 1,851 2,157 2,668 5,714 7,453 9,424 11,752 13,628 15,335 16,547 17,133 18,184 Fuente: Estadística Básica del Autotransporte Federal 2021, DGAF, SICT. FLOTA VEHICULAR
AGENDA ECONÓMICA DEL AUTOTRANSPORTE DE CARGA 0 5,00 0 10,00 0 15,00 0 20,00 0 25,00 0 30,00 0 UNIDADES MOTRICES DE CARGA 33 UNIDADES MOTRICES DE CARGA POR MODELO Y CONFIGURACIÓN VEHICULAR Clase de Vehículo Año Modelo del Vehículo C-2 C-3 T-2 T-3 Otros Total 1960 - 2005 67,656 64,452 2,077 163,812 405 298,402 2006 4,501 1,650 148 13,042 56 19,397 2007 4,722 2,755 224 17,497 54 25,252 2008 6,365 2,774 142 18,269 91 27,641 2009 3,308 2,343 164 16,852 103 22,770 2010 2,312 1140 79 7,121 64 10,716 2011 3,461 1,440 94 11,246 58 16,299 2012 3,606 1,444 100 14,999 47 20,196 2013 2,877 1,501 73 13,620 45 18,116 2014 2,393 1,412 86 12,410 58 16,359 2015 3,195 1,245 61 10,600 75 15,176 2016 3,053 1,745 106 11,702 72 16,678 2017 3,602 2,101 91 14,641 49 20,484 2018 3,422 2,420 77 14,603 90 20,612 2019 3,160 2,119 85 13,644 68 19,076 2020 1,795 1,327 57 13,984 57 17,220 2021 1,517 999 49 8,447 41 11,053 2022 952 887 34 8,761 9 10,643 Total 121,897 93,754 3,747 385,250 1,442 606,090 Fuente: Estadística Básica del Autotransporte Federal 2021, DGAF, SICT. FLOTA VEHICULAR
AGENDA ECONÓMICA DEL AUTOTRANSPORTE DE CARGA 0 5,00 0 10,00 0 15,00 0 20,00 0 25,00 0 UNIDADES DE ARRASTRE DE CARGA 34 UNIDADES DE ARRASTRE DE CARGA POR MODELO Y CONFIGURACIÓN VEHICULAR Año Modelo Unidad Arrastre Clase de Unidad de Arrastre Total S-1 S-2 S-3 S-4 S-5 S-6 R-2 R-3 R-4 R-5 R-6 1960 - 2005 3,132 258,380 56,404 292 40 67 2,100 472 101 13 22 321,023 2006 82 16,730 2,736 9 1 0 91 18 2 0 0 19,669 2007 82 17,507 3,040 10 2 7 71 26 2 0 1 20,748 2008 121 14,795 3,188 17 4 2 136 19 0 1 1 18,284 2009 81 10,598 2,864 25 1 0 48 29 2 2 6 13,656 2010 42 8,055 2,641 13 6 2 23 20 3 1 1 10,807 2011 104 7,560 2,377 16 1 3 40 17 3 0 6 10,127 2012 135 10,016 2,992 21 3 8 28 10 5 0 3 13,221 2013 122 11,108 3,651 28 2 6 99 9 0 0 3 15,028 2014 78 10,556 3,447 48 5 3 46 6 1 0 1 14,191 2015 87 10,707 3,198 37 8 15 18 24 11 0 4 14,109 2016 152 13,708 3,208 68 5 12 28 8 4 0 2 17,195 2017 136 14,540 3,750 78 2 2 20 7 1 0 3 18,539 2018 76 16,088 3,353 22 2 10 28 8 0 0 0 19,587 2019 54 16,348 3,247 22 4 5 61 6 0 0 0 19,747 2020 209 16,181 3,017 15 3 3 49 6 1 0 0 19,484 2021 90 13,742 4,014 12 2 0 18 31 0 0 3 17,912 2022 5 9,012 2,081 6 0 0 3 9 0 0 0 11,116 Total 4,788 475,631 109,208 739 91 145 2,907 725 136 17 56 594,443 Fuente: Estadística Básica del Autotransporte Federal 2021, DGAF, SICT. FLOTA VEHICULAR
Grúas industriales 355 483 684 877 1,052 1,224 449 464 497 505 520
Empresas Autotransporte
Empresas del Autotransporte de Carga 130,856 144,294 152,776 147,802 151,883 156,714 164,011 169,312 178,196 197,219 201,976 210,392
Personas morales 16,892 19,887 20,014 18,937 19,903 21,337 22,704 25,720 27,374 28,121 29,003 30,591
Personas fisicas 113,964 124,407 132,762 128,865 131,980 135,377 141,307 143,592 150,822 169,098 172,973 179,801
Fuente: Estadística Básica del Autotransporte Federal 2021, DGAF, SICT. Nota: La diferencia del total de permisionarios respecto al cuadro de la Estructura Empresarial, se debe a que estos pueden tener oficinas en más de un Estado, es por ello que es mayor en su número.
AGENDA ECONÓMICA DEL AUTOTRANSPORTE DE CARGA FLOTA VEHICULAR DE EMPRESAS DEL AUTOTRANSPORTE FEDERAL (UNIDADES) 2010 635,468 2011 658,760 2012 715,683 2013 729,046 2014 763,480 2015 806,405 2016 864,835 2017 917,381 2018 982,856 2019 1,099,371 2020 2021 1,143,940 1,201,053 35 FLOTA VEHICULAR DE EMPRESAS DEL AUTOTRANSPORTE FEDERAL (Unidades) Año 2010 2011 2012 2013 2014 2015 2016 2017 2018 2019 2020 2021 Vehículos del Autotransporte de Carga 635,468 658,760 715,683 729,046 763,480 806,405 864,835 917,381 982,856 1,099,371 1,143,940 1,201,053 Unidades motrices 342,064 351,705 380,342 381,250 395,552 414,790 443,058 463,016 496,057 561,061 580,035 606,090 Unidades de arrastre 293,053 306,700 334,858 347,112 367,051 390,563 420,553 453,916 486,335 537,813 563,400 594,443
351
en servicio de
de Carga
FLOTA VEHICULAR
AGENDA ECONÓMICA DEL AUTOTRANSPORTE DE CARGA 16.1 11 a 15 año s 14.3 6 a 10 año s 13 0 a 5 año s 14 .1 16 a 20 año s 9.8 21 a 25 año s 6.7 26 a 30 año s 7 .1 31 a 35 año s 4.3 36 a 40 año s 7.7 41 a 45 año s 3.8 46 a 50 año s 3.0 Más d e 50 año s ANTIGÜEDAD DE LA FLOTA VEHICULAR DEL AUTOTRANSPORTE DE CARGA POR RANGO DE EDAD - 2021 (PARTICIPACIÓN PORCENTUAL EN EL TOTAL) 36 ANTIGÜEDAD DE LA FLOTA VEHICULAR DEL AUTOTRANSPORTE DE CARGA Y RANGO DE EDAD - 2021 Unidades Motrices Antigüedad C-2 C-3 T-2 T-3 Otros Total 0 a 5 años 10,846 7,752 302 59,439 265 78,604 6 a 10 años 15,120 8,004 417 62,973 299 86,813 11 a 15 años 19,052 9,141 579 68,487 363 97,622 16 a 20 años 18,592 8,910 695 57,085 208 85,490 21 a 25 años 14,520 8,460 480 36,126 85 59,671 26 a 30 años 10,855 6,383 302 22,839 53 40,432 31 a 35 años 9,552 7,934 226 25,335 64 43,111 36 a 40 años 3,665 5,239 166 16,936 51 26,057 41 a 45 años 9,884 15,786 231 20,979 27 46,907 46 a 50 años 5,376 8,852 124 8,876 12 23,240 Más de 50 años 4,435 7,293 225 6,175 15 18,143 Parque Vehicular 121,897 93,754 3,747 385,250 1,442 606,090 Antigüedad 22.6 28.8 23.0 18.7 15.2 21.1 Fuente: Estadística Básica del Autotransporte Federal 2021, DGAF, SICT. Antigüedad calculada con unidades motrices 1960-2022. FLOTA VEHICULAR
AGENDA ECONÓMICA DEL AUTOTRANSPORTE DE CARGA 14.8 0 a 5 año s 13 .3 6 a 10 año s 11.1 11 a 15 año s 14.9 16 a 20 año s 16.5 21 a 25 año s 9 .8 26 a 30 año s 6 .8 31 a 35 año s 4 .6 36 a 40 año s 4.6 41 a 45 año s 2 .0 46 a 50 año s 1.5 Más d e 50 años ANTIGÜEDAD DE LA FLOTA VEHICULAR DEL AUTOTRANSPORTE DE CARGA POR RANGO DE EDAD - 2021 (PARTICIPACIÓN PORCENTUAL EN EL TOTAL) 37 ANTIGÜEDAD DE LA FLOTA VEHICULAR DEL AUTOTRANSPORTE DE CARGA Y RANGO DE EDAD - 2021 Antigüedad Unidades de Arrastre Total S-1 S-2 S-3 S-4 S-5 S-6 R-2 R-3 R-4 R-5 R-6 0 a 5 años 434 71,371 15,712 77 11 18 159 60 1 0 3 87,846 6 a 10 años 575 60,619 17,254 259 22 38 211 54 17 0 13 79,062 11 a 15 años 483 51,024 14,062 92 15 15 275 95 13 4 17 66,095 16 a 20 años 506 75,842 11,702 63 12 11 403 94 22 3 5 88,663 21 a 25 años 976 83,055 13,375 67 8 18 661 149 32 5 11 98,357 26 a 30 años 711 48,716 8,322 37 12 8 450 56 14 3 4 58,333 31 a 35 años 498 28,117 11,239 36 1 13 223 85 6 0 1 40,219 36 a 40 años 249 21,977 4,893 25 1 10 181 37 5 0 1 27,379 41 a 45 años 130 18,102 9,017 53 8 11 162 64 22 2 1 27,572 46 a 50 años 87 9,293 2319 16 0 2 95 22 4 0 0 11,838 Más de 50 años 139 7,515 1313 14 1 1 87 9 0 0 0 9,079 Parque Vehicular 4,788 475,631 109,208 739 91 145 2,907 725 136 17 56 594,443 Antigüedad 22.4 19.8 20.5 17.7 17.6 19.6 24.7 23.4 24.9 22.8 15.9 20.0 Fuente: Estadística Básica del Autotransporte Federal 2021, DGAF, SICT. Antigüedad calculada con unidades de arrastre 1960-2022. FLOTA VEHICULAR
2010 13,210 3,682 16,892 107,175 6,789 113,964 130,856
2011 15,370 4,517 19,887 116,758 7,649 124,407 144,294
2012 15,298 20,014 124,414 8,348 132,762 152,776
2013 14,416 4,521 18,937 120,484 8,381 128,865 147,802
2014 15,084 4,819 19,903 123,050 8,930 131,980 151,883
2015 16,109 5,228 21,337 126,078 9,299 135,377 156,714
2016 17,082 5,622 22,704 131,391 9,916 141,307 164,011
2017 20,319 5,401 25,720 135,544 8,048 143,592 169,312
2018 21,582 5,792 27,374 142,238 8,584 150,822 178,196
2019 22,849 5,272 28,121 161,587 7,511 169,098 197,219
2020 23,471 5,532 29,003 165,160 7,813 172,973 201,976
2021 24,655 5,936 30,591 171,436 8,365 179,801 210,392
Fuente: Estadística Básica del Autotransporte Federal 2020, DGAF, SICT.
Nota: La diferencia del total de permisionarios respecto al cuadro de la Estructura Empresarial, se debe a que estos pueden tener oficinas en más de un Estado, es por ello que es mayor en su número.
AGENDA ECONÓMICA DEL AUTOTRANSPORTE DE CARGA EMPRESAS DEL AUTOTRANSPORTE DE CARGA POR TIPO DE SERVICIO 2010 2011 2012 2013 PERSONA MORALPERSONA FÍSICA 2014 2015 2016 2017 2018 2019 2020 2021 113,964 124,407 132,762 131,980 135,377 141,307 143,592 150,822 169,098 172,973 179,801 128,865 16,892 19,887 20,014 18,937 19,903 21,337 22,704 25,720 28,121 19,293 29,003 30,351 38 EMPRESAS DEL AUTOTRANSPORTE DE CARGA POR TIPO DE SERVICIO Empresas Año Persona Moral Subtotal Persona Física Subtotal Total Carga General Carga Especializada Carga General Carga Especializada
4,716
FLOTA VEHICULAR
AGENDA ECONÓMICA DEL AUTOTRANSPORTE DE CARGA VENTA AL PÚBLICO DE VEHÍCULOS DEL AUTOTRANSPORTE - MERCADO NACIONAL (UNIDADES) 2010 22,597 2011 25,646 2012 31,490 2013 31,145 2014 26,527 2015 29,241 2016 34,470 2017 32,808 2018 32,099 2019 33,890 2020 2021 2020* 2021* 23,275 26,678 16,195 13,226 39 VENTA AL PÚBLICO DE VEHÍCULOS DEL AUTOTRANSPORTE DE CARGA, MERCADO NACIONAL (Unidades) Año/Segmento 2010 2011 2012 2013 2014 2015 2016 2017 2018 2019 2020 2021 2021* 2022* Camiones 15,613 14,825 16,703 16,098 13,737 14,696 16,627 15,828 15,221 15,414 11,961 14,213 6,455 8,771 Tractocamiones Quinta Rueda 6,984 10,821 14,787 15,047 12,790 14,545 17,843 16,980 16,878 18,476 11,314 12,465 6,771 7,424 Total Carga 22,597 25,646 31,490 31,145 26,527 29,241 34,470 32,808 32,099 33,890 23,275 26,678 13,226 16,195 Fuente: ANPACT. *2020-*2021 acumulados enero-junio. FLOTA VEHICULAR
Robo
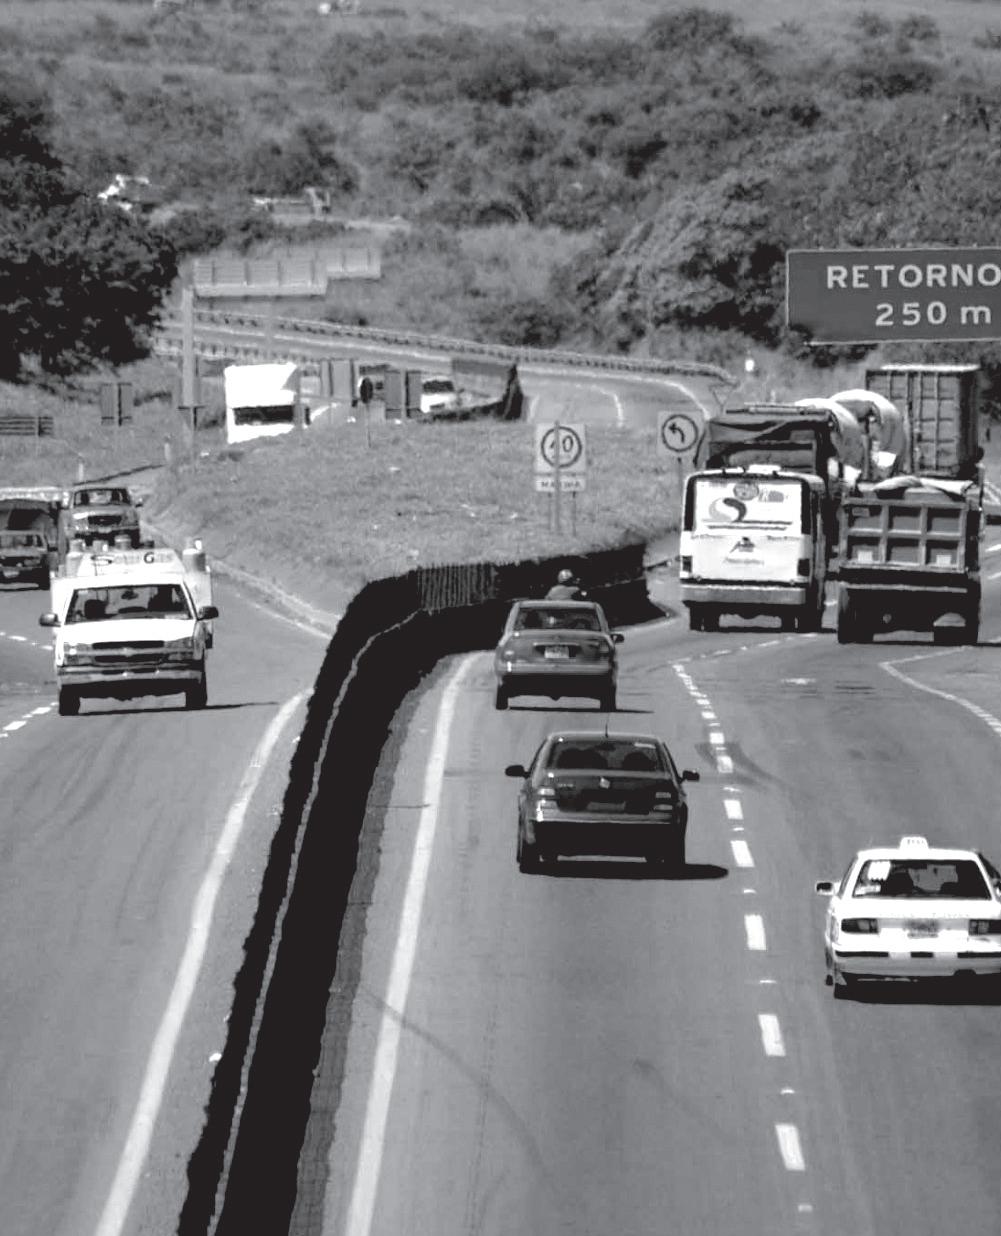
INCIDENCIA DELICTIVA DEL - A
Var. -18.31 -8.03 -4.26 -17.97 -8.89 4.91 1,341 -5.56 -20.25 -2.97 -15.66
AGENDA ECONÓMICA DEL AUTOTRANSPORTE DE CARGA INCIDENCIA DELICTIVA DEL FUERO COMÚN, ROBO A TRANSPORTISTA (NÚMERO DE ROBOS) 2010 4,959 2011 5,114 2012 5,078 2013 5,155 2014 4,708 2015 5,735 2016 7,495 2017 10,230 2018 12,206 2019 11,662 2020 2021 2021* 2022* 9,527 8,762 4,188 4,261 40
FUERO COMÚN
ROBO
TRANSPORTISTA (Número de robos) 2010 2011 2012 2013 2014 2015 2016 2017 2018 2019 2020 2021 2021* 2022*
Nacional 4,959 5,114 5,078 5,155 4,708 5,735 7,495 10,230 12,206 11,662 9,527 8,762 4,188 4,261
% 3.13 -0.70 1.52 -8.67 21.81 30.69 36.49 19.32 -4.46
1.74 Con Violencia 3,823 3,822 3,669 4,244 3,894 4,888 6,214 8,894 10,371 9,929 8,145 7,421 3,543 3,717 Var. % -0.03 -4.00 15.67 -8.25 25.53 27.13 43.13 16.61
Sin Violencia 1,136 1,292 1,409 911 814 847 1,281 1,336 1,835 1,733 1,382
645 544 Var. % 13.73 9.06 -35.34 -10.65 4.05 51.24 4.29 37.35
Fuente: Secretariado Ejecutivo del Sistema Nacional de Seguridad Pública. *2021-*2022 acumulados enero-junio. FLOTA VEHICULAR
MOVIMIENTO DE CARGA POR MODO DE TRANSPORTE (Millones de toneladas transportadas)
Años Autotransporte Ferroviario Marítimo Aéreo Total Carga Terrestre % Autotransporte % Ferroviario
2010 470 105 273 0.6 848 575 81.8 18.2
% 55.4 12.3 32.2 0.1 100
2011 486 108 283 0.6 877 594 81.7 18.3
% 55.3 12.4 32.2 0.1 100
2012 498 112 283 0.6 894 610 81.7 18.3
% 55.7 12.5 31.7 0.1 100
2013 502 112 289 0.6 903 614 81.8 18.2
% 55.6 12.4 32 0.1 100 511 117 287 0.6 916 628 81.4 18.6
% 55.8 12.8 31.3 0.1 100
2015 523 120 293 0.7 936 643 81.4 18.6
% 55.9 12.8 31.3 0.1 100
2016 536 122 297 0.7 955 658 81.5 18.5
% 56.1 12.8 31.1 0.1 100
2017 547 127 308 0.7 982 674 81.2 18.8
% 55.7 12.9 31.3 0.1 100
2018 556.4 128.0 317.0 0.8 1002 684 81.3 18.7
% 55.5 12.8 31.6 0.1 100 552.0 125.0 303.0 0.8 981 677 81.5 18.5
% 56.3 12.7 30.9 0.1 100 512.7 120.4 266.7 0.6 900 633.1 81.0 19.0 % 56.9 13.4 29.6 0.1 100 534.5 129.9 286.1 1.0 952 664.4 80.4 19.6
% 56.2 13.7 30.1 0.1 100
MOVIMIENTO DE CARGA POR MODO DE TRANSPORTE 2021
AGENDA ECONÓMICA DEL AUTOTRANSPORTE DE CARGA
41
2014
2019
2020
2021
Fuente: Estadística Básica del Autotransporte Federal 2021, DGAF, SICT. TRANSPORTE DOMÉSTICO DE CARGA 56.2% AUTOTRANSPORTE 30.1% MARÍTIMO 13.7% FERROVIARIO 0.1% ÁEREO
AGENDA ECONÓMICA DEL AUTOTRANSPORTE DE CARGA TOTAL DEL MOVIMIENTO DE MERCANCÍAS (MILES DE TONELADAS TRANSPORTADAS) 2010 470,000 2011 485,502 2012 498,147 2013 502,150 2014 511,340 2015 522,990 2016 535,548 2017 546,588 2018 556,411 2019 552,318 2020 2021 512,726 534,469 42 MOVIMIENTO DE MERCANCÍAS POR TIPO DE VEHÍCULO DE CARGA (Miles de toneladas transportadas) Año 2010 2011 2012 2013 2014 2015 2016 2017 2018 2019 2020 2021 Total 470,000 485,502 498,147 502,150 511,340 522,990 535,548 546,588 556,411 552,318 512,726 534,469 Clase de vehículo Camión de dos ejes C2 32,445 33,515 34,388 34,664 35,299 36,103 36,969 37,732 38,410 38,275 35,394 36,895 Camión de tres ejes C3 62,949 65,025 66,718 67,255 68,485 70,046 71,728 73,206 74,515 73,826 68,672 71,583 En combinación con T2 3,566 3,685 3,781 3,811 3,881 3,970 4,065 4,149 4,225 4,185 3,892 4,057 En combinación con T3 371,040 383,277 393,260 396,420 403,675 412,871 422,786 431,501 439,261 436,032 404,768 421,934 Fuente: Estadística Básica del Autotransporte Federal 2021, DGAF, SICT. TRANSPORTE DOMÉSTICO DE CARGA
Año Unidades Unidades arrastre Grúas % Toneladas transportadas % Toneladas-km transportadas
2010 342,064 3.10% 293,053 5.40% 351 635,468 4.10% 470,000 4.20% 213,507,000
2011 351,705 2.80% 306,700 4.70% 355 658,760 3.70% 485,502 3.30% 226,900,000
2012 380,342 8.10% 334,858 9.20% 483 715,683 8.60% 498,147 2.60% 233,464,000
2013 381,250 0.20% 347,112 3.70% 684 729,046 1.90% 502,150 0.80% 235,427,000
2014 395,552 3.80% 367,051 5.70% 877 763,480 4.70% 511,340 1.80% 239,710,000
2015 414,790 4.90% 390,563 6.40% 1,052 806,405 5.60% 522,990 2.30% 245,136,000
2016 443,058 6.80% 420,553 7.70% 1224 864,835 7.20% 535,548 2.40% 251,122,000
2017 463,016 4.50% 453,916 7.90% 449 917,381 6.10% 546,588 2.10% 256,136,000
2018 496,057 7.14% 486,335 7.14% 464 982,856 7.14% 556,411 1.80% 260,739,145
2019 561,061 13.10% 537,813 10.58% 497 1,099,371 11.85% 552,318 -0.74% 258,684,000
2020 580,035 3.38% 563,400 4.76% 505 1,143,940 4.05% 512,726 -7.17% 240,394,000
2021 606,090 4.49% 594,443 5.51% 520 1,201,053 4.99% 534,469 4.24% 250,350,000
AGENDA ECONÓMICA DEL AUTOTRANSPORTE DE CARGA MOVIMIENTO DE MERCANCÍAS POR EL AUTOTRANSPORTE DE CARGA (TONELADAS-KM. TRANSPORTADAS) 2010 213,507,000 2011 226,900,000 2012 233,464,000 2013 235,427,000 2014 239,710,000 2015 245,136,000 2016 251,122,000 2017 256,136,000 2018 260,739,145 2019 258,684,000 2020 2021 240,394,000 250,350,000 43 MOVIMIENTO DE MERCANCÍAS POR EL AUTOTRANSPORTE DE CARGA (Miles de toneladas transportadas)
motrices %
%
industriales Total
Fuente: Estadística Básica del Autotransporte Federal 2021, DGAF. TRANSPORTE DOMÉSTICO DE CARGA

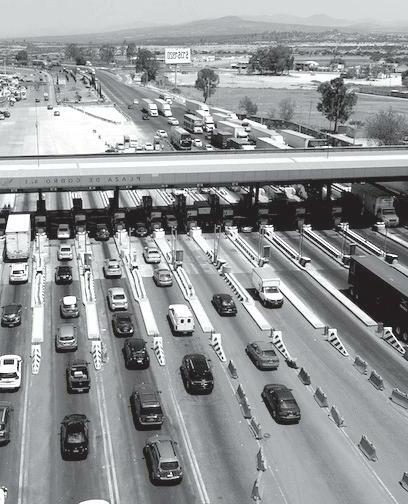
AGENDA ECONÓMICA DEL AUTOTRANSPORTE DE CARGA PRINCIPALES CORREDORES DEL SISTEMA CARRETERO NACIONAL MA Z ATLÁN-MATAMOROS MANZ ANILLO TAMPICO CON R AMALES A LÁ Z ARO C ÁRDENAS ALTIPLANO MÉXICO TUXPAN AC APULCO VER ACRUZ CIRCUITO TRANSÍSTMICO TRANSPENINSULAR DE BA JA CALIFORNIA MÉXICO-NOGALES CON R AMAL A TIJUANA QUERÉTARO CD. JUÁREZ MÉXICO-NUEVO LAREDO CON RAMAL A PIEDRAS NEGRAS VER ACRUZ-MONTERRE Y CON RAMAL A MATAMOROS PUEBLA OAX ACA CD. HIDALGO MÉXICO-PUEBLA-PROGRESO PENINSULAR DE YUCATÁN COSTER A PACÍFICO 44 INFRAESTRUCTURA CARRETERA
AGENDA ECONÓMICA DEL AUTOTRANSPORTE DE CARGA 45 RED NACIONAL DE CARRETERAS (Kilómetros) Año 2010 2011 2012 2013 2014 2015 2016 2017 2018 2019 2020 2021 Var % 2021/2020 Total 371,936 374,262 377,660 378,924 389,345 390,301 393,473 398,149 407,959 397,312 397,938 401,366 0.9 Por tipo de camino Federales 48,972 49,102 49,652 49,986 50,241 50,403 50,499 51,020 51,197 51,418 51,405 51,428 0.0 Cuota a 8,397 8,459 8,900 9,174 9,457 9,664 9,818 10,430 10,614 10,794 10,843 10,912 0.6 Libre 40,575 40,643 40,752 40,812 40,784 40,739 40,681 40,590 40,583 40,623 40,562 40,516 -0.1 Estatal 79,264 80,774 83,982 85,076 93,521 94,983 95,855 133,228 133,698 129,350 130,238 130,494 0.2 Rural 169,354 169,072 169,429 169,311 175,775 175,521 177,657 144,534 154,409 158,196 157,568 161,178 2.3 Brechas mejoradas 74,346 75,314 74,597 74,550 69,808 69,394 69,462 69,367 68,654 58,348 58,727 58,266 -0.8 Por estado superficial Pavimentado 138,404 141,361 146,221 148,329 155,239 156,797 164,459 174,912 177,192 175,124 176,250 176,599 0.2 Revestimiento 150,404 148,782 145,576 144,800 152,252 152,879 148,849 144,070 130,989 131,269 128,713 130,643 1.5 Terracerías 8,782 8,805 11,266 11,245 12,046 11,231 10,703 9,800 31,123 32,571 34,248 35,859 4.7 Brechas mejoradas 74,346 75,314 74,597 74,550 68,808 69,394 69,462 69,367 68,654 58,348 58,727 58,266 -0.8 Por carriles Dos carriles 125,764 128,320 131,722 133,286 139,956 141,545 148,822 158,459 161,195 159,082 160,637 161,151 0.3 Cuatro o más carriles 12,640 13,041 14,499 15,043 15,283 15,252 15,636 16,453 15,996 16,042 15,613 15,447 -1.1 Fuente: Estadística Mensual del Sector Comunicaciones y Transportes, 2022, SICT. a Incluye estatales de cuota. CARRETERAS FEDERALES (KILÓMETROS) INFRAESTRUCTURA CARRETERA
AGENDA ECONÓMICA DEL AUTOTRANSPORTE DE CARGA 3,500 3,600 3,700 3,800 3,900 4,000 4,100 4,200 4,300 2,000 4,000 6,000 8,000 10,000 12,000 14,000 16,000 18,000 2010 2011 2012 2013 2014 2015 2016 2017 2018 2019 2020 2021 20212010 2011 2012 2013 2014 2015 2016 2017 2018 2019 20203,500 3,600 3,700 3,800 3,900 4,000 4,100 4,200 4,300 2,000 4,000 6,000 8,000 10,000 12,000 14,000 16,000 18,000 2010 2011 2012 2013 2014 2015 2016 2017 2018 2019 2020 2021 20212010 2011 2012 2013 2014 2015 2016 2017 2018 2019 2020 LONGITUD DE LA RED DE CUOTA CAPUFE (PUENTES- METROS-) LONGITUD DE LA RED DE CUOTA CAPUFE (CAMINOS - KILÓMETROS-) 46 LONGITUD DE LA RED DE CUOTA A CARGO DE CAPUFE Año 2010 2011 2012 2013 2014 2015 2016 2017 2018 2019 2020 2021 Caminos (kilómetros) 4,128 4,069 3,795 3,864 3,870 4,111 4,198 4,228 4,106 4,106 3,761 3,761 Propios 121 77 83 77 77 190 190 189 190 190 190 190 Contrato 250 308 162 162 141 141 141 Fondo Nacional de Infraestructura (FNI) 3,757 3,684 3,550 3,625 3,652 3,780 3,867 4,039 3,916 3,916 3,571 3,571 Puentes ( metros) 16,918 16,461 16,461 16,461 16,407 15,980 15,980 15,980 15,980 15,580 12,195 12,195 Propios 8,606 8,606 8,606 8,606 8,606 8,334 8,334 8,334 8,334 8,334 8,334 8,334 Contrato 1,012 555 555 555 555 400 400 400 400 Fondo Nacional de Infraestructura (FNI) 7,300 7,300 7,300 7,300 7,246 7,246 7,246 7,246 7,246 7,246 3,861 3,861 Fuente: Estadística Mensual del Sector Comunicaciones y Transportes, 2022, SICT. INFRAESTRUCTURA CARRETERA
INFRAESTRUCTURA CARRETERA
AGENDA ECONÓMICA DEL AUTOTRANSPORTE DE CARGA VEHÍCULOS REGISTRADOS EN LAS CASETAS DE CAPUFE (MILES DE UNIDADES) 2010 62,965 2011 58,679 2012 60,216 2013 2014 60,407 2015 61,722 2016 55,504 2017 54,796 2018 54,719 2019 53,490 2020 2021 39,228 50,040 PUENTESCAMINOS 58,669 374,012 381,246 376,174 382,300 406,228 431,338 433,340 393,931 370,489 311,428 370,854367,971 47 VEHÍCULOS REGISTRADOS EN LAS CASETAS DE CAPUFE (Miles de unidades) Año 2010 2011 2012 2013 2014 2015 2016 2017 2018 2019 2020 2021 Total 436,977 439,925 436,390 426,640 442,707 467,950 486,842 488,136 448,650 423,979 350,655 420,894 Caminos 374,012 381,246 376,174 367,971 382,300 406,228 431,338 433,340 393,931 370,489 311,428 370,854 - Propios 4,533 3,844 4,178 4,338 3,957 4,550 4,955 5,158 5,400 5,430 3,986 5 532.9 - Contratados 49,390 49,099 50,856 48,678 52,676 54,670 56,928 - Fondo Nacional de Infraestructura (FNI) 320,089 328,303 321,140 314,955 325,667 347,008 369,455 428,182 388,532 365,059 307,442 365,321 Puentes 62,965 58,679 60,216 58,669 60,407 61,722 55,504 54,796 54,719 53,490 39,228 50,040 - Propios 53,087 51,361 52,342 50,655 52,437 53,802 50,345 49,629 49,375 48,683 36,321 47,930 - Contratados 4,754 2,432 2,795 2,882 2,888 2,889 64 66 62 - Fondo Nacional de Infraestructura (FNI) 5,124 4,886 5,079 5,132 5,082 5,031 5,095 5,101 5,281 4,807 2,907 2,110 Fuente: Estadística Mensual del Sector Comunicaciones y Transportes, 2022, SICT.
AGENDA ECONÓMICA DEL AUTOTRANSPORTE DE CARGA ANUAL E INGRESOS EN LAS AUTOPISTAS Y PUENTES DE CUOTA POR CLASE DE VEHÍCULO (VEHÍCULOS DIARIOS PROMEDIO ANUAL) AUTOBUSES AUTOMÓVILES CAMIONES 2013201220112010 2014 2015 2016 2017 2018 2019 2020 2021 789,929 56.909 221,327 779,885 56,754 232,315 815,739 59,562 253,296 812,926 58,559 257,007 836,062 57,047 267,555 894,732 60,645 290,551 962,672 63,925 314,110 1,002,113 66,158 341,491 1,034,353 66,032 365,340 1,019,724 64,684 386,465 820,502 1,036,973 37,919 41,328 359,270 412,371 48 TRÁNSITO DIARIO PROMEDIO ANUAL E INGRESOS EN LAS AUTOPISTAS Y PUENTES DE CUOTA POR CLASE DE VEHÍCULO (Vehículos diarios promedio anual) Vehículo 2010 2011 2012 2013 2014 2015 2016 2017 2018 2019 2020 2021 Aforo Vehicular 1,068,165 1,068,954 1,128,597 1,128,492 1,161,665 1,245,929 1,340,707 1,409,762 1,465,725 1,452,874 1,217,691 1,490,673 Automóviles 789,929 779,885 815,739 812,926 836,062 894,732 962,672 1,002,113 1,034,353 1,019,724 820,502 1,036,973 Autobuses 56,909 56,754 59,562 58,559 57,047 60,645 63,925 66,158 66,032 64,684 37,919 41,328 Camiones 221,327 232,315 253,296 257,007 267,555 290,551 314,110 341,491 365,340 368,465 359,270 412,371 Ingresos (millones de pesos) 35,788 37,644 41,419 44,508 47,405 52,241 56,804 64,034 67,188 79,078 72,466 101,265 Automóviles 18,460 18,668 20,093 21,224 22,004 24,524 26,259 29,063 30,494 34,515 28,519 42,732 Autobuses 2,799 2,924 3,174 3,278 3,296 3,545 3,777 4,118 4,321 4,709 2,831 3,691 Camiones 14,530 16,052 18,152 20,006 22,105 24,172 26,768 30,854 32,373 39,854 41,116 54,842 Fuente: Estadística Mensual del Sector Comunicaciones y Transportes, 2022, SICT. INFRAESTRUCTURA CARRETERA
INFRAESTRUCTURA CARRETERA
Año
2010 119,465 4,295,350 142,985
2011 109,469 4,314,190 154,330
2012 104,784 4,233,551 160,704
2013 22,036 104,427 3,815,507 136,122
2014 18,014 17,504 3,784 89,101 3,456,467 132,312
2015 17,264 15,738 3,547 76,336 2,732,214 138,143
2016 12,567 11,175 3,376 54,338 1,992,427 140,182
2017 11,883 8,910 2,921 56,166 1,829,896 145,719
2018 12,237 8,761 2,994 61,005 2,184,958 151,475
2019 12,056 8,501 3,044 61,018 2,153,685 157,393
2020 11,449 5,040 2,722 51,808 1,647,715 132,844
2021 15,020 5,975 3,298 80,703 2,213,410 152,664
ACCIDENTES REGISTRADOS EN LAS CARRETERAS FEDERALES DE SINIESTROS)
LESIONADOS EN LAS CARRETERAS FEDERALES
AGENDA ECONÓMICA DEL AUTOTRANSPORTE DE CARGA
(MILES
20112010 2012 2013 2014 2015 2016 2017 2018 2019 2020 2021 27,847 24,905 24,216 22,036 18,014 17,264 12,567 11,883 12,237 12,056 11,449 15,020 28,275 26,056 24,736 20,979 17,504 15,738 11,175 8,910 8,761 8,501 5,040 5,975
ACCIDENTES 49 ACCIDENTES REGISTRADOS
(Miles de siniestros)
Accidentes Lesionados Muertos Daños materiales (miles de dólares) Costo total de los accidentes (miles de dólares) Vehículos-kilómetro anual (millones)
27,847 28,275 4,966
24,905 26,056 4,398
24,216 24,736 4,548
20,979 3,899
Fuente: Anuario Estadístico de Accidentes en Carreteras Federales 2021, SICT, IMT.
Inversión 163,679.0 159,911.8 186,409.3 162,528.5 171,285.1 195,698.7 209,985.6 187,138.5 188,465.9 76,962.4 95,341.5 84,683.5 94,041.2
Pública 73,452.1 78,175.7 76,817.8 76,000.8 87,819.4 83,700.8 95,750.2 102,199.0 101,554.3 53,596.6 44,930.6 38,353.5 65,553.6
Privada 90,226.9 81,736.1 109,591.5 86,527.7 83,466.0 111,997.9 114,235.4 84,939.5 86,911.6 23,365.8 50,410.9 46,330.0 28,487.6
Transportes 85,849.8 92,172.8 92,161.0 97,147.4 118,739.7 117,516.4 123,280.5 123,790.6 128,982.7 76,962.4 94,894.5 84,603.5 ND
Pública 70,679.2 73,876.4 72,113.2 71,418.3 83,627.4 78,516.5 94,115.3 100,332.8 99,846.8 53,596.6 44,483.6 38,273.5 ND
Privada 15,170.6 18,296.4 20,047.8 25,729.1 35,112.3 38,999.9 29,165.2 23,457.8 29,135.9 23,365.8 50,410.9 46,330.0 447.0 80.0 Pública 1,634.9 1,866.2 1,707.5 447.0 80.0 Privada 61,481.7 57,775.7
AGENDA ECONÓMICA DEL AUTOTRANSPORTE DE CARGA 2013201220112010 2014 2015 2016 2017 2018 2019 2020 2021 2022 250,000.0 200,000.0 150,000.0 100,000.0 50,000.0 INVERSIÓN PÚBLICA Y PRIVADA EN EL SECTOR DE COMUNICACIONES Y TRANSPORTES (MILLONES DE PESOS) PÚBLICA INVERSIÓN TOTAL PRIVADA 50 INVERSIÓN PÚBLICA Y PRIVADA EN EL SECTOR DE COMUNICACIONES Y TRANSPORTES (Millones de pesos) 2010 2011 2012 2013 2014 2015 2016 2017 2018 2019 2020 2021 2022
total
ND Comunicaciones 77,829.2 67,739.0 94,248.3 65,381.1 52,545.7 78,182.3 86,705.1 63,347.9 59,483.2 ND
ND
2,772.9 4,299.3 4,704.6 4,582.5 4,192.0 5,184.3
ND
ND
75,056.3 63,439.7 89,543.7 60,798.6 48,353.7 72,998.0 85,070.2
ND ND ND ND Fuente. SICT. Programa de trabajo anual de 2010 a 2022. ND: No Disponible INVERSIÓN EN EL SECTOR TRANSPORTE
PÚBLICA 266,276.4 476,542.6 469,651.2 89,696.2 105,058.0 89,566.1 80,756.2 50,161.8 54,412.8 53,830.7 57,738.1 59,659.1 55,442.6 213,520.7 428,323.6 378,218.6 78,171.6 79,896.3 68,511.8 67,194.6 42,829.9 41,614.4 41,215.9 34,462.1 32,341.4 36,783.6 52,755.7 48,219.0 91,432.6 11,524.6 25,161.7 21,054.3 13,561.6 7,331.9 12,798.4 12,614.8 23,276.0 27,317.7 18,659.0
AGENDA ECONÓMICA DEL AUTOTRANSPORTE DE CARGA INVERSIÓN PÚBLICA Y PRIVADA EN INFRAESTRUCTURA CARRETERA (MILLONES DE PESOS) 2013 2014 2015 2016 2017 2018 2019 2020 2021 2022 90,000.0 80,000.0 70,000.0 60,000.0 50,000.0 40,000.0 30,000.0 20,000.0 10,000.0
PRIVADA 51 INVERSIÓN PÚBLICA Y PRIVADA EN INFRAESTRUCTURA CARRETERA (Millones de Pesos) 2001-2006 2007-2012 2013-2018 2013 2014 2015 2016 2017 2018 2019 2020 2021 2022 Inversión Total
Pública
Privada
Cifras a precios constantes, base junio 2019=100 Fuente. SICT. Serie sexenal de 2001 a 2018 y programa de trabajo anual de 2013 a 2022. 36,783.6 18,659.0 INVERSIÓN EN EL SECTOR TRANSPORTE
INVERSIÓN EN EL SECTOR TRANSPORTE
Transportes por agua -17.8 -9.5 -24.4 -21.6 -28.5 92.2 72.6 1.3 9.9 10.9 5.2 0.6
Autotransporte de carga 0.0 0.0 0.1 0.1 0.2 0.1 0.2 0.1 0.0 0.1 0.0 0.0
Transporte terrestre de pasajeros 0.0 208.5 71.7 -30.3 -27.4 9.5 11.3 0.0 0.0 49.4 0.0 0.0
Transporte por ductos 445.8 -32.7 872.2 913.6 1,211.0 1,857.3 1,402.9 2,312.4 559.7 119.4 -2.0 1781.6
Transporte turístico 0.0 0.0 0.0 0.2 0.0 0.0 0.0 0.0 0.0 0.0 2.4 0.0
Servicios relacionados con el transporte 36.9 304.9 333.7 297.4 141.9 888.9 92.7 212.3 199.9 243.4 2,427.5 613.6
Servicios de mensajería y paquetría -4.4 31.9 156.5 46.7 70 149 16.4 6.1 20.0 27.0 12.8 14.0
Servicios de almacenamiento 28.1 35.9 21.3 8.4 12.4 0.3 29 -2.1 122.6 61.5 25.8 79.2
Fuente: Secretaría Economía,
AGENDA ECONÓMICA DEL AUTOTRANSPORTE DE CARGA INVERSIÓN EXTRANJERA DIRECTA EN TRANSPORTES, CORREOS Y ALMACENAMIENTO (MILLONES DE DÓLARES) 2010 681.3 2011 391.1 2012 1,403.8 2013 1,485.7 2014 1,673.3 2015 3,107.7 2016 1,780.2 2017 3,212.8 2018 1,308.1 2019 837.4 2020 2021 2,853.3 2,764.3 52 INVERSIÓN EXTRANJERA DIRECTA EN MÉXICO REALIZADA POR SUBSECTOR ECONÓMICO Millones de dólares Subsector 2010 2011 2012 2013 2014 2015 2016 2017 2018 2019 2020 2021 Transporte, correos y almacenamiento 681.3 393.1 1,403.8 1,485.7 1,673.3 3,107.7 1,780.2 3,212.8 1,308.1 837.4 2,853.3 2,764.3 Transporte aéreo 2.8 -0.8 75.4 12.6 135.2 30.6 114.5 688.6 0.0 0.0 41.5 5.6 Transportes por ferrocarril 189.9 -145.1 -102.7 258.6 158.5 79.8 40.6 -5.9 395.6 325.7 340.1 269.7
de
Comisión Nacional de Inversiones Extranjeras.