
7 minute read
Terraforming Mars Ivan Liu
Inheritance of Atopic Disorder is End organ Specific The specific end organ manifestation in the airway, the nose, or the skin for asthma allergic rhinitis and atopic dermatitis are in part familial. On top of the inheritance of an exaggerated IgE response as the basis for all these conditions, individual genes may also lead to specific clinical manifestations of the allergic phenotype.
Specific Regions of the Human Genome Harbor Susceptibility Genes for Asthma and Allergy Six loci have been implicated by independent investigations, and linkage has been replicated in chromosomes 5, 6, 11, 12, and 13, and multiple candidate genes have been suggested as the reason for the linkage. Additionally, there are no DNA sequence variations that alter protein expression or function that have been incriminated as “asthma mutations”.
WHAT IS PARTLY KNOWN?
In asthma genetic research, several replicated linked loci have been identified while fine mapping, gene identification, and polymorphism localization are in progress in laboratories. A few specific polymorphisms have been associated with asthma and allergy phenotypes.
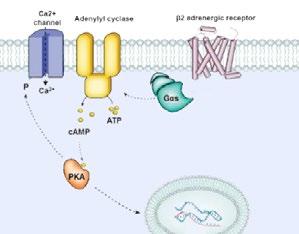
β2-Adrenergic Receptor Gene These genes are on chromosome 5q within the region that had been linked to asthma and allergy phenotypes. Several variants in the gene have been identified that alter receptor function, which influences the down regulation in response to an agonist. These polymorphisms have been associated with several phenotypes including measures of asthma severity and bronchial responsiveness.
IL-4 Gene
The IL-4 receptor gene is another candidate gene that is in a linked region of chromosome 5q region and is important in contributing to the elevated blood level of IgE that is characteristic of asthma and allergy. The polymorphism has been identified in a region of the gene that binds transcription factors, influencing gene expression. Evidence shows that it may be associated with increased gene expression.
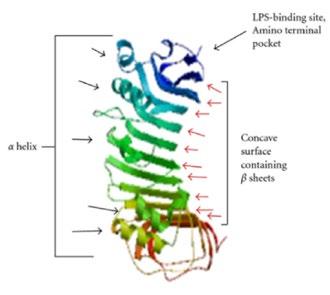
CD14 Gene The CD14 gene in the 5q region is the major receptor that mediates the cellular response to endotoxin. A prevalent polymorphism has been identified in the CD14 gene and studies have shown that this gene is associated with an increased level of IgE. The binding of the CD14 receptor by endotoxin during infections in infancy may stimulate the expression of Th1 cytokines, steering the immune system away from the Th2 predominance that exists in utero and during the immediate neonatal period.
WHAT IS REMAINED TO BE ANSWERED?
As research continues, there are still several epidemiological issues that remain to be answered. There are four genome screens published for asthma and allergy phenotypes, and which linkages of the presence of susceptibility genes are still unknown. Replication of linkage study is a difficult task in complex diseases like asthma. This leads to an extended question of which genes are responsible for the linkages. If a linked region contains no obvious candidates, it is difficult to identify the causal gene. Another important question is whether the enormous expense committed by major pharmaceutical companies to find asthma genes will lead to diagnostic or therapeutic innovation.
Modelling Infectious Disease
Isabelle Oliver
Mathematical models are used as tools to predict the spread of infectious diseases in a population. These models can inform research for the eradication and containment of the disease, through various restrictive measures and medical interventions.
THE SIR MODEL
The simplest way to model diseases is by using the SIR model. There are three groups within this model- susceptibles, infectives, and removed, all of which make up the total population:
To explain in further detail. Susceptibles are individuals who could potentially catch the disease. Infectives are people who currently have the disease and can infect others. The removed individuals are those who have already caught the disease and have either recovered or died as a result.
In order to simplify the complexities of how diseases spread, some assumptions are made:
1. The epidemic is sufficiently short- the total population remains constant. 2. The rate of increase in infectives is proportional to the increase in contacts between susceptibles and infectives and occurs at a constant rate.
3. Infectives recover or die at a constant rate.
We can calculate the rate of change of the number of susceptibles in the population over time:
We can expect that as people become infective, the number of susceptibles is going to decrease proportionally, according to assumption 2. Therefore, individuals are moving from the susceptible group into the infective group, leading to a decrease in the number of susceptibles, We can also calculate the rate of change of the number of infectives over time:
calculates the rate at which susceptibles move into the infective group, so the rate at which infectives are increasing. However, we must also take into account that infectives will recover/die so we subtract , which calculates the number of individuals that recover/die over time, by multiplying the rate at which this occurs by the number of infectives. The rate at which infectives recover or die ( ) is constant, according to assumption 3.
To calculate the rate of change of the number of removed individuals over time:
As I previously explained, calculates the number of individuals that recover or die over time, which is the rate at which individuals move into the removed group.
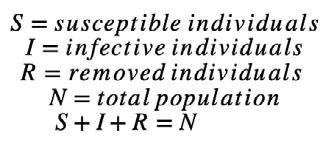
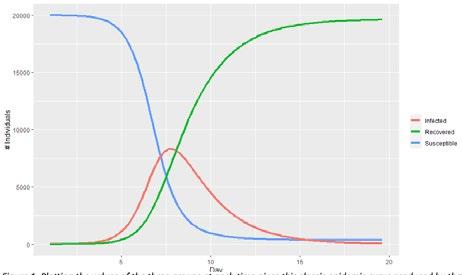
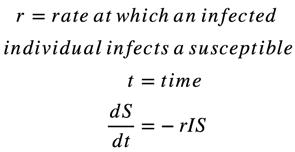
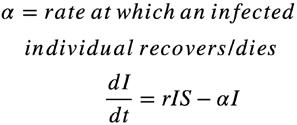
Figure 1. Plotting the values of the three groups at each time gives this classic epidemic curve produced by the SIR model.
WILL THE DISEASE SPREAD? BASIC REPRODUCTIVE RATIO
To phrase the question differently, will grow?
is always negative, as , and are all
positive, so their product is a positive number, which becomes negative when multiplied by -1. Therefore, because the rate of increase of the number of
susceptibles is negative, there must be a decrease in over time, so is always smaller than (the initial value):
Substituting into
Factorise:
If the constant is positive then there will be spread of the disease, because the rate of increase of infectives over time will be positive, so there will be an increase in the number of infectives
- there will be spread of the disease.
The disease will spread if: If we take , and multiply both sides
by , then divide by , we get:
is the basic reproductive ratio. This is the
number of secondary infections in a population
that will be caused by one initial primary infection.
If only one person has the disease, tells us
the mean number of infections that person will
cause. This helps scientists to see and describe the
intensity of an infectious disease outbreak.
An epidemic is defined when:
Examples of some basic reproductive ratios:
1. The influenza virus - ranges from 0.9-2.1.
2. Measles - from 12-18 (extremely infectious).
3. Ebola - about 1.51-2.53.
4. SARS-CoV-2 - between 1.5 and 3.5.
There is a range for each reproductive ratio as they
can vary due to factors such as population density
and life expectancy.
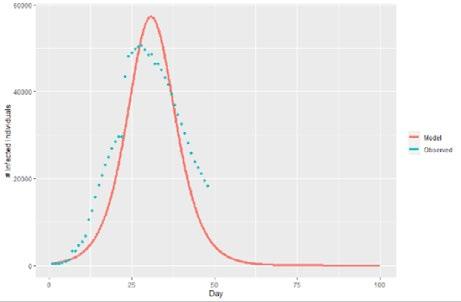
Figure 2. Graph showing the accuracy of a mathematical model of the spread of COVID-19 in comparison with the observed data


Figure 3. Graph showing a model and the effects of different restrictive measures on the spread of COVID-19
COVID-19
As COVID-19 is a novel disease, mathematical models are difficult to produce due to little data and understanding about the mechanisms of the virus. In addition, the intricacies of COVID-19 result in a more complicated version of the SIR model, including symptomatic and asymptomatic infectives, as well as exposed and quarantined groups. Numerous parameters must also be taken into consideration, such as the proportion of individuals who use a face mask, the efficacy of face masks, the effectiveness of social distancing, the isolation rate of individuals, to name a few. I shall not delve too deeply into these complex models due to the intense detail. However, this application of mathematics to such a current situation, allows us to see how useful mathematical models are in aiding to predict various outcomes of disease spread. Including the possibility to see the effects of various restrictive measures to inform governmental policies.
MALARIA
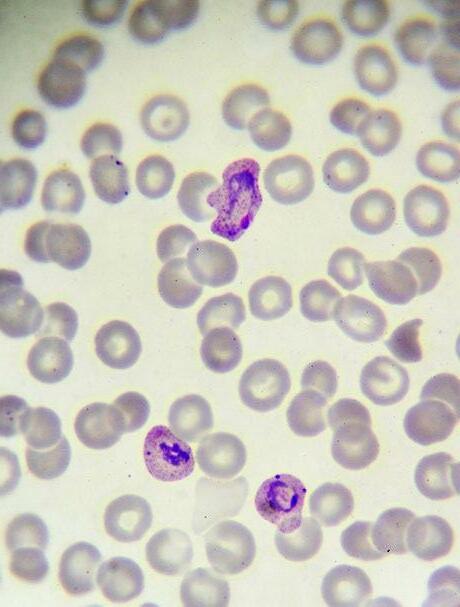
Malaria is a disease caused by Plasmodium parasites, transmitted through female Anopheles mosquitos. This vector-borne transmission causes complexities to the modelling of malaria, as the compartments of the SIR model are applied to both the human host and mosquito vector.
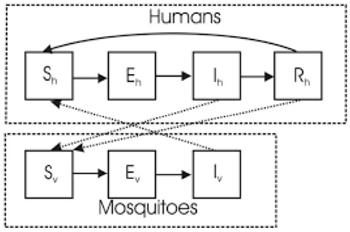
Figure 4. A compartmental model of malaria parasite transmission between humans and mosquitos.
Special Relativity
William Pye
The Special Theory of Relativity was first put forwards in 1905 when Albert Einstein published his work describing ground-breaking ideas of time, energy and light. The theory was built upon two fundamental postulates: • The laws of physics are the same in all inertial (non-accelerating) frames of reference. • The speed of light in a vacuum is constant between all observers


