NOVEMBER, 2022


2
Sharon Austin, Iuka Ravine Association Martin Butler, Executive Director of Neighborhood Services, Inc. Dilnavaz Cama, Off-Campus and Commuter Student Engagement Pasquale Grado, University Area Commission Justice Harley, MOZAIC, Equitas Health Susan Keeny, NECKO Neighborhood Michael Kehlmeier, Dennison Place Civic Association Lanton Lee, University Kiwanis Club Paul Newkirk, Northwood Park, University Community Association board member Pastor Robey, 7th Avenue Community Missionary Baptist Church Karl Stevens, St. Stephens Episcopal Church, OSU Faith Council
FOR University District Organization Spring 2022
President Nora Gerber
Executive Director Jina Yu, Intern (guided discussion and focus groups qualitative data visualization) Isabela Gould, Executive Director Kerry Reeds
Director, Urban Design & Planning Juliana Silveira, Senior Planner Carlos Iniguez, Planning Intern We greatly acknowledge the important contributions of the University District Organization, the University Area Commission, and the Neighborhood Design Center. We also greatly appreciate the support and work from the advisory committee Thank you to all our survey respondents for their answers, their insights, and their passionate discourse. Thank you to the participants in our guided discussions and focus groups for the valuable experiences and reflections.
President UNIVERSITY DISTRICT ORGANIZATION ADVISORY GROUP PLANING TEAM UNIVERSITY AREA COMMISSION
ACKNOWLEDGMENTS
PREPARED
Ellen Moore Griffin,
,
,
Doreen Uhas-Sauer,
UNIVERSITY DISTRICT 3 Table of Contents 4 EXECUTIVE SUMMARY 5 12 WHAT WE LEARNED 13 Process & Schedule 13 Survey Results 16 Guided Discussion 34 Focus Groups 36 Who Lives in the District 7 6 UNIVERSITY DISTRICT 7 38 PATHWAY TO ALL BE WELL 39 SECTION 1 SECTION 3 SECTION 2 SECTION 4
SECTION 1
EXECUTIVE SUMMARY
Executive Summary
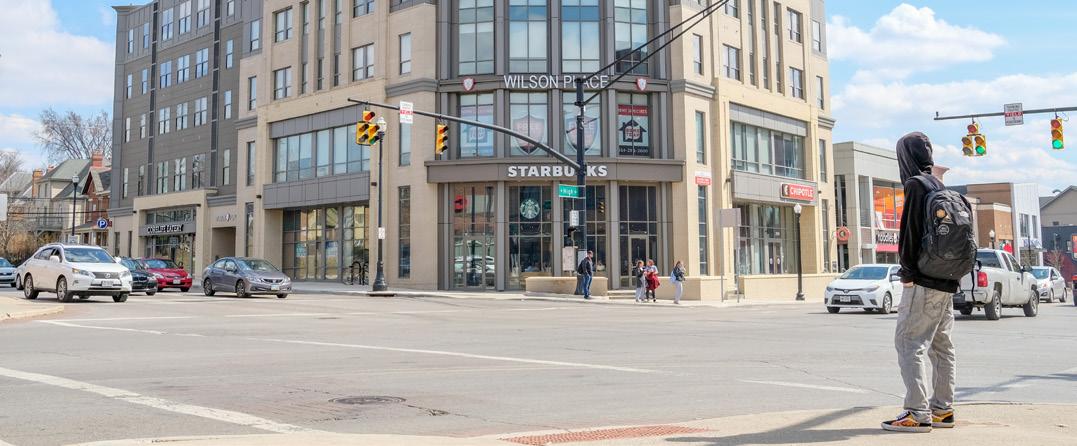
How do you define quality of life? Housing options and affordability? Easy and safe access to places? Shared community gathering spaces? Mix and diversity of retail and services? Strong sense of community and neighborliness? Quality Schools? Feeling of safety?
The University District Organization (UDO) together with the University Area Commission (UAC) conducted a community survey to learn what quality of life means for residents and visitors of the University District.
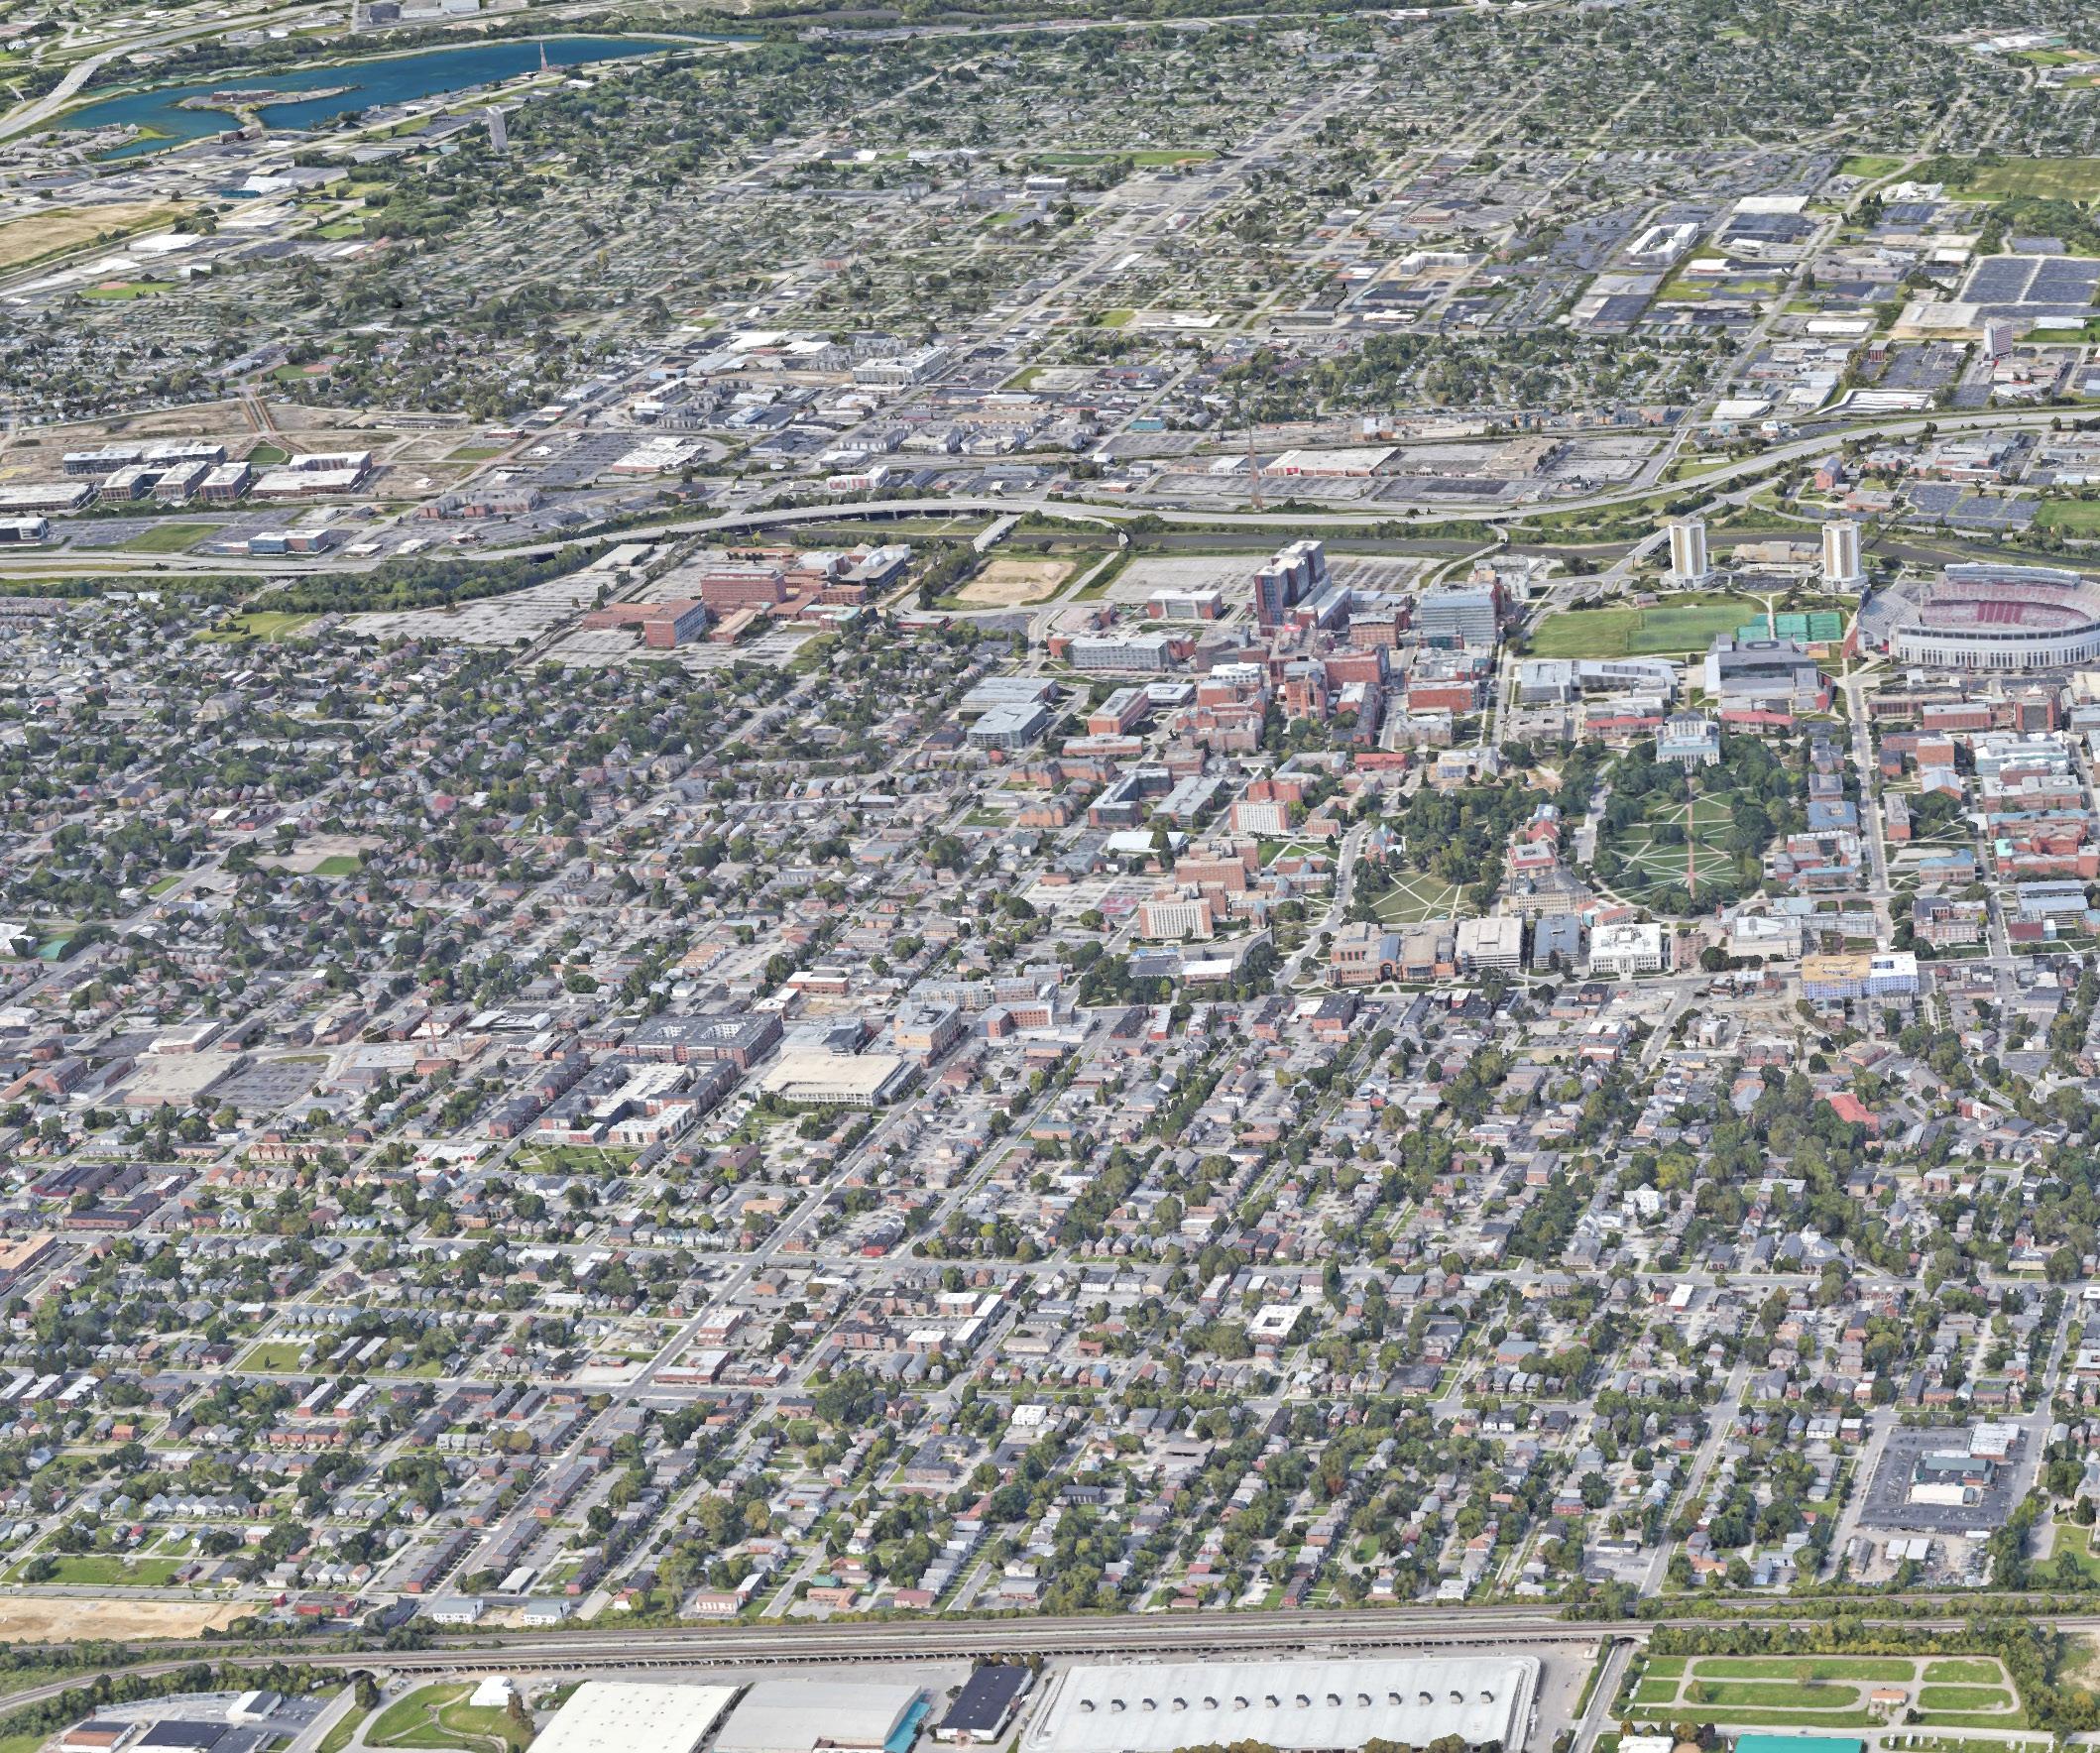
The focus area of this survey was the University District bounded by 5th Avenue on the south, the Olentangy River on the west, the Glen Echo Ravine on the north, and the railroad tracks on the east. The area includes 13 neighborhoods and is home to The Ohio State University.
OLENTANGY RIVER
Arcadia Ave
DISTRICT 2
Glen Echo
Old North SoHud
Glen Echo Indianola Ave
Old North SoHud
Turtle Park Northwood Parkway
Turtle Park Northwood Parkway
Woodruff Ave
The Ohio State University The Ohio State University
DISTRICT 1
NECKO
NECKO
DISTRICT 4
iuka Ravine Indianola Forest
iuka Ravine Indianola Forest
CONRAIL RAILROAD TRACKS
High St
Indianola Terrace
Indianola Terrace
DISTRICT 3
Peach District Weinland Park
Peach District Weinland Park
Dennison Place & the Circles
Dennison Place & the Circles
Patterson Ave 16th Ave 5th Ave
5 UNIVERSITY DISTRICT
GLEN ECHO RAVINE
Quality of Life in the University District
The planning team structured the conversation with the community around six main themes as they influence and impact the quality of life: Housing, Mobility & Transportation, Community Safety, Community Character & Life, Community Services, and Neighborhood Amenities.
There is an understanding that they don’t work in isolation but rather in conjunction with each other, as illustrated in the top right diagram. In the same way, addressing issues related to any of these themes positively impact and help address the others, as illustrated in the bottom left diagram.
hoodAmenities Mobility &Transp
Housing
ervices
inummoC
ieNhg
Communi
Within this structure and the critical support of the advisory group, community sentiment was gathered through a three-part approach: an online survey, a series of guided discussions, and four focus groups. While the almost five hundred survey respondents provided mostly tallied answers, the guided discussions and focus groups allowed more in-depth conversations.
6 | EXECUTIVE SUMMARY
b o r
o
Housing ieNhg
r noitat Community S a f e yt
t
t y S
y retcarahC & efiL
b o r
o r
Community S a f e yt
t y S
The ten key takeaways summarize the high-level results and reflect the combined articulation of the community’s sentiment. Each statement captures a multitude of overlapping comments from the need to provide opportunities to connect, policy changes, as well as, physical improvements. They are presented on the following page in no particular order and will serve as a framework to inform and be further refined in a separate strategic plan. t
hoodAmenities Mobility &Transp
noitat
inummoC
ervices Communi
y retcarahC & efiL
10 Key Takeaways
Embrace diversity and bridge cultural and social gaps in the district
Strengthen the sense of belonging and welcoming, including short-term residents
Create opportunities for neighbors to meet and engage in the community
Provide a suite of resources and development tools to homeowners and invested property owners
Work with landowners and developers to preserve architecture character and uniqueness of the many neighborhoods in the district
Provide the necessary infrastructure to strengthen walkability and pedestrian safety
Identify areas and work with community partners to address cleanliness and noise
Provide and connect the community to gathering and other recreational opportunities
Attract and retain local shops and services geared towards the diverse audience in the University District
Implement a holistic approach to community safety
UNIVERSITY DISTRICT 7
SECTION 2
AT A GLANCE
Who lives in the University District
This section gives a brief overview of the University District demographics. These results help to illustrate and better understand who lives in the district and their perception of this area. The primary tool for collecting socio-economic and demographic data is ESRI Business Analyst (2022), which relies on user-generated overlays and groupings of Census Tract geographies.
From college students and young professionals to longterm renters, longtime homeowners, and community patrons, the University District is home to a diverse collection of Columbus residents. This includes retired Battelle and OSU staff, especially those who are in single households and/or want to live close to university to take advantage of free tuition “Over 60” programs or cultural events.
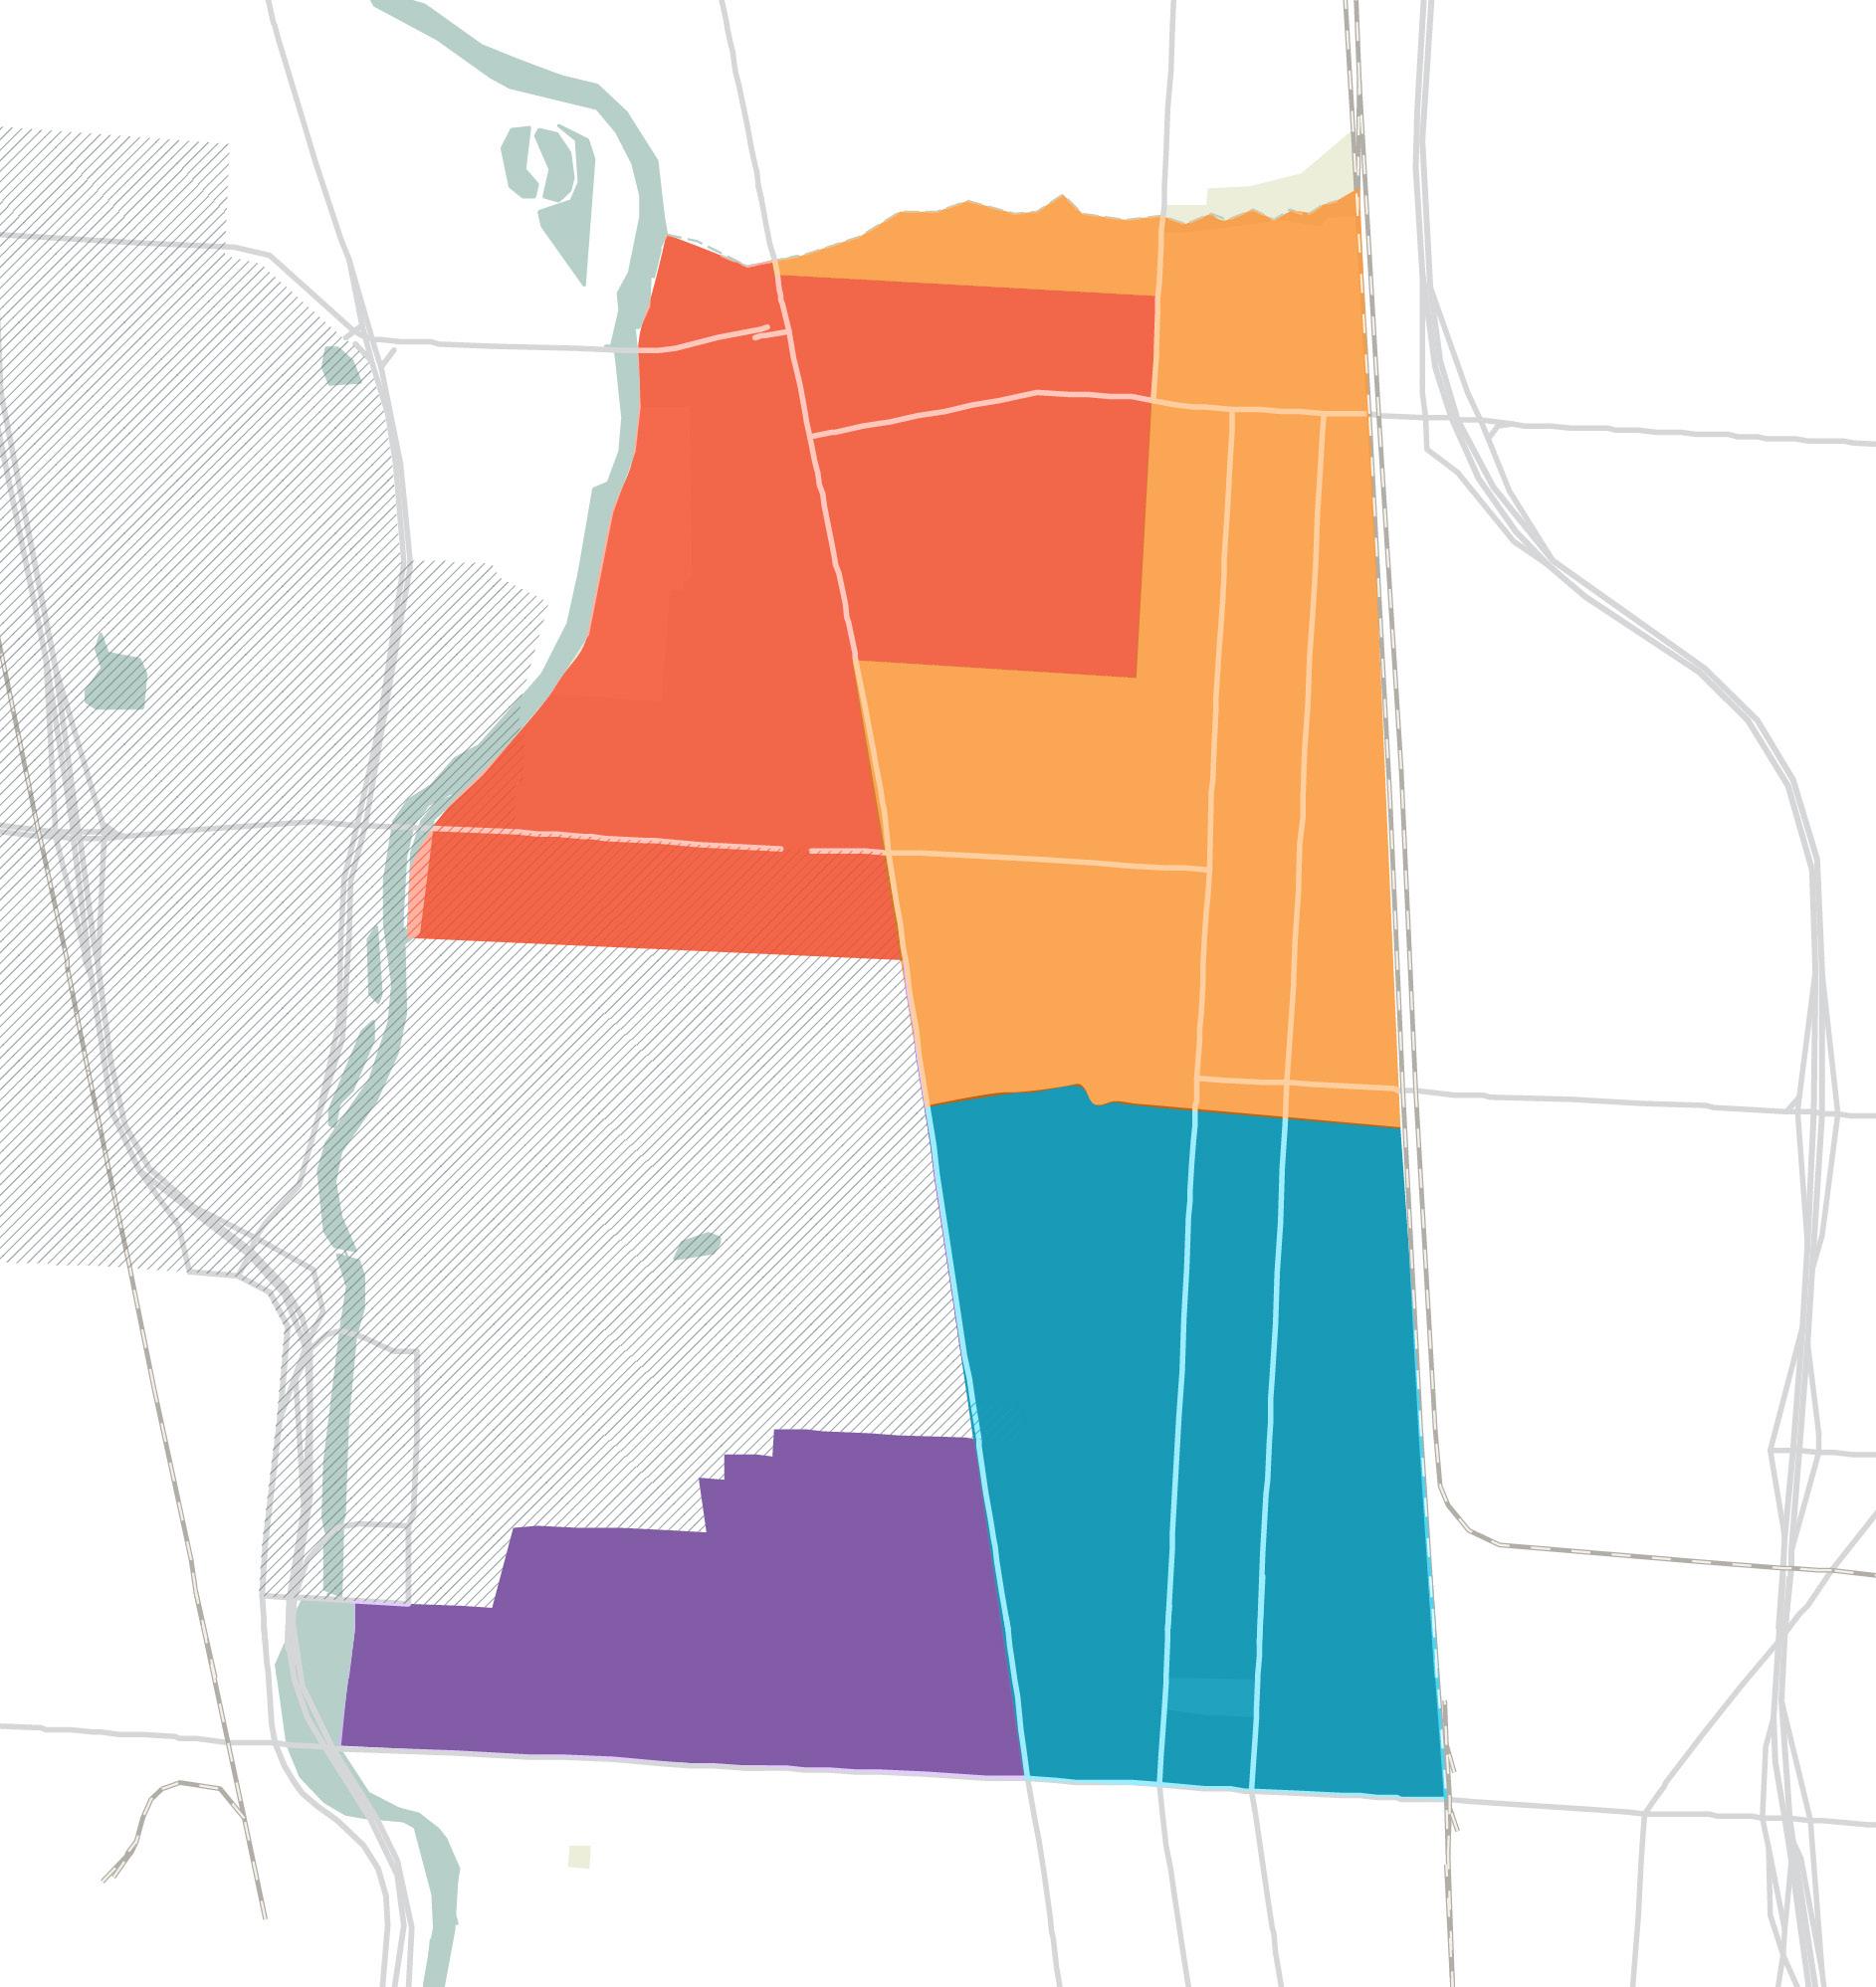
Often, many Columbus residents believe that the University District is eponymous, comprised predominantly of university students and staff. A deeper look into the numbers reveals a more diverse community. This study analyzed the demographic data for the entire University District which contains four Area Districts: Area District 1 (Northeast AD1 Glen Echo/Iuka Ravine), Area District 2 (Northwest AD2 Tuttle Park and Old North), Area District 3 (Southeast AD3 Indianola/ Weinland Park), and Area District 4 (Southwest AD4 Dennison Place/Peach District) - see diagram on bottom right, not including campus. While specific trends apply across the entire University District, there are several unique qualities of each Area District. The term “district” is used to correspond to geographic quadrants of the University District with approximately the same population numbers, and each of these areas elect neighborhood representatives to serve on the University Area Commission. Many diverse neighborhoods (with different names) can be found within each “district.”
Columbus’ University District is one of the city’s most recognizable and visited communities. The district is characterized by the commonly attributed
demographics of a student population—lower median incomes and younger median ages from a rent-heavy market. According to population forecasts from Esri using Census data, there are a total of 35,899 residents in the University District living in 15,923 households (36% oneperson, 17% family, and 46% non-family households), and an average 2.13 persons per household compared to 2.39 in Columbus. As a reference, the City of Dublin has 49,328 residents in 16,819 households, while Upper Arlington has 36,800 residents in 13,627 households.
Basic demographics(2) do suggest that many students occupy this area—a median age of 22.4(2), per capita income of $23,766, 64% of the population between the ages of 15-24, and renters occupying 78.3% of all housing units. Low ages and low wages indeed suggest that students are the principal residents within the District.
9 UNIVERSITY DISTRICT
Arcadia Ave Patterson Ave 16th Ave 5th Ave High St Woodruff Ave GLEN ECHO RAVINE CONRAIL RAILROAD TRACKS OLENTANGY RIVER Indianola Ave OSU AD1 AD2 AD4 AD3
Yet, there are sizable populations apart from the students. 10.5% of the housing units in the University District are owner-occupied. There are 2,764 families in the University District, with an average family size of 2.55 persons. Families are especially abundant in AD3, where 14.6% of the population is under 18 years old. These numbers still fall short of the rest of the city, where 22.3% of the population is under the age of 18. Still, AD3 has the highest school-age population percentage in the entire University District. While 10.4% of Columbus’ population is above 65 years old, only 2.5% of the University District falls into this category.
The University District is home to 973 businesses, almost entirely in the service sector (94%) concentrated between education institutions and libraries (43.3%) and health (21%). OSU alone registered 62,000 students enrolled and 39,000 full-time employees (2021-22). The daytime population increases to 66,215, with 25,231 residents staying within the District, indicating a substantial daily influx of people into the District.
How does the University District’s racial composition compare to the City of Columbus? 73.6% of University District residents are White, while 10.3% are Black. The Esri Diversity Index, which measures the probability that two people from the same area will be from different racial or ethnic group, is 49.3. According to new data from the 2020 US Census, 57.4% of Columbus residents are White, while 29.2% are Black. The District is home to a larger proportion of Asian residents within its population (10.8%) than the city as a whole (5.9%).
The University District has divergent housing market characteristics depending on location in the neighborhood. One of the main concerns for the University District, both through this report and anecdotally, is housing affordability. As a regional housing shortage begins to influence the area, concerns about being priced out are more prevalent for old and new residents. Two metrics shed light on these concerns: Housing Affordability Index (HAI) and Wealth Index (WI). The HAI measures the ability of a typical resident to purchase an existing home in an area, while the WI is compiled from a number of indicators of affluence including average household income and average net worth. The University District (not includign campus) performs lower than the national average: 45% lower HAI and 71% lower WI. Within the District, 41% of income is spent on mortgages, over the 30% line that suggests a mortgage or rent burden. Anything above 30% indicates a risk of foreclosure and not making payments, a rule of thumb for the mortgage industry.
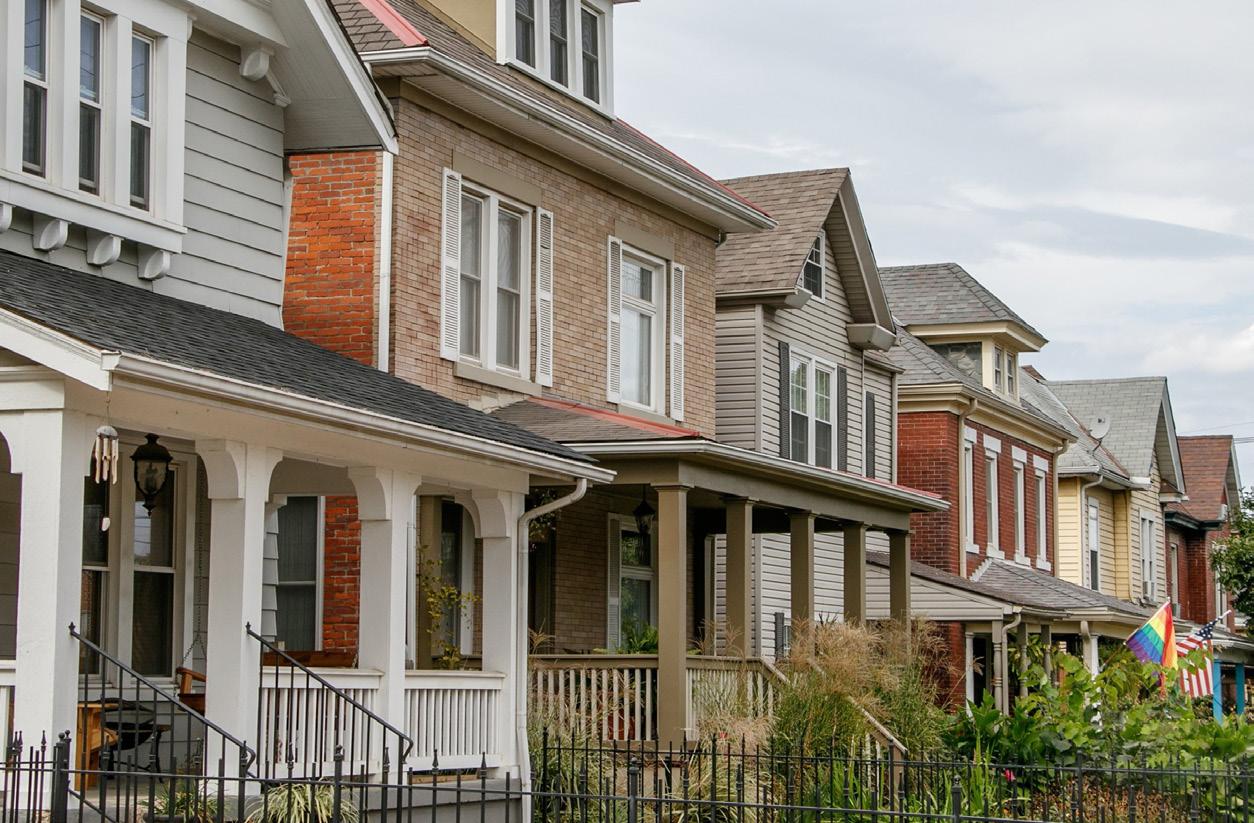
The University District, historically (c. 1840-1970), developed and evolved into enclaves and patterns which are still visible today in housing stock, affordability, demographics, income levels, institutions, health issues, and opportunities for its residents, all of which affect perceptions of “quality of life.” Historic factors included: annexation of small independent towns; acquisition of farmland developed over three generations by the same Neil family; settlements of distinct ethnic groups; early streetcar line development used by developers to mandate restrictive deeds on lots (separate from redlining and mortgage restrictions), creating color lines by streets which prohibited African American and Italian residents; Civil War era railroads spurring industrial zones (later toxic brownfield) belts; flood plain and swamp areas along the Olentangy River, township and city squabbles; extreme Notes:
10 | AT A GLANCE UNIVERSITY DISTRICT BY THE #’S 35,899 Population1 15,923 Households1 2.13 Avg. Household Size1 22.4 Median Age2 47% Living in non- family households1 $31,357 Median Household Income1 78% Renter Occupied1
1 - Data does not include OSU Campus 2 - Data includes OSU Campus
UNIVERSITY DISTRICT 11 <$50,000 $150,000 $250,000 $400,000 $750,000 $1,000,000 + 0% 10% 20% //HISTORICAL POPULATION TRENDS [2020-2027]
VALUE 1 //HOUSING: YEAR BUILT
Home Value Percent of Income for Mortgage AD3 is
and AD4 is
Most housing stock was built prior to the 1940s New development is the past two decades is concentrated in Area District 3 AREA DISTRICT 1 UNIVERSITY DISTRICT 1 LEGEND AREA DISTRICT 3 AREA DISTRICT 2 AREA DISTRICT 4 1 % growth 2010-2020 -3% 4% 2% 13% 1% $168 $27% 78% $424 $245 41% $286 55% $245 35% 2020 2021 2022 2027 6,581 7,135 7,389 7,866 11,668 11,788 11,470 11,859 37,366 35,899 <1939 1950-59 1970-79 1990-99 > 2010 0% 10% 20% 30% 40%
//HOME
Median
household costburdened
severely cost-burdened
housing shortages after World War II and the GI bill; unintended consequences of gentrification and rapid growth of institutions; and differing interpretations and expectations of mission statements.
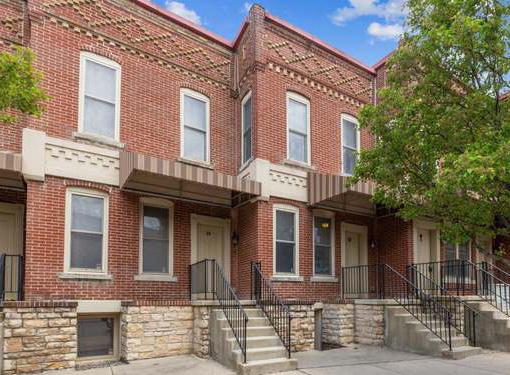
A further look shows the different factors that create these affordability fears in Area District 3. The median home value of owner-occupied units in Columbus is $160,000. In AD3, the median home value is nearly twofold higher at $286,000. This figure, along with AD3’s median household income of $27,595, drops the HAI to 43% lower than the national average. Within AD3, there has been an increase in homes built within the last ten years, likely driving up median home prices. More than 50% of these homes are valued at over $250,000. Coupled with a 13% population growth in just the previous decade, the highest in any four district areas, there is increasing pressure on the housing market in this area.
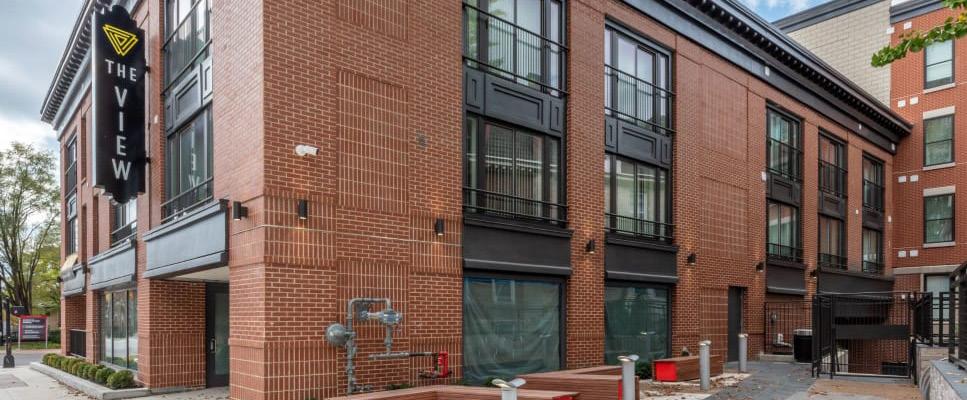
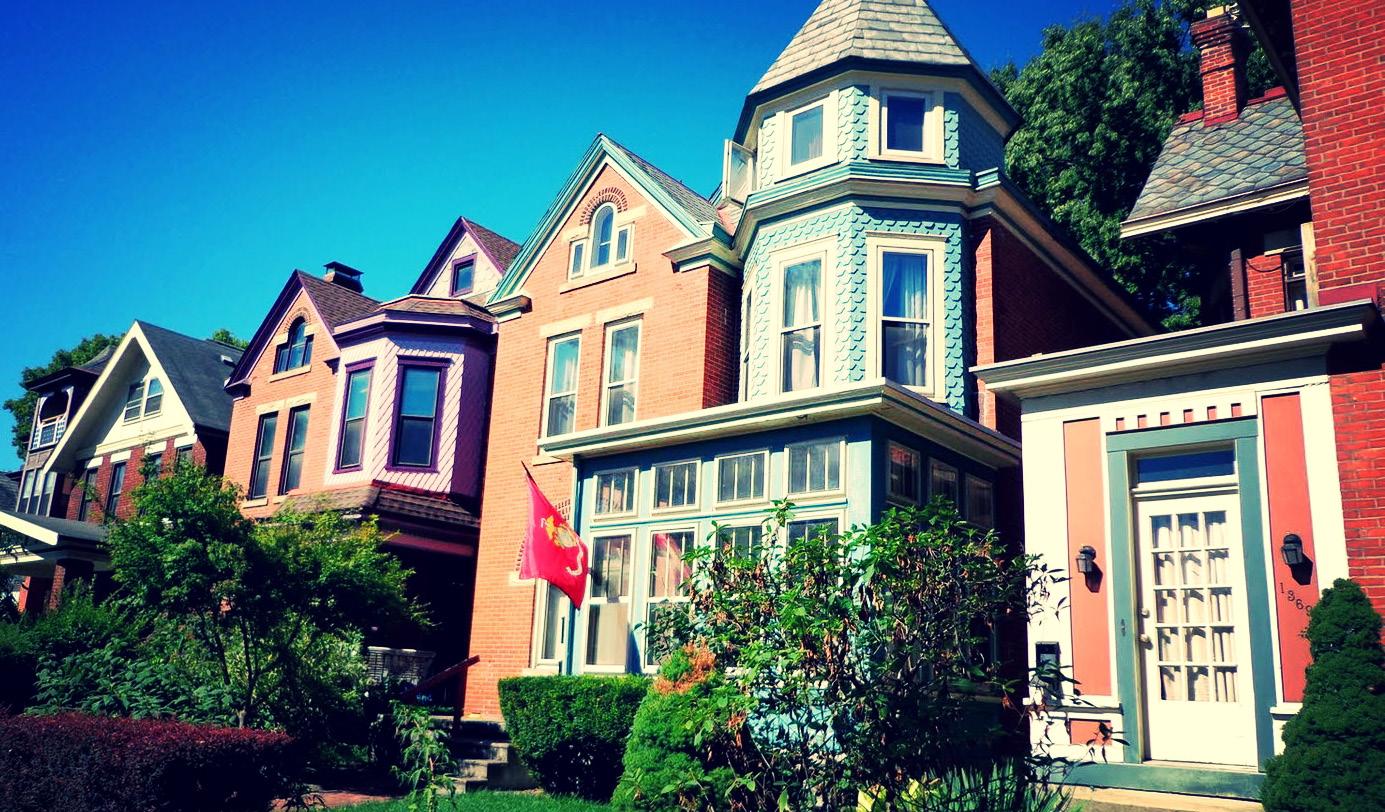
Homes are valued at much higher prices in AD4, with a median home value of $424,000. This area offers a collection of historic buildings like the Victorian homes at Dennison Place and South Campus, many valued at over $400,000. The median household income of $28,465 drives the HAI to 59% lower than the national average, the lowest of the Area Districts.
Even though Area Districts 1 and 2 have lower median home values and higher median incomes than AD3 and AD4, the HAI values are still lower than the national average: 22% less in AD1 and 27% less in AD2. Traditional housing assistance program criterion is based on a fixed percentage of Area Median Income (AMI). At less than 80% of the AMI, households are considered low-income. At less than 50%, households are considered very low-income, and at less than 30%, they are considered extremely low-income. Columbus’s housing incentive policy criteria for affordable housing in the community reinvestment areas, including Weiland Park, is 80% of the AMI. For the Columbus metropolitan area, the one-person low-income limit is $46,950. The highest median household income among the four University District subdivisions is $37,272 (AD1).
Lastly, Esri’s CrimeRisk Index sheds light on the sensitive topic of safety. Applied Geographic Solutions developed this index to describe the likelihood of various incidents normalized to a national average of 100. Further, it is simplified on a 1 to 5 scale, from “not a concern” (1) to “strong concern” (5). The University District’s overall crime risk scored 4, higher than the City of Columbus (1) and falling under “somewhat a concern.” Assault (1) is the lowest likely crime, lower than the national average. Robberies (5) and motor vehicle thefts (5) are of “strong concern.” According to this metric, these two types of incidents present the most significant concern for the entire University District.
The data presented in this section focused on major themes discussed during the outreach process. Their intent was to open the dialogue about the quality of life in the University District as the Be Well survey invited this dynamic and diverse community to share their thoughts, concerns, and values to help build a pathway to all be well. In the following sections, we’ll hear what they said and how they feel about the District. Notes: 1 - Data does not include OSU Campus 2 - Data includes OSU Campus
12 | AT A GLANCE 87,526 Day-time Population2 59,513 Workers2 1,029 Total Businesses2 39,000 OSU full-time employees 74% White Alone2 62,000 OSU registered students
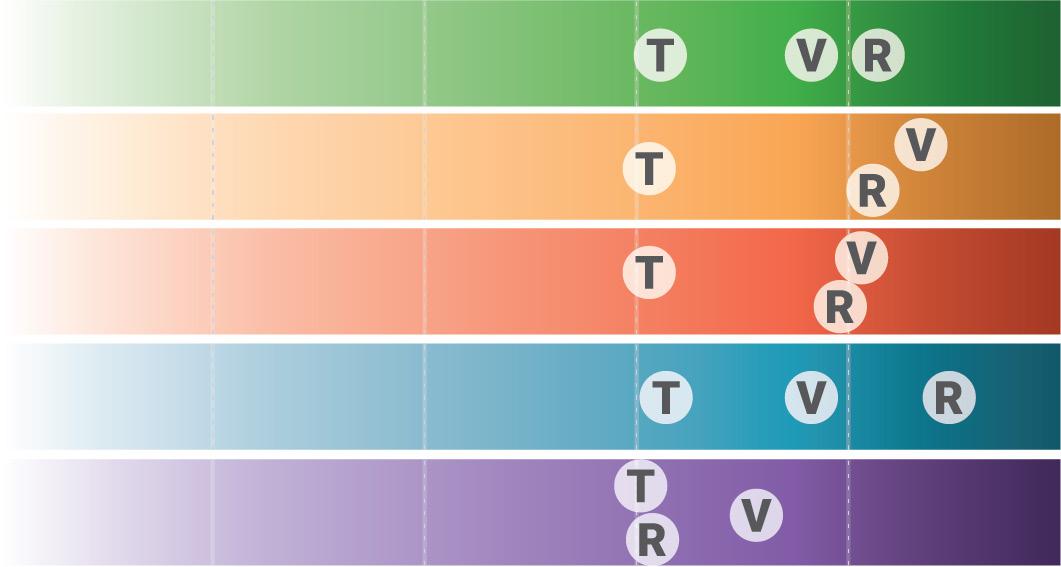
UNIVERSITY DISTRICT 13 //COMMUTE 2 //HOUSING: OWNERSHIP 1 //RACE & ETHNICITY 2 //COMMUNITY SAFETY 2 25.4% 52.8% 4% 5.2% Walked to Work Drove Alone to Work Bike to Work Carpooled Black Alone White Alone Other Asian Alone 16% 74% 10% 11% 5% 80% 13% AD1 largest % of White pop. University District AD3 largest % of Black pop. AD2 largest % of Asian pop. Owner Renter Vacant
1
DISTRICT
3
2
4 0% 100% AD1 has the highest ownership percentage Robbery and motor vehicle theft are the two leading incidents, driving the total crime up TRAVEL TIME TO WORK 2 T - TOTAL CRIME R - ROBBERY V - MOTOR VEHICLE THEFT AD3 and AD4 have similar percentage of renter occupancy AD2 and AD3 have the highest vacancy rate 14.4% ±80% ±14% 11% 78% 11% NOT A CONCERN STRONG CONCERN 6.6% Took Public Transportation 10% 20% >35 min <10 min 10-14 min 15-19 min 20-25 min 25-30 min 35% of workers do not use a car to commute
AREA DISTRICT
UNIVERSITY
LEGEND AREA DISTRICT
AREA DISTRICT
AREA DISTRICT
SECTION 3 WHAT WE LEARNED
Process
Quality of life is often an evaluation or perception of one’s living conditions, meaning different things for different people. Yet, they are all impacted by factors outside of their control. The built environment, social services, community relationships, and social conditions affect one’s satisfaction levels. The University District has experienced tremendous change over the past ten years as it continues to grow and previously vacant properties are redeveloped.
The constant flux of students, new residents attracted by recent developments, and long-term residents have witnessed and experienced some characteristics of their lives change. For residents, has life improved in the District? For visitors, is it an inviting environment? Better understanding these perceptions helps to inform decision-makers, community partners, and community members where to allocate resources and efforts to create a more vital University District.
The survey results present several community reflections and recommendations on many critical aspects of life in the University District. These contribute to defining and assessing the quality of life for this area. The primary goal of this study was to learn what “quality of life” means for residents and visitors of the University District. This study helps to identify areas of need and understand what is or is not working well as well help to determine shared community values and assess the cultural assets of the University District. Long-term, the survey results could be used to inform broader community dialogue with OSU, the City, and other major partners, offering evidence of community feelings to guide priorities, strategies, and actions. Community feedback gives the necessary information to base future recommendations and investments to improve the quality of life in the University District.
PROJECT SCHEDULE showing the seven months process divided in three phases.
PROJECT ORGANOGRAM displaying relationship of who was involved, their roles, and planned activities.
15 UNIVERSITY DISTRICT
UDO UAC LEAD NDC FACILITATE Advisory Group GUIDE Community Survey Guided Discussion Focus Groups Target Population Students Retirees Families with children Young professionals Minority groups Visitors Employees Non-student public ENGAGE Stakeholders COMMUNITY KNOWLEDGE Civic associations in the University District OSU – Office of Student Life; Administration & Planning University Community Business Association/ Owners Landlords/property owners Nonprofit organizations Churches City of Columbus, neighborhood liaisons SUMMER 2022 FALL/SPRING 2021 PHASE 1 PHASE 2 PHASE 3 Survey, branding, graphic, and web development Public engagement, survey dissemination and guided discussion Focus groups, survey results analysis, report drafting
& Schedule
Engagement & Outreach
Process
The Be/Well was a public engagement process and survey designed to take the pulse on the quality of life within the University District. This seven-months process included the following tasks within three distinct phases:
• Phase 1 – Project kick-off including survey, branding, graphic, and website development.
• Phase 2 - General public engagement, survey dissemination, and guided discussions.
• Phase 3 – Focus groups, engagement, survey results analysis, and draft report.
The University District Organization (UDO) and University Area Commission (UAC) led this community outreach effort, facilitated by the Neighborhood Design Center (NDC) and guided by an Advisory Group. Before issuing the Be/Well survey, the UDO and UAC established an Advisory Group comprised of 11 community members to provide advice on how to engage residents in the University District Area throughout this process. They shared their expertise with the planning team and were vital in developing the survey. This group met four times throughout the engagement process to review content, approach strategies, and give feedback on the survey questions. These meetings were vital in finding ways to fully engage residents in sharing their thoughts on what quality of life means in the district. The composition of the Committee included members of The Ohio State University, local civic groups, and the local church community. The commitment of the Advisory Group was instrumental to the success of this effort.
Types of engagement
The engagement approach included an online survey, guided discussions, and focus group meetings as shown in the following calendar. To reach as many residents as possible, the planning team distributed 200 flyers and 1,500 postcards through USPS service Every
Door Direct Mail (EDDM). Materials were placed at local businesses, shared via email campaigns, and promoted on social platforms.
ENGAGEMENT SCHEDULE
Online Survey:
• October 2021-February 2022
Guided Discussion:
• During the month of November 2021
Focus Groups:
• Area District 1: February 24th, 2022
• Area District 2: February 17th, 2022
• Area District 3: February 15th, 2022
• Area District 4: February 22th, 2022
Survey Methodology
The survey consisted of 23 questions grouped in three sections – 1) About You, 2) Civic Groups, and 3) Quality of Life. The About You section included questions about the demographics of respondents. The Civic Groups section intended to learn about their knowledge and involvement with the local civic organizations. The Quality of Life section was centered around six main themes – housing, transportation, and mobility, neighborhood amenities, community character & life, community services, and safety. Questions were a combination of multiple-choice, rating, and open-ended.
Survey respondents were able to communicate priorities and values. Some of these include:
• Value in the University District location, the historic architecture, and its diversity.
• An expressed need to improve safety, adequate pedestrian and bicycle infrastructure, and a better mix of retail and services.
• A need for growth and reinvestment committed to allowing the University District area to remain diverse and inclusive, bringing long-term residents, newcomers, and students invested in building one single community.
16 | WHAT WE LEARNED
UNIVERSITY DISTRICT 17 Housing Mobility & Transportation Neighborhood Amenities Community Character & Life Community Services Community Safety BY THE #’S 6 MAIN THEMES survey responses ±500 stakeholders engaged 65+ months process 12 focus groups 4 guided discussions 20+ main themes 6 postcards distributed 1,500 UAC meetings 5
Survey Results
Who Responded to the Survey
The survey acquired nearly 500 responses, mostly from people in the University District, but also from other Columbus areas residents and students’ parents. Most respondents indicated that they live in University District neighborhoods, with Old North topping the list, followed by Glen Echo, SoHud, Weinland Park, and Dennison Place.
The age representation is well-distributed. The most represented age group was 25-34 with 21%, and the least represented age group, but not by a large margin being >65 with 12.5%. White respondents were the largest group (81%). In comparison, the second-largest group preferred not to identify their race or ethnicity with 9% — Black and Hispanic were next with 6% and 4%, respectively, which is representative of the overall district demographics.
Indeed, most survey respondents were residents (57%), where 65% of those residents were homeowners, and 30% were renters. The next largest respondent group was students (24%), followed by employees of The Ohio State University (23%). Of the residents, lifelong residents were most represented. Only 13% have lived in the district for fewer than two years.
18 | WHAT WE LEARNED
“I want more neighborhood and community building, more resources for neighbors in need so we can keep this awesome place diverse and friendly to all (...)”
UNIVERSITY DISTRICT 19 //RELATIONSHIP WITH THE DISTRICT 30% 15% 19% 22% 13% > 20 5-10 2-5 10-20 < 2 //HOW MANY YEARS HAVE LIVED IN THE UNIVERSITY DISTRICT Lifelong Residents Tops the List 81% 10% 9% 6% White Other Black Rather Not Respond //RACE/ETHNICITY White Tops the List //AGE GROUP 25-34 Age Group Tops the List With 25% 43% 40% 3% 14% < 25 25-45 > 45 ±500 Responses 1. Old North (51) 2. Weinland Park (32) 3. SoHud (26) 4. Glen Echo (25) 5. Dennison Place (23) TOP 5 COMMUNITIES Student 24% OSU Employee 23% Frequent Visitor Business Owner/ Employee Church Member Other 97% OSU students 18% 10% 6% 3% 57% RESIDENTS 65% homeowner 30% renter 5% other 0.4% landlord Homeowners Residents Tops the List
Housing
Respondents rated aspects of housing in the University District related to affordability, diversity of housing options, quality and upkeep of existing housing stock, and quality of new development.
Survey respondents generally rated overall aspects of housing as average in the University District. Housing affordability is a hot topic, and even though 49% rated it as average, there was a clear divide, with a split between those considering it below average and above average. They also consider that the area offers a range of housing types and price points, with 45% rating as average and another 33% above average.
These results reflect the larger context of the regional housing crisis we face. The job creation to housing ratio is 2.5/1 below the desired 2.5/1.5, putting pressure on the market. As the second most segregated region in the country, this particularly affects the black and most vulnerable population.
There is a concern with the quality and upkeep of existing housing stock given the high percentage of rental property in the University District, with 49% considering it below average and only 7% rating it as above average. The quality of new development was divided and somewhat of a concern, with ratings of 44% average, 30% below average, and 20% above average.
For the entire pool of respondents, most (71%) say that rent increases have not affected their ability to live in the University District. There were 3.4% of respondents who shared that they are unhoused. Noted that by the time this survey was closed, some long-term rental residents experienced up to 45% rent increase and reported having to relocate.
THE CIRCLES HOME
20 | WHAT WE LEARNED
Aspects of Housing in the University District TOWNHOMES
DEVELOPMENT
DETACHED SINGLE-FAMILY MIXED-USE
Affordability is a hot topic Somewhat offers a range of housing types and price points
Concerns with maintenance of existing and quality of new housing stock
UNIVERSITY DISTRICT 21
3.4% of respondents are unhoused //RATE THE FOLLOWING ASPECTS OF HOUSING IN THE UNIVERSITY DISTRICT. //HAVE RENT INCREASES AFFECTED YOUR ABILITY TO LIVE IN THE UNIVERSITY DISTRICT? //PLEASE SELECT WHAT BEST DESCRIBES YOUR CURRENT LIVING CONDITION? Affordability Below Average Average Above Average Not Applicable Diverse Housing Options Quality and Upkeep of Existing Housing Stock Quality of New Housing Development 27% 18% 49% 30% 49% 45% 40% 44% 21% 33% 7% 20% 4% 4% 4% 6% 29% YES (11% are renters) 71% NO
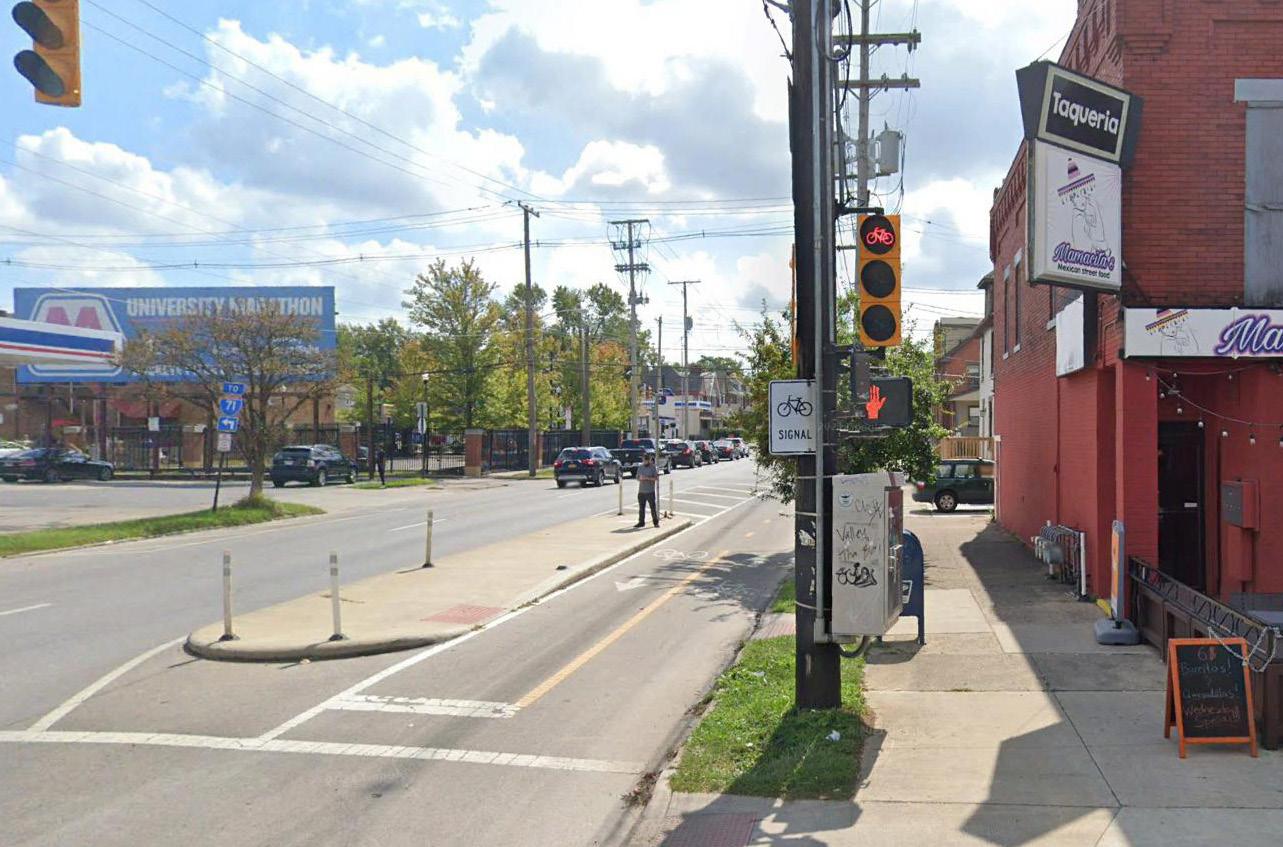
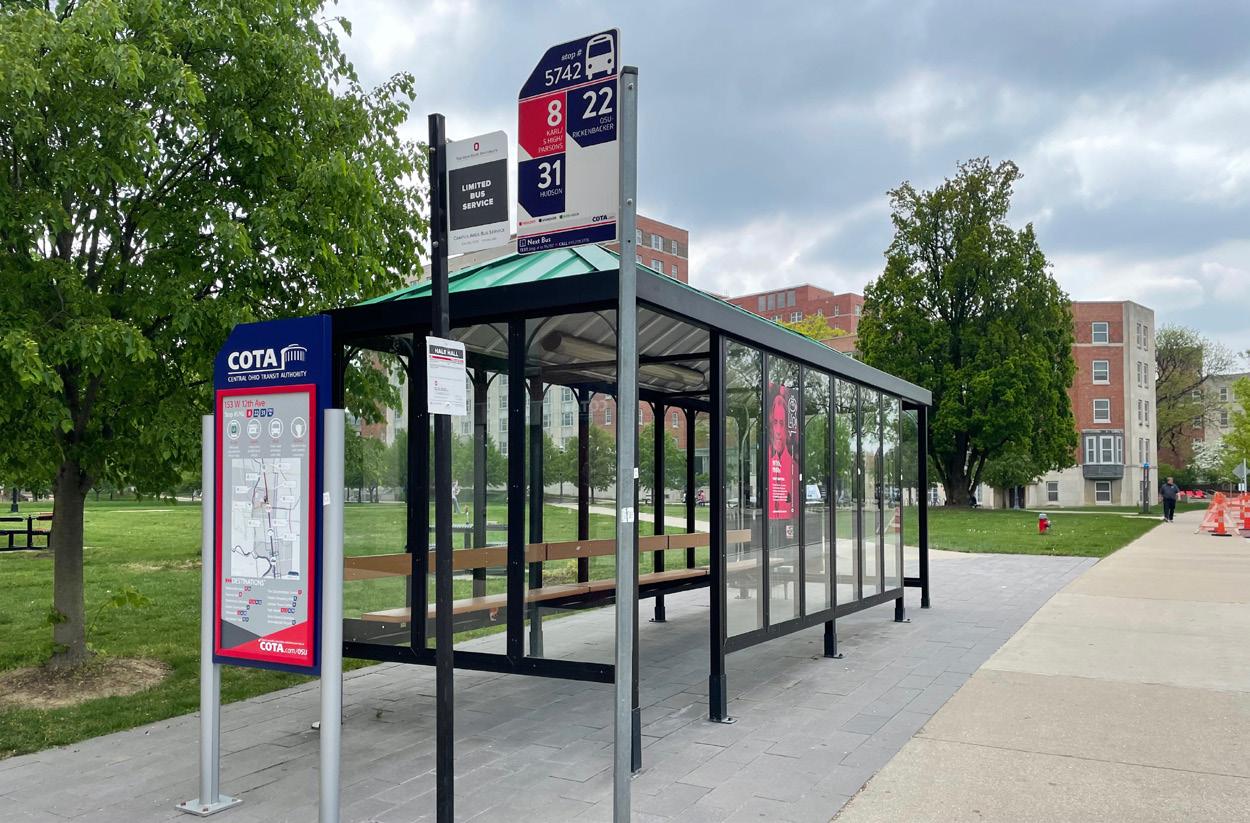
Mobility & Transportation
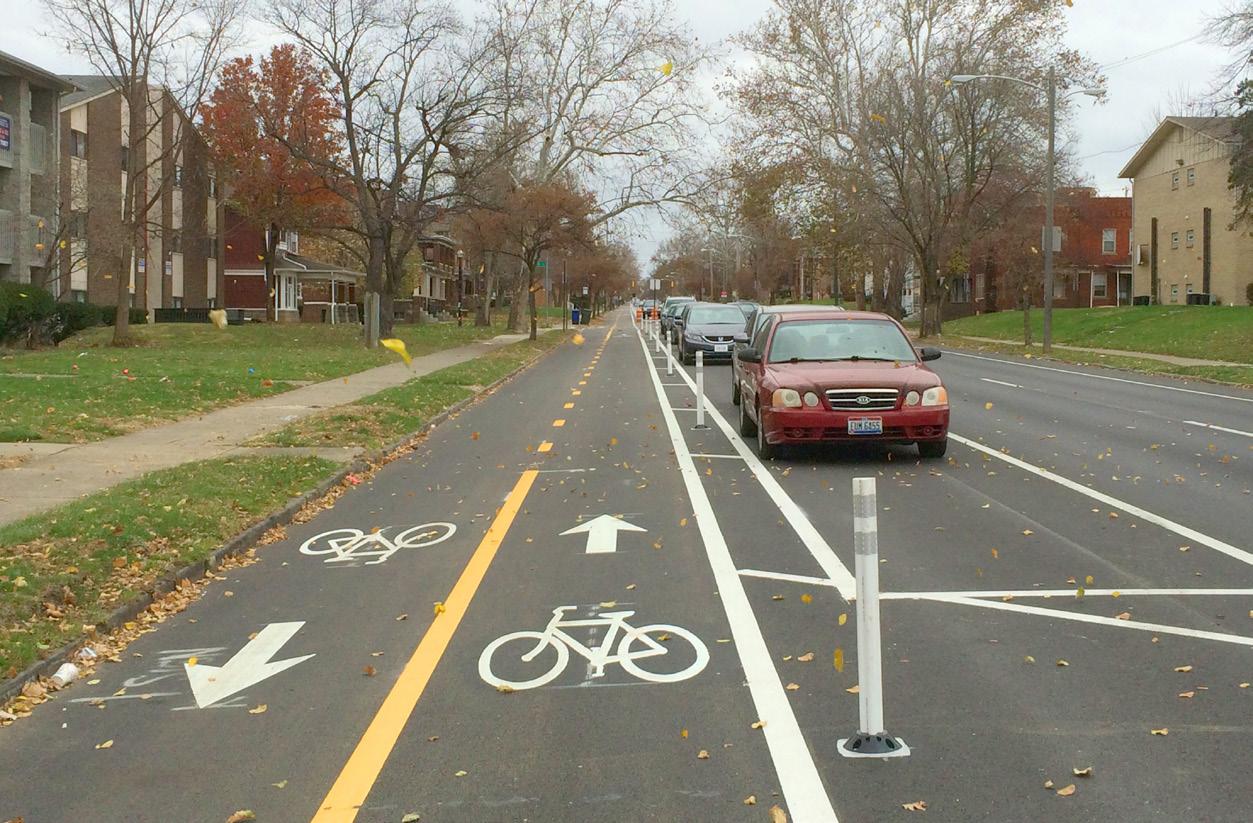
PROTECTED BIKE LANE
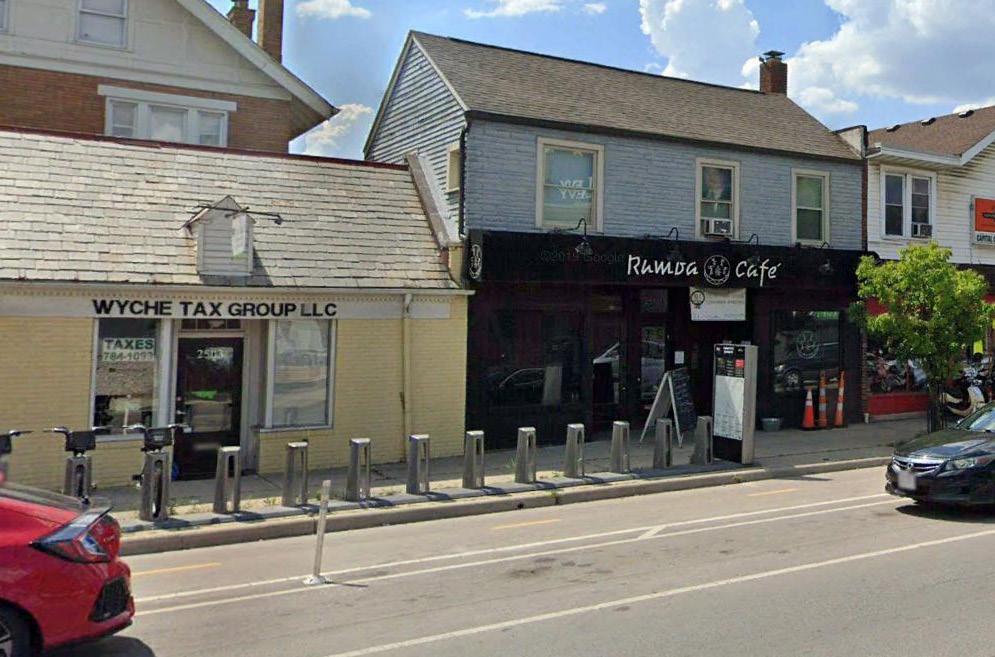
Mobility and transportation encompass a friendly environment for walking, a safe cycling network, availability of local public transit, manageable travel by car, and easy access to places. In rating these aspects of mobility and transportation, respondents used a scale from awful, bad, unsure, good, or amazing (see an expanded meaning on the next page). Overall, respondents consider they have easy access and can mostly get to places using different transportation modes, with over 60% rating as good or amazing.
Walkability was rated the highest, with over 65% rated as good or amazing. The safe cycling network had the most significant divide, with 26% unsure and 24% good, and the largest not applicable rate (15%). There is generally good local public transit (30.4%) and travel by car (33%), but there is clear room for increasing the public transportation network and improving navigation in and out of the district.
These results indicate that the district is a walkable and accessible area, but some areas are better served than others. The district is on the right path with the existing infrastructure. Investing in better maintenance and expansion of multi-modal infrastructure would enable this area to serve as an active transportation zone.
22 | WHAT WE LEARNED
Aspects of Mobility and Transportation at the University District BUS STOP AT HALE HALL
COGO BIKE SHARE STATION
PROTECTED BIKE LANES
Walkability (friendly environment to walking)
Safe cycling network
Local public transit
Travel by car (traffic congestion)
//RATE THE FOLLOWING ASPECTS OF MOBILITY AND TRANSPORTATION IN THE UNIVERSITY DISTRICT. 6% 10% 9% 5% 5%
Easy access to places you need or visit often
>65% rated walkability and easy access to places as good and amazing
Awful Bad Unsure/ Average Good Amazing Not Applicable
7.2% 18% 11% 17% 10%
19% 26% 25% 27% 24%
41% 26% 1% 24% 7% 15% 30% 15% 11% 34% 14% 4% 33% 27% 1%
(5) Amazing — I can get anywhere I need/want!
(4) Good — I can mostly get to places!
(3) Unsure — I get to some places but not others!
(2) Bad — I have a hard time getting to places!
(1) Awful — I can never get to places!
(N/A) Does not apply to me
UNIVERSITY DISTRICT 23
Neighborhood Amenities
Under neighborhood amenities, respondents rated neighborhood parks, shared gathering spaces, recreational opportunities, access to trails, retail shops, restaurants and bars, services, and the mix of retail and services.
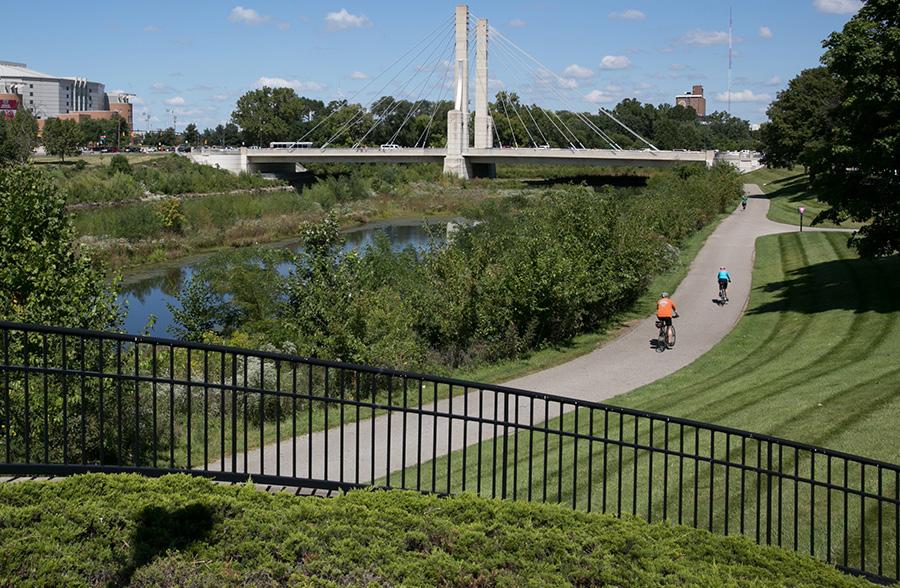
Most of the amenities surveyed were rated good and indicated that there are enough quality options. However, community spaces, recreational opportunities, and the mix of retail and services were the lowest-rated amenities, with more than 50% of respondents rating these as unsure or below.
These results indicate an uneven distribution or offering of these amenities in the district and its audience. Interestingly, even though retail and services were rated high, 50% rated as good or amazing, it lacks a mix and diversity of offerings, with over 50% rating as unsure to awful.
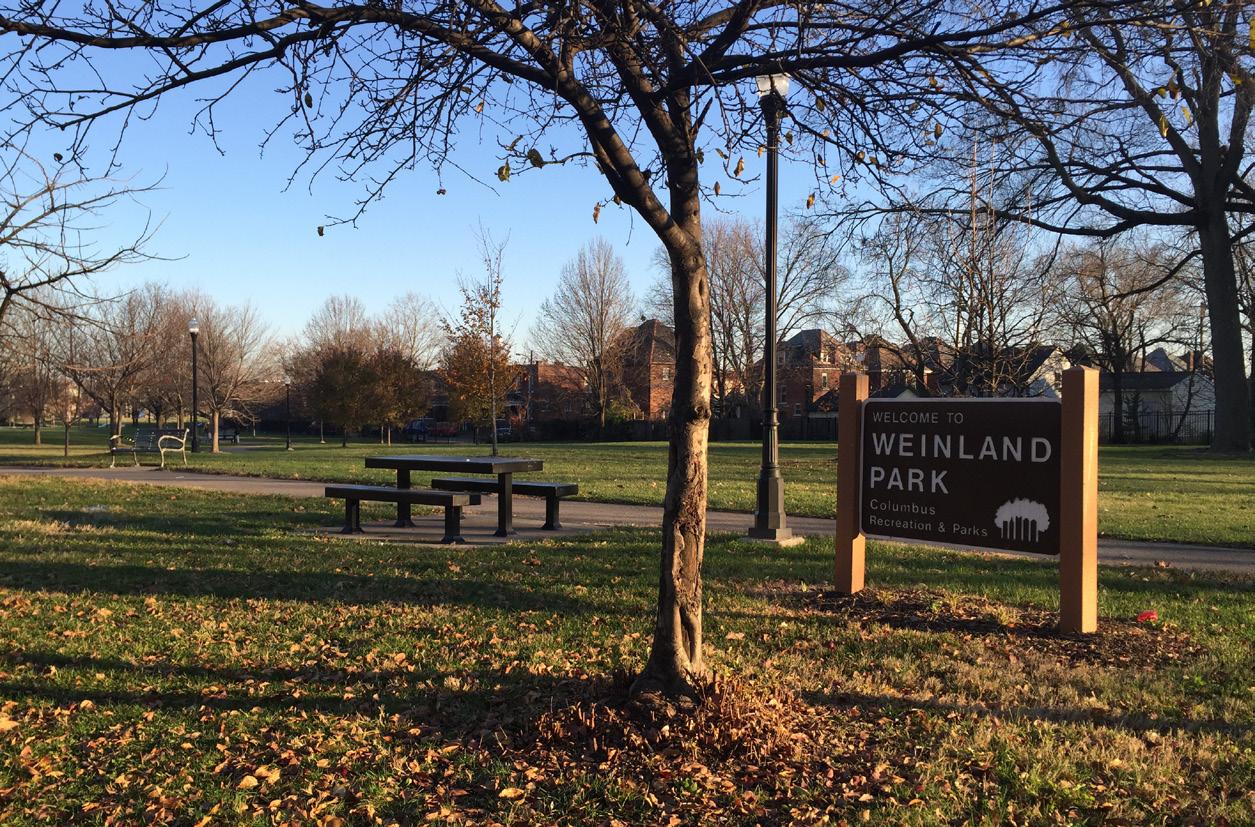
WEINLAND PARK
24 | WHAT WE LEARNED
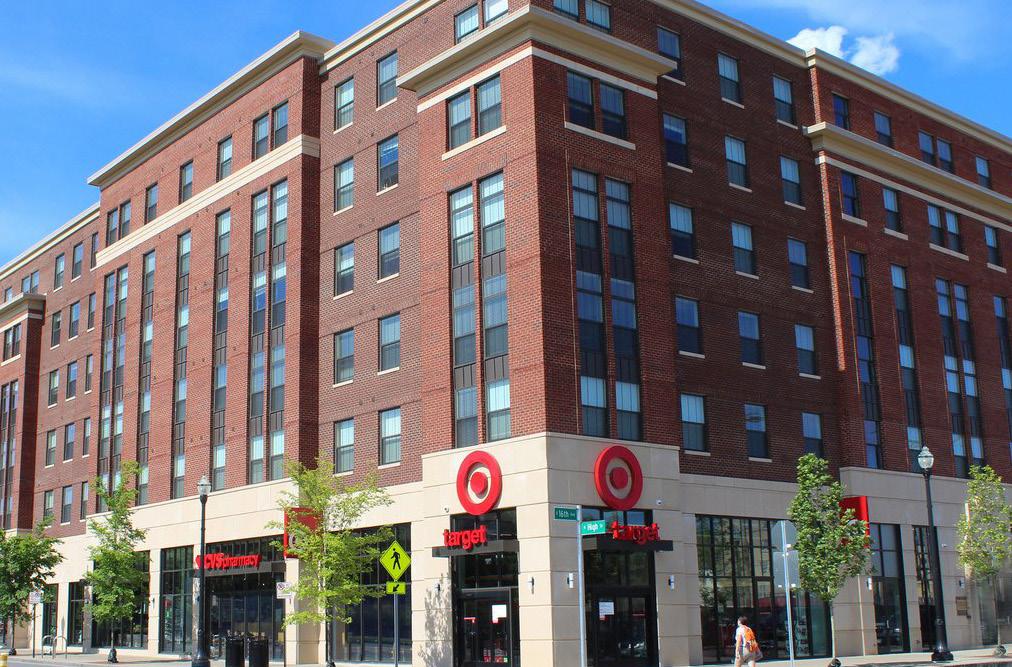
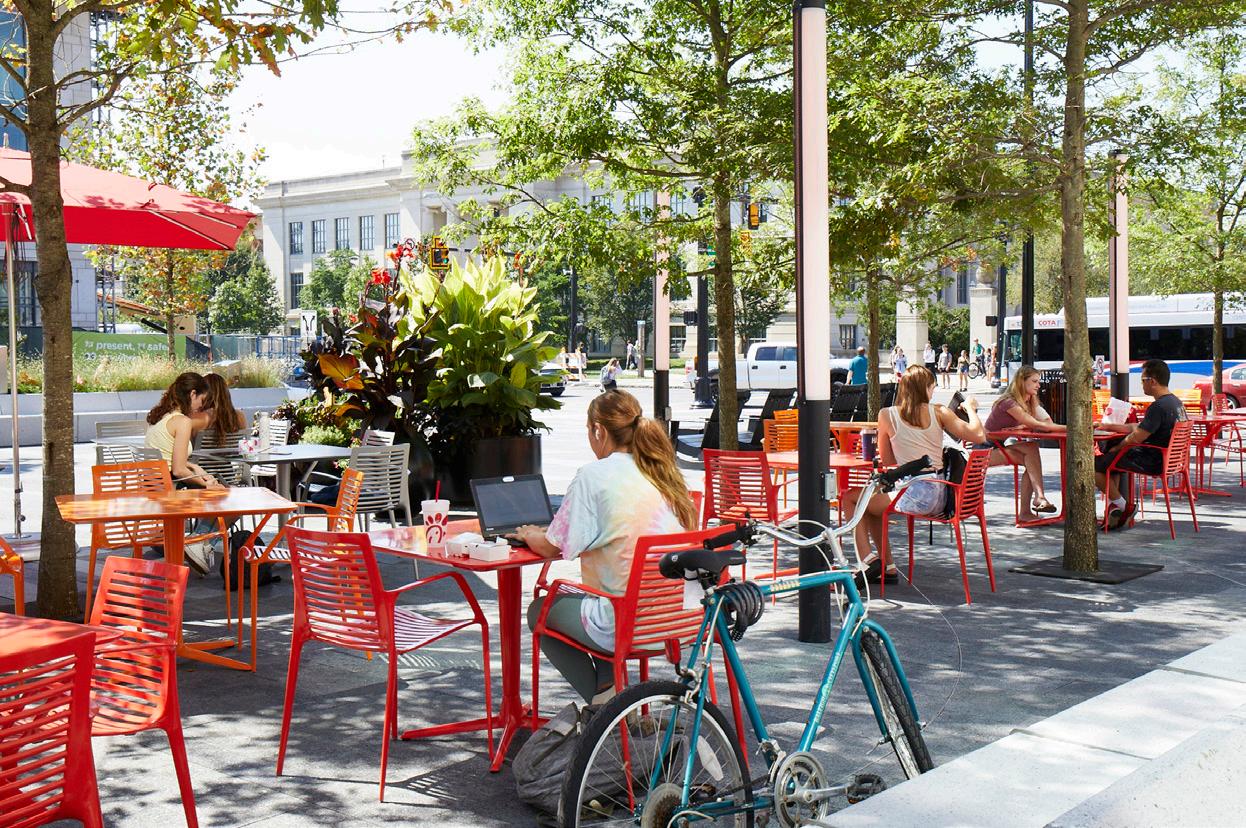
Aspects of Neighborhood Amenities in the University District 15TH & HIGH PLAZA
OLD NORTH MIX OF USES
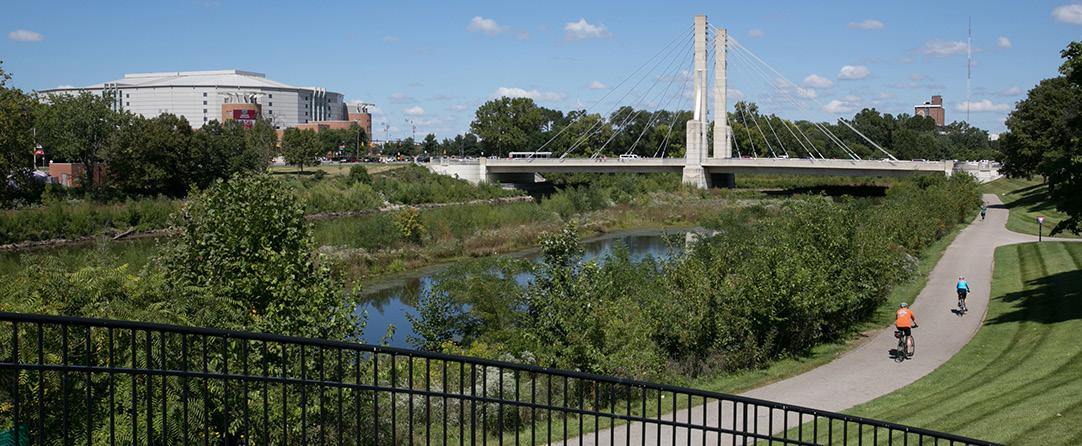
OLENTANGY RIVER TRAIL
//RATE THE FOLLOWING ASPECTS OF NEIGHBORHOOD AMENITIES IN THE UNIVERSITY DISTRICT.
Community spaces, recreational opportunities, and mix of retail and services were the lowest-rated amenities
Awful Bad Unsure/ Average Good Amazing Not Applicable
Neighborhood Parks
Shared community gathering spaces
Other recreational opportunities
Access to Trails
Retail shops or stores
Restaurants and/or bars
Services (bank, fitness, salons, etc.)
and diversity of
and
(5) Amazing — I love the quality and options!
(4) Good — There are enough quality and options (3) Unsure — I don’t necessarily find quality and options
(2) Bad — I have a hard time finding quality and options (1) Awful — I can never find quality and options! (N/A) Does not apply to me
UNIVERSITY DISTRICT 25
37%
Mix
retail
services 11% 12% 11% 2% 11% 4% 5% 6% 18% 24% 21% 10% 19% 14% 13% 16% 29% 29% 31% 22% 24% 27% 28% 32% 29% 26% 8% 24% 5% 6% 24%
6% 27% 8% 3% 26% 35% 14% 16% 6% 4% 39% 29% 13% 15% 2% 3%
Community Character & Life Aspects of Community Character & Life in the University District
In community character and life, respondents looked at architecture, the presence of community art, live music and cultural events, sports events, neighborliness, a sense of community, nightlife, restaurants and dining options.
Perceptions of tangible and intangible community assets are generally good. Home to the Ohio Stadium (Horseshoe), and a regional draw, the district is known for its nightlife, food and drink establishments, and sports events, with over 50% rating these as good and amazing.
Neighborliness and sense of community were a split ranging from good to bad. Both rated mostly as unsure (31% and 27% respectively), signaling it could be better.
In summary, results indicate an interesting perspective that the community offers activities for different lifestyles, yet feels disconnected from intangible measures of belonging and connectedness.
26 | WHAT WE LEARNED
ART BOX AT HIGH ST & 9TH
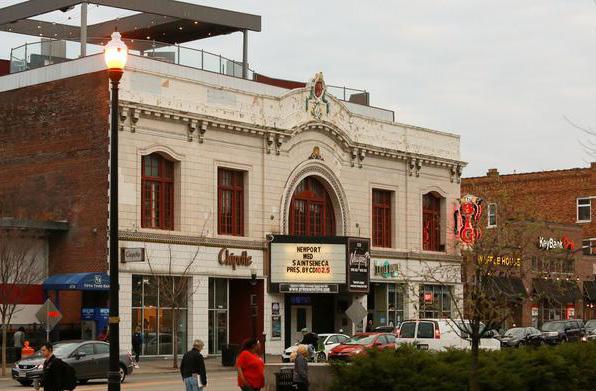
NEWPORT MUSIC HALL
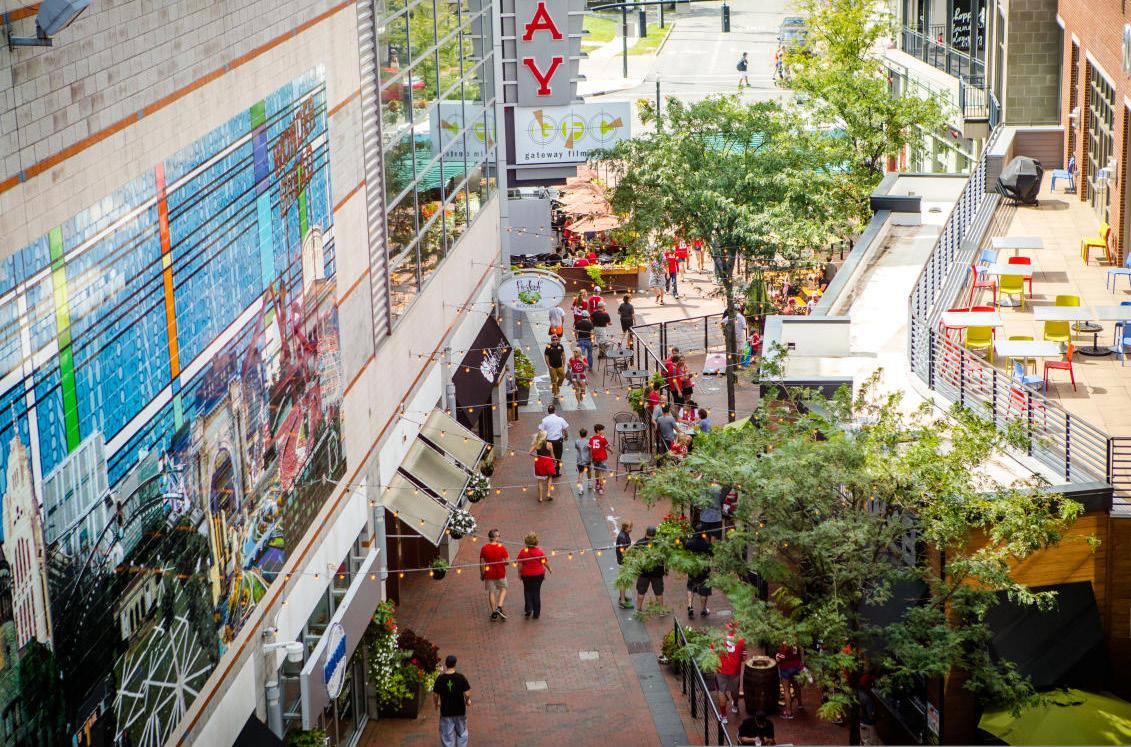
GATEWAY PLAZA
4TH STREET FARMS
//RATE THE FOLLOWING ASPECTS OF COMMUNITY CHARACTER & LIFE IN THE UNIVERSITY DISTRICT.
Neighborliness and Sense of Community are a split ranging from good to bad
>50% rated sports events, night life, and eating & dining good and amazing
(5) Amazing — I love it! (4) Good — I usually like it (3) Unsure — I kind of like it but could be better (2) Bad — There’s a lot of work to do (1) Awful — I don’t like it at all! (N/A) Does not apply to me
UNIVERSITY DISTRICT 27
13%
3%
10%
27%
20%
24% 34%
25%
29% 22%
12%
27% 33%
23%
19% 37%
Architecture Presence of Community Art Live music & Cultural Events Sports Events Neighborliness Sense of Community Nightlife Restaurants/Eating & Dining Awful Bad Unsure/ Average Good Amazing Not Applicable 8% 8% 8%
5% 5% 9%
14% 21% 19% 23% 11% 11% 19%
27% 33% 26%
17%
31%
15% 2%
10% 3%
14%
5% 4%
28%
13% 9%
11% 23% 11% 3%
Community Services
Aspects of community services included quality of schools, street character, sidewalk conditions, availability of on-street and public parking, noise, cleanliness, and feeling of safety.
Overall ratings indicate all ranges from average to bad. The high percentage of not applicable responses to the quality of schools reflects the median age (23.2)1 for this area and the college student population. Street character was a close split ranging from good (24%), average (29%), and bad (27%), and reflects attitudes based where respondents are in the district. Parking is an increasing concern across the district, with a 48% rating of bad and awful combined. A targeted parking study would inform the gap between perception and actual demand for parking.
Cleanliness, safety, noise, and sidewalk conditions are the top concerns, and in general rated over 50% as bad and awful. The ratings indicate an uneven quality of these services provided throughout the district, with some areas better served than others. Identifying and locating the problem spots is a reasonable next step to addressing perceived issues.
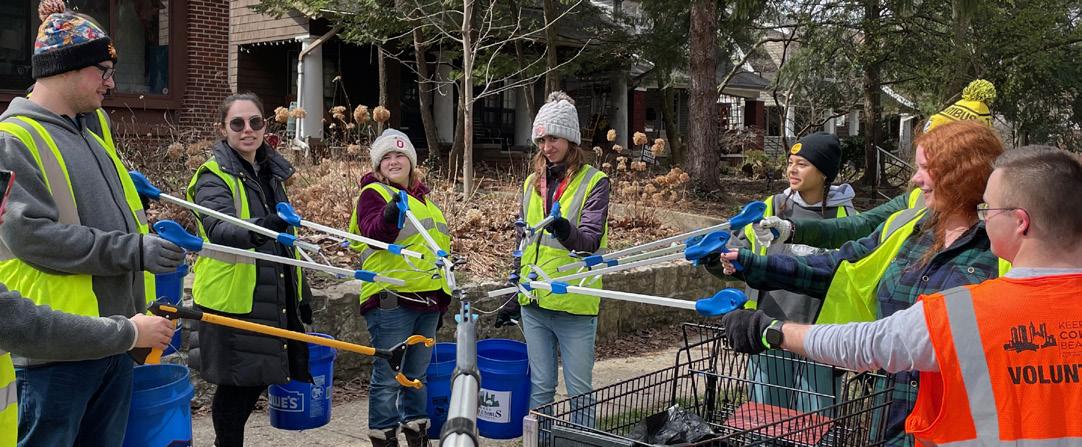
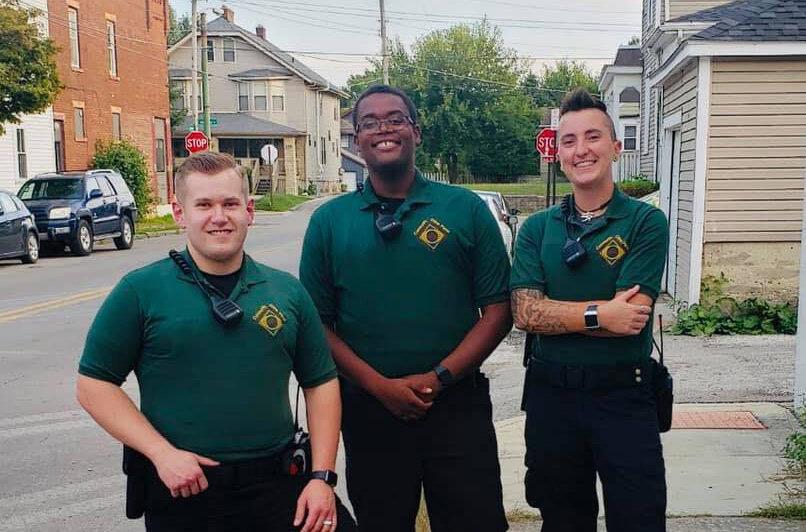
COMMUNITY CRIME PATROL
28 | WHAT WE LEARNED
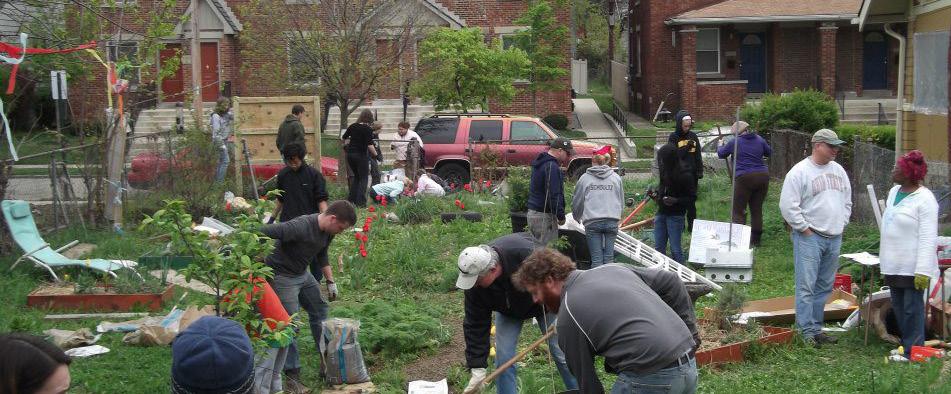
Aspects of Community Services in the University District (CCP)
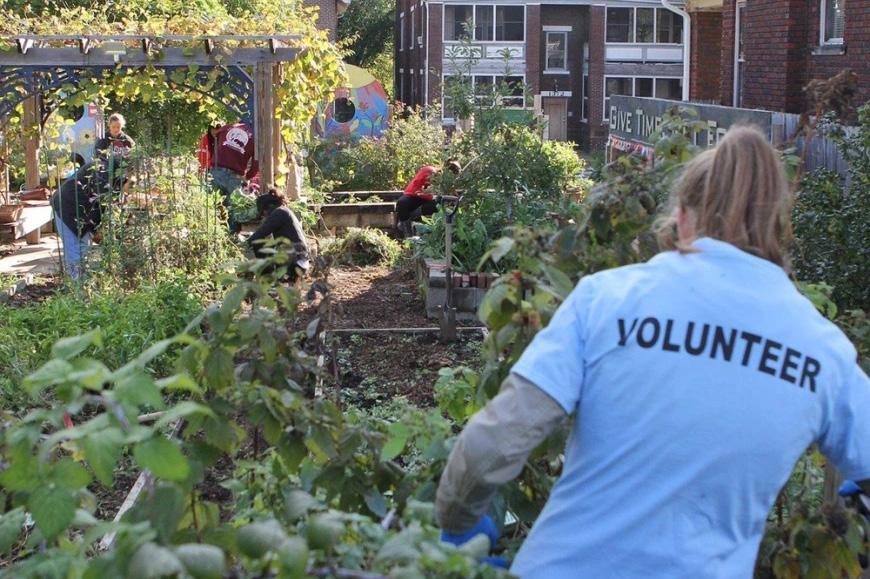
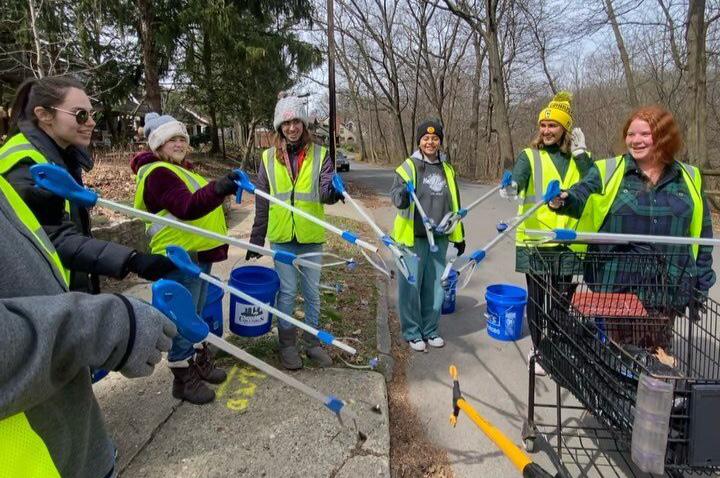
CLEAN-UP DAY
GRAHAM ELEMENTARY AND MIDDLE SCHOOL
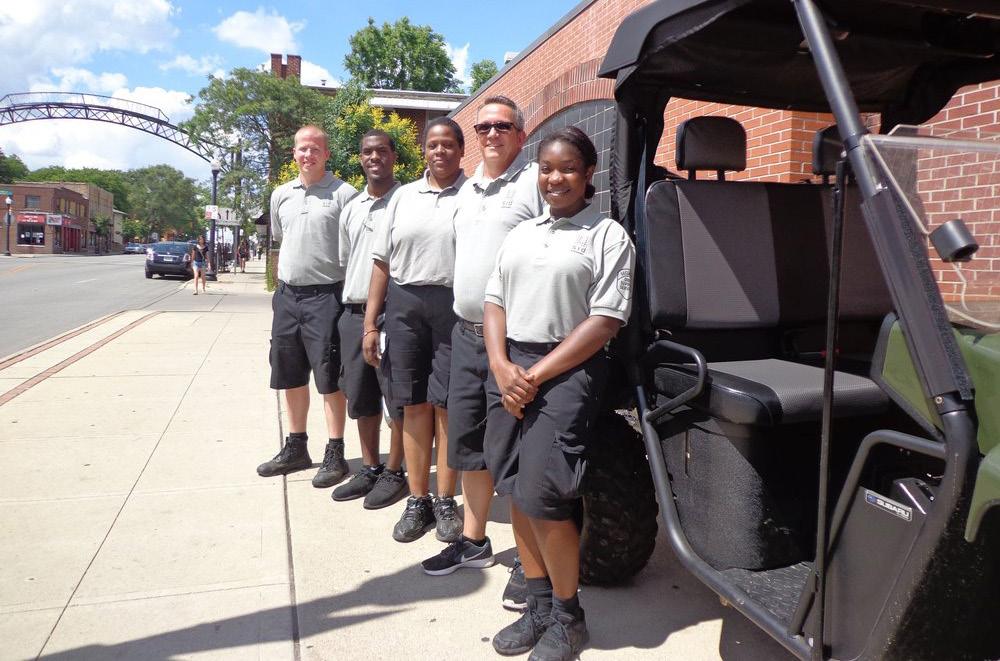
UNIVERSITY DISTRICT STEWARDS
//RATE THE FOLLOWING ASPECTS OF COMMUNITY SERVICES IN THE UNIVERSITY DISTRICT.
Cleanliness, safety, noise, and sidewalk conditions are the top concerns
Quality Schools
Street Character (Trees, Furniture, Lighting, Etc.) Availability Of OnStreet And Public Parking
Sidewalk Conditions
Noise Cleanliness
Feeling Of Safety
21% 27%
19%
19% 27% 36% 33%
27% 27%
31%
23% 29% 27% 24%
26% 26%
28%
(5) Amazing — I love it/extremely satisfied with it! (4) Good — I am usually satisfied with the level/quality (3) Unsure — I am kind of satisfied but could be better (2) Bad — There’s a lot of work to do (1) Awful — I am extremely unsatisfied! (N/A) Does not apply to me
Awful Bad Unsure/ Average Good Amazing Not Applicable 11% 14% 19% 26%
13% 8% 26% 24% 6% 1% 14% 12%
16% 15%
4% 4%
5% 4%
1% 1%
5% 1%
15% 5% 3%
UNIVERSITY DISTRICT 29
Safety
Aspects of Safety in the University District
The survey separately asked what would improve safety and what is missing in the University District. There was an overlap in the responses, indicating that what is missing in the district would help address safety issues and concerns. These three groups combine and categorize the overall community sentiment:
• Infrastructure Improvements, • Neighborhood Development, and
• Community Safety Infrastructure improvements
Walkability and multimodal transportation safety were the most frequently mentioned responses. While the University District is walkable, its current infrastructure makes active transportation unsafe. Many call for conversion of 4th and Summit to two-way traffic to alleviate excessive speeding. Slower vehicle traffic, more crosswalks, and multimodal infrastructure improve safety. Respondents call for garbage control, as excessive trash makes the area feel unsafe.
Infrastructure improvements can enhance pedestrian friendliness. Among the most critical priorities was a high demand for pedestrian-friendly amenities:
• Street furnishing including benches, lighting, transit shelters, crosswalks, and lower speed limits.
• More neighborhood green and informal gathering spaces.
• The primary infrastructure cited was lighting to address excessive dark areas, especially during winter when it gets dark earlier.
would like to have more lighting in the Northern and Southern parts of the University District (...)”
community ties, fewer transitory residents and more long-term or permanent residents of various ages would allow for relationships to form & be preserved (...)”
“A neighborhood watch would be nice, especially if it is a partnership with safety authorities. More police presence would lessen crime, but I worry about the tension and issues that could arise from more police being in this district (...) ”
30 | WHAT WE LEARNED
“Stronger
“I
UNIVERSITY DISTRICT 31 » Improved lighting » Sidewalk improvement and maintenance » Two-way conversion (e.g. along 4th St. and Summit St.) » Neighborhood block watch » Code enforcement equity » Landlord/property group accountability » Support and attract local businesses » Affordable and diversity of housing options » Community centers and public spaces » More protected crosswalks » Litter and garbage control » Slower vehicle traffic » Street furnishing » Pedestrian safety » Strategic police presence • Time of the day, such as night and early morning • Location, such as touring alleys » Representative community leadership » Resources for families and individuals FINDINGS — OPEN-ENDED QUESTIONS — INFRASTRUCTURE IMPROVEMENTS NEIGHBORHOOD DEVELOPMENT COMMUNITY SAFETY NEIGHBORHOOD DEVELOPMENT INFRASTRUCTURE IMPROVEMENTS COMMUNITY SAFETY
Neighborhood Development
A safe neighborhood is taken care of and invested in. Another layer of recommendations called for more neighborhood amenities and destinations. These included more gathering spaces, local businesses, parks, places to sit, community centers, public spaces, destinations at various hours, and representative community leadership. The district is missing affordable and middle housing, other than detached single-family and mid-rise. Respondents want resources for families and individuals to attract more long-term residents and businesses.
The maintenance of the district’s character is missing. Respondents expressed displeasure with new, modern developments that ignore the University District’s tradition. Respondents were dissatisfied with their local representation. Many wanted more than appearances from city officials, while some called for their replacement. Respondents wanted more involvement from community development partnerships with outside influence groups (e.g., Ohio State University, WOSU).
Community Safety
Most respondents agree that improved patrolling by a neighborhood or block watch is favorable and that only increasing police presence can be detrimental to safety. Respondents desire better code enforcement, especially for landlords and rental properties. Enforcement inequity cites minor infractions but allows landlords and property groups to operate without adequately maintaining their properties.
Findings on this theme were similar to what the OSU Task Force on Community Service and Well-being reported on their Campus Safety Survey.
32 | WHAT WE LEARNED
SUMMARY — CAMPUS SAFETY SURVEY — HIGHLIGHTS HIGHLIGHTS OSU Task Force on Community Service and Well-being » People feel safer oncampus regardless » of race » Primary safety concern: • Crime against people • Sexual assault/rape • Crime against property » Top 3 recommendations: • Increase quality of life in the district* • Increased police presence • Infrastructure changes * Catalyst for the BeWell project to understand what quality of life means and how to improve it for those in the university district.
“Need better code-enforcement for sidewalks and for trash”
“Support of new independent small businesses as opposed to corporate chains, preservation of existing historic structures (...), partnership with neighboring communities such as Linden and Weinland Park”
“I think Columbus in general, but especially the University District, has become more diverse. [...] There’s more and more authentic Indian food, Asian food, African food… and it’s not just these big corporate chains. That’s one of my favorite parts that creates a positive experience for me. I think the university district could capitalize on the growing diversity in the area.[...] I would like to see more of that but not just in food. I don’t think this is in the district, but Crafted Culture is a black-owned brewery and that’s awesome. We could use more Hispanic-clubs, African-clubs, Asian-clubs. More culture in bars and clubs would be incredible.”
“General cleanliness would help. Trash often blocks sidewalks forcing pedestrians into the street and the accumulation of trash gives the appearance of a neighborhood susceptible to crime.”
UNIVERSITY DISTRICT 33
Quality of Life
The survey asked respondents to indicate whether they fully considered, partially considered, or did not consider the University District a place to conduct certain activities. Most believe that the district is a place to live, work, and play/visit, with each of those questions receiving at least 64% approval. However, 51.5% do not believe that the district is a place to raise children, while only 22% agree that it is. Similarly, 57% say that the district is not a place to retire, while only 20.3% say it is. While the University District is perceived to be an excellent place to live at certain stages of life, many disagree that it is somewhere to age in place or raise a family.
The University District is most certainly a destination; 66.8% are likely to recommend visiting. While many consider the University District a place to live, only 41.3% likely recommend living in the district. Similarly, only 45.7% are likely to recommend working or starting a business in the district. 33.8% remained neutral on this question.
In two separate questions, respondents selected from a list of positive and negative words as many as they considered applied to describe the University District. Of the positive words, the University District was most described as “Diverse,” “Fun,” and “Progressive” (59%, 46%, and 41%, respectively). Of the negative words, the most used was “Dirty”, “Dangerous”, and “Expensive” (51%, 39%, 35%, respectively). It is worth noting that 17% of respondents said that none of the positive words described the district, and 11% marked that none of the negative words applied.
34 | WHAT WE LEARNED
//TOP 5 POSITIVE WORDS USED TO DESCRIBE THE DISTRICT 59% DIVERSE 46% FUN 41% PROGRESSIVE 37% ACCEPTING 31% CREATIVE 51% DIRTY 39% DANGEROUS 35% EXPENSIVE 29% OVERCROWDED 26% STRESSFUL //TOP 5 WORDS NEGATIVE USED TO DESCRIBE THE DISTRICT Environment conducive to diversity and inclusion “Dirty” stands out as the second most used word overall to describe the district
//PLEASE INDICATE IF YOU CONSIDER THE UNIVERSITY DISTRICT A ...
Place to Live Place to Work
Place to Play/Visit Place to Retire
Yes Partially No 69% 65% 66% 52% 57%
Place to Raise Children
19% 23% 23% 27% 23%
//HOW LIKELY (OR UNLIKELY) WOULD YOU…
Play/Visit
12% 12% 11% 21% 20% Live Work/ Start a Business Live in the Next 5 Years
Consider a place to live/work/play
Not necessarily a family friendly environment Recommend as a Place to Live, Work & Play
UNIVERSITY DISTRICT 35
Unlikely Neutral Likely 43% 47% 68% 42% 33% 34% 20% 27% 24% 19% 12% 31%
Guided Discussions
Aiming to reach people typically left out of the outreach process, throughout November 2021, members of the Advisory Group were asked to reach out to their individual networks and conduct informal conversations about the quality of life in the University District. The representation of this group allowed the planning team to reach residents across age groups and a range of social-economic classes in the district.
Though the majority of survey-respondents were white, as expected given the University District’s demographics, several residents expressed priority of diversity and inclusion within the guided discussions and focus groups portions of this process. In one-o-one interviews, many POC residents expressed concern in regards to the lack of diversity, lack of awareness of diversity-related issues, inequitable opportunities for people of color, and desire for the University District to capitalize on and celebrate its growing diversity.
These informative discussions were grounded in the following guiding questions and themes:
GUIDING QUESTIONS
• What do you like/works well in the University District?
• What do you dislike/does not work well in the University District?
• How to improve quality of life in the University District?
GUIDING THEMES
•
Affordable and diverse housing products
• The mix of local shops and services
• Local public transit, safe bike network, and walkability
• Shared community and gathering spaces
The critical input gathered during these advisory groupled conversations is summarized in five identified main topics:
1. Mobility & Transportation
2. Housing
3. Green & Public Spaces
4. Community & Sense of Place
5. Community & Economic Development
Almost thirty people participated in individual and group discussion. The community sentiment was recorded on each of these topics:
1. Mobility & Transportation
• Reported the overall walkability in the University District is good.
• Daytime feels different than nighttime, and the district’s sense of place could benefit from improvements to minimize crime and increase traffic safety, including better lighting, reduce curb cuts, expanded bike infrastructure, more crosswalks, and signals.
• Acknowledge biking is relatively safe, especially with bike lanes like on Summit Street, adding that protected bike lanes are positive for both cyclists and motorists.
• Complaints about access to public transit and the perception that access to parking is an issue.
2. Housing
• Expressed the need to expand and diversify the housing, offering for a broader market share, considering affordable, workforce, students, market rate, etc.
36 | WHAT WE LEARNED
• Existing housing is limited to either students or the upscale/luxury market.
3. Green & Public Spaces
• Indicated a significant need for public and open spaces such as parks, plazas, and gathering areas that would benefit walkability and the sense of place.
• It would also increase safety and sense of place with more seating areas for meeting with friends and taking a break from a walk.
4. Community & Sense of Place
• Registered the desire to maintain the character of its built environment by acknowledging, elevating, and amplifying the uniqueness of each of its thirteen neighborhoods.
• Instead of looking like any other place in town, new development should compliment and not undermine or be detrimental to those characteristics.
5. Community & Economic Development
• The overall sentiment indicates that there needs to be a balance between the vibrancy and vitality brought by new developments and all it entails and the existing socio-economic dynamic of the area.
• The district could benefit from partnerships with different stakeholders to bridge this gap and build trust to create a stronger community supporting local initiatives, minorities, and businesses.
The next pages shows a graphic visualization of the qualitative findings.
UNIVERSITY DISTRICT
“(...) The more people move into the neighborhood the more our reliance on driving is causing problems (...) Shifting people into taking the bus or walking or riding a bike makes our neighborhood safer, quieter, healthier, and can only happen if the bus is quick, convenient, and comfortable, and cycling is safe”
“Making environment more conducive to people being out and about (i.e., not only improved walkability but also a better mix of places to walk to – convenience stores & other retail shops, parks, gardens, etc.)”
“An overall negative is that there’s not a lot of people that look like me. It’s predominantly middle-to-high socioeconomic students that are White. It would be nice to see more people who look like me. The university itself feels safe, but the surrounding neighborhoods… How are we addressing safety? And I don’t just mean more police necessarily. I mean, how are we building the community in the surrounding areas? Whether it’s employment or places that are relational spaces. The farther out you get, it’s liquor shops and smoke shops more than coffee shops. Same goes for the mental health stuff. Is there a place for that for the whole community?”
“I would love to see more parks and play spaces for children. I also would like to see slower traffics and more crossing areas on some of the major streets”
38 | WHAT WE LEARNED
UNIVERSITY DISTRICT 39 FINDINGS — GUIDED DISCUSSIONS — TOPICS TOPICS Topics from guided discussions (17 Individual & group conversations) 1 Safety / crime 2 Transportation / parking 2 Green space / park / public spaces 3 Diversity / cultural events 3 Housing 4 Cleanliness 4 Local art 4 Accessibility 4 Development 4 Food / restaurants 4 Community 4 Walkability 4 Cost of living 4 Proximity to activities 4 Small business 1 = Eleven mentions ; 2 = seven mentions ; 3 = six mentions ; 4 = less than six mentions
40 | WHAT WE LEARNED CAPTION LEAD IN Caption description
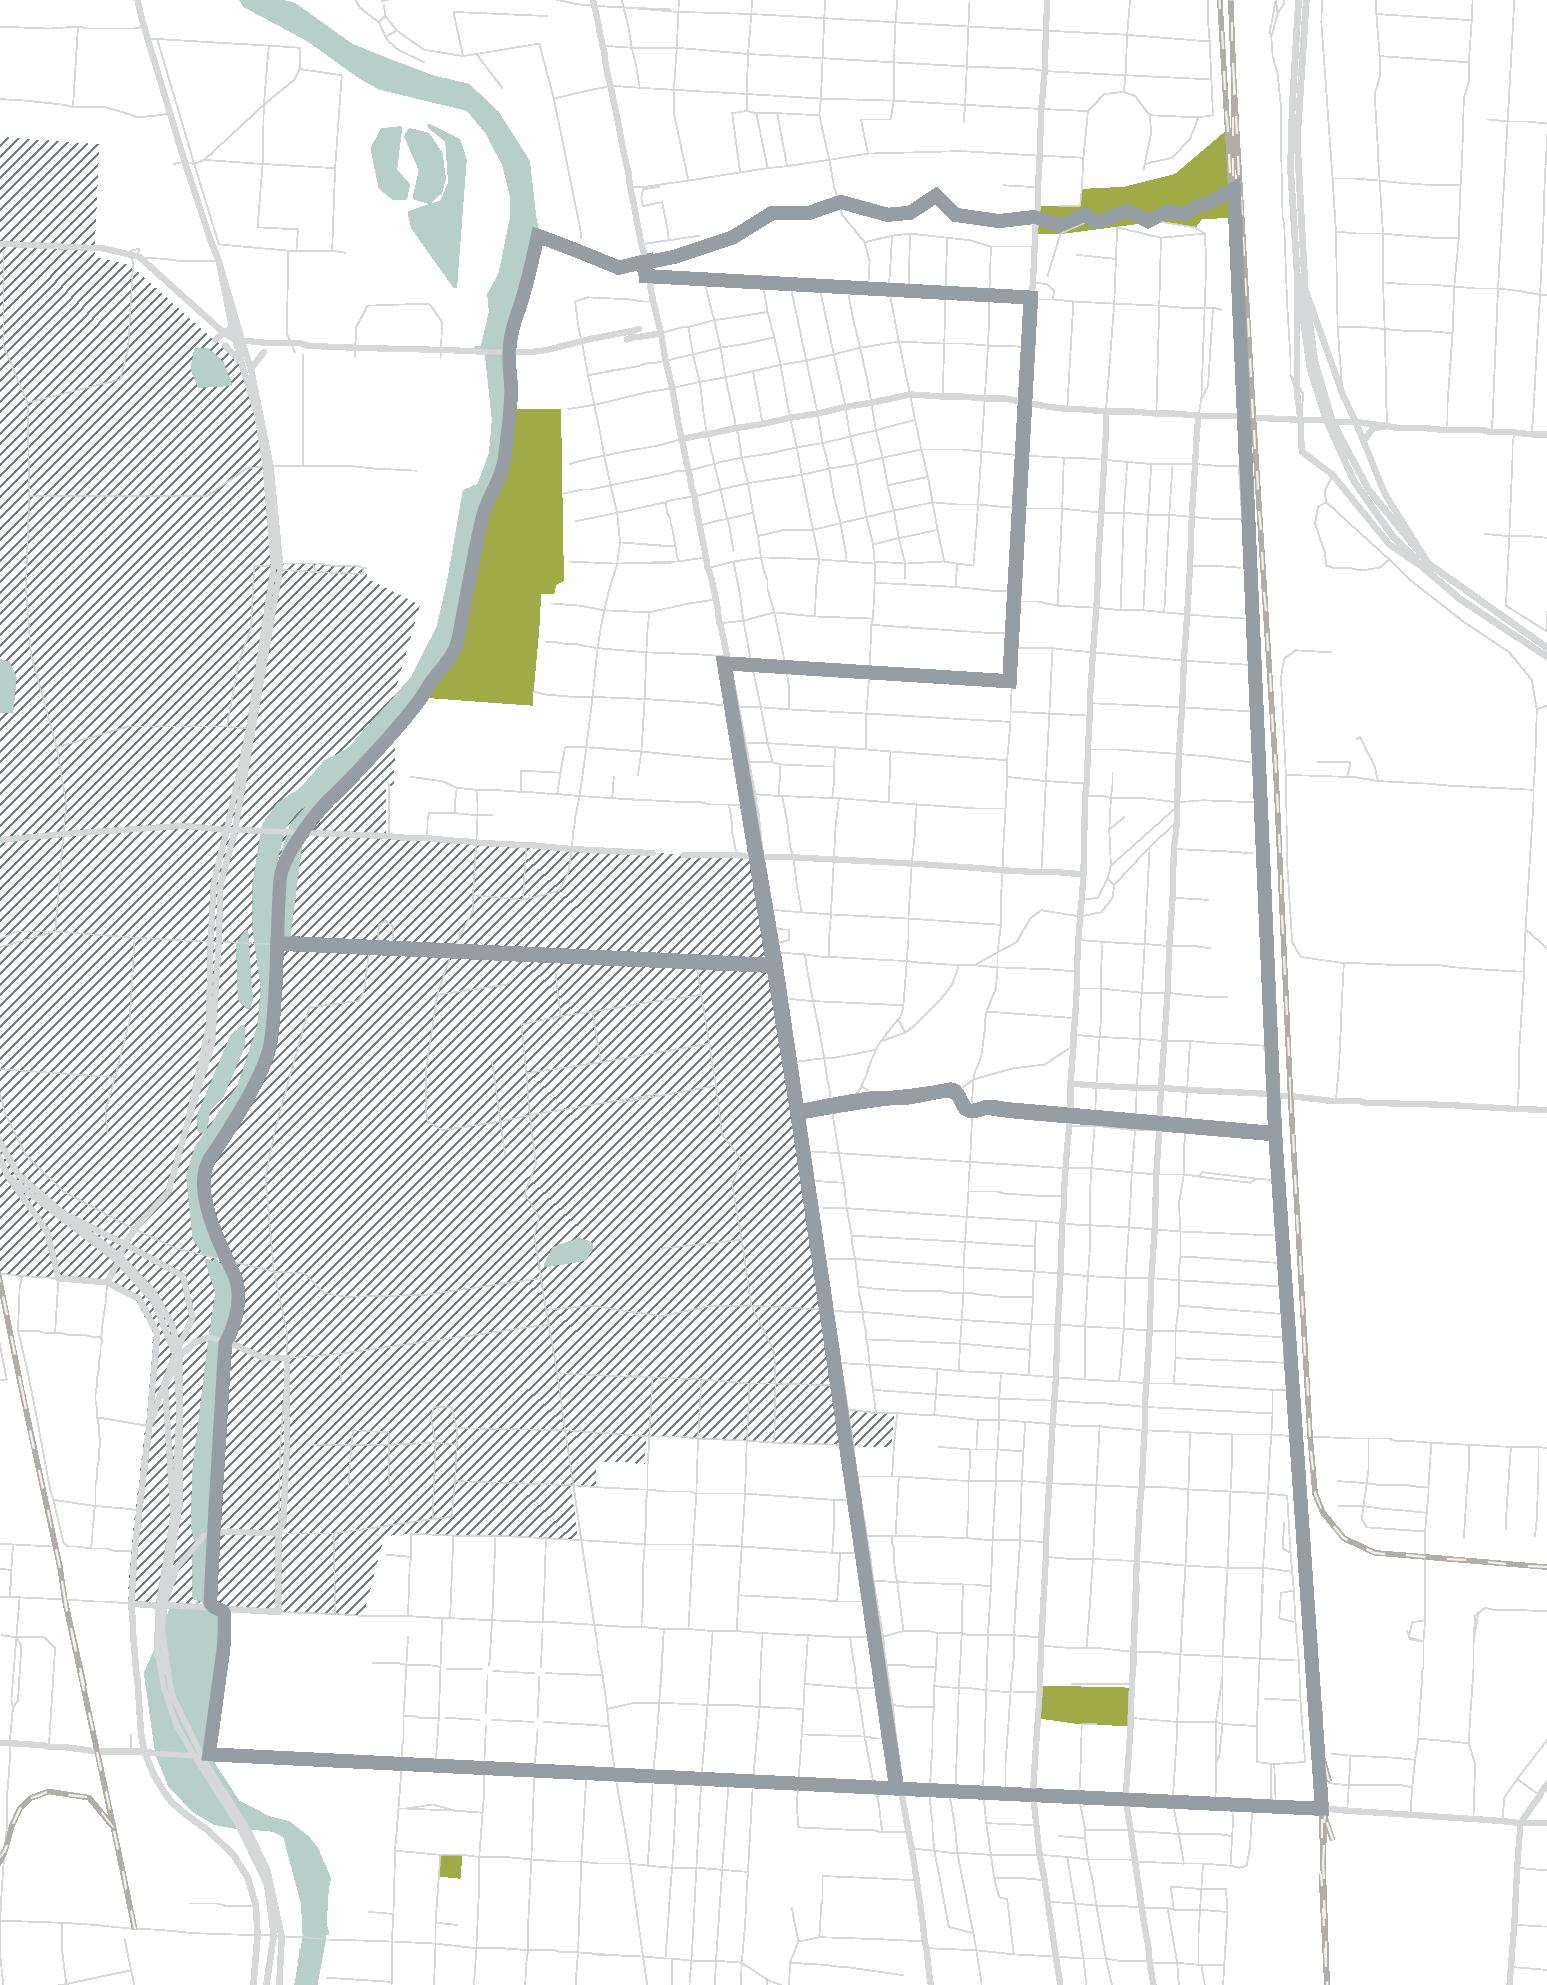
— GUIDED DISCUSSIONS — NOTABLE PLACES NOTABLE PLACES University District areas, businesses, and institutions mentioned by name. Safety / Crime Transportation / Parking Green Space / Parks, etc. Housing Food / Restaurants Proximity to Activities Small Business Staples (Outside Themes) Glen Echo Ravine DISTRICT 2 DISTRICT 4 Olentangy River Woodruff Ave Patterson Ave Arcadia Ave Indianola Av e Conrail Rai l r oad Tr acks 5th Ave H gih S t UDF CVS Kroger Positive Mostly Positive Neutral Mostly Negative Negative DISTRICT 1 DISTRICT 3 Housing (with clear water) Housing (with brown water) Evolved Glen Echo Park Maynard Park Iuka Park Target Cielo Gateway The Bottleshop Panera
FINDINGS
UNIVERSITY DISTRICT 41 KEY KEY KEY KEY FINDINGS — GUIDED DISCUSSIONS — POSITIVES POSITIVES + Walkable + Historic buildings + Aesthetically pleasing + Restaurant (lots of options) + Places to get away / nature + Youth organizations + Local art + Small businesses + Proximity (osu + clintonville + downtown) + Lots of events + Convenience + Job opportunities + Diversity + Some free parking + Coffeeshops + Voting locations Summaries of the 17 guided conversations were parsed for key ideas. Above is a list of constructive suggestions regarding the University District. MORE MENTIONS LESS MENTIONS
NEGATIVES NEGATIVES
42 | WHAT WE LEARNED CAPTION LEAD IN Caption description
— GUIDED DISCUSSIONS —
FINDINGS
– “The word average comes to mind” – Parking is very difficult – Late night parties / drunk people – Unfair equity / lack of opportunities – Cost of housing / people forced out – Road conditions (potholes, ice in winter) – Garbage on the streets & alleys – Safety concerns at night (insufficient lighting) – New development (“out of place” ; “ugly”) – Property management groups – Traffic accidents – Homeless population(“are we doing enough?) – Construction – Corporate feel – “Public transportation is a hassle” – Scooters / bikes on the street – Traffic during events – Crime Summaries of the 17 guided conversations were parsed for key ideas. Above is a list of constructive suggestions regarding the University District. MORE MENTIONS LESS MENTIONS
FINDINGS
GROUPING MENTIONS
PHYSICAL STRUCTURES
MENTIONS
SENSE OF NEIGHBORHOOD
+ Diversity
Youth Organizations
Job Opportunities
Cost of Housing / People Forced Out
Unfair equity / lack of opportunities
LIVING IN DENSITY
Homeless Population (“Are we doing enough?) – “The word average comes to mind” ^Access to Resources for Non-Students (Students have access to indoor gyms, medcal services, counseling services, community gathering spaces, etc.) ^ Better Communication between Districts ^ Connecting Students to Non-Students ^ Promotion of Events (website with info)
Events that aren’t Food or Drink-related
LOVE OF PARKS / NATURE
WALKABILITY
TRANSPORTATION
LOVE OF LOCAL
EATING
UNIVERSITY DISTRICT 43 KEY KEY KEY KEY
— GUIDED DISCUSSIONS —
GROUPING
Correlations between positives, negatives, and suggestions mentioned. + POSITIVES - NEGATIVES ^ SUGGESTIONS + Historic Buildings + Aesthetically Pleasing – New Development (“out of place” ; “ugly”) – Construction – Garbage on the Streets & Alleys – Property Management Groups ^ Improved Housing (quality and/or price) ^ Tighter Property Standards – More Art / Beautification
+ Places to get away / Nature –Tree Sanctuary / Parks / Green Spaces
+
–
^“Less
+ Local Art
Small Businesses + Coffeeshops
Corporate Feel
Chain, More Character”
+ Lots of Events + Proximity (OSU + Clintonville + Downtown) + Convenience – Traffic During Events – Late Night Parties / Drunk People – Crime
+ Walkable – Safety Concerns at Night (insufficient lighting)
+ Some Free Parking – Road Conditions (potholes, ice in winter) – Scooters / Bikes on the Street – Traffic Accidents – “Public transportation is a hassle” – Parking is Very Difficult ^ Better Streets ^ One-Way Streets into Two-Way Streets ^ More Parking (free for residents & visitors)
^
^
^
+ Restaurant (lots of options)
Healthier Food / Quality Groceries
Ethnic-specific Food, Bars, and Clubs
Food for Families / Dine-In Restaurants
+
+
–
–
–
^
Focus Groups
Throughout February 2022, the planning team held four focus group meetings that were planned to take place in each of the four area districts. Considering the CoVID-19 pandemic and an untimely spike in infection rate, meetings moved from in-person to virtual over the zoom platform. Formed by invited community members, these were small, facilitated meetings for residents and business owners from within those neighborhoods to gather place-specific feedback. More than 65 attendees participated in these area districts’ gatherings. A realtime web-based survey via zoom poll asked questions centered around the partial response to the online BeWell survey.
A summary of the key takeaways indicates that the universal concern relates to infrastructure improvements for pedestrian and cyclist mobility. It correlates to safety and neighborliness, as all groups value how walking and community spaces can bring neighbors together. Also, all recognize that policing is not the answer to better safety but that improvements to infrastructure and community-based approaches work better. In all meetings, affordability was brought up when discussing housing quality and conditions, especially in Area District 3. New development classified as affordable (80% of AMI) is not the reality in this area. Coupled with the rise in property value and as a result in property taxes, it could price people out of the neighborhoods, urging the City to implement policies to control and provide stability. Additionally, all expressed a desire for better communication and coordination from the University.
The highlights per area district are as follows:
AREA DISTRICT 1
• Neighborliness is key for this group. It’s what keeps them in the neighborhood
• Concerned about pedestrian/bike infrastructure and
Zoom poll did not capture Area District 3 responses
would like to see more crosswalks/traffic calming and sidewalk improvement
• Recognize the value of green spaces and want improvements to existing ones
AREA DISTRICT 2
• Often more concerned about their current living condition
• Would like to see home improvement programs
• Improve district walkability with better mobility and amenities
AREA DISTRICT 3
• Housing upkeep and affordability are the strongest concern
• There is a disconnect between the long term residents of this community and the market demand created by the University’s presence
• The landlords are not invested in the community, lapsing on property and sidewalk upkeep
• Concerns about community spaces and safe places for their kids
AREA DISTRICT 4
• Continue to foster and increase the sense of community and neighborliness
• Complaints about the increase in noise and nuisance as the area experiences growth
• Sidewalk improvements and traffic calming are important
• Call for landlords to be better property managers and take care of their properties
• Concern about the affordability of new housing units
The graphics on the next page show the poll results. The next pages show a graphic visualization of the qualitative findings.
44 | WHAT WE LEARNED
Woodruff Ave. 16 Ave. Patterson Ave. Arcadia Ave. Indianola
Northeast (AD2)
Northwest
Ave. High St. Southeast (AD3)
Southwest (AD4)
(AD1)
UNIVERSITY DISTRICT 45 Housing Mobility & Transportation EXISTING HOUSING UPKEEP vs. NEW HOUSING QUALITY HOW DO YOU FEEL ABOUT... HOW DO YOU FEEL ABOUT... HOW DO YOU FEEL ABOUT... PRIORITY IMPROVEMENTS AVAILABILITY & OFFERING OF... decreasing same improving Not Neighborly Not Clean Not Quiet Not Safe Lacking Somewhat Somewhat Clean Somewhat Quiet Somewhat Safe Some Very Neighborly Clean Quiet Safe Strong Available Available Somewhat a Good Mix Just the Right Mix Not Available Not Available Somewhat Somewhat Neighborhood Amenities Community Character & Life Community Services Safety Overall quality of new development is improving. Stronger support for either a community base approach or infrastructure improvements WALKABILITY University District vs. Area District UD UD UD AD1 AD2 AD4 same Less Walkable More Walkable Neighborliness Cleanliness Noise Sense of Community Roadway Maintenance and Improvements Public Transportation Sidewalk Maintenance and Improvements Public Transportation Bike Infrastructure Community Spaces Safety Infrastructure Improvements Community Based Approach Policing Recreational Opportunities Mix of Retail & Services There is an overall sense of neighborliness within all 3 districts. But less so in AD1 Southwest AD4 noted the strongest sense of community followed by AD2 Northwest is better served of community spaces and recreational opportunities ... but the least mix of retail and services Overall concern with cleanliness Southwest area feels quieter
46 | WHAT WE LEARNED FINDINGS — FOCUS GROUPS —
IN HOUSING TOPICS IN HOUSING Top 4 common mentions between all focus groups 1 Housing is not affordable 2 Quality of housing is increasing 3 Unresponsive/unsatisfactory landlords 3 Want down-payment assistance 4 Skeptical of new development 4 People have been displaced 4 Want more landlord responsibility - Prices rise while quality of housing remains the same - Quality of housing is decreasing - Houses are good quality - Want better city regulations - Want subsidized, affordable housing - Want more renter responsibility - Houses are poor quality - New development is pushing landlords off campus - Historical district zoning - Balancing student-renter needs & renter-resident needs 1 = eleven mentions ; 2 = seven mentions ; 3 = five mentions ; 4 = three mentions
TOPICS
- Trash / smells / litter (issues with walkability)
- Bike lane viewed positively and/or used regularly
- Bike lane viewed negatively
- More parking needed
- People don’t abide by traffic rules
- More bike lanes
- Insufficient traffic signage (e.G. On summit)
- Walkability between amenities
- Suggestion: pedestrian bridges over high street
- Accessibility concerns
- Want connection between walkability + public transportation
- Want better public transit
- Safety concerns with parking lots
- Insufficient set-back between sidewalk and road
- Want more speed limit signs
- Overgrown shrubs (issue with walkability)
- Frequent traffic accidents (issue with driving)
- Want lowered speed limits (i.E. Successful results with lane ave)
UNIVERSITY DISTRICT 47
— FOCUS GROUPS —
4
mentions
1 Poor condition of sidewalks (issue with
2 Many options within walking distance 2 Want better infrastructure (walking / biking) 3 Want snow / ice removal (issue with walkability) 3 Want more streetlights 4
(issue
FINDINGS
TOPICS IN MOBILITY & TRANSPORTATION TOPICS IN MOBILITY & TRANSPORTATION Top
common
between all focus groups
walkability)
Frequent traffic accidents
with walkability)
1 = eight mentions ; 2 = six mentions ; 3 = five mentions ; 4 = four mentions
48 | WHAT WE LEARNED FINDINGS — FOCUS GROUPS — TOPICS IN NEIGHBORHOOD AMENITIES TOPICS IN NEIGHBORHOOD AMENITIES Top 4 Common Mentions Between All Focus Groups 1 Want More Parks 1 Want Community Gathering Spaces 2 Want a Mix of Businesses 3 Iuka Ravine 3 Tuttle Park 3 Want Practical, Affordable Amenities 4 Glen Echo Ravine 4 Olentangy Trail 4 Want “Third Space” (e.g. Coffee Houses) - Retail at Summit & Hudson - Vacancy Spots (e.g. Near Tompkins & Summit) - Lots of OSU events - Maynard Park - Olentangy River - Community Gardens Function like Pocket Parks - Want More Advertising of Existing Parks - Repurposing Existing Buildings - Want Flexible Amenities - Want More Parks & Recreation (budget) - Want More Racial Representation in Discussions 1 = five mentions ; 2 = four mentions ; 3 = three mentions ; 4 = two mentions
UNIVERSITY DISTRICT 49 FINDINGS — FOCUS GROUPS — TOPICS IN COMMUNITY CHARACTER & LIFE TOPICS IN COMMUNITY CHARACTER & LIFE Top 3 Common Mentions Between All Focus Groups 1 Want a Sense of Community 1 Sense of Neighborhood Varies (Year-to-Year) 1 Owner-occupied vs. Renter for Upkeep (Pattern: Owner-Occupied = More Upkeep & Renter = Less Upkeep) 1 Neighbors are Neighborly 1 Long-term residents = More Neighborly 1 Red Solo Cup Culture 2 Sense of Neighborhood 2 Different Types of People 3 Different Types of Housing 1 = three mentions ; 2 = two mentions ; 3 = one mention
50 | WHAT WE LEARNED FINDINGS — FOCUS GROUPS — TOPICS IN COMMUNITY SERVICES TOPICS IN COMMUNITY SERVICES Top 3 Common Mentions Between All Focus Groups 1 Issues with Pet-owners (Not Picking Up Dog Poop) 2 Some Community Clean-Up 2 Some Community Beautification 2 Issues with Bulk Furniture in Alleys 2 OSU Move-Out week (Excess Trash & Furniture) 3 Unaware of Move-In / Move-Out Events 3 Issues with Noise 3 Concern with CPD Helicopter Patrols 1 = three mentions ; 2 = two mentions ; 3 = one mention
UNIVERSITY DISTRICT 51 FINDINGS — FOCUS GROUPS — 1 = three mentions ; 2 = two mentions ; 3 = one mention TOPICS IN SAFETY TOPICS IN SAFETY Top 4 Common Mentions Between All Focus Groups 1 No Longer/Not Feeling Safe at Night 2 Columbus Police + Social Workers Partnering for Mental Health Crises 2 Want Holistic Approaches to Safety (Not Just Better Lighting) 3 Crime Rates have Gotten Higher 3 Crime Rates have Gotten Lower 3 Mental Health Training for Police 3 “I feel safe and secure” 3 Bring Safety Initiatives Back 3 More Frequent Trash Pick-Up Needed 3 More Recycling Bins Needed
Prioritization Exercise
The six themes structuring this survey are interconnected. Investments focused on any one theme will have a ripple effect on the others, as illustrated in the diagrams to the right. The information presented on the next page is the ten key takeaways after collecting, compiling, and analyzing all responses and discussions from all the different types of engagements during the entire planning process. These brief statements are a high-level summary of the community sentiment that carries a wealth of insight beneath them. As key takeaways, they help to create a framework that can utilize the survey results to inform and strategize toward a better quality of life for the community.
The planning team conducted one last round of meetings. Attendees were invited to participate in a final interactive presentation. This was an opportunity to help prioritize the six guiding themes on how they impact their quality of life in the district. It was also an opportunity to rank the ten key takeaways on their level of importance in receiving investments. Lastly, participants were given an open-ended prompt to discuss any priorities that were missed by the ten takeaways. A total of 59 University District members participated in the Prioritization Exercise. Each Area District met at the Neighborhood Design Center office in a hybrid meeting. A combined meeting occurred during the monthly University Area Commission meeting at the Northwood High Building. Another exercise was conducted with the advisory group. These results are described on the next page.
Meetings Schedule:
• Area District 3: August 4th, 2022
• Area District 2: August 6th, 2022
• Area District 4: August 9th, 2022
• Area District 1: August 16th, 2022
• University Area Commission: September 16th, 2022
52 | WHAT WE LEARNED
Housing ieNhg b o r hoodAmenities Mobility &Transp o r noitat Community S a f e yt Communi t y retcarahC & efiL inummoC t y S ervices
Housing ieNhg b o r hoodAmenities Mobility &Transp o r noitat Community S a f e yt inummoC t y S ervices Communi t y retcarahC & efiL
10 Key Takeaways
Embrace diversity and bridge cultural and social gaps in the district
Strengthen the sense of belonging and welcoming, including short-term residents
Create opportunities for neighbors to meet and engage in the community
Provide a suite of resources and development tools to homeowners and invested property owners
Work with landowners and developers to preserve architecture character and uniqueness of the many neighborhoods in the district Identify areas and work with community partners to address cleanliness and noise
Provide the necessary infrastructure to strengthen walkability and pedestrian safety
Provide and connect the community to gathering and other recreational opportunities
Attract and retain local shops and services geared towards the diverse audience in the University District
Implement a holistic approach to community safety
UNIVERSITY DISTRICT 53
dAmenities
hrobhgieN
Housing
Regarding the six themes that influence quality of life, respondents ranked Housing the highest with a mean score of 4.2 out of 5. This was followed by Community Safety (4.1) and Mobility & Transportation (3.8). Neighborhood Amenities was ranked as having the lowest impact on quality of life with an average score of 2.8.
Without a doubt, the highest ranked priority of the ten takeaways is “Provide the necessary infrastructure to strengthen walkability and pedestrian safety” with an average score of 7.78 out of 10. “Implement a holistic approach to community safety” follows up with a 7.12 average score. The rest of the ten takeaways fall around an average of 6.24. “Provide and connect the community to gathering and other recreational opportunities” is the lowest priority, with an average score of 4.88.
An analysis of open-ended responses was conducted for anything that was indicated as a Missing Priority. Many of these are similar to or fall within the six themes of quality of life mentioned earlier. For example, “housing” was the most frequently mentioned priority with 11 mentions, while “affordable” was mentioned another 5 times. There is a need for more public infrastructure, especially for children. Among the top ten most mentioned words are “school”, “children”, and “age”. Another highly mentioned topic is the inclusion of neighborhood amenities such as street trees, trash receptacles, parks, and lighting.
It becomes clear that mobility and safety are high priorities and lead to better quality of life outcomes for University District residents. These work in tandem with interventions related to walkability, equitable mobility, and reductions in traffic violence. Affordable housing is also at the forefront of University District priorities. Respondents are also concerned about improved public infrastructure, cleanliness and noise, and developing a strong sense of community.
54 | WHAT WE LEARNED SUMMARY What priorities are missing? » Schools and amenities for school-age residents » Public Infrastructure: • Street trees • Sidewalks, crosswalks, lighting • Parks » Dignified affordable housing options » Noise control and cleanliness
o o
liboM i t y &Transportation Community S
Communit
S
Communi t y retcarahC efiL& FINDINGS — PRIORITIZATION EXERCISE —
//RANK THEMES AS THEY IMPACT QUALITY OF LIFE IMPACT
a ytef
y
secivre
SUMMARY
“Treescape, internet connectivity, and affordable housing”
LOW (01) TO HIGH (10)
Embrace diversity and bridge cultural and social gaps in the district Strengthen the sense of belonging and welcoming, including short-term residents
DIVERSITY BELONGING
“genuinely affordable housing not the “affordable” housing standards”
“Promoting our new educational opportunities for school age children.”
“Schools are a major issue. Often, families with small children either move when their kids reach school age or send them to private schools.”
Create opportunities for neighbors to meet and engage in the community
NEIGHBORS
Provide a suite of resources and development tools to homeowners and invested property owners
HOUSING TOOLKIT CHARACTER
Work with landowners and developers to preserve architecture character and uniqueness of the many neighborhoods in the district
Provide the necessary infrastructure to strengthen walkability and pedestrian safety
NON-MOTORIZED MOBILITY NOISE & CLEANLINESS
Identify areas and work with community partners to address cleanliness and noise
Provide and connect the community to gathering and other recreational opportunities
THIRD PLACES
Attract and retain local shops and services geared towards the diverse audience in the University District
LOCAL BUSINESSES SAFETY
6.6 6.4 6.1 5.8 6.1 7.8 6.4 4.9 6.3 7.1
Implement a holistic approach to community safety
UNIVERSITY DISTRICT 55
//PRIORITIZE INVESTMENTS FROM
SECTION 4 PATHWAY TO ALL BE WELL
Next Steps
This effort of uncovering what quality of life means for the University District community was centered around their level of satisfaction, access, perception, and overall feeling of belonging as it relates to the six main themes of this survey – housing, mobility & transportation, neighborhood amenities, community character & life, community services, and community safety. What we learned is that the University District community is an eclectic cultural hub for Columbus. All its occupants, stable and transient alike, create an environment that invites diverse opportunities for living, growing, and bonding. It’s no surprise that increasing population and investment comes to this area and it is not immune to local and broader issues.
University District residents know that a walkable and multimodal neighborhood supports a safer and stronger community. While community safety is on most minds, desired solutions frequently point to addressing responsible property owners supplemented by a community block watch. What does better community development look like to the respondents? Gathering spaces, resources for families and individuals, and accountability from outside representatives and partners lead to better neighborliness and better outcomes for all.
This effort was just a first step in assessing and learning from residents and visitors to identify common values to strengthen the uniqueness of each neighborhood as it comes together to form a single community.
The responses, opinions, and recommendations from the community members are vital for guiding policy and partnerships both in the near and long-term future. Their concerns must be earnestly addressed. Their hopes must be brought to reality. For the quality of life to improve, stakeholders must take a multifaceted approach to not only attending to these issues but resolving them.
Often, there is a misunderstanding of the community’s composition. Namely, the District may be fragmented by the unstable student population and the long-term residents. Perceptions of the area differ and are often influenced by the other group. A collaborative effort is required for the District to achieve the goals referenced in this report.
The next three items are intended to continue this conversation:
»
“Know Your Neighbors” Case Study
» Preliminary Initiative Ideas
» Suggested Next Steps
57 UNIVERSITY DISTRICT
“If one can tolerate a certain untidiness in the environment the vitality that you get is good for stability”
Denise Scott Brown
“Know Your Neighbor” Case Study
Recently featured in the community newspaper The Land, which serves the Cleveland neighborhoods, this case study provides some pause for thought. There are lessons to learn in addressing some of the wellknown divides between the University Circle and the communities around it. The planning team suggested that OSU invites the students who formed it to share their experiences.
Preliminary Initiative Ideas
The graphic visualization shows a high level initiative ideas. These are responding to the negatives, positives, and suggestions originated from the guided discussion. But also applies to what we heard during the focus groups and open-ended questions responses. The topics covered includes:
» Physical structures
» Living in density
» Walkability
» Transportation » Sense of Neighborhood
» Love of Parks and Nature
» Love of Local
» Eating
Suggested Next Steps
Looking forward to ensure the conversation about quality of life in the University District continues, the planning team suggests three sets of next steps. Immediate next steps focus on disseminating the survey responses and incorporating the ten key takeaways in the UDO Strategic Plan. The intermediate next steps focus on identifying local leadership and creating participatory opportunities to improve each area district. Lastly, the long-term vision is to foster and strengthen relationships to build one single University District.
58 | WHAT WE LEARNED
KNOW YOUR NEIGHBORS
Cleveland, OH
There is a disconnect between students at Case Western Reserve University (CWRU) and adjacent Glenville and East Cleveland residents. Often, perceptions of an unsafe environment prompt CWRU students to avoid engaging with the nearby community. When encouraged to stay within the “Case Bubble,” students miss opportunities to be part of their neighbors’ local businesses and culture. Community activist and student Delaney Jones sought to dismantle the divide. Jones created a student-led initiative at CWRU called Know Your Neighbors. The organization seeks to build community and develop positive relationships between CWRU and its neighbors. The organization hopes to make positive changes in campus culture, race relations, safety, networking, and neighborliness. Breaking down stereotypes is the way to diminish the effects of the Case Bubble and introduce the transient student community to the surrounding long-term residents.
The effort is a partnership between the organization and the Office of Local Government and Community Relations at CWRU. There, they receive guidance and support for various events. These include dialogue series, inviting residents to guest lecture in their areas of expertise, developing a buddy system between students and residents, and social media initiatives. Internally,
Know Your Neighbors is working to create a task force to guide CWRU student representatives on how to communicate with students about the neighborhood. This effort attacks the negative perceptions of adjacent communities that were often passed on from representatives like orientation leaders and tour guides.
Know Your Neighbors isn’t alone. The student advocacy has further moved the university to act on its approaches to improved community relations. The East Cleveland Partnership, led by CWRU and University Circle institutions, set out redevelopment efforts to secure appropriate neighborhood rehabilitation funds. Other community networks have been spurred into more action. The CWRU Community Innovation Network offers community-building training to local residents. A Neighborhood Advocacy Council with stipends for community members was established.
While Know Your Neighbors is just getting started, Delaney Jones’ efforts are making tremendous progress toward erasing the stereotypes that divide people on either side of the rail bridge between East 120th and East 118th Streets. Instead, Know Your Neighbors will soon build bridges to connect students and neighbors. Together, these efforts can improve the community for all.
UNIVERSITY DISTRICT 59
KNOW YOUR NEIGHBORS Glenville Neighborhood Exhibition. Photo: Delaney Jones.
OF PARKS / NATURE
60 | WHAT WE LEARNED
INITIATIVE IDEAS INITIATIVE IDEAS Ideas for Initiatives based on the positives, negatives, and suggestions mentioned. + Historic Buildings + Aesthetically Pleasing – New Development (“out of place” ; “ugly”) – Construction – Garbage on the Streets & Alleys – Property Management Groups ^ Improved Housing (quality and/or price) ^ Tighter Property Standards – More Art / Beautification
+ Places to get away / Nature –Tree Sanctuary / Parks / Green Spaces
+ Local Art + Small Businesses + Coffee shops – Corporate Feel ^“Less Chain, More Character” LOVE
LOCAL + Lots of Events + Proximity (OSU + Clintonville + Downtown) + Convenience – Traffic During Events – Late Night Parties / Drunk People – Crime LIVING IN
+ Walkable – Safety Concerns at Night (insufficient lighting) WALKABILITY + Some Free Parking – Road Conditions (potholes, ice in winter) – Scooters / Bikes on the Street – Traffic Accidents – “Public transportation is a hassle” – Parking is Very Difficult ^ Better Streets ^ One-Way Streets into Two-Way Streets ^ More Parking (free for residents & visitors) TRANSPORTATION + Restaurant (lots of options) ^ Healthier Food / Quality Groceries ^ Ethnic-specific Food, Bars, and Clubs ^ Food for Families / Dine-In Restaurants EATING + Diversity + Youth Organizations + Job Opportunities – Cost of Housing / People Forced Out – Unfair equity / lack of opportunities – Homeless Population (“Are we doing enough?) – “The word average comes to mind” ^Access to Resources for Non-Students (Students have access to indoor gyms, medical services, counseling services, community gathering spaces, etc.) ^ Better Communication between Districts ^ Connecting Students to Non-Students ^ Promotion of Events (website with info) ^ Events that aren’t Food or Drink-related
NEIGHBORHOOD COMMUNITY ART BY COMMUNITY ARTISTS ORGANIZED BEAUTIFICATION PREPARING & RECOVERING FROM EVENTS CONNECTING RESIDENTS TO HELP ATTENTION TO MAINTENANCE ADDRESSING ROAD SAFETY ADDRESSING PARKING ACCESS TO JOBS & RECREATION CREATING COMMUNITY PROMOTING EVENTS PROMOTING PARKS & GREEN SPACES MAINTAINING / PROTECTING SUPPORTING LOCAL CREATIVELY SUPPORTING MINORITY BUSINESSES QUALITY TIME SHARING QUALITY FOOD Initiative Ideas Inspired by the Positives, Negatives, and Suggestions Mentioned.
PRELIMINARY
PHYSICAL STRUCTURES
LOVE
OF
DENSITY
SENSE OF
SUGGESTED
NEXT STEPS NEXT STEPS
Immediate / Intermediate / Long-Term
Immediate Next Steps
Disseminate report findings
Translate findings into infographics and/or sharable deck
UDO Strategic Plan
Intermediate Steps
Create participatory design opportunities
Identify community leaders for each of the 4 area districts
Identify projects to pursue from findings
Long-Term Vision
Build relationships to bring all four area district together to form a one single university district
Empower each district to start and maintain projects for improvement
UNIVERSITY DISTRICT 61