Logistics & Transport

Laying the groundwork for future transport infrastructure
Twenty aerial urban cable car transport links identified in new report
Chain of Responsibility in road freight transport


Laying the groundwork for future transport infrastructure
Twenty aerial urban cable car transport links identified in new report
Chain of Responsibility in road freight transport


The Coalition Government was elected on a mandate to get our country back on track, and I was pleased to become the Minister of Transport in November last year.
I believe effective, efficient, and reliable transport networks are pivotal in unlocking New Zealand’s economic potential and enhancing our quality of life. Our communities depend on these transport networks every day to get to work, school, visit family and friends, and travel around New Zealand.
Holding the Transport portfolio is a privilege and a responsibility I take very seriously. It also comes with a number of challenges apparent every day in the pothole-stricken roads, congestion in our city centres, and maintenance of core infrastructure not keeping up.
As part of our Coalition Government’s 100-day plan, I have released a new draft Government Policy Statement (GPS) on Land Transport.
This GPS is not just a document; it's a blueprint for refocusing New Zealand’s transport agencies, and our wider partners, on our priorities: building and maintaining the roading network to support economic growth, reliable public transport, and delivering a safe network that makes efficient use of every dollar spent.
Whether you travel by bus, coach, or private vehicle in New Zealand, it is essential that our roading network is fit for purpose for all users. Our Roads of National Significance are back on the agenda, underscoring our commitment to critical infrastructure that supports economic growth and regional development. And our directive to refocus the NZ Transport Agency is clear: we are prioritising projects that deliver real value to commuters and businesses alike, ensuring that our cities and regions are wellconnected and that our economy thrives.
As the Minister for Transport, I’m determined to provide the leadership and direction necessary to help ensure we focus on these
priorities. We are moving away from the previous government’s untargeted approach to a targeted strategy that addresses the core needs of our transport network.
Our transport strategy encompasses a broad pipeline of work, focusing on both immediate improvements and long-term developments. Maintenance and fixing potholes are immediate priorities, ensuring that our roads are safe and reliable. But our vision extends far beyond these basics. We are laying the groundwork for a future where transport infrastructure supports and enhances our way of life, rather than detracts from it.
I’ll be shifting our focus for transport investment from the current narrow, three-year, short-term thinking, to a more ambitious and aspirational 10-year framework. This will help give certainty and stability to our delivery partners both in the local government and construction sectors.
In the public transport space, I want to see an effective, regular, and reliable network that provides users with more choices and helps to reduce travel times, congestion, and emissions.
I want to focus on ensuring we are getting value for money in our investment in public transport services. I also want to ensure closer alignment between urban development and housing growth –particularly in Auckland – as this will allow for increased public transport choice, building on the investment already made in the City Rail Link. This approach will unlock more housing opportunities along key roading and rail corridors.
We will focus our transport goals for Auckland through the Auckland Rapid Transit Network, which includes completing the Eastern Busway and Reeves Road Flyover, North-West Rapid Transit, and the Airport to Botany Busway.

In Wellington, we will continue to support replacing rolling stock as part of the Lower North Island Rail Integrated Mobility programme. This will enhance regional connectivity, providing a more resilient transport network for the Lower North Island
We are also discussing the North-South, EastWest, and Harbour Quays’ bus corridor projects with councils. These projects could complement our investment in the Basin Reserve and the additional Mt Victoria tunnel.
At the heart of our transport policy is also the investment in infrastructure that meets today's needs and anticipates those of tomorrow. But to do this, we need to be open to alternative ways of funding and financing infrastructure.
The Government is looking at a holistic approach to the delivery of transport infrastructure, combining traditional and innovative funding and financing models to ensure sustainable and effective project delivery.
We are a government that is open to road pricing – both tolling and time of use charging. We are committed to working with councils to deliver a time of use charging framework that will improve travel times and network efficiency in our city.
Another critical enabler of delivering transport infrastructure is leveraging private sector involvement in project development. This promises to bring about a new era of efficiency and innovation in how we build and maintain our transport network.
The Government will establish a new National Infrastructure Agency to connect local and offshore investors to transport projects, including our new Roads of National Significance and major public transport infrastructure projects. Options for alternative funding and financing arrangements should be considered for all major new infrastructure projects.
Infrastructure Minister Chris Bishop is working hard alongside other Ministers to get this key agency set up so it can work closely with our infrastructure delivery agencies, including the NZ Transport Agency.
Work is also underway to fast-track consents, which have previously been a longstanding issue in delaying the delivery of projects. Fast tracking consents is a significant step change that will provide certainty and confidence to the sector, enabling it to invest in the capacity and capability needed to deliver these infrastructure projects.
City and regional deals will see central and local government taking a more collaborative approach to high-impact infrastructure projects, with each deal tailored to the needs of cities and regions.
I look forward to sharing more details as our city and regional deals policy is refined and made ready, so we can begin a new set of positive discussions with the sector about the way forward.
Addressing New Zealand’s infrastructure deficit is key to unlocking economic development and building greater opportunities for our communities.
This Government is all about delivery. We are committed to not just planning but executing these plans to bring about real, positive change across New Zealand. The challenges we face are significant, but we are up for it. We are making the tough calls, prioritising the well-being of our communities, and focusing on long-term solutions to deliver economic growth and prosperity.
Another critical enabler of delivering transport infrastructure is leveraging private sector involvement in project development. This promises to bring about a new era of efficiency and innovation in how we build and maintain our transport network.
Cyclone Gabrielle showed how vulnerable New Zealand is to extreme weather events and it is imperative we build back smarter and invest in infrastructure that serves future generations.
It’s clear the regions will be more affected by extreme weather events in future and the government’s regional infrastructure investments to mitigate the effects of these weather events have proven their worth across the country.
In Gisborne, the recently completed $7.5 million Waipaoa River Flood Control Scheme upgrade is a significant resilience infrastructure project for the region.
This project has already played a critical role in protecting Gisborne and surrounding horticultural and pastoral areas from the weather events the region has suffered over the past couple of years.
The eastern side stopbanks (as they were four years ago) wouldn’t have protected the city in the Gabrielle event. The upgrades have been instrumental in protecting people and property, and this cannot be understated.
Every year, the Northland township of Kaikohe faces significant drought and water shortages due to lack of reliable back-up water supply. The area’s highly fertile soils remain under-utilised due to a lack of a reliable and plentiful water supply for irrigation.
However, funding from the Provincial Growth Fund (PGF) has enabled local water group Tai Tokerau Water Trust to build a 13ha artificial lake at Matawii to help address this issue and solve other problems.
This reservoir holds the capacity equivalent of 300 Olympic-sized pools and will be transformational for the region with many flow-on effects including improved living standards, increased community buy-in and new opportunities for businesses.
A total of $68 million in government investment supported the construction of the reservoir, along with two other local water storage and distribution
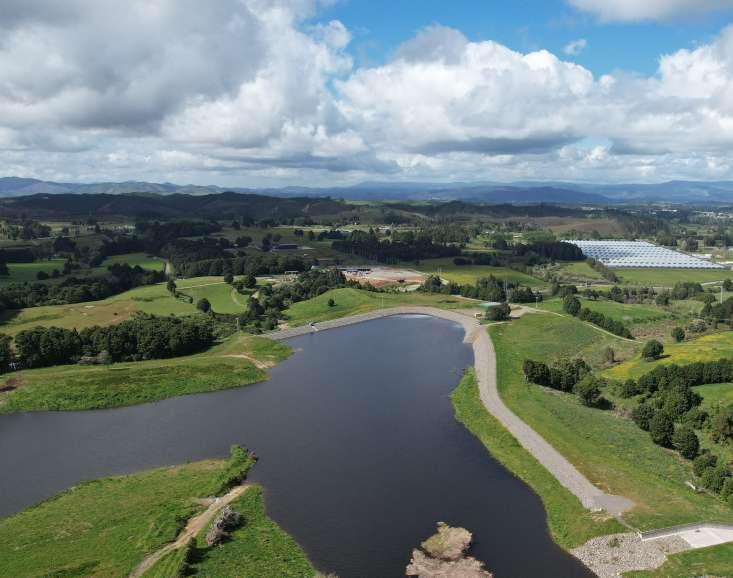
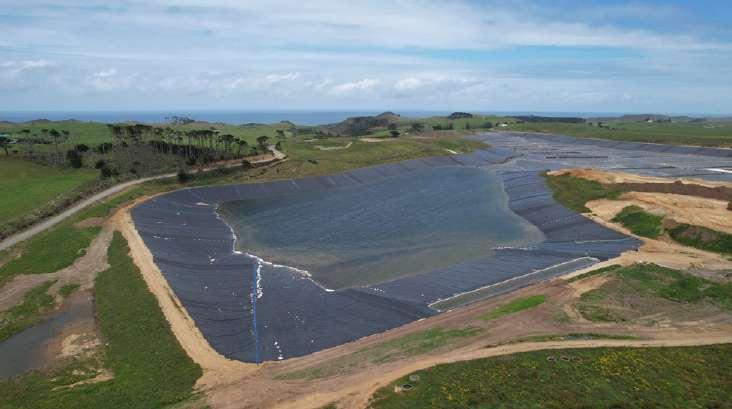
projects. Estimates are that the three completed projects will mean Northland has the infrastructure and water to develop approximately 7000ha of horticulture, creating more than 500 jobs and $400m of annual regional output.
Among other key infrastructure projects funded through the PGF were airport terminals in Gisborne, Bay of Islands, Invercargill and Hokitika.
Airports are critical regional infrastructure and vital to the health and future of our
regional economies. Often the gateway for welcoming visitors, airports offer regional businesses opportunities to export, expand and grow, and improve regional communities’ transport resilience in the event of a natural disaster.
The redevelopment of Taupō Airport was completed last year following a $5.87m PGF grant and features a brand new terminal that is three times bigger than the previous building, an extended runway apron, and carpark.
The airport has now been future-proofed to handle larger planes and the increased volume of travellers arriving in Taupō, as well as ensuring the financial sustainability of the Taupō Airport Authority.
Regional development contributes to a more diversified, resilient and productive New Zealand.
Investing in regions helps reduce disparities, creates jobs, improves living standards, strengthens social cohesion, empowers local communities and solutions to problems, promotes responsible resource management, improves resilience, and ultimately enhances the economy.
New Zealand’s long-standing infrastructure deficit means regions face challenges with access to capital. Establishing the $1.2b Regional Infrastructure Fund (RIF) as part of the Coalition Agreement of the new government will help address this.
Every region is different and has its own set of unique strengths and challenges, so any investment from the RIF into regions will be informed by the regions where there are agreed priorities and needs.
The aim of the RIF is to improve both resilience and productivity to grow regional economies, continue to build on previous investments, focus on small- to mediumsized regional infrastructure projects while encouraging continued co-investment.
Through the administration of previous funds, including the PGF, improvements to the operation of these funds have been identified and made. These insights will be drawn on for the RIF to ensure projects deliver results and fund infrastructure projects that create enduring regional assets.
Distribution of the RIF will follow tight criteria, focusing on lifting the performance and resilience of regional economies.
The RIF will be delivered by the government’s Regional Economic Development & Investment Unit, Kānoa - RDU, based at the Ministry of Business, Innovation & Employment. The team is
experienced in delivering funds in the regions and getting results.
Successful regional development requires effective collaboration between stakeholders, central government, regional authorities, local communities and the private sector.
New data released by Kānoa estimates the government’s investments of $3.172b into the regions between 2016 and October 2023 generated an additional $1.85b in co-funding from local stakeholders into contracted and completed regional projects.
Additionally, these investments are estimated to have provided the following financial boosts for regions, including:
• $10.2b in additional expenditure
• $4.4 b in added gross domestic product (GDP)
• Supporting more than 44,000 full-time equivalents (FTEs) in supported employment
This estimated return on investment is testament to how government investment can support regional development by unlocking co-investment from local stakeholders, add GDP to local economies, provide employment opportunities, and make the regions more attractive places to live and work.
Kānoa - RDU officials will begin discussions with stakeholders and iwi in the regions over the next few months and I am eager to get things moving. Watch this space.
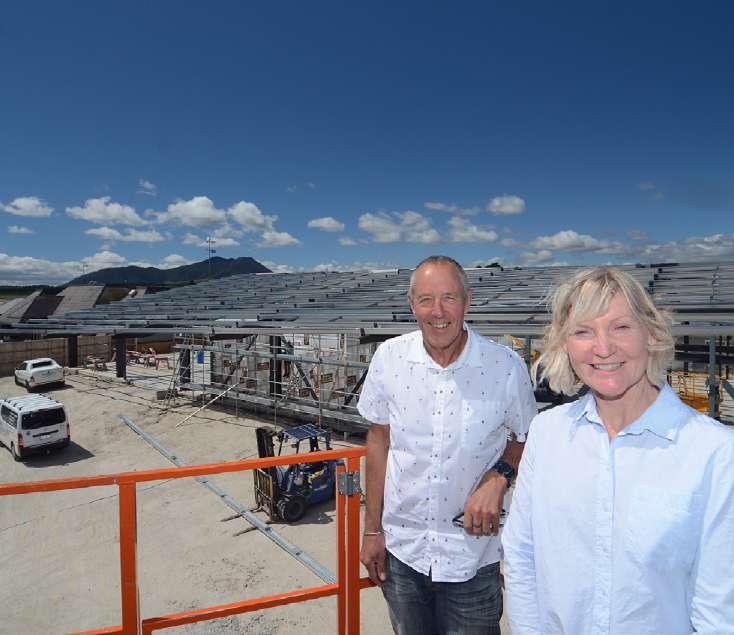
 Trevor Watts (left) of Watts Construction and Airport operations manager Kim Gard overlook the redevelopment of Taupō Airport in 2022. The project was completed last year following a $5.87m PGF grant. Photo: Taupō Airport
Estimating the Costs of an Uncertain Infrastructure Pipeline September 2023
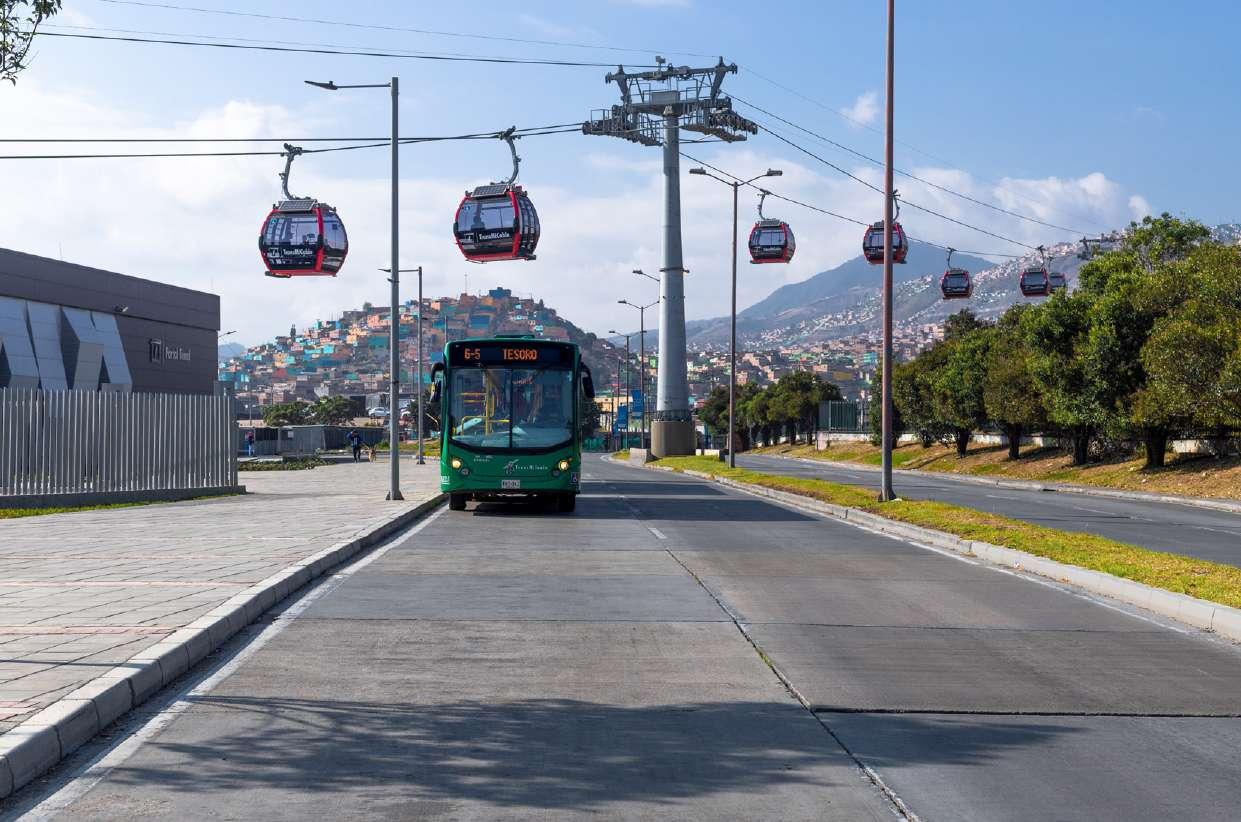
The cancellation of the Auckland light rail scheme may have opened the door to a more novel solution.
Doppelmayr New Zealand has taken the next step in its ambition to enter New Zealand’s public transport market through the release of its Urban Transport Solutions Report (www.doppelmayr.nz/urban), which makes the case for urban cable car solutions in Aotearoa.
The Report shares the findings of an independent strategic level analysis by transport planning and engineering specialists Abley, which identified 20 locations around the country where there is a case for an urban aerial cable car. Doppelmayr New Zealand intends to pursue a shortlist of 10 sites across Auckland, Wellington, Christchurch and Queenstown – with its sights set on Auckland and Wellington in the short term.
According to the report, the overall advantages of aerial cable cars are significant.
Aerial cable cars are attractive to passengers and provide reliable, direct and fast journeys at high frequencies. They can, according to Doppelmayr, resolve many of the public transport challenges facing New Zealand’s major cities, including congestion, air and noise emissions as well as severance between our communities and the places we work, live and enjoy
In cities such as Portland, and soon to be in Paris, aerial cable cars glide above the city and
the streets below. As part of an integrated network, they open new possibilities by maximising the unused aerial environment and traversing other modes of transport. The Paris line is a 4.5 km line in the city’s south-east aimed at commuter traffic, and avoiding the complications of having to work amongst existing infrastructure. The Portland route is 1 km long and rises 150m to a university hospital. The destination is poorly served by road.
Other advantages of aerial cable car systems include being a reliable, efficient lowemission, low-cost transport solution compared to that of other transport infrastructure, a build time of two years or less, and minimal disruption to local communities and impact on the land and existing infrastructure. Once operational, aerial cable cars have a minimal physical and carbon footprint and are highly energy efficient. With capacity to transport up to 8000 passengers per hour per direction, aerial cable cars have the potential to connect communities around New Zealand to major activity hubs such as CBDs, airports, shopping centres, new developments, transport facilities and ports.
In Doppelmayr’s view, there are no significant planning or consenting impediments to the introduction of an aerial cable car system for public transport purposes in New Zealand.
Unlike the significant disruption and related network impacts when installing heavy solutions such as with rail-based systems, cable cars can be installed with a minimum of disruption and in a shorter period in comparison to other on-road means of transport.
These could be funded in several ways, which align with the new Government's desire for innovative funding mechanisms, as expressed in the GPS:
• Public works: traditional financing run by public operators
• Public turnkey project: procurement of design, construction, and the start-up by government agencies, run by private operators
• Private Concession: construction, operation, and maintenance under private concession
• Doppelmayr note that they are open to exploring the potential for private/public financing or equity arrangements to facilitate the implementation of a suitable cable car solution for New Zealand
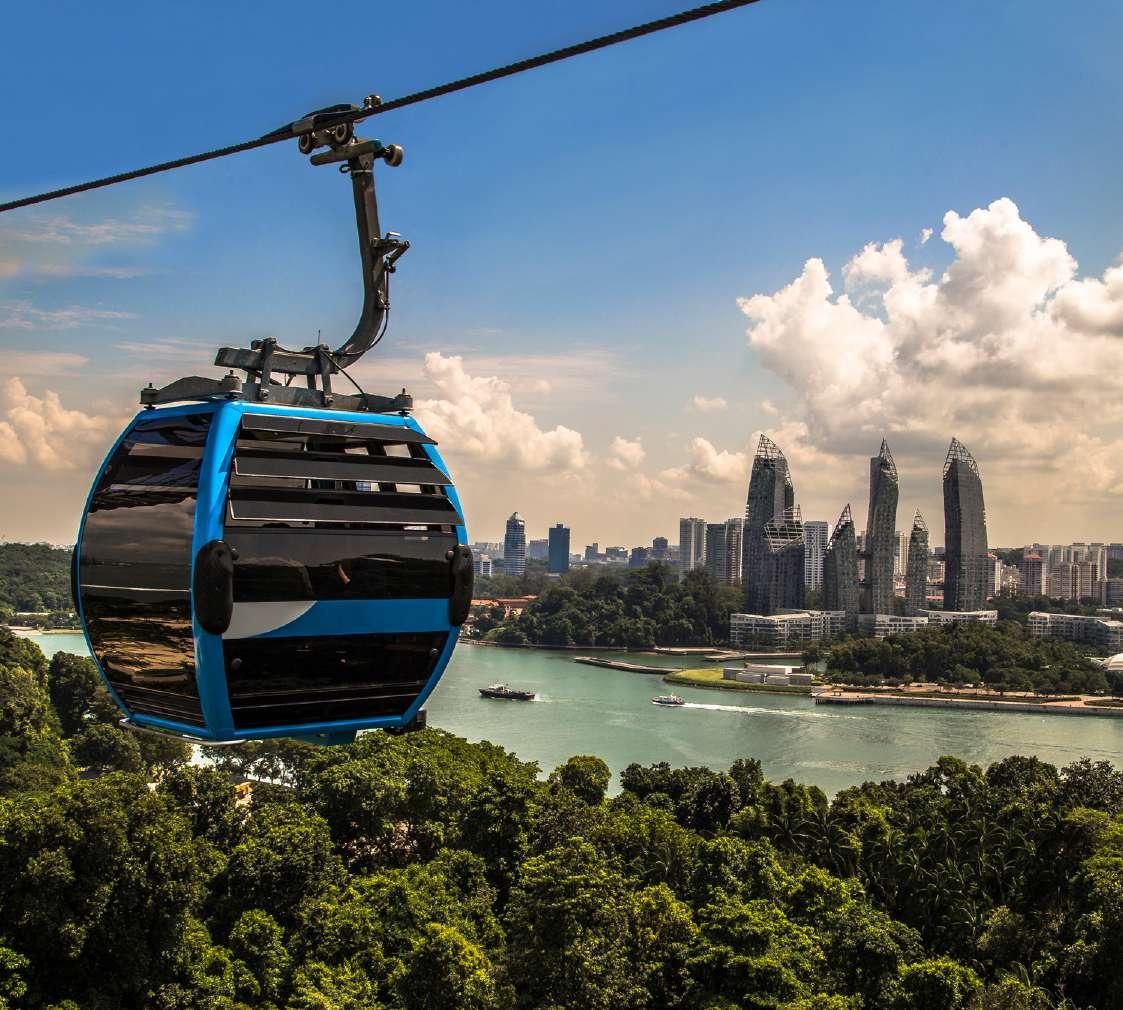
Doppelmayr New Zealand CEO Garreth Hayman says the business is focusing on Auckland and Wellington due to the proven potential for aerial cable cars to address key transport challenges and provide urban development opportunities in both cities.
“Doppelmayr’s experience is that aerial cable car systems offer a range of benefits to urban environments under pressure from growth and increasing vehicle congestion, and while cities endeavour to meet ambitious climate targets. We have done extensive research with local experts to assess the feasibility of integrating aerial cable cars into New Zealand’s major cities.
“The sites we are looking at across Auckland and Wellington will save passengers up to 29 minutes’ travel time in comparison to the existing public transport systems. We know these solutions work because we have seen
them in action in large international cities –where they complement existing transport networks and are incorporated into existing buildings, underground stations, airports and housing developments,” says Hayman.
Three of the transport links Doppelmayr intends to pursue would connect the Auckland and Wellington airports with suburbs that do not have a strong existing public transport solution, says Hayman.
“Mobility in and around many airports across the world are facilitated by a Doppelmayr cable car, such as the recently installed Luton airport DART in the United Kingdom. The solutions proposed for New Zealand would reduce congestion and pressure on the existing transport networks, with capacity to transport up to 6000 people per hour between main transport links and suburbs.”
Doppelmayr New Zealand will partner with the appropriate planning and transport agencies to progress the investigation of these opportunities. The business is also seeking private/public financing or equity agreements to facilitate the implementation of New Zealand’s first aerial cable car.
“Worldclass cities require worldclass infrastructure and innovative, effective transport solutions. As part of an integrated network, aerial cable cars provide new possibilities by making use of the currently unused aerial level – one that is not hindered by other modes of transport. We are motivated by the opportunity to introduce public transport solutions in New Zealand that will complement, extend and fully integrate with existing train, bus and ferry services, as we have successfully done around the world,” says Hayman.
Airport to Botany Airport – Puhinui Railway Station –Manukau CBD – Botany
• Rapid Transit network, alternative to Bus Rapid Transit
• 15 minutes faster than current bus network
• Carry up to 2000 passengers per hour, per direction
• Benefit: Cost ratio 1.8
• Next step: Develop cable car concept, costing and impacts –compare with Bus Rapid Transport
Airport to Onehunga Airport – Mangere Town Centre – Mangere Bridge – Onehunga
Te Atatū to Henderson, via Busway
Te Atatū – Northwestern Busway –Henderson
Te Whanganui a Tara / Wellington
Airport to CBD Airport – CBD – Wellington Railway Station
• Alternative to Light Rail: Airport – Onehunga section
• 18 minutes faster than current bus network
• Carry up to 3000 passengers per hour, per direction
• Goes under airport runway in a tunnel!
• Benefit: Cost ratio 2.4
• Next step: Develop cable car concept, costing and impacts –compare with Light Rail
• Connect to proposed Northwestern Busway
• 25 minutes faster than current bus network
• Carry up to 1000 passengers per her
• Benefit: Cost ratio: 0.7
• Next step: Initial demand and feasibility analysis
• Alternative to Bus Rapid Transit
• 14 minutes faster than current bus network
• Carry up to 2000 passengers per hour, per direction
• Benefit: Cost ratio 1.7
• Needs tunnel under airport, or shuttle bus.
• Nextstep: Develop cable car concept, costing and impacts –compare with Bus Rapid Transit
Island Bay to CBD
Island Bay – Newton – Wellington Hospital
–CBD – Wellington Railway Station
Karori to CBD
Wainuiomata to Hutt Valley
West Karori – East Karori – CBD
Wainuiomata – Waterloo Rail – Hutt Town Centre
• Alternative to Light Rail Transit
• 22 minutes faster than current bus network
• Carry up to 3000 passengers per hour
• Benefit: Cost ratio 2.0
• Next step: Develop cable car concept, costing and impacts –compare with Light Rail
• Additional capacity for constrained corridor
• 25 minutes faster than current bus network
• Carry up to 2000 passengers per hour, per direction
• Benefit: Cost ratio 1.8
• Next step: Initial demand and feasibility analysis
•Direct connection across physical barrier
•29 minutes faster than current bus network
•Carry up to 1000 passengers per hour, per direction
• Benefit: Cost Ratio 1.2
• Next step: Direct connection across a physical barrier
Elsewhere in the country, a line from Christchurch Airport to the city centre has a Benefit: Cost ratio of 1.4 and Queenstown Airport to the city centre of 1.1. In many cases, cable cars are seen as a direct alternative to planned or suggested light rail or bus rapid transport, and they have used existing research for these routes. Of these seven sites, nearly all have BCRs in excess of 1. The one that doesn’t is the Te Atatū-Henderson route in west Auckland. Two have BCRs in excess of 2, which is a very respectable level. They are Auckland Airport to Onehunga and Island Bay to Wellington CBD.
The Doppelmayr report is based on a threepart report from NZ transport consultants
Abley: "Introduction to Cable Cars". The Abley report is (to the best of our knowledge) the first-ever comprehensive attempt to assess the scope, at a pre-feasibility level, for cable cars as a mode of public transport in NZ’s main urban areas. Its primary focus is on options for the three largest urban areas, i.e. Auckland (5 main corridors plus 3 proposed development areas), Wellington (5 main corridors) and Christchurch (2 main corridors, linked through the CBD, as an alternative to light rail or bus-based options under consideration). The report also includes assessments of the potential role of cable cars, at a less detailed level, for Hamilton, Tauranga, and Queenstown.
Given the challenging nature of the topic (including the lack of data or previous studies of urban cable car feasibility in the NZ context), in my view, the Abley report provides a commendable starting point for more detailed studies on the topic, which would be expected to focus first on the more promising corridors identified to date.
This section of our appraisal draws on the Abley work, providing some generic comments applicable to all (or most of) the Abley assessments, with a focus on the various inputs to the scheme economic assessments for the main corridors. The following section examines in more detail issues arising in the application of the Abley assessment framework to a typical metropolitan corridor currently served by buses - in this case Wellington’s Karori corridor.
Table 2.1 (following) summarises our generic comments on Abley’s economic assessments (drawing largely on the Abley report part C, chapter 9, principally Table 9.2). It should be kept in mind that the primary focus of this table is on the situation likely to apply when/ if CC services are implemented in PT corridors currently served principally by bus (rather than corridors being considered for Mass Rapid Transit ((MRT)) implementation).
Our key findings from this review of the Abley assessments are as follows:
** Typical CC operations in the NZ metropolitan/urban context are assumed (by Abley) to have station spacing typically in the order of 1.0 km for MRT-type corridors. This compares with typical stop spacing for NZ urban bus routes of around 300m. It seems
Aspect Abley basis (1) IWA comments
1. CC operating speeds
2. CC passenger capacity, service frequency
3. CC station spacing policies
25 km/hr between stops; 0.5-1.0 min/stop Reasonable.
Not specified in detail, but noted by Abley (report C) that capacity could be up to 8,000 passengers per hour per direction (pphpd).
Typical station spacing of c1.0km was assumed for potential MRT corridors but recognised that lesser spacing is likely to be appropriate for suburban bus corridors.
4. CC passenger demand assessment
5. CC operations and maintenance (OPEX) costs
Applies ‘point-to-point’ model (using readily available data sources) “based on SA2 area within 800m of theoretical CC stations”. It also assumes an 80% increase in ‘base’ user benefits because of CC’s improved service reliability (relative to buses).
6. CC capital costs (stations, vehicles, pylons, and cables etc)
The estimate (provided by Doppelmayr about the Island Bay corridor) is that annual operating expenditure for CC services is typically in the order of 1% (pa) of scheme capital costs.
Stated as $30 mill/route km for ‘normal’ terrain, and $40 mill/route km for inner urban routes. Estimates provided by Doppelmayr, are based largely on international evidence.
BY IAN WALLISIt is assumed that CC capacity and service frequency on each route will be optimised, having regard to ‘base’ demand (and expected future demand trends) and in the light of capital and operational costs.
Major implications if CC introduced in main corridors currently served by bus, with CC stop spacing of say 800-1000m: (i) typical bus stop spacing in major bus corridors now c300m, giving typical walking distance to the bus stop of around 200m; (ii) with proposed CC stop spacing, we estimate average walking distances to nearest CC station would be around 300m; (iii) on this basis, if CC were to provide the only PT services in the corridor, typical walking distances for current bus users would increase by around 50%; (iii) this would be highly unpopular (especially in winter), with user disbenefits from increased walking time likely to largely offset any potential benefits from expected improved service reliability (for CC travel over bus travel). In practice, it seems highly likely that, in at least some of the major bus corridors, some existing bus services would need to be retained, with the result that the ‘base’ bus passenger market would be split between bus and CC travel.
Demand and user benefit estimates appear to show a degree of ‘optimism bias’, certainly in the case of CC introduction in corridors currently well served by buses: (i) we agree that CC services are likely to be more reliable than bus services, but an 80% user benefit increase appears too large in the case of the ‘stronger’ bus corridors; (ii) any such reliability benefits could well be more than offset by significantly longer access/egress times for the majority of PT passengers (as noted in point 3 above); and (iii) a substantial proportion of passengers would have to transfer to/from other bus services (a city and/or suburban locations) to complete their trips (refer further discussion below relating to Wellington’s Karori corridor).
This aspect warrants further consideration (in the next stage of studies). It would certainly be relevant to know how the assumed CC service operations and maintenance costs compare with bus service O&M costs for typical corridors and patronage levels.
Understood that these costs are largely based on international evidence, and that they include vehicles as well as fixed infrastructure (stations etc) but exclude land costs. Further investigation is warranted as part of more detailed studies for specific corridors in the next stage.
Table 2.1: Main Inputs to Abley Economic Assessment and Ian Wallis Associates (IWA) Commentsunlikely that the total replacement of typical NZ corridor urban bus services by a cable car service with (say) 0.8-1.0 km station spacing would be publicly/politically acceptable, given the increased walking distances to the nearest CC station that would be required for the majority of PT users. Some modified bus services in corridors served by CC would most likely need to be retained, either: (a) in a feeder role to the CC services – which would result in a substantial proportion of passengers who now have a through bus service having to transfer for the first and/or last portions of their trips; or (b) as through services, i.e. similar to the existing bus services, in effect competing with the CC for a significant proportion of the corridor’s present market of PT users. Both these options appear undesirable and unlikely to be popular with current or potential PT users, in terms of requiring additional transfers between bus and CC (in case (a)); or considerably increasing the total costs (to the public sector) of PT provision in the corridor (in case (b)). This issue does not appear to be addressed in the Abley report in the context of what are now major urban bus corridors.
** Partly, because of the above point, it seems likely that the user benefit figures and the benefit: cost ratios in the Abley report (which are primarily related to MRT-replacement studies) are considerably over-estimated, quite probably by a substantial magnitude where they are applied to current main urban bus corridors. This calls into question many of the economic-related figures in the Abley part C report, summary table 9.2 (i.e. the columns headed Benefit Total, BCR and VKT reduction): in my view, it is premature to draw (even indicative) conclusions on the relative (or absolute) economic merits for CC services in the corridors assessed by Abley.
The Wellington CBD – Karori corridor is one of the ‘strongest’ corridors in Wellington City in terms of its levels of bus service and usage. The implications of introducing CC services in this corridor are examined here, as being typical of issues arising with introducing such services in corridors currently served by bus services in NZ’s main urban areas.
Key characteristics of the current Karori bus services include:
• A strong primary bus route (#2) along the main road through the suburb, with service intervals of 7-8 minutes during weekday daytimes (inter-peak period). This service runs from Karori into and through the CBD (via Lambton Quay) and then continues to Miramar and Seatoun (as two separate routes, each with half the frequency of the Karori services).
• The main Karori route has some 20 bus stops between the main Karori terminus (adjacent to Karori Park) and the north end
of Lambton Quay. The current bus route distance between these two points is approximately 6 km, with typical (daytime) bus running times averaging around 20 minutes (i.e. average timetable speed, including stops, of around 18 km/hr).
• The main route #2 services are supplemented by additional peak period services extending from the Karori Park terminus to serve the newer/outlying areas of Karori South and Karori West. (These additional services are not addressed here, but the expectation would be that these areas continue to be served by bus, potentially connecting with CC services in the vicinity of the present route #2 terminus at Karori Park).
My understanding is that the proposed CC route serving Karori is assumed to run between the north end of Lambton Quay (near the bottom of Bowen Street) and the current route #2 terminus at Karori Park. Based on typical cable car station spacings of around 0.8-1.0 km (as assumed by Abley), the proposed service would have probably four intermediate stations, as compared with about 20 stops (c300 m average spacings) on the current route #2 bus services in the section between the two CC termini.
If a CC service were to be introduced for the Karori corridor (to replace, totally or partially, the present bus route #2), our initial findings are, in summary, as follows:
• At the CBD end of the CC route, a large proportion of the existing route #2 passengers would have to transfer at the CC terminal to/from other bus services running further into and through the CBD. This additional transfer would be unpopular.
• At the suburban (Karori) end of their trips, a large proportion of the current bus passengers would experience significantly longer walking distances than at present: the current average of around 200 metres would increase by around 50%. This would also be unpopular.
• Any perceived (net) passenger benefits from the CC services operating (potentially) more reliably and somewhat faster than the current bus services could well be (more than) offset by the additional need for a large proportion of passengers to transfer (or have a longer walk) at the CBD end of their trip and to have a significantly longer walk at the suburban end.
• Offsetting any such negative aspects of the CC services, there is little doubt that CC users would have a more pleasurable experience than travelling by the existing bus services – in particular in relation to service reliability (on-time performance), service frequency, ride quality and interesting views of the city and harbour.
Given the limited information in the Abley report on the recurrent (operations and maintenance) costs of CC services in the NZ urban context, no quantitative comparisons have been attempted at this stage between the total (capital and operating) costs of the proposed CC services and the present bus services in the Karori corridor (or in any other of the corridors examined in the Abley report). While some cost reductions could well be achievable if all the route #2 bus services to/from Karori could be replaced by CC services (which seems unlikely in practice), these would be expected to be small (or potentially negative) once allowance for CC system (annualised) capital costs is included.
In summary, based on the evidence currently available from the Abley reports, it appears most likely that replacement of the main bus services in the Karori corridor by a CC service would result in:
• A poorer perceived level of service for most PT passengers, principally resulting from: (i) significant increases in walking distances (on average) for most passengers at the Karori start and end of their trips (which could well offset any reliability benefits of the CC operation relative to the current bus operations); and (ii) the need for additional passenger transfers (or longer walks) for a substantial proportion of trips terminating in the CBD and for those trips with destinations currently served by the Miramar and/or Seatoun ‘legs’ of bus route #2.
• These negative aspects of such a CC service in the corridor would be at least partially offset by better service reliability and increased service frequency, together with a more pleasurable travel experience with better ride quality.
• At best, only modest reductions and possibly some increase in total PT capital and operating costs for the PT services in the Karori corridor.
Ian Wallis runs a Wellington-based consultancy specialising in the field of urban transport policy, planning and evaluation, with a particular emphasis on public transport issues. He has made substantial contributions to the NZTA Monetised Benefits and Costs Manual in the areas of demand assessment, costing and economic/financial evaluation. He was the consultant project manager for the development/updating of the Australian (Federal Government) Transport Assessment and Planning Guidelines, vol M1: Public Transport. Most recently, he was the consultant project director/manager for the NZ Ministry of Transport’s Domestic Transport Costs and Charges Study.
The ongoing maintenance and management of major infrastructure assets in New Zealand is on a downward spiral and will create major issues for NZ Inc in the coming years. That’s the key message from Āpōpō, the industryleading association for asset management professionals in New Zealand.
Āpōpō President, Gary Porteous, said New Zealand is dropping the ball regarding investment to look after our declining infrastructure.
He said this was highlighted by then-acting NZTA Chair, Cassandra Crowley, who told a select committee hearing recently that “Our funding system is strained because of a combination of past under-investment in asset management, inflationary pressure on costs and more frequent and extreme weather events.”
Mr Porteous said unless New Zealand has a better plan for investing in and prioritising the management of existing infrastructure assets like roads, pouring more money into new infrastructure is sending good money after bad.
“Yes, the country needs some new infrastructure, but we also need sufficient investment to look after what we’ve already got, and a good master plan to bring that together with the new infrastructure we need to build.
“So, I cautiously welcome Transport Minister Simeon Brown’s approach in the draft 2024-2034 Government Policy Statement on Land Transport as a great start to balance new investment in asset maintenance and resilience with building new infrastructure.”
Mr Porteous says NZ Inc needs to do four things to improve its collective decision making:
1. Ensure all the players are conversant in the infrastructure management process, understand the role they play, and the consequences of their decision making.
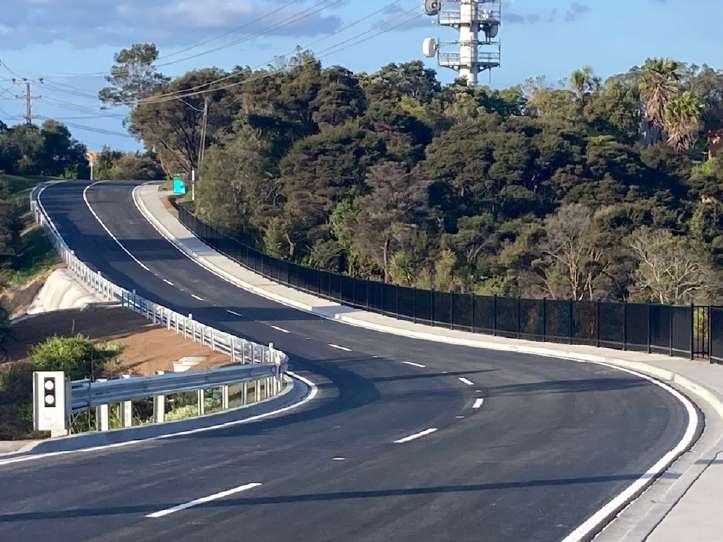
The complex Glenvar Road rebuild required significant work but has resulted in a safer road, more resilient to future weather events. Photos: Auckland Transport
2. Build assets with a long-term life cycle in mind, with a focus on the quality of newly built infrastructure.
3. Secure the appropriate operations and maintenance funding for our current portfolio of infrastructure, and for any new infrastructure that is being built.
4. Create better systems to report on the current state of infrastructure, and what will happen to it based on investment forecasts.
“It wouldn’t hurt to take a leaf out of the books used by the early Greeks and the Romans. Plenty of their infrastructure assets are still around after more than a thousand years,” he said.
“We need to take the same long-term view – build to deliver life cycle value, rather than the cheapest option, and then actively manage and maintain what we build to maximise the value of that investment over as many years as possible.”
New Zealand has around $300 billion of infrastructure assets, 70 per cent of which are owned by central and local government.
Take Auckland as an example: according to an Auckland Transport (AT) December 2023 presentation to the Auckland Council’s Transport and Infrastructure Committee, the city had a backlog of over 1,400 kilometres of sealed roads that urgently required resurfacing.
Over the 2023/24 summer period, AT planned to – “within our current funding constraints” – resurface 400km of roads. This entailed 90km of asphalt and 310km of chipseal. The renewal programme also included rehabilitating 7km of sealed road pavement; strengthening 43km of unsealed roads; replacing 60km of footpaths; and replacing 40km of kerb and channel.
AT could utilise the country’s first-ever all-in-one pothole repairing machine, which arrived in the country late last year. The Pothole Pro is designed and manufactured by JCB Construction in the UK.
The machine is being distributed through Power Farming’s nationwide network of retail branches, and they are well underway with demonstrations to roading-contractor potential clients. Its benefits include:
• Cuts, crops, and cleans potholes with one machine
• Is up to six times faster compared to two manual labourers (8 minutes per pothole compared to approximately 50 minutes for 2 workers)
• Delivers consistently higher quality results than manual repairs
• Improves safety by minimising time/need for workers being exposed to on-road repairs
• Carries out all conventional excavator tasks - digging, trenching, loading and lifting
JCB Construction Sales Manager, Tony Hennessy, says: “One of the great features of the Pothole Pro is that it doesn’t need to be transported to the site on the back of another truck or carrier – it can be driven directly to the pothole locations saving even more time and freeing up more labour and logistics.”
However, AT requires more funding from NZ Transport Agency Waka Kotahi (NZTA) to renew and maintain Auckland roads, according to the Council report. National Land Transport Fund (NLTF) coughs up the money for such projects, however, NZTA has indicated that “the NLTF will only fund 60 -70% of what is required for Auckland”.
“At this low rate of funding, local roads will continue to deteriorate, and potholes will increase.” The Council report also claims the damage to roads, or the “increased rate of deterioration”, is caused by “increased vehicle loads” and that the “frequency of extreme
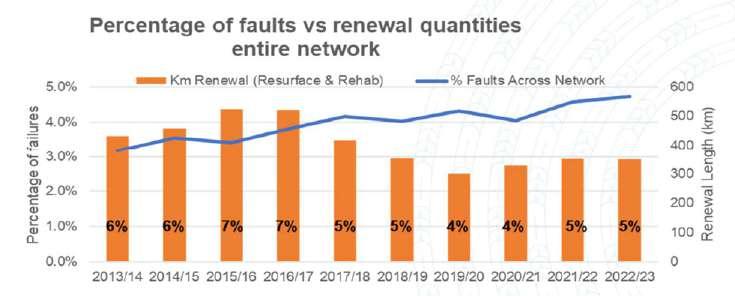
Source: Auckland Transport update, Auckland Council Transport & Infrastructure Committee
weather events is increasing with climate change”
Thankfully, the newly published Government Policy Statement on Land Transport has just what AT is looking for: a new $500 million Pothole Prevention Fund. It is ringfenced for resealing, rehabilitation, and drainage maintenance works.
According to the Transport Minister, Hon Simeon Brown, this ensures NZTA and local authorities “get our State Highways and local roads up to the safe and reliable standard that Kiwis expect”
More than 211,000 potholes have been reported on New Zealand state highways over the past five years – with a quarter of them being in 2022. Over 62,000 potholes needed repair on state highways around the country in 2023.
However, AT is still wrestling with the damage wrought by the 2023 Auckland Anniversary Weekend floods, having cleared 1,200 minor slips in the three months following and 300 medium and major slip repairs in nine months. The top section of Glenvar Road, a key route to and from Long Bay and Torbay that was damaged during floods, was finally reopened in October 2023 albeit six weeks earlier than expected.
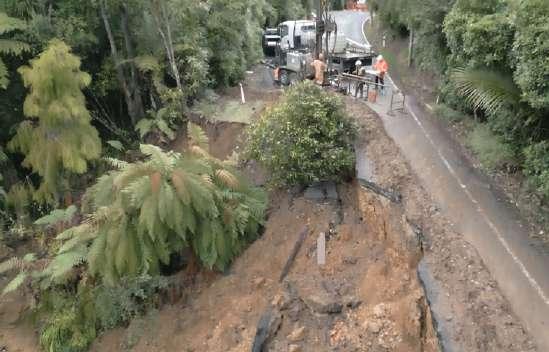
AT closed the top end of the road in both directions after land gave way on both sides of the narrow ridge between East Coast Road and Fitzwilliam Drive, and geotechnical experts advised further slips could put property and lives at risk. Designs developed for the previously planned upgrade of Glenvar Road were used to inform and help with the repair work to make it more resilient, and the construction was fast-tracked under the Auckland Flood Recovery emergency works settings.
“Making sure our communities were safe was our primary concern, and we thank the local community for their patience and understanding,” says Flood Recovery Chief Engineer, Murray Burt.
“The first priority was to locate and secure existing utility services, specifically the power lines, which were undermined by the slips and were in danger of falling on the road.
More than 2,000 slips and issues were reported across Auckland as a result of the January and February weather events. AT’s programme of repairs to more than 500 medium-large scale slips is expected to be completed in 2025/2026 and cost between $300-390m.
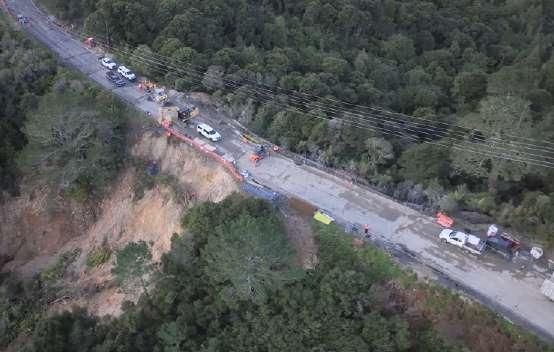 AT closed the top end of Glenvar Road after land gave way on both sides of the narrow ridge between East Coast Road and Fitzwilliam Drive.
In Australia, the Heavy Vehicle National Law provides for heavy penalties for actors in the road freight industry for safety offences. The key point of difference from usual road laws is that they are aimed at all participants in the decisions that led to a safety incident, including those outside the transport sector. Thus all actors from sender to receiver are covered, in what is known as the “chain of responsibility”.
The HVNL is enacted in every state in Australia, except Western Australia and Northern Territory, in nearly the same terms. It provides for duties to be obeyed by all actors involved with heavy vehicles. These actors include operators, schedulers, consignees and consignors, packers, loaders and unloaders (and loading managers), and the driver’s employer or prime contractor (but not the actual driver). Executives of companies and other legal entities must do due diligence to ensure the company complies.
Putting pressure on the driver to achieve schedules that would necessarily involve speeding, or to drive while impaired, is forbidden. Hence a supermarket would be exposed if they had unrealistic delivery times for their freight.
The primary duty is that “Each party in the chain of responsibility for a heavy vehicle must ensure, so far as is reasonably practicable, the safety of the party’s transport activities relating to the vehicle”. “So far as is reasonably practicable” is defined in a very similar way to our Health and Safety at Work Act 2015’s definition, so it is quite a high hurdle. Interestingly the “safety” is defined to include property (including vehicles and roads) and environmental damage, not just personal injury.
The law has teeth, very sharp ones. In recent judgements, the courts handed down penalties relating to a collision between a heavy truck and police working on a freeway shoulder in Melbourne in 2020. Four of the police were killed. The driver of the heavy vehicle was impaired by fatigue and drugs, and was sentenced to 18.5 years imprisonment (outside of the chain of responsibility framework).
The investigation by the regulator found numerous deficient practices relating to work diaries (logbooks in NZ), failure to follow up on safety incidents, and work time breaches, multiple cases of fatigued driving, and deficient training.
The company was charged with a Category 1 offence, the highest level, for failing to implement systems and procedures to properly manage drivers’ fatigue and/ or fitness for duty. To make it a Category 1 offence, not only must a person (or company) have a duty under the law, but as well engages (without reasonable excuse) in conduct which exposes a person to a risk of death, serious injury or illness, and is reckless as to the risk.
The Managing Director was charged with failing to exercise due diligence to ensure the company complied with its duty. Both were convicted and fined in November. The company was fined AUD$2.31 million, and banned from working in transport for a year. The Managing Director was fined $22,500, and required to undertake further education. Managing Directors, the court said, cannot put their hands over their eyes and ears to avoid responsibility. They must take positive steps to monitor and ensure compliance with the HVNL and company policies.
However, in December, the company’s National Operations Manager was also convicted, and in January was sent to prison for three years for failing to fulfil their primary duty as an operator, as well as facing over $100,000 in penalties. The maximum penalty for an individual is a fine of $300,000 or five years imprisonment. As well, the Manager was prohibited for working in similar transport roles for a year.
A spokesperson for the National Heavy Vehicle Regulator in Australia said that the National Operations Manager’s sentence was the second sentence of imprisonment for a Category 1 offence under the HVNL. However it is the first sentence of imprisonment to be served (the other was much shorter, and was suspended). The National Operations Manager has appealed.
Supply Chain Technical Manager at Australian transport and logistics specialist NTI, Aaron Louws, said whilst transport and logistics is highly regulated with a high standard held
across the industry, this case is a reminder to individuals that the National Heavy Vehicle Regulator may bring charges against them personally, as opposed to only prosecuting their employer.
“The sentence sends a clear message to parties within the supply chain – the law will be enforced,” Mr Louws said.
“What also makes this case ground-breaking is that the defendant was convicted as an ‘operator’ of a heavy vehicle for their failure to fulfil their primary duty.” An ‘operator’ is a person who is ‘responsible for controlling or directing the use of a heavy vehicle’ – but the Court held that this could also include the immediate manager or supervisor of drivers, and senior management who have responsibilities for the use and control of a heavy vehicle.
New Zealand only has weakly developed chain of responsibility laws for land transport (in part 6C of the Land Transport Act 1998), but in terms of the GPS focus on road safety, it may be timely to upgrade them. There are similar rules relating to dangerous goods in the maritime sector.
However, a similar result might be achieved under the NZ Health and Safety At Work Act, at least for personal injury, using the wide scope of the duties under that Act. Section 32 says that a person in charge of a business or undertaking must ensure, so far as is reasonably practicable, that the health and safety of other persons is not put at risk from work carried out as part of the conduct of the business or undertaking. It is not hard to see the Australian facts falling under this section, at least as far as the company goes. And a truck is a workplace for the purposes of the Act.
As well, the recent Whakaari White Island prosecutions show the breadth of scope that WorkSafe sees in the law. And in its Briefing to Incoming Ministers late last year it noted that the prosecution “seeks to hold to account duty holders across the entirety of the work supply chain”.
However, its scope with respect to all the other parties in the chain of responsibility is not as precisely defined as in the Australian law, and road safety would benefit from such a law here.
The Government is signalling an increase in excise duty and RUCs over coming years to help pay for new roads that will help people ‘quickly and safely’
The new draft Government Position Statement on Land Transport (GPS) has been released for consultation, replacing the previous Government’s draft version, and proposes some big changes.
As the Transport Minister, Hon Simeon Brown, has previously mentioned, Roads of National Significance “are back on the agenda”
But first, a quick recap: the GPS is a statutorily required document that outlines how to spend revenue collected from fuel excise duty, RUC, etc – the government’s National Land Transport Fund (NLTF) –– for the National Land Transport Programme (NLTP).
That money, from the likes of car registrations, is then allocated through the three-yearly NLTP to “authorised organisations”, which are primarily NZTA and local councils.
The GPS tells NZ Transport Agency Waka Kotahi (NZTA) how much money should be spent in different areas of the transport system, called “activity classes”
The GPS is renewed every three years and guides investment in transport by providing a 10-year outlook of how spending is prioritised for the transport network.
It is prepared by the Ministry of Transport on behalf of the Minister of Transport and is published in draft form for public consultation.
You can access the draft GPS online at https://www.transport.govt.nz/assets/ Uploads/GPS-on-land-transport-2024Consultation-4-March-2023-.pdf
In announcing the GPS 2024, Brown stated “the Coalition Government’s plan to build and maintain a transport system that enables people to get to where they need to go quickly and safely”
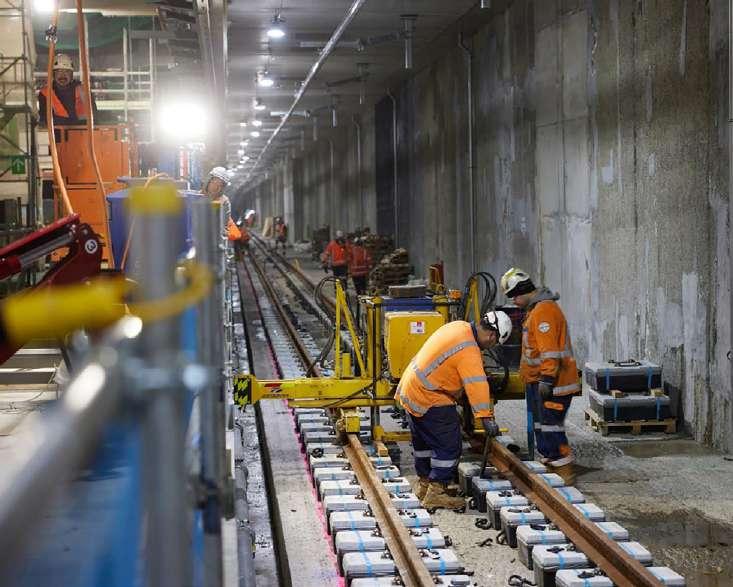
Balancing investments between new projects and maintaining and repairing existing infrastructure, the GPS focuses on four priorities:
• Economic Growth and Productivity
• Increased Maintenance and Resilience
• Safety
• Value for Money
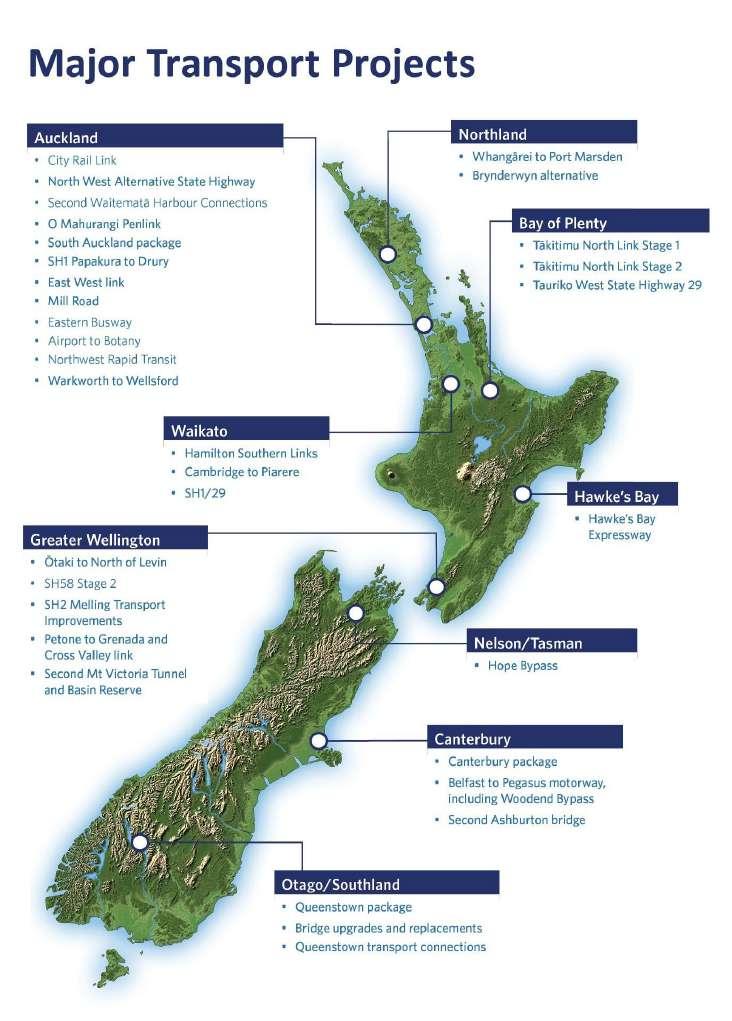
“Delivering on commitments in our Coalition Agreements, we are re-introducing the successful Roads of National Significance (RoNS) programme, with 15 projects to enable people and freight to move as quickly, and safely, as possible,” Brown says.
The RoNS include:
• Whangarei to Auckland
• Tauranga to Auckland
• Auckland roads
• Roads to unlock housing growth:
– Hamilton Southern Links
– Petone to Grenada Link Road and the Cross Valley Link
• Other major routes:
– Takitimu Northern Link Stage 2
– Hawkes Bay Expressway
– Second Mt Victoria Tunnel and Basin Reserve upgrade
– the Hope Bypass
– The Belfast to Pegasus Motorway and Woodend Bypass.
Overall, there is close to $20 billion in transport investment: including up to $2.3 billion for public transport services and $2.1 billion for public transport infrastructure over the next three years.
This, Brown says, will help deliver “reliable, effective, and efficient public transport is a priority, particularly in our main cities of Auckland and Wellington”.
This will see the completion of the City Rail Link and the Eastern Busway in Auckland, with planning to be undertaken in the next three years for the delivery of the Northwest Rapid Transit Corridor and the Airport to Botany Busway.
The draft GPS 2024 outlines the Government’s land transport investment priorities, and guides expenditure of around $7 billion from the National Land Transport Fund (NLTF), and around $1.5 billion from local government, each year. Cont.
– North West Alternative State Highway (SH 16).
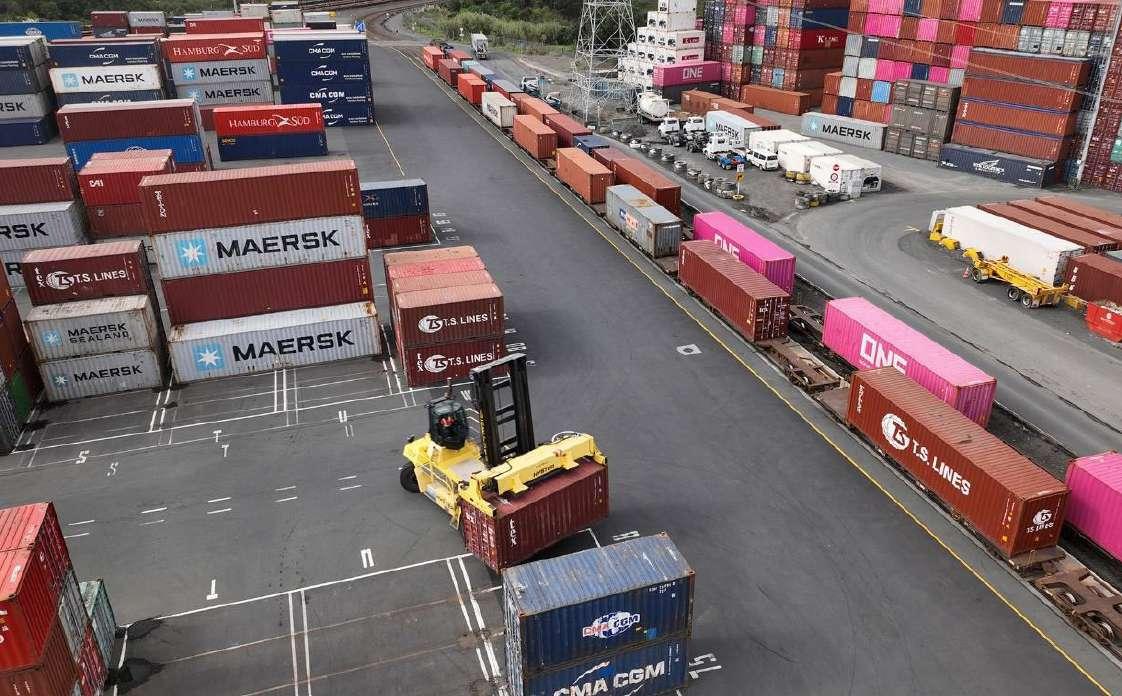
For Wellington, the investment means the continuation of the Lower North Island Rail Integrated Mobility project, to upgrade rail network substations, and replace rolling stock for the Wairarapa and Manawatu lines.
The North-South, East-West, and Harbour Quays’ bus corridors will also benefit from the funding.
There is also a road maintenance fund and newly established State Highway and Local Road Pothole Prevention Activity Classes to address potholes on State Highways and local roads.
But as highlighted in the Ministry of Transport’s Briefing to Incoming Minister, a new approach to paying for land transport is needed. The Government recognises the increasing pressures on the NLTF, and the need to increase revenue.
“To balance the transport budget, we are proposing an increase to the Motor Vehicle Licencing (MVR) Fee by $25 in January 2025 and a further $25 in January 2026,” Brown says.
This will increase the annual cost of MVR in 2026 by $50 for most vehicles, $28 for Motorcycles, trailers and ATVs and $16.5 for Mopeds. The increase in MVR will add approximately $530 million to the NLTF over the years 2024/25-2026/27.
A Crown grant ($3.1 billion) and loan ($3.1 billion) will feed into the overall investment
pool with a 12 cent, 6 cent, and annual ongoing 4 cent per litre increase in Fuel Excise Duty, and RUC equivalent, in January 2027, 2028, and 2029, respectively.
“While there has been a 71 per cent increase in funding for public transport over the past five years, patronage has decreased by 23 per cent. This has partly been caused by COVID-19 restrictions, but numbers have not increased back to pre-COVID levels,” Brown says.
The Minister might not have had the Wellington region bus patronage figures for February at hand when publishing this statement: 2,333,339, an increase from 2,189,182 in pre-Covid February 2020.
That’s according to Wellington Regional Councillor and Transport Chair Thomas Nash, who has shared there were 110,225 bus boardings on 29 February. This eclipsed the region’s previous record of 109,747 set two days earlier on February 27.
“Watch this space for a new record in busy March,” he tweeted.
Despite this, this GPS is expecting greater farebox recovery and third-party revenue by Public Transport Authorities, such as councils, to help support the increased costs that are occurring through the public transport sector.
“The private share of funding for public transport over the same period has also fallen
from approximately 32 per cent to 11 per cent which is putting significant funding pressure on local councils and the NLTF,” Brown says.
“I expect the NZ Transport Agency to consider different ways of funding and delivering major transport projects. This includes ‘Build, Own, Operate, Transfer’ equity finance schemes, and value capture. Ensuring local government pays their fair share, funding should also be supplemented by increased public transport fare-box recovery and third-party revenue.”
Regardless, the release of the GPS now means that (once the public consultation process has concluded) Regional Land Transport Plans and Long Term Plans can now be finalised. These will also need to be publicly consulted on and agreed in order for regions to apply for government funding from the NLTF via the NLTP 2024/27.
“Alongside the draft GPS, we are signalling several system reforms, including shifting to a 10-year National Land Transport Programme, progressing legislation on time of use charging, and moving the whole vehicle fleet to RUC,” Brown says.
“I invite local government, the transport sector, community groups, and the wider public to have their say on the draft GPS.
Projects and funding commitments will be confirmed through the National Land Transport Programme (NLTP) later this year.”
The Draft 2024 GPS will focus rail investment in maintaining the network between the busiest and most productive parts of the existing rail network – between Auckland, Hamilton, and Tauranga.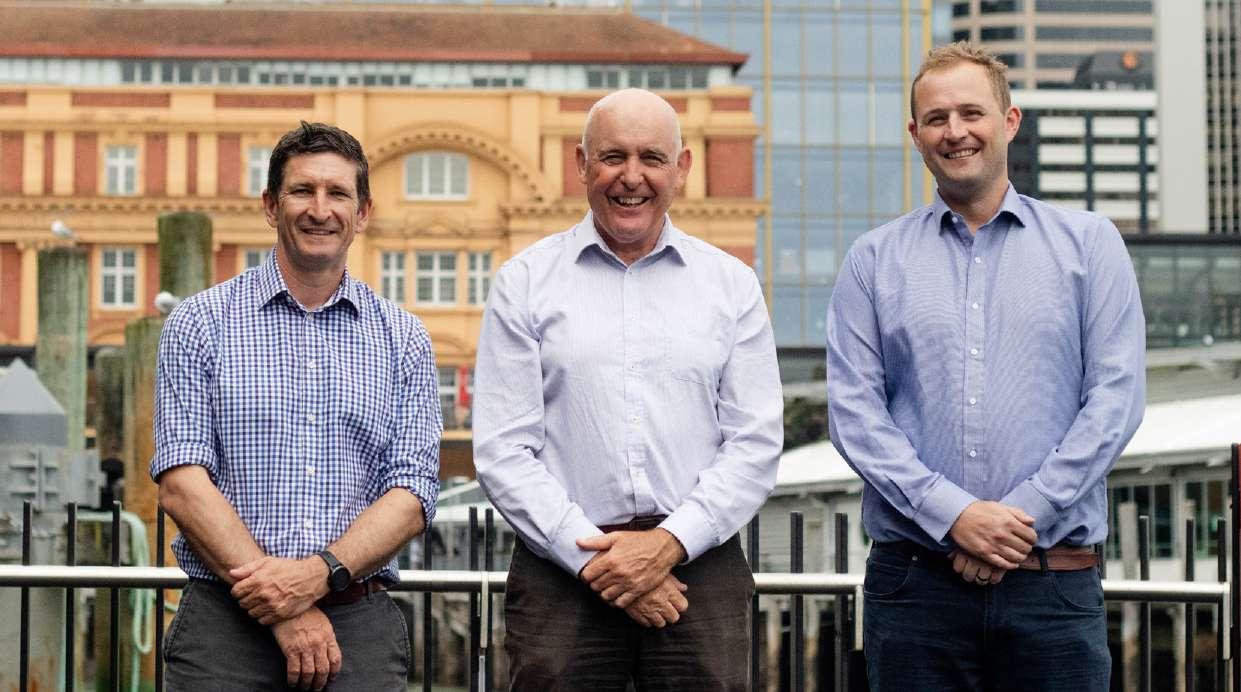
ABB Ability (ABB) is set to deliver the maritime industry’s first megawatt charging system (MCS) for electric and hybrid ferries of Auckland Transport (AT).
ABB has successfully obtained a contract with AT to lead the development of the inaugural maritime MCS in the world.
Designed to recharge electric ferries using the identical interface found in trucks and aeroplanes the shore-to-ship charging system will substantially diminish market entry obstacles for electric ships and amplify the competitiveness of electric vessels in comparison to their fossil-fuel counterparts.
Working toward the Mission Electric initiative and in alignment with New Zealand’s Zero Carbon Act, outlining a net-zero emissions target for 2050, AT has commissioned two all-electric ferries with a capacity for 200 passengers, along with two hybrid-electric ferries accommodating 300 passengers.
This acquisition positions them to become the most predominant electric ferry fleet operator in the Southern Hemisphere by the year 2030.
Ferries cater to just 6 per cent of public transport users in Auckland, however, their diesel engines contribute significantly,
producing 20 per cent of the city’s public transport greenhouse gas emissions.
The electrification is anticipated to result in a noteworthy reduction, cutting diesel consumption by 1.5 million litres annually and curbing CO2 emissions by 4,000 metric tons, equivalent to the emissions generated by approximately 90 diesel buses each year.
To fast-track the creation of ferry recharging infrastructure, ABB’s local channel partner, Singer Electric, will collaborate with local partners to deliver, engineer, and install five comprehensive charging solutions at different ferry terminals, spanning the period between 2024 and 2025.
Each system is set to include a duo of 1.65 MW chargers, incorporating transformers, ACS880 converters, MCS plugs, and effective cable management situated on the ferry pontoons.
The handling of connectors during passenger turnarounds will be managed by the crew without relying on external support from a robot arm or other machinery.
The potential expansion of infrastructure needs to encompass up to nine Auckland ferry locations by 2030, contingent upon the availability of funding.
Nathan Cammock, Programme Director at Auckland Transport, expressed his feelings on leading the way: “It is incredibly exciting to lead the way with modern, low-emission public transport.”
“Our new Auckland-owned ferries will bring greater passenger capacity, improved accessibility, and a more consistent customer experience.”
Emphasising the efficiency of the charging process, Cammock highlighted that, during passenger boardings, each ferry will undergo a charging period lasting only five to 10 minutes. This approach not only minimises the size of marine batteries but also facilitates high vessel utilisation without the need for extended charging periods.
The Auckland installation will also be the first MCS supplied by ABB, adding to the company’s experience in delivering shoreto-ship power for over two decades. The solution mirrors ABB’s landmark project in Lisbon, Portugal, supporting 10 all-electric ferries for Transtejo Soflusa, and New Zealand’s first fully electric, high-speed passenger ferry, Ika Rere in Wellington, utilising ABB’s lower-power charging solution for electric vehicles.
While
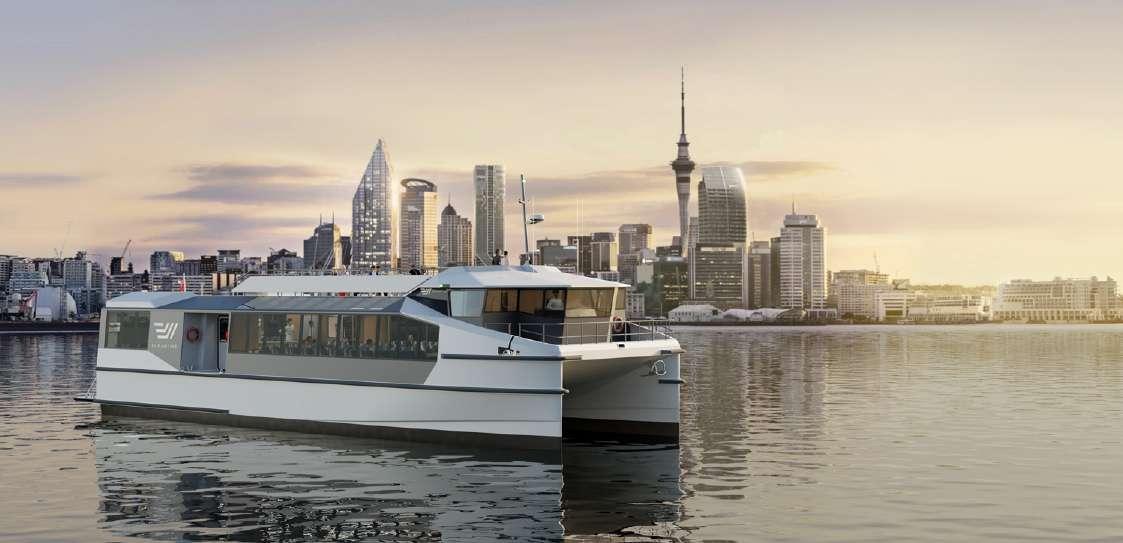
AT Chief Engineer, Murray Burt says, “ABB’s proven experience in delivering robust and high-performance ship charging solutions and their willingness to embrace the megawatt charging system were major considerations in AT’s choice.”
Palemia Field, Ferry Segment Manager at ABB Marine & Ports, says that as global ferry fleet electrification increases, ABB expects more operators to opt for a standardised interface that is familiar to other industries.
“Ferries connect communities and have a significant impact on the environment,” says Mr Field.
“Electrification is crucial, and we must move away from emissions-generating technologies. Noise-free and emission-free operations benefit both the broader and local communities, while passengers onboard enjoy improved travel comfort thanks to less vibration.”
Jeff McLaren, the Managing Director of Singer Electric, asserts that the project stands at the forefront of charging technology. He envisions it paving the way for other megawatt charging applications in New Zealand.
“Securing the AT ferry ship-to-shore charging solution with our global partner ABB is a significant step for Singer Electric in our quest to decarbonise buildings and transport in New Zealand,” says Mr McLaren.
Between 2019 and 2022 electric ferry orders made up 37 per cent of maritime battery capacity deliveries. A forecast from Spherical Insights suggests that the market for all types of electric ships will double in value by 2030, surpassing US$10.5 billion over a 2021 baseline.
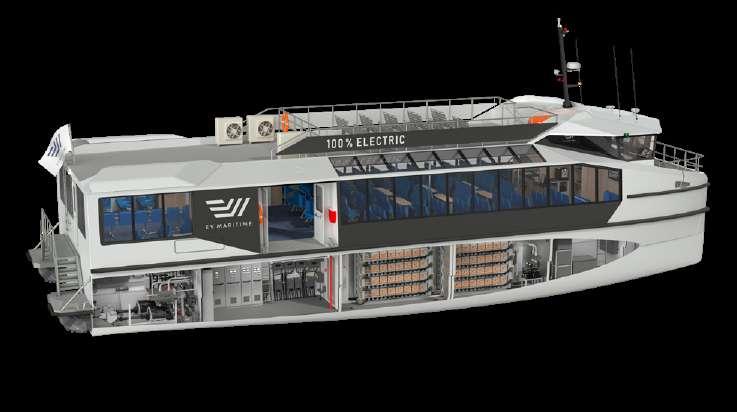
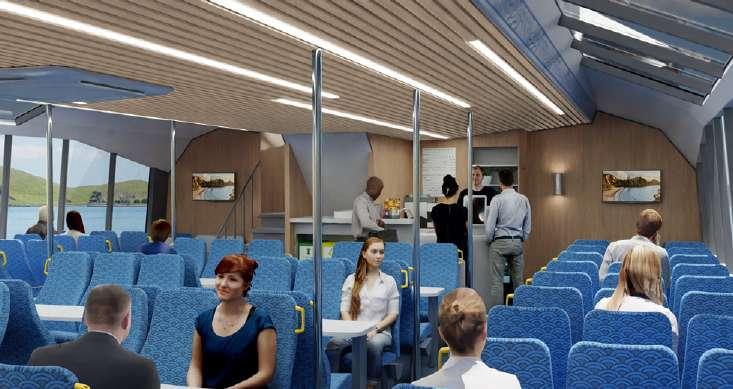
During passenger boardings, each ferry will undergo a charging period lasting only five to 10 minutes. This approach not only minimises the size of marine batteries but also facilitates high vessel utilisation without the need for extended charging periods.
ferries cater to just 6 per cent of public transport users in Auckland, their diesel engines contribute significantly to the city’s public transport greenhouse gas emissions. Electrification is key to curbing CO2 emissions by 4,000 metric tons, equivalent to the emissions generated by approximately 90 diesel buses each year. Five comprehensive charging solutions will be implemented at different ferry terminals, spanning the period between 2024 and 2025. Each system is set to include a duo of 1.65 MW chargers, incorporating transformers, ACS880 converters, MCS plugs, and effective cable management situated on the ferry pontoons.Auckland Mayor Wayne Brown answers Logistics & Transport NZ’s questions
1. What are some of the challenges faced by Auckland's transport network?
• Losing sight of ‘the basics’, like the road and rail maintenance needed to keep Auckland’s transport network in good order.
• Crippling congestion at peak times, which is spreading into other periods, causing unreliable journey times.
• Unreliable and slow public transport, which is not attractive enough to increase passenger numbers.
• Not listening enough to Aucklanders, when Auckland Transport (AT) designs and implements projects.
• Too much focus on headline-grabbing megaprojects, overshadowing more practical and cost-effective solutions.
2. Has the Auckland Integrated Transport Plan and its priorities changed in any way since the election of a new Government and Transport Minister?
Auckland Council’s priorities have not changed. The Northwest Rapid Transit is still a priority for us, and we understand that it’s a priority for the new Government based on its manifesto.
In the meantime, the Council is continuing to work on the Auckland Integrated Transport Plan. We expect to commence joint discussions with Transport Minister Simeon Brown on priorities in coming months.
3. Why is a partnership between local and central government important to improving Auckland's transport network?
A fundamentally different relationship between local and central government is integral to developing an aligned and integrated policy and investment strategy for Auckland’s transport network.
Auckland has been held back by fragmented decision-making, and lack of a vision and strategy agreed by both central and local government. The transport funding model is broken. Even when projects are agreed, funding is tied up and relitigated. And headline-
grabbing megaprojects have overshadowed more practical solutions and the preservation of our existing transport network.
What’s needed to improve Auckland’s transport network is: a framework for central and local government strategic alignment, collaboration, and coordination; new partnerships and joint investment across strategic priorities required to unlock growth; and, agreement on legislative and regulatory change to support Auckland, unlocking new funding tools and a fairer share of revenue.
The Auckland Manifesto (https://shorturl.at/ cy246) outlines why our region and the new Government need to work together, focusing on the Integrated Transport Plan and a proposed City Deal.
4. Following Auckland Council's Transport and Infrastructure Committee decision not to support the Waitematā Harbour Crossing, what plans do the Mayor and Council have for a potential second harbour crossing in the future - if any?
We do not yet know the new Government’s position on a proposed Waitematā Harbour Crossing, although Transport Minister Simeon Brown has told NZTA that ‘a more realistic and cost-effective proposal for
the Waitemata Harbour Crossing should be investigated to focus more on better connectivity and resilience’.
The Mayor welcomes the Minister’s call for a rethink of the previous overly-expensive project, and would like to work with the new Government to determine the scale of investment and priority of a proposed Waitematā Harbour Crossing as part of the Auckland Integrated Transport Plan.
 Wāhanga Tuarima: Te Haumitanga Matua
EASY2C, WITH ITS IMPRESSIVE 90-year track record across New Zealand and Australia, stands at the forefront of this revival.
beat the value that calendars offer businesses,’ says Walmsley, CEO at easy2C Calendars & Promotional Products. much else that gets you the same sort of year-round the cost of a coffee.’ Enjoying daily prominence in offices, these promotional gems fortify your brand customers consult them for schedules, deadlines, and Affordable and functional, they’re the strategic choice businesses aiming for extensive and enduring advertising impact.
brand with calendars — a powerful, budget-friendly keeps your business at the forefront of customers' minds the year.
on 0800 225 363 or check out our extensive range at www.easy2c.co.nz
According to Steve Walmsey, CEO at easy2C, the company designs and manufactures over 150 different styles of calendars, ranging from wall calendars to showcase inspirational imagery, to desk calendars for quick date referencing, to waterfall calendars for that long range perspective.

‘Whatever you need, our team of 72 across New Zealand can help. We collaborate closely with our customers to grasp their needs, identify the designs and styles that will best suit their business, and assist with a comprehensive distribution plan,’ says Walmsey.
As industry leaders, easy2C has long understood the many benefits of calendars as a powerful and costeffective branding tool.
For calendar enquiries contact 0800 225 363 or enquiries@easy2c.co.nz

The classic calendar has defied the digital age and reemerged as a vital tool in the world of logistics and transportation. Calendars
As industry leaders, easy2C has long understood the many benefits of calendars as a powerful and cost-effective branding tool.
