Logistics & Transport
Volume 22 Issue 1 September 2023
Making New Zealand’s freight system more efficient, reliable Setting out how funding will be allocated for transport activities in 2024 NZ Domestic Transport Costs and Charges Study - Key Features and Findings $15.00 THE OFFICIAL PUBLICATION OF CILT NEW ZEALAND
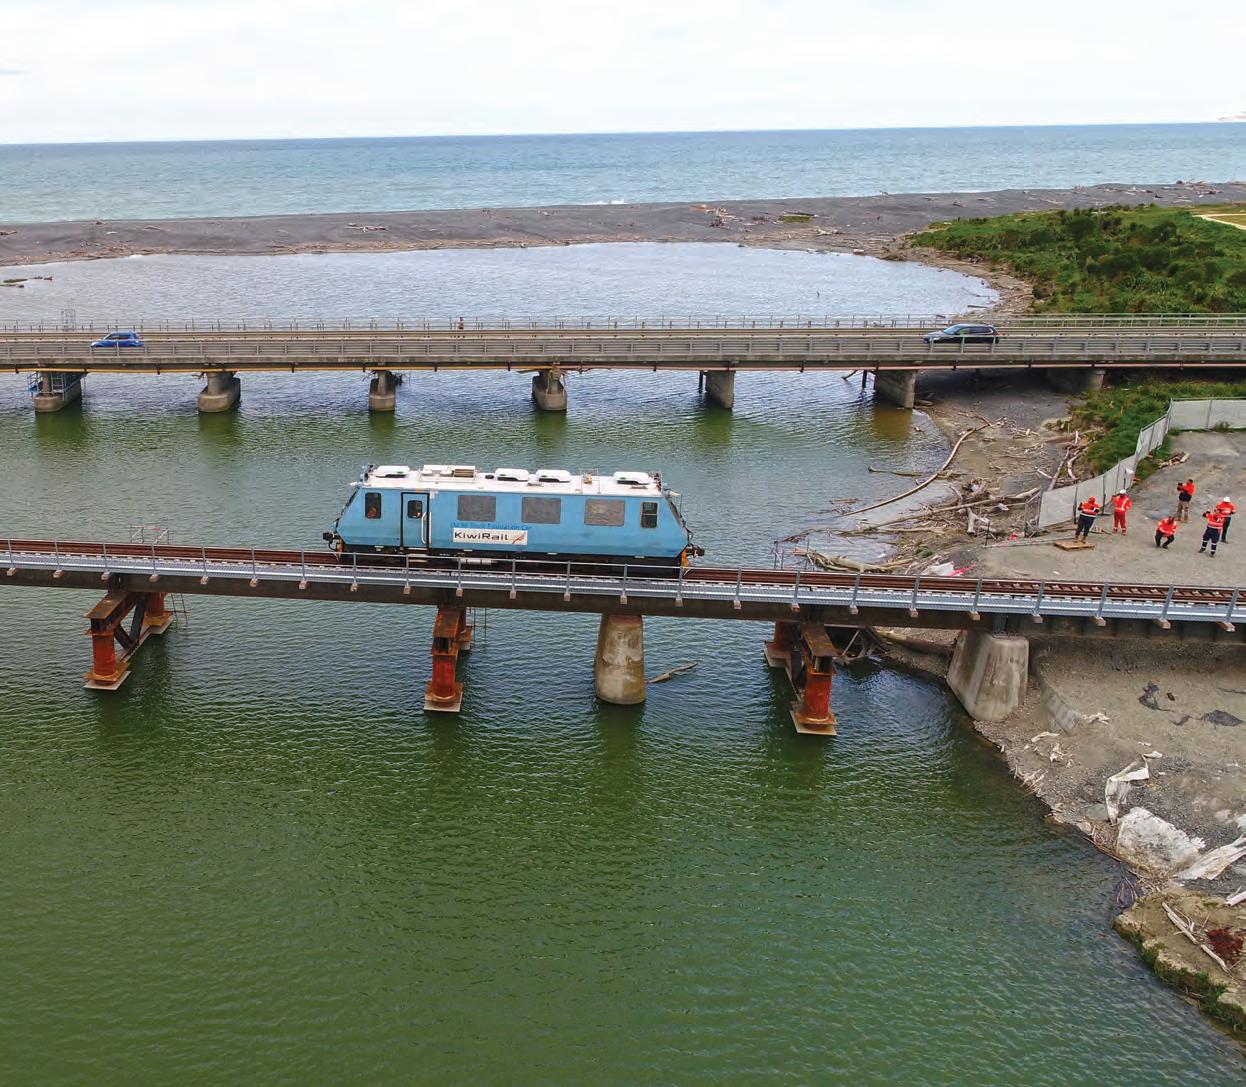
A temporary bridge #217 at Awatoto was opened on 15 September, months ahead of estimates, following measurements by the Track Evaluation Car EM80, the first rail vehicle to cross the bridge, and a test train the next day. The line is now reopened to Napier.
SPREAD THE WORD ABOUT CILT … If you enjoy reading this magazine and think others would too, please share it with others – leave it on the coffee table at work, or out at reception.

ON THE COVER
& TRANSPORT NZ IS THE OFFICIAL JOURNAL OF THE CHARTERED INSTITUTE OF LOGISTICS & TRANSPORT NZ 13 Contents 15
the next edition The editorial
welcomes expressions of interest for submitting an article for the December 2023 edition of this journal, especially from young professionals (those under the age of 35). Contributors should in the first instance
convenor,
King (email
December 2023
10 2023. 8 4 Published under contract (print) by: Excel Digital 21 Jamaica Drive, Wellington 5028 Tel: 04 499 0912 Email: studio@exceldp.co.nz Advertising Contact: CILT national office Tel: 09 368 4970, Email: info@cilt.co.nz Editorial Contact: James Paul, The PR Company Tel: 022 514 0716 Email: james@theprcompany.co.nz CILT NZ National Office: PO Box 1281, Shortland Street, Auckland Tel: 09 368 4970 Fax: 09 368 4971 Disclaimer: This publication is the official magazine of the Chartered Institute of Logistics and Transport New Zealand Inc (CILT NZ). It is published quarterly. All material appearing in this publication is copyright and may not be reproduced without the permission of CILT NZ. The views expressed in this publication are not those of the editorial committee, CILT NZ, its council, officers or The PR Company, unless expressly stated as such.
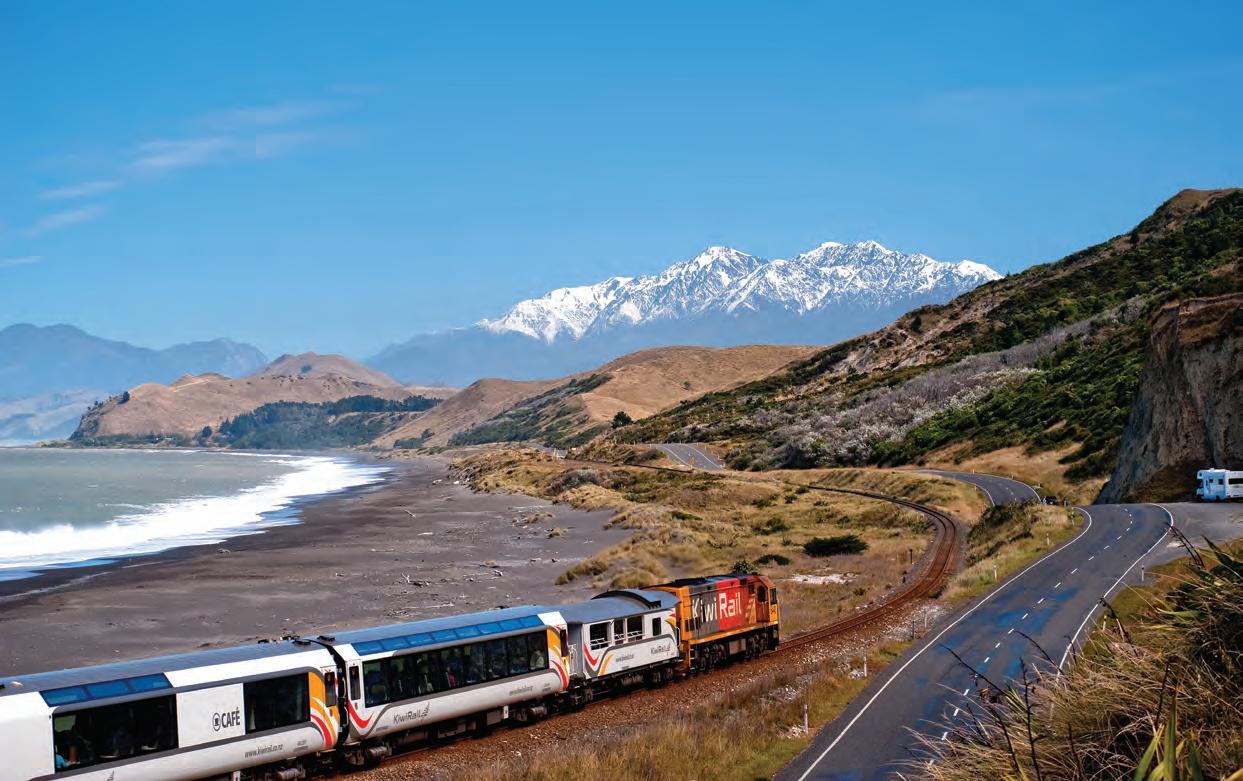
PHOTO: KiwiRail
LOGISTICS
In
team
contact the editorial
Murray
murray.king@xtra.co.nz) to discuss their article. Deadline for the
edition: November
Also published under contract (web) by: Webstruxure 29 Tory St, Wellington Tel: 04 801 7053 Email: hello@webstruxure.co.nz Web: webstruxure.co.nz Making New Zealand’s freight system more efficient, reliable .........................3 18,000 skilled workers urgently needed for logistics sector ............................ 5 New Zealand’s first fully automated third-party logistics warehouse to open in late 2023 .....................................................................................................7 Restoring and reinvigorating rail in New Zealand ............................................... 9 The Future Is Rail Conference – Wellington 28 June 2023 ................................. 11 Setting out how funding will be allocated for transport activities in 2024 ........................................................................................................ 13 NZ Domestic Transport Costs and Charges Study - Key Features and Findings ................................................................................................................ 15 Promotional calendars: A tool for boosting business ...................................... 19 2023 CILT Annual Forum and Awards Dinner ..................................................... 20
Making New Zealand’s freight system more efficient, reliable
BY JAMES PAUL
THE FREIGHT AND SUPPLY CHAIN system faces substantial changes over the coming years, including from climate change, geopolitical volatility, new technologies, and growing population and densification. But a new strategy sets out goals and focus areas for the next three, 10 and 30 years.
New Zealand’s first-ever national freight and supply chain strategy hopes to improve the productivity and resilience of the country’s ports, freight and shipping sectors. So said the Minister of Transport, David Parker, at the strategy’s launch last month at the Ruakura Transport Hub in Hamilton.
Dubbed Aotearoa New Zealand Freight and Supply Chain Strategy: Preparing our freight and supply chain system for the future, the 62-page document serves as a blueprint for how New Zealand can become more flexible and competitive in the face of recent disruptions, like COVID-19, severe weather events, and other geopolitical roadblocks.
The strategy identifies four new work programmes that centre around ports, road freight and shipping decarbonisation, supporting data sharing through connected systems, and preparedness against disruptions and disasters.
A joint government and industry initiative, the strategy is underpinned by aspirations such as zero-emissions freight transport; resilient, reliable, and prepared for potential disruptions; and highly productive and efficient. It outlines what needs to be done over three timehorizons, three, 10 and 30 years.
Mr Parker said the strategy shows that a more collaborative approach is needed to resolve issues in the freight and supply chain system. The system is complex and no single agency, organisation, or business can affect the necessary improvements on its own.
Between 2007 and 2017, climate changerelated floods and droughts cost the New Zealand economy an estimated $840 million, while the extreme weather events of early2023 severely damaged freight infrastructure and triggered a national state of emergency.
New Zealand’s transport sector is our biggest emitter, producing 40 per cent of the country’s domestic carbon emissions and
around a quarter of that is produced by trucks. Therefore, moving to a zero-emissions freight transport system will help New Zealand meet its goal of net-zero carbon emissions by 2050.
Under Aotearoa New Zealand’s first Emissions Reduction Plan, the country's freight system
will need to emit 35 per cent fewer carbon emissions by 2035 than it did in 2019 – a challenging task as freight volumes are also projected to increase by approximately 20 per cent in that timeframe.
Cont. on page 4 September 2023 3
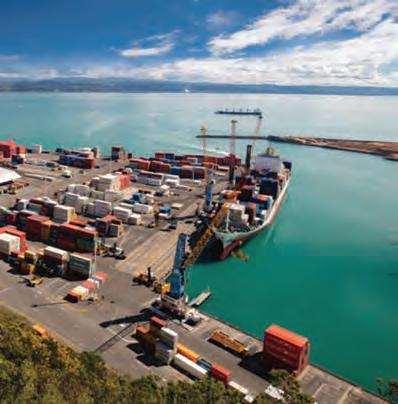
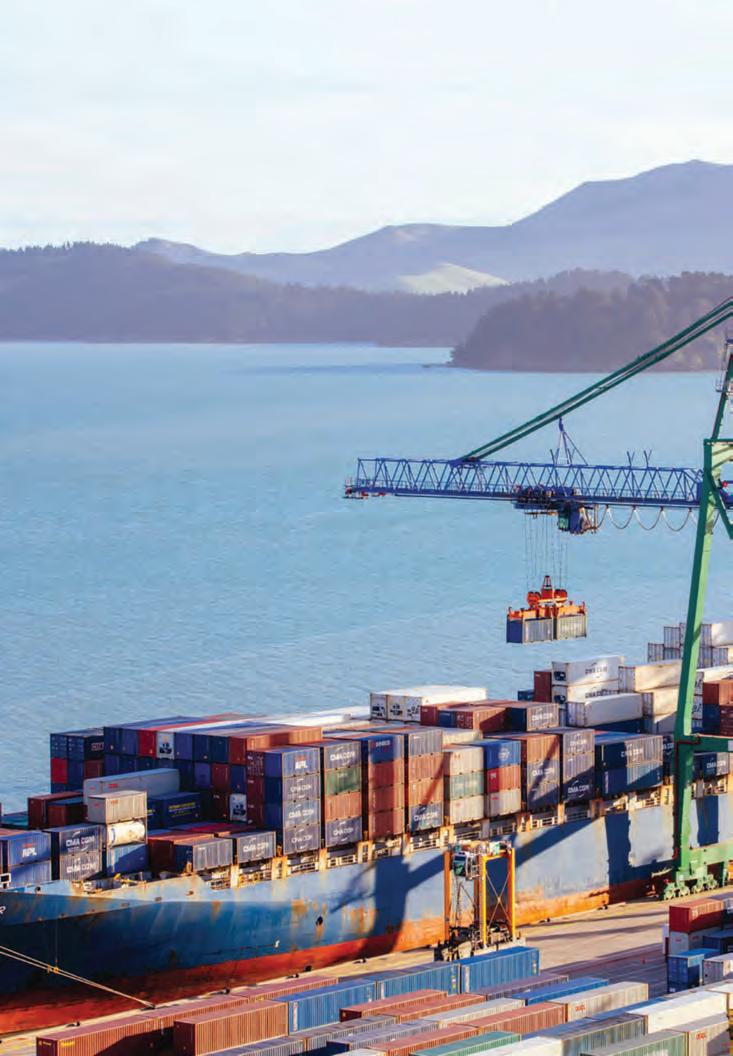
The freight and supply chain system faces substantial changes over the coming years but a new strategy sets out goals and focus areas for the next three, 10 and 30 years. Photos: Ministry of Transport
“The Aotearoa New Zealand Freight and Supply Chain Strategy identifies four new work programmes that will commence now,” Minister Parker said.

“This work will help to ensure that New Zealand’s freight system … makes better contributions to the country’s climate goals.
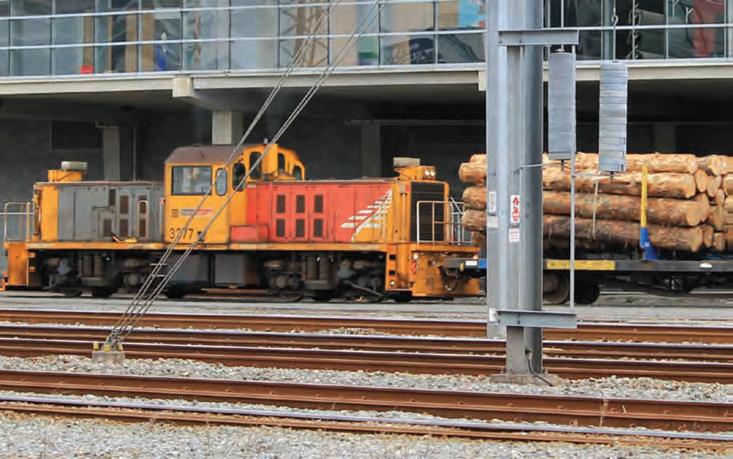
“Work in these areas will include identifying strategic freight corridors and looking at operating models. It will include work to set up a grant scheme for clean heavy vehicles, and policy changes to better enable them to operate on our roads.”
Part of the road freight decarbonisation work programme also includes partnering with the Sustainable Business Council on a feasibility study into “a market-led low-carbon freight mechanism”. Other initial actions the strategy lays out are identifying and investing in freight data needs based on the priorities of different public and private sector stakeholders.
The strategy also hopes to establish a partnership with the freight and supply chain sector to support mutual data sharing, while maintaining its relationships with key international partners to share information and assessments, and strengthen lines of communications for disruption preparedness.
Supporting the establishment of green shipping corridors for zero-emissions maritime freight by 2035 is also a plank of the strategy’s initial actions under its “international engagement” focus area.
Understandably, ports will play a crucial role in the strategy from the get-go; the Government wants to undertake an analysis of alternative port models and strategic freight vulnerabilities, and develop a spatial analysis of port connections that supports future regulatory and investment decisionmaking.
“To do this we will identify strategic freight corridors and analyse the role they play in achieving different government objectives.
“Through the resource management system reform we will work to underline the strategic importance of ports to our economy and society. Part of this includes working on new Regional Spatial Strategies.
“The new National Planning Framework will also be an opportunity to emphasise the critical role of ports.”
In addition, the nature of land use is also likely to change over time, as climate, demographic, and other systematic changes affect what is and can be grown, manufactured, and transported across the country.
To avoid missing opportunities for economic development, freight infrastructure and
services will need to be invested in to ensure this land use change is well served by our supply chain system.
If we achieve this, the strategy states, we will be able to monitor how the system is performing, spot major disruptions early, and have plans ready that allow us to respond effectively.
It is sorely needed as the World Bank’s Logistics Performance Index ranked New Zealand’s logistics system as the 26th best in the world in 2023, a decline from 15th in 2018. Consultations with stakeholders have revealed nine long-standing issues in the system.
These endemic issues include siloed decisionmaking between central and local government; little supply chain knowledge among New Zealand’s small and medium sized enterprises; insufficient commercial incentives to build resilience and reduce emissions; a workforce shortage; and a limited influence on the world stage.
But freight industry bodies National Road Carriers Association (NRC) and the NZ Trucking Association (NTA) called the strategy a pragmatic document and where we need to go.
NRC GM Policy & Advocacy James Smith says the freight and supply system has been lacking the aspirational targets this document brings and the time horizons in the document are helpful.
“The collaborative focus of the strategy is what is necessary to face the challenges the strategy outlines. There has been a lack of government leadership in this area and this document is filling that vacuum,“ says Mr Smith.
NTA CEO David Boyce says the strategy recognises the importance of the freight and supply chain sectors’ contribution to New Zealand’s economic wellbeing.
No single agency, organisation, or business can affect the necessary improvements in the freight and supply chain system on its own. So, the new strategy is a collaborative approach.
4 Logistics & Transport NZ
To avoid missing opportunities for economic development, freight infrastructure and services will need to be invested in to ensure land use change is well served by our supply chain system.
18,000 skilled workers urgently needed for logistics sector
THE WORKFORCE SHORTAGE of around 4,700 employees in New Zealand’s logistics and freight sectors is expected to widen to about 17,900 people by 2028 (a nearly 290 per cent increase), according to a report conducted on behalf of the Manufacturing, Engineering and Logistics Workforce Development Council Hanga-Aro-Rau (WDC).
Titled Workforce development needs in New Zealand’s logistics sector, the findings by Deloitte highlight the logistics sector’s struggles to attract and retain workers –having lost thousands of employees to other industries and overseas roles over the past two years.
Samantha McNaughton, Deputy Chief Executive of Hanga-Aro-Rau, says a functional freight and logistics industry underpins the growth of every sector of the economy. The report identifies a number of systemic issues facing logistics firms and calls for the immediate introduction of an industry-wide strategic approach to reduce barriers to training, she says.
“The logistics sector covers the movement of goods throughout our national and international supply chains – including order processing, inventory management and distribution across our air, sea and land ports.
“This industry acts as a critical enabler and lynchpin in the economy – intersecting and supporting the growth of every other sector in some way. The new report shows the pandemic has accelerated the adoption of automation within logistics firms as they attempt to mitigate the international impact of skilled labour shortages.
“Rather than reducing the size of the workforce, these new technologies are changing the nature of the roles within the industry and are creating opportunities to grow through a more gender and culturally diverse workforce as well as facilitating the entry of more disabled workers into the sector for the first time.”
Deloitte used several research methods to compile the report’s data, including a desktop literature review of existing research compiled
by Hanga-Aro-Rau; engagement with key stakeholders from across the industry; and gathering relevant data from Stats NZ.
Deloitte’s labour force projections show labour demand outpacing labour supply, and the 17,900 workforce gap is widening faster than the manufacturing and engineering forecast. Comparatively, the skills shortage in the manufacturing and engineering sectors is set to grow by 38 per cent to 40,000 workers by 2028.
“This [logistics workforce] gap arises from difficulties in recruiting people both locally and overseas in a highly competitive labour market. The disruption caused by COVID19 has led to high attrition rates among the youngest and oldest cohorts of employment in logistics due to work preference changes,” the report notes.
Cont. on page 6 September 2023 5
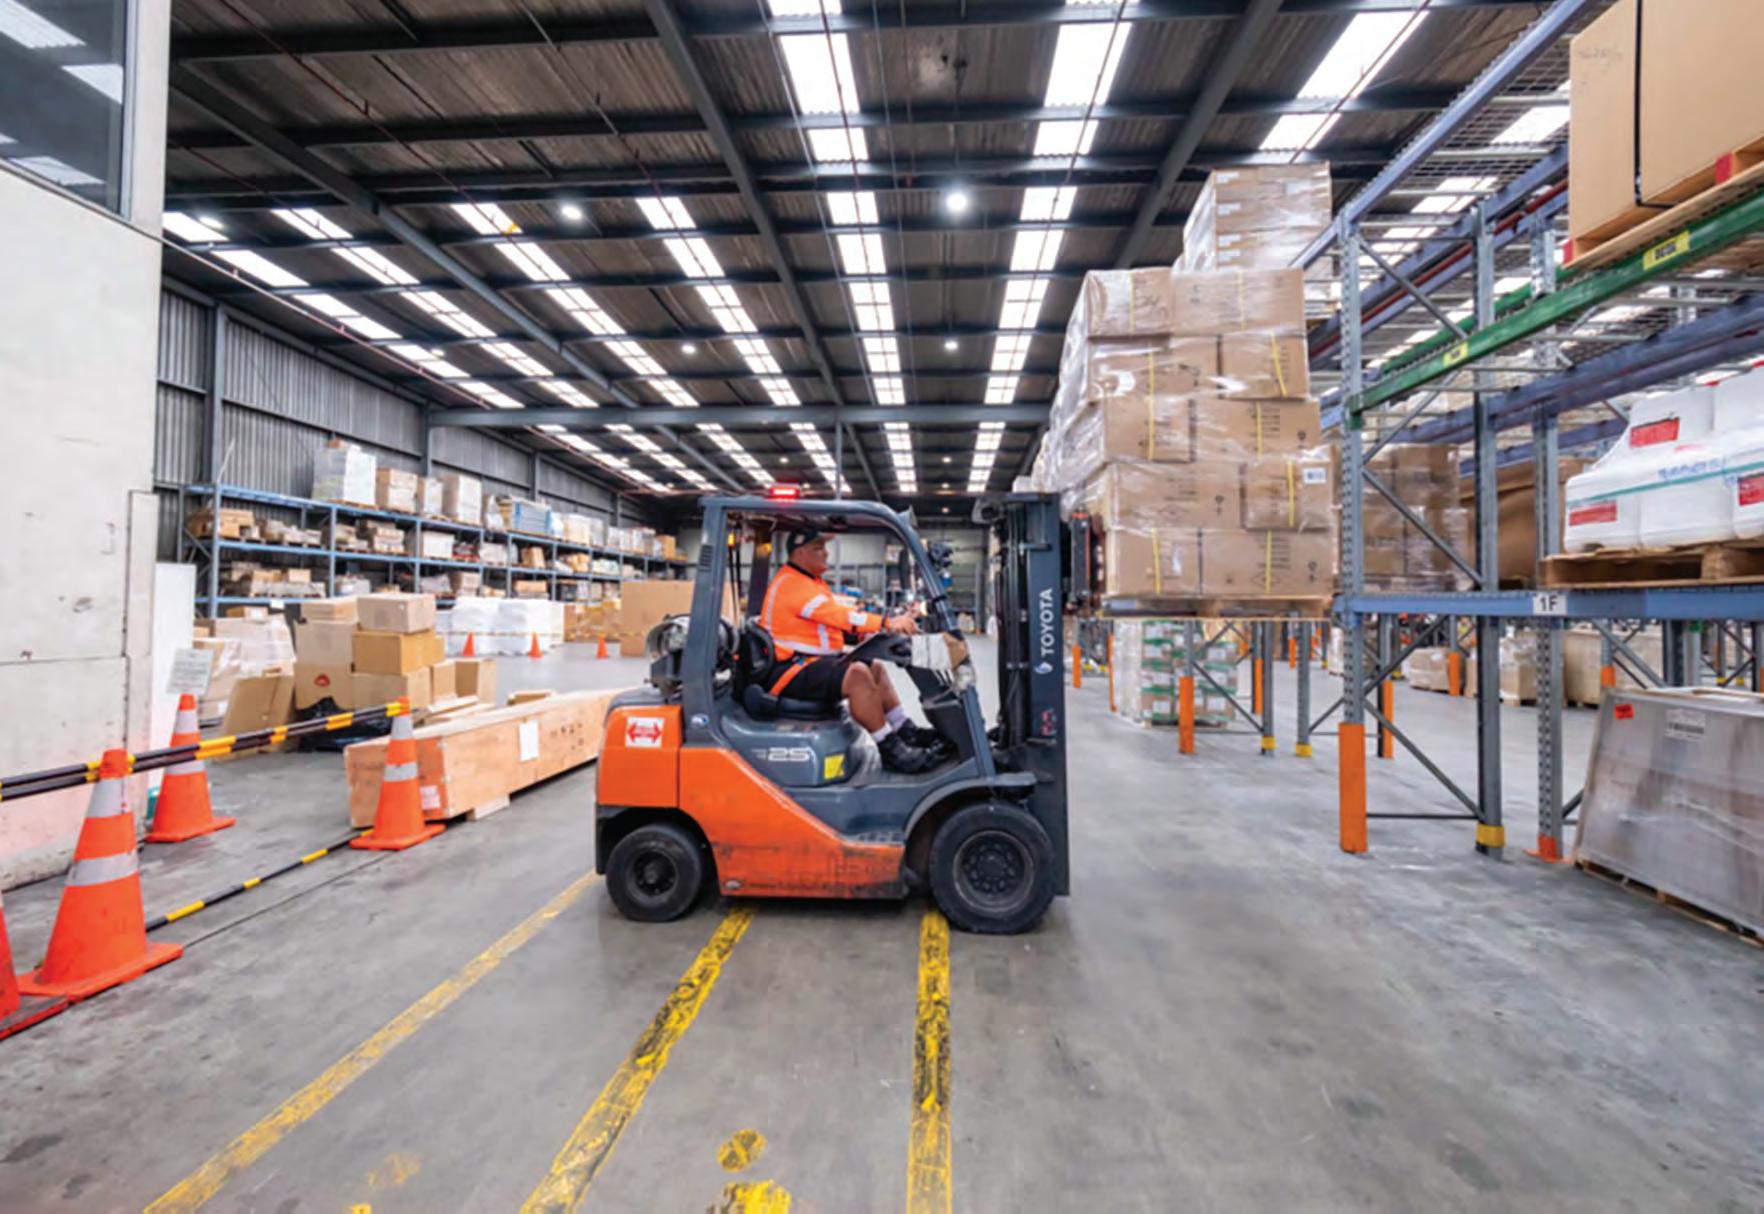
A new report identifies a number of systemic issues facing the logistics and freight sectors, and calls for the immediate introduction of an industry-wide strategic approach to reduce barriers to training. Photos: Hanga-Aro-Rau
While some employers invested in technology to improve productivity, transitioning the current workforce to meet the changing skills required to meet the demands brought by automation, for example, was also of huge importance.
The workforce’s skills should evolve alongside the sector’s adoption of new technologies and ways of working, but some employers were filling these more skilled roles with migrants. Other employers noted there is a need to increase the delivery of internal training programmes, specifically in data sciences and analysis, so as to upskill local employees.
“While the approach differed across companies, there is a growing demand for skills that the current workforce is unable to meet,” the report reads.
“With the changing nature of roles within the sector, stakeholders highlighted the increased value on the softer skills that support teamwork, leadership and customer-facing roles. With the increase in demand for these skills, businesses can see the opportunity to increase workforce diversity through recruitment or promotion into these roles, especially for women.
“In addition to technical skills, stakeholders highlighted the importance of investment in basic job-readiness skills. Many have highlighted the need to better partner with education providers to deliver the skills needed and remove barriers for young people.”
The report also identifies key workforce trends in the logistics sector including, for example, the ageing nature of the workforce. Between 2020 and 2022, average annual employment in the 15 to 24 age cohort declined by 22 per cent,, while some of those aged over 65 left the industry or retired early because of COVID-19 (decreased by 3.1 per cent over the same period).
“Stakeholders noted that without a clear pipeline from secondary or vocational providers, SMEs will continue to struggle to attract young talent and build a sustainable workforce.
“Further, engagement highlighted the disconnect between the workforce training and upskilling required, and the availability of training offered. Many employees perceive the sector as a stepping stone to other jobs and therefore do not take part in training that would advance and grow the workforce over time.”
To this end, the report suggests there is an opportunity to reach more sustainable workforce levels with targeted investment in building a workforce pipeline of school leavers.
“Noting declining numbers of those aged 15–24, research into where this cohort is going
or where they are choosing to start their careers instead of logistics may assist HangaAro-Rau in developing initiatives to increase the attractiveness to the 15-24 age cohort into the logistics sector,” the report suggests.
“The sector needs a logistics pipeline strategy and engagement approach with employers, industry bodies, secondary and tertiary providers to develop a sustainable pipeline into the sector.”
Regarding ethnicity, the Ma - ori and Pacific peoples workforce is growing and there is significant opportunity to ensure the sector and its employers are better equipped to realise the full potential this particular group of the workforce has to offer.
However, there are systemic barriers that limit Pacific peoples’ ability to take advantage of career progression and training opportunities. These include the current performance and assessment structures, availability of training in Pacific languages, and inequitable treatment in the workplace.
The analysis also highlights the disparity in skill levels across ethnicities, and what a likely skills shift for Ma - ori and Pacific peoples could look like to address this inequity.
“The availability of cultural competency training will be a key tool to tackling inequity in the workplace. Stakeholders highlighted cultural differences as a potential source of friction, and education on these matters had contributed to greater workplace wellbeing.”
Additionally, the report suggests there are opportunities for Hanga-Aro-Rau to work with the sector to influence the design of training and development that better reflects the unique needs of diverse groups, and cultural and language requirements.
The report was presented at a summit on June 1 where employers, industry stakeholders, government, and vocational education participants collaborated on developing solutions to the skills shortages and workforce development challenges faced by the sector.
6 Logistics & Transport NZ
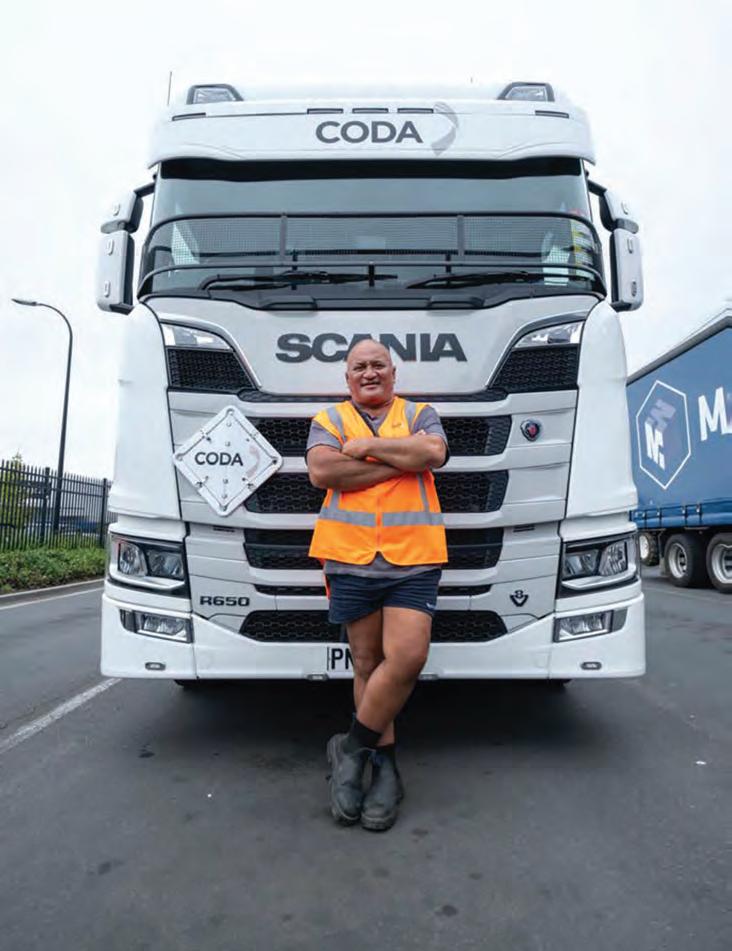
A report by the Manufacturing, Engineering and Logistics Workforce Development Council Hanga-AroRau identified key workforce trends in the logistics sector including the ageing nature of the workforce.
New Zealand’s first fully automated third-party logistics warehouse to open in late 2023
MASSIVE CAPITAL INVESTMENT in New Zealand supply chain infrastructure will mean 115,000 automated pallet capacity to be available in Auckland by June 2025, with an additional similar 45,000 automated pallet Christchurch site under design.
Cardinal, the country’s largest privatelyowned third-party logistics (3PL) company, has announced it is developing New Zealand’s first-ever fully automated 3PL warehouse in Drury, believed to be the largest of its type in the Southern Hemisphere.
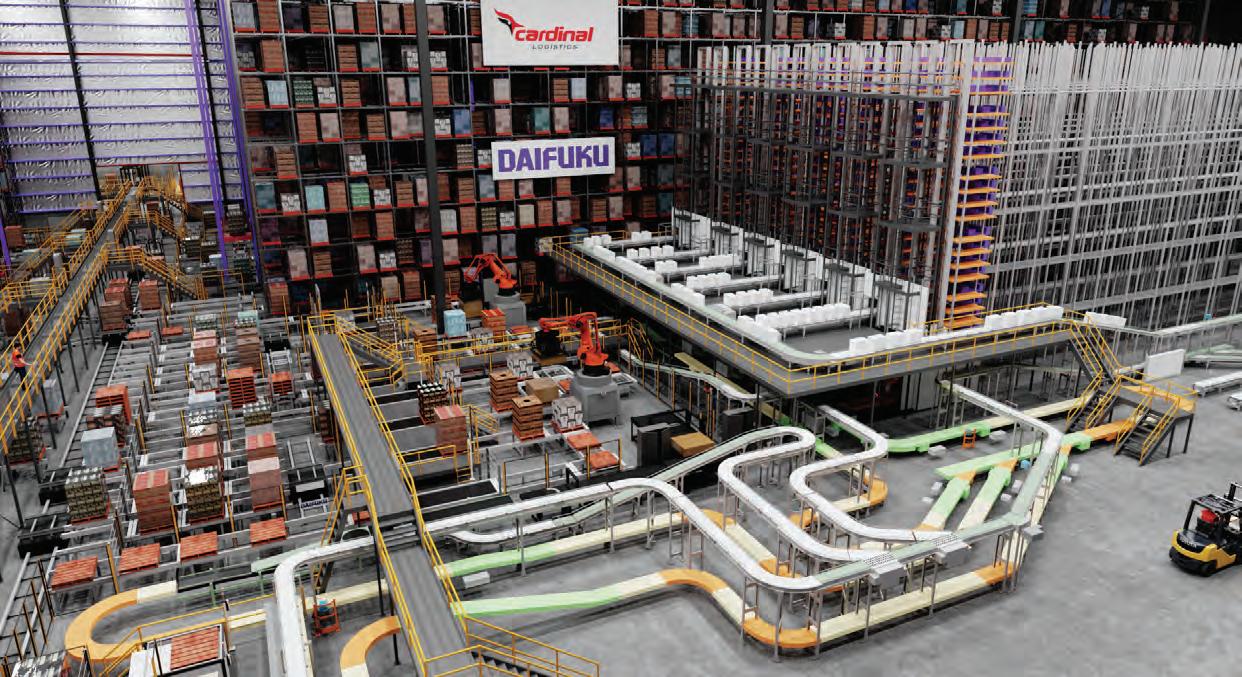
The innovative new facility is set to improve order processing times by up to 400 per cent. The total infrastructure, property and automation investment will be around $450 million over a five-year period and is part of a wider multi-billion industrial development in Drury.
While speed is important, the core focus of Cardinal’s Drury development is to improve productivity and customer service delivery, lower costs, reduce waste, and increase customer confidence in delivery.
Its innovative automation technology will enable the smoothing of peaks in demand, meaning an optimised and lower-cost New Zealand supply chain for Cardinal partners and for end-consumers, at a time when national supply chain infrastructure struggles with peak volumes.
Cardinal Chief Executive Brendon Furness says Covid-19 and recent extreme weather events like Cyclone Gabrielle have highlighted the critical importance of New Zealand having more resilient infrastructure.
“This investment is the first of its kind for New Zealand’s highly competitive logistics industry and will provide more resilience and efficiency at the customer end of supply chains.
“We think technology and innovation can transform the future of New Zealand supply chains. Large-scale infrastructure investments in automation like this will help flatten out the surges of volume that can occur when another part of the supply chain is constrained.
“Combine that with more collaborative use of data analytics and AI in areas like demand planning and forecasting, and we expect to see much better and faster logistics decision-making, which will ultimately benefit consumers.
“Automation and robotics in warehouses are now proven technologies in other markets, however, this is the first investment of this scale in automated logistics technology here in New Zealand, and we think the new facility will revolutionise carton warehousing.
“It will also drive sustainability and waste minimisation, with the use of innovative technology that will have the use of plastic shrink-wrap, and with smarter transport and
warehouse utilisation that reduces emissions. The warehouse will also feature solar roof panels, capable of generating 1.4 MGW, enough to power around 220 homes.
“This is a long-term strategic investment supported by rising market demand, increasing supply chain costs, and the emergence of leading new automation technologies.
“These technologies will also reshape how we invest in our people to operate and maintain what we believe will be the fastest and most accurate pallet management and carton picking system in the country.”
Construction is underway and will feature:
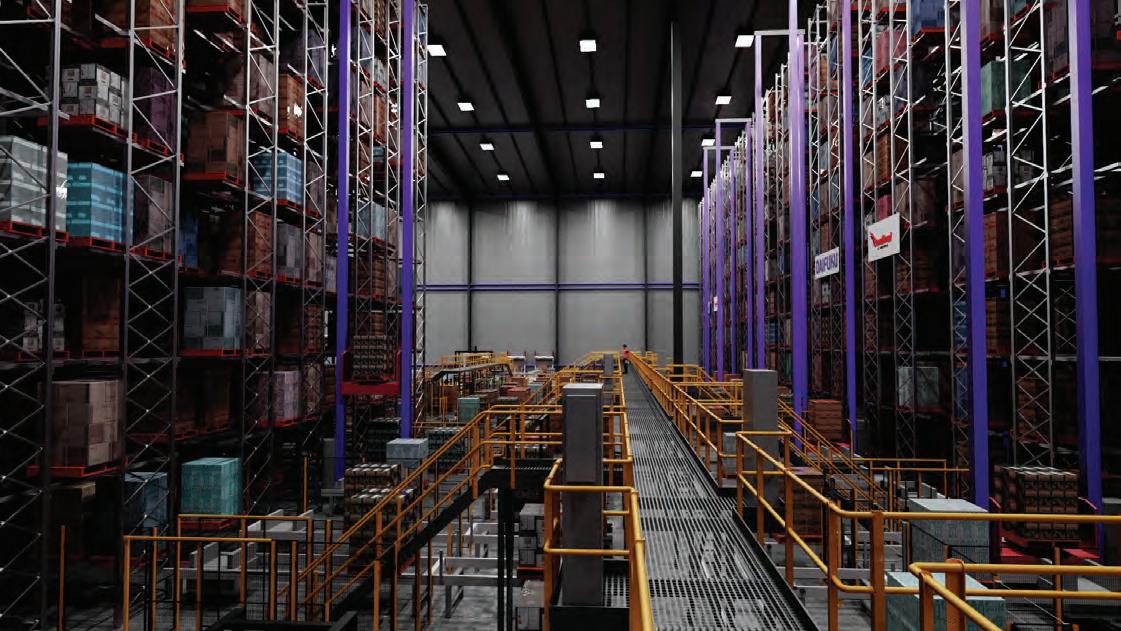
• a central distribution hub filled with highspeed pallet cranes and rapid sorting vehicles, with 115,000 automatic storage and retrieval system (ASRS) pallets;
• an integrated buffering system with capacity to handle 62,000 cartons provides for automated carton picking on a massive scale; and
• automated technology will move products to pallets and into trucks at high speed.
This will all be housed in a six-hectare building with a 25-metre ceiling height – one of the tallest warehouses in New Zealand – to allow room for the robotics.
Cont. on page 8 September 2023 7
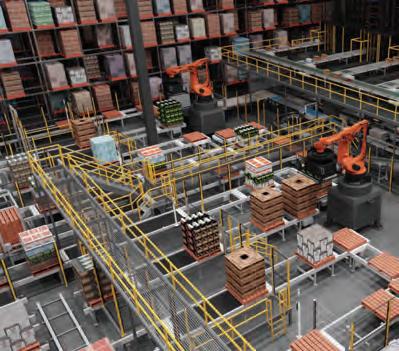
Cardinal, the country’s largest privately-owned third-party logistics (3PL) company, has announced it is developing New Zealand’s first-ever fully automated 3PL warehouse in Drury, near Auckland. Photos: Cardinal
Delivery of the Drury project is broken down into three stages. The first stage will be completed in December 2023 and will deliver 12,000 ASRS pallets. Stage two is due for completion in December 2024 (a further 48,000 ASRS pallets) and stage three in June 2025 (the last 55,000 ASRS pallets) respectively. Another 45,000 pallet project in Christchurch is already in the pipeline.
When operational, an order will be placed into the automated system, robotic cranes will retrieve specific cartons from their location and will, based on their weight, deliver them in the right order to the correct pallet, to be packed and then dispatched. How delivery trucks are packed will be determined by the AI system and will be based on the best route to reach each customer.
Cardinal has partnered with the worldleading automated material handling solutions provider, Daifuku. Daifuku aims to deliver automation that inspires and will provide all the high-tech machinery and infrastructure to run the warehouse along with a shuttle system capable of moving individual cartons through the warehouse at nearly 200 metres a minute.
This move towards automation is not the first for Cardinal. In 2022, they pioneered the Perfect Pallet program. Using smart technology to weigh products onto pallets and track their accuracy through the delivery process, Cardinal can load multiple customer products on the same pallet.
BY NAPIER PORT
Viewpoint Supply Chain – your visible advantage for supply chain services

Launching in September 2023, Napier Port is excited to introduce Viewpoint – a uniquely integrated supply chain service that offers landside warehousing and transport solutions to customers.
Built with flexibility and agility in mind, Viewpoint’s visibility of the supply chain enables it to provide tailored solutions for customers to deliver better value and take waste out of the logistics network.
Viewpoint’s solutions are fully integrated and coordinated, including landside road and rail transport, domestic coastal shipping, freight warehousing, bulk storage, container storage, product packing, de-vanning and cross-dock, as well as solutions for bulk and containerised cargo.
The team understands global and domestic supply chains and has built trusted relationships with a wide range of partners. Together with the visibility of the supply chain, it is these networks and relationships that enable Viewpoint to provide a highly personalised service, with tailored freight and logistics solutions for customers.
Viewpoint’s services:
1. Supply chain design, implementation and management
a. We provide supply chain solutions from site to sea for the export and import of containerised and bulk cargo.
2. Landside transport and coastal shipping
a. Multi-modal transport solutions to and from Napier Port customised to meet customer needs – dynamically managed to minimise supply chain lead time.
3. Warehousing
a. Fully compliant, MPI-approved transitional facilities and bulk storage solutions.
b. Cargo is packed and unpacked to align with shipping schedules to minimise dwell time.
4. Export container packing, import container de-vanning and cross-dock
5. Cargo from trucks and rail wagons is packed into containers for export from Napier Port; import containers are unpacked and loaded for road and rail transport.
Contact the Viewpoint Supply Chain team today to discuss efficient, customised options for your import and export cargo in the North Island viewpoint@napierport.co.nz
The automated 3PL warehouse will be housed in a six-hectare building with a 25-metre ceiling height – one of the tallest warehouses in New Zealand – to allow room for the robotics.
8 Logistics & Transport NZ
Restoring and reinvigorating rail in New Zealand
 BY DR DUNCAN CONNORS
THE PUBLIC DEBATE on rail transport in New Zealand has a problem: fantasy dominates reality. A body of biased statements both for and against dominates the national discussion. There are two reasons for this: a teary-eyed romanticisation of a global age of rail travel that never existed, and a hard-nosed view of infrastructure spending that values penny scrimping over the necessity. Both are detrimental to the development of rail and modern infrastructure.
However, that we can have a modern rail infrastructure in New Zealand fit for a modern affluent country is down to one simple fact: New Zealand’s narrow gauge, running on single track lines and steep terrain is no different from the successful rail passenger and freight networks found in Japan, Taiwan, South Africa, Queensland, Western Australia and in isolation in Southern Africa, Latin American and the Europe Union
that use the same 1067mm ‘Cape’ gauge. New Zealand must abandon the fantasy to embrace the orthodoxy underpinning rail in every major Western economy and do so in the national interest.
We must adopt technology from overseas. In the South Island, we ordered 57 DM class locomotives made in Spain by Swiss company Stadler, a company specialising in narrow gauge rolling stock1. Prior to this, the Chinese-made DL class locomotive caused controversy; whilst a cheaper alternative to buying from an established manufacturer, the class led to massive remedial costs for KiwiRail, not least the asbestos embedded across the locomotive’s structure2. In passenger rail, we have an advantage based upon the use of a 1067-millimetre gauge. Japan may be famous for its shinkansen highspeed lines3, but the majority of intercity and regional passenger rail is on narrow gauge
lines the same as ours, running on curving tracks through mountainous regions using tilting technology to reach speeds of up to 180kph on some stretches. Certainly, average speeds are in the region of 120kph. This technology was the basis of the highly successful tilt train used in Queensland and would be simple to introduce here4
So why not adopt this technology in New Zealand? In theory, ordering a fleet of the best freight and passenger trains from Japan, Switzerland, France or Germany as a single standardised fleet of freight locomotives and passenger railcars makes sense. However, what is the issue? In short: our political culture and how it impacts spending decisions.
Cont. on page 10
1 Stadler DM Class Kiwirail: https://www.stadlerrail.com/es/media/article/stadler-and-kiwirail-sign-a-contract-for-57-mainline-locomotives/972/
2 DL Class KiwiRail issues: https://www.rnz.co.nz/news/national/418739/kiwirail-defends-troublesome-diesel-locomotives-and-wants-to-buy-more#:~:text=The%20 corporation%20says%20it%20needs,were%20found%20to%20contain%20asbestos
3 Japanese Tilt Trains: https://www.railjournal.com/fleet/jr-central-to-introduce-new-generation-tilting-technology-in-series-385-prototype/
4 Queensland Rail Tilt Train: https://www.queenslandrailtravel.com.au/railexperiences/ourtrains/tilttrain
Rail travel will not succeed without government support, but it will also not succeed without a strong private sector, Dr Duncan Connors says.
Photo: Waka Kotahi NZ Transport Agency
September 2023 9
Resources are allocated on a regional case-bycase basis and politicians support minority voices advocating low expenditure over the expressed wishes of a populace demanding the same modern infrastructure found in other developed nations. Many economists argue that New Zealand’s GDP is around 15 per cent to 20 per cent lower due to the low spending on core infrastructure, contrasting poorly with the similar economies of Finland, Sweden, Denmark and the Netherlands (Norway being an outlier due to massive oil revenues)5. The focus on Auckland and Wellington, where the majority of the electorate live, also leads to a bias towards spending in favour of those cities to the detriment of the nation.
New Zealand experienced a prolonged collective hangover from the United Kingdom’s decision to join the EEC which impacts economic policy-making to this very day. Britain’s disengagement hammered our exporting economy and we dropped from a high-income nation to one experiencing economic difficulties and unemployment within a decade. Policy responses were mixed: Muldoon’s state-funded projects of the ‘Think Big’ era increased debt and at times were at odds with market forces and yet Labour’s ‘Rogernomics’ may have provided necessary deregulation, but it needlessly slashed infrastructure spending and left many industries to fend for themselves6
A modern country does not do either of these to survive it does both, simultaneously. There is a balance between business and the state in the interests of the economy, what the economist Mariana Mazzucato calls ‘The State as Entrepreneur’7. That is why the countries above have higher GDPs than New Zealand and better rail systems: business and the state value each other’s contribution to a successful capitalist system, more so now we have to factor in the climate crisis.
Rail travel will not succeed without government support, but it will also not succeed without a strong private sector. The age of the monolithic state-owned rail company is at an end. This is not proposing a privatised KiwiRail; the nightmare of Toll Holdings ownership still lingers. Rather, as has been done in the UK and within the European Union, KiwiRail should have a single role: providing and maintaining track. As a public
agency, its goal would be to develop existing lines, restore mothballed or abandoned routes and develop new lines, using private contractors to do so. After all, Waka Kotahi NZ Transport Agency develops the road network. Once in place, a dual level of access to service providers is essential.
The first would be for socially important services, such as commuter rail in Auckland and Wellington, subsidised yet vitally important. The same applies to freight if the alternative to rail contributes to the climate crisis. However, this should not be stateowned: services should be outsourced to private companies bringing state expenditure back into the private sector.
The second level of access should be for any company or municipality that, as long as they meet the criteria, would want to run a service. This is called open access and is central to freight and passenger rail in the United Kingdom and European Union, providing an alternative to the state-run rail company that fuelled the rail freight renaissance in Europe8
In Dunedin, the City Council and expert advisors such as myself know a successful commuter service from Mosgiel to Port Chalmers via the city centre is possible9 Central government funding will be required at first, but so what? Even with the same funding as Auckland and Wellington receive per passenger, we can start the service within three years. There is also a huge demand for a reasonably priced intercity rail between Christchurch and Dunedin, an alternative to the expensive flight burning seven times the fuel per passenger as a train, or slow buses along State Highway One.
Any Japanese or European diesel-tilting train can do the journey in three hours. Again, a private company must run the service to respond to market forces, but it might need some central government assistance but that is our right: the Capital Connection, Wairarapa Connection and Te Huia are all subsidised for fewer passengers than a regular Christchurch – Dunedin intercity can expect. People in the South pay into the state coffers, as do our exporting agricultural and resource industries. We deserve the same funding per passenger as Auckland or Wellington.
Rail, both passenger and freight, is essential for the economic future of New Zealand. It is
not a technology of the past; the renaissance of passenger and freight rail in Europe, the United States, Australia, and indeed across the globe is a testament to that. However, New Zealand is hampered by the lack of a coordinated approach to rail, a testament to a lack of government-business coordination and a public discourse that is fractured, prone to irrelevant debates and rarely leads to a successful outcome.
It is time for business, society and government to support a single rail plan for New Zealand that provides the needed coordination whilst at the same time allowing for a widening of private sector participation so that regardless of where a person lives, be it Auckland or Wellington or Dunedin or Christchurch or Invercargill, or even Timaru, Napier, Gisborne or Tauranga, they will have access to a reliable rail network at the core of our national economy.
Dr Duncan Connors
Dr Duncan Connors is a business and economic historian in the field of energy, resources and maritime history and has a strong interest in research methodologies and the development of the body of academic literature. He has published in a number of journals on energy and maritime matters and co-authored the fourth edition of the well-known text, A History of Money (2015).

5 New Zealand Infrastructure Spending: https://www.infometrics.co.nz/article/2020-06-new-zealand-infrastructure-spending-lags-international-partners
6 Singleton, J., & Robertson, P. L. (1997). Britain, Butter, and European Integration, 1957-1964. The Economic History Review, 50(2), 327–347. http://www.jstor.org/ stable/2599063
7 Mariana Mazzucato: https://marianamazzucato.com/
8 Perennes, P (2017) Open Access for Rail Passenger Services in Europe: Lesson Learnt from Forerunner Countries, Transportation Research Procedia, 25, pp. 358-367, https://doi.org/10.1016/j.trpro.2017.05.413
9 Duncan Connors’ articles on Southern rail expansion: https://www.odt.co.nz/opinion/all-aboard-passenger-rail-south, https://www.odt.co.nz/news/dunedin/ passenger-rail-south-floated, https://www.scoop.co.nz/stories/AK2304/S00074/save-our-trains-campaign-arrives-in-dunedin.htm
10 Logistics & Transport NZ
The Future Is Rail Conference –Wellington 28 June 2023
THE FUTURE IS RAIL CONFERENCE’S aim was to provide an opportunity to develop a shared vision of the contribution that a rebuilding of inter-regional and long-distance passenger rail services would make to creating a more sustainable future through reducing carbon emissions and increasing mobility choices for New Zealanders, especially those living regionally. Its high-level purpose was to be a day of big ideas on passenger rail & how New Zealand could turn them into reality.
Organised by Dr Roger Blakely, Patrick Rooney, Dr Paul Callister and myself, the day drew around 200 people to hear a packed agenda from 25 speakers and panellists.
Topics were broad and informative, ranging from the visionary, through to funding processes, government bodies and legislation, and detouring along some innovative business ideas to help deliver rail passenger solutions in a sustainable fashion.
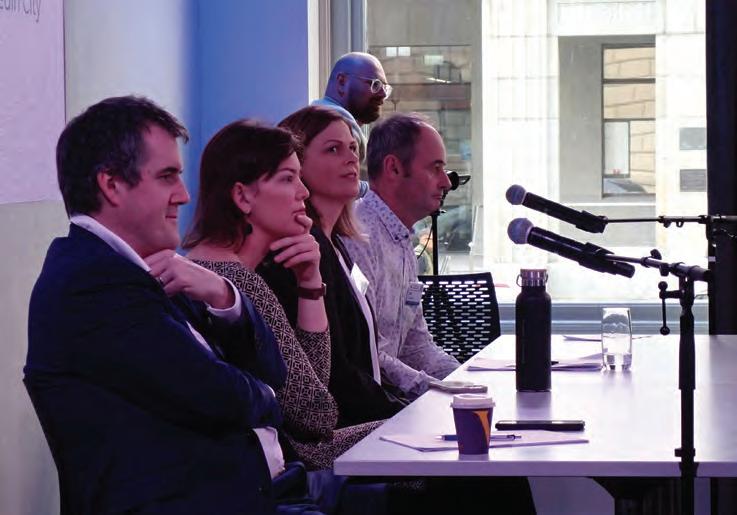
Included in the crowd were four MPs, four KiwiRail board members, at least 24 regional councillors or heads of regional council transport planning staff, senior KiwiRail staff, representatives of international rail operators, the Rail and Maritime Transport Union (RMTU), prospective rolling stock providers, transport advocates, media, youth/student representatives, university academics, leading transport consultancy firms, CEOs of rail operators KiwiRail, Transdev and Auckland One Rail together with senior leaders of the Central Government agencies MBIE, Waka Kotahi, Ministry of Transport and the Ministry for the Environment.
The day was a real success, exceeding the expectations of both attendees and organisers.
It kicked off with a keynote address from Northcote MP Shanan Halbert, chair of the Transport and Infrastructure Select Committee outlining the government’s investments in rail, including since 2019, $8.6 billion toward replacing tracks, building new culverts and bridges, signalling, electrifications etc. Halbert also briefly alluded to the select committee’s report on the inquiry into the future of interregional passenger rail, which received roughly 1700 submissions – noted as some of the highest numbers of submissions for any inquiry.
Three speeches by school senior prefects followed. This included Grace Burnard Head Girl and Joshua Simons Head Boy both from Ruapehu College. Corbin O’Shannessey Head Boy from Taumarunui High School wrapped this session up. All three gave very rousing, refreshing and insightful presentations on exploring sustainable and
BY MICHAEL VAN DROGENBROEK
efficient transportation solutions that could act to bridge the gaps between our rural and suburban areas, creating a seamless flow of people and resources. These youth perspective presentations set the tone well for what was to follow.
Cont. on page 12
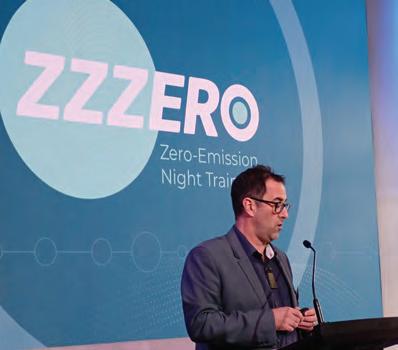
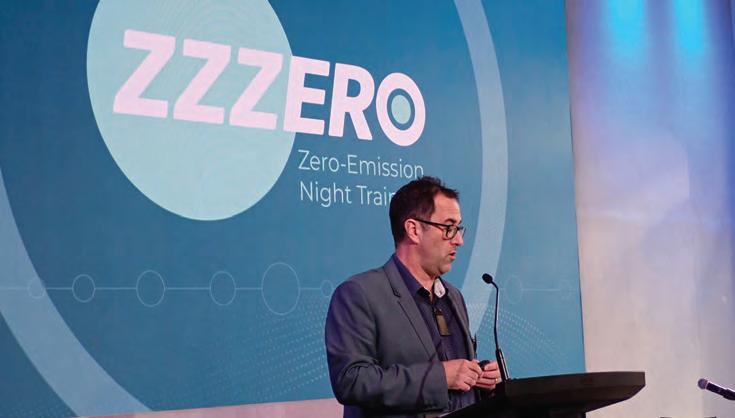
A daily overnight train between Auckland and Wellington was promoted by Greg Pollock. Branded ZZZERO, as in “zero emissions” and “catching some Zs”. Each 11-hour trip would emit under 3 per cent of the greenhouse gases of an equivalent-distance flight. Photos: Richard Young, SmartSense Ltd
The Perspectives on The Future for Passenger Rail discussion left the audience in little doubt about where the National and Green Parties stood on passenger rail.
September 2023 11
I gave a presentation on the subject Why Passenger Rail?: Vision for Aotearoa New Zealand. This vision outlined the current state on passenger rail in New Zealand and set a pathway forward for connecting the country from north to south starting with Auckland - Hamilton - Tauranga (Golden Triangle) concurrent with development of the Lower North Island Masterton, Wellington, Palmerston North, Whanganui corridors — with fast, frequent passenger rail.
From there Auckland to Wellington and Picton to Christchurch via the Interisland ferries. This would be followed by developing a central South Island connections from Christchurch to Timaru and over time to Dunedin and further South. This would later expand to places like Napier, New Plymouth and other parts of New Zealand.
A joint panel discussion followed with the CEO’s of the major New Zealand Rail operators that included Magda Robertson (Auckland One Rail), Peter Lensink (Transdev New Zealand) and Peter Reidy (KiwiRail). The importance of rail being essential services, customer centricity, investment in network resilience and rail being part of the land transport system integrated in a multi modal way where key themes.
Hon Julie Anne Genter, Green Party MP spokesperson and Deputy Chair, Transport and Infrastructure Select Committee explored the broad themes of the Inquiry Into the Future of Inter-Regional Passenger Rail in New Zealand. Whilst findings were not able to be specifically detailed as the release of this was prohibited due to the report not yet being finalised at the time of the conference, Genter did an excellent job in exposing the broader benefits of rail investment.
The Panel on Perspectives on The Future for Passenger Rail included Hon Julie Anne Genter, Chris Bishop, MP, National Party Spokesperson on Infrastructure, Councillor Angela Strange, Deputy Chair, Regional Transport Committee, Waikato Region and Councillor Dr Jim O’Malley, Chair, Infrastructure Committee, Dunedin City Council. A spirited discussion took place between Genter and Bishop and the audience was left in little doubt as to where each party stood as to the Future of Interregional passenger rail. Councillor Strange discussed lessons learnt and the success of the Te Huia service whilst Councillor O’Malley discussed challenges Dunedin faces in establishing passenger rail there specifically about a potential Mosgiel – Dunedin service noting proactiveness in siting a new park and ride facility for buses at Mosgiel Railway station future proofing it for potential future commuter rail.
Following lunch a keynote address: Night Trains – Vision for Aotearoa was made by Greg Pollock of Pollock Consulting. His ideadaily overnight trains between Auckland and Wellington and vice versa. Branded ZZZERO, as in “zero emissions” and “catching some Zs” Each 11-hour trip would emit under 3 per cent of the greenhouse gases of an equivalentdistance flight. It was noted a 11-hour trip on the North Island Main Trunk line is perfect for an overnight rail trip and requires minimal infrastructure upgrades, so ZZZERO because it doesn’t require huge infrastructure investment - 11 hours is the current transit time. Councillor Thomas Nash, Chair Transport Committee, Greater Wellington Regional Council responded very supportively to Pollock’s presentation.
Next up was Why Rail?: Regional, Business and Community Benefits. This was led by Robert Pigou, Deputy Chief Executive and Head of Ka-noa – Regional Economic Development & Investment Unit, MBIE. Pigou detailed MBIE’s work on the future of rail which was very encouraging to hear.
The panel discussion following included iwi, business, and community leaders with Arnaud Deutsch, from WSP, Helmut Karewa Modlik, Tumu Whakarae – CEO, Te Runanga o Toa Rangatira and Katrina Ramage from Making Rail Work. Deutsch gave a good overview of the proposal for North Island regional connector passenger rail whilst Ramage described passionately how innovative ideas for inward investment may facilitate rail passenger development on the Golden Triangle. Modlik was superb in the holistic philosophical (more spiritual bigger life picture) approach of the Tangata Whenua with regards to rail development.
Next up was What Changes are Required to Legislation and Funding for Inter Regional Passenger Rail? The lead speaker here was Bryn Gandy, Deputy CE, Ministry of Transport (MoT) where he talked about the work the Ministry had done over the past 6 or so years and that rail is a key part of a sustainable future.
The following panel included Bryn Gandy (MoT), Dr Deborah Hume, National Manager of Multimodal Integration, Waka Kotahi NZ Transport Agency, Councillor Daran Ponter, Chair, Greater Wellington Regional Council and Darren Davis, Technical Director, Public Transport Policy, MRCagney. The necessity of interregional cooperation was discussed. Davis drew attention to how public transport systems follow regional boundaries, unlike the nationally integrated state highways, commenting, “Which way the water flows should not determine transport access”
Hume noted that proponents of passenger rail should be focused and not get distracted by doing too many things at once. Councillor Ponter gave an informative update on lessons learnt during their business case development recently funded for new generation rolling stock replacement and service expansion in the lower North Island to both the Wairarapa and Manawatu from Wellington.
The day’s final speaker was a bookend of the Youth Voice from Generation Zero’s Roman Shmakov who summed up very well the importance of the youth perspective.
Key challenges to developing rail noted included a heavy car and aviation bias, finding the proper public-private funding arrangements, negotiating regional borders, infrastructure improvements (such as electrification). It is clear much work needs undertaking to make the rail network fit for inter-regional passenger rail across both Islands. One key area of focus is a move to nonpartisan agreement on rail so whilst flavours of government may change, rail still needs longterm commitment and investment.
The day ended with conference chair Roger Blakeley asking, “Where do we go from here?” Overall there was good consensus that passenger rail is essential infrastructure (Just like roads, water, telecoms, electricity and fibre) and that an integrated multi-modal approach is necessary for rail to bridge the rural-urban divide, and that focusing just on metro rail services underserves rural communities.
Michael van Drogenbroek
Michael is a Transport Consultant/Advisor at Heriot-Edievale Ltd with 30 years plus experience. Currently he is working with various clients on rail, public transport and freight development projects both in New Zealand and overseas jurisdictions including the Middle East. He has held various senior executive/ management roles in Public Transport, Railway and Strategic Planning in Victoria Australia, Etihad Rail in the UAE together with over 20 years at Kiwi Rail and its predecessors.

12 Logistics & Transport NZ
Setting out how funding will be allocated for transport activities in 2024
COURTESY OF JO WILTON FROM THE BUS AND COACH ASSOCIATION
THE GOVERNMENT POLICY STATEMENT (GPS) is a statutorily-required document that sets the government’s revenue for the National Land Transport Programme (NLTP) –i.e., fuel excise duty, RUC – and details what that revenue is to be spent on, at a high level, by using “activity classes”.
Waka Kotahi NZ Transport Agency (Waka Kotahi) then has to put it into action, setting the level of expenditure within each activity class range that it thinks will best deliver on the GPS outcomes. This money is then allocated through the three-yearly National Land Transport Programme to “authorised organisations” which are primarily Waka Kotahi and local councils.
The GPS is renewed every three years and guides investment in transport by providing a 10-year outlook of how spending is prioritised for the transport network. It is prepared by the Ministry of Transport on behalf of the Minister of Transport and at this stage it is a draft document that is open for public consultation.
The priorities
The draft GPS sets out six key strategies that the Government wishes to achieve from the NLTF investment for New Zealand’s transport network.
The priorities are:
• Maintaining and operating the existing transport system efficiently at a level that meets users’ current and future needs.
• Increasing resilience so the transport system can cope with natural and anthropogenic hazards.
• Reducing emissions by transitioning to a lower carbon transport system.
• Making transport substantially safer for all.
• Providing an integrated freight system with well-designed and operated transport corridors and hubs providing efficient, reliable, resilient, multi-modal and low-carbon connections.
• Providing sustainable urban and regional development enabling people to readily
access social, cultural and economic opportunities through a variety of transport opportunities.
Reducing emissions targets
One of the key parts of the draft GPS is the government’s intention, as part of its overall transport investment programme, to reduce emissions. This will involve investment from the National Land Transport Fund (NLTF) and direct Crown investment.
Waka Kotahi will be expected to satisfy itself that each three-year programme contains a range of activities that makes an appropriate contribution to the 2035 transport emissions reduction targets, within the available NLTF funding and takes into account other interventions that impact on greenhouse gas emissions (including land transport investment outside of the NLTF).
This will involve prioritising interventions that can deliver emissions reduction and benefits across a range of strategic priorities and outcomes.
The objective is for VKT (vehicle kilometres travelled) reduction programmes to be
developed for urban areas to meet VKT reduction targets. Waka Kotahi, councils, iwi, businesses, communities, and other Crown entities are expected to work together to develop urban VKT reduction programmes to identify investments and other measures that make it easier and more attractive for people to use public transport.
The draft GPS makes it clear that it does not expect that every individual investment within the NLTP must reduce emissions. For example, safety improvements, such as median barriers, will not reduce emissions on their own. Other safety improvements, such as traffic calming and speed management, may be effective ways of delivering safety benefits while also reducing emissions.
Prioritising emissions reduction will look different depending on local circumstances. For example, the NLTF is expected to prioritise activities that improve the reach, frequency and quality of public transport.
But the draft policy recognises that shifting travel from cars to public transport will often be easier to achieve and result in larger emissions reductions in urban areas. Improving walking and cycling facilities, and
September 2023 13
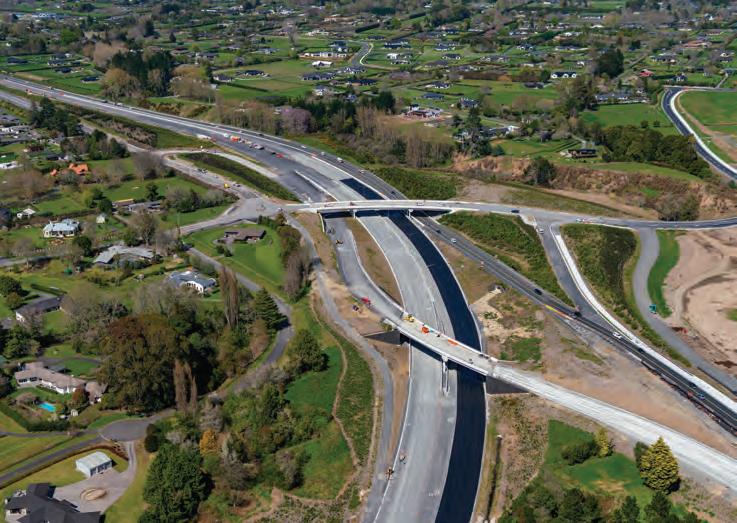
The Hamilton section of the Waikato Expressway. Photo Waka Kotahi NZ Transport Agency
low/zero-emissions vehicles are likely to play a greater role in mitigating climate change in some regions. Increasing adoption of low/zero emissions vehicles is supported by non-NLTF funding levers such as the Clean Car Discount.
Inter-regional public transport
In a bid to improve the inter-regional passenger transport network the GPS creates a new dedicated activity class. It is based on the idea of creating a partnership with local government and the private sector to develop new inter-regional public transport services, including rail.
The document also talks about recognising the diverse transport needs of communities around the country including access to social opportunities such as health, education and work.
It says local funding pressures, exposure to natural hazards, and the increasing pressures of climate change are placing stress on rural and regional communities to maintain public transport connections so it is critical that sufficient funding is available to maintain networks to the condition required to ensure they are safe, resilient, sustainable, and accessible.
New investment will be expected once the necessary plans and strategies are in place. In the short term, it says, the land transport sector will continue to work collaboratively to share insights and tools and improve decision-making.
Key strategic priorities for rural and regional communities include resilience, maintaining and operating the existing system, safety, and better freight integration. Inter-regional public transport is expected to play a crucial role in achieving emissions reduction targets.
The inter-regional public transport activity class provides for investment in existing and new inter-regional services, encouraging regional councils and unitary authorities to work together to expand and improve interregional public transport service offerings. This activity class also provides funding to support the delivery of new services. It will work in a similar way to the Coastal Shipping activity class in the 2021-24 GPS, by providing a dedicated funding source to partner with other players to develop and deliver new services.
It is expected that Waka Kotahi will develop key principles and objectives once the Government has responded to the select committee inquiry into the future of interregional passenger rail, and that Waka Kotahi will then work with public transport agencies, KiwiRail, and the private sector to support proposals that will extend and improve services.
The Government expects this activity class will initiate extensions to inter-regional passenger rail, but it can also be applied to other forms of Inter-regional public transport including bus and ferry services. Funding for 2024-2027 for improvements to interregional transport has been set at $20 to $50
million a year. The is no funding allocated for successive years.
National Road Carriers Association (NRC) is pleased to see the Government committing to significant investment in roading infrastructure as this reflects the essential role the network plays in supporting the entire New Zealand economy.
“We have been calling for a long-term commitment to road transport infrastructure for some time, so it is pleasing to see government is responding,” says NRC GM Policy & Advocacy James Smith.
“We continue to ask for road transport infrastructure to be removed from the threeyear political cycle which has been shown to lead to a stop-start approach that benefits no one. A 50-year roading infrastructure plan is desperately needed to ensure New Zealanders have a safe, productive, and resilient networking that will be fit for purpose into the future.
“Shoring up our long-term infrastructure investment and maintenance plan is critical if we are to protect the network from further damage. The cold hard facts are this will take money, and a decent amount of it.
“So, the additional $5 billion boost is hugely welcomed. But money alone will not deliver the outcomes New Zealand needs. We also need to be smart about how we spend, where we spend it and what we get for it. Results matter if we are to get our roading infrastructure back up to scratch.”
14 Logistics & Transport NZ
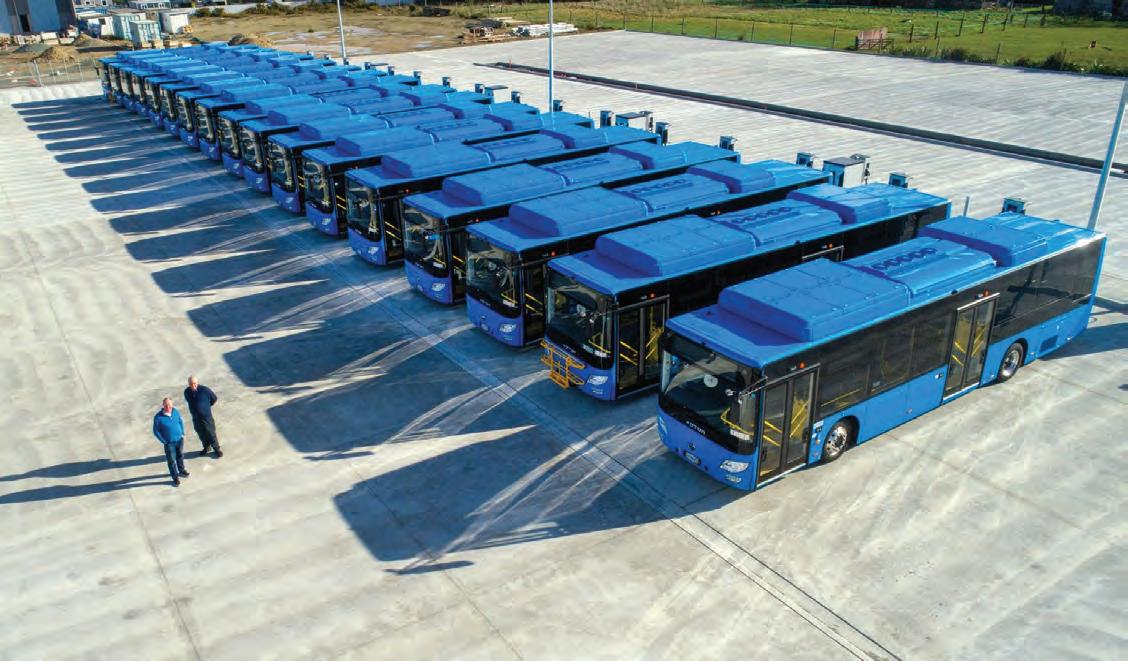
Nelson Tasman's new bus service is a gamechanger for public transport in the region, with a new fleet of 17 electric buses. Photo: Nelson City Council
NZ Domestic Transport Costs and Charges S tudy – Key Features and Findings
A: Study overview - what’s it all about?
This article provides a (selective) summary of the key features and findings of the NZ Domestic Transport Costs and Charges (DTCC) study, which was completed earlier this year. The study was undertaken for Te Manatu - Waka Ministry of Transport (MoT) by a consultant consortium led by Ian Wallis Associates Ltd. It was peer-reviewed by an international team1 supported by expert staff from New Zealand government agencies.
The overall objective of the study was to identify all the financial, economic and social costs associated with the domestic transport system, together with the contributions to these costs by transport users and other parties. Its outputs aim to improve understanding of the full range of costs associated with different domestic transport modes. It covers person and freight movements, principally by road (including walking and cycling as well as motorised transport), rail (people and freight) and urban public transport (by bus, train and ferry).
It is emphasised that DTCC is NOT a policy study, i.e., its outputs do not involve any recommendations on future policies relating to the New Zealand domestic transport sector. Rather, it provides extensive information on the financial, economic and social costs associated with the existing transport system, together with approaches to estimating the marginal (incremental) costs of changes to the system. This information will be valuable for government(s) in the formulation and assessment of potential transport policy directions.
The study began in early 2020, and is based on data for the financial year 2018/19. While the costs and charges figures may therefore be regarded as somewhat dated, they have the merits of relating to the most recent financial year that was unaffected by the Covid epidemic.
The key DTCC output is its Main Report, which is available on the MoT website.2
B: NZ domestic transport task
The study developed a set of annual estimates of NZ domestic transport movements as detailed in Table 1. The person transport task, defined as the total person-km (pkm) travelled3, is dominated by road-based travel, which accounted for 98.6 per cent of total pkm: cars/light vehicles alone accounted for 94.4 per cent of the total, buses/coaches for 2.7 per cent and walking/cycling for 1.5 per cent. Travel by rail (urban and longer-distance) accounted for 1.1
BY IAN WALLIS
per cent of total pkm and by passenger ferry/ ship for the remaining 0.3 per cent.
Road travel also dominates the freight transport task, measured in net tonne km (ntk), but this dominance is significantly less so than for person travel. Road transport accounted for 77 per cent of the total freight transport task, with rail accounting for 11 per cent (but for a higher proportion of heavy freight movements) and coastal shipping (including the Cook Strait ferries) for the remaining 12 per cent.
Table 1: NZ Domestic Transport Market Summary (2018/19)
Cont. on page 16 September 2023 15
Mode Service/Vehicle type Person km Pkm (mill pa) % total Road Car/light vehicle 57,350 92.7% Motorcycle 400 0.6% Demand-response/Taxi 650 1.1% Micro-mobility 5 0.0% Walk 656 1.1% Cycle 289 0.5% Public bus 890 1.4% School bus (Min of Education) 380 0.6% Long-distance coach 371 0.6% Rail Urban rail passenger 607 1.0% Long-dist rail pax 73 0.1% Sea Urban ferry 91 0.1% Cook Strait ferry 108 0.2% TotalTot Total person km 61,870 100.0%
Mode Service/Vehicle type Net tonne km Ntk (mill pa) % total Road Road trucks 30,800 77.0% Rail Rail wagons 4,407 11.0% Sea Coastal shipping 4,630 11.6% Cook Strait ferry 140 0.4% Total net tonne km 39,977 100.0%
A: Person Transport
B: Freight Transport
3
This international review team comprised senior staff from the Institute for Transport Studies, University of Leeds (UK). 2 www.transport.govt.nz. The Main Report is supported by 25 working papers. A number of these are not being made publicly available as they include commercially sensitive information; the remaining working papers are, or will shortly be, available on the MoT website.
Domestic air travel was outside the study scope, so is not included in this table
C.1 Overview of financial and economic costs and charges
The Study assessed the financial and economic costs associated with the New Zealand transport system and the charges paid by users. Financial costs are the costs incurred by infrastructure providers and service suppliers. The Study was particularly interested in the costs to governments (at all levels) of publicly-provided infrastructure and services, and in the extent to which these costs are covered by prices charged to users. It was also interested in the total costs faced by users and in the user costs per unit of travel output (i.e., cost per person-km or per net tonne-km).
The economic analysis considers the resource costs consumed or incurred in the transport task. These resource costs include the costs associated with transport infrastructure, and also the social and environmental costs (often referred to as externalities) associated with travel. Key measures of economic cost efficiency for person transport are total economic costs per person-km, and for freight transport total economic costs per net tonne-km.
User charges (such as fares, fuel taxes) and their associated revenues were essentially contributions to the financial costs of transport infrastructure and services. They are therefore relevant to the financial analyses (as contributions towards the financial costs), but not to the economic analyses.
The Study addressed the economic and financial assessments within a common framework, given that both aspects incorporate in large measure a similar and overlapping set of items. The main cost and cost-related impact categories are shown in Table 2.
Table 3 summarises our analyses (covering Table 2 cost categories) of the total and average economic (including environmental and social) costs and financial costs for the four main domestic surface transport sectors, i.e., New Zealand road and rail transport sectors (each divided between people and freight movements), urban public transport, and ‘sustainable’ modes (walking and cycling)4
The first row of Table 3 summarises the transport task estimates (in pkm and ntk). The remaining rows set out the key financial and economic inputs and outputs, which are discussed in the next two sections of this article.
Table 2: Costs and charges categories covered in the Study
Main category
Revenue from user charges
Sub-category
Road user charges
Petrol excise duties
Toll charges
Parking fees
ACC levies and insurance
Cost nature
Financial
Infrastructurerelated costs
Operations (vehicle-related) costs
Parking costs
Capital costs (including econ return)
Infrastructure operations and maintenance
Vehicle ownership costs
Vehicle repairs and mtce
Fuel
On street parking (paid/unpaid)
Commercial/council (off-street) parking
‘Free’ parking (staff/clients/shoppers)
Private parking (e.g., garaging)
Financial and economic
Financial and economic
Travel time costs
Business-related travel time
Other person travel (incl commuting) time
Truck travel time
Freight inventory costs (incl perishables)
Financial and economic
Economic
Social and environmental impacts
Transport accidents
Greenhouse gas emissions
Noxious gases
Noise
Ecology and biodiversity
Health/quality of life
C.2 Commentary on financial assessment findings
Table 3 includes a summary of the financial assessment for person and freight transport, by the main road and rail modes, i.e., for person transport, by car/light vehicle, by urban public transport (bus, train, ferry), by walking/cycling, by long-distance rail; and for freight transport by road (truck) and by rail (freight wagons). The key estimates relevant to this financial assessment are given in rows 1, 3, 14-18 of the table. We comment first on these results at an aggregated level, then in rather more detail for the main modes, comparing both between modes and between person transport and freight transport.
Note that the financial assessment excludes5:
• All environmental and social costs (rows 8-11); and
Economic
• Vehicle parking costs (row 4). These are excluded from the financial assessment as insufficient information is available to estimate the users’ share of the total (economic) parking costs.
The all-modes total public sector costs for infrastructure and services (but excluding car parking) were some $10.8 billion (row 3); while the total user charges (row 14) contributed some $4.8b to these costs, resulting in an overall financial cost recovery of just under 50 per cent. Breaking down these aggregate figures between person transport and freight movements, about $2.9b of the total user revenue is collected from person transport (average cost recovery 49 per cent) and $1.9b from freight transport (average cost recovery 56 per cent, row 18).
By the main person travel modes, user charges for car/light vehicle travel (row 16)
16 Logistics & Transport NZ
5 GST is
the
4 Note that Table 3 does not cover water-based transport (coastal shipping and Cook Strait ferry services), long-distance coach services or rural school transport services (run by the Ministry of Education) – which were all addressed in the Study (see Table 1), although not in the same depth as the four main sectors.
excluded from all
financial and economic
assessments.
Table 3: Economic and financial analysis summary (2018/19)
averaged 4.3 c/pkm (covering 55 per cent of the public sector costs, row 18), and for urban PT 22.7 c/pkm (covering just under 28 per cent of the public sector costs). For freight transport, user charges averaged 9.1c/ntk for rail transport (sufficient to cover 39 per cent of public sector costs) and for heavy truck (HCV2) movements 3.4c/ntk (covering 76 per cent of public sector costs).
It should be noted here that these comparative figures relate to the public sector costs only, without regard to the different splits for the different modes between public sector and private sector costs (charges). For example, for road-based person travel, the majority of the total costs are borne directly by the private sector (e.g., through fuel purchases by individual motorists); whereas for an equivalent trip by public transport, all financial costs are initially borne by the public
sector (with some off-setting payments from user fares). The implication is that any figures for the cost coverage of public sector costs from user revenues need to be treated with considerable caution in any comparisons between modes. In any such comparisons, the comparative figures between modes for financial subsidy (per pkm or ntk) are likely to be more useful for modal comparisons than the cost recovery ratios (i.e., user charge/ public sector costs).
We also note here that all the economic cost estimates (in Table 3 and elsewhere in this article) allow for the opportunity cost of capital, based on an annual return (4 per cent in real terms) on the economic value of the transport system assets6. For the roads sector in particular, this approach differs from the way that New Zealand roads are currently funded, which is on a ‘pay-as-you-go’ (PAYGO)
6 Valued on an optimised depreciated replacement cost (“ODRC”) basis
basis, under which funding levels relate moreor-less directly to capital expenditure on the road system on a year-by-year basis7
C.3 Commentary on economic assessment findings
Table 3 (row 12) shows that the total economic costs in 2018/19 for the four main domestic transport sectors combined were some $127 billion (including parking). This figure covers: (i) public sector costs for providing and maintaining the transport system (row 3); (ii) transport operator and user costs (both time costs and money costs) (rows 6,7); and (iii) social and environmental costs (rows 9-12), covering transport accident costs, public health costs and environmental costs (including costs associated with greenhouse gas and other emissions).
7 Adoption of the PAYGO approach for roads would result in modest reductions in the cost figures used here, resulting in modest (apparent) improvements in cost recovery performance and other assessment indicators – but it would undermine any comparisons between the performance of the roads sector and the other transport modes. We note that our economic return on capital approach has been adopted for Study purposes only in order to provide comparability between the modes: it is not intended to suggest any move from the PAYGO model to an economic return on capital approach (consideration of any such move was well outside the DTCC terms of reference).
18 September 2023 17
Cont. on page
Person Transport Freight Transport Total all modes Units Road (Car, LV) Rail (Long dist) Urban PT Walk/ cycle Total person transport Units Road Truck Rail / Wagon Total freight transport Non HCV2 trucks HCV2 trucks 1 Transport task pkm (mill) 58,405 73 1,588 945 61,011 ntk (mill) 10,500 20,300 4,407 35,207 2 Economic costs Infrastructure and services: 3 Public sector costsinfrastructure & services $mill pa 4,538 46 1,306 1,496 7,385 $mill pa 1,406 917 1,042 3,365 10,751 4 Parking $mill pa 14,656 14,656 14,656 5 User economic costs: 6 Vehicles & operations $mill pa 20,536 - - 87 20,623 $mill pa 18,332 3,787 0 22,119 42,742 7 User time $mill pa 31,116 12.5 768 1,793 33,689 $mill pa 15,368 2,290 0 17,658 51,347 8 Social/environmental costs: 9 Accidents $mill pa 4,979 0.9 n.a. 1,116 6,096 $mill pa 337 53 15 405 6,501 10 Health impacts (benefits) $mill pa - - - (2,353) (2,353) $mill pa - - - (2,353) 11 Environmental (GHG, air qual, noise, biodiversity) $mill pa 2,299 0.4 87 - 2,387 $mill pa 959 332 90 1,382 3,769 12 Total economic costs $mill pa 78,124 59.5 2,161 2,139 82,483 $mill pa 36,403 7,379 1,147 44,929 127,412 13 Econ costs Summary Econ costs per pkm or ntk (excluding parking) cents/pkm 108.7 81.5 136.1 226.3 111.2 cents/ntk 343.4 36.4 26.0 127.6 14 Financial costs Financial costs summary Total user charges (excl parking) $mill pa 2,503 30.9 360 n.a. 2,894 $mill pa 801 697 403 1,901 4,794 15 Financial surplus/(shortfall) (i.e., Public sect costs minus User charges) $mill pa (2,035) (14.8) (946) (1,496) (4,492) $mill pa (605) (220) (639) (1,465) (5,957) 16 User charges per unit- excl W&C cents/pkm 4.3 42.3 22.7 n.a. 5.1 cents/ntk 7.6 3.4 9.1 5.4 17 Financial surplus/(shortfall) per pkm or ntk cents/pkm (3.5) (20.3) (59.6) (158.3) (7.4) cents/ntk (5.7) (1.1) (14.5) (4.1) 18 User charges / Public sector costs (%) – excl W&C % 55.2% 67.6% 27.5% 0.0% 49.1% % 57.0% 76.0% 38.6% 56.5%
Note: W&C is Walking and Cycling
This total economic cost of $127 billion represents an average over the total NZ population of $25,000 per person during 2018/19.
Some key features of the Table 3 economic cost estimates are as follows:
• Of the total economic costs ($127b), $82b (64 per cent) relates to person transport, $45b (36 per cent) to freight transport.
• The costs associated with the road system and its use (i.e., excluding environmental and health costs) dominate the total economic costs (row 12) for both person and freight transport. For person transport, they account for 95 per cent of the total ($78b out of $82b); for freight transport, they account for 97 per cent of the total ($43.7b out of $44.9b).
• The $82b total for person transport (row 12) comprises $78.1b related to motorised road traffic (principally cars and other light vehicles), $2.2b for urban public transport (bus, train, ferry), $2.1b for walking/cycling and a small amount for long-distance rail passenger services.
• Similarly, looking at freight transport overall, the total economic costs (row 12) for road freight are estimated at some $45.0b, of which $7.4b relates to the heaviest category of road trucks (which potentially compete with rail for longer distance/heavy freight movements). The economic costs for rail freight are much lower, at some $1.1b.
• This dominant role of the road system applies similarly to the market shares for the three main modes. For landbased freight movements (in ntk), road freight accounts for 87 per cent of the market and rail freight 13 per cent (but rail has a considerably larger share of the heavy freight/long-distance market). For motorised person movements (in pkm), road travel (cars, other light vehicles) has a market share of 97.1 per cent, urban PT (including urban rail) a share of 2.6 per cent, and long-distance rail a minimal share of 0.1 per cent8
Aside from parking costs and health-related benefits, between one-third and one-half of the total economic costs for person travel in the roads sector (49 per cent) and the UPT sector (36 per cent) relate to travel time. In
the roads sector, this includes a sizable share related to car-based business travel and in-work (paid) time. In the UPT sector, most trips are for non-business purposes and their travel time is largely personal or leisure time (which is valued in economic terms).
origin-destination locations etc; and that (ii) many freight movements are not suitable for transport by rail as their origins and destinations are not close to facilities for loading, unloading or transferring freight consignments.
For the roads sector overall, the costs associated with the environmental impacts (GHG and local emissions, noise and ecology/ biodiversity impacts) account for some 3.6 per cent of total roads sector economic costs, while the costs of road accidents comprise a further 7.8 per cent of these economic costs. For the UPT sector, the environmental impact costs again account for around 4 per cent of total economic costs, principally reflecting the rather mixed performance of urban bus operations (primarily diesel-powered) in terms of GHG and local emissions.
The relationships between the key components of the total economic costs for each sector and that sector’s total transport task are of significant interest (i.e., economic costs per unit of transport task, refer Table 3, row 13).
For freight movements, the following points should be noted:
• The economic cost for rail freight transport averages 26c/ntk, which may be compared with an average of 36.4c/ ntk for heavy trucks (HCV2). However, it should be borne in mind that these two figures are very much averages over a wide range of situations. For a specific heavy commodity movement, it cannot be concluded that the rail cost (or charge) will necessarily be lower (in economic terms) than that for road transport.
• It should also be noted here that (i) there is a very wide variation in average costs/ ntk according to truck type, commodity,
• There is a substantial spread in the total economic cost per ntk for road freight, affected by commodity carried, the type of vehicle used and multiple other factors: average economic costs may be as high as 500 c/ntk or even higher for light vans, parcel deliveries etc.
For person movements, the average economic cost of 134c/pkm for road (mainly car/light vehicle, travel, row 15) is very similar to the 136c/pkm for urban PT travel. However, we would be particularly cautious about comparisons in this case: (i) the UPT figure covers only the PT leg (stop-to-stop) of the trip, with no allowance for access and egress travel time or costs; while (ii) the car/light vehicle figure includes an average economic cost figure for car parking, which in most cases is likely to overstate the car users’ parking costs, except perhaps in the case of some CBD-oriented trips.
The average rates for the ‘sustainable’ person transport modes are 122c/pkm for cycling and 272c/pkm for walking. These results reflect the relatively high travel time involved, particularly for walking, for other than shorter-distance trips.
As a general comment, we would advise considerable caution in the interpretation of these modal relativities: inevitably, they represent averages over a wide variety of trip types in a wide variety of circumstances. They do however offer a methodology that could be adapted for wider use in the evaluation of transport policies and options, as a component of urban (and non-urban) transport studies.
8 These market share figures relate only to the three main modes for which comprehensive comparative analyses have been undertaken. They therefore take no account of walking, cycling, flying, coastal shipping, micro-mobility and other ‘minor’ modes.
18 Logistics & Transport NZ
The relationships between the key components of the total economic costs for each sector and that sector’s total transport task are of significant interest (i.e., economic costs per unit of transport task, refer Table 3, row 13).
A tool for boosting business
Promotional calendars have become a go-to marketing strategy for many transport and logistics companies in New Zealand. According to Steve Walmsley, CEO of Easy2C calendar company, these calendars have emerged as a versatile and effective means of engaging customers and fostering brand loyalty.
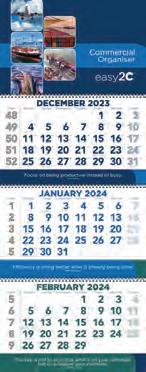
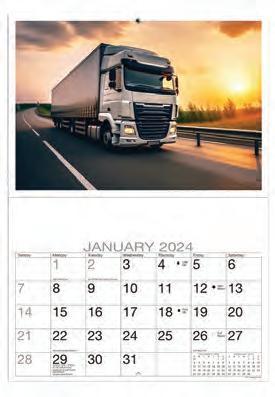

In today’s fast-paced business world, where competition is fierce and consumer attention is fleeting, businesses must use every tool at their disposal to stand out. Among these tools, promotional calendars have become increasingly popular in the transport and logistics industry.
“Promotional calendars are an excellent way to stay top-of-mind with customers throughout the year,” says Mr Walmsley. “They offer lasting brand exposure and can be customized to showcase your brand's unique personality and style.” But that’s not all. Promotional calendars can also help businesses build relationships with clients and partners. “Sending a calendar to clients or partners is such a tangible gesture that it often strengthens relationships by demonstrating appreciation and maintaining that ongoing connection,” says Mr Walmsley.
In addition to their marketing benefits, promotional calendars are also an affordable way to promote your business. With prices starting as low as a few dollars per calendar, they offer an excellent return on investment.
Transport and logistics companies have found promotional calendars to be an effective marketing tool that can help take their business to the next level. By providing lasting brand exposure, building relationships with clients and partners, offering cost-effective marketing solutions, and driving sales through strategic design elements, promotional calendars are an excellent investment for businesses looking to make an impact.

calendars:
YOU CAN’T GO PAST 365 DAYS OF BRAND VISIBILITY Be the FIRST to present clients with a gift by ordering your branded calendars early from Easy2C. That means you’ll have your calendars well before Christmas - giving you ample opportunity to be the FIRST to present one to your clients. Come over and see us at the awards to be in to WIN a dinner for TWO* *to the value of $200, conditions apply. Calendars & Promotional Products 0800 225 363 www.easy2c.co.nz BE IN TO DINNERWIN FOR 2
Promotional
September 2023 19
2023
CILT Annual Forum and Awards Dinner – brought to you by ViewPoint Supply Chain

The future of Logistics and Transport in Auckland
and the implications for New Zealand
WHEN: FORUM 1:00 pm – 4:30 PM
DINNER 5:30 PM - 11:00 PM, October 27 2023
VENUE: JetPark Hotel Auckland Airport & Conference Centre
This premier industry event is not to be missed with confirmed Forum speakers including:
› Simon Bridges, CEO, Auckland Business Chamber
› Alan Piper, Group General Manager
– Sales & Commercial, KiwiRail
› Dr Ganesh Nana, Chair, New Zealand Productivity Commission
–
Not only will it serve to recognise the achievements from within the industry, but will evoke intriguing and thought-provoking discussions among attendees, many of whom will be key players from the transport and logistics industries in New Zealand.

PROUDLY BROUGHT TO YOU BY
https://cilt.co.nz/event/annual-forum-and-awards-dinner-2023


 BY DR DUNCAN CONNORS


