This report is an example of effective cooperation among agencies of government. The critical step in its production was a plan for joint research ·by the Bureau of Employment Security of the Department of Labor and the Bureau of Economics and Statistics of the Planning Board, of the Commonwealth of Puerto Rico. A research grant by the United States Employment Service has financed, in cons·iderable part, the final stages of the study.
The collaboration necessary to produce this study goes beyond the above mentioned agencies, however. The actively contributing agencies include the Depal'tment of Education, the Economic Development Administration, the University, the Superior Educational Council, the Bureau of Labor Statistics of the pepartment of Labor and the Departrr.ent of Health, all of the Commonwealth of. Puerto Rico. In addition the data produced by other agencies, especially those of the United States Bur.eau of the Census, were. indisp·ensable to this study bf Puerto Rico's manpower needs and supply.
The organizing agency 'for this collaborative effort is probably unique in government. In 1952 the Governor of Puerto Rico, Luis Munoz 'Mar:rn, established a Committee on Human Resources, composed of the heads of most of the agencies of the Commonwealth Government. The ideas which led to the establishment of the Committee go even further back, to a small group of government and university officials who prior to 1950 saw not only that Puerto Rico's greatest wealth lay in her people but that the development of these human resources would require analysis and planned effort by all of the agencies of the Commonwealth Government. To them and particularly to Ram6n Torres Braschi, first chairman of the Committee on Human Resources·, must go much of the credit for the coordinated work which produced this report.
Because this study makes original contributions of method, which will be of -interest to individuals in countries concerned with economic development, it seems desirable to identify not only the agencies but also some of the individuals who are primarily responsible.
Petroamerica Pagan de Col6n, Director of the B:ur:eau of Employment Security of the Department of Labor, Alvin Mayne, Director of the Bureau of Economics and Statistics of the Planning Board and Everett Reimer, Executive Secretary of the Committee on Hmna.n Resources are jointly responsible for the plan of ·the study. The economic forecasts on which the estimates of manpower needs are based are primarily the work of Pr, Miguel Echenique of the Puerto Rico Planning Board; The projections of population and labor force, on which the estimates of manpower supply are based are the joint work of Jose Janer of the Puerto Rico Department of Healt~ and of Robert Carleton of the Puerto Rico Planning Board. The work of translating these underlying forcecasts into terms of manpower .needs and supply is principally that or Marchia Meeker Gilbertson of the Puerto Rico Employment Service. The study was directed by the S~cretary of the Committee on Human Resources, W?-O is also responsible for the final form. of the report and particularly f9r the recommendations it contains.
Some of the principal recommendations. of this study are already being carried into action. An emergency increase in_ this year 1 s Budget of the Department of Education has been approved by the Legislature and .the Governor of Puerto _Rico. Plans to increase the supply of .skilled manpower have been. worked out and are being put into effect by various agencies of the Commonwealth.
Antonio Cuevas Viret, Chairman Committee on Human Resources r
Fernando .Sierra Berdecia Secretary of Labor
Oli;eras
President of the Planning Board
November 1957
V. RECOMMENDED ACTION
I. Making Up the ·Educational Deficit' •.'15;
2. Utilizing the Surplus. of Unskilled Manpower 83
3. Preliminary Summary of Reco~en:datio~.s, 86
4. Specific Recommended Action 87 APPENDIX TABLES
Productivity for :Selec'ted Sectors, 1950-1975
3- Employment for Selected Sectors, 1950·-1975
4- Method of Calculating Manpower mputs
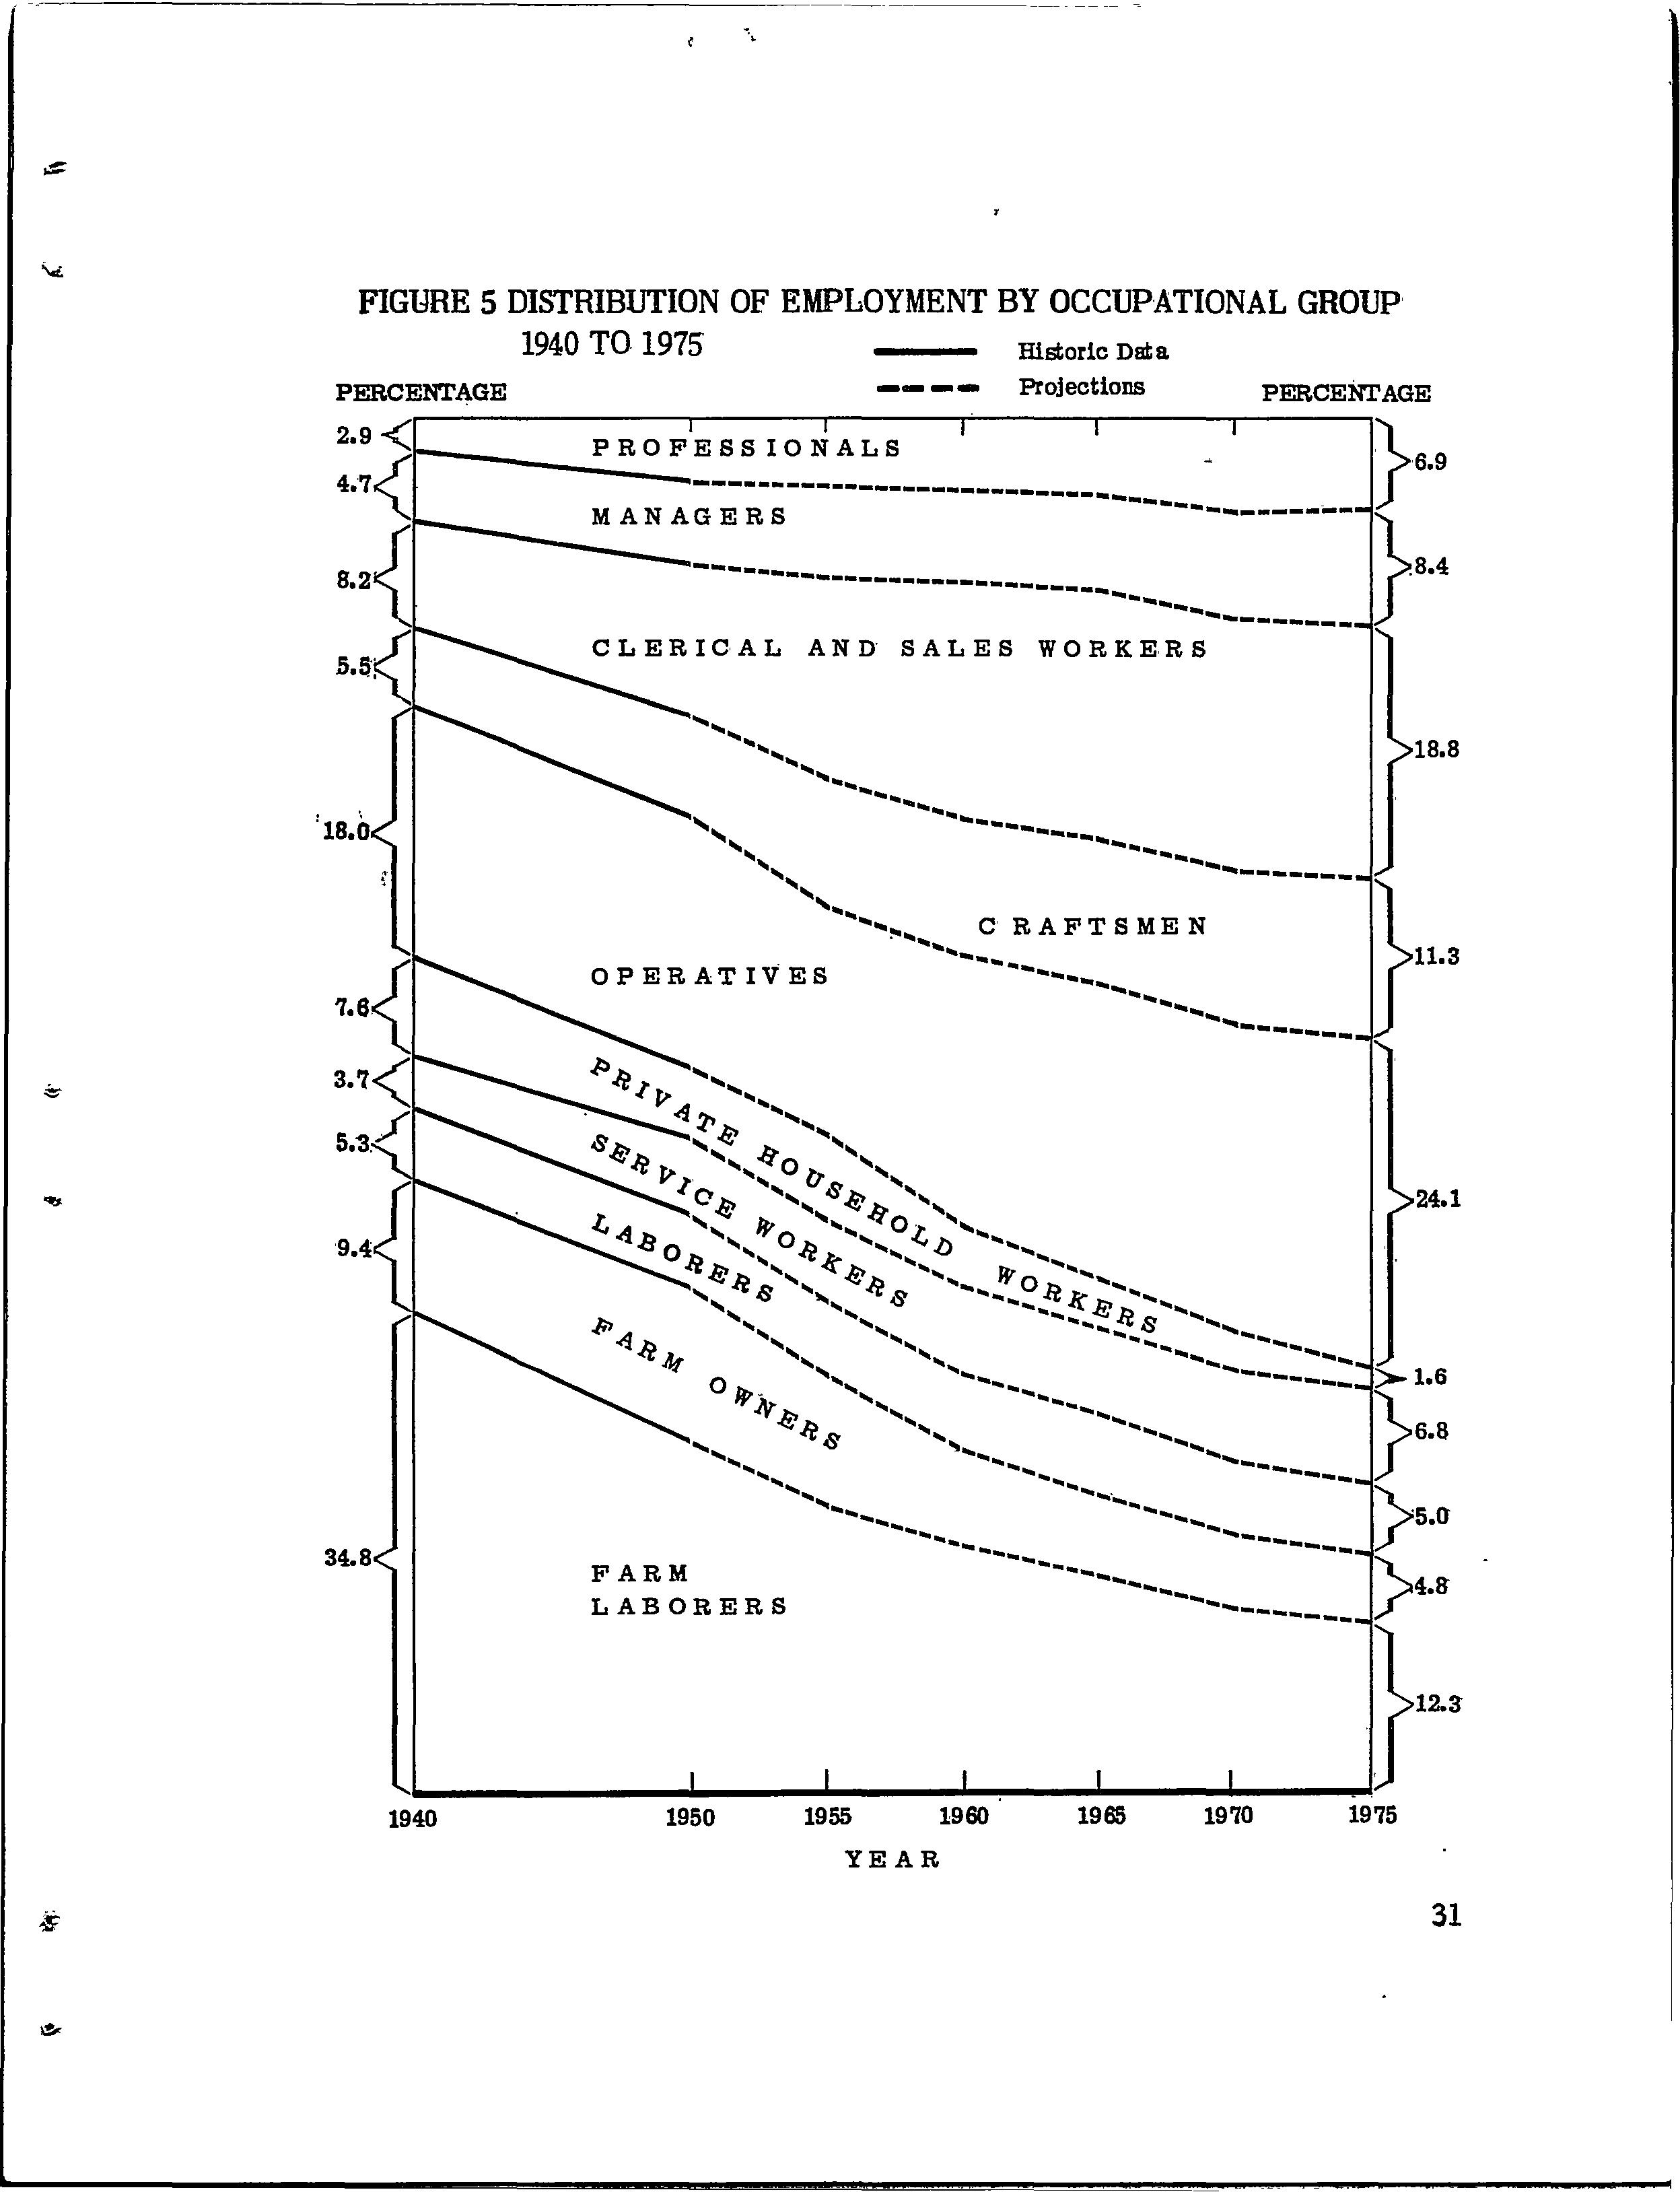
5- Distribution of Employment by Occupational Group, 1940 to 197-S
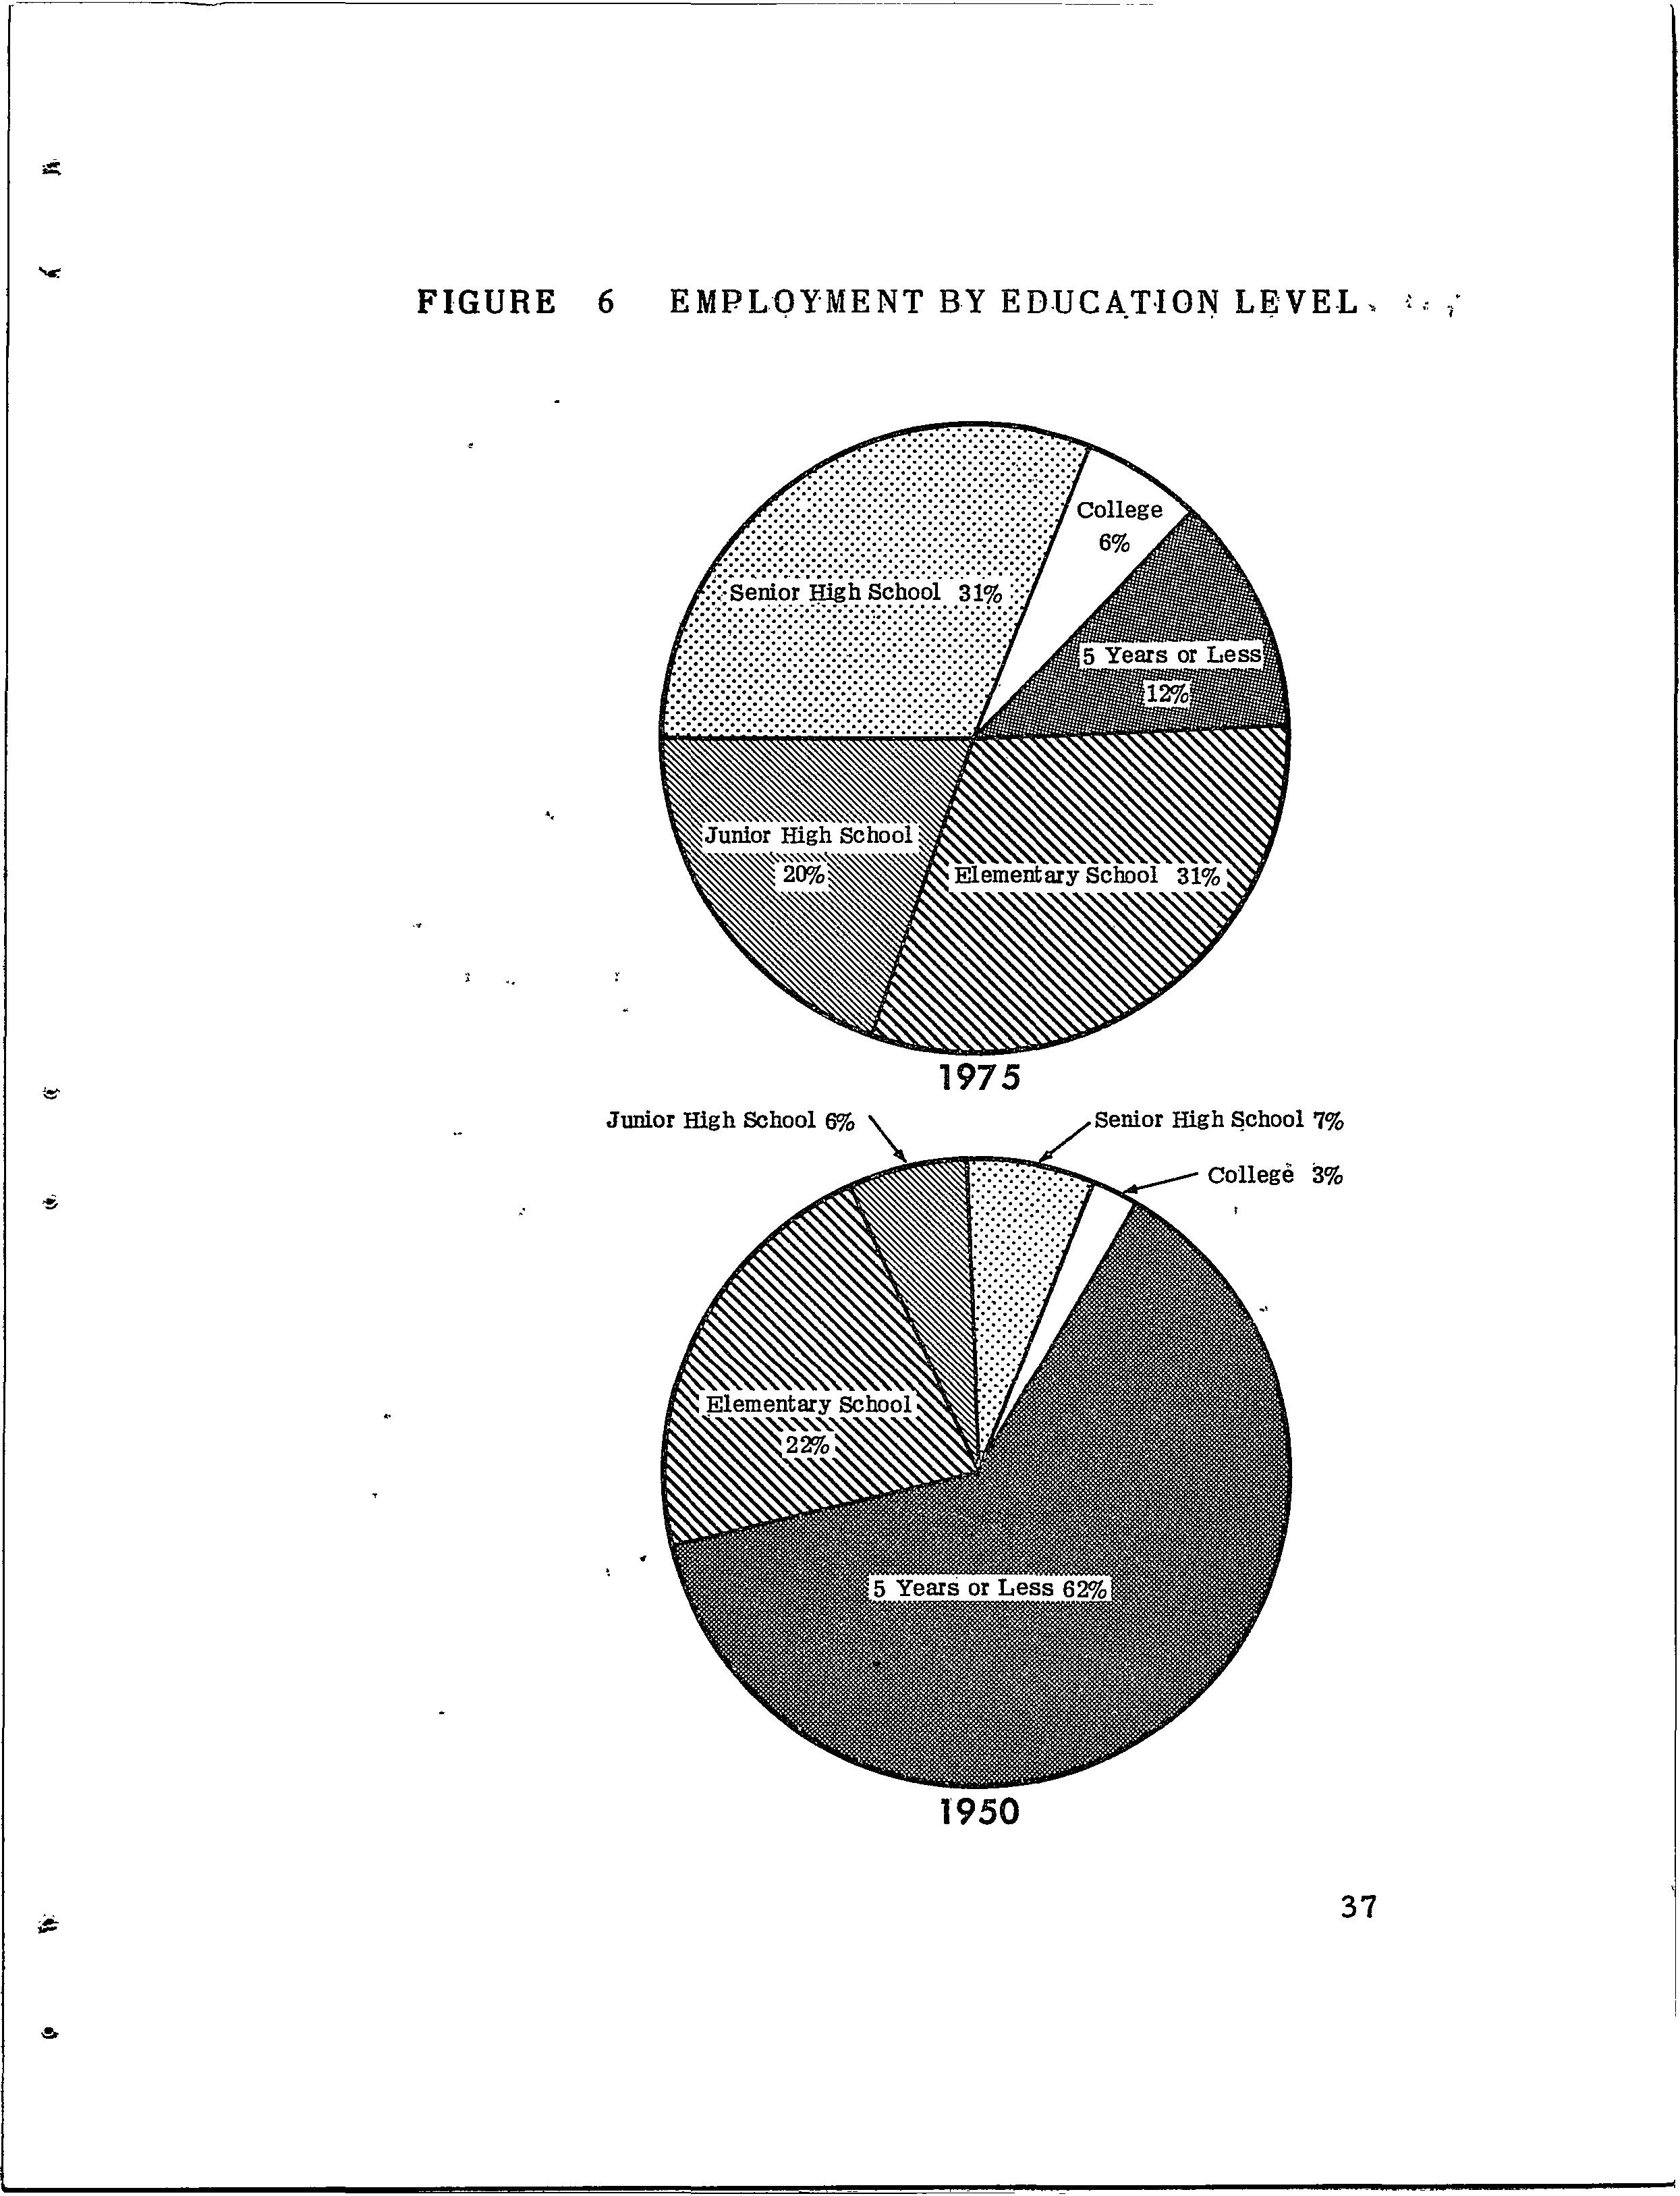
Em.ployment 'by Education Level, 1950 and 19-75
LIST OF TEXT TABLES
9- Clerical Workers by S~x and ·Education, 1950-1975 10- Population by Age, 1955-1975
11- Number of Six Year Olds, 1950-1975 12- Educ;:ition Level of .. the Po.pulation,... 1-955..;.197':;5:::._.
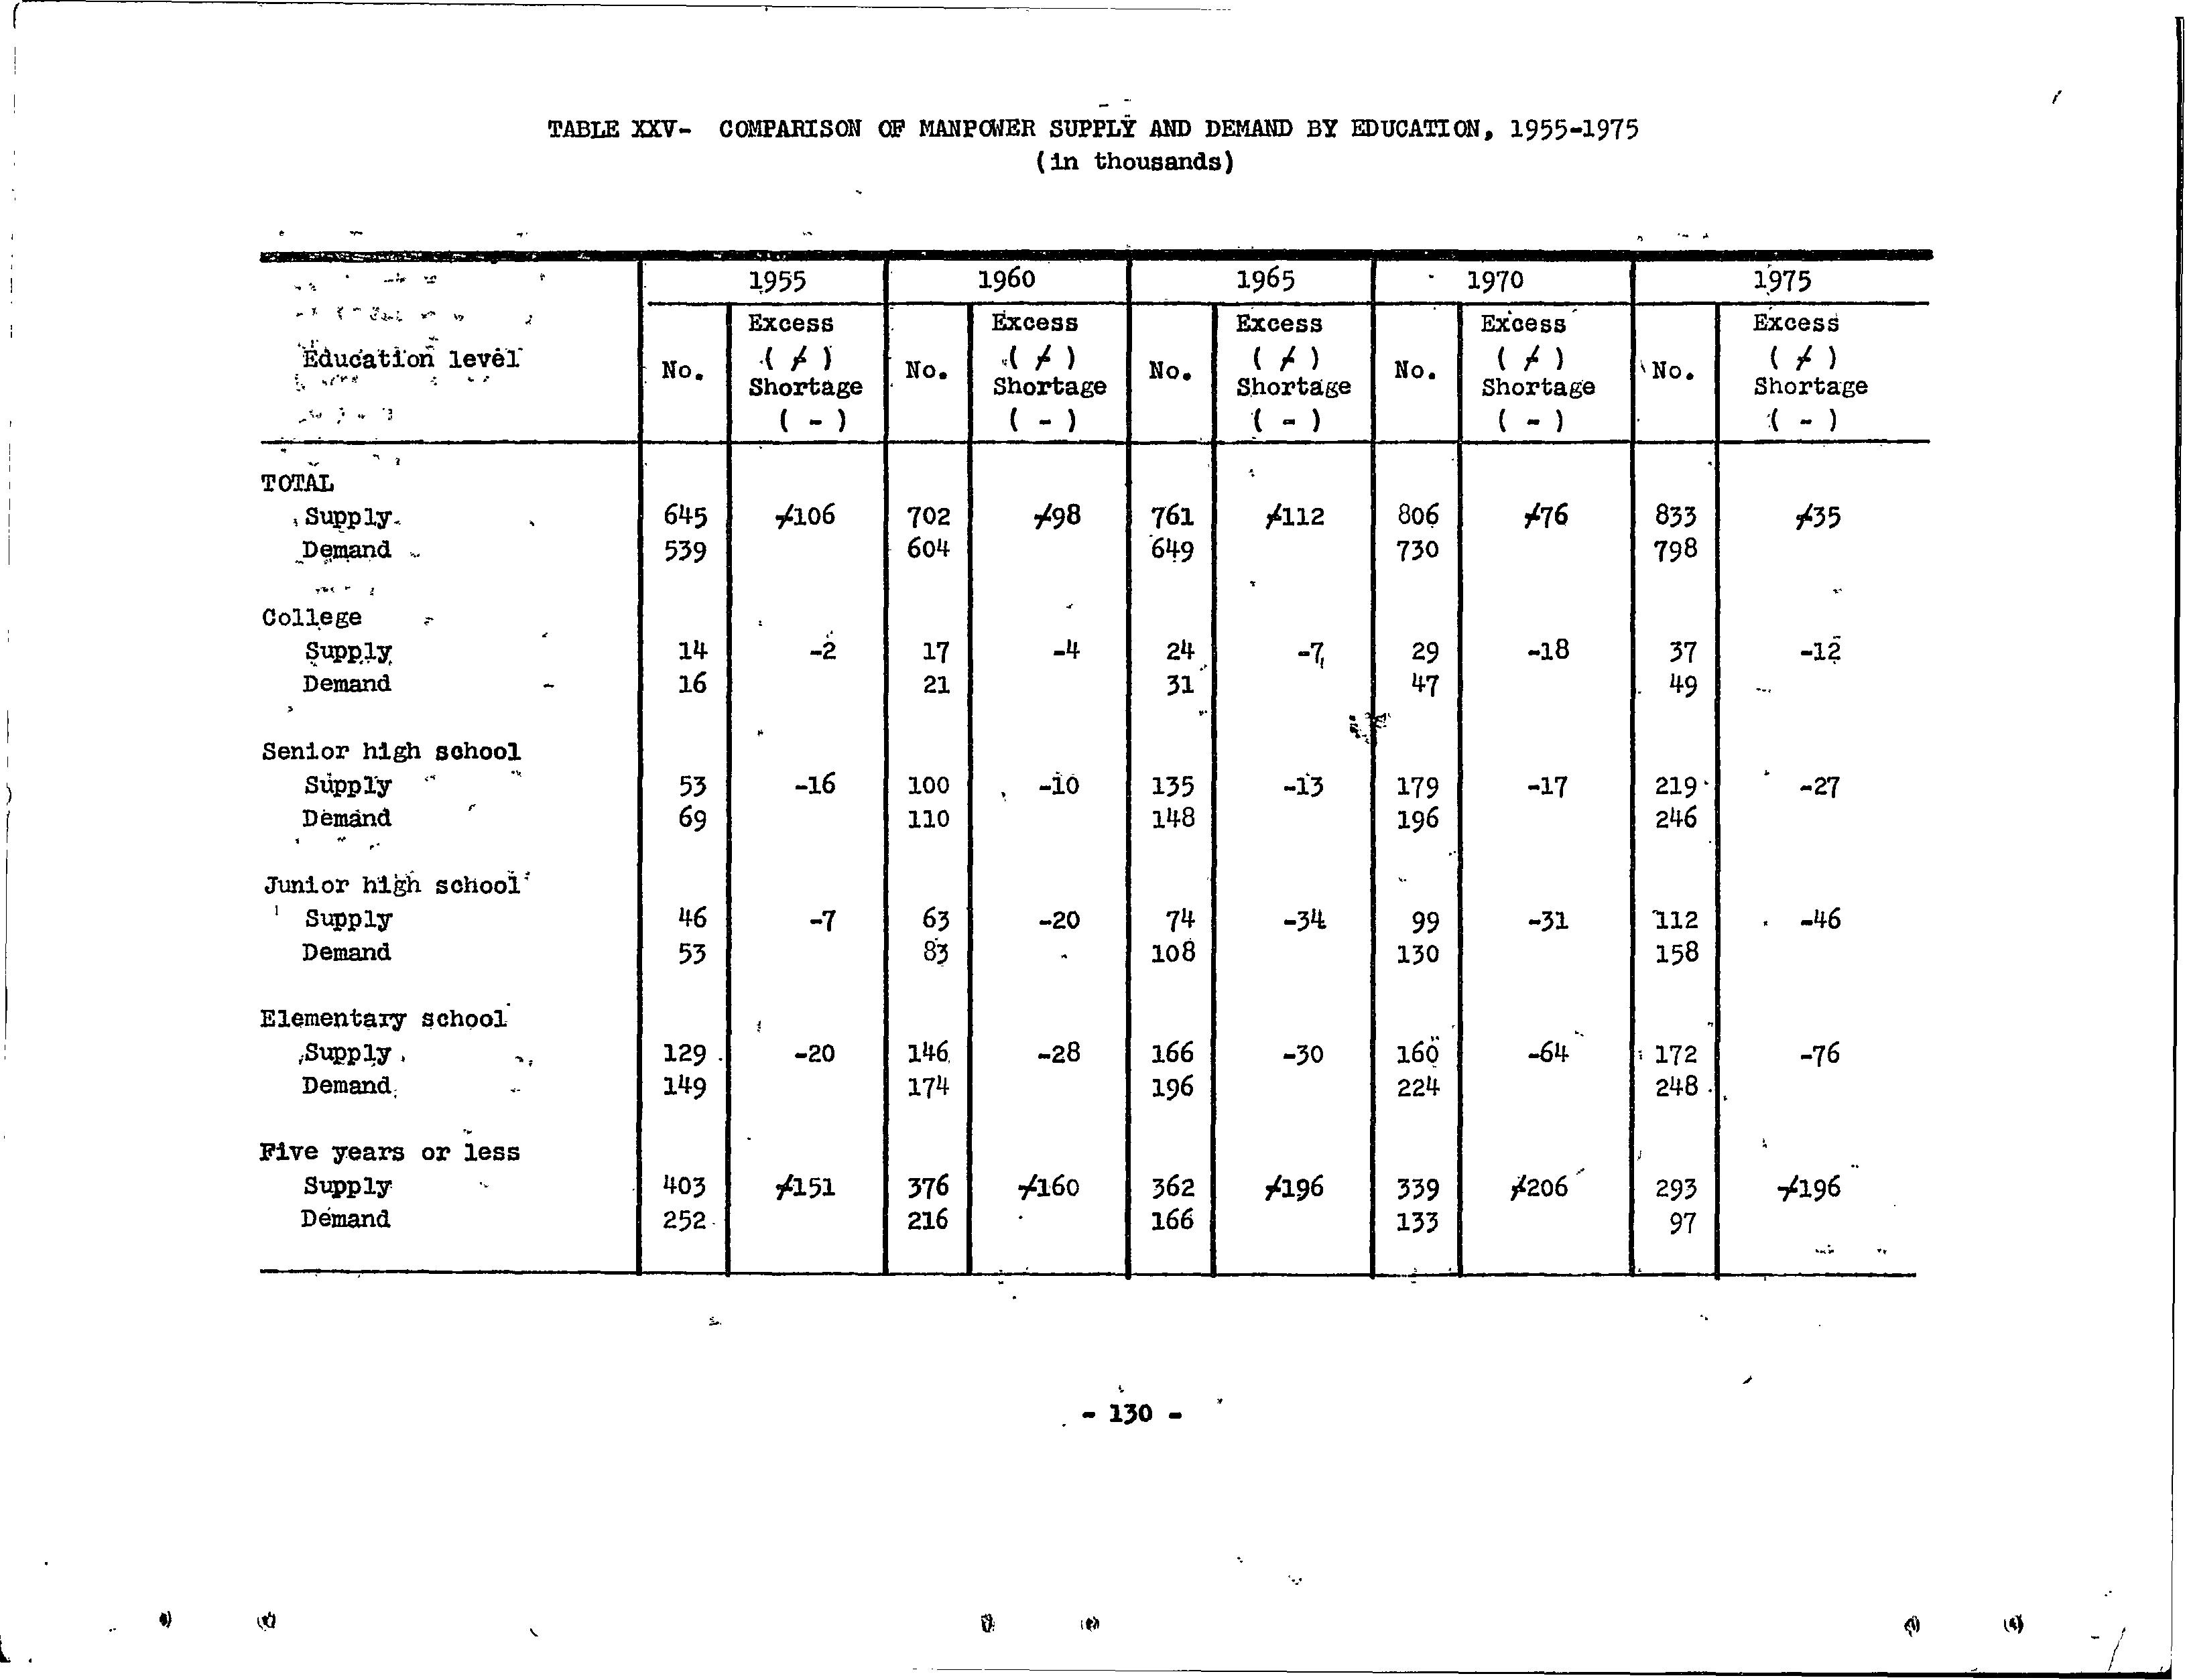
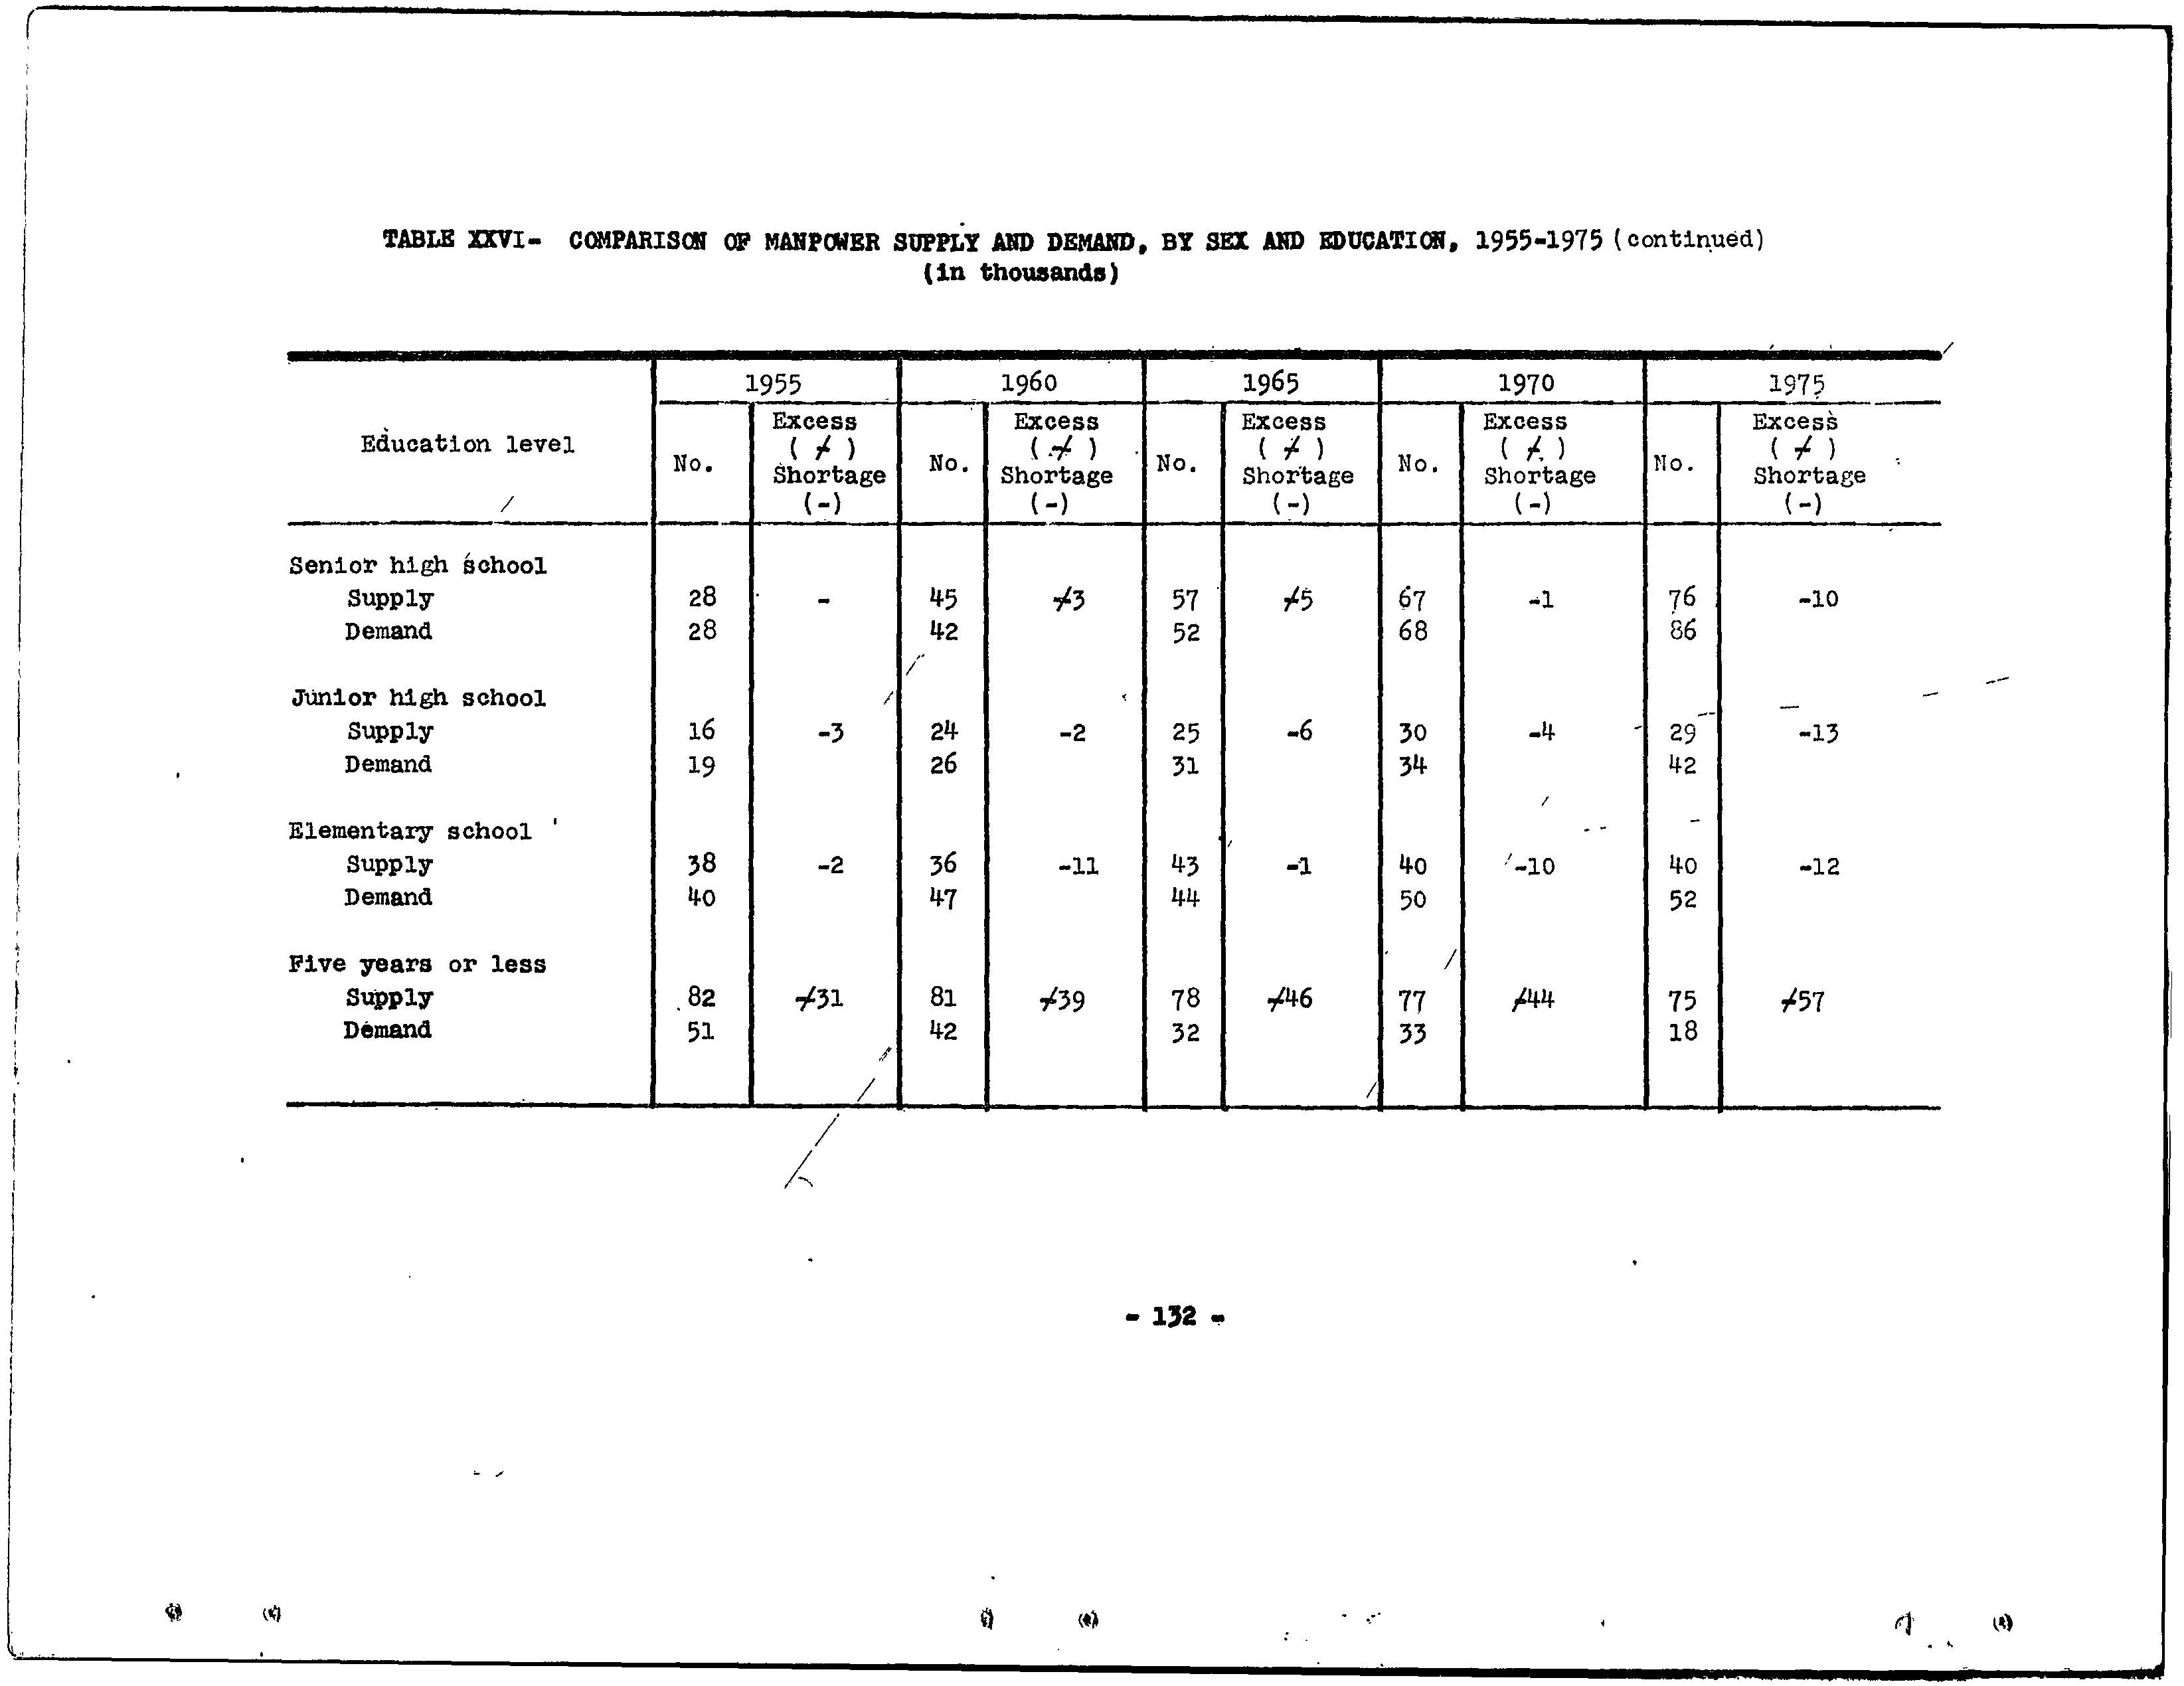
15- Education Shortages an:d Surpluse.s in the .Labor Force, 1955-1975 ,!
16- Shortages in the Labor Force by Le:'vel -of Education, 1955-1975
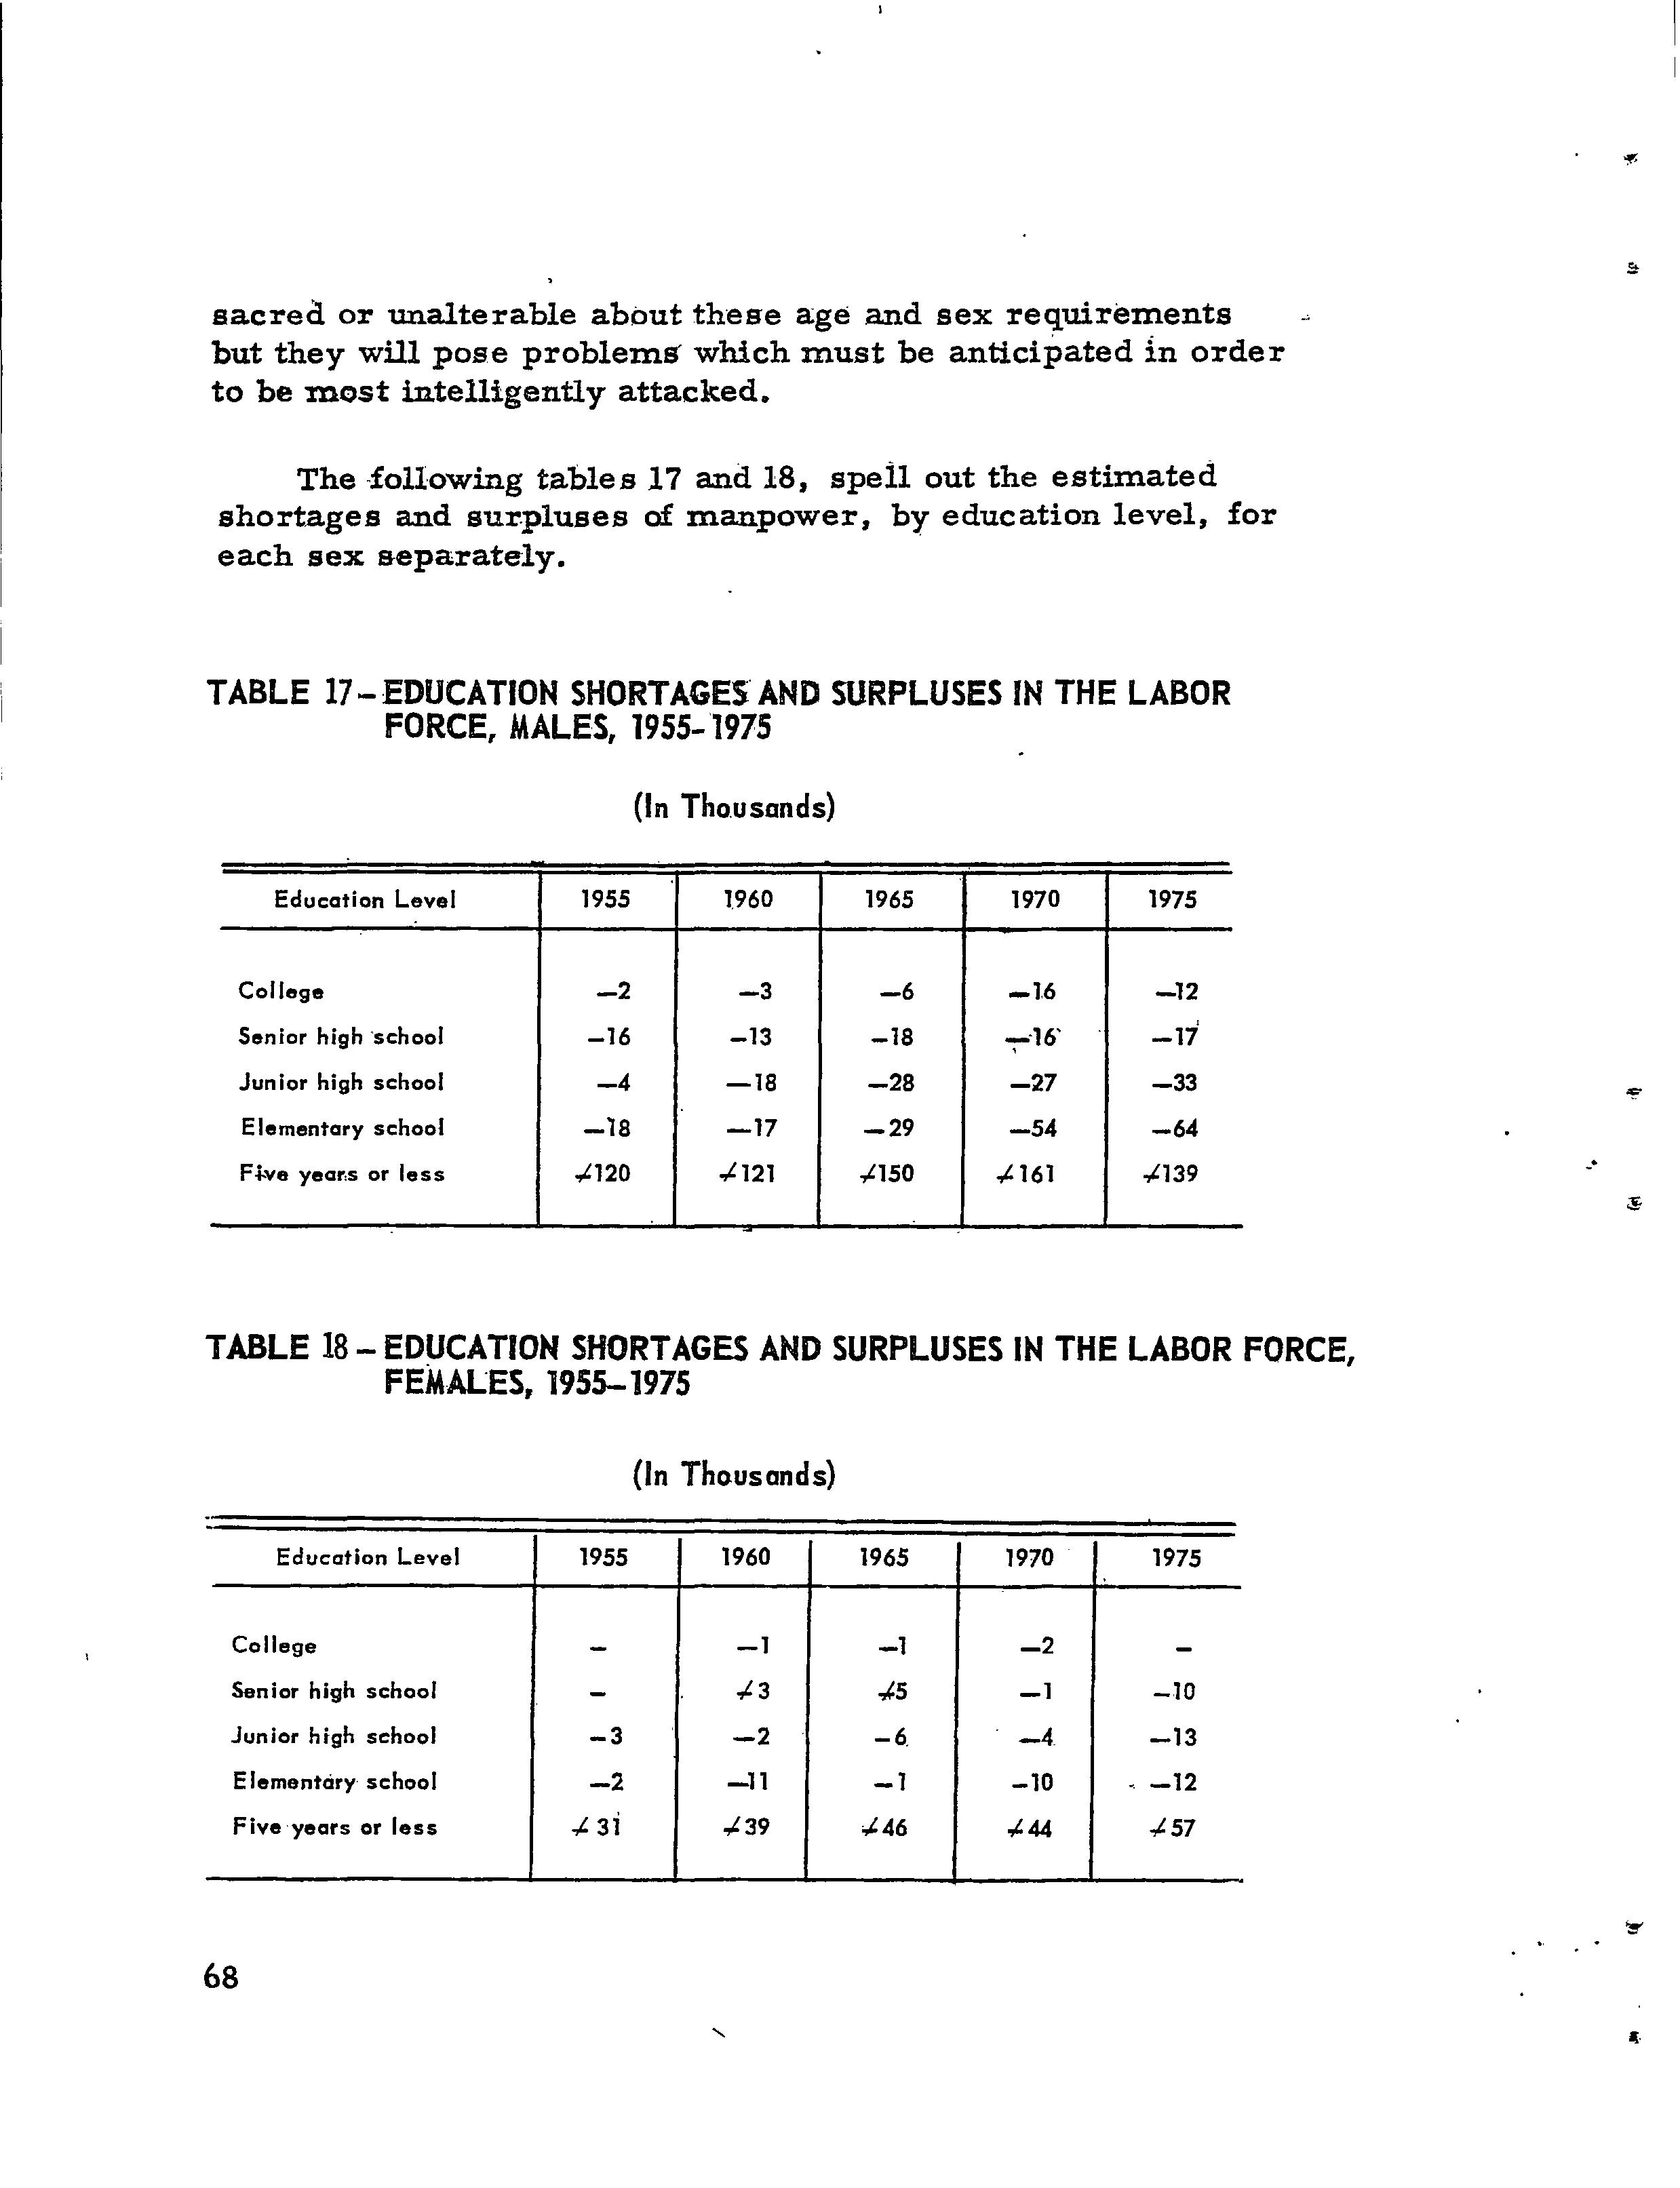
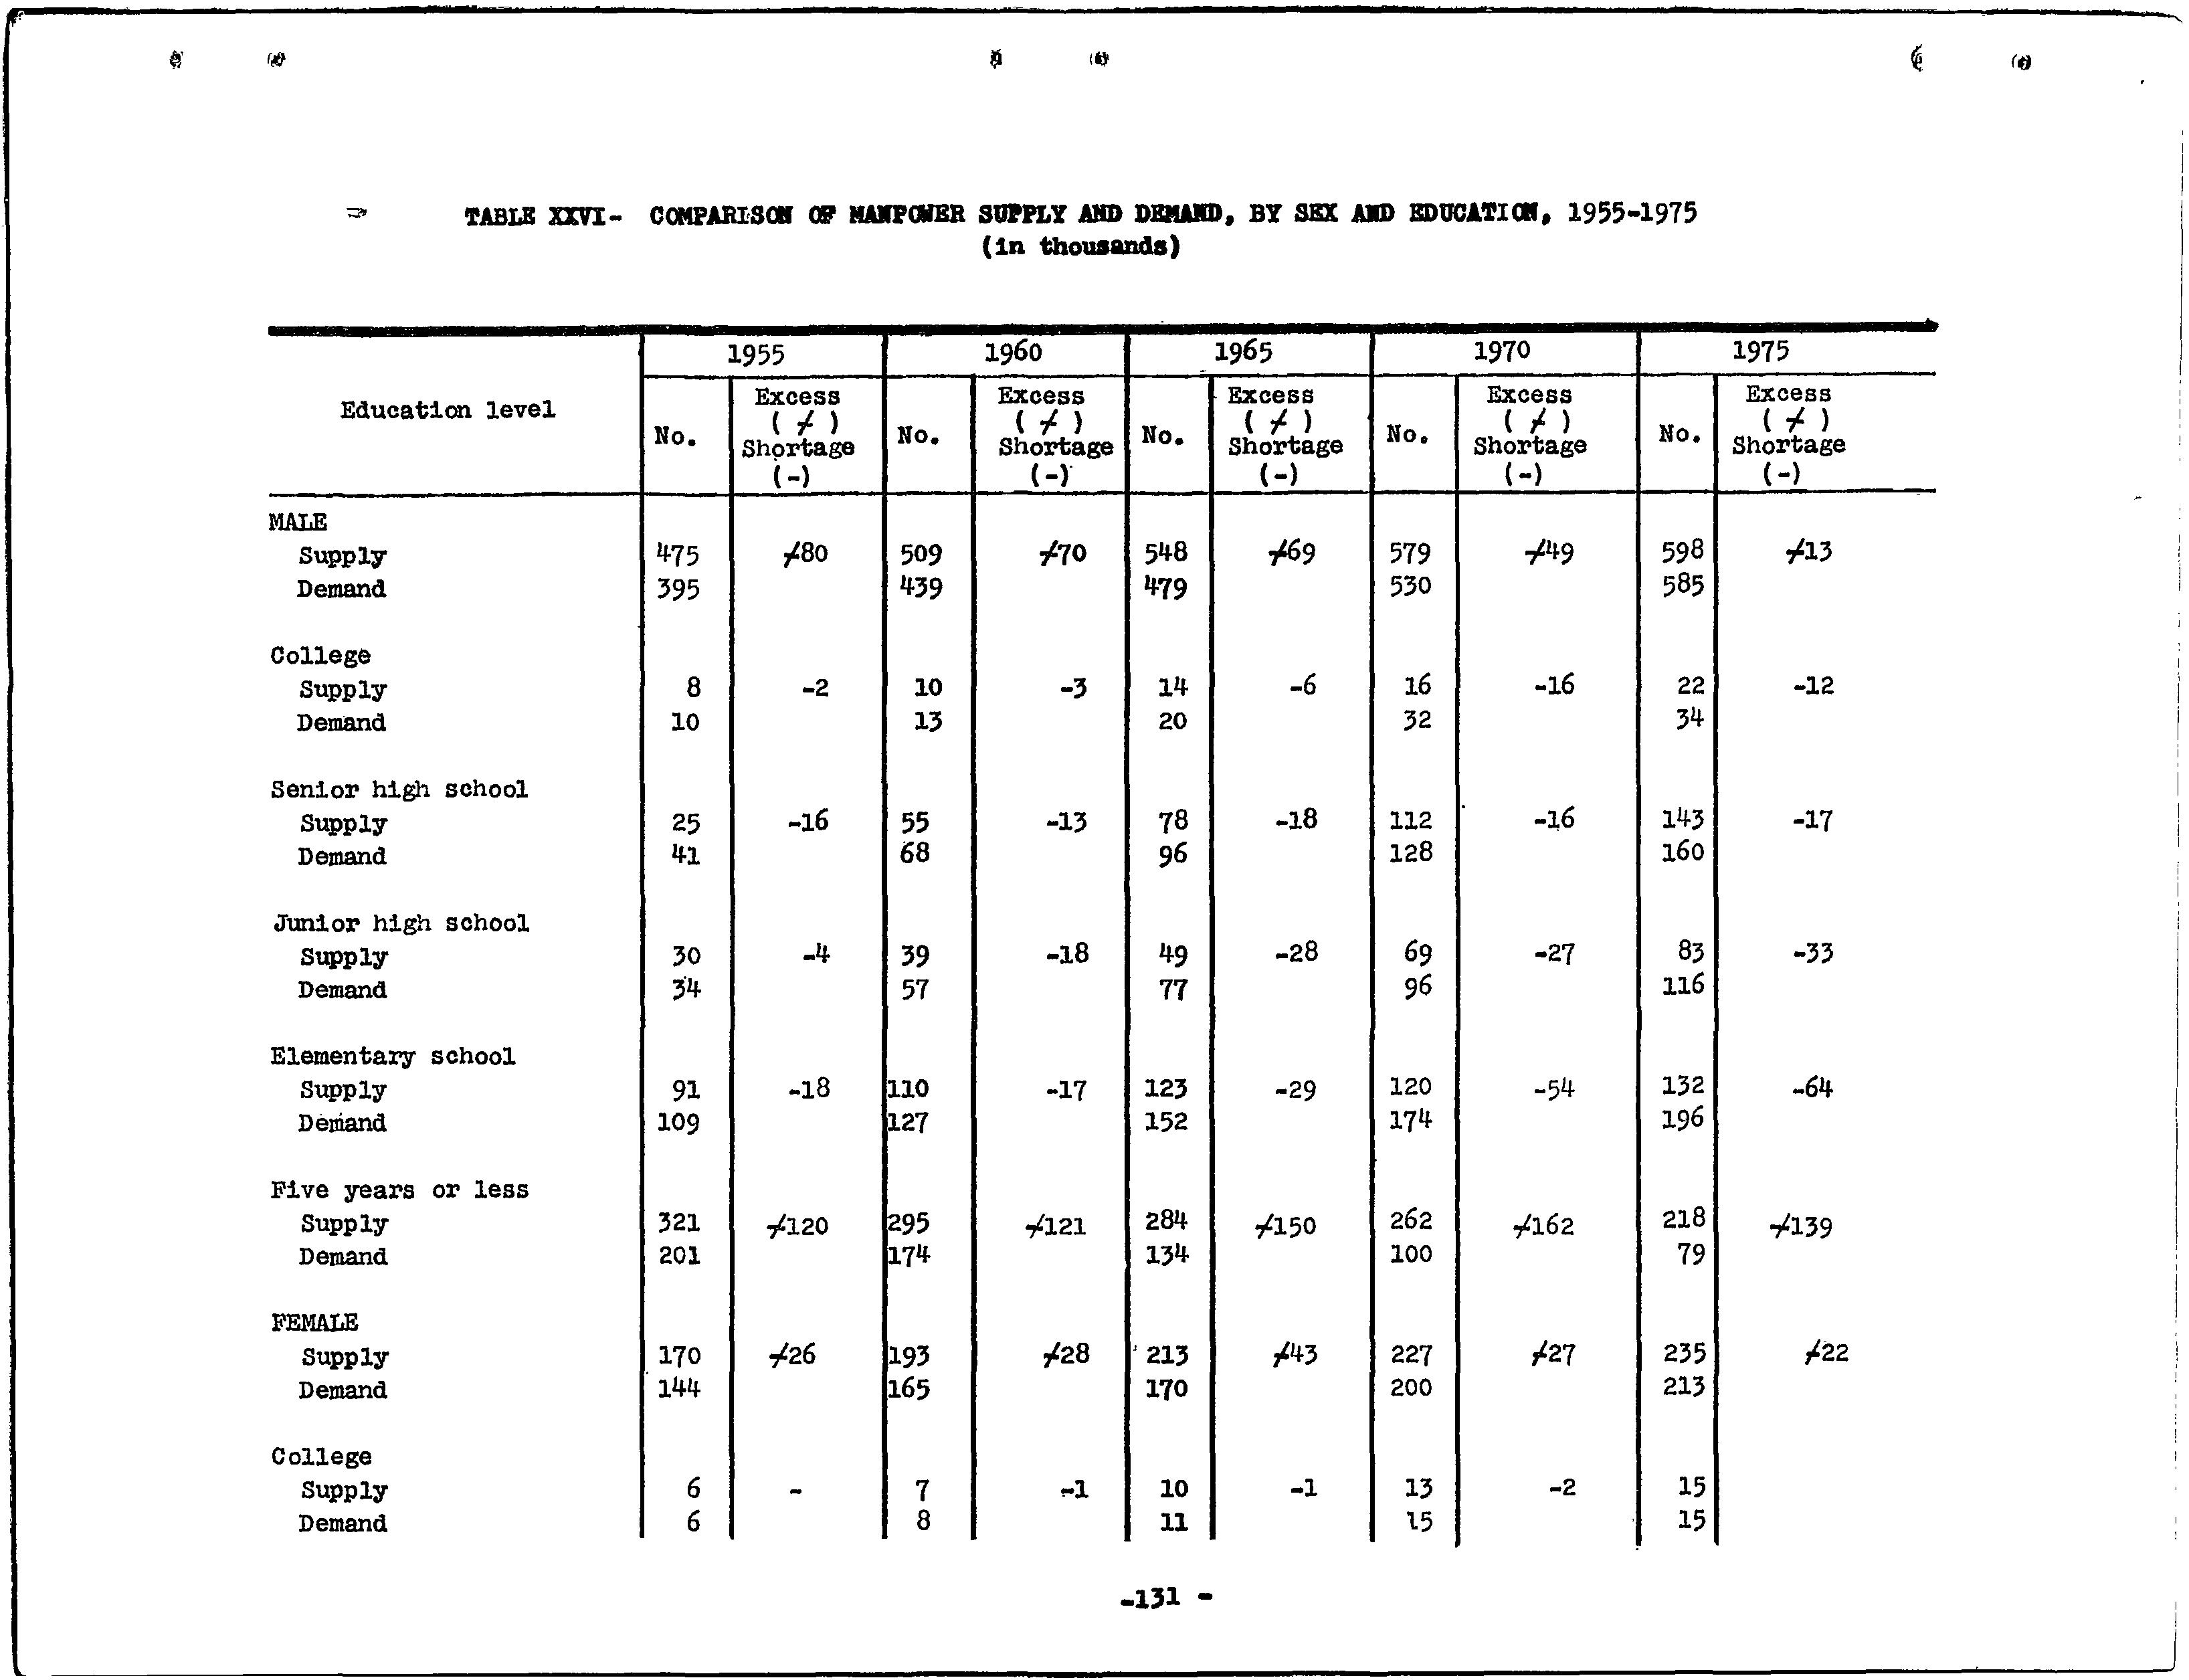
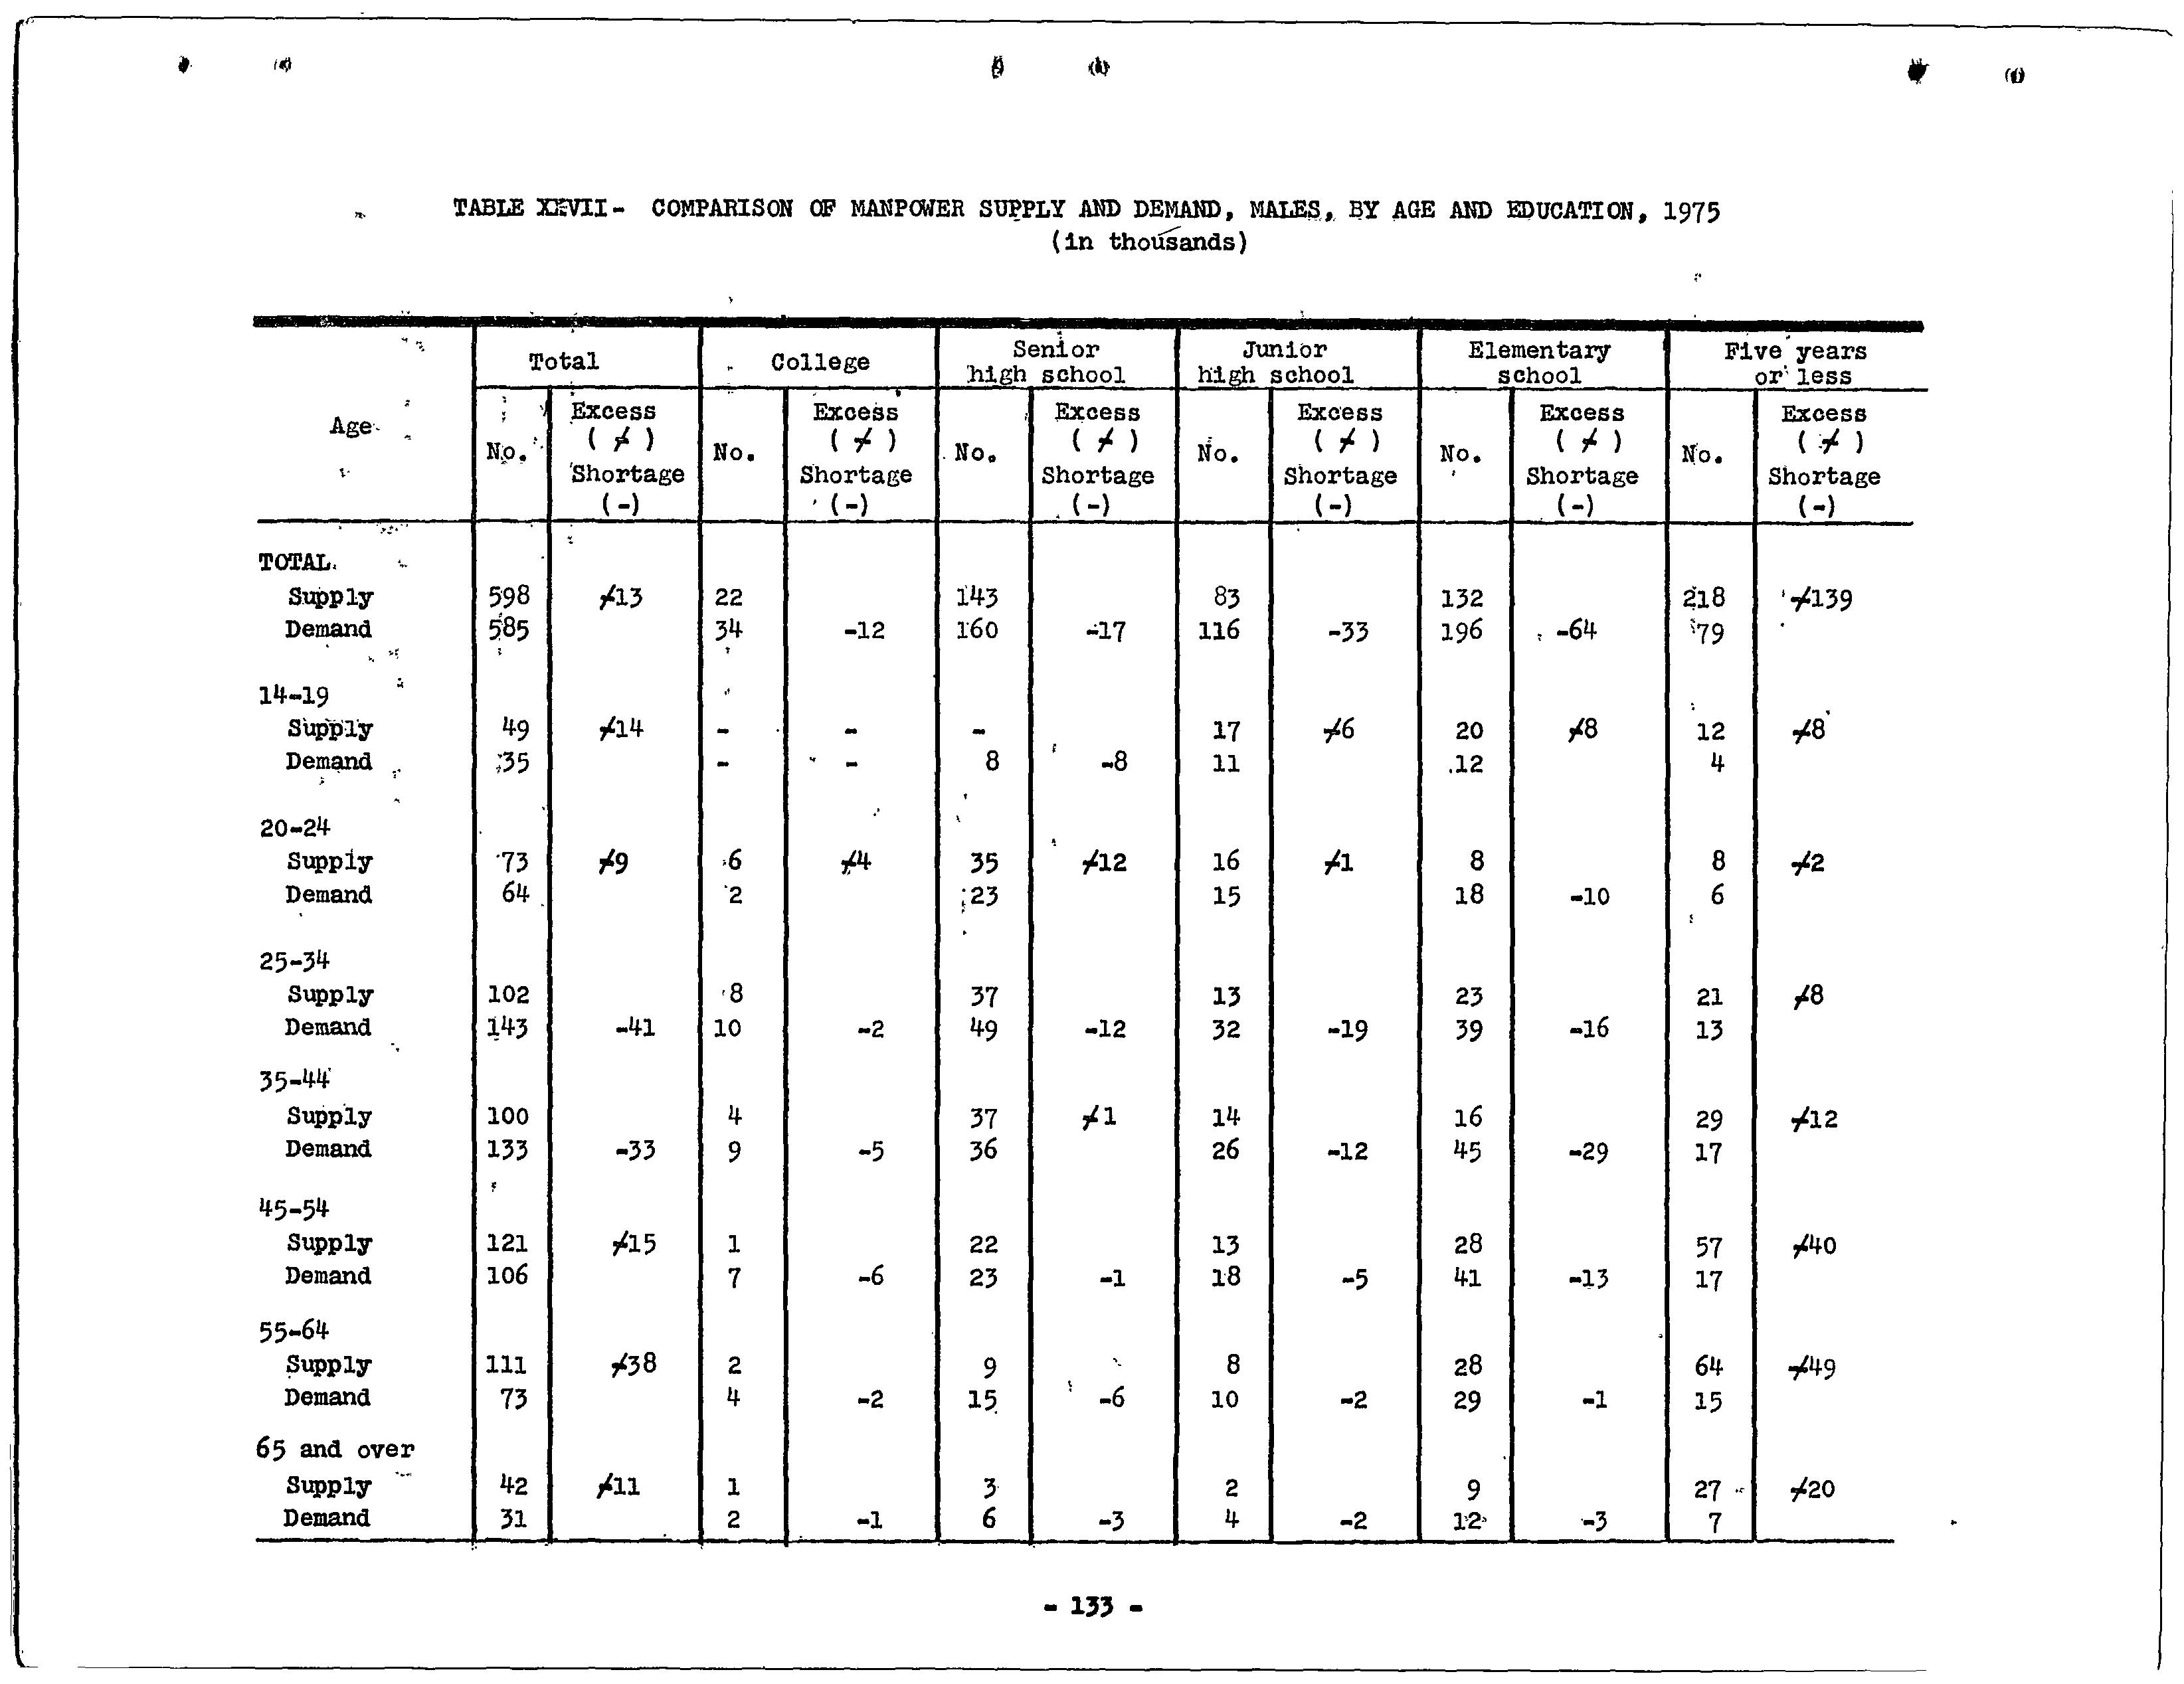
17- Education Shortages and Surpluses in the I1i'".ibor r? ':f'Z ,. ,68 For.ce,Males 1955-1975·
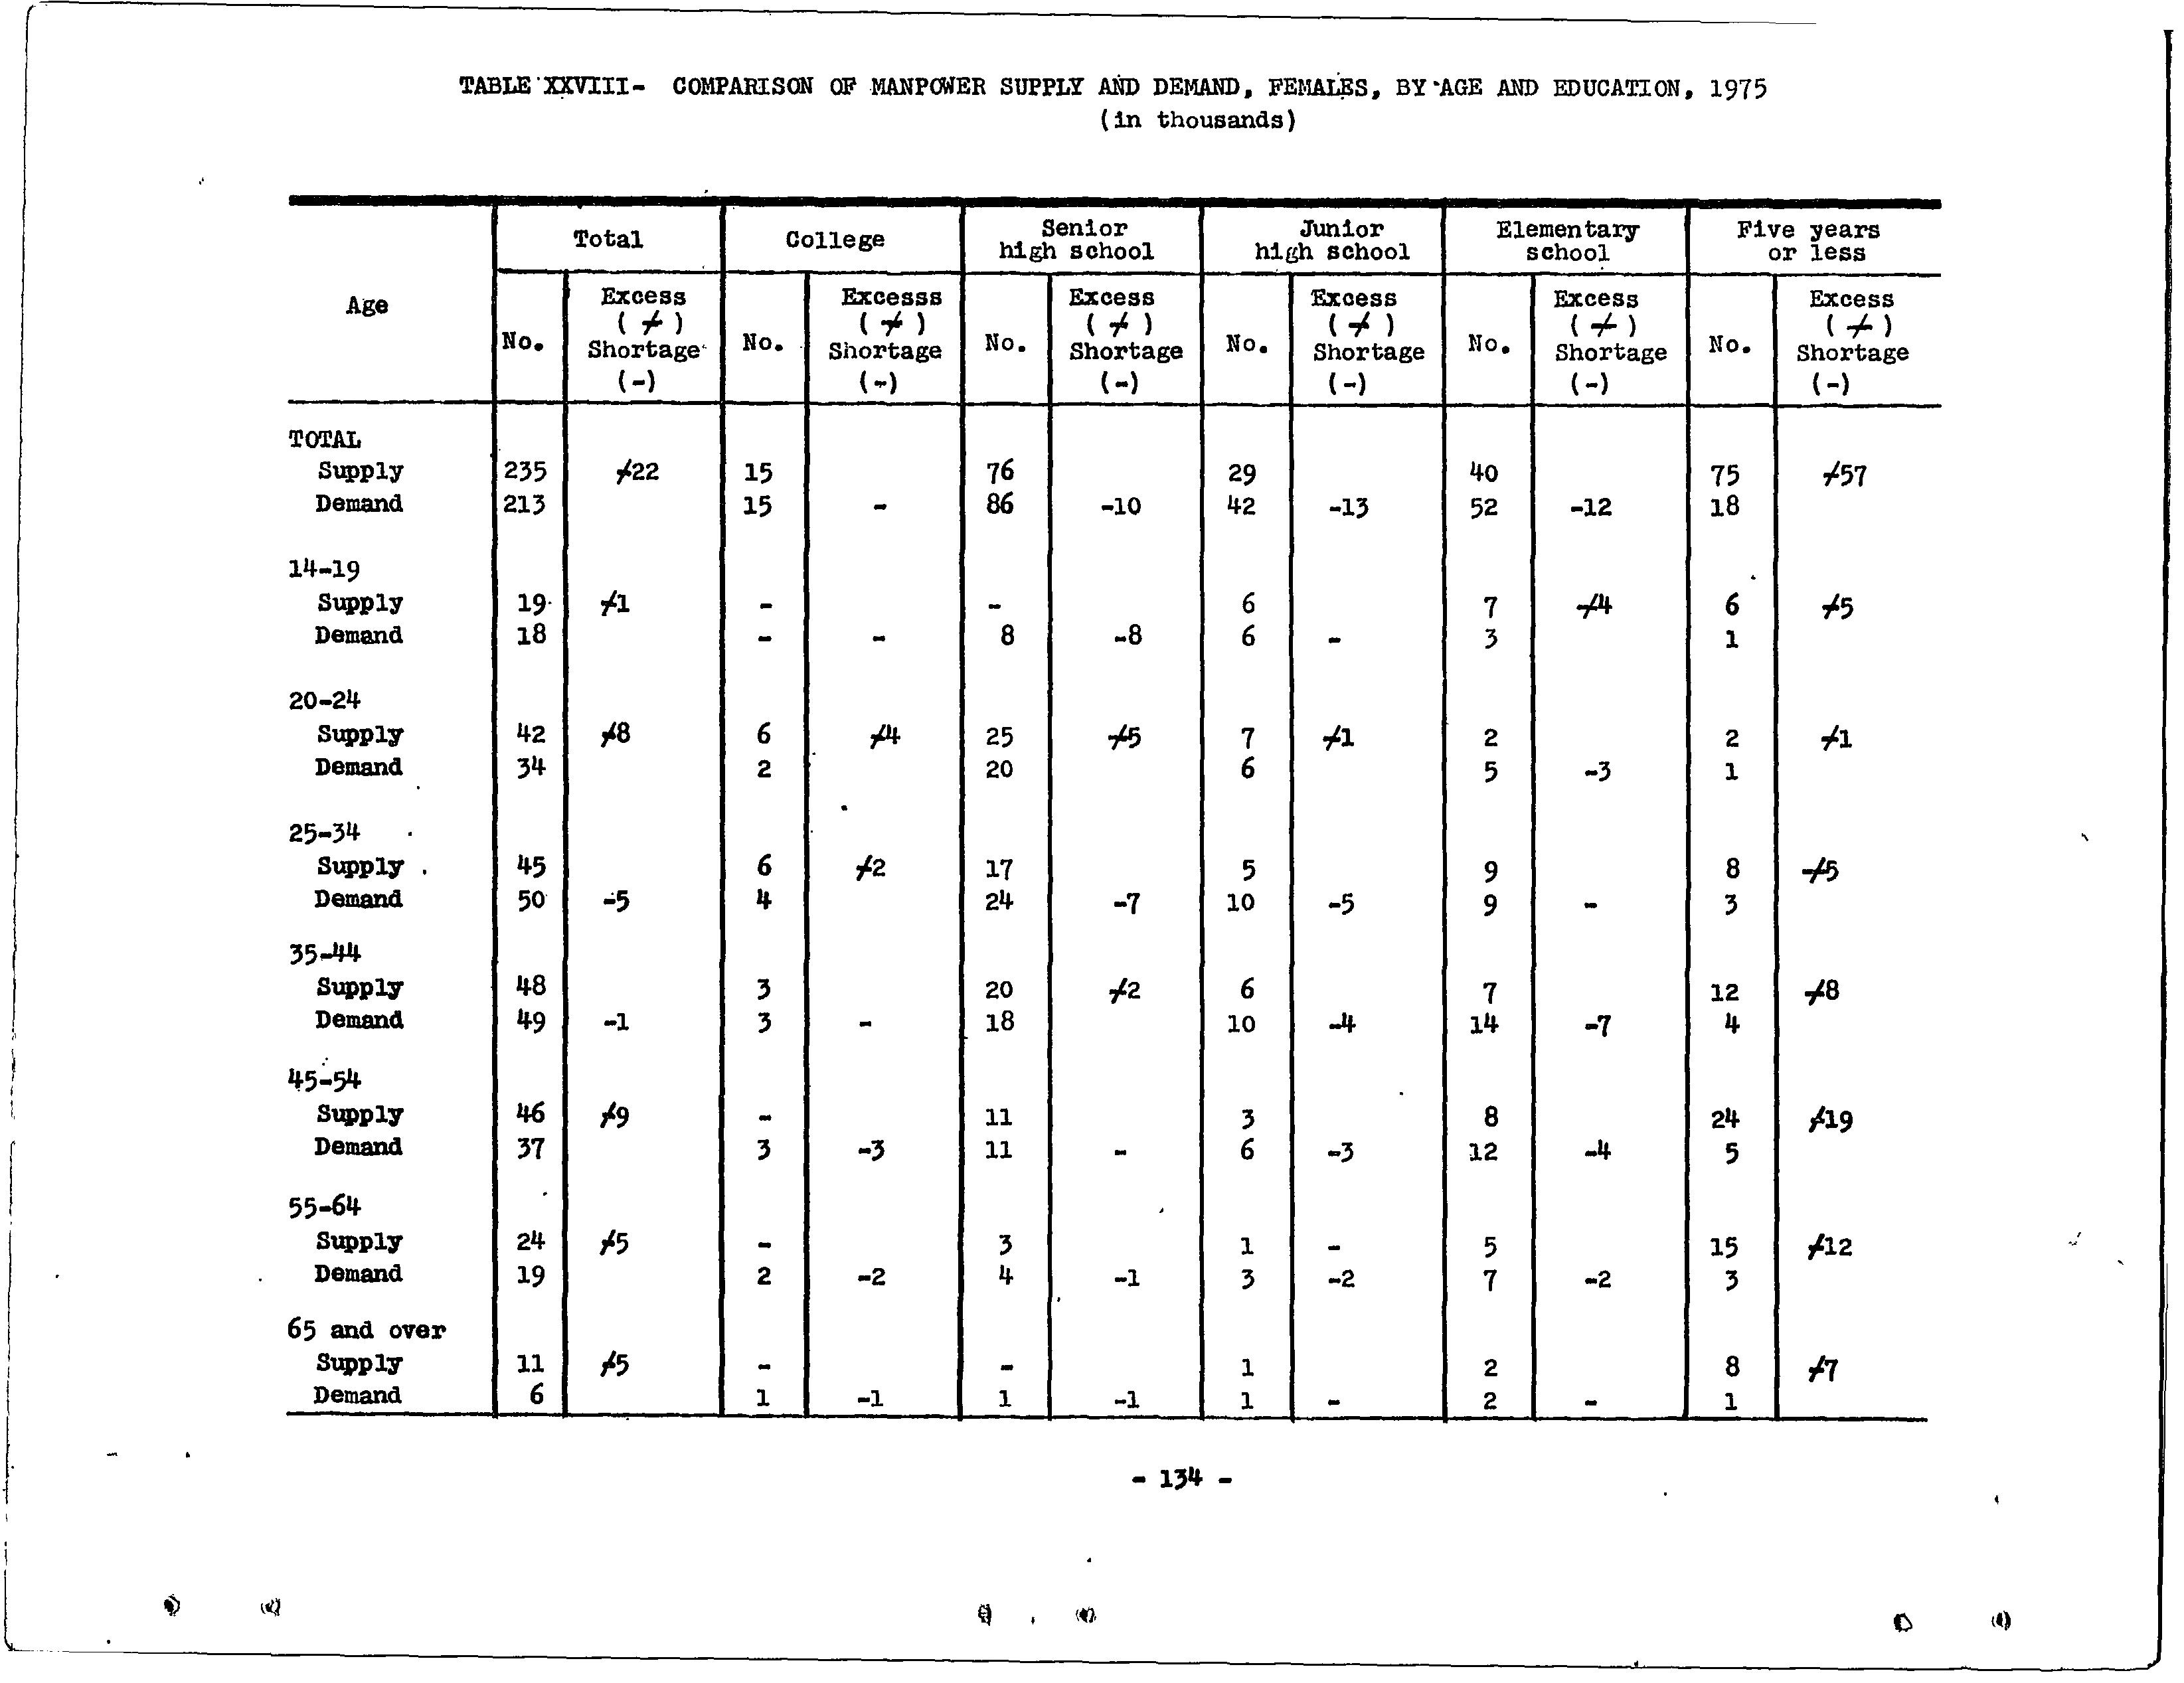
~lij- Education Shortages and Surpluses in the. Labor Force, Females 1955-1975
19- Shortages and Surpluses in the Labor Force by Age and Education, 1975 ,,
20- Manpower Shor'tages by Level of Education, 1975
I
GENERAL
PURPOSE, METHODS AND CONCLUSIO,NS
Operation Bootstrap was launched by Puerto Rico, fifteen years ago, on the assumption that manpower was her only plentiful resource. It looks now as if skilled manpower may turn out to be her scarcest resource and this in spite of the fact that Puerto Rico is devoting much more of her economic resources to education than any other country in the world. 1/ Anticipating this problem the Commonwealth Government several years ago began a continuing study of manpower needs and of the training :facilities required to produce a corresponding supply of :manpower.
By manpower needs we mean the distribution of manpower which would exactly match the available opportwiities for employment. By training facilities we mean homes and schools and jobs and such other social institutions as contribute to the skills and training necessary :fo1· employinent. These definitions make it clear that the estimation of manpower needs and supply is a complex task of which the research repqrted here is'neither the beginning nor the end.
Specifically this report will present:
A Estimates of employment available in 1960 and in each fifth year thereafter to 1975.
(1) For eleven major occupation groups, by sex;
(2) Fora num.ber of specific professions and crafts;
(3) For five levels of education, by sex.
_1/ The ratio of students in school in Puerto Rico to full time em.ployed persons is. more than one to one. In the United States and in. every other country except Israel this. ratio is ne.arer one to two.
H ,,·Esti~ate s of tne popul'ati6h-io:f labd1:JI0:i::i:M} aJge·) antfilf~ tne future labor force, for 1960 and each fifth year thereafter to 1975, by five levels of education, by age and sex. 'i!. ;,~., ,; -. l ·l t ·:,
C ,Estimat¢s of the size of futu}-"e- ~~o:rtag,e.s .a,nd surplus~s of m'an.power by le..:vel of educati_~.:m,and s~x fo:r,,l9£?0 an.d fo,r ea.ch ' •· ~- ~" succeeding. fifth year to 1975. ...-:r.1.: •~ -· , ,. { :. ' l > .l '
In order to make the ab~ve estimc!,tes ,it wai;; :p.ec~ssary to haye a. proJection -of ~he tota~ p_opulatio;n by ag~ and. f:!~i, wl}ich· involves, not only birth and death, rate projec:tions bµt ~.stimate·s '•al future mig_ration rat~s ._ It was nece.ssary to make projecti.011,s of th~ out.put of the economy by class of product and service, to es.ti:r:nate the expected in.creases in productivity in each sector of the economy and, to p.redic.t changJng occupational patterns in each of these sectors, It w·as 31ecessary to estimate tl;te growth of education_al faciliti~s, how many pe'·rson.s would contin-µ.~ in sc4ool_ to each level and also what p9-rt of each educat:j.on group woulq. migr?,te and what par1; yv-oul9- ente,r the labor force. It wa~, th.us, nec~ssary ~or many different set_s of basic data, developed by _many different departments of the C.ommonwealth an¢!., Federal Ga'vernments, ~o be brought together, in 'order to arrive at estimates of fut4.re manpower needs and manpower supply.
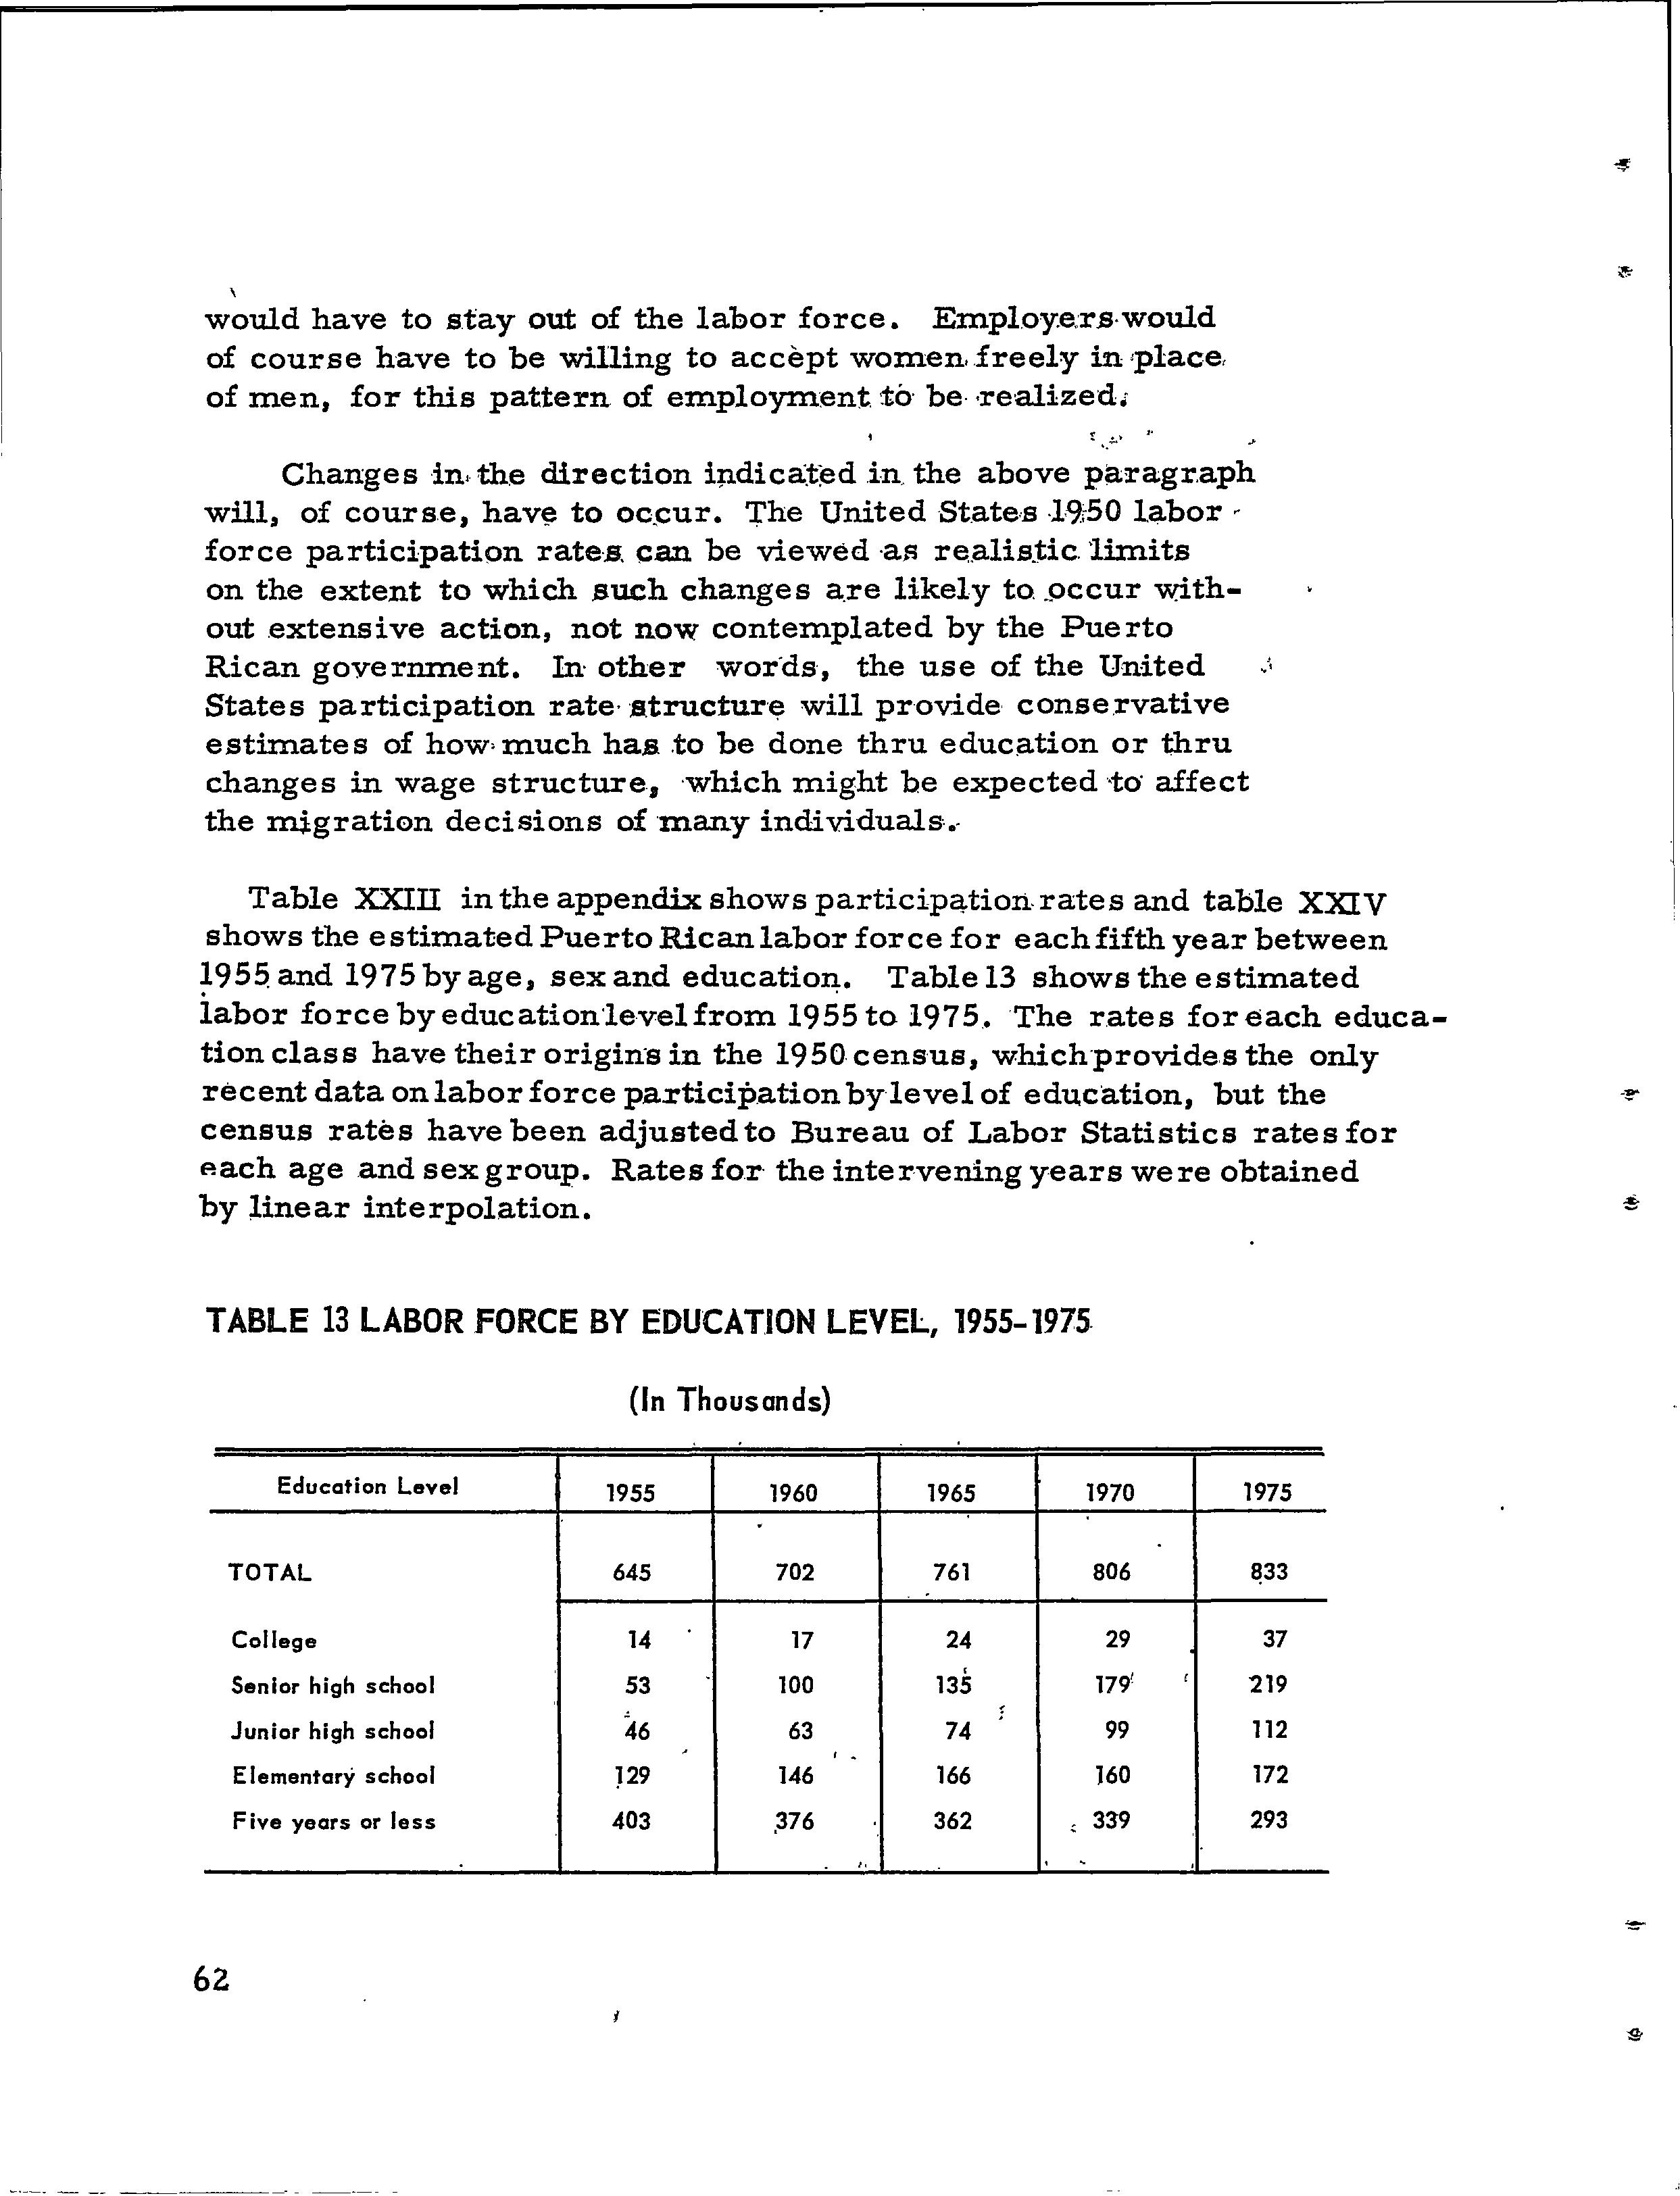
One of the primary purposes of the p;\~se~t study ·was to provide a bas.is fo;r ·planning the future workload and policies of the Puerto Rico Employment Service; but, just as the research required the cooperation of many departments of governm~ent, so its results will also be of great value to these departments and particularly to the Department of 'Education and the Office of Personnel of the Commonwealth, Government. The same data will provide a basis for e~ployment counseling and for educat'ion and pe.rsonne1 planning.
Another approach to the estimation of manpower needs and supply could have been taken. It might have appeared to serve the short-range needs of the Employment Service better to have studied occupational supply and demand in the current labor market and to have proceeded from such studi~s to short range esfimates for the future·. Such studies· 'will be 11,ecessar:y to. sup- , ... plement the information ·presented in this rep·ort, but to have made s1.+ch studies first would have· ignored-what is perhaps the most important aspect of Puerto Rican society.
Puerto Rico is in the .full. cou~se .of funda.:mental and rapid• i economic and social change,:.;.:;Employment .in· agdcu1ture and in handicrafts such as home needlework is declining',rapidly, at. the sa.:me time that the manufacture of modern p·roducts s~ch as electronic components and petrochemicals is 'faciilfa vast i~cre ~se Incomes are rising rapidly and la·rge scale chang~el -a:·re' occu:'rrih~ in consumption patterns, place of residence and socio;;.economic· structure. Educatfon facilities 'have bee:b. g~eatiy :e'xpanded and 1 the people getting the new· jobs tend to be the recent graduates from school rather than the people being displaced from employment in the old sectors of the economy. A study of the cur:tent labor market would have little value, therefor·e,unless 'its results could be interpreted in the context of the changing scene and this context is what the present study aims to provide.
If it is asked what validity-long range projections can have in such a dyna.:mic situation, the answer is that they can be given considerable credence; since Puerto Rico's sociaL change is not accidental but stems from specific policie.s designed to achieve• ·rapid economic development. There is now a large body of data which shows good progress toward this goal. It has, for exa.:mple, been Commonwealth policy to encourage the growth of manufacturing~ which is not limited in its potential by the local availability of •• physical resources. Tax exemptions and a plentiful labor force '· have proven succe~ssful attractions to private enterprise and, barring' a major political or economic• catastrophe in the United States, will continue to attract manufacturing industry to Puerto Rico. The attention the Puerto Rican government 'has giveh to education, health, the improvement of transportation, 'the provi'sion of eie-ctric power, etc. has further) supported the continuing•ind'ustrialization of the island. J , ' ••
' This study will itself provide additional underpinning fp~ the planned development of Puerto Rico,, insofar as it result~. in ·actions to avoid the predicted manpqwer. shortages and surpluses· It will, on the other hand, by no means ,provide .. alL the m~power i.nformation needed by th~ Puerto Rico Employmep.t $el;".v:ice and by other departments of the Puerto ~Rican .government. iWe .. have, for example, no estimates of the future supply of engineers, doctors and other professional personnel, to put along Side- our estimates of future demand for these occupations .. '· Such e·stimates can be made and, in the coming ·year, we expect to make· them.
They will be: more useful, howeve.r, if made .after a de.dsioh . is reached to increase· the total .output of the schools to match the indicated ma:npo:.ver· :hee.ds by educational level.
-~~" ,· s,, Eve:r:i witho,ut correspondin,g supply estimates projections of t4e demand for engineers, doctors, plumbers, machinists, etc. can ~-~rve. a very useful purpose. Such estin:i.ate_s of future empl9yr:p.en~ .c~ be compared with .presen:t employment figures a,nd ~the ip_di,~.~te~ :cates_.of g.rowth of ~ach profession '"and .craft c~n· ,t:P,us he cpmp~red. - These comparative rates 9:f growth can :i,n ;1;1;1:p~ prq~de. va.iuable ..if not d.efinitive -guidG1;nce to young _people choosing .a,:voca,tion and to school admfnistrators allocating a tot.'1~ bug.get arnong !¥ubject matter fields.
A more serious limitation of the present esti:i:nates lies in the fact ·that- they do not. include the experience requirements of the various oc·c'upations'. Census data on the. education levels achieved ·• by pers·ons in the var-±ous occupations make it pos:s•ible to conve·r't ·:occupational estimates into e-ducational terms. Si:n1ilar data on~work experience are not available.
iThe a~sence_ of data op. job experience, whi,ch. we expeet to. obtain in futu:r~ studies, il_lustrates a ::.:::.-iore general limitation in,the ~v~ilab~lity of mc1,npoyve_r ~nd related data. None of our d~ta . .series on the output of g_oods and services, on productiyity, on . -mig},"?,-tipn, on labor force participation, on school enrpiln:,i.ent, etc., are as, e:x:tensive or as detailed as would be desirable. It is often- necess1=1-ry,to choose dat9- series on .the b.asis of their avc'J.il,ab:i,lity. In the pr~sent study this fact is il:J,ustrated by the freq:uent .recourse to d~ta for the United States, because this w.as the only av~ilable data which has been tabulated to sL.ow educa'f;ion by occupation and labor force participation by level of edq.cation. As' a part of tliis study comparable tabulations for Puerto Rico have been secured,but it would,.be desirable also to have comparative statistics from other states or countries. Another year·1s work should emphasize a search for such data but we do· not believe ·that the'y'would invalidate the use we have made of United States data in the present estimates for Puerto Rico.
~Exam.ination;of many Puerto Ricc:1.n tj.at~-series, placed ;:i.longside-,their United •State,s_ counterparts, .reveal that in most instanc.es. 'Puerto: Rican tre~d li:nes -appr.o_a,~p, United States tr,end lines
as limiting values. It would be surprising if this were not the case.
The economic development of Puerto Rico is repeating the history of all the more advanced economies of which the United States is one. The similarity and the relationships of politic.al and economic institutions in Puerto Rico and the United States make it likely that in certain aspects development trends in· Puerto Rico will follow those of the United States particularly clos.ely. The differences between the two economies, some of them very important, show themselves principally in the relative size and growth rates of the major economic sectors. Since our analysis is made by sector these differences are taken into account. Thus the use of data on the United States is a virtue not only of necessity. Were we given only one body of data to chose from this would undoubtedly be the be st choice.
It may be wondered why we are so concerned with the pre:cision of trend data when, after all,· our projections contain a much more fundamental source of error, namely the uncertainty of future events. But this point is raised primarily to make clear the nature and the purpose of the projections which are to be presented. It cannot be too much stressed that these are contingent projections, contingent on assmnptions all of which are subject to change by future events and some of which are expected to be changed by planned action. One of the principal purposes in making these projections is to ir.sure that they shall not all be borne out. What has been done in estimating manpower needs is to pl."oject the. probable employment opportunities, assmning the availability of manpower poss.essing the appropriate qualifications.. Our estimates of economic growth are based on availabilities of capital, n:iarkets, management skills of non-Puerto Ri.c:an origins, electric power, transportati.on facilities, etc., which on the basis- of past trends and present policies we. have g.ood reason to expect. Our purpose is to estimate what manpower :r, we will requir~ if. these expectations are fulfilled. Our supply estimates, on the other hand, are basE;ld on changes in the rates of population growth, migration, educational development and labor for.ce participation, that we can now expect on the basis of present policies and conditions.
Ou~.1 esti.Ir.!-.ates Qf :rn~powt;lr ne.e.ds a_re- expressed in-;te:,;ms of num.bers of individuals of each sex, in each age range, at each level of education. Our estimates of manpower supply are expressed i~ similar te~s.. W~ ass;ume that t!ie educ~tion level_ q~ ·t:li~ pop-glation can be incr~a.sed, anci tj).c1t thus th~1 supply o! train~·d manpowe~ ··can be :increase~d,- We ass~e on, the other hao,d, that while. the age ~d. se~ composition. of .;the pop~ati~n c.µmot be signif~~~tiy modified, it will be possi~ble , to modify the age and sex qu,al.U'ication~ re.qu,ired for employni.ent, . in many,,,occupatfo:ns)' without sig_nificant effect. Qn output an,d pro.-, ductivity levels.
• •• ~ 1 , 1
If it w~:i:e~found impossible to match the e'~timate9,,manpo~r , ' supply to t4e estima~ed m.anpQ:wer n~ed~ on essentiaf.c;haracteristics, o~. t.o modify the estimated m~power needs on what appear. to be non.:essential characteris,tics_, we would have. to reduce ou_r· estimated output, producti,vity and inc.ome goals. The purpose of our manpower estimates is to determine whether manpower nee~s and manpower supply can be· brought••into balance by,. desirable- and. feasible action and to .enable us t~ specify the nature and extent ·of '; this action. " '·· '
To meet the. projected employment demand 'it seems to be -necessary-for. Puerto Rico during the next :seventeen years, to· give at least 300, 000 persons an ayerage of six years more education than they would get without··an accelerated education progra:m. To provide·· this additional education is not an impossible ,task for- a government with the r.ecord of the pres.ent Gomm.onwe~th Government. But providing the .additional education will o:D,),y. begin to s.olve the problem. The. additional. education will h:a~ to ·be properly distrib.! uted a:mong subject matter fields and by level of education. Even then it will turn out that. the educated ·persons in-the ·population are in lllany instances far younger: :than are usually required for· the occupations. for which they pos-sess the educational qualifications. Putting it another,way, the ·sufficiently .educated will tend to lack expe-~ience whil~ those- with .. sufficient age and general experienc~ will tend to lack education.
Actually,. if-tp:e-education goals are met; graduates will ·be c·oming into the labor m.arket Jaster than ·the labo:r ma'rket will normally abao;i:h new entrants and this :at· a tiine when.:it:will be
important to mobilize every motive which would keep people in achoo!. Furthermore, if educational opportunities are provided for those best able to profit from them, it will be necessary to aubstitute women for men in some occupations and men for women in others.
The Employment Service will. be faced with a series of difficult tasks and will have to maintain policies which will in some instances be in apparent conflict. It will, for exa:mple have to counsel young people to stay in school, preparing ·for jobs in which it will have difficulty placing then immediately upon leaving school. It will have to persuade employers to modify experience requirements and at the sa:me time persuade new entrants to the labor force to take beginning jobs below their level of expectation. It will have to ind-q.ce better educated women to enter the labor market and at the sa:me time induce employers to use men in place of women in certain Jobs. It will have to intensify recruitment in the States for skilled jobs in Puerto Rico and at the same time intensify its efforts to place unskilled persons in the States.
Other departments of the Commonwealth and Federal Government will face similar difficult tasks in matching Puerto Rico's labor s:µpply to the,potential employment demand. The principal purpose of the present study is to anticipate the nature and the approximate magnitude of these tasks. Our future manpower studies will have the purpose of refining our_ present estimates, making them more reliable instrwnents for planning by government agencies, employees and employers.
II
MANPOWER NEEDS
There are many possible ways of estimating manpower needs, none of which ii;t the past have proved to be very satisfactory. First of all there is a prQblem of defining terms, which we have solve~ by m.aking m.anpo-yver needs equivalent to actual .employnient present and future. Under this aefinition manpower needs and labor market ~ema.nd have the sam.e m.eaning.
Mo.st past attempts to estimate manpower needs have tried· to answer one of two questions~ either. (1) how m.a.ny vacant jobs are there right now, say~. engineering?, -or (Z) how many engineers. :will we need to meet a certain ;standard, say to stay ahead of Russia in military development and at the sam.e tune satisfy .consUiner demands? Neither of these questions· is inclusive .enough to se-rve our purppses. Since Puerto Rico is ' adding-nearly a hup.dred factories· a year to its econ~my we m.ust be concerned ~th the -manpower needs of these factories ev~:n\though their owners ar.e not yet in Puerto Rico. Andsince Pue.x;to Rico exports about half its production and imports about half the goods and services cQnsumed here vre caJ,mot very well start our manpower estimates from a schedule of local needs for goods and services.
So we asked the questions,. how many people .are now emp1oyed in Puerto Ri.co in each type of job, producing each type of pro.duct or s·ervice, ~d how m.any will be similarly employed in 19~:0 and in 1975 and in the years in between? These questions could be .an:swered if we could develop: (1) schedules of the value of goods and services which were being and would be p·roduced. in Puerto Rico in each of various categories; (Z) estim.ates. of the levels. of productivity (value of goods and services per, D?-an:) .at which various categories of. goods and services were being_, and would be produced; .(,3) formulas for the oc~upational input:s (proportion of pe-rsons in each occupat~onal c.at~-ory) employed in the production of a unj.t .amount of goods or servic.es .in each category, at the e.stim.ated level:s of product;yity.
1. Estimates of lrico,me
The Plaruilng Board of the Commonwealth has ·annual data on the 'net income of the variqus sectors of the economy, by crop in agriculture, by type bf product in manufacturing, by type of ·se;vice in t,he governme.nt. Sine~ n~t inc·ome ia an inde~ of the value of production it is pO'ssible to estimate the futur·e value of goods and services pr'ocl.uced from net income •• ; data for past years.
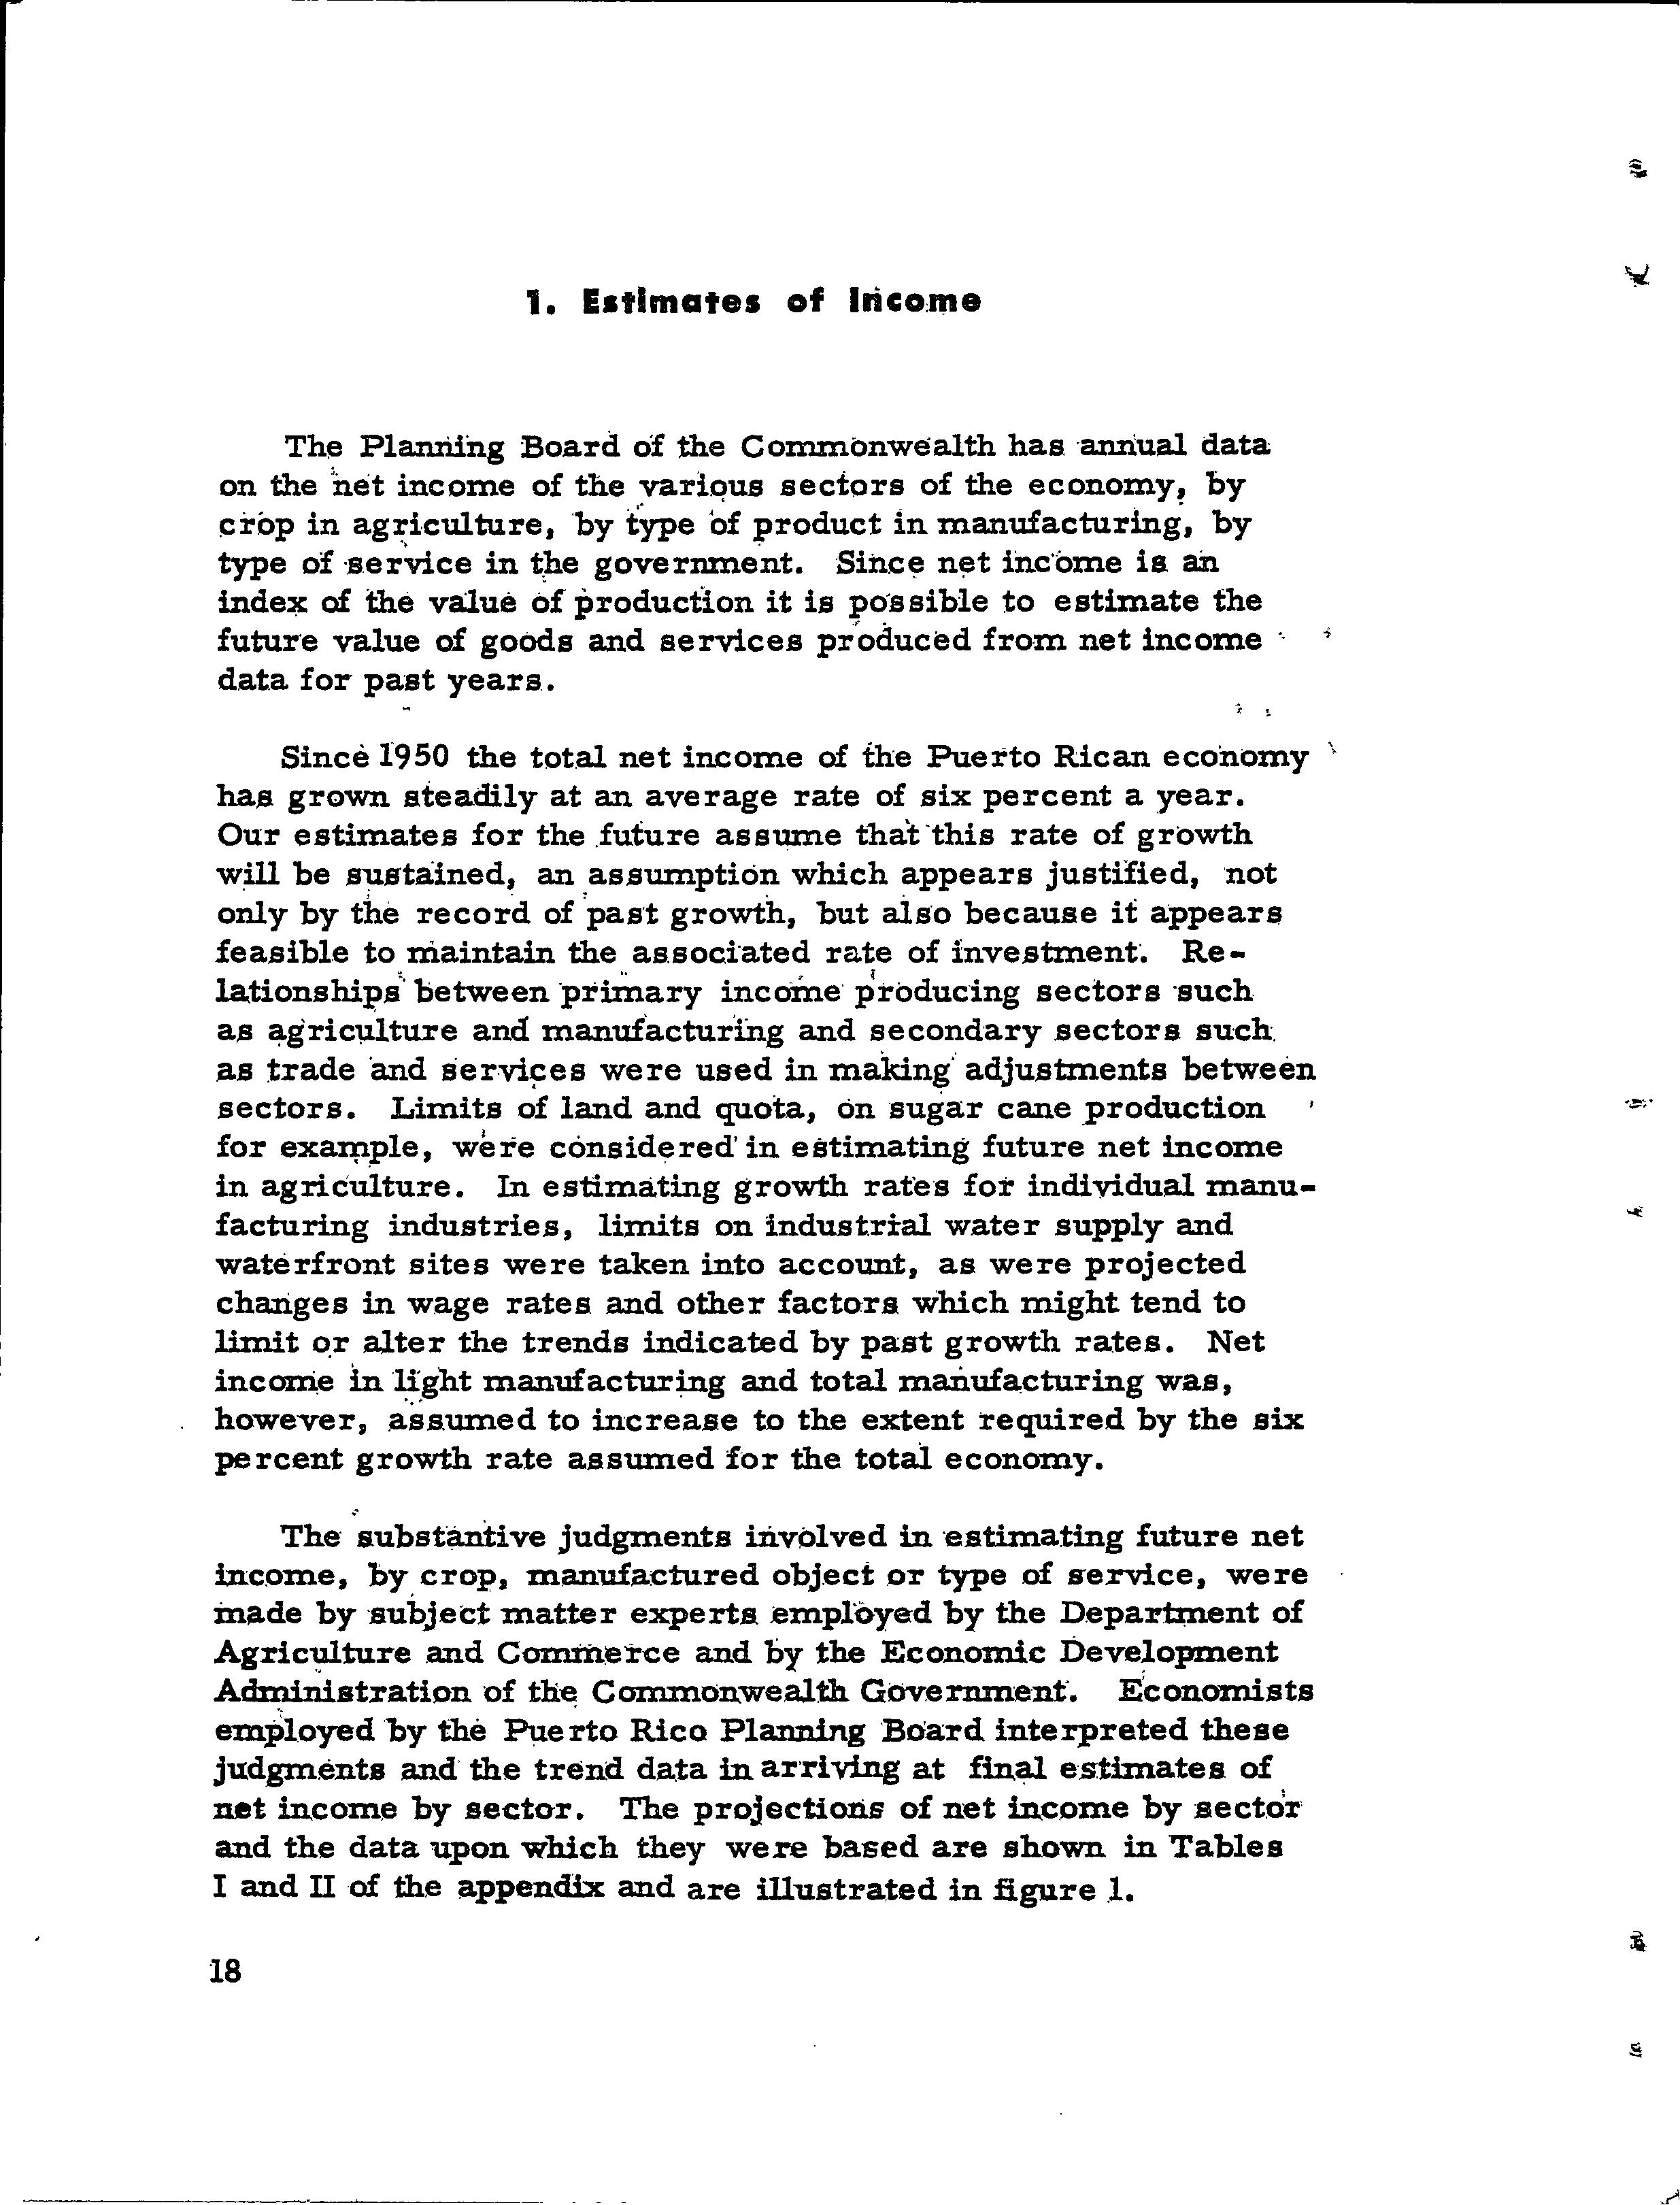
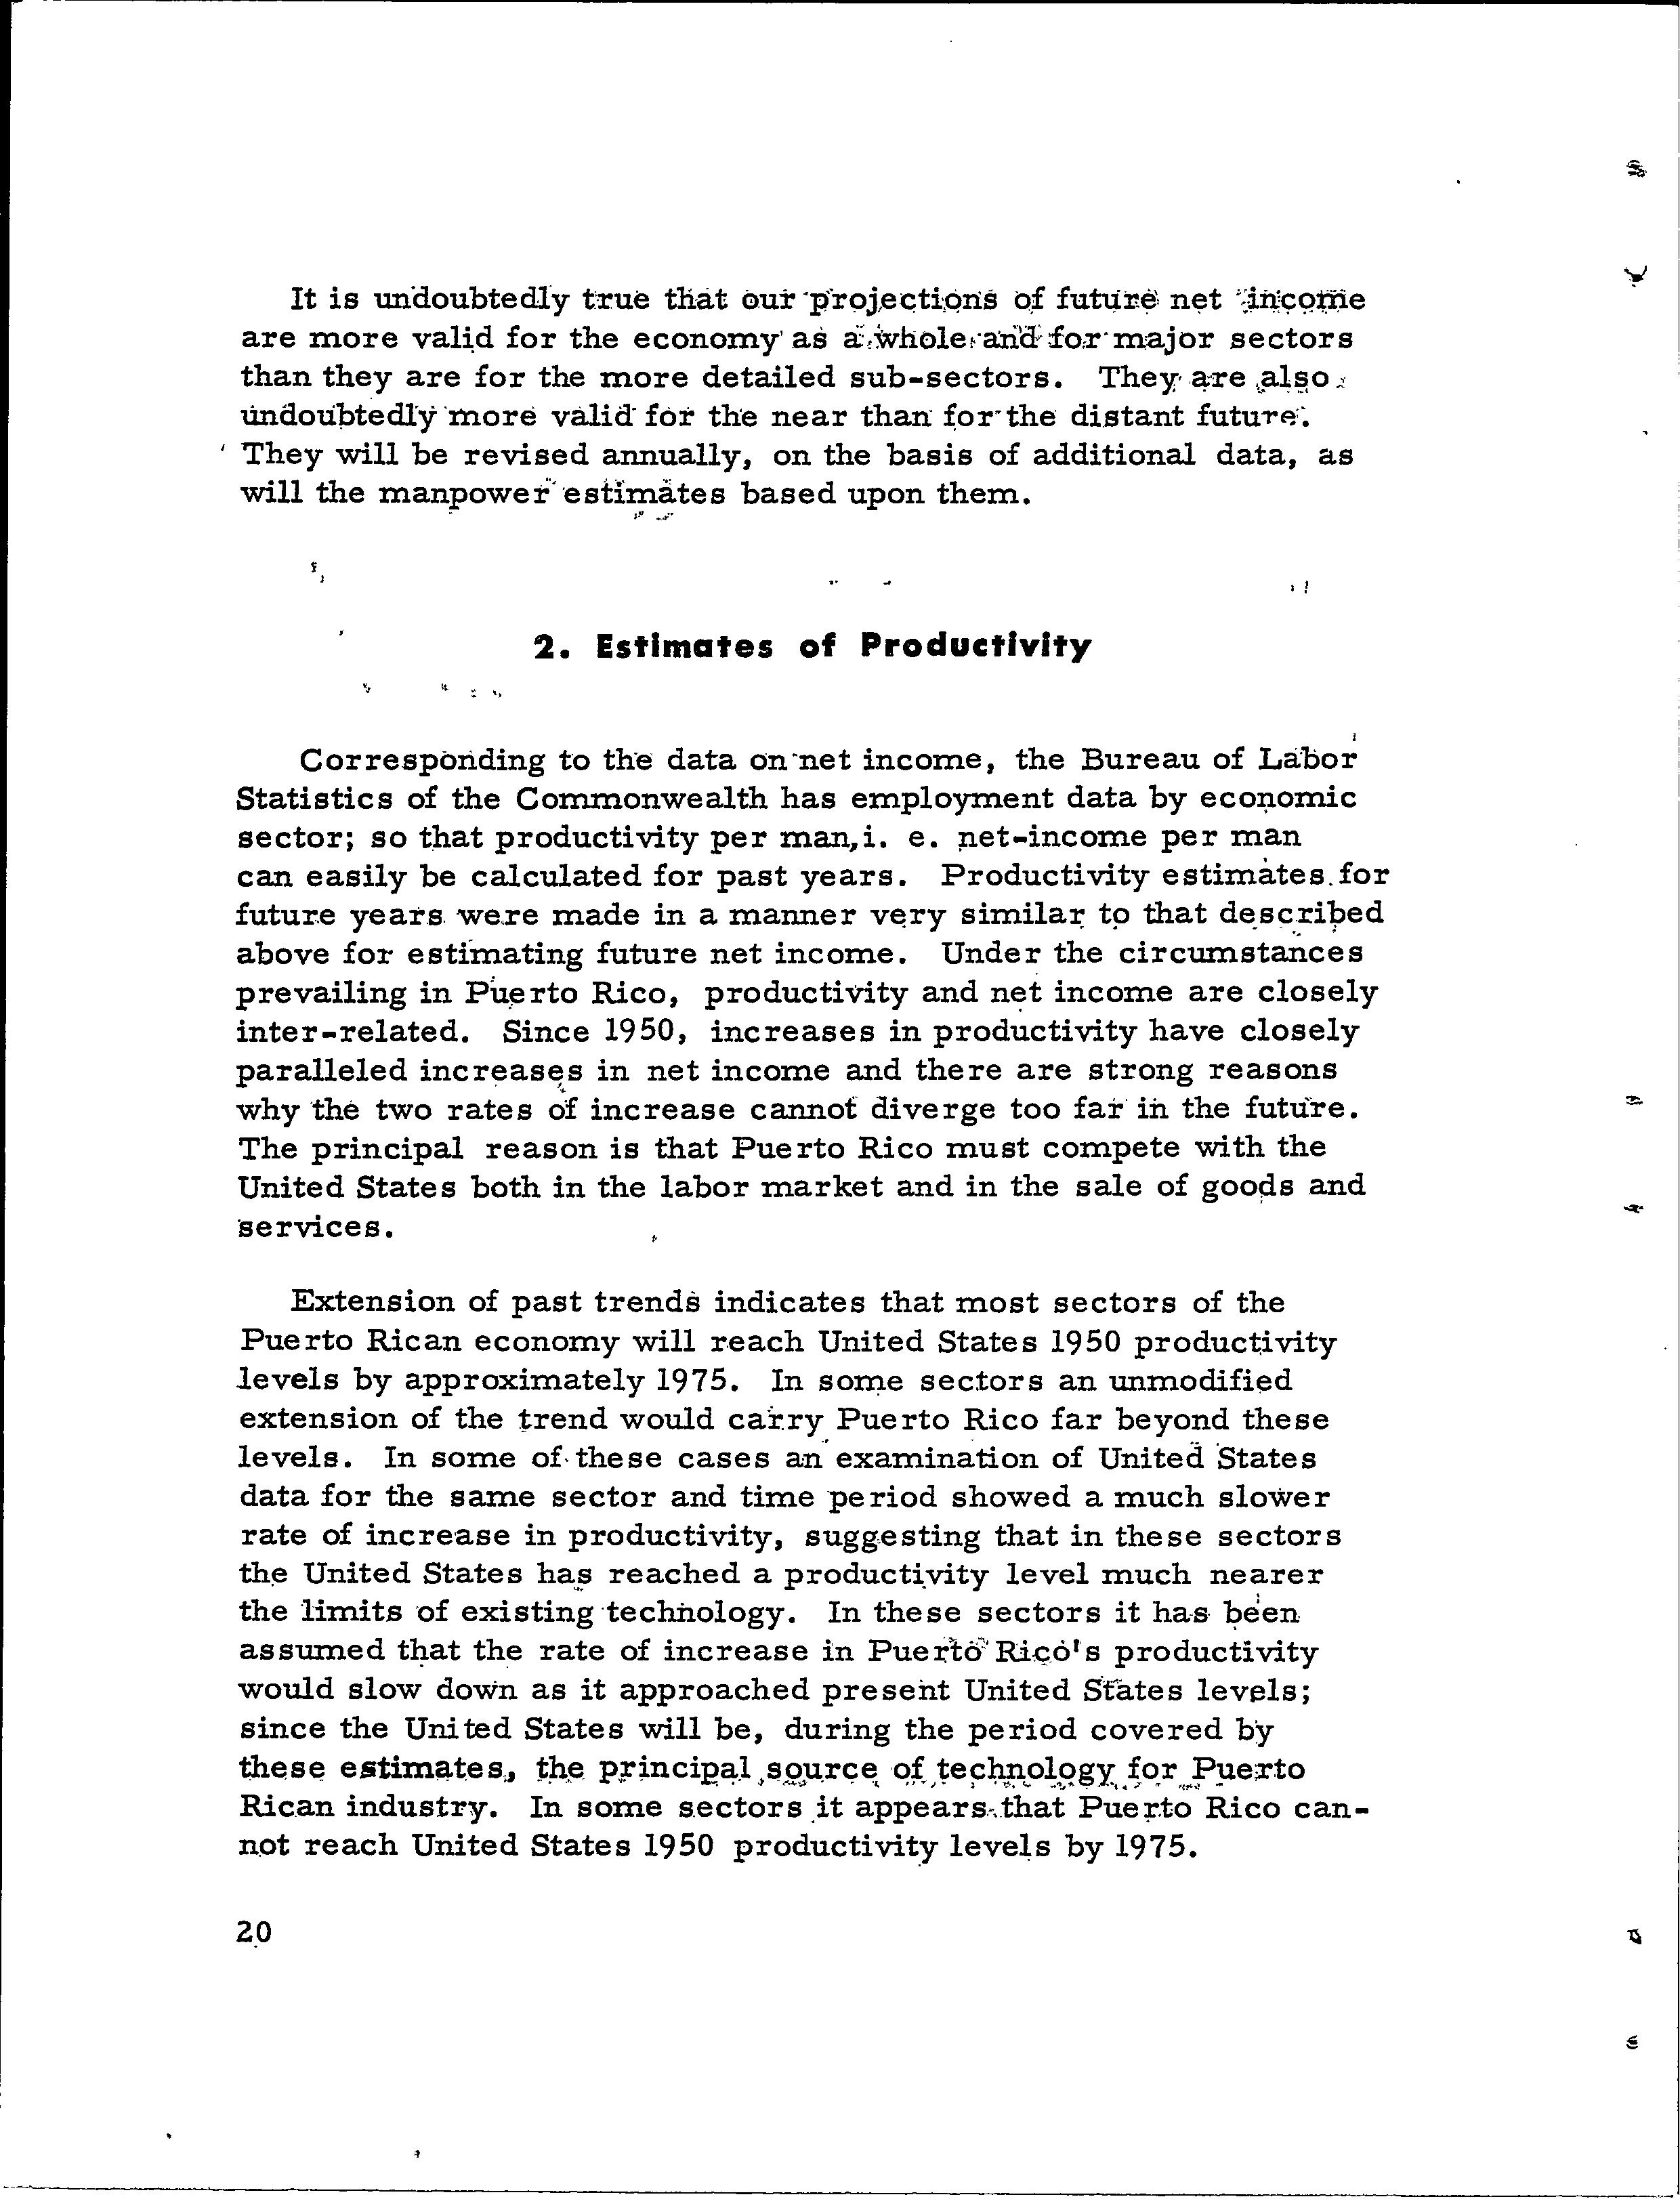
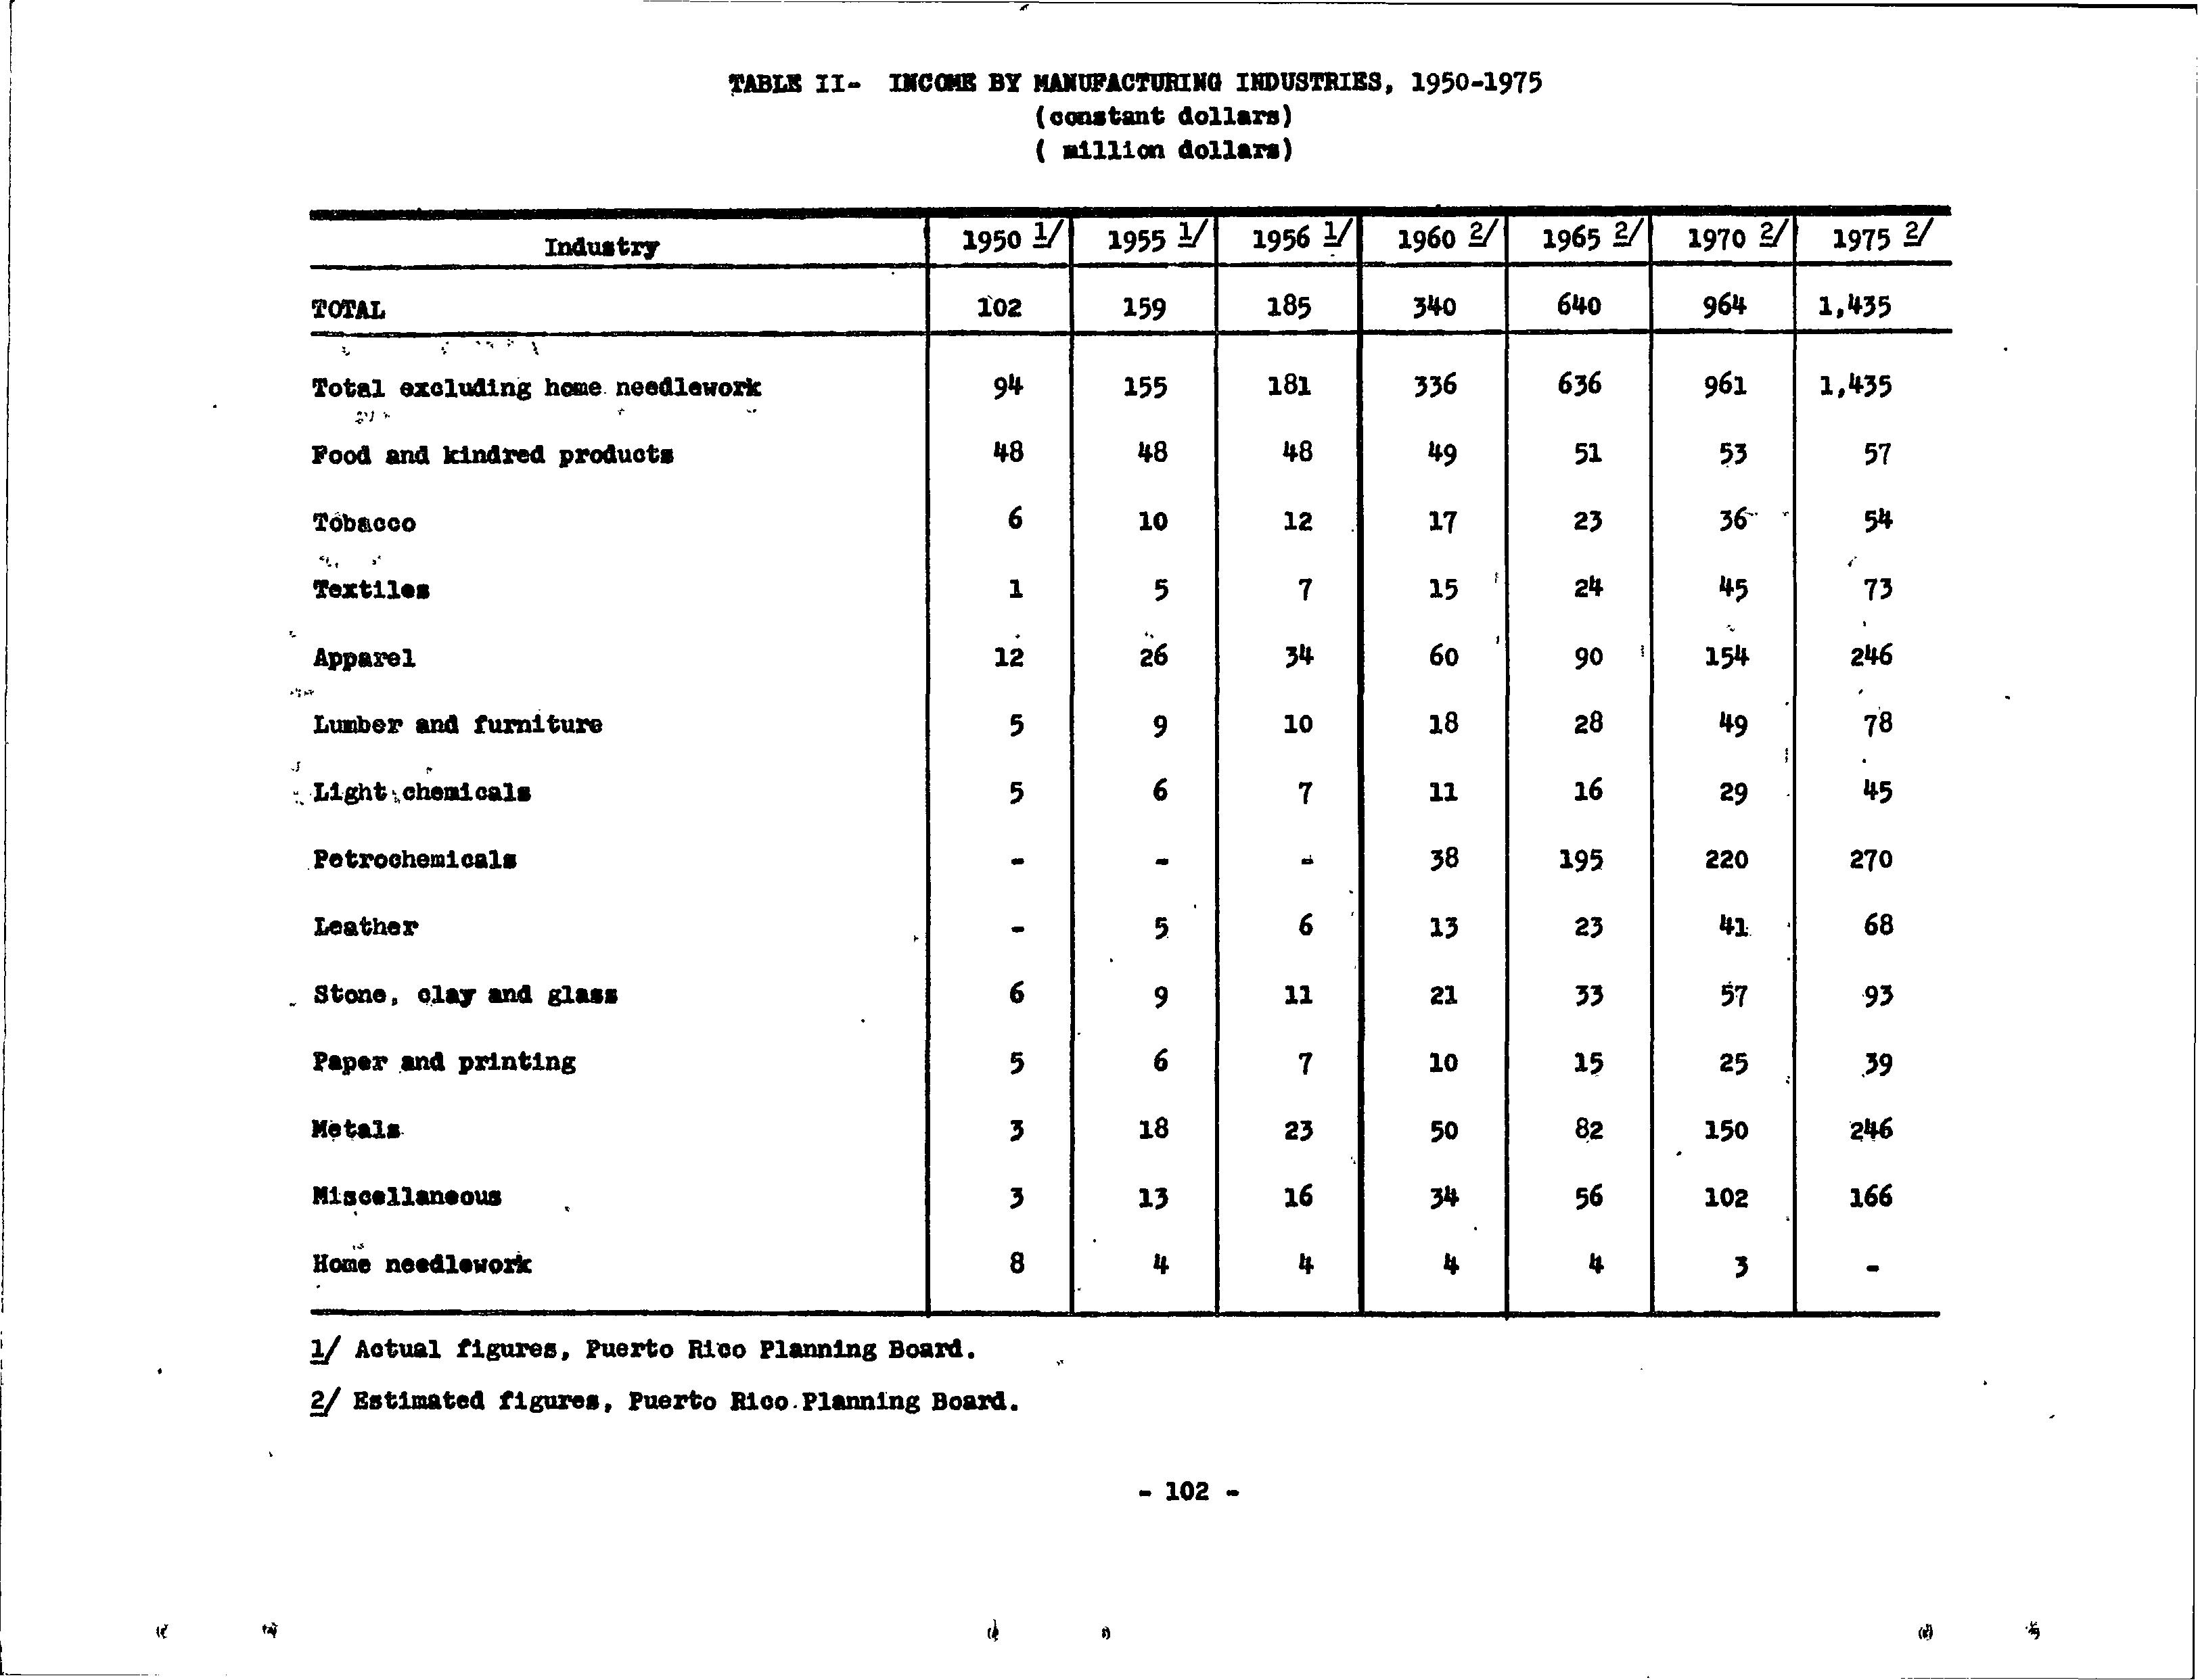
Since 1950 the tot.al net income of the Puerto Rican economy ha,s. grown steadily at an average rate of six percent a year. Our estimates for the .future assume that ·this rate of growth will be sustained, an assumption which appears justified, not only by the record of 'past growth, but aiso because it appears feasible to maintain the as.sociated rate of investment~ Relationships· between ·primary income producing sectors ·such as ~gricµlture and manufactur'u1.g and secondary sectors such. as trade ·and ser~es were used in making· adjustments between sectors. Limits of land and quota, on sugar cane production for ex~ple, were considered' in estimating future net income in agriculture. In estimating growth rates for individual manufacturing industries, limits on industrial water supply and waterfront sites were taken into account, as were projected changes in wage rates and other factors which might tend to limit o_r alter the trends indicated by past growth rates. Net incorri,e in light m.anuf acturing and total manufacturing was, however, assumed to increase to the extent required by the six percent growth rate assumed for the total economy .
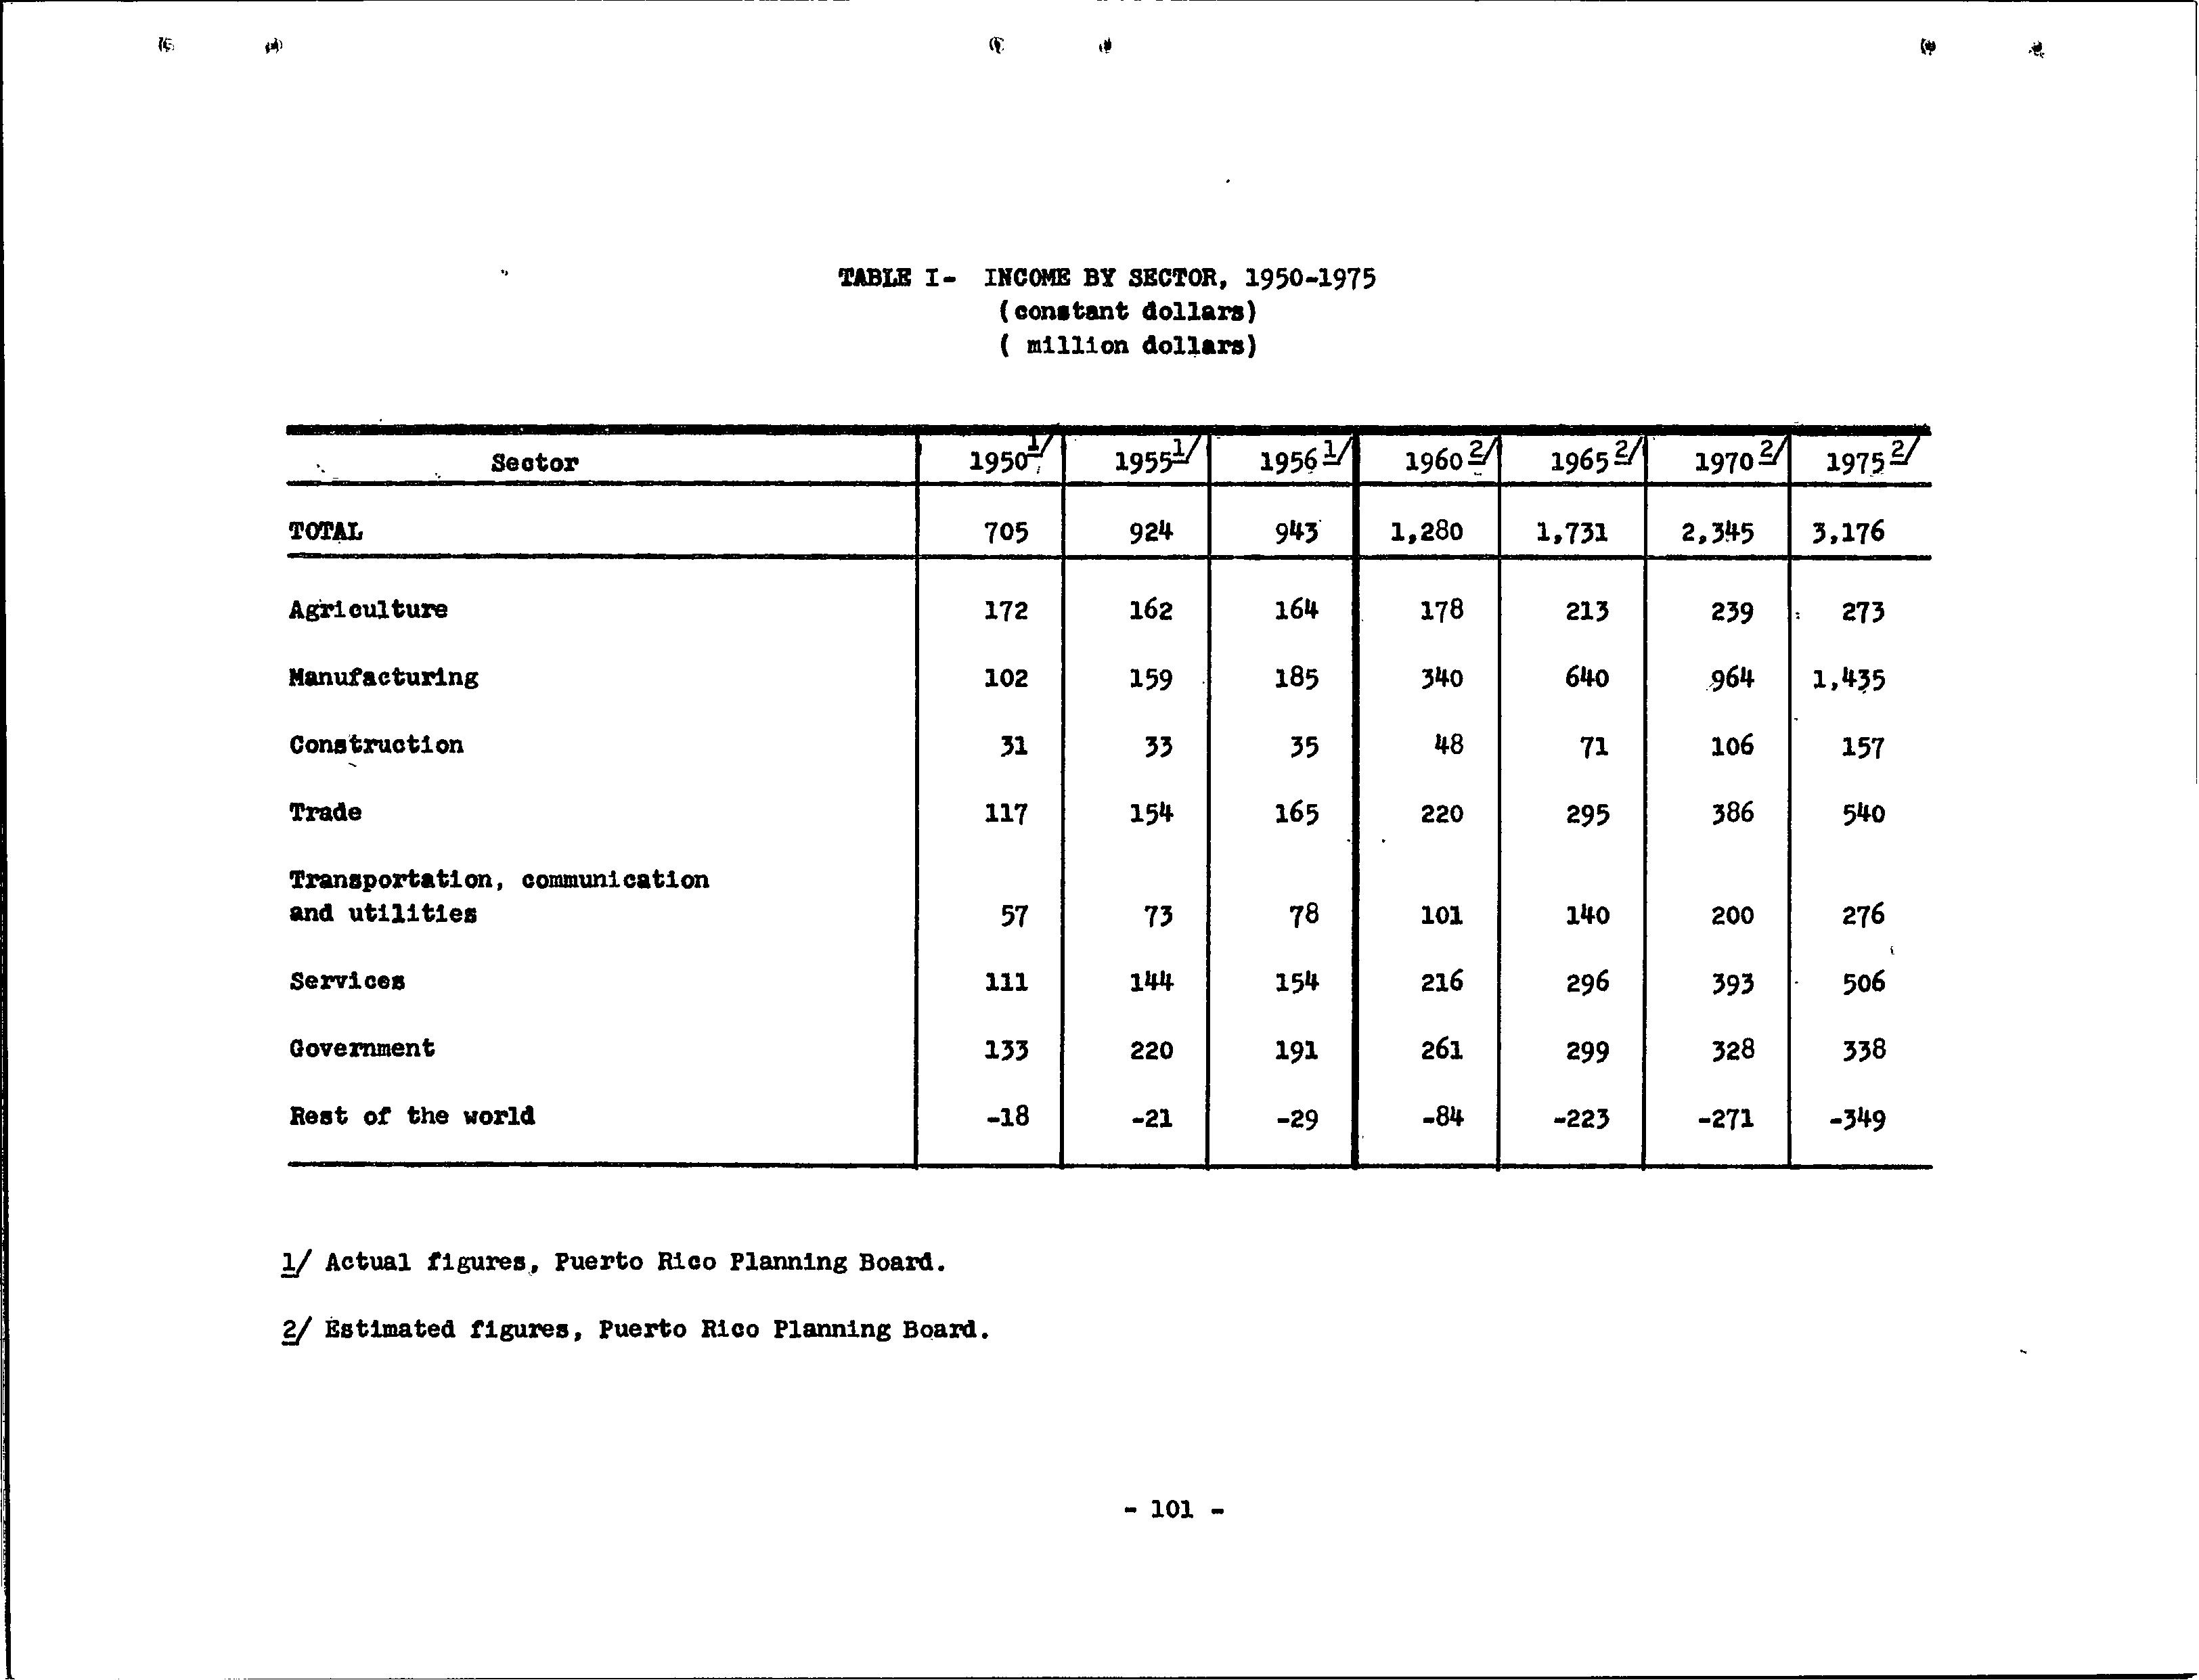
The substantive judgments involved in ·estimating future net in:c.om.e, by crop, manufactured obj.ect or type of s-e:rvice, were made by ·:subject m.atter experts. employed by the Department of Agric1:11ture and Commerce and by the Economic Deve~opment A~stration of th~ Comm.onweal:th Government. Economists employed by the Puerto Rico Planning Board interpreted these judgments and the trend data in ar·riving at final estimates of net incom.e by sector. The projections of net income by secto:i:" and the data upon which they were based are shown in Tables I and II of the appendix and are illustrated in figure .1.
FIGURE 1 INCOME FOR ·SELECTED-SECTORS 1950-1975 1 (IN
CONST·ANT DOLLARS)
It is un'd.oubtedly true that o.ur •1:froj,ec;ti:Qns o.f futtjre, n~t \i:qc;:groe are more val~d for the economy· as a:,ivholefa:ricf fo,r·major sectors than they are for the more detailed sub-sectors. They• ~re ,._al!;!O:: undoliptedly ·:more valid• for the near than ~or·the distant futu-rP.': ' They will be revised annually, on the basis of additional data, as will the manpower···estimates based upon them.
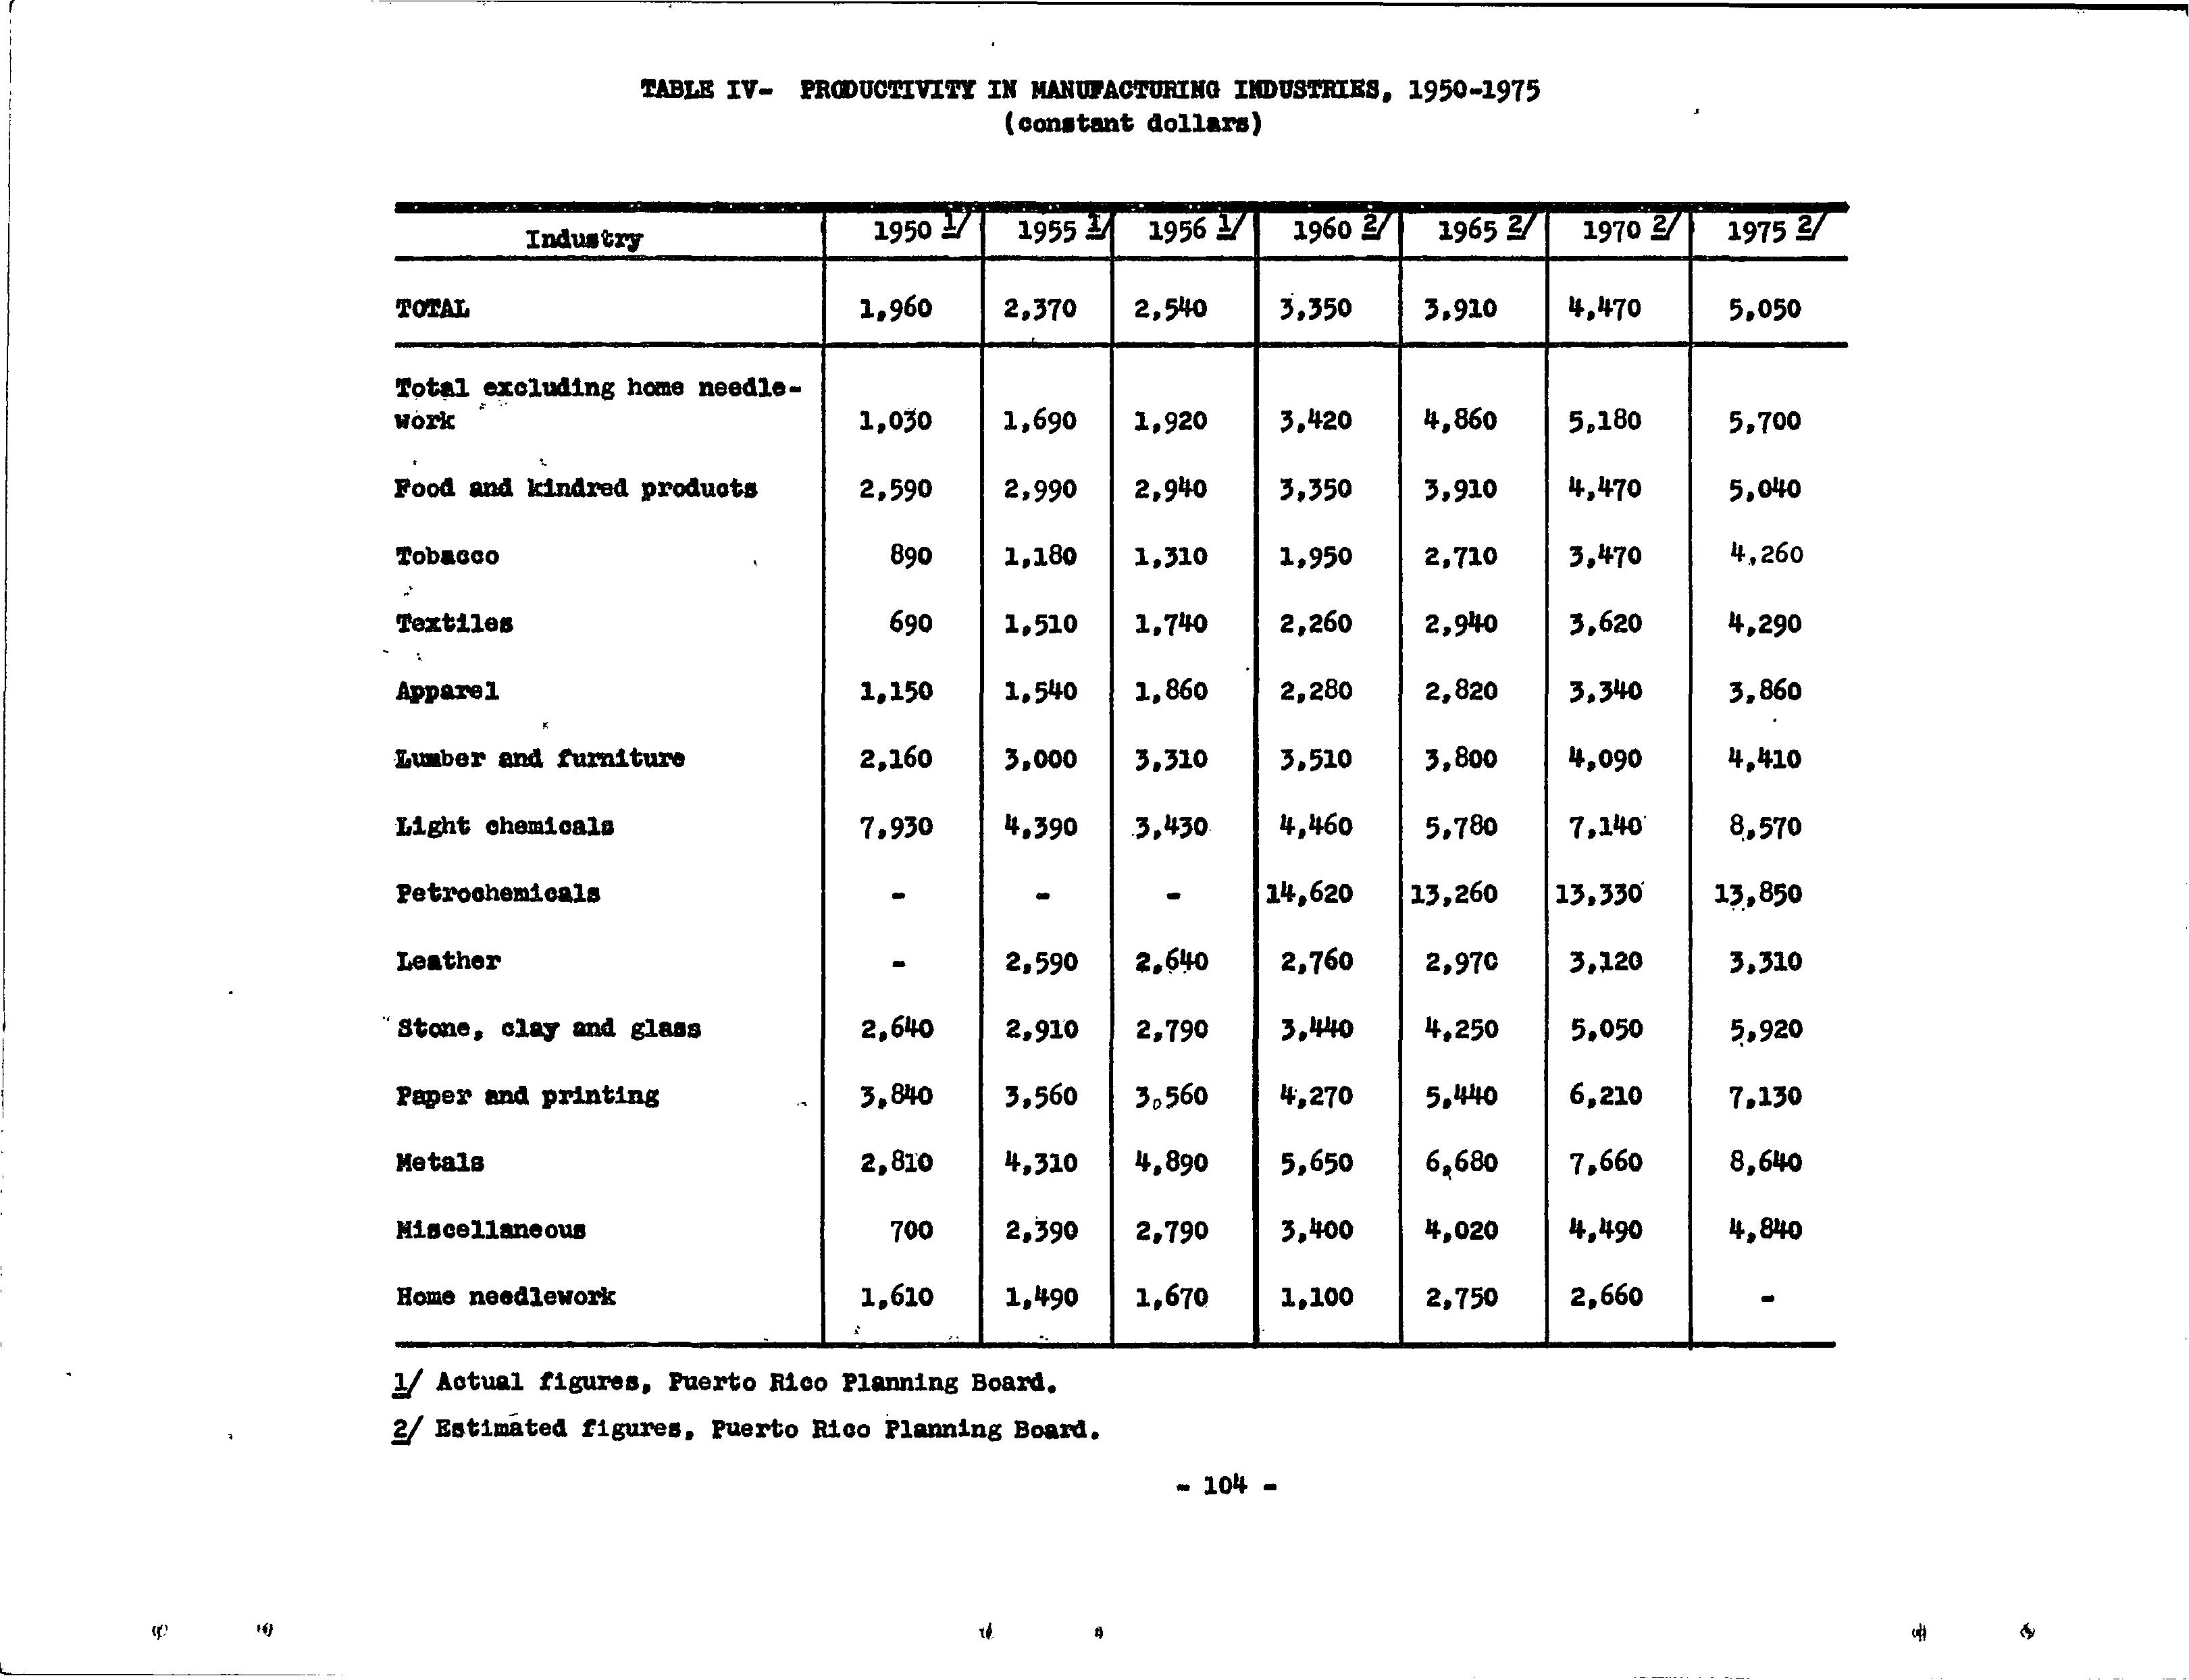
2. Estimates of Productivity
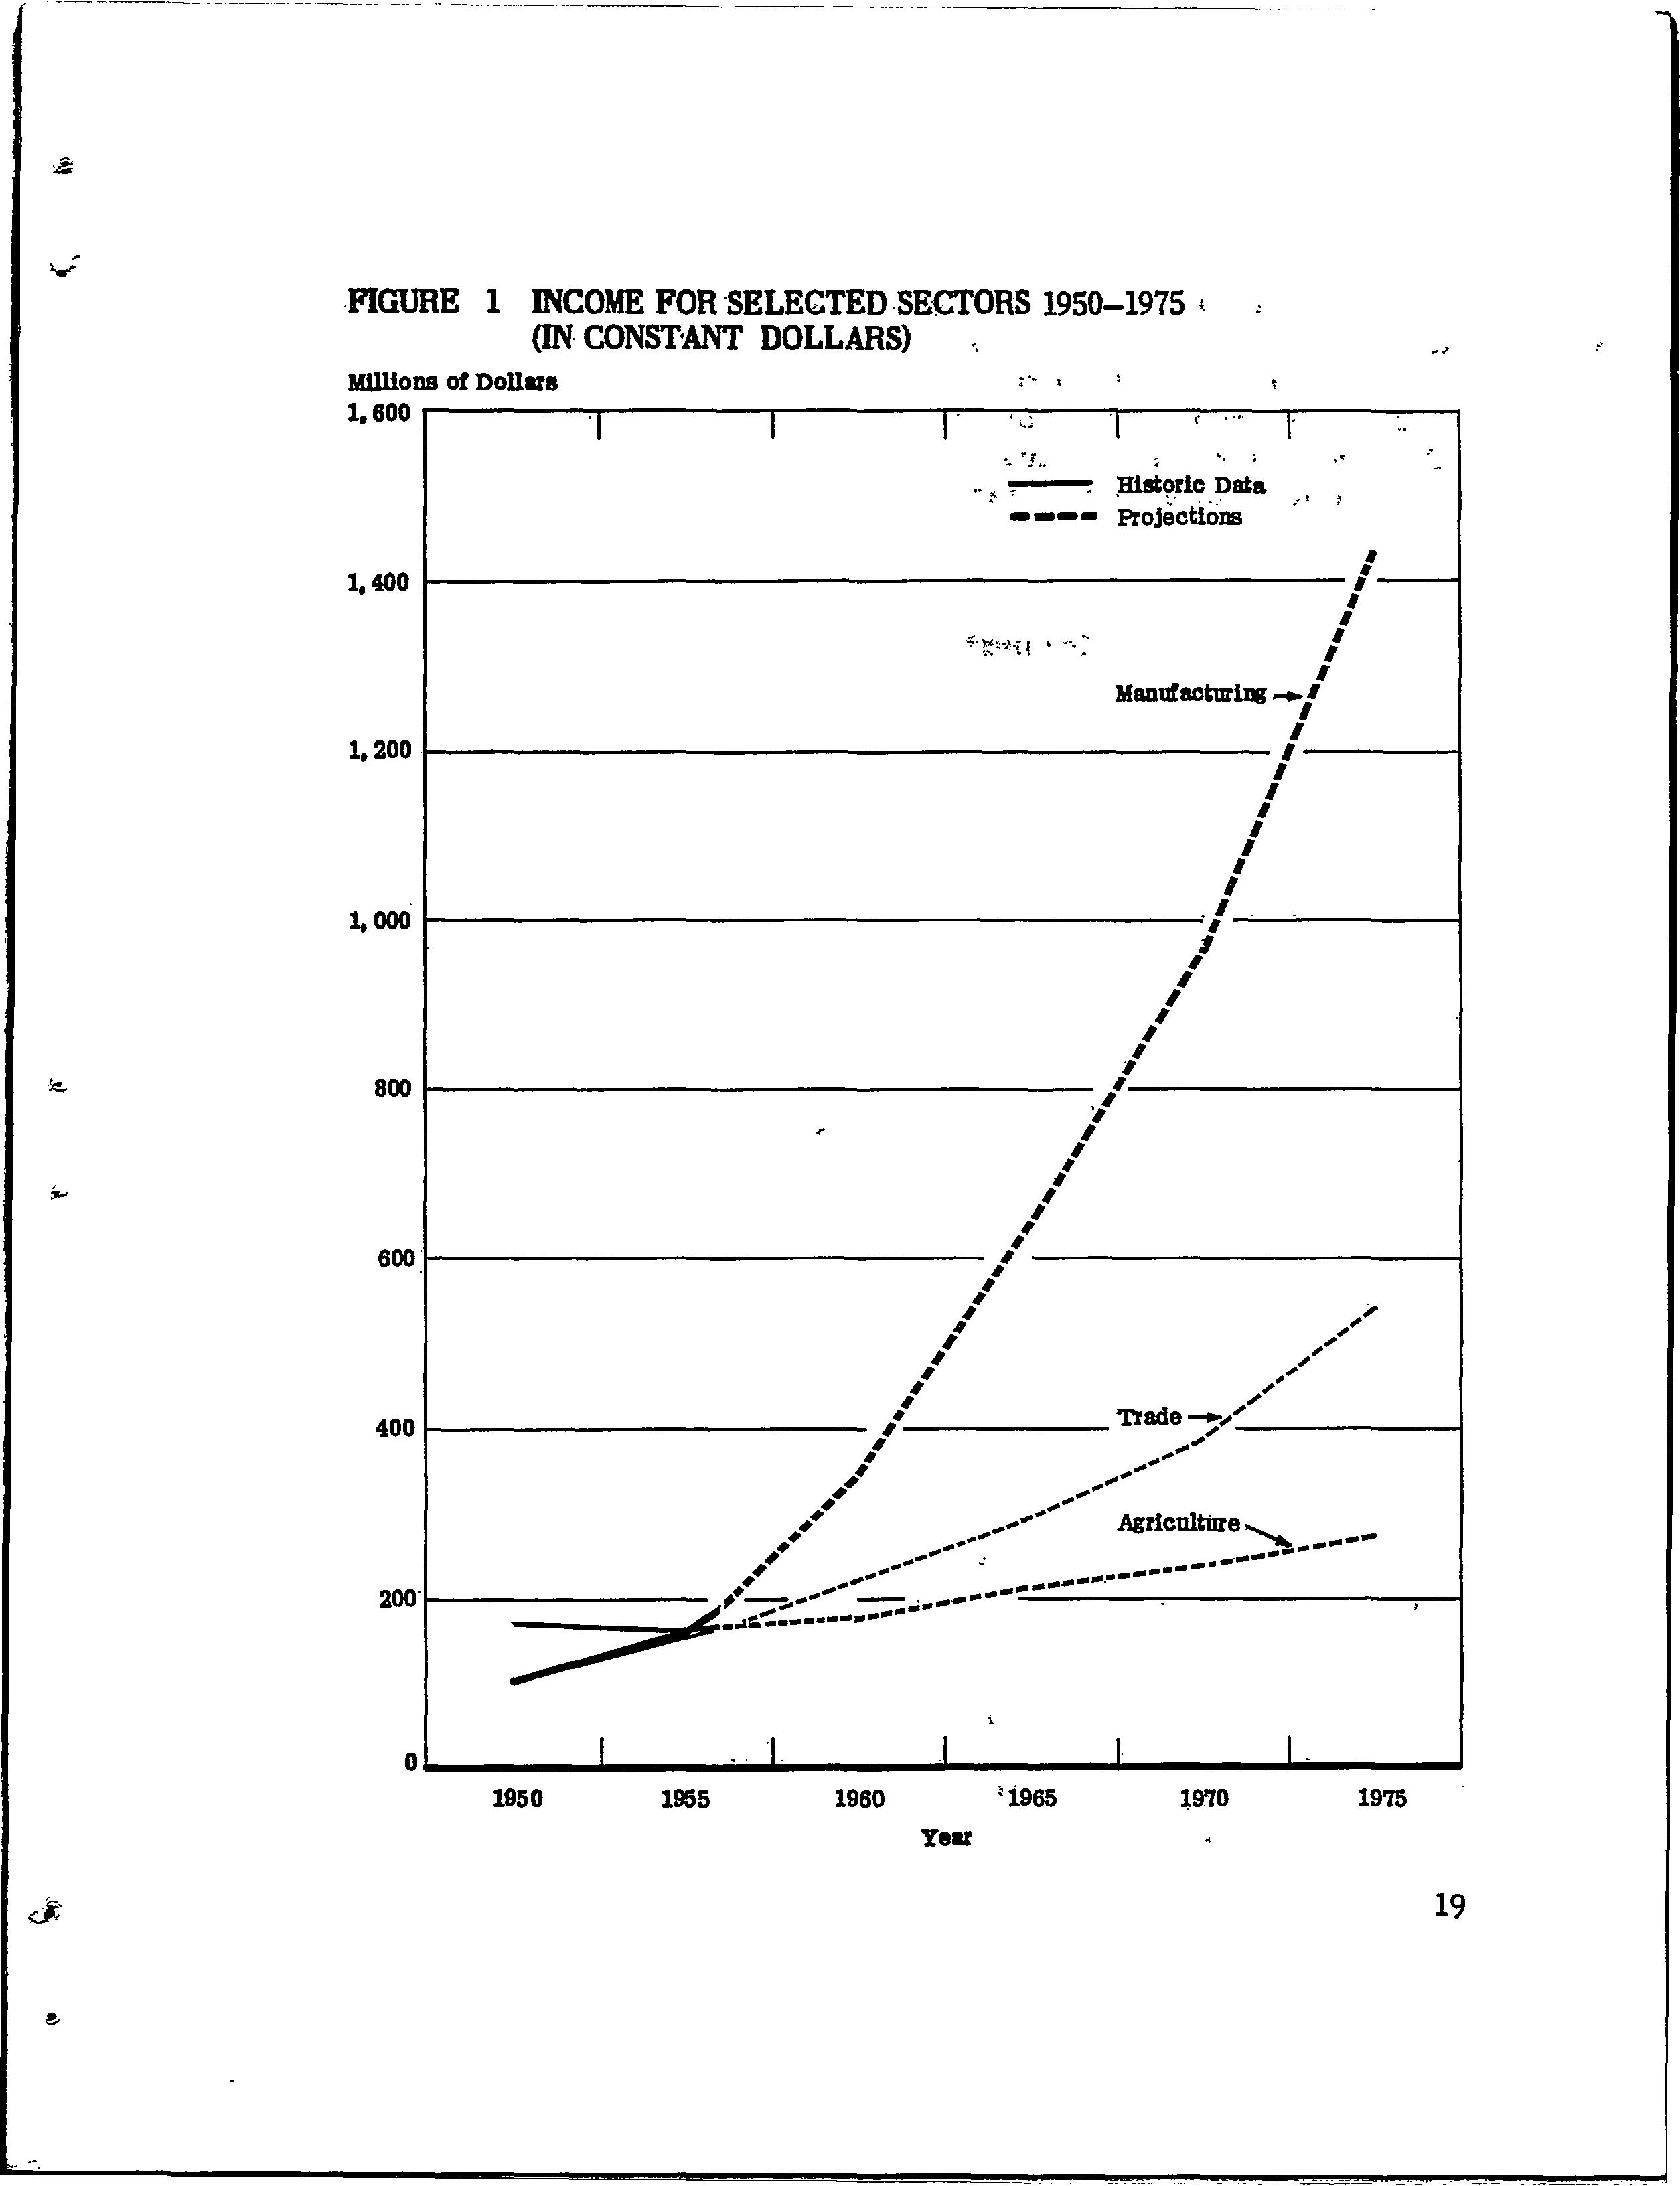
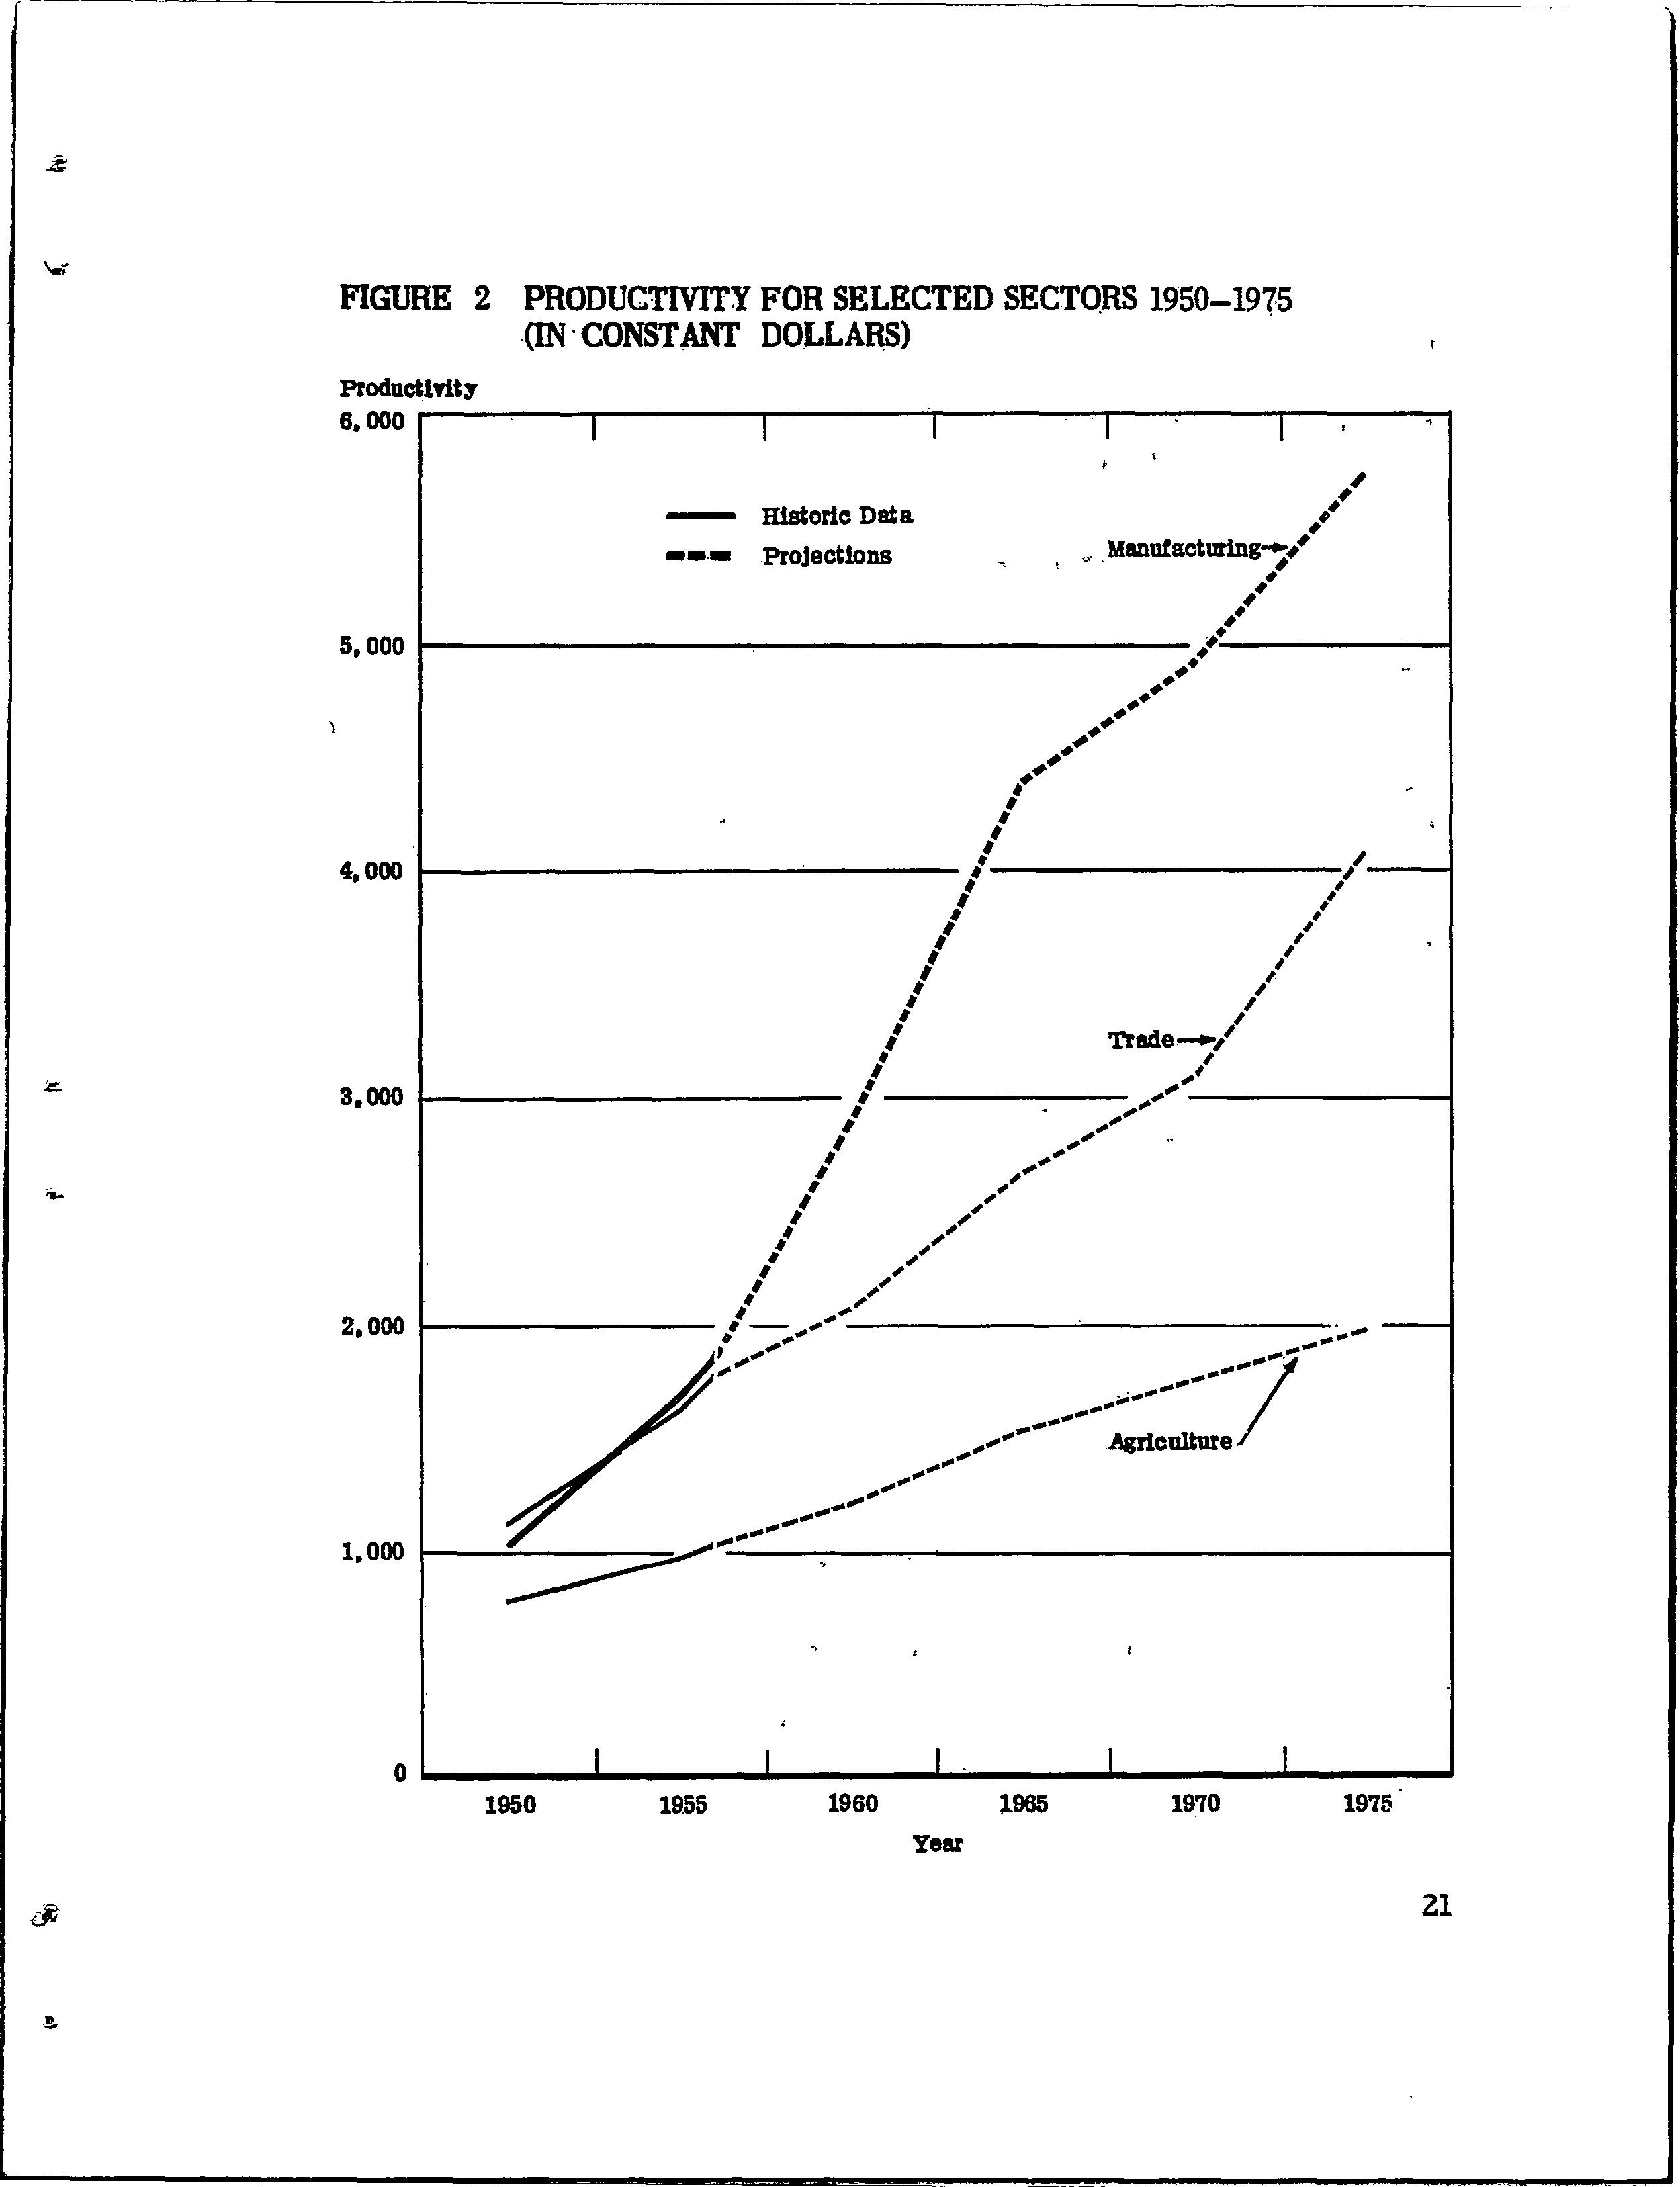
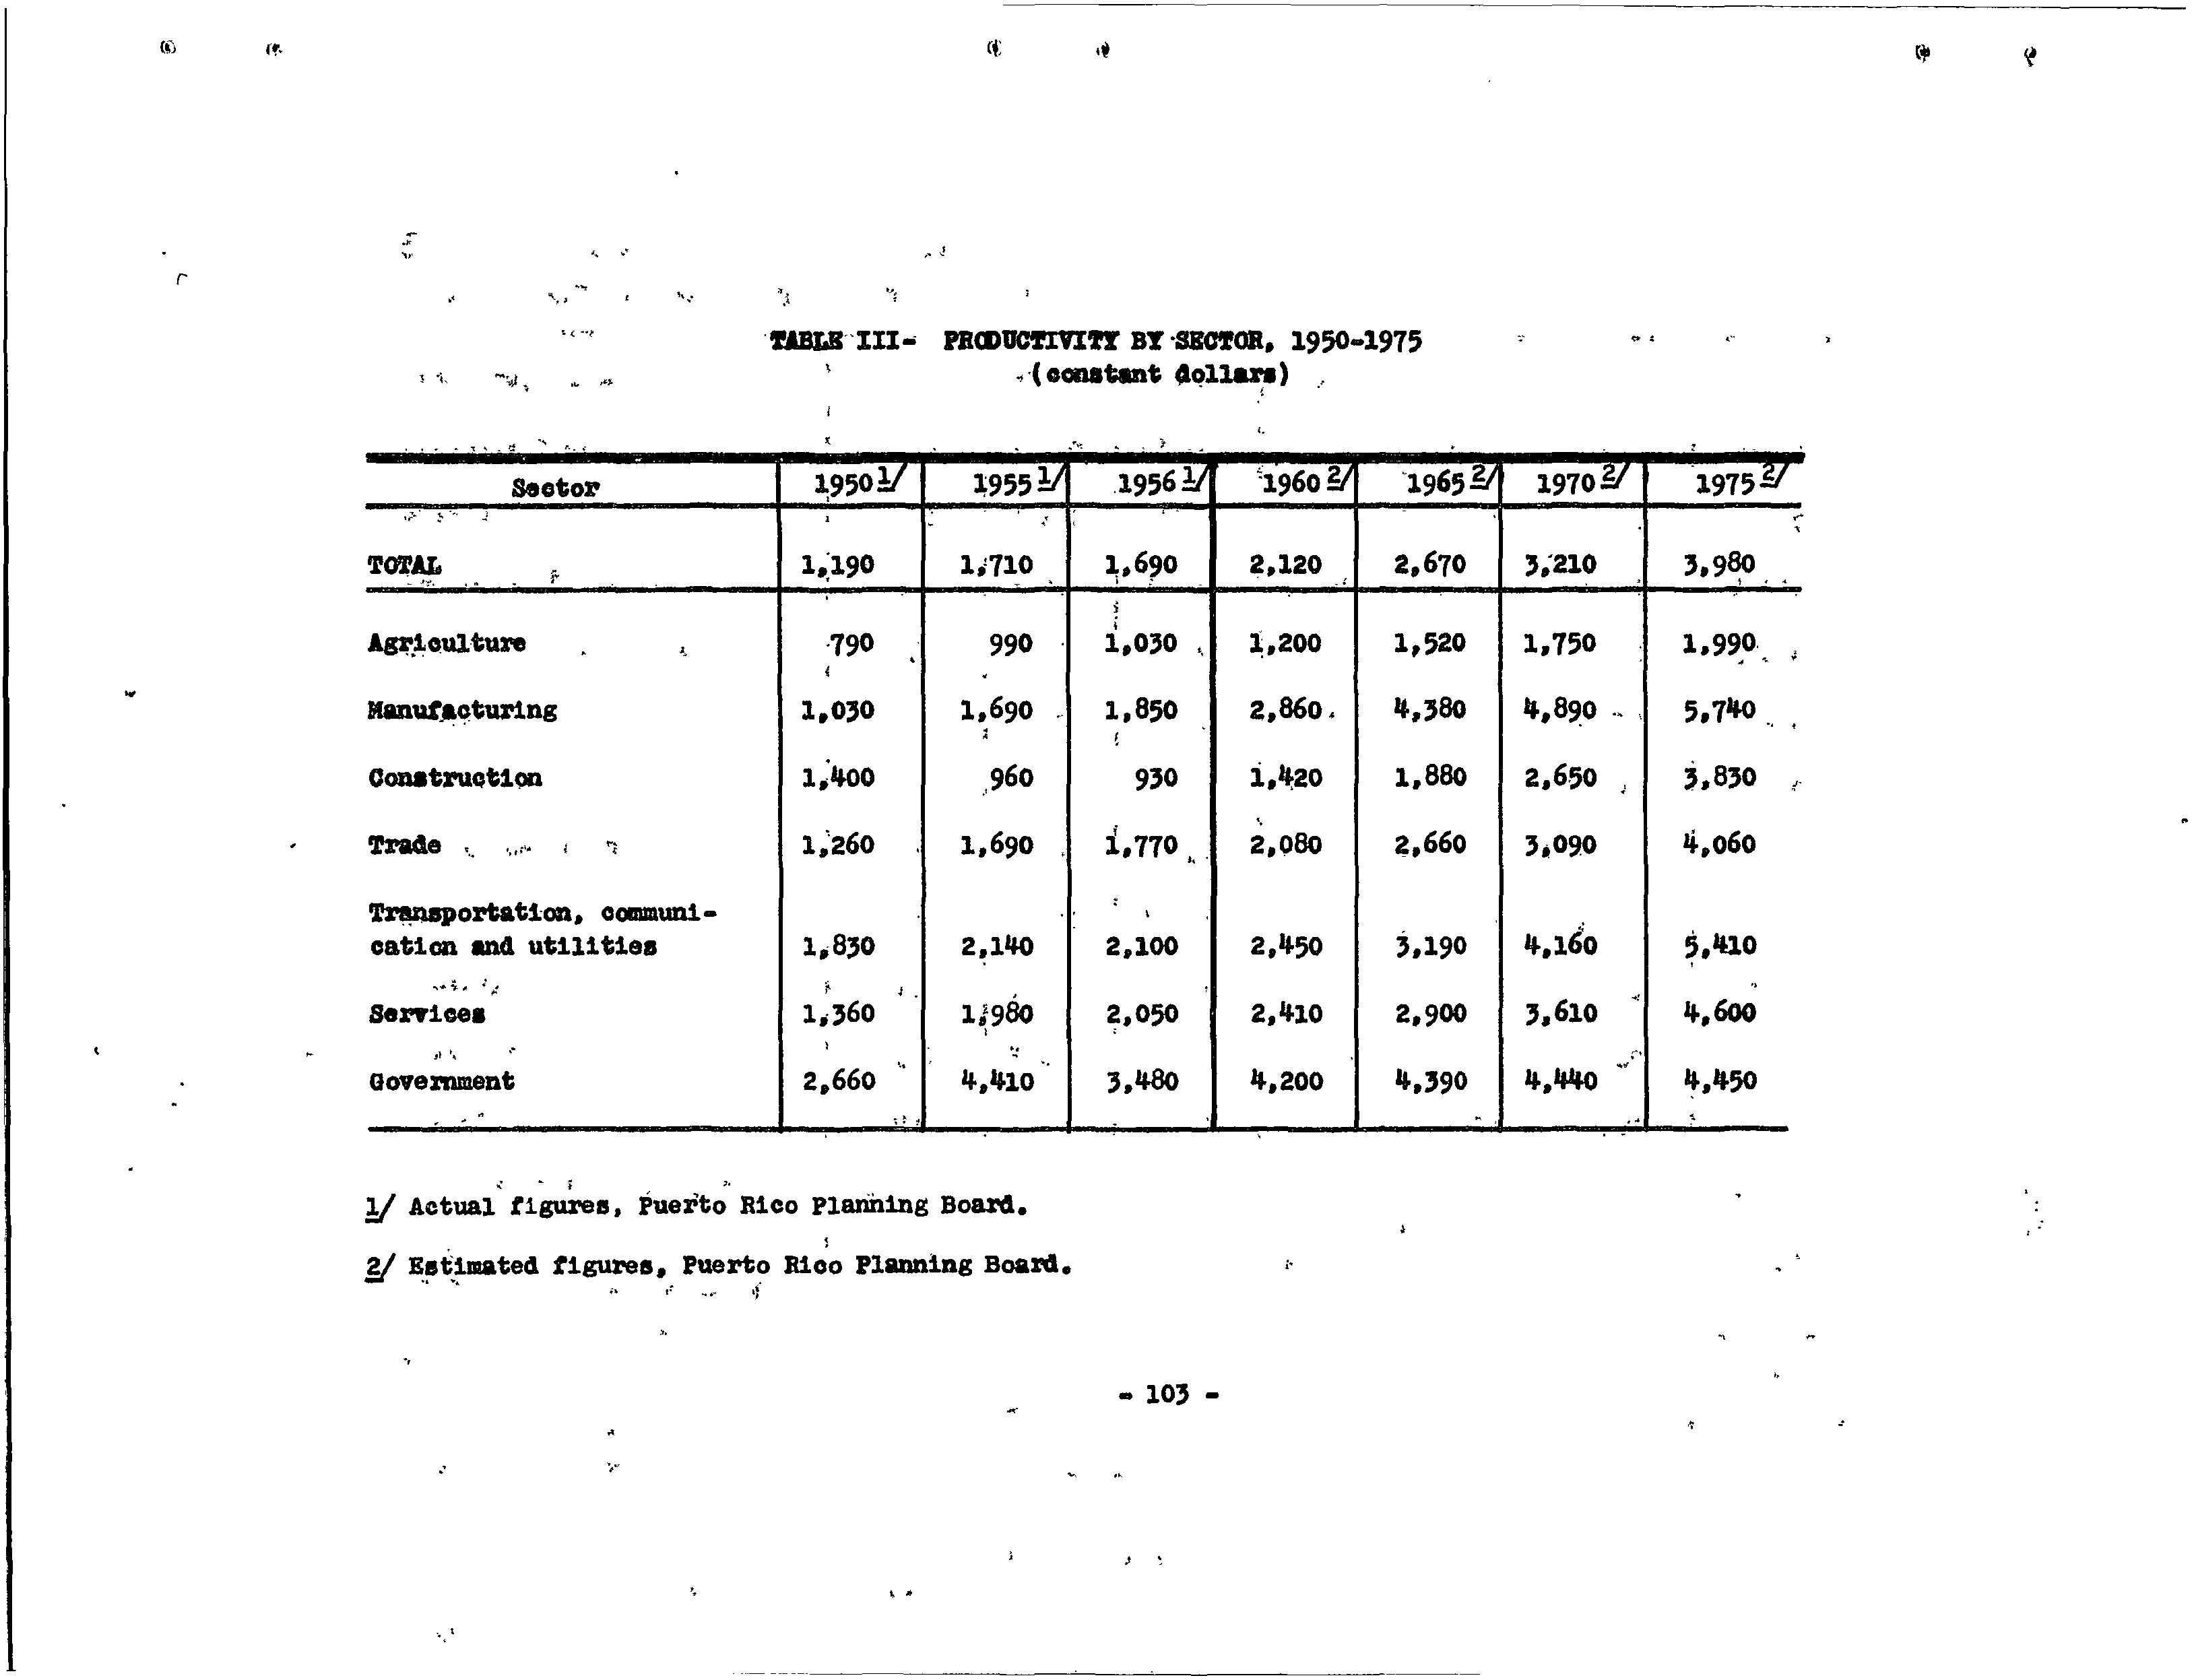
' Corresponding to the data on ·net income, the Bureau of Labor Statistics of the Commonwealth has employment data by eco:i:,i.omic sector; so that productivity per man,i. e. ;net-income per man can easily be calculated for past years. Productivity estimates.for future years we.re made in a manner very similai: t9 that de_sc_~iped above fo:r estimating future net income. Under the circumstances prevailing in Pu~rto Rico, productivity and n~t income are closely inter-related. Since 1950, increases in productivity have closely paralleled increas~s in net income and there are strong reasons why the two rates c;;f increase cannot diverge too far i:h the future. The principal reason is that Puerto Rico must compete with the United States both in the labor market and in the sale of goop.a and services.
Extension of past trends indicates that most sectors of the Puerto Rican economy will reach United States 1950 productivity levels by approximately 1975. In sorrl.e sectors an unmodified extension of the trend would carry Puerto Rico far beyond these levels. In some of-these cases an' examination of United. ·states data for the same sector and time period showed a much slower rate of increase in productivity, suggesting that in these sectors th~ United States ha.~ reached a producti_vity level much nearer the limits of existing technology. In these sectors it ha-s l;>een assumed t:q.at the rate of increase in Pue rte:>" Ric;:o 1 s productivity would slow down as it approached present United States levels; since the United States will be, during the period covered by these e.stimc1,tes,, tp~ P,~j.nci:e~.l ,s9,_,u.rc;:e. q;(Je~w.i~o~9gy:Jo,r,,,.?:µerto Rican industry. In some s.ectors _it appears.-.that Pue~.to Rico cannot reach United States 1950 productivity levels by 1975.
FIGURE 2 PRODUCTMTY FOR SELECTED SECTORS 1950-1975 (IN· CONST ANT DOLLA~)
Productlrity
mstorlc Data ProJect!ons
Productivity estimates have been made:, as in the ·case of !. net income, by specialists in agriculture, industry an:d trade and by economists employed by the Commonwealth Governmen~. These estimates are shown in tables III and IV of the appendix and some examples are illustrated in figure 2.
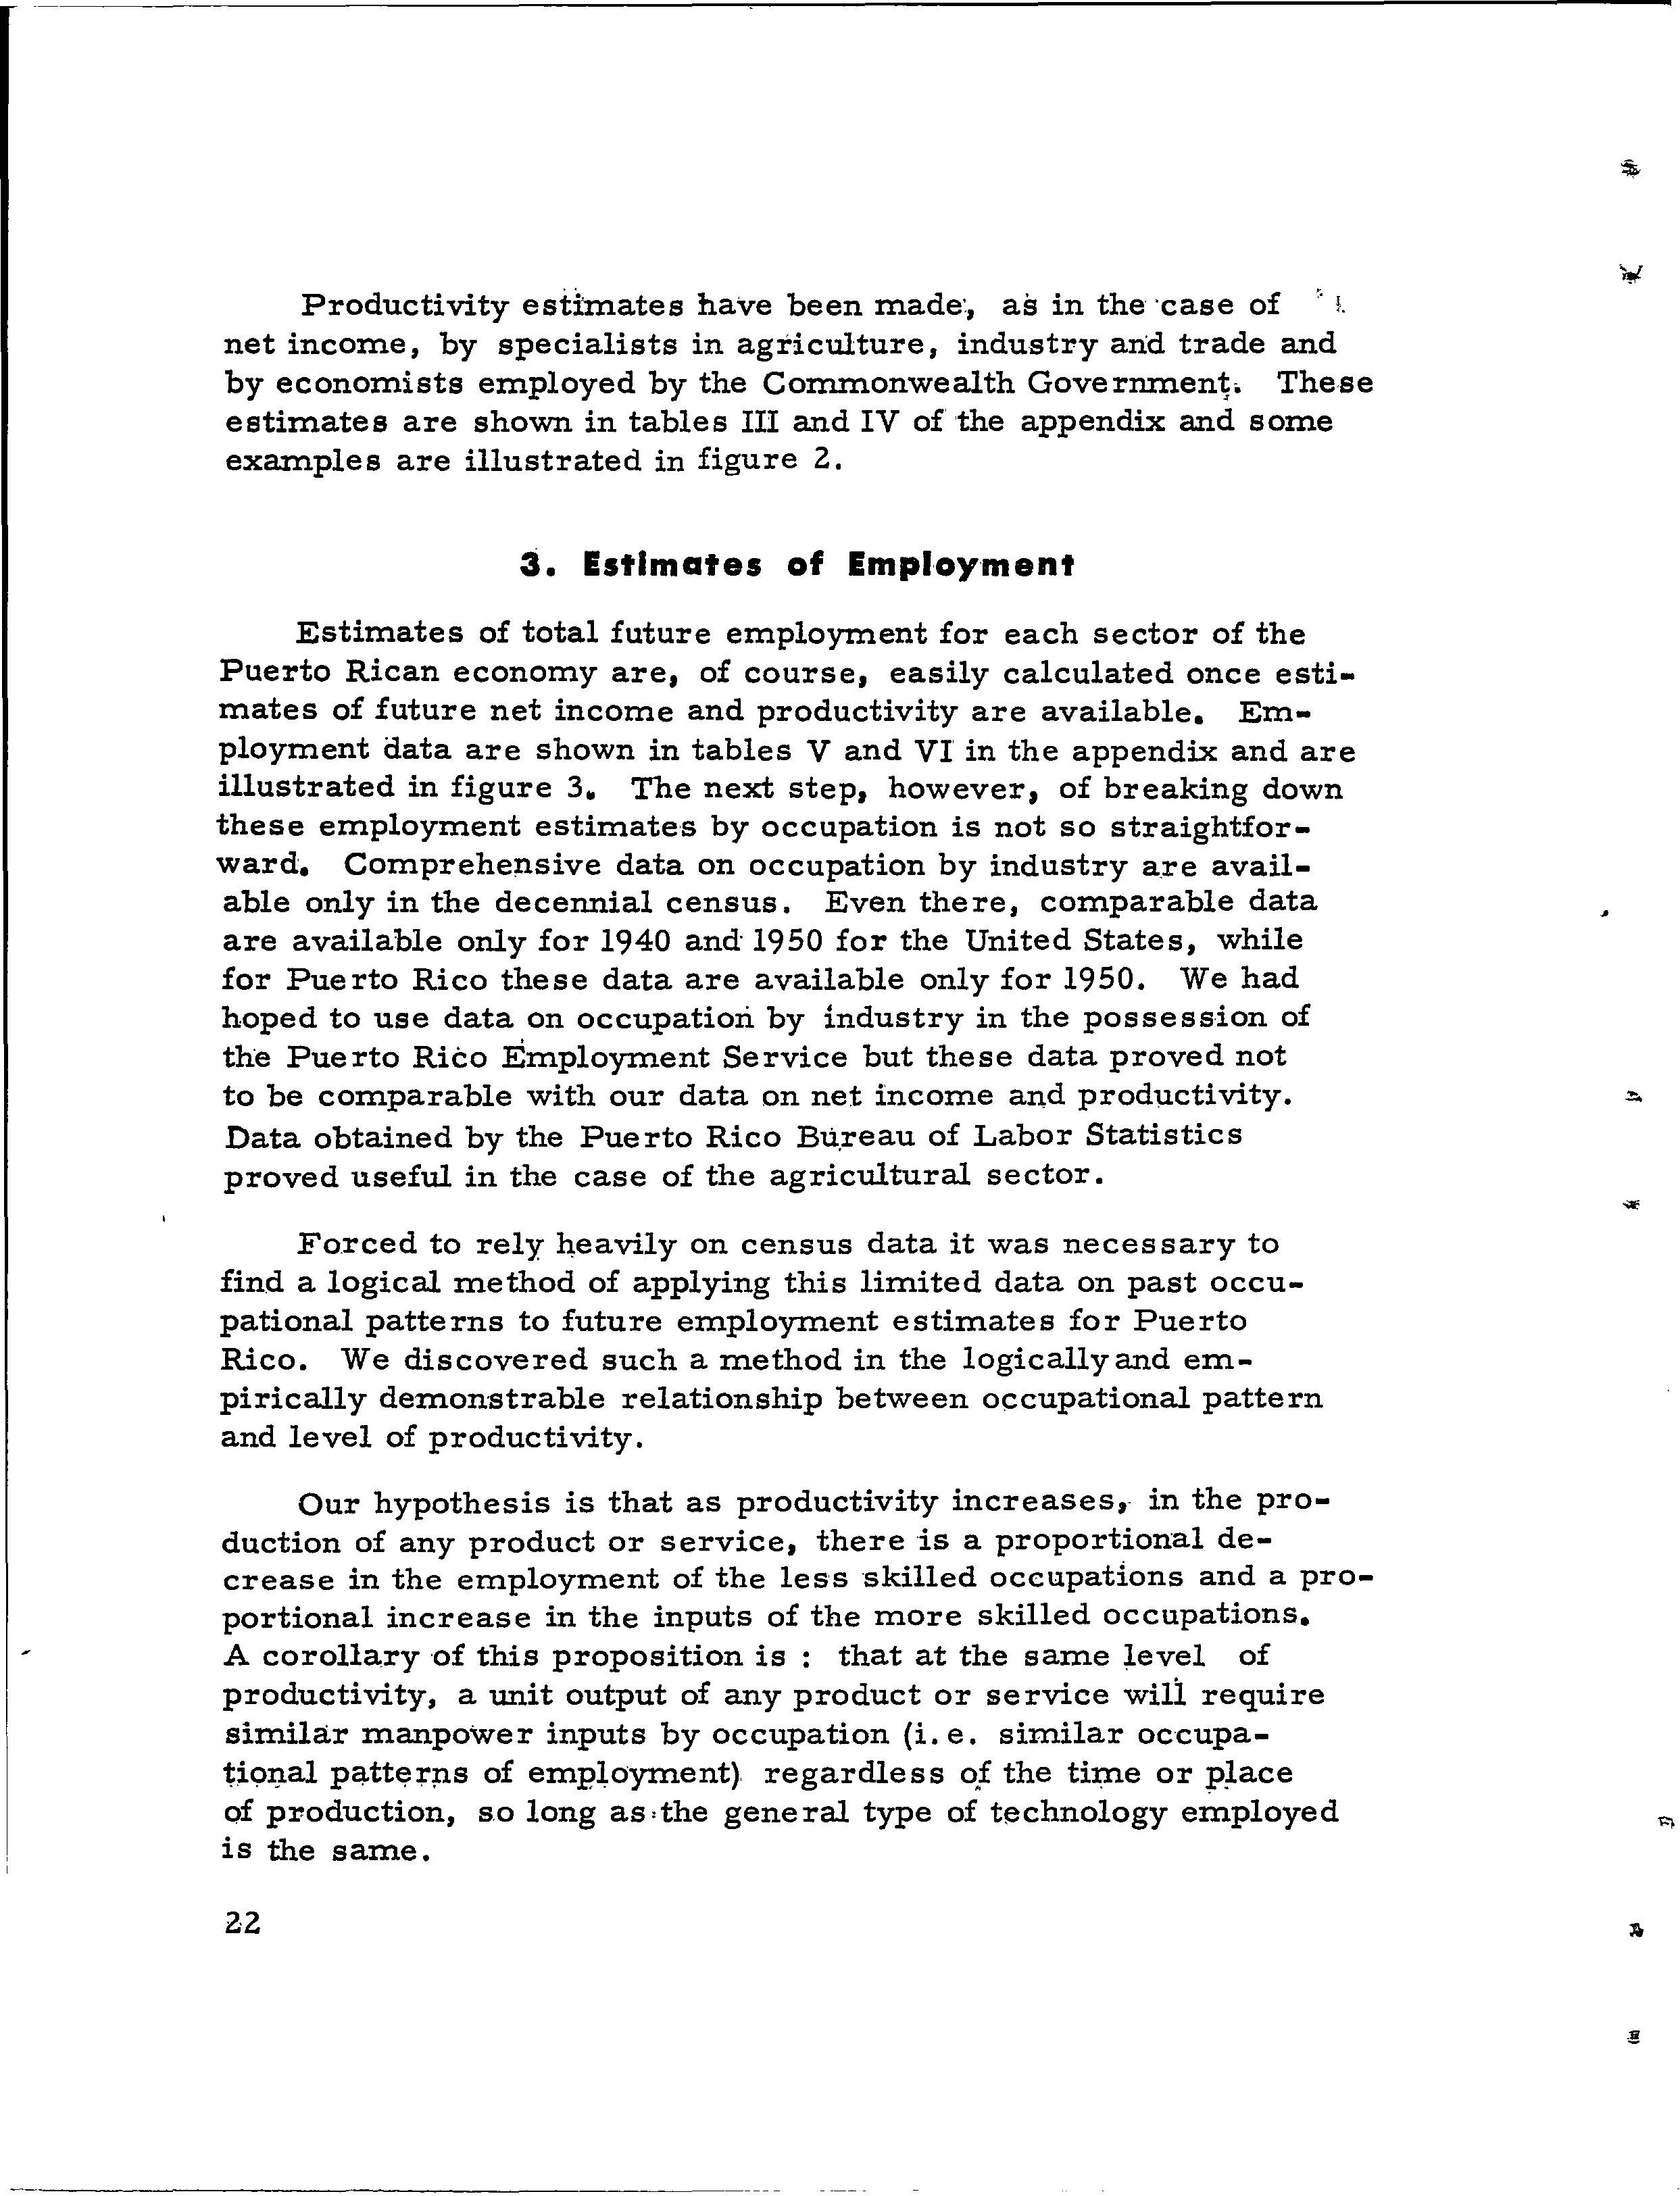
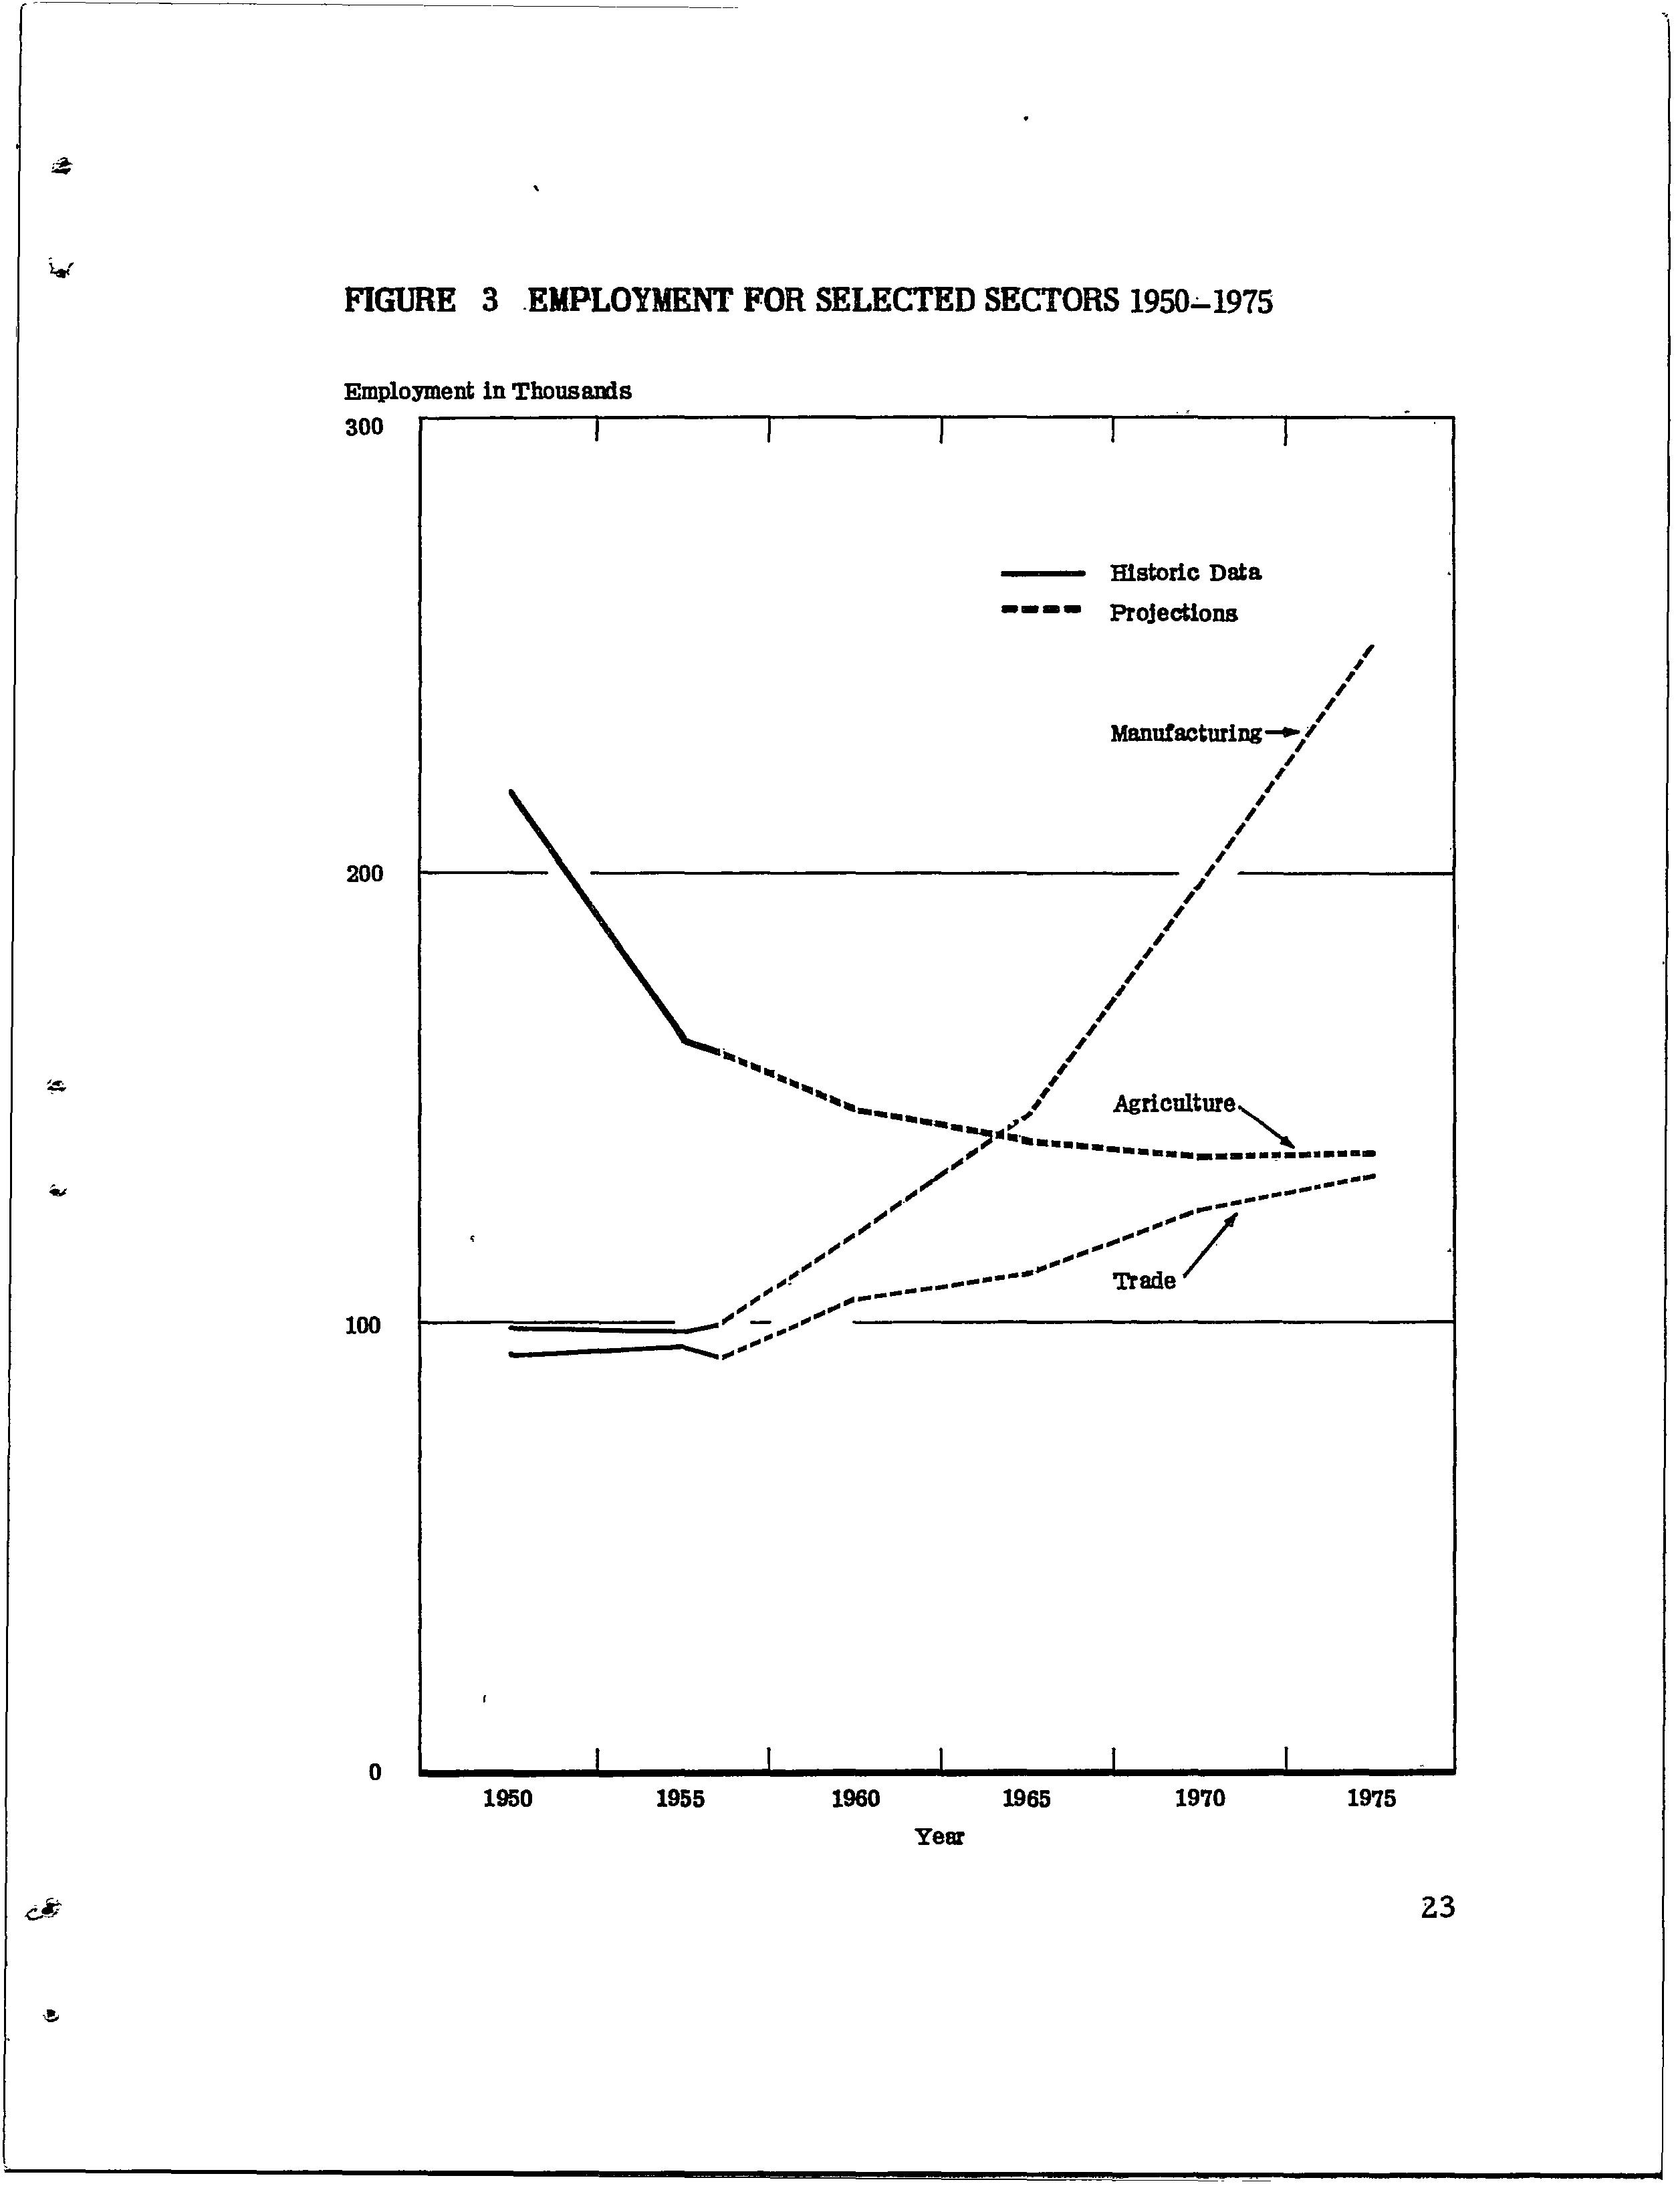
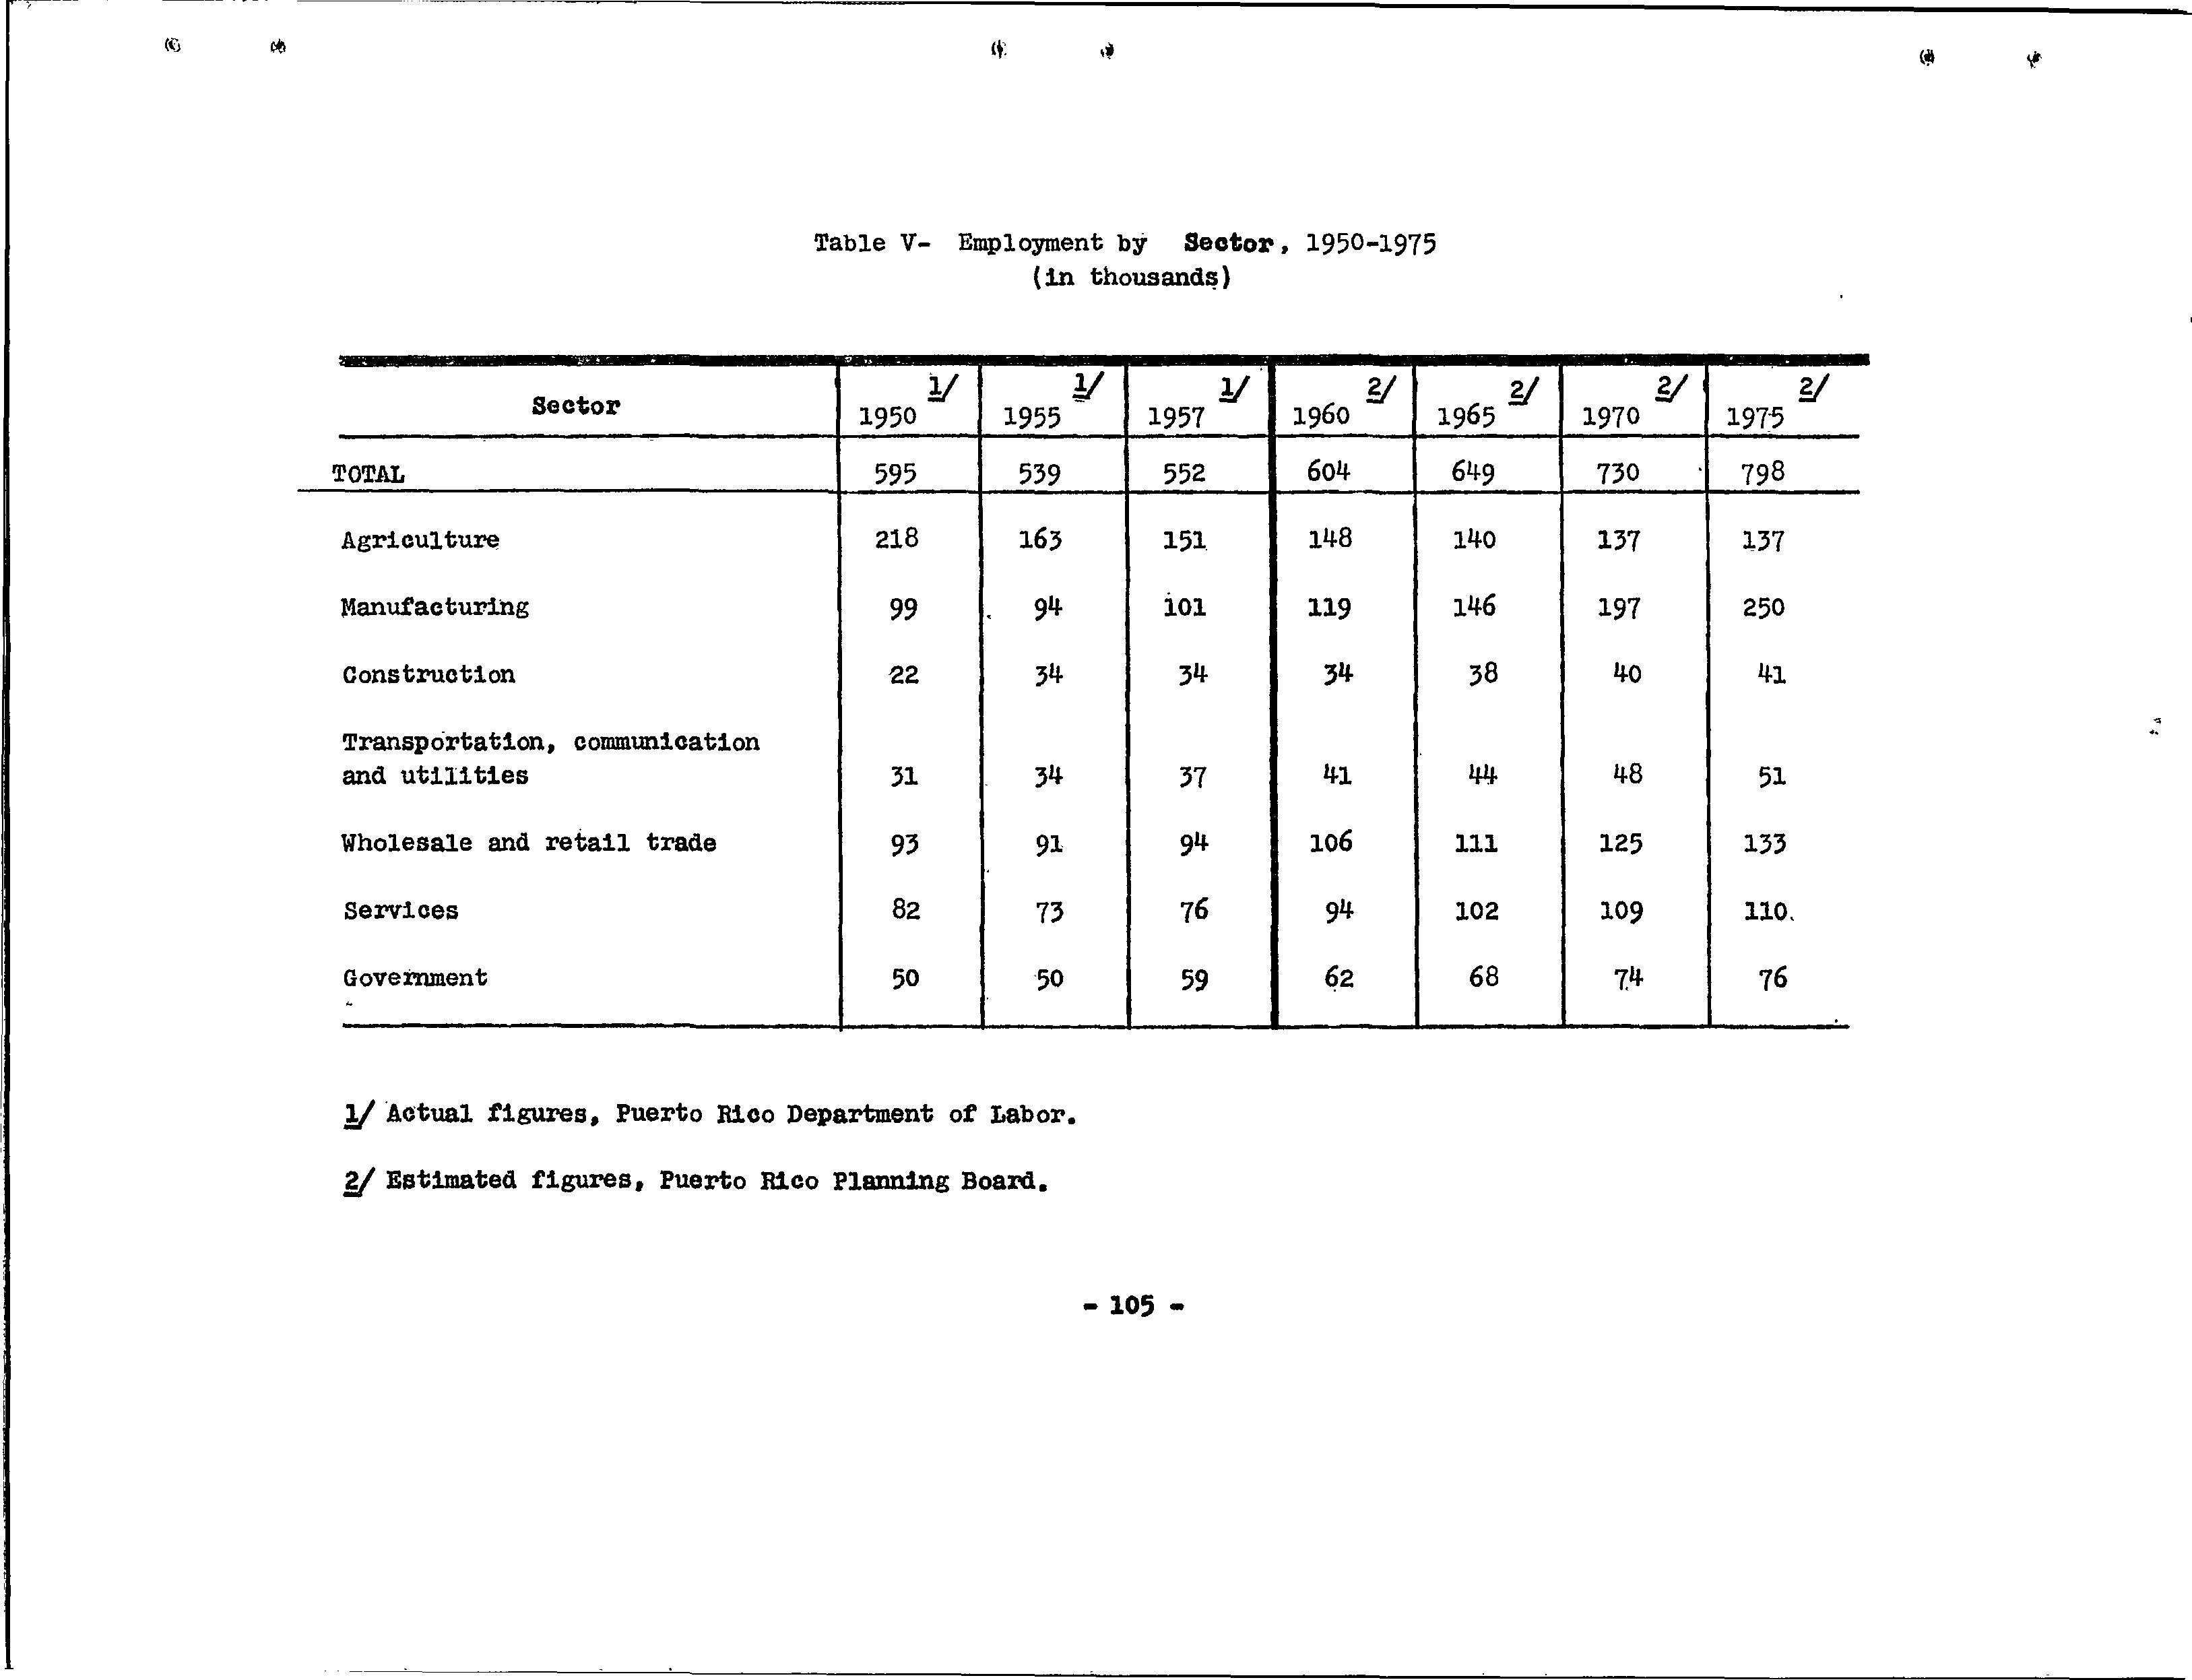
3. Estimates of Employment
Estimates of total future employment for each sector of the Puerto Rican economy are, of course, easily calculated once estimates of future net income and productivity are available. Employment data are shown in tables V and VI in the appendix and are illustrated in figure 3.. The next step, however, of breaking down these employment estimates by occupation is not so straightforward. Comprehensive data on occupation by industry are available only in the decennial census. Even there, comparable data are available only for 1940 and 1950 for the United States, while for Puerto Rico these data are available only for 1950. We had hoped to use data on occupation by industry in the possession of the Puerto Rico Employment Service but these data proved not to be comparable with our data on net income and productivity. Data obtained by the Puerto Rico Bu.reau of Labor Statistics proved useful in the case of the agricultural sector.
Forced to rely h,eavily on census data it was necessary to find a logical method of applying this limited data on past occupational patterns to future employment estimates for Puerto Rico. We discovered such a method in the logicallyand empirically demonstrable relationship between occupational pattern and level of productivity.
Our hypothesis is that as productivity increases, in the production of any product or service, there is a proportional decrease in the employment of the less skilled occupations and a proportional increase in the inputs of the more skilled occupations. A corollary of this proposition is : that at the same level of productivity, a unit output of any product or service wili require similar manpower inputs by occupation (i.e. similar occupati<;:>IJ.al patt(;!r;ns of employment) regardless o.f the time or :p~ace of pr.eduction, s.o long as,the general type of technology employed is the same.
FIGURE 3 .EMPLOYMENT FOR SELECTED SECTORS 1950.:....1975
Employment in Thousams 300
Historic Data Projections
We do not, of.cours.e, regard the above propositions. as proved; proof would require the analysis of a great deal of data from many countries and for con.siderable periods of time. We know, however, that th,e data we have s.upport these relationships b~tween productivity and occupational pattern, that a logical analysis of ~e productive process also supports them and we believe therefore, that future investigation will further demonstrate their validity. The validity of the hypothesis depends, of course,· on the terms in which it is defined. Where the terms employment and occupation ·have fundamentally different meanings than they have in a.m<:>dern industrial society it :r;nay not hold.
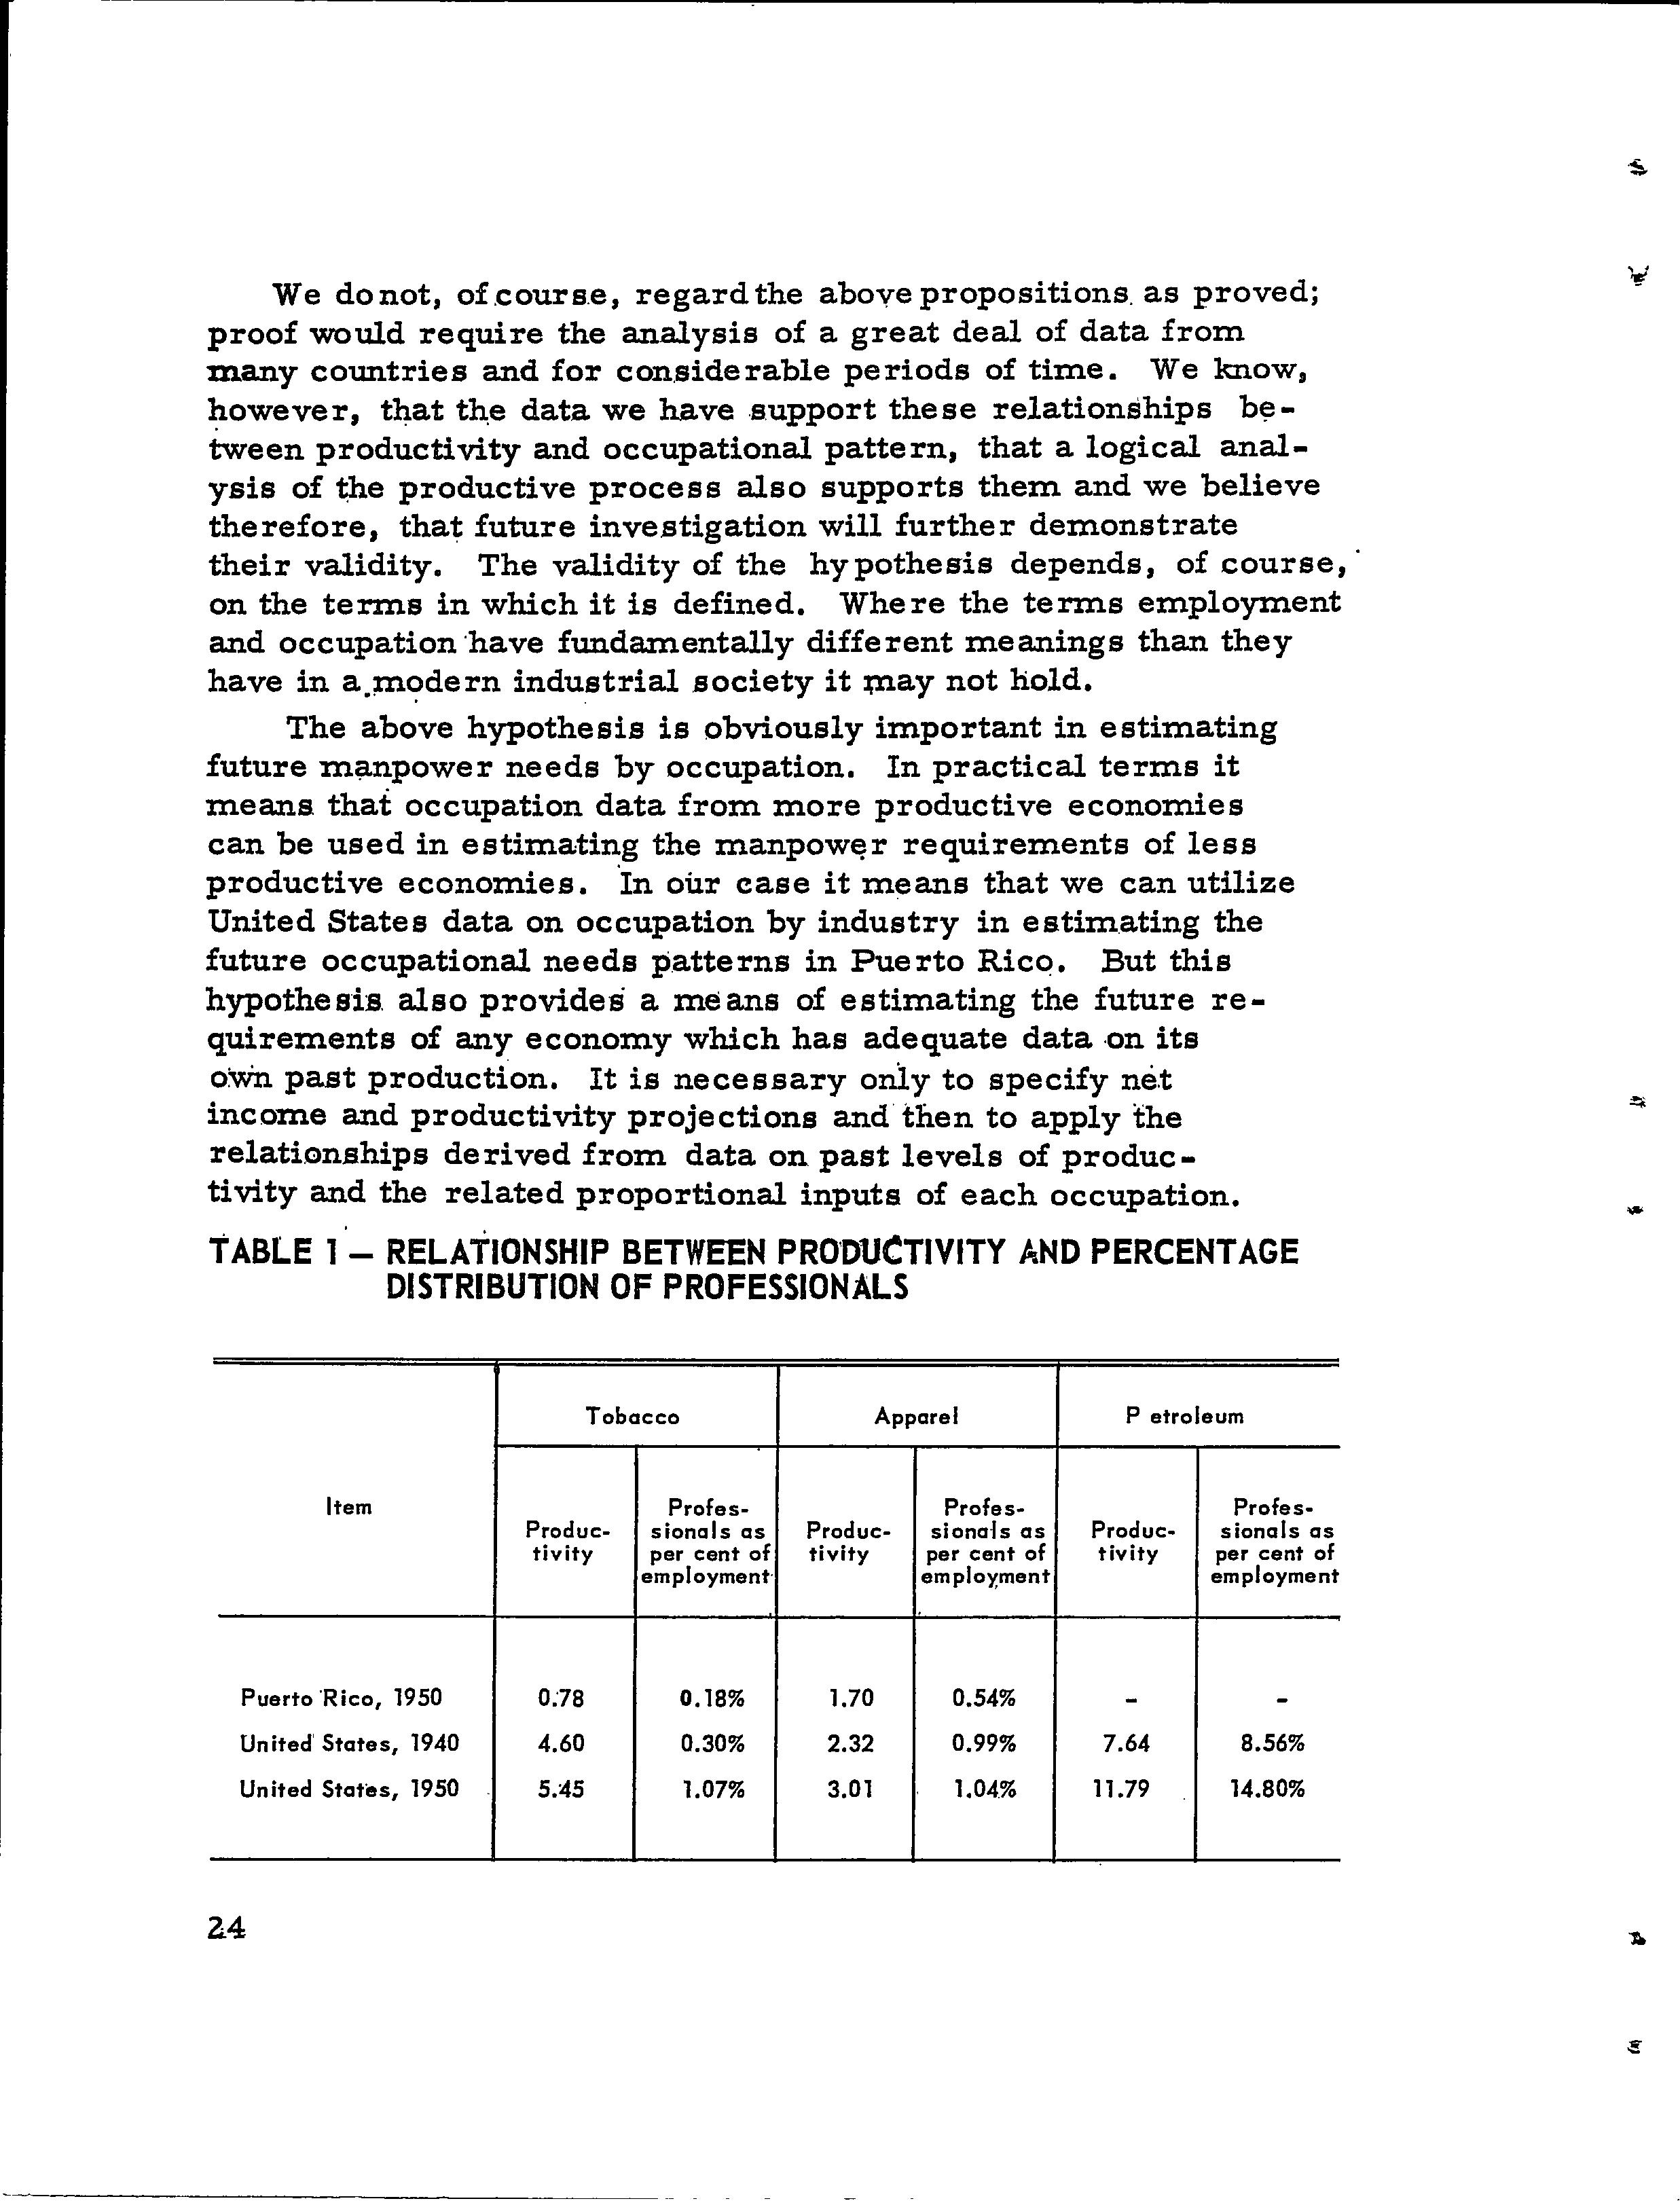
The above hypothesis is obviously important in estimating future manpower needs by occupation. In practical terms it means that occupation data from more productive economies can be used in estimating the manpow~r requirements of less productive economies. "in our case it means that we can utilize United States data on occupation by industry in estimating the future occupational needs patterns in Puerto Rico. But this hypothesis. also provides a means of estimating the future requirements of any economy which has adequate data •On its own past production. It is necessary only to specify ne.t income and productivity projections and then to apply the relationships derived from data on past levels of productivity and the related proportional inputs of each occupation.
TABLE 1·- RELATIONSHIP BETWEEN PRO'DUCTIVITY AND PERCENTAGE DISTRIBUTION OF PROFESSIONALS
Table 1 illustrate-s the relationships between productivity _J.~vel and employment input of professional personn'~l for three industries. A consistent relationship js shown by these data between productivity .and professional exnployment, for each product. The relationship is not consistent from one product to another and this is, of course, not hypothesized nor to be uniformly expected.
The data f9r each occupation class do not all conform &o neatly to the productivity hypothesis. The following table shows two indust.ries in which the expected relationship for the professional, occupations does not hold between Puerto Rico and the United States although it does hold for the United States between 1940 and 1950.
TABLE;2- RELATIONSHIP BETWEEN PRODUCTIVITY AND PERCENTA~~DISTRIBUTION OF PROFESSIONALS
.• St~ne, clay and glass Lumber and furniture
Th~ appaf"ent ~xcess of professional employment in relation to productivity level, illustrated for Puerto Rico by the above table, was found in a number of industries. A similar, appar.en~y excessive employment of managers was also found in a number of industries. Such data do not refute our genera;Lh;ypothesi.s- which is not asserted to hold. for each occupatiQn,group in an indq.s.try but for all occupation groups taken
together. Such data ao, however,. suggest .caution in the .. application of our m.ethod of estim.ating,-~mployment by occu-, pation and especially in the use of data from one country to predict employment .patternS:' in another. ,, .,
The data we·'have :show that the more productive indus-. trie.s do in all ·cases em.ploy a higher proportion of ·pers:ons· .. .in t.he m.ore skilled occup.ations but the specific ·proportion .. µ:i. which any··one class of worker' is em.ployed depends, -of
•• course; on the pr·oduction tec-hnology which will -vary from·· one -c::laa.:s. 'of product to another and '.als·c; upon the economic structure and JJetting .of an industry -which will vary from one country te> another. ·Thus, for example, the stone clay,and glass industry in .Puerto Ric·o is made up of one large ·company employing a high proportion of professionals a;nd a large number of very smc!ll firms, e~ch one with a man~ger (by defµrl~on) ~c;I. otherwise employing ~~rgely common laborers. The'same industry in.the United States i's made upof a·few _, large firms and many firms of mEidium··si:ze. Furthermore, the United States. firm.:s ar.e able ~o puy pr(!~essional f:l.ervices niuch more readily than is .pos:aible in.Puerto Rico and ·thus dci not need to hire so many professional workers,.
.· ·The preceding ana,ly.ai:a and exa:mple. suggest that our e,st:im.ates. of employment' by occupation will be more accurate • '"for Puerto Rico as a whole than they will be .for narrow cai.egories of industry. They will also be more ~ccurate for. those .industries whose technology and econom.ic structure are more similar t.o t}lose of the. comparable industries in the-'States. In our use of United State$ data on occu~on.al distribution we have elim.inated _large industrial segments ~d product _categories which are not predicted to have future counterparts in Puerto Rico. We have not, on the o:tller h~d, been able to adjust for many smaller difference• . in product mix and economic structure betw.een Puerto Rico . and the UJ;lit,ed"Sta:tes.
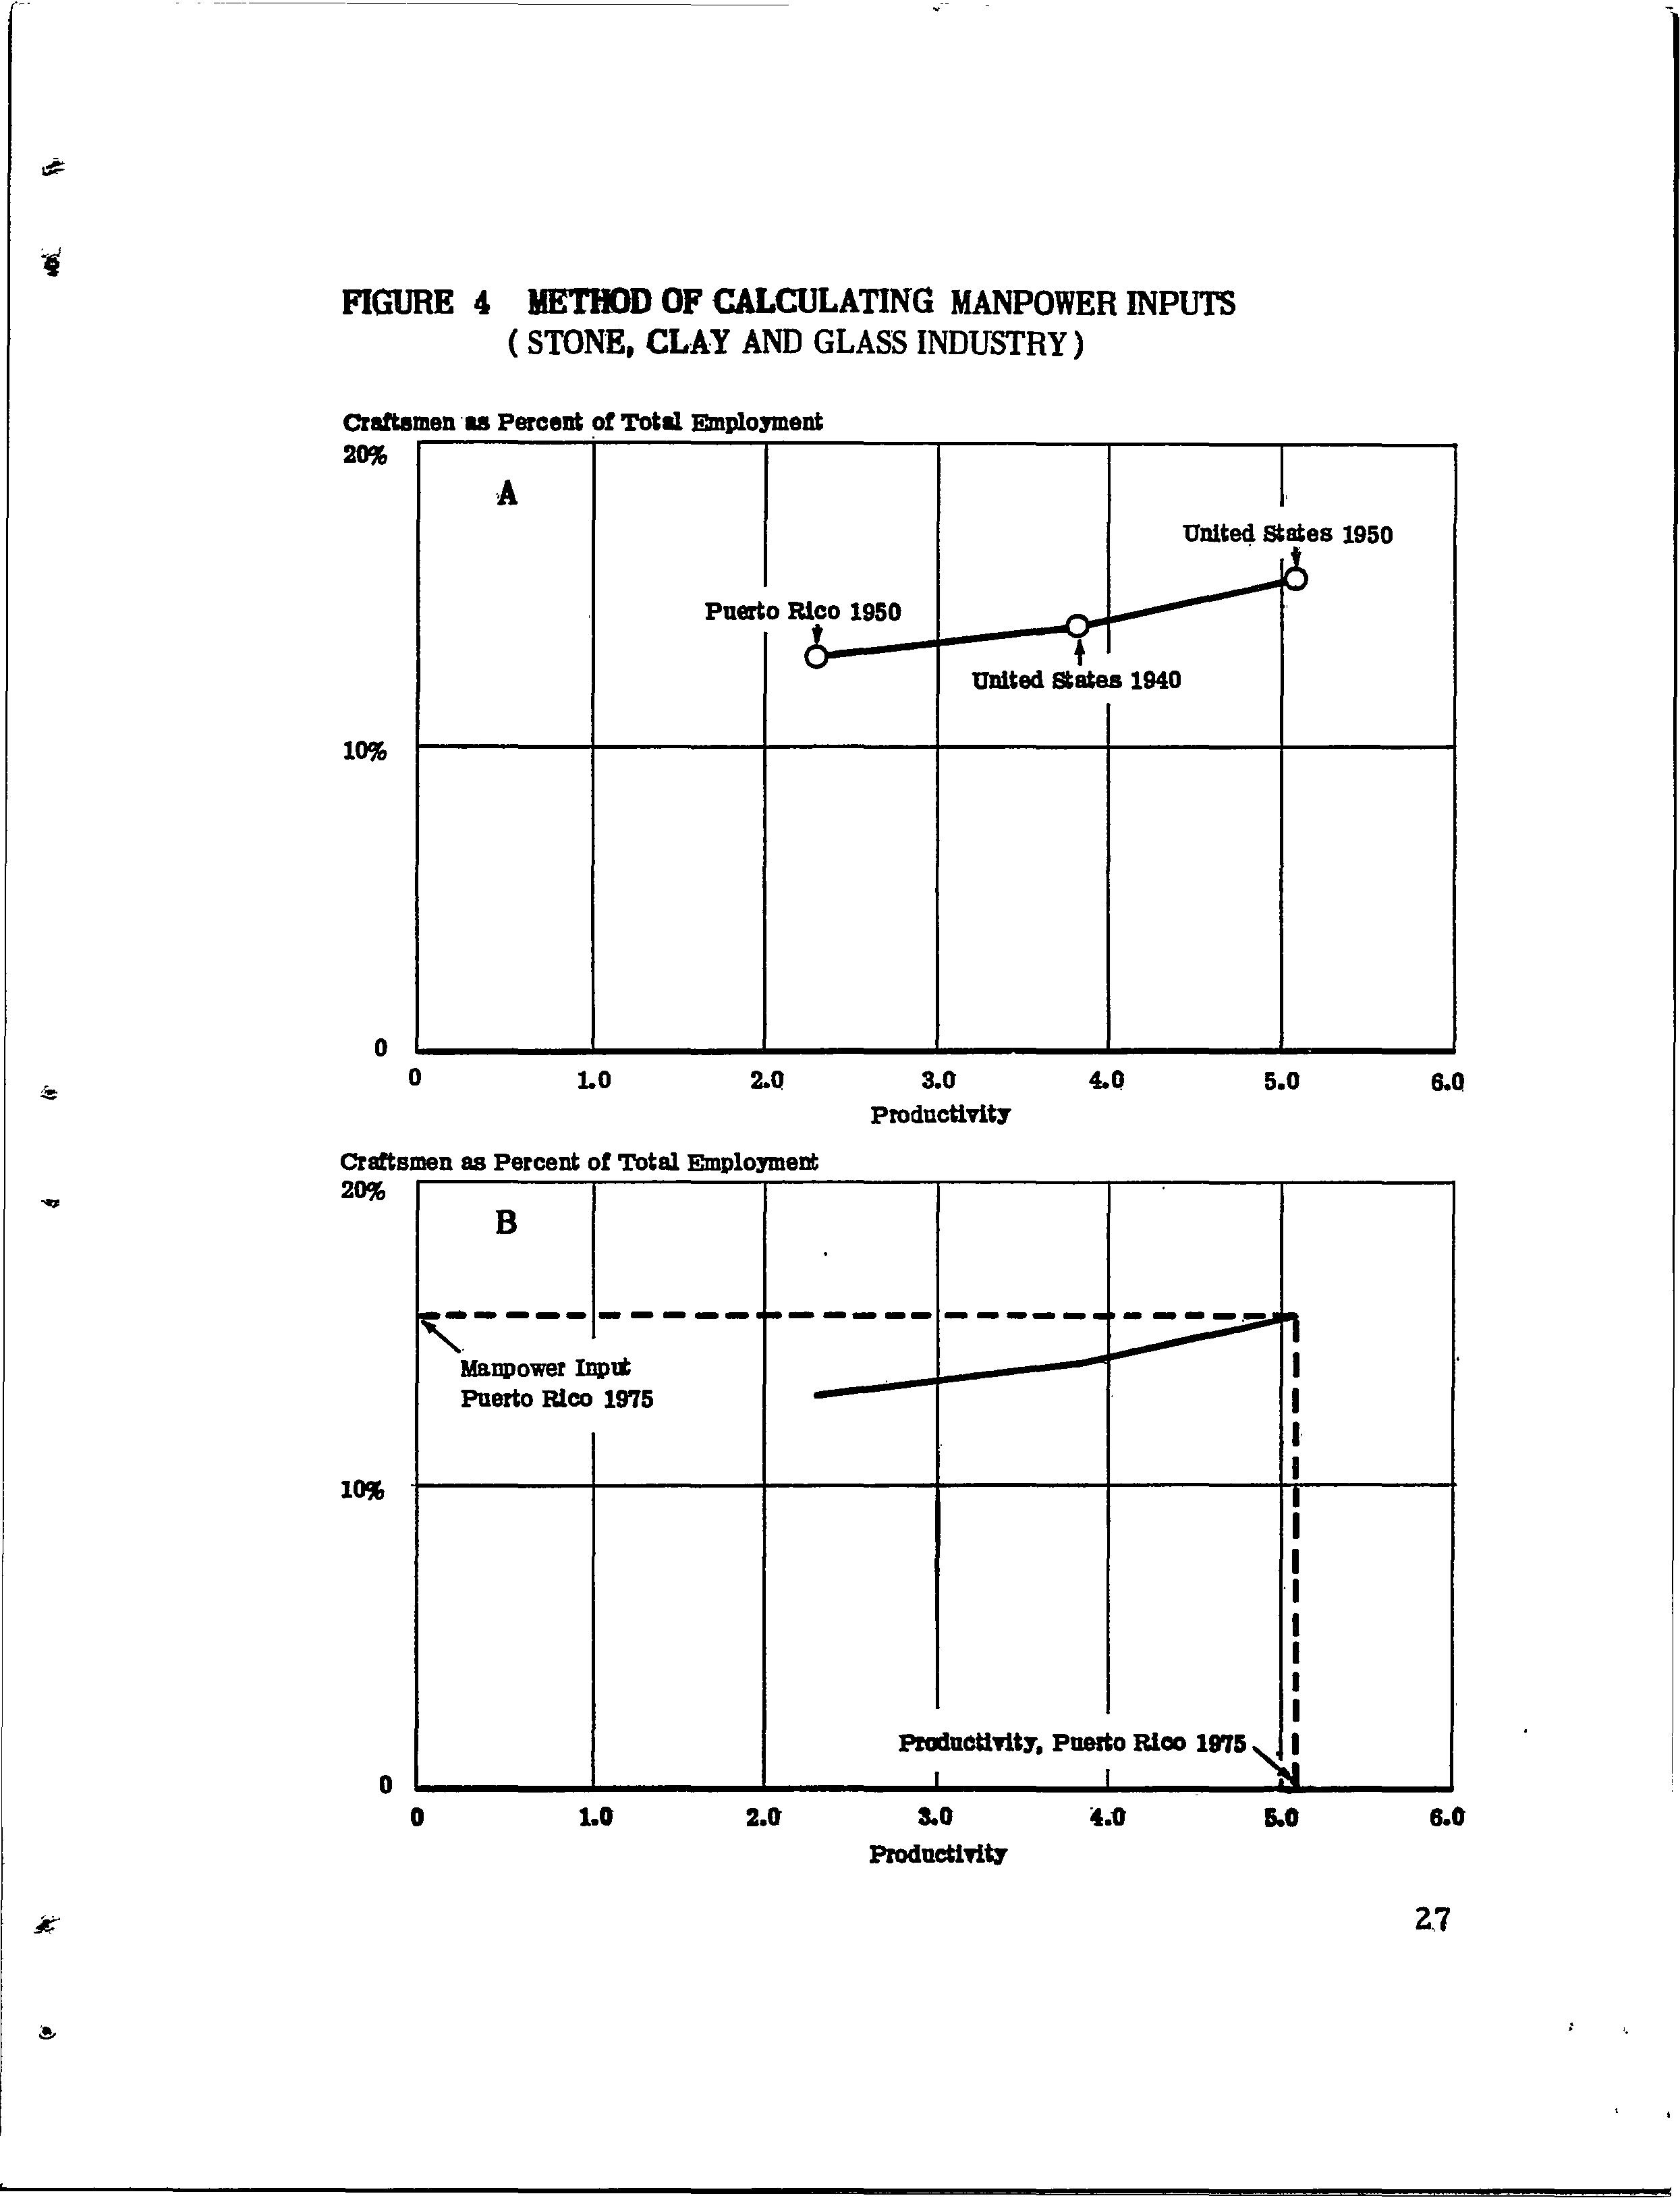
... bur manpower ~stimates by major occupation ciass: profes:sional, cr.al_t.sm..an., labore.r, etc. , we're made: 'by· reading of! p.erceritage •in.puts: of":each oc·cupation ·from line- ·g.raphs·, the- cdn:struction an.d.·uae· of- which are illustrated in figure 4.
FIGURE 4 METHOD OF CALCULATING MANPOWER INPUTS ( STONE, CLAY AND GLASS INDUSTRY)
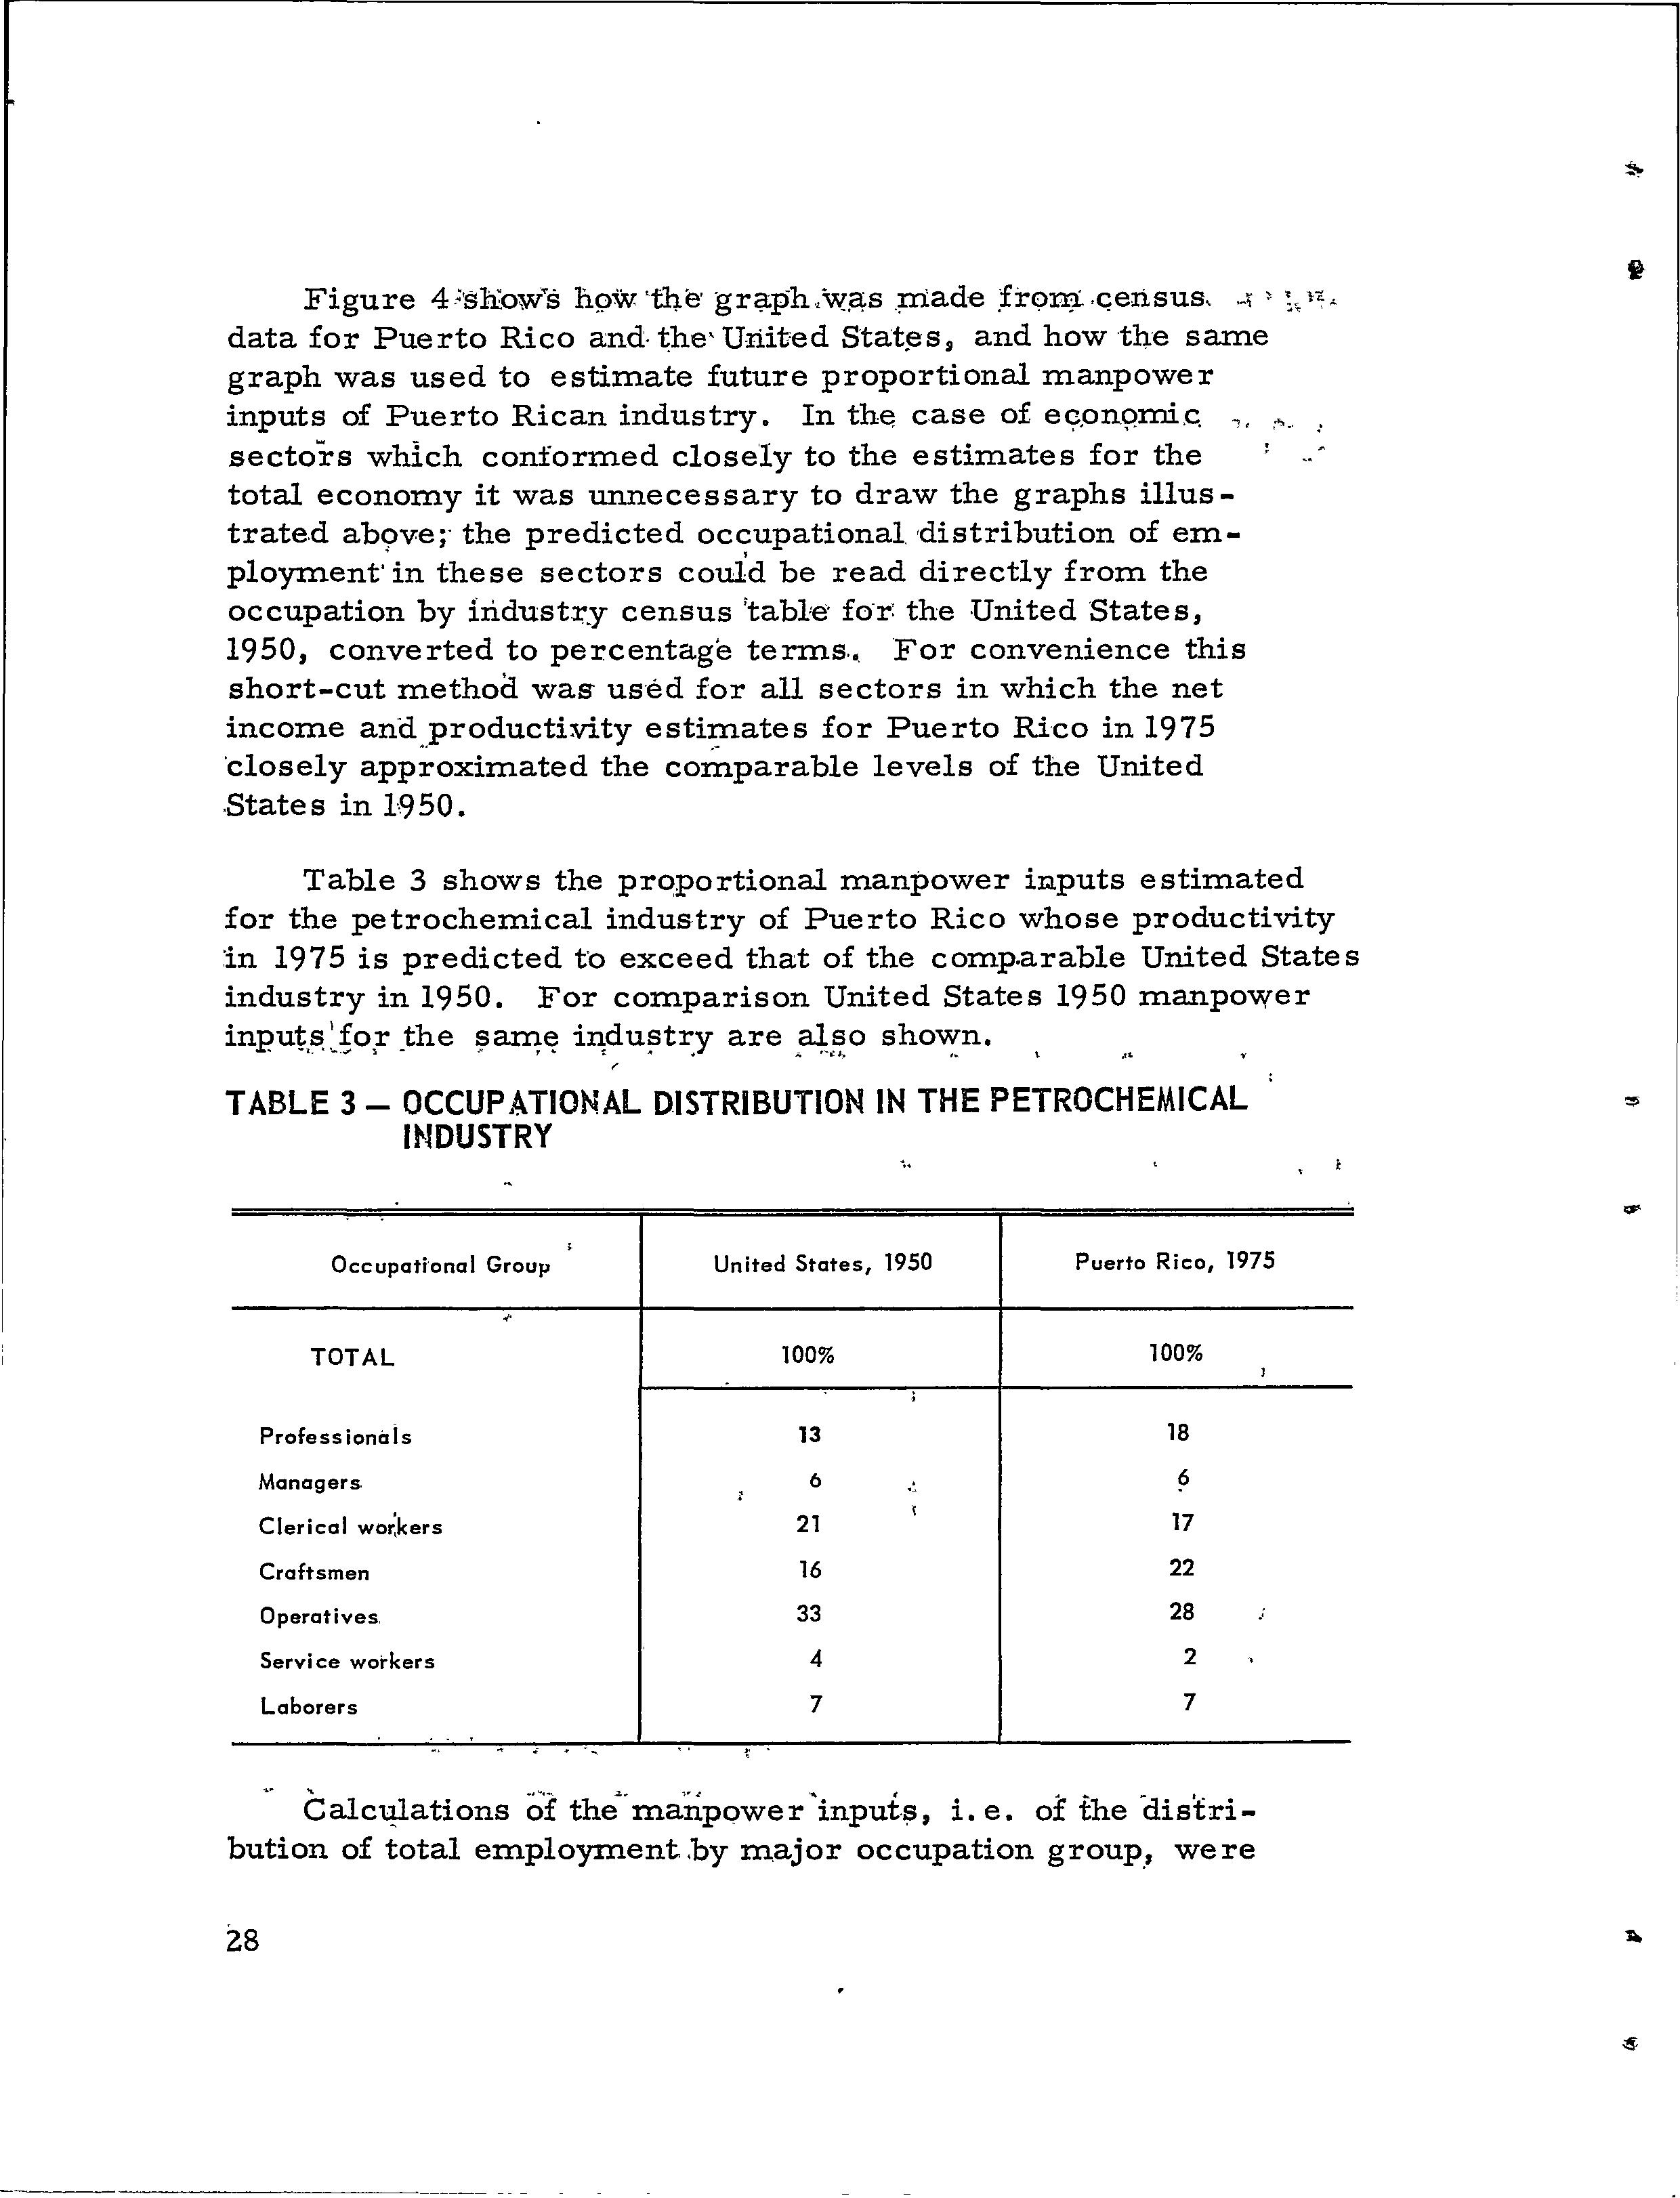
Figure 4;•sh:ovls hpw'the· gr;;tph,wp:s .;made ;fr9~.c;ensus, -1, ~,•~, data for Puerto Rico and- ~he' United Stat~s, and how the same graph was used to estimate future proportional manpower inputs of Puerto Rican industry. In th~ case of ec;;.onqmi.c. ,, ·"'· sectors whlch conformed closely to the estimates for the total economy it was unnecessary to draw the graphs illustrated above;· the predicted occupational distribution of employment:in these sectors could be read directly from the occupation by iridust:i,-y census 'table· fo·r: the United States, 1950, converted to percentage terms... For convenience this short-cut method was used for all sectors in which the net income and producti:vity estimates for Puerto Rico in 1975 'closely app;oximated the co~parable levels of the United .States in 1950.
Table 3 shows the proportional manpower inputs estimated for the petrochemical industry of Puerto Rico whose productivity :in 1975 is predicted to exceed that of the comp.arable United States industry in 1950. For comparison United States 1950 manpower input,~~io,r _the i:qdu¥3ti:y are .~~o shov<:'.'n·
TABLE 3 - OCCUPATIONAL DISTRIBUTION IN THE PETROCHEMICAL INDUSTRY
•• Calculations of the··manpower'input~, i.e. of the -distribution of total employment.by major occupation group_, were
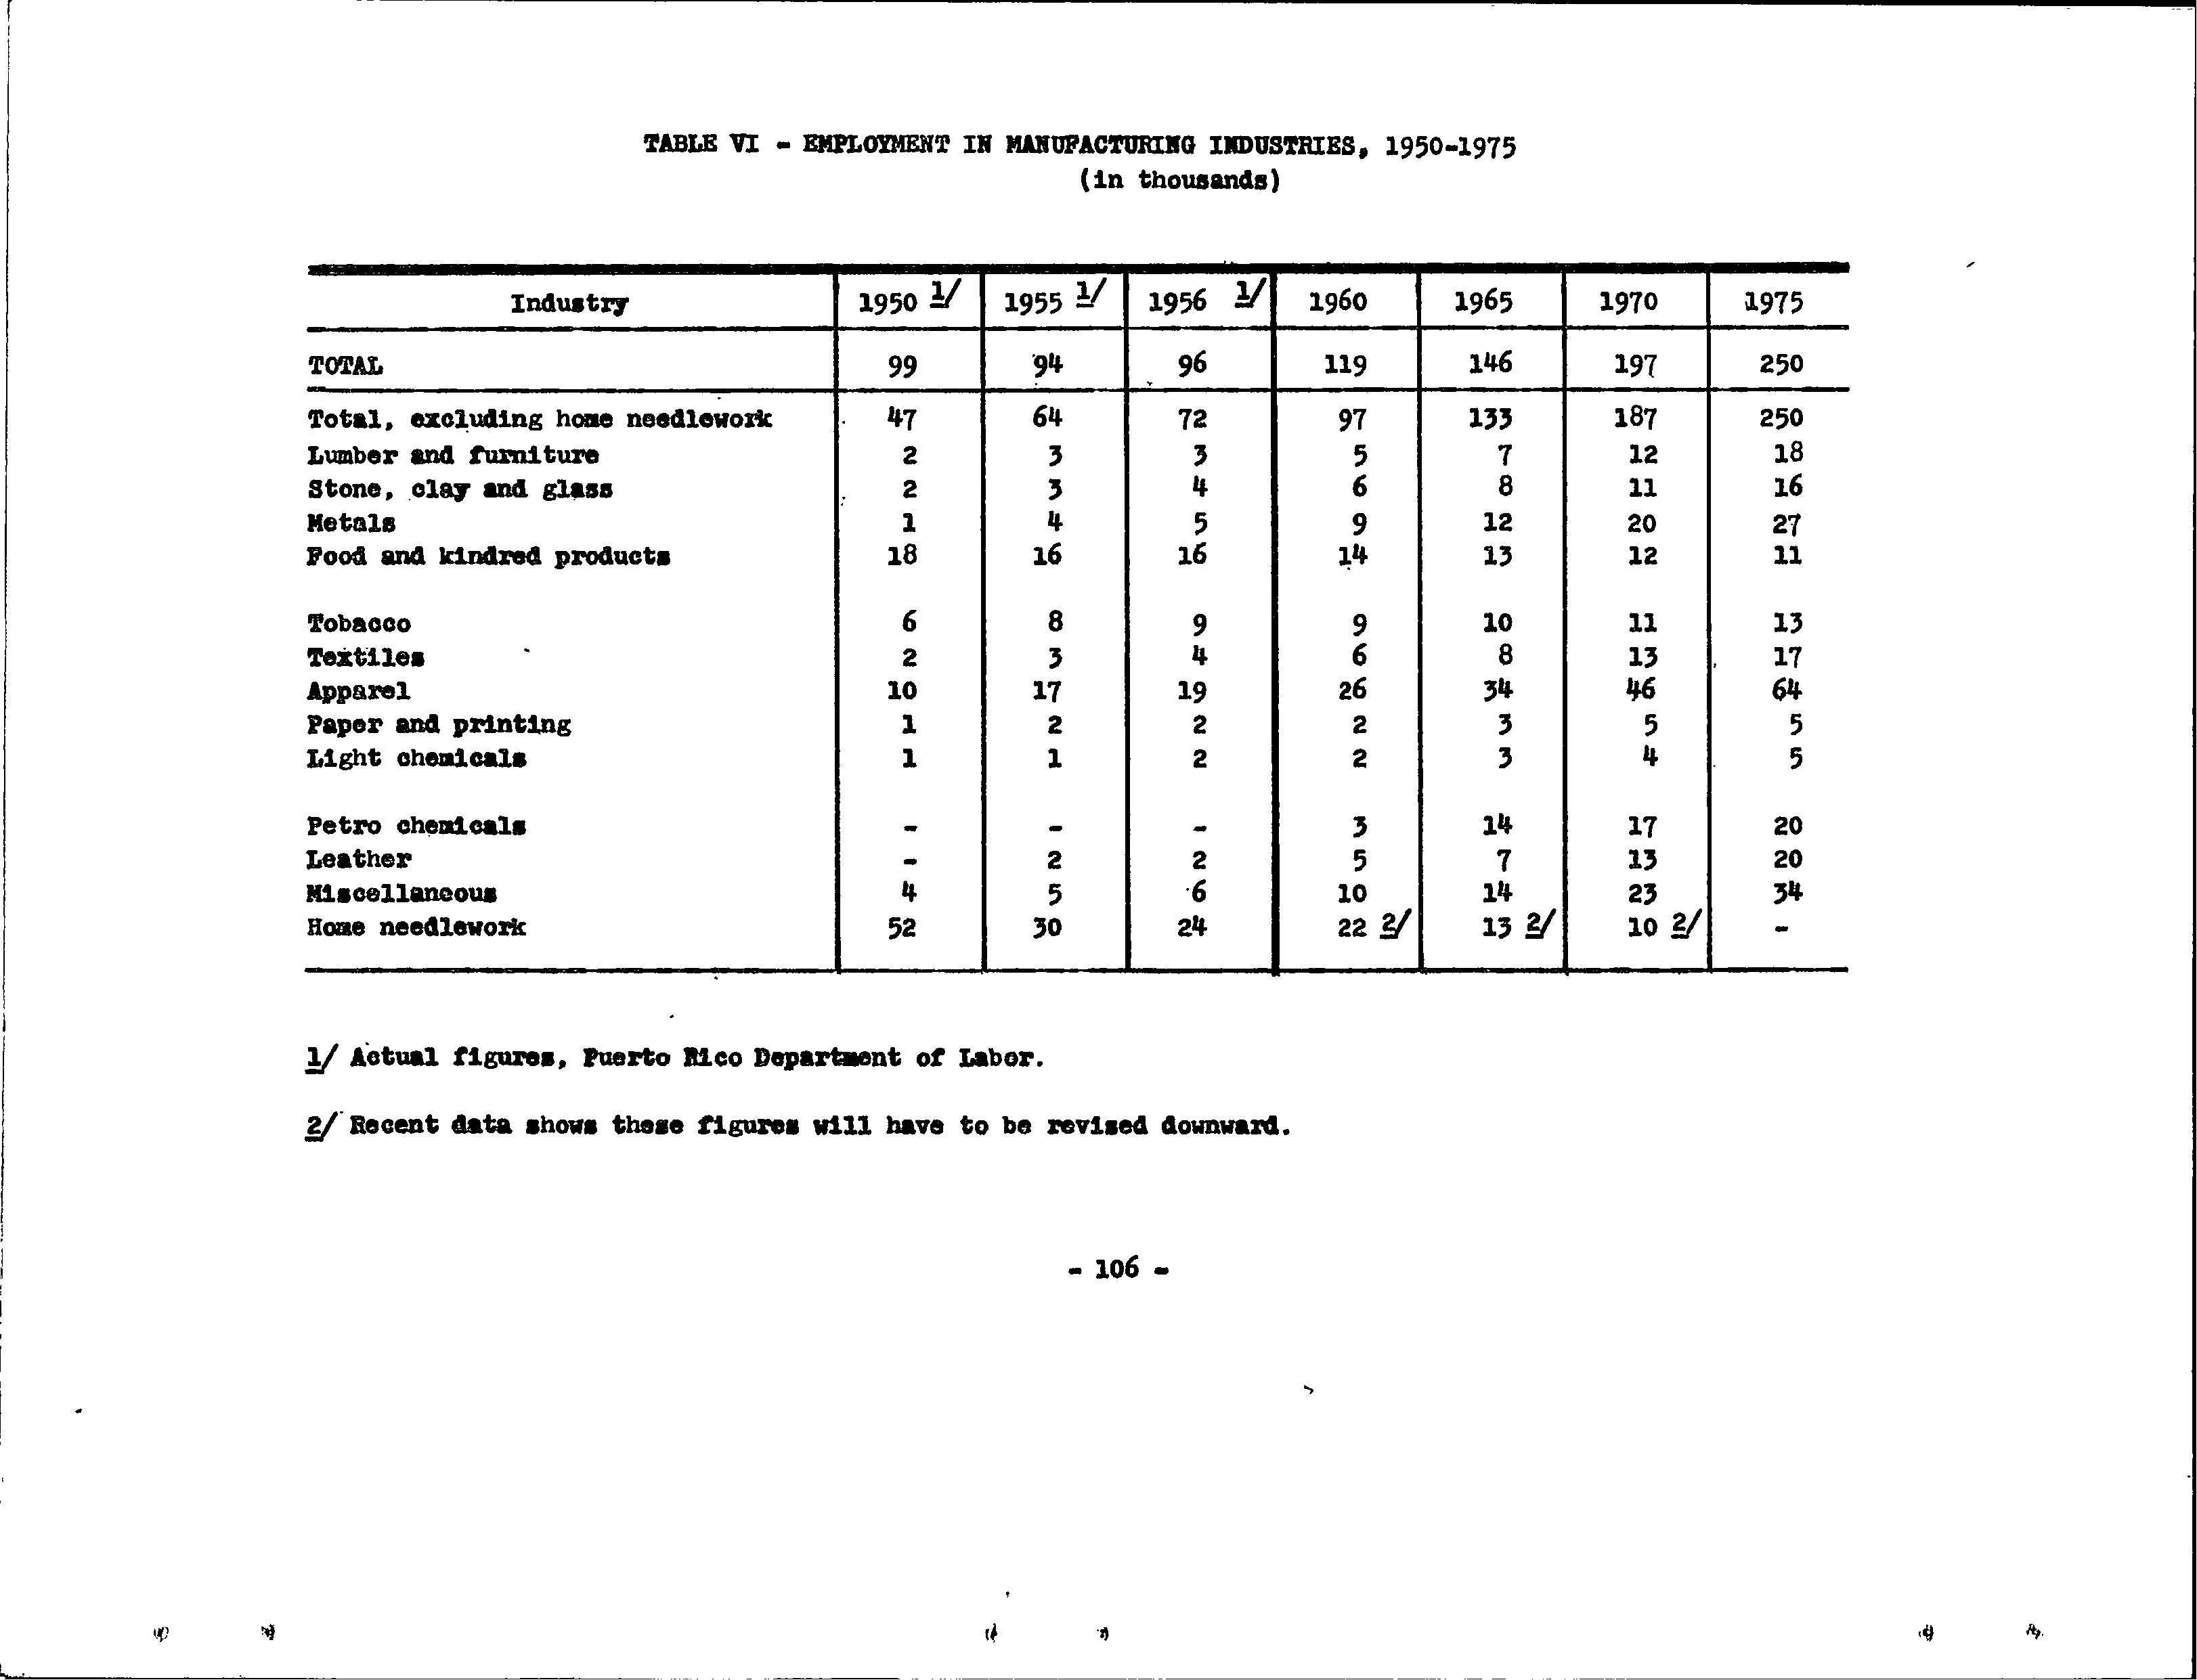
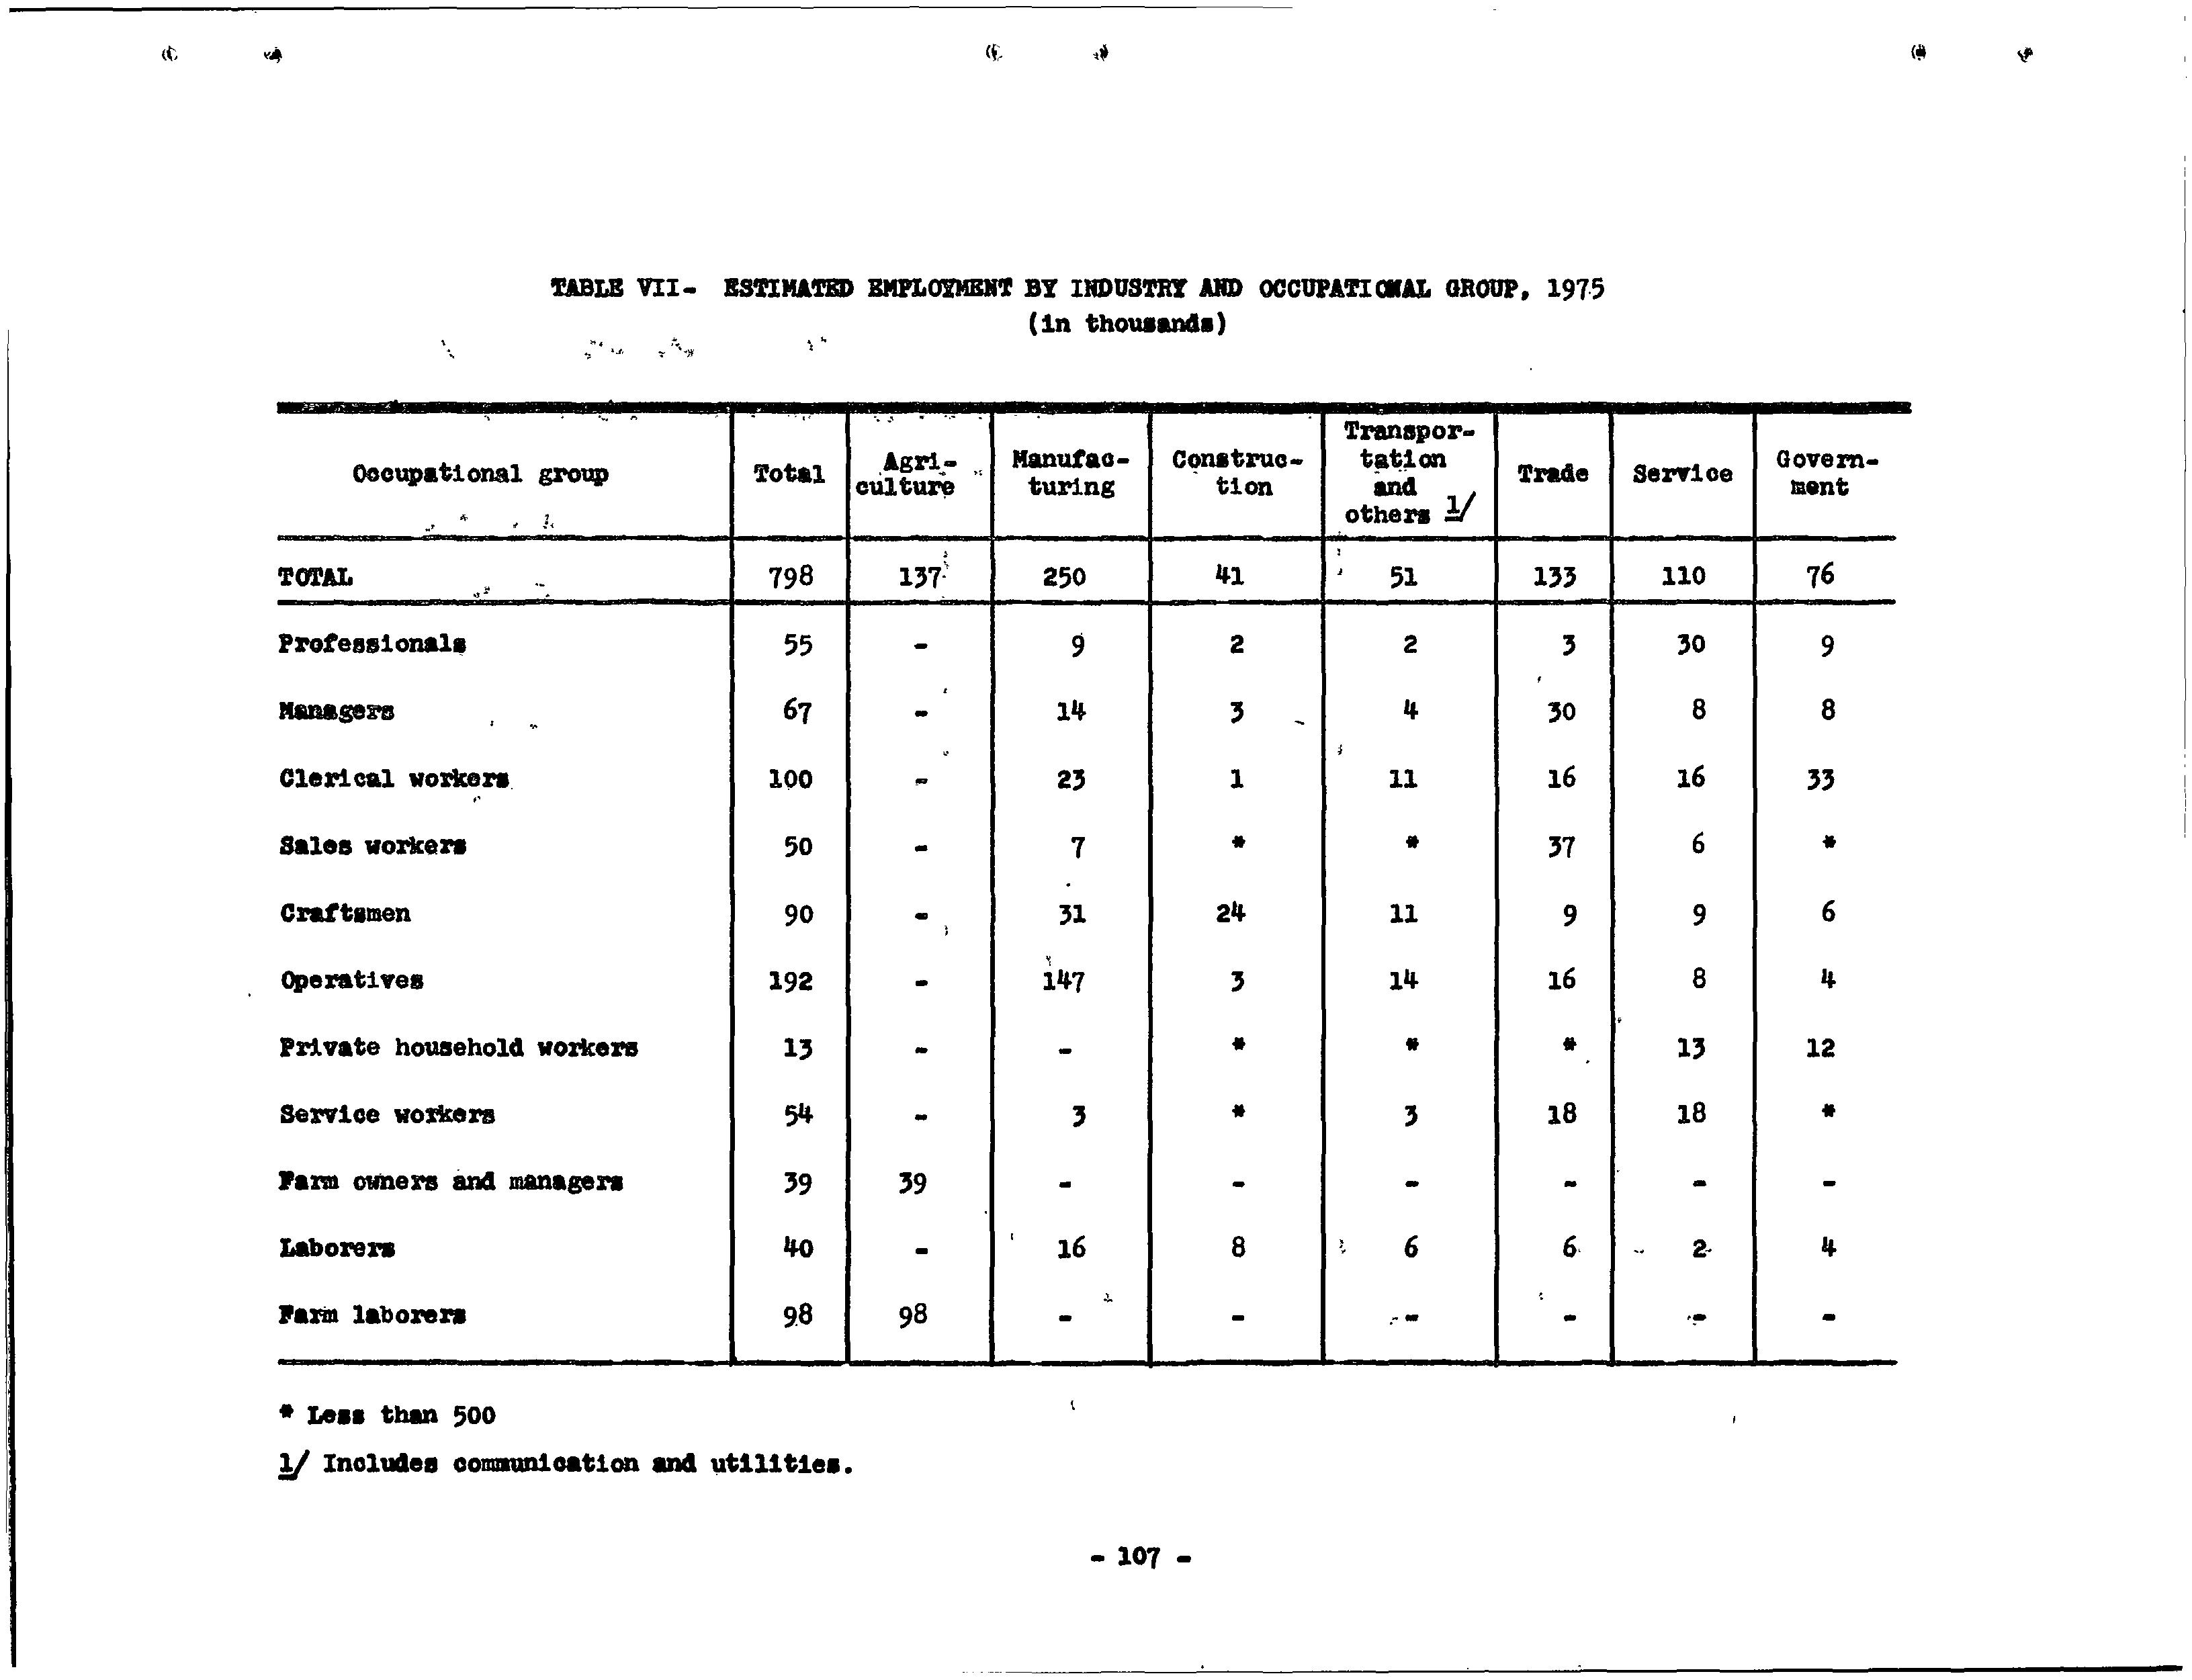
made as illustrated above for each o:£ six :ma-j:or econ,o~ic sectors and for eleven product categories in the manufacturing sector of the Puerto Rican economy. The results qf these calculations are shown in table VII of th~ appenq.ix.
4. Estimates of Employment iq Agricult-,r·e
Puerto Rican agriculture is so different from that of the United States, in major crops, in technology and in land tenure pattern, that it w<;>uld be inappropr1ate to mix data from the United States and Puerto Rico in estimating future employment by occupation in agriculture. On the other hand, it is possible to simplify the estimation of occupational distribution in agriculture without significant loss of p:i:ecision. According t9 t}l.e 1950 census, 97. 6% of agricultural employment in :Pue::rto Rico was made up of farm owners or managers an¢!. of fa:i:m laborers. The United States, at the s~e time, with an agricultural productivity over three times that of Puerto Rico, had 97. 8% of its agricultural employment in the. same two categories. On the other hand, 61 % of the agricultural employment in the United States was made up of farm owners and managers, while Puerto Rico had only 17% of its agricultural employment in this. class.
It seems probable that the higher agricultural productivity of the United States is related to the much higher proportion of farm owners or managers and the much lower proportion of farm laborers. It does not seem probable that Puerto Rica:h agriculture can reach an owne:t-laborer ratio like that of the United States, in the foresee.able future. The principal reason is tha1; it would be very difficult to achieve United States machineland ratios with Puerto Rican land .and Puerto Ric.an crops.
Confining the problem of estimating occupational distribution of employment in agriculture to the two categor:j.es of ownermanager and farm laborer, permitted us to use Puerto Rican data exclusively. The Bureau of Labor Statistics. 0£ the Commonwealth Department of Labor has employment estimates for
farm managers and farm laborer.a from 1948 to 1956. E~ending the trends indicated by these data, with considerable modification to· reflect proposed governmental assista,nce to agriculture, we arrive at an estimated employment of 39 thousand farm managers and 98 thousand farm laborers in 1975.
5. Estimates of Employment
;In Spe.clflc Professions and Crafts
Although we have :much less adequate data for specific professions and crafts than we have for the broad occupation groups previously ·discussed, it seemed desirable to make at lea.st some preliminary estimates of future employment for such professions as medicine and engineering and for s~ch craftsmen as electricians and machinists. Not only do occupations such as these play critical roles in social and economic development but the training period required to master them 'is long and thus occupational choices have to be made well in advance of entry into the labor force. Furthermore the training facilities required for such occupations are highly specialized and involve considerable investment. There is no Puerto Rican data which relates employment in individual professions and crafts to economic sectors or t9 product or service categories. The. only available body of data, on employment by specific profession and craft within ~.pecific industries, is the United States census for 1950 and it provides these data only for th~ United States as a whole. Fortunately we can use these data for estimating employment in Puerto Rico in 1975 without introducing major errors.
We have estimated that, with the exception of agriculture, the major sectors of the Puert_o Rican economy would achieve, by 1975, productivity levels closely approximating ~ose of the United States in 1950. We have e~tlmated for e.ach of these sectors the .total employment in each major occupation group, 'from relationships between productivity and occupational structure demonstrated by three sets of data; data for Puerto Rico, 1950, and for the Uni~ed States, 1940 and 19~0. It is, not unreasonable to assUine that the distribution of employment
FIGURE
5
among specific professions, within the class of all professions, within a specific economic sector, and in ·the case of manufacturing industry withi.n specific product categories, will be the same in Puerto Rico in 1975 as in the United States in 1950. We are saying, for example, that, among the profe.ssional personnel employed in the manufacture of petroche:micals in Puerto Rico in 1975, the proportions of chemical engineers, electrical engineers and physical scientists will parallel the proportions of these same professions employed in the manufacture of petrochemicals. in the United States in 1950. The assumption becomes a little more tenuous when we apply it to the service sector of the economy which includes many of the self-employed in the professions but still it would appear to provide reasonable preliminary el:ltimates. In the case of teachers., we have .deviated from the general assumption stated above and have used data on estimated school population for our estimates of teacher ~mployment.
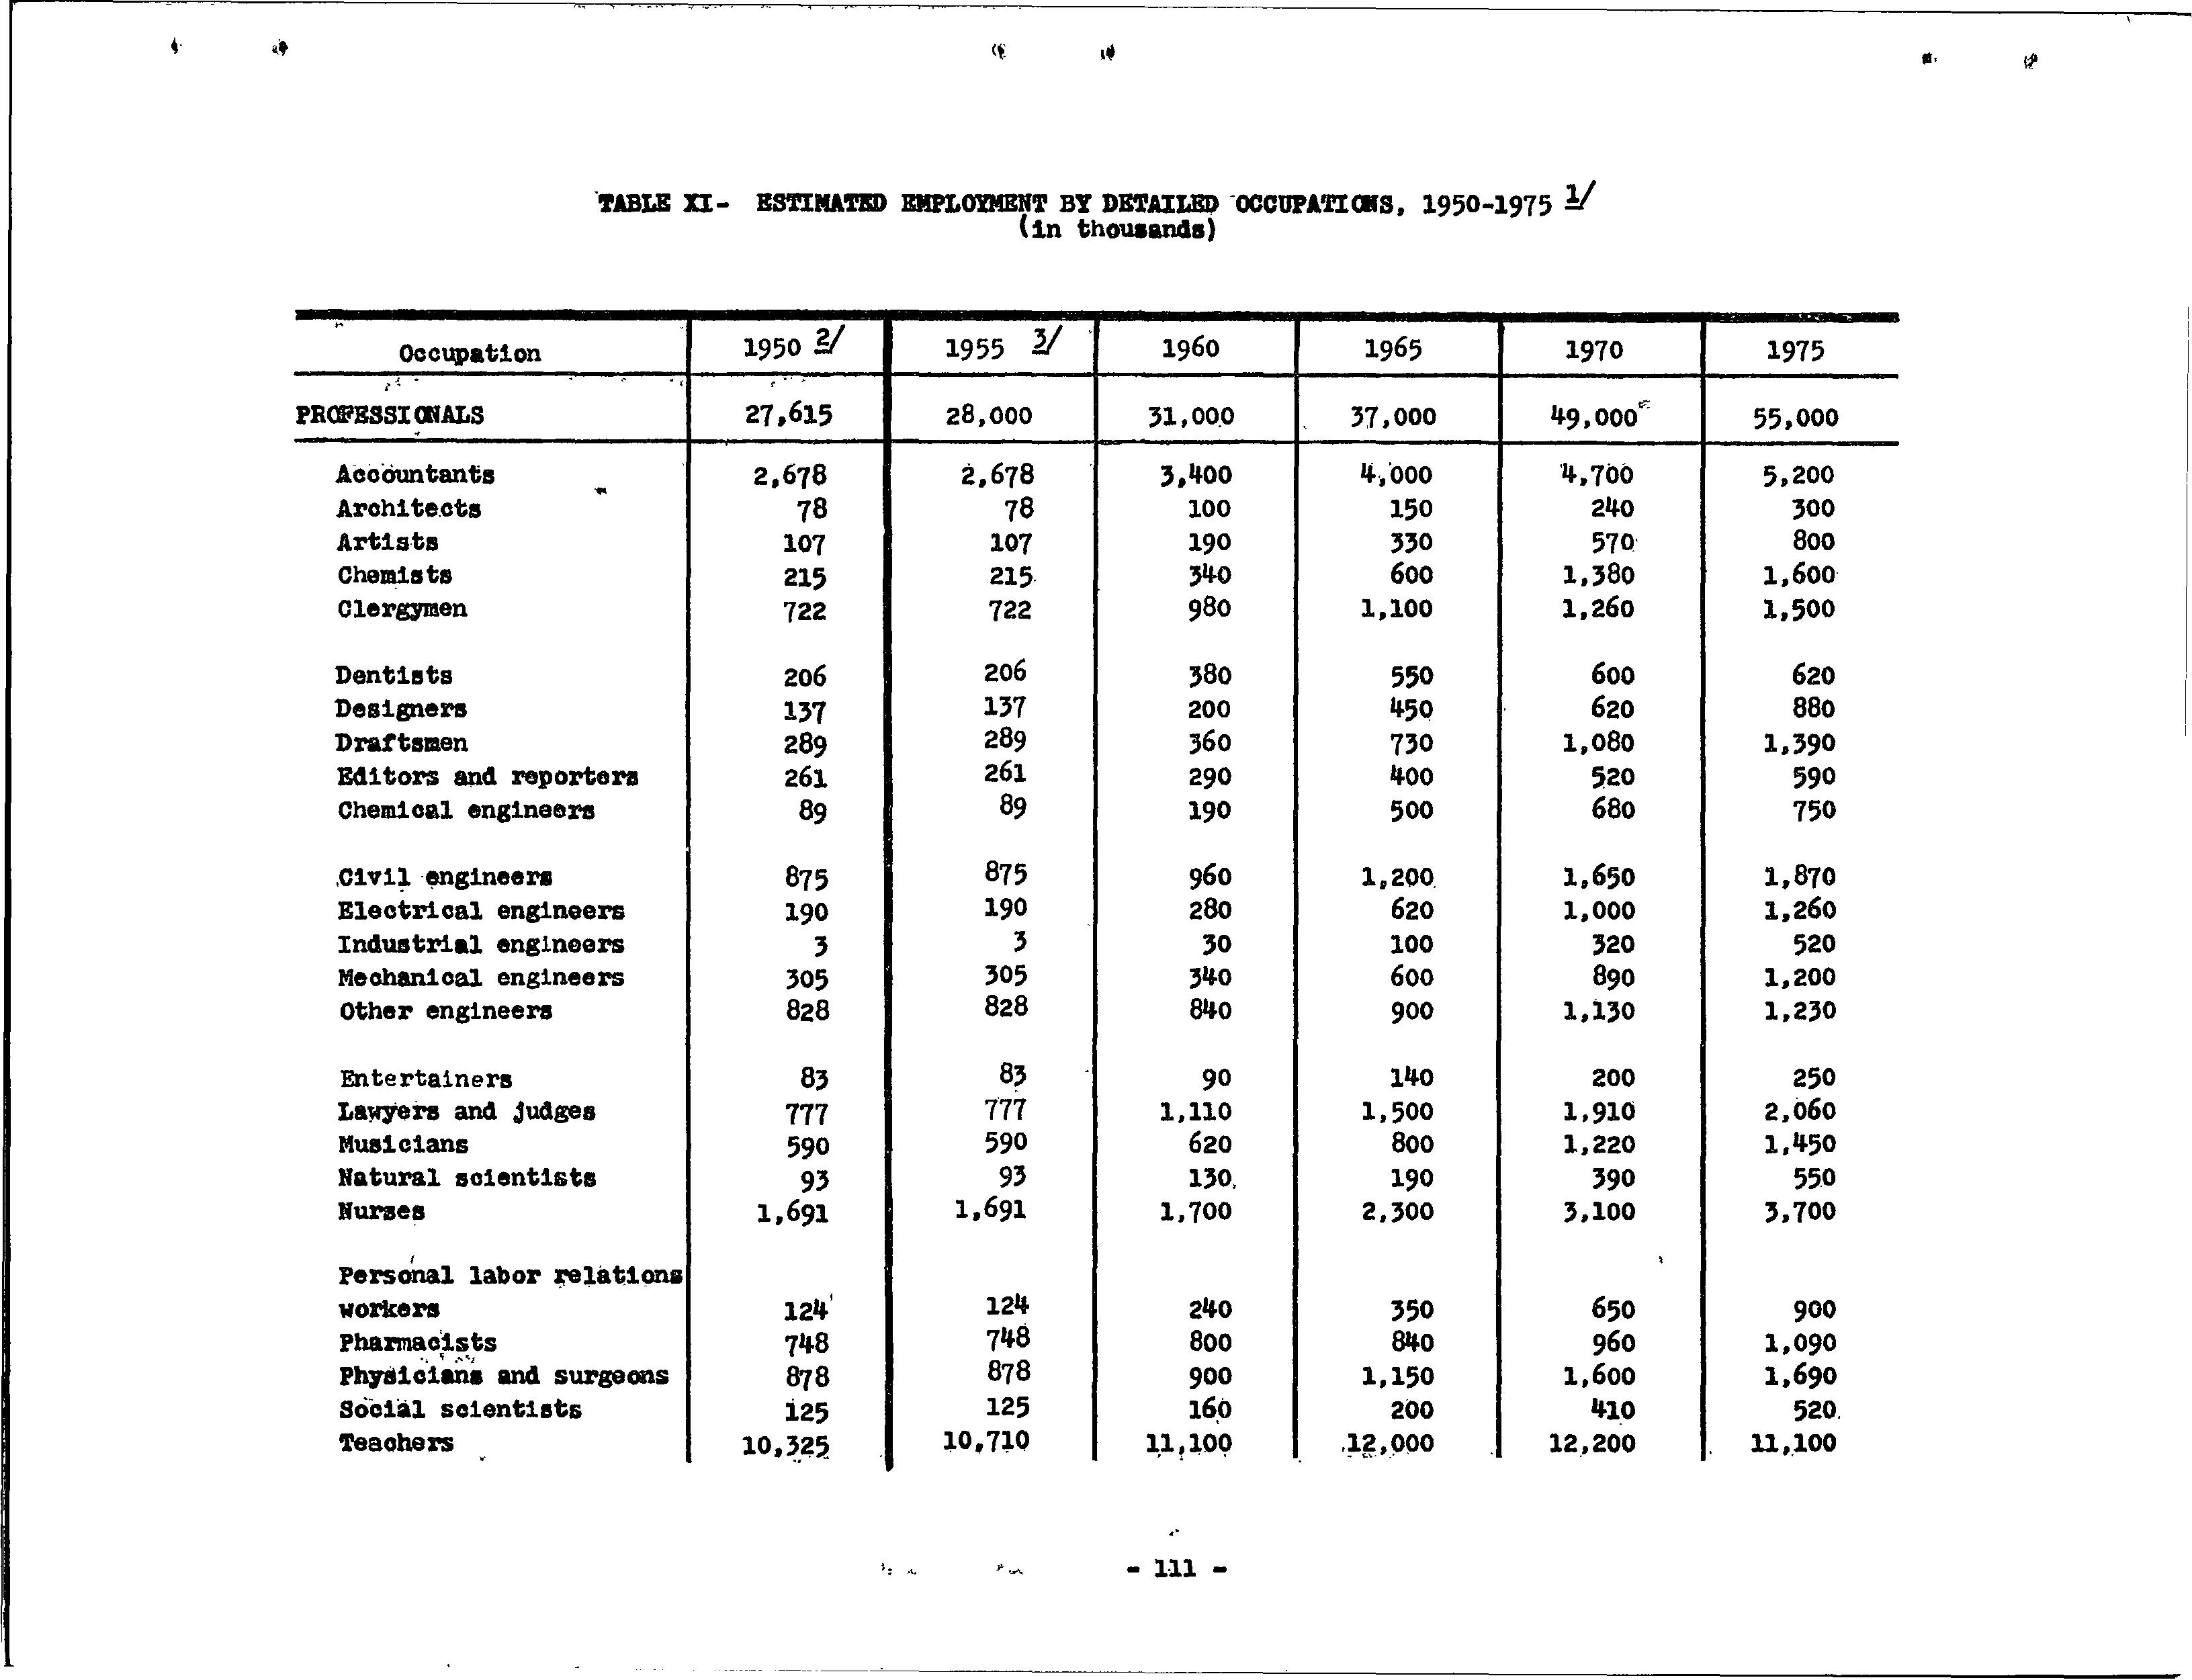
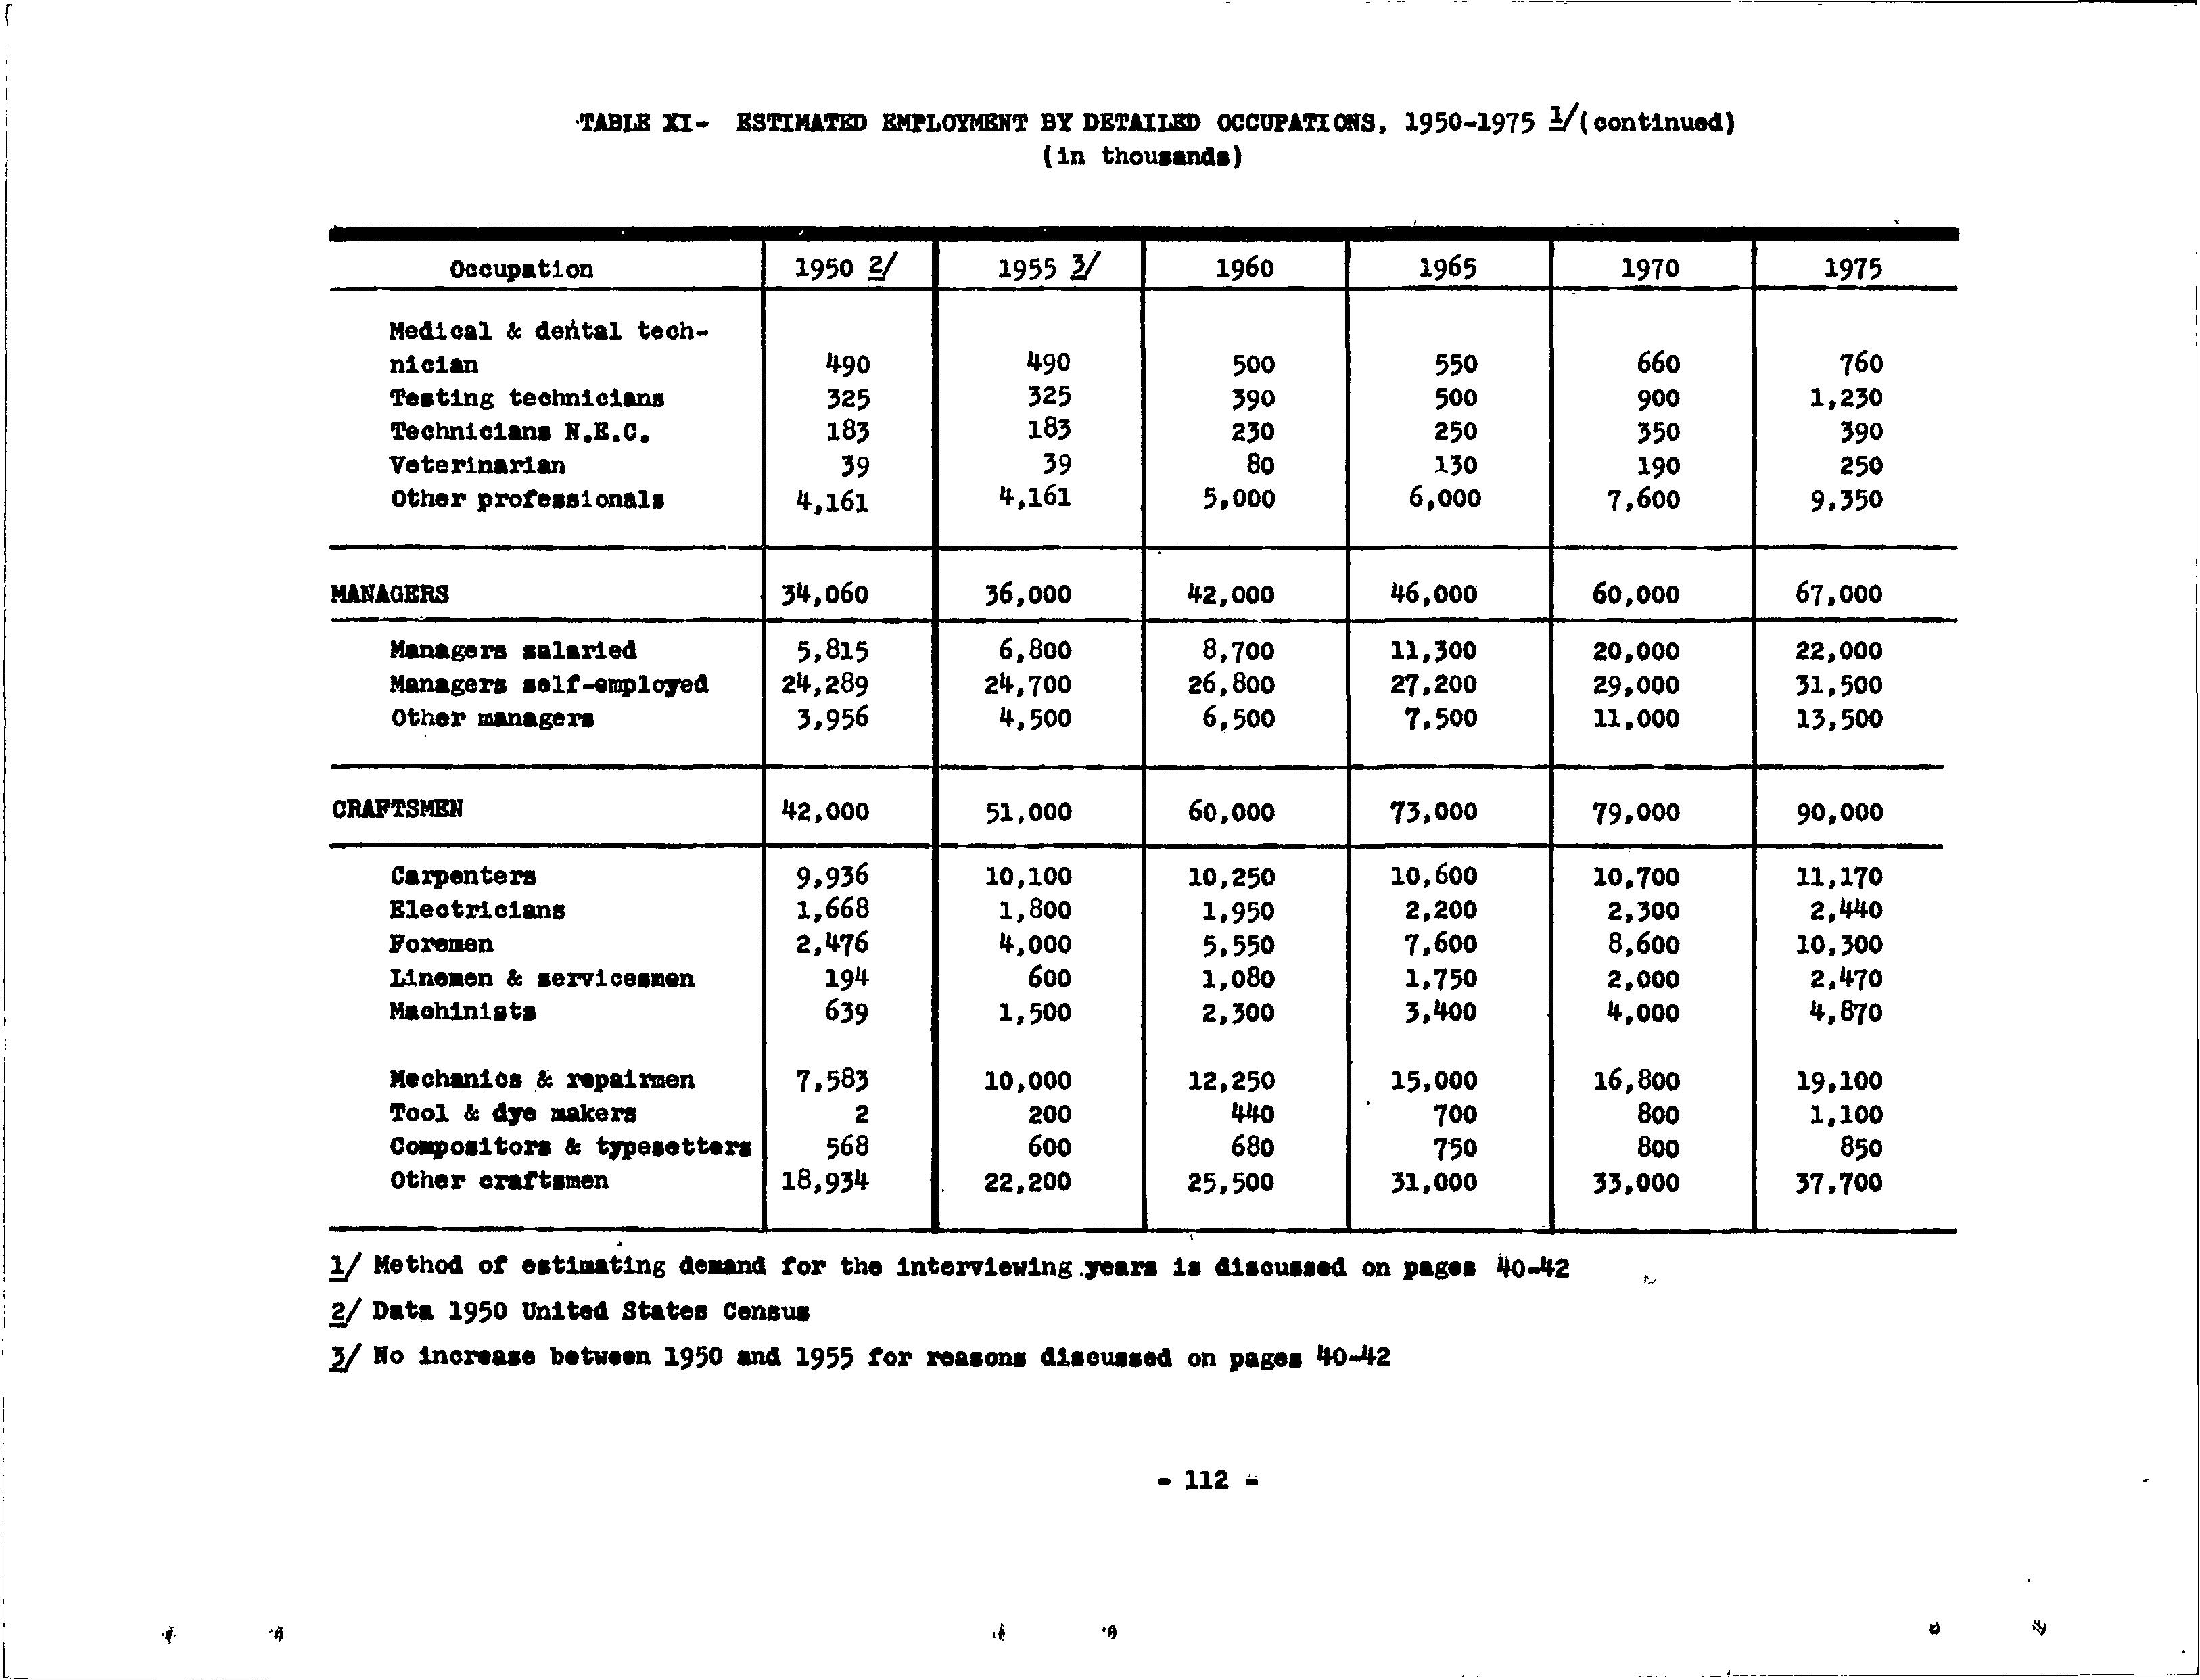
Clearly our estimates of future employment for the members of specific professions and cr.afts are less satisfactory than our estimates for major occupation groups. They represent only a starting point for future work, in the course of which we will have to secure more detailed data than we have available at present. Nevertheless the present estimates, presented in table XI in the appendix, will probably serve a useful purpose in vocational counseling and education planning.
6. Estimates of Employment by Level of Education
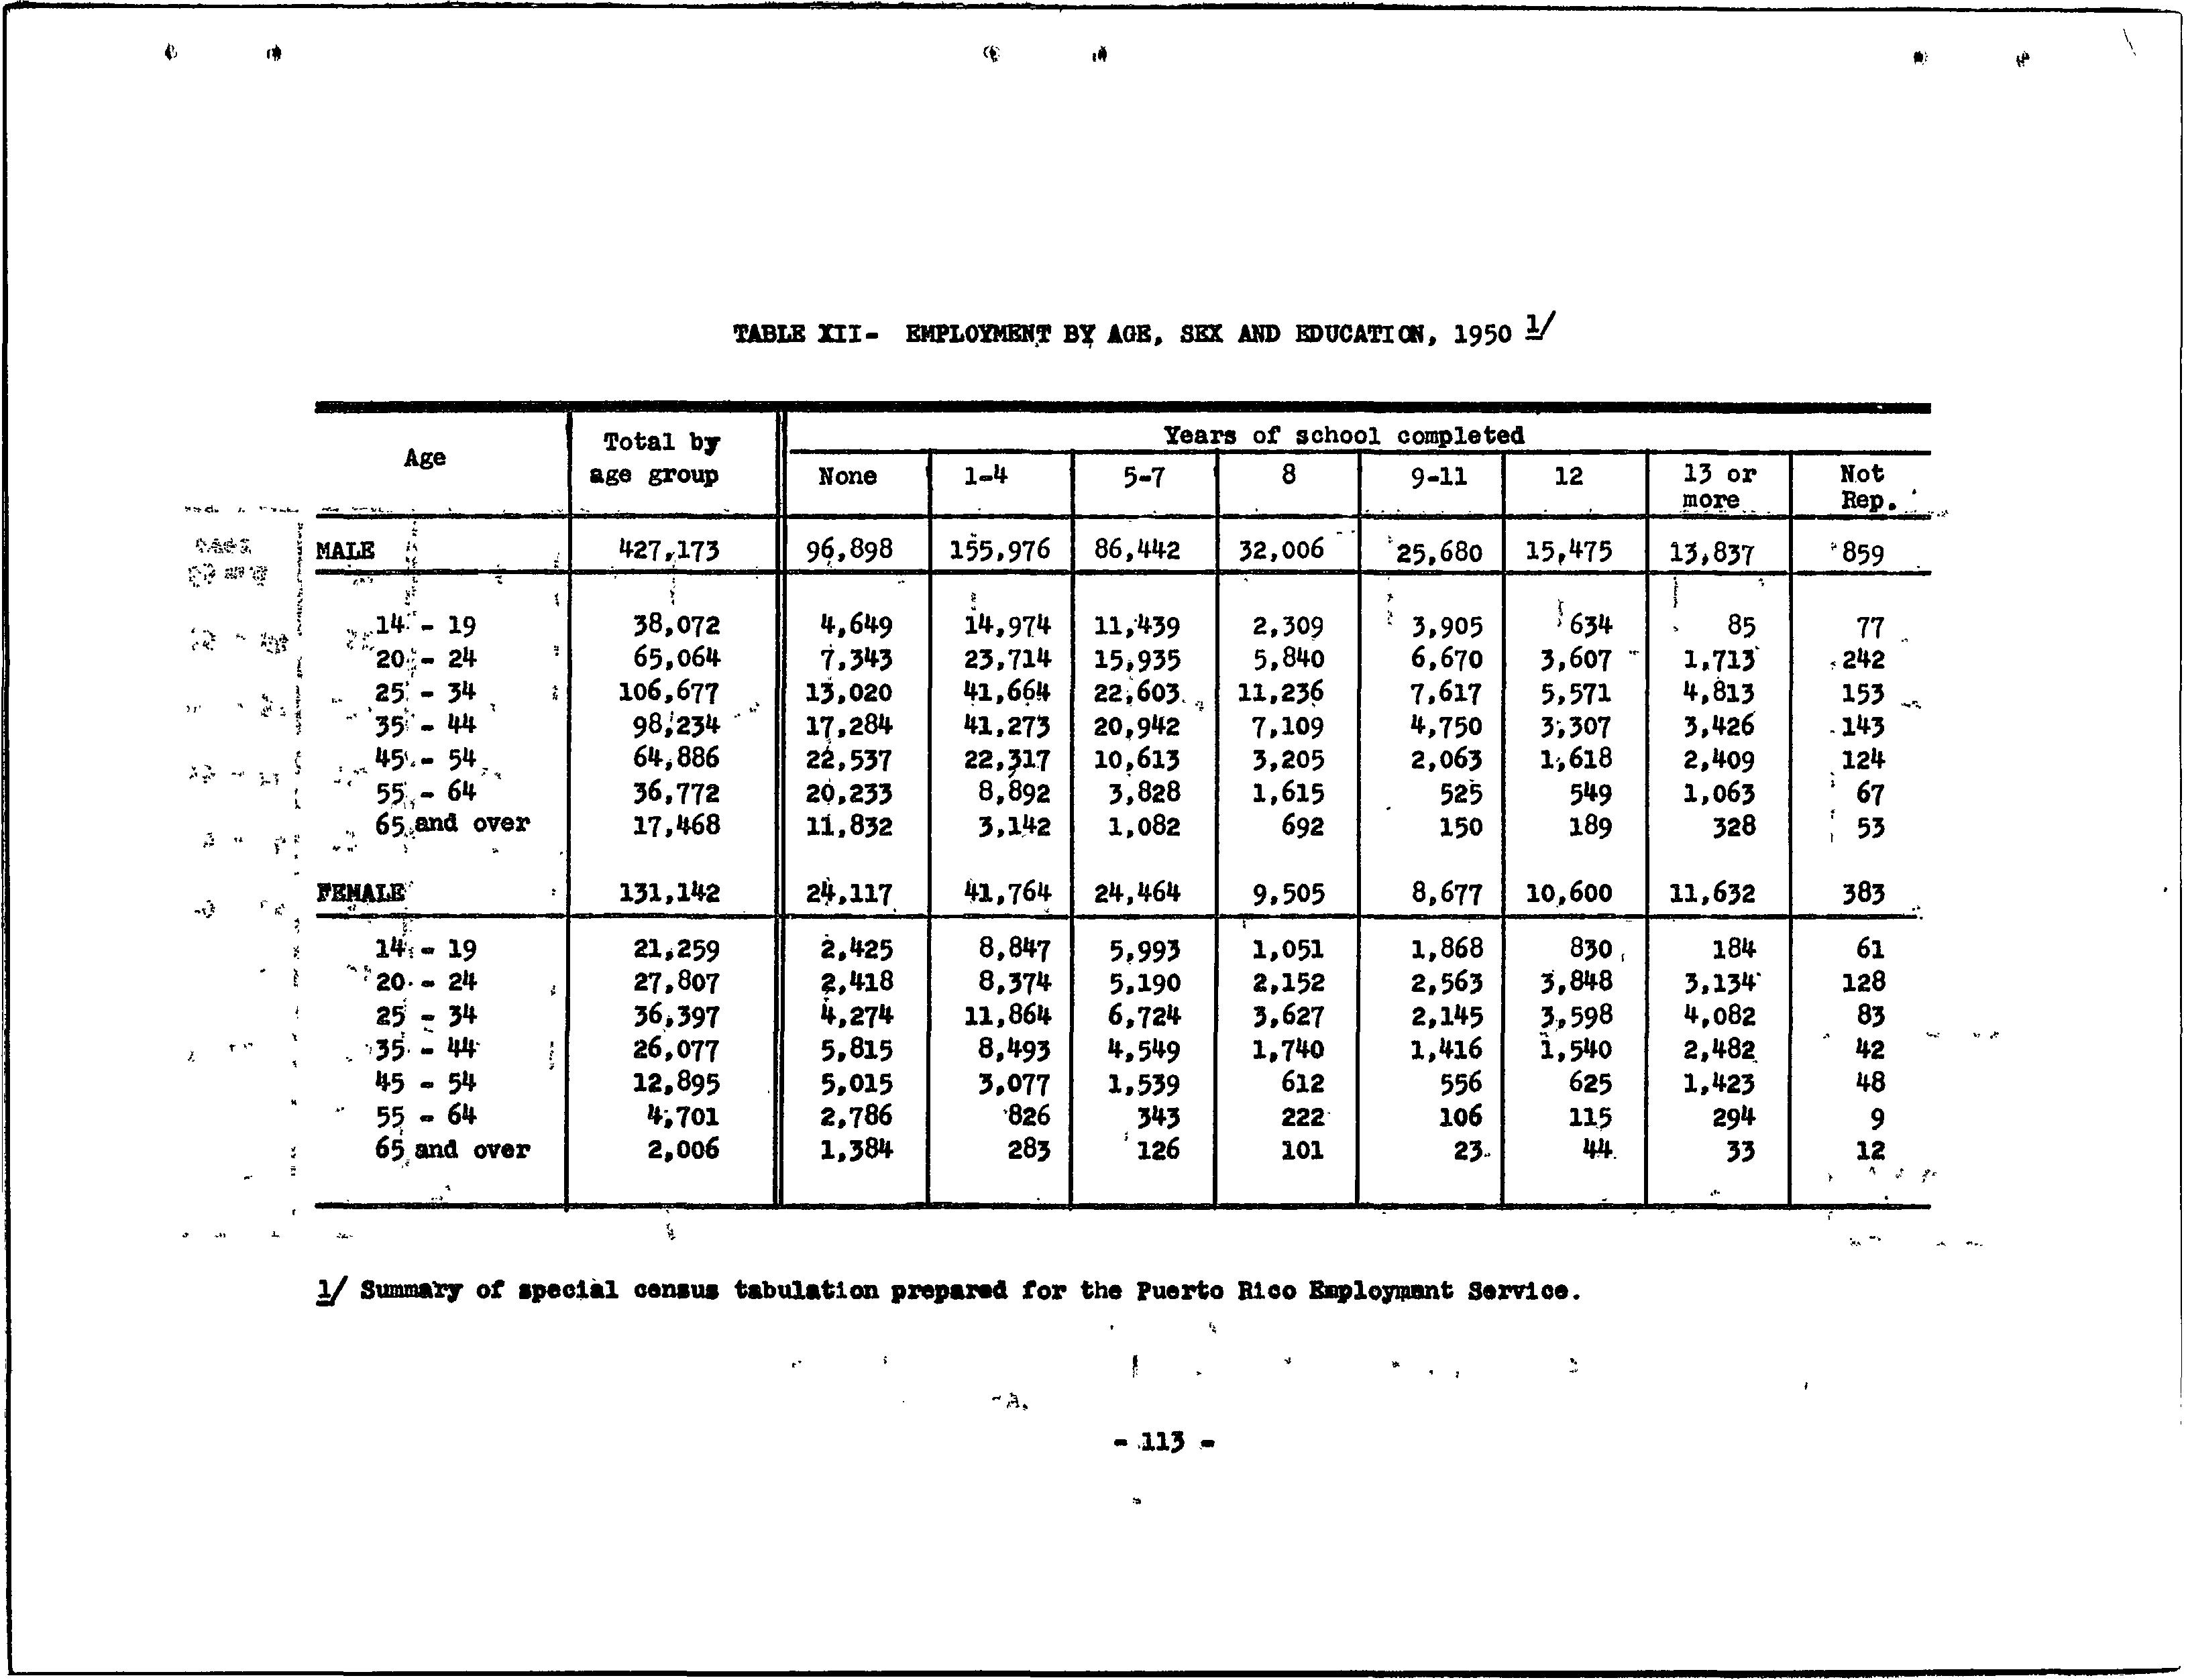
The census of the United States for 1950 provides information on years of school completed for employed persons in every occupation. This information is published only for the United States as a whole but, as a part of this research study, we obtained .comparable inform.ation for .Puerto Rico, 1950. 1/ From this information we could tell how many and what pro.:-
J:J A summary of this data is fncluded in table XII in the appendix.
portions of· the persons· employed in Puerto Ric.o .in each. occupation, in 1950, were· college graduates, .high ·school graduates, elemer.{tary school graduates, etc. Our problem, however, was to estimate the future educational distribution of each occupation.
To solve this problem we returned to the pr.oductivity hypothesis, previously utilized to estimate the occupatiQnal distribution of employm~nt. A new corollary of this hypothesis can be stated as follows: to achieve equivaleIJ.t levels of productivity, two parc!,llel occup~tion groups in two economies,must- have equivalent educational characteri.stics. Again we must admit that this proposition is not proved and can only say that all the available data supports it and that logical anal~ ysis of the .production process supports it.
To achieve similar levels of productivity there must be similar inputs of energy, .machinery, raw materials and hw:nan skill, taken_ all together. Theoretically there could be substitutions of one input factor for another. For example, with ~etter machiner.y and better raw material a: less skilled group of worers could produce as much as a more skilled group working with poorer machinery and raw materials. Practically, it does not work out·that way. Bette,r machinery and raw material a 7e more -expensive and, therefore, to avoid waste and machine damage, a better cl.ass of worker is. employed, Thus quality and complexity of machines and of the production process tend to go hand in hand with better education of the work force. As machines take over the physical aspects of the work, more is demanded of the' worker by way of understanding the machine. As the production process becomes more specialized and more complex, demanding less craft skill from the worker, it demands in return a greater understanding of the total production process and of his place within it.
Some .elaboration of this point may be needed, because the impression is wide spread and in some respects valid, that modern industrial methods. have made jobs simpler and more routine. It is true that jobs have been specialized, sometimes to points of making the worker little more than a robot. Nevertheless even the human "robot" of the modern factory is vastly
different from a peasant or a s·elf taught c-raftment.: .. He may lack, many of the -skills of h1s anc~stors but he requires some which they did not have,. He m.ust for example be able to read and to understand at least the signs which ar,e pos.ted in the faGtor;r- .. He must usually be able to make at least elementary calcula- , tions with numbers. Above all he must under.stand the physical and human environment'in which he wo.rks, well enough to avo~d the 1:1,undred and one ways in which its sm,ooth fun,.ctioning can be disturbed. Because this envi·ron:ment· is being constantly changed by the purposful acts of managers ·and engineers he cannot come by his understanding thru l0ng experi~nce·but must achieve it thru the medium of language. This. ·means that he· mu.st be educa,ted to understand by means of symbols ·-the common physical facts of modern life, ·(mechanical, electrical and chemical) and, also the values, the rationale and the basic structure of modern economic life.
Following this logic· and the existing evidence, we ass·ume that if Puerto' Rican workers are to achieve the' productivity levels achieved in the ·United. States in 1950, these workers must achieve the educational levels reached by their occupational counterparts in the United States -in 1950.
Thus, employ:ment by education level for Puerto .Rico in 1975 has been calculated-by converting esfimates for ea.ch major .occu-
TABLE 4-EDUCATION LEVEL OF CRAFTSMEN
patiori ·g·roup into education level estimates; acc.ording to the .educatfonal .. 4istribution shown by the parallel .o.ccupatiqn g.rqup ~:P. t4e United States, in 1950. For· instanc.e, OUJ.i _p-revious calculat;on ~dicated that a:bout 90,000 craftsmen would be needed in-Pue.rto Rico in' 1975., Table 4 illustrates ho.w this figure was conve·:rted into demand by education level
•• •. :fhe edqca:tional distribution of each ·major cfoc:upation group is given by th;~ census only £or the group as a whole and not by industrial se.c,t9~. Some of the refinement which data on occupation by indu;t:i;-y would have introduced into our estimates is p:tes.~;rvE:d· QY .our :qi'ethod of estimating education requirements separat~fr Jar each age and sex group, as described in the next sections of the report. lnsofar, for exa1nple, as tne ·apparel ·' industry hires more women £or manufacturing operations than the metal manufacturing industry ,the differences in education of factory dper.atives in these two in,dustries are _reflected in, our estimates of education needs for Puerto Rico.
TABLE 5-E·MPLOYMENT BY OCCUPATIONAL GROUP AND EDUC~TION, 1975 (in thousands)
Table 5 shows how each educatibn level is ,distributed among. the major occupation groups.· This tab1e re'veal'.S- exten:si ve substi~.tutidn of experience for educa.tio·ru, even in the pr·ofessiori.al· class • and others which are popularly assume·d to li'ave 11 rigiid ·education requi.rements. This amount of substitution actually did occur in. the United States in 1950. ;With increasing emphasfs on education requirements for each occupation clasi;;, itJ~-~ely :that. there will be less substitution of experience for education.~ ·Puer.to Rico in 19-75 than the estimates indicate. On ·the other hand, there will probably also be less education~! waste, as represente·d by college graduates performing common labo:i,-.. Such wast~ cannot be whoily eliminated but it may have been high~r than necessary in the United States in 1950, as a residual effect of the depres,sfon of tp.e 19~0 1 s.
7. Estimates of Employ·ment by Age and Sex
.An important differen~.e e_xists between the previously dis_ ~ussed estimates of employment by occupation and education and our estimates of employment by age and sex characteristics. Qccupation and education are primary aspects of employment. Where a clerk is needed a laborer will not do nor will a person who does not possess the minimum education necessary to perform clerical duties. Certain pat~erns of occupations will have to exist in Puer.to R,.ico an.d certain distributions of education levels within each occupation will have ,to exist, if the predicted output and productivity levels are to be achieved. Whether these output and productivity levels will be achieved and how correctly we have estimated the patterns of occupation and education necessary to achieve them may, of course, ·be questioned. The existence of necessary relationship's between output and productivity, on the one hand, and employment by occupation and education on the other, cannot seriously be questioned.
The matter is altogether different as rega3ids age and sex qualifications for employment. Within most occupations there can be wide substitution• with respect to these characteris_tics. This is very fortunate since oth~rwise our output and productivity _goals could not be met. For the Pmrrto Rican labor
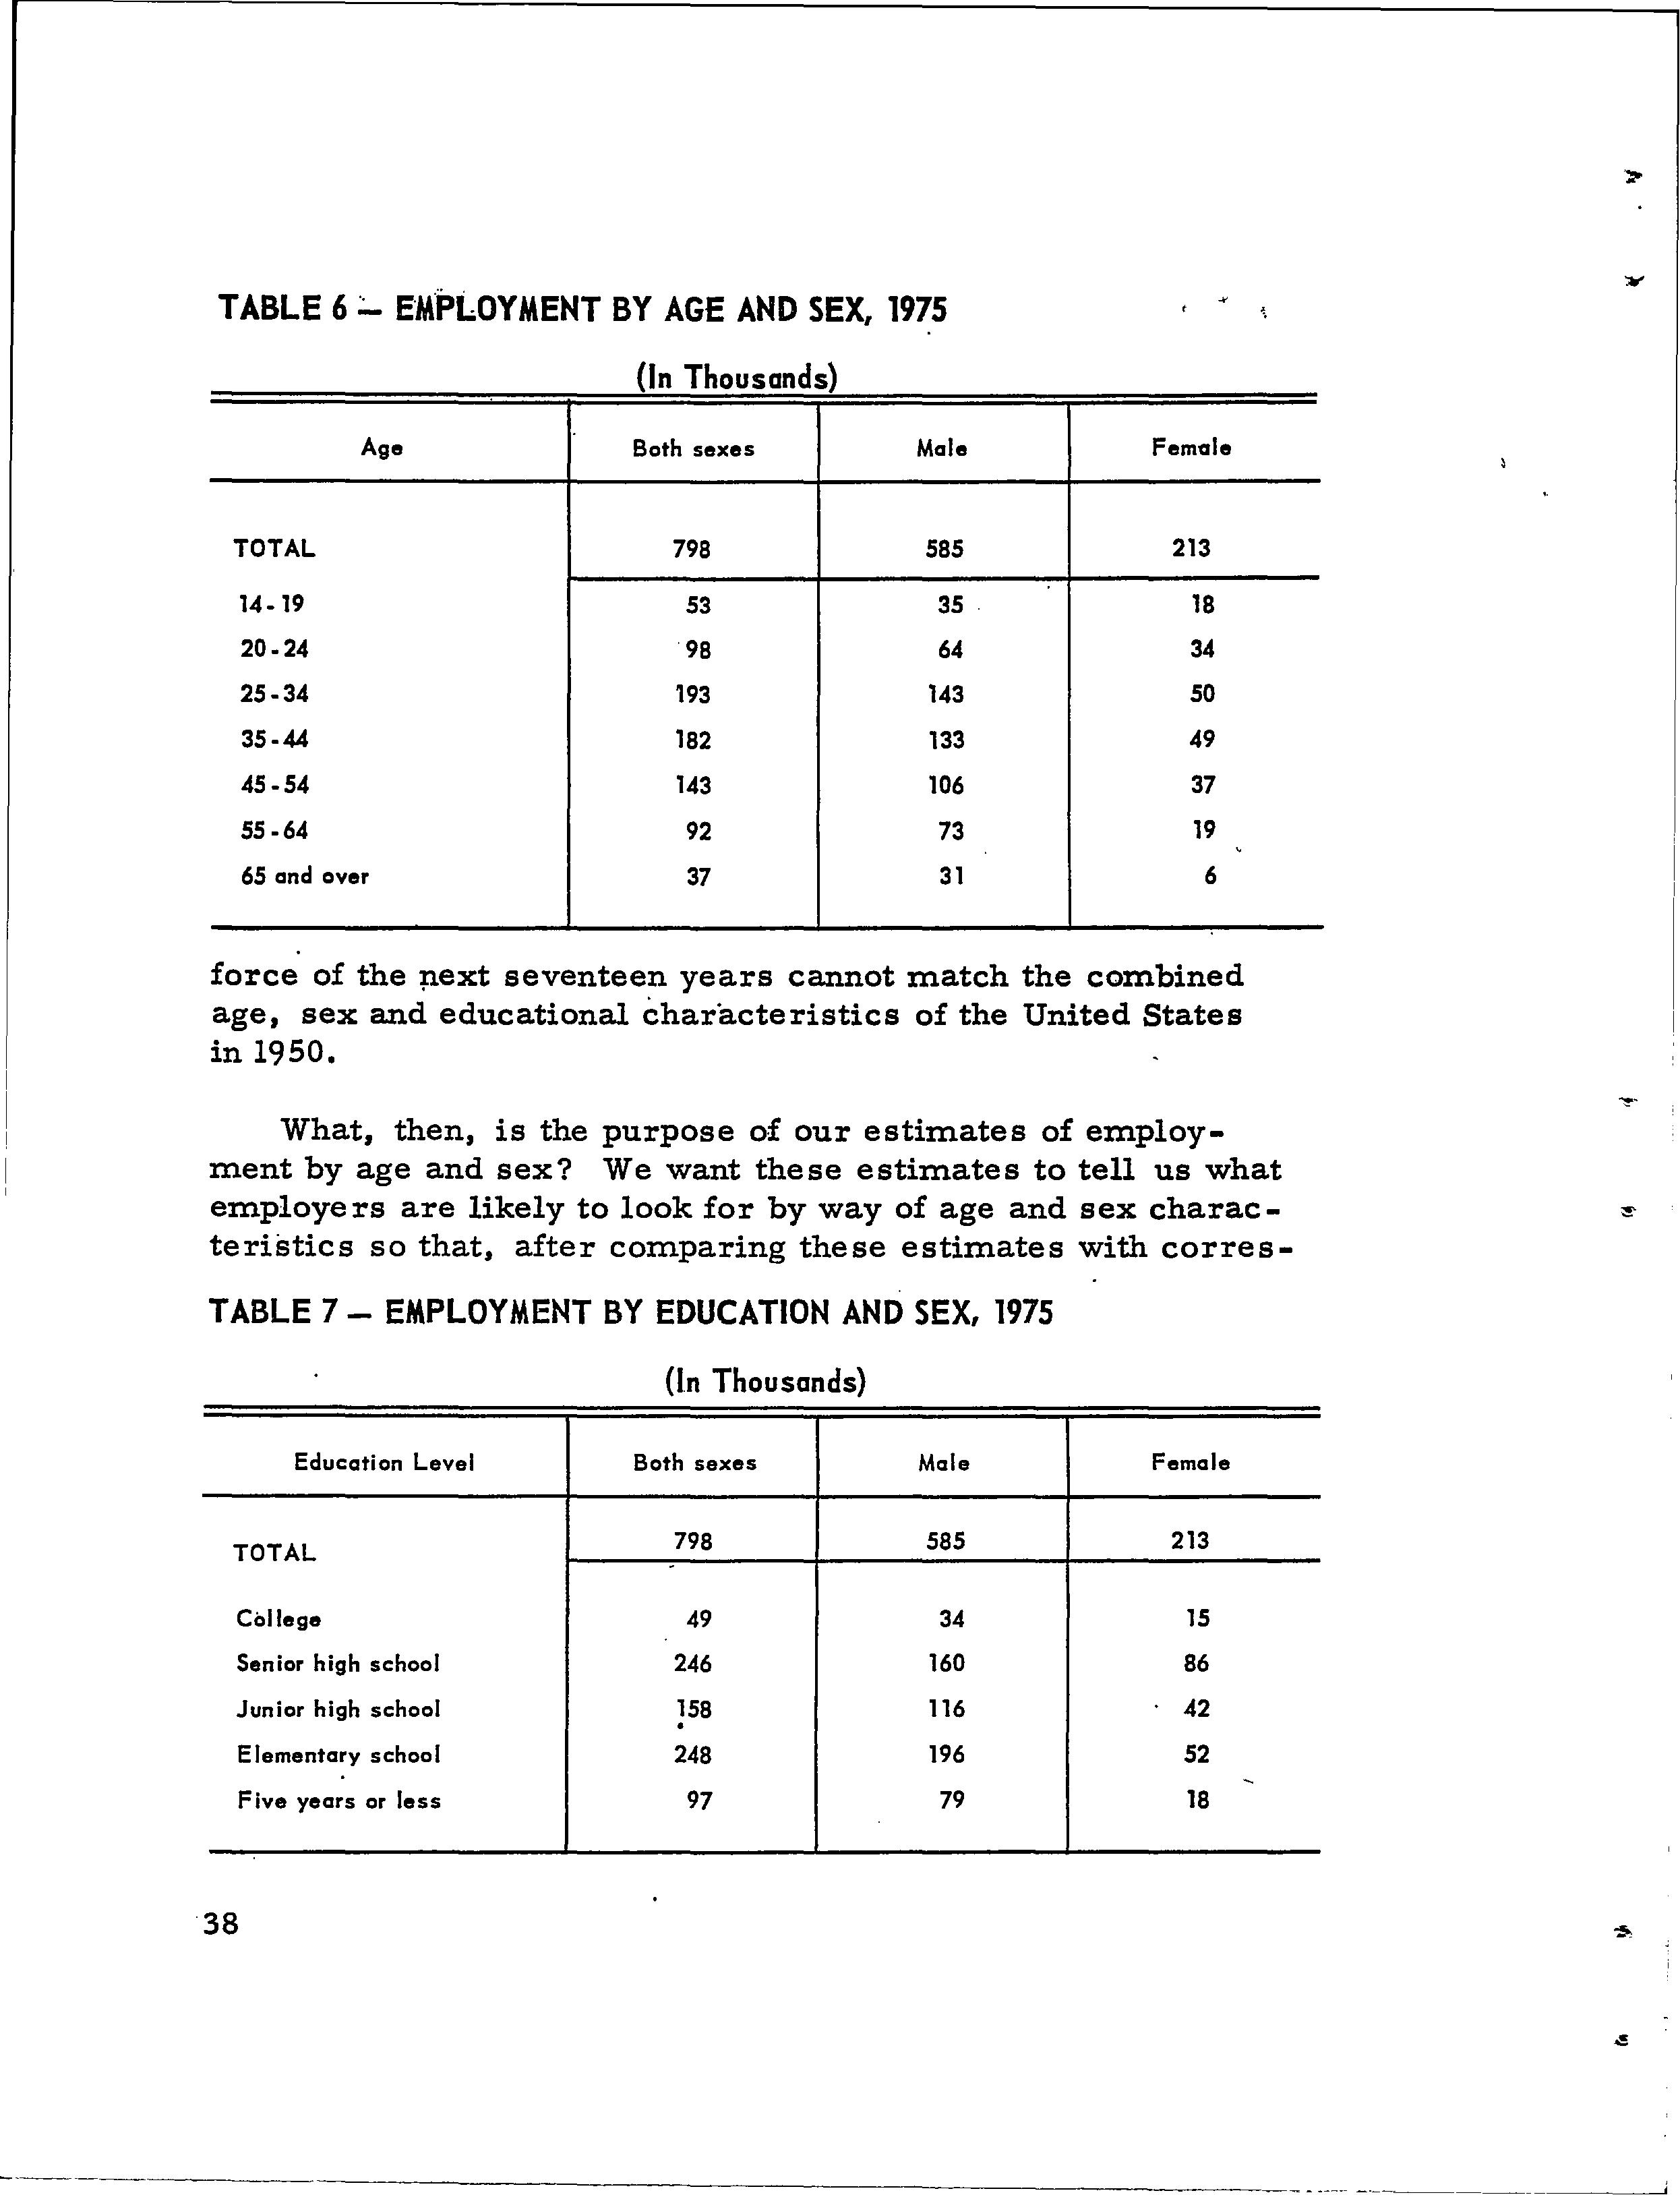
TABLE
6
;;_ E·MPLOYMENT BY AGE AND SEX, 1975
'
force of the :µ.ext seventeen years cannot match the combined age, sex and educational characteristics of the United States in 1950.
What, then, is the purpose of our estimates of employment by age and sex? We want these estimates to tell us what employers are likely to look for by way of age and sex characteristics so that, after comparing these estimates with corres-
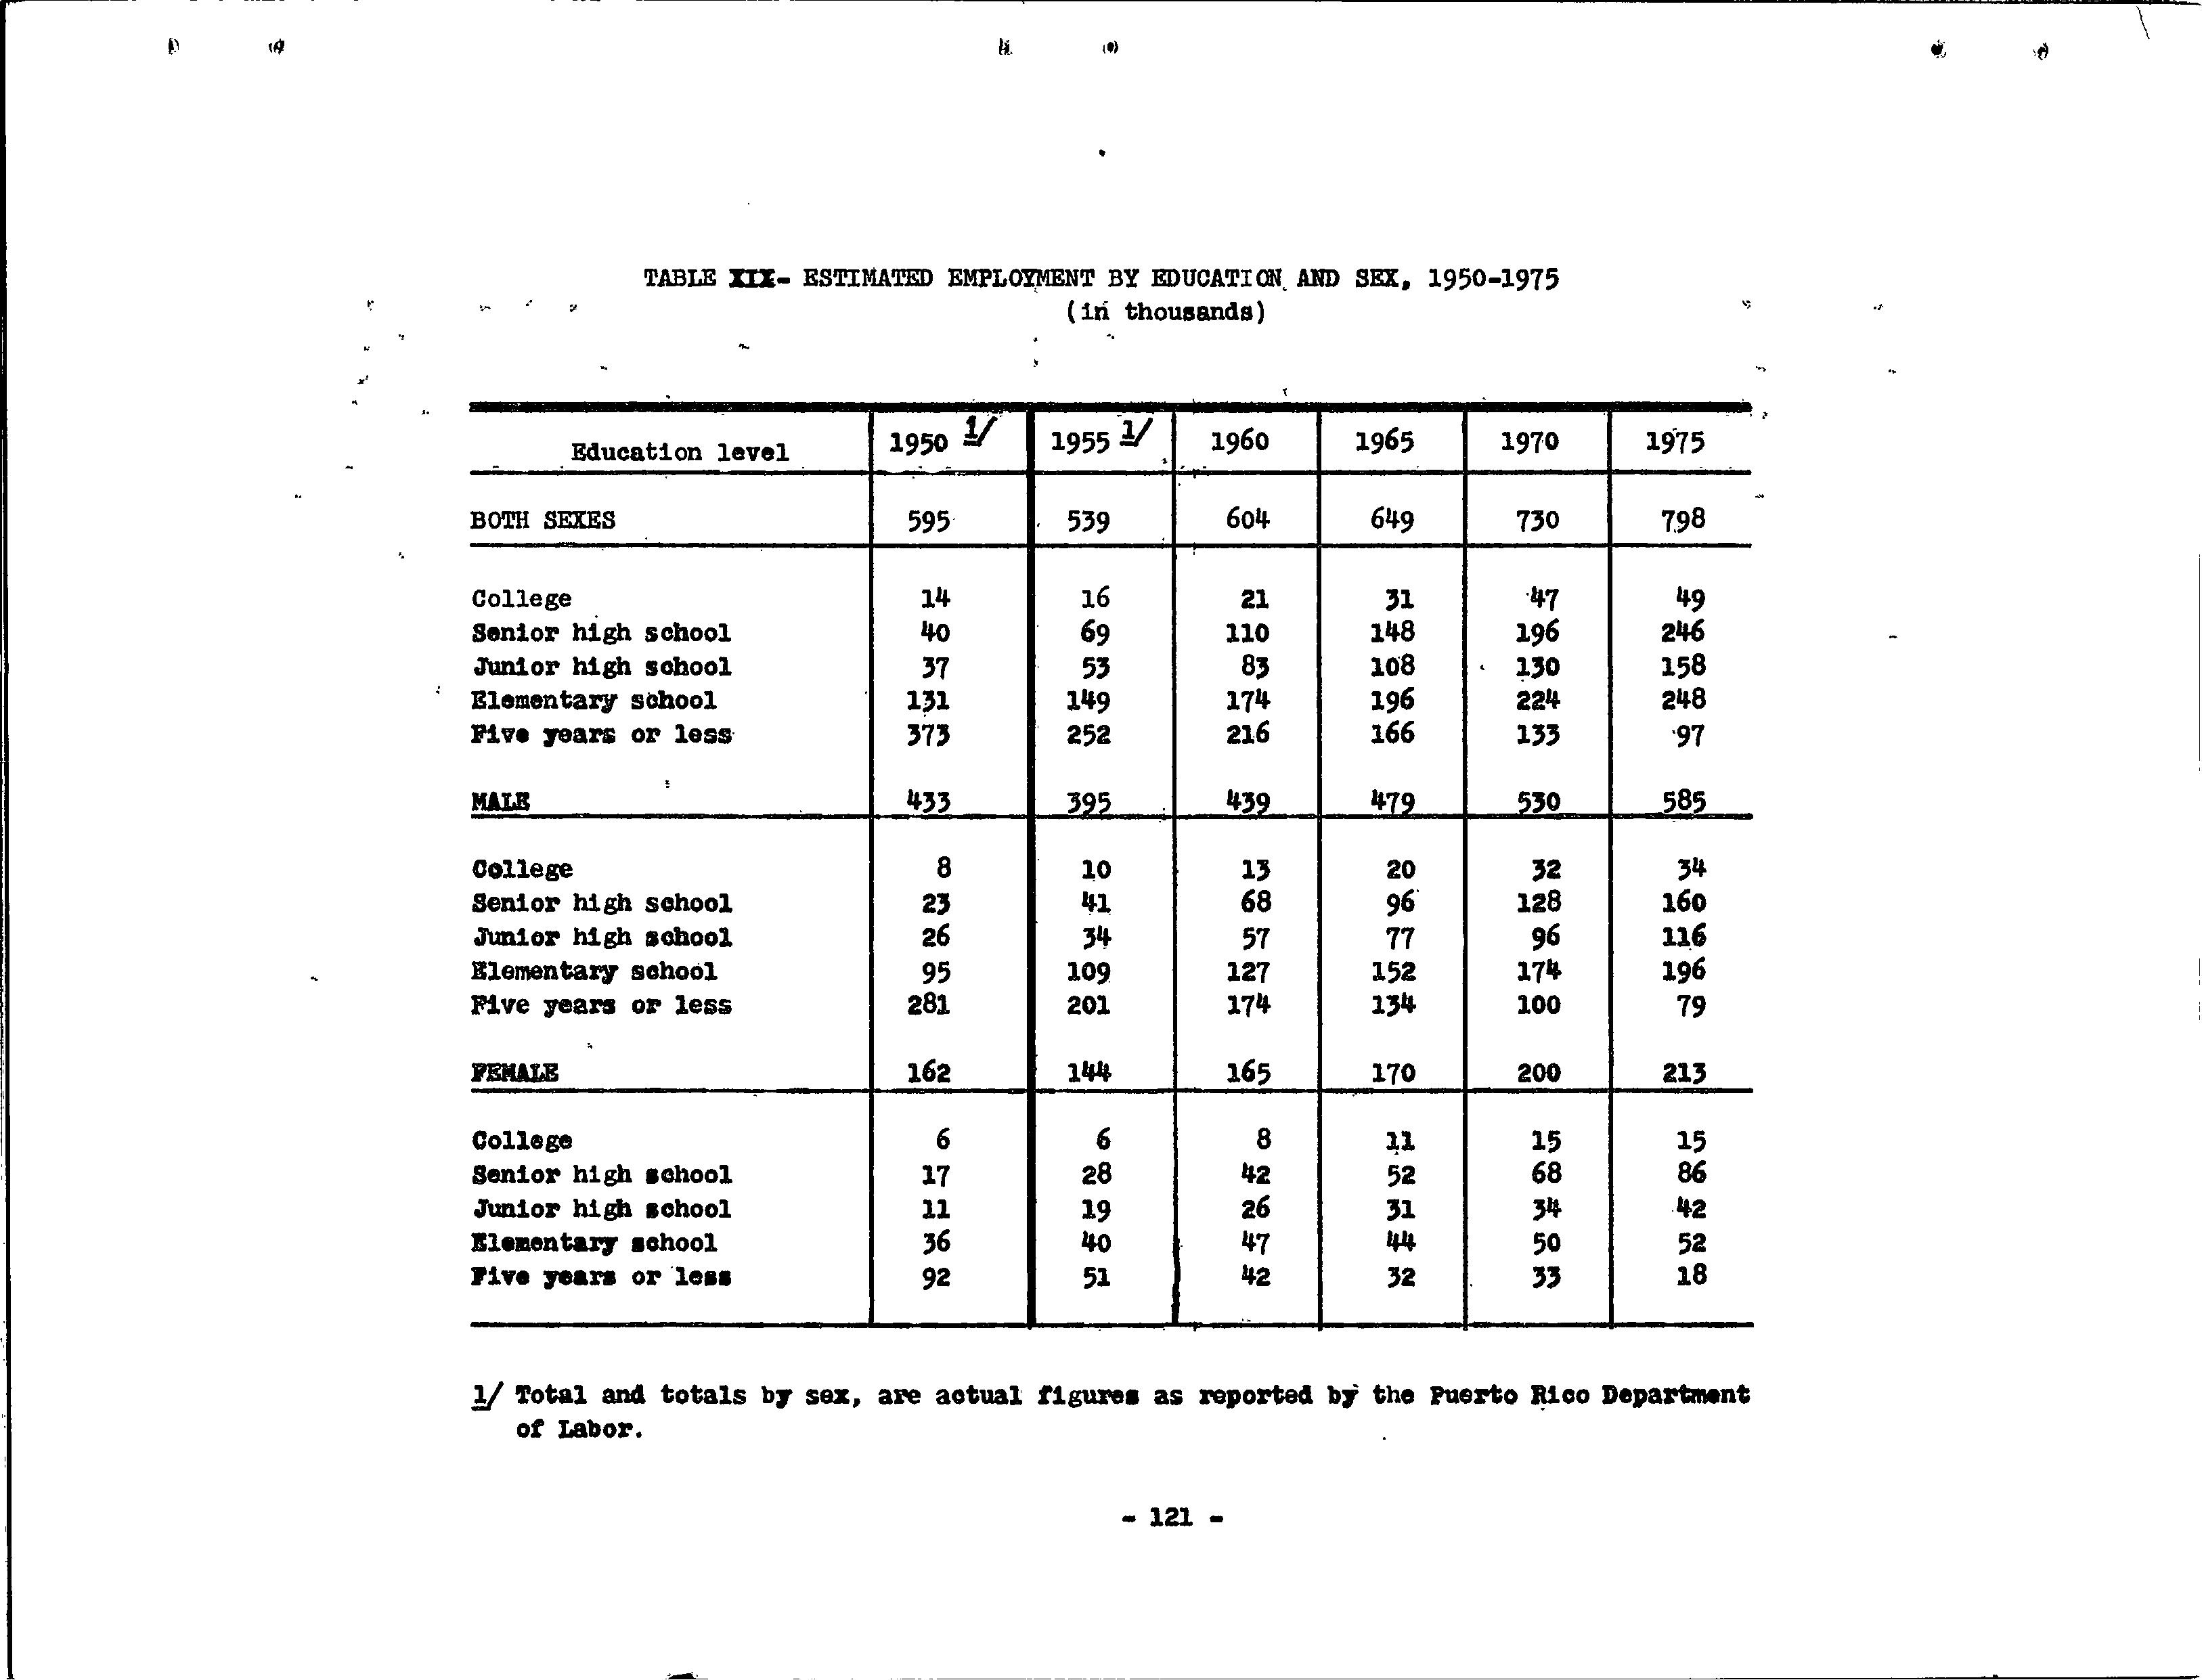
TABLE 7 - EMPLOYMENT BY EDUCATION AND SEX, 1975
ponding e.stimates of labor supply we can tell how much modification of the ideal age and sex requirements of employers will have to occur. One of the critical tasks of the Puerto Rico Employment Service during th~ next decades will be to determine iII; which occupations and in which secto.rs of the economy modifi,cations o~ traditional age and sex requirements can most easily and most successfully be made.
TABLE 8 - EMPLOYMENT BY OCCUPATIONAL GROUP AND SEX, 1975
(In Thousands)
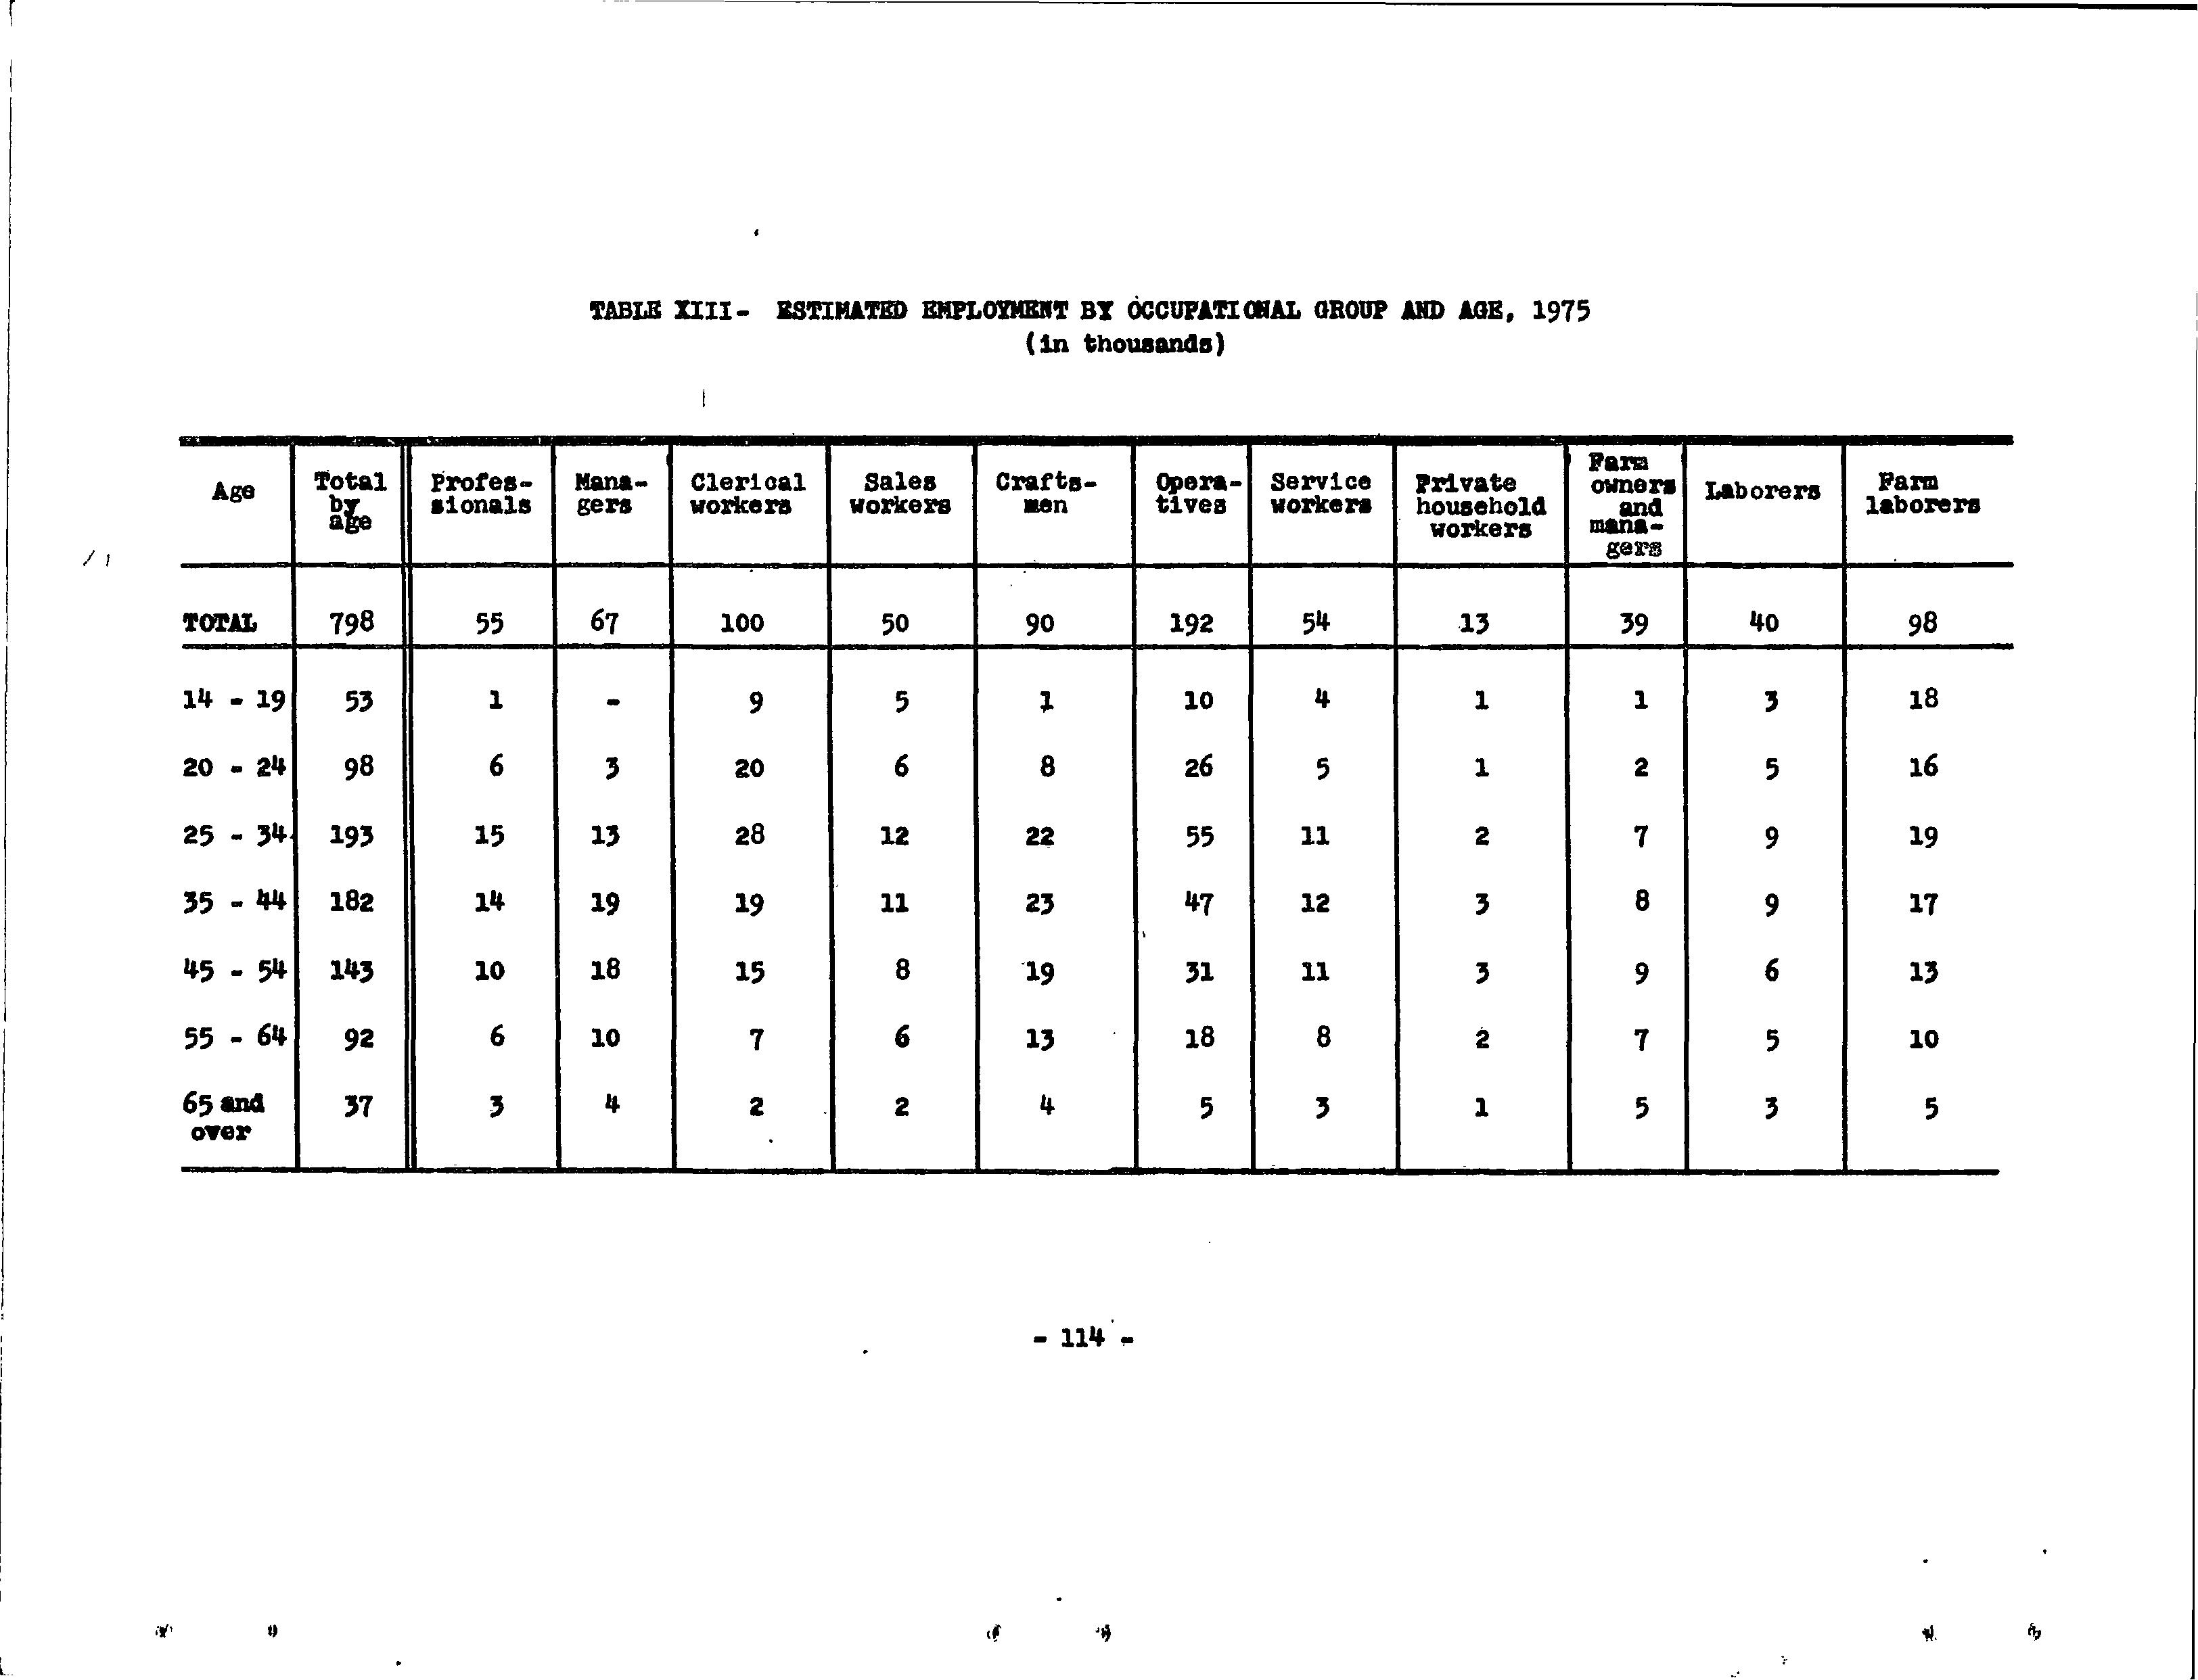
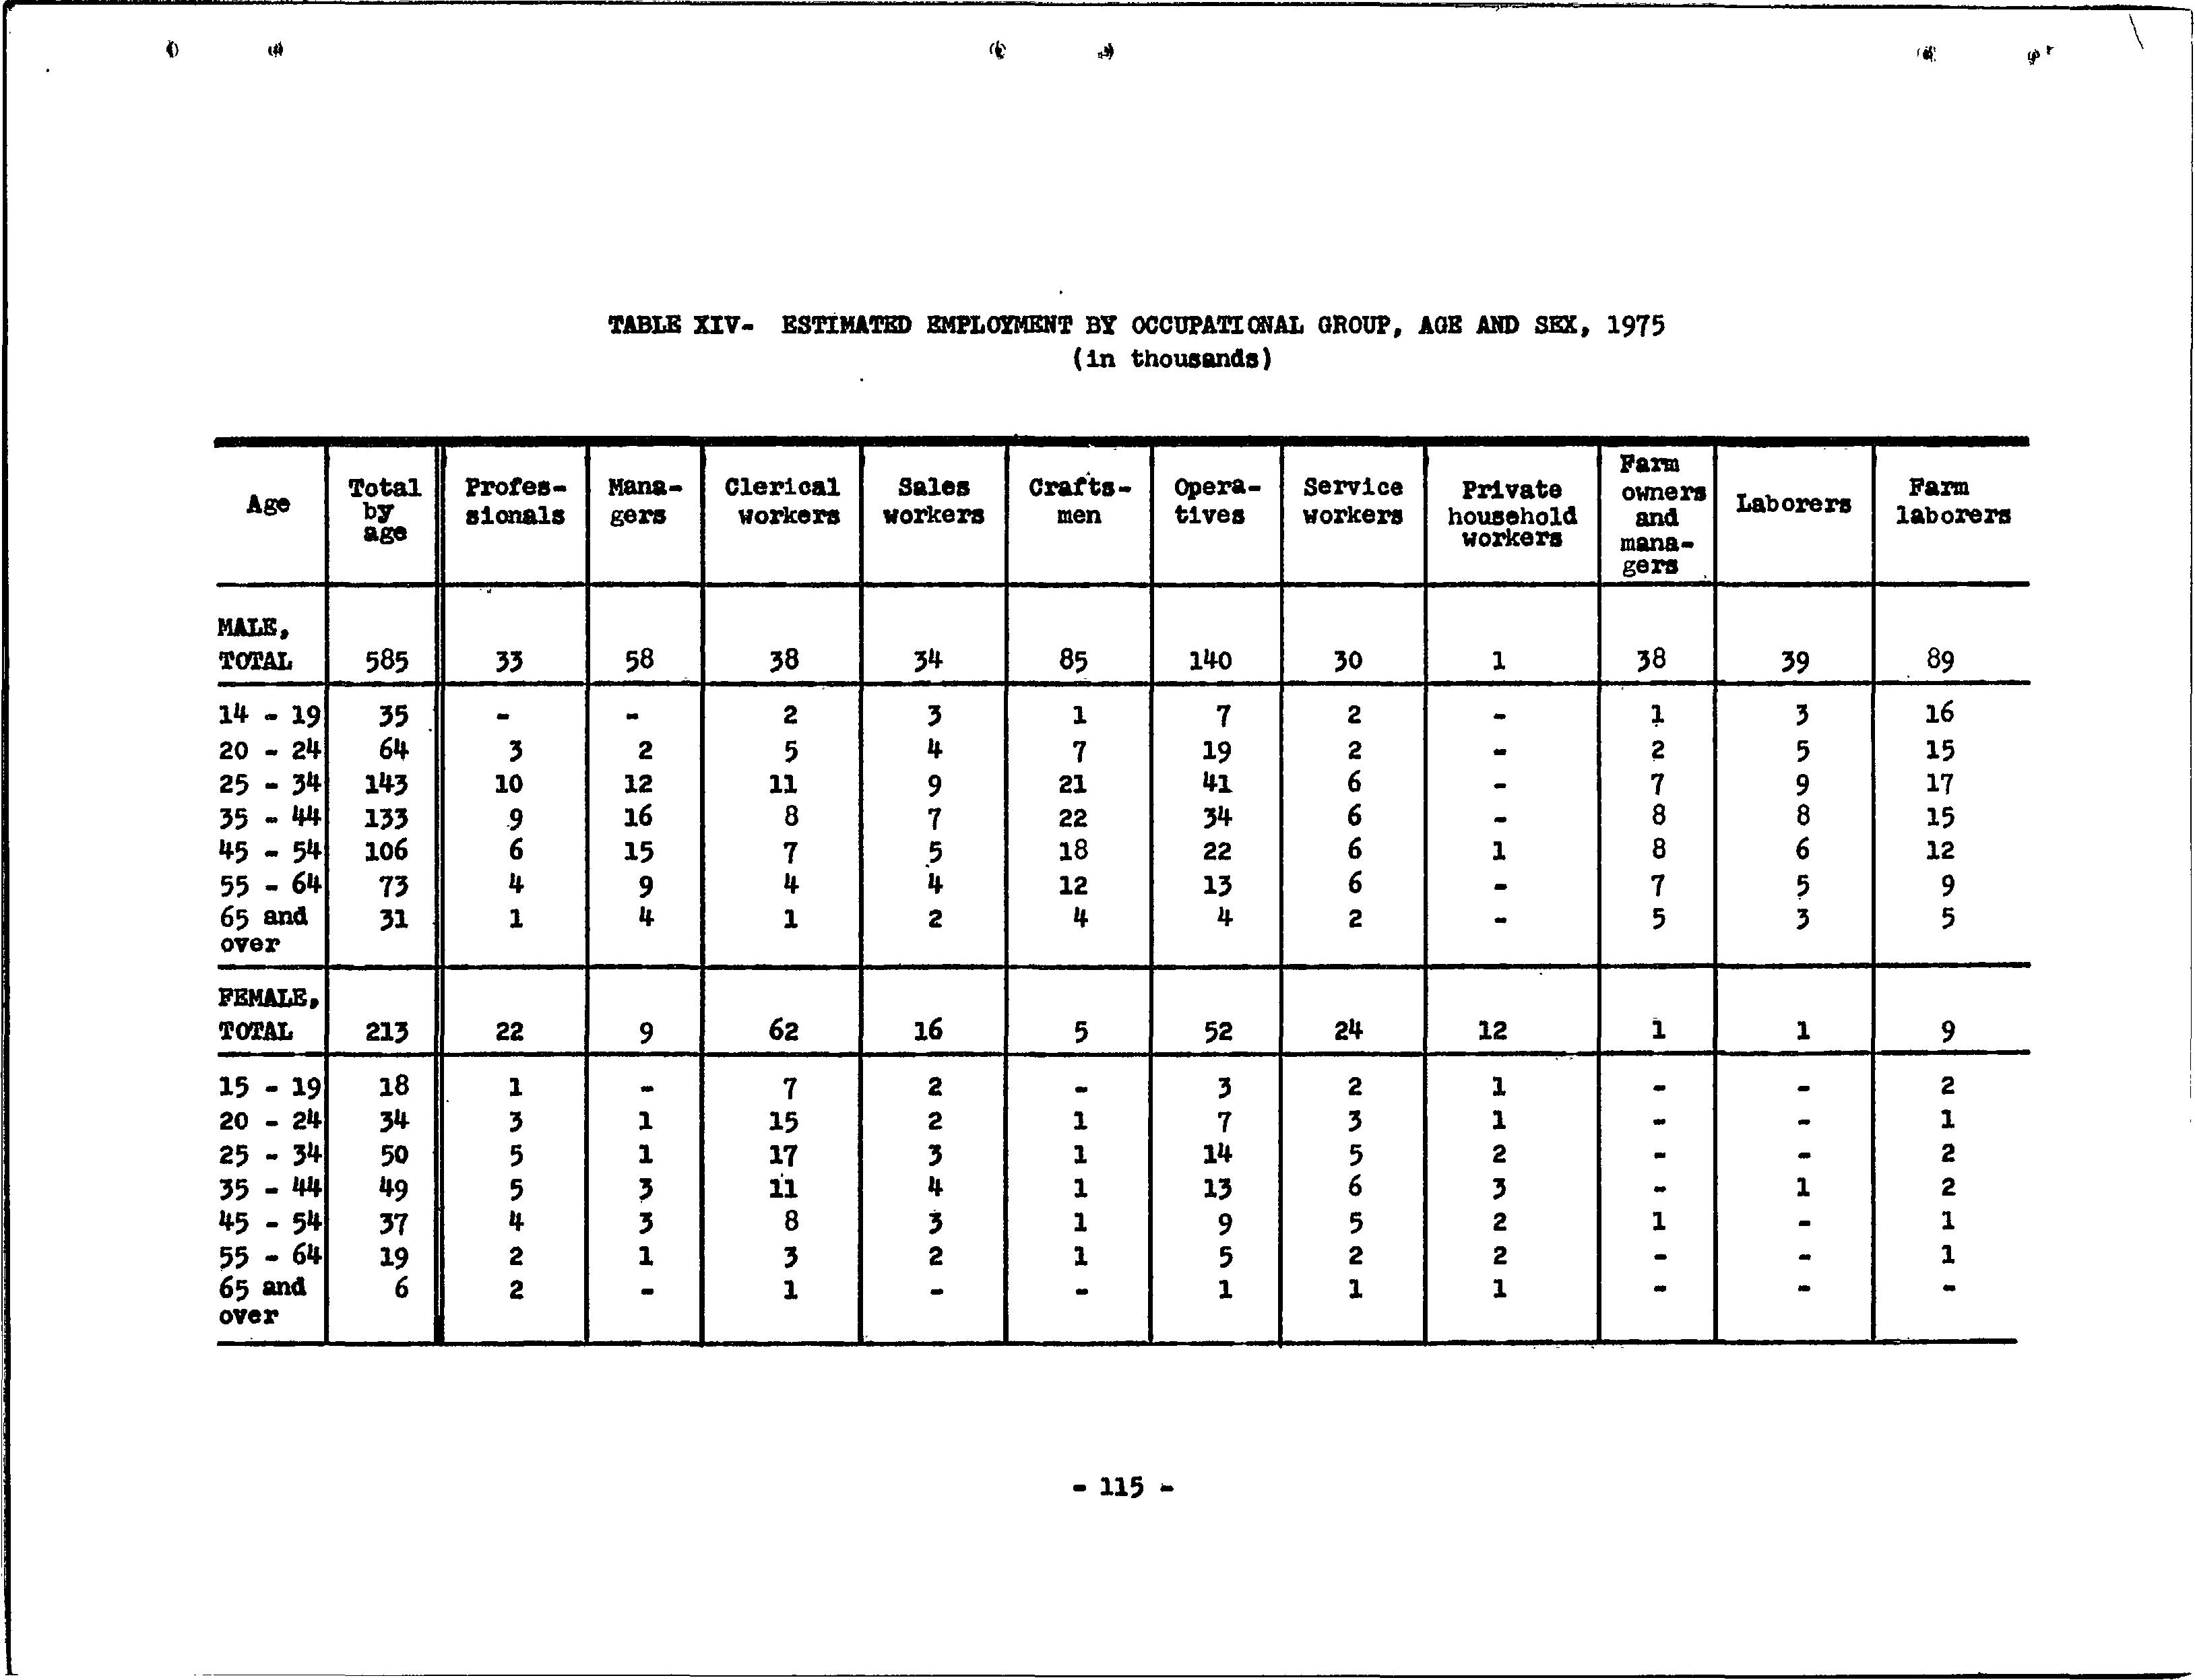
With the above purpose in mind we have based our estimates of. employnient by age and sex in 1975 on the age and sex distributions of-each mi:!.jor occ-q.pation group, as l:!hown,, .._" in the 1950 census foI" tp.e United States. as a whole. We do • not expect this e;mploynient pattern to be duplicated in Puerto Rico in 1975. It cannot be and it need not be. In some occupations, however, and i:,;_i some economic sectors, traditipnal age and sex requirements .are µiore valid o~ more stubborn than in others. In such a.re.as the estimates presented by~ag.e and sex in tables 6., 7 and 8 will be borne out. Table XIII
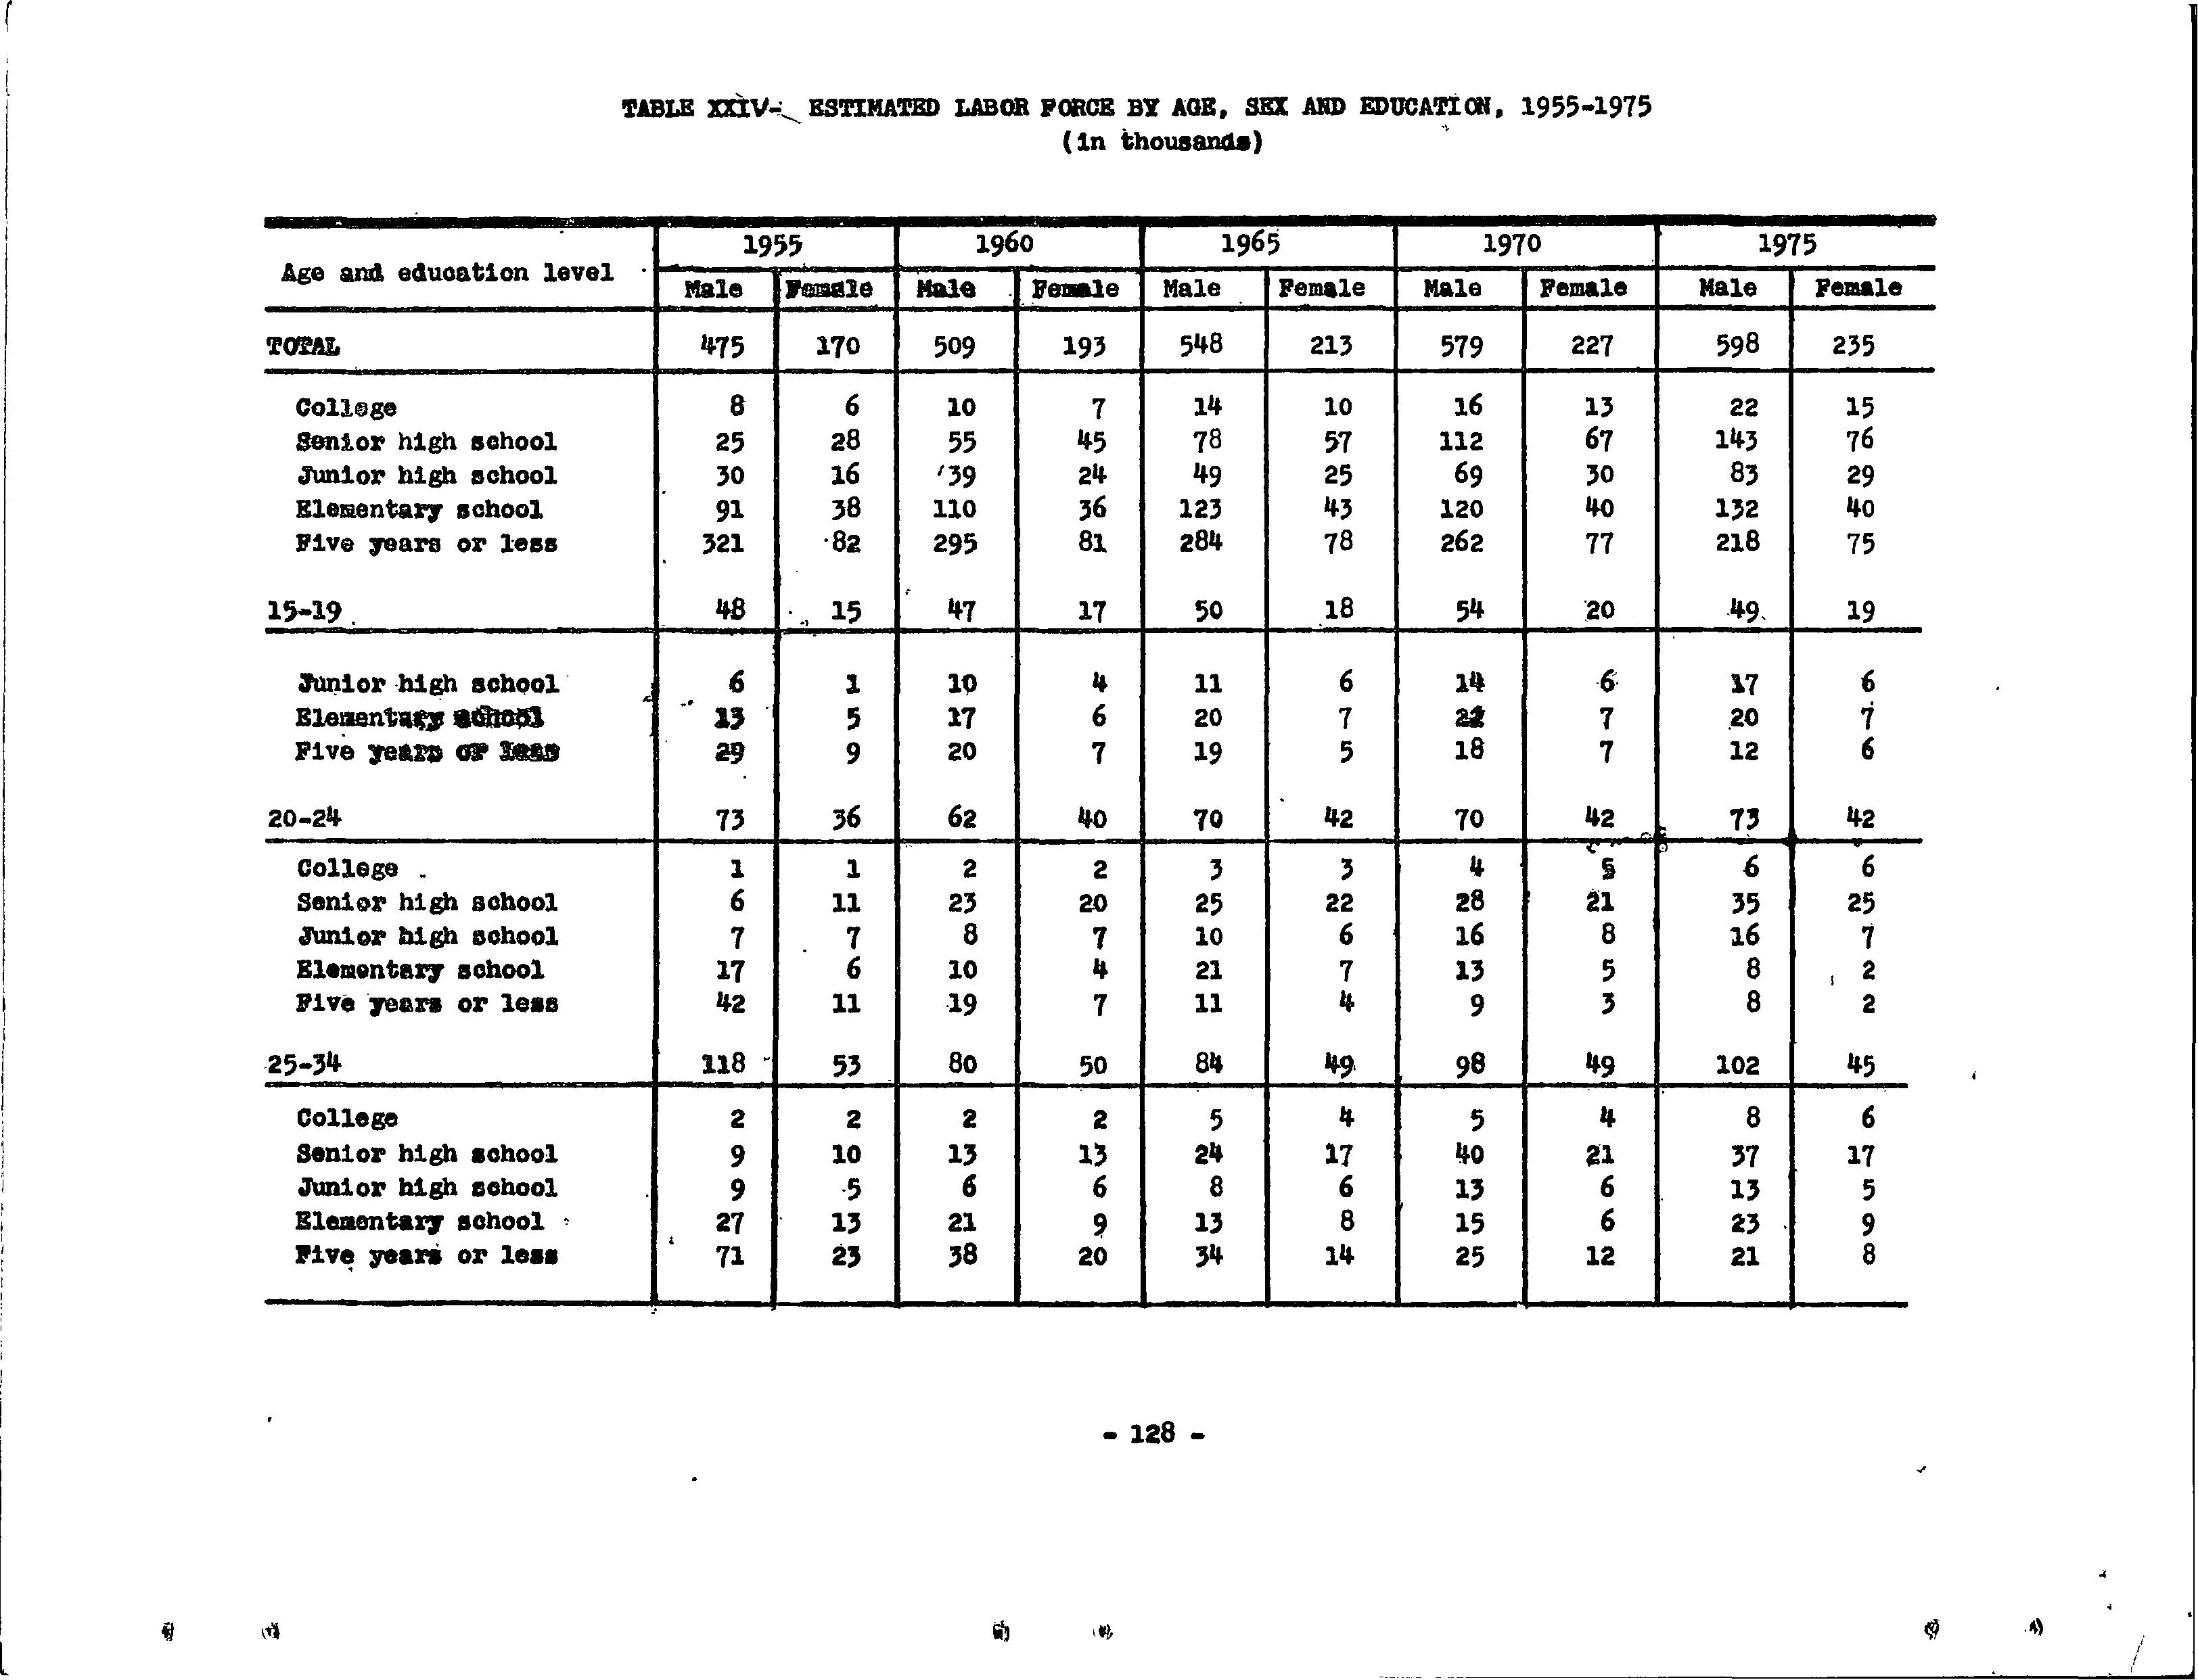
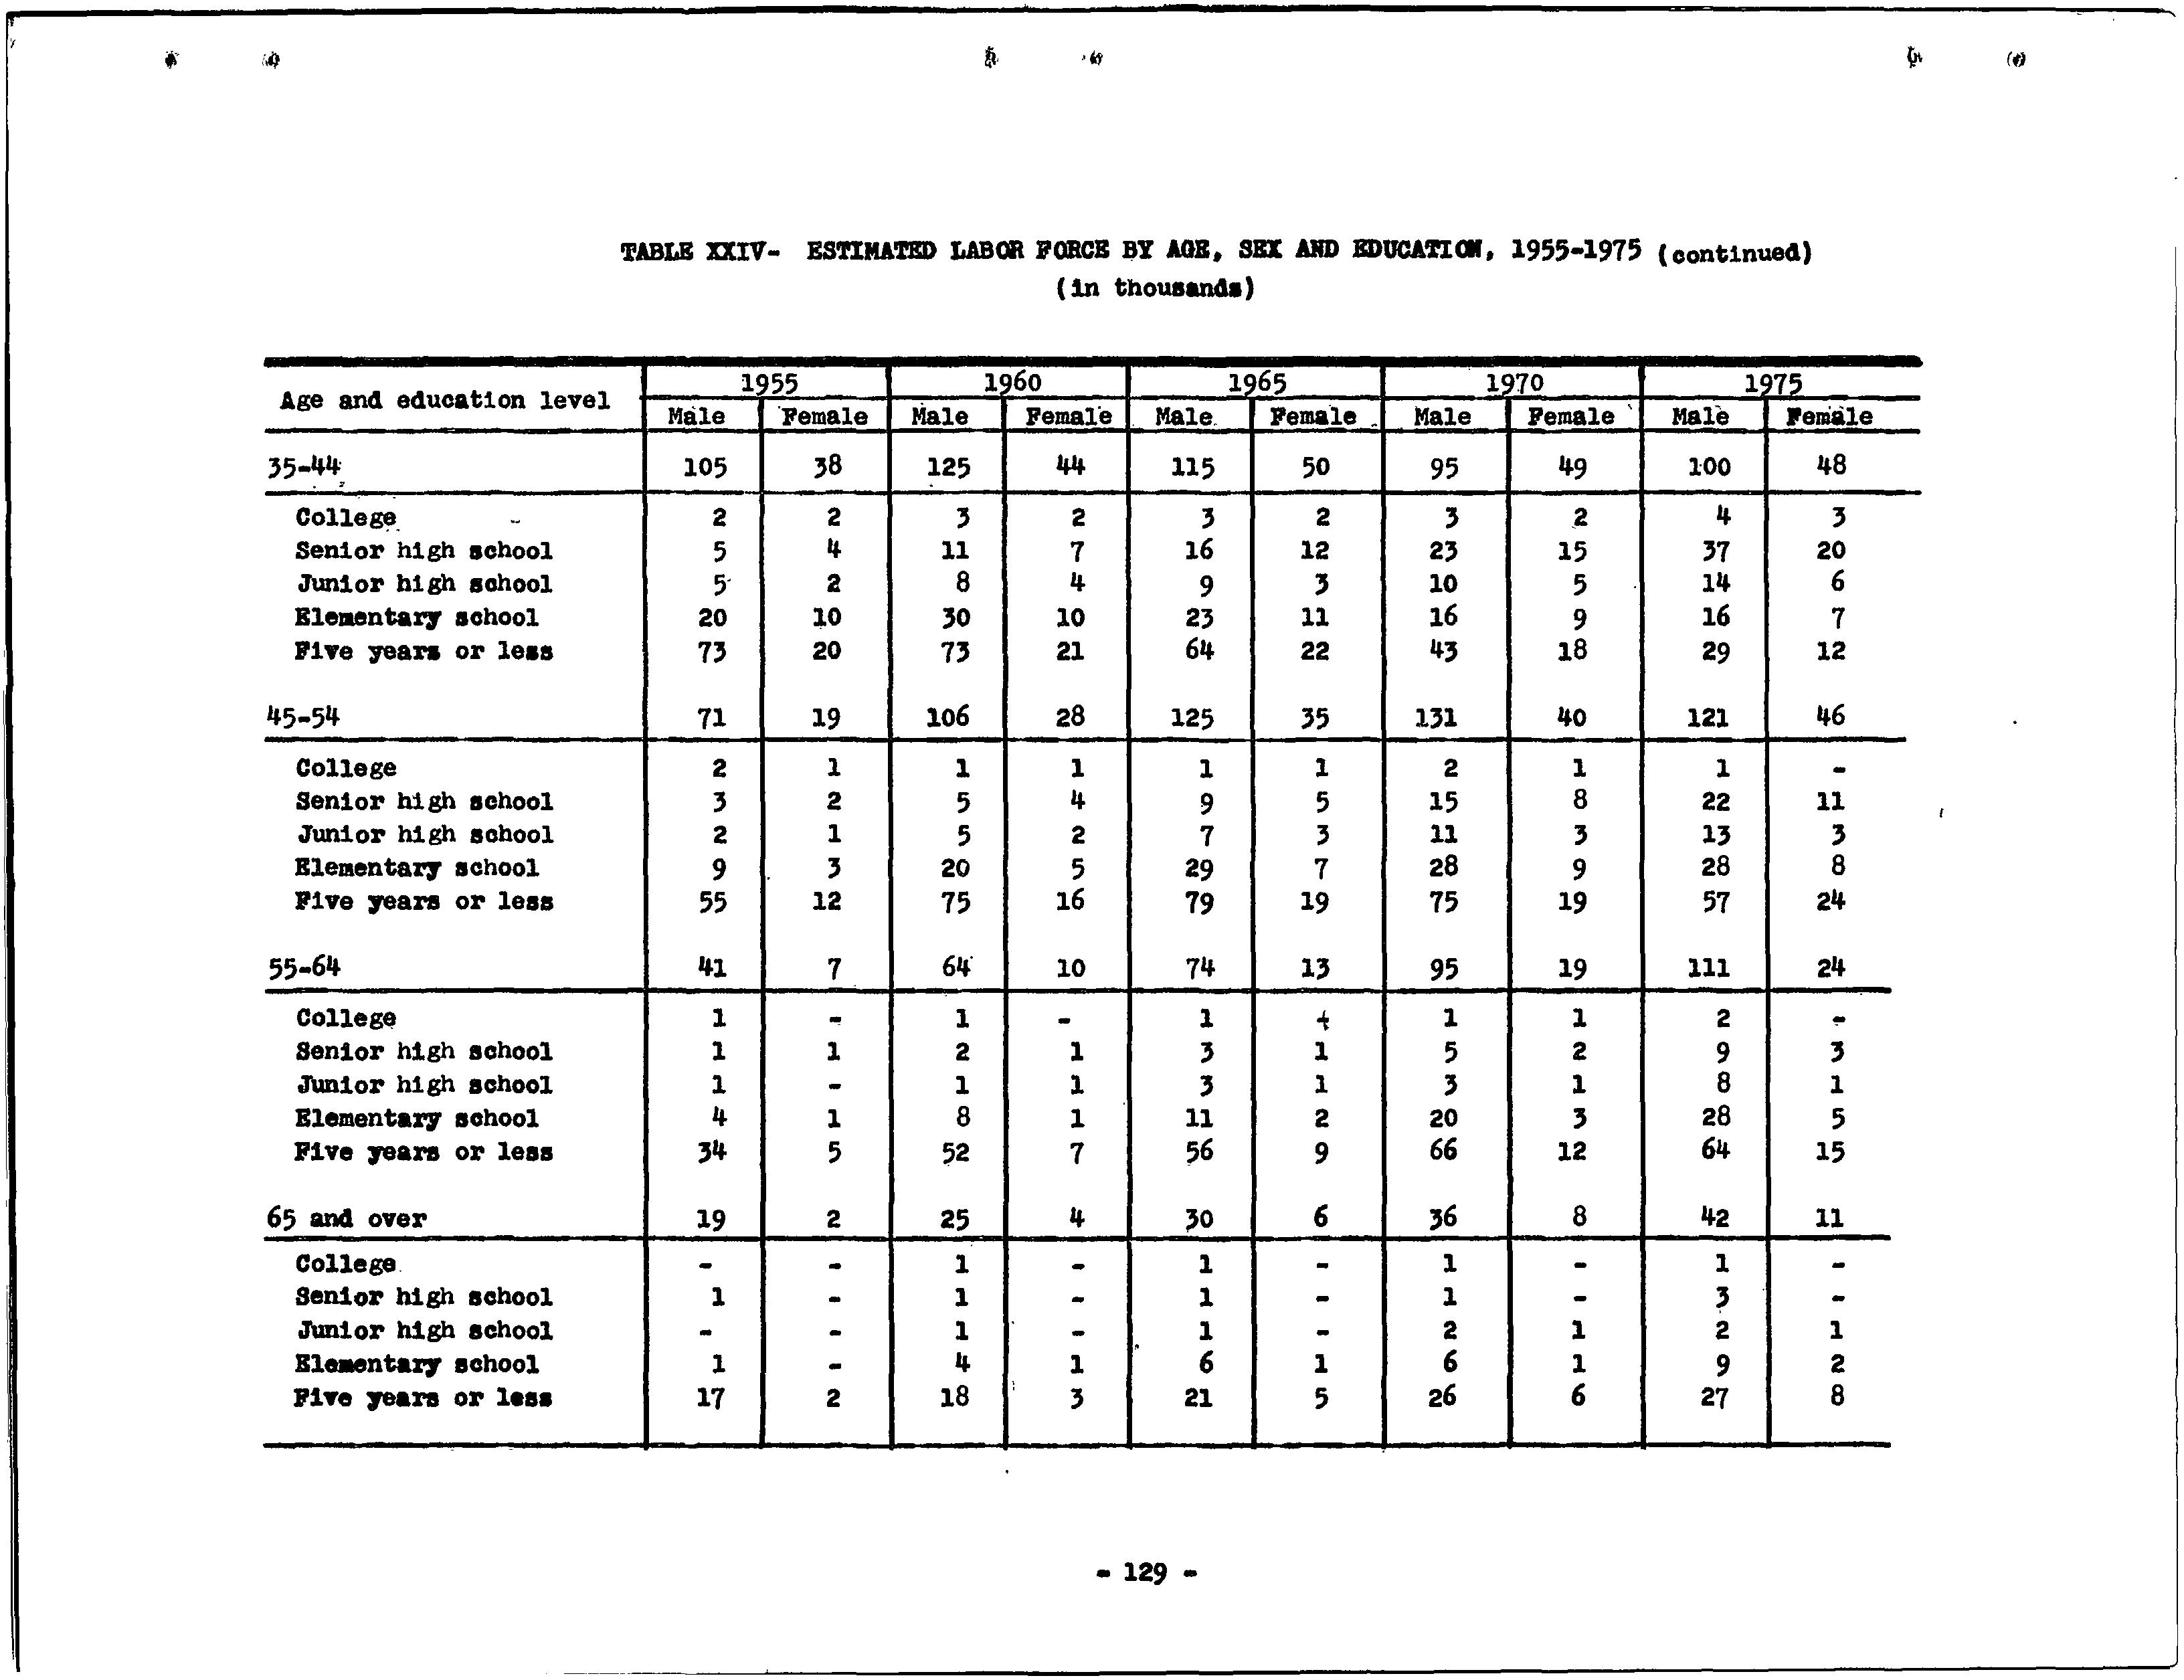
and table· XIV in the appendix show the estimated employmer:1J' 1 --_,- ,·. in 1975 for· each .major occupation group, by age and sex: •.... >i"·.i ·:,, •·
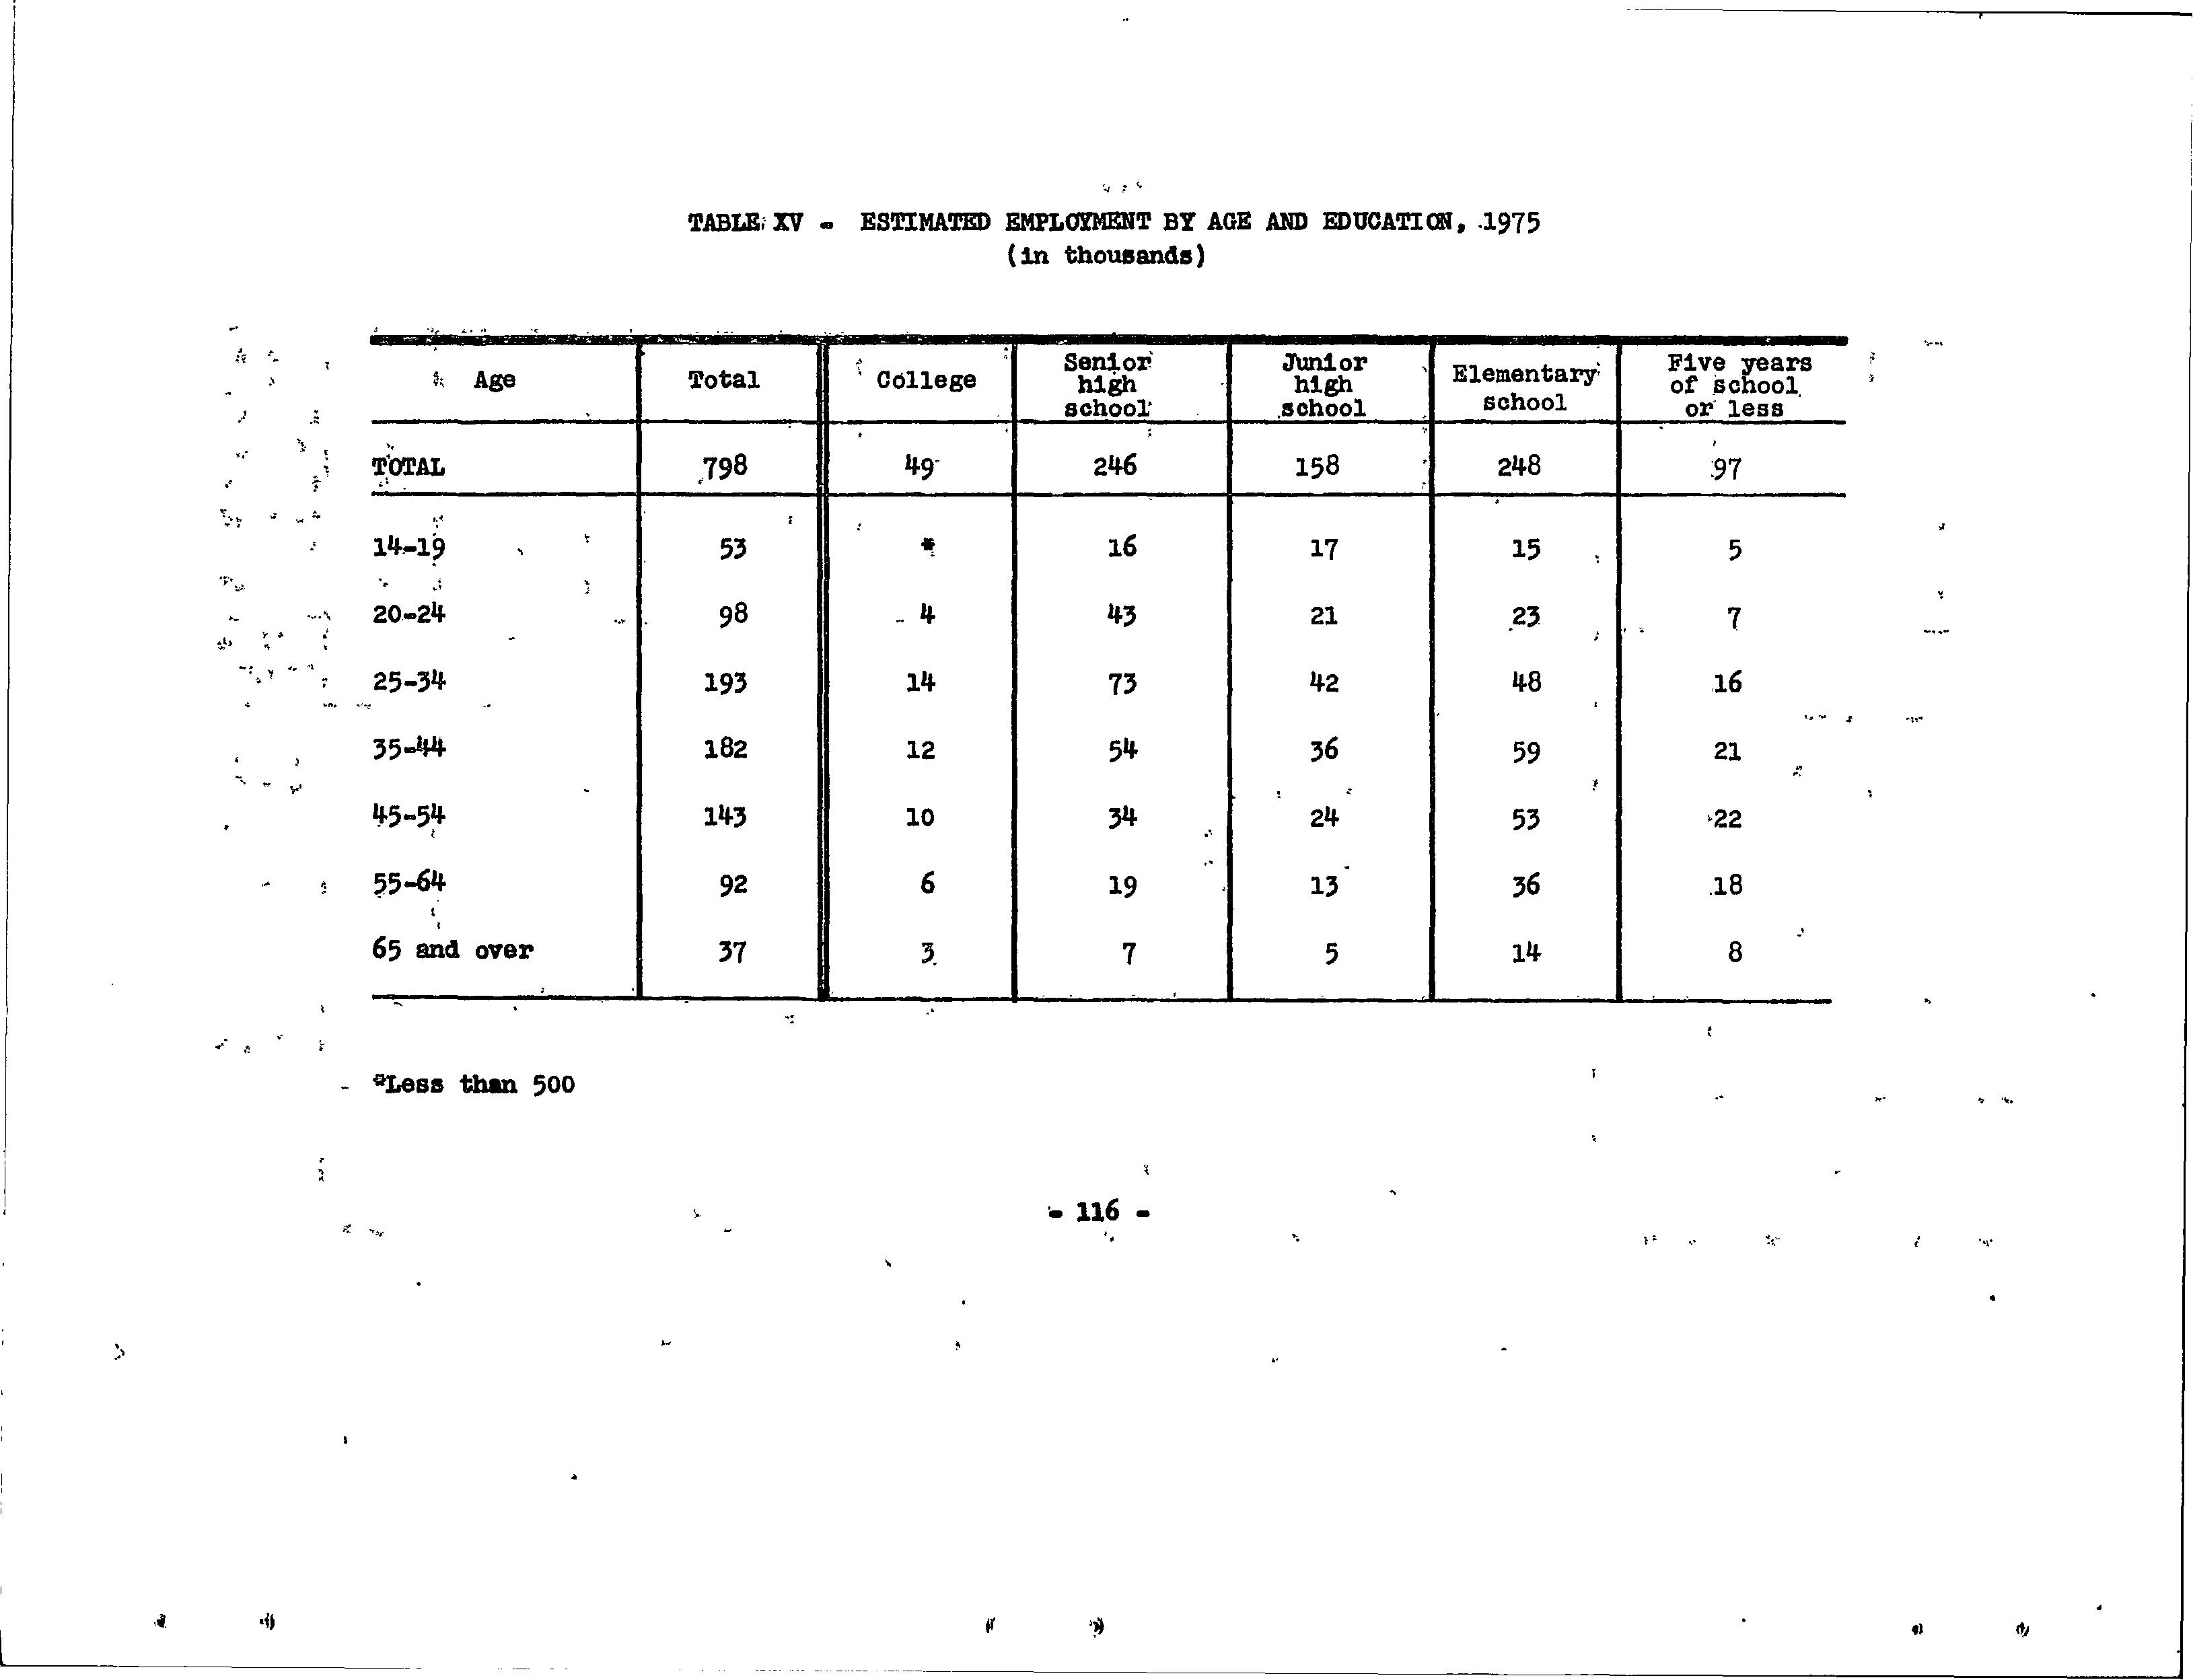
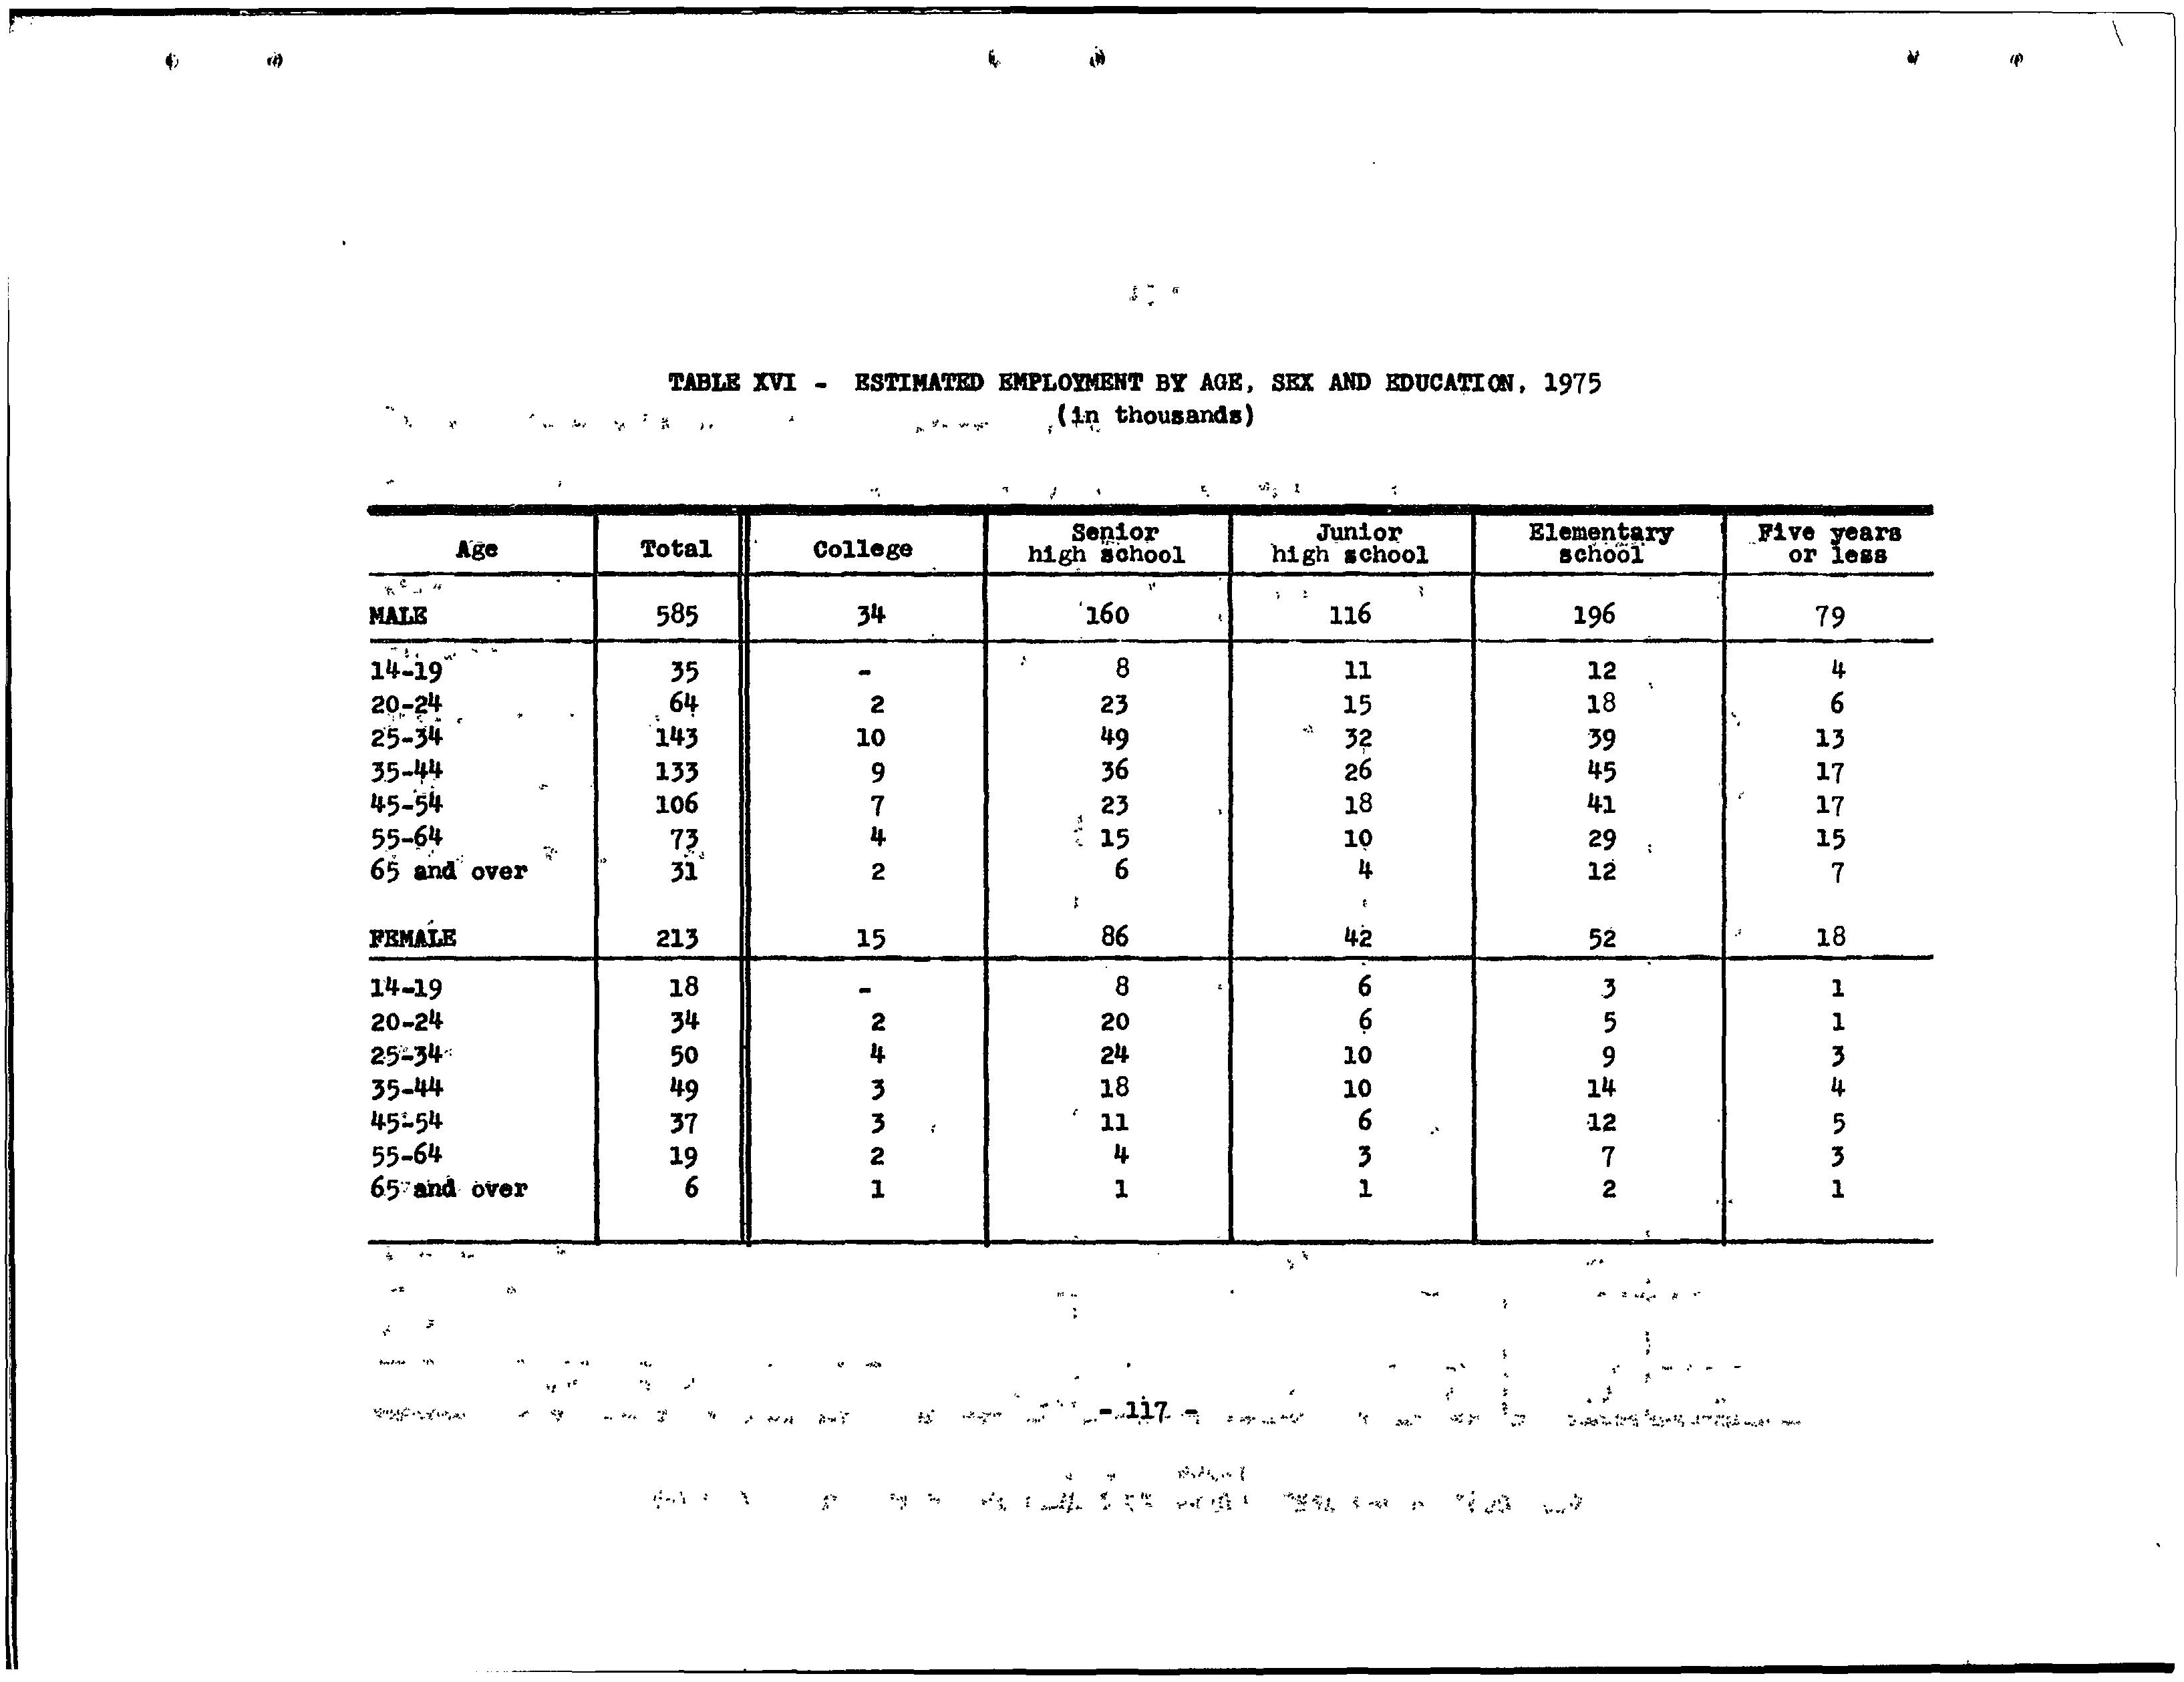
Tables XV and XVI in the appendix show estimated employrne nt in 1975 by age, sex and education.. These estimates· were obtained by summing the age, ·sex and educational dis·tributions of each major occupation group. '
:
8. Estimates of Employment
for the Years Between 1950 and 1975
It will be evident from the preceding ·tables and descrip,tions of method that our detailed estimates of employment ·by occupation., education, age and sex were first made for the year 1975. This was done as a matte.r of convenience rather than necessity, insofar as th~ major occupation groups are concerned. We had graphs relating occupational characteristics to produc.tivity levels for all years between 1950 .and 1975 and could have constructed similar graphs with respect to educational ·and agesex characteristics. It was nevertheless a great convenience to calculate the detailed characteristics of employment for the year 1975 -and then to interpolate between these estimates and the corresponding data for 1950 as given in the census. This proc.edure saved a great deal of computation and was adopted in order to get more estimates made in a shorter time. Nevertheles~ we should and intend, in our future work, to compute employment estimates for 1960 and other future years directly from output and productivity estimates for these years and from the hypothesized relationship between productivity level and the characteristics oi the manpower employed.
The above program is desirable, not because there will be major differences between our interpo:1,ated es_timates and 'those which will be directly calculated, but because directly· cafou1ated estimates for the Jnterveriing years will provide an important' tool for· the testing and refinement of our estimating procedure. As new actual data o~n net income and productivity become available and also corresponding new data on characteristics of the employed (especially in the cen~us of 1960) we will be able to see precisely· how each of oU:r estimates of net income, produc-
ti vity, occupational distribution, educational and age and ·sex distribution within an occupation, have deviated ·from reality ·and thus will be able to refine our definitions, hypotheses and methods of estimating.
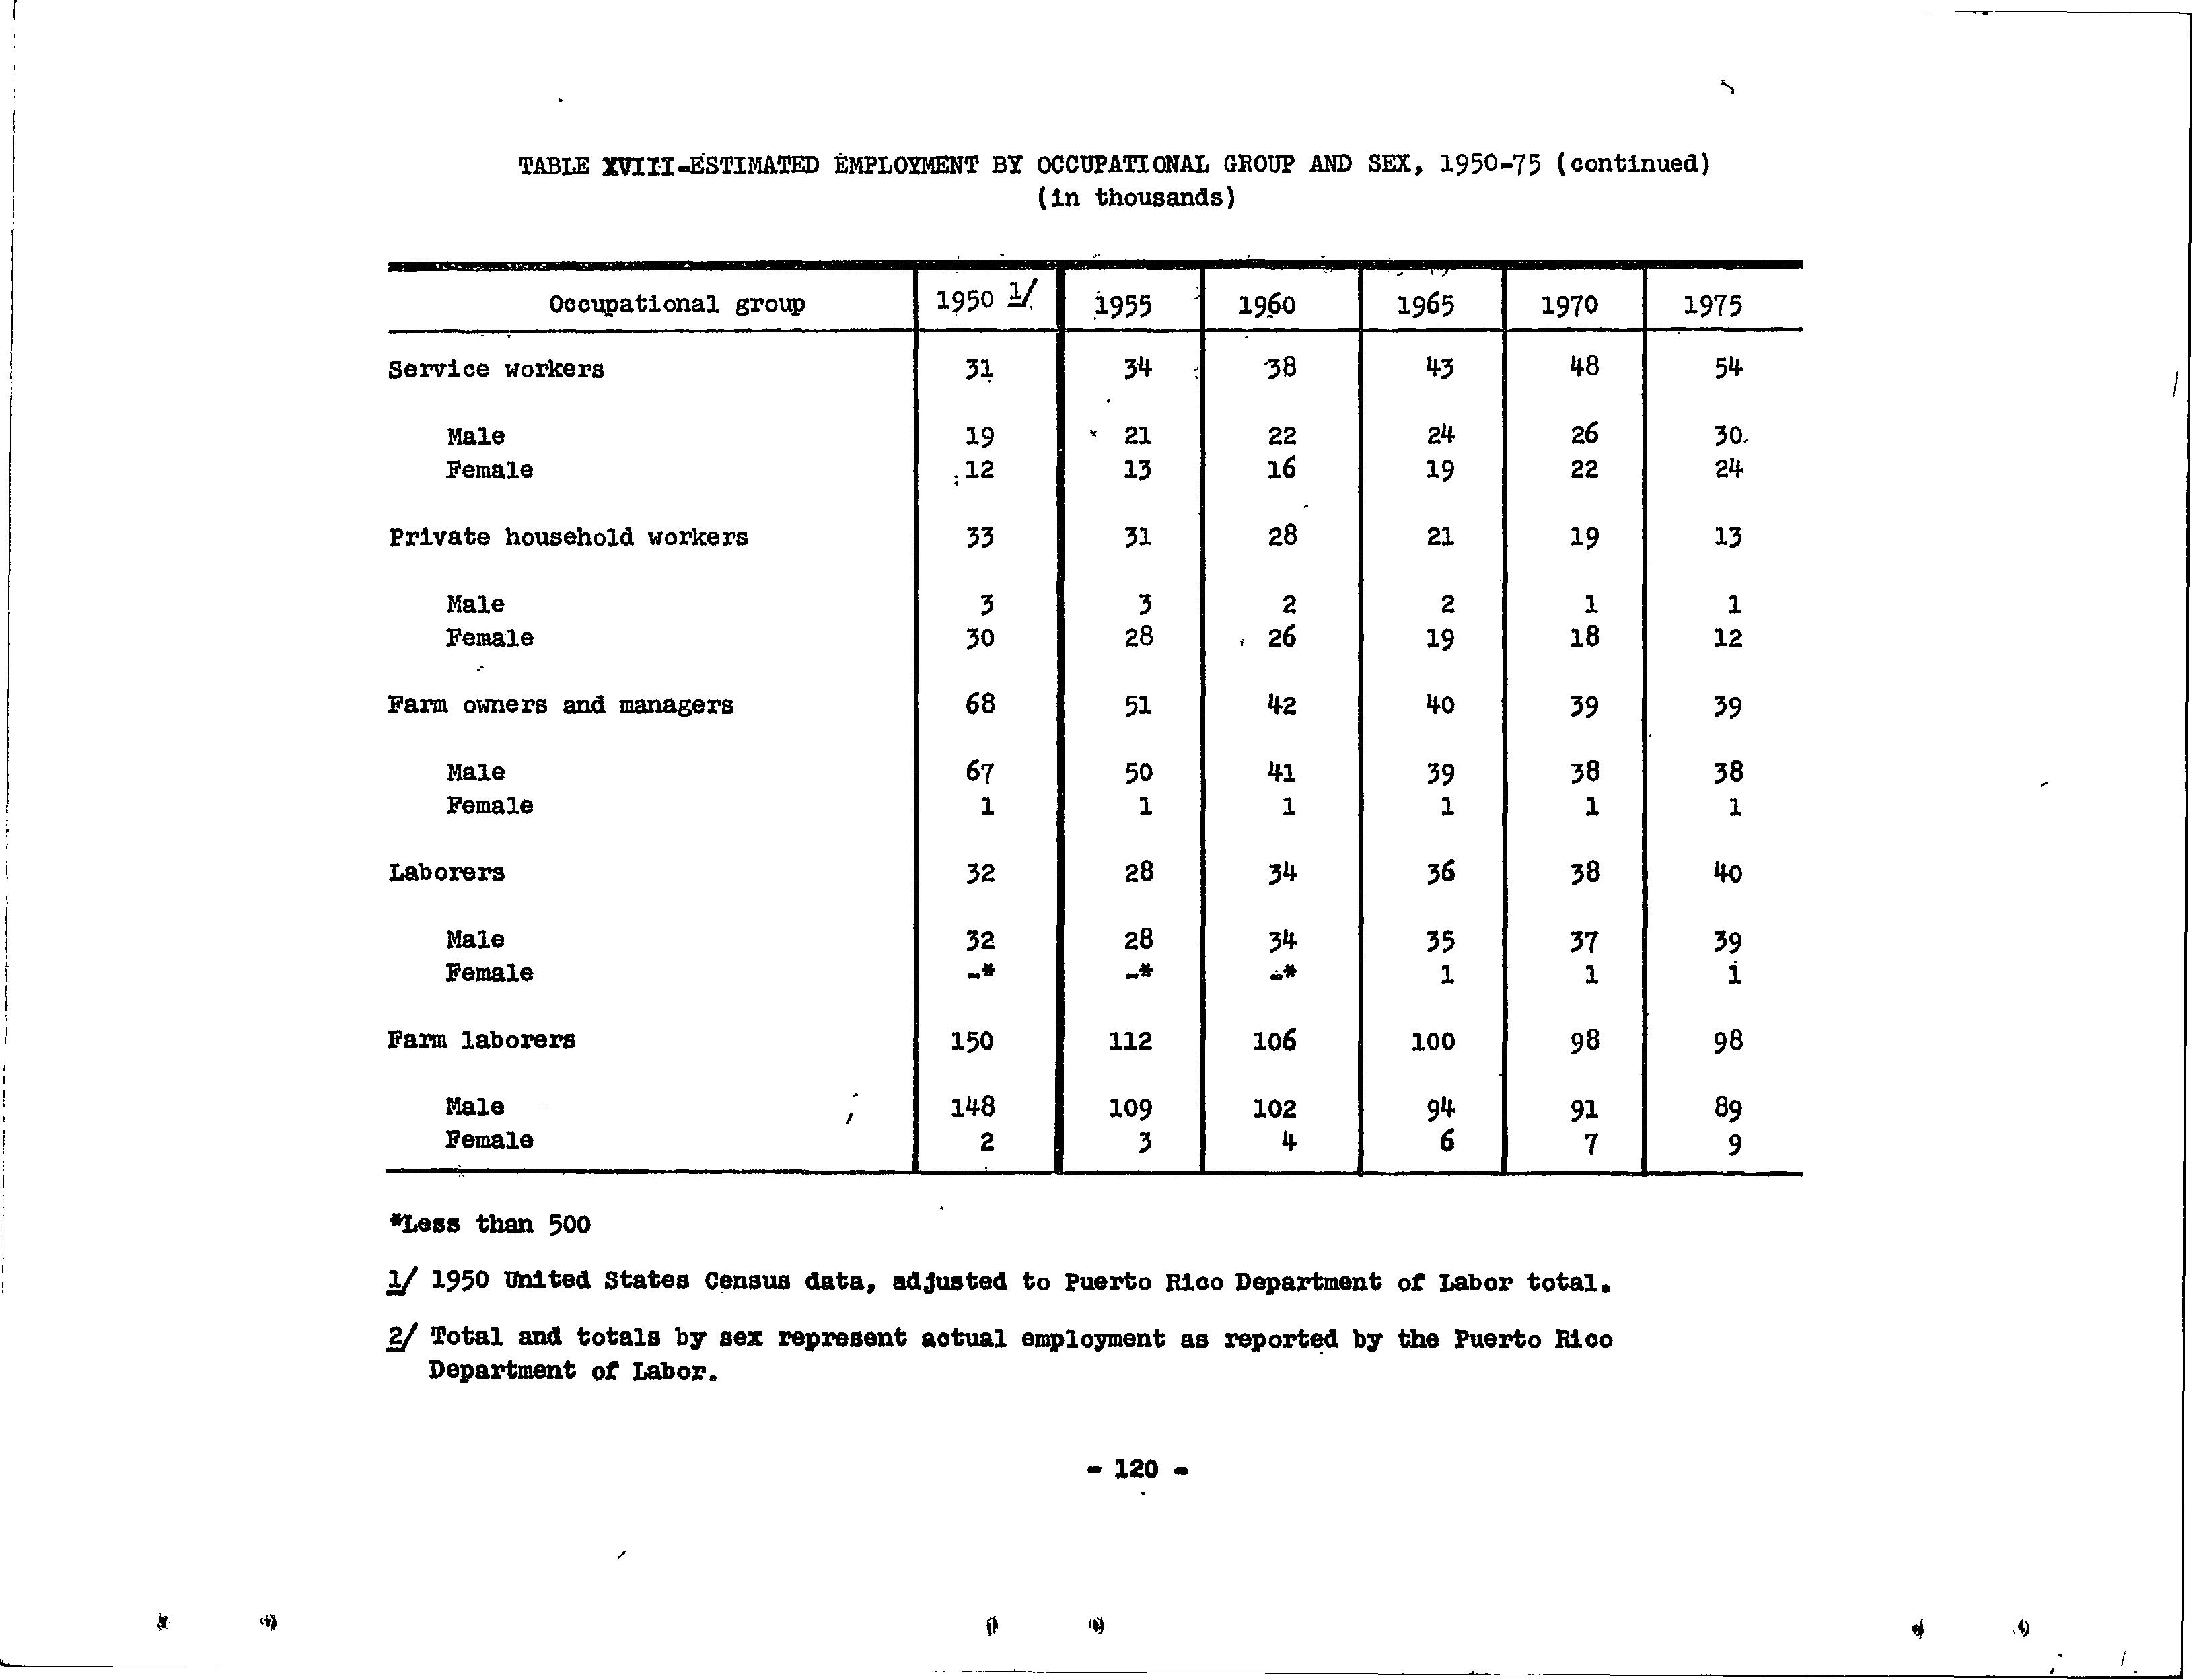
In making the int~rpolated estimates for the years between 1950 and 1975, which are shown in the variqus text and appendix tables, we tried to take account of all the factors which might influence the rate of growth or decline of va-rious occupations. To.ta! employment showed a downturn, for exampl~, in f955 before beginning an estimated long range increase. Bureau of Labor Statistics data showed that the drop in employment from 1950 to 1955 should be distributed largely among private"·household workers, farm laborers and home needleworkers-,. _I/ Since some industries, as previously noted, ;have sho~ a proportion of professionals and managers ap'i,arently :in excess of that indicated by productivity levels, we estimated the increases .for' these occupations between 1950 and 1960 at less than a linear interpolation would have indicated. 2/ Since the petrochemical industry is predicted to build up rap-idly during the sixties, to an- apparent limit of capacity, the increase in o~cupations associated with this industry were largely assigned to the decade of the sixties. Predicted chan-
1/ The drop is greater than is indicated by census data. The - census figure for 1950 employment is 560, 000 as compared to the BLS figure of 595,000. Two factors account for the discrepancy: l) The BLS data provide an annual average employment figure while the census represents employment· for one week in April; 2) The census did not completely enumerate home needleworkers (classed as operatives), street peddlers (classed as salesworkers), and farm managers. We have therefore adjusted the census data both for seasonality and for under-reporting.
2/ A special tabulation of employment by occupation, made, last year- by the Puerto Rico Bureau of Labor Statistics showed little increase in employment over 1950 in ~ost professions.
ges in the popW:ation and in. the school population were taken into ac·count in• the timing of increases for- teachers, clergym.en and othe·r·occupations where labor is assoeiated with population size.
Differences in the growth rates of various occupations ¢.ich are shown in the estimates for tli'e years between 1950 and '19·75 arise from the consideration of factors such as the above. Similar differences, wo-q].d, of course, have been ·reflected if calculations for intervening· yea.rs had been made independently, 'from the basic out put -and productivity projections.
T.ABtE :9 - CLERICAL WORKERS BY SEX AND ·EDUCATION, 1950-1975
(!n Thousands).
In making the interpolations we first estimated overall needs
by major occupation group, then by sex within the ~ccupation groups and finally by educ·ation level for each sex 1 Table above shows the estimates obtainecl. by this method for one occupation group. As with tne· 1975 estimates, .summing the data for the eleven occupa-
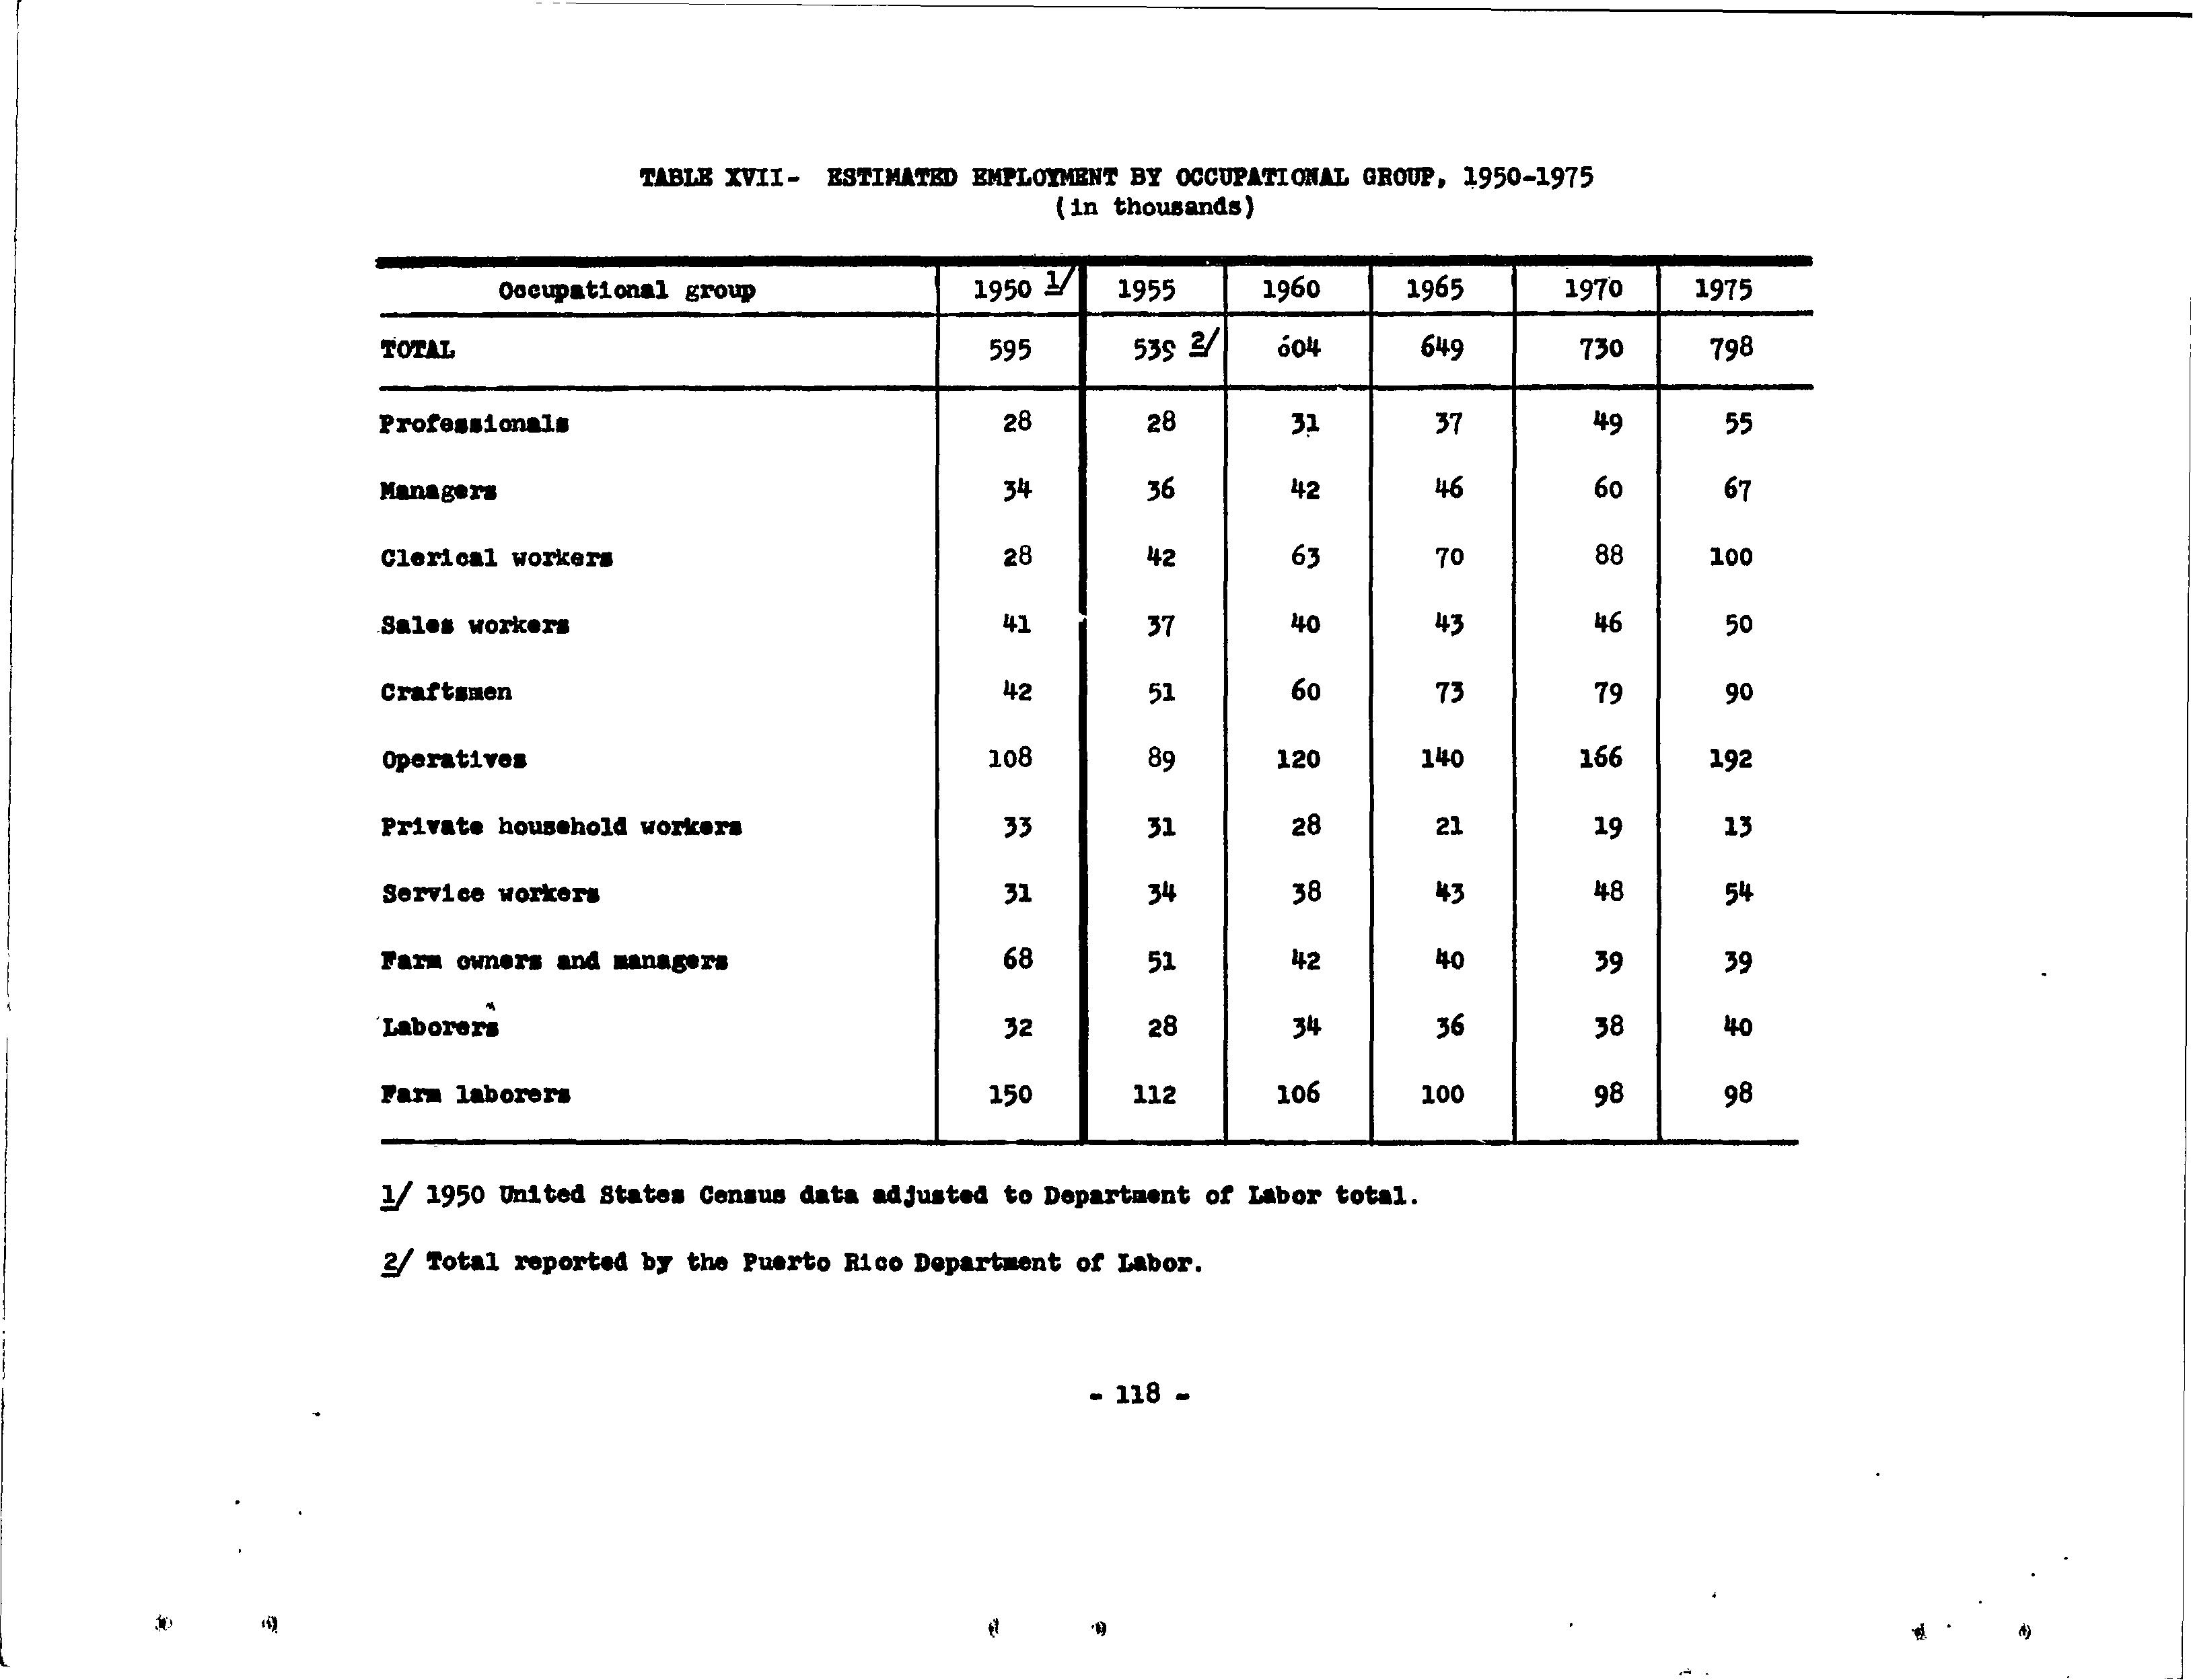
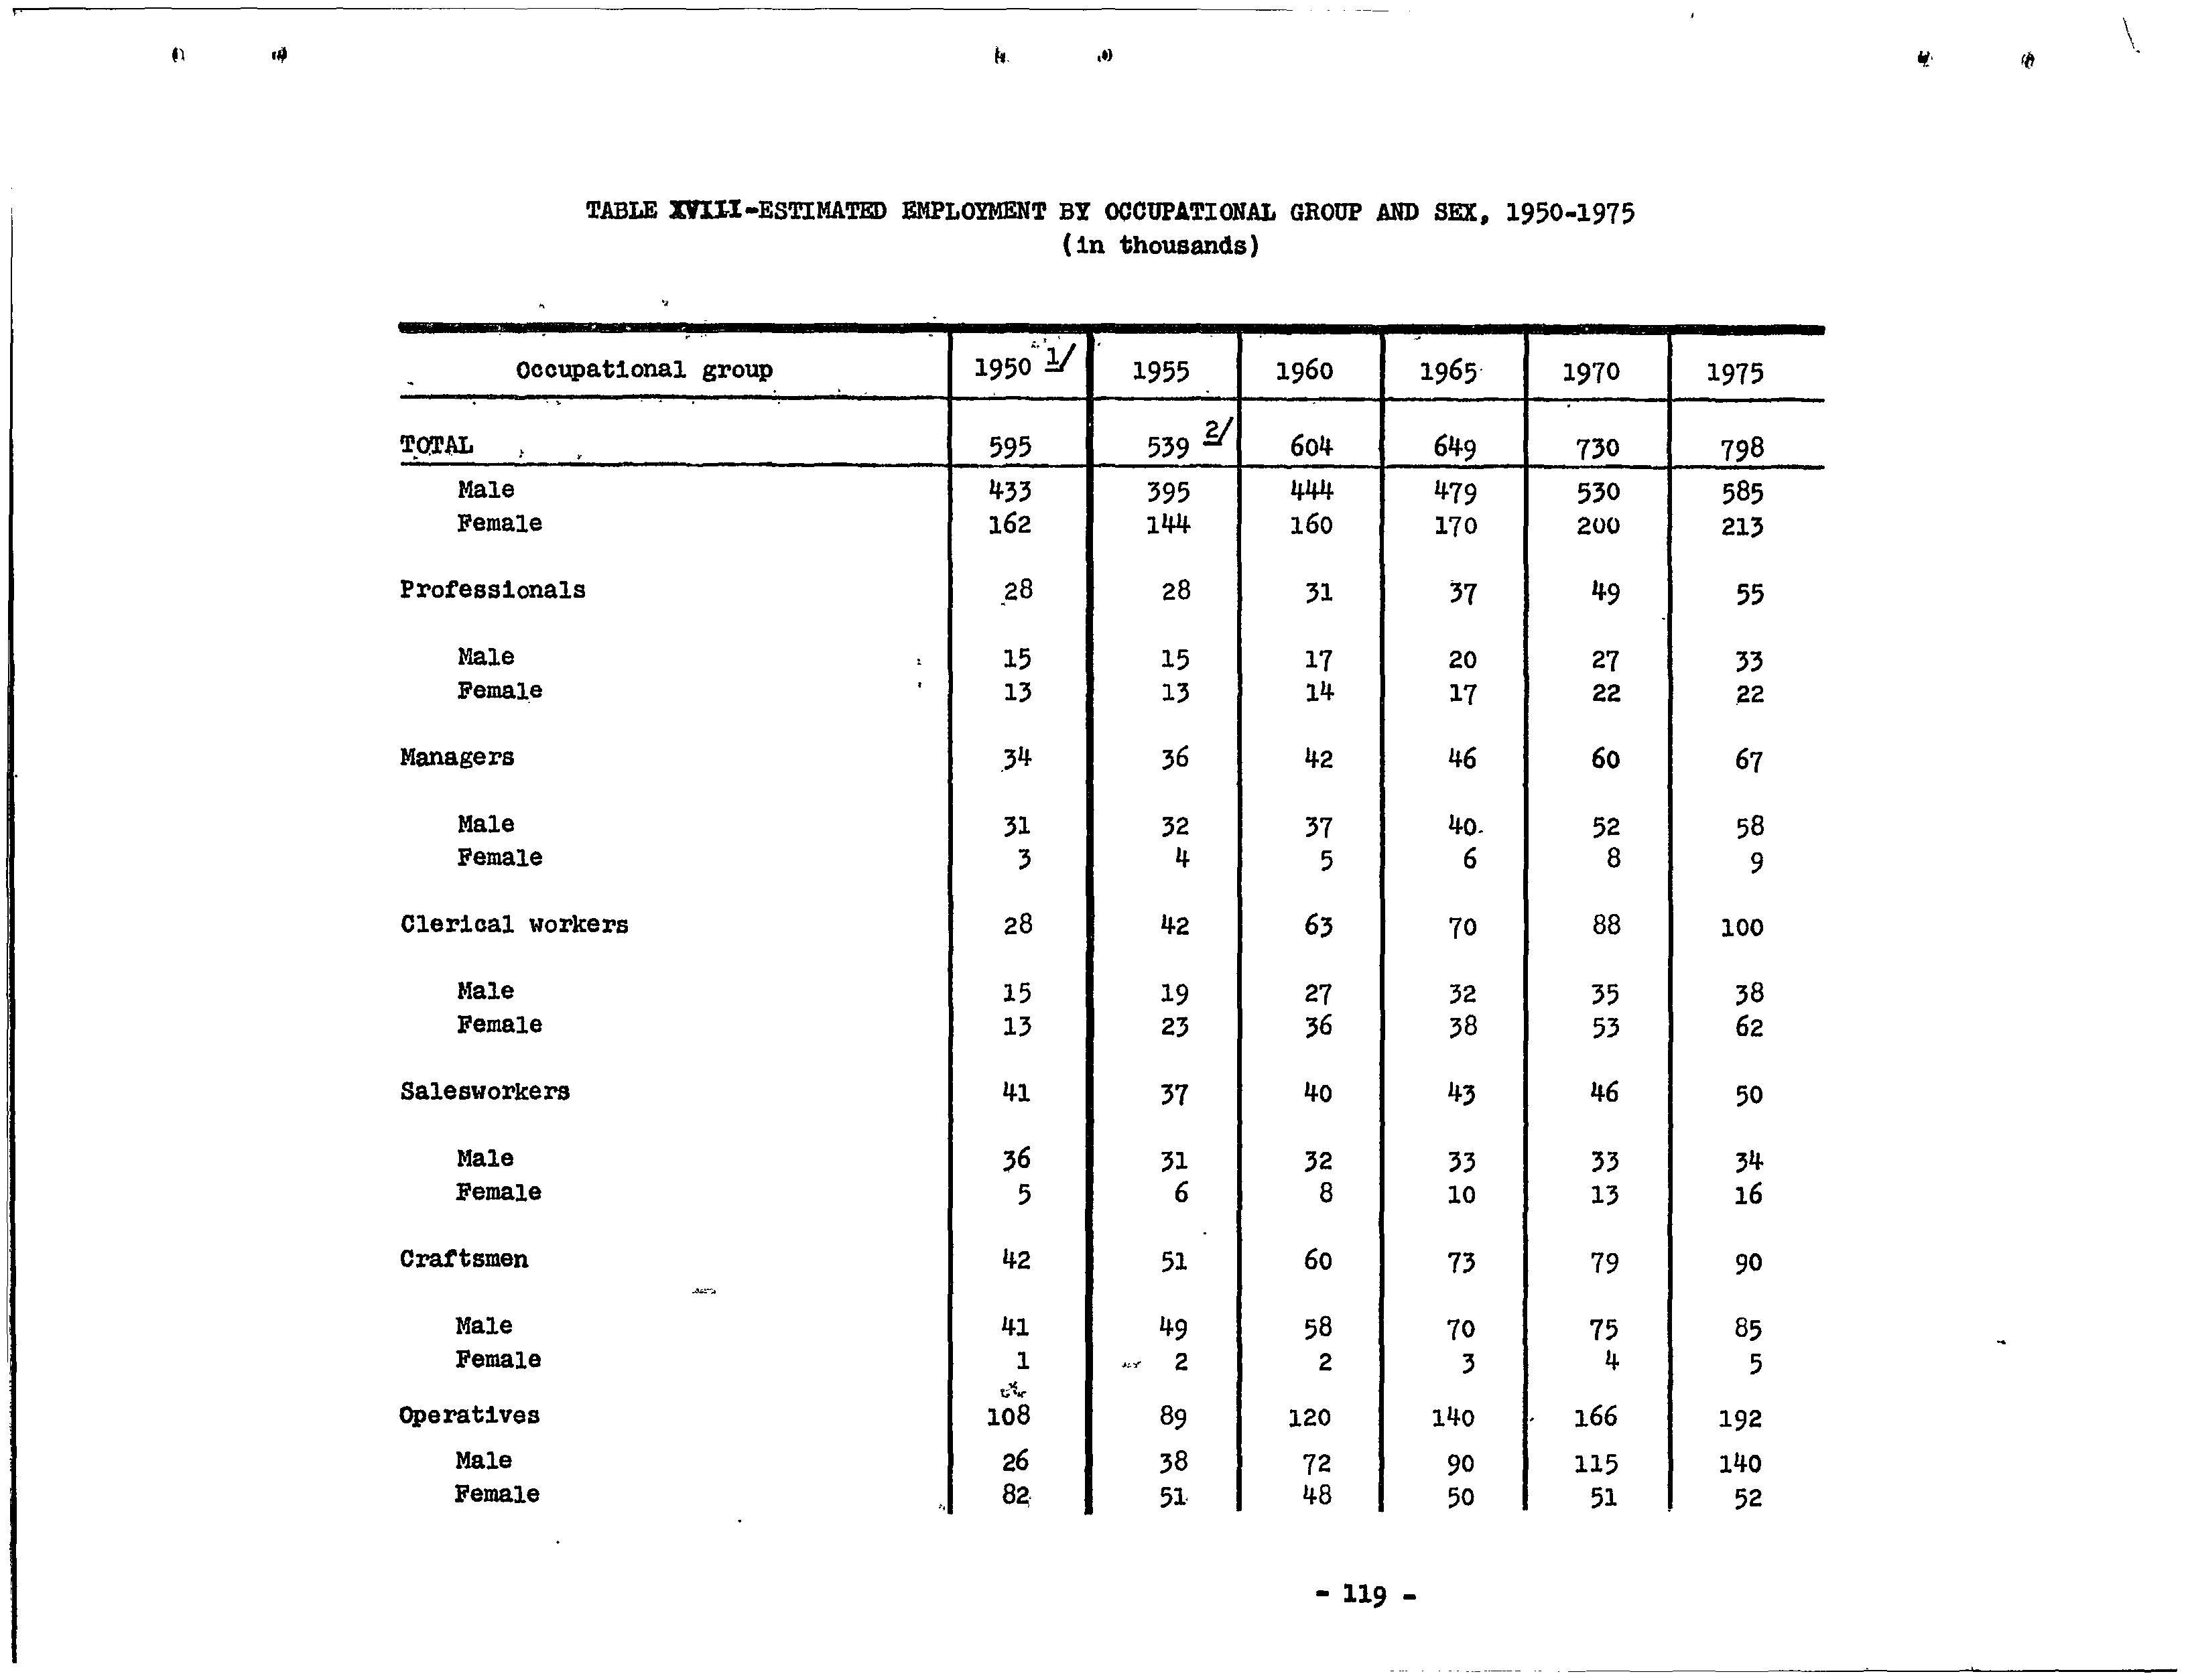
tion groups at each five year period gives us overall needs by occupation group, by sex and by education. Tableij XI, XVII, XVI~ and XIX. in the appendix show overall estimates as obtained by interpolation.
9. Future Research
The methods we have used in estimating the manpower needs of Puerto Rico seem promising enough to warrant fuller development. Some of the present deficiencies of these methods have already been mentioned and the steps necessary to correctthemhave in some cases been suggested. These suggestions, and some others, are summarized below.
1. The hypothesis that productivity is proportional to the occupational composition of the labor force and to the education of each occupational group needs further study; utilizing data from as many countries as possible.
2. The changing relationships of men and machines need to be studied directly with particular emphasis upon the intellectual demands which increasingly complex. machines make upon the men who build., operate and maintain them. Such studies as have been made, principally with respect to the operatic;m of military equipment, have usually had only a limited purpose and scope.
3. Relationships between machines and the human organizations which build and use them also need further study, particularly with reference to the intellectual skills required by individuals to fit into the human organizations associated with complex machines.
4. The experience requirements of various occupations need to be further investigated and particularly the relationships between education and experience as they relate to increasingly complex machines and human organizations.
Ill MANPOWER SUPPLY
Methods of es.timating manpower supply are more highly developed and bette't" standardized than method.a of estimating manpower needs_. Difficult problems of definition and analysis are nevertheless involved. Since we have definedmanpower needs, in terms of employment it is a natural choice to clefine suppiy in labor force terms~ i. e., persons available :for work ap.d either employed or seeking employment.
1. The Nature and Limitation of the Supply Estimates
Not1 all of the terms used to describe manpowe_r needs have corresponding terms in- our estimates of supply. We have not, for ~xatnple, made estimates of supply by occupation class. We need them and in the future we will make them but this will require d~ta which is not available now.
If everyone remained in his first occupation the task of estimating manpower supply would be easier. But many occupations are entered via other occupations. Moreover, people do not always follow the occupation of their choice. Some·~ork has been done on measurement of occupational mobility and occupational choice, 1/ but we need data which can be obta:ined only thru field studies, such as these proposed to be made by the Puerto Rico Employm:ent Service in the coming year, before estimates of manpower supply by occupation can be made .. In this report, therefore, we have concentrated on estimates of the educational characteristics of the labor force, si'nce the needed inf°ormation: is available.
There is, however,. another fundam.ental rea.s'on for our con'.:. centration on educational characteristfc·s' arid pcirticula:riy on
]j Jaffe, A. J., and Carleton, R. 0., Occupatiqp?,l_MoJ:$il(ty in the United States_, 193'0--1960~ King"s Crown Pre·ss, Columbia ·university, New York, 19~
years of school comp~ete.dJp.th~p-t,h.,a;r,i~on:;~p~.cia:Ij,zed training. It is that the normal education pipe -line is so· long in comparison with other forms of training and even in comparison with the time required for specialized education. A college graduate go·e,s -to ·schopl for sii:X:feen~yea±•s, a:hfgh ~d:i:dol' graduate fo r.:,tw:el:v-e; ,Jn ·c0t.npa1.:i'sbr-i the- specializ'e'ci. training: 'fbr:' •• ·~ medicirt~,· 'law and e·ngineeri-ng· 'an.If the. apprenticeshipperfod's, ., for craftsme-n ·seldoril· -take· more 'thah' six --years~ =· ·T±-aiRing'f6r most othe-r ockupations-i-s dbns'ide:rably sh6r·fe:r thah•·this and ' many skilled occupa:ti0ns require le-ss than!a ·year of'specializedtraining. Furthermore·;· -at· le·ast a 'minimum'.- of gene ial educ a::.' tion must almost a,~wa,ys,precede any speciaHzed training.
Both the length ·and the 'preced·e'iit· character of general education for!=e us t_o give it._priori,ty in the estin:iation. 0£.,.m~power supply. .E\r.~t~. 'bec~1tse, ~(an' ov~r~lr ed-1;1-.c~tionaj shortage., ?,tall levels,)s ?,ct1:1.ajiy, tg,uru.nent anc(µ, this shortage_ is to be ·avoided it must be p\e_d.icte4 fa} in a)ivc!,nce of its_ qci;:urrence. Second, because an i~~reas~ ·in any for_~ 9f speciali~e~,tr.ai:q.ing, in the face of a general educational shortage, is only robbing Peter to pay Pa:t,ij,
There is J:iothing _more fu.nd.aII?-ental for .ecqnomic 'and soci?t,l development tl:}.an t4e, c!,dequac'y '.of tJJ.e ~ene ral .lev~l of educati~n,, unless it i~ ?-vailability of capital .f.or the constru~ti~n o.f physical .:eroduc~t<;>~ facilities. I.f sufficient capital is avaii~pl~, parti~ular faci~ities can alr.pc;>st always be bt:~.1~ qn Sf~!tnotice. Similarly, if t4e .gen~n:al level pf edu.cation is adequate, specialized sld,lls can qsually be mag.e avaj}abie. in_ a .relc3:tively, short time. The re. i.E!., .. :i.n fact, 'n.o :form· of capi_talinv.es~ent ,... more fu.:qdamental to' e<;:on9mic and soci.~i deye~opme~t- t_h,;1,n ., I investment in the general education o~ '):he ·pop:ul?,tion since with• t I • .r · out this investment, investment in physical facilities is futile.
·we do :q.o~ in~end to.confuse years of school_ c,omplete~ wi.t~ the training ~ecessary to perform a"job. Job p'erformance •• , clearly involves basic attitudes and habits to which many institutions, including the school, contribute. Work experiegc-e is .also-~ ,necessary Jorm of: tr.ainh,i.g fo,rjc;>~ pe:i;.{o:rmance, but1 : 9_3?-,e,,'Ylitch··if t~is st~ci.y we can ~,stim~t~, oniy v~ry c:i;udelr;, _ thru its correlation with age. Grap,.:i1·d -~Jqat .f9rmal·«r9-~c;atiqn:';.
is only one form of trairting, it is, nevertheless, in the modern world the one that takes the most time and money, the one for which government has the greatest responsibility and over which -it has the most control.
In order to- estimate the size and characteristics of OUI'. future labor force we first had to estimate the size and characteristics of our future population. This was done by adding to and .subtracting from the base provided by the 1950 cerisus. 'The validity of our estimates of manpower supply depend, thus, upon the validity with which we have estimatep. birth and death rates, migration, school enrollment, school retention from grade to grade, and labor force participation. These estimates are discussed and illustrated below.
2. Estimates of B.irth and Deat'h Rate,s
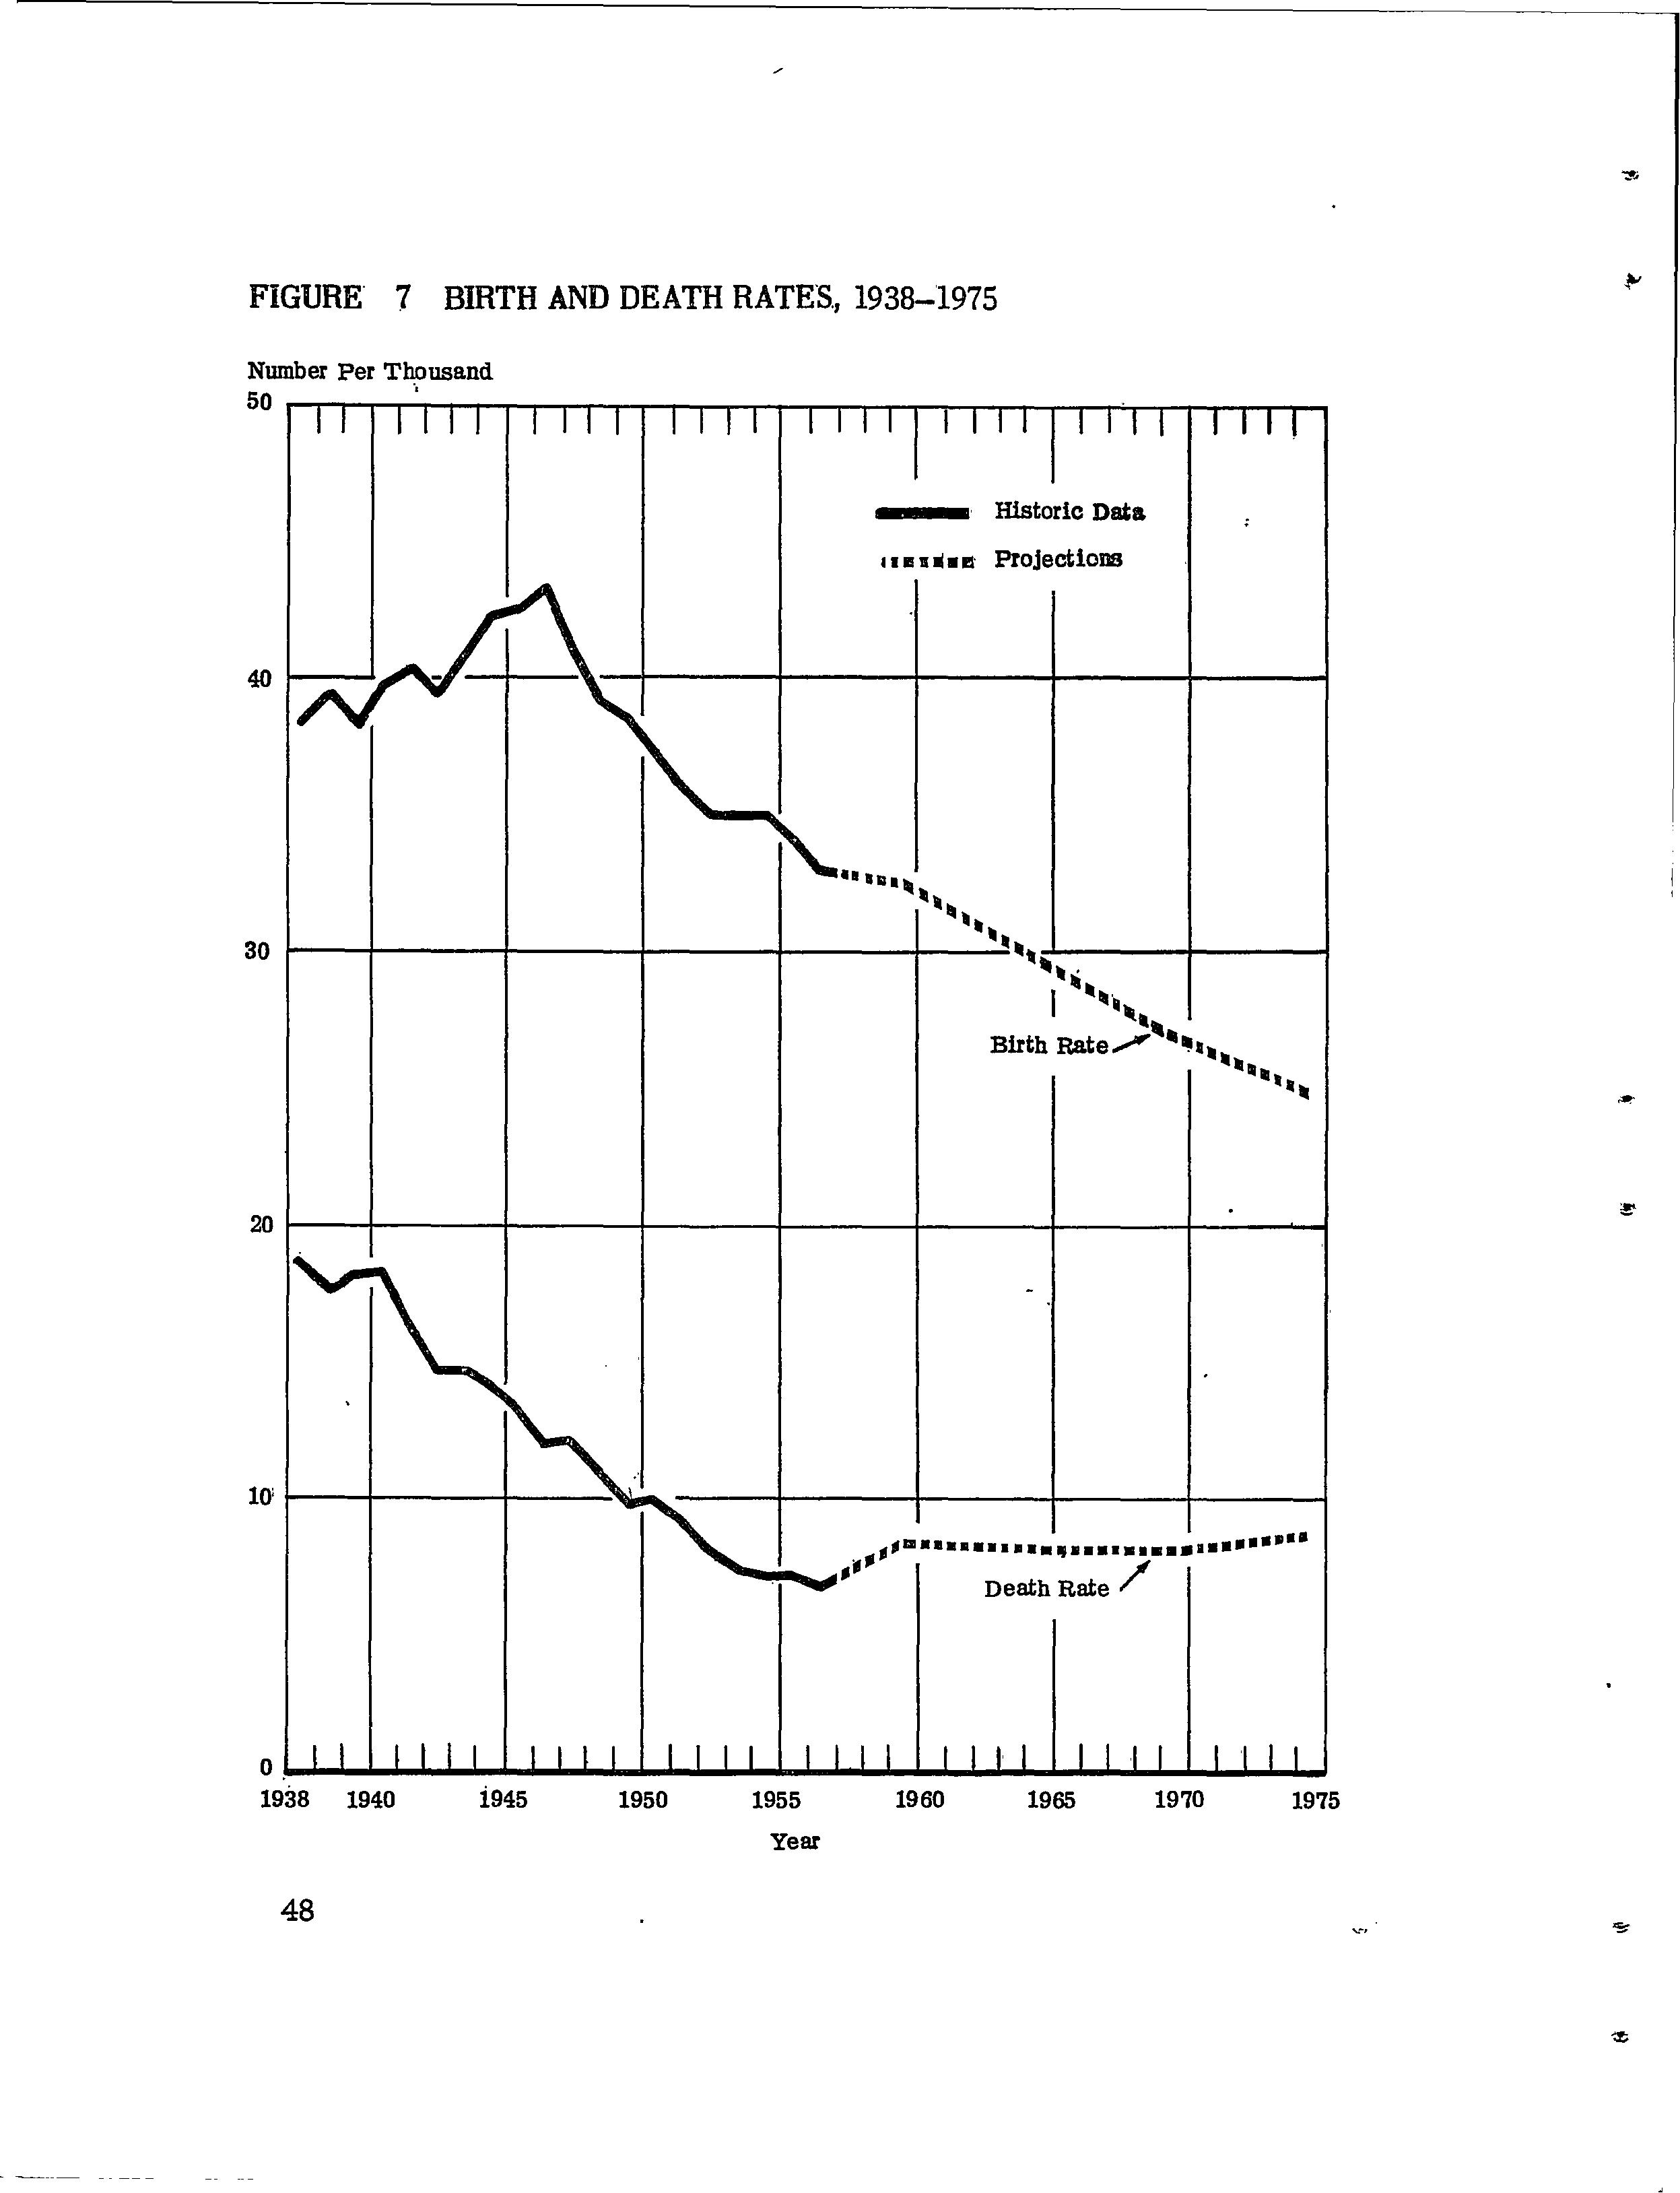
Population size depends upon birth, death and migration rates. During the past decade both crude birth and death rates in Puerto Ric·o have fallen considerably. The birth rate has fallen from an all time recorded high in 1947 of 43 per thousand to 33 per thousand in the first ·quarter of 1957. The death rate in the same periodhas fallen from 12 per thousand in 1947 to 7 per thousand in 1957. During the past decade the rate of natural increase has, thus,declined from 31 per thousand to 26 per thousand. This decline in the rate .of natural increase is expected to continue, since the crude death rate will soon begin to rise as the average age of the population increases while it is expected that gross birth rates will continue to decline. Figure 7 shows the recent course of birth and death rates in Puerto Rico and their expected future course.
The projected decline in the birth rate does not have as solid a basis in current data as it appears .to have: The recent steady drop in the crude birth rate is principally due to changes in the age and sex composition of the population, brought a.bout through migration of younger men and women and by the drc!,r.aatic recent decline in death rates.. Age-specific birth rates, ('for example births pe:i;- thousand women, age 20-24) have begun to drop only recently and, so far, have dropped very little. Our assumption that they will continue to drop is based on the
FIGURE 7 BIRTH AND DEATH RATES., 1938-1975
large seal,~ movements from rural to urba;n residence, the large scale improvements in family incorn,e and the rapid improvements in level of education which are occurring and which are predicted to continue
..
In any case., future birth rates have only a minor dire~t bearing on our es:t;i:tnates of the size and composition of the'labor force betwen now and .1.975. Al! of the persons who will .be old enough to participate in this labor .force will be born by 1961. Indi~ectly, howe~e.r, birth rates after 1961 may influence our labo.r force estimates in severai w.ays. They will,. for example, influence school population and thus- the educational resources which can be diverted to higher level and adult education. They will al·so influence the labor .force participation rates of women. Finally they may influence the ·ra:te of net migration which in the past ten years ·has largely offset the natural increase in the population of Puerto Rico.
3. Estimates of Migration
~ince 1950 net migration from PueTto Rico to the States has averaged 50,000 persons per year and it appears likely to continl;le at this average level over the next seventeen years. If this rate of migration continues and if our employment and labor force estimates are correct Puerto Rico's labor force will by 1975, be about 5% in excess of average employment. As this "full employment'' ;,ituation is approached net migration figures may be expected to decline. Befor~ the gap betwe~n employment and labor force size be.gins to close, however, .it is predicted to become larger than at present and during this period net migration figures may be .s.omewhat in excess of the predicted. average.
. Net mig!ation from Puerto Rico to the States refle,cts job. ·opportUil.ities in the States as well as the lack of them in Puerto Rico. Since the. United States .is not relaxing its barrie:r:.s against foreign immigrants, Puerto Rican workers will have at least, ,the job opportunities in the States they have had in the past. In addition, since Puerto Rican populations are becoming established in an ever growing nurn_ber of communities and, since
future migrants will be coming from an environment undergoing rapid industrialization, the variety of-jobs available to Pue·rto Ricans in the States shouldprogressivelyincrease. While wagesi in Puerto Rico, will be rising faster than in the States, the a~tual dollar .and cent differences in wage rates are likely to be maintained for a long time. ':Barriers to movement between Puerto Rico and the States, such as the time and cost of travel and cultural and language differences, will steadily decline during the same period in which economic condition_s between Puerto Rico and the States are approaching equivalence. All of the above considerations are reflected in our estimate that migration will continue at the same average level as in the recent past, for the period covered by our estimates.
,. We have assumed that the net -migrant population will continue to have the age-sex composition that it had between _1953 and 1955. Data 'for these years shows that the great majority of the migrants are less than 30 years of age; The ratio of the sexes is about even but men migrate in largest numbers between the ages of 20 and 30 while women migrate more evenly at aJ:i._;ag_es.. After 30 years of age there is a net back migration tq Pue;rto Rico which accounts for the fact that our population projection s,hows equal or slightly larger numbe;rs of persons in .the ag.e groups 35-44 ~nd 45-54 than in the 25-34 year age group_.
:. -. It :i:s also assumed that the net-migrant population will ·'have· the same educational composition as the total population. This assumption leads to conservative estimates of manpower shortages and surpluses by education level. The data we have, although inconclusive, strongly indicate thatin the past a higher proportion of persons with more than average education for their age and sex groups have been included among the net migrants. Analysis of the age structure of the population in. the United State.s also indicates that the job attractions of the '· States will be strongest for the Puerto Rican age and sex groups ·which have already been most depleted. On the· other hand, since our estimates show that these sam.e age, sex and education groups will be in short supply in-Puerto Rico, we may be warranted in our previously stated assumptions.
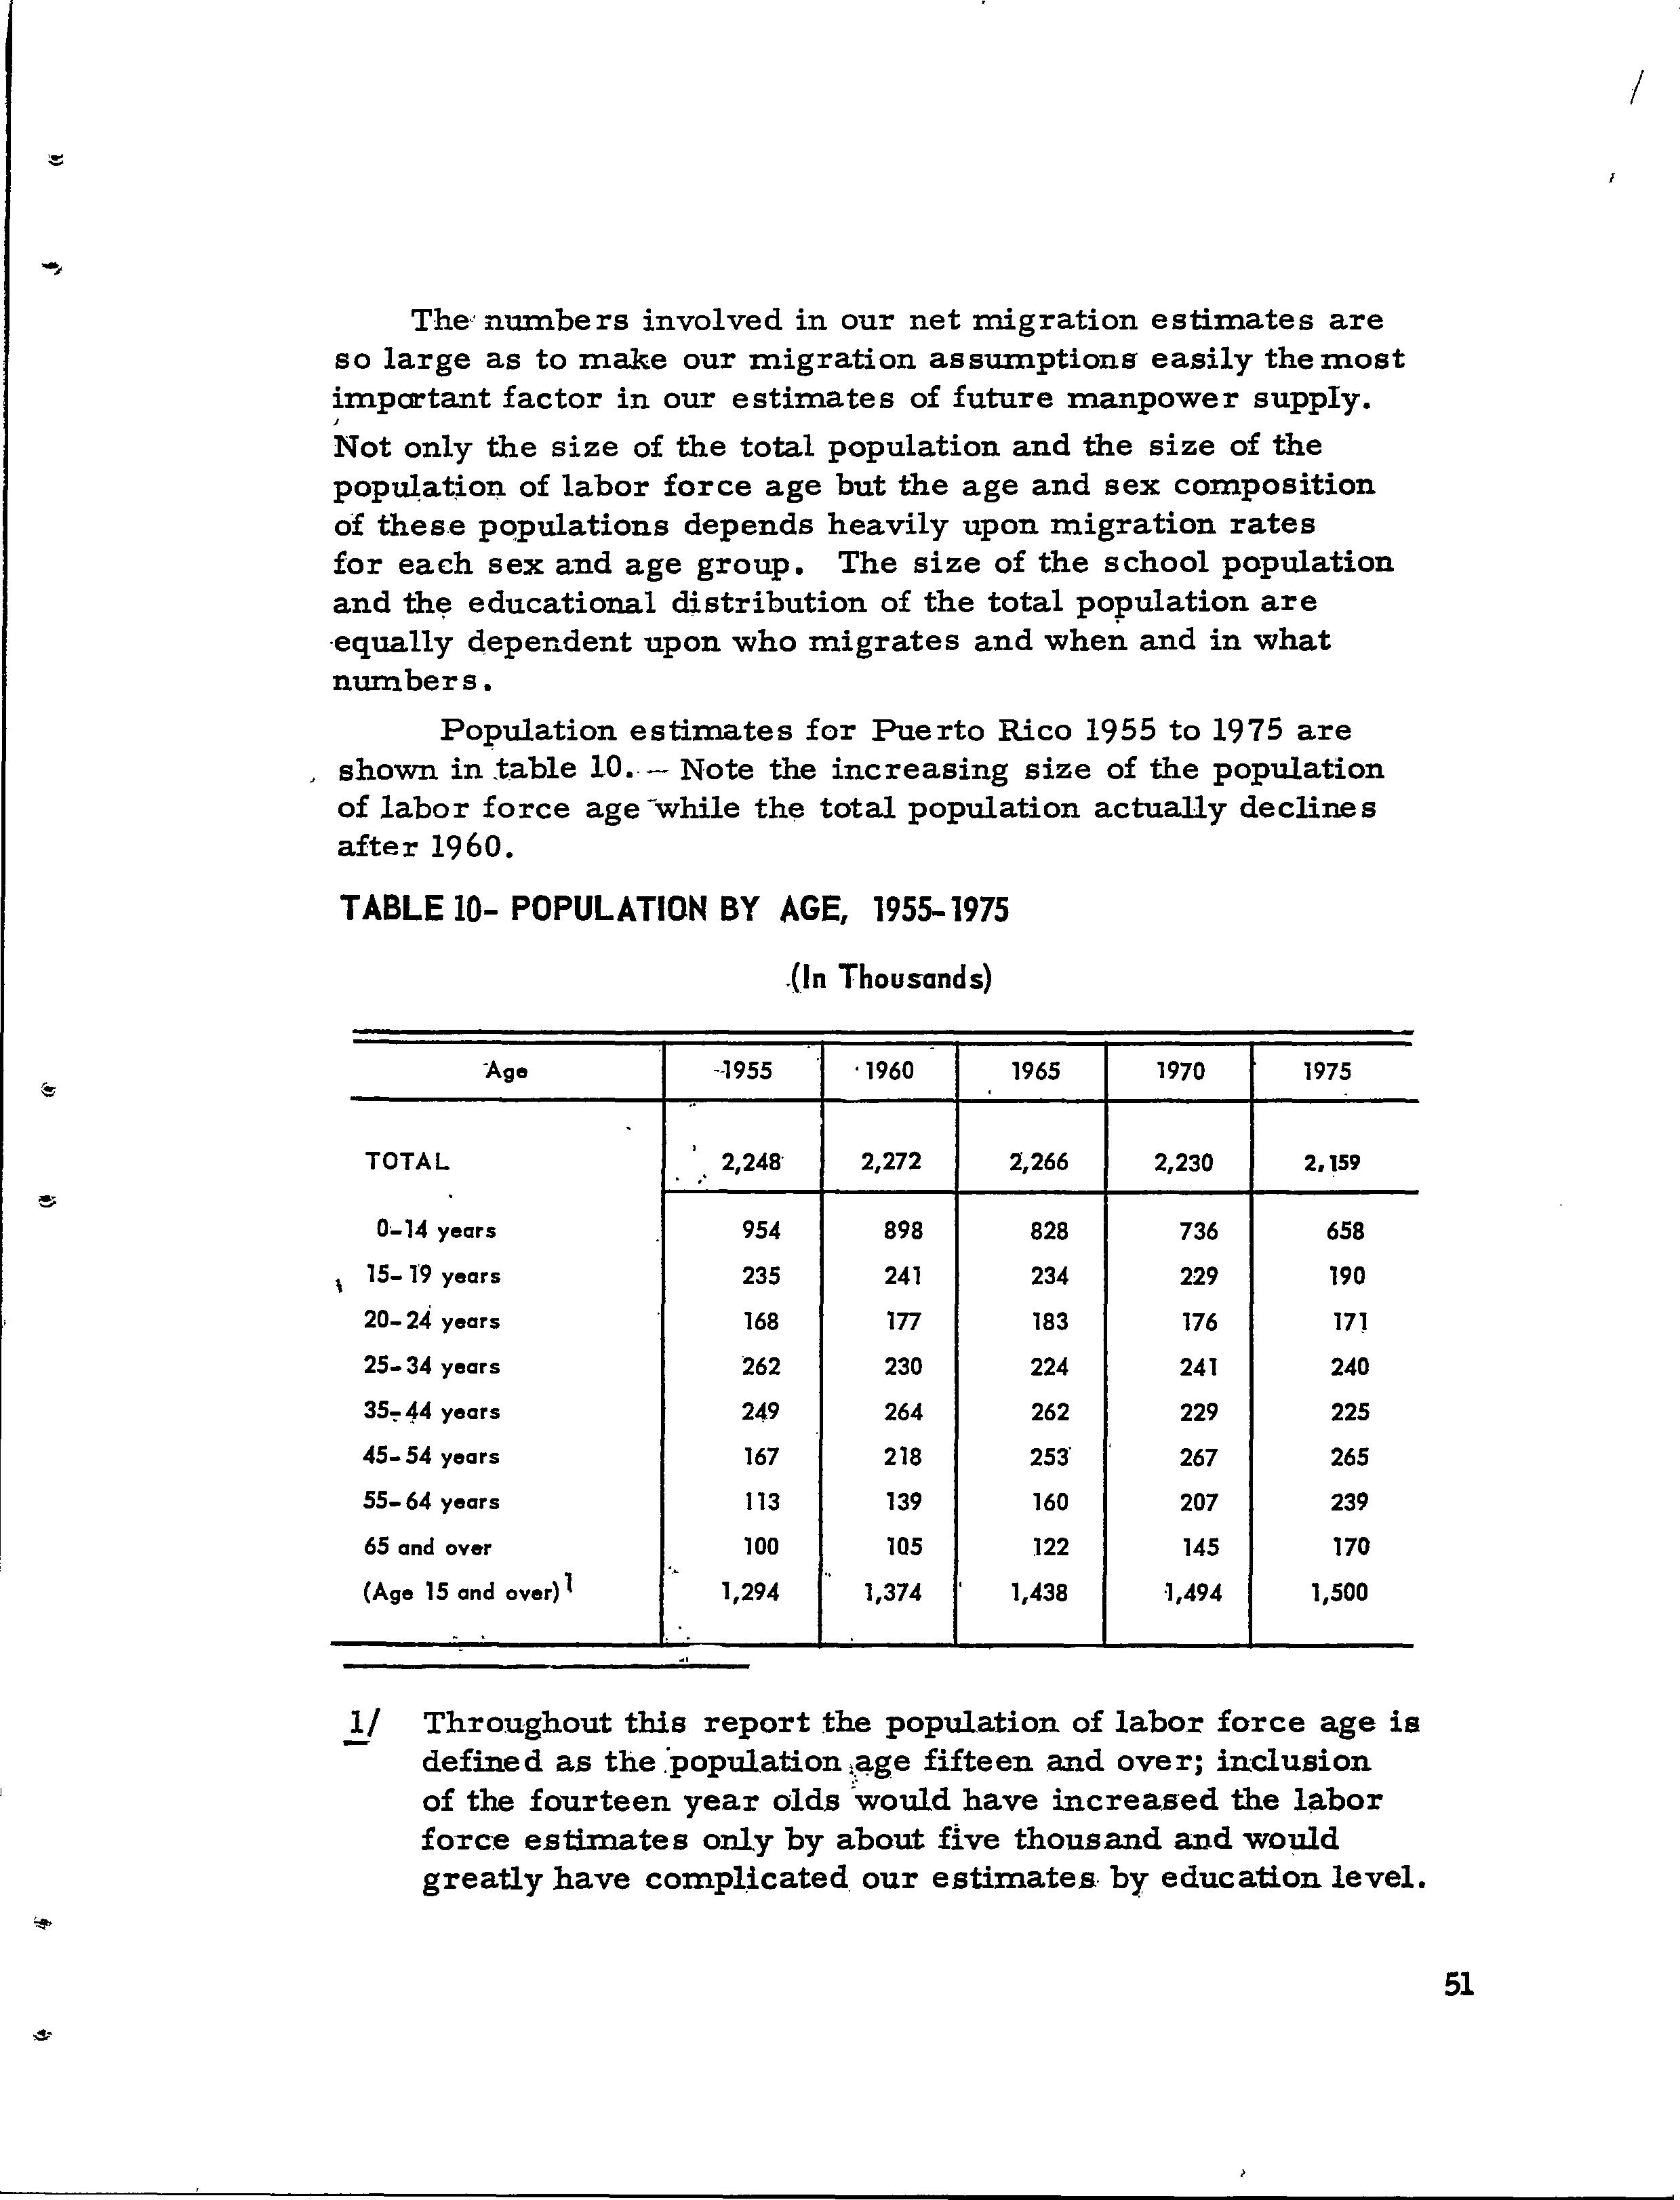
The· numbers involved in our net migration estimates are so large as to make our migration assumptions easily the most important factor in our estimates of future manpower supply.
I Not only the size of the total population and the size of the popul,atioil of labor force age but the age and sex composition of these p~pulations depends heavily upon migration rates for each sex and age group. The size of the school population and th~ educational distribution of the total population are ·equally dependent upon who migrates and whe~ and in what numbers.
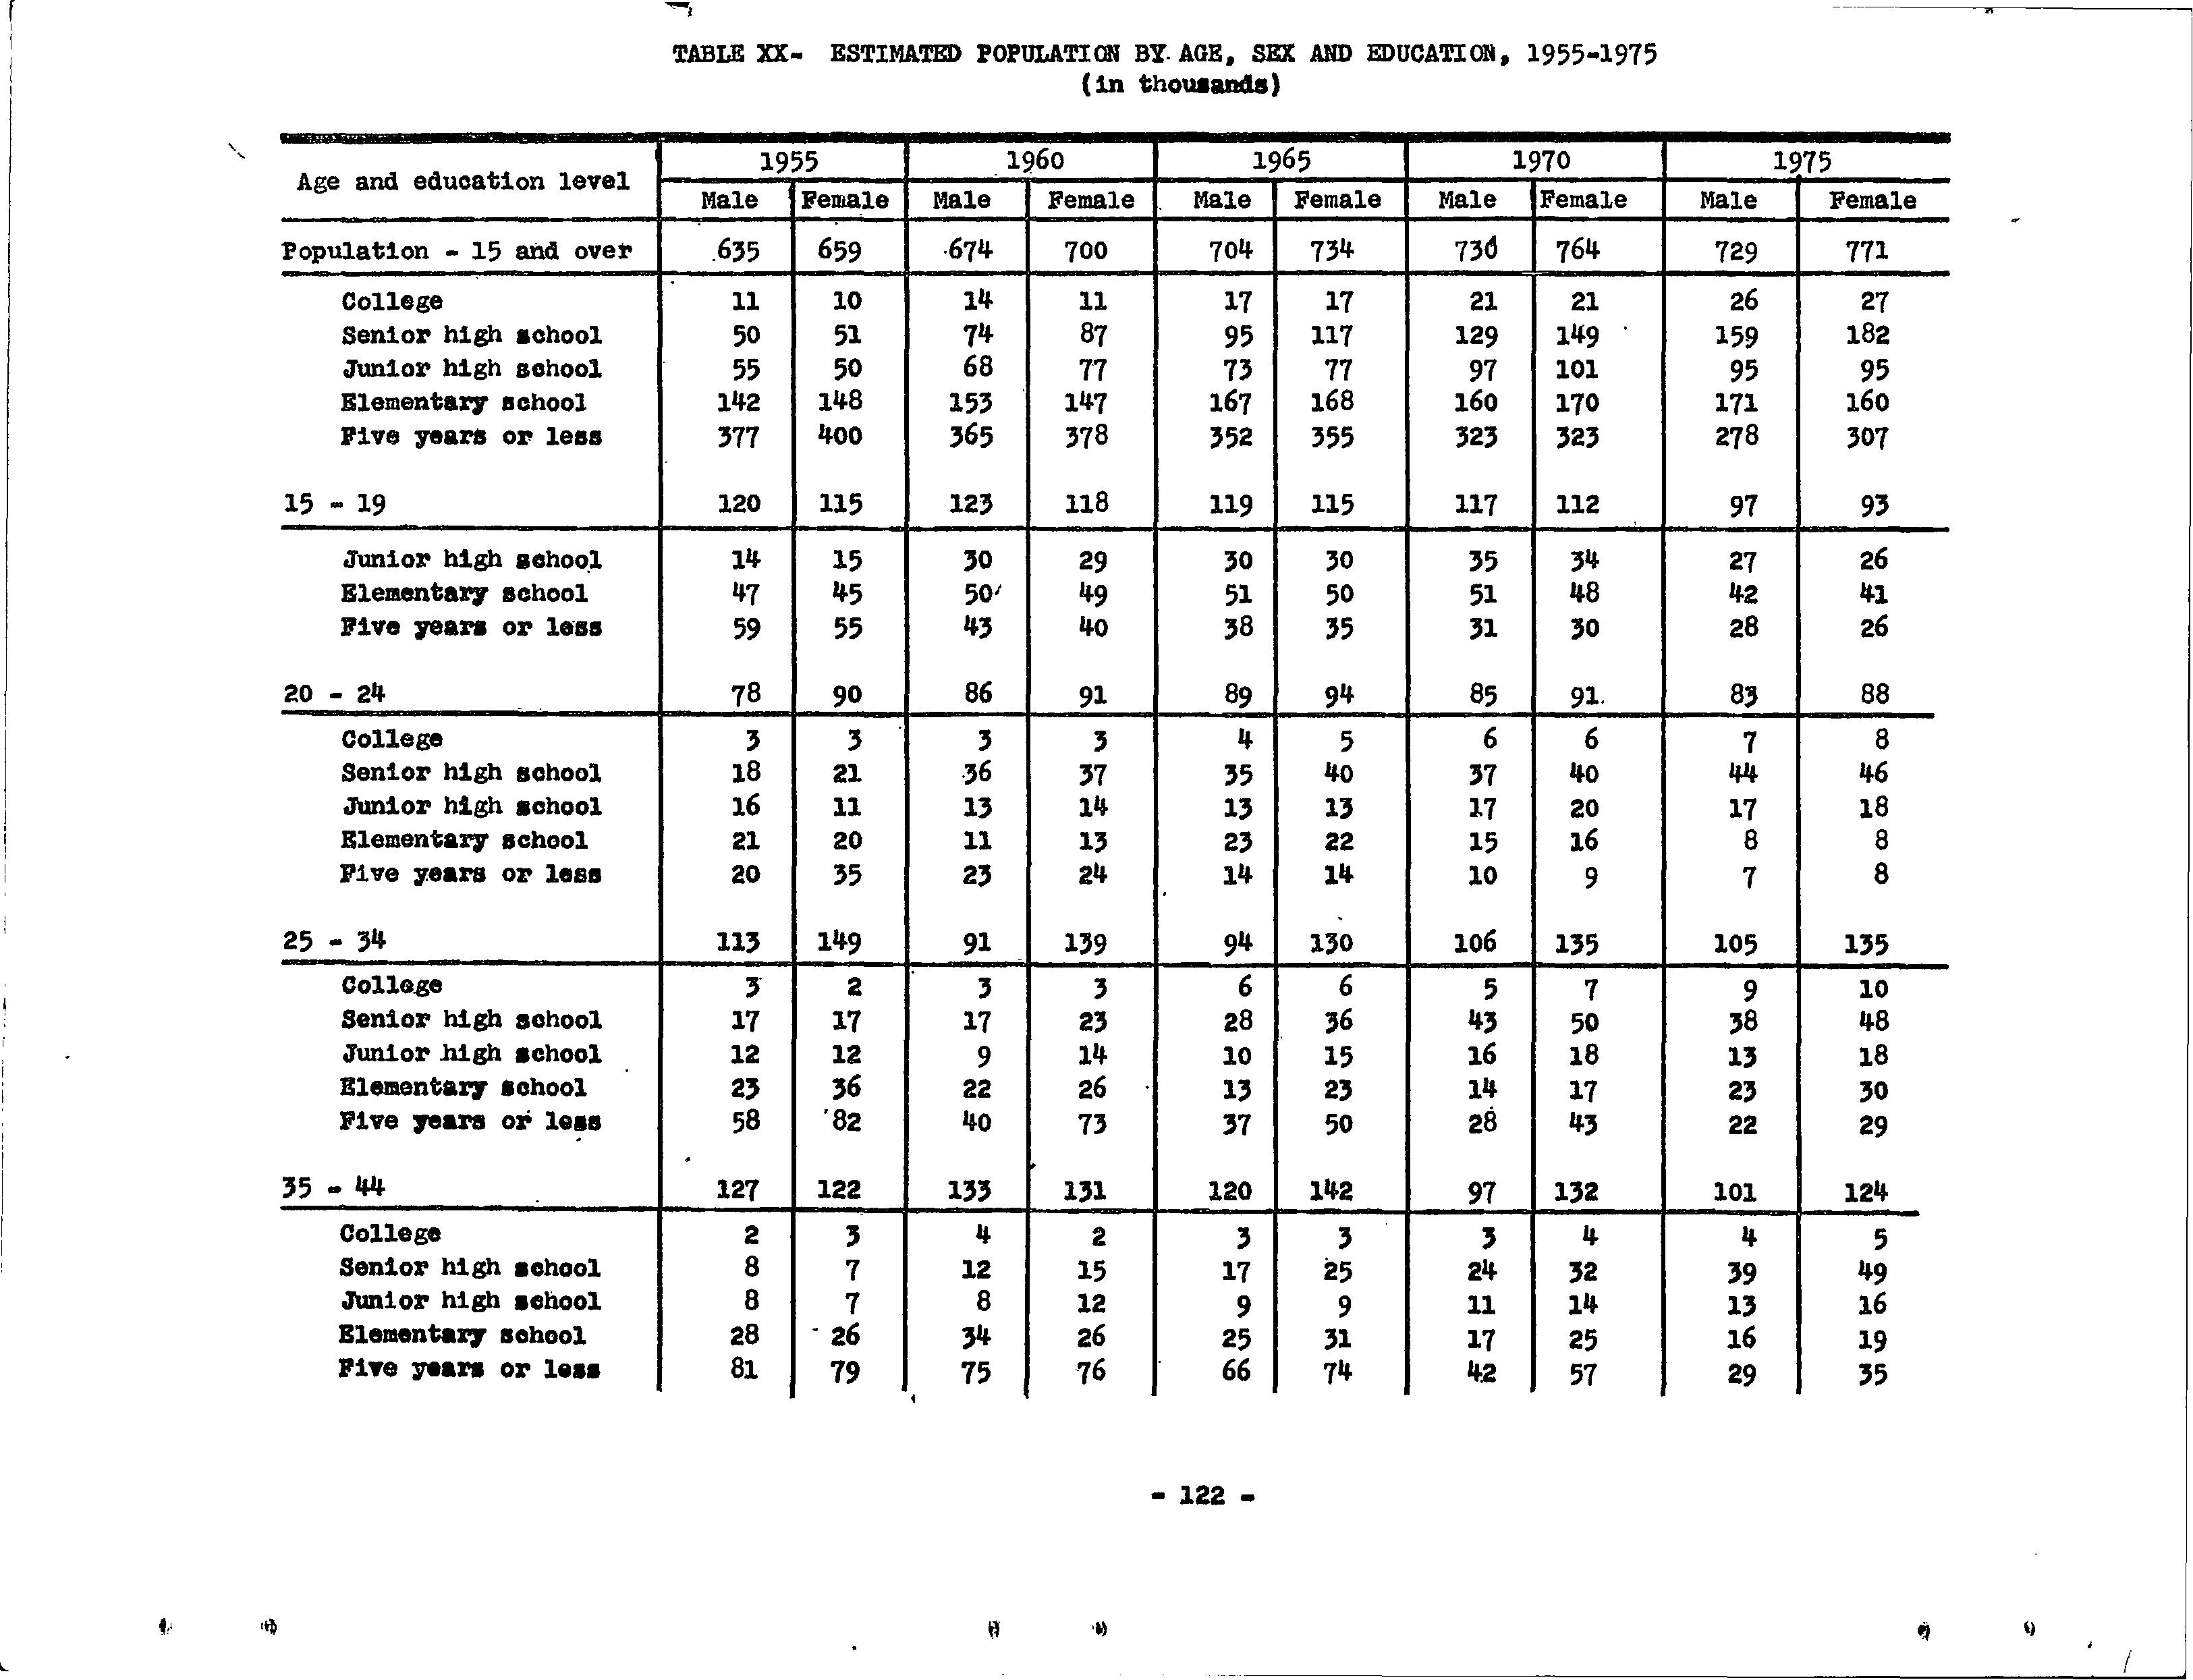
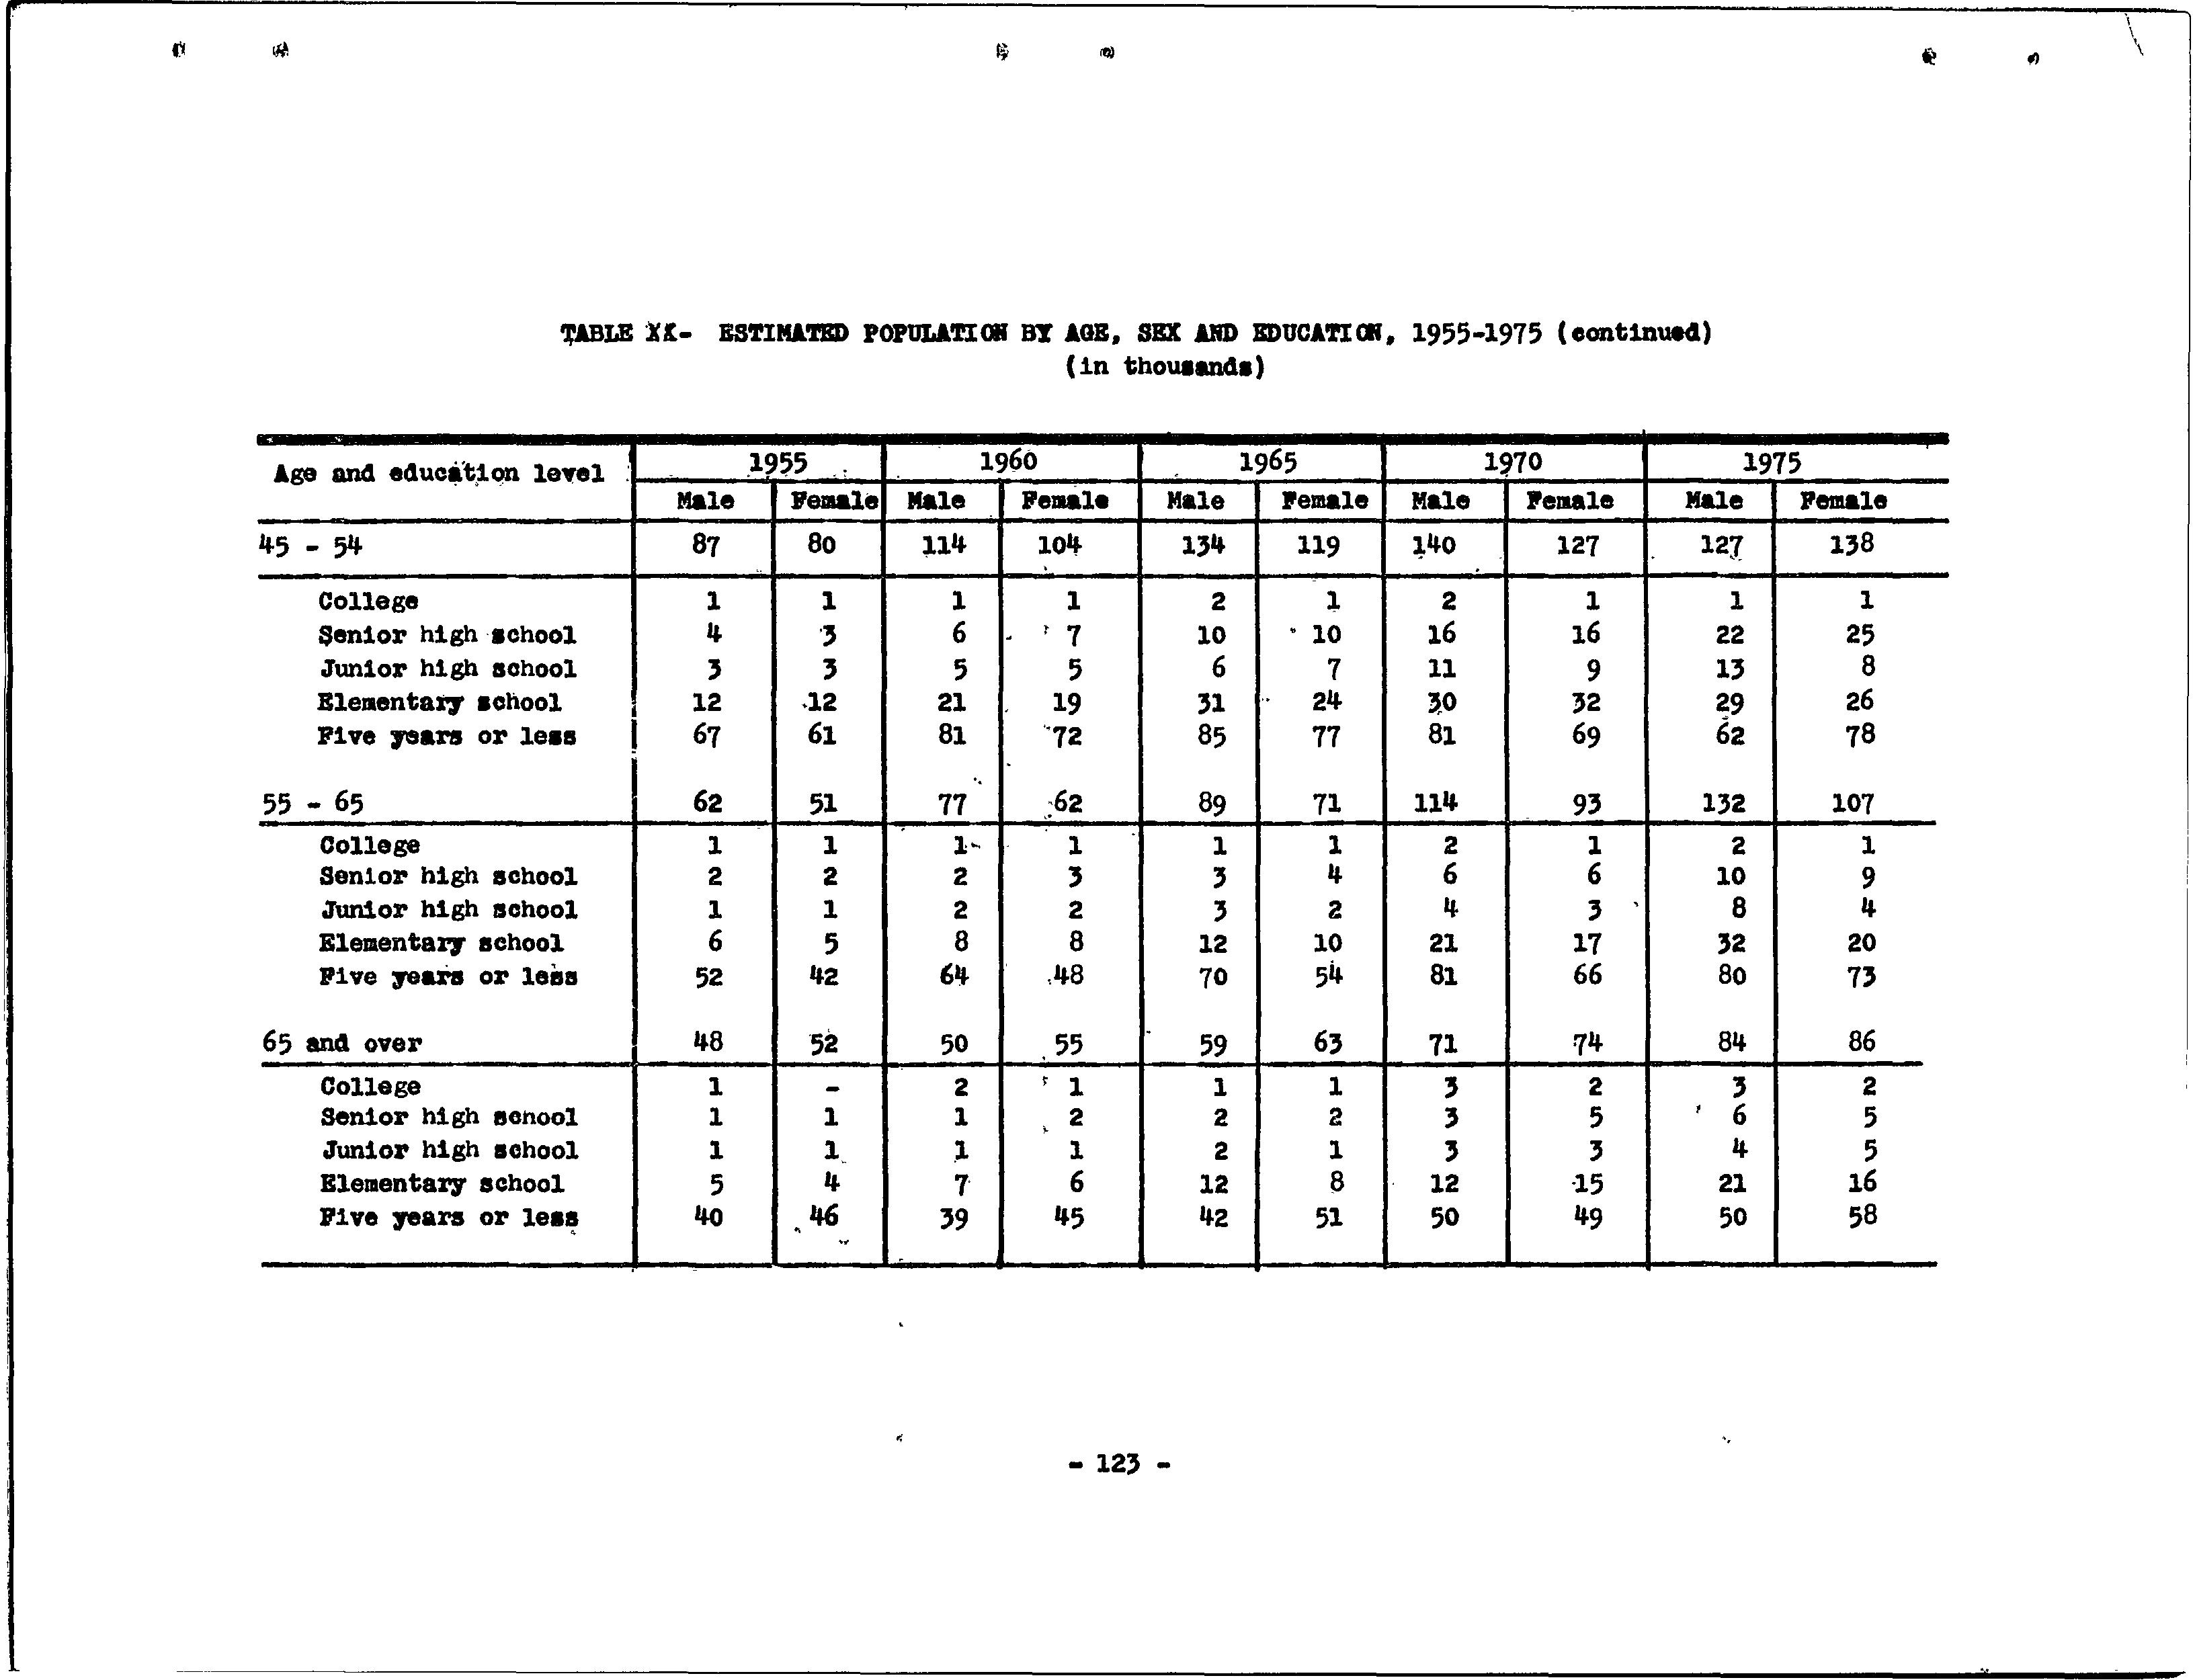
Population estimates for Puerto Rico 1955 to 1975 are shown in .table 10. - Note the increasing size of the population of labor force age -while the total population actually declines after 1960.
TABLE 10- POPULATION BY AGE, 1955-1975
Thousands)
(Age 15 and over) 1
1/ Throughout this report the population of labor force age is defined as the .·population :,~ge fifteen and over; inclusion of the fourteen year olds '~ould have increased the labor fo-rce estimates only by about five thousand .and would greatly have complj.cated our estimates.. by education level.
Schoo'I Enrollm;ent .and. Jetentlo.n R.ates
Our ~:tailed a.nalysi~ of -enrolhnent and retention rates -is·· ce.ntered ·on the day school pr-ograms of the public .and private s.chools .. Students il). night and extension courses and in the • adult~ ve~-rans 1 educa1;ion. program:s have not been ieft out of account but the num.bers of pe:rs.ons attaining various leve1s. of education thru these n1.e.ans have been estimated as a variable perc~Irl:~ge, ·b~sed on actual trends, of the corresponding day sch.c;><;?l g=!-"aduates. Since these special educational programs seldom include ~ore than a small percentage of any age group, it • would be difficult to make reliable, detailed estimates of future enrollment and retention rates £or them
.. We have assUined, on the other hand, that it is possible to".ift:oJect initiai enrollment and retention rates .for the .day school progr~ms of P~erto Rico, which account 'for over 90% of the educational output at all levels of education. But as·we hav'e said before. we do not regard these. projections as p+ecµ.ctions of what will actually happen. We expect, rather, that our estimates of shortages in the higher education brackets vri'li cause every effort to be made to raise the proje.cted enroll:me-nt and retention rates. Our projections, then, are pased on t,r-ends indicated by past data and on-existing, specifi.c commitznents to expan.d educational facilities at various levels. We h ..aye_ called these projections e.stimates of the "normalJ', educational supply in contrast with the educational supply thatwould result fro;m an 11 acceler.ated 11 education program, w;h.ich-we hope will develop as a result of these projections. !·
I r~
The number of persons. who ..reach each level of educ.ati;on ultimately depends upon two factors: (l) The num.ber who enter the "first-grade and (2) the extent to whi:ch the school system retitins· them from one year. to th~ next on up to the high~r·grades. These projections assume that retention rates· in Pue•rto· Rico will incre.a.se, but on the other hand, that lower birth. rates and migrati6n will cause' first grade enrollment to decline ...
5. Estimates of First Grade Enrollment
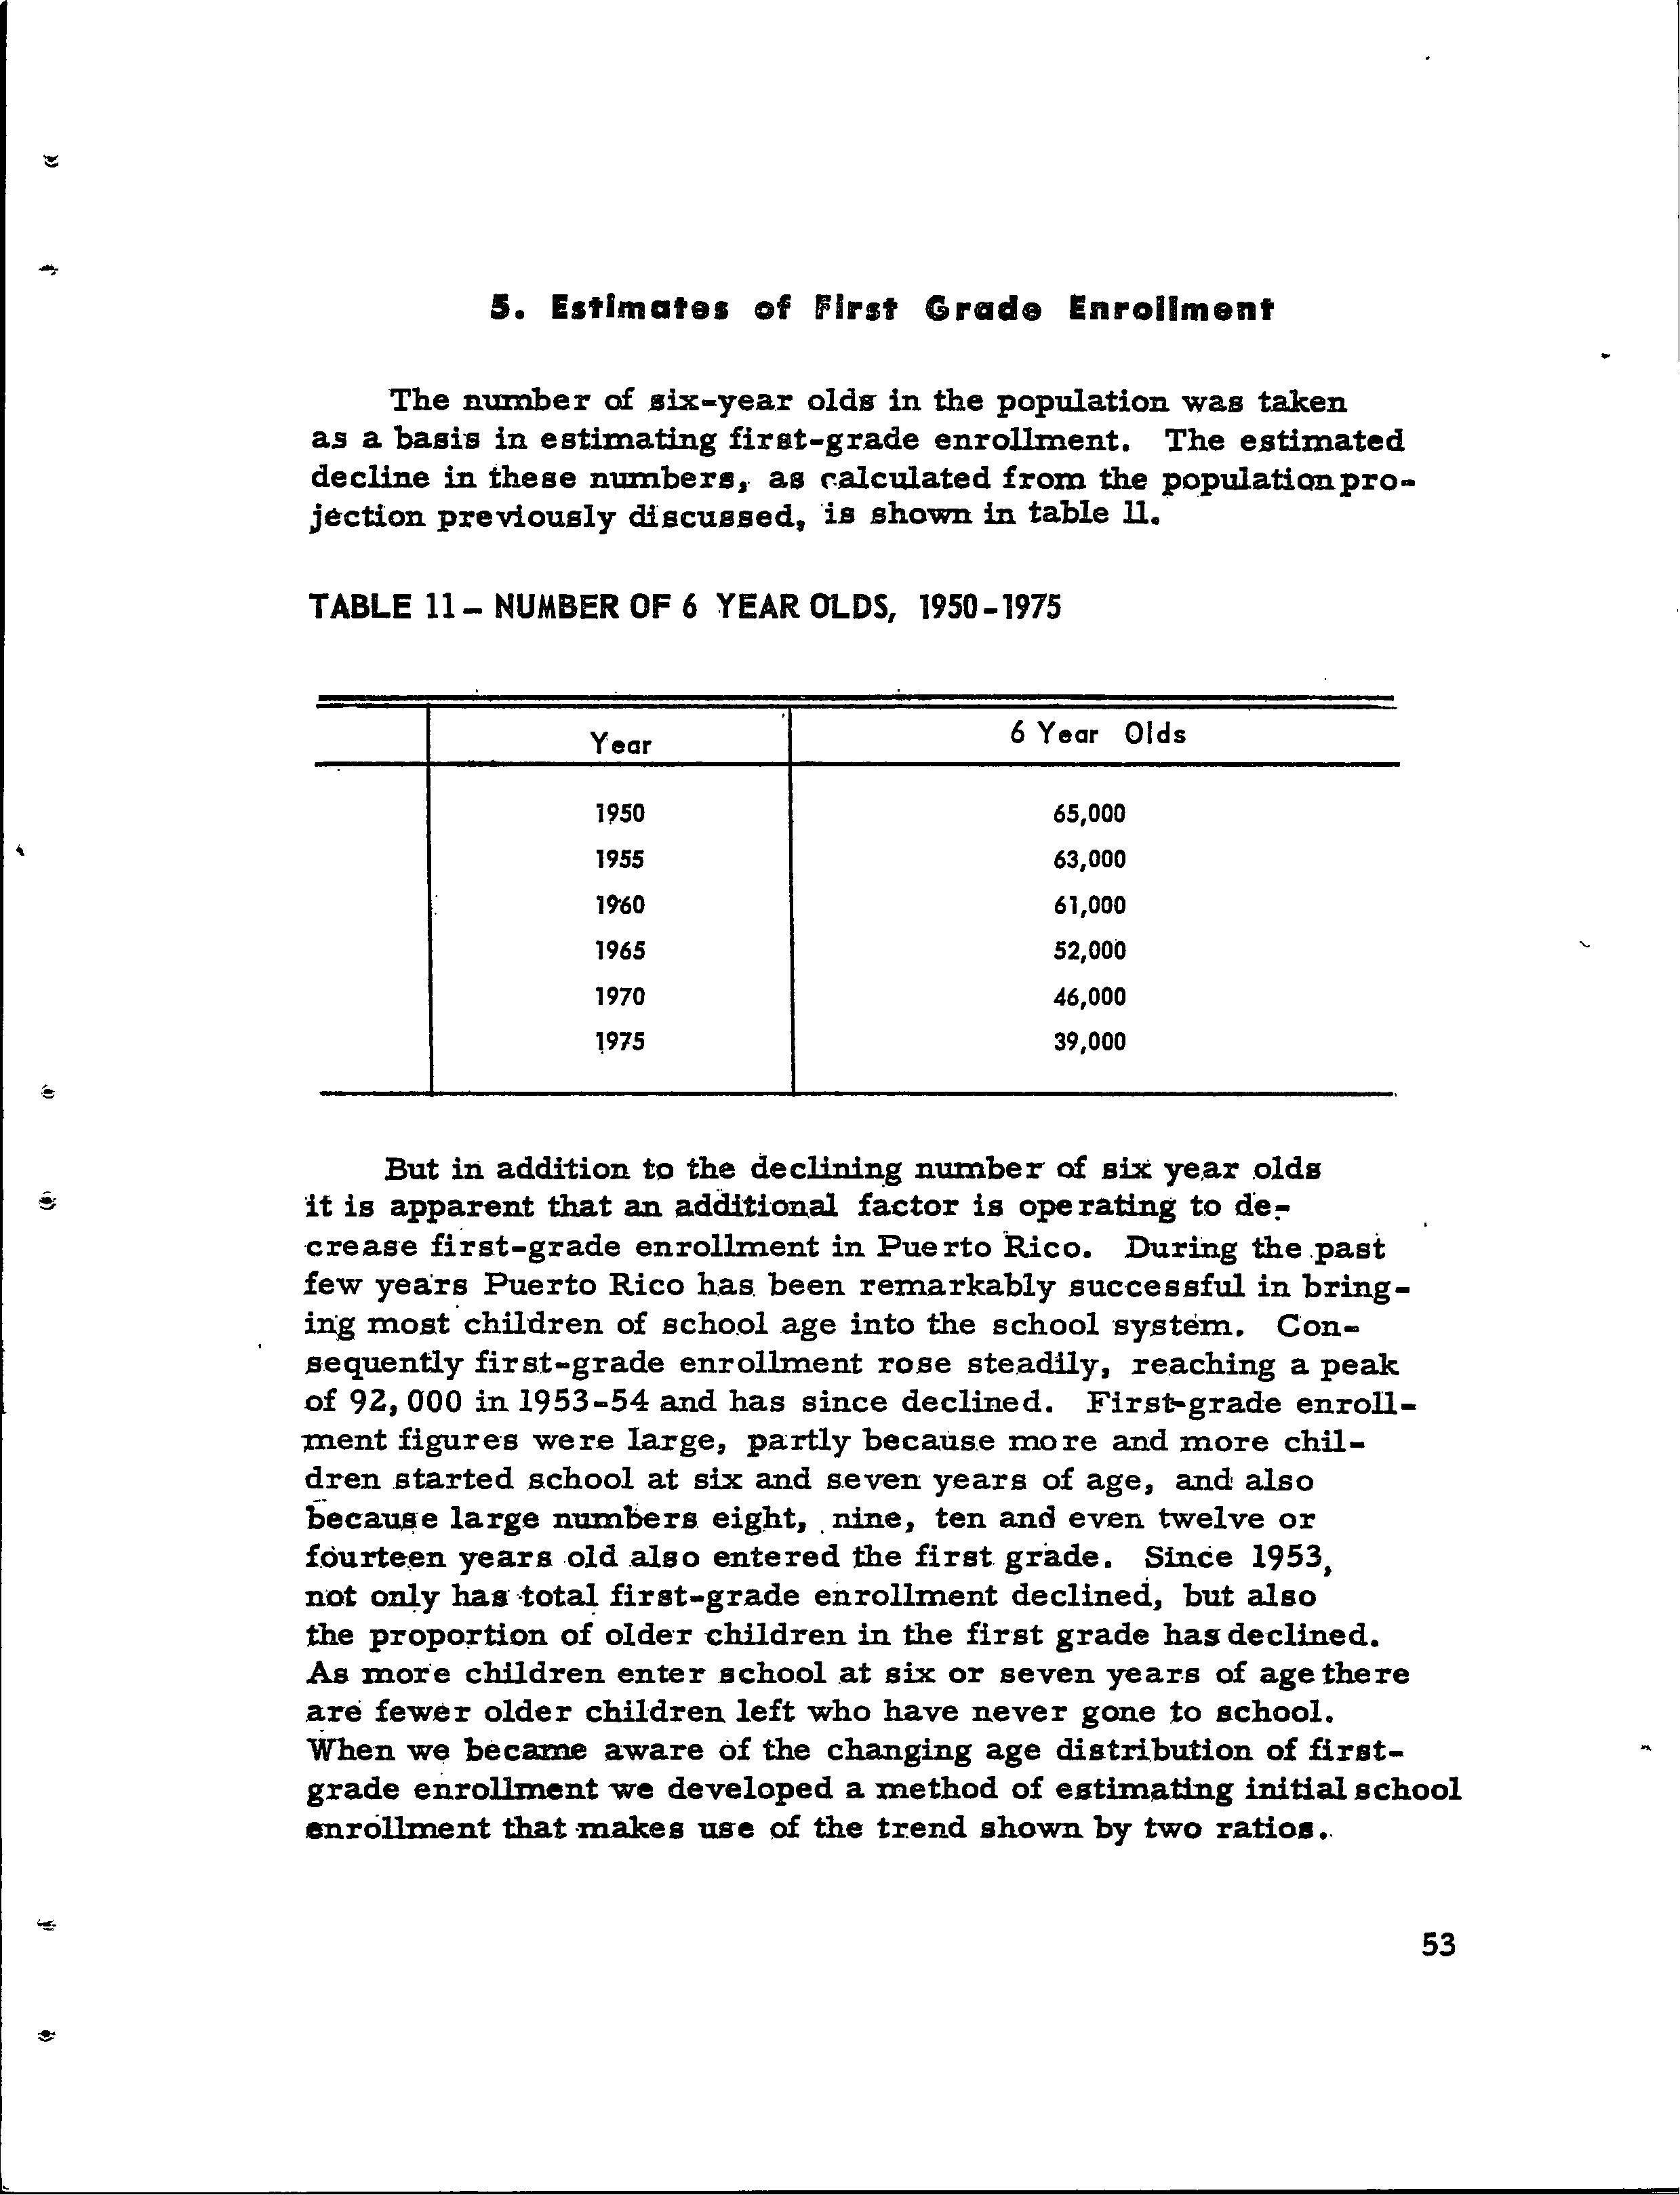
The num.ber of ,aix-year olds- in the population was taken as a basis in estimating first-grade enrollment. The estimated decline in these numbers,. as r.alcul.ated from the populationprojection previously discussed, 'is shown in table ll. • •
TABLE 11- NUMBER OF 6 YEAR OLDS, 1950-1975
But in addition to the declinb~g number of six ye.ar .olds it is apparent that an additional factor is operating to de=crease first-grade enrollment in Puerto Rico. During the .past few years Puerto Rico h.as. been remarkably successful in bringing most· children of scho.ol age into the school ·system. Consequently first-grade enrollment rose steadily, re.aching a peak of 92,000 in 1953-54 and has since declined. Firs~grade enrolllTlent figure·s were large, partly becau.s.e more and more children .started school at six and a.even years of age, and also because large numbers eight,. nine, ten and even twelve or fourte.en years old .also entered the first grade. Since 1953, not o~y has -tot~ first-grade enrollment declined, but also the prop~tion of olde·r -children in the first grade has de-clined. As mor·e children enter school at six or seven year.a of age there .a:re few.er older children left who have never gone to school. When we becmne aware of the changing age diatri.bu.tion of firstgrade enrollment we developed a method of estimating initial school enrollment that -makes use of the trend shown by two ratios ..
The fir.st ratio is:
Number of six-year olds in first grade
Total number of six-year olds in _population
Between 195.0 and 1955 this ratio increas.ed .as shown in figure 8. On the basis of the trend shown in the five-year period 1950-55, we have projected the ratio as shown. The figure 60 ~. US'ed as a limiting value, was the proportion of all sixyear olds who were in first grade i;n the United States inl950, which we assume had reached a rel.atively stable situation with regard to the age at which children enter school.
The second ratio used to estimate first-grade enrolhnent is:
Number of six-year olds in first grade
Tot.al fir.st-grade enrolhnent
We. have assumed that total first-grade enrollment is afunetion of the number of six-year old pupils in first grade. We can calculate {rom population figures and the previous ratio, the number of six -year olds in· first grade. If we als.o know what proportion of the first gr.ade the six year olds repres:ent, we can estim.ate total first-grade enrollment for any year. The historic and projected values of this ratio also are shown in figure 8. Dividing the number of six-year olds in. first grade in any one year by the estimated numerical value of the abov~ ratio for that y.ear., we es.ti.mate total first-grade enrollment for that year.
By extending the second ratic;> to ·the same nu.me :r:ical value as the first, namely, 60o/o, we are a,suming that by 1975 f~r:stgrade enrollment will exactly equal the number of children born in Puerto Rico six yea;rs earlier, who reach s.chool age. As long as the second ratio is. lower than the first, it meanl:i that more children a.re entering school, than are reaching school age. This is a.. phenom.enon that .can occur temporarily (as in Puerto Rico today where -many older children are now beginning school) but it cannot go on for.ever. Eventually first grade enrollment can be no larger than -die number of children who are born $ix years earlier.
8
It should b.e ·noted that while the two ratios are .eBtimated to reach the same limiting v:alue of. 60% 1 they reach it .at clif.fe·rent thnes. Therefore, .both of the above estimating steps are necessary at the pres.ent. From. 1975 on we c.ouid .uae sim.ply the nu:mber of si»-year olds in the populatio11 as .an estbna.te of first-grade enrollm.ent.
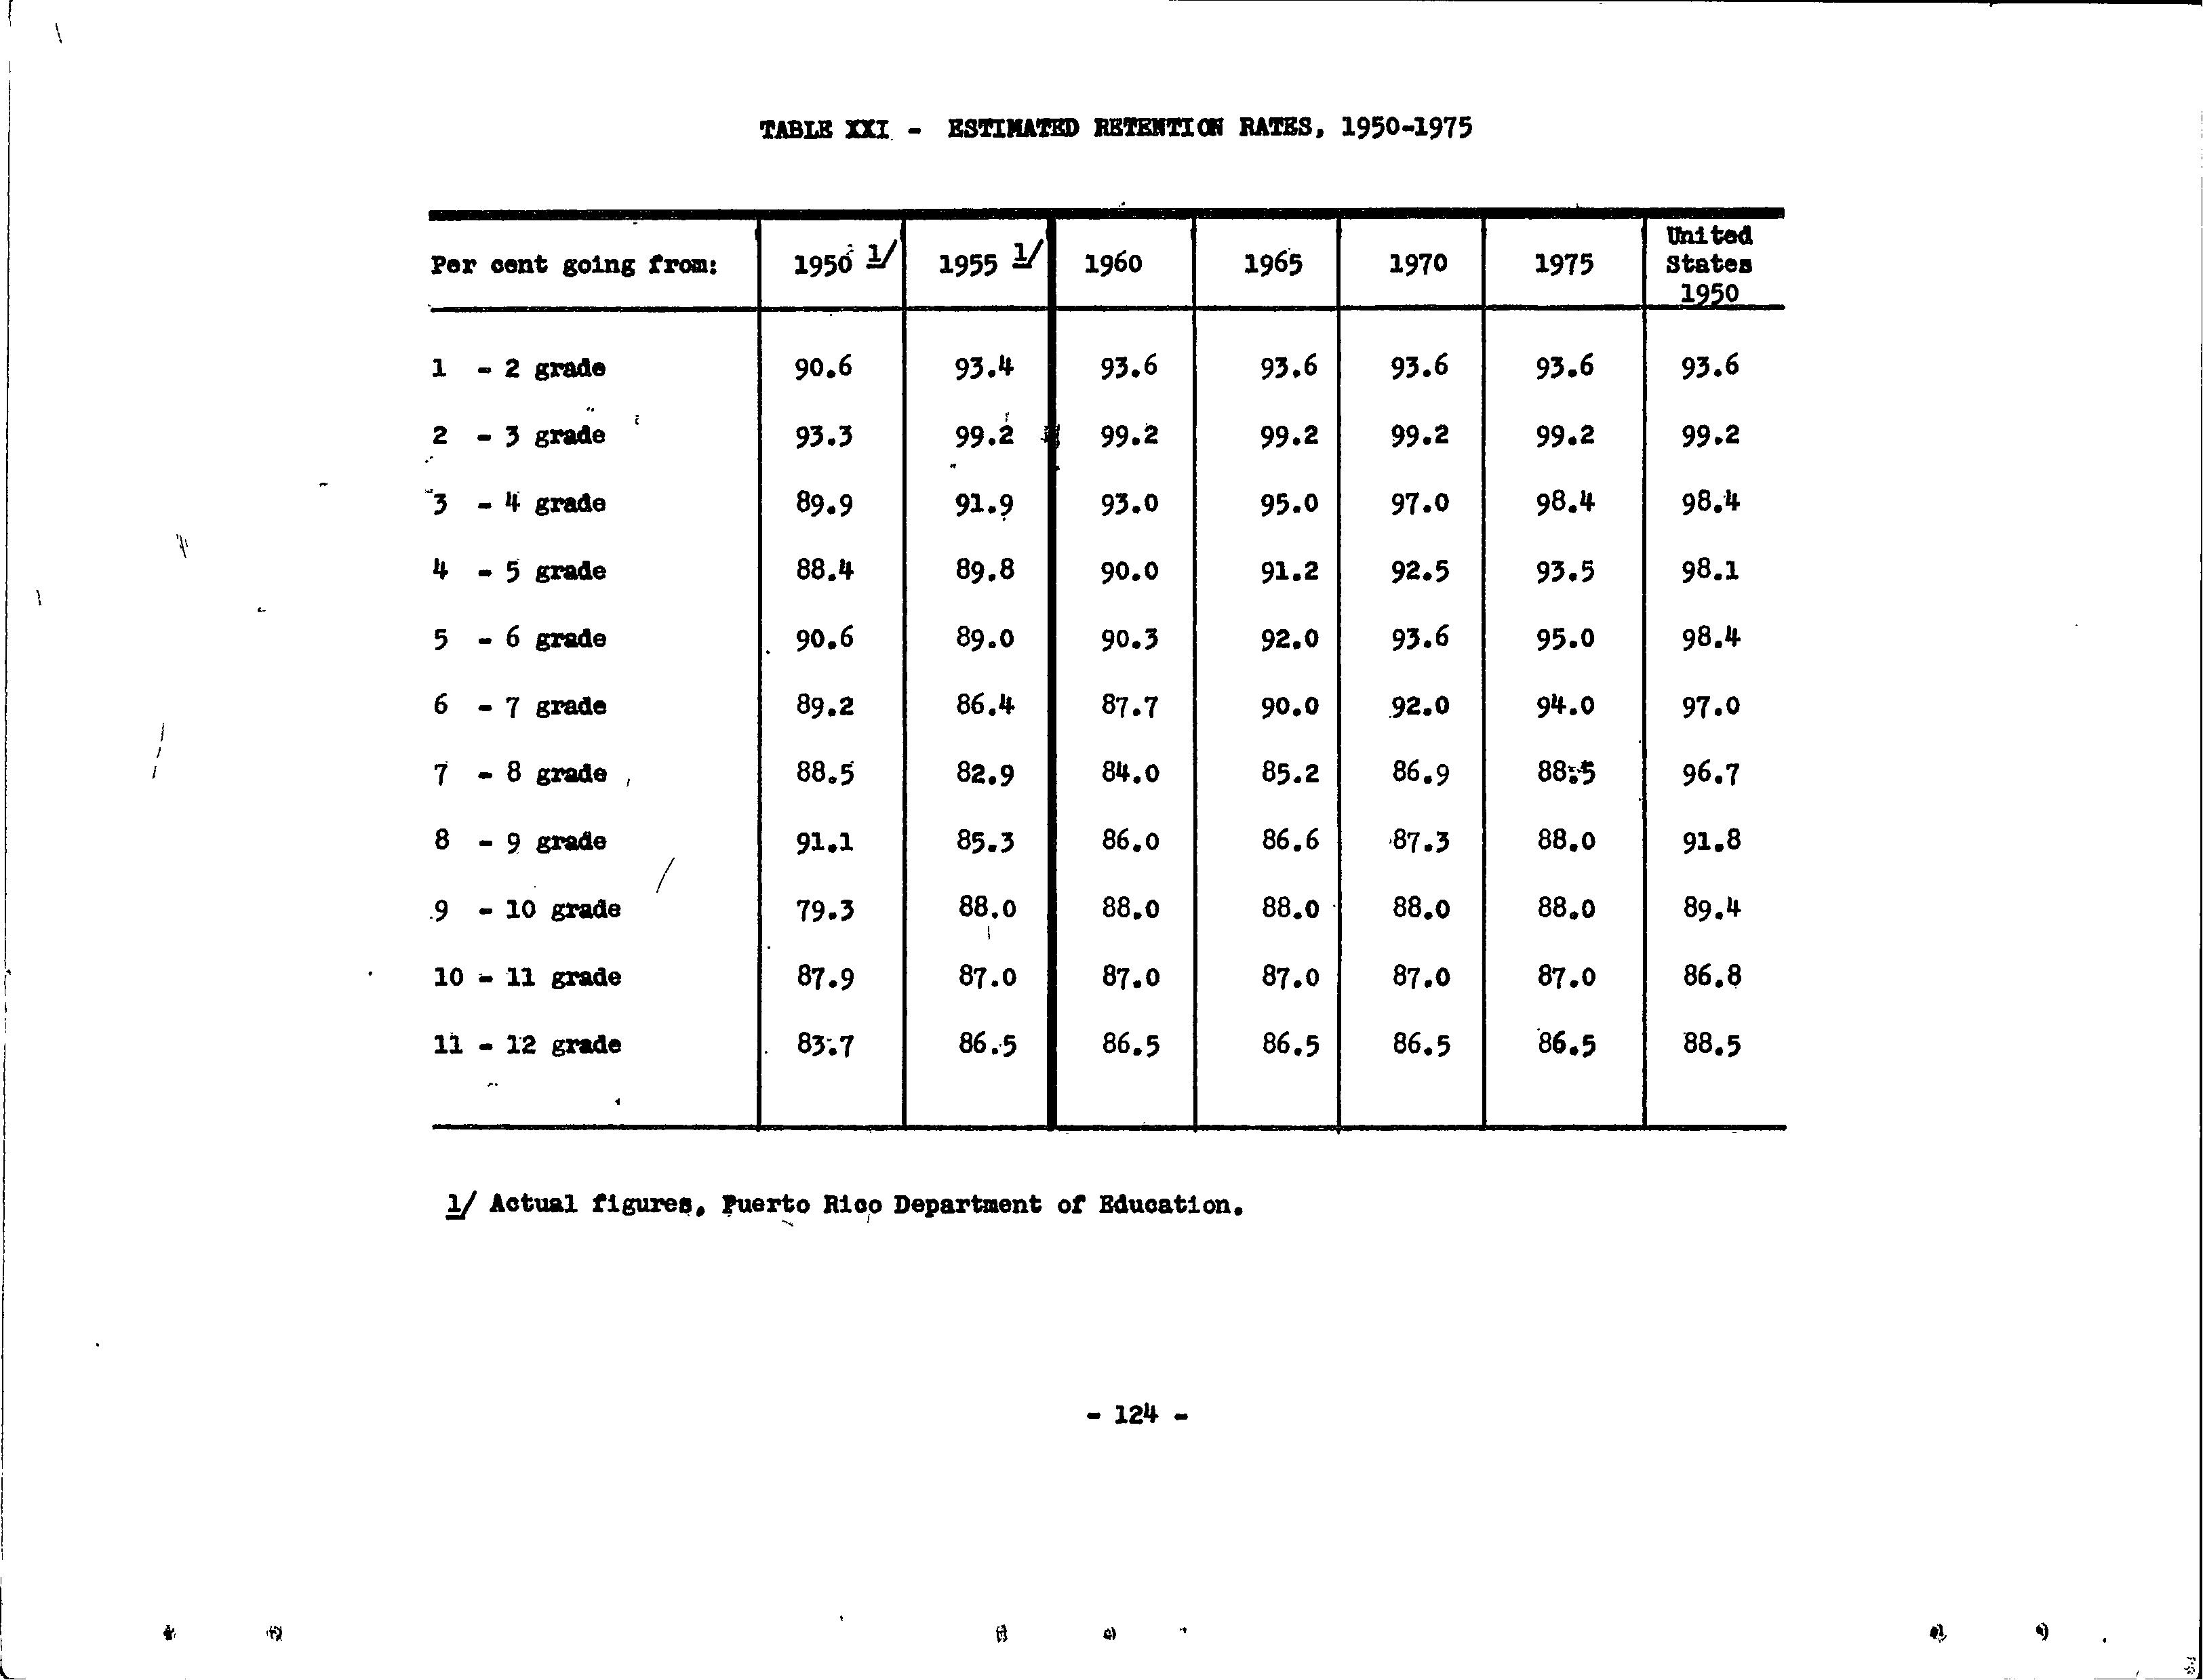
6. Estimates of Retention Ratas "
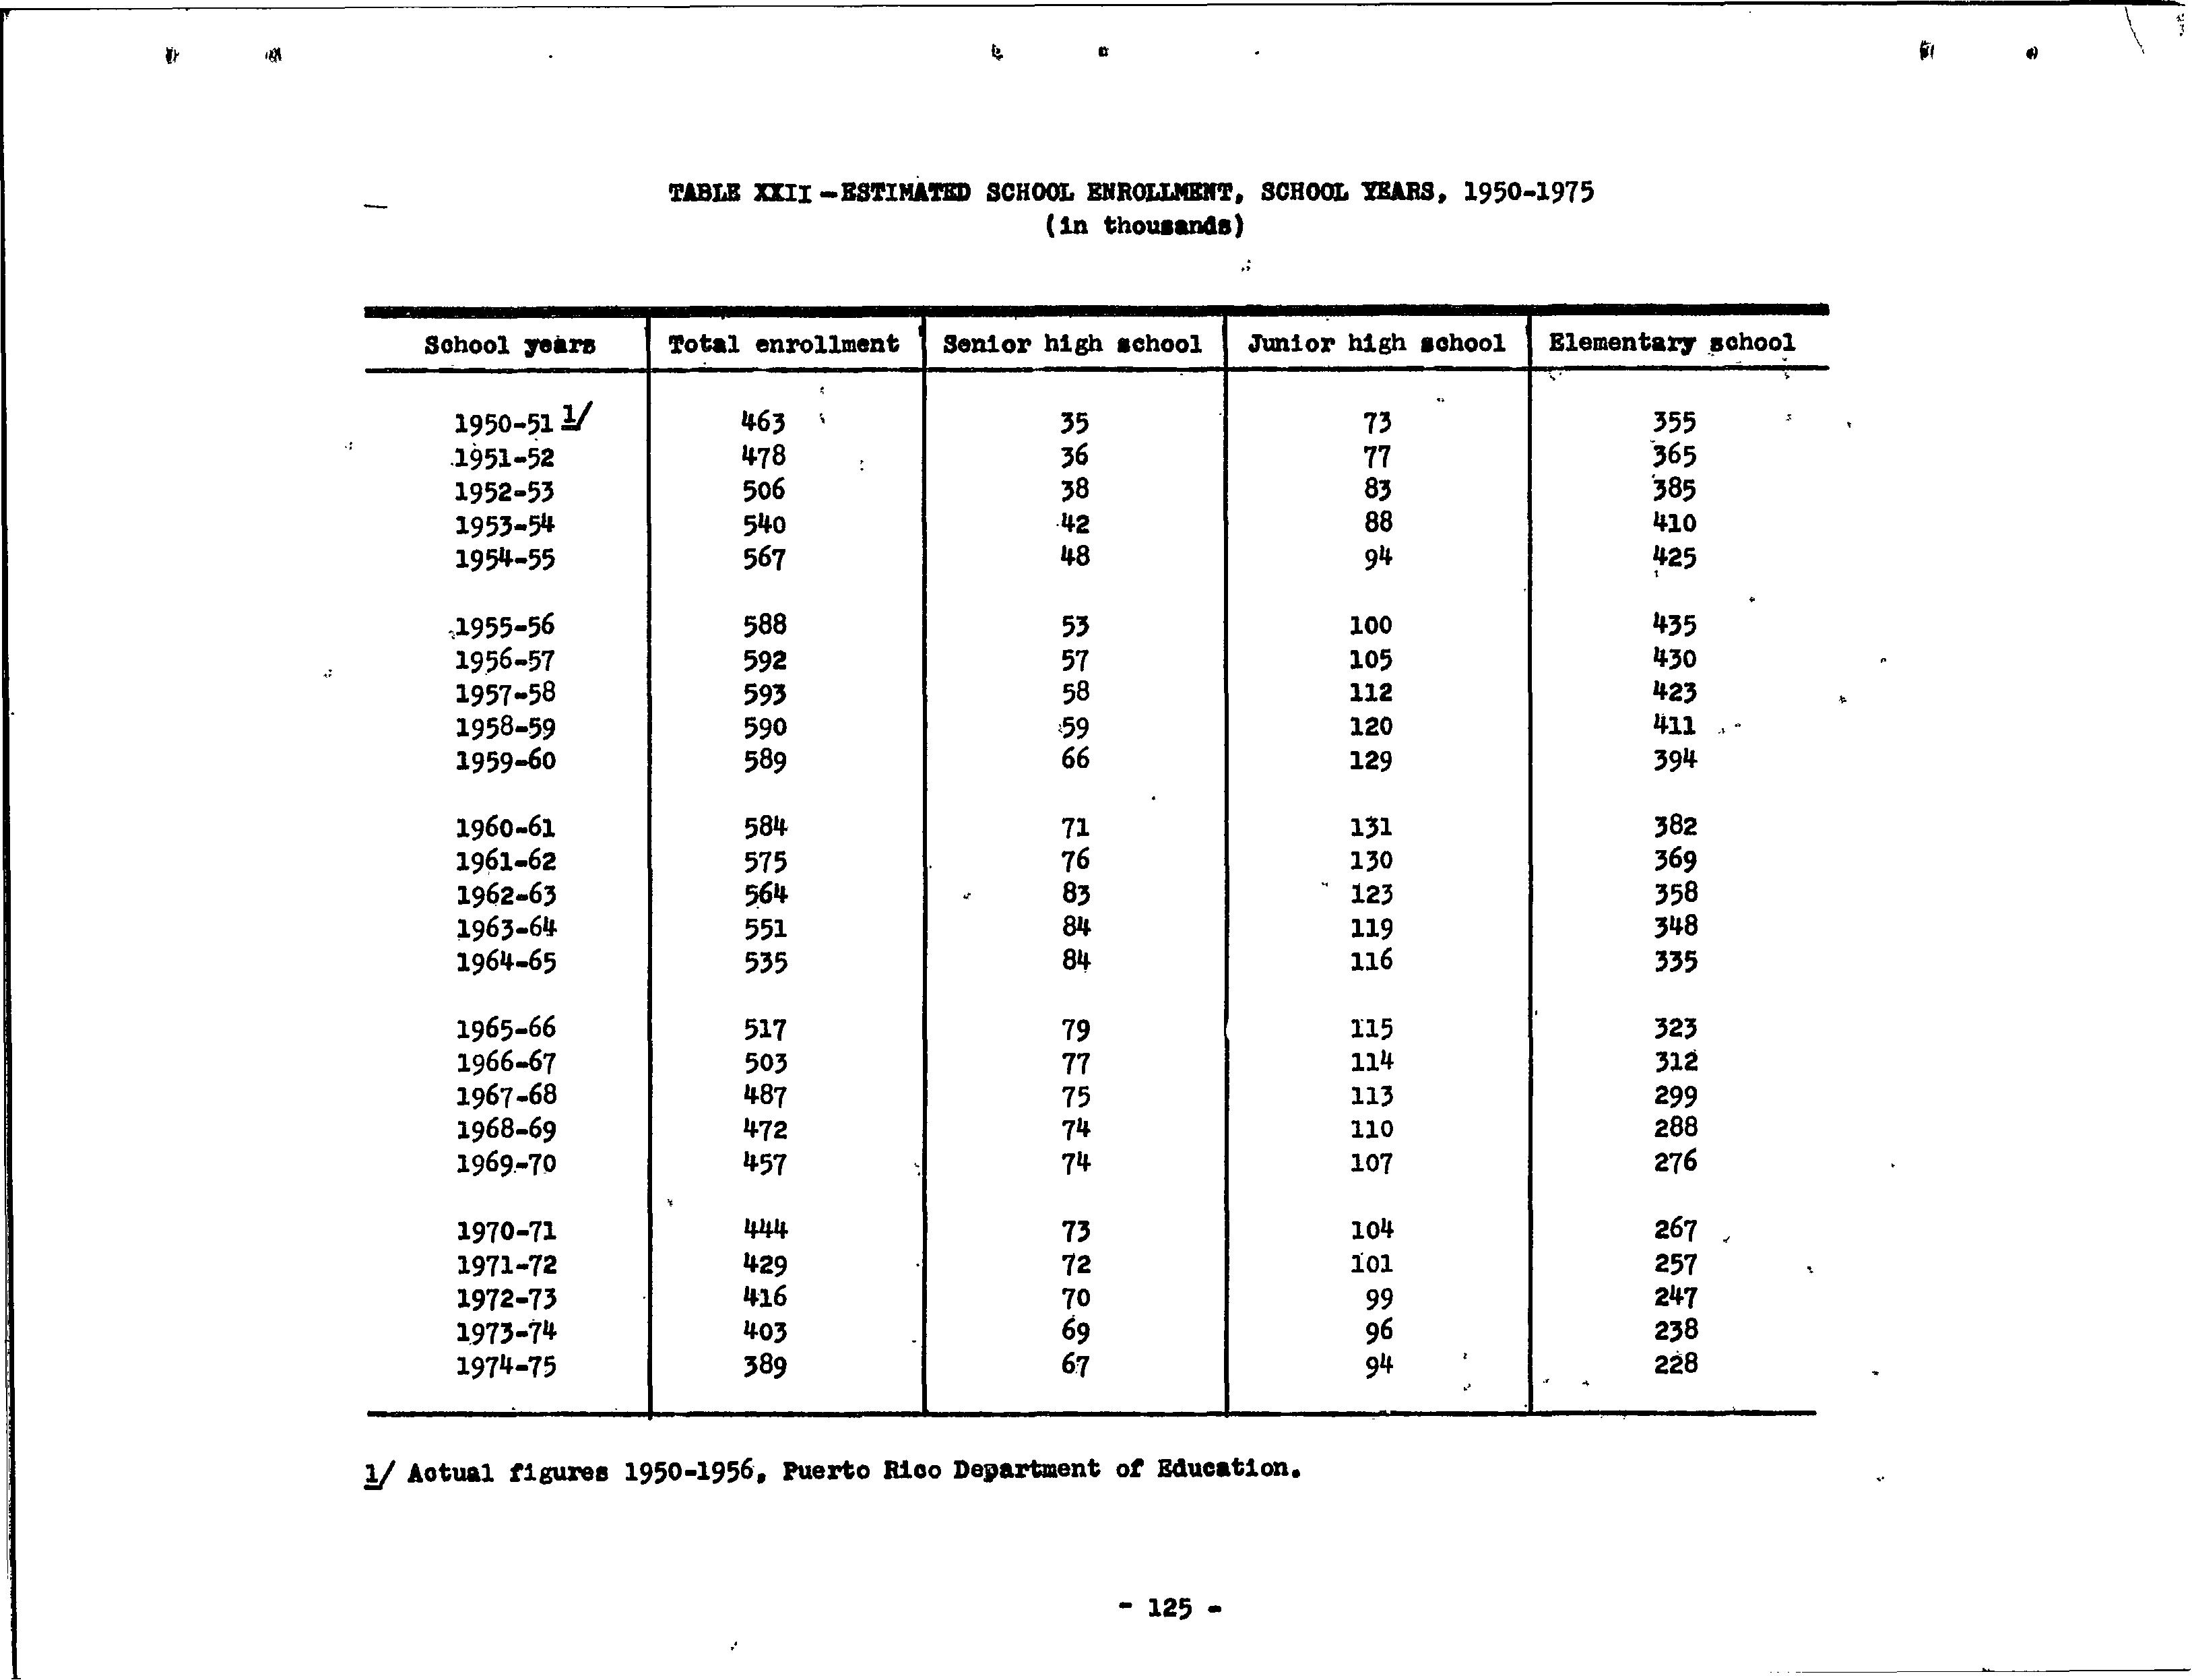
The. 1950 United States· retention ra-.:es were us.ed as limiting values in estim.ating future rete·ntion r.ates in Puerto Rico. Up to the third grade and also in senior high school Puerto Rico has retention rates approximately equivalent to United States 1950 rates.. Fr.om. the fourth to the ninth grade the number of dropouts in Puerto Rico is much larger than in the United States. Moderate increases in .retention we·re projected for thes~· latter grade~s but in only one case did they reach United St.ates 1950 lev¢1s. These proje·cted retention rates we~e used to estim..ate future sch~ol enrollment from first to twelfth grade. Tables XXI .and xxa in the appendix show retention rates an.a 1:otal enrollmeJ1t figures at each level.
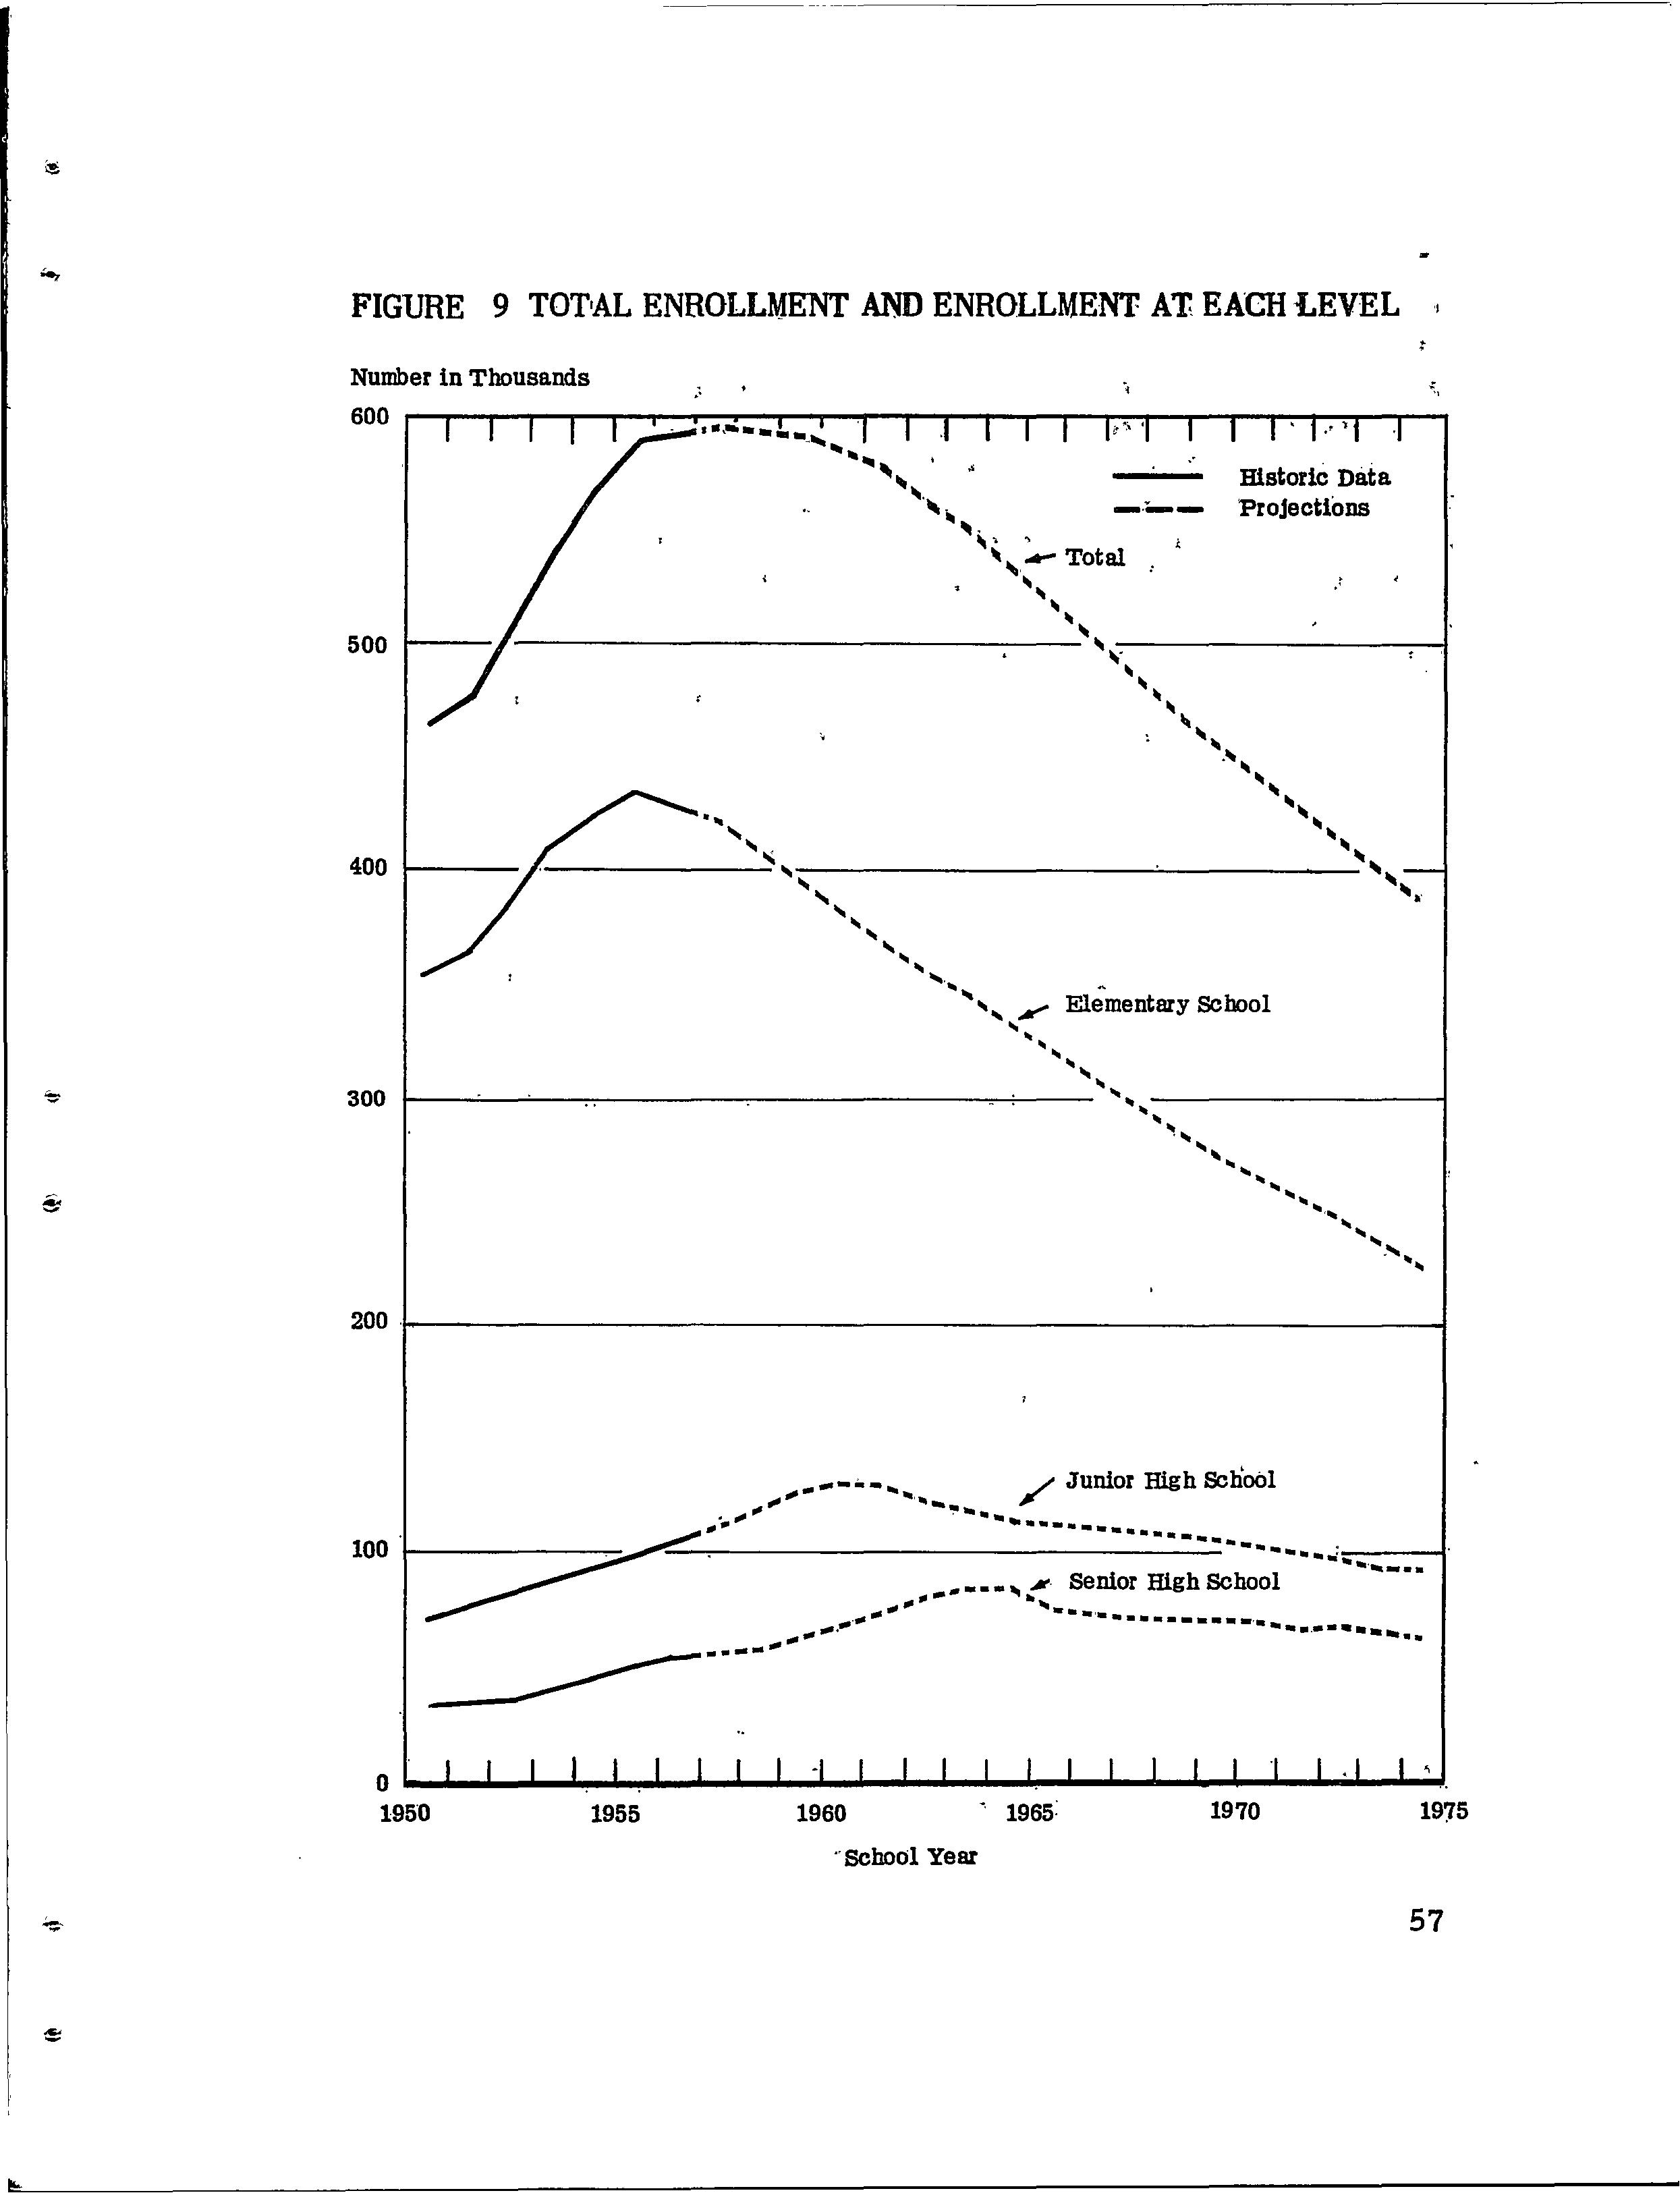
Tt is interesting to note that even with an increase in retention, the drop in first grade enrollment causes an overall drop in the s.chool population as shown in figure 9. This creates a planning problem for the Education Department which .at the ·elamentary level must provide for a, declining enrollment and at higher levels provide facilities for an expanding enrollment. However, if these characteristics of the future school population are known, future pl~s and expenditures can be made with greater efficiency and economy.
7. E&tlmates of Graduates at all L.evels
The day school enrollm.ent fiJ!l,lre.s .obtained by the previo1;1,s step wer.e used to estim.ate nlU?lber of gradua-.:es .at all levels~ College and senior high .school graduates were estim.ated as a proportion .of twelfth grade enrollment, junior high school gradu•
FIGURE
9
TOT•AL ENROLLMENT AND ENROLLMENT A'E EACH
-ates _a's' a proportion of ninth grade enrollment ·a;nd elementary school graduates as a proportion of sixth g·rade enrollment. We worked out past ratios of graduates to enrollment for ·each o~ these grades and, except at the college level, we ·considered separately the ratio of day and night school graduates to enrollment. In projecting these ratios we considered such factors as the historical trend, th~ planned expansion of e_dt1:cational facilities and the interest in education that has been shown by the Puerto· Rican people. Larger increa.ses were projected for night school graduates than for day school graduates because, while day school enrollment is dropping, the population twenty to thirty five years of age, from which night schools draw their student body, is increasing.
8. Estimates of Education Level of the Popul,atlon
In estim.ating the net munber of graduates added to the population during each five year period, we have had. to consider the losses through death and migration. Associated with our population projection which estimates the ,changes in each age cohort in each- succeeding five year period, we have· survival rates (which combine mortality and migration) for ea-ch age and. sex group at each five year period. We used these rates to calculate the net· nUinber of graduates to be added to each age and sex group at each level of education in each five year period.
Our estimates of elementary school graduates include those who have gone on to junior high school but have not graduated (those with 6-8 years of school). Junior high school graduates include those who have gone on to senior high school but have not graduated. High school graduates include those who have gone to college but have not graduated .. The estimates do not take account of people who receive degrees outside of Puerto Rico.
Our estimate of the population .with five years of school or less is. obt.µned by subtrac:;:ting ·from the total n1,1~ber in eac:11 age arid sex group all those who are elementary school graduates or graduates of higher levels of school.
It is perhaps worth while pointing out ,that· ·ce.nsus, cate,gories of education level do not ·correspond to :the,e:ducational categories we have used and have. had to be adjus,ted. The categori~s in the census were designe~ when the· American. schools operated on an 8-4-4 system. Now,. although. the American school system follows a 6-3-3 sys:tem. and re:c:en.t degree. dat_a are available only on this basis, the census: clas-sification still iollows the old system exclusively .. ·This. cr.e:ates: a problem for anyone working with c.ur.r.ent educational data
Estimates of the number of persons in the population. of labor fprce age, who will have completed each educationaI level, are shown in table 12 for each fifth year be.tween 19-50 and 1975. Estimates for each of those years by age, s.ex and. education level are shown in table XX in. the appendix.
TABLE 12-EDUCATION LEVEL OF THE POPULATION, l9:50-1975i
(In Thousands)
9.
Estimates of Labor Force Participati.on. R.ates.
Estimating future labor. force participation rates in Puerto. Rico was a most difficult and provocative problem. Lab.or force participation in Puerto Rico today differs markedly from par.ti.-· cipation in the United States, due undoubtedly to differ.ence:s in cultural traditions, the nature of the two economies. and thea:vailability of employment. It is difficult to assess the relative importance- of these factors and to know juat how the.y may change with further industrializ.ation in Puerto .Rico ..
Specifically:,. Puerto Rican men participate to a lesser extent than-United. States men in every age group below .65 but the differ,ences are more pronounced when we look at education levels ·within· each age group. While in the United States high school and college graduates participate at approximately the same .rate: as the total age group, in Puerto Rico, junior high school, senior high .school, and college graduates participate- .at a m..uch lower rate than the two lowe.st education groups. Part of the r.eason- for this is that large n-qm.bers of Puerto Rican men are now utilizing veterans benefits to extend their education.
,_ Whe:i;i: we look at the rates for women the picture is quite different, ,While women in each age group also participate at a lower rate than in the United States, the educated we.men in all age groups participate at a higher rate than the group as whole and at .a higher -rate. than the women of the same age and, education in the United States. The rate is increasingly higher for each higher level of education. The difference between Puerto Rico ·and the United States seems much easier to explain for women than -for men. The women are much in demand ~nd, in addition, care of young children presents much less of a problem in Puerto Rico, where the extended family is still common and maids are still available, at low wages.
In trying .t:o estimate how these rates might change with increased industrialization we weighed many factors: the increasing demand for trained manpower; the rising standard of living with higher salaries for men (and consequently less pressure for women to work); the growing shqrtage of maids; the previous low participation rates fo"J: educated men; the effect of growing job opportunities on both sex groups at all age and educational ievels; the fact that women have been entering the new fac.tories in larger numbers than men and that this, ratio· is· ·now being reversed; the recent expansion of the school: system causing younger people to have more education than o1de r pe-ople
On:e .of the biggest questions was whether educated women would· con/1:inue to participate at the present high- rate. The rate in 1950 for college women, age 45-54, was 75. 2%.
ln view of th:e changing conditions already mentioned, i. e. , higher salaries for husbands and growing maid shortages and considering that women college graduates were a very small and select group in Puerto Rico in 1950, it seems unlikely that the very high.1950 rates will continue. There were also great uncertainties in projecting labor force participation rates for men since the historical data shows a declining trend which we must expect will be reversed.
We decided finally to use 1950 United States participation by age, sex and education, as a.modelfor Puerto Ricoin 1975. There was really no good alternative choice. Labor force participation data are of fairly recent origin and the existing data in Puerto Rico show a steady decline. Par~icipation rates 1nust rise if the projected future demand for workers is to be met,. and ther~ is every reason to believe they will rise in response to the steadily increasing number of steady jobs at steadily increasing rates of pay. Real uncertainties arise only with respect to how rapidly and how far labor force participation rates will rise and how this rise will be distribute¢!. among age, sex and education classes.
The 1950 United States participation rate structure is not so rnuch a prediction of what will happen in Puertu Rico in 1975 as a device for measuring what must happen if manpower demand and supply are to be in balance. To achieve a labor supply which v1ill match the estimated labor demand one of three things must happen:
(1) A sharp increase in the projected level of education,
(2) A radical change in migration patterns,
(3) A radical change in labor force participation rates.
If a supply of labor matching the projected demand were to be obtained solely by means of chang.es in labor fo-rce participation rates, almost all college graduates would have to be employed, women as well as men,. a very high propo1':'tion of both men and women high school graduates would have to seek employment and most of the people with less than five years. of education
would have to stay out of the labor force. Employ.e:r.s•would of course have to be willing to accept women.freely in ,place, of men, for this pattern of employment to· be- •realized:
Changes in,. the direction ip.dicat¢d in, the above paragraph will, of course, hav~ to oc_cur. The United State,s 1-9r50 laborforce participation rate-.s. can be viewed aa re.alis.tic. limits on the extent to which such changes a.re likely to .9ccur without .extensive action, not now contemplated by the Puerto Rican government. In other wor·ds, the use of the United States participation rate· s.tructur~ will provide conse.rvative estimates of how,much has. .to be done thru education or thru changes in wage structure, ·which might be expected -to· affect the migration decisions of many individuals ..
Table XXIII in the appendix shows participc!,tioitrates and table XXCV shows the estimated Puerto Rican labor force for each fifth year between ~95~ and 1975 by age, sex and educatio:q.. Table 13 shows the estimated labor force byeducation'levelfrom 1955 to 1975 .. The rates for each education class have their origin·s in the 1950census, which·provides the only recent data on labor force participation bylevel of education, but the census rates have been adjusted to Bureau of Labor Statistics rates for P.ach age and sex group. Rates for· the intervening years were obtained by linear interpolation.
TABLE 13 LABOR FORCE BY EDUCAT.ION LEVEL, 1955- 1975.
10. Fu.ture Research
Th,e task of estimating manpower supply, which looked· , routine in comparis.on with the task of estimat,ing demand, has been a. most illw:ninating experience. Exa.nrination of the· data has uncovered une_xpected problems so:rne of which have, been· partially· solved. Most of these prob!em~, however, remain on the agenda for future more comprehensive investigation. Some of the areas which should be examined in more detail in the next year• s work are:
(1) The relationship of birth rates to rural-ur'.b.an residence, economic status and level of education. We need to know how each of these variables is related to birth rates when the others are statistically controlled.
(2) The relationship pf age, sex, rural and uroan residence, etc. to enrollment and retention in school and to the choice of curric.ulum or type of school. The age, sex and residence characteristics of the population a.re changing rapidly.
(3) Occupational aspirations. of students ang. parents of students, at all levels of educati,on and the relationahip of these occupational aspirations to actual, later job· choices. The class structure and the job aspirations of the population are in course of rapid change.
( 4) Night and extension courses and other forms.c of adult education, including the g~anting of degrees by examination. These programs are growing and must· grow even-more.
(·5) The effect of military service and particularly: of, veterans 1 educational. benefits on enrollment in and the output pf the schools. The decline in veter.ans• .education benefits_ may have important effects on Puerto Rican e.ducation and lab.or force participation.
(6) The .educational and o.ccupational cha:r:act!:'r.istics:
of migrants. The imp·ortance of 'this factor has already been discussed.
(7) Occupational mobility with particular emphasis on vertical mobility and the work experience re9.uirements of the various occupations.
(8) Labor force participation and the factors which affect it. There is no ade·quate theory of labor force participation nor any adequate analysis of relevant data of which we· are aware.
IV SHORTAGE AND SURPLUS Of MANPOWER.
Our preceding estimates of future eniploym.ent and of the future labor force are presented together in tables XXV to XXVII] of the appendix. The numbers shown in tables 14 to 19 below were taken from these appendix tables but have been rounded, to the nearest five thousand in the two following tables.
Table 14 below, compares overall employment and labor force projections and shows the levels of unemployment that would result if both were realized.
TABLE 14-J..ABOR FORCE AND EMPLOYMENT, 1955-1975
(In Thousands)
Table 15 below, summarizes the overall educ.ational imbalance implied in our projections of employment and the labor force.
TABLE
15-EDUCATION SHORTAGES AND SURPLUSES IN THE LABOR FORCE,. 1955-1975
(In Thousands)
The two p,:.. ojections represented in the two preceding tables appear to be entirely inconsistent. It does not seem possible that unemployment can be reduced to the level predictedfor1975 inthe face of amounting shortage Qfadequately educated manpower and a mounting surplus of undereducated manpower.
It must be noted, however, that in 1955 there was,according to our estimates,· already an educational shortage. The employment and productivity levels achieved in 1955 were achieved, apparently despite a substitution of at least 45,000 persons with fifth grade education or less, for persons estimated to require six years of education or more. If our estimates are _accurate this substitution involved about 8% of employment in 1955. It seems quite probable that a good bit of the stress and strain involve_d in achieving the 1955 productivity levels may have resulted from such substitution. But according to our estimates the percentage of employment of persons with less than adequate education would rise; by 1960 to 10% of total employment, by 1965 to 13%, by 1970 to 18% and by 1975 to over 20o/o. It does not seem possible that this. can happen and that the estimated productivity levels can, nevertheless, be achieved. Our estimates of economic growth and, thus of employment are, of course, contingent on the estimated improvements in productivity. It appears, therefore, that the level of education of the labor force will have to rise more rapidly than it is projected to rise, if the projected economic growth potential of Puerto Rico is to be realized.
Details of the educational shortage projected for Puerto Rico are shown in table 16 below.
These figures indicate a growing shortage at every level of education. The progressively larger shortages, at lower rather than at higher levels of education, show that the primary problem is not one of overcoming shortages. of specialized or very highly trained manpower but rather one of increasing the educational quaiifications of the labo+ force, at all ·levels, faster than they now appear to ·be increasing.
TABLE 16- SHORT AGES IN THE LABOR FORCE BY LEVEL OF EDUCATION, 1955-1975
{In Thousands)
Before continuing to elaborate the magnitude of the problem indicated by the preceding data, it may be well to review the nature of the problem. Puerto Rico is not suffering from a pre.sent under emphasis on education but, ~s previously indicated, is devoting more of her· current resources to education than any society in the world. Puerto Rico is suffering from a preceding underemphasis pii education extending from 1940 back over 400 years. Because this long history was characterized also by an underemphasis in the development of physical resources there is now occurring a. massive outward movement of people; correcting the imbalance of physical and human resources but also siphoning off a very large proportion of the educational output 'of the society. Finally, the problem of educational shortage is also ·created by the very speed with which economic development is now occurring in Puerto Rico.
But, reg'3-rdless of causes, the problem of gr.owing shortages· of adequately educated manpower and of growing surpluses of undereducated manpower exists in Puerto Rico and haf} only been partially stated above. The problem bec.omes more complicated and is. also magnified when we consider the age ands-ex struc.ture of the labor force and the "normal" age and sex requirements of the proj.ected employment opportunities. !Ii.. calculating these so-called normal requirements we have, as. indicated, used certain aspects of the United States employment patteTns of 1950 as measu-ring devices. There is nothing
sacrea or unalterable about these age and sex requirements but they will pose problemS' which must be anticipated in order to be -most intelligently attacked.
The -following tables 17 and 18, spell out the estimated shortages and surpluses of manpower, by education level, for each sex separately.
TABLE 17 - EDUCATION SHORTAGES: AND SURPLUSES IN THE LABOR FORCE, MALES, 1955-1975
(In Thousands)
TABLE 18 - EDµCATION SHORT AGES AND SURPLUSES IN THE LABOR FORCE, FE.MALES, 1955-1975
(In Thousands)
The preceding tables show that our manpower shortages and surpluses are fundamentally educational shortages and surpluses. Every education level above the sixth grade, for both men and women, is in short supply. There 1s a temporary exception in the case of women high school graduates from 1960 to 1965. Even in these years- there is an overall shortage of women with six years of education or more.
Shortages by education level do not follow a consistent pattern for either sex. Considering their lower labor force participation rates, women show a larger proportional deficit than men at the senior high school level; on the other hand the deficit of college graduates seems to be concentrated almost entirely in the male sex. In order to overcome these deficits it will be-necessary either (1) to substitute additional wome.n college graduates for men in occupations requiring college graduates and additional men high school graduates forwomen in occupations requiring high school graduates; or (2) to bring an excess of men thru the high school level in order to achieve the estimated number of male college graduates needed.
Consideration of age and experience qualifications complicates and magnifies our problem of manpower shortage and surplus even more than the preceding consideration of sex qualifications.
Manpower supply and demand e.stimates by age, sex and education have been made £or the year 1975 but not yet £or preceding years. The.se estimates and the consequent shortages and surpluses are shown together in tables XX:Vll and XXVIII of the appendix. The shortages and surpluses indicated by a comparison of these figures, £or both sexes taken together,. are shown in table 19,
This table ·.ahows that, in~ofar as the age and educational pattern of employment in the United States in 1950 is an appropriate model, Puerto Rico 1 s educational shortages in 1975 will be concentrated in the middle aged groups.. The younger age groups actually -show small surpluses even at some of the higher levels of education. As pre.viously indicated these should not be regarded as :real surpluses but as a challenge to the age qualifications predominant in the United States in 1950.
TABLE
There is nibre involved· lie re, however, tha,n mere~y cl:, challenge to trcldi'tfon .•• For whi,le· age is 'I_l.ot ~n its own riglit a rational qualificati.on for, -ernplo~ent,'·, the -.e~pe.rienc,e, ,I:P-c!,turity and :i:fe·~poI;tsil:>ilHles, assoc:i-q;ted ;with: age are;, in, val;'.~g degrees~ . legitimate· ~cl so-metinies ne~~ss~ry ,qualifi.cations The pr~-, ceding table cannot be entirely disregarded therefore a:s a. J:AOde~ of how additional education ought to be distributed thruout the labor fo"r-ce. ·;, l';h.e• ,tabl4i= ma¥ as a matter of £act represent .a r.ea-
1/ft • )
•. There '.are',at -pre.sent practically no s.er.d'or high s.chool I graduates ;in-the 14 to.19.,age g.roup .. •; InA~-stimating the,,L nunibers qf ·g.radua,tes at all levels,we a.ssumed,the age,,,. ', distribution of graduates that exists at the pres.ent, time .. But if children commence -school at .an e.arlier ag'Eh:ii~y:wi.il .. fmis'h .s~hoc;;i"" it ari ,~rlier ag,e~· There£b:;~, .~Y, l9'75 -~bine hltie se:hlo':t 1high' s'c~oot g'ra,duat~s, ,. ~·stirliil.tJd 'tcj be"\µ 1 1:li~ ·'io t~ :24'yei'ai: ',a.g·e gr,oup, "'will_;·actually' faif iii .ffi'.e0 14'.to 19 eti:iPi"! i 'ibii :· Siftce· our 1 tot'at n~ber
•• • 11 6f '·l'•rkd.~te~'-~h1\ioi e~ 1;hf nit/effect of su.<31(~ ·,shift ; !< l"1 r- ,.~ ._, 1 It. ' • t : ,,~ ·.:• ;. r : r ·•· ,, • 1 is.'.rl:eglig'fble:;·n merer.···redu.ces·theshorta e'in one a ·e ·• g'~oiip il.ftd ±~duces''the Y~J- 'ius.; ii:i'~n~thi~r' ig e u;~u · :' ~,,..-:: ,. ·· !• ':'";?' ,.i.. ;'!,•;;-,,~ )1'.Lll'« 1 : , 'i;,_..,r ,, f? .••. .?. , l 1' <'·
sonably good model af how additional education would be most efficiently distributed by age if it were feasible to achieve such a distribution. In general, it will not, of course, be feasible s.ince the Puerto Rican labor force will not, overall, be old enough to reproduce the United States 1950 pattern of employment by age •
What the preceding table really tells us is that our estimat~s .of educational shortages are minimum. estimates. We will, that is, eithe.r have to more than make up the estimated educational shortages or else we will in addition have to bring about substantial modifications of age requirements for employment in many occupations; requirements which in some instances are sanctioned merely by tradition and custom but which in others reflect the test of valid experience.
The scope of the problem we have been discussing in the immediately preceding paragraphs cannot be indicated with any precision at the present state of our knowledge. We will have to carry thru studies of the age· and experience actually associated with employment and successful performance in the various occupations. T.his, as previously stated, we hope to do next year. When we have done this and have also obtained sufficient information on how occupations are chosen and entered we will be able .to make more precise and detailed estimates of manpowe~ supply and demand and will be able to e.stimate shortages an<i surpluses more accurately.
At this point we have what can be regarded as minimlllil estimates of growing shortages at all levels of education above the sixth grade and of growing su~pluses of manpower with five years or less of education. In addition we are able to specify the type and the magnitude of adjustments, in age and sex :requirements for· employment, which will have to be made but we are not able to say on the basis of our data in which occupations these adjustments c.an be achieved with minimum. loss and with maximum. eas·e. In this matter however, the practical experience of the Employment Service will supplement the findings of_ this research.
V RECOMMENDED ACTION
Action to bring the manpower needs and manpower supply of Puerto Rico into balance can afford to be no less complex than the··factbrs which determine these needs and this supply. By no means 'all of these factors have been brought to light in .the _preceding analysis but enough have been touched upon to show that corrective action will have to be many-faceted. The following attempt to outline programs of action will alinost inevitably ove:r;simplify what has to be done and can be. done; not only because our analys'i'S ef the manpower problem is incomplete but also bec~us.e the institutions thru which effective action can be taken are organized in par'tictil'ar -ways. Finally, the very acts of analysis and recommendation force us to emphasize certain aspects of the problem and of the solution to the neglect of others.
,., ,.,
'Questions may be raised as to whether a need for action has bee:ti."'demonstrated by the preceding analysis. Both our estimates of :manpowe.r .needs and of manpower supply involve series of assumpt-ions which cannot be rigorously justified. Furthermor.e, the resulting estimates of imbalance between projected employment and labor force are not overwhelming
Perhaps the Pue-rto Rican labor force of 1975, even if it .is twenty' to thirty percent under par- educationally, as compar.ed •with.that of the United States in 1950, can, nevertheless, achieve ... the ·s.am·e level of productivity. A plausible argument c·ould run as fo1lows. The new industries being added_ to the Island's economy·will get first choice in the labor market by offering better wages and opportunities. They will thus be enabled to achieve the indicated productivity levels. Agricultural productivity will profit .from the increasing .competition for unskilled jobs and from the increasing competition among farm owners and managers. The tr-ade. :and services sector, along with agriculture and construction., •.-wi-11 have to absorb mo.r;;t of the under-qualified workers and any resul:ting-',inefficiencies will be absorbed by·the consumer in the form .of' lower quality> in areas protected from outside competition by the nab.ire·-of the goods and services involved. Net income and productivity goals might, thus, be achieved in money terms,
although not in terms..of real income. Th~ c·o:i;iclu,sion oi this argument is; of course, a contradiction of what was supposed to be proved, namely, that the 1950 levels of productivity in the United States, as m•easured in constant dollars, could be achieved with a pre>portionally less educ:-ated labor force.
•Nevertheless, matters might develop alo:,;ig the lines indicated above, if the indicated manpow·e·r imbalances are not redres{3ed. Whether the indicated output and pr,oductivity goals would actuaHy be achieve.cl, even in money terms, is. another questi9n. The hidden inflation inv:olved in the picture painted above would be pervasive and might have profound effects on the motivations of workers and managers, even in the presumably favored manufacturing sector.
; Another basic. questioning of the need fqr action might take-. the following form. Will not the normal functioning of the .labor market solve the problem? In the face of strong demand fc,r more highly educated persons and shrinking demand for less educated persons-, will not the educational composition of the migrant stream change s.u:fficientiy? Will not labor force participation rates fo,. educate.cl women remain abno·rmally high? Will not people enroll in school an¢{ remain longer in school of their own accord in sufficiently larger numbers?
All of the above types of behavior are, of course, anticipated to so:tne degree in the .estimates of supply we have made. They might all occur to a greater degr.ee if. the labor market and the markets associated with it functioned in a classic manner .. Actually, many institutional impediments exist. Labor is not allowed to seek its own price. eithe:i;- in Puerto Rico or in the United States. Minimum wage and other protective laws raise the price of unskilled labor· above what the market w~mld pay and relatively to a greater degree ip. Pu~rto Ri~o than in the United States. Traditions and institutional. restriction!! by emplQyers and employee organizations. Hin.it the ·employment opportunities of women and also, to a lesse:r degree, of men. Education is not a commodity comtr.1-only bought and .sold on the market; instead the availability of educational facilities depends largeiy upon governmental decisions. All of the above facts, plus the absence of full information, U,:nit the effectiveness of the labor market in achieving a full balance betwe~n the supply of and the need for manpower
Finally, it might be asserted that the United States labor force of 1950 was over educated; that it had more education than necessary "to achieve the 1950 productivity levels. This assertion canno1; be disproved except by repeated tests of ou:r productivity hypothesis. All that can be said now is that most production managers in the,,Un-ited States would probably not ag.ree with this assertion: These managers would-probably agree that hwna~ limitations rather than machine capacities, raw material shortages or limited markets set the ceiling -on 1950 productivity levels in the United States. Undoubtedly, greater exercise of power in the hands of managers or greater ideological.pressures on the workers could have- squeezed more production out of the same labor force. But unless we want to asswne that motivatio'n ~o produce will be stronger in Puerto Rico in 1975 than it was in the Uni~e9 States in 1950 it would be safest to asswne t~t the labor force will r~quire ·equival.ent educational qualifications in order to achieve the same ·1evel of productivity. We believe, as we- have said before, that Puerto Rico's manpower supply can be brought in:to balance with the estimated needs.for manpower, but only _by means o'f a complex of governmental actions_ carefully tailored to what we know about the labor market and about human nature.
Action to balance Puerto Rico's manpower needs and supply ~.;.,ill first be discussed under several general headings which have already been introduced in the course of the analysis. Specific recommendations will then be listed in accordance with the institutions having primary responsibility for the action in question:.
I • .Making Up the Educational Defi.clt
We have. asswned that the estimated employment needs of Puerto Rico can be met and have mentioned seve-ral ways in which a labor ~orce with the necessary occupational distribution and with the necessary educational qualifications can be achieved:
1. Thru an accelerated education program; 2. Thru increased labor force participation of women; 3. Thru modification of traditional age and sex
; 4., qualifieations £or employment in va,r-'io,µs . .occupations-; Thru changes in the educational compo'sit'ion :0£. ~he migrant population.
We will 'f;ry to indicate, below, the pr.actical li:mits ·of1 ;each.:. ~• •• of the above methods and thus in4icate roughly the emphasis which i , should be .laid upon each. This can be done· only in, very GrUc;le terms, however ... The safe cou:i;se will be to push. each method.-: ·1 f as .f~r as seems practical and to aim at a .theoretic-al. oversolutiqn .of the problem, on. the a~sumption that res,ults ·•may fall ,_, somewhat shor;t of t:P,e .obje.ctives ~hich are establis.hed. ,,.
A. Ac~eierated E'ducation
Educatiorial shortages have, so far, bee:d expres~ed only inriumbe;i.-s which i"epreseht the difference between estimated employment and eeitimatedlabor force."fn calculating the additional ecl.ucat~on which needs to be provided, these Il:umbers have to ~e inflated, firstb_yth,e appr<;>.Priat 7 labor force participation rates and then by the appropriate rates of survival from.deathandmigr.ation. The results ofsuchcalculationa~e shown in table 20 below.
TABLE 20-MANPOWER SHORTAGES BY LEVEL OF
EDUCATION, 1975
(In Thousand_s)
Shortage in the Add.itiona'I -Addi"tioncil , Educational Level Labor force graduates graduates shortage populatJon needed needed 15 and over (net) 1 (gross) 2 :
1/ Prior to death and emigration ~/ To provide also for the graduates needed at higher levels
According-to the above table we_need about 450,000 mor,e elementary school graduates bet~een now and 1975 than. it is,estimated· we. wHl get; about half of th~se- ought to go on and finish junior high school;· again, ,about half of these additional junior high school graduates ought to complete high sc_hool and one quarter of the .additional high school graduates ought to finish college. :Sow much. of this. is feasible?,_
A look back-at the school enrollment an,d retention rates discusse·d in the section of Manpower Supply reveals that the crux of the problem lies at the elementary school level. If the indicated additional number of elementary school graduate,s could be obtained and if these persons continued on, at the present retention rates, above the sixth grade, the educational shortages at all levels would be substantially made up.
At first glance, it also seems possible to boost the number of elementary school graduates by the required m.unber; since the number of students _starting school between 19so'and 1975 but dropping_ oµt before completion of the sixth grade is estimated at 465, 000--one•thj.rd of the number- estimated ~o start school between 1950-and 1975. But quite a large proportion of the 465, 000 have already dropped out of school since 1950; others will migrate, with their parents, before reaching the sixth grade level;, ot~ers for. a variety of reasons cannot be retained in school.
When all practical limitations are taken•into account it appears feasible 'to -reduce by about one-third, the estimated educational shortage thru acceleration of the day sc'hool program. This much can be done by retaining- 85 percent-instead of 65 percent-of those who enroll in the first grade (less the migrants) thru the sixth grade. This rate of retention is attained in the States· and.is 'consistent with sound educational practices If this. accelerated· day school program is aq.opted in Puerto Rico • and if the additional elementary school graduates go on to higher levels of school at the present rates, 150,000 additional elementary school graduates will be obtained, 90, 000 additional junior high school graduates, 60, 000 additional high school graduatesand 8,000' additional college graduates. Some of these, of. course, ~11 migrate after leaving school and some will not enter the labor market'. ' •
Adult education would apparently have to carry most· of the load, except at the senior high school lev·e1, if:.the-·manpower shortage were to be made up entirely thrtt additional education.,. But an adult education program of the· r·equisite size may .not , ··' be feasible, especially ·at the elementary level.. It would ·be necessary, for example, to :increase the number of adult elementary school graduates from about one thousand per year ·to about fifteen thousand per year. This. is not as impossible as it sounds since today'·s adult education program places the least emphasis on the upper elementary grades. In the lower grades and at the high· school and college levels the present adult education program is at least within striking distance of the numbers needed. ,
Tentatively we suggest an adult education program whic·h-i would wipe out another one-third ·of the estimated educational deficit. Without more detailed study it is not possible to say definitely that such a program wfll be feasible at all levels. of education.' The s'hortage at ·the high ·school level can almost ce'rtainly be entirely wiped out. The goal sugg.ested here for adult education can in all probability be achieved at 'the junior high school and college levels. There appears to be a very good chance that it could also be achieved at the elementary, level.
B. Increased Labor Force Participation
['his is the most·-efficient way of closing the manpower gap_. It requires only tp.a:t people already· estimated_to possess the necessary educational qualifications, and to be living in Pue.rto Ricp be brought into the job market. But there. are so .few: men with- $ix years or more of education, not already assumed to be in the futur-e ,.labo;r :force, that.increases in the neeq.ed lab9r supply by this ·efficient me.ans must be assumed to come from the ·,- , ranks of women
Theoretically·, half the deficit at the lµgh school gradµate , level·,. about 40. percent .at the juru,or ·4igh school level and ab.out .. 25 percent at the elemen:f;ary school l~vel, could be wiped out by increased labor fo·rce participation of_ wome:q. w.ith. the appropriate educational qualifications. This much could be done without m?~:-
.ifying the imU.cated em.plQyment pr~.f.erences by s.ex, i. e , py p~tting women in ''wo~en1 s joba."
There ~e several .serious. difficulties., ho;wevet', in .applpng the preceding theoretical .solution. One is that the e .stim.ated labor force;, _pa..rticip~on rates £or women with junior and s-ei'lior high achoo1 training are already high. even more serious: dif!ictjlty is- that. a program which would achieve such dr.as.tic increases in the iabor force participation of women with high school. training would rg.n counter to other social objectives.
Our over.all estimates of employm.ent and the labor force show .a surpiu_s of r,nen continuing thru 1975. It is prob.ably not a healthy .state of .affairs, in any society as..now constituted .and especially in a society )"Ji~ the traditions· of Puerto Rico., to· have c.ontinuing une:r;nploy:r:p.ent. of men coi1:i~ide with great -efforts to bring more women .i;nto the ],abor market.
_A second di#'iculty would .arise if the indicated shor~ages., .for women high s·chool and elementary ~chool graduates, were filled , solely thr:u increased lab:Dr force participation. It would, then, not be .necessary to inc reaae educational opportunities tor women. But', to· conce~trate an .accelerated educational program on the male po,Pulaij,on would not only be socially undesirable; it would als.o be :eclu.c.ationally inefficient for two r.easons. First, educa_tion would be giv~n to less qualifie,d men rather than be.tter qualifi~d wpmen. $econd, an excessive number of men would have to be put thru jw;do.r .and s·enio.r high school in order to produce the indicated number .of male college graduates.
If an a~celerate:d education program. is· adopted and made .available to both :sexes ·it will not be ne.cessary to depend entirely on increas·ed labor for.ce participation to wipe out the 11female" educational defi-cit. Since the .accelerated program. we have tent,atively reeomm.ended will not, how.ever, wipe out more than two-thirds- of the shortage,. w~ may perhaps: be able to depend upon s.maller decreases· in the labor force particlp.ation rate.a of we.men than we have projected-enough smaller_perhaps.-to make up half the rem-~g deficit, one-sixth of the total for both :sexe.s. :;We 1;,elieve that positive ~ction Qy go.vernment -and employers. will be ne·ceasa:cy- to bring about the required levels
of participation but-this. action may not have to be so extreme as to have serious, negative, s.ocial consequences.
C.. Modification of Age and Sex Qualifications for E.mploym.ent
A· great deal will have to be done in this area, not so much to. help directly in making up the educational deficit as to keep thiS' deficit down to the estimated levels and to supplement an efficient, accele··ra.ted educ.ational program.; one which would provide educational opportunities to both men and women on the basis of ability and motivatiop. rather than sex.
U .accelerated education is approached on this basis then clearly part of the deficit at the college level of training, now indicated as largely a deficit of college trained men, will have to be ma.de up in part by the increased employment of college trained w~en. This means some substitution of women for men in professional, managerial and.higher level, clerical jobs. Such subs.titution -would not be inconsistent with the objective of eliminating uh.employment .alllong men, for an accelerated education program., balanced petween the sexes should also lead to the substitution of men. for women ~n jobs at the high ·school lev.el. We are recommending the ·principle of providing educational opportunities in accordance with demonstrated ability and interest and of providing employment opportunities in accordan-ce with educational and experience qualifications, in all occupations for· which sex qualifications are not essential.
D. Selective Migration
We are .left with about one-sixth of the educational deficit to be eliminated th~u .appropriate influence on the decisions of migrants. This wou1d mean that about one out of every s.eventeen anticipat~d migrants should make different decisions than they are now expected to-make. This s.ounds like a modest goal but the difiiculties· involved in influencing the decisions of migrants are ve--ry great.
First· of all the Commonwealth G9vernment is. com:mitted to a policy of neither encouraging nor discouraging migration; whieh means that any influence on the de.cisions of migrants will
have to come. via the wage structure or employm.ent opportunities or the co.st of travel or thru other impersonal mechanisms. Wage differences, em,ploym.ent opportunities and the economic and social cos~ or benefit of relocation are the three interdependent factors ~hich determine migration decisions. Let us review our existing knowledge about these three factors. and see what can legitimately be done about each one.
What we know about wage differentials, about employment opportunities for Puerto Ricans in the United States and about the co.sts and benefits of migration is far too little. Some studies have be~n made in each of these fields, others are now in process and mo~e are planned. We can draw only limited generalizations from the ~xiet.ing data and even some of these cannot be rigorously justified.
Wage differences between Puerto Rico and the United States clearly ~xist. it seems very likely that these differences are. greater.;· in absqlute if not in percentage terms, for jobs with higher' edµ_~ation requirements than for jobs with lower education requirements. Furthermore, it seems very likely that existing upward pressures on wages will tend to close the gap between Puerto Rican and United States wage rates more rapidly for the unskilled than for the skilled occupations. The reason is that in: Puerto Rico the legal minimum wage is at present the major factor in raising wage rates while in the United States, labor unions and professional associations constitute the major upward forces on rates of pay.
The growing shortage of skilled ma.apower in Puerto Rico and the growing surplus of unskilled manpower will certainly tend to offset the effect of the factors described above. How rapidly this offset will develop and how effective it will be is the important question .•
About all the government of Puerto Rico can do with respect to wage differentials. between occupational skill levels is to continue to encourage the growth of labor unions, to inform private employers with respect to the labor market a:nd perhaps to set private eriiployers an example by establishing a government wage structure with higher differentials between· occupational skill levels.
The Govermnent of Puerto Rico can clearly not cease to raise•" , mm1mum wages. To do so would be to de-emphasize one .of ·.the:,pTin;,;,• cipal objectives of economic •development, .namely to ra:is•e low incomes. Furthermore, the Congress and the .labo,r unions of the United State.s would not cooperate in a, slowdown on the raising of ••• legal minimum. wage rates in Puerto Rico.
Initial employment opportunities for Puerto Ricans in the· United States have so fa~ been principally in the less d~sirabl~ and less a.killed oc~upations. Puerto Ricans have taken the jobs in the United States which were formerly filled by im-µilgrants from: other coun·tries. This will undoubtedly· continue to be the case but ·as Puerto Rican communities become established in American cities and as earlier Puerto Rican migrants up-grade themselves occupationally, the later Puerto Rican migrants will find wider and better job opportunities than did their pioneer predecessors. Nevertheless the kinds of jobs avaiiable to most Puerto Rican migrants to the Un'ited State~ ought to be ~ore· attractive to the less educated than to the better educated. Erilployme-nt opportunities taken by themselves ought, thus, to lead to a migrant group in which the less educatea are m:ore than proportionally repres ented.
Why has this not happened? Becaus,e it is harder for :f;he i~~s educated Puertq ];lican to finance a move to the United States, because it is harder for him to get a job without institutional .al:!sistance and because .it is harder for hlm to overcon;i.e language and cult:u.r;µ barriers to relocation. To these reasons must be added the £.act that wag~ differences l;>etween .Puerto Rico .and the United Sta,tes are great enough to make it wo'1"th while for many better educated Pue;rto Ricans to accept occupational downgrading in the United ~tates: But Puerto Rican .in¢.omes are improving and thus the oppo.rtunitie.s to acquir~ a travel stake a.re· increasing. • Cultural and language barriers to migration are also becoming more equal for all educational levels~. as -all forms of interchange between Puerto Rican and the United States .increase and particularly as the nll?1-b~r of Puerto Rican , families with members residing.in t4.e States increase~s.. B't;tt th~ less educa:ted. Puerto Rican is still .J.landicapped in seeking e~p!o.yment in the UnAted States, par:tly .by the con;i.petition of his better ed,ucated compa~ri9ts and pa,rtly by the lack o{ suffici.ent institutional assistance in gei;'ting a job. ' ' •
The pr,4rce,ding analysis suggests that the. composition of the _ net mig,;rant.-population would gradually .change. On the basis of incomp.l.e,te ,data it appe ars. that this migrant population is now mor.l'.;,·ne~rly .repre~entative, educationally, of the total Puerto Rican population than it was in the nineteen-forties. The census of 1950 showed that persons of Puerto Rican birth, then residing in United States, had an average of eight grades of school. At that time the. average education level of the Puerto Rican population was less than four years of school. Recent data-still very incomplete-indicate 'that the migrant stream still contains a disproportionately large s.hare of junior and senior high school graduates in. each age and sex group, but the disproportion is not so large as tha.t,.indicated by the 1950 census for previous migrant groups .. •
Since• our labor force estimates assumed that the future net migrant population would be educationally representative of the total population, the apparent trend described above will have to· continue or else our educational shortages and surplus~s will be larger than they have been estimated to be. But we have been considering the possibility that the shortages and surpluses of ma.iipower'ihdicated by these estimates, might actually be reduced. It- appears ·that"concrete government action will be required if such reductions· 'a.re to. be brought about by changes in the composition of the m±grant"sfream..' Specifically, action to increase wage differentials in Puerto Rico between occupational skill levels seems -to be indicated. Furthermore, there apparently needs to be an increase in the scope and effectiveness of institutional assist~ce to uns.killed Puerto Ricans, in finding employment in the United States and also to skilled Puerto Ricans working in the United States,. in finding employment in Puerto Rico.
;2. ·u•iU_z:ing the Surplus of Unsk.illed Manpower
If tp.e ,act~ons broadly outlined abov~ are .succes.sfully c~rried out they, w.µl eliminate the educational deficits estimatec;l for 1975 and will,presll;tllably keep these deficits within tolerable limits be~;e,:0:n:ow •.an,d then. We will in the future make .more specific ,e_.s;f;iJ:n~~s for the years between now and 1975, of the effect of th~-~e._,r~-~<:?~m~nded programs, but this can be bett~l'.' done a_.fter specµi([aqtio~. decisions have been made with respect to these prog;.~;.: • ,W"e ~an reasonably assume that the programs recom-
mended to a:v:oid- the estimated eduG;a_tional. deficit. will approxi-mately keep pa:ce with the ·growth of the·se deficits.,. •"since -we assw:ned an educational balance in 1950 and-have also 'calculated that the recommended programs vvfll achi'eve an• educational supply in balance with manpower needs in 1975. '
Oµr estimated manpower surpluses co.nstitute a different , ~nd ,of p;roblem. While these are also expected,.,as a consequence of the recommended pr.ogra.zns, to be ~educed to a -reasonable ,level by 1975-to about :(ive or six percent of the e..stimated _ labor-.force-our surplus of manpower with less than 5 years of education is very high at the present time. This surplus was estimate-d _at one hundred and thirty thousand for 1955 and none of the preceding recommendations will accomplish more than to gradually reduce this nw:nber to about forty thousand by 1975. During th~ en:tire decade of the sixties this manpower surplus can be expected to average about one hundred thousand persons and not to fall far below this level until. 1970, even though the .program.a recomr.p.ended above are carried out.
Although a continuing surplus of manpower in the large nw:n_bers indicate.d above will .not preve3:1t economic growth at the. rates preyi,ously projected it will, nevertheless, result in serious loss_e.s to the individuals involved, to their fa.znilies and to the rest of the. society. There are several ways in which these losses might be ,. reduced,; thru additional government employment, thru increaseq. temporary migration and th;ru increased seasonal work in the United States.
A. Government .E;mployment
The Government of Puerto ;Rico has already launched a progra.zn of small public works designed particularly to supplemfnt the seasonal employnient available to unskilled agricultural wor-kers. One million dollars has been appropriated for this progra.zn 'in the current year and it is' planned to increase appropriations over a five year period to a level of :five million dollars per year. The proposed s·cope of this ,progra.zn, is however, clearly inadequate to employ more than a small percentage of the estimated surplus manpower. A program. of at least ten times this magnitude would be needed but to finance such a progra.zn the Government of Puerto Rico would have to discover new methods of financing.
There is.no-lack of capital improvement projects wlµch would in the long run be self-liquidating. Reforestation, improYemen,t of agricultural land, housing and road construction are merely a few exa.niples. of such projects. The search for methods of financing s;Uch projects ought to be relentless and ought 'to include the ~xamination of methods by which the persons who constitute the surplus manpower group would themselves help to provide capital resources, by deferring part of their earnings on government projects, to a future date. Either high retirement benefits or profit sharing in project returns might be used as partial substitutes for current wages.
B. Temporary Migration
It would be neither desirable nor easily possible to increase net migration from Puerto Rico to the United States over the whole period of time between now and 1975. According to our estimates Puerto Rico can not only employ but will need a labor force and thus a population of the size projected for 1975, provided only that this population is appropriately schooled and skilled. Furthermore, the size of the net migrant population is, according to our earlier analysis, determined by the relative attraction of employment and living conditions in Puerto Rico and the United States and is'· thus not easily influenced except by factors which change these conditi·ons.
It may nevertheless be possible to increase the number ef unskilled' temporary migrants from Puerto Rico, durmg a brief period of years, by providing additional employment service. .As previously stated, unskilled workers are particularly in need of assistance in securing employment. Also, such assistance ·is more easily' provided for unskilled. workers who are frequently; employed in large numbers. on temporary projects. Large scale construction .and maintenance projec~s in the United States have always drawn a considerable part of tp.eir worker.s from i;mrnigrant populations and still do. Puerto Ricans would compete principally with Mexican and Canadian labor for employment on such prdjects.
There is a history of successful large scale placement of Pue.rte Rican workers for railroad maintenance and other similar work in the United States. It ought to be possible to incr~ase this kind of job placement, if necessary at the expense of fore:i,gn nationals,
and thus to help reduce the temporary surplus- of unskilled labor in Puerto Rico.
C. Seasonal Employment
Seasonal work in the United States is, in one sense, a fo'1'm of temporary migration but one which has many advantages for Puerto Rico and Puerto Ricana. It does not require the relocation of homes, it calls for minimum adaptation to a str'ange language and culture and, very importantly, it is consistent with the retention of a large farm labor force in Puerto Rico during the sugar cane harvest.
A very good beginning has been made in the placement of Puerto Rican farn::i workers for seasonal agricultural employment in the Unite.d States. The consequent additions to the income of rural Puerto Rican families is of great significance. Nevertheless, ·the number of. seasonal agricultural workers in the United States, coming from Puerto Rico, is very small in comparison with the number -of Mexican nationals similarly employed. A very small increase in the proportion of Puerto Ricans, among workers in the total of seasonal ag;ricultural employees in the United States, could solve a large part of the proble;m of surplus unskilled manpower in Puerto Rico and .solve it very efficiently. This solution would leave the Puerto Rican farm worker available in Puerto Rico for employment in the peak season, for employment on capital improvement projects, which if confined to a smaller number of months could be spread over a larger mnnber of workers.• Most importantly, this solution would leave the Puerto Rican w<;>rker available in • Puerto Rico for enough of the year so that he might take advanta·ge ·of opportunities for further- educ·ation and thus be eventually absorbed in permanent employment in his own country.
3. Pre llminary Summary of Recommendations
Summarizing to this point, we have r~commended that the estimated shortages of manpower, with elementary school education or more, be made up as follows: '-,,;
(1) One-third, by raising retention rates in the elementary
day sch.9~ls and by providing for the additional elementary sch:ool gratj.uates at higher levels of_ education.
(2) One-third, by :increasing adult education at all levels of educ.ation.
(3) One-sixth, by encouraging higher labor force participations rates £or women with high school and college, education.
(4) One-sbµh, by changes in wage structure and improved employment service· which would result in a somewhat lower ·proportion of persons, with elementary school education or more, in the net migrant population.
We· have also pointed out that achieving a manpower balance along the lines indicated above will require substantial changes in the traditional age and sex quc1.lifications for employment in various occupations.
We have•, furthermore, recommended that our surpluses of unskilled manpower, which are estimated to remain high for at least another decade ,despite successful efforts to achieve an adequately educated labor force, should ·be reduced as follows:
(1) Thru new methods of government financing which would enable a larger capital improvement program to be carried on by government
( 2) Thru increased efforts to place unskilled Puei:,to Rican workers in temporary employment in the United States and particularly in seasonal agricultural employment.
4. Specific Recommended Action
Specific actions that should be taken by different agencies of govermnent·, in order to carry the preceding recommendations into effect, are listed below under the name of the agency assumed to have primary responsibility for the action in question. This method of listing tends, of course, to disguise the fact that
many of th~ recommended actions will require the cooperation of more than one agency.
Not all of the following recommendations· are based exclusively on the conclusions reported above. In some cases these recommendations have the supplementary purpose of correcting inad~quacies of data experienced in the co-µ.rse of the research or of making use of the methods of research we have develo.ped, outside Puerto Rico.
In almost all cases the specific form of the recommendations reflects preliminary discussion of the conclusions of the study with ' officials of the agencies responsible for action or with other experts.
A. The CommonweaHh Department of Education should:
(1) Tak~ steps to raise the retention rate in elementary day schools from 65% to 85% by not later than 1960 as follows:
(a) By providing additional classrooms and teacher.sf in rural areas which do not have schools at all elementary grade levels.
(b)- By providing additional free transportation to all elementary school students who do not live within walking distance of school.
(c) By adopting a complete child accounting system..
(d) By following up all drop-outs from school, by home vis.its if necessary.
(e) By providing additional financial aid to children who cannot otherwise attend school.
(f) By enforcing the school attendance law, after other appropriate measures have been tried and faile-d.
(g) By carrying out the ot:11er recommendations to improve school retention, made by_a confer-
:~
••
ence of munic;pal school .superintendents in June 1957.
(2.) Expand educational facilities at the junior and senior high school levels sufficiently to provide for the additional eleme~ta_t}'.' school graduates estimated tc;> result from the achiev~n:ient of the higher retention goals recommended above. The proporti'ons of elementary school graduates assumed to remain in school' thru the junior high an:d senior high school levels are to b~ based on presentiy projected retention rates above the sixth grade.
(3) ·Provide free transportation and other necessary economic aid ·to al-1.-.needy, prospective junior and senior high school- student-a with- sup.erior aptitude and school achievem~nt ,. recor-ds.
( 4) Take steps to expand enrollment in adult education pro- .i grall).s s~ficiently so that they will produce by 197~ approxi~at,eiy 180, 000 elementary s'chool graduates, 100,000 junior -high s~hoo~ graduates and 60,000 high school graduates.
(5) Cooperate with the Univer~ity of Puerto Rico and with othe'.r -college·s and universities in programs of teac~er education and recruitment and in programs of research designed to increase the quality and efficiency of instruction. Some of the specific prbgrams recommended are listed under recommendations for the University.
(6.) Acceler_ate the development of educational records, statistics and accounting procedures with the objective of being able ·to :pr<;>duce .quickly, reliable data on all important measurable a~pe.ots of the educational prqcess .inciuding specific measures of achievement in the learning of basic skills.
"17) Utilize the data in thi,s report, on employment by .. o"~cupat'ion, in plann1ng curricula and in the apportionment of 1educad6hal funds among academic' indU:str'ial and commercial curricula.
B. The Univ:er·E!ity c;>(P,uerto, -:tlico should:
(1) Make detailed estimates of the expansion required in educatiqna,l f,a~ilit.il:'.s. above th~ high sc~pol level,_ ip. ac~or~ap.ce with the pr~ceding recomm~ndations of this report.
(.2) D~terz:n,ine :j.n c;:ooper~tion w'ith other institutions and , agen~ie.s what .propo~ti.Qn of the e_xpande.d higher education faci- ' litie~ should b'e under· _the juris'diction of the University'. -
dr ''i'~kE;' steps to carry out the expansion 'program indicated for the University.
(·4) Plan• an extension program at the college. level calculated -to~provide 16,000 college graduates between now and 1975 ,from· a'-student· bo~y .of adults, as previously defined in ; this report. A decision should be reached on the portions of this adult education program which should be the responsibility- of ·the· Urtive-r,s"ity.
(5)· .qooperate with the, Department of Education in :the dev:elopment .of improveq programs of teacher training and recruitment and in research designed to improve -the quality and efficiency of instructions at all levels of education. Specifically:
(a)·-Seek for ways of ,e!Xpanding the base from which teathe rs ·can be· recruited.
(b) Develop more. efficient methods of selecting teachers.
(c) Develop additional means of providing for the post-eID;ployment education of teachers.
(d) Institute +esearch on the processes of education, particularly those mvolved in the development of basic skil11;1
(eJ Carry.out research on the us.e of mod~rn, mass media techniques in improving ~e quality and lowering the cost of educating large num.be:i;s of students. •• -
C. The Puerto Rico Employment Service should:
(1) Inform the people of Puerto ~ico of the relationship between adequate education, future employment opportunities and income; specifically by developing popular, mass media presentations of the principal findings and conclusions of this report.
(
2) Develop vocational guidance material ,of a general nature for the school population of Puerto Rico, stressing:
(a} The relationship of level of educ.ation and opportunities for employment.
(b) The level of education required for various clas·ses of occupations, the income differences between these classes of occupations and the estimated lifetime income differentials between persons with different levels of education.
(c) The relationship of academic educationparticularly of training in language and logic skills -and the achievement of high levels of proouctivity and income in modern production_., systems.
(d) The need for experience as well as education in job performance and therefore the need to serve an "'apprenticeship 11 pr~or to full employment in the occupation of the students choice.
(e) Employment opportunities for well educated women.
(3) Develop occupational guides:
(a) For particular occupations, utilizing the data on estimated growth rates contained in this report.
(b) For broad dccupational class.e.s, utilizing the • supply and demand data of·this. report.
(4) Develop a close liai13on with the hi.gh·schools. a:nd ~oU.~;ge~ ·; of Puerto Rico and develop a cooperative program for making job placement's, of·'prospective high school and college gr;a.dq~t~s prior to graduation. ..,, :-, ,:s;; .,
(5)'-Develop informational n:iateria.1,_s for .employe.:rs; .st~e,s~iµ,~:
(a) The advantages of flexible age and sex qualifica,, ·tions. , , , ':f
(b) The desirability of "apprenticeship"' positions for ,- high school and college graduates.
(c) The desirability of recruitment from high school and college populations ·prior to graduation.
(d)··The :desirability of turnover• studies and of advance recruitme.nt schedules
(e) The desirability of encouraging and providing for continued ed-µcation among .their e~ployees.
(,f) The desirability of adequate wage differentials between occupational skill levels.
(6')' Develop, on a considerably expanded basis, methods of recruitment for highly skilled occupations among Puerto Rican migrants ,in the United $tates; utilizing not only the machinery of refe.rral petwe.en State EmploymeI_l.t Services but also the management linkages between Uni~ed States a11:d Puerto Rican firms.
( 7), Develop a closer relationship with the Economic Developmt;!nt Administration of the Commonwealth:
(a) To exploit the. management linkages between" Puerto Rican and United States firms referred . . . to above.
(q) 7'.o obtain more cpmplete advance information on.new firms planning to estab~ish in Puerto Rico.
(8) :Qevelop, on a considerably expanded basis, methods of placing unskilled Puerto Rican workers in temporary or permanent employment in the United States 8 particularly in c;easonal agricultural jobs.
(9) Develop its operational statistics witp. the particular objective of routinely producing comparative data on the number of job orders and the number of job applicants by occupation. Further useful analyses of such data would include classifications by age, sex, education, experience, geographic area and time elapsed in filling the job order and in placing the job applicants.
'(10) Carry forward the research here reported, particularly along the following lines:
(a) Develop estimates of manpower needs which specify the experience as well as the educational requirements of each occupation group.
(b) Develop supply estimates for specific occupations.
(c) Develop more· precise estimates of employment and labor force for the next five years.
( d) Develop detailed employment and labor force estimate.a for the United States in the unskilled occupations characteristically filled by Puerto Rico immigrants.
(e) Study wage differentials. between various levels of skills between Puerto Rico and the United States for the saine occupations.
(f.) Develop data on labor mobility between occupation.a and between 1.abor markets in Puerto Rico.
(U), Utilize the estimates in this report, on employment ne.eds and ,labor force by occupation class and industrial .sector, in estimating future placement loads by occupation and industry.
Future studies estimating, the geographic distributio:q._ of employment in each economic sector and industry would permi tp:re-,,, diction.a· of placement· loads by a.r·ea. 1 ,
(12) Study and prepare to deal with the. problems unsolved in achieving acceptance ·of changes in traditional age and sex qualifications for various occupations, using the. data of this. report-as a guide in estimating the magnitude -of the change·s in.-:,,") dicated at the various leyels -of education. (.....
D. The Employment Service of the United States sho"Q.ld consider:
(I) A review of data on the employment of foreigns nationals in unskilled oc.cup~tions in the United States and the ne_ed for additional data on this subject.
(2) Develop~g a program of cooperation among state e;p.ployment agencies, design.~d to relieve the temporary surplus o"f unskilled manpower in Puerto Rico.
E. The Depa,rtment of Labor of the Commonwealth should:
(I) Accelerate the expansion of its apprentic~ship program, utilizing the data in this report to determine the size of the apprenticeship program needed for the various crafts
(2) Encourage labor organizations to seek adequate wage differentials- between skillled and unskilled occupations.
(3) Regll;larly analyze its quarterly employment and unem- 1 ployment data by occupation and education! level.
F. The Office of Personnel of the Commonwealth should:
(1) Seriously consider a revision of the wage structure of the Commonwealth Goverilille'nt which would create substantially higher pay differentials between levels of skill and levels :of .responsibility.
(Z.) Make detailed estimates of future government employ.ment by.•hccupation.
(3) Develop ptan:s fo~ the recr~itm.ent\of ,h,igh schoo~ aµd coll~ge students prior to graduation,. ;. :.,:,.o: ,-, ,., , • ,.-3·•
• (14) Gontinu:e to- offer incentives,ancLa.:szsistance to,.gov.er.n;,ment employees in furthering th:eir education and- extend :these.• .incentives and this assistance to employees whq now have very little education. 1 ·, i ;f'I •.•• ':
G. The Department of He~lth an._d -Welfare' :of the Cpmm.c;>.nw~a.1th, should:
(1) Cooperate with the Departmen~ of Education in a program for keeping children in school: especially thru the close cooperation of individ1,1al social workers with school pri'p.cipals an9 teach~rs in following up children who drop out of school; discovering and if possible correcting the reasons for the drop-outs.
H. The Department of Health, Education and Welfare ~f the United States should.consider:
(1) Using as a basis for federal aid to education, the relationship between estimated future school population and estimated future working population. Com.par~tive statistics on where the future labor force is expe~ted to 1;),e edq.cated ~p._d it is expected to be employed might provide a j-g,sti:fiable basis for an equitable distribution c;,f federal aid for education. ·Such data c.ould be obtained by c;l,P. extension of the. :m,ethods used in arriving at the estimates .of em.ploy:rp.ent ~p.q la1;)o* :(ore~- presented in this report.
1. The Governmental leaders of Puerto Rico shoul~:
(1) Infor:qi tlw peopl~ of Puertq Rico of the need for m.ore manpower with at least six years of education and of the depend~ ence of opportunities £9:r employni~nt up,oµ th.e a._ttain,zn.ent of at least six. y.ear s of educ~tion.
(2.) Encourage all of the people of Puerto Rico, adults as well as children, to get as ~uch education as possible, but· stressing the need to give preferenc~ at th~ higher levels of
the public .school syst~ms to those ~with the m~st ability_ a~d .demonstrated personal motivc1;_t.ion~ .. ..,.
.(~) Provide ~d:u,cat:ional facil:i,ti~~ ~l).d incent.iv:~s. to. ~hild~en ,/ • ~. 1 and .adults t.o the .greatest exte11t,pqs.s.iple. • , , .•
'
(4) Seek for new metliods of financing ~prov~:rnen,1:s i11, t1:ie physical capital of th_e island, p~rticularly such improvem~nts as ·wc;,ul¢1 .em:pl.~y unskill.~d ~a90.r. .~ ..... '.; ..,·..