
Indigenous Students Executive
National Study on College Affordability for Summary


Dr. Meme Kinoti, Associate Professor, Regis University
Dr. David Sanders - Vice President for Research, Evaluation, and Faculty Development
Cobell Scholarship Program
Copyright © 2022 American Indian College Fund, Cobell Scholarship Program, American Indian Science and Engineering Society, and American Indian Graduate Center. All rights reserved. All content of this document contains proprietary research, copyrighted materials and literary property of the National Native Scholarship Provider (NNSP) organizations. Its purpose is for guidance only and is not to be copied, quoted, published or divulged to others without the express written permission of the collective organizations.
Dr. John L. Garland - Director of Research and Student Success
AmericanTeamIndian College Fund
Aleks Humeyumptewa, Administrative Assistant, American Indian College Fund
Dr. Johnny Poolaw, Director of Student Success
Julia Mosconi, MA, Assistant Director of Research and Student Success, Cobell Scholarship Program
Dr. Corey Still, Director of Research Research Consultants and Support
Dr. Robert Talbot, Associate Professor, University of Colorado - Denver
American Indian Science and Engineering Society
American Indian Graduate Center
Dr. Amanda Tachine, Assistant Professor, Arizona State University
Dr. Jameson Lopez, Associate Professor, University of Arizona
This national study explored college affordability for Indigenous students as part of a thirty month grant from the Lumina Foundation received in November 2019 by the American Indian College Fund (College Fund). The National Native Scholarship Providers ((NNSPs) - College Fund, Cobell Scholarship Program, American Indian Science and Engineering Society, and American Indian Graduate Center*) collaborated to conduct this research Researchproject.
Dr. Tiffany Smith, Director of Research and Career Support, American Indian Science and Engineering Society
Shani O’Brien, Doctoral Candidate, University of Colorado - Denver
*The American Indian Graduate Center changed its name to Native Forward Scholars Fund during the dissemination of this report and therefore, names and logos may be used interchangeably.


1 Copyright © 2022 | All Rights ReservedTable of Contents 2 Circle of Collaboration 3 Overview of Study 5 Demographic & Background Data 9 Navigating Personal Finances 11 Financial Aid & FAFSA 14 Debt 16 Findings on Affordability and Completion 17 Discussion 18 Practice and Policy Recommendations 19 Next Steps 1
Circle of Collaboration
College Affordability
The National Native Scholarship Providers ((NNSPs) - consisting of the Cobell Scholarship Program, American Indian College Fund, American Indian Science and Engineering Society, and American Indian Graduate Center) work collaboratively to amplify the voices and experiences of Indigenous students in higher education. This important collaboration results in Indigenous-centric data sharing, collection, analysis, and reporting –the first cross-organizational partnership of its kind. Our collective goal is to conduct collaborative research on topics that support Indigenous student success and inform effective practice as scholarship providers. As a result of our collaboration, we are emerging as a powerful partner within higher education data collection and research. In doing so, we challenge U.S. higher education’s history of maltreatment and invisibility of Indigenous college student data and seek accountability for data inclusion at the campus and national levels.
College affordability has been identified as one of the major obstacles to both enrollment and completion.
The research of Goldrick-Rab (2016)¹ documents the effect of rising college costs on completion, highlighting the experiences of students struggling to overcome a lack of basic needs including hunger and homelessness. Invariably, researchers found the primary obstacle to completion is simply a lack of finances. Graduation rates at four-year institutions remain shockingly low for Indigenous undergraduates. Just 36.2% of Indigenous students entering all four-year undergraduate institutions in 2014 completed their degree program in six years compared to a completion rate of 60.1% among all students.² Although affordability is a central factor in the overall college student attrition rate, national data on the effect of college affordability on Indigenous student completion had not been fully explored until this study.
¹ Goldrick-Rab, et al. (2016). https://hope4college.com/wp-content/uploads/2018/09/Goldrick-Rab-etal-Reducing-Income-Inequality-in-Educational²Attainment.pdfNCES.(2021). Graduation Rates for Selected Cohorts, 2012-17; Outcome Measures for Cohort Year 2012-13; Student Financial Aid, Academic Year 201920; and Admissions in Postsecondary Institutions, Fall 2020. https://nces.ed.gov/pubsearch/pubsinfo.asp?pubid=2021105
2 Copyright © 2022 | All Rights Reserved


3 Copyright © 2022 | All Rights Reserved Overview of Study
This mixed-methods study on college affordability for Indigenous college students followed an explanatory sequential design¹ and is likely the largest and most up-to-date national dataset on this topic. Likewise, this study’s collaboration among four of the largest National Native Scholarship Providers (NNSP) provided an Indigenous-centered and managed research project from concept to analysis to recommendations. The principal research staff from each NNSP organization served as co-principal investigators for this project with support from Indigenous research faculty from across the country.
In accordance with commonly accepted protocols for research with human subjects, and more specifically with Indigenous college students, an institutional review board (IRB) application was submitted (07/01/2020) and approved (07/16/2020) by Northwest Indian College IRB.
research for Indigenous students is more than simply understanding the costs of college and sources of funding, it’s about understanding the integrated college-going experiences of the scholar, their family, community, tribe, and the promise of post-secondary education. As part of a larger study funded by a grant from the Lumina Foundation to the American Indian College Fund, this NNSP portion of the research project focused solely on a deeper understanding of how Indigenous students navigated the complexities of college affordability. Likely the largest mixed-methods data set ever collected on Indigenous student perceptions and experiences of college affordability, these data help us to confirm anecdotal experiences, offer new insights into Indigenous college student finances, elicits new questions for future research, and most importantly creates space for Indigenous student voices to be heard on a research topic where their data are frequently missing.
Consistent with explanatory sequential design, quantitative data were initially collected and analyzed then qualitative data were collected from survey respondents and analyzed in light of each set of data. Given the limited research available on college affordability for Indigenous students, a mixed methods approach offered an opportunity for deeper understanding of student experiences and their insights with funding a college education.
¹ Creswell, J.W, Plano Clark, V., Gutmann, M., and Hanson, W (2003). Advanced mixed methods research designs. In A. Tashakkori and C Teddle (Eds.), Handbook of mixed methods in social and behavioral research (pp. 209-240). Thousand Oaks, CA : Sage.; Edmonds, W. & Kennedy, T. (2017). Explanatory-sequential approach. In An applied guide to research designs (pp. 196-200). SAGE Publications, Inc, https:// dx.doi.org/10.4135/9781071802779
CollegeMethodsaffordability

² . Of those who indicated an interest, scholars were invited to either a sharing circle or an individual interview. A total of 96 former and current scholars participated; 51 across six sharing circles and 45 individual interviews during the first quarter of 2021.
SurveysAtthetime of survey distribution, 5,231 current combined NNSP scholarship recipients were invited to complete the survey receiving 1,607 responses for a 30.7% response rate. Likewise, at the time of survey distribution 6,785 former NNSP scholarship recipients were also asked to complete the survey receiving 1,182 responses for a 17.4% response rate. Survey data collection took place from Oct 1 to Nov 1, 2020.
SurveyParticipantOverviewThepurposeofthesurveyonaffordability
was to gather quantitative data on how Indigenous college students experienced the many facets of funding their college education. Two groups of NNSP scholarship recipients were surveyed, former scholarship recipients and current scholarship recipients at the time of the survey’s administration. A total of 12,016 scholarship recipients were invited to participate; 2,789 responses were received for an overall response rate of 23.2%. Additionally, scales from the surveys were developed, updating the Native Americans Giving Back scale¹, to examine affordability factors on college completion. These data are presented in the findings section. Standard validity and reliability measures were applied to the development of both survey instruments and questions. Survey and sharing-circle participants included students attending 2-year and 4-year Tribal College/Universities and non-Native colleges/universities (NNCUs), both private and public institutions as well as vocational/trade colleges. This report uses the terms Indigenous, American Indian, Native, and Native American interchangeably. Alaska Native may also be used independently when appropriate or within these terms.
Note about terminology: ¹ Lopez, J. D. (2021). Examining construct validity of the Scale of Native Americans Giving Back. Journal of Diversity in Higher Education, 14(4), 519–529. ²https://doi.org/10.1037/dhe0000181Tachine,A.,YellowBird,E.&Cabrera, N. (2016). Sharing circles: An Indigenous methodological approach to researching with groups of Indigenous people.
4 Copyright © 2022 | All Rights Reserved
participatingtheSharingCircles&IndividualInterviewsSurveyparticipantswhocompletedoneofsurveyswerealsoaskedoftheirinterestininfollow-upinterviewsandsharingcircles
5 Copyright © 2022 | All Rights DemographicReserved & Background Data Gender Identity of Participants Age of 45-54Participants=>55=<15 16-17 18-19 20-21 22-24 25-29 30-34 35-44


6 Copyright © 2022 | All Rights Reserved Most Recent Institution Attended 2% 1% 11% 12% 9% 15% 60% 18% 47% 25% Note: Percentages equal percent of total category, Former Scholar Group Participants or Current Scholar Group LocationParticipants.of Residence On20%CampusScholarCurrent ParticipantsGroup ScholarFormer ParticipantsGroup On21%Campus OffOff80%Campus79%Campus “I travel about 30 miles to the nearest library or grandparents home for“Iwifi.”currently travel 240 miles round trip.” “[My commute was] 15 to 20 miles when I stayed in the city, but when I came from home it was 148 miles.” 44%24%32%76%24% Most Recent Enrollment Status Note: Percentages equal percent of total category, Former Scholar CurrentParticipantsGrouporScholar Group Participants.ScholarCurrentofCount ParticipantsGroup ScholarFormerofCount ParticipantsGroup


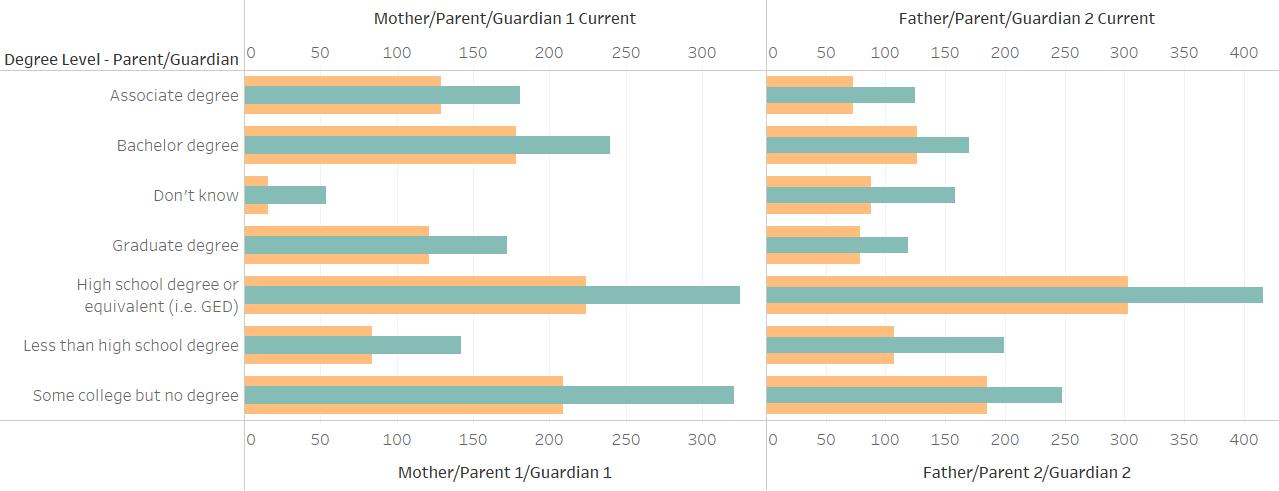
7 Copyright © 2022 | All Rights Reserved Participants’ Tribal Affiliation Current Scholar Group Participant Response Former Scholar Group Participant Response Key Highest Earned Degree Level of Parent(s)/Guardian(s) 13% 13% 19% 17% 2% 4% 13% 12% 23% 23% 9% 10% 22% 22% 9% 8% 12% 13% 11% 9% 8% 8% 29% 32% 14% 11% 17% 19% Note: Percentages equal percent of total category, Former Scholar Group Participants or Current Scholar Group Participants, per column. 172 Tribal Nations represented; circles above are proportionate to Tribal affiliation of participants.


8 Copyright © 2022 | All Rights Reserved 65% of Current participants work fewer than 20 hours per week during the academic term 35% of Current participants work more than 20 hours per week during the academic term 60% of Former participants recalled working fewer than 20 hours per week during the academic term 40% of Former participants recalled working more than 20 hours per week during the academic term 16% of all participants have experienced homelessness during higher education Participants were asked if they experienced food insecurity during college Former Scholar ParticipantsGroup31%17%25% 9% 18% Current Scholar 20%21%ParticipantsGroup33%20%6%


Navigating72%Personal Finances 72% of Current participants reported running out of money at least once in the last six months Participants indicated that if they exhausted their funds, the top five places they would turn include:•Financial Aid • Parent(s)/Guardian(s) • Credit Card • Tribal Council • Pawnshop Household Income Former Scholar Group Participants 17% 27% 9% 10% 18% 19% Current Scholar Group22%Participants43%5%12%12% 6% “I was shocked when I got my … statement for the semester, because when you think about college expenses, you think of housing, tuition, food. And that statement had probably 20 or so different fees. And each fee when they're $100 to $200, they add up extremely quickly, especially because I'm out of state...So that was a shock, something that made me angry because if those fees weren't there, it would be a lot simpler.” -Indigenous College Student 9 Copyright © 2022 | All Rights Reserved


Top seven college costs negatively impacting participants’ education budgets: I know how I will pay for college next year: 67% of Current students are expected to contribute to family bills. Over one-half of participants were not able to save any money prior to enrolling in college. 28% 16%34%16% 6% Participants were asked if they served as the primary source of income for their household during college. 47% 48% 40% 39% 13% 13% MaintenanceCarGasBooksHousingFoodUtilitiesCellPhoneBill 10 Copyright © 2022 | All Rights Reserved


Financial Aid & FAFSA Half of overallbasedparticipantsallchosetheirinstitutiononancostofattendance. I did not fully understand the actual costs of attending college. 14% 23% 30% 28% 23% 20% 27% 22% 6% 7% 6% 11% 26% 30% 39% 37% 23% 16% 6% 6% How difficult was it for you to navigate the financial aid process as an undergraduate? 11 Copyright © 2022 | All Rights Reserved


Over 80% of participants found Financial Aid Award notifications helpful in budgeting for their education. The College Net Price Calculator was helpful budgeting for college: The majority of participants indicated that they were most comfortable discussing finances with family, financial aid counselors/advisors, and/or friends. Top unanticipated costs: • Healthcare • Maintenance/ParkingTransportation/Car • Technology (Laptops/Wifi) • Fees • Food • Housing • Books Over 30% of Former participants found Freshman year of college the most difficult for which to find funding. 48% 12%40% 12 Copyright © 2022 | All Rights Reserved


*Note: Emergency Grant was significantly higher in the Current participant responses, possibly due to the COVID-19 pandemic. Average Combined Financial Resources Received 58% of participants received help completing their Free Application for Federal Student Aid (FAFSA). Those who sought help did so from: Google Search ParentsFinancialAidAdvisors SiblingsFriends 25% 20% 26% 9% 8% 11% 13 Copyright © 2022 | All Rights Reserved


Mainstream society often believes the notion that Indigenous students attend college for free, due to tribal nation resources¹. This is a very pervasive and damaging myth. College is an overwhelming expense for many Native American students as they make the decision to leave their home communities to pursue higher education while taking on Debtdebt. "I find there's more help to get [in] to debt, not so much to get out of it." -Indigenous College Student My perception of debt influenced my choice in major 14% 21% 31% 26% 9% “Compared with other alumni at my institution, I feel like I am in a worse financial situation” 37% 27% 36% ¹ Nelson, C., & Tachine, A. R. (2018). Native student financial aid as Native nation building. In S. J. Waterman, S. C. Lowe, & H. J. Shotton (Eds.), Beyond access: Indigenizing programs for Native American student success (pp. 65–82). Stylus.; Lumina Foundation. (2021). Changing the narrative on student borrrowers of color. Retrieved from: https://www.luminafoundation. org/borrowers-of-color/ 14 Copyright © 2022 | All Rights Reserved


College Student Type of Debt Most Accrued by Former Scholar Group Participants 34% 30% 25% 11% 15 Copyright © 2022 | All Rights Reserved
“His property taxes were behind. So it was either that or he had to lose the property. And I was like, "No." So I bought his old 1999 Honda Civic from him. And then I had a car. And I remember that Civic had grass growing in the back of it. I had to push start it a couple of times. It was just so funny. That was my senior year of college. And I just remember being astounded that I had to buy this car from my dad to help him make the payments. And then my friends, who had millionaire parents, had an Audi and no financial worries at all. It was interesting.”-Indigenous
Total Amount of Debt Accrued by Former Scholar Group Participants


-Indigenous College Student
Table 2 (left) : Of the statistically significant predictors examined in the model, cultural experience, being off campus, parent education, and age were positive predictors of highest level of education, whereas negative budget impacts, caretaking responsibilities, and being the primary source of income were negative predictors of number of undergraduate hours completed. Multiple R2 indicates that approximately 14% of the variation in number of undergraduate hours completed was predicted by the independent variables.
The surveys for current and former scholars were subjected to an exploratory factor analysis to develop summary variables for scales on affordability. The scales were then used in a regression analysis to measure their influence on the number of undergraduate hours completed for current scholars (Table 1) and the highest level of education completed for former scholars (Table 2). This is important because it provides insight into which combined sets of variables most influence progress toward degree completion for each group. Based on the research team’s collective experience working with Indigenous students, several additional variables were entered into each regression analysis to determinesignificance.their “I had negative money. I had some credit card debts and I drove this car that was made out of 10 other cars, it was 10 different colors and all of that. I had nothing. And I think a lot of people in that situation say forget it. I can't go to college. Can't afford that.”
(-)(+)
Findings on Affordability and Completion
Table 1 (Above): Of the statistically significant predictors examined in the model, cultural experience, negative budget impacts, and parent education were positive predictors of highest level of education; and, caretaking responsibilities, life delays, and being the primary source of income were negative predictors of highest level of education. Multiple R2 indicates that approximately 21% of the variation in highest level of education was predicted by the independent variables.
16 Copyright © 2022 | All Rights Reserved


While the financial cost of higher education played a significant role in college affordability, there were additional costs that emerged through the data that deeply affected students’ experiences. One of the more apparent costs that surfaced focused on the cost of time. For Indigenous students, time can often be an expense that is not easily afforded. Due to family, cultural, community, and in some cases ceremonial ties, time is a precious commodity. Upon entering college, students are often aware of the basic time commitments, but the burden and stress of reallocating that time from other priorities is carried not only by the student, but by their family and their community. Hidden expenses are very real costs associated with attending a post-secondary institution and although some may view these costs as part of the collegegoing experience, others experience them as barriers to future access and opportunity.
Furthermore, most students said that their college experience offers many benefits and opportunities that they would not have had before. Some students explained that the burden of debt for college “makes you quit your dreams” while conversely others encouraged future students to attend college regardless of the debt, saying “don’t let the money stop you.” Some students expressed that while their education feels advantageous, the financial stress of their debt overshadows that value. Others detailed that their education felt more and more “worth it” over time, especially if their presence in higher education environments allows them to give voice and visibility to Indigenous issues, reconnect with their heritage by attending a TCU, and/or give back to future generations of Indigenous students.
Discussion
“[College] was totally worth it. It really allowed me to try to become the person I wanted to be - I think that was a big part of it. Try to be someone that can create change, make a difference in the world and hopefully soon I'll be able to start doing that.”
-Indigenous College Student
17 Copyright © 2022 | All Rights Reserved
Despite financial barriers, students in this study overwhelmingly noted the worth of pursuing higher education. This speaks to the need to “live in two worlds,” or pair our own tribally-centered paradigms with that of westernized perspectives of knowing. Students emphasized the need to gain degrees from their mainstream institutions and bring back the duality of knowledge to their home communities.
Students spoke of a variety of hidden costs regarding college expenses. Common costs that were not associated with the college-going experience included the increasing cost of books and materials, travel to and from their institutions, and technology (such as computers and printers). Additionally, many students addressed their frustration towards mandatory on-campus housing and meal plans, stating that they could have saved a lot of money if those were not required. These frustrations beg the question of what other mandatory costs serve as barriers which college and universities could make more equitable.
• Evaluate internal organizational and awarding processes for cultural competence and inclusion.
Practice & Policy Recommendations
• Offer emergency aid programs that are clear, accessible, and inclusive of Indigenous student needs.
• Eliminate campus-based data invisibility of Indigenous students by being data inclusive and ensure evidence-based financial aid practices are informed by Indigenous student data.
• Update training for school personnel to be aware of and support the unique needs of Indigenous students.
• Deepen understanding and competence of staff around Indigenous student populations and their financial needs in order to support overall student success.
• Communicate and improve transparency surrounding the actual costs of fees, housing and other non-tuition related expenses so that Indigenous students better understand the full cost of attendance.
For National Non-Native Scholarship Providers
For Secondary and Pre-College Education
• Assist Indigenous high school students to explore funding options for their institution of choice, in addition to college choices perceived as ‘affordable’.
18 Copyright © 2022 | All Rights Reserved
• Advocate for expanded federal grant programs to support Indigenous students around issues relative to the unique mission of your institutions.
• Continue developing financial aid programs to fully offset tuition and fees acknowledging the unique roles and responsibilities land-grant and NASNTI campuses hold for Indigenous students.
• Advocate nationally for additional investment and expanded eligibility for Pell Grants.
• Increase and strengthen financial literacy school curricula and pre-college financial planning.
• Expand FAFSA information and planning for families/caregivers and students.
• Engage with financial aid offices to ensure that they are providing adequate funding beyond scholarships for addressing the unique needs of your Indigenous students without increasing debt.
For Land Grant Colleges and Universities and Native American Serving Non-Tribal Institutions
For Higher Education and Financial Aid
• Expand campus-based tuition and fee waivers and non-debt funding sources for costs and fees such as transportation, healthcare, books/technology/internet access, housing, and food.
• Improve school data inclusion of Indigenous student data especially as it relates to financial need and college transition planning.
• Provide expanded aid for non-tuition expenses, such as housing, transportation, utilities, etc.
• Use this report as a benchmark for collecting more campus-based data to inform financial aid practices to improve affordability outcomes for Indigenous students.
Please contact: Dr. David Sanders dsanders@collegefund.org or Dr. John L. Garland john.garland@cobellscholar.org information related to this Executive Summary
Home-going after graduation support loan scholarships their year scholarships versus 1 year of cost of attendance college choice award voice, tribal member representation campus tribal representation
effect on collegiate outcomes 4
Next Steps for Research on Affordability for Indigenous
scholarships Perception
may overshadow within group diversity. 19 Copyright © 2022 | All Rights Reserved
success and default rates External
on
and
families/communities Student
displacement Explore quantitative analytic methods for insuring
to
within national and
Implications of scholarship
visibility, and data inclusion for smaller
for
“[I discovered] a feeling of fulfillment… I found something that I want to do, and that feeling itself will give me confidence. So I have gained a lot of confidence as a person since learning all of this and just feeling complete…I have something that I really really enjoy, and I really want to do, and I’m working towards. And as frustrating and as hard as it can be, I’m really good at it, and I’m going to finish it, and I can put something underneath my belt as a person and be like, “Yeah, I struggled, and I had a really hard time, but I did it,” and that’s really cool.”-Indigenous College Student Students Impact of StudentCOVID-19loans
data sets where larger
Report.


