UNIVERSITÀ DEGLI STUDI DI PADOVA

Department Of Civil, Environmental and Architectural Engineering
MASTER DEGREE IN ENVIRONMENTAL ENGINEERING
MASTER THESIS
Decompacting Holocene delta sequences to quantify their (proper) weight
Supervisor: Prof. Teatini Pietro Graduate student:Anita Rigoni
Co-supervisors: Claudia Zoccarato
Philip S. J. Minderhoud
1206710
Academic year
2019-2020
Most of the world major deltas are threatened by relative sea level rise ∆������:
• ��, delta aggradation rate;
• ∆��, sea-level rise;
• ����, natural compaction and ����, anthropogenic compaction;
• ��, downward vertical movement (tectonics).
The aim of this study is to quantify the weight of the Holocene portion of deltas to evaluate the natural component of the land subsidence:
1. Deformation of the Earth crust due to the cumulative load of Holocene (SIA);
2. Natural compaction of Holocene deposits.
The work is organized as follows:

1. Decompaction of Holocene delta sequences;
2. Construction of map of actual (i.e. compacted) delta thickness;
3. Representation of map of natural compaction of Holocene deposits;
4. Integration of 2-D representation over delta extent to compute the weight
5. Application of the modelling procedure to 8 major deltas.
Introduction
∆������=��−∆��−���� −���� ±��
Methodology
1. Decompaction of Holocene representative columns
2. Interpolation of Holocene thickness data

3. Set type of environment (i.e. marine/fluvial, coastal/inner)


4. Calculation of the weight

Methodology

From the combination of the previous flowchart steps, through the Weight Model, it is possible to extrapolate a 3-D grid with Holocene decompacted thickness. The total specific weight is computed as: �� = ��=1 �� ����(��) ∗����.

Po, Italy
Study areas


Pearl, China Krishna, India
Danube, Romania
Mekong, Vietnam
are those specifically addressed in this work. (1) Amazon, ; ( ) Amur, ; ( ) Mexico; (6) Congo, DRC; (7) Danube, Romania; (8) Fly, Papua New Guinea; (9) Ganges, Bangladesh; (10) Godavari, India; (11) Han, Korea; (12) Indus, Pakistan; (13) Irrawaddy, Myanmar; (14) Krishna, India; (15) Limpopo, Mozambique; (16) Magdalena, Colombia; (17) Mahakam, Borneo; (18) Mahanadi, India; (19) Mekong, Vietnam; (20) Mississippi, USA; (21) Niger, Nigeria; (22) Nile, Egypt; (23) Orinoco, Venezuela; (24) Parana, Argentina; (25) Pearl, China; (26) Po, Italy; (27) Rhone, France; (28) Sao Francisco, Brazil; (29) Tigris, Iraq; (30) Tone, Japan; (31) Vistula, Poland; (32) Yangtze, China; (33) Yellow, China.


Lithological Characterization
Holocene sedimentary layers are:

• Collected and examinated
• Associated with the main sedimentary categories identified by Bridgeman (2018) for the Mississippi delta.

Soil type e0 Cc grain [KN/m3] Peat 12.70 4.720 12.6 Mouth bar sand 1.01 0.033 27.6 Silt loam 1.06 0.230 22.9 Silty clay 1.80 0.565 19.5 Organic clay 2.50 0.300 22.9
Results: interpolated maps of the actual (compacted) thickness of the whole delta
4 4 4 4 8 8 8 8 8 12 1 2 12 12 12 16 16 16 20 20 580000 600000 620000 640000 660000 680000 700000 720000 740000 760000 780000 XcoordUTM(mE) 1480000 1500000 1520000 1540000 1560000 1580000 1600000 1620000 1640000 1660000 1680000 Y c o o r d U T M ( m N ) 0 5 10 15 20 25 30 Actualthickness (m) 15 1,5 1,5 15 3 3 3 3 3 45 4,5 4,5 4,5 6 6 6 6 6 6 75 7 5 75 7,5 7,5 7 5 9 9 9 640000 650000 660000 670000 680000 690000 700000 710000 XcoordUTM(mE) 4960000 4970000 4980000 4990000 5000000 5010000 5020000 5030000 5040000 Y c o o d U T M ( m N ) 0 2 4 6 8 10 12 14 Actualthickness (m) 8 8 8 8 16 16 16 16 24 24 24 24 32 32 40 48 560000 570000 580000 590000 600000 610000 620000 630000 640000 XcoordUTM(mE) 1810000 1820000 1830000 1840000 1850000 1860000 1870000 1880000 Y c o o r d U T M ( m N ) 0 16 32 48 64 80 96 112 128 Actualthickness (m) 5 5 10 10 10 15 15 20 20 20 25 25 460000 470000 480000 490000 500000 510000 520000 530000 XcoordUTM(mE) 1740000 1750000 1760000 1770000 1780000 1790000 1800000 1810000 1820000 Y c o o r d U T M ( m N ) 0 5 10 15 20 25 30 35 40 45 50 Actualthickness (m) 25 2 5 25 25 25 25 25 50 50 50 50 450000 500000 550000 600000 650000 XcoordUTM(mE) 950000 1000000 1050000 1100000 1150000 1200000 Y c o o r d U T M ( m N ) 0 20 40 60 80 100 Actualthickness (m) 20 20 20 20 40 40 40 40 40 60 80 50000 100000 150000 200000 250000 300000 XcoordUTM(mE) 3200000 3250000 3300000 3350000 3400000 Y c o o d U T M ( m N ) 0 80 160 240 Actualthickness (m) 15 15 15 15 15 304 5 680000 700000 720000 740000 760000 780000 800000 820000 XcoordUTM(mE) 2440000 2460000 2480000 2500000 2520000 2540000 2560000 2580000 Y c o o r d U T M ( m N ) 0 15 30 45 60 75 90 105 Actualthickness (m) 26 32 38 280000 290000 300000 XcoordUTM(mE) 4950000 4960000 4970000 4980000 4990000 5000000 5010000 Y c o o r d U T M ( m N ) 20 26 32 38 44 50 56 62 68 74 Actualthickness (m) 30 0 0 0 0 0 20 0 0 14 128 100 240 105 50 74
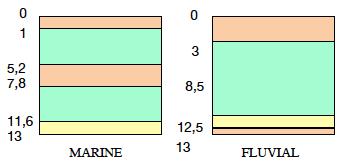
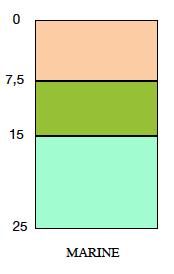
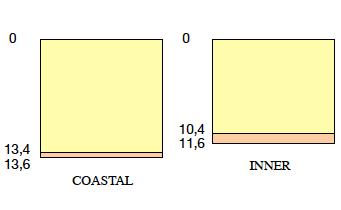
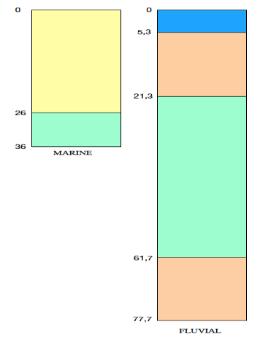
Results: compacted and decompacted representative sedimentary columns


Chao Phraya
Danube
Godavari
Krishna
Results: compacted and decompacted representative sedimentary columns


Mekong Pearl Mississippi Po
Results: interpolated maps of the decompacted thickness of the whole delta 30
4 4 4 4 4 8 8 8 8 8 8 12 12 12 12 12 16 1 6 16 16 16 20 20 2 0 24 24 580000 600000 620000 640000 660000 680000 700000 720000 740000 760000 780000 XcoordUTM(mE) 1480000 1500000 1520000 1540000 1560000 1580000 1600000 1620000 1640000 1660000 1680000 Y c o o r d U T M ( m N ) 0 5 10 15 20 25 30 Decompacted thickness (m) 1,5 1,5 1,5 1,5 3 3 3 3 3 45 4,5 4,5 45 6 6 6 6 7,5 7 5 75 7,5 7,5 9 9 9 9 9 9 10,5 10 ,5 10 5 10,5 10,5 1 0, 5 12 12 12 12 12 640000 650000 660000 670000 680000 690000 700000 710000 XcoordUTM(mE) 4960000 4970000 4980000 4990000 5000000 5010000 5020000 5030000 5040000 Y c o o r d U T M ( m N ) 0 2 4 6 8 10 12 14 Decompacted thickness (m) 8 8 8 8 16 16 16 16 24 24 24 24 32 32 32 32 40 40 40 40 48 48 48 48 56 56 56 64 64 72 72 808896 560000 570000 580000 590000 600000 610000 620000 630000 640000 XcoordUTM(mE) 1810000 1820000 1830000 1840000 1850000 1860000 1870000 1880000 Y c o o r d U T M ( m N ) 0 16 32 48 64 80 96 112 128 Decompacted thickness (m) 5 5 10 10 10 15 15 15 20 20 25 25 30 30 30 35 35 35 40 40 45 460000 470000 480000 490000 500000 510000 520000 530000 XcoordUTM(mE) 1740000 1750000 1760000 1770000 1780000 1790000 1800000 1810000 1820000 Y c o o r d U T M ( m N ) 0 5 10 15 20 25 30 35 40 45 50 Decompacted thickness (m) 25 25 25 2 5 25 2 5 2 5 25 25 25 50 5 0 50 50 50 50 75 75 75 75 450000 500000 550000 600000 650000 XcoordUTM(mE) 950000 1000000 1050000 1100000 1150000 1200000 Y c o o r d U T M ( m N ) 0 20 40 60 80 100 Decompacted thickness (m) 20 20 40 40 40 40 60 60 60 60 80 80 80 80 80 100 100 100 120140 160 180200220 50000 100000 150000 200000 250000 300000 XcoordUTM(mE) 3200000 3250000 3300000 3350000 3400000 Y c o o d U T M ( m N ) 0 80 160 240 Decompacted thickness (m) 15 15 15 15 15 15 15 15 30 30 30 45607 5 680000 700000 720000 740000 760000 780000 800000 820000 XcoordUTM(mE) 2440000 2460000 2480000 2500000 2520000 2540000 2560000 2580000 Y c o o r d U T M ( m N ) 0 15 30 45 60 75 90 105 Decompacted thickness (m) 38 38 44 5 0 50 56 62 280000 290000 300000 XcoordUTM(mE) 4950000 4960000 4970000 4980000 4990000 5000000 5010000 Y c o o r d U T M ( m N ) 20 26 32 38 44 50 56 62 68 74 Decompacted thickness (m)
0 0 0 0 0 20 0 0 14 128 100 240 105 50 74
Results: interpolated maps of the absolute and percentage compaction

0,4 04 280000 290000 300000 XcoordUTM(mE) 4950000 4960000 4970000 4980000 4990000 5000000 5010000 Y c o o r d U T M ( m N ) 0,0 0,1 0,2 Compaction (%) 0,3 0, 3 0,3 0,3 0 ,3 0,3 0,4 04 04 0,4 0, 4 0,4 0,4 680000 700000 720000 740000 760000 780000 800000 820000 XcoordUTM(mE) 2440000 2460000 2480000 2500000 2520000 2540000 2560000 2580000 Y c o o r d U T M ( m N ) 0,0 0,1 0,2 0,3 0,4 0,5 0,6 Compaction (%) 0,1 0,1 0,1 0,2 0,2 0,2 0 ,2 0 3 0,3 0, 4 0 ,4 0,4 0,5 0, 5 0,5 0 ,5 50000 100000 150000 200000 250000 300000 XcoordUTM(mE) 3200000 3250000 3300000 3350000 3400000 Y c o o d U T M ( m N ) 0,0 0,1 0,2 0,4 0,5 0,6 Compaction (%) 25 25 25 2 5 25 2 5 2 5 25 25 25 50 5 0 50 50 50 50 75 75 75 75 0 ,2 0, 2 0,2 0,2 0,2 0,2 0,2 0,2 0,2 0,2 0,2 0,2 0,3 0 ,3 0 ,3 0 3 0,3 0,3 0 3 0,3 0 4 0,4 450000 500000 550000 600000 650000 XcoordUTM(mE) 950000 1000000 1050000 1100000 1150000 1200000 Y c o o r d U T M ( m N ) 0,0 0,1 0,2 0,4 0,5 0,6 Compaction (%) 01 0,1 0,1 0,2 0,2 0,2 03 0,3 460000 470000 480000 490000 500000 510000 520000 530000 XcoordUTM(mE) 1740000 1750000 1760000 1770000 1780000 1790000 1800000 1810000 1820000 Y c o o r d U T M ( m N ) 0,0 0,1 0,2 0,4 0,5 0,6 Compaction (%) 0,2 0,2 0,3 0,3 0,4 ,4 0,4 0,4 0,4 0,4 0,4 0, 4 0,5 560000 570000 580000 590000 600000 610000 620000 630000 640000 XcoordUTM(mE) 1810000 1820000 1830000 1840000 1850000 1860000 1870000 1880000 Y c o o r d U T M ( m N ) 0,1 0,1 01 01 0,2 0,2 02 0,3 0 3 0,3 0,3 0 ,3 0, 3 03 0,3 0, 3 0 ,3 03 0,3 640000 650000 660000 670000 680000 690000 700000 710000 XcoordUTM(mE) 4960000 4970000 4980000 4990000 5000000 5010000 5020000 5030000 5040000 Y c o o r d U T M ( m N ) 0,0 0,1 0,2 0,4 0,5 0,6 Compaction (%) 02 0, 2 0 2 0,2 0 2 0,2 02 0,2 0 2 02 0 2 0 2 580000 600000 620000 640000 660000 680000 700000 720000 740000 760000 780000 XcoordUTM(mE) 1480000 1500000 1520000 1540000 1560000 1580000 1600000 1620000 1640000 1660000 1680000 Y c o o r d U T M ( m N ) 0,0 0,1 0,2 0,4 0,5 0,6 Compaction (%)
������������������������ −�������������� ������������������������
��������.%=
0 6 0, 6 0,6 06 1,2 1 2 1 2 1,2 1,2 1,8 1, 8 1 8 1 8 1,8 2 4 2 4 2,4 2 4 24 3 3 3 3 3 3 6 3,6 3,6 4,2 42 4 2 580000 600000 620000 640000 660000 680000 700000 720000 740000 760000 780000 XcoordUTM(mE) 1480000 1500000 1520000 1540000 1560000 1580000 1600000 1620000 1640000 1660000 1680000 Y c o o r d U T M ( m N ) 0 1,2 2,4 3,6 4,8 Compaction (m) 0,6 06 12 1,2 12 12 1,8 1,8 18 2,4 2, 4 2,4 2,4 2,4 2 4 2, 4 3 3 3 3 3 3 3 36 3 6 3,6 3,6 640000 650000 660000 670000 680000 690000 700000 710000 XcoordUTM(mE) 4960000 4970000 4980000 4990000 5000000 5010000 5020000 5030000 5040000 Y c o o r d U T M ( m N ) 0 0,9 1,8 2,7 3,6 Compaction (m) 6 6 6 12 12 12 12 18 18 18 18 24 24 24 30 30 36 36 4248 560000 570000 580000 590000 600000 610000 620000 630000 640000 XcoordUTM(mE) 1810000 1820000 1830000 1840000 1870000 1880000 Y c o o r d U T M ( m N ) 0 10 20 30 40 50 Compaction (m) 2 2 2 4 4 4 6 6 8 8 10 10 10 12 12 14 14 16 460000 470000 480000 490000 500000 510000 520000 530000 XcoordUTM(mE) 1740000 1750000 1760000 1770000 1780000 1790000 1800000 1810000 1820000 Y c o o r d U T M ( m N ) 0 2 4 6 8 10 12 14 16 18 Compaction (m) 8 8 8 8 8 8 8 8 16 16 16 16 16 16 24 24 24 24 24 2 4 24 450000 500000 550000 600000 650000 XcoordUTM(mE) 950000 1000000 1050000 1100000 1150000 1200000 ( ) 0 8 16 24 32 Compaction (m) 15 15 15 15 30 30 30 30 45 45 45 60 75 90 105120 50000 100000 150000 200000 250000 300000 XcoordUTM(mE) 3200000 3250000 3300000 3350000 3400000 Y c o o d U T M ( m N ) 0 25 50 75 100 125 Compaction (m) 4 4 4 4 4 4 4 4 8 8 8 8 8 12 12 12 12 16 16 16 202 4 680000 700000 720000 740000 760000 780000 800000 820000 XcoordUTM(mE) 2440000 2460000 2480000 2500000 2520000 2540000 2560000 2580000 Y c o o r d U T M ( m N ) 0 6 12 18 24 30 Compaction (m) 13 15 15 17 19 2 1 21 2 3 23 25 280000 290000 300000 XcoordUTM(mE) 4950000 4960000 4970000 4980000 4990000 5000000 5010000 Y c o o r d U T M ( m N ) 11 14 17 20 23 26 Compaction (m) 4.8 0 0 0 0 0 0 0 11 3.6 50 32 125 26 18 30
Discussion

• Mississippi and Po: heaviest deltas per unit area, largest average compaction.
• Godavari: large compaction.
• Mekong: significant sediment weight per unit area, smaller average compaction.
• Krishna and Pearl: small compaction values.
• Chao Phraya and Danube: Lighter deltas per unit area, small average compaction
Delta Area [������] Average Actual Holocene thickness [m] Average decompacted Holocene thickness [m] Average Compaction Average sediment weight per unit area [tons/m2] Total weight (sediments) [Mtons] Chao Phraya 23,000 7.85 9.83 18% 3.59 0.85×10⁵ Danube 4,000 5.95 8.40 25% 3.87 0.16×10⁵ Godavari 4,000 14.41 26.01 38% 7.00 0.34×10⁵ Krishna 3,500 13.17 19.84 23% 9.94 0.38×10⁵ Mekong 50,700 25.20 36.48 25% 15.35 6.00×10⁵ Mississippi 29,000 33.35 66.03 48% 17.77 5.70×10⁵ Pearl 11,600 10.13 16.10 31% 4.27 0,49×10⁵ Po 948 28.86 49.94 42% 17.14 0,15×10⁵
Conclusion
Large variability in compaction and specific weight distribution from case to case.
• Natural compaction plays a significant role on the delta environment evolution, with the largest values computed for the Mississippi and Po deltas.
• Quantifying sediment accumulation and natural compaction is not trivial. It requires a deep knowledge of geomechanical properties of soils and information about delta progradation. These data are often difficult to obtain.
• Future improvements: accounting for more precise information and more specific knowledge of the geomechanical properties of the various deltaic deposits.

•

Thank you for the attention.


