4. Study areas
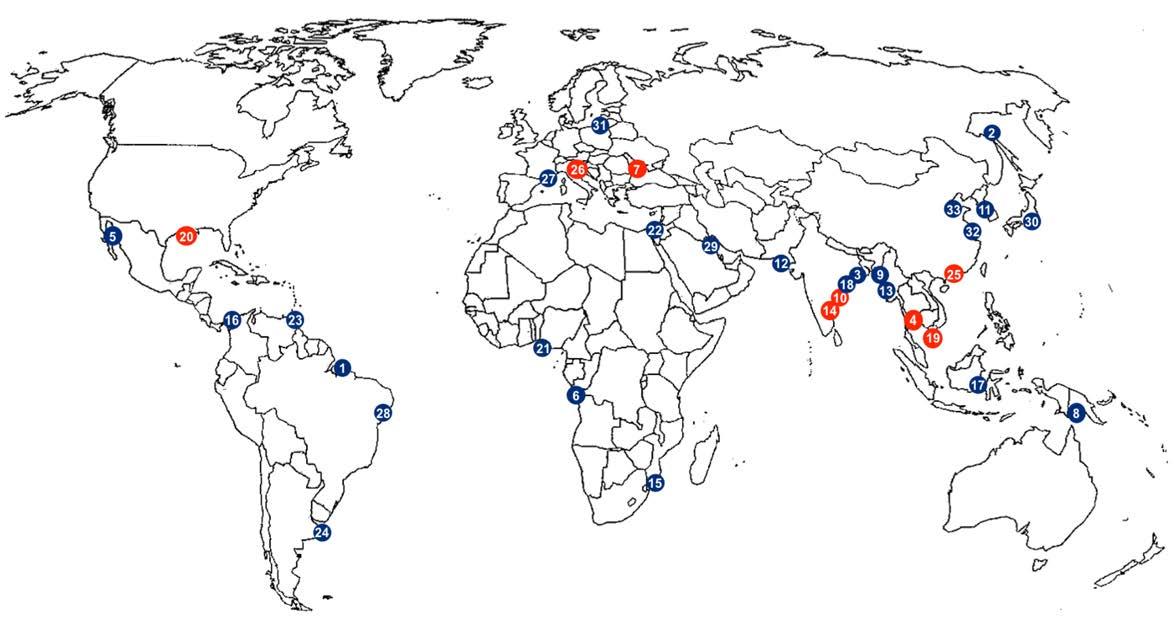
Figure 4:
this work. (1) Amazon, Brazil; (2) Amur, Russia; (3) Brahmani, India; (4) Chao Phraya, Thailand; (5) Colorado, Mexico; (6) Congo, DRC; (7) Danube, Romania; (8) Fly, Papua New Guinea; (9) Ganges, Bangladesh; (10) Godavari, India; (11) Han, Korea; (12) Indus, Pakistan; (13) Irrawaddy, Myanmar; (14) Krishna, India; (15) Limpopo, Mozambique; (16) Magdalena, Colombia; (17) Mahakam, Borneo; (18) Mahanadi, India; (19) Mekong, Vietnam; (20) Mississippi, USA; (21) Niger, Nigeria; (22) Nile, Egypt; (23) Orinoco, Venezuela; (24) Parana, Argentina; (25) Pearl, China; (26) Po, Italy; (27) Rhone, France; (28) Sao Francisco, Brazil; (29) Tigris, Iraq; (30) Tone, Japan; (31) Vistula, Poland; (32) Yangtze, China; (33) Yellow, China.
Several studies were conducted over the last decades to assess the present state of major worldwide deltas and anticipate their possible fate in the next decades depending on natural and anthropogenic stressors. This thesis refers to the 33 major deltas (Figure 4) investigated by Syvitski et al., (2009) to establish their tendency to flooding and evaluate if they are sinking more rapidly than mean sea level is rising. Syvitski et al. (2009) examined the present environmental conditions in relation to relative sea level rise and related processes. The aggradation rates were estimated, both before and after significant human interventions. Aggradation was then compared with subsidence rates obtained from the literature. The subsidence rates are often local maximum values
18
Location of the 33 major delta according to Syvistki et al. (2009). The deltas highlighted by the red dots are those specifically addressed in
within the deltaic plain, relative sea-level rise represents a local value, whereas aggradation rates are spatially averaged. They concluded that 85% of the deltas experienced severe flooding in the past decade, causing a temporary submergence of 260,000 km2 (Syvitski et al., 2009). Moreover, aggradation rates were examined and compared with published tide gauge records and DEMs (digital elevation model) to determine the risk of future delta inundation. The authors concluded that most of the deltas are sinking at rates many times faster than global sea level rise.
Table 1 provides a list of the 33 major deltas and the corresponding level of risk as evaluated by Syvitski et al., (2009). For deltas identified as “at greater risk”, such as Brahamani, Godavari, Indus, Mahanadi, Parana and Vistula reduced aggradation can no longer keep up with local sea-level rise. Among deltas “in peril”, the authors located Gange-Bramaputra, Irrawaddy, Magdalena, Mekong, Mississippi, Niger and Tigris deltas. In this case, reduced aggradation plus anthropogenic subsidence are overwhelming the rates of global se-level rise. The third category of risk groups the deltas which are named “in greater peril”. Belong to this set the Chao Phraya, Colorado, Krishna, Nile, Pearl, Po, Rhone, Sao Francisco, Tone, Yangtze and Yellow river deltas. They experience virtually no aggradation and/or are subject to heavy oil and gas extraction that places them in great peril of flooding and inundation. A few of studied deltas (Amazon, Congo, Fly, Orinoco, Mahaka river deltas) seem to be “not at risk”. Deltas “at risk” are experiencing a decrease in aggradation but rates still exceed the local sea-lever rise, such as Amur, Danube, Han, Limpopo river deltas.
19
Level of risk Deltas
Deltas not at risk: aggradation rates unchanged, minimal anthropogenic subsidence.
Deltas at risk: reduction in aggradation, but rates still exceed relative sea-level rise
Amazon (Brazil), Congo (DRC), Fly (Papua New Guinea), Orinoco (Venezuela), Mahaka (Borneo).
Amur (Russia), Danube (Romania), Han (Korea), Limpopo (Mozambique).
Deltas at greater risk: reduction in aggradation where rates no longer exceed relative sea-level rise.
Deltas in peril: reduction in aggradation plus accelerated compaction overwhelming rates of global sea-level rise
Brahmani (India), Godavari (India), Indus (Pakistan), Mahanadi (India), Parana (Argentina), Vistula (Poland).
Ganges (Bangladesh), Irrawaddy (Myanmar), Magdalena (Colombia), Mekong (Vietnam), Mississippi (USA), Niger (Nigeria), Tigris (Iraq).
Deltas in greater peril: virtually no aggradation and/or very high accelerated compaction
Chao Phraya (Thailand), Colorado (Mexico), Krishna (India), Nile (Egypt), Pearl (China), Po (Italy), Rhone (France), Sao Francisco (Brazil), Tone (Japan), Yangtze (China), Yellow (China).
20
Table 1: Major deltas and relative level of risk (after Syvitski et al., 2009).
21 Delta Area < 2 m above sea level (km2) Stormsurge area (km2) Recent area of river flooding (km2) Recent area of in situ flooding (km2) Sediment reduction (%) Floodplain or delta flow diversion Distributary channel reduction (%) Subsurface water, oil and gas mining Earlytwentieth century aggradation rate (mm/y) Twentyfirst century aggradation rate (mm/y) R elative sealevel r ise (mm / y) Amazon, Brazil 1960 0; LP 0 9340 0 No 0 0 0,4 0,4Amur, Russia 1250 0; LP 0 0 0 No 0 0 2 1,1 1 Brahmani, India 640 1100 3380 1580 50 Yes 0 Major 2 1 1,3 Chao Phraya, Thailand 17800 800 4000 1600 85 Yes 30 Major 0,2 0 13-150 Colorado, Mexico 700 0; MP 0 0 100 Yes 0 Major 34 0 2-5 Congo, DRC 460 0; LP 0 0 20 No 0 0 0,2 0,2Danube, Romania 3670 1050 2100 840 63 Yes 0 Minor 3 1 1,2 Fly, Papua New Guinea 70 0; MP 140 280 0 No 0 0 5 5 0,5 Ganges, Bangladesh 61700 10500 52800 42300 30 Yes 37 Major 3 2 8-18 Godavari, India 170 660 220 1100 40 Yes 0 Major 7 2 3 Han, Korea 70 60 60 0 27 No 0 0 3 2 0,6 Indus, Pakistan 4750 3390 680 1700 80 Yes 80 Minor 8 1 >1,1 Irrawaddy, Myanmar 1100 15000 7600 6100 30 No 20 Moderate 2 1,4 3,4-6 Krishna, India 250 840 1160 740 94 Yes 0 Major 7 0,4 3 Limpopo, Mozambique 150 120 200 0 30 No 0 0 7 5 0,3 Magdalena, Colombia 790 1120 750 750 0 Yes 70 Moderate 6 3 5,3-6,6 Mahakam, Borneo 300 0; LP 0 370 0 No - 0 0,2 0,2Mahanadi, India 150 1480 2060 1770 74 Yes 40 Moderate 2 0,3 1,3 Mekong, Vietnam 20900 9800 36750 17100 12 No 0 Moderate 0,5 0,4 6 Mississippi, USA 7140 13500 0 11600 48 Yes - Major 2 0,3 5-25 Niger, Nigeria 350 1700 2570 3400 50 No 30 Major 6 0,3 7-32 Nile, Egypt 9440 0; LP 0 0 98 Yes 75 Major 1,3 0 4,8 Orinoco, Venezuela 1800 0; MP 3560 3560 0 No 0 - 1,3 1,3 0,8-3 Parana, Argentina 3600 0; LP 5190 2600 60 No - - 2 0,5 2-3 Pearl, China 3720 1040 2600 520 67 Yes 0 Moderate 3 0,5 7,5 Po, Italy 630 0; LP 0 320 50 No 40 Major 3 0 4-60 Rhone, France 1140 0; LP 920 0 30 No 40 Minor 7 1 2-6 Sao Francisco, Brazil 80 0; LP 0 0 70 Yes 0 Minor 2 0,2 3-10 Tigris, Iraq 9700 1730 770 960 50 Yes 38 Major 4 2 4-5 Tone, Japan 410 220 0 160 30 Yes 0 Major 4 0 >10 Vistula, Poland 1490 0; LP 200 0 20 Yes 75 - 1,1 0 1,8 Yangtze, China 7080 6700 3330 6670 70 Yes 0 Major 1,1 0 3-28 Yellow, China 3420 1430 0 0 90 Yes 80 Major 49 0 8-23
Table 2: Representative deltas with key environment data (after Syvitski et al., 2009). LP: Little Potential; MP: Medium Potential. Different colors are representative of different level of risk.
As we can infer from Table 2, river sediment delivery to deltas has been reduced or eliminated over the last years. Most deltas have experienced coastal inundation, floods from rivers or intense rainfall. More in detail, the authors inferred that, only in 20072008, Chao Phraya, Godavari, Krishna and Mekong experienced substantial flooding which causes 100,000 lives lost and more than a million habitants displaced (Syvitski et al., 2009). Some of the deltas received fluvial or marine sediments, but not enough to make up for the floods and the upstream-damming they are subjected to. Another significant element is the reduction in the number of active distributary channels in order to support navigation in the main ones, with the consequence that channels are no longer free to migrate across the delta plain making sedimentation easier.
As previously anticipated, the aim of this thesis is to evaluate the natural components of the land subsidence mostly affecting deltas. The processes that drive subsidence involve several contributors as tectonics, isostatic adjustment, natural sediment compaction and anthropogenic compaction due to underground fluids extraction, reduced aggradation and coastal erosion. In river deltas, natural compaction and reduced aggradation are a common cause of subsidence, which also influence the deltaic morphology. According to Jankowski et al. (2017), compaction of Holocene sedimentary layers is identified as the main cause for Mississippi river delta subsidence, where SIA represents a minor contributing factor. The effects of the sinking of deltas include aquifer salinization, damage to buildings and infrastructures, flooding and inundation. For this reason, the evaluation of the impact of anthropogenic and natural drivers of land subsidence in coastal area, as well as sea level rises, is important to face with possible scenarios of delta management.
22
4.1. Relevant information about study areas
A large literature review was carried out to develop a significant dataset for the various deltas listed in Table 2. With the main aim to collect information supporting the application of the proposed methodological approach, i.e. the quantification the proper weight of Holocene deltas, qualitative and quantitative information about deltaic environment, composition and geomechanical characteristics of soils, sediment type, properties and depositional history, sedimentation and compaction rates and presence of natural and anthropogenic drivers are acquired, revised, and analyzed. Estimation of natural compaction at a delta scale is often missing: a general lack of data was found in literature since this is a topic currently under research and because little is known about sediment properties and depositional history. Many deltas are not well studied with a lack of quantitative databases of key morphodynamic factors associated with their recent evolution. These deltas are mainly located in developing countries, and basic research on these systems is slow to start. A summary of the collected information on area, sediment type and properties, thickness of the Holocene deposits, subsidence and sedimentation rates, and other drivers for the 33 selected deltas is summarized in Table 3.
Area (km2 ):
Amazon delta, Brazil
108,882 km2
Sediment type and properties: Mud (85-95%), fine grained continental margin sediments, silt and clay.
Thickness of Holocene strata: Mean elevation 30 m, width of Holocene coastal plain goes from 10 to 100 m
Subsidence rate: 0.15 - 0.2 mm/y
Sedimentation: Annual sediment discharge 1 2 x 10⁹ t, sediment accumulation > 1 cm/y
Currents, tide, waves, fluvial sediment flux: High energy coastal regimes, tide and litoral current dominated, moderate surface waves, no development of delta plain but dispersal of Amazon sediments
Natural/anthropogenic drivers: Supply of sediment sufficient to create major topographic deposit on the shelf. Shear stress associated
Dunne et al., 2019
Nittrouer et al., 1986
Nittrouer et al., 1995
23
Table 3: Relevant information for the list of 33 representative deltas
with the ambient physical processes inhibit the deposit from accreting to sea level, tectonic motions.
Amur delta, Russia
Brahmani delta, India
Chao Phraya delta, Thailand
Sediment type and properties: Mud dominated environment. Sand, dark gray clay, silty clay. Holocene sediments divided in: lower transgressive peaty sediments and upper regressive deltaic sediments.
Thickness of Holocene strata: Holocene marine sediments are 10–20m thick in the central part of the delta, thin toward the margins
Subsidence rate: Between 1978 and 1988, groundwater pumping to supply the city of Bangkok, Thailand, caused more than 100 mm/year of subsidence
Sedimentation: Deltaic sediment volume for the last 7.5 ± 0.5 kyr shows that the average rate of sedimentation was 23.1 ± 3.6 million t/y, which is nearly the same as the present total sediment discharge from both rivers Accumulation rate was 0.26 cm/y for prodelta and shelf sediment, 0.66 cm/y delta front sediments.
Currents, tide, waves, fluvial sediment flux: The coast of the Chao Phraya delta is a low-energy environment. The mean tidal range is approximately 1.2 m, and the maximum is 2.3–2.8 m. Sum of annual discharge from Chao Phraya and Mae Klong river is 19 million t.
Natural/anthropogenic drivers: Groundwater extraction, great sediment supply by rivers
Colorado delta, Mexico
Saito et al., 2002
Danube delta, Romania
Sediment type and properties: Delta composed of two main units Sand, silty clay, clay. VespremeanuStroe et al. 2017
Thickness of Holocene strata: Holocene thickness goes from 4 m in the fluvial part to 9 m in the maritime part.
24
Area (km2 ): 1,452 Dunne et al. 2019
Area (km2 ): 12,448 Dunne et al. 2019
Area (km2 ): 23,000 Dunne et al. 2019
Area (km2 ) 8,611 Dunne et al. 2019 Congo
Area (km2 ) 2,219 Dunne et al. 2019
Area (km2 ) 4,000 Dunne et al. 2019
delta, DRC
Subsidence rate: The reconstructed subsidence shows rates of 0.4–0.6 mm/y in the north for the fluvial delta (Old Danube Lobe), whilst the southwestern part presents higher rates of 0.7–1 mm/y
Sedimentation: The sedimentation rates: values of 1.8 mm/y for the 5.5–4.1 ka interval, during the 3.1–2.4 ka interval highest sedimentation rate of 2.4 mm/y occurs the sedimentation rates decreased three to four times – 0.8 mm/y in 2.38–2.15 ka, respectively 0.6 mm/y in 2.15–0.44. After a phase of wave dominated river mouth (0.9–0.25 ka), fluvial dominated morphology of the lobe with mean progradation rates up to 100 m/y during the 19th and the beginning of the 20th centuries;
Currents, tide, waves, fluvial sediment flux: Sediment discharge of 25 to 35 Mt/y, of which 4–6 Mt/y is sandy material. Tideless and medium wave energy conditions. Vigorous southward longshore sediment transport.
Natural/anthropogenic drivers: Situated in a mobile area affected by subsidence and important sediment accumulations. Formed as major coastal accumulation feature.
Fly delta, Papua New Guinea Area
(km2 )
3,541
Sediment type and properties: Fine grained <63um, muddy system, alternation between sand and muds. Sand-mud couplet is about 2 cm. Muddy stratigraphy dominated.
Thickness of Holocene strata: thickness from 0 to 10 m
Sedimentation: 8-10 cm/y. 85 million t/y of sediment discharged, about 47 million t/y is deposited in the delta area.
Currents, tide, waves, fluvial sediment flux:
Currents > 1m/s along the distributary channels. Tidally dominated. Tidal ranges between 3.5-5m. Water and sediment discharges by the Fly/Strickland River are quite high, averaging 6000 m3/s and 4 t/s. Sediment transport associated with tidal, fluvial, and marine processes is responsible for the complex erosion and deposition patterns throughout the delta
Natural/anthropogenic drivers: Tides, waves, tectonics Voluminous rainfall and tectonically active mountains provide 20/25% of the total sediment load
Ganges delta, Bangladesh
Dunne et al. 2019
Area (km2 )
92,455
Sediment type and properties: Stiff soil, Soft soil, marshy clay, alluvial silt and clay. More than 70% of sediment load is silt, 10% is sand.
Thickness of Holocene strata: From 15 to 100 m
Subsidence rate: Holocene in the alluvial and deltaic plain give 2-4 mm/y. On the outer shelf, since Middle Pleistocene
Goni et al., 2006
Walsh et al., 2009
Dunne et al. 2019
Allison et al., 2001
Palamenghi et al., 2011
25
averages to 0.4 mm/y. Generally, 0-18 mm/y. Average 6,5 mm/yr. Long term subsidence of 1-12 mm/y in the eastern half of the delta has been documented.
Sedimentation: Suspended sediment load is 1x10⁹ t/y. The mean annual storage rate for the foreset beds is 0.82x10⁸ t/y, equivalent to 13.8% of the total suspended sediment flux per year. Load > 1GT/y (1/3 deposited on the active floodplain). Average rate 3.5mm/y, long term 12,3 mm/y
Currents, tide, waves, fluvial sediment flux: tide dominated, large sediment supply of river system can compensate for both sea level rise and land subsidence (sediment load > 1 GT/y)
Natural/anthropogenic drivers: Local stratigraphy, tectonics, monsoons, precipitations, cyclones, tides, earthquakes, groundwater extraction, landscape modification, coastal and river embankment, gas exploitation.
Higgins,et al., 2014
Area (km2 ) 4,000 Dunne et al. 2019
Sediment type and properties: The upper 9.0 m thick sediment unit with predominant sand-silt content, and low (<1%) organic carbon seems to be the floodplain deposit. The lower unit of predominant silt clay sediment with higher levels of organic carbon. Sedimentary stratigraphy peat, sand, silty clay, silty loam.
Thickness of Holocene strata: 10-50m
Subsidence rate: The presence of about 2.5m thick intertidal swampy/lagoonal material between 9.0 m and 11.5 m depth, suggests post-depositional subsidence at an average rate of less than 1.0 mm/a. Higher rate of subsidence of about 2.0 mm to 4.0 mm/y is estimated for the upper 9.0 m thick floodplain sediment unit which embeds the Early Historic culture remains.
Sedimentation: A maximum annual load of 482.74 Mt was recorded in 1986 and a minimum of 12.09 Mt in 2009 at an average of 106.32Mt during this period. Higher accumulation rates ranging between 71 and 11mm/y, Currents, tide, waves, fluvial sediment flux: Wave dominated delta.
Natural/anthropogenic drivers: Natural coastal erosion and deposition has occurred on millennial to centennial time scales during the Holocene. Considerable decrease of sediment discharge due to dam construction and water diversion
Nageswara Rao et al., 2010
Nageswara Rao et al., 2015
26
Godavari delta, India
Area (km2 )
Han delta, Korea
2,536 Dunne et al. 2019
Sediment type and properties: Muddy heterolytic strata over a sandy heterolytic strata. Cummings et al,. 2015
Currents, tide, waves, fluvial sediment flux: Tie dominated.
Indus delta, Pakistan
Area (km2 )
5,809
Sediment type and properties: High silt and low carbonate contents in surface sediments on the modern Indus shelf. Southeast of the Gulf of Kutch, micas make up less than 5% of the shelf sands.
Subsidence rate: 17 7 mm/y
Sedimentation: During the Holocene between 300 and 1100 Mt/y were delivered by the Indus River to its lower alluvial plain and delta. The annual water and sediment discharges between 1931 and 1954 averaged 107 km3 and 193 Gt, respectively. These discharge rates during the period 1993 to 2003 dropped by an order of magnitude to 10 km3 and 13 Gt, respectively. The sediment budget remains qualitative, as it does not take into account subsidence across the delta, for lack of quantitative data.
Currents, tide, waves, fluvial sediment flux: During the Late Holocene, river avulsions both transient and permanent were normal, and multiple distributary channels fed an actively prograding tideand wave-affected delta. Tidal range 2.7 m, powerful offshore waves. The more natural Indus Delta (pre 1869) is characterized by high river discharge, moderate tides and high wave energy conditions. High wave energy coast that is susceptible to erosion.
Natural/anthropogenic drivers: Flood deposition and avulsions are restricted by engineering works, water and sediment flux to the coastal ocean is greatly reduced, and coastal retreat, tidal-channel development, salinization of irrigated soils, and saltwater intrusion have all occurred.
Irrawaddy delta, Myanmar
et al. 2019
Giosan et al., 2006
Syvitski et al., 2014
Area (km2 )
33,212 Dunne et al. 2019
Sediment type and properties: Martaban sediments silty clays with silt ranging from 25 to 50%. Outer shelf sediments range from sand to sandy and silty clays.
Sedimentation: Most of the estimated 334x106 tons of Irrawaddy sediment is composed of silt and clay. Depositional
Rodolfo, 1975
27
Dunne
rates for these portions of the delta-shelf have been estimated at 2mm/y.
Krishna delta, India
Sediment type and properties: The Holocene marine sediment has three distinct units: the bottom sandy or peaty unit, the middle muddy unit, and the top sandy unit. Sand, silty loam, silty clay.
Thickness of Holocene strata: From 10 to 25m
Sedimentation: Suspended sediment loads, from 1965 to 2015 showed an average annual load of 3.47 Mt. A maximum load was recorded in 1965 and almost zero loads were in the last nine-years period.
Currents, tide, waves, fluvial sediment flux: Wave dominated delta. The area is affected by a micro-tidal regime and moderate wave conditions, on the contrary it is frequently prone to high intensity cyclonic storms with serious economic and social consequences.
Natural/anthropogenic drivers: Coastal erosion and land loss in the Krishna Delta may intensify due to dam construction. These effects exacerbated by land subsidence due to extraction of groundwater and hydrocarbon resources.
Thickness of Holocene strata: Average thickness of 7 m
Subsidence rate: Do not experience subsidence due to compaction of underlying sediments, because the deltas are sand-rich systems that lack organics and thick prodelta mud deposits.
Sedimentation: 144x106 t/y.
Currents, tide, waves, fluvial sediment flux: Wave-dominated system. suspended sediment load in the river: 144 x 106 t/y
Natural/anthropogenic drivers: Weathering factors. Tectonics increase erosion rates and dictate the composition of erosion products Construction of the Barranquilla port has seriously affected the erosion/accretion equilibrium along the delta front.
28
Area (km2 ) 3,500 Dunne et al. 2019
Nageswara Rao et al., 2020.
Limpopo delta, Mozambique Area (km2 ) 3,412 Dunne et al. 2019 Magdalena delta, Colombia Area (km2 ) 4,131 Dunne et al. 2019
Restrepo et al., 2007
Sediment type and properties: Clay, silt and sand
Thickness of Holocene strata: 10-50m
Subsidence rate: long term: 0.2-0.5 m/ky
Sedimentation: Average sediment discharge 8x10⁶ m3/y, average deposition rate 10.9 mm/y.
Currents, tide, waves, fluvial sediment flux: Fluvial dominated
Natural/anthropogenic drivers: Tides, rivers. Mahanadi delta, India
Storms et al., 2004
Sediment type and properties: fine-grained sediments in the marine part (silty clay and clay), fluvial part characterized by sand, peat and silty clay.
Thickness of Holocene strata: Marine part: 18-25 m on top of the older Pleistocene deposits, Fluvial part: max depth 70 m
Subsidence rate: 30-35 mm/y
Sedimentation: 32-63.7 mm/y
Currents, tide, waves, fluvial sediment flux: Wave-tide dominated delta
Natural/anthropogenic drivers: Natural subsidence, sediment compaction, groundwater pumping, infrastructural loading, sand mining, dam construction
Mississippi delta, USA
Hoang et al., 2016
Zoccarato, Minderhoud, Teatini, 2018
Area (km2 )
29,000
Sediment type and properties: Peat, silty loam, silty clay.
Thickness of Holocene strata: 10-100m
Subsidence rate: Leveling surveys measured 16.9 mm/year of subsidence associated with motion along the Michoud Fault between 1969 and 1971, and 7.1 mm/year of subsidence at the same location between 1977 and 1995. Present-day Pleistocene basement subsidence in the MD produced by viscoelastic deformation mechanisms is unlikely to exceed 2mm/y; subsidence due to sediment loading alone is unlikely to exceed 0.5mm/y. Present rate: 5.2 mm/y. Vertical land motion rate 1 mm/yr. Late Holocene rates: 0.15 mm/y.
Sedimentation: Long-term suspended sediment loads in the river average 436,000 t/d
Bridgeman, 2018
Zoccarato et al., 2020
29
Area
5,569 Dunne
Mahakam delta, Borneo
(km2 )
et al. 2019
Area (km2 ) 5,910 Dunne et al. 2019
Area (km2 ) 50,700 Dunne et al. 2019
Mekong delta, Vietnam
Dunne
et al. 2019
Currents, tide, waves, fluvial sediment flux: River dominated. Abundance of inflowing fresh water and sediments.
Natural/anthropogenic drivers: Compaction of top soil, subsidence, hurricanes, tidal erosion, sea level rise, and human activities. The loss has been aggravated by maintenance of navigation channels and construction of canals for mineral exploration. Relative sea level rise glacial isostatic adjustment 10mm/yr.
Niger delta, Nigeria
Area (km2 )
18,681
Dunne et al. 2019
Sediment type and properties: Older sands and younger silts and clays. George et al., 2019
Currents, tide, waves, fluvial sediment flux: Upper delta plain: fluvial. Lower delta plain: tidal and wave dominated.
Nile delta, Egypt
Area (km2 )
27,842
Sediment type and properties: Clays, silts/muds, peat, and sands. Thick sections (up to 50 meters) of compactable Holocene sediments have been considered to be the cause of the high subsidence rates Thin layer of silt above a thick layer of sand. The relative proportions of grain sizes in the overall Holocene sections averaged for all core sites in the northern deltaic study area are as follows: sand, 29.2%; silt, 35.3%; and clay, 35.5%.
Thickness of Holocene strata: Northeastern part consists of thick younger Holocene (< 3500 year) sediments of 31 m thickness, while the northwestern part is composed of thin 16 m layer of older Holocene sediments. The average thickness of Holocene sequences: in sector I, 10.6 m, with a range of thickness from 1.5 m to 49 m; in sector II, it is 15.0 m, with a range of thickness from 3.6 m to 24.5 m; and, in sector III, it is 20.2 m, with a range of thickness from 1.3 m to 47 m.
Subsidence rate: 0,1-15 mm/y. From time series for selected PS pixels from Cairo, Tanta, Mahala, Mansoura, Damietta, and Port Said, the estimated subsidence rates from Envisat scenes are around −6.4 ± 0.4 mm/year, −4.0 ± 0.6 mm/year, −4.8 ± 1.0 mm/year, −10.0 ± 1.2 mm/year, −10.3 ± 1.6 mm/year, and −4.9 ± 1.6 mm/year, respectively.
Sedimentation: Prior to 5200-5950 cal BP, aggradation rates appear to range approximately between 2.4 and 12 mm/y; after this time they are lower, generally between 0.5-1.5 mm/y.
Natural/anthropogenic drivers: The main mechanisms that appear to control the subsidence include neo-tectonic movements,
Dunne et al. 2019
El Bastawesy et al., 2016
Pennington et al., 2017
30
compaction of sedimentation and the extraction of gases and groundwater.
Orinoco delta, Venezuela
Area (km2 ) 26,833 Dunne et al. 2019
Sediment type and properties: Mud, silt and clay
Thickness of Holocene strata: Thickness > 100 m
Subsidence rate: Subsidence rate of Holocene: 0-3,3 mm/y
Sedimentation: 150 x106 t/y
Warne et al., 2001
Currents, tide, waves, fluvial
sediment flux: High fluvial sediment flux
Natural/anthropogenic drivers: River, tides, rainfalls
Parana delta, Argentina
Area (km2 ) 15,263
Subsidence rate: Subsidence that is natural or accelerated by human processes is another contributing factor to the transformation of the delta terrains. It occurs at a rate of 60 mm per year due to porosity losses in the top 10 cm of the surface soil layer of the lower delta.
Pearl delta, China
Area (km2 )
11,500
Sediment type and properties: Holocene were divided into six main sedimentary facies from bottom to top, i.e., fluvial facies, floodplain facies, littoral-swamp facies, estuaryneritic facies, and tidal flat facies. The fluvial facies is composed of medium-fine-grained cross-bedding sands. The bottom is composed of massive sandy gravels containing some breccias and rocks with massive structure as well as poor separation and psephicity. The floodplain facies is composed mainly of gray sandy clay, where horizontal, wavy, lenticular and small crossbedding is developed. Plant debris exists commonly, as well as a small number of iron nodules and siderites, but marine fossils are rarely found. The littoral-swamp facies is composed mainly of gray silty clay and tawny clay silt. The bottom contains many of plant roots and debris. Sharp bioturbation occurs in this facies. The estuary-neritic facies is composed mainly of caesious fine silty sand and silty clay with wavy, horizontal and bimodal cross bedding, where abundant foraminifera and ostracod shells are found. The tidal flat facies is composed mainly of caesious or chocolate silty clay with a few caesious fine muddy sands.
et al. 2019
Hedlund, 2015
Dunne et al. 2019
31
Dunne
Wei X. et al., 2011
Thickness of Holocene strata: 10-60 m
Subsidence rate: The Holocene average uplift rates in the tectonic uplift area, tectonic subsidence area, strong subsidence area and tectonic stable area are 0.5, -0.5, -3.6, and 0 mm/y, respectively. The tectonic uplift rate of marginal regions is 1.03–1.8 mm/y. The subsidence rate of most plain areas is -0.59/- 0.88 mm/y, whereas that of local coastal areas is -3.44/-3.6 mm/y
Sedimentation: Annual average suspended sediment discharge of 88.72 Mt and an average suspended sediment concentration of 0.284 kg/m3. The suspended sediments consist primarily of silt and clay.
Currents, tide, waves, fluvial
sediment flux: Small tidal range and significant spatial differences. The wave intensity is relatively weak in the estuary, with a high frequency of wind waves.
Natural/anthropogenic drivers: Urbanization. Groundwater extraction.
Po delta, Italy
Area (km2 ) 948
Sediment type and properties: Alternating of sand and clay layers, almost normally consolidated and normally pressurized
Thickness of Holocene strata: 30-40m
Subsidence rate: Average value of 5 mm/y Ranges from 1 to 15 mm/y. Between 1950-1957: 300 mm/y. Average 2.5 mm/y over the last 1.3 Myr.
Sedimentation: Sedimentary loading 0.4-0.5 mm/y
Currents, tide, waves, fluvial sediment flux: Active weather and marine regimes, wave dominated beach system
Natural/anthropogenic drivers: Consolidation of late Holocene sediments, downward flexure and northward motion of the Adriatic plate, elevation of Adriatic sea, methane extraction, river diversions, artificial channels and dams, land reclamation. River dominated.
Rhone delta, France
Dunne et al. 2019
Correggiari et al., 1996
Gambolati et al., 1998
Amorosi et al., 1999
Correggiari et al., 2005
Teatini et al., 2011
Area (km2 )
1,683
Sediment type and properties: Massive sand, sandy silt, fine sand.
Natural/anthropogenic drivers: Wave dominated. The eastern margin of the delta is characterized by an important influx of groundwater.
Sao Francisco delta, Brazil
Tigris delta, Iran
Dunne et al. 2019
Vella et al., 2005
32
Area (km2 ) 1,311 Dunne et al. 2019
4,734 Dunne
Area (km2 )
et al. 2019
Sediment type and properties: The surface sedimentary succession of the Ahwar, in the studied stations, consists of an upper organic-rich sandy silt with some shells (0-7 cm depth), an intermediate shelly silt dominated by macro-molluscs and their shell fragments (7-45 cm depth) and a basal brackish/marine grey silty clay or clay (usually found at depths of 35 cm or more).
Subsidence rate: Rates between 1-1.8 mm/y were dominant throughout the Holocene from 8400 years BP until about 3000 years BP. During the later stage of the Holocene, rates of 0.4 mm/y were not exceeded.
1995
Sediment type and properties: Silt 60-70%, clay 30-40%, sand below 3%. The sediments in the delta front are dominated by fine sand and silt, with small-scale ripple cross-bedding and other sedimentary structures, while in the pro-delta area the sediments are mainly poorly sorted silty clay.
Thickness of Holocene strata: 70-80 m
Subsidence rate: 1 mm/year. From 1995 to 2005, groundwater extraction caused subsidence rates of more than 150 mm/y in Suzhou. Precise geodetic leveling between Sheshan Hill and other hills adjacent to Shanghai show that vertical differential movement was only 2.0 to 3.0 mm from 1956 to 1973, with a rate of about 0.12 to 0.18 mm/y.
Sedimentation: The Yangtze River annually transports a runoff discharge of 29,000 m3/s and carries about 4.7 x 10⁸ tons of sediments to the sea. The annual mean water discharge to the sea varies from 43,100 m3/s in 1954 to 21,400 m3/s in 1978. Meanwhile, most of water discharge is concentrated in the summer months. Sedimentation rate on the subaqueous delta varies from 5.4 cm/year to 0.5 cm/y
Currents, tide, waves, fluvial
sediment flux: High sediment load from river, 1x10⁹ t/y; influenced by tide. Turbid zone: seawards. The sediment concentration varies from 0.1 kg/ m3 to 0.7 kg/ m3 in the surface layer, and from 1.0 kg/ m3 to 8.0 kg/ m3 in the bottom. Delta often impacted by flood.
Natural/anthropogenic drivers: Progradation due to human activities (rice cultivation, deforestation). According to 1990 statistics, there are more than 2800 wells around the major cities of
33
Aqrawi,
Area (km2 ) 1,026 Dunne et al. 2019 Vistula
Area (km2 ) 2,638 Dunne et al. 2019
Area (km2 ) 36,776 Dunne et al. 2019
Tone
delta, Japan
delta, Poland
Yangtze
delta, China
Xiqing, 1998
Area (km2 )
Suzhou, Wuxi and Changzhou, extracting deep groundwater and resulting in a drop in the underground water table, ranging from 2 to 3 m/y.
Yellow delta, China
6,391 Dunne et al. 2019
Thickness of Holocene strata: 20-30 m
Subsidence rate: Vertical subsidence rate 432 mm/y.
Sedimentation: Sediment load from river, 1x10⁹ /y High sediment concentration 20 g/l.
Sediment type and properties: Silt, high permeability coefficient, little clay. Jia et al., 2020

Currents, tide, waves, fluvial
sediment flux: Wave dominated
Natural/anthropogenic drivers: Over extraction of underground brine for salt production, oil and gas extraction, overexploitation of underground resources.
4.2. Lithological characterization
Decompaction of sedimentary columns requires a detailed knowledge of the lithostratigraphic distribution and subsurface geotechnical properties. Unfortunately, this kind of information, especially the latter, are not available for all the Holocene sedimentary lithologies in deltas.
34
Figure 5: Texture triangle used to describe the main lithology of the studied deltas.
Common classes are identified to overcome this lack of knowledge. All the Holocene sedimentary layers identified during the phase of data collection and examination for the various deltas are analyzed in their components and associated with one of the six main sedimentary categories listed in Table 4. The subdivision is carried out according to the main features of the layer deposits, such as type of sediments and grain-size distribution (Figure 5). This is done to group and homogenize all the sediments with similar features into a same sedimentary texture category. For each of the main soil type, the value of the geomechanical parameters are obtained from the oedometric tests performed on samples taken from the Myrtle Grove Superstation core drilled in the Mississippi delta (Bridgeman, 2018). These are the values used to develop a shallow compaction model for the simulation of the natural land subsidence for the Holocene portion of the Mississippi delta by Zoccarato et al. (2020). Table 4 summarizes the values �0 (initial void ratio) and �� (compression index) for each soil type used in the simulations that follow. The values of �0 refer to the soil condition at the land surface, when sediments deposited on the plain platform and the vertical effective stress �� is almost null, γgrain refers to the specific weight of the soil grains.
35
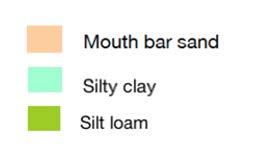
Soli type e0 Cc γ grain [KN/m3] Peat 12.7 4.72 12.6 Mouth bar sand 1.01 0.033 27.6 Silt loam 1.06 0.23 22.9 Silty clay 1.8 0.565 19.5 Organic clay 2.5 0.3 22.9
Table 4: Geomechanical parameters of the materials which characterized the Holocene sequences for the studied deltas. The values are derived from Bridgeman (2018).
5. Selected deltas
Among the 33 deltas described above, the decompaction of Holocene layers and weight quantification have been carried out for eight of them, specifically Chao Phraya, Danube, Godavari, Krishna, Mekong, Mississippi, Pearl, Po. These cases have been selected because of availability of accurate lithostratigraphic profiles and information on the Holocene bottom.
Areal extensions are taken from the supplementary materials after Dunne et al., 2019. In order to built-up the best possible representation of the delta plains, they are divided among subareas, referred to as “environments”. To best represent the feature of each environment, a core providing the Holocene sedimentary stratigraphy is assigned.
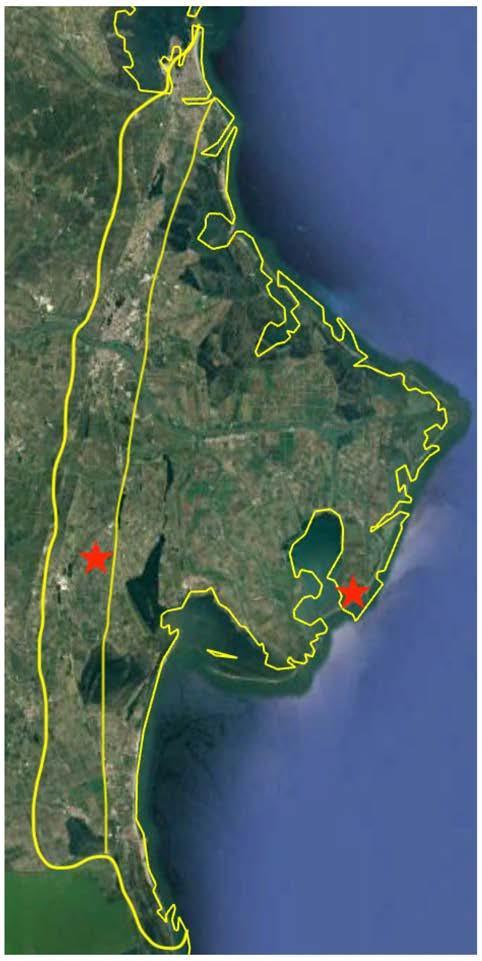
Figure 6: Aerial view of Chao Phraya delta, Thailand. The yellow lines provide the boundary of the Holocene delta and the subdivision in different environments according to available information and lithostratigraphic boreholes. The red dots represent the location of the cores used to characterize the sedimentary stratigraphy of Holocene.

36
5.1. Chao Phraya
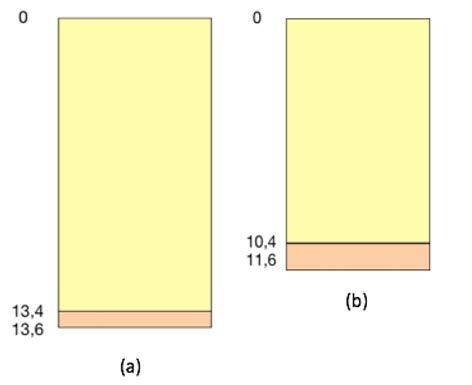
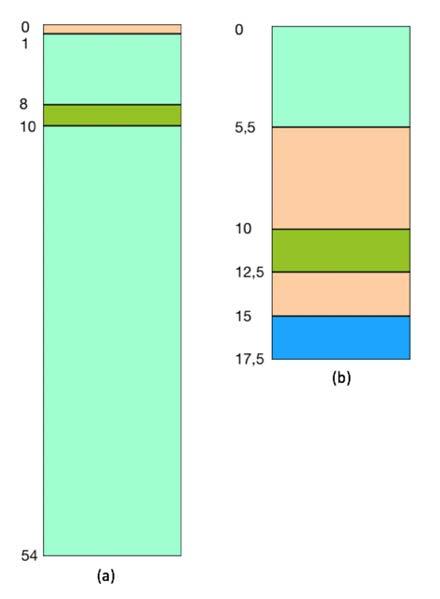
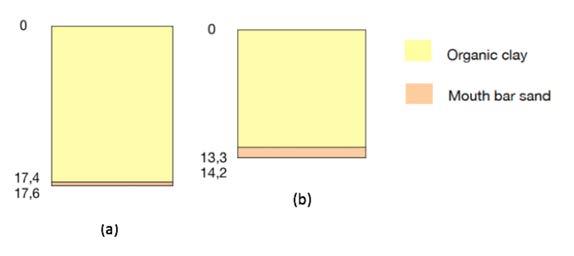
The Chao Phraya delta is located in Thailand, has an area of 23,000 km2 (Figure 6) and is the third largest delta plain in Southeast Asia, after the Mekong and Irrawaddy plains It is one of the most populous delta, with a population of 18.6 million of people in 2015 (CESIN 2015). It was formed over the last 8-7 kyr mainly by the deltaic process of two major rivers, the Chao Phraya and the Mae Klong. Deltaic sediment volume for the last 7.5 ± 0.5 kyr shows that the average rate of sedimentation was ranging around 25 million t/y, which is nearly the same as the present total sediment discharge from both rivers. Between 1978 and 1988, groundwater pumping in parts of the Chao Phraya Delta to supply the city of Bangkok, Thailand, caused land subsidence due to accelerated compaction �� between 50 to 150 mm/y It is defined as a mud-dominated delta (deltaic sediments are fine grained and mangroves and tidal flats fringe the deltaic coast) and classified as a microtidal low-energy coast, where the mean tidal range goes from 1.2 m to 2.8 m. (Saito et al., 2002). The boundary between Pleistocene and Holocene sediments is defined by Bangkok Clay and it consists of a layer of Late Pleistocene Bangkok Stiff Clay followed by a layer of Holocene Bangkok Soft Clay, deposited as a result of delta progradation. The Holocene sediments are divided into lower transgressive peaty sediments and upper regressive deltaic sediments, their thickness ranges between 10-20 m in the central part of the delta and they thin toward the margins. The area is divided between inner and coastal environment, the first area is found in the northern and inner part of the delta plain while the latter is identified in the southern part near the coast. Inner environment is mainly composed by a layer of organic clay and silty clay, overlying a layer of bauxite granules and pebbles in a medium-sand matrix. Coastal environment is quite similar to the inner one and is characterized by a very small layer of sand on top followed by a thick layer of dark gray clay and silty clay, with abundance of mollusk shells, crab shells and plant fragments (Saito et al. 2002). Figure 7 shows the two simplified sedimentary columns for the (a) coastal and (b) inner environment.
37
The Danube delta is located in Romania and has an area of about 4,000 km2 (Figure 8). It is situated in an area affected by subsidence and important sediment accumulation, being formed as a major coastal accumulation feature under the combined deposition of sediment discharged by the Danube river, generally 25-35



38
5.2. Danube
Figure 8: Aerial view of Danube delta, Romania. The yellow lines provide the boundary of the Holocene delta and the subdivision in different environments according to available information and lithostratigraphic boreholes. The red dots represent the location of the cores used to characterize the sedimentary stratigraphy of Holocene.
Figure 7: Simplified sedimentary columns representative of (a) coastal and (b) inner environment in Chao Phraya delta. (Saito et al., 2002).
Mt/y. The Danube delta coast is characterized by tideless and medium-wave energy conditions. The mean relative sea-level rise registered during the last 150 years on the Danube delta coast is 2.56 mm/y, a mix of sea-level rise due to climate change and natural subsidence (Vespremeanu-Stroe et al. 2017). The area is divided among fluvial and marine environment: the first is located in the western part and the latter in the eastern part of the deltaic region. The fluvial delta morphologically is represented by fluvial levees, channels and lakes. The maritime delta is composed by open coast lobes, mostly affected by subsidence where lagoons developed. Holocene thickness ranges from 4 m in the fluvial part to 9 m in the maritime one. The representative sedimentary stratigraphy for the fluvial delta provides a sandy layer on the bottom, followed by clay, silty/clay and another layer of sand on top. The marine stratigraphy is characterized by a bottom layer of clay, then there is an alternation between a layer of silty/clay and sand and again silty/clay and sand on top (Figure 9).


39
Figure 9: Simplified sedimentary columns representative of (a) marine and (b) fluvial environment in Danube delta. (Vespremeanu-Stroe et al., 2017).
5.3. Godavari
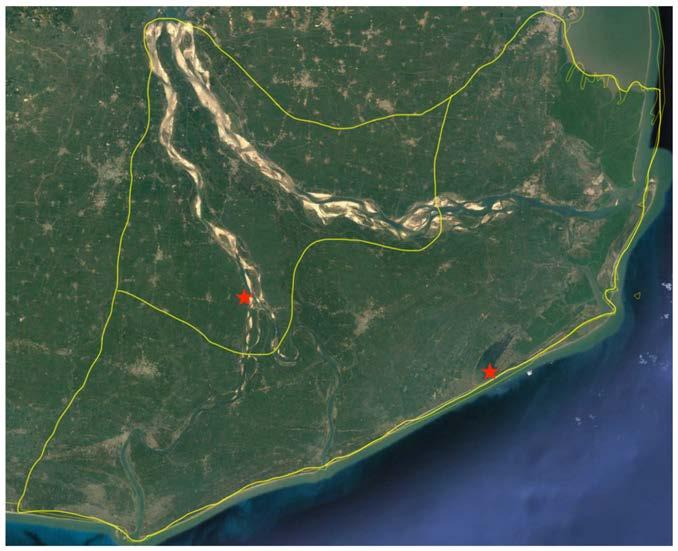
The Godavari delta is located along the east coast of India. It is one of the world largest wave-dominated delta with an area of 4,000 km2 (Figure 10). Its surface area is densely populated, with 2.59 million of inhabitants in 2015 (CESIN 2015). Values of annual sedimentary load go from a maximum of 482.74 Mt, recorded in 1986 and a minimum of 12.09 Mt, in 2009 with an average of 106.32 Mt. Accumulation rates in the deltaic zone ranges between 71 and 11 mm/y. Rates of compaction are less than 1.0 mm/y for sediments between 9.0 and 11.5 depth, while it increases till 4 mm/y in the upper 9.0 m thick floodplain sediment unit (Nageswara Rao, 2010). The main river mouths of the Godavari currently associated with deposition are the eastern and western parts of the delta, while erosion is dominant in the central part. A study conducted by Nageswara Rao et al. (2015) has shown that natural coastal erosion and deposition occurred on millennial to centennial time scales during the Holocene. However, a considerable decrease of sediment discharge due to dam construction and water diversion has increased coastal erosion during the past four decades, pushing the
40
Figure 10: Aerial view of Godavari delta, India. The yellow lines provide the boundary of the Holocene delta and the subdivision in different environments according to available information and lithostratigraphic boreholes. The red dots represent the location of the cores used to characterize the sedimentary stratigraphy of Holocene.
delta into a persistent destruction phase. The entire Godavari delta plain is divided into two major units: the upper fluvial plain and the lower beach-ridge plain, with the innermost beach ridge marking the boundary between the two. The upper fluvial plain is crossed by the two main distributaries, i.e. Gautami and Vasishta, and is sloping towards the coast, characterized by landforms such as abandoned river courses and natural levees. The lower beach-ridge plain is marked by beach ridges, mudflats, mangrove swamps, lagoons, spits, barrier islands, and tidal channels (Nageswara Rao, 2015). The Holocene sedimentary stratigraphy of the fluvial area is composed by a basal layer of muddy peats in the lower succession and cross-bedded coarse sand to mottled dark greyish brown silty clay in the upper succession. The marine area is characterized by a very dark gray marine muddy sediments, except for the uppermost layer which is made of sandy sediments (Figure 11). Holocene marine sequence thickens from 10 m to more than 40 m with a gentle slope.


41
Figure 11: Simplified sdimentary columns representative of (a) marine and (b) fluvial environment in Godavari delta. (Nageswara Rao, 2015)
5.4. Krishna
The Krishna delta is located in the Indian east coast, with a surface area of 3,500 km2 crossed by the Krishna river (Figure 12) Suspended sediment loads, from 1965 to 2015 showed an average annual load of 3.47 Mt. A maximum load of 18.26 million tons was recorded in 1965 and almost zero loads were estimated over the last nine-years. About 4 million people live in the area, making the Krishna delta one of the most densely populated delta in the world (Ericson et al. 2006). The area is affected by a micro-tidal regime and moderate wave conditions, and it is frequently prone to high intensity cyclonic storms with serious economic and social consequences. The cores contain mostly marine sedimentary Holocene deposits overlying Pleistocene basement. Holocene marine sediment contains three different units: the bottom sandy or peaty unit, the middle muddy unit characterized by silt loam sediments and the top sandy unit (Figure 13). The delta progradation during 6.0-4.5 cal ky BP added an area 343 km2 to the delta plain, at slow rate of 0.23 km2 /y. Subsequently, progradation increased till

42
Figure 12: Aerial view of Krishna delta, India. The yellow lines provide the boundary of the Holocene delta. The red dot represents the location of the core used to characterize the sedimentary stratigraphy of Holocene.
0.88 km2 /y from 4.5-3.0 cal ky BP, then decreases in the subsequent stages at 0.41 km2 /y from 3.0-2.0 cal ky BP, 0.63 km2 /y from 2.0-0.5 cal ky BP. In the last 0.5 cal ky progradation increased till 1.15 km2 /y. From these data it is possible to state that the Krishna delta develops more over the last 500 years than during the Holocene. In fact, 40.5 km2 of land was added to the delta front coast during 1930–1965, at an average rate of 1.15 km2 /y. However, a significant loss of land occurred between 1965 and 2015, at a consistently increasing rate, from 0.59 km2 /y during 1965–1990 to 0.80 km2 /y during 1990–2015, due to upstream dams which impounded almost the entire sediment load and intensified coastal erosion and land loss (Nageswara Rao et al., 2015). These effects are increased by land subsidence due to extraction of groundwater and hydrocarbon resources.


43
Figure 13: Sedimentary columns representative of marine environment in Krishna delta. (Nageswara Rao et al., 2015)
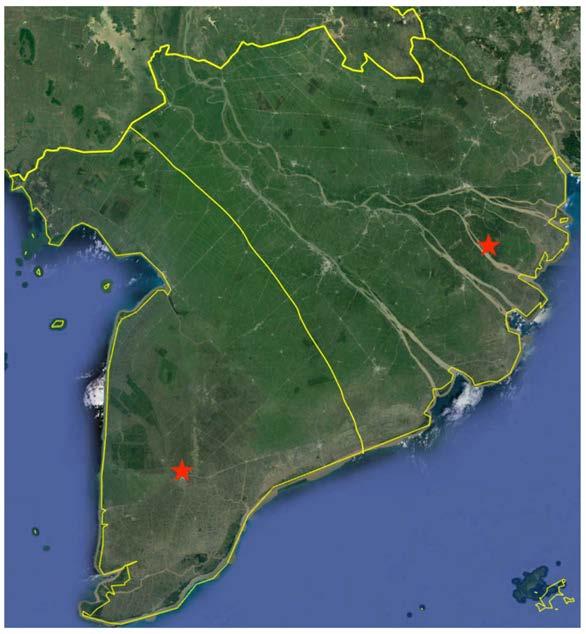
The Mekong delta is located in Vietnam and it has an area of 50,700 km2 (Figure 14). It is one of the largest delta in Southeast Asia, with a high sediment yield caused by monsoonal precipitation that lead to the development of huge delta plain in the past 67 ka. In fact, it was estimated that the amount of sediment deposited annually is about 1 billion m3 (Giao et al., 2014). The deltaic plain is divided among marine and fluvial part, the first one is located in the south area while the latter in the northern part. The sediments are mainly finegrained deposits of marine origin, which were subjected to high compaction rates. Since 1,000 years ago, sea level started to rise with a rate of 12mm/y. Holocene sedimentary succession is characterized by organic clay and silty clay in the marine area, while the fluvial part there are sand, silty clay and peat (Figure 15). Holocene thickness is mainly constant and ranges between 18-25 m in the marine delta plain, on the contrary the fluvial part goes from a minimum of 10 m to a maximum
44
5.5. Mekong
Figure 14: Aerial view of Mekong delta, Vietnam. The yellow lines provide the boundary of the Holocene delta and the subdivision in different environments according to available information and lithostratigraphic boreholes. The red dots represent the location of the cores used to characterize the sedimentary stratigraphy of Holocene.
of 50 m. Natural compaction of these layers, together with sea level rise and human exploitation of soil represents a serious issue for the deltaic plain. In fact, selfcompaction of the soft Holocene strata and groundwater pumping for irrigation contribute mostly to the land subsidence and land loss. Nowadays, in fact, some areas are sinking at a rate of 1 to 4.7 cm/y, with an average value of 1.6 cm/y (Hoang et al., 2016). A sea-level-rise scenario analysis, performed by Giao et al. (2014), estimated that an area of 128 km2 of Ca Mau and 5,133 km2 of Mekong delta will be submerged by 2100.


45
Figure 15: Simplified sedimentary columns representative of (a) marine and (b) fluvial environment in Mekong delta (Hoang et al., 2016).
5.6. Mississippi
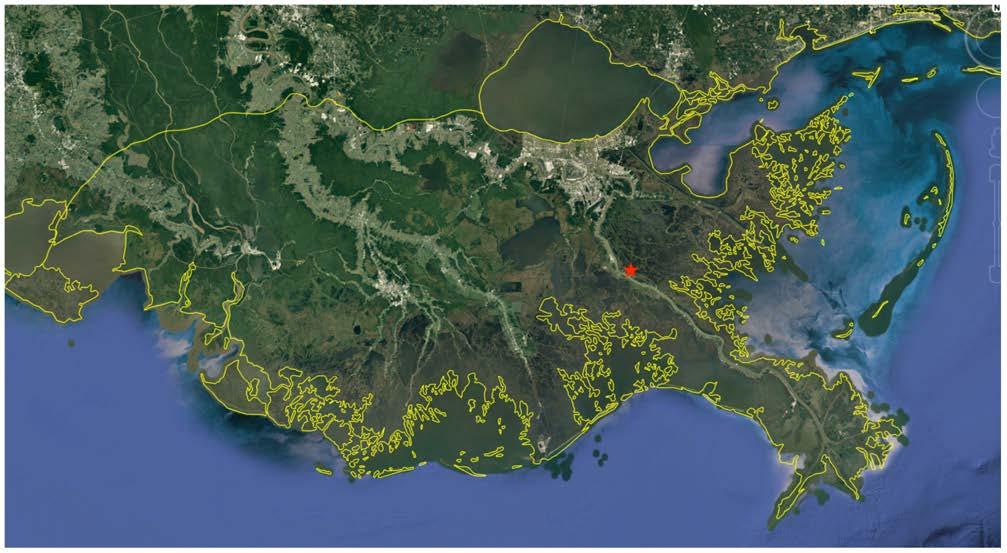
The Mississippi delta is located in the USA in the Gulf of Mexico. Its area extends for 29,000 km2 (Figure 16) and it is characterized by a river dominated environment, particularly vulnerable to catastrophic events such as hurricanes and storms. The area is densely populated with a 2 million of inhabitants registered in 2015 (CIESIN 2015) with an extensive economic activity. This induced environmental degradation such as wetland loss from human influences (Day et al., 2007). As a matter of fact, the elimination of a big portion of fluvial sediment input to the delta from upstream reservoir construction, flood control levees and hydrocarbon extraction have contributed to a relative sea level rise of 10 mm/y (Day et al., 2000). Nevertheless, compaction of top soil still represents one of the major factors contributing to relative sea level rise. Deltaic sediment loading is primarily responsible for present-day
Pleistocene basement subsidence in the Mississippi delta, produced by viscoelastic deformation mechanisms, which is exceeding 2mm/y; subsidence due to sediment loading alone is unlikely to exceed 0.5mm/y (Wolstonecroft et al., 2014).
46
Figure 16: Aerial view of Mississippi delta, USA. The yellow lines provide the boundary of the Holocene delta. The red dot represents the location of the core used to characterize the sedimentary stratigraphy of Holocene.
Holocene sedimentary stratigraphy is characterized by a layer of silty clay over which there are a layer of silt loam and one of peat with a maximum thickness of 35 m (Bridgeman, 2018) (Figure 17).


47
Figure 17: Simplified sedimentary columns representative of fluvial environment in Mississippi delta. (Bridgeman, 2018)
5.7. Pearl
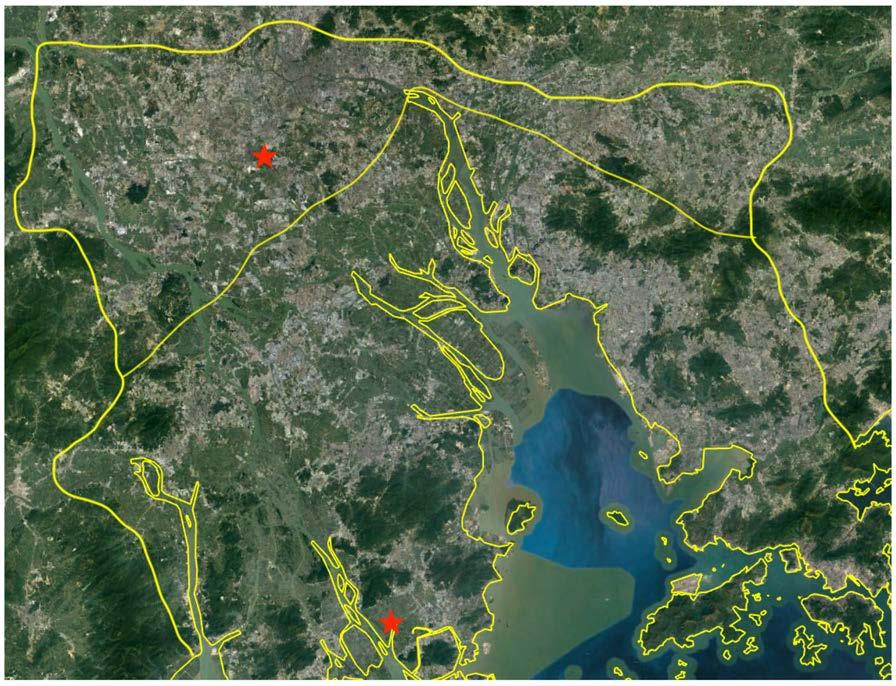
The Pearl delta is located in China, in the central coast of Guangdong province. It has an area of 11,600 km2 (Figure 18) and it is the second largest estuarine delta in China, after the Yangtze river delta. It receives water and sediments from many main rivers, which form a river network in the delta plain with a total length of about 1,600 km2 with annual average suspended sediment discharge of 88.72 Mt and an average suspended sediment concentration of 0.284 kg/m3. The suspended sediments consist primarily of silt and clay. The area is characterized by a small tidal range of 0.86-1.63 m, the average wave height is 1.2 m, with weak wave intensity and high frequency of wind waves. The delta plain is restricted by tectonic patterns, which allowed it to develop only in the basin area. Tectonic uplift rate of marginal area in the delta plain is 1.0-1.8 mm/y, subsidence rate of inner plain is 0.6-0.9 mm/y, whereas in coastal areas is 3.4 -3.6 mm/y (Wei X. et al., 2011). Holocene average uplift rates in the
48
Figure 18: Aerial view of Pearl delta, China. The yellow lines provide the boundary of the Holocene delta and the subdivision in different environments according to available information and lithostratigraphic boreholes. The red dots represent the location of the cores used to characterize the sedimentary stratigraphy of Holocene.
tectonic uplift area is 0.5 mm/y, tectonic subsidence goes from 0.5 to 3.6 mm/y. The delta plain is divided among an inner environment, in the northern part of the delta and a coastal environment, in the southern part. The first zone is characterized by an average Holocene thickness of 10 m and a sedimentary layer profile composed, from bottom to top, by clay, silty loam and peat. The latter, thicker and more various, ranges between 5 m to 62 m. Its stratigraphic profile is defined by a basal layer of sand, followed by a layer of silt loam, a layer of sand and then silty clay on top (Figure 19).


49
Figure 19: Simplified sedimentary columns representative of (a) coastal and (b) inner environment in Pearl delta (Wei X. et al., 2011).
The Po fluvial system is one of the largest in the Mediterranean watershed, its delta is located in the northern-east part of Italy and its plain develops for 948 km2 (Figure 20). The Po delta system is part of a broad coastal plain that is below mean sea level over ca. 1550 km2 and which is poorly supplied with sediments. The present day delta can be considered as an example of wave-dominated system that is evolving towards a more cuspate morphology. (Correggiari et al., 2005). Structural and seismic-
50 5.8. Po
Figure 20: Aerial view of Po delta, Italy. The yellow lines provide the boundary of the Holocene delta and the subdivision in different environments according to available information and lithostratigraphic boreholes. The red dots represent the location of the cores used to characterize the sedimentary stratigraphy of Holocene.
stratigraphic studies indicate that the coastal-plain area surrounding the modern Po delta has been affected by high rates of subsidence and sediment compaction during the Plio-Quaternary. The natural land subsidence is on the order of 1.1 mm/y in the Po delta (Gambolati et al., 98). This rate was increased by anthropogenic subsidence, caused by groundwater and gas extraction, which reached as much as 10 cm/y over short time intervals. Moreover, the delta plain faced also with decreasing sediment load during the last decades, caused by intensive sand excavation within the Po river. As result, sedimentary loading ranges between 0.4-0.5 mm/y and most of the surface is below mean sea level. During the Last Glacial Maximum (ca.20 kyr BP), the Po river and tributaries reached the central Adriatic basin, where an extensive alluvial plain covered the north Adriatic area where the late Holocene Po delta is now located (Correggiari et al., 2005). The late Holocene Po delta formed after the present sea-level highstand was attained and represents a major component of the mud accumulated in the Adriatic coast and stretches for 600 km along the Adriatic coast of Italy (Correggiari et al., 1996). The Po delta is an extensive mud wedge divided among two types of environment, the first one corresponds with the coastal area, while the latter is located more inland. The Po delta includes a variety of depositional elements, each characterized by a distinctive geomorphological expression reflecting local variations in the balance between oceanographic processes, such as intensity and direction of waves and currents relative to coast orientation and sediment supply. The Holocene thickness is more or less constant in the whole plain, with values ranging between 30 m in the inner part of the delta and 35 m near the coast. The sedimentary stratigraphy is composed by prodelta marine muds in the marine environment, while proceeding through the inner part of the delta there is an alternation between sand and clay layers, almost normally consolidated and normally pressurized (Figure 21).
51


52
Figure 21: Simplified sedimentary columns representative of (a) coastal and (b) inner environment in Po delta. (Correggiari et al., 2005, Amorosi et al., 1999)
6. Results
The present chapter provides the outcomes of the proposed procedure for the 8 selected deltas. The results are represented in terms of:
• decompacted thickness of the representative column;
• interpolated maps of the actual ( ������� ) and decompacted (������������ ) thickness of the whole delta;
• maps of the absolute and percentage compaction;
• map of the delta weight per unit area.
The compaction expressed as percentage of the decompacted thickness has been computed as in Eq.12:
The results are reported separately for each of the 8 studied deltas.
6.1. Chao Phraya
The representative columns for the Chao Phraya delta are decompacted back to their “original” thickness by using the Decompaction Model (Figure 22).
53
����.%= ������������ −������� ������������
(12)
Figure 22: Decompacted sedimentary columns representative of (a) the coastal and (b) inner environment in Chao Phraya delta.
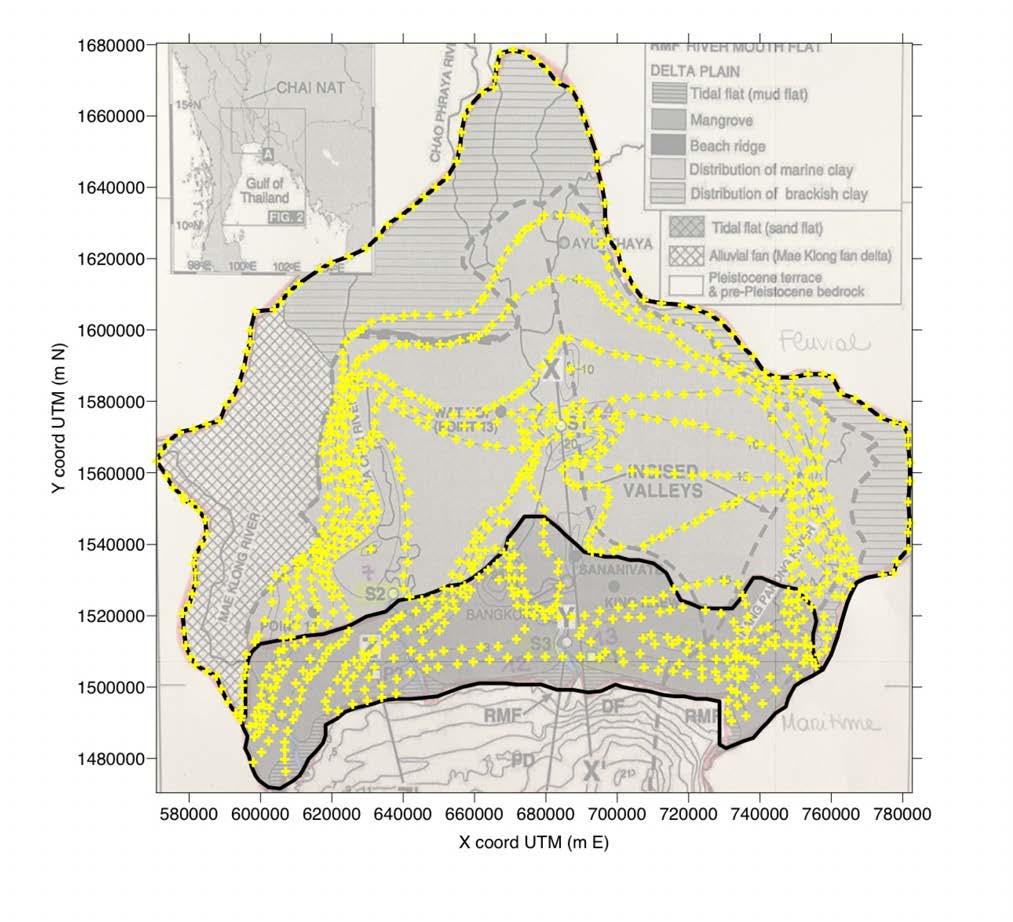
A map of the actual Holocene thickness is carried out by interpolation starting from the dataset after Saito et al., (2002). The data are sufficient from both the qualitative and quantitative point of view and therefore no other information has been added to improve the interpolation outcome (Figure 23).
54
Figure 23: Base map after Saito et al. (2002) properly georeferenced in UTM coordinates, fuse 47N. The yellow crosses represent the digitized points used to generate the map of the Holocene thickness.
The actual thickness of Holocene obtained by kriging is provided in Figure 24. In agreement with Saito at al. (2002), the deepest points are located in proximity of the coast and the thinnest along the inner part of the delta plain.

55
Figure 24: Chao Phraya delta: contour map the actual Holocene thickness (in m) obtained from the interpolation of the spatial information summarized in Figure 23.
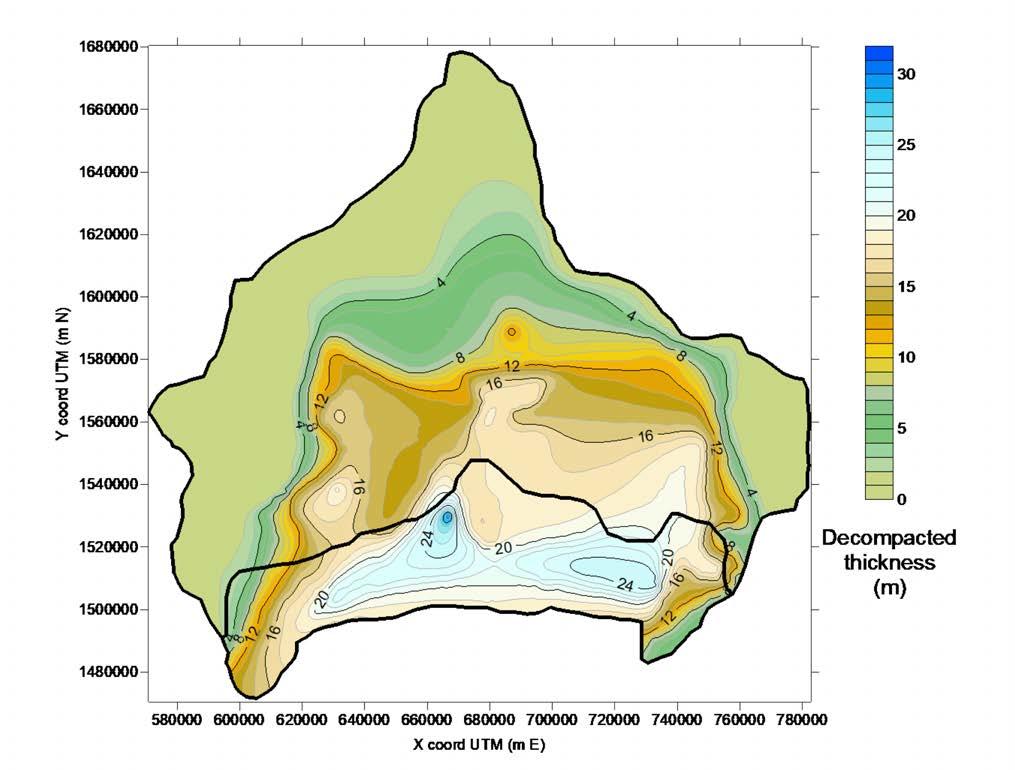
The map of decompacted Holocene thickness is then obtained by the procedure described in the methodological section, i.e., by integrating the 1-D decompacted columns and the 2-D map of the actual thickness (Figure 25). It is possible to distinguish a certain discontinuity along the boundary between the two identified environments. This occurs because of the different representative columns (Figure 22) selected for the two environments. Nevertheless, the trend in the decompacted Holocene thickness is not very different because the two cores are quite similar in terms of soil type distribution.
56
Figure 25: Chao Phraya delta: contour map of the decompacted Holocene thickness (in m) obtained through the proposed methodology.
Figure 26 shows the map of the compaction of Holocene deposits computed as difference between the decompacted (Figure 25) and actual (Figure 24) thickness. As expected, the thickest zones, i.e. the coastal and central portions, are those with the largest natural compaction, where the difference between decompacted and compacted sediments reaches 4.8 m. The compaction reduces in the inner part of the delta plain because Holocene is thinner. The discontinuity along the boundary between the two environments is quite small because the two reference cores are similar in terms of soil types.

57
Figure 26: Chao Phraya delta: contour map of compaction (m) of the Holocene deposits.
Figure 27
Consistently with Figure 26, the highest values of percentage variation are computed in the coastal and central area, while decrease to zero at the inner boundaries.

58
Figure 27: Chao Phraya delta: contour map of the compaction in percentage with respect to the actual thickness.
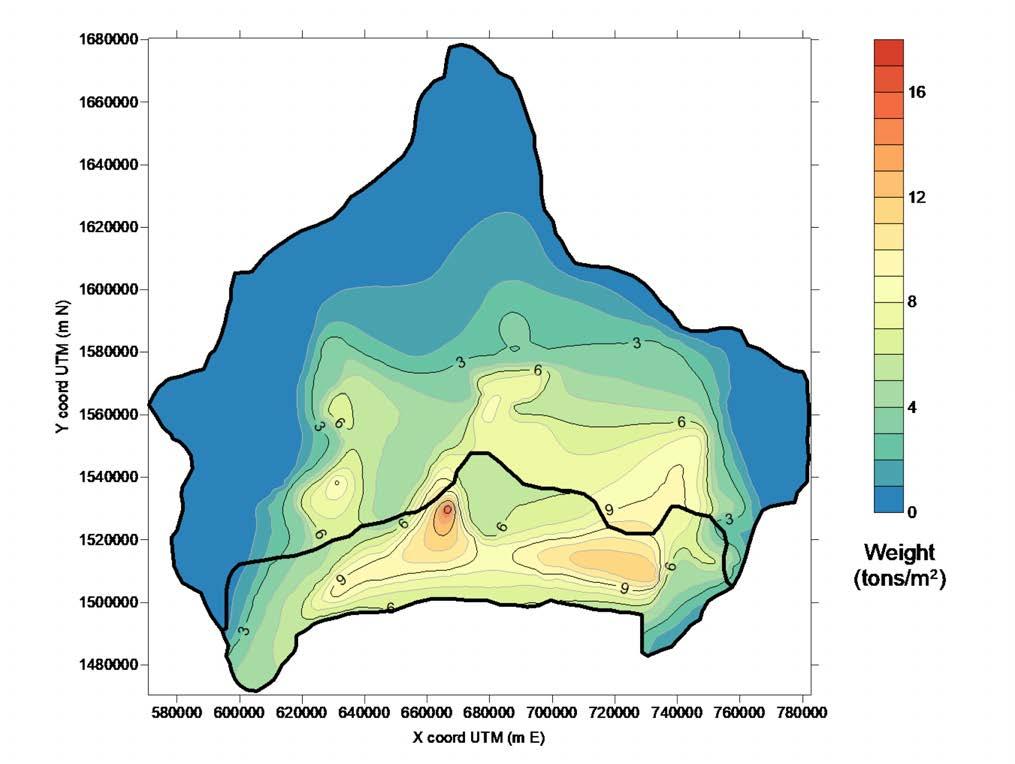
The final result is the delta weight per unit area, expressed in tons/m2 (Figure 28).
Integration of this latter over the delta extent (Eq.11) allows to compute the entire weight of the Holocene portion of the delta and its distribution on the Pleistocene top. In the case of the Chao Phraya delta, for an area of 23,000 km2 the weight of its Holocene portion calculated with the Weight Model procedure is 0.85×10⁵ Mtons.
59
Figure 28: Chao Phraya delta: contour map of the weight per unit area (tons/m2) derived from the proposed procedure.
6.2. Danube
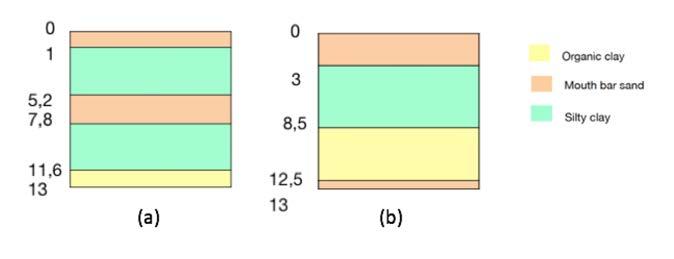
The representative columns for the Danube delta are decompacted back to their “original” thickness by using the Decompaction Model (Figure 29).
A map of the actual Holocene thickness is carried out by interpolation starting from the dataset after Vespremeanu-Stroe et al. (2017). Since the data are relatively few other reasonable information, e.g., a null value along the boundary of the deltaic plain, have been added to improve the interpolation outcome (Figure 30).
60
Figure 29: Decompacted sedimentary columns representative of (a) marine and (b) fluvial environment in Danube delta.
UTM coordinates,
The yellow crosses represent the location of the cores with information on the Holocene thickness. The red crosses are the points reasonably added to better recreate the Holocene actual thickness. Points on the coastal border are taken of the same depth of the cores in that area. Points on the inner border are assumed to be characterized by null Holocene thickness, since the Holocene is supposed to vanish at the boundaries between the delta plain and the surrounding environments.

61
Figure 30: Base map after Vespremeanu-Stroe et al. (2017) properly georeferenced in
fuse 35N.
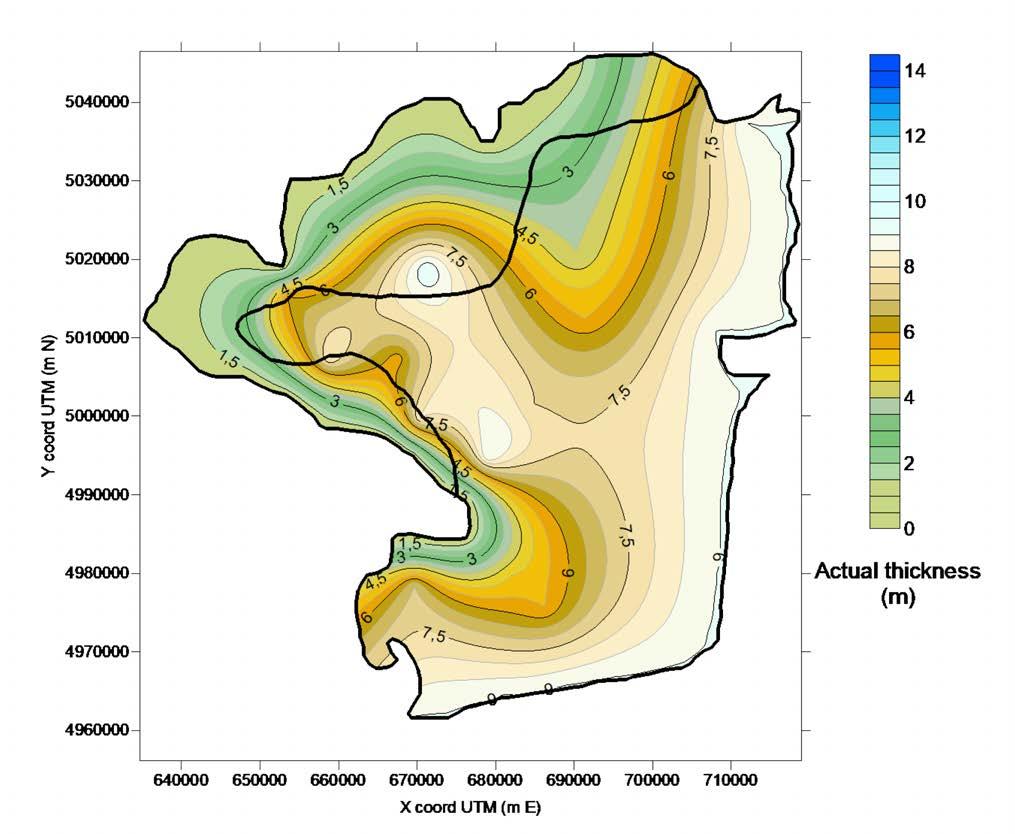
The actual thickness of Holocene obtained by kriging is provided in Figure 31. As we can see from the map, the actual Holocene thickness is consistent with preliminary literature research reported in chapter 5. The thickest points are located in proximity of the coast and also in the central part of the delta where a paleochannel was detected. The thickness vanishes along the inner boundary.
62
Figure 31: Danube delta: contour map of the actual Holocene thickness (in m) obtained from the interpolation of the spatial information summarized in Figure 30.
The map of decompacted Holocene thickness (Figure 32) is then obtained by the proposed methodology. It is possible to distinguish a discontinuity in the map of decompacted thickness along the boundary between the two identified environments. This occurs because of the different representative columns (Figure 29) selected for the two environments. Nevertheless, the trend in the decompacted Holocene thickness is not very different because the two cores are quite similar in terms of soil types.

63
Figure 32: Danube delta: contour map of decompacted Holocene thickness (in m) obtained through the proposed methodology.
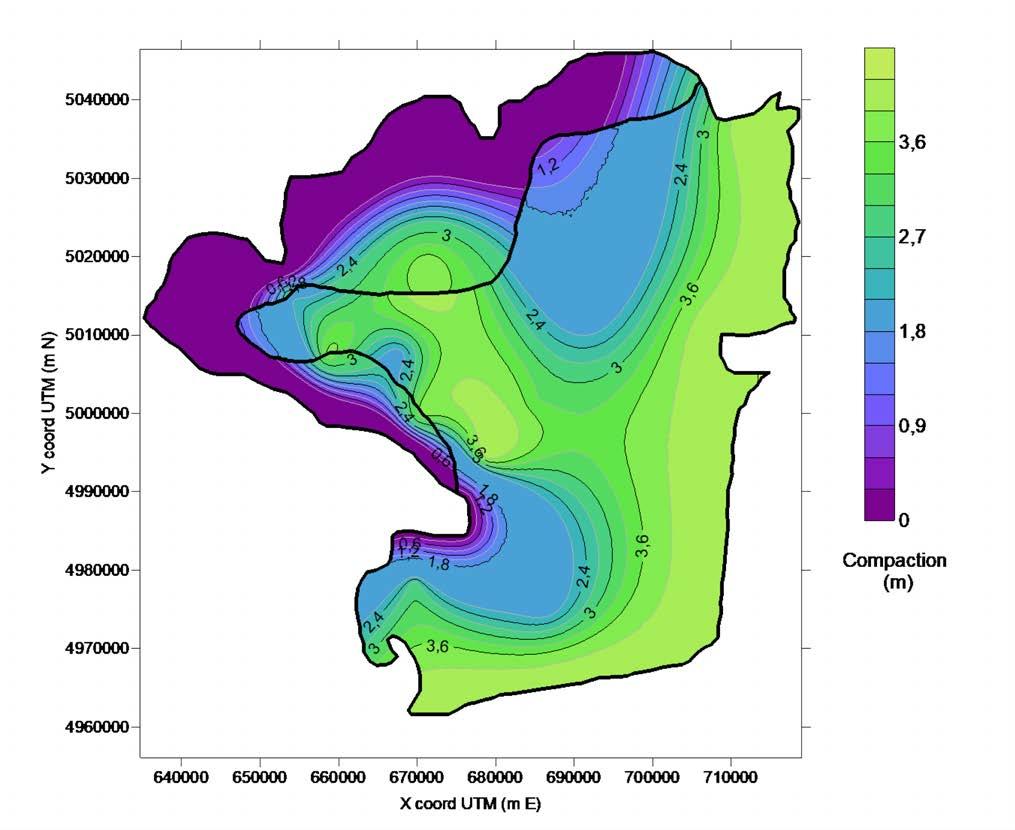
Figure 33 shows the map of the compaction of Holocene deposits computed using the proposed procedure. The area mostly affected by natural compaction is the marine one, where the difference between decompacted and compacted sediments reaches 4.4 m, while it reduces in the inner part of the delta plain because Holocene is thinner and the shallowest layers are made of sand, which has a compression index (Cc =0.033; Table 4) lower than that of the other soil types.
64
Figure 33: Danube delta: contour map of compaction (m) of the Holocene deposits.
In Figure 34, consistently with Figure 33, the largest values of percentage variation are computed in the coastal area, while it tends to zero along the inner boundaries.
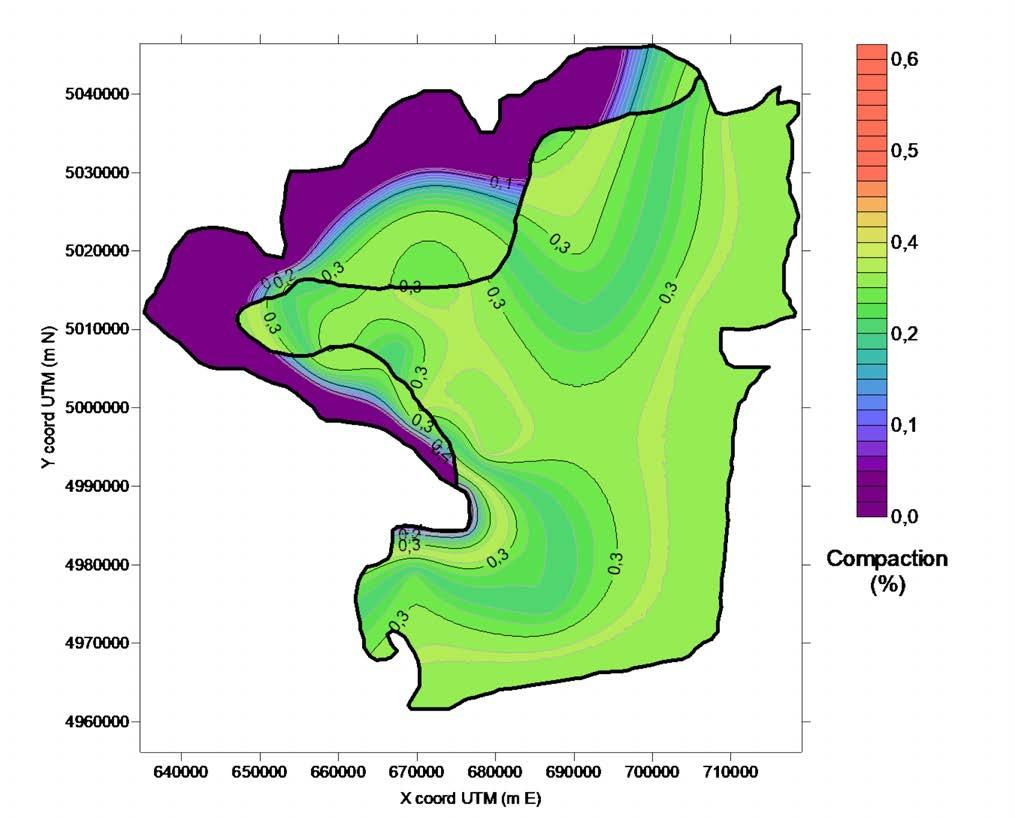
65
Figure 34: Danube delta: contour map of the compaction in percentage with respect to the actual thickness.
Finally, the delta weight per unit area, expressed in tons/m2 is shown in Figure 35. Integration of this latter over the delta extent (Eq.11) allows to compute the entire weight of the Holocene portion of the delta and its distribution on the Pleistocene top. In the case of the Danube delta, for an area of 4,000 km2 the weight of its Holocene portion calculated with the Weight Model procedure is 0.16×10⁵ Mtons.
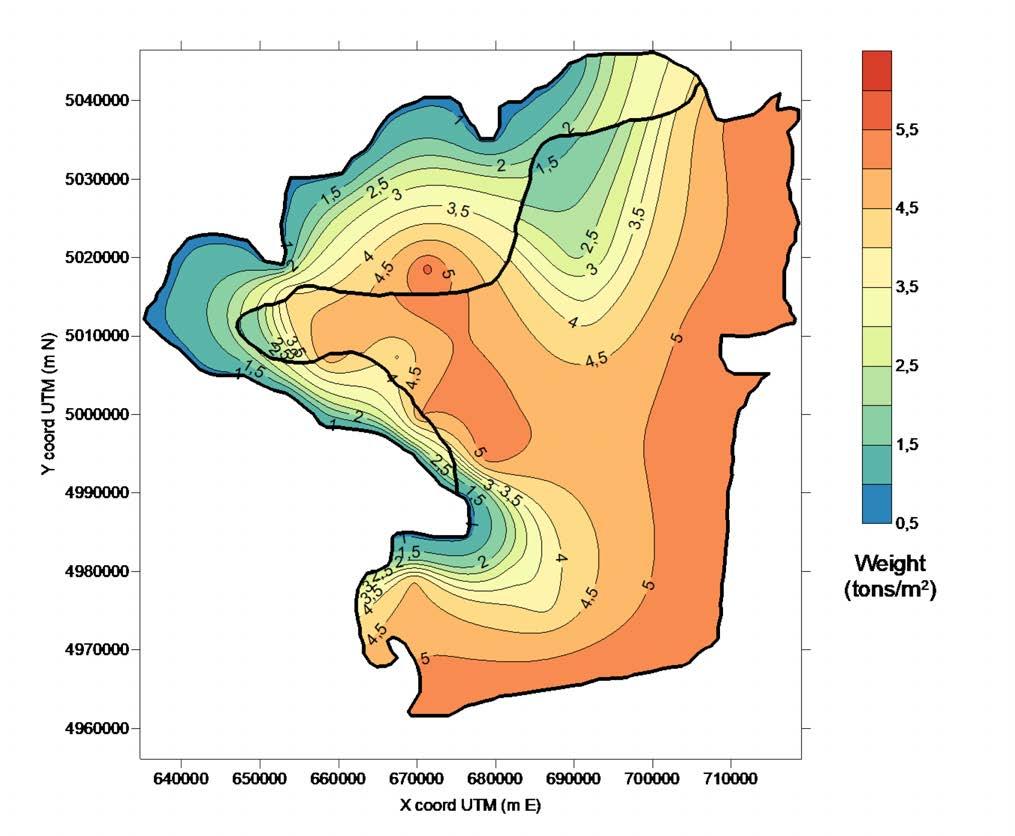
66
Figure 35: Danube delta: contour map of the weight per unit area (tons/m2) derived from the proposed procedure.
6.3. Godavari
The representative columns for the Godavari delta are decompacted back to their “original” thickness by using the Decompaction Model (Figure 36).
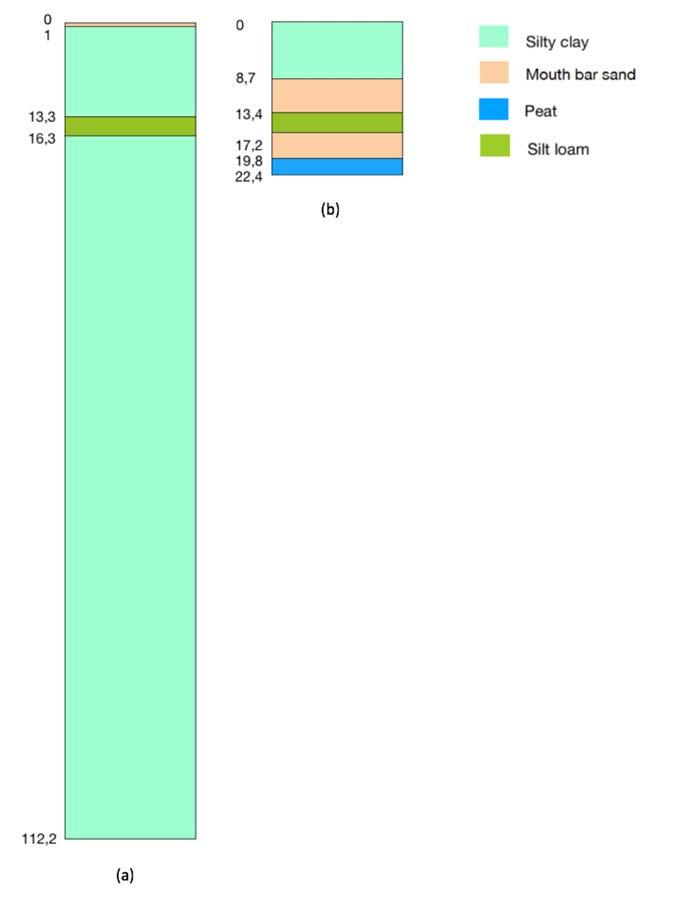
67
Figure 36: Decompacted sedimentary columns representative of (a) the marine and (b) fluvial environment in Godavari delta.
A map of the actual Holocene thickness is carried out by interpolation starting from the dataset after Nageswara Rao et al. (2017). Since the data are relatively few other reasonable information, e.g., a null value along the boundary of the deltaic plain and a few isolines, have been added to improve the interpolation outcome (Figure 37).
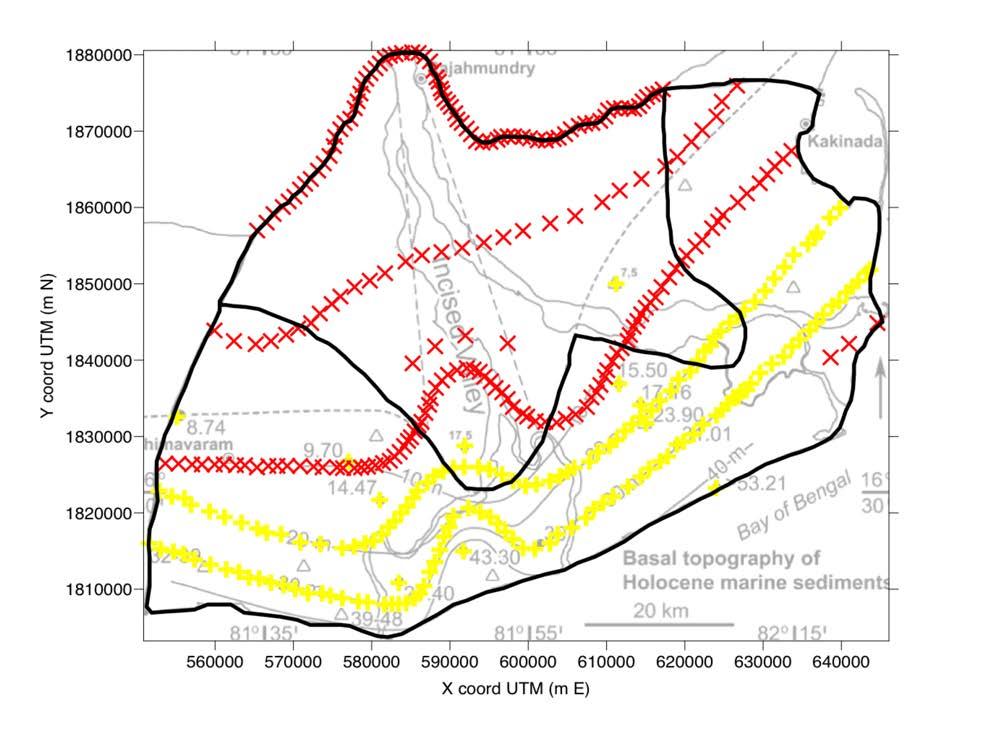
crosses represent the location of the cores
information on
thickness.
crosses
points reasonably added to better recreate the Holocene actual thickness. Points on the inner border are assumed to be characterized by null Holocene thickness, since the Holocene is supposed to vanish at the boundaries between the delta plain and the surrounding environments.
68
Figure 37: Base map after Nageswara Rao et al. (2015), properly georeferenced in UTM coordinates, fuse 44N. The yellow
with
the Holocene
The red
are the
The actual thickness of Holocene obtained by kriging is provided in Figure 38. As we can see from the map, the actual Holocene thickness is consistent with preliminary literature research reported in chapter 5 and with Nageswara Rao et al. (2017) study. The thickest points are in proximity of the coast. The thickness gently and constantly decreases moving inland and vanishes along the inner boundary.

69
Figure 38: Godavari delta: contour map of the actual Holocene thickness (in m) obtained from the interpolation the of spatial information summarized in Figure 37.
The map of decompacted Holocene thickness (Figure 39) is then obtained with the same kriging interpolation procedure explained above. A significant discontinuity in the decompacted thickness is obtained along the boundary between the two identified environments because of the different representative columns (Figure 36) selected for the two environments.
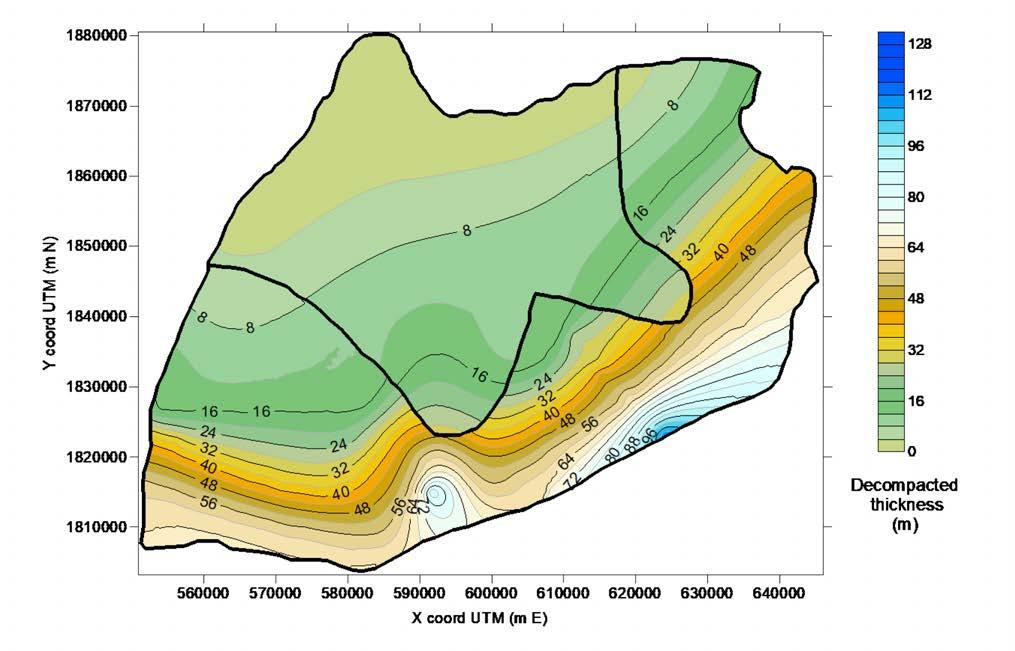
70
Figure 39: Godavari delta: contour map of the decompacted Holocene thickness (in m) obtained through the proposed methodology.
Figure 40 shows the map of the compaction of Holocene deposits computed using the proposed procedure. The area mostly affected by natural compaction is the marine one, mainly composed by silty clay (Cc =0.56; Table 4) where the difference between decompacted and compacted sediments reaches 50 m. The difference reduces significantly in the inner part of the delta plain because Holocene is thinner and the shallowest layers are made of an alternation between silty and sandy layers (Cc =0.033; Table 4).

71
Figure 40: Godavari delta: contour map of compaction (m) of the Holocene deposits.
In Figure 41, consistently with Figure 40, the highest value of percentage variation are obtained in the marine area, while lower values in the fluvial zone. The Godavari delta is characterized by high compaction rates, up to 52%, due to a large presence of compressible sediments.
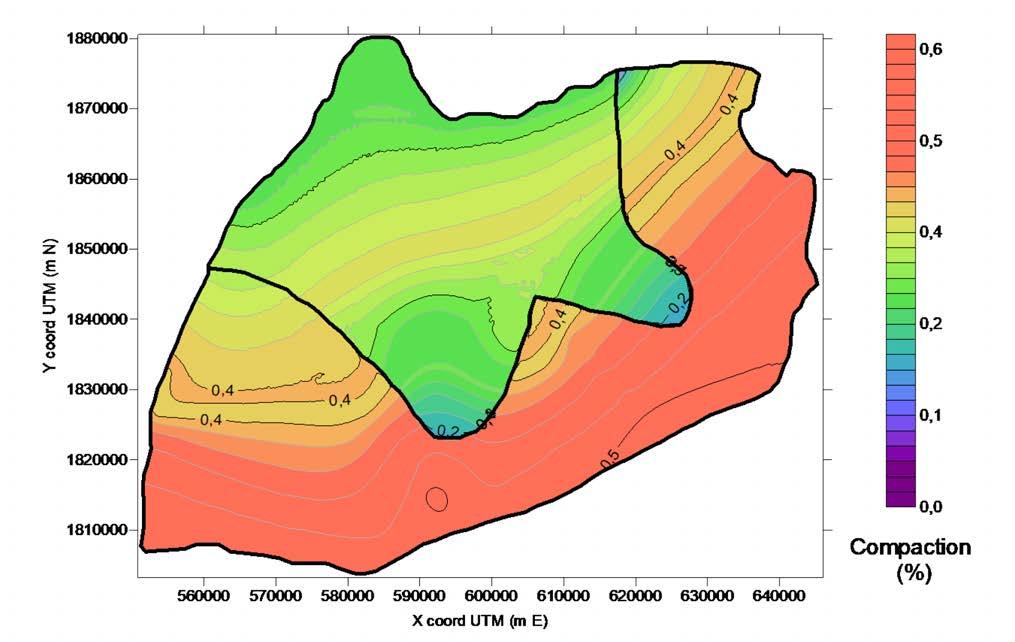
72
Figure 41: Godavari delta: contour map of the compaction in percentage with respect to the actual thickness.
Figure 42 shows the final result in terms of weight per unit area for the whole delta.
Integration of these values over the delta extent (Eq.11) allows computing the entire weight of the Holocene portion of the delta and its distribution on the Pleistocene top. In the case of the Godavari delta, with an area of 4,000 km2 , the weight of the Holocene amounts to 0.34×10⁵ Mtons.

73
Figure 42: Godavari delta: contour map of the weight per unit area (tons/m2) derived from the proposed procedure.
6.4. Krishna
The representative column for the Krishna delta is decompacted obtaining the profile shown in Figure 43.

74
Figure 43: Decompacted sedimentary columns representative of marine environment in Krishna delta
A map of the actual Holocene thickness is carried out by interpolation using the dataset after Nageswara Rao et al. (2015). These data have been integrated with other reasonable information, e.g., a null value along the boundary of the deltaic plain and isolines crossing the cores with known thickness. This has allowed to improve the interpolation outcome (Figure 44).
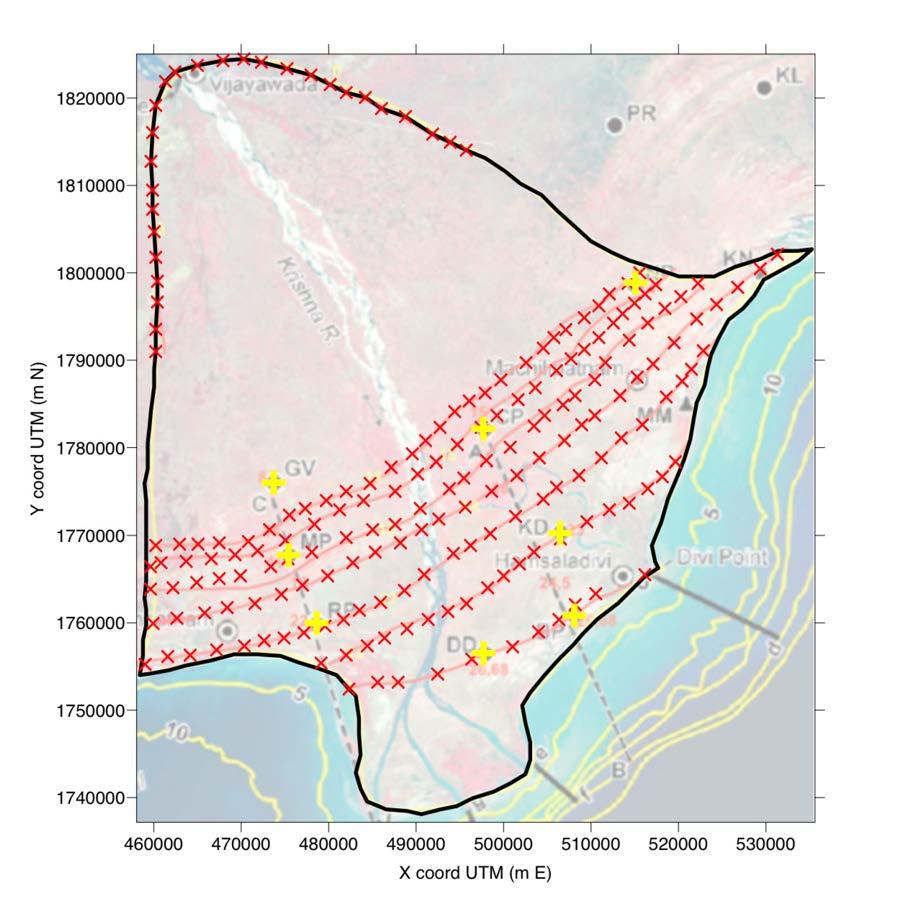
location
points added to improve the interpolation outcome. Points on the inner border are assumed to be characterized by null Holocene thickness, since the Holocene is supposed to vanish at the boundaries between the delta plain and the surrounding environments.
75
Figure 44: Base map after Nageswara Rao et al. (2020) properly georeferenced in UTM coordinates, fuse 44N. The yellow crosses represent the
of the cores with information on the Holocene thickness. The red crosses are the
The actual thickness of Holocene obtained by kriging is provided in Figure 45. The thickest points are located in proximity of the coast, with the thickness that gently reduces moving inland and reaches a null value along the inner boundary.
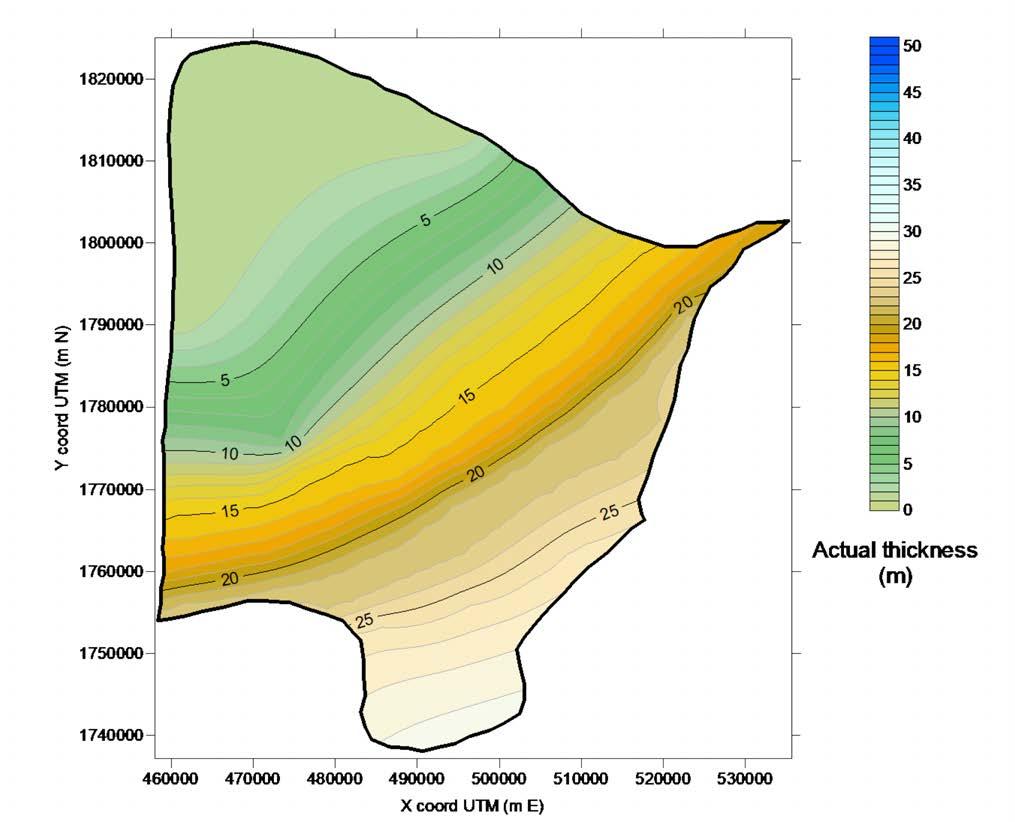
76
Figure 45: Krishna delta: contour map of the actual Holocene thickness (in m) obtained from the interpolation of the spatial information summarized in Figure 44.
The map of decompacted Holocene thickness is shown in Figure 46.
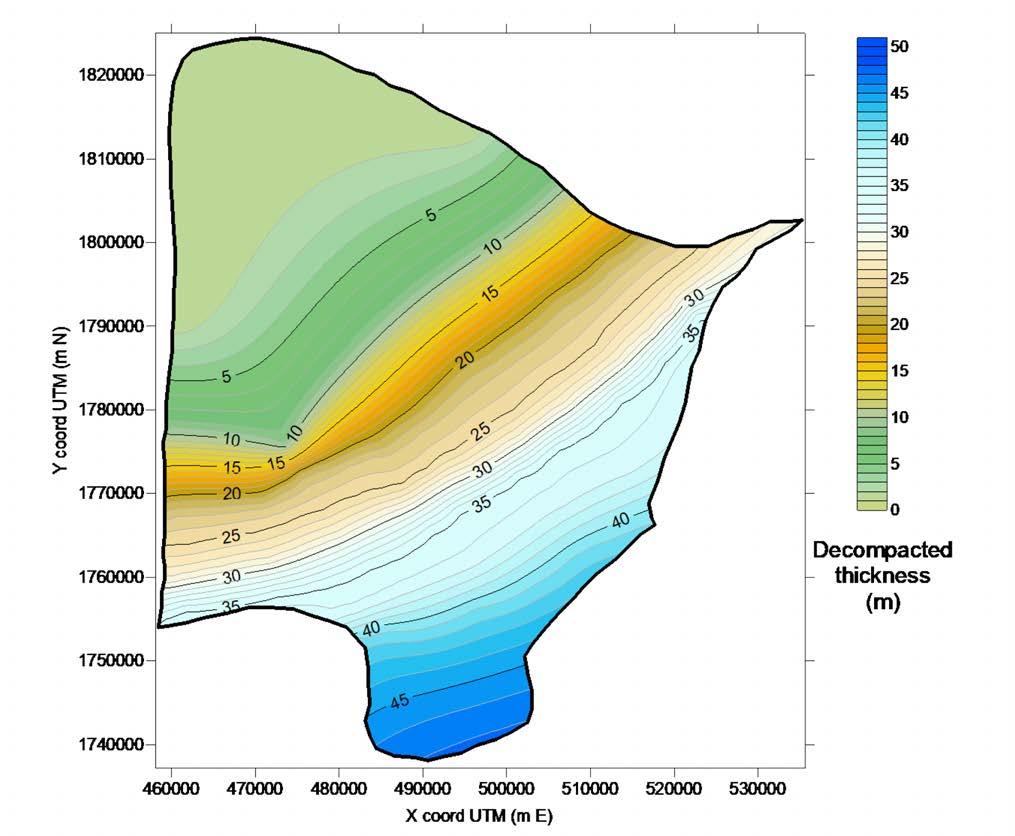
77
Figure 46: Krishna delta: contour map of the decompacted Holocene thickness (in m) obtained through the proposed methodology.
The compaction of Holocene deposits computed using the proposed procedure is presented in Figure 47. The area mostly affected by natural compaction is near the coast, where the difference between decompacted and compacted sediments reaches 18 m, while it reduces in the inner part of the delta plain because Holocene is thinner and the shallowest layers are made of sand, which has is characterized by a low compression index (Cc =0.033; Table 4).
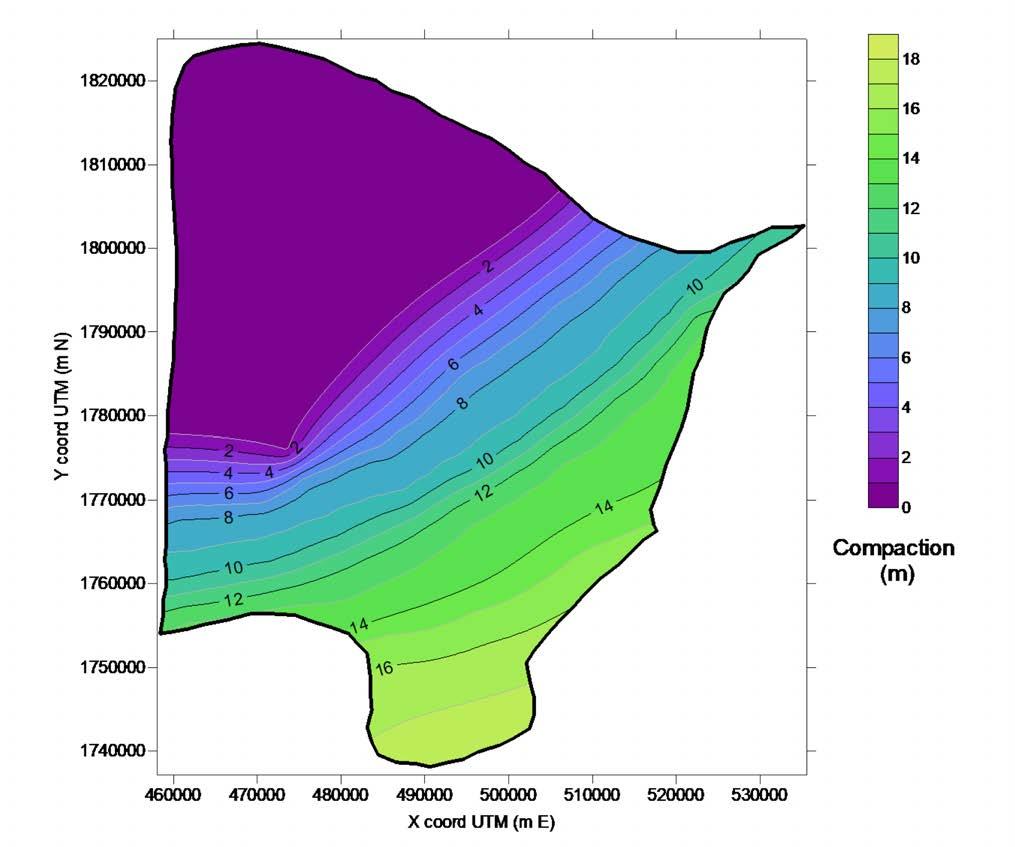
78
Figure 47: Krishna delta: contour map of compaction (m) of the Holocene deposits.
The compaction in percentage with respect to the actual thickness is shown in Figure 48. The largest value amounts to almost 40%.
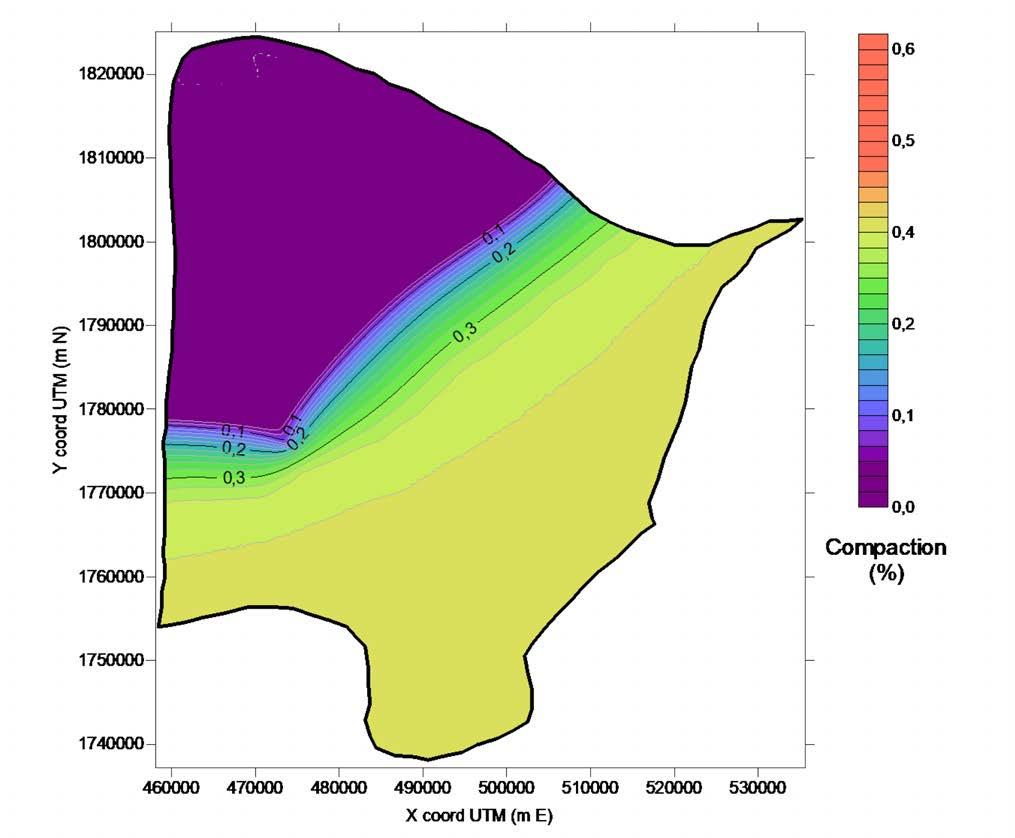
79
Figure 48: Krishna delta: contour map of the compaction in percentage with respect to the actual thickness.
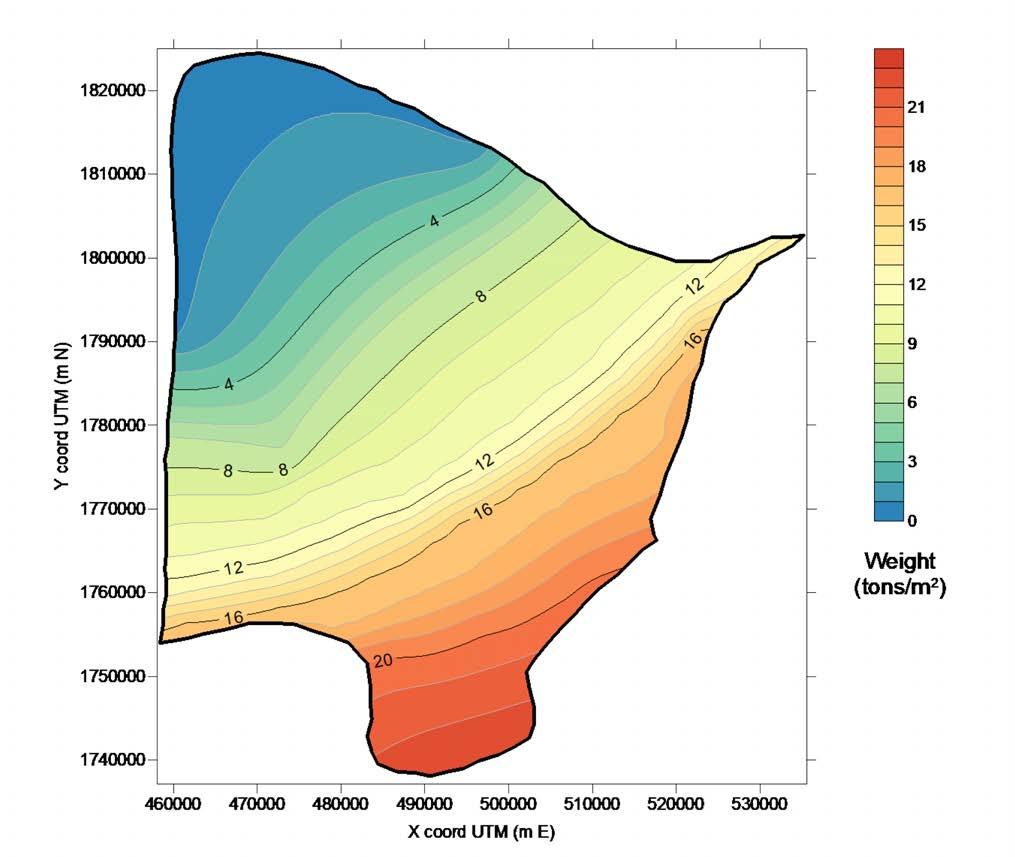
The delta weight per unit area, expressed in tons/m2, is shown in Figure 49. With an area of 3,500 km2 , the cumulative weight of the Holocene portion of the Krishna delta calculated with the Weight Model procedure results 0.38×10⁵ Mtons.
80
Figure 49: Krishna delta: contour map of the weight per unit area (tons/m2) derived from the proposed procedure.
6.5. Mekong
The representative columns for the Mekong delta are decompacted. The outcome is presented in Figure 50.

81
Figure 50: Decompacted sedimentary columns representative of (a) the marine and (b) fluvial environment in Mekong delta.
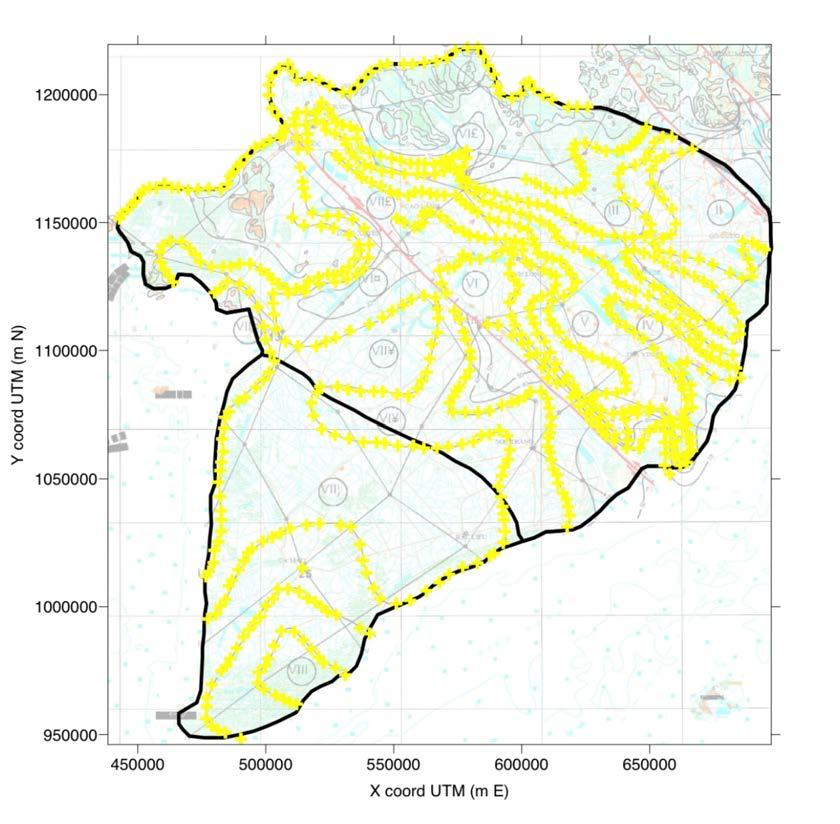
A map of the actual Holocene thickness is developed using the datased provided by DGMV (2004). The data are summarized in Figure 51.
82
Figure 51: Base map after DGMV 2004 properly georeferenced in UTM coordinates, fuse 48N. The yellow crosses represent the location of the points used to built-up the map of the actual Holocene thickness.
The actual thickness of Holocene obtained by kriging is provided in Figure 52. The delta thickness in the two environments differ significantly: the marine part is characterized by and almost uniform value averaging 20-25 m.; conversely the thickness on the fluvial-dominated portion is really variable, with a maximum value of about 60 m.

83
Figure 52: Mekong delta: contour map of the actual Holocene thickness (in m) obtained from the interpolation of spatial information summarized in Figure 51.
The map of decompacted Holocene thickness is presented in Figure 53. Notice the discontinuity along the boundary between the two environments accounting for the lithostratigraphic differences between the two representative columns (Figure 50).

84
Figure 53: Mekong delta: contour map of the decompacted Holocene thickness (in m) obtained through the proposed methodology.
Figure 54 shows the map of the compaction of the Holocene deposits computed using the proposed procedure. The largest compaction, up to 32 m, takes place in the fluvial area, which is thicker and composed also by silty clay and peat (Cc=0.56 and Cc = 4.72 respectively; Table 4). We can notice a relevant compaction also in the marine part where, in the proximity of the thicker layers, reaches 32 m. Here, the Holocene is composed by organic clay and silty clay with high compaction coefficient (Cc=0.3 and Cc=0.56 respectively; Table 4).

85
Figure 54: Mekong delta: contour map of compaction (m) of the Holocene deposits.
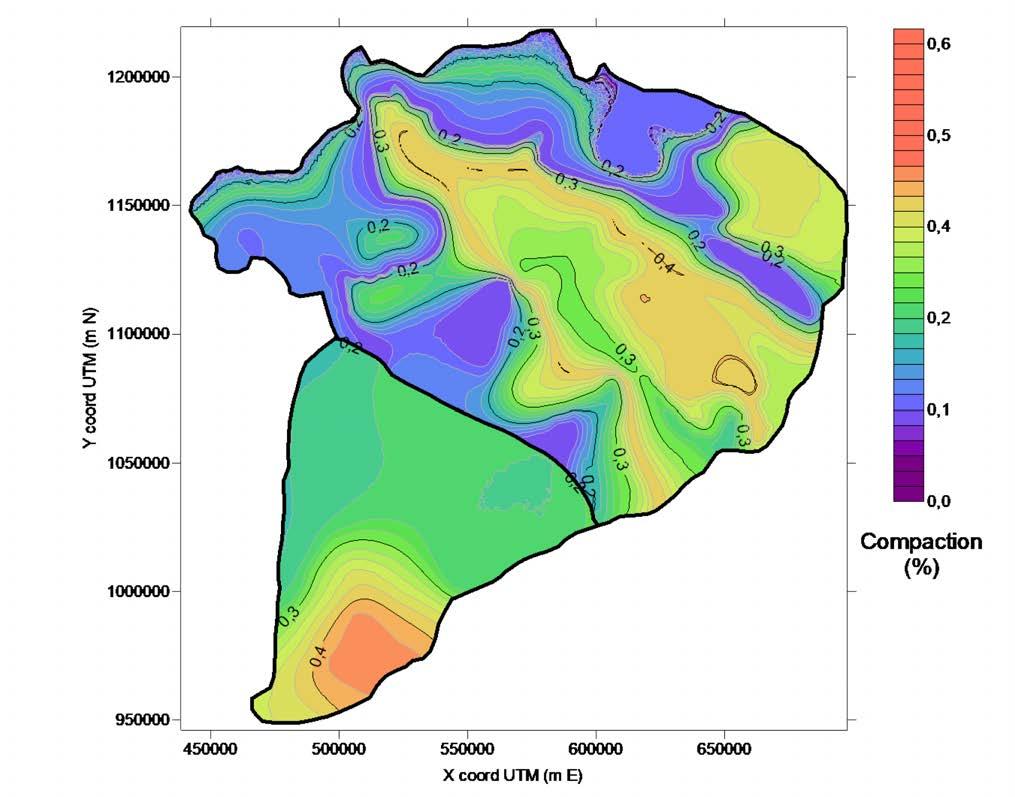
Consistently with Figure 54, Figure 55 shows that the largest value of compaction in percentage are located in the same spots, with values up to 44%. This is justified by the huge amount of compressible sediments forming the Holocene.
86
Figure 55: Mekong delta: contour map of the compaction in percentage with respect to the actual thickness.
The delta weight per unit area, expressed in tons/m2, is shown in Figure 56. Integration of this map over the areal extent of the entire Mekong delta, which amounts to 50,700 km2 , provides a total weight equal to 6.00×10⁵ Mtons.

87
Figure 56: Mekong delta: contour map of the weight per unit area (tons/m2) derived from the proposed procedure.
6.6. Mississippi
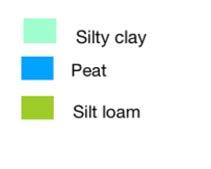
The representative column for the Mississippi delta is decompacted as shown in Figure 57.

88
Figure 57: Decompacted sedimentary columns representative of the fluvial environment in Mississippi delta
A map of the actual Holocene thickness is developed using the dataset after Jankowsky et al. (2017). The digitized data are shown in Figure 58.
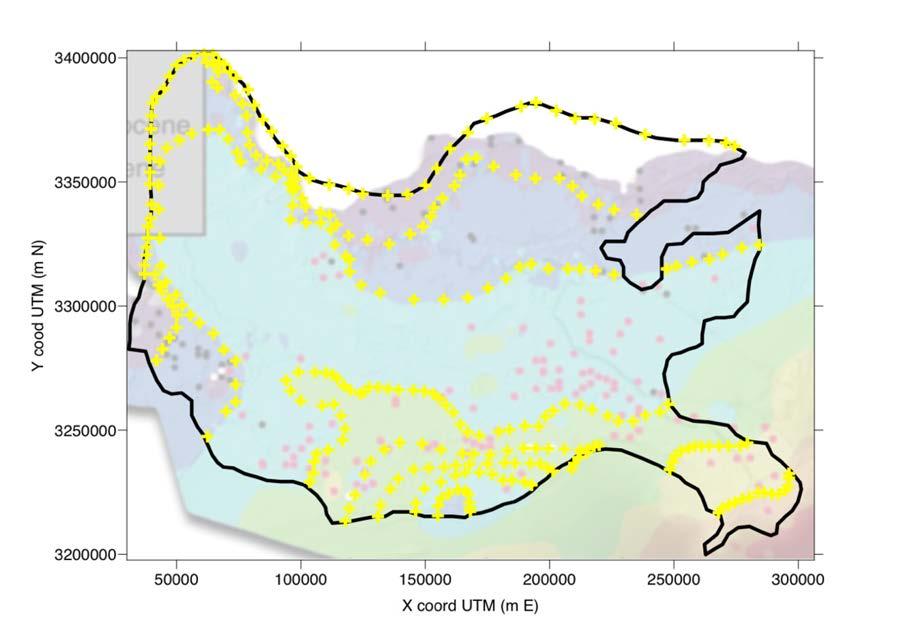
89
Figure 58: Base map after Jankowsky et al. (2017) properly georeferenced in UTM coordinates, fuse 16N. The yellow crosses represent the digitized points used to generate the map of the Holocene thickness.
The actual thickness of Holocene obtained by kriging is provided in Figure 59. The actual Holocene thickness is consistent with the literature information reported in chapter 5. i.e. with the data provided by Jankowsky et al. (2017) and Bridgeman (2018).
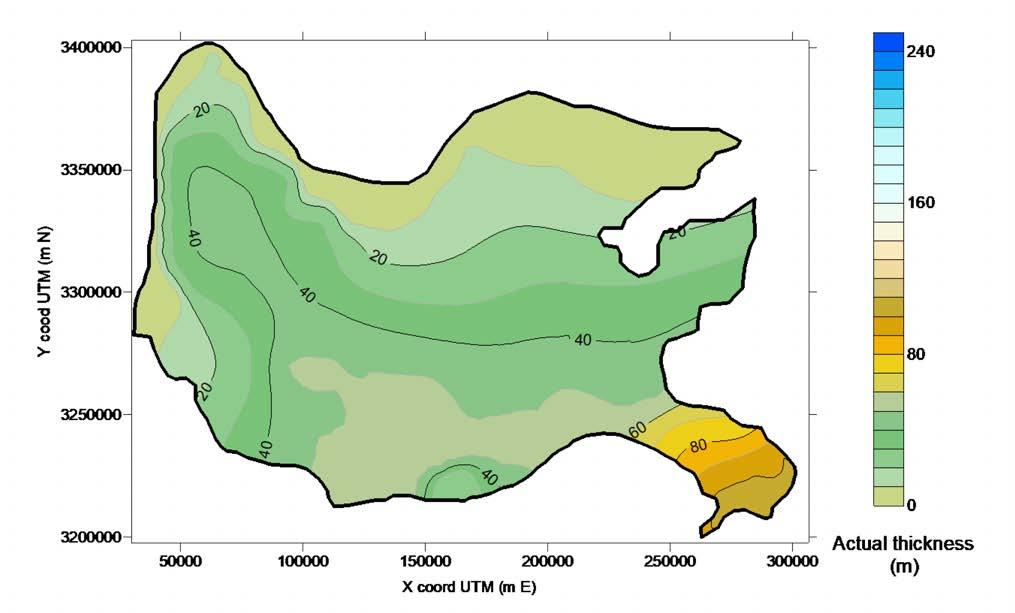
90
Figure 59: Mississippi delta: contour map of the actual Holocene thickness (in m) obtained from the interpolation of the spatial information summarized in Figure 58.
The map of decompacted Holocene thickness is then obtained integrating the actual thickness map and the decompacted representative column. The result is shown in Figure 60.
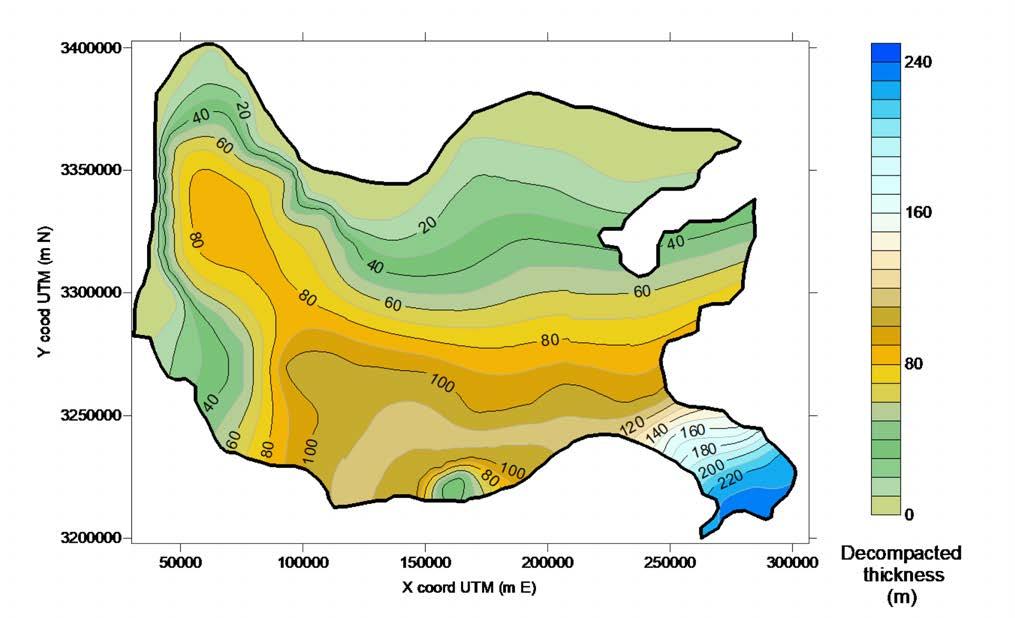
91
Figure 60: Mississippi delta: contour map of the decompacted Holocene thickness (in m) obtained through the proposed methodology.
deposits. The area characterized by the largest natural compaction is the most progradated one at the delta tip, which is the thickest area. The maximum compaction amounts to more than 100 m.

92
Figure 61 shows the map of the compaction of the Holocene
Figure 61: Mississippi delta: contour map of compaction (m) of the Holocene deposits.
In Figure 62, consistently with Figure 61, the highest value of percentage variation are computed in the same spots where high compaction in terms of meters are reported. The maximum compaction in percentage relative to the actual thickness peaks 0.56, which is a very large values, and it is justified by the large thickness and the huge amount of compressible sediments in the Holocene layers, such as peat, silty clay and silty loam with Cc respectively of 4.72, 0.56, 0.6, respectively.
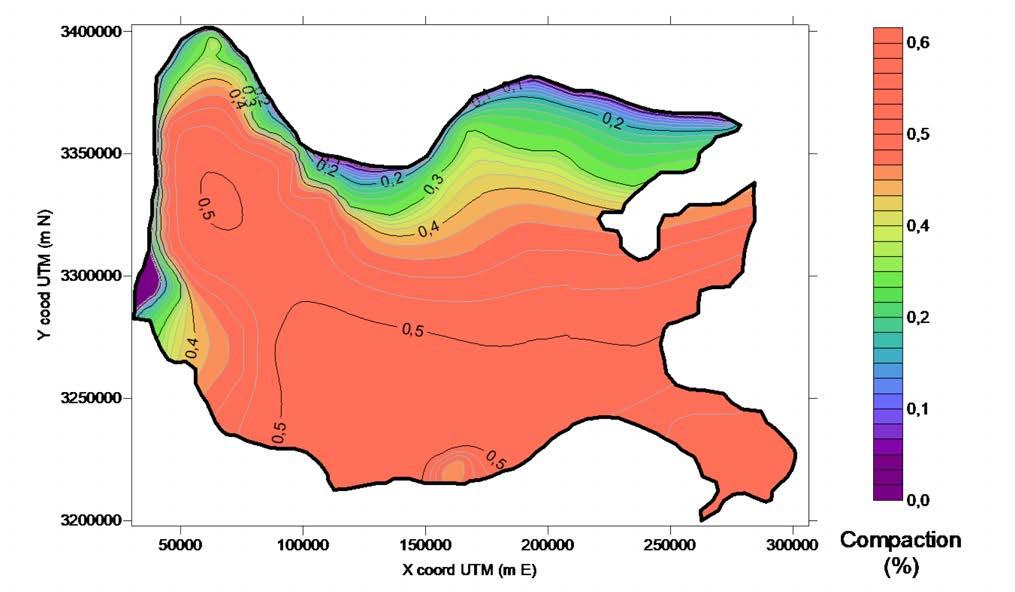
93
Figure 62: Mississippi delta: contour map of the compaction in percentage with respect to the actual thickness.
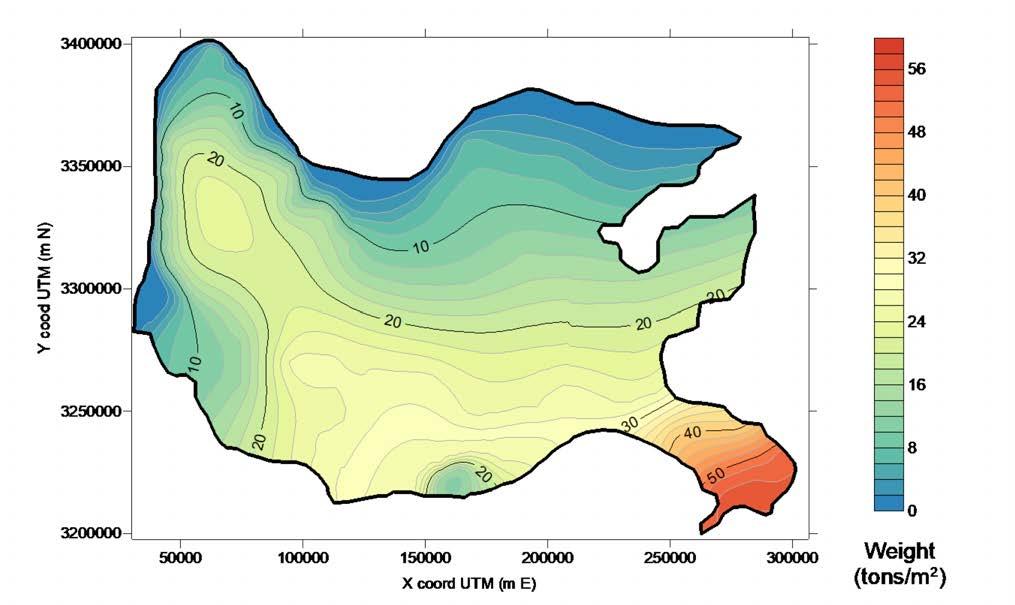
The map of the weight per unit area, expressed in tons/m2, is shown in Figure 63. With an area of 29,000 km2 , the total weight of the Holocene portion of the Mississippi is estimated in 5.7×10⁵ Mtons.
94
Figure 63: Mississippi delta: contour map of the weight of unit area (tons/m2) obtained through the proposed procedure.
6.7. Pearl
The decompacted representative columns of the Perl delta are shown in Figure 64.

95
Figure 64: Decompacted simplified sedimentary columns representative of (a) the coastal and (b) inner environment in Pearl delta.
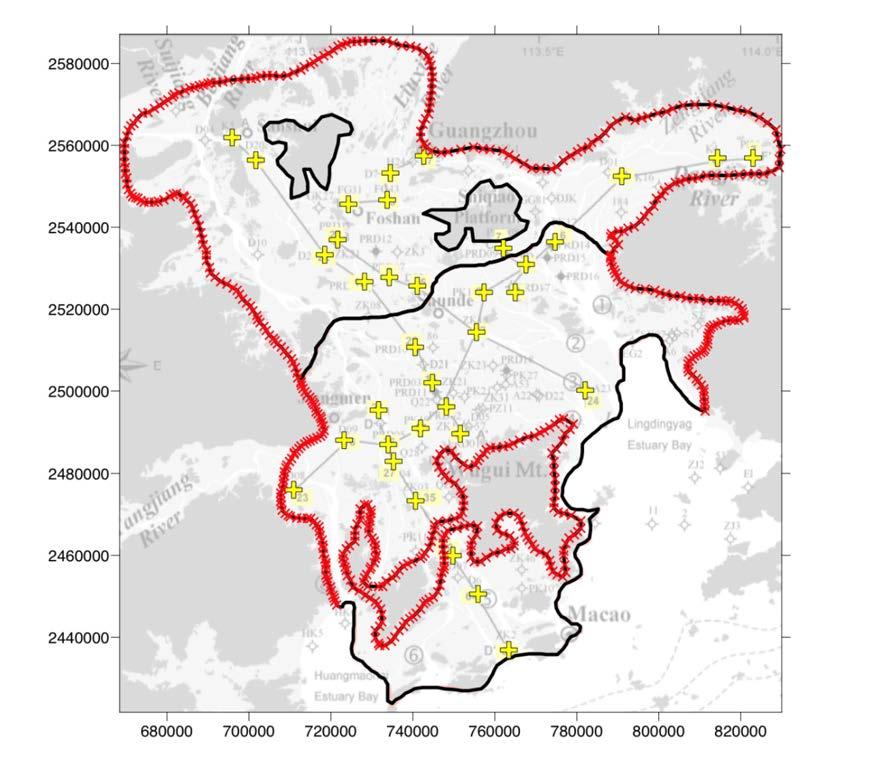
A map of the actual Holocene thickness is carried out by interpolating the dataset after Yu et al. (2011) integrated with few other reasonable information, e.g., null values along the boundary of the deltaic plain and near the mountain areas, added to improve the interpolation outcome (Figure 65).
coordinates,

represent the location of

cores with information on the Holocene depth.
red crosses are the points reasonably added to better recreate the Holocene actual thickness. Points on the coastline are characterized by the same thickness of the cores in that area. Points on the boundaries of the mountain outcrops are characterized by null Holocene thickness.
96
Figure 65: Base map after Wei X. et al., (2011) properly georeferenced in UTM
fuse 49N. The yellow crosses
the
The
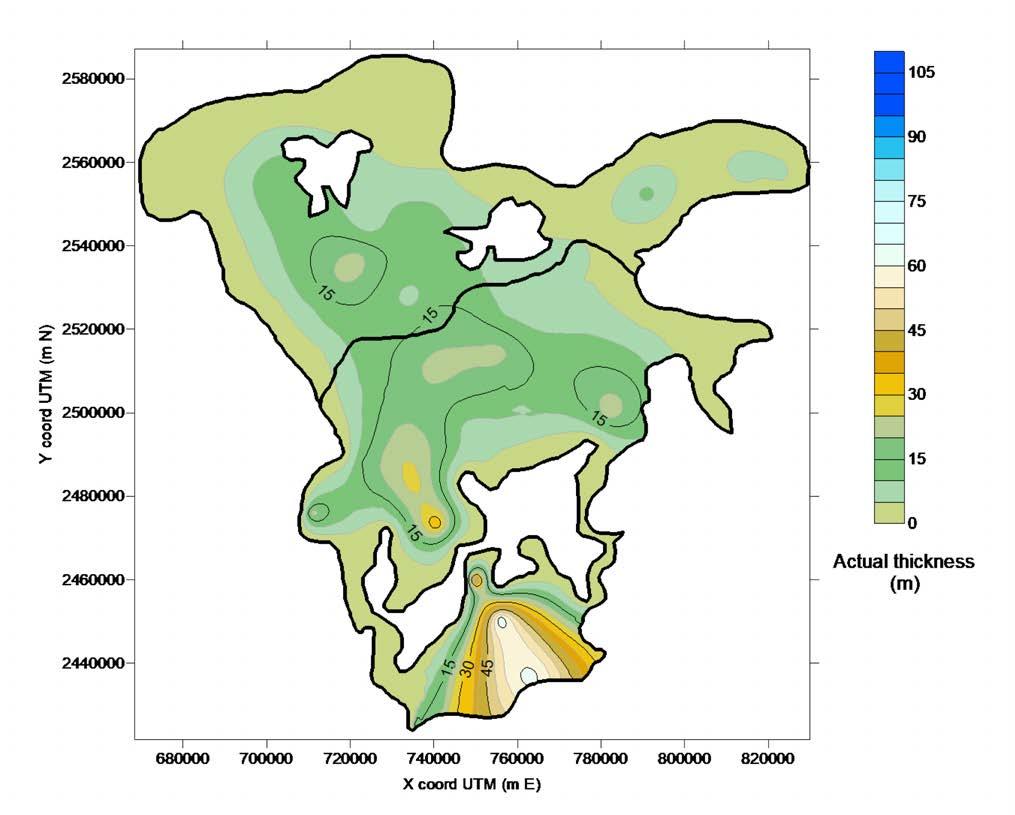
The actual thickness of Holocene obtained by kriging is provided in Figure 66. The thickest zone is located in proximity of the coast.
97
Figure 66: Pearl delta: contour map of the actual Holocene thickness (in m) obtained from the interpolation of the spatial information summarized in Figure 65.
Figure 67 shows the map of decompacted Holocene thickness It is possible to distinguish a discontinuity along the boundary between the two identified environments. This occurs because of the different representative columns (Figure 64) selected for the two environments.

98
Figure 67: Pearl delta: contour map of the decompacted Holocene thickness (in m) obtained through the proposed methodology.
Figure 68 shows the map of the compaction of Holocene deposits computed using the proposed procedure. The area mostly affected by natural compaction is the one near the coast, which is the thicker area and where compaction reaches 30 m. This is also because the sedimentary layers are mainly made of silty clay and silt loam, with compression index Cc equal to 0.56 and 0.23, respectively (Table 4). Note that along the boundary between the two environments, in the central position of the delta where the actual thickness is approximately 15 m, the compaction in the coastal environment doubles that in the inner environment because silty clay is characterized by a Cc value twice that of silty loam and organic clay.

99
Figure 68: Pearl delta: contour map of compaction (m) of the Holocene deposits.
Figure 69 shows the compaction in percentage. The largest value is obtained in the coastal environment, where it reaches 0.46. The discontinuity along the boundary between the two environments is evident.
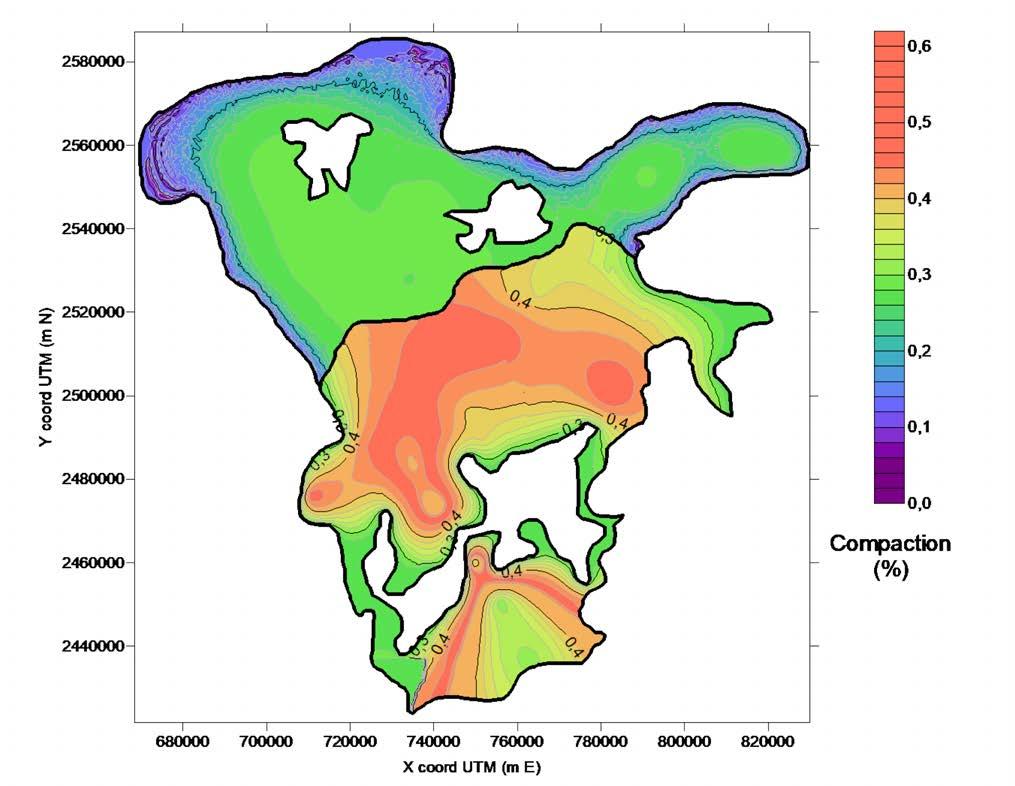
100
Figure 69: Pearl delta: contour map of the compaction in percentage with respect to the actual thickness.
The map of the weight per unit area, expressed in tons/m2, is shown in Figure 70. The total weight amounts to 0.49×10⁵ Mtons for an area of 11,600 km2 .
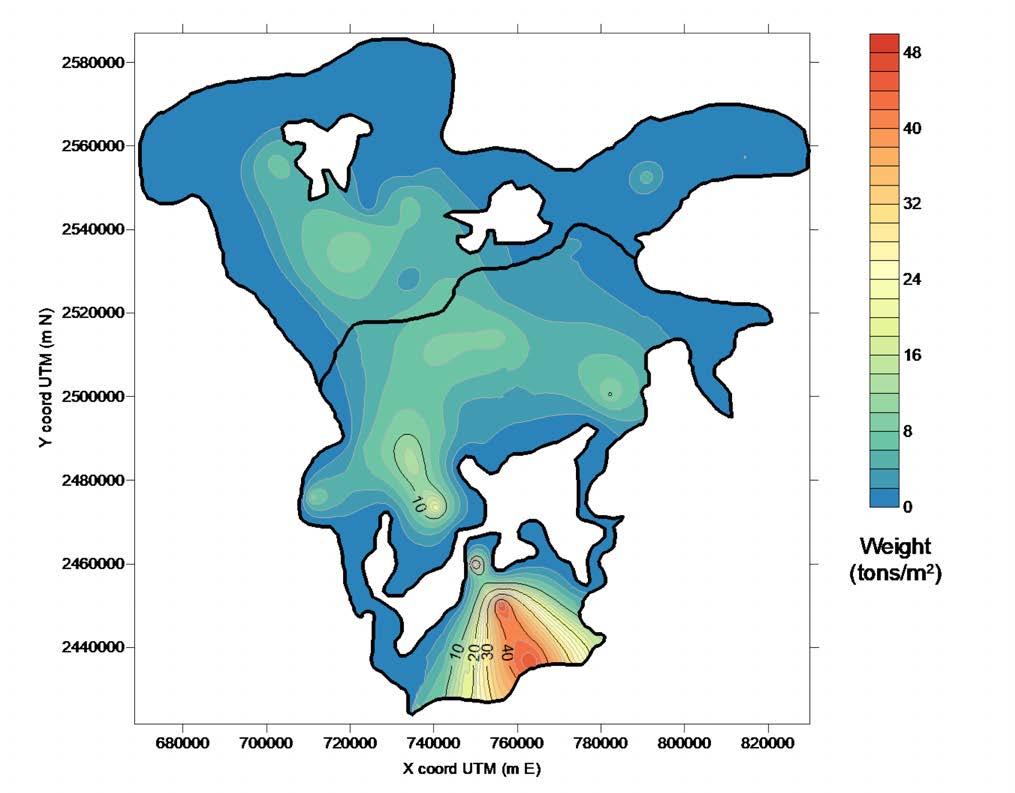
101
Figure 70: Pearl delta: contour map of the weight per unit area (tons/m2) derived from the proposed procedure.
6.8. Po
The representative column for the Po delta is decompacted back to its “original” thickness by using the Decompaction Model (Figure 71).
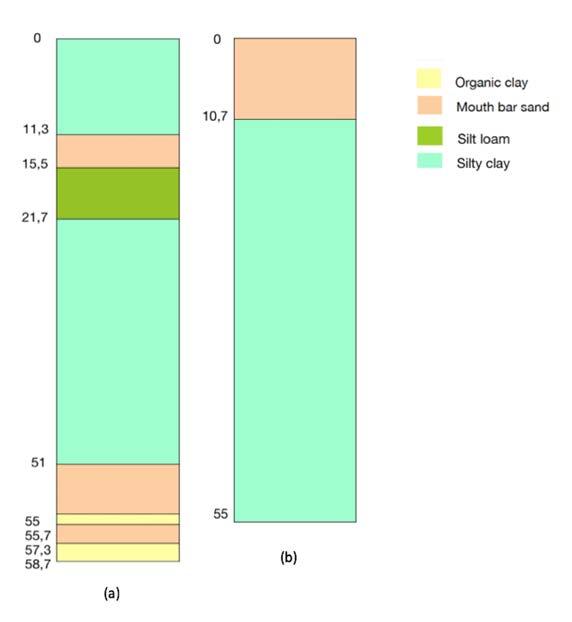
102
Figure 71: Decompacted sedimentary columns representative of (a) the coastal and (b) inner environment in Po delta.
A map of the actual Holocene thickness is carried out by interpolating starting from the dataset of Correggiari et al., 2005. Since the data are relatively few other reasonable information, e.g., isolines crossing the cores with known thickness, have been added to improve the interpolation outcome, since the thickness of Holocene in Po delta is quite constant (Figure 72).
Figure
and properly georeferenced in
coordinates, fuse 33N The yellow crosses represent the location of the cores with information on the Holocene thickness. The red crosses are the points reasonably added to better recreate the Holocene actual thickness. The delta tip is characterized by the same Holocene thickness of the cores in that area (40 m) Holocene thickness decreases homogeneously towards the inner boundary, its value is taken considering the average 25 m of thickness of the cores in that area. In proximity of the Venice Lagoon the thickness is setted, after Tosi et al., (2009), at 20 m.
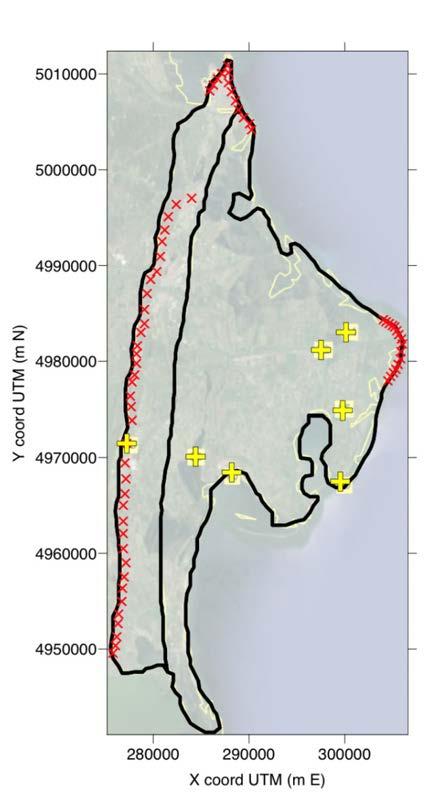
103
72: Base map of the Po delta modified after Correggiari et al., (2005)
UTM
The actual thickness of Holocene obtained by kriging is provided in Figure 72. Holocene thickness is quite constant, with the thickest zone located in proximity of the delta tip.
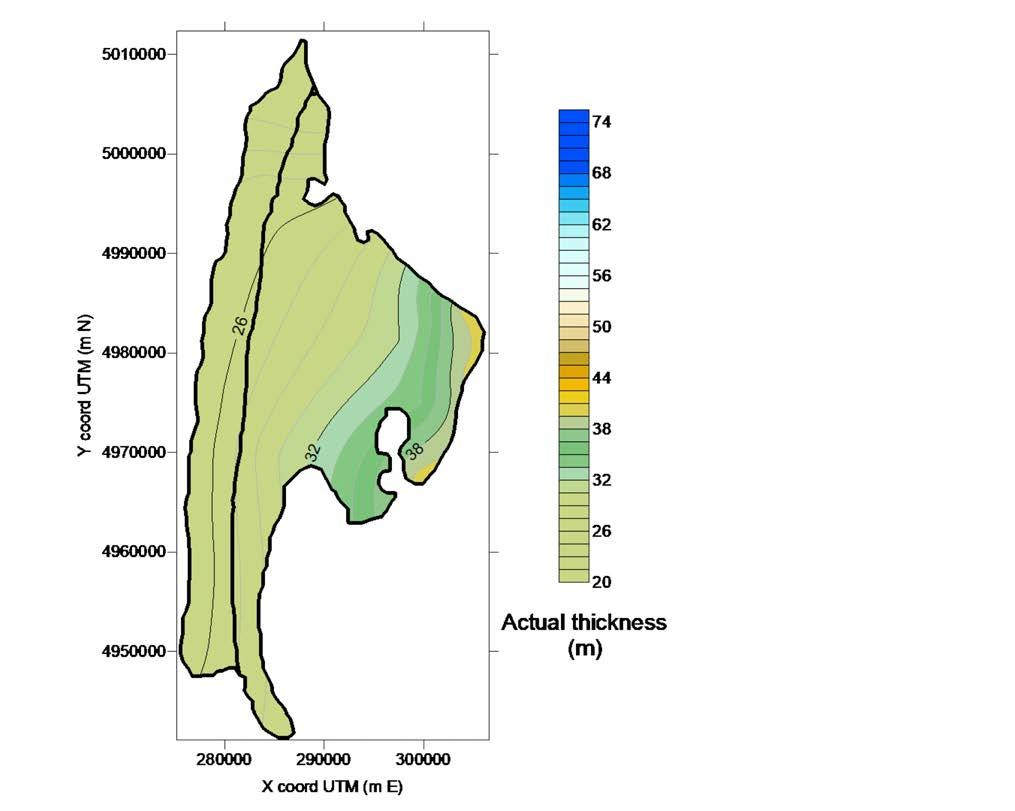
104
Figure 72: Po delta: contour map of the actual Holocene thickness (in m) obtained from the interpolation of the spatial information summarized in Figure 72.
The map of decompacted Holocene thickness presented in Figure 73.
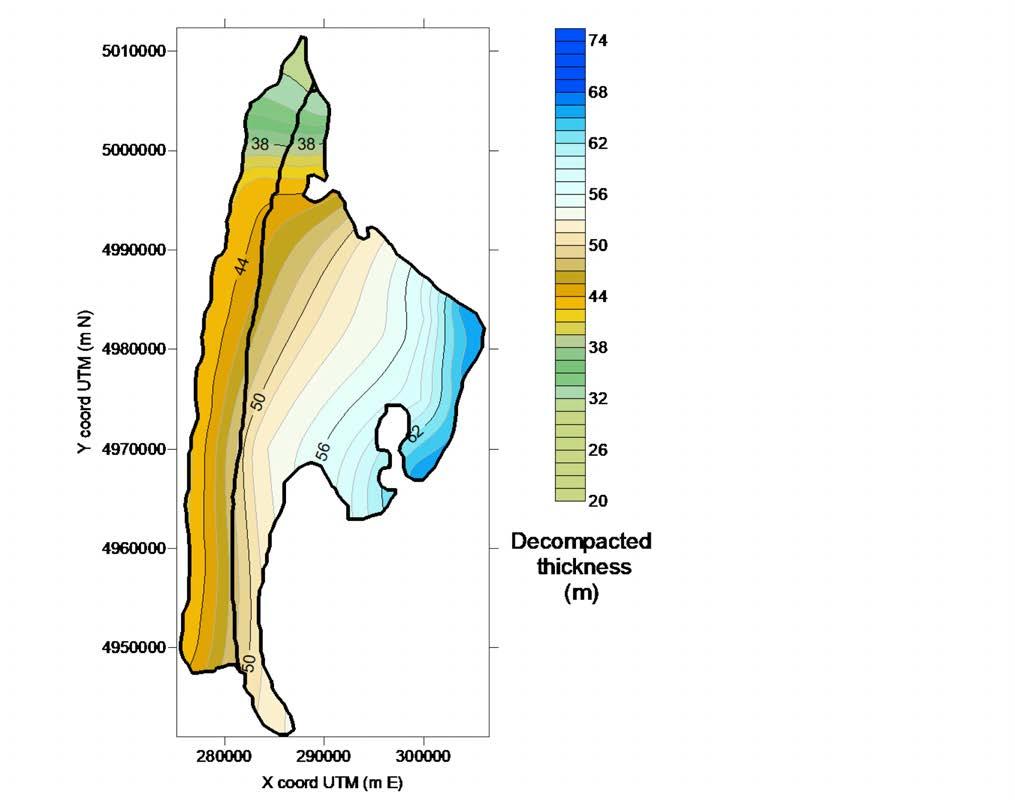
105
Figure 73: Po delta: contour map of the decompacted Holocene thickness (in m) obtained through the proposed methodology.
Figure 74 shows the map of the compaction of Holocene deposit computed using the proposed procedure. The area mostly affected by natural compaction is the one near the coast, which is the thicker area and where compaction reaches 26 m. This is also because the sedimentary layers are mainly made of compressible silty clay (Cc = 0.56; Table 4). Notice the almost null discontinuity in term of compaction along the boundary between the two environments, despite the quite large difference between the stratigraphic columns in the upper 25 m. This is due the fact that in the inner environment the sand unit is heavy but stiff, while in the coastal part the lithology is more uniform with the presence of compressible but lighter materials (Table 4).
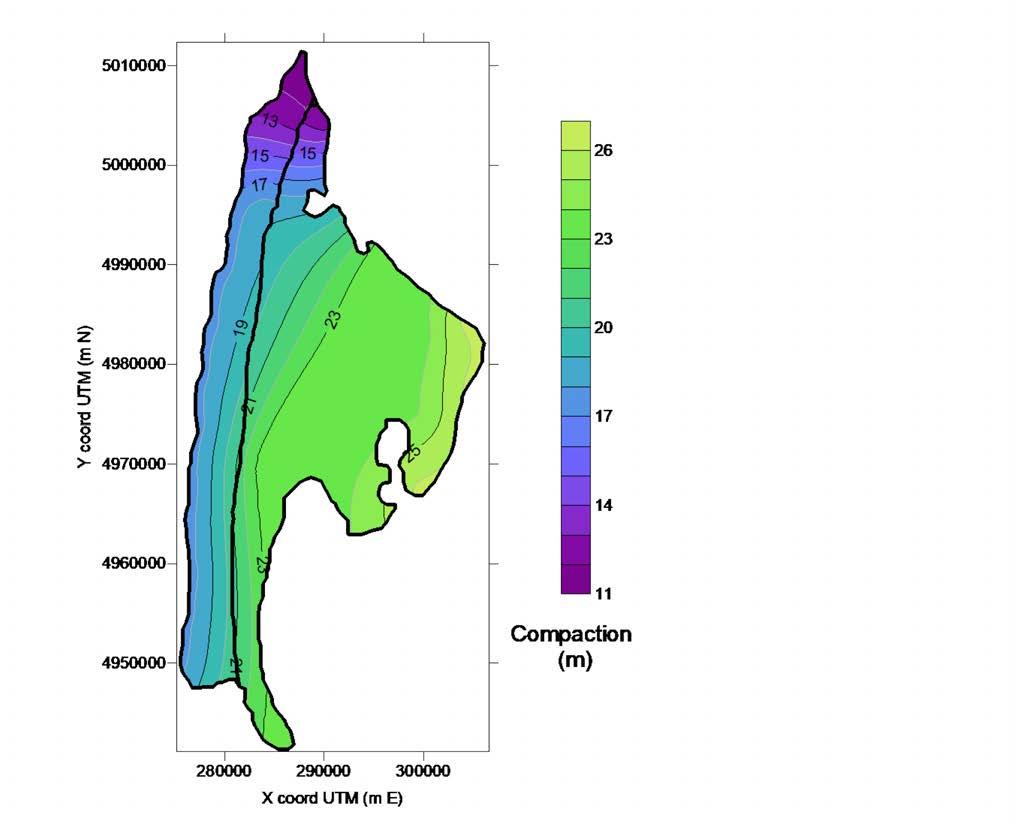
106
Figure 74: Po delta: contour map of compaction (m) of the Holocene deposits.
Consistently with Figure 74, Figure 75 shows that the largest value of compaction in percentage (47%) is obtained in the coastal area. However, the quantity is quite uniformly distributed, with the exception of the portion toward the Venice Lagoon.

107
Figure 75: Po delta: contour map of the compaction in percentage with respect to the actual thickness.
Figure 70 shows the distribution of the weight per unit area, expressed in tons/m2. With an area of 948 km2 , the total weight of the Holocene Po delta amounts to 0.15×10⁵ Mtons.

108
Figure 70: Po delta: contour map of the weight per unit area (tons/m2) derived from the proposed procedure.
7. Discussion
The results obtained for the 8 studied deltas are critically compared in this chapter. Table 5 reports the main results, expressed in terms of average actual and decompacted thickness, average compaction and total weight.
Another interesting comparison among the 8 delta plains can be performed in terms of weight per unit area. As we can see from Table 6, the heaviest delta per unit area is the Mississippi, which has also the highest average compaction of 48% (Table 5). A similar result is obtained for the Po delta, where the average compaction amounts to 42% and the sediment weight to 17.14 tons/m2.
A clear correspondence is obtained between the distribution of the specific weight per unit area and the compaction maps. For example, Chao Phraya and Danube have a small compaction, equal to 18% and 25%, respectively, due to the small average thickness of the Holocene unit and, consequently, the relatively small sediment weight per unit area. Conversely, the large compaction values characterizing Mississippi and Po deltas are associated to the thick Holocene layer and, consequently, the large weight per unit area. With reference to the Mekong delta, although characterized by a significant sediment weight per unit area, it shows a lower average compaction, i.e. 25%, due to the composition of the representative columns. In fact, the Mekong fluvial area has a large thickness, but it is mainly composed by sand, which is characterized
109
Delta Area [��� ] Average actual Holocene thickness [m] Average decompacted Holocene thickness [m] Average Compaction Total weight (sediments) [Mtons] Chao Phraya 23,000 7.85 9.83 18% 0.85×10⁵ Danube 4,000 5.95 8.40 25% 0.16×10⁵ Godavari 4,000 14.41 26.01 38% 0.34×10⁵ Krishna 3,500 13.17 19.84 23% 0.38×10⁵ Mekong 50,700 25.20 36.48 25% 6.00×10⁵ Mississippi 29,000 33.35 66.03 48% 5 70×105 Pearl 11,600 10.13 16.10 31% 0,49×10⁵ Po 948 28.86 49.94 42% 0,15×10⁵
Table 5: Summary of the results obtained with the developed methodology for the 8 studied deltas.
by a small Cc=0.033 (Table 4). On the contrary, in the Po delta the sedimentary layers are mainly made of compressible silty clay Cc = 0.56 (Table 4) yielding to a larger compaction. A similar situation characterizes the Godavari delta, where the 38% average compaction is due to the significant percentage of silty clay within the representative columns. A similar trend is valid also for the Krishna and Pearl deltas, but average compaction is smaller due to the presence of sand in the sedimentary layers.
It must be noticed that the values obtained in the study are obviously affected by the simplifications described in Chapter 3 and 4 related to the methodology and, even more, to the lithological characterization which is strictly dependent on the available information at the local (borehole) and the whole delta scales.
110
Delta Average sediment weight per unit area [tons/m2] Chao Phraya 3.59 Danube 3.87 Godavari 7.00 Krishna 9.94 Mekong 15.35 Mississippi 17.77 Pearl 4.27 Po 17.14
Table 6: Comparison between the average weight per unit area (tons/m2) among the 8 studied deltas.
Figure 71 provides a comparison between the maps of the sediment weight per unit area redrawn using a same range (from 0 to 56 tons/m2) for the colorbar.
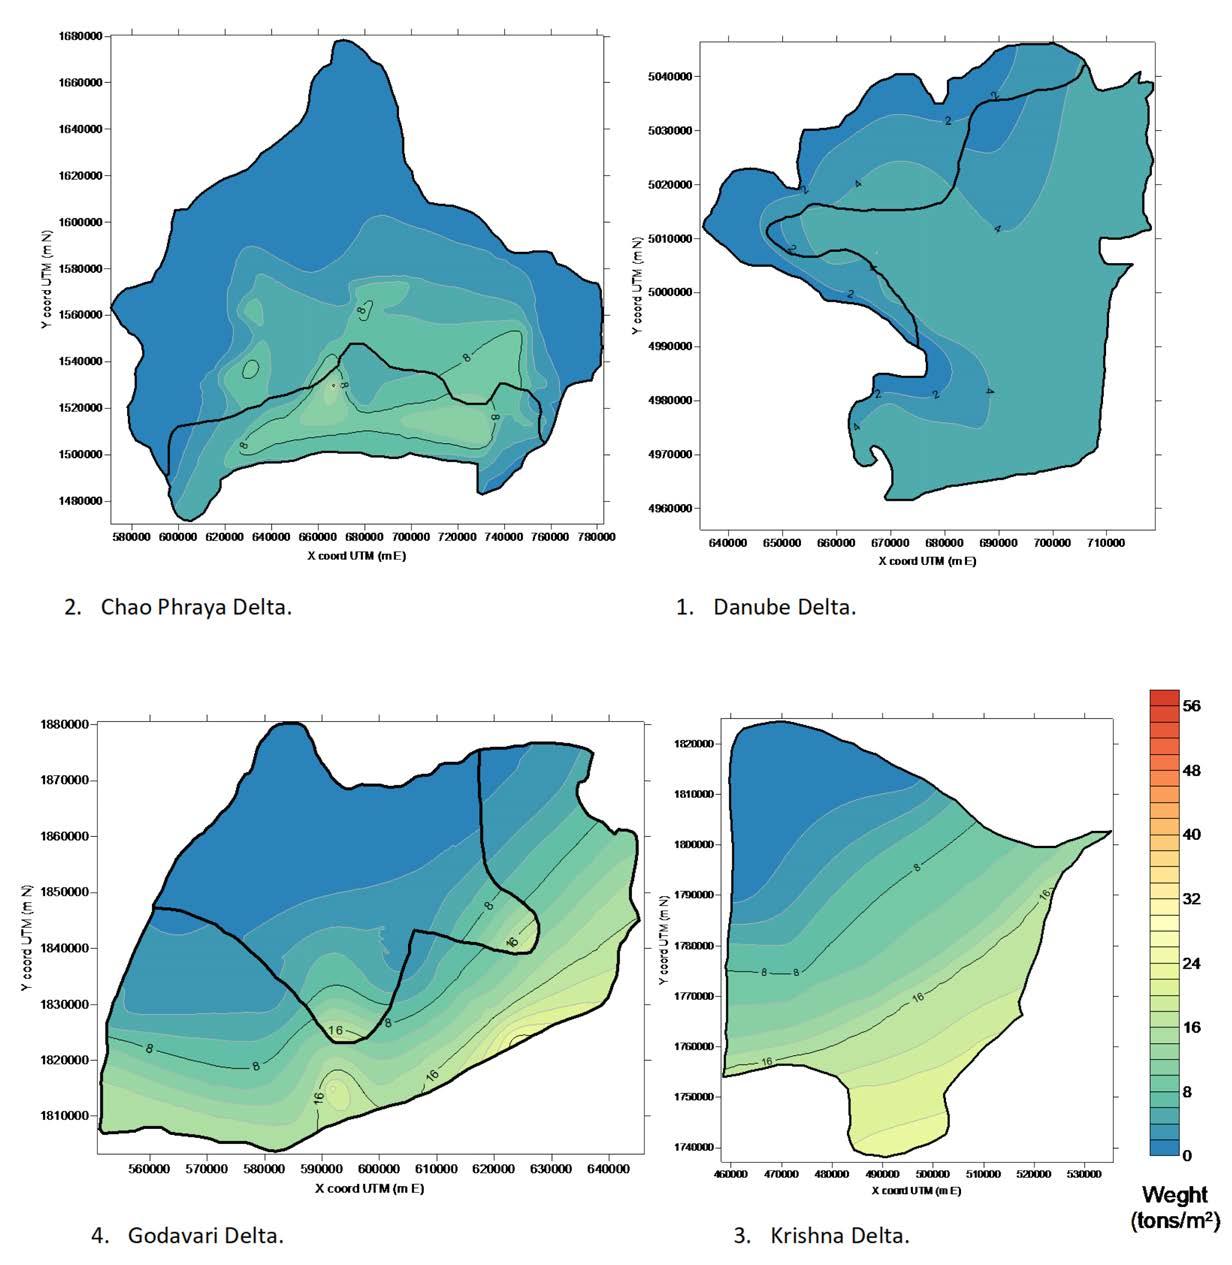
111
1. Chao Phraya Delta.
2. Danube Delta.
3. Godavari Delta.
4. Krishna Delta.
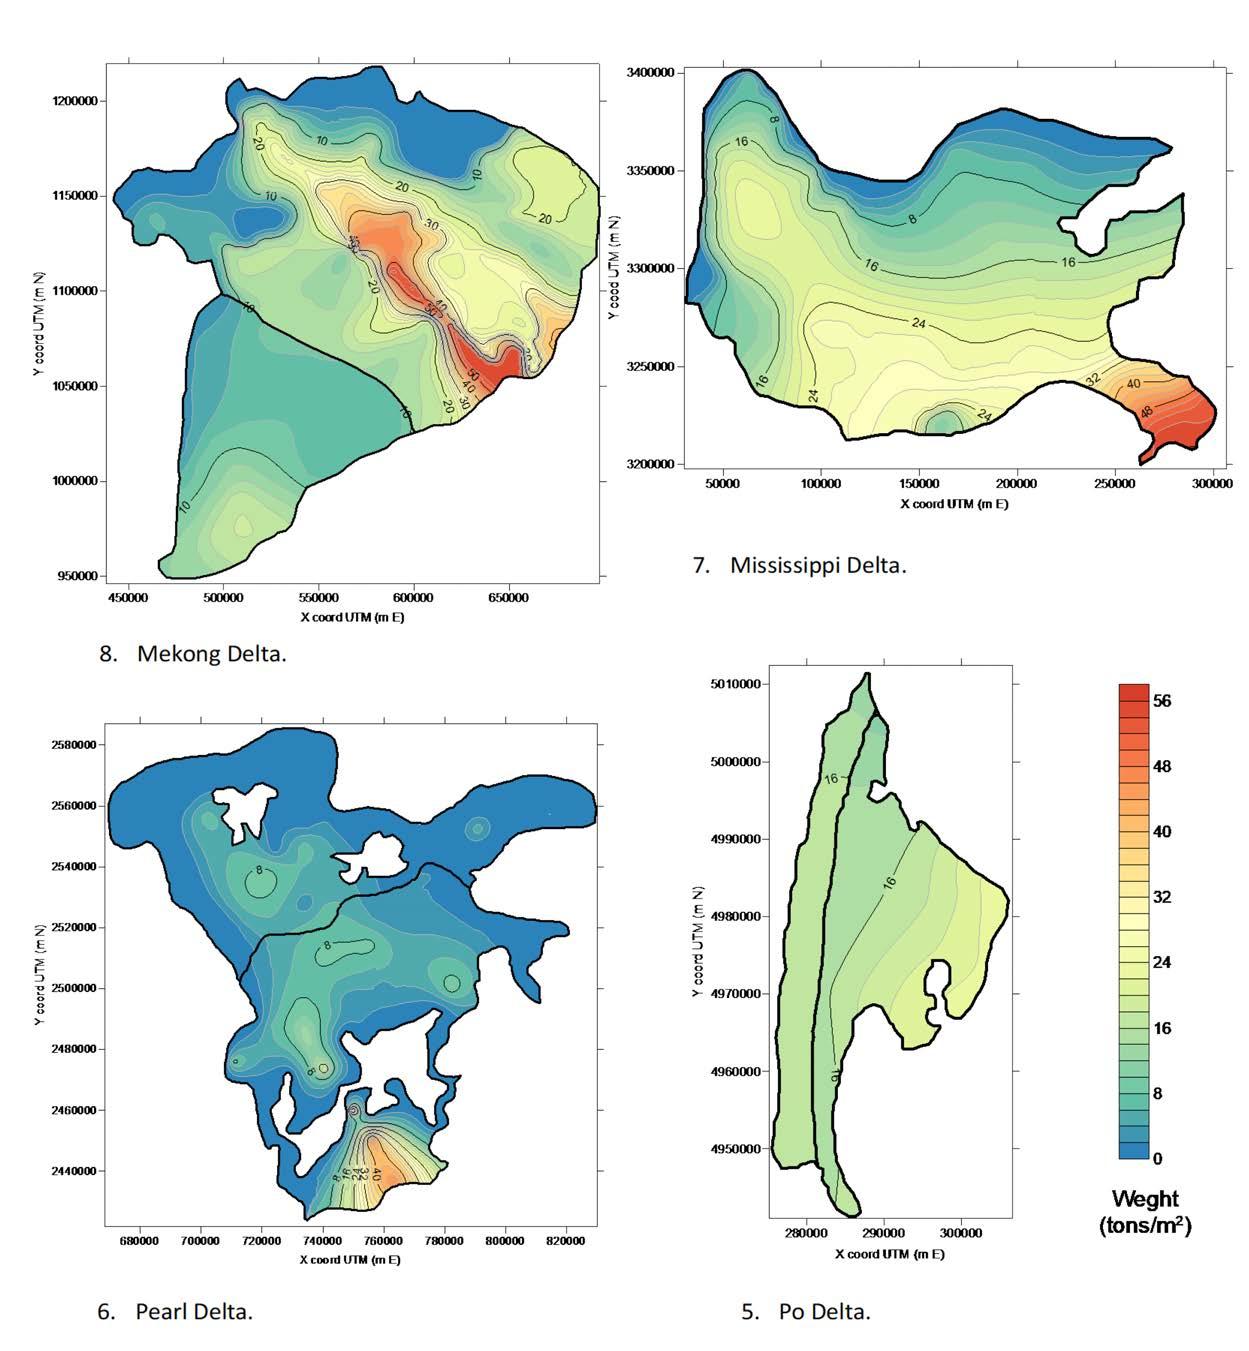
112
5. Mekong Delta.
6. Mississippi Delta.
7. Pearl Delta.
8. Po Delta.
Figure 71: Comparison of the map of sediment weight per unit area (tons/m2) for the 8 studied deltas.
8. Conclusion
The work developed in this thesis has allowed to develop an original methodology to provide a reliable evaluation of the weight of Holocene layer in a delta. The procedure is based on the quantification of how the specific weight of the deposits composing a delta varies with depth and compacts due to the increase of the effective stress. In fact, natural compaction of Holocene sediments strongly influences the subsidence rates and the morphology in the deltaic plain. Nevertheless, quantifying sediment accumulation and natural compaction is not trivial since it requires a deep knowledge of geomechanical properties of soils and information about delta progradation. These data are often difficult to obtain. To overcome this lack of knowledge, the methodology developed in this thesis combines i) specific lithological distributions with ii) maps of Holocene thickness at the delta scale and iii) a database of the main geomechanical properties for the lithotypes generally composing the delta landform derived from the Mississippi delta. A proper 1-D decompaction model is applied to the characteristic stratigraphic succession of the main depositional environments of a delta and then the solution extrapolated over the entire delta scale taking into account the actual thickness of the Holocene deposits. The procedure allows to map on a regular grid the compaction of the Holocene sequence and its sediment weight. Weight of a delta is particularly important to force model aimed at quantifying the sediment isostatic adjustment. The procedure is applied to eight major deltas, namely Chao Phraya, Danube, Godavari, Krishna, Mekong, Mississippi, Pearl, Po. The results are very interesting showing a large variability in compaction and specific weight distribution from case to case depending on complex interrelationships between thickness, compressibility, porosity, and lithostratigraphic variability. We can conclude that natural compaction plays a significant role on the delta environment evolution, with the largest values computed for the Mississippi and Po deltas.
113
The results could be obviously improved. The major improvement could be obtained accounting for the delta stratigraphic variability more precise and with a more specific knowledge of the geomechanical properties of the various deltaic deposits.
114
Allison, M.A., Kepple, E.B., 2001. Modern sediment supply to the lower delta plain of the Ganges-Brahmaputra River in Bangladesh. Geo-Marine letters 21, p. 66-74.
Amorosi, A., Marchi, N., 1999, High-resolution sequence stratigraphy from piezocone tests: an example from the late quaternary deposits of the southeastern Po Plain. Sedimentary Geology 128, p. 67–81.
Aqurawi, A.A.M., 1995. Correction of Holocene sedimentation rates for mechanical compaction: the Tigris-Euphrates Delta, Lower Mesopotamia. Marine and Petroleum Geology, Vol. 12, No. 4, p. 409-416.
Bridgeman, J. G., 2018. Understanding Mississippi delta subsidence through stratigraphic and geotechnical analysis of a continuous Holocene core at a subsidence superstation.
Church, J., Gregory, J.M. 2001. Changes in sea-level. A cura di J. T., Ding, Y., Griggs, D.J., Noguer, M., van der Linden, P.J., Dai, X., Maskell, K., Johnson, C.A. (Eds.) Houghton. Vol. Climate Change 2001: the Scientific Basis. Contribution of Working Group 1 to the Third Assessment Report of the Intergovernmental Panel on Climate Change, Cambridge: Cambridge University Press.
CIESIN (Center for International Earth Science Information Network)(2005) Gridded population of the world version 3 (GPWv3).
Correggiari, A., Cattaneo, A., Trincardi, F., 2005. The modern Po delta system: Lobe switching and asymmetric prodelta growth. Marine Geology 222–223 (2005), p. 49– 74.
Correggiari, A., Roveri, M., Trincardi, F., 1996. Late-Pleistocene and Holocene evolution of the North Adriatic Sea. Il Quaternario. Ital. J. Quat. Sci. 9, p. 697–704.
Day, J. W. Jr., Day, J. W., Boesch, D. F., Clairain, E. J., Kemp, G. P., Laska, S. B., Whigham, F. 2007. Restoration of the Mississippi Delta: Lessons from Hurricanes Katrina and Rita. Science, 315, p. 1679–1684.
115 9. Bibliography
Day, J.W., Pont, D., Hensel, P.F., Ibanez, C. 1995. Impacts of sea-level rise on deltas in the Gulf of Mexico and the Mediterranean: the importance of pulsing events to sustainability. Vol. Estuaries. 18 vol.
DGMV (Department of Geology and Minerals Vietnam). (2004). Report: division stratigraphy Neocene-Quaternary and geological structure research southern delta (Vietnamese).
El Bastawesy, M., Cherif, O.H., Sultan, M., 2016. The geomorphological evidences of subsidence in the Nile Delta: Analysis of high resolution topographic DEM and multi-temporal satellite images, Journal of African Earth Sciences 136 (2017), p. 252-261.
Ericson JP, Vorosmarty CJ, Dingman SL, Ward LG, Meybeck M (2006) Effective sealevel rise and deltas: causes of change and human dimension implications. Glob Planet Chang 50:63–82.
Frances E. Dunn et al., 2019. Environ. Res. Lett. 14 084034.
Gambolati, G., Teatini, P., 1998. Numerical analysis of land subsidence due to natural compaction of the upper Adriatic Sea basin. In: Gambolati, G. (Ed.), CENASCoastiline Evolution of the Upper Adriatic Sea due to Sea Level Rise and Natural and Anthropogenic Land Subsidence. Klwer Acedemic Publ., pp. 103–131.
George, C.F., Macdonald, D.I.M., Spagnolo, M., 2019. Deltaic sedimentary environments in the Niger Delta, Nigeria. Journal of African Earth Sciences 160 (2019) 103592.
Giao, P. H., Thoang, T.T., Nguyen, V. L., & Vu N. H. H. (2014). Geotechnical Characterization of the Subsoil profile Underlying the Land Subsidence
Monitoring Points in Southern Vietnam Delta. Conference: Proc. of the 9th Intl’ Symp. on Lowland Technology “Problems and Remedy measures of Lowland”, p.429-436
116
Giosan, L., Constantinescu, S., Clift, P.D., Tabrez, A.R. Danish, M., Inam, A., 2006. Recemt morphodinamics of the Indus Delta shore and shelf. Cont. Shelf Res. 26, 1668-1684.
Goni, M.A., Monacci, N., Gisewhite, R., Ogston, A., Crockett, J., Nittrouer, C., 2006. Distribution and sources of particulate organic matter in the water column and sediments of the Fly River Delta, Gulf of Papua (Papua New Guinea), Estuarine, Coastal and Shelf Science 69, p. 225-245.
Haq, B.U., 1997. Regional and global oceanographic, climatic and geological factors in coastal zone planning. In: Haq, B.U., Haq, S. M., Kullenber, G., Stel, J.H. (Eds.), Coastal Zone Management Imperative for Maritime Developing Nations. Kluwer Academic Publishers, pp. 55–74.
Hedlund, J., 2015. Transforming delta terrains. Faculty of Landscape Architecture, Horticulture and Crop Production Science Swedish University of Agricultural Sciences, Degree project.
Higgings, S.A., 2015. Review: Advances in delta-subsidence research using satellite methods. Hydrogeol J (2016) 24:587–600.
Higgins S, Overeem I, Steckler MS, Syvitski JPM, Akhter SH (2014) InSAR measurements of compaction and subsidence in the Ganges- Brahmaputra Delta, Bangladesh. J Geophys Res Earth Surf 119(8): 1768–1781
Hoang, T.M., Van Lap, N., Oanh, T.T.K., Jiro, T., 2016. The influence of delta formation mechanism on geothechnical property sequence of the late Pleistocene-Holocene sediments in the Mekong River Delta. Heliyon 2.
Jankowski, K. L., Törnqvist, T. E., & Fernandes, A. M. , 2017. Vulnerability of Louisiana’s coastland wetlands to present-day rates of relative sea-level rise.
Nature Communications, 8.
Jia, Y., Zhang, H., Liu, X., Du, Q., Sun, Q., Yin, P., Shan, H., 2020. Rapid consolidation characteristics of Yellow River-derived sediment: Geothechnical characterization and its implication for the deltaic geomorphic evolution. Engineering Geology 270.
117
Knotters, M., Brus, D.J., Voshaar, J.H. ,1995, A comparison of kriging, co-kriging and kriging combined with regression for spatial interpolation of horizon depth with censored observations, Geoderma, Volume 67, Issues 3–4, p. 227-246.
Kuchar, J., Milne, G., Wolstencroft, M., Love, R., Tarasov, L., & Hijma, M., 2018. The influence of sediment isostatic adjustment on sea level change and land motion along the U.S. Gulf Coast. Journal of Geophysical Research: Solid Earth, 123, 780–796.
McManus, J. 2002. Deltaic responses to changes in river regimes. Marine Chemistry 79, 155-170.
Meckel, T. A., Ten Brink, U. S. & Williams, S. J., 2007. Sediment compaction rates and subsidence in deltaic plains: numerical constraints and stratigraphic influences. Basin Research 19, 19-31.
Milliman, J.D., Broadus, J.M., Gable, F., 1989. Environmental and economic implications of rising sea-level and subsiding deltas: the Nile and Bengal examples. Ambio 18, 340–345.
Nageswara Rao, K., Sadakata, N., Shinde, V., Rajawat, A.S., Ajai, 2010. Subsidence of Holocene sediments in the Godavari delta, India. Front Earth Sci. China 4, 410–416.
Nageswara Rao, K., Saito, Y., Naga Kumar, K.Ch.V., Kubo, S., Pandey, S., Li, Z., Demudu, G., Rajawat, A.S., 2020. Holocene evolution and Anthropocene destruction of the Krishna Delta on the east coast of india: delta lobe shifts, human impacts, and sea level history, Marine Geology 427, p. 106-229.
Nageswara Rao, K., Saito,Y., Nagakumar, K.Ch.V., Demudu, G., Rajawat, A.S., Kubo, S., Li, Z., 2015 Palaeogeography and evolution of the Godavari delta, east coast of India during the Holocene: An example of wave-dominated and fan-delta settings, Palaeogeography, Palaeoclimatology, Palaeoecology, Volume 440, p 213-233.
118
Nittrouer, C.A., Kuehl, S.A., DeMaster D.J., Kowsman, R.O., 1986. The deltaic nature of Amazon shelf sedimentation. Geological Society of America Bulletin, v. 97, p. 444-458.
Nittrouer, C.A., Kuhel, S.A., Figueiredo, A.G., Allison, M.A., Sommerfield, C.K., Rine, J.M., Faria, E.C., Silveira, O.M., 1995. The geological record preserved by Amazon shelf sedimentation. Continental ShelfResearch, Vol. 16, No. 516, p. 817-841.
Palamenghi, L., Schwenk, T., Spiess, V., R.Kudrass, H., 2011. Seismostratigraphic analysis with centennial to decadal time resolution of the sediment sink in the Ganges–Brahmaputra subaqueous delta. Continental Shelf Research, Volume 31, Issue 6, p. 712-730.
Pennington, B.T., Sturt, F., Wilson, P., Rowland, J., Brown, A.G., 2016. The fluvial evolution of the Holocene Nile Delta. Quaternary Science Reviews 170 (2017), p. 212-231.
Pont, D., Day, J.W., Hensel, P., Franquet, E., Torre, F., Rioual, P., Ibanez, C., Coulet, E., 2002. Response scenarios for the deltaic plain of the Rhone in the face of an accelerated rate of sea-level rise with special attention to Salicornia-type environments. Estuaries 25, 337–358.
Poulos, S.E., Collins, M.B., 2002. Fluviate sediment fluxes to the Mediterranean Sea: a quantitative approach and the influence of dams. In: Jones, S.J., Frostick, L.E. (Eds.), Sediment Flux to Basins: Causes, Controls and Consequences. Special Publications, vol. 191. Geological Society, London, pp. 227–245.
Restrepo, J.D., Lòpez, S.A., Morphodynamics of the Pacific and Caribbean deltas of Colombia, South America, 2007. Journal of South American Earth Sciences 25 (2008) 1–21.
Rodolofo, K.S., 1975. The Irrawaddy Delta: tertiary setting and modern offshore sedimentation.
119
Saito, Y., Tanabe., S., Sato, Y., Suzuki, Y., Sinsaku, S., Tiyapairach, S., Chaimanee, N., 2002. Stratigraphy and Holocene eveolution of the mud-dominated Chao Phraya delta, Thailand. Quaternary Science Reviews 22 (2003) 789–807.
Stanley, J.D., Warne, A.G., 1994. Worldwide initiation of Holocene marine deltas by deceleration of sea-level rise. Science 265, 228–231.
Storms, J.E.A., Hoogendoorn, R.M., Dam, R.A.C., Hoitink, A.J.F., Kroonenberg, S.B., 2004. Late-Holocene evolution of the Mahakam delta, East Kalimantan, Indonesia. Sedimentary Geology 180 (2005), p. 149–166.
Syvitski JPM, Kettner AJ, Overeem I, Hutton EWH, Hannon MT, Brakenridge GR, Day J, Vorosmarty C, Saito Y, Giosan L, Nicholls RJ (2009) Sinking deltas due to human activities. Nat Geosci 2:681–686.
Syvitski, J.P.M., 2008, Deltas at risk. Sustainability Science 3, 23-32.
Syvitski, J.P.M., Kettener, A.J., Overeem, I., Giosan, L., Brakenridge, G.R., Hannon, M., Bilham, R., 2014. Anthropocene metamorphosis of the Indus Delta and lower floodplain, Anthropocene 3 (2014), p. 24-35.
Teatini, P., Tosi, L. & Strozzi, T., 2011. Quantitative evidence that compaction of Holocene sediments drives the present land subsidence of the Po Delta, Italy. J. Geophys. Res. - Solid Earth 116, B08407.
Törnqvist, T.E., Wallace, D.J., Storms, J.E.A., Wallinga, J., Dam, R.L., Blaauw, M., Derksen, M.S., Klerks, C.J.W., Meijneken, C., A., S.E.M., 2008. Mississippi Delta subsidence primarily caused by compaction of Holocene strata. Nat. Geosci. 1, 173–176.
Tosi, L., De Franco, R., Biella, G., Teatini, P., Lozej, A., Chiozzotto, B., Giada, M., Rizzetto, F., Claude, C., Mayer, A., Bassan, V., Gasparetto-Stori, G., 2009. Monitoring the saltwater intrusion by time lapse electrical resistivity tomography: The Chioggia test site (Venice Lagoon, Italy), Journal of Applied Geophysics, Volume 69, Issues 3–4, p. 117-130.
120
Vella, C., Fleury, T.J., Raccasi, G., Provansal, M., Sabatier, F. Raccasi, G., Provansal, M., Sabatier, F., Bourcier, M., 2005. Evolution of the Rhône delta plain in the Holocene. Marine Geology 222–223 (2005), p. 235– 265.
Vespremeanu-Stroe, A., Zăinescu, F., Preoteasa, L., Tătui, F., Rotaru, S., Morhange, C., Stoica, M., Hanganu, J., Timar-Gabor, A., Cârdan, I., Piotrowska, N., 2017. Holocene evolution of the Danube delta: An integral reconstruction and a revised chronology, Marine Geology, Volume 388, p. 38-61.
Walsh, J.P., Ridd, P.V., 2009. Process, sediments and stratigraphy of the Fly river delta. Developments in Earth & Environmental Sciences, 9, Chapter 4.
Warne, A.G., Meade, R.H., White, W.A., Guevara, E.H., Gibeaut, J., Smyth, R.C., Aslan, A., Tremblay, T., 2001. Regional controls on geomorphology, hydrology, and ecosystem integrity in the Orinoco Delta, Venezuela. Geomorphology 44 (2002) 273–307.
Wei X, Wu C Y. Holocene delta evolution and sequence stratigraphy of the Pearl River Delta in South China. Sci China Earth Sci, 2011, 54: 1523–1541.
Wei X, Wu C Y., 2011. Holocene delta evolution and sequence stratigraphy of the Pearl River Delta in South China. Sci China Earth Sci, 54, p. 1523–1541.
Wolstencroft, M., Shen, Z., Törnqvist, T. E., Milne, G. A., & Kulp, M. (2014). Understanding subsidence in the Mississippi Delta region due to sediment, ice, and ocean loading: Insights from geophysical modeling. Journal of Geophysical Research: Solid Earth, 119, p. 3838–3856.
Xiqing, C., 1998. Changjian (Yangtze) River Delta, China. River Delta, China Journal of Coastal Research, 14(3), p. 838-858.
Zoccarato, C., Minderhoud, P.S.J., Teatini, P., 2018. The role of sedimentation and natural compaction in a prograding delta: insights from the mega Mekong delta, Vietnam. Scientific Reports, (2018) 8:11437.
Zoccarato, C., Teatini, P., 2017 Numerical simulations of Holocene salt-marsh dynamics under the hypothesis of large soil deformations. Advances in Water Resources 110 (2017) 107–119.
121
Zoccarato, C., Törnqvist, T.E., Teatini, P., Bridgeman, J.G., 2020. A shallow compaction model for Holocene Mississippi Delta sediments. International Association of Hydrological Sciences, 382, p. 565-570.
122

