


Columbus School for Girls’ Science Department’s mission statement begins:
We believe that science is everywhere and for everyone. We want all students to discover that they are scientists and engineers: confident, curious, and capable of analytical and critical thinking.
That conviction led to the creation of the science journal you read today. Mrs. Fries-Gaither, Science Department Chair and Lower School Science Specialist, has been dreaming of a student science journal since she began teaching at CSG 12 years ago. The creation of the Institute for Innovation & Leadership and the partnership with Dr. Nelson, Director of the Center for Science Research & Engineering and Upper School Science Faculty, provided a means to finally make this dream a reality. As co-editors, we hope that this journal shows students that their questions, research, and designs matter. They don’t need to wait until they grow up or learn more to become scientists; they are scientists today.
Students have been involved at every stage of this journal’s creation: naming, creating a logo, submitting articles, and providing constructive feedback and suggestions for revision for their peers. We couldn’t be prouder of their efforts and of this inaugural edition, and we hope you agree!
Until next time, happy inquiring!
Stephanie Nelson Jessica Fries-Gaither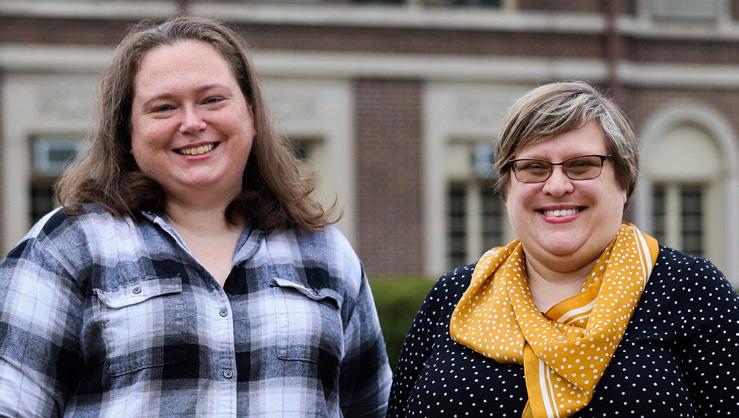


On the cover
VII students explore
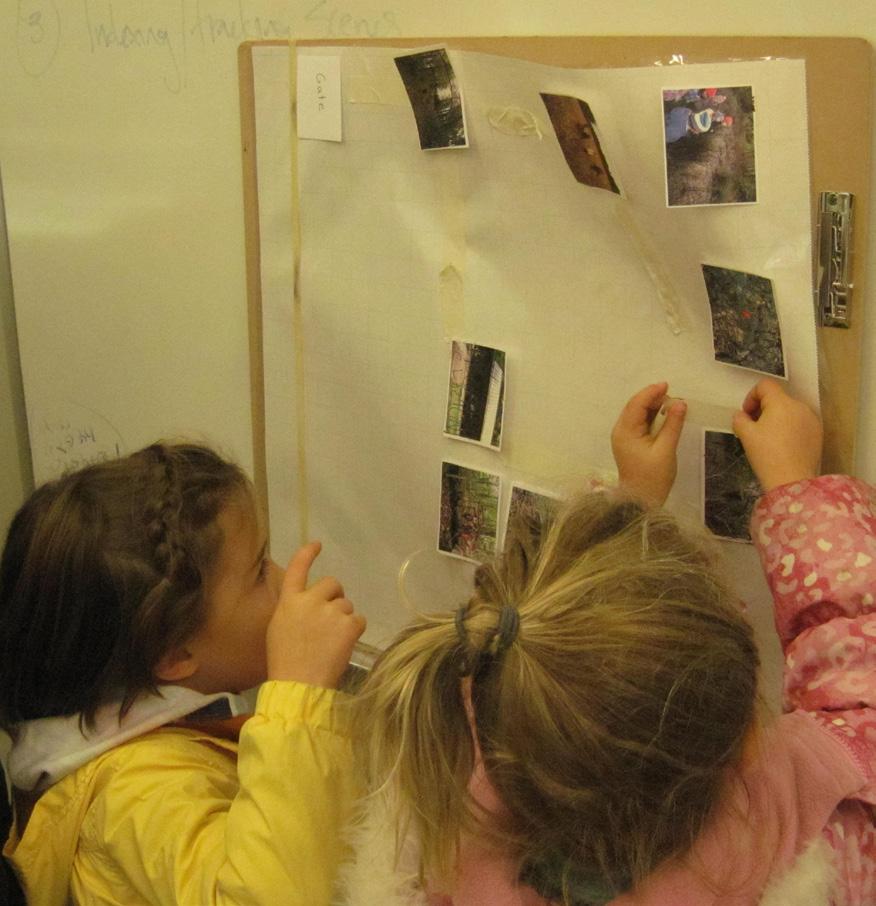
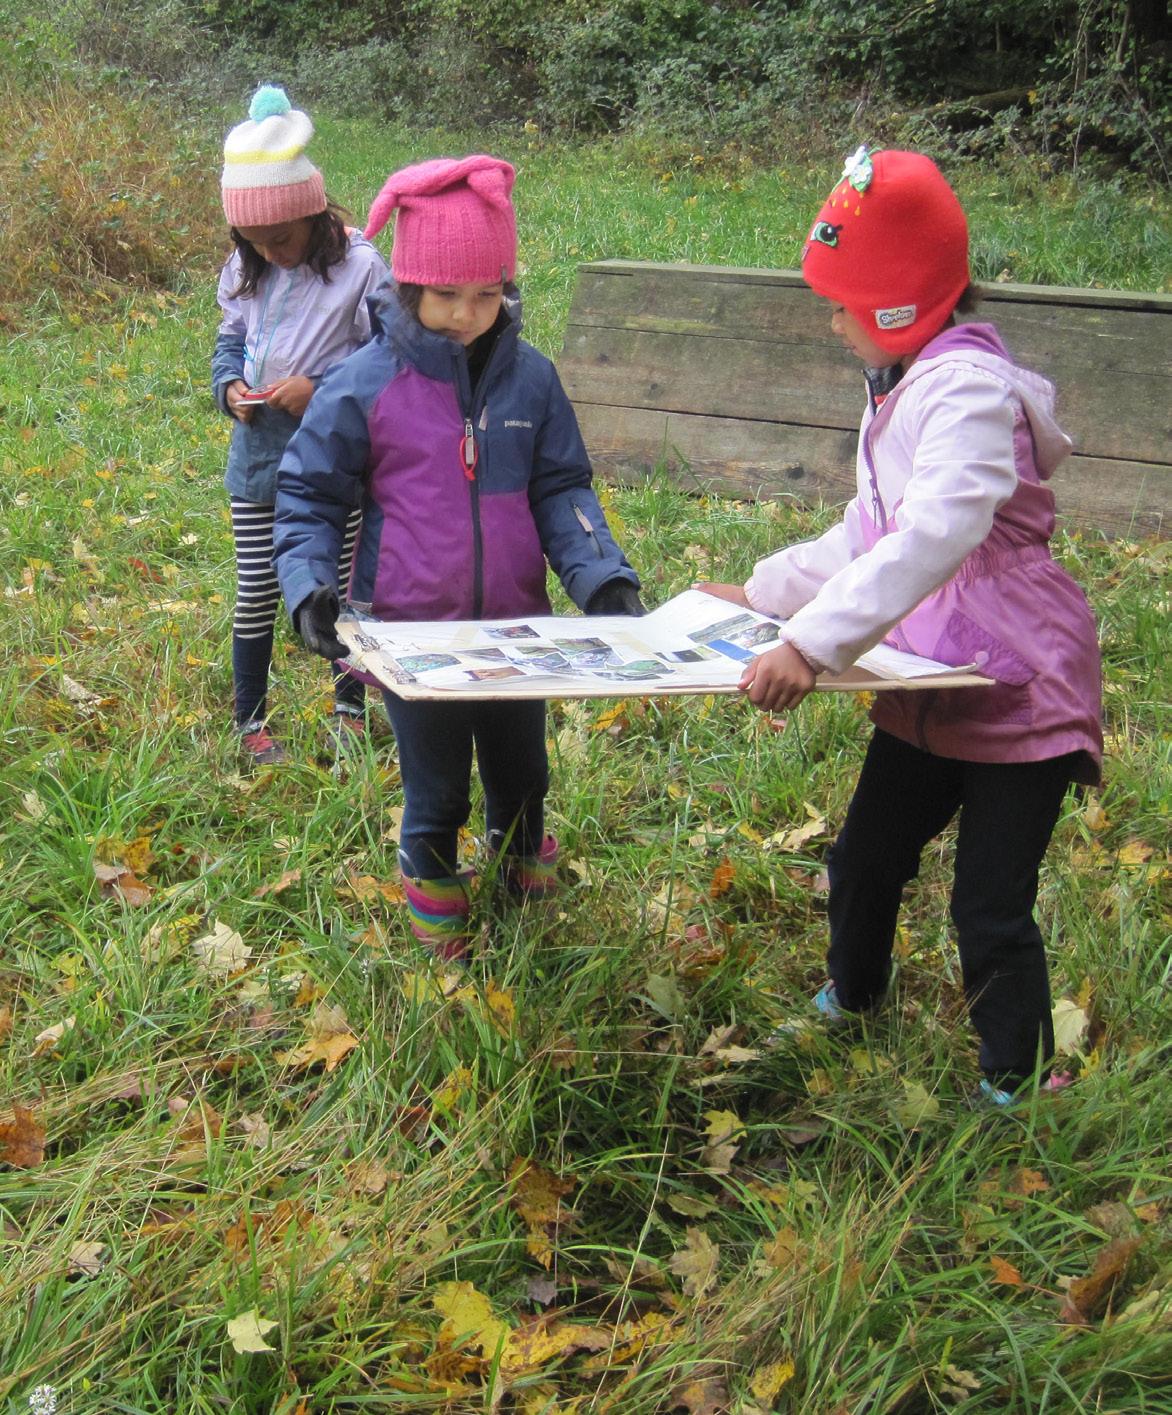
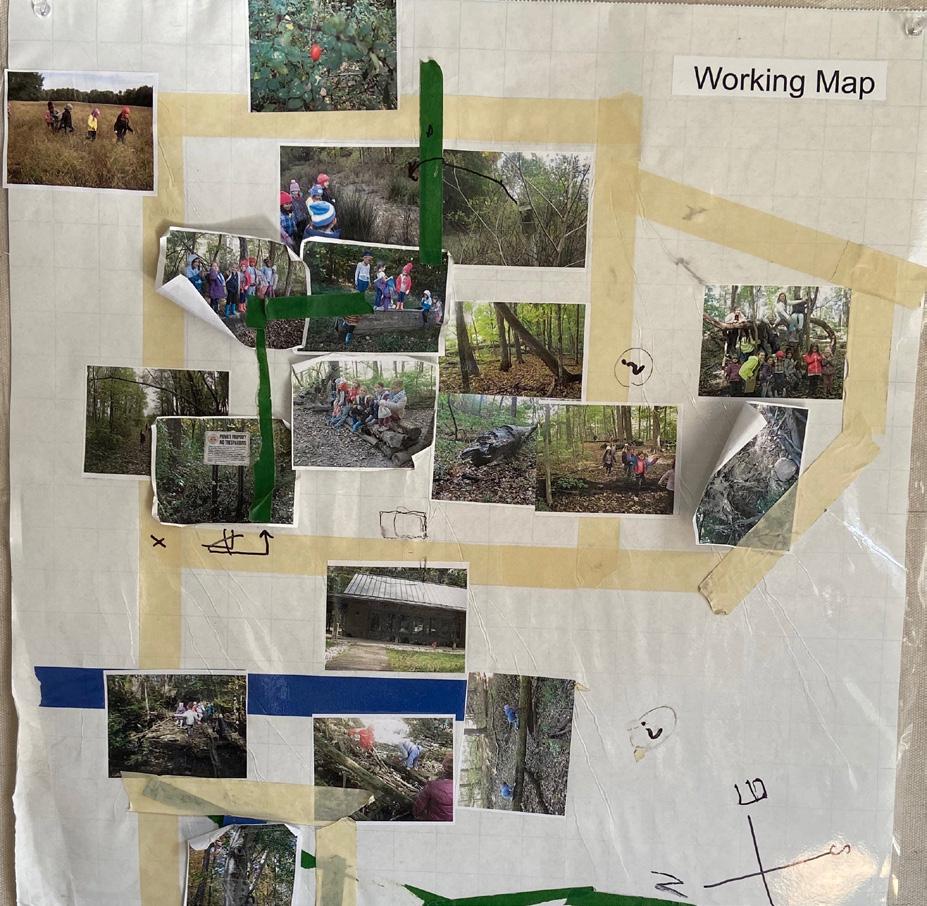
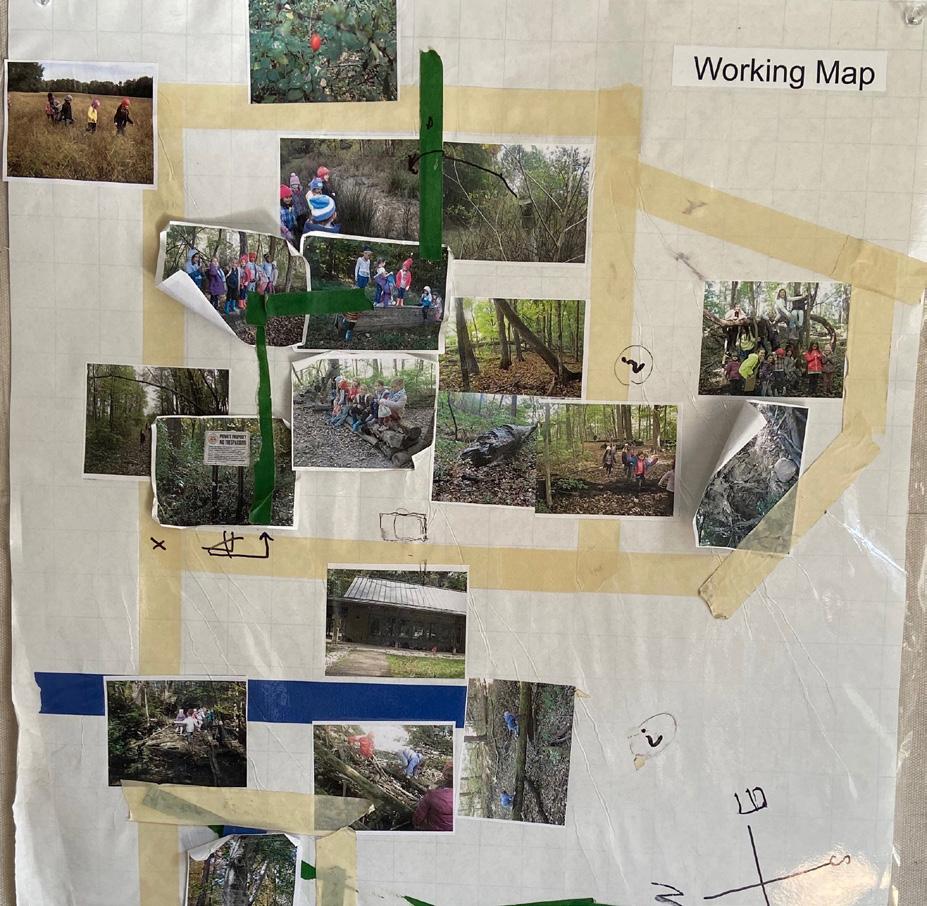
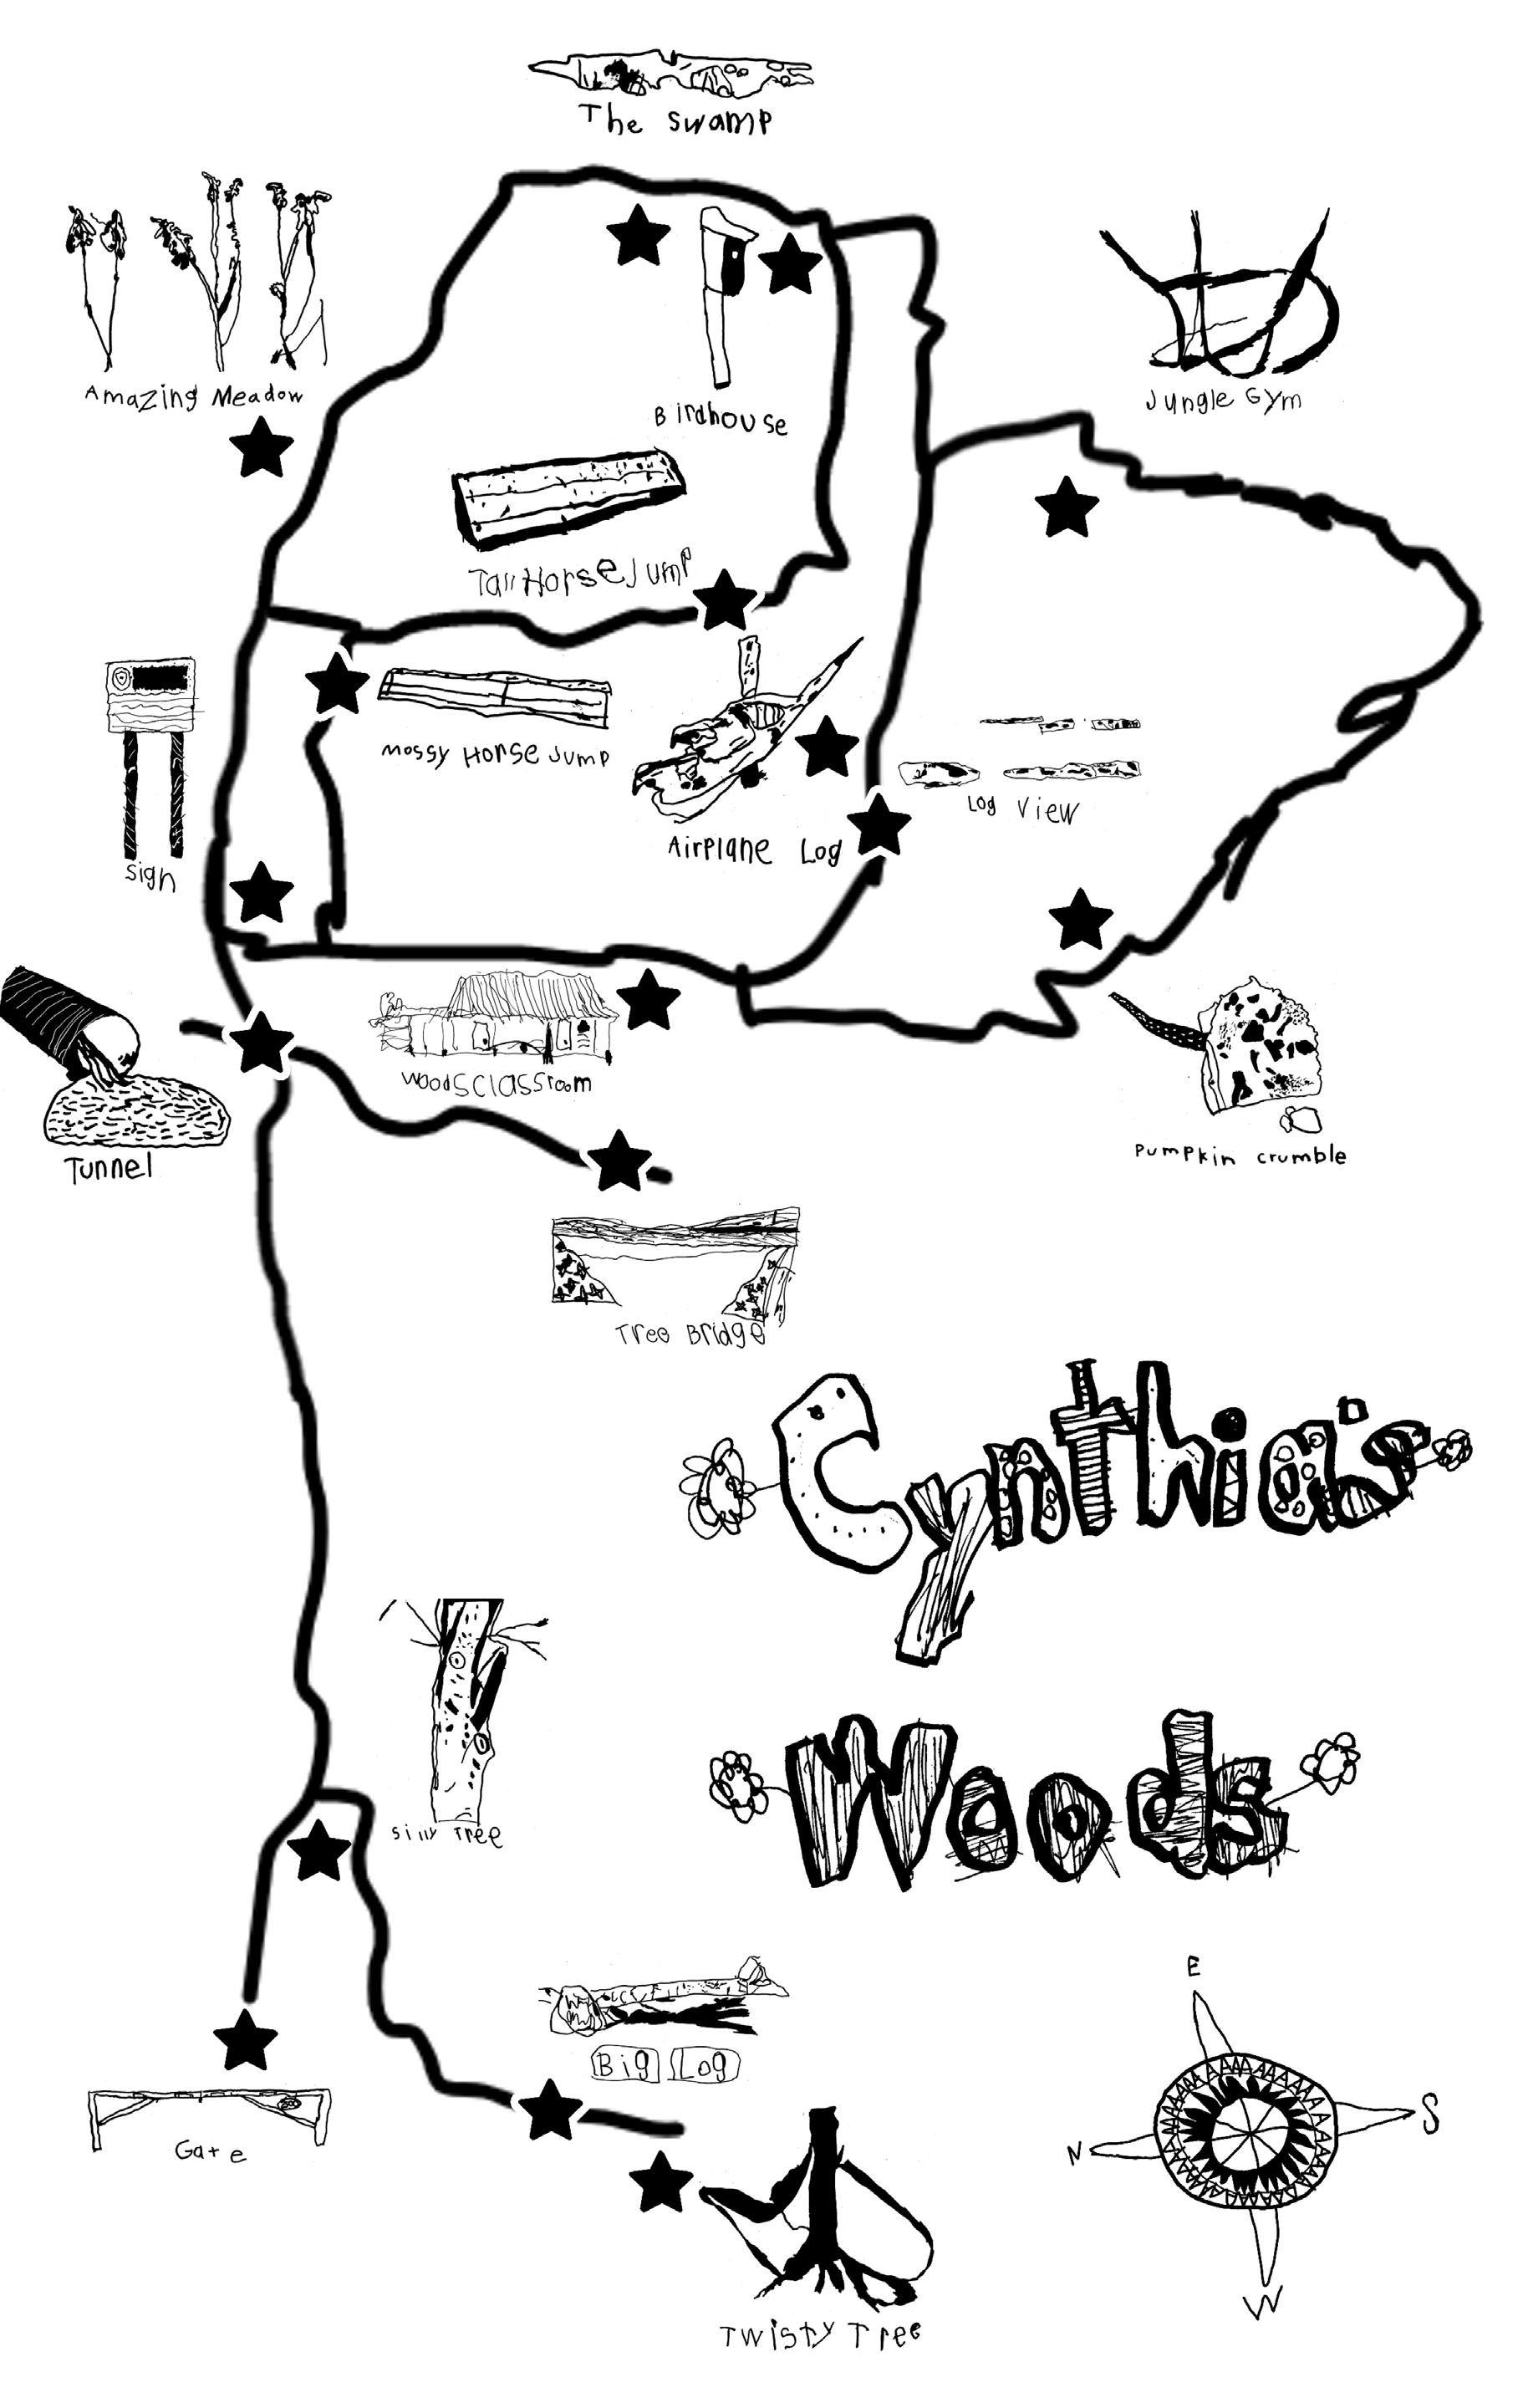
One of the core tenets of the Reggio Emilia approach that CSG employs in the Program for Young Children is a committment to student-directed experiential learning. Starting with a group of three-year-olds who had a fascination with maps, the Cynthia’s Woods mapping project has developed over the last five years into an ongoing kindergarten experience that is added to and updated yearly. Students now spend five consecutive days out in the Woods where they, amongst other activities, use their spatial reasoning, drawing, and observational skills to develop their understanding of navigating unfamiliar landscapes, useful landmarks (and which are not!), and using a compass to aid in orientation. Through an iterative design process these students have created a map of part of our 100-acre natural area that can be used by all members of our community.
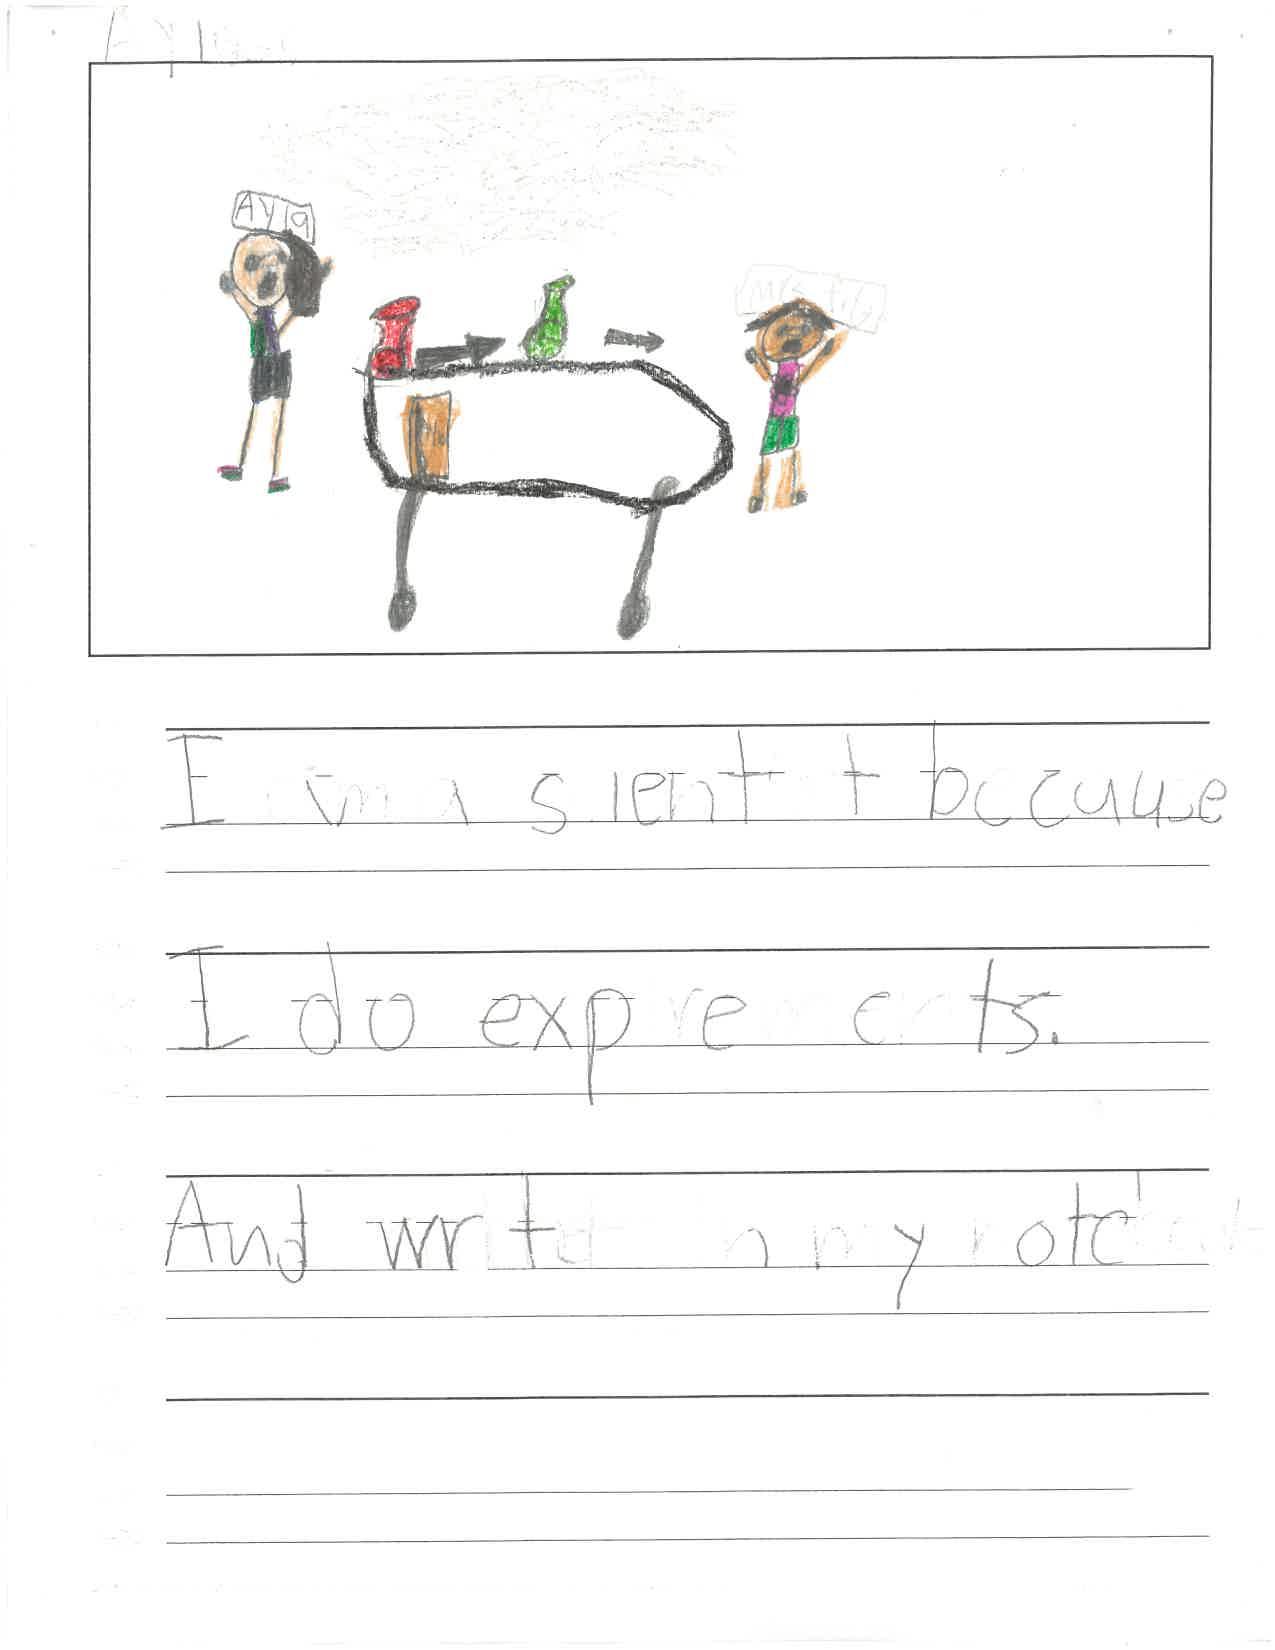

I am a scientist because I do experiments And write in my notebook.
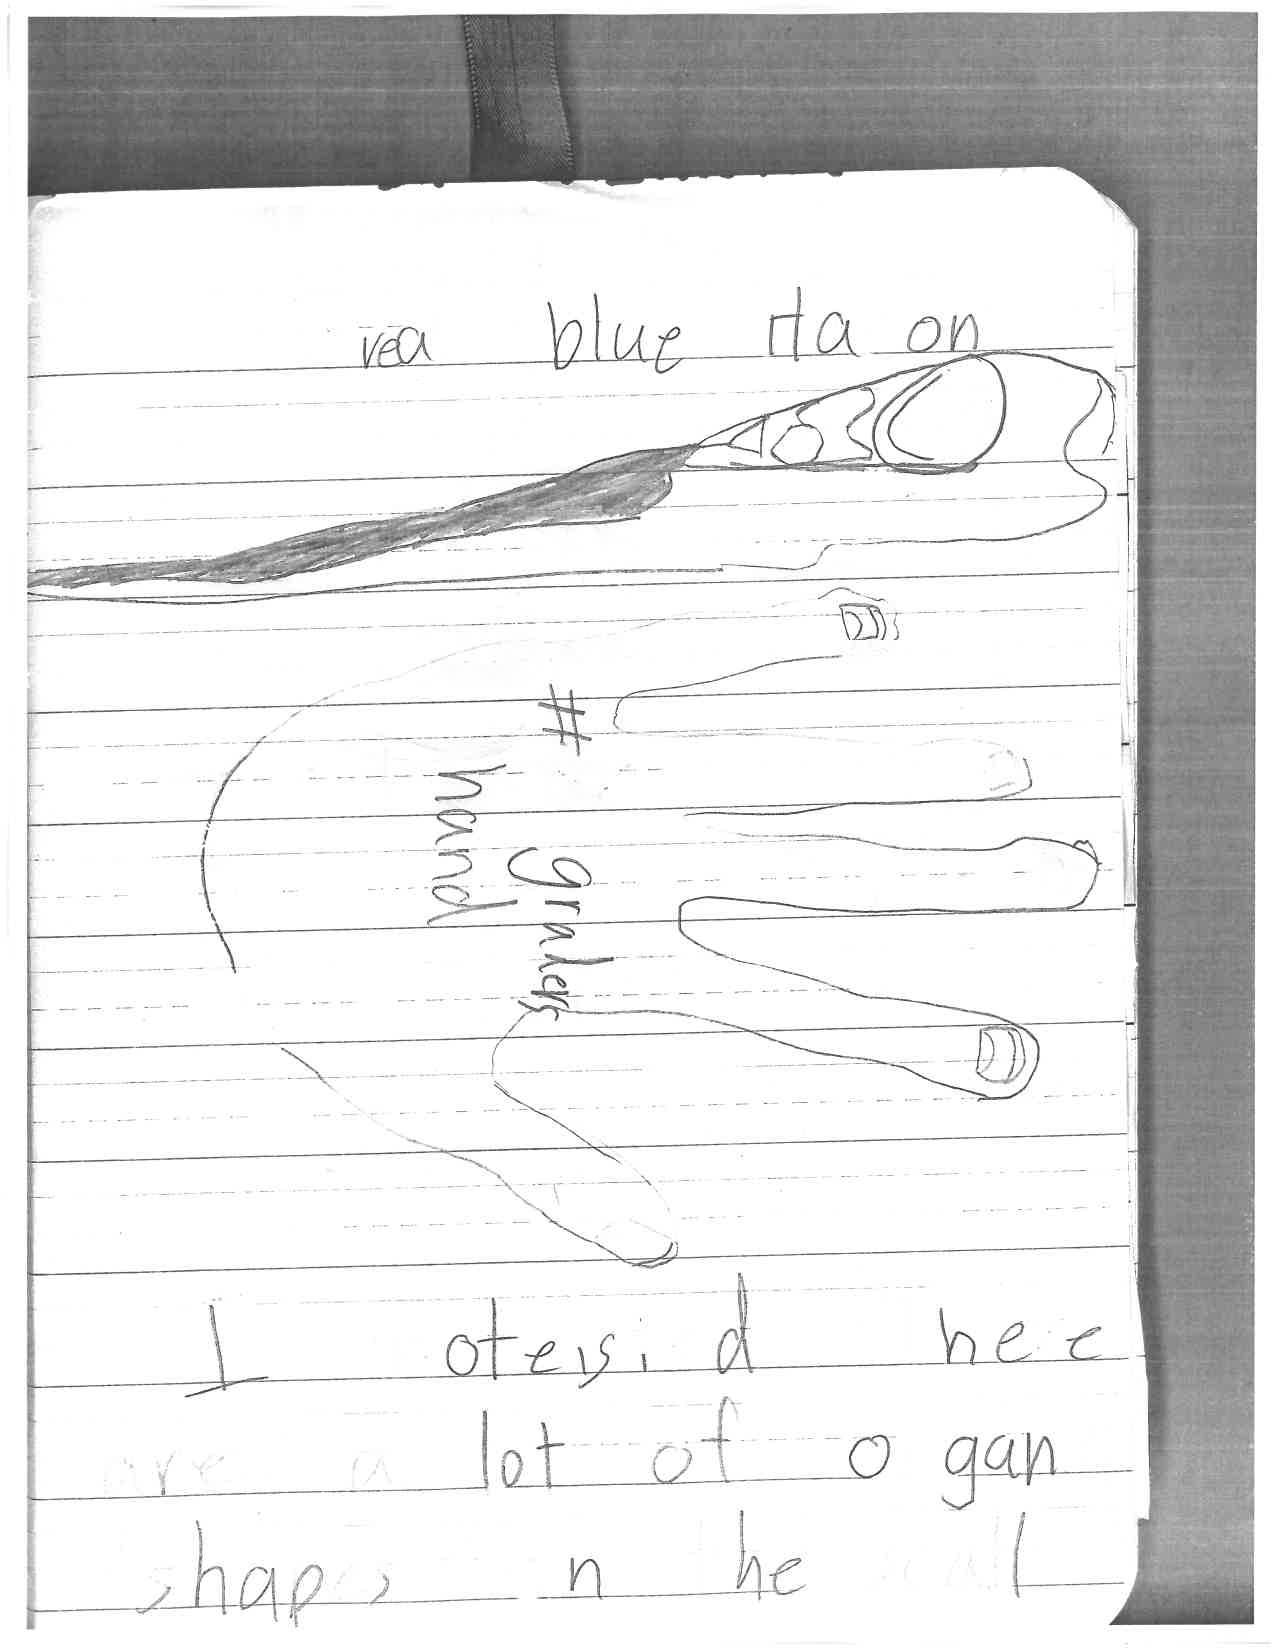
Form I students learned about famous men and women in science as they explored how to use a variety of scientific tools. Then they drew themselves as a scientist and drew upon what they had learned to
I noticed there are a lot of organic shapes on the skull.

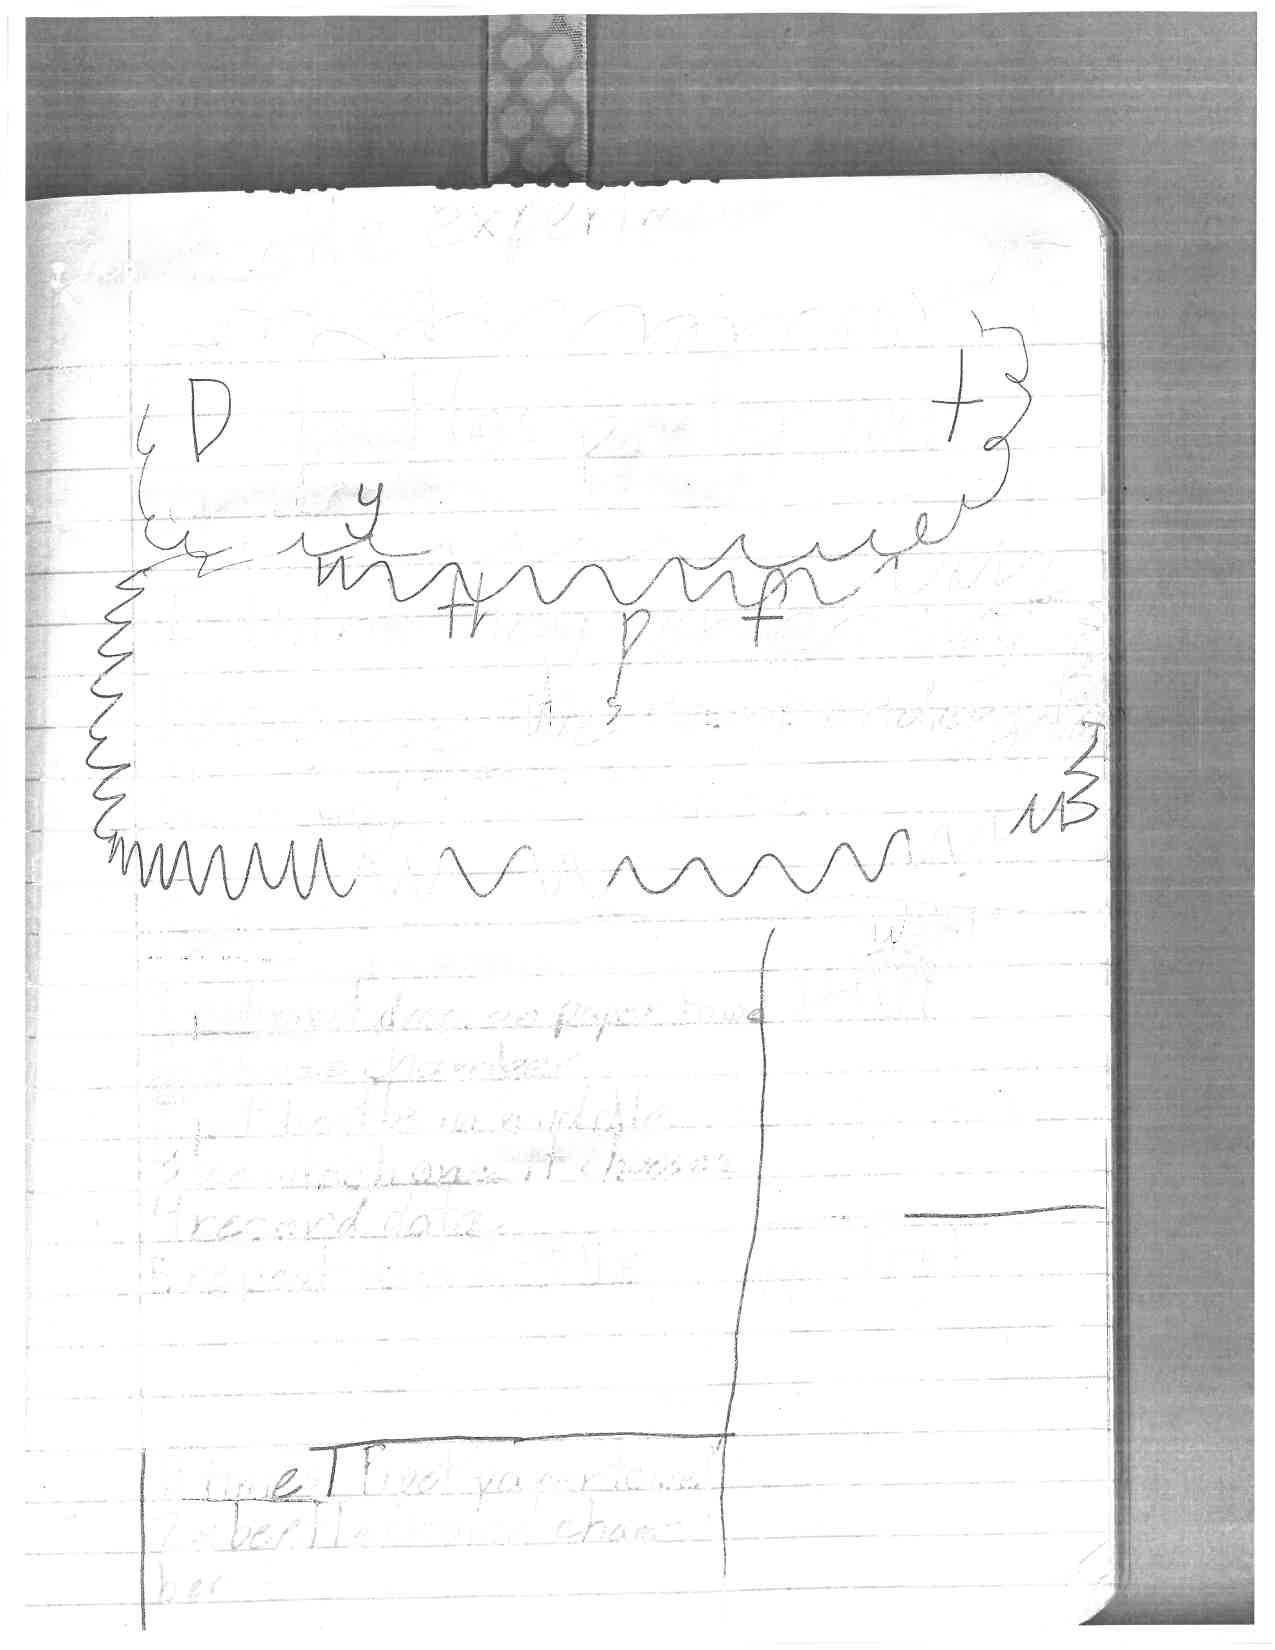
Form III studied darkling beetles throughout their life cycle, from the larval form (mealworm) to the adult beetle. At different stages, students worked collaboratively to plan and conduct their own investigations
Beetle experiment 1/24/24
Do beetles prefer wet or dry?
I think they prefer wet because it is damp underground.
Plan
1 put pipet drops on paper towel in choice chamber
2 put beetle in middle
3 see which one it chooses
4 record data
5 repeat steps 1-4 11x

(materials)
1 times: pipet, paper towel
2x beetle choice chambers
I claim that my beetle preferred wet. My evidence is that it went to wet 7 times and dry 2 times.
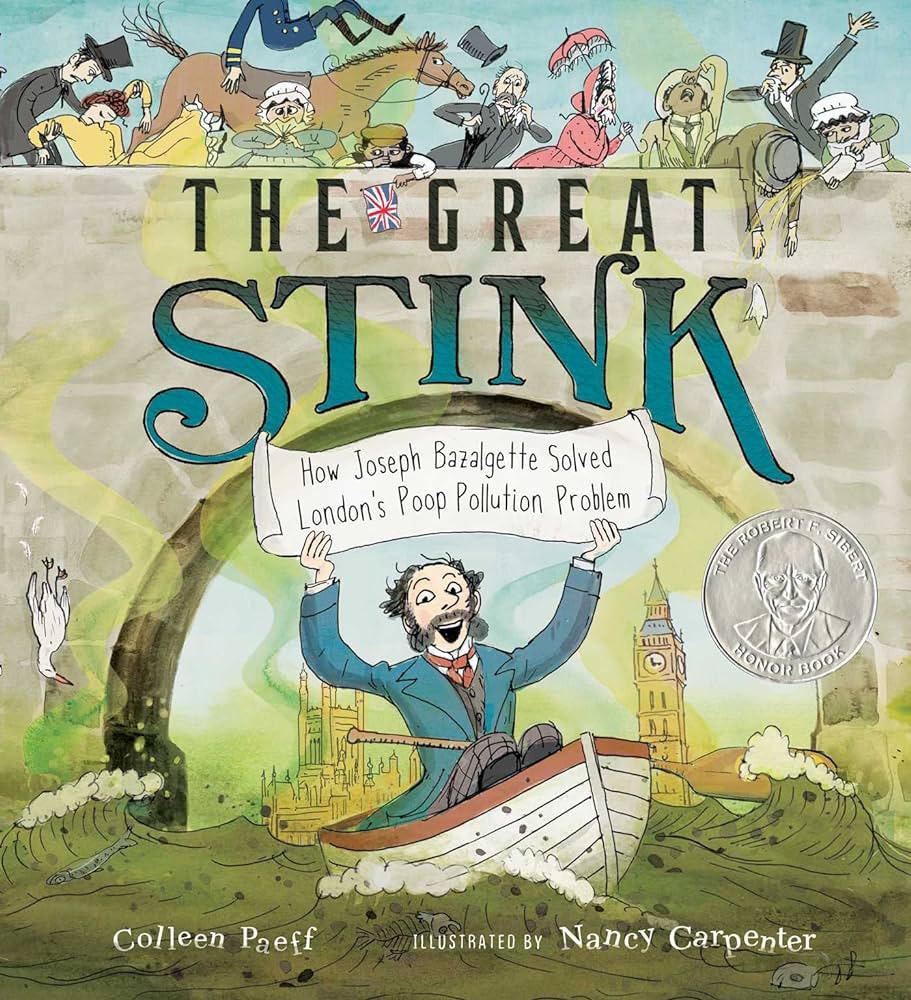
A book review
by Maisie Streeter ’32Pee-ew! What is that smell? POOP! The great stink was a tragic time for extraordinary London 1858. The Great Stink, a nonfiction book, takes place in London before modern plumbing exists. The book begins with a historical retelling of London’s sewer system. People used cesspools in their backyards to dispose of poop and pee by digging holes to put it in. The pee would seep into the soil, and the poop would just sit there and pile up. They hired night soil men to collect the poop to sell to farmers for their soil. This strategy worked for a while, but London’s population kept growing, and so did the poop! All of the bodily wastes would eventually end up in the Thames River. During this time, a disease called cholera plagued London and killed many. But in all this mess, one small boy saw change. Joseph Bazalgette, born a tiny boy, survived multiple cholera outbreaks. As an adult, Joseph wanted to solve London’s poop problem, so he explored the sewers and came up with a plan. Will Joseph get his plan through Parliament? Will London figure out what is really causing cholera, so they can save their citizens?
The Great Stink is an exquisite book to read! The writing in the book is so detailed it is hard to believe it happened less than 200 years ago. Although the story is based on challenging times, the illustrations provide comic relief. This book will have you thinking about the importance of clean water, even today.
H ave you ever wondered what it was like in Nebraska 12 million years ago? What if I told you that barrel bodied rhinos, four-tusked elephants, and saber-toothed deer lived there? Would you believe me? Well, you should! Keep reading to find out about Nebraska and the Ashfall Fossil Beds!
Imagine this: A wide, grass-filled plain, with trees sprouting all around. You hear elephants in the distance, playing with each other. Some rhinos pass by, and the sound of their hooves fills the air. Over to your right some mammals munch on grass. Deer, maybe? They look up, concerned. You turn and see something prowling in the bushes. Ok, what is this place? It’s Nebraska, believe it or not.
Twelve million years ago Nebraska was just like an ancient African savanna because of the climate, the plants, and basically everything except for the animals. Instead of hyenas, there were the bone-crushing beardogs. Instead of the regular deer with two antlers you sometimes see in your backyard, they had three. Those are just some examples of how different the animals were. They still did the usual things. They ate and drank. The only thing to worry about was getting eaten, right? That’s where those animals were horribly wrong.
BAM! A massive eruption happens. Rocks and hot magma shoot everywhere. Ash starts to rain down on the earth. What happened? A supervolcano, that’s what. A supervolcano is like a gigantic chamber underground, filled with lots of hot magma and rocks. The supervolcano slowly fills up until it explodes! Idaho is where the eruption happened, so how could it affect our animals in Nebraska? Well, it wasn’t the supervolcano that destroyed the land, it was the ash that destroyed the animals.
How can the ash get there, and how can the ash destroy the animals? Tons of ash was blown east by the wind. The larger chunks fell first covering anything and everything in their path, while the smaller pieces, which were lighter, stayed airborne longer. The ash that traveled all that way is no regular ash. This ash is like tiny glass shards scratching at the insides of your lungs. The animals breathed in all the ash as it floated down, and the smaller animals, like birds and lizards, died first. Then larger reptiles died. After them it was the animals like camels and horses. And at the very end, the rhinos died.
The first step to learning all this information is finding the evidence. In this case, the evidence is fossils. The fossils were first discovered in 1971 by a paleontologist named Michael Voorhies. He discovered the first fossil, a skeleton of a baby rhino, after heavy rainfall had exposed it.
How do the fossils that Michael Voorhies and his team uncovered tell us the story of the deaths of all these animals? Well, the way the animals fossils were layered in the ash tell us a lot. The smallest ones were layered at the bottom, and the largest ones were at the top. The smallest animals died first because their lungs were small and fragile.Then the larger animals died. And then finally, after all those animals, the rhinos.
Why did the rhinos die last, though? The animals like horses and camels were around the same size as rhinos. The explanation is pretty simple. There are browsers and grazers. Browsers are animals that eat off trees and bushes, and grazers are animals that eat grass and flowers off the ground. Horses and camels are grazers, so they inhaled and ate more of that glassy, lung-destroying ash. How? They ate and inhaled more grass because, unlike browsers, they can’t sweep all the dust off, and even if they could, it would just land on top of their other food. Also, when they bend down to enjoy their meal, they immediately suck ash up their nose. So, does that mean the rhinos are browsers? You guessed right! The rhinos could sweep the dust off the bushes without inhaling too much ash, though they only live a few weeks longer than the grazing animals.
When people found the fossils, they were in almost perfect condition. The weird thing is though, the fossils weren’t created by water. Fossils are usually created by water because the minerals in the water are used to fill porous spaces and take the shape of the body. Well, as the animal’s body laid in the ash layers and the carcass started rotting, the dense ash did the job the water minerals would do.
This was just a glimpse of Nebraska a long long time ago, and there is still so much more that we don’t know. Maybe you will be the one to figure it out.
Stevens, A.P. (2021). Rhinos in Nebraska
There once was an ancient type of rhinoceros that had a large horn and may have been the basis for unicorn myths that exist today. Elasmotherium sibiricum is more commonly known as the “Siberian unicorn” because of the large horn on its forehead. Scientists thought that it went extinct 100,000-200,000 years ago, but a new study tells us that they actually died out 39,000 years ago. This means that the Siberian unicorn time overlapped with the time of Neanderthals and early humans.
The Siberian unicorn was a strange animal. It weighed about 3.5 tons! Despite its massive size, it was very fast. It lived on grassy plains in Africa, Eurasia, and North America, and it was a grazing animal. Its teeth show that it ate mostly grasses. The horn on its forehead was massive and it was probably used to defend itself, attract mates, or find food. It is the largest horn of any known rhinoceros species. We do not know why the Siberian unicorn became extinct. The most likely reason was climate change.
Legends of unicorns have existed for ages. Maybe they started because of the Siberian unicorn! There is a bronze vessel from ancient China that is shaped like the Siberian unicorn. It looks similar to cave paintings of unicorns from the past. In fact, the word for unicorn in the Arabo-Persian language combines rhinoceros with unicorn.
Kosintev, P., et al. (2019). Evolution and extinction of the giant rhinoceros Elasmotherium sibiricum sheds light on late Quaternary megafaunal extinctions.
Katz, B. (2018). Modern humans emerged as ancient ‘Siberian Unicorns’ died out—but their demise wasn’t our fault.
Parkes, V. (2017). The Last of the Siberian Unicorns: What Happened to the Beasts of Legend?
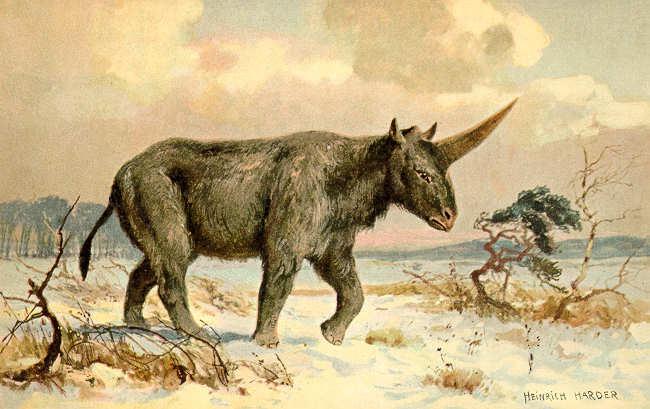

◀ Bogdanov. (2006). Elasmotherium sibiricum. Paleontologists’ understanding and predictions of what Elasmotherium sibiricum probably looked like have changed dramatically over the past 100 years. The current accepted set of characteristics, including wooly fur and a more “hunched” look to the shoulders, is based on additional fossil finds, reconstructions of other contemporary species, and the anatomy of modern relatives.
What was the cleanest place to eat in my house?
There is a world of living creatures that are so small you can’t see them with just your eyes. They are called microbes and they are everywhere. They can be found on objects, plants, hands, and they can even live in the bodies of humans and animals. The most common types of microbes are bacteria, viruses, and fungi.
Microscopes help scientists see microbes. Scientists can also see bacteria and fungi by growing them on a nutrient-rich material called agar. The agar is usually placed in a circular covered plate called a petri dish. A colony is a group of bacteria, fungi, or other microbes that have grown on the agar in the petri dish. Scientists can determine what type of microbe is growing by looking at the colony size, shape, color, and also by examining the growth under a microscope.
1. Gather your materials
2. Label each petri dish that we plan to swab. EX: Plate, Toilet, Cell Phone, Hand (washed), Hand (unwashed), cutting board, table, and floor.
3. Wash hands with soap and water.
4. Using one petri dish at a time, swab an item noted above, then gently swab the agar in the petri dish in a “Z” fashion. Turn the agar plate 90 degrees and using the same swab, apply it again in a “Z” fashion.
5. Tape the petri dish on opposite sides.
6. Repeat above steps to all the label petri dishes.
7. Put all the petri dishes in a shoe box.
8. Put the shoe box in a warm area around 70 to 80 degrees.
9. If you can’t find a warm spot, cover the shoe box with multiple blankets .
10. Monitor the petri dishes and collect data from Day 3, Day 5, Day 7, and Day 10.
11. Take pictures of each petri dish and record the growth results.
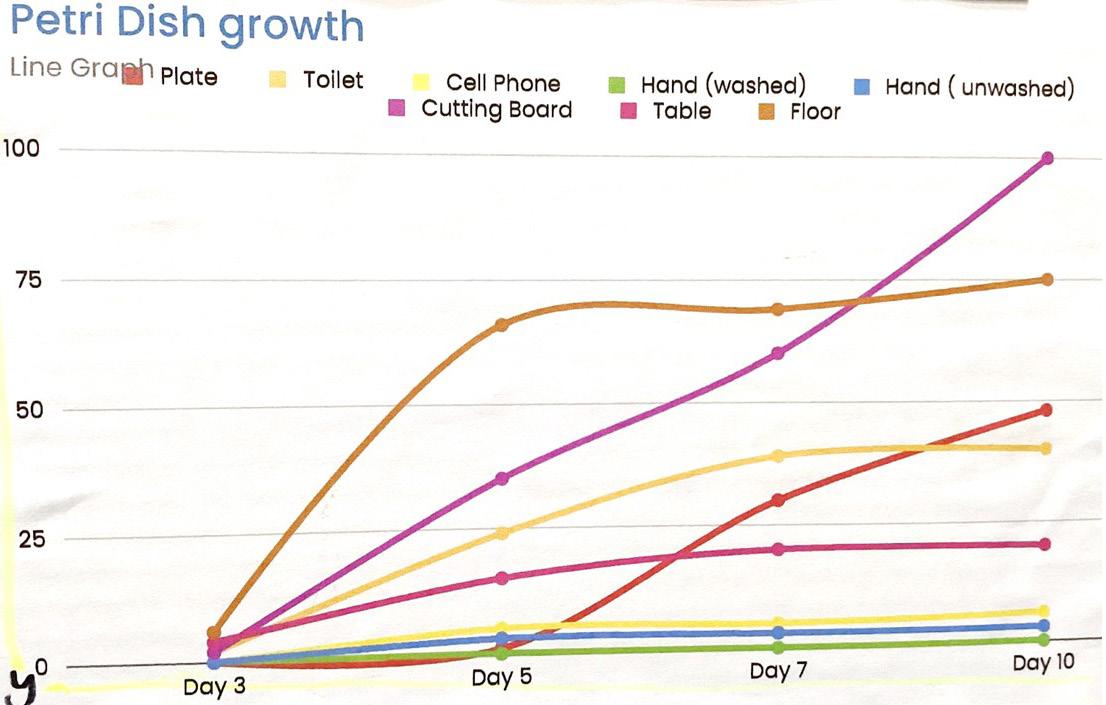
When recording samples from different places in my house for ten days, I predict that the plate from the cupboard will have the least microbe growth since it is regularly washed and I predict the floor will have the most microbe growth since many people walk on it with their dirty shoes and feet.
8 premade petri dishes with agar
8 sterile swabs Tape
Sharpie Paper Blankets Camera
Shoe box (and blankets if we don’t have a warm place to store petri dish)
I found that the cutting board is the dirtiest. The cutting board is the dirtiest because there were a lot of tiny bacteria and over one hundred colonies on the sample. I also found that the sample that tested the microbe growth of washed hands was the cleanest since there was no bacteria growth throughout the entire study.
We heard that many people make batteries out of lemons and potatoes. We started to wonder if other things like limes and oranges could be batteries, too.
Our prediction was that the lime was not going to be as good of a battery because we thought limes were less acidic than oranges. We thought oranges would work better because they are bigger.
2 limes (tops sliced off)
2 oranges (tops sliced off)
2 copper strips
2 magnesium strips
One yellow wire with alligator clips
One clock with two wires coming out Timer
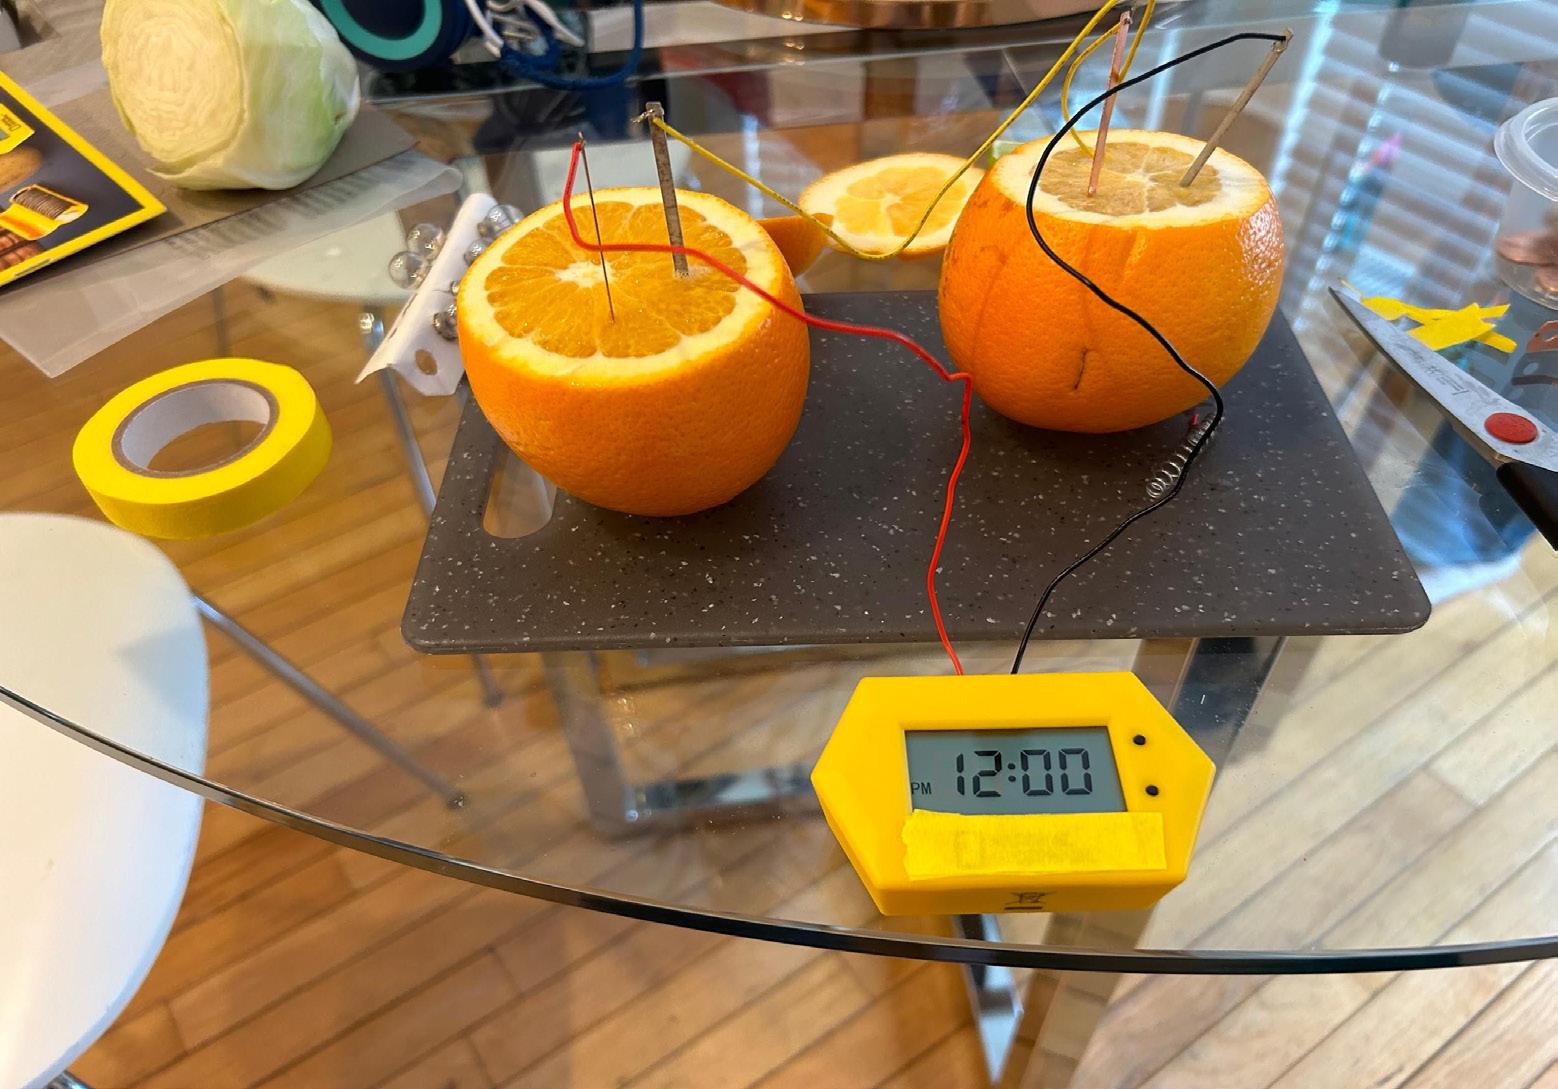
First, we stuck one copper and one magnesium strip into each orange/lime. Next, we connected one set of the copper and magnesium strips with the yellow wire. Finally, the other two strips (one magnesium and one copper), were connected with the wires of the clock (one black and one red). The copper strip was connected to the red wire, and the magnesium strip was connected to the black wire. We timed how long the clock display stayed on without flickering or turning off.
In our first attempt, we couldn’t get the clock to work at all. Our alligator clips were broken because the wires had come out. We learned that we needed to have a closed circuit for the experiment to work. A closed circuit can’t have any breaks or loose wires.
Our second attempt worked better. The orange was steady and calm. It made it through one minute without turning off or flickering. The lime was the hardest one to get to work, and it only lasted 30 seconds and was not steady. Something weird happened with the limes, though: the magnesium strip had a fascinating chemical reaction that made it foam.
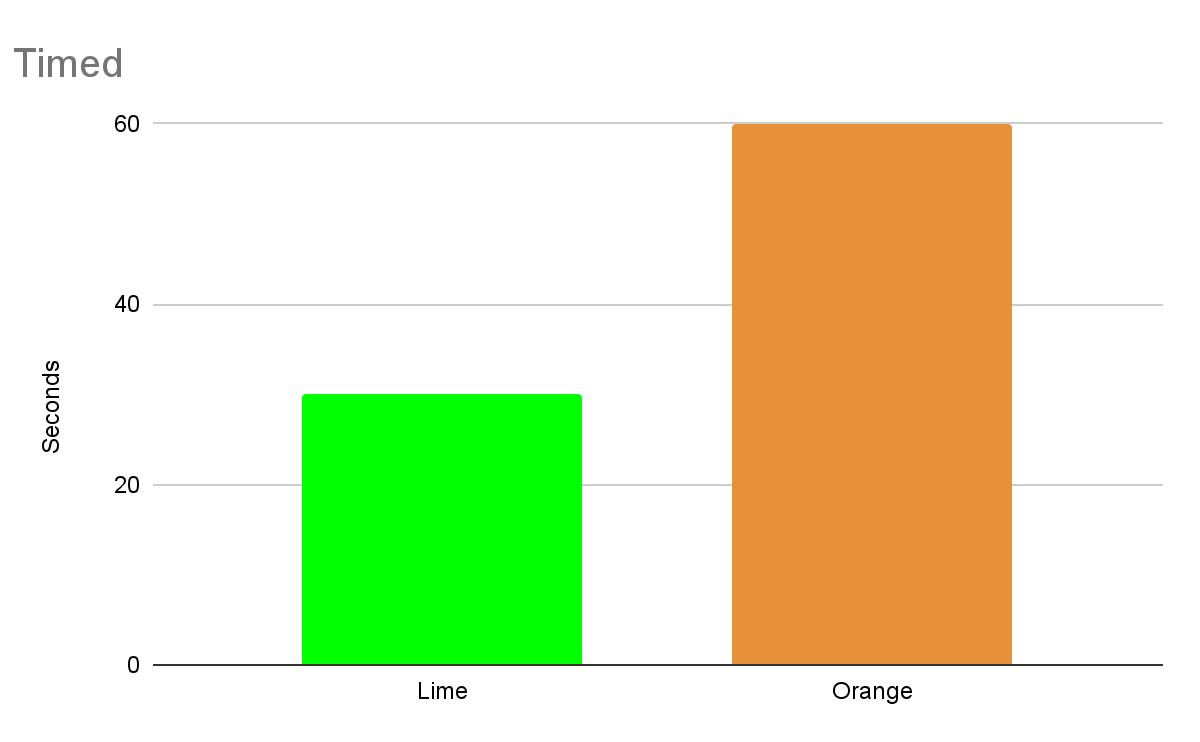
In conclusion, both oranges and limes can be batteries, but oranges are better batteries than limes but still they do not last a long time. So we recommend using lemons if you need to make a battery.
The question in this experiment is which skincare products will work best in keeping skin from drying out. I wanted to answer this question because I really enjoy doing skincare and wondered if I could just use Vaseline instead of buying expensive products.
Of the three skincare products (Vaseline, Bubble Skincare, Byoma), I feel like Vaseline will be the best. Even though the look of Vaseline might not be appealing, it’s been around the longest which in my opinion means it’s more advanced. There’s been more time to test and revise.
Food scale
3 makeup/petri dishes
Jell-O
Wooden mixing spoon
Mixing bowl
Black pen
Measuring cup (½ cup size)
Skincare products: Bubble skincare
Vaseline
Byoma
1. Make Jell-O following the directions on the package.
2. Pour equal amounts in petri dishes.
3. Let cool.
4. Weigh Jell-O and petri dish.
5. Add 3 grams of skincare product to each petri dish. I melted the Vaseline in the microwave because it was too thick to apply.
6. Weigh petri dishes after 7 hours and again after 24 hours to measure how much water evaporated.
I observed when I was adding the products to the Jell-O that Vaseline was thicker than any of the other ones. Also, with Vaseline we had to melt some of it because it was too thick to apply. With the Bubble I saw that it was smooth to apply. Bubble kind of reminded me of hotel shampoo. Byoma was like Bubble, just a tad bit less colored. After 5 hours of letting the skincare sit on top of the Jell-O at room temperature, I saw that all the skincare products looked like nothing changed. The only noticeable change was with the Vaseline you could not see it that much anymore. With Byoma the skincare looked like it was still laying on top of the skin. Bubble it looked like the Jell-O absorbed it a little bit.
I claim that Byoma allowed the most evaporation of water out of the Jell-O. My evidence is that after 24 hours, Byoma’s weight changed from 573 grams to 570 grams.
I claim that Vaseline and Bubble allowed the least evaporation of water out of the Jell-O. My evidence is that after 24 hours, both Vaseline and Bubble’s weight changed from 573 grams to 571 grams.
Vaseline and Bubble allowed the least evaporation. Also it is true that Vaseline is just as good as any skincare.
The Skinny on Moisturizers: Which Works Best to Keep Skin Moist? https://shorturl.at/BEJOY
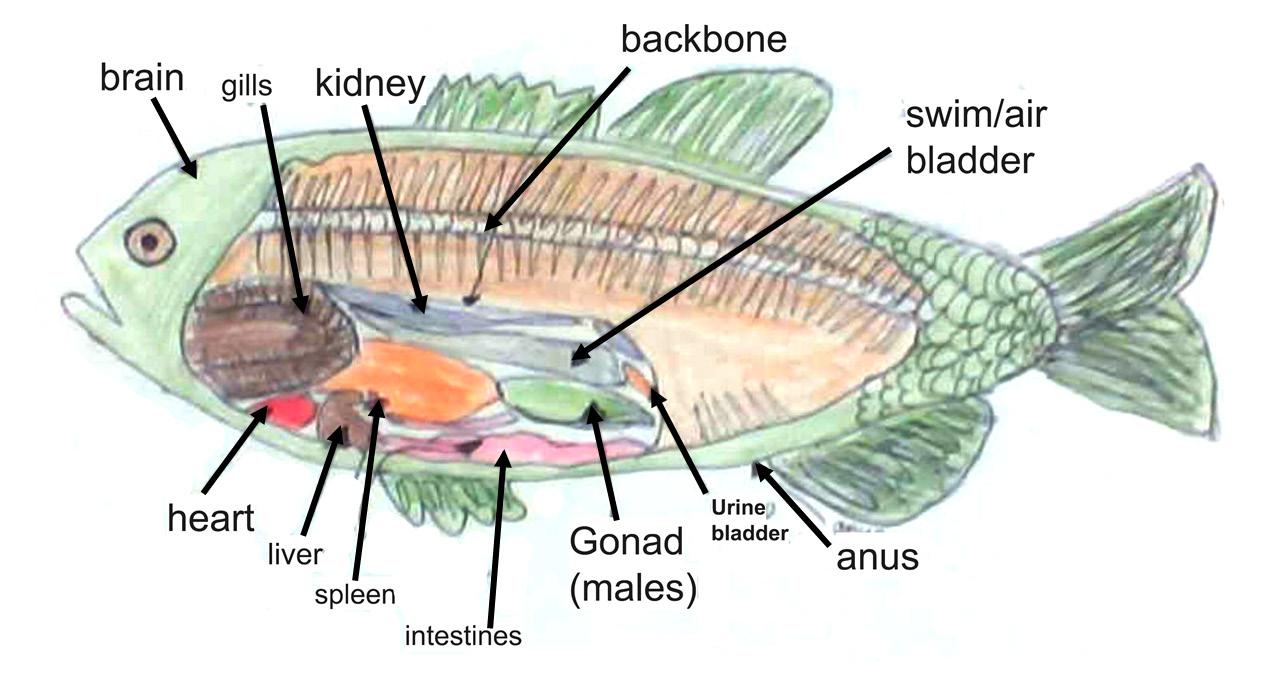
This is a drawing of the internal anatomy of a fish that I created on September 21, 2023 as part of a homework assignment. For making this drawing, I used colored pencils, paper, and a prior diagram of a fish. While working on it, I gained plenty of new information. For instance, the reproductive organs of a fish are called gonads. You can determine the sex of the fish by examining its gonads. Female fish have ovaries, while male fish have testes. I also learned about the importance of gills in fishes. Fish breathe by using their gills, which filter oxygen from the water and return carbon dioxide. Furthermore, I learned about a fish’s swim bladder. A swim bladder is a gas-filled sac that enables a fish to regulate its buoyancy in the water by taking in and letting out air. This helps the fish to move up or down in the water column, which is a vertical section of water from the surface to the bottom of the ocean.
What is the difference in the sound levels in a freshman single-gender world history class between the morning and afternoon?
Researchers found that only 25% of all teen students are morning people, and the rest of teens are night people. It is recommended that teens get roughly 9 hours of sleep per night, but the average teen gets about 7 hours of sleep, limiting their productivity and alertness in the morning. Productivity and alertness impact the sound levels generated by teens inside a classroom.
We believe that in the afternoon, the sound levels in a single-gender freshman world history class will be louder than in the morning because only 1 in 4 (25%) high school students are morning people. Therefore, the other 75% would be more sluggish.
Pencils (x3)
Science notebook (x3) Computer
Vernier sound sensor
Vernier software (on computer) Printer
1. Choose a neutral location in the center of the classroom to record data
2. Plug in Vernier sound sensor into the computer
3. Open Vernier sound software
4. Change the software requirements to: minutes - 15, a-weighted dB, and add a title
5. Start recording data through the sound sensor
6. Sit quietly and observe activity, and materials (number of students and their whereabouts, type of ceiling and flooring, wall coverings, time
of day, activity of students, and the student’s distance relative to the sensor)
7. After 15 minutes stop the software from recording data
8. Save your graphed data from the Vernier software
9. Quietly leave the observation site
10. Print out findings and analyze data
The graph (Figure 1, top of next page) shows the noise levels of a freshmen single-gender world history class, where data collection began at 10:40 AM. Factors that affected the noise levels were the 13 occupants in the room at the time of data collection, and 70% of the walls were covered. The ceiling was porous, the floor was carpeted, and the room was of a cascading stair design. The main source of sound was about 5 meters away.
The students were quietly doing work and checking in with the teacher, and there was instrumental music playing in the background. The first sizable increase in sound levels at 2 minutes was when the teacher was giving instructions to the students. After check-ins and instructions were finished, everyone was working quietly. An increase of dB after 2 minutes is when kids started screaming on the playground outside while the windows were open. Some of the small increases in dB were people walking by in the hallway while the door was cracked open, and while a student was going to the bathroom. Throughout the study, the heater would turn on periodically and make a low humming noise. The highest level of sound was 66.5 dB at 2 minutes; the lowest was 52.9 dB between 6 and 8 minutes, and the sound level range was 13 dB.
The graph (Figure 2, middle of next page) shows the noise levels of a freshmen single-gender world history class, where data collection began at 2:30
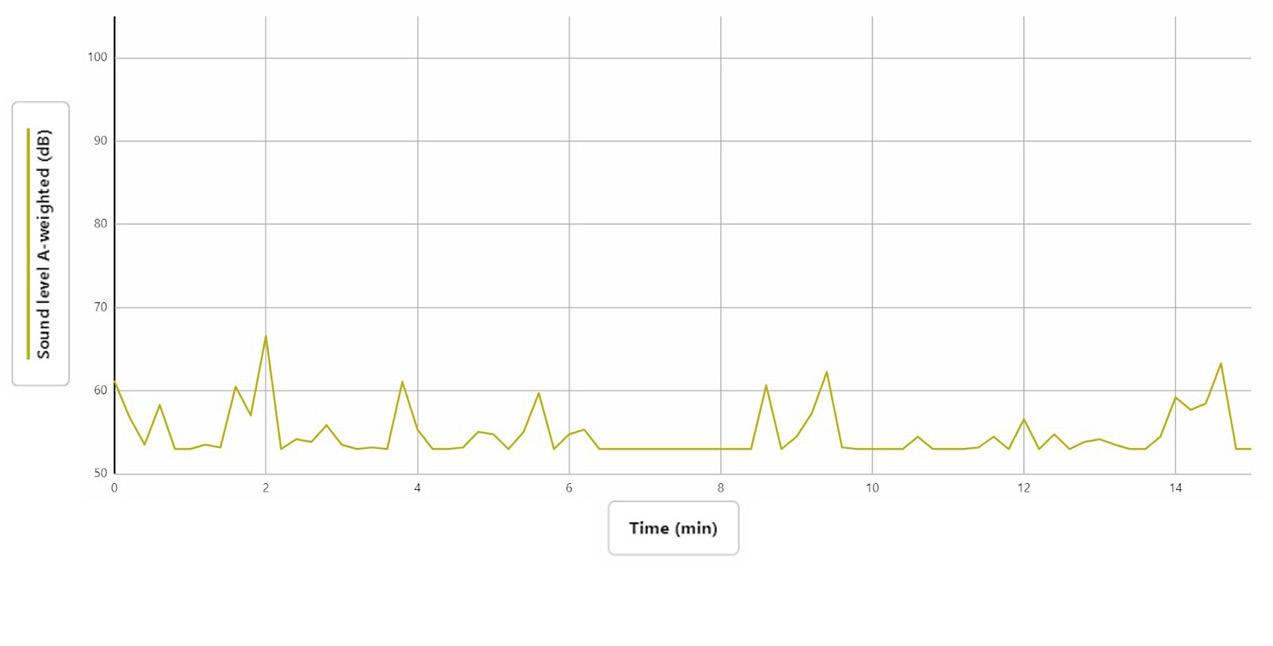
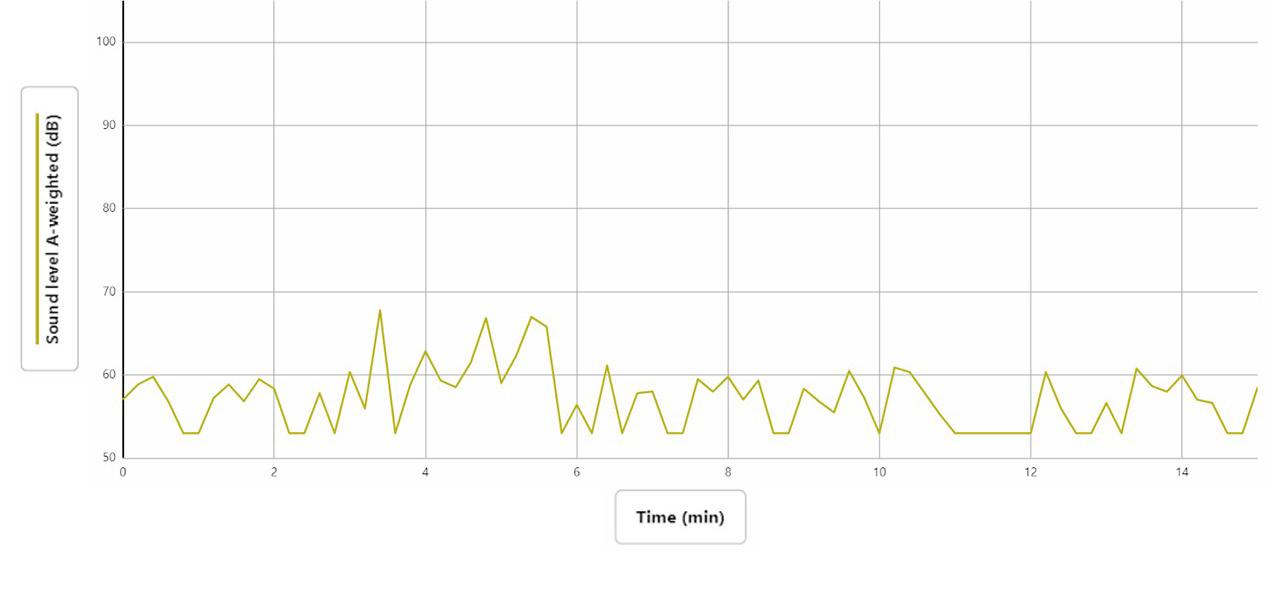
PM. Factors that affected the noise levels were that there were 13 people in the room at the time of data collection, and 70% of the walls were covered. The ceiling was porous, the floor was carpeted, and the room was of a cascading stair design. The main source of sound was about a 5-meter radius away.
Students were conversing with each other and discussing their work; they seemed pretty chatty and were talking a lot. They snapped their fingers when they agreed with something. The first medium-sized increase in dB was at 3 minutes when
they were all agreeing with each other and talking at the same time. The teacher started talking around minute 4, and the level of decibels went up by a lot. The big drop around minute 6 was when the students started leading class and had discussion-based questions. The medium stretch around minute 11 was when a girl started quietly talking. Around 12 minutes, they all started talking, then discussed in small groups for the rest of our recording session. The highest level of sound was 67.7 dB, and the lowest was 52.9 dB, the sound range was Δy: 15 dB.
Our overall results indicate that the decibel levels were higher in the afternoon compared to the morning in a single-gender high school world history class. The lowest sound level in both graphs was 52.9 dB at 8 minutes, and the highest was 67.7 dB at 2 minutes. The average was 55 dB, and the Δy was 14 dB. These sound levels were within OSHA’s recommendations of 70 dB; however, they were above the recommended sound levels of the World Health Organization (WHO). The Occupational Safety and Health Administration (OSHA) stated that if the sound levels of a work space were above 85 dB, employees need hearing protection. These sound levels were almost 20 dB below this recommendation. The lowest decibels were 52.9, and the highest were 67.7 The average level of decibels was 57, and the Δy was 15 dB. There was a 2-dB difference in the average sound level, a 1.2 dB difference in the highest, and the lowest was 52.9 dB for both times.
It was hypothesized that the single-gender freshman world history class would be louder in the afternoon than in the morning because only 25% of high school students are morning people. Our hypothesis was supported by the data that we collected. The purpose was to see if the decibel levels in the class were higher in the morning than the afternoon. The sound levels in the afternoon were 2 dB higher than in the morning. Some limitations of this study were having to go to the class in the second period and fourth period on different days, as well as having to sit in a different location on the
second day of observation. We also only conducted one study. The sound levels in this classroom were below the average of which research shows is 70 dB for classroom chatter. There were also three people less than the average amount of teens in a high school class, but that data applies to public schools. This investigation was important because we learned that the sound levels were at the appropriate levels for this world history class. Therefore, students are able to learn effectively without distractions or possible headaches, which research says can result from prolonged exposure to high levels of sound. “About Sound Health.” About Sound Health, NIH, www.nih.gov/ research-training/medical-research-initiatives/sound-health. Accessed 20 Jan. 2023.
Mindell JA & Owens JA (2003). A Clinical Guide to Pediatric Sleep: Diagnosis and Management of Sleep Problems. Philadelphia: Lippincott Williams & Wilkins. https://docs.google. com/document/d/1Im3ah2nqlP8pg3PJc4c7anNFUtknB9X9Wa5JE7Foz5M/edit
McKibben, Sarah. “Wake up Calls.” Wake up Call, Start School Later, Apr. 2014, www.startschoollater.net/wake-up-callsfast-facts.html. Accessed 13 Jan. 2023.
Nuwer, Rachel. “Night Owl And Early Bird Teens Think Differently.” Night Owl And Early Bird Teens Think Differently, Smithsonian, 26 Mar. 2013, www.smithsonianmag.com/ smart-news/night-owl-and-early-bird-teens-think-differently-9607779/#:~:text=Around%20one%20in%20four%20 teens,measured%20intelligence%20and%20school%20performance. Accessed 13 Jan. 2023.
Public Health and Scientific Information. CDC, 11 Dec. 2018, www.cdc.gov/nceh/hearing_loss/public_health_scientific_info.html#:~:text=The%20World%20Health%20Organization%20(WHO,period%20to%20avoid%20hearing%20 impairment. Accessed 20 Jan. 2023.







How do scientists know what’s plastic versus what’s metal? Scientists can identify and describe materials by studying the material’s characteristics or properties. They do this through a process called materials characterization, or “the process of studying and understanding the physical, electrical, and chemical properties of materials” (ATRIA Innovation, 2023). Materials characterization uses a multitude of techniques to understand materials, including microscopy to analyze properties, spectroscopy to study composition, and thermogravimetric analysis to do a combination of these.
Microscopy is a technique that uses microscopes to study and analyze materials (Platypus Technologies, n.d.). All types of microscopy can be used to study various characteristics of materials, such as their size, texture, and elemental composition (Schumacher, 2014). Different types of microscopy, such as optical microscopy and electron microscopy, use different types of microscopes. Optical microscopy uses optical microscopes, which are the microscopes commonly used in classrooms that use lenses and visible light to produce magnified images in color. On the other hand, electron microscopy uses electron microscopes, which use lenses and electron beams to magnify black-andwhite images at much higher resolutions and magnifications than optical microscopes (Cheriyedath, 2023). In general, microscopy is a technique used primarily to study the physical, chemical, and structural properties of materials.
Spectroscopy is also used as a technique in materials characterization. It uses electromagnetic radiation to study a material’s absorption and emission of light or other radiation (ATA Scientific, 2020). There are many different types of spectroscopy, such as X-ray spectroscopy and infrared spectroscopy. X-ray spectroscopy involves exciting the atoms of a material using a high-energy beam, causing the electrons to change energy levels, which then results in the emission of X-ray photons. This technique is used to study the chemical composition of a material by looking at the way the X-ray photons are emitted, which is unique to the atoms of particular elements (Tommasone, 2021a). Conversely, infrared spectroscopy directs a beam
of infrared light to pass through a material, causing parts of the infrared spectrum to be absorbed. Looking at the portions of the infrared spectrum that are absorbed can reveal what bonds are present, which can then be used to study the chemical composition of a material (Tommasone, 2021b). This way, both X-ray spectroscopy and infrared spectroscopy are used to study the chemical composition of materials.
Thermogravimetric analysis is another technique used in materials characterization. Thermogravimetric analysis is done by heating a material in a controlled environment and studying its change in weight as a function of temperature or time. Two types of thermogravimetric analysis that can be used are static and quasistatic. Static thermogravimetric analysis involves heating a material at a constant temperature and recording the material’s change in weight. In contrast, quasistatic thermogravimetric analysis involves heating a material to different intervals of temperatures, letting the material stabilize before each change, and recording its change in weight. (Mathias, 2021). Therefore, thermogravimetric analysis can be used to study the chemical or physical properties, water content, and composition of materials (Wisconsin Centers for Nanoscale Technology, n.d.).
In conclusion, materials characterization can be used to study various characteristics of materials, such as their properties and composition. Multiple techniques are used within materials characterization, such as microscopy, spectroscopy, and thermogravimetric analysis, which all have different types. Overall, materials characterization helps scientists to study and describe materials, which is how they can understand what’s plastic and what’s metal.
ATA Scientific. (2020, January 17). Spectrometry and Spectroscopy: What’s the Difference?. https://www.atascientific.com. au/spectrometry/
ATRIA Innovation. (2023, March 9). Characterization of materials: What techniques are used?. https://www. atriainnovation.com/en/characterization-of-materials-what-techniques-are-used/
Cheriyedath, S. (2023, July 19). Optical, Electron, and Scanning Probe Microscopy. News-Medical.net. https://www. news-medical.net/life-sciences/Optical-Electron-and-Scanning-Probe-Microscopy.aspx
Mathias, J. (2021, August 10). TGA Analysis: What, How and Why. Innovatech Labs. https://www.innovatechlabs.com/newsroom/2270/tga-analysis-what-how-why/
Platypus Technologies. (n.d.). Material Characterization Techniques. https://www.platypustech.com/material-characterization-techniques
Schumacher, E. F. (2014, September 9). Microscopy for Materials Characterization: Illuminating Structures With Light and Electrons. American Laboratory. https://www.americanlaboratory.com/914-Application-Notes/167499-Microscopy-for-Materials-Characterization-Illuminating-Structures-With-Light-and-Electrons/
Tommasone, S. (2021a, January 28). X-Ray Spectroscopy: An Overview. AZO Life Sciences. https://www.azolifesciences. com/article/X-Ray-Spectroscopy-An-Overview.aspx
Tommasone, S. (2021b, January 28). Infrared Spectroscopy: An Overview. AZO Life Sciences. https://www.azolifesciences. com/article/Infrared-Spectroscopy-An-Overview.aspx
Wisconsin Centers for Nanoscale Technology. (n.d.). Thermogravimetric Analysis. https://wcnt.wisc.edu/thermogravimetric-analysis/Cheriyedath, S. (2023, July 19). Optical, Electron, and Scanning Probe Microscopy. News-Medical.net. https://www.news-medical.net/life-sciences/Optical-Electron-and-Scanning-Probe-Microscopy.aspx
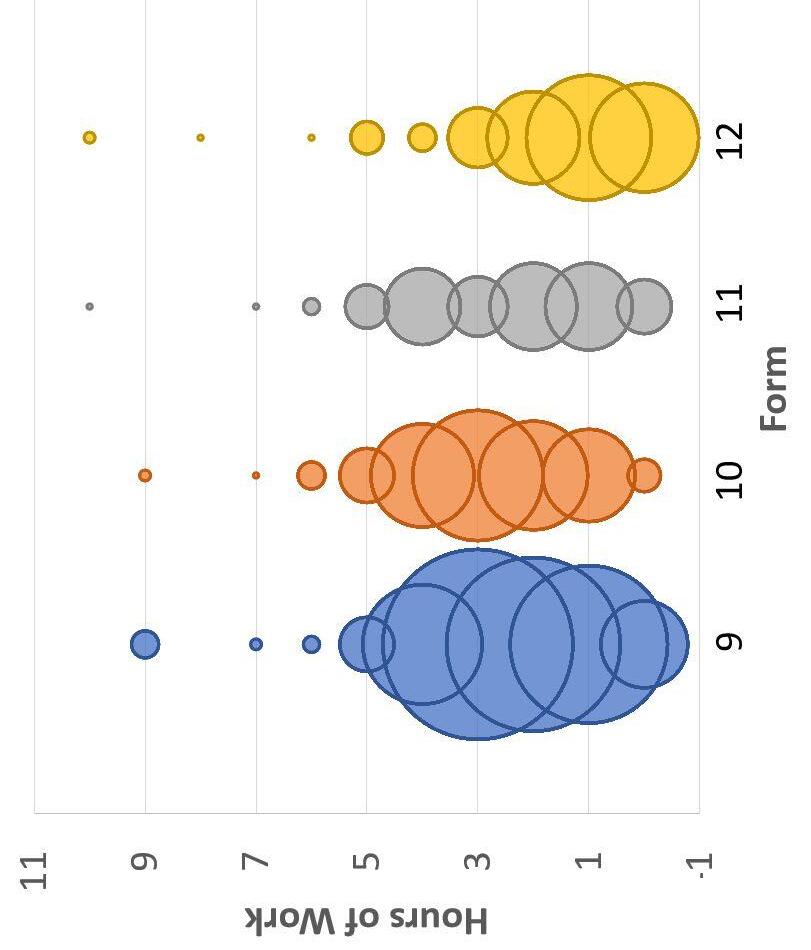
Figure 3. Distribution of Hours of Work by Form (width of each circle indicates number of responses)
● Weak negative correlation between hours of time spent working outside of school and hours of sleep (r = -0.241, p < 0.001)
● Very weak, but significant, negative correlation between a student’s form and work time outside of school (r = -0.0948, p = 0.0496)


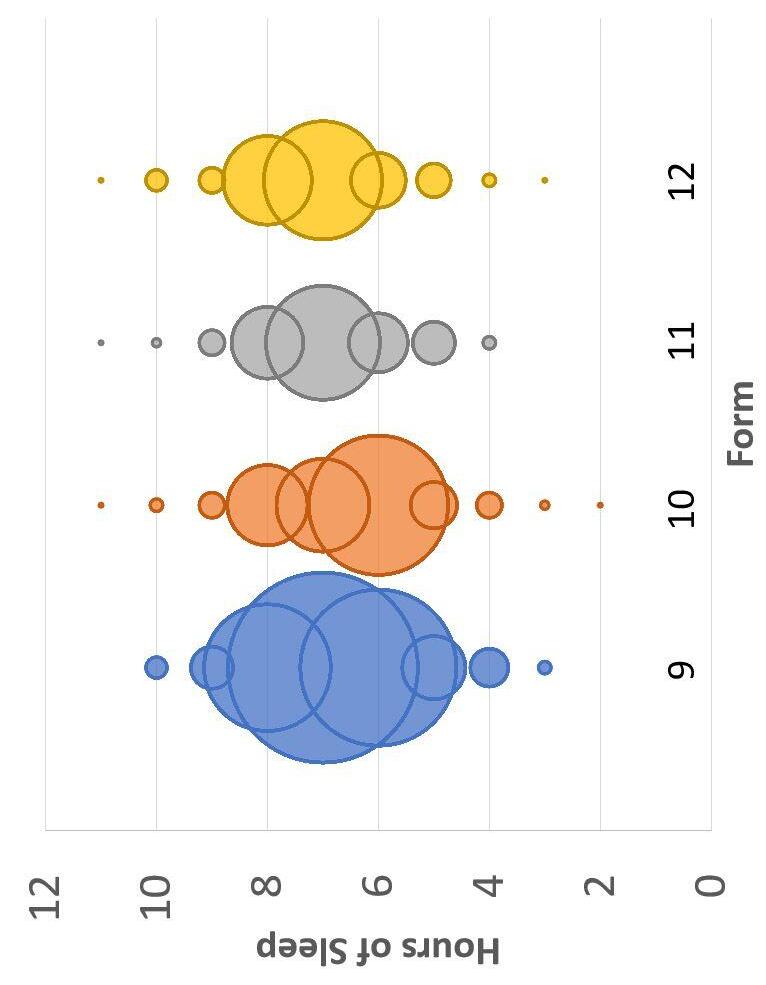
Figure 2. Distribution of Hours of Sleep by Form (width of each circle indicates number of responses)
● No significant correlation between students with a greater number of APs and less study halls or hours of sleep in a night (# APs and # study halls: r = -0.0653, p = 0.177; # APs and hr of sleep: r = 0.025, p = 0.61)
● Significantly lower median hours of sleep for Form 10 relative to other forms (median test, χ 2 = 9.11, p = 0.028)
● 15 responses were removed for impossibility (e.g., Freshman cannot have only 1 study hall per rotation)
● Findings are mixed among studies regarding workload and sleep length (Jansen et al., 2020)
○ some cite heavy workload for lack of sleep (Hershner, 2015)
○ At least one epidemiological study found no association between the number of hours spent studying and sleep duration (Tsui & Wing, 2009)
○ However, most of these studies are conducted on college students, so the data is not fully applicable to this study
● A repeat of this study could potentially display a correlation between the individuals in forms and hours of sleep
○ Is it the form/age that affects hours of sleep, or the group of individuals currently in that form?
● These results do not support my hypothesis
● Workload (# AP Classes, Extracurriculars, and # Study Halls) had no statistically significant effect on sleep
● Older students spent less time out-of-school on school work
○ Inverse correlation between age and work time
○ Positive correlation between age and sleep
● Possible causes of older students spending less time on school work could include:
○ Experience with high school workload
○ More efficient use of work time
○ Not wanting sleep deprivation
○ “Senioritis”
■ Less perfectionism on school work
■ Understanding of time management
■ Focus on other issues (e.g., college applications)
○ Generally more free time
● Sleeping is vital to maintain good health and well-being throughout human lifetime (NHLBI, 2022)
● Sleep deficiency can cause physical and mental health problems, injuries, loss of productivity, and a greater likelihood of death (NIH, 2021)
○ It can raise the risk of many diseases and disorders, including heart disease, stroke, obesity, and dementia (NIH, 2021)
● Sleep deprivation has been shown to reduce attention, impair central processing, and produce an overall decline in cognitive functioning (Ratcliff, 2009)
● An estimated 50 to 70 million Americans have chronic sleep disorders (NHLBI, 2022)
● The CDC recommends that teenagers aged 13 to 18 should sleep 8-10 hours per night (CDC, 2020)
○ In a national survey, however, the CDC found that about 7 out of 10 teenagers do not get enough sleep on school nights (CDC, 2020)
● Workload: amount of work a student has, considering free time, # classes, and out-of-school work time
School workload impacts amount of sleep because the amount of work a student must complete outside of school can affect the number of hours a student would have available to sleep.
Prediction
If workload is related to hours of sleep, then high school students with more AP classes and extracurriculars and fewer study halls will get fewer hours of sleep on average.
Data Collected per Student
Form (Grade)
# Full-Block Classes # APs #
Study Halls # FLEXs (free short blocks)
Y/N Extracurricular # Hr Out-of-School Work # Hr Sleep Previous Night
Figure 1. List of information collected by survey questions
● Data was collected using a Google Forms survey (Figure 1) sent out once a day for 6 consecutive school days to the entire Upper School student body of Columbus School for Girls (CSG)
○ 6 days covers a full A-F-day class rotation at CSG
Abstract
The purpose of this experiment is to find the heat of combustion of magnesium by finding the heat of reactions for parts of the combustion reaction and applying Hess’s Law. For this experiment, I performed two chemical reactions: one with magnesium (Mg) and hydrochloric acid (HCl) as the reactants and the other with magnesium oxide (MgO) and hydrochloric acid as the reactants. In order to do the necessary calculations, I needed both the masses of the magnesium and the magnesium oxide as well as the temperature changes during the chemical reactions. To get the masses, I used an electronic balance. For the temperature changes, I used a temperature probe and a LabPro system. After my calculations, I found the heat of combustion of magnesium to be -604.54 kJ/mol, meaning when magnesium reacts with dioxygen (O2), 605.54 kJ are released per mole of reactant. This answer proved to be very accurate, since it yielded a percent error of only 0.450%.
Introduction
The heat of reaction of a chemical reaction is the energy per mole that is either absorbed or released in a chemical reaction. Combustion is a type of chemical reaction where a substance reacts with dioxygen. Finding the heat of combustion of magnesium by actually performing the combustion in lab is impractical. This is why I instead applied Hess’s Law: a method of finding the heat of reaction by mathematically manipulating the heats of reactions of chemical reactions that contain all of the compounds and elements in the desired reaction. Chemists use Hess’s Law to find the heat of reaction when it is either impossible or impractical (Bell, n.d.). One heat of reaction was given to me: the heat of reaction of water. The other two heats of reactions I had to figure out on my own by performing the chemical reactions in lab. These were the heat of reaction for both magnesium and hydrochloric acid and the heats of reaction for magnesium oxide and hydrochloric acid.
For this experiment, I needed a system to collect temperature changes and the equipment required to perform the necessary chemical reactions. For the system to collect temperature changes, I used my computer, a LabPro, and a temperature probe. For the equipment required to perform the chemical reactions, I obtained solid Mg, solid MgO, 1.00 M HCl, a ring stand, a stirring rod, a styrofoam cup, a 250 mL beaker, and a graduated cylinder.
First, I set up the LabPro system and plugged in the temperature probe. Then I placed the styrofoam
cup into the 250 mL beaker; although it still is not perfect, styrofoam is a good insulator so it allows less heat to be lost. For the first reaction, I measured 100.0 mL of 1.00 M HCl with the graduated cylinder, poured it into the styrofoam cup, and added the temperature probe. Then, I weighed about 4 grams of Mg and recorded its exact mass. I began collecting data to obtain the initial temperature and then added the magnesium. I stirred until the temperature stopped rising and then recorded the highest temperature. After cleaning the cup, probe, and rod and disposing the solution, I performed the second reaction with all of the same steps but using MgO instead of Mg.
In order to apply Hess’s Law, I first needed to turn this data into heats of reactions for the two chemical reactions. I did this by first calculating the heat released during the chemical reaction using this equation: q=mcΔT where q is the heat (kJ), m is mass, c is the specific heat capacity (a constant), and ΔT is the change in temperature. For the first reaction (Mg), I got that q = -22.908 kJ, meaning 22.908 kJ were released. For the second reaction (MgO), I got that q = -6.971 kJ, meaning 6.971 kJ were released.
Those values, however, are not the heats of reaction since those quantities are the heat released for the amount of reactant I used in the experiment, not for 1 mole, which is what heat of reaction is measured in (kJ/mol). In order to convert these values to kJ/
mol. I had to divide by the moles of 1 reactant in the chemical reaction. To find that value, I needed to find the limiting reactant because if I used the amount of the reactant that was in excess, I would be getting an inaccurate heat of reaction since that would be assuming all of that reactant actually partook in the chemical reaction. In order to find the limiting reactant, I needed to balance the chemical equations:
Mg + 2HCl ® MgCl2 + H2
MgO + 2HCl ® MgCl2 + H2O
The limiting reactant for both reactions was HCl. So I divided the moles of HCl by two and then divided the heat released by that value. I found the heat of reaction for the first reaction to be -458.16 kJ/mol and the heat of reaction for the second reaction to be -139.42 kJ/mol.
To find the heat of combustion of magnesium, I applied Hess’s law by mathematically manipulating the 3 heats of reaction I had. I did this because I had to manipulate the chemical equations in order to form the desired chemical equations.
Mg + 2HCl ® MgCl2 + H2
MgO + 2HCl ® MgCl2 + H2O
H2 + ½O2 ® H2O
Mg + 2HCl ® MgCl2 + H2
MgCl2 + H2O ® MgO + 2HCl
H2 + ½O2 ® H2O
Mg + ½O2 ® MgO
Since I flipped the second equation, I multiplied that heat of reaction by negative 1. After adding up all of the heats of reactions, I foundthat the heat of combustion of magnesium is -604.54 kJ/mol.
With my experimental data, I found the heat of combustion of magnesium to be -604.54 kJ/mol. The accepted heat of combustion of magnesium is -601.83 kJ/mol. This gives me a percent error of a mere 0.450%. This is quite low, which means the heat of combustion I calculated is very accurate. This is likely due to me collecting accurate and precise data during the experiment.
Due to the accuracy of my calculated heat of reaction, I do not think any significant experimental errors occurred. However, there are some that may have happened. One possibility is the temperature probe being inaccurate at times since sometimes it can spike in temperature. Another possibility is that enough heat was absorbed by the surroundings to skew the data; although styrofoam is a good insulator, it does not completely prevent heat from being transferred.
Overall, I think this experiment went very well for a couple of reasons. First, my lab partner and I were able to get the lab done quickly and faced no major challenges or setbacks. Second, we ended up collecting data that lent itself to an answer very close to the accepted answer, which likely means my lab partner and I did a good job performing the reactions and collecting accurate data.
Bell, O. Why is Hess’s Law useful to calculate enthalpies?. Socratic Q&A. https://socratic.org/questions/why-is-hess-law-useful-to-calculate-enthalpies#:~:text=1%20Answer&text=Hess’%20Law%20allows%20us%20to,is%20either%20 impossible%20or%20impractical.
s Coffee and milk cause a decrease in the growth of Wisconsin Fast
● The control group had an overall higher survival percentage to day 12 than both experimental groups (Figure 4)
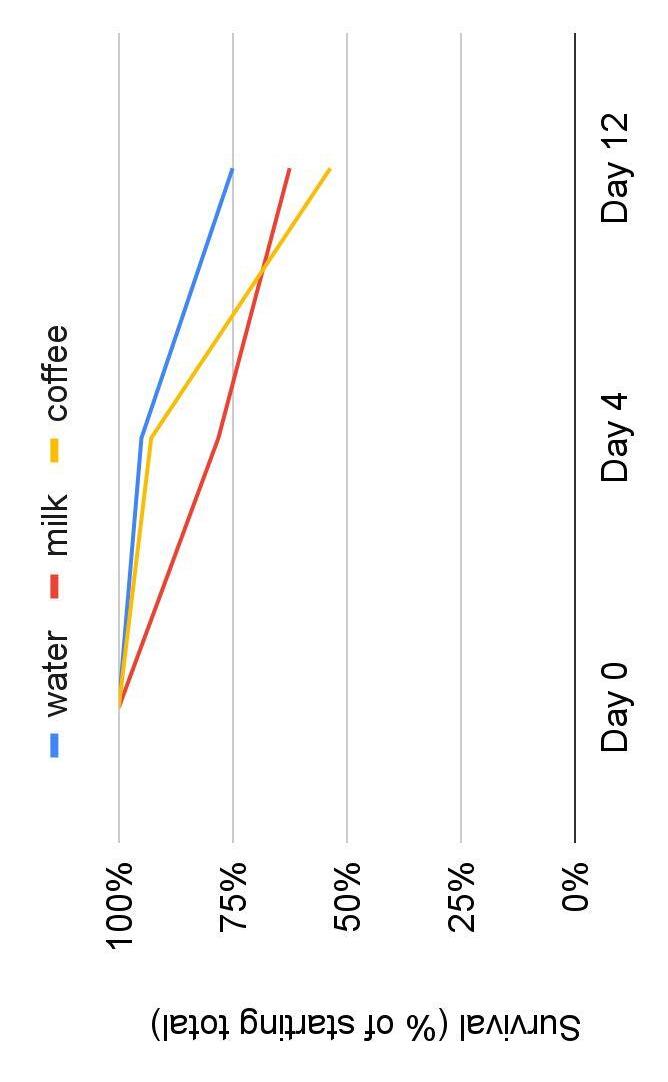
Figure 4: Percent of each treatment group of WFP surviving from Day 0 to Day 12.
● R 2 for control (0.22) is greater compared to experimental groups (milk=0.101, coffee=0.123) which showed the best overall growth. (Figure 3)
● The results of this experiment did not support my hypothesis: plants in the treatment groups of milk and coffee were not taller than the ones in the control group (Fig 3)
● WFPs in the control group showed an overall higher growth of the heights of the plants over a 12-day period than the experimental groups (Figure 3)
● The control group had an overall higher survival percentage than the experimental group (Figure 4)
● Caffeine is known to have effects on the growth of angiosperms
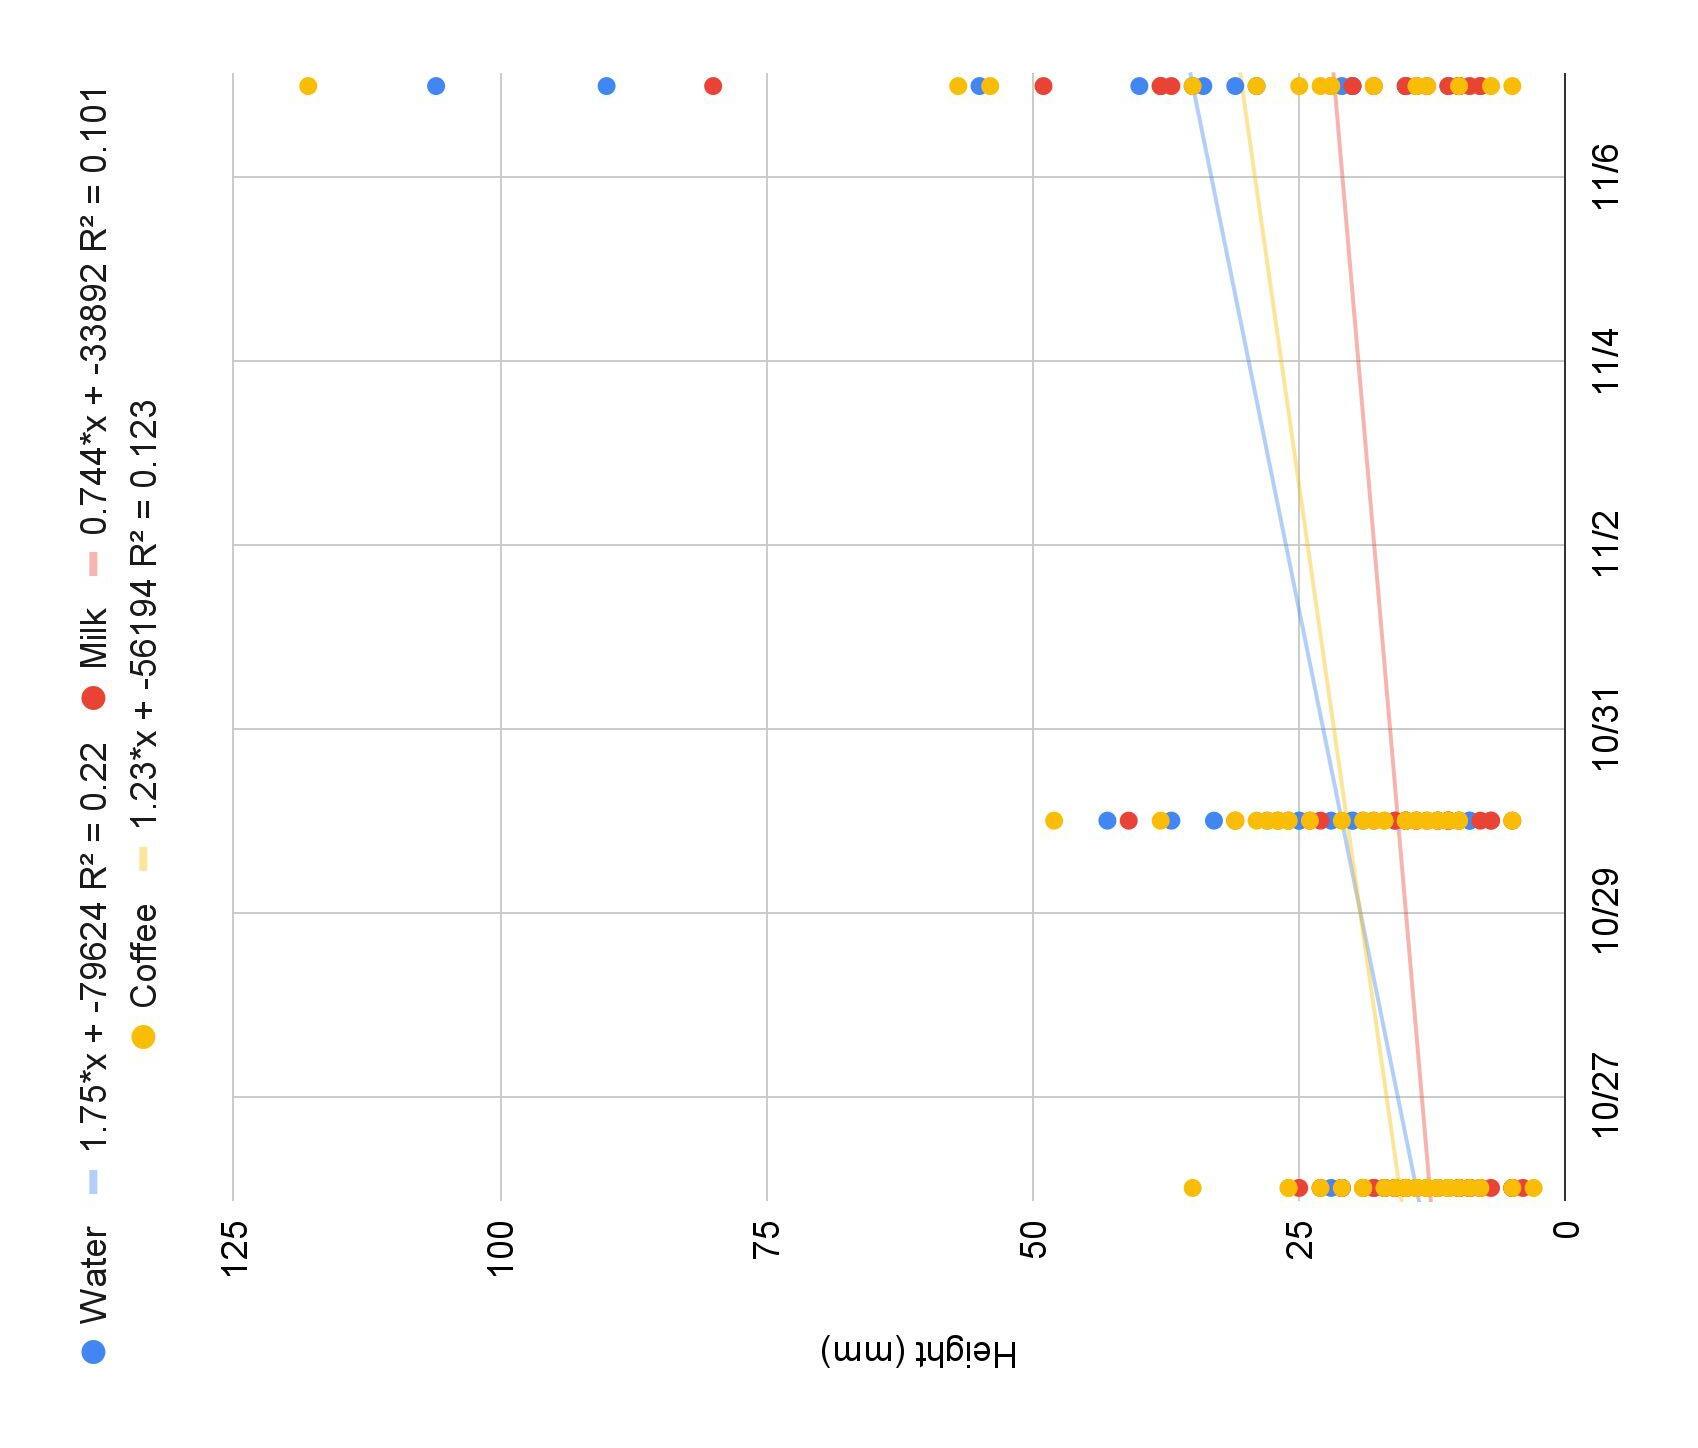
Figure 3: The overall growth (mm) of Fast Plants under the treatment groups of milk (red), coffee (yellow), and water (control, blue)) over a 12-day period.
○ Plants germinated in soil, then exposed to the squeezed contents of one green coffee bean pill and took measurements every Tuesday and Thursday for eight weeks (Ferguson 2015)
○ Results of this experiment did not match their hypothesis: caffeine did not have a negative impact on plant growth (Ferguson, 2015)
● Next steps: test the effect of the pH of milk and coffee on the overall growth of WFPs.
○ Would differentiate between effects of pH and nutrients on growth


● All plants need the nutrients of carbon, hydrogen, and oxygen, nitrogen.
● Angiosperms require phosphorus and potassium in larger amounts than the carbon, hydrogen, oxygen, and nitrogen (MN Extension, 2020)
● Milk and coffee both contain nitrogen, phosphorus, and potassium (Ogden, 2017)
● Milk contains more of these elements than coffee
○ Calcium helps angiosperms grow because it adds to the structure of the cells and provides essential nutrients such as nitrogen, phosphorus, and potassium (Thor, 2019).
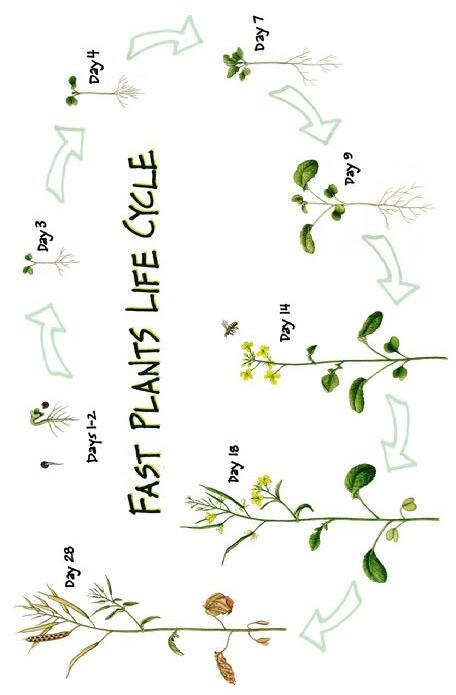
● Wisconsin Fast Plants (WFPs, Brassica rapa ) are angiosperms that develop from seed to flower in just 14 days (Figure 1)
○ Requires constant full-spectrum light, environmental temperature between 72°F to 84°F, and a limited amount of moist soil (University of Wisconsin-Madison, 1997)
Watering plants with liquids that contain more nutrients than water will result in the increase of overall growth in plants because the nutrients in the different liquids are what best help the plants grow the most.
Prediction
If there is a relationship between Wisconsin Fast Plant growth and nutrient content of liquids given to the plant, then the plants watered with milk and coffee will be overall taller than the plants given water.
● WFP seeds inside were germinated on filter paper disks in petri dishes
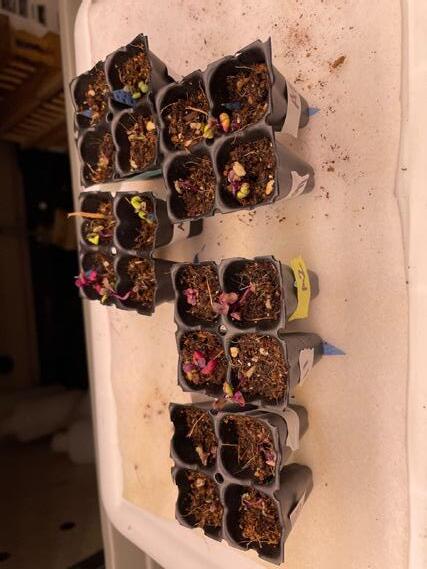
● Seedlings transferred to individual cells in 2-by-2 inch planters with seedling (Figure 2) starter mix and 2-3 fertilizer pellets (NPK of 14-14-14)
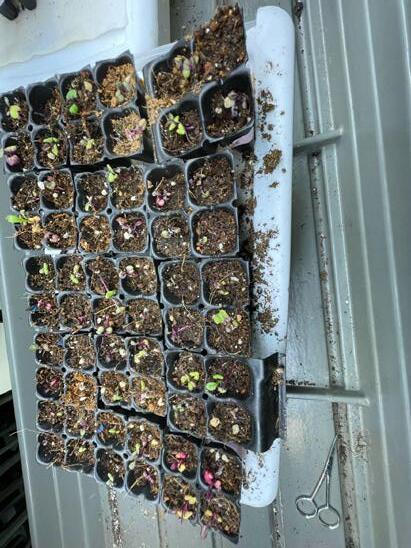
○ Placed under a full-spectrum LED light for the full 12-day period
● Control Group = 20 plants
● Experimental Groups
○ Milk = 32 plants
○ Coffee = 28 plants
Figure 2: The plants in the 2-by-2 planters after they have germinated
Figure 1: The Life Cycle of Wisconsin Fast Plants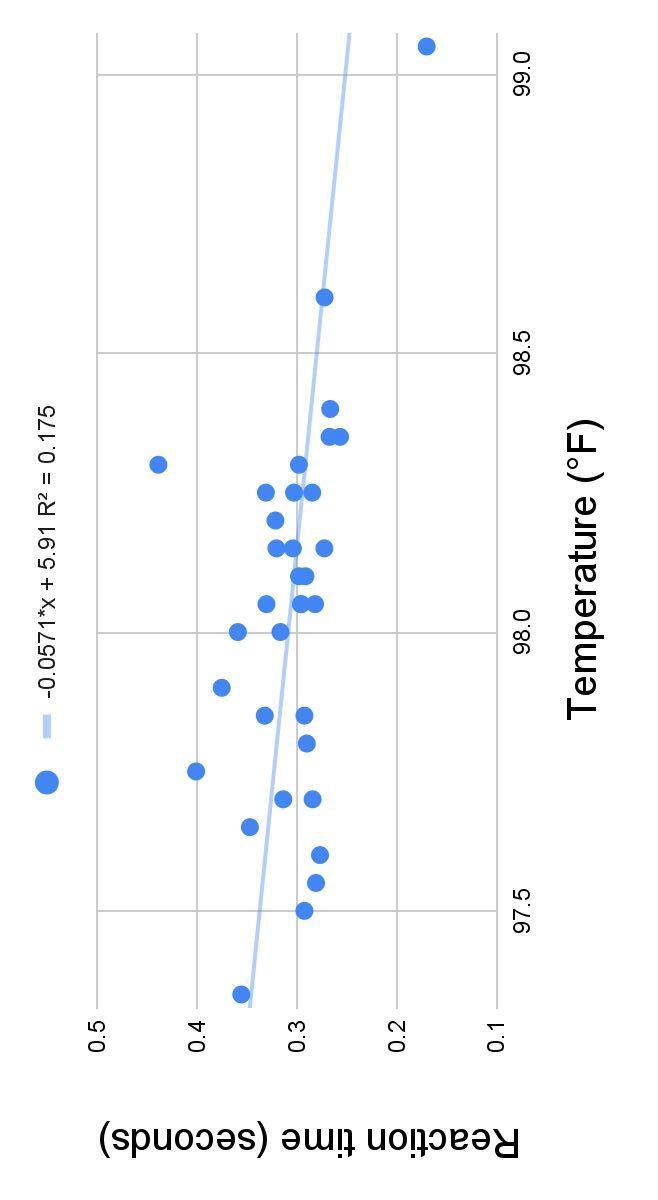
Figure 3 . Reaction time (s) and body temperature (°F) of seven teenage girls for every day combined.
● Results did not match my hypothesis: no strong correlation between reaction time and body temperature
● The brain's internal clock, AKA the circadian rhythm, controls cycles of alertness and drowsiness by adapting to changes in environmental light levels (NIGMS 2023)
● Body temperature fluctuates predictably, so it could be used as an indicator of circadian rhythm (Del Bene VE 1990)
○ Average human body temperature = 37°C (98.6°F), but can vary by 0.5°C (0.9°F)
○ Typically, body temperature reaches its lowest point about 4 a.m. and its highest point around 6 p.m. (Figure 1)
● The body will be most awake when reaction time is quicker
● Possible reasons for no correlation:
○ Thermometer measured outside the body
○ Body temperature does not vary by much
○ Knowledge and skill improved over time so reaction time would eventually plateau
● Reaction time did decrease and then plateau
○ Visual reaction time was found to be less after practicing in other studies as well (Ghuntla 2014)
■ 50 male subjects (17-20 years old) were tested by Teja Ghuntla and others
■ Visual stimuli were given for three times and the lowest reaction time was taken
■ Participants then practiced and retested
■ Reaction time decreased after the practice session
○ Therefore, participants can learn new motor skills and improve them with practice
● Potential improvements to my study
○ More days, more participants, and larger range of times for higher confidence in the pattern found
○ More precise and accurate thermometer
■ Body temperature varies internally and externally
■ Varies by very little so it would be helpful to have a thermometer with less uncertainty

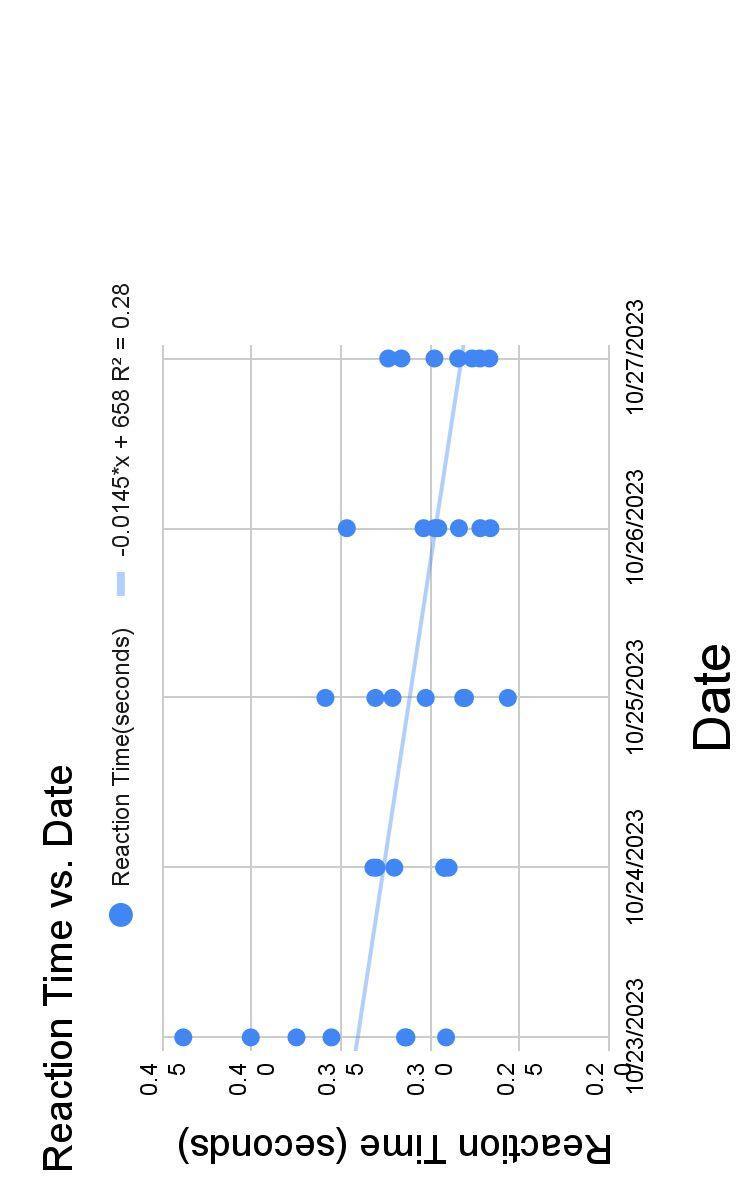
Figure 2. Reaction time (s) of 7 teenage girls everyday for five consecutive days.
Participants took an online reaction test from the University of Washington which took five rounds of reaction time and gave the average time.
● Decreasing trend in reaction time over the five days (Figure 2)
○ Larger range of reaction time of the first day (0.1472 s), but shorter range of reaction time on the last day (0.0566 s)
○ The variation in reaction times generally decreased over time
● Decreasing trend in reaction time as body temperature increased (Figure 3)
○ Body temperature did not vary much overall (range of 1.7°F)
● I selected a group of 7 girls, aged 14-16 years old, and routinely tested their body temperature and reaction time from October 23 to October 27, 2023 at Columbus School for Girls.
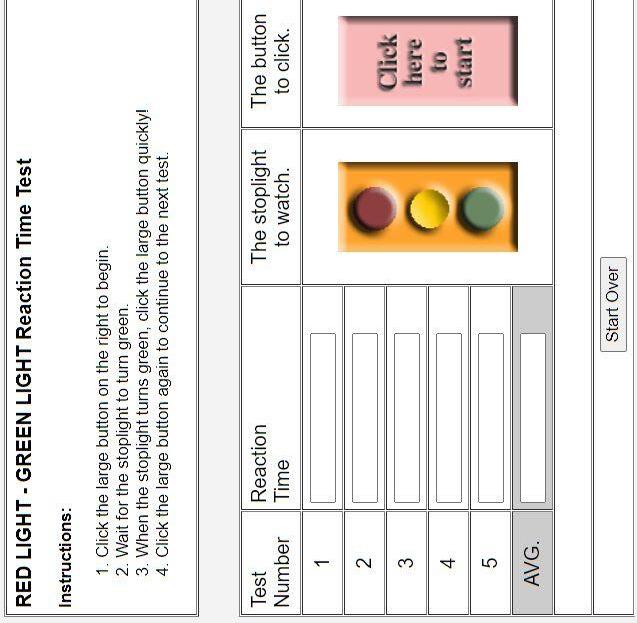
● Measured body temperature using a digital thermometer before and after subject took the reaction test (Figure 4)
● Each participant was tested once a day for five consecutive days at varying times of the day.
● Participants were read aloud a consent script and verbally consented to participating in the research project.
● The circadian rhythm cycle is regulated by biological clocks, proteins that are an organism's intrinsic timing system
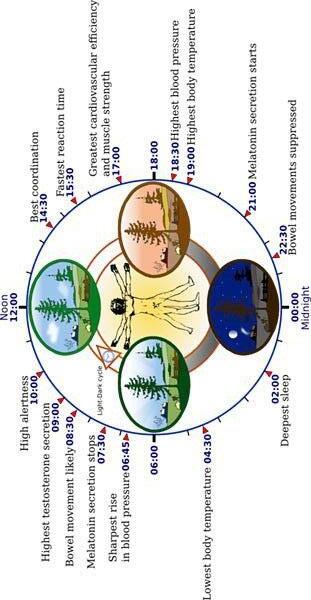
Figure 1 . Typical human circadian rhythm.
● Circadian rhythms are also impacted by environmental signals, such as light exposure (Del Bene VE 1990)
○ The suprachiasmatic nucleus (SCN) is the brain area that increases melatonin production when there is less light
○ This leads to a slower reaction time because melatonin is a hormone that helps one fall asleep
Teenage girls have a circadian rhythm that is influenced by the time of day because the brain regulates cycles of alertness/sleepiness due to environmental light changes
If there is a relationship between human circadian rhythm, body temperature, and reaction time in teenage girls, then reaction time will be fastest in the morning and body temperature will be highest in the early afternoon.
Figure 4 . Reaction time test from the University of Washington Grace Chapman ‘26● I built a machine using an Arduino UNO breadboard and wires connecting to smaller breadboards
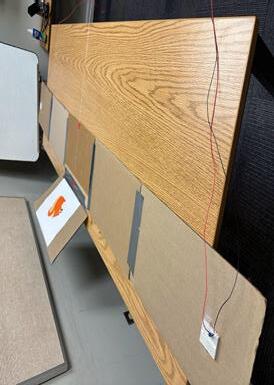
● The subject sat one meter away from an image, and the image sat one meter away from each of the lights (Figure 2a)
● The subject signed a consent form and was told the instructions on how to operate the machine (Figure 3b)
○ The first button push would initiate each of the ten trials
○ The second button push would be when they saw the light on either the right or left side
○ Subjects had to keep their focus on the center image
● The subject’s reaction time (time between the light flash and when they pushed the button) for each trial would be recorded
● The subject is given a survey regarding their driving experience
○ Included their driving status approximate miles per week, and driving experience in months
● W ith the help of an Arduino UNO code, I wrote a script to turn on a light, on the left or right, at a random interval of time
○ Set up functions for each light and where they went on the breadboard (Figure 1a)
○ Coded a loop for each person’s test with ten trials embedded
■ Could not ensure an equal number of right and left lightings, so had to manually make an order (Figure 1b)
○ Each light flash is initiated by button push, with time recorded by a second button
○ After ten trials, the program would reset
● Unintentional injury is the leading cause of death in teens in the United States with 48% of deaths. Of that percentage, 73% of those injuries come from motor vehicle traffic accidents 1
● When placed in the same breaking/collision situation, novice teens decelerated on average 50% less than adults 2
○ Result showed that more experienced adults have a better reaction time and braking ability than comparable inexperienced teens
Figure 2.
a. Main breadboard with home wires and button that records reaction time.
b. Central image with the peripheral lights one meter away from the image.

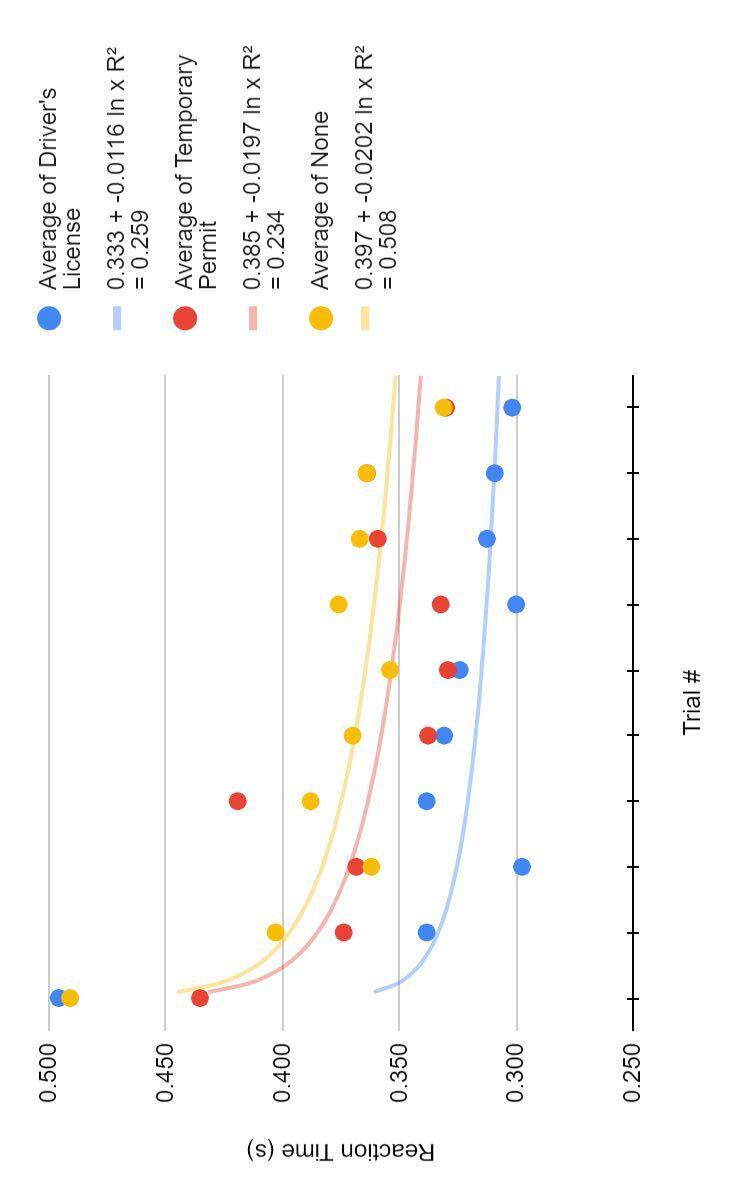
Subjects with their driver’s license, on average, had a faster reaction than those who had their temporary permit or no driving experience, which supports my hypothesis (Figure 3) A logistical curve showed each group’s learning reached an asymptote indicating a clear leveling of reaction time Reaction time can not reach zero naturally, so it levels to a generally consistent time
The nervous system can only work so fast
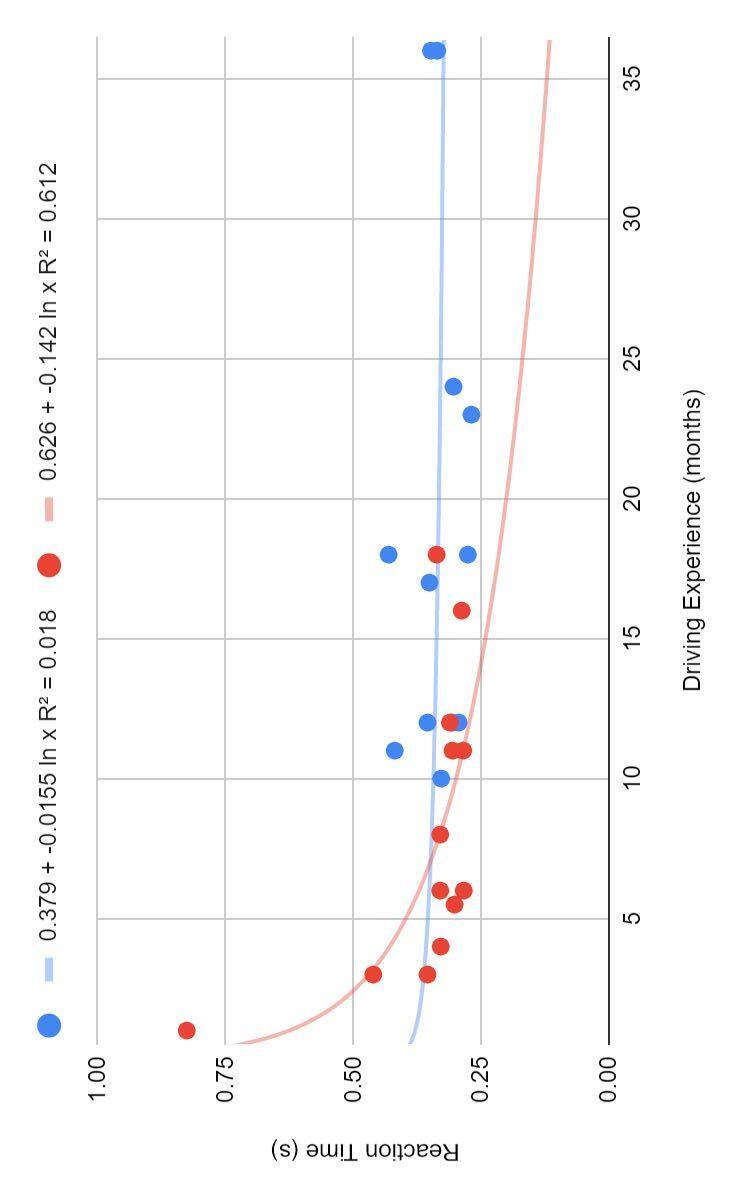
Figure 4 indicates that more experience for licensed drivers does not support the continual improvement of reaction time
However, more experience for subjects with permits does show a logistical improvement of reaction time values on both Figure 3 and 4, however, are not close enough to one to be considered significant
● Possible sources of error or confounding variables include subject’s not being accurate on their questionnaire answers, them not looking at the central image, and the change of location of the machinery
● While tests regarding the reaction time within the variation of teenagers is scarce, a study comparing the reaction time of adults and a range (aged 15-18) of teenagers found that there was no significant difference between their reaction times 5
● To expand, I could compare results of male and female because all of the subjects tested were female
Figure 1.
a. Code indicating the locations of the wires and the function definitions.
b. One of the ten trials with the text displayed on the computer screen.


● Few studies only include the ranges of teen drivers
● The human brain does not fully develop/mature until the mid-to-late twenties
○ The adolescent period is crucial when it comes to experience/exposure and learning from it 3
○ More experience increases exposure to automotive events
● Those with a driver’s license show faster reaction times than those with a temporary permit or no driving experience (Figure 3)
● Those with a temporary permit show logarithmic learning as they gain more driving experience, and those with a license show little improvement with experience (Figure 4)
● Reaction time to sudden events can significantly affect the chances of road traffic accidents 4
○ Quick reaction times can be the deciding factor between life and death
Due to the lack of driving experience, teens without their driver’s license or driving exposure will have slower reaction times than those with their driver’s license.
Prediction
Figure 3. ▲ Reaction times (s) over 10 trials of the three groups, driver’s license (n=12, blue), temporary permit (n=13, red), and none (n=10, yellow) of participants according to their driving status. Logarithmic curve indicating the learning of each of the groups over the trials.
When testing students with a variety of driving experience, those with more experience will respond to a flash of light in their peripheral vision with a faster response time than those with less experience.

Figure 4. ▶
The driving experience (months) of subjects with a driver’s license (n=12, blue) and those with a temporary permit (n=13, red) compared to their average reaction time (s). Logarithmic curve indicating the learning of each group over time.
Eight students contributed 14 ideas for the title of CSG’s STEM journal, and Sisters in STEM (by Chloe Brooks ’25) was selected via an all-school vote in November 2023. Then students from Forms I-XII submitted their ideas for the first Sisters in STEM logo. The top three, shown here, will be used on the journal’s website and in future publications.


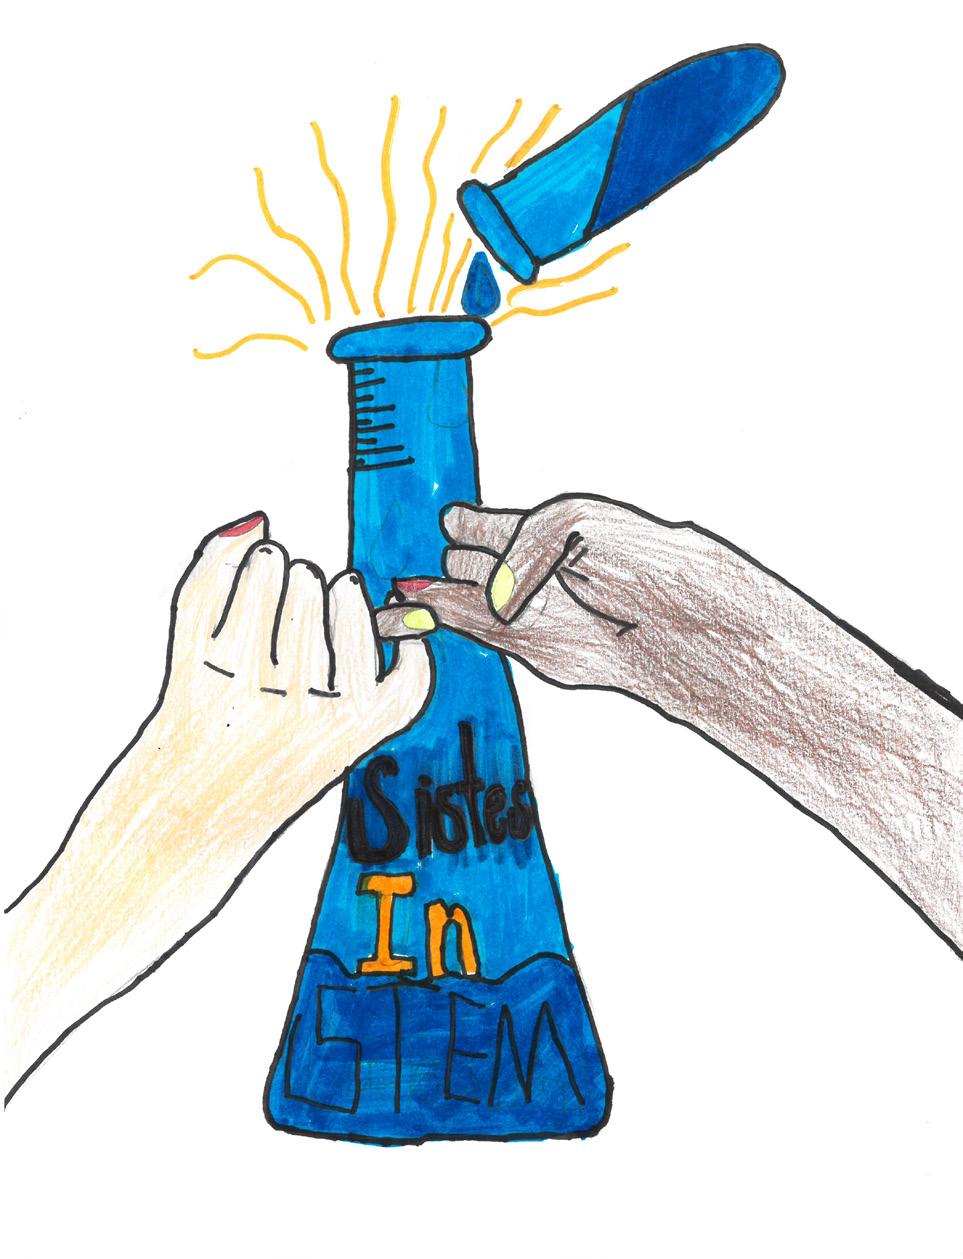
place
place
design by Rose McLarty ’25 Third design by Maisie Streeter ‘32 Runner-up design by Delaney Woods ’26 Third design by Maisie Streeter ’32