

1 F L O O R P Eval
Floor Plan Evaluator using GML

Conclusion and future work
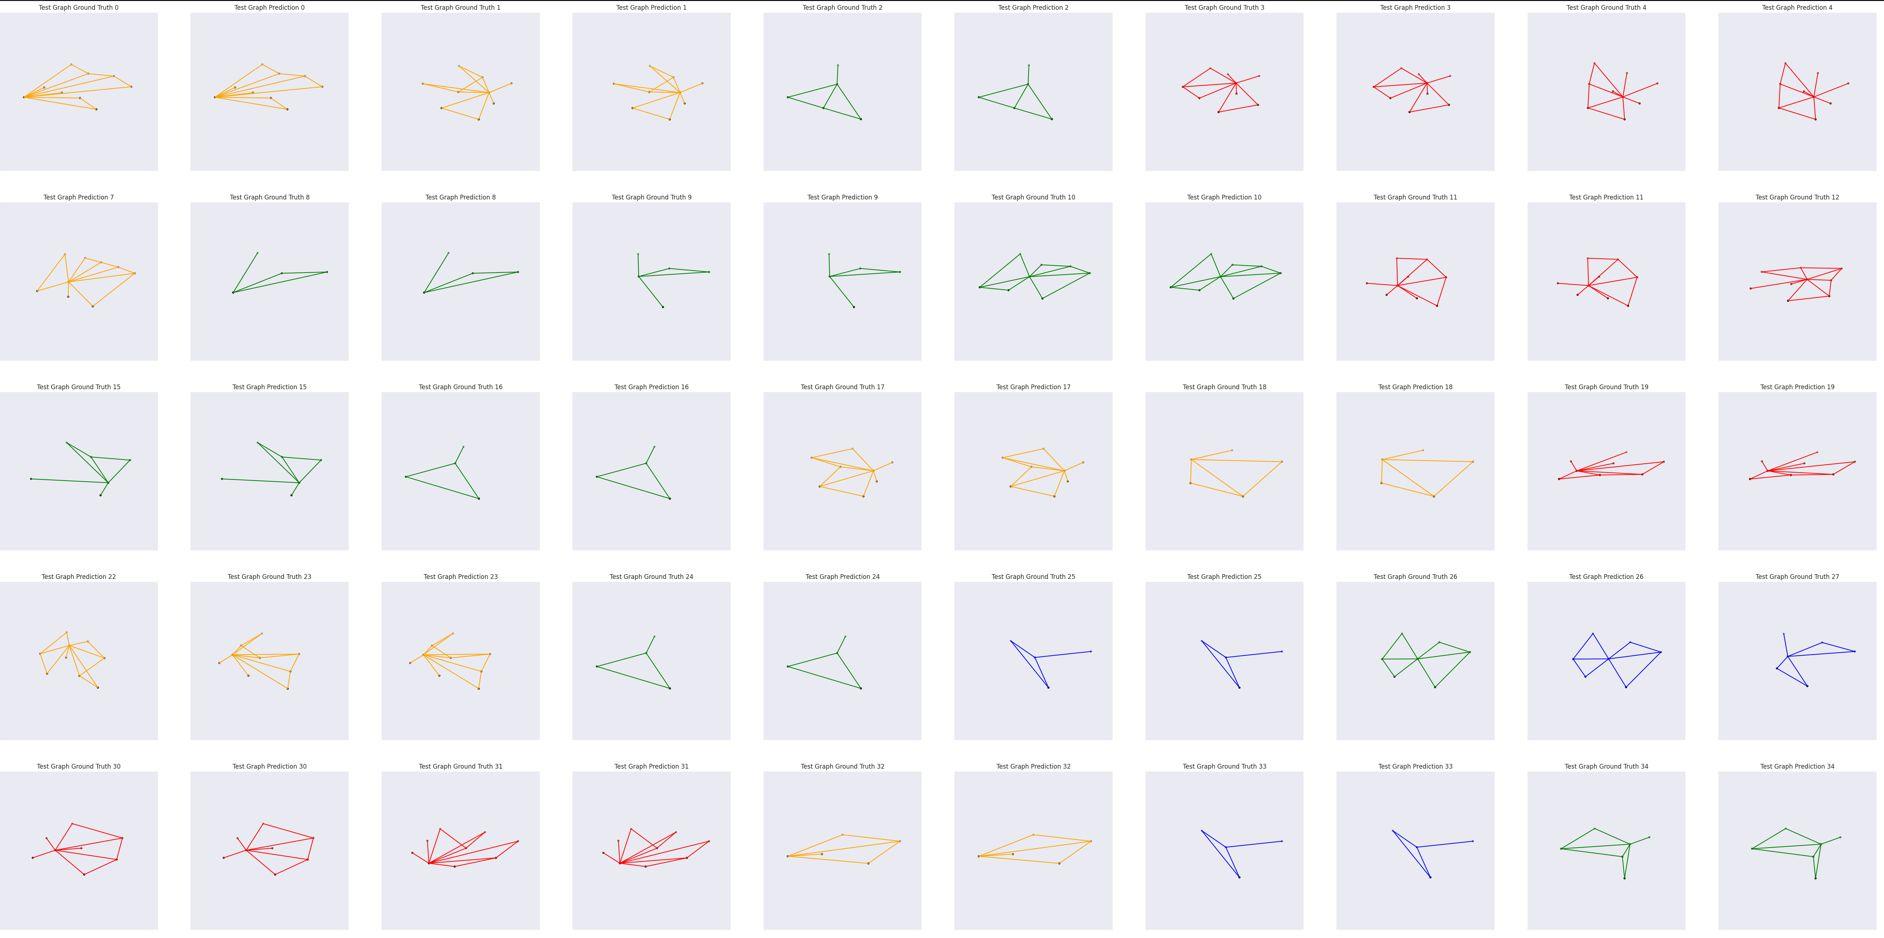
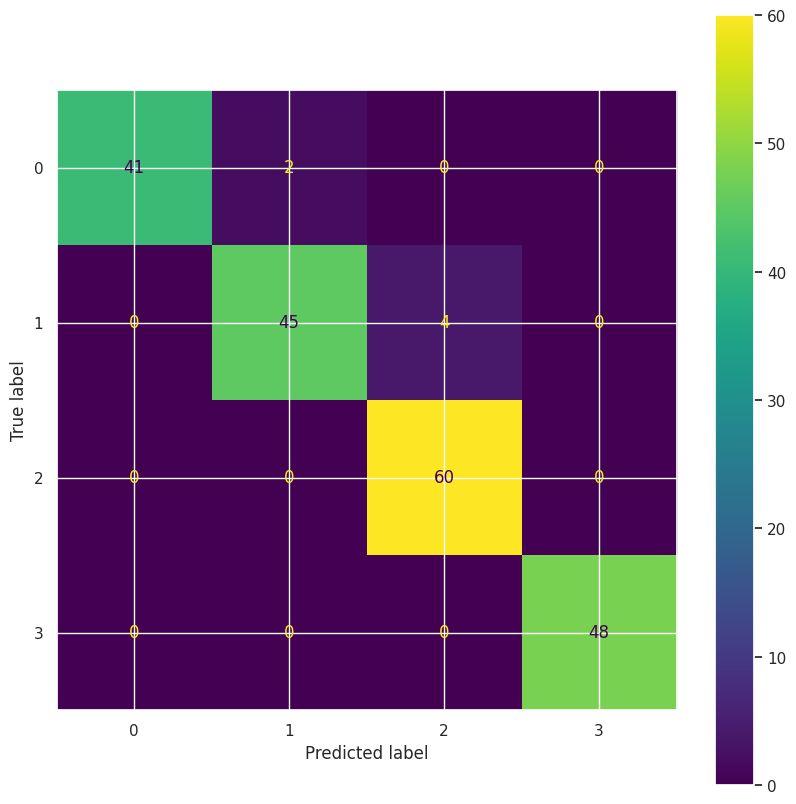
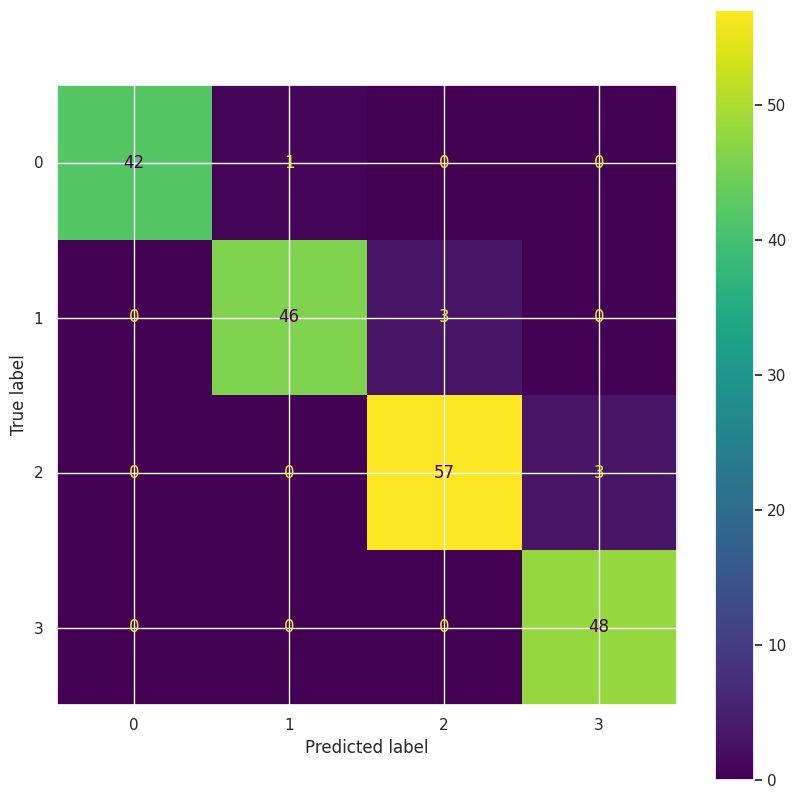
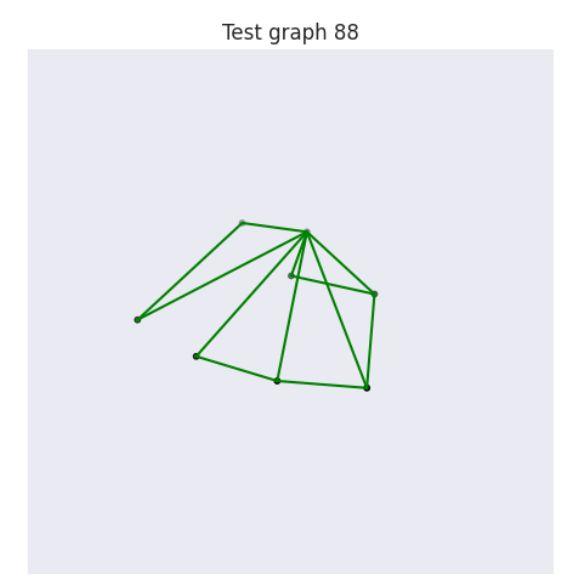
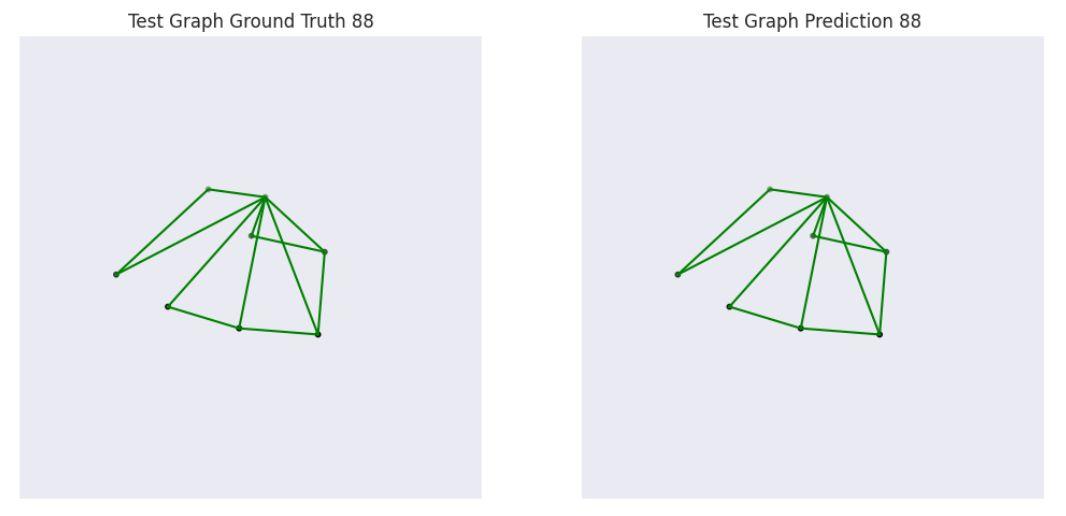
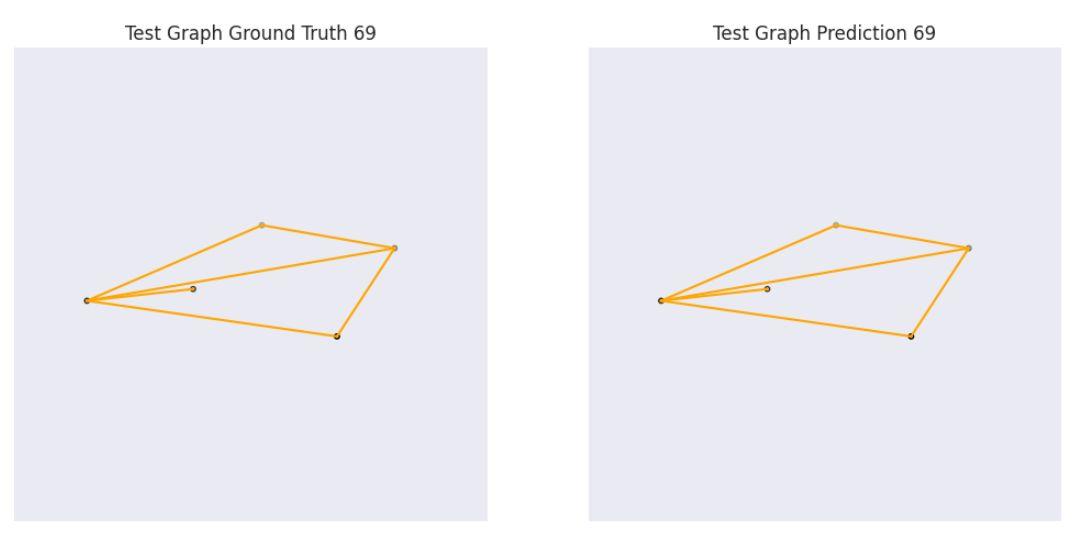
Model verification and testing
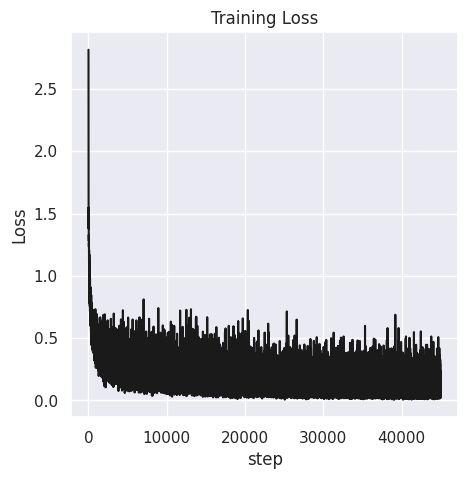
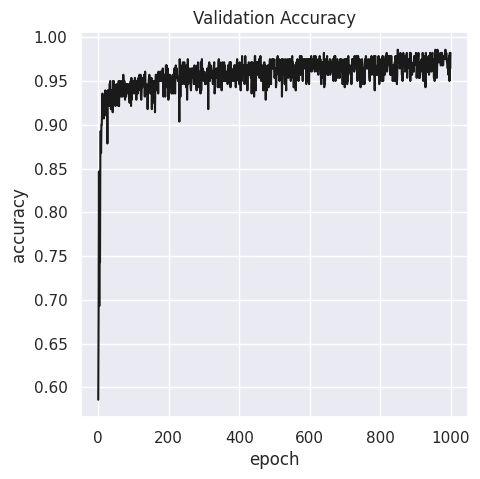
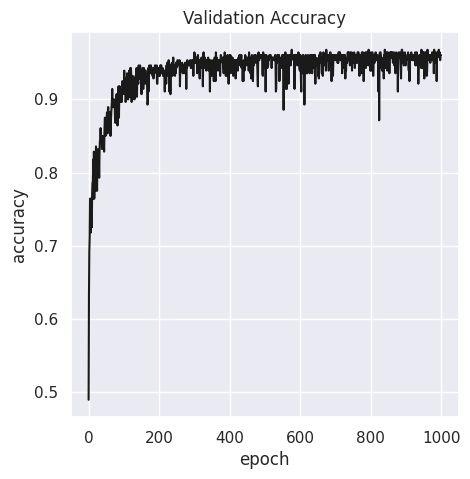
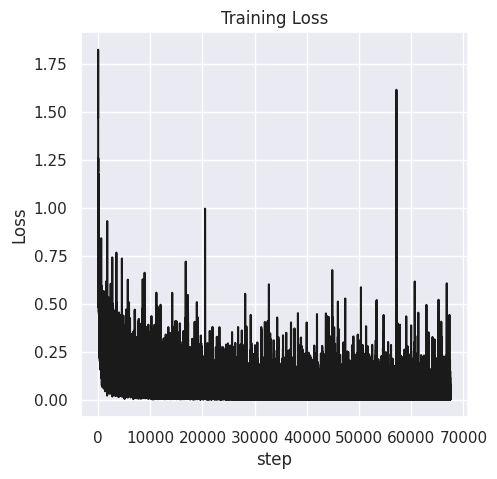
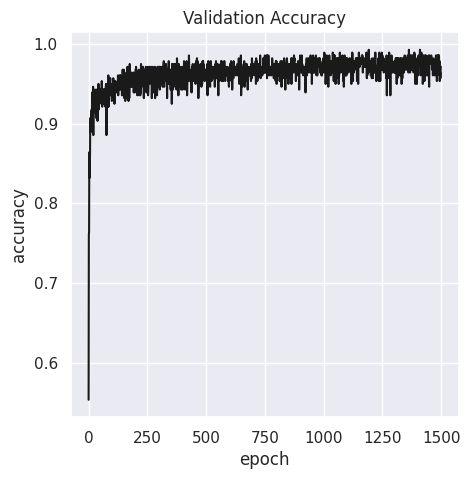
Model training
GML Model selection
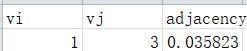
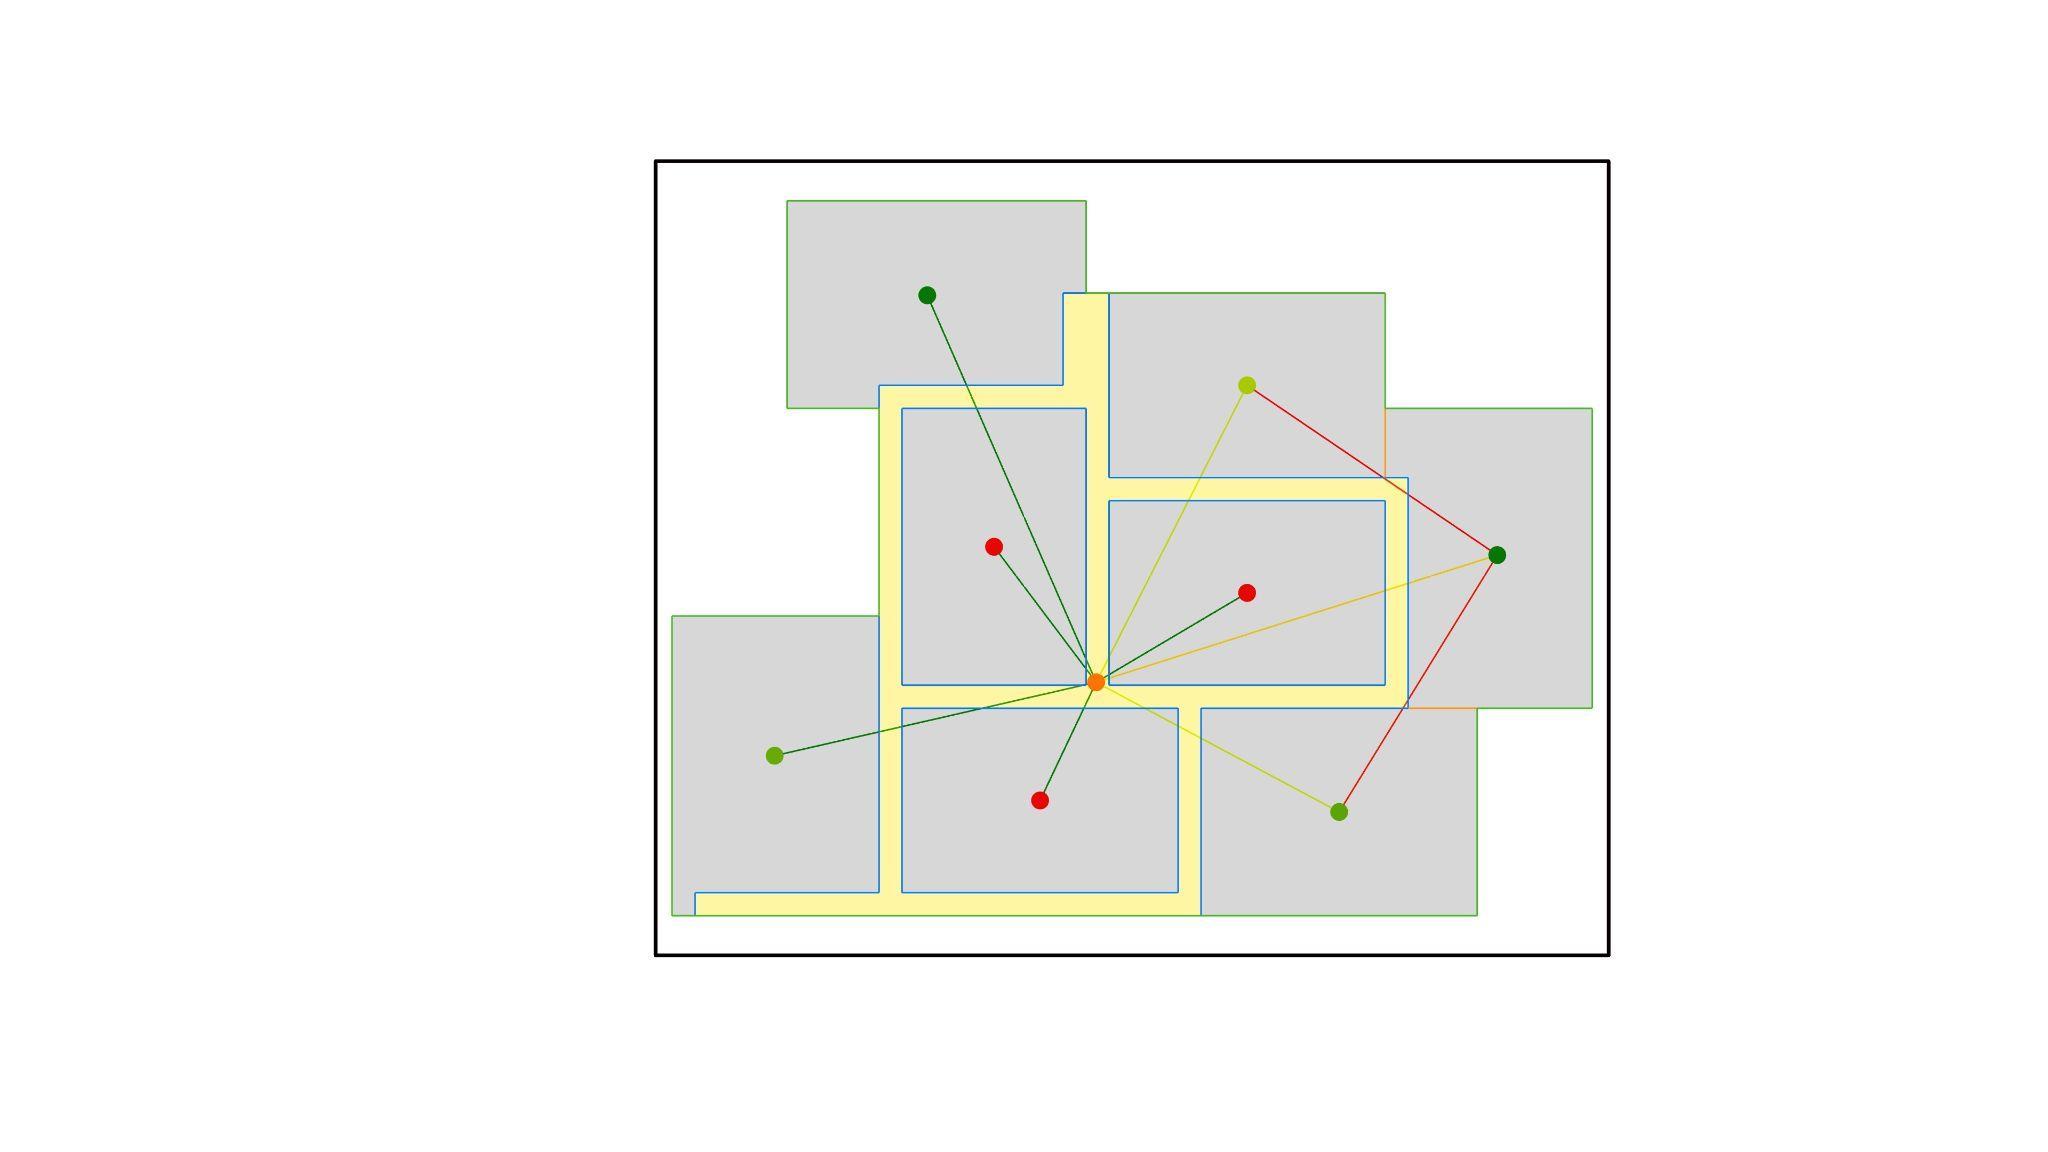
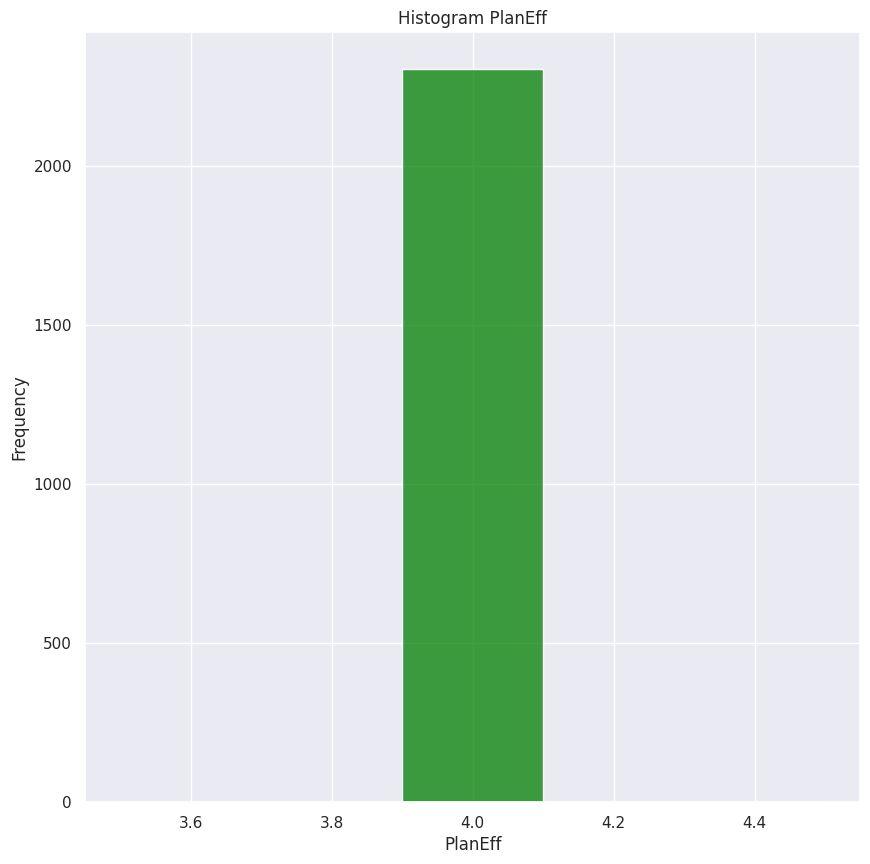
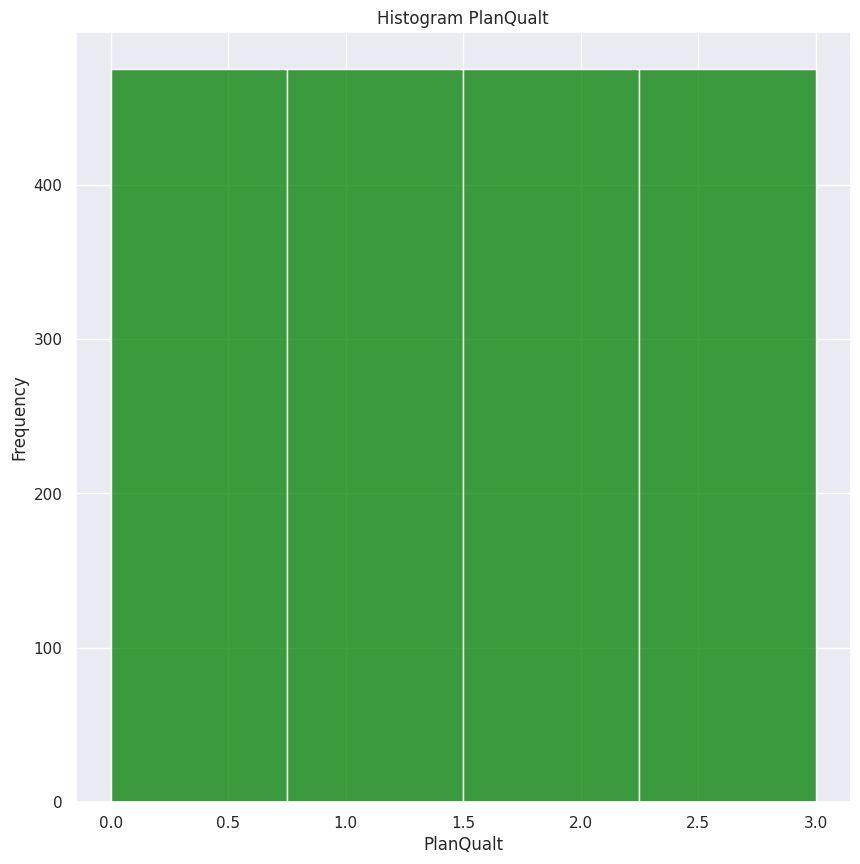
Define Parameters to encode on node, edge and graph levels
Dataset preparation
Problem definition & objective formulation
With the growing pressure on cities available spaces for vertical or horizontal expansion, it's crucial to make the most efficient use of the available spaces without compromising the space qualities.
Conventional work flow of floor plan design is rigid regarding evaluating the designed plans as most of times they are evaluated at the end of the design process.
It will be more interesting and time saving to get to evaluate the designs while designing the floor plans, to provide a continuous feedback loop that helps designers enhance and modify their designs.
The objective of this project is to develop an AI model that can instantly show floor plan performance metrics “Efficiency and quality” during the design process to help the designer in tackling the design problem

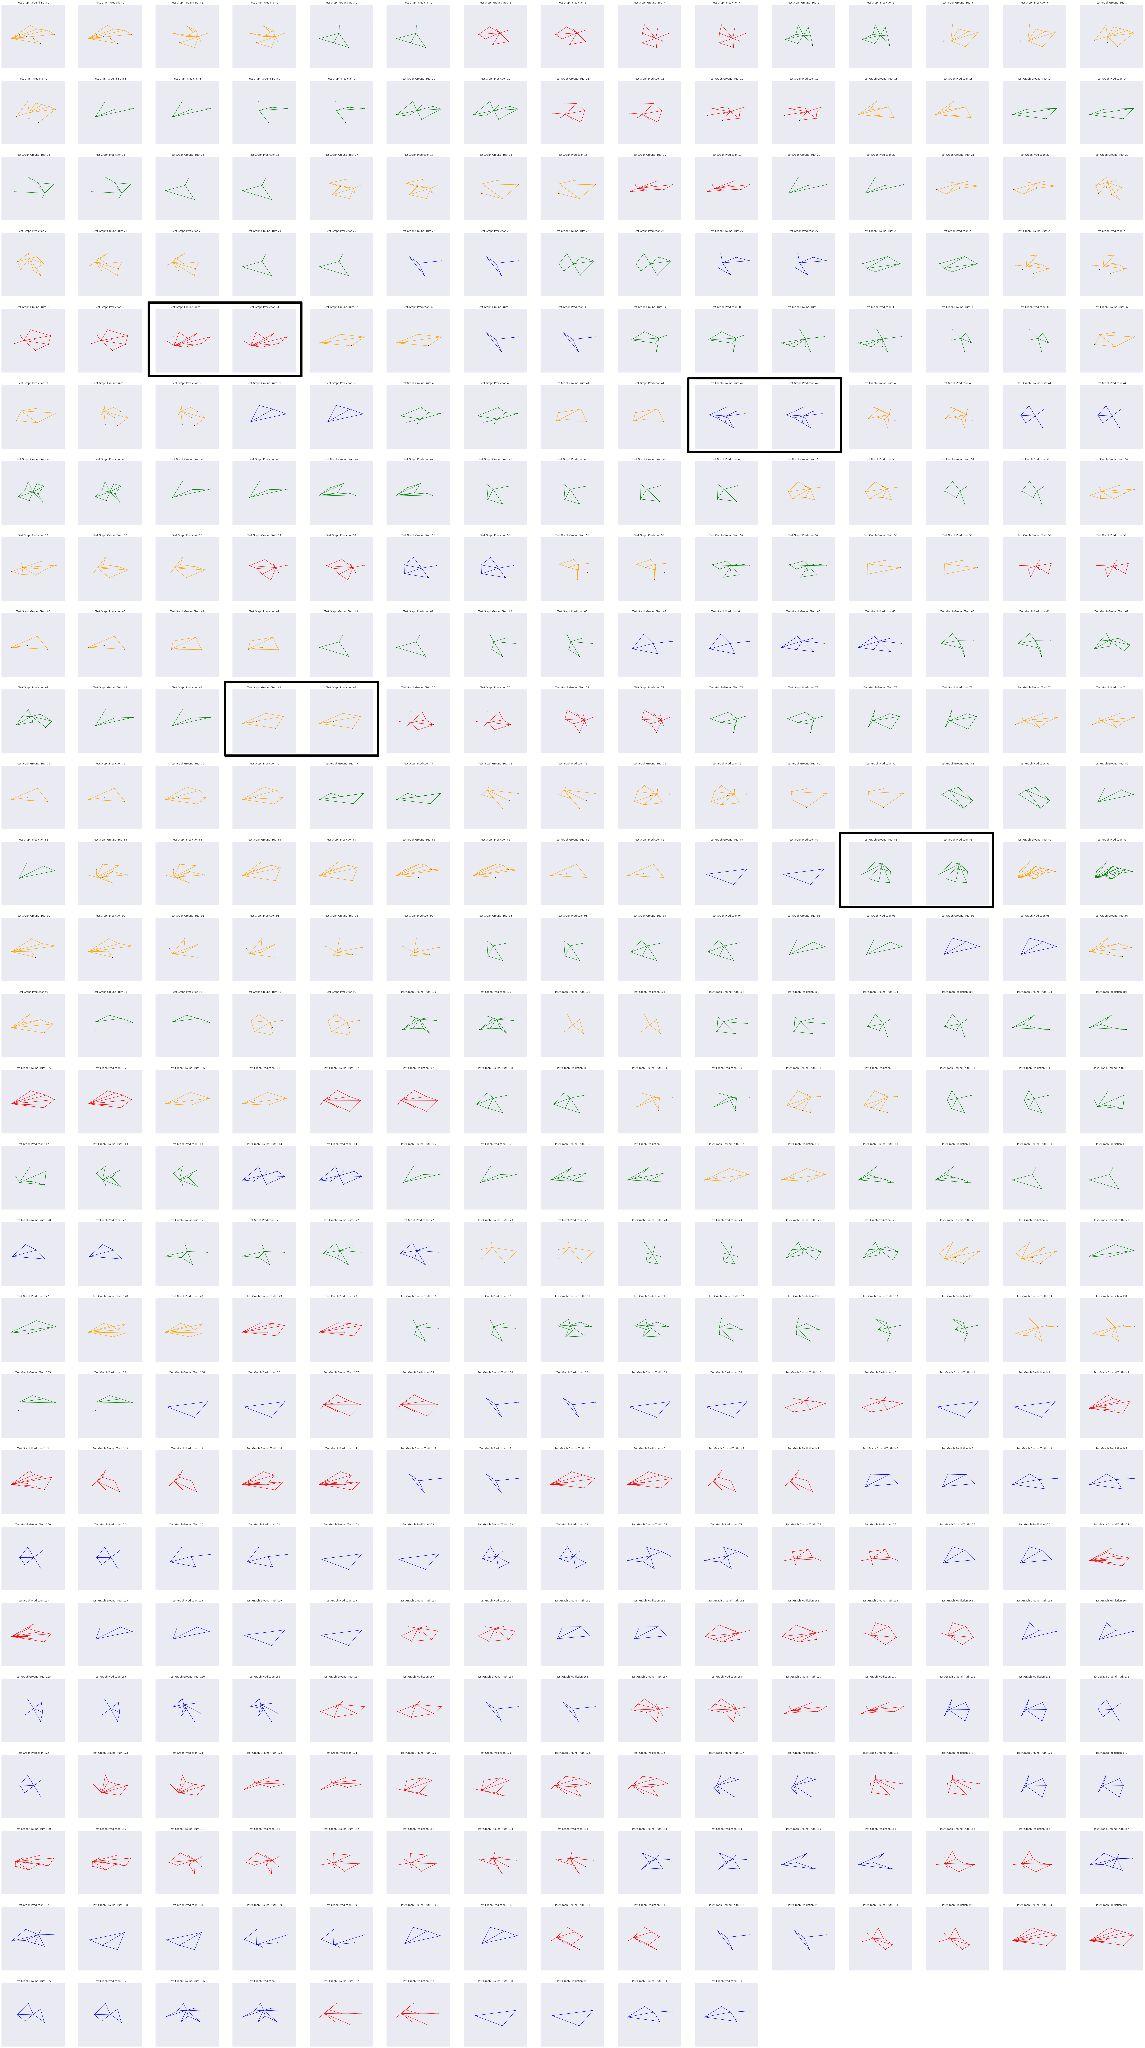
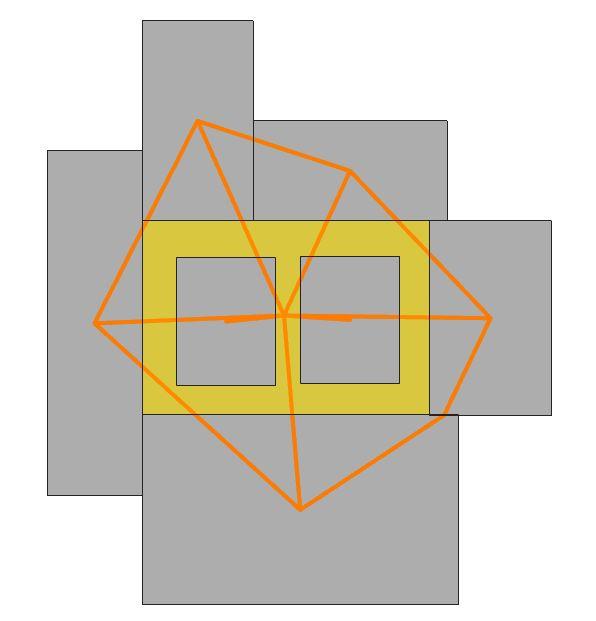
Using magnetizing rooms plugin we generated around 4000 floor plans with different number of rooms and a circulation area. we ensured good variation within our dataset Through variening:
rooms count
corridor type “ one sided or Two sided “
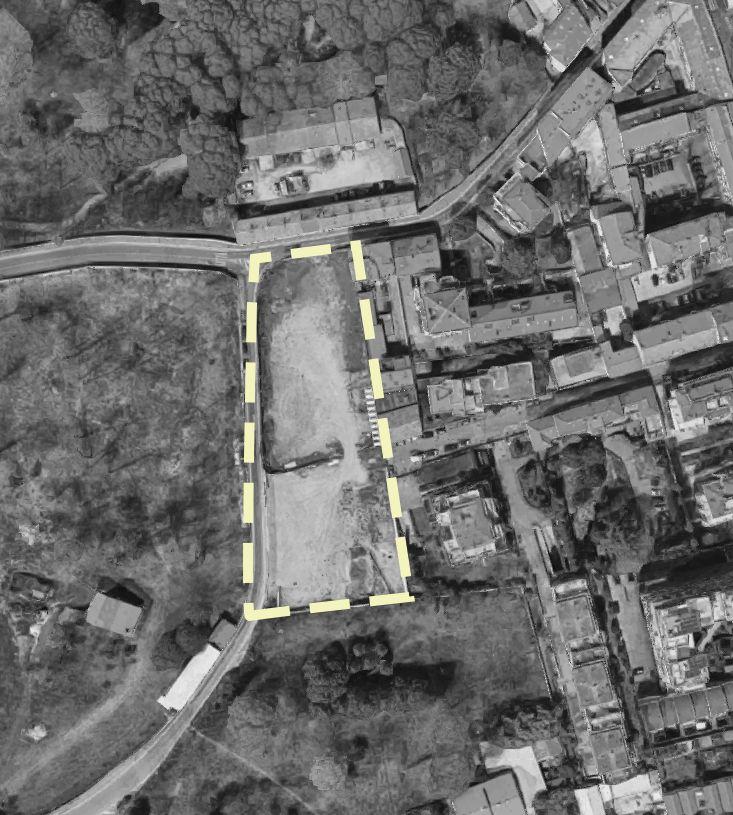
plot size
Plot proportions entrance position
Some Samples

4000 Samples Dataset

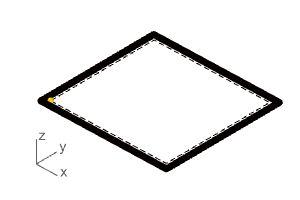
Corridor= 0 rooms= 1
Limitation due to the plugin used

is always fixed
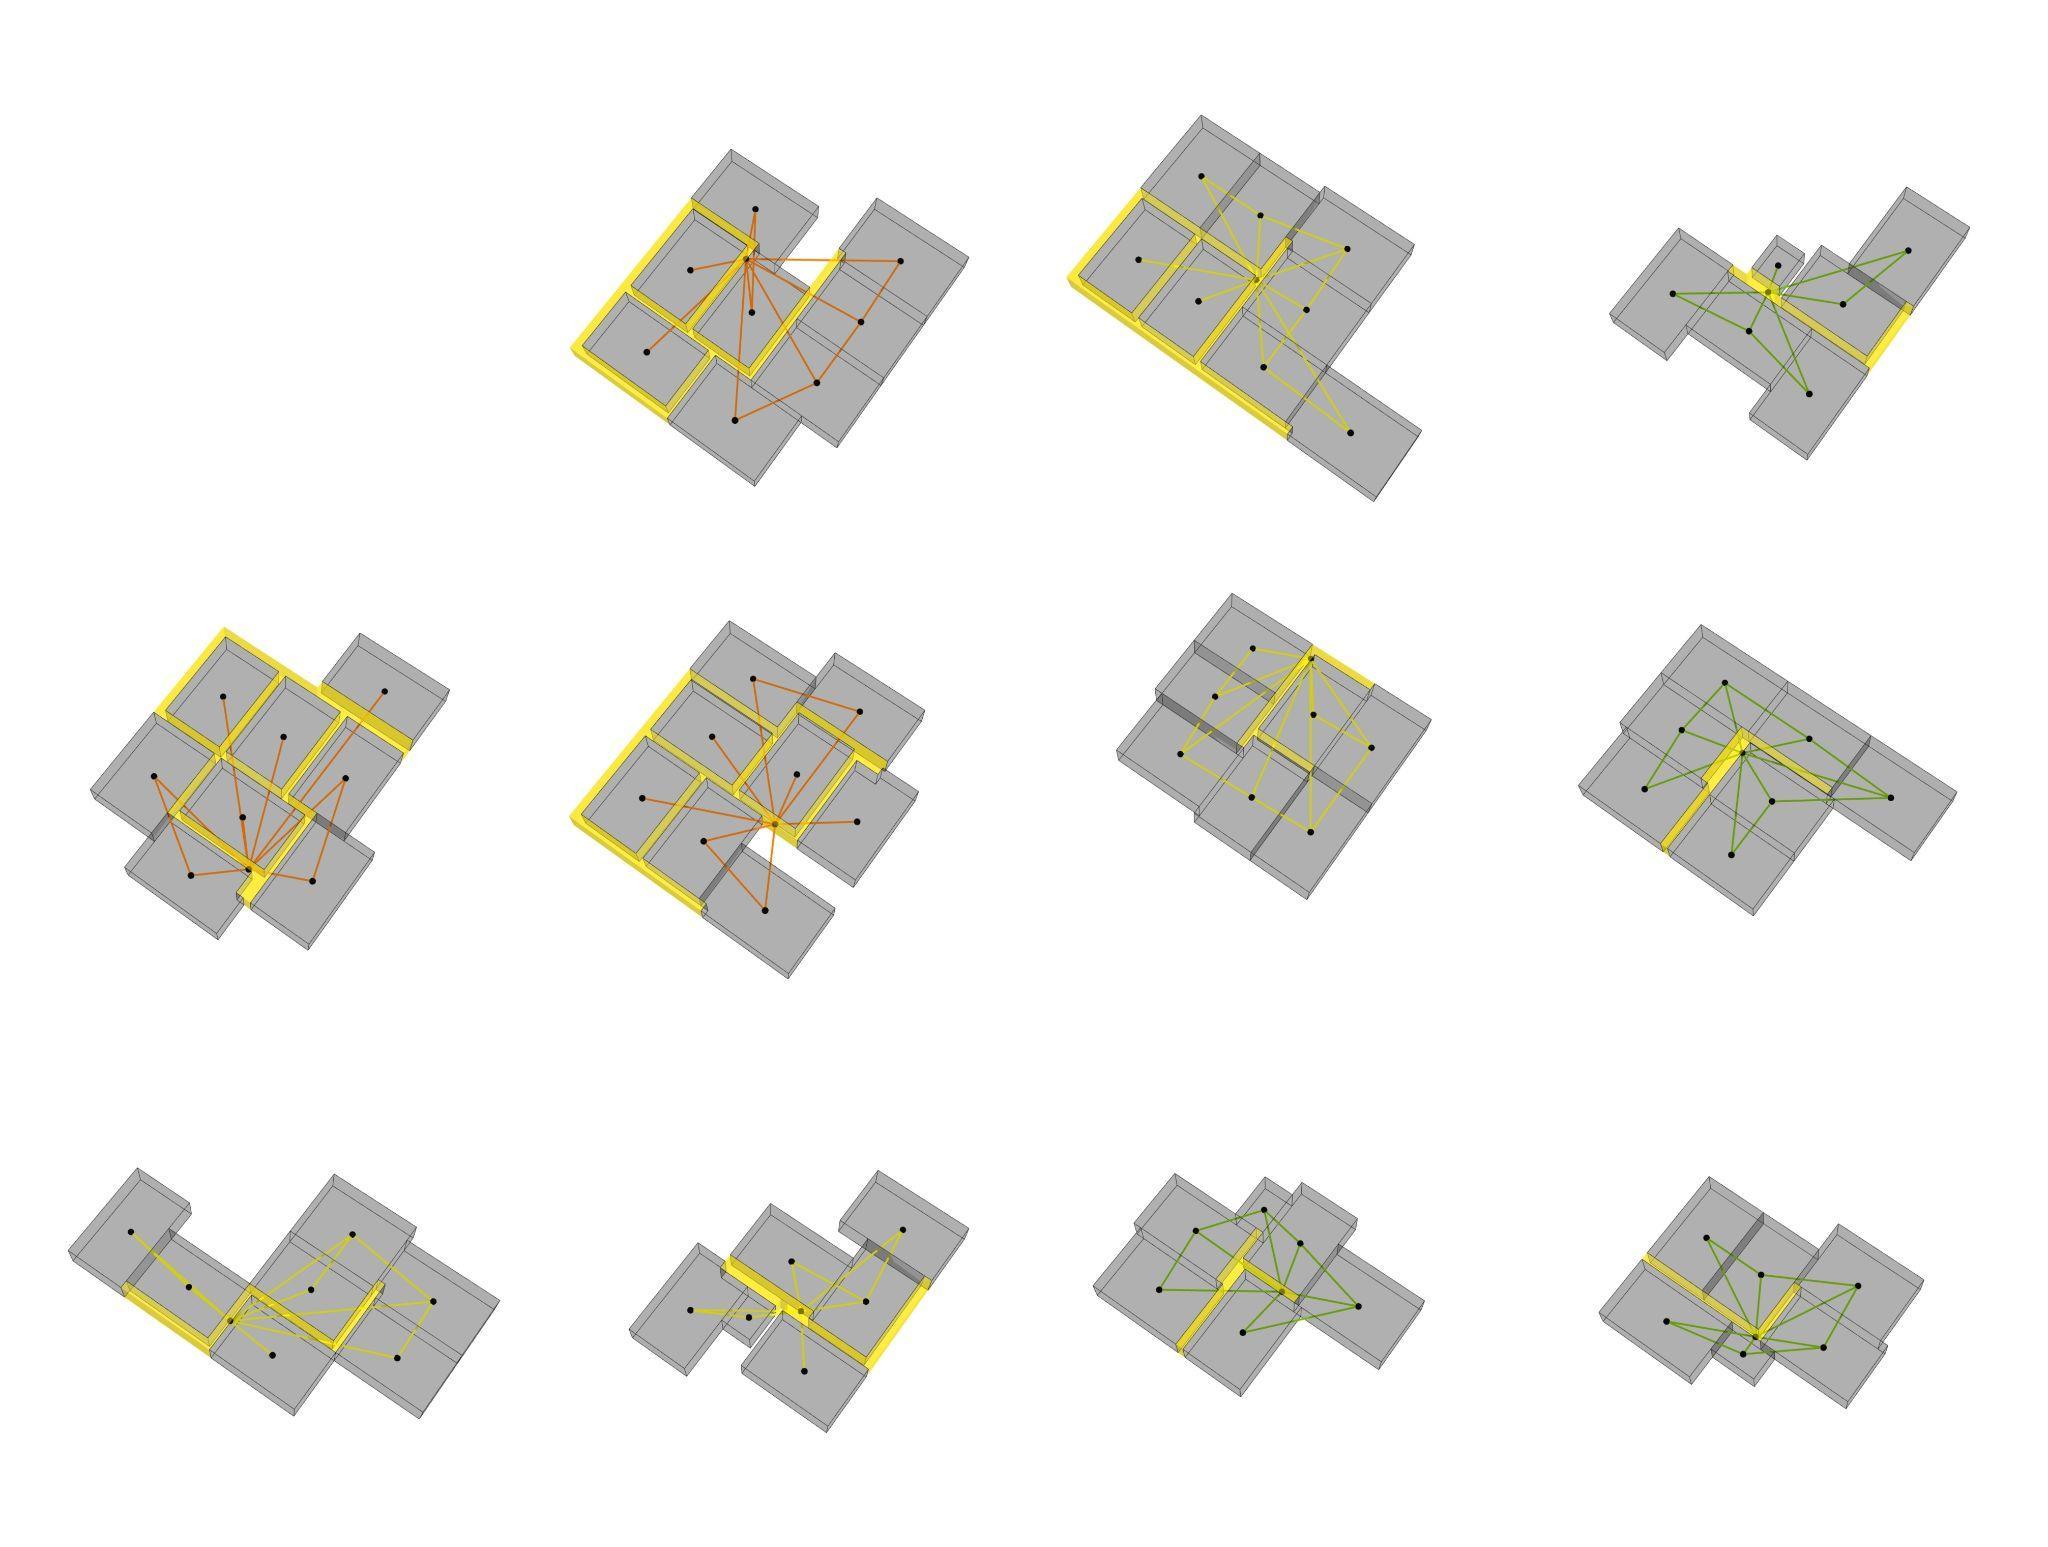
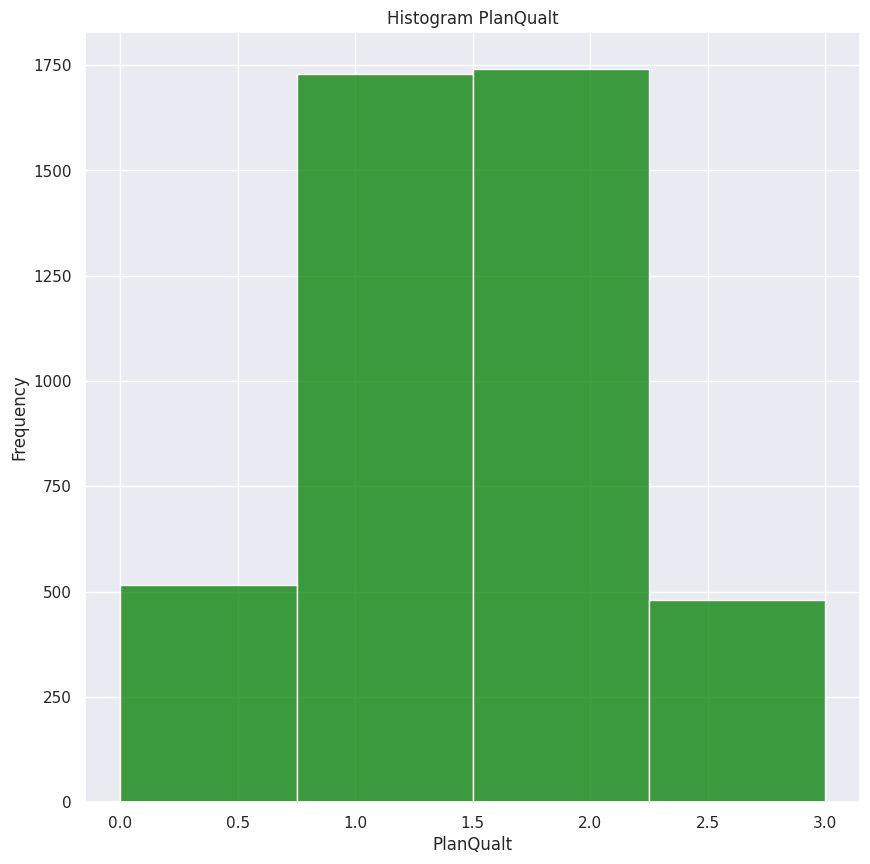
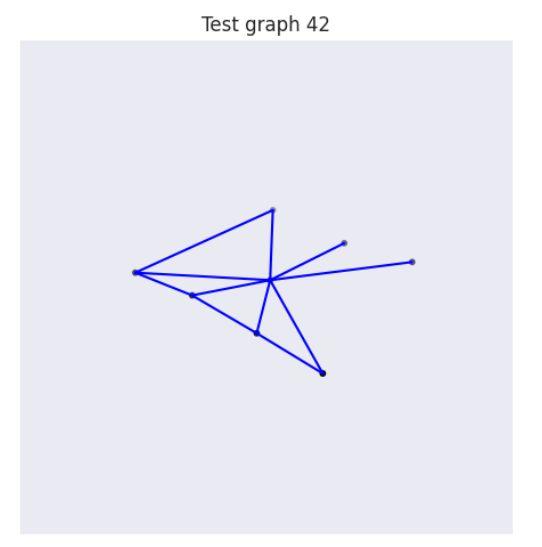
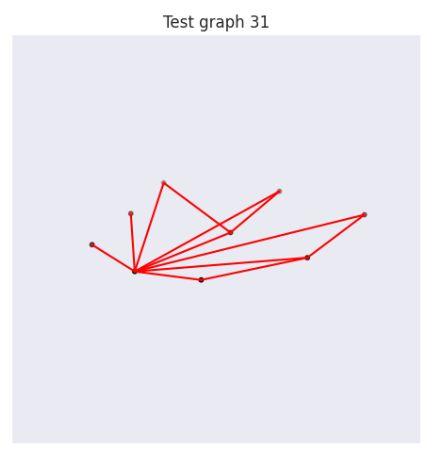
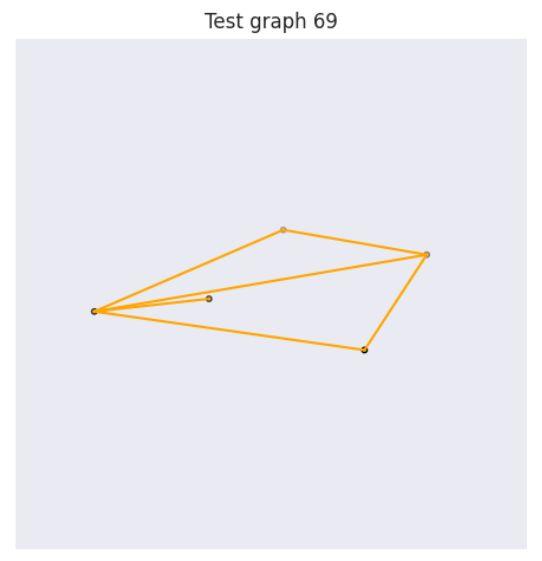
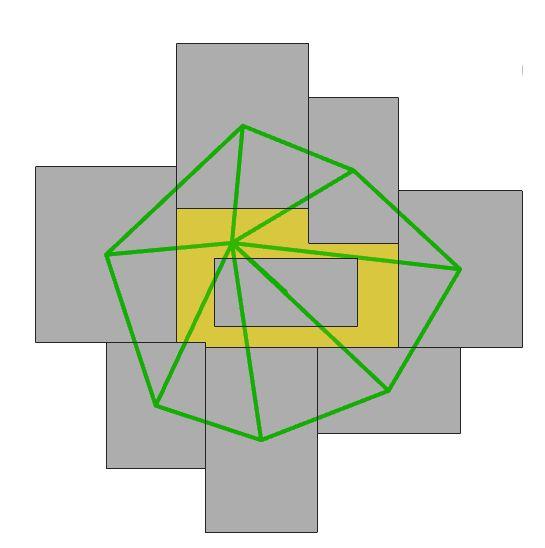
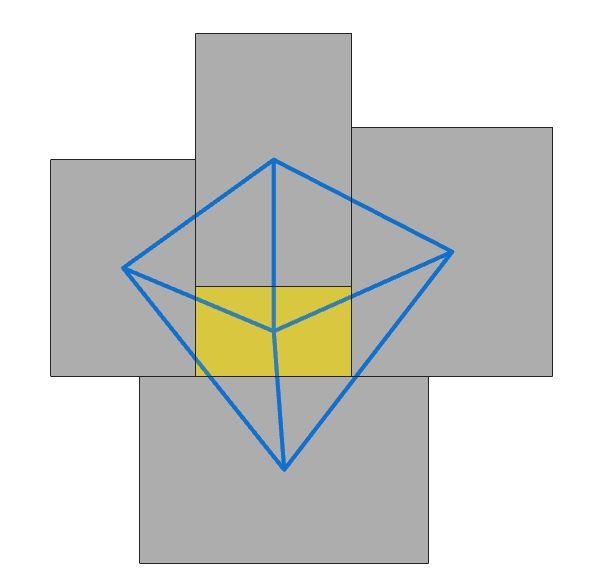
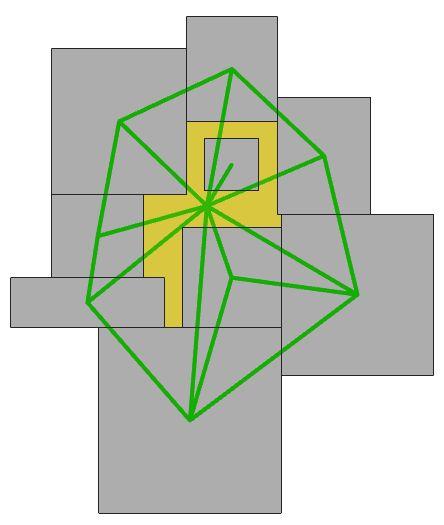
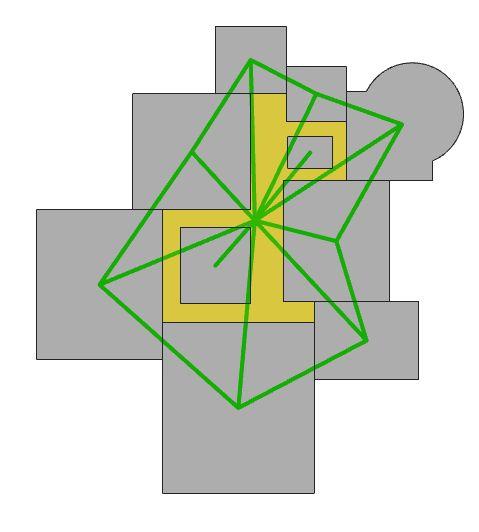
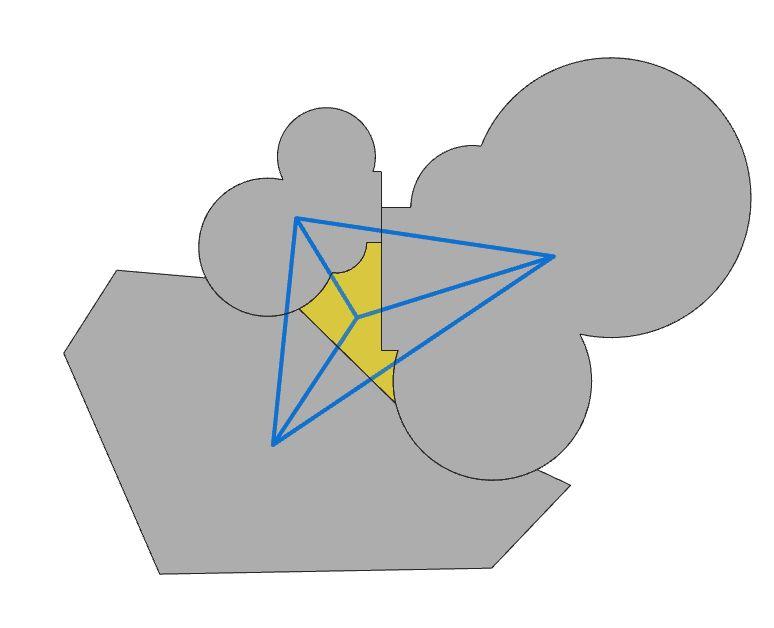
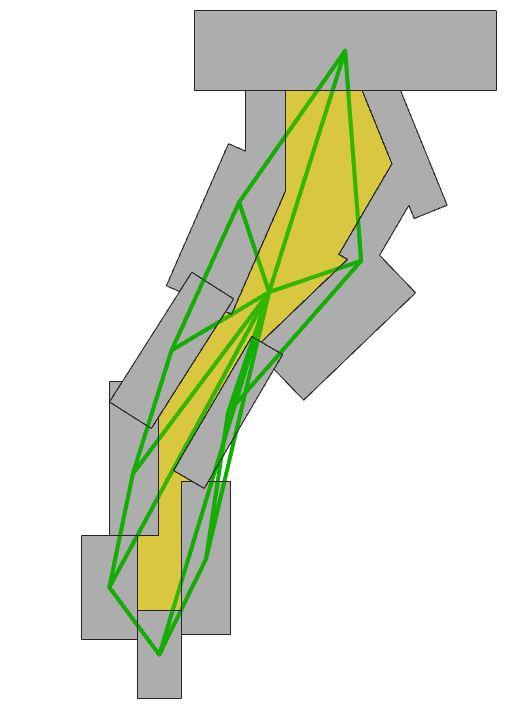
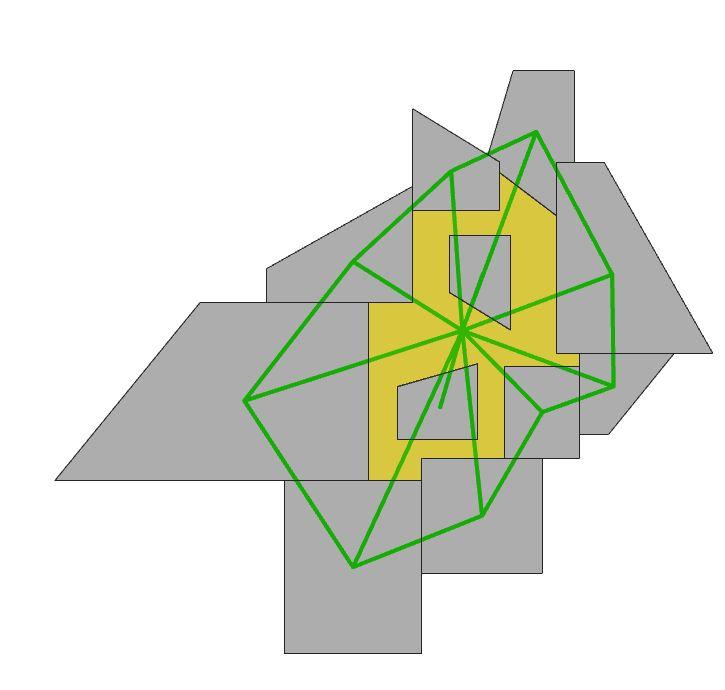
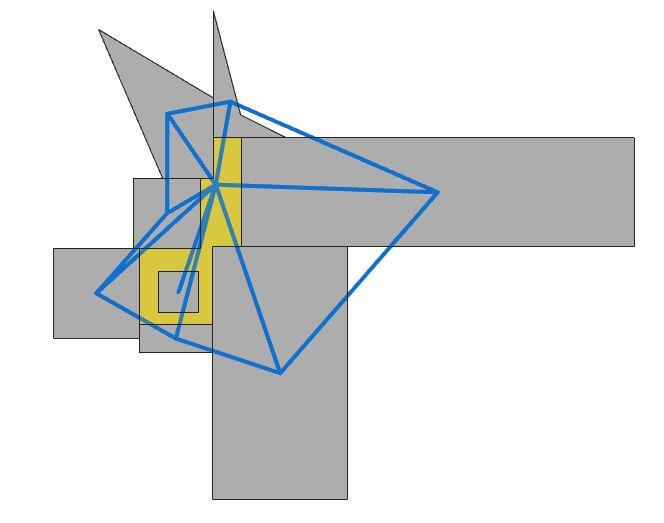
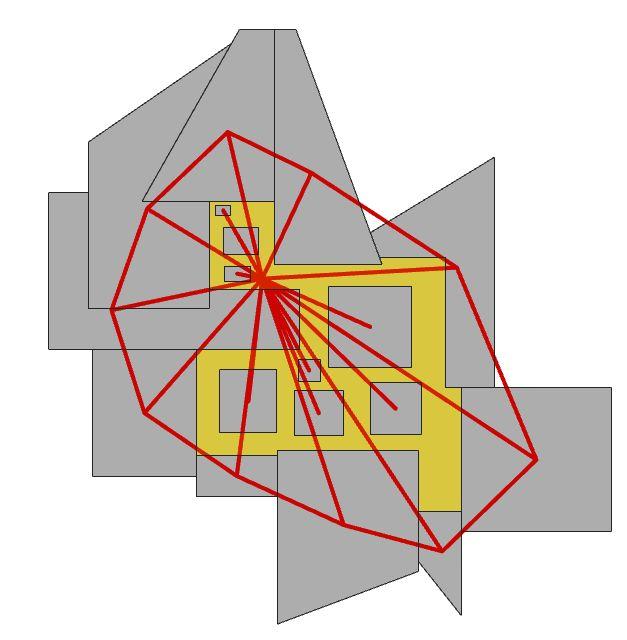
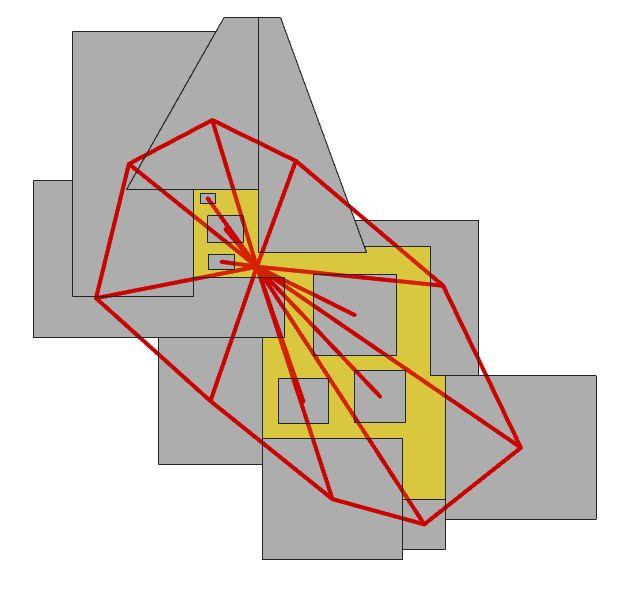
Graph Samples “ Classified by quality ”
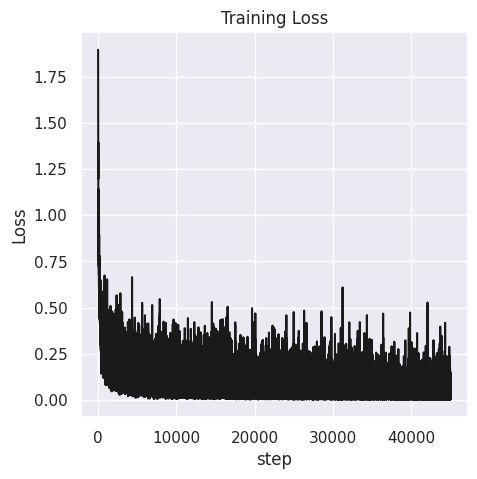

192h:
Model Accuracy = 98%
Class C
Class B

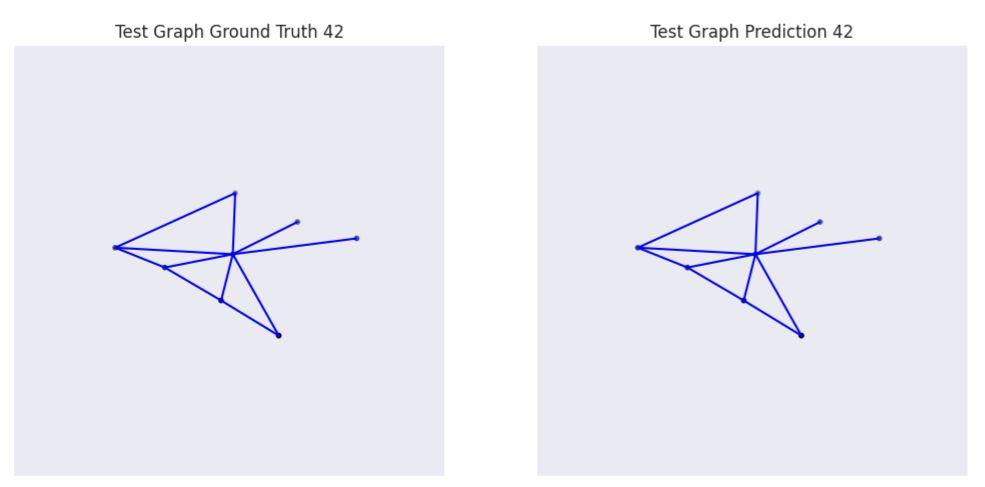
Actuall Classification = Class A
Predicted Classification = Class A
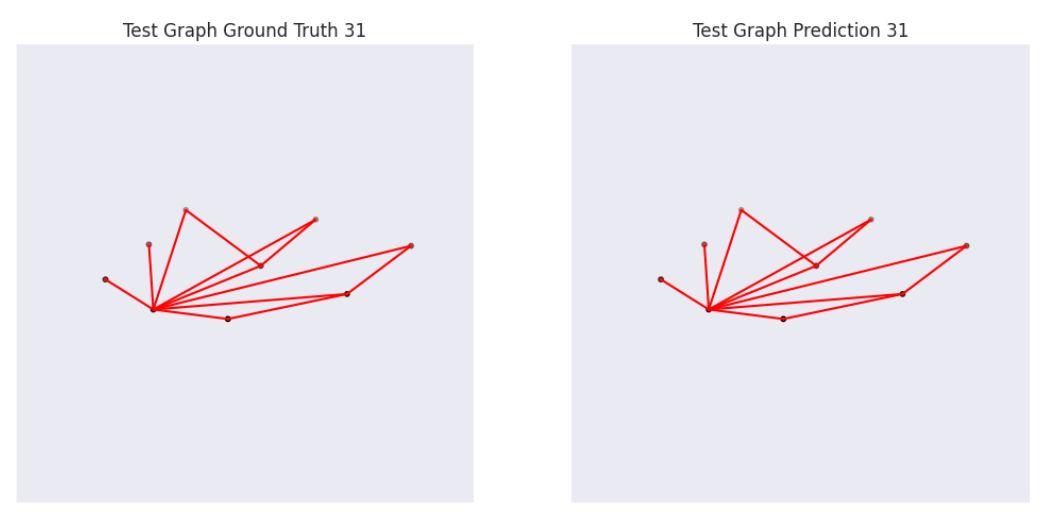
Actuall Classification = Class B
Predicted Classification = Class B
Actuall Classification = Class C
Predicted Classification = Class C
Actuall Classification = Class A
Predicted Classification = Class A
Actuall Classification = Class B
Predicted Classification = Class B
Actuall Classification = Class B
Predicted Classification = Class B
Plans out of training Domain
Actuall Classification = Class A
Predicted Classification = Class B
Error margin = 0.02
Actuall Classification = Class B
Predicted Classification = Class B
Here we tried different scales and the result is the same
“ model is not affected by plan area”
Actuall Classification = Class B
Predicted Classification = Class A
Error margin = 0.01
Actuall Classification = Class D
Predicted Classification = Class C
Error margin = 0.1
Actuall Classification = Class D
Predicted Classification = Class C
Error margin = 0.15
Conclusion:
The model performed in a very goodway regarding predicting plans quality within training domain, also it’s performance was good for predicting unseen out of training domain data with a minor margin of error ( only one class up or down in some plans ), overall graph SAGE classification showed a very good potential for our particular problem with acceptable ability to generalize.
Future work:
Our current research is based on 2D plan exploration. In the future, we hope to use similar methods to train prediction models suitable for 3D building layout quality.
Moreover the plugin we used to generate the dataset is limiting our possibilities to only train for quality maybe we can use another approach in plan generation to include more measures like efficiency.