Catalogue edited by Arnie Anonuevo, Daniel Crouch, Iona Fielding, Rose Grossel, Kate Hunter, Ellida Minelli, Massimo De Martini, Mia Rocquemore, Nick Trimming and Julian Wilson
Design by Ivone Chao and Nicky Valsamakis
Photography by Louie Fasciolo and Marco Maschiao
Terms and conditions: The condition of all books has been described. Each item may be assumed to be in good condition, unless otherwise stated. Dimensions are given height by width. All prices are net and do not include postage and packing. Invoices will be rendered in £ sterling. The title of goods does not pass to the purchaser until the invoice is paid in full.
Altea Gallery Limited 35 Saint George Street London W1S 2FN
The manuscript and printed archive of the maritime publisher Imray, Laurie, Norie and Wilson. Charting the firm’s birth, rise, and heyday, from the eighteenth to the beginning of the twentieth century.
“The sea, once it casts its spell, holds one in its net of wonder forever”
(Jacques Cousteau)
Over 70% of the World’s surface is covered by Ocean.
Over 80% of the volume of international trade in goods is carried by sea.
Introduction
It is with great pleasure that Altea Gallery and Daniel Crouch Rare Books bring you this catalogue of the manuscript and printed archive of the worldrenowned maritime chart publisher Imray, Laurie, Norie and Wilson Ltd. The collection features over 200 manuscript charts, and 24 atlases, together with catalogues, sailing directions, and associated ephemera. The archive depicts the maritime world during the last quarter of the eighteenth, and the first quarter of the nineteenth centuries. This is a world defined not only by great advances in navigation, exploration, economics, and science, but also a world shaped by political upheaval and revolutions, and by the emergence of the British Empire as the world’s pre-eminent superpower. This is a world in which the map can be seen as a symbol of progress and of the Age of Reason: a physical manifestation of the scientific method and of the organization of knowledge. It is no accident that the encyclopaedists Diderot and d’Alembert, called their work “a kind of world map”, or Ephraim Chambers referred to his 1728 dictionary as a “map of knowledge”, or that Carl Linnaeus described his system of classification as a “mappa naturae”. No form of cartography is more redolent of this than the sea chart: a scientific instrument that codifies and defines the globe and enables commerce and wealth creation.
All the maps and atlases in this collection are rare. The majority are unique. This is in part due to the naturally high mortality rate for paper goods used at sea; in part because inaccurate navigation costs lives, and so it was active policy on board ship to destroy out-of-date charts; in part because many charts and other papers were lost when the firm’s offices at 123 Minories were gutted by incendiary bombs during the Blitz in 1941; and in part because of the extraordinary circumstances under which the firm of Imray, Laurie, Norie and Wilson Ltd came into existence.
Nothing of its like has ever been brought to the market before. This is because it couldn’t have been. The archive is the largest repository of the surviving manuscripts of eighteenth and nineteenth-century private sector chartmaking. Established in 1904 as an amalgam of the four main chart publishers of the previous century, the firm of Imray, Laurie, Norie and Wilson Ltd was a response to legislation introduced that year mandating the use of Admiralty Charts for all vessels sailing under the British flag. This consolidated nearly the entire private sector production of maps, atlases, instruments, and sailing directions under one umbrella. The company’s history is, therefore, the story of the British chart trade and of the makers of the so-called “blueback charts”, named for the strong blue paper used as a protective backing. A detailed history of how this consolidation came about may be found in Volume III of the catalogue.
A note on the catalogue
We have arranged the collection, the vast bulk of which is formed by the output of the firms of Robert Sayer and Laurie & Whittle, in three volumes:
Volume I: The Atlantic Ocean
The Americas, The North and Irish Seas, The Baltic, The Channel, The Mediterranean, and Africa, including: the Canadian surveys of Captain James Cook, which includes one of only two known copper plates of his work; the mysterious Captain Holland’s charts of the northeastern seaboard of the newly-minted United States of America; Bernard Romans’s manuscript for his monumental chart of Florida – a genuine “treasure map” used to locate a sunken Spanish galleon; Joseph Huddart’s accurate surveys of the waters surrounding the British Isles; charts documenting the infamous “Middle Passage” route between West Africa, the West Indies, and the Americas, by which ships crossed the Atlantic Ocean with their cargo of enslaved people.
Volume II: The Indian & Pacific Oceans
The second volume encompasses the navigation of the Indian Ocean, the China Seas, Australia, and the Pacific, and includes: the manuscript, two engraved variants, and Australian extension, of Robert Sayer’s spectacular wall chart of the Indian Ocean; early mapping of Mauritius, the Seychelles, the Maldives, Andaman, and Nicobar Islands; Benjamin Lacam’s track across the Indian Ocean and attempts to build, and then defend, “New Harbour” on the Hooghly River; the navigation of the Straits of Malacca and Singapore, Captain Lloyd’s surveys of the Sunda and Banca Straits and the Spice Islands on board the ‘General Elliot’; the manuscripts for Captain Robert Carr’s chart of the Philippines, Joseph Huddart’s charts of the Pearl River and Hong Kong; as well as depictions of Australia and the Pacific Islands, just prior to the arrival ofthe First Fleet.
Volume III: Atlases, Sailing Directions, and Ephemera
The third volume includes 24 rare atlases, and several unique items of interest to the history of map and chart publishing, such as the annotated catalogues of the publications of Sayer and Laurie & Whittle in the late-eighteenth century;
J. W. Norie’s own copy of his rival John Hamilton Moore’s ‘New Practical Navigator’, liberally annotated with detailed criticisms; portraits of the hydrographers John Hamilton Moore and J. W. Norie, and, of course, there is Lord Nelson’s favourite chair!
Enjoy!
Daniel, Massimo, and Nick
Northwest Passage
Stan Rogers
Atlantic Ocean
Cook’s surveys of the St. Lawrence and Newfoundland
At the Treaty of Paris in 1763, France had relinquished all of Newfoundland to the British, except for the islands of St. Pierre and Miquelon off the south coast,... but no reliable maps of the area existed and, “if disputes between the English and French fishermen were to be averted, there must be a survey” (Skelton and Tooley).
This monumental task was offered to the still young James Cook, as his first major commission, secured for him by the first British Governor of the newly acquired territory, Commodore Hugh Palliser, under whom Cook had served aboard the HMS ‘Eagle’ during the Seven Years’ War.
The result “was unequalled, for thoroughness, and method, by any previous hydrographic work by Englishmen; and it produced the first charts of this extensive and difficult coastline that could... with any degree of safety be trusted by the seaman” (Skelton and Tooley).
Cook sold the copyright for his charts to Thomas Jefferys, before embarking on his epic voyage in HMB ‘Endeavour’ to the Pacific. Jefferys then sold some of his plates to Sayer and Bennet, and they acquired the rest after Jefferys died in 1771.
Atlantic Seaboard of North America
Sayer and Bennett probably began preparing one of their earliest charts of the Atlantic Ocean during the opening salvos of the American War of Independence in 1775, providing the British men-o-war with much needed navigational detail.
However, their charts of the Ocean were also of considerable interest to traders: including whalers and slavers.
Many of the Laurie and Whittle’s charts of the eastern seaboard of North America cite as author, or source, the mysterious “Captain N. Holland”. This may be an erroneous reference to Samuel Holland, contemporary of Des Barres, and fellow surveyor with Captain James Cook of the St. Lawrence River and Newfoundland, and the eastern seaboard of North America. Or, it may be a deliberate pseudonym, to conceal the identity of one, or more, official government cartographers moonlighting their maps to the highest private bidder. Many institutions, however, credit the chart to Captain Nathaniel Holland, without any other information.
FLEURIEU, Charles Pierre Claret de
A New General Chart of the Atlantic or Western Ocean and Adjacent Seas, including the Coasts of Europe and Africa From 60 Degrees North Latitude to the Equator, and also the Opposite Coast of America, Drawn and Regulated by the most accurate Astronomic Observations, and the Journals of the most experience Navigators: in which also are particularly distinguished the Determination of Longitude as given by the Marine Clocks of M.r Ferdinand Berthoud, in the Voyage performed by order of the Government of France, in 1768 and 1769, in the Ship Isis, to the Azores, Madera, the Canaries, Cape-Verd Islands, St. Domingo, the Great Bank of Newfoundland &ca. By Mr. de Fleurieu an Officer in the French Navy and Member of the Royal *Marine Academy &ca.
Publication [London, c.1776].
Description
Original working manuscript chart on four separate sheets, pen and black ink on paper, each sheet inscribed “4” in one lower corner, some minor manuscript losses.
Dimensions
Sheet one: 525 by 730mm (20.75by 28.7 inches); sheet two: 520 by 730mm (20.5 by 28.7 inches); sheet three: 520 by 730mm (20.5 by 28.7 inches); sheet four: 515 by 725mm (20.2 by 28.5 inches).
American Atlantic seaboard: “The third of the kind hereto made public” (Advertisement)
Sayer and Bennett probably began preparing this chart during the opening salvos of the American War of Independence in 1775. It is an extremely detailed chart of the Atlantic rim: from Labrador to Guyana, and the Shetland Islands to the Gulf of Guinea, and would have provided the British men-o-war with much needed navigational detail.
A lengthy “Advertisment” in the heart of western Africa details the map’s pedigree: citing the Van Keulen family chart as the first of the Atlantic, then an unnamed cartographer from London, who so “miserably mangled” many of the essential details, that the poor engraver added two whole new islands to the Cape Verdes. In their own chart they have chosen to ignore the various “Vigias”, or tops of submerged mountains as “it is extremely possible to mistake one of them for another, or to repeat them”, and anyway, they might be “whales”. Apparently whales can be particularly tricky, since one mariner cited mistook a dead carcass for a large bird.
No imprint appears on this chart, however it was first published by Sayer and Bennett in 1777, and then reprinted until 1803, with various amendments.
[LAURIE, Robert; and James WHITTLE; after Robert SAYER; and Charles Pierre Claret de FLEURIEU
A New General Chart of the Atlantic or Western Ocean and Adjacent Seas, including the Coasts of Europe and Africa from 60 Degrees North Latitude to the Equator and also the opposite Coast of America : drawn and Regulated to the most accurate Astronomic Observations, and the Journals of the most experience Navigators, in which also one particularly distinguished the determinations of the longitude as given by the Marine Clocks of Mr. Ferdinand Berthoud in the Voyage performed by orden of the Goverment of France in 1768 and 1769 in the Ship Isis to the Azores, Madeira, the Canaries, Cape-Verd Islands, St. Domingo, the Great Bank of Newfoundland.
Publication
London, Printed for Robert Sayer, Print, Map and Sea Chart Seller, No 53 Fleet Street, as the Act directs, Aug.t 10, 1786 [altered to “1793”].
Description
Engraved chart on 3 (of a potential 4) sheets, with inset corrections and extensive revisions in pen and red ink.
Dimensions
Sheet one: 500 by 710mm (19.7 by 27.96 inches); sheet two: 535 by 720mm (21 by 28.25 inches); sheet three: 525 by 720mm (20 by 28.25 inches).
Preparing for one of the earliest maps to name the “United States”
First published, in 4 sheets, as ‘A New General Chart of the Atlantic or Western Ocean and Adjacent Seas,.... By Mr. de Fleurieu an Officer in the French Navy and Member of the Royal *Marine Academy &ca’ by Sayer and Bennett in 1777 (see item 1), and then reprinted, with amendments by Robert Sayer and then Laurie and Whittle until 1802.
The present chart is a preliminary draught for Laurie and Whittle’s 1794 re-issue of the original 1777 chart, and is made up from engraved sheets pulled from the lower two, and upper left printing plates of the 1786 reprint, which after nearly 10 years of use are clearly quite worn, and in desperate need of renewal on those grounds alone, but also in order to update information. This is supplied in the form of inset corrections and extensive amendments, including: the addition of “UNITED STATES”, extensive revisions to the northeastern seaboard of North America from Manhattan to Labrador, the St. Lawrence River, the northern coastline of Central America, the Antilles, Guiana, and Greenland, on the western sheets; and all of the visible coast of western Africa, on the eastern sheet.
In an act of thrift and economy, the three plates have each been printed on the verso of older charts; in this case Sayer’s chart of: ‘Plymouth Sound, Hamoaze and Catwater surveyed in 1786. London, published by R. Sayer, Fleet Street No. 53, Fleet Street, Nov. 10th, 1786.’
The published version of the 1794 issue is exceptionally rare, with only one example located at the Biblioteca National de Espana.
[LAURIE, Robert; and James WHITTLE]
The Western Part of the Atlantic Ocean, Greenland to the Equator.
Publication [London, after 1803].
Description
Original working manuscript chart, pen and black and red ink, and pencil on paper, one inset correction, lower left corner excised.
Dimensions 630 by 820mm (24.75 by 32.25 inches).
American Atlantic seaboard: the western Atlantic Ocean: “the sprigs are small and few”
The top sheet (of two) of an apparently unpublished and very large chart of the western Atlantic Ocean, not unlike the Laurie and Whittle chart ‘A New and Correct Chart from the 63º of lat. N. to the Cape of Good Hope and from 71º Long. W to the 38º E. of London: Exhibiting the whole of the atlantic or Western Ocean’ (1802), but further west, and possibly meant as a companion.
The chart shows the Canadian Maritimes in great detail, including a corrective inset of the coast of Labrador, and amendments to the western reaches of the St. Lawrence River. Observations on the chart are recorded to 1803. A very large blank inset in Canada was intended to include a scale of distances.
Rather curiously, along one of the arrows that mark the arc of the gulf stream is written “[wh]ere the sprigs are small and few”.
[ANONYMOUS; and Captain James COOK, R.N., F.R.S.]
A Plan of Ristigouche Harbour in Chaleur Bay Surveyed in 1760 by the King’s Ship Norwich.
Publication [London, R. Sayer and J. Bennett, 1775].
Description Original working manuscript chart, pen and black ink on paper, inscribed lower left “137”.
Dimensions
360 by 535mm (14.25 by 21 inches).
Cook’s surveys of the St. Lawrence and Newfoundland: “mud” and “hard ground”
When Thomas Jefferys died in 1771, the original copper printing plates that he had accumulated for his ‘A Collection of Charts of the Coasts of Newfoundland and Labradore, &c.’ (1769), and other related charts, including James Cook’s survey of the St. Lawrence, were acquired by Sayer & Bennett, who included them in their new ‘North American Pilot’ (1775). “As the impressions taken over in Jefferys’s stock by Sayer and Bennett were sold out, the new proprietors reprinted the charts after inserting their own names in the imprints on all the plates used in the ‘Collection’ of 1770,... Cook, who returned to England from his second circumnavigation at the end of July 1775, was presented by Sayer and Bennett with a copy of ‘The North-American Pilot’ and persuaded to write a letter of commendation, dated from Mile End, 26 February 1776” (Skelton & Tooley).
The chart is finely detailed, and extends from Ristigouche Harbour in the west to Indian Point in the east. It was published in ‘The NorthAmerican Pilot for Newfoundland, Labradore, the Gulf and River St. Laurence’ (1775). As the current chart appears not to have been published before its inclusion in the ‘Pilot’, it is most likely that this manuscript chart was prepared specially for it, based on Cook’s survey. It is not known who the hydrographer aboard the man-o-war ‘Norwich’ was, but its companion chart (see item 10) does note that it ran aground in Chaleur Bay, and was “near being lost”... which is not surprising as there are many references to “mud” and “hard ground” throughout.
[ANONYMOUS; and Captain James COOK, R.N., F.R.S.]
A Draught of the Gut of Canso between Nova Scotia and Cape Breton Island, Surveyed by the King’s Ships in 1761 [and] A Plan of Port Dauphin on the Eastern Side of Cape Breton Island Surveyed in 1743 [and] A Plan of Murgain or Cow Bay on the Eastern Side of Cape Breton Island, surveyed in August 1760.
Publication [London, R. Sayer and J. Bennett, 1775].
Description Original working manuscript chart, pen and black ink on paper, inscribed lower right “142”.
Dimensions 365 by 530mm (14.25 by 20.75 inches).
Safe havens on the eastern shore of Cape Breton
Three charts on one sheet, each detailing two safe harbours on the Atlantic side of the strategic Cape Breton, and the narrow passage between it and Nova Scotia. The chart was published in ‘The North-American Pilot for Newfoundland, Labradore, the Gulf and River St. Laurence’ (1775). As the current combination of charts appears not to have been published before its inclusion in the ‘Pilot’, it is most likely that this manuscript chart was prepared specially for it, including one based on James Cook’s survey.
MORRIS, Charles; [and Captain James COOK, R.N., F.R.S.]
A Draught of the Harbour of Halifax, Jebucto Bay, Cape Sambro. with the Islands, Ledges & Soundings done by Order of His Excellency Brigadier General Lawrence, Governour [sic] of the Province of Nova Scotia. Novr. 3d 1759 by Chas: Morris Chf Surv.
Publication 1759.
Description
Surveyor’s fair copy manuscript chart on two joined sheets, pen and black ink and colour wash on paper, inscribed on the verso “Harbour of Hallifax” [sic], some repairs to verso.
A very elegant chart of the strategic Harbour of Halifax, in Nova Scotia. The published version, by Thomas Jefferys, issued in his ‘General topography of North America and the West Indies’ (1768), is much less beautiful, and is dedicated to “the right honourable George Dunk Earl of Halifax, first lord commissioner, and to the rest of the right honourable commissioners for trade and plantations”.
It would not be long before the chart was superseded by the extensive survey of James Cook, who was resident in Halifax when Morris conducted his survey.
[HOLLAND, Samuel Johanes, probably]
[Chignecto Bay and Isthmus].
Publication [London, c.1791].
Description Original working manuscript chart, pen and black and red ink on paper.
Dimensions 840 by 290mm (33 by 11.5 inches).
The Missaguash River, dividing the French from the English
An apparently unpublished extension sheet for Laurie and Whittle’s ‘New and correct chart of the coast of New England and New York with the adjacent parts...’ (1794), which ends in Fundy Bay at just about the place where this chart begins, albeit with a slight difference in orientation. The chart shows in great detail the area considered to be the boundary between the French and British territories, the Missaguash River which connects the Bay of Fundy with the Northumberland Strait.
That chart is attributed to “Captain Holland”, who is in all likelihood Samuel Holland (1729-1801) who had been commissioned by the British Government in 1770 to map the Atlantic seaboard, from the Saint John River to New York City, in preparation for impending conflict. While Holland supplied several surveys of great merit and use, he conspicuously did not produce a general map, like that eventually published by Laurie and Whittle in 1794.
Robert Sayer is known to have commissioned the engraving of other charts by “Nathaniel Holland” in about 1791, as he was ailing, and it is possible that Holland’s ‘...New England and New York...’ was amongst them, and the current chart too, as a companion. In 1792 Sayer took on Robert Laurie and James Whittle as junior partners, eventually selling them his business. As the first known printed version of this chart appeared published by Laurie & Whittle in 1794, it may be that it and the other charts by “Captain N. Holland” were some of the last commissions of his career, which were then shelved until after his death in 1794.
Of the identity of “Captain N. Holland” Wooldridge writes, “there is no record of a hydrographer named N. Holland in the imprints produced by any other firms; this may be an erroneous reference to Samuel Holland, who was a contemporary of Des Barres, an associate of Captain James Cook, and a notable figure in Canadian marine surveying. The ‘error’ if such it were, is unaccountably repeated on other maps by [Sayer and Bennett and] Laurie and Whittle, who certainly knew better”. Others suggest that “Captain N. Holland” is a deliberate pseudonym, to conceal the identity of one, or more, official cartographers moonlighting their government funded maps to the highest private bidder.
Many institutions, however, credit the chart to Captain Nathaniel Holland, without any other information.
[ANONYMOUS; and Captain
James COOK, R.N., F.R.S.]
[A] Chart of the South-east part of Newfoundland containing the Bays of Placentia, St. Mary, Trepassey and Conception from Actual Surveys.
Publication London, Printed for R. Sayer and J. Bennett, 10 May 1770.
Description
Original working manuscript chart, pen and black ink on paper, imprint inscribed across the lower margin, and “130” lower right and on verso, “5” upper right, with loss to upper left-hand corner.
Dimensions 525 by 715mm (20.75 by 28.25 inches).
The Cape Shore
The chart was published in ‘The North-American Pilot for Newfoundland, Labradore, the Gulf and River St. Laurence’ (1775). As the current combination of charts appears not to have been published before its inclusion in the ‘Pilot’, it is most likely that this manuscript chart was prepared specially for it.
COOK, Captain James, R.N., F.R.S.; and James LARKEN
A Chart of the West Coast of Newfoundland. Surveyed by Order of Commodore Palliser, Governor of Newfoundland, Labrador, &c. &c. by James Cook, Surveyor.
Publication [London, Published by Permission by the Right Hon.ble, the Lords Commissioners of the Admiralty... by Robert Sayer & J. Bennet, Chart Sellers Fleet Street, [1768] - 1770.
Description
Original engraved copper printing plate, with subsequent alterations to the imprints.
Dimensions 508 by 584mm (20 by 23 inches).
References Skelton & Tooley, ‘The Marine Surveys of James Cook in North America 1758-1768’, 9, 11, and 13.
The original engraved copper printing plate for the title-sheet for James Cook’s fourth chart in his sequence of surveys of the vast coastline of Newfoundland. It was engraved by James Larken in 1768, as a direct commission from Cook, and remained current and unchanged, except for alterations to the imprint, as the plate passed from Cook to Thomas Jefferys, and then to Sayer and Bennett.
At the Treaty of Paris in 1763, France had relinquished all of Newfoundland to the British, except for the islands of St. Pierre and Miquelon off the south coast “but her fishermen were allowed rights of fishing and curing from Cape Bonavista in the north-east to Point Rich in the northwest. But no reliable maps existed and, if disputes between the English and French fishermen were to be averted, there must be a survey” (Skelton & Tooley). This monumental task was offered to the still young James Cook, as his first major commission, secured for him by the first British Governor of the newly acquired territory, Commodore Hugh Palliser, under whom Cook had served aboard the HMS ‘Eagle’ during the Seven Years’ War.
The result “was unequalled, for thoroughness, and method, by any previous hydrographic work by Englishmen; and it produced the first charts of this extensive and difficult coastline that could... with any degree of safety be trusted by the seaman” (Skelton & Tooley). During the spring, summer, and autumn of each year between 1763 and 1767, Cook surveyed the more vulnerable coasts of Newfoundland, and the most frequented by British shipping, returning to England during the winter months to draw-up and commission the printing of his charts.
Between 1766 and 1768 Cook self-published four charts of the Newfoundland coast, with the permission of the Admiralty, who did not engage with publishing charts themselves until 1808: ‘A Chart of the Straights of Belleisle’ (1766), ‘A Chart of the South Coast of Newfoundland’ (1766), ‘A Chart of Part of the South Coast of Newfoundland’ (1767), and ‘A Chart of the West Coast of Newfoundland’ (1768). Each was engraved by James Larken.
Cook retained the copyright for each of his charts until early in 1768, after which he sold them to Thomas Jefferys, before embarking on his epic voyage in HMB ‘Endeavour’ to the Pacific. Jefferys then published two issues, unchanged except for the imprint, one in 1769, and one in 1770, as ‘A Collection of Charts of the Coasts of Newfoundland and Labradore &c.,’. He then sold the plates to Sayer and Bennet, who included the chart in their ‘The North-American Pilot for Newfoundland,...’ (1775 onwards) as chart XVI, as here, unchanged except for their imprint. This copperplate is for the middle-sheet of three.
While original manuscript charts from this period of Cook’s endeavours have survived, we are aware of only one other engraved printing-plate related to Cook’s cartographical work from his entire career, that for John Bayly’s “The Great Pacific Ocean” and “South Pacific Ocean” (1772), now held as part of the Daniel Solander collection at the British Museum.
A twentieth century impression taken from the original copper plate.
[ANONYMOUS; and Captain James COOK, R.N., F.R.S.]
A Plan of Chaleur Bay in the Gulf of St. Laurence. Surveyed by His Majesty’s Ship Norwich in 1760.
Publication [London, R. Sayer and J. Bennett, 1775].
Description
Original working manuscript chart, pen and black on paper, with an extended margin.
Dimensions 360 by 555mm (14.25 by 21.75 inches).
“Mud”, “mud and shell”, “muddy shells”
The chart is finely detailed, and extends from Ristigouche Harbour in the northwest to Gaspe Bay in the northeast. It was published as chart XIV in ‘The North-American Pilot for Newfoundland, Labradore, the Gulf and River St. Laurence’ (1775). As the current chart appears not to have been published before its inclusion in the ‘Pilot’, it is most likely that this manuscript chart was prepared specially for it based on Cook’s survey. It is not known who the hydrographer aboard the man-o-war ‘Norwich’ was, but the chart does note that it ran aground in Chaleur Bay, and was “near being lost”... which is not surprising as there are many references to “mud”, “mud and shell”, “muddy shells”, and “hard sand” throughout the chart.
[COOK, Captain James, R.N., F.R.S; and Michael LANE]
A Chart of the Gulf of St. Laurence. Composed of a great number of Actual Surveys and other Materials Regulated and Connected by Astronomical Observations.
Publication [London, R. Sayer and J. Bennett, 1775].
Description
Original working manuscript chart, pen and black and red ink on paper, inscribed lower left “136”, inscribed on the verso “Banks of Newfoundland”, and “II”.
Dimensions 635 by 505mm (25 by 20 inches).
One of the most contentious gateways to North America
A superb and very detailed chart of one of the most important and busiest sea-ways of, and gateways to, North America for the last 350 years. The French and British fought for sovereignty over the Gulf and the territories it gives access to for hundreds of years, culminating in the conflicts of the Seven Years’ War, and the Treaty of Paris of 1763, which gave Britain the upper hand.
The chart was first published in ‘The North-American Pilot for Newfoundland, Labradore, the Gulf and River St. Laurence’ (1775), and is based on the surveys of Cook, Lane, and others.
DESJARDIN; and Captain James COOK, R.N., F.R.S.
Pointe aux Allouettes or Larks
Point By Desjardins Pilot of Quebec.
Publication [London, R. Sayer and J. Bennett, 1775].
Description Original working manuscript chart, inscribed lower right “127”, small loss to lower right-hand corner.
Dimensions 205 by 170mm (8 by 6.75 inches).
Desjardin’s vignette
Prepared for inclusion as an inset in Sayer and Bennett’s new edition of Cook’s ‘A new chart of the River St. Laurence, from the Island of Anticosti to the Falls of Richelieu’, in their ‘The North-American Pilot for Newfoundland, Labradore, the Gulf and River St. Laurence’ (1775).
The chart shows a finely detailed section of the St. Lawrence River, extending from Hare Island (i.e. “Iles aux Lievres”) to Les Petites Bergeronnes, encompassing the confluence of the Riviere Saguenay. As the current chart appears not to have been published before its inclusion in the ‘Pilot’, it is most likely that this manuscript chart was prepared specially for it based on Cook’s survey. No other charts by “Desjardin” are known.
[ANONYMOUS]
[The St. Lawrence, from Quebec to Montreal].
Publication [Quebec, Patent Office, c.1790].
Description
Original manuscript plat map on four joined sheets, pen and black, blue and red ink, and colour wash, on paper, edges a little frayed, early repairs to verso.
Dimensions 595 by 720mm (23.5 by 28.25 inches).
Plotting the Constitutional Act of 1791
A very detailed survey of the St. Lawrence River, extending from TroisRivieres in the southwest to Saint-Antoine-de-l’isles-aux-Grues in the northeast, showing the historical “Fiefs”, “Seigneury”, and larger swathes of property owned inland to about 40 miles either side of the river. It was probably prepared in connection with the Constitutional Act of 1791, which principally created two new British colonies from Quebec, “Upper Canada” and “Lower Canada”, but on a more local level, also guaranteed continuity of ownership of land held under the feudal “seigneurial” system in Lower Canada (the lower St. Lawrence River).
This plat map is very similar to one first published by Samuel Holland in 1802, ‘A New Map of The Province of Lower Canada, Describing all the Seigneuries, Townships, Grants of Land, &c. Compiled from Plans deposited in the Patent Office Quebec; By Samuel Holland’. It may have been acquired by Robert Sayer, who commissioned the engraving of a number of maps by “Captain N[athaniel]. Holland” in 1791. It is very likely that Nathaniel Holland was actually Samuel Holland, who was topping up his retirement savings by selling his government-funded survey charts privately.
The seigneurial system had been established in New France from its earliest days as a French colony, in 1627. Between then, and the Treaty of Paris in 1763, which ended the French and Indian War in North America, nearly 220 seigneuries were granted encompassing the habitable areas on both banks of the St. Lawrence River, between Montréal and Québec City, the Chaudière and Richelieu Valleys, and extending to the Gaspé Peninsula.
The Act also created “Clergy Reserves” in Upper Canada, and it is no coincidence that as well as marking out the very large seigneuries owned by religious orders on the map, there is an additional note about which islands in this part of the St. Lawrence are owned by them. On the northern shore, the largest landowners are ‘The Seigniory [sic] of Coat [sic] de Beaupre the property of the Seminary of Quebec’, and the Jesuits, who hold several seigneuries surrouding Quebec City; on the southern shore are ‘Nicholet Seig. the Property of M. Cresse’, ‘M. Grantilly’s Seigniory’, ‘M. de Lerys Seigniory’, ‘M. La Nadiere’s Seigniory’, ‘St. Jean De Chillon a Mons:r De V’Our’s De Chillon’, ‘Mon. Lotboniere’s Seigniory’, ‘St. Croix the property of the Ursalines of Quebec’, and the ‘Cote de Lauzon the property of Gen. Murray’.
14
BACKHOUSE, Thomas
An archive of manuscript surveys prepared for ‘A New Pilot of the South East Coast of Nova Scotia’.
Publication [London], 1798.
Description 11 surveyor’s fair copy manuscript drawings, pen and black, grey, and red ink, and colour wash on paper, most surrounded with a plain but decorative colour wash border, with numerous office amendments in pencil, occasionally outlining the title and its cartouche, placing of references and scales, most inscribed on the verso in pen and black ink and pencil, two backed with muster-roll book paper.
References Fisher, ‘The Makers of the Blueback Charts’, p. 61; see Phillips [Atlases], 1251.
“Original surveys which were supplied direct to the publishers by their author” (Fisher)
Original fair copy manuscript surveys, by Master Thomas Backhouse, who seems to have been plying the coastline of Nova Scotia, Halifax, Lunenburg, Canso, and Cape Breton, in HMS ‘Thisbe’, since 1790, for Laurie and Whittle’s completely new pilot: ‘A new pilot for the south east coast of Nova Scotia, Chedabucto Bay, Gut of Canso, Bay of Funday, and round the isle of Cape Breton with the principal harbours surveyed by Thomas Backhouse’. Published with 15 charts, “as the Act directs July 12th 1798 by Laurie and Whittle, No. 53, Fleet Street, London”, the pilot was “exclusive to the firm [with] original surveys which were supplied direct to the publishers by their author” (Fisher).
The printed ‘Pilot’ is exceptionally rare, with only one incomplete example being offered publicly in commerce, in 1939 (13 of 15 charts); with complete examples at the Newberry Library, and the Houghton Library at Harvard; an incomplete set of charts (14 of 15 charts) at the Huntington Library, and in the Canadian archives (13 of 15 charts), and a later edition (1810) recorded in the archives at Quebec.
Nova Scotia and Cape Breton had been seen as strategic locations in naval warfare for as long as France and England had been contesting territory in North America, throughout the seventeenth and eighteenth centuries. Of particular contention, was the Fortress of Louisburg, on Cape Breton, which fell to the British in 1758. The French were expelled from the island, Nova Scotia, and Newfoundland, as a result of the Treaty of Paris in 1763, which ended the Seven Years’ War, creating a safe haven for fleeing refugees of the American War of Independence.
As this part of North America fell outside the divisions of the Constitutional Act of 1791, which principally created two new British colonies from Quebec, “Upper Canada” and “Lower Canada”, Nova Scotia and Cape Breton became a haven of refuge for loyalists fleeing the new Republic of post-Revolutionary War North America. The ‘Pilot of the South East Coast of Nova Scotia’ would have appealed to these prospective immigrants, as well as supplying important defensive details for this vulnerable coastline.
The Charts:
[No. 2.]. “Harbor of St Johns N. Brunswick”, proposed title-cartouche in pencil, inscribed on the recto “156” lower right, and also on the verso, on two joined sheets, backed with muster-roll paper. Published as ‘The Harbour or River St. John in New Brunswick Surveyed by Thos. Backhouse 1798.... Stephenson sculp.’. Showing St. John, part of New Brunswick, Manhogenes Manawagonish Island to Cape Spencer.
[No. 3]. “Shelburne or Port Roseway Harbour by Thomas Backhouse”, proposed title-cartouche in pencil, inscribed on the recto “155” lower left, and on the verso: “No. 2”, “155”. Published as ‘A survey of Shelburne, or
Port Roseway Harbour. By Thomas Backhouse. 1798...Engraved by J. Lodge’ (1798). Showing Durfey’s Settlement and the Shelbourne Town.
[No.6]. “Country Harbor Nova Scotia [Plate I]”, inscribed on the recto lower left “151”, and on the verso “No. 4 2 sheets”, “151”. Published as ‘A survey of Country Harbour on the coast of Nova Scotia by Thomas Backhouse. Plate 1st. Facing the sea.1798’ (1798). Showing part of Novia Scotia, Country Harbour, the Outer shoals to Regged Point.
[No. 7]. “A Survey of Country Harbour on the coast of Nova Scotia by Thomas Backhouse Plate IInd”, proposed title-cartouche in pencil, inscribed on the verso “No. 4 - 2 sheets”, “152”. Published as ‘A Survey of Country Harbour on the Coast of Nova Scotia by Thomas Backhouse. Plate IInd’ (1798). Showing part of Nova Scotia, Country Harbour Entrance, the entrance to the head of harbour, and the homes of Loyalists, Captain Leggett and Captain Dickensen.
[No. 8]. “The Harbour of Canso Surveyed by Tho.s Backhouse... Sept. 27, 1790”, inscribed on recto “150” lower left, and on the verso “No. 5”, “Canso”, “Canso & Crow Harbor”. Published as ‘The Harbour of Canso Surveyed by Thos. Backhouse. 1798... Stephenson sc.’ (1798). Showing part of Nova Scotia, Canso Habour, the South end of Andrew Island to the North end of Binny [Piscatiqui] Island, with numerous leading lines, soundings, the northern entrance is inverted for reading with the chart upside-down.
[No. 10]. “Part of The Isle of Cape Briton [sic]. Inhabitant Bay & Harbour. His Majesty’s Ship Sepr 26 1790”, inscribed in ink on the verso “Lunenberg & Inhabitant”. Published as ‘Part of the isle of Cape Breton, Inhabitant Bay’ (1798).
[No. 11]. “Cape Breton Island”, inscribed on verso “143”, published as ‘The Island of Cape Breton, with the Gut of Canso, and Chedabucto Bay. By Thomas Backhouse. 1798’ (1798). Cape Breton and adjacent coast.
[No. 12]. “Port Hood on the Coast of Nova Scotia”, proposed titlecartouche in pencil, inscribed on the recto “144” lower left, and on the verso “No.7”, “144”, backed on muster-book paper. Published as ‘Port Hood on the North West Side of Cape Breton, Surveyed by Thos. Backhouse, 1798...Engraved by J. Tuppen’ (1798). Showing Port Hood, Port Hood peninsula and anchorage, part of Nova Scotia, with two leading lines for entering the anchorage, farmhouses.
[No. 13]. “St. Anns Bay and Harbour on the North East Side of Cape Breton Island”, within a pencilled title-cartouche, inscribed on the recto “145” and on the verso “145”. Published as ‘St. Ann’s Bay and Harbour on the North East Side of Cape Breton Island. Surveyed by Thos. Backhouse. 1798... Engraved by J. Tuppen’ (1798). Part of Cape Breton Island, St. Ann Bay, showing St. Ann Bay from Cape Dauphin and Cape Smoke, farmhouses.
[No. 14]. “Spanish River in the Isle of Cape Breton or Sydney Harbour”, inscribed on the recto “146”, and on the verso “No.9”, and “Sydney”, backed with muster book paper, lacking a strip from lower edge, including most of scale and key. Published as ‘Survey of Spanish River or Sydney Harbour by Thos. Backhouse. 1798... Stephenson Sculp.’ (1798). Showing part of Cape Breton Island, Sydney Harbour, the entrance to town of Sydney and west arm, showing the early settlement of Sydney on the Island in Dartmouth River, with a view of the town, farms, and coal mine.
[No. 15]. “Louisburg harbour to Rupert George Esqr. Commander of His majesties Ship Hussar, and Senior Officer, on the Nova Scotia Station This Chart Is most Humbly dedicated, and Presented by His very Humble Servant Tho: Backhouse 27th August 1792”, inscribed on the recto “147”, and on the verso “No 10”, “147”. Published as ‘A survey of Louisburg Harbour To Rupert George, Esq. Commander of His Majesty’s Ship Hussar, and Senior Officer on the Nolva Scotia Station; This Chart is most respectfully dedicated, by his very humble Servant, Thos. Backhouse...’ (1798). Part of Nova Scotia, Louisburg, Louisburg Harbour, with the remains of the old town and ruins of the old fort and lighthouse, houses and trees, and leading and clearing lines for the harbour.
Without: I: ‘A new chart of the Coast of Nova Scotia’, IV: ‘A Survey of Lenenberg Harbour’, V: ‘The Harbour of Halifax, in Nova Scotia’, and IX: ‘Crow Harbour’.
OWEN, Francis, Master R
A Chart of the Road & Harbour of Great Placentia in Newfoundland. Surveyed in August 1800 by Francis Owen, Master of His Majesty’s Ship Agincourt. To Charles Morice Pole Esqr; Vice Admiral of the Blue, Commander in Chief, and Governor of the Island of Newfoundland &c&c. This chart is by Permission Most Respectfully Dedicated, By his obliged humble Servant, Francis Owen.
Publication [London], 1801.
Description
Original working manuscript chart, pen and black ink, and colour wash on paper, loss to the top left-hand corner.
Dimensions 485 by 645mm (19 by 25.5 inches).
With all the Fishing Stages
A very detailed manuscript chart, oriented with east at the top, extending from Moll Point to beyond Dixons Hill and South East Arm, and from beyond Mount Pleasant to Point Verd. With an extensive “Description”, indicating “the only dangers near Placentia are the Virgin Rocks & the Gibraltar Rocks, on the South, & the Moll Rocks on the North”. In addition to more obvious landmarks, the chart notes the “Fishing Stages” at Point Verd, and the Town of Placentia. Since the earliest European settlement of the area, fishing had been a major industry.
The chart is less detailed, topographically, than that of James Cook, published by Sayer and Bennett in 1770.
Published as ‘A chart of the Road and Harbour, of Great Placentia, in Newfoundland Surveyed in August 1800 by Francis Owen, Master of His Majesty’s Ship Agincourt’ (engraved by I. Tuppen, 27 King St., Golden Sqre. London, No. 53 Fleet Street: Published by Robt. Laurie and Js. Whittle, January 31st 1801), and in the ‘North American pilot. The first part of the North American Pilot’ 1806.
[DESSIOU, Joseph Foss, after Captain James COOK; and others]
Drawing of Newfoundland.
Publication [London, 1808].
Description
Large original working manuscript chart on four separate double-page sheets, pen and black ink and colour wash on paper, contemporaneously laid down on linen, each inscribed in the lower outer corner “127”, and on the verso of the “title” sheet “Drawing of Newfoundland by I. Dessiou”.
Dimensions
Each sheet 530 by 675mm (20.75 by 26.5 inches).
References UK Hydrographic Office Archive, SVY/A/E6.
A monster manuscript map of Newfoundland
A monumental manuscript chart of Newfoundland, showing the northeastern seaboard of Canada, Labrador, New Brunswick, Nova Scotia, all of Newfoundland, the Greater Bank, the Outer Bank or False Bank, Jaquet Bank, Great Bank of Newfoundland, New Bank, Whale Bank, Green Bank, Banquereau, Mizen Bank, Middle Ground, Sable Island Bank, La Have Bank, Browns Bank, St. George’s Bank, Cashes Ledge, and Jefferys’s Bank. An inset upper left shows the continuation of the St. Lawrence River to Quebec and the falls of Richelieu.
Eventually published in six sheets as ‘Laurie and Whittle’s New General Chart of the Island of Newfoundland with all its banks. The Gulph [Gulf] and River of St Lawrence and the Bay of Fundy,... By Joseph Dessiou (from the surveys of JFW Des Barres, Captain James Cook, Captain S Holland, Mr Thomas Backhouse, Mr Francis Owen and others); engraved by J Wallis’, with the inset titled ‘‘Continuation of the River St Lawrence to Quebec and the falls of Richelieu”, published in London, “53, Fleet Street:... by Rt. Laurie & Js. Whittle, May 6th. 1808”, probably for inclusion in the 1808 edition of the ‘The First Part of the North American Pilot, for Newfoundland, Labradore, and the Gulf and River St. Laurence...’, intended to update the surveys of James Cook of the 1760s. The chart would have been available and extremely valuable to the Royal Navy during the War of 1812.
The first issue of the printed chart is exceptionally rare, only known in one institutional example, at the Admiralty Office; a second issue was published in 1810, but this too seems to be scarce; no examples have appeared in commerce in available records.
[HOLLAND, Samuel Johanes, probably]
Proof sections for a ‘New and correct chart of the coast of New England and New York with the adjacent parts’.
Publication [London, after 1794].
Description
Three original working manuscript charts, pen and black and red ink, and colour wash on paper, with pencilled office amendments.
Dimensions
Sheets one and two: 345 by 555mm (18.6 by 21.8 inches); sheet three: 345 by 615mm (18.6 by 24 inches).
Proof
Proof sections for an apparently unpublished later issue of Laurie and Whittle’s ‘New and correct chart of the coast of New England and New York with the adjacent parts...’ (1794), based on the surveys of Samuel Holland. These charts include two unpublished insets: ‘Part of the River St. Lawrence from the Isle of Bic to Cape Lauzon on an enlarged scale’, and a ‘Chart of Portland Harbour from I.F.W. Des Barres with Additions’, a section of the St. Lawrence River between Cape Diable and Havre St. Nicolas, and the top left-hand sheet of the engraver-ready manuscript of the first issue of Laurie and Whittle’s ‘... New England and New York’, with office amendments / corrections in red ink.
The first issue of the ‘...New England and New York...’ chart is attributed by Laurie and Whittle to the elusive “Captain Holland”.
HOLLAND, Captain N.; [possibly pseudonym for Samuel Johannes HOLLAND, or others]
A New Chart of the Coast of North America From New York to Cape Hatteras. Including the Bays of Delaware and Chesapeak, with The Coasts of New Jersey, Maryland, Virginia and Part of the Coast of North Carolina.
Publication
London, Printed for Robert Sayer, Fleet Street, as the Act Directs, [c.1791].
Description
Original working manuscript chart on two separate sheets, pen and black ink on paper, some marginal losses, inscribed “165” on each lower right-hand corner, and on the verso “5 Drawings of America engraved by Palmer in 1791”.
Dimensions
Each sheet 550 by 750mm (21.75 by 29.5 inches).
References
Wooldridge, ‘Mapping Virginia’, 2012, figures 200 and 200a, pages 220-223.
Amongst Sayer’s last commissions
An extremely detailed manuscript chart of one of the busiest portions of the northeastern seaboard of North America.
Although this manuscript version of the chart has the imprint of Robert Sayer, it interestingly states that it is to be “printed for” him, rather than by him, and the name of the engraver “Palmer” is written on the verso of the chart, again implying some out-sourcing. This might be explained by the fact that it is known that Sayer was ailing by 1791, and in 1792 took on Robert Laurie and James Whittle as junior partners, eventually selling them his business. As the first known printed version of this chart appeared published by Laurie & Whittle in 1795, it may be that these and the other charts by “Captain N. Holland” were some of the last commissions of his career, which were then shelved until after his death in 1794.
HOLLAND, Captain N.; [possibly pseudonym for Samuel Johannes HOLLAND, or others]
A New Chart of The Coast Of North America From The Currituck Inlet To Savannah River. By Captain N. Holland. Comprehending the Coasts of North and South Carolina.
Publication London, Printed for Robert Sayer, No. 53 Fleet Street As the Act Directs, [c.1791].
Description
Original working manuscript chart on two separate sheets, pen and black ink on paper, inset correction, some loss to upper right-hand corner of each sheet, inscribed on the verso “Original Drawings of 5 Plates of Charts of the American Coast Engraved by Palmer in 1791”.
Dimensions
Each sheet 750 by 545mm (29.5 by 21.5 inches).
References Wooldridge, ‘Mapping Virginia’, 2012.
“The
Graveyard of the Atlantic”
An extremely detailed manuscript chart of the treacherous coastline of North and South Carolina, with all its shifting shoals and sandbanks, which earned it the name of “the graveyard of the Atlantic”.
The chart extends along the east coast, from Currituck Inlet, which is the current border between Virginia and North Carolina, to Savannah River, the border with present-day South Carolina and Georgia.
HOLLAND, Captain N.; [possibly pseudonym for Samuel Johannes HOLLAND, or others]
A New Chart of the Coast of North America from Port Royal Entrance to Matanza Inlet Exhibiting the Coast of Georgia &c. by Captain N. Holland. An Improv’d Edition.
Publication
London, Published by Laurie & Whittle, 53 Fleet Street, 12th May, 1809.
Description
Engraved chart, annotated in pencil to add lighthouses and a ship’s track.
Dimensions 730 by 550mm (28.75 by 21.75 inches).
American Atlantic seaboard: a proof copy of Holland’s map of Florida and Georgia
A very detailed chart of the coastline of Georgia and northeastern Florida. The three insets are of the Mouth of the Nassau River, Mouth of the St. Mary’s River, and St. Augustine Harbor. There appear to be no differences between the current chart and the issues of 1792 and 1794.
Of the identity of “Captain N. Holland” Wooldridge writes, “there is no record of a hydrographer named N. Holland in the imprints produced by any other firms; this may be an erroneous reference to Samuel Holland, who was a contemporary of Des Barres, an associate of Captain James Cook, and a notable figure in Canadian marine surveying. The ‘error’ if such it were, is unaccountably repeated on other maps by [Sayer and Bennett and] Laurie and Whittle, who certainly knew better”. Others suggest that “Captain N. Holland” is a deliberate pseudonym, to conceal the identity of one, or more, official cartographers moonlighting their government funded maps to the highest private bidder.
Many institutions, however, credit the chart to Captain Nathaniel Holland, without any other information.
Sloop John B anon.
Caribbean & South America
Jefferys charts the Caribbean
Published posthumously, but at least ten years in the making, Thomas Jefferys first announced ‘The West-India Atlas’ in his advertising for ‘A Description of the Spanish Islands and Settlements of the Coast of the West Indies’ (1772). Unfortunately, Thomas Jefferys would not live to see the publication of his ‘West India Atlas’ (1775), and it was left to Robert Sayer who, in partnership with John Bennett, acquired his materials and published the atlas posthumously under Jefferys’s name. The work was evidently a commercial success as there were five subsequent editions under the Sayer and Bennett imprint. The ‘West Indian Atlas’ combined both the elements of an atlas and a pilot with both geographic and hydrographic information. It included an ‘Index-map’, showing how the following sixteen charts join to create a single large ‘A Compleat Chart of the West Indies’.
New Spain
There are a number of Spanish fair copy manuscript charts in the collection. Some of them date from 1789 to1799 and are undoubtedly the “Spanish Survey of the Antillas” that influenced Laurie and Whittle’s similarly discreet ‘A New General Chart of the West Indies From the several Surveys, made and regulated By Captn. N. Holland, Capt. B. Romans, &c. &c. and Corrected from the Spanish Survey of The Antillas, Publish’d in 1799.... Improved to 1st. Jany. 1802’; and most importantly their update of the Romans chart of the ‘Chart of the Gulf Passage’ (1779), ‘A Mercator’s Chart of the Gulf Passage, from Cape Antonio in the Isle of Cuba, to the 30th Degree of North Latitude in the Ocean, through the Gulf of Florida, or New Channel of Bahama’ (1802).
Others were acquired later, probably by Robert Laurie, from Felipe Buaza y Canas, the official hydrographer to the Malaspina expedition, who fled to London in 1823, bringing his papers and charts with him.
Romans
The collection includes two examples of the holy grail of charts of the waters around Florida: the original working manuscript chart of Sayer and Bennett’s ‘A New Chart of the Gulf Passage from Cape Antonio in the Isle of Cuba to the 30th Degree of North Latitude in the Ocean, through The Gulf of Florida, or New Channel of Bahama’ (1778), published in 1779 and known in only one example, after the surveys of Bernard Romans and William Gerrard de Brahm. And Laurie and Whittle’s update ‘A Mercator’s Chart of the Gulf Passage, from Cape Antonio in the Isle of Cuba, to the 30th Degree of North Latitude in the Ocean,
through the Gulf of Florida, or New Channel of Bahama’ (1802), which references the Spanish surveys included in the ‘Caribbean’ section, and known in only 2 other examples.
The latter chart is well-known to treasure-hunters worldwide because of a legend that was spotted on it, near the St. Sebastian River, just to the South of Cape Canaveral: “Opposite this River Perished the Admiral of the Plate Fleet in 1715. The Rest of the Fleet 14 in number were lost between this and the Beach Yard”. In 1961, and on the basis of this information, Kip Wagner, Mel Fisher and the Real Eight Corporation located 8 submerged wrecks from the fleet, and recovered some $4 million in gold, silver, and other artefacts: at that point the largest salvage haul in history and only superseded by recovery of the ‘Nuestra Señora de Atocha’ in 1985 by the same team.
[JEFFERYS, Thomas]
[A Compleat Chart of the West Indies].
Publication [London, before 1775].
Description 15 (of 16) mapsheets, comprising 14 in manuscript, plus one engraved (sheet two, Louisiana coast) with copious amendments in pen and red ink, together with three further engraved duplicates (sheets 3, 5, and 6), also extensively amended in manuscript pen and red ink.
Gestetner, ‘Thomas Jefferys: The West India Atlas, 1775’, Map Forum, Issue 8, 2005, pages 30–35.
Preparing the largest chart of the
West Indies
Published posthumously, but at least ten years in the making, Thomas Jefferys first announced ‘The West-India Atlas’ in his advertising for ‘A Description of the Spanish Islands and Settlements of the Coast of the West Indies’ (1772). Unfortunately, Jefferys would not live to see the publication of his ‘West India Atlas’, and it was left to Robert Sayer who, in partnership with John Bennett, acquired his materials and published the atlas posthumously under Jefferys’s name. The work was evidently a commercial success as there were five subsequent editions under the Sayer and Bennett imprint. The ‘West Indian Atlas’ combined both the elements of an atlas and a pilot with both geographic and hydrographic information. It included an ‘Index-map’, showing how the following 16 charts join to create a single large ‘A Compleat Chart of the West Indies’, as here.
All but one of these charts is an early manuscript draft, lacking some details that appeared on the printed charts: such as titles, the more general place-names from both land and sea, decorative features like rhumb lines, compass roses, and galleons. Three of the charts are also present as engraved proofs, with copious amendments in red ink, and as insets. One other chart appears only as an engraved proof, and another is lacking, as described below:
[An Index Map to the Following Sixteen Sheets being a Compleat Chart of the West Indies, with Letters in the Margin, to direct the placing the different Sheets in their proper Places] - early draft (before 1775).
‘The Coast of West Florida and Louisiana by Tho.s Jefferys Geographer to His Majesty’: engraved working proof, amendments in pen and red ink (c.1775).
[The Peninsula and Gulf of Florida or Channel of Bahama with the Bahama Islands] - early draft (before 1775) - [with] - engraved working proof, corrective insets, amendments in pen and red ink (c.1775).
[The Coast of Mexico from Laguna de Esmotes to Punta Brava] - early draft (before 1775).
[The Coast of Yucatan from Campeche to Bahia del Ascension; with the West End of Cuba] - early draft (before 1775) - [with] - engraved working proof, amendments in pen and black ink (c.1775).
[The Island of Cuba with part of the Bahama Banks & the Martyrs]early draft (before 1775) - [with] - engraved working proof, corrective insets, amendments in pen and red ink (c.1775).
[The Windward Passage, with the several Passages, from the East End of Cuba, and the North part of St. Domingo] - early draft with many correctional insets (before 1775).
[The Coast of New Spain from Neuva Vera Cruz to Triste Island] - early draft (before 1775).
[The Bay of Honduras] - early draft (before 1775).
[The Island of Jamaica and Cape Gracias a Dios with the Banks] - early draft (before 1775).
[South part of St. Domingo, of Hispaniola] - early draft (before 1775).
[The Caribee Islands, The Virgin Islands, and the Isle of Porto Rico]early draft (before 1775).
[Part of the Provinces of Costa-Rica and Nicaragua with the Lagunas] - early draft (before 1775).
[The Isthmus of Panama with the Coast from Great River on the Mosquito Shore to Cartegena]: early draft (before 1775).
[The Coast of Tierra Firma from Cartagena to Golfo Triste] - early draft (before 1775).
[The Coast of Caracas, Cumana, Paria and the Mouths of Rio Orinoco, with the Islands of Trinidad, Margarita, Tobago, Granada, St. Vincent &c] - early draft (before 1775).
[Without: ‘The Western Coast of Louisiana and the Coast of New Leo’ (1775)].
A further set of working drafts for the ‘West India Atlas’ survives in the British Library (BL Maps 188.o.2).
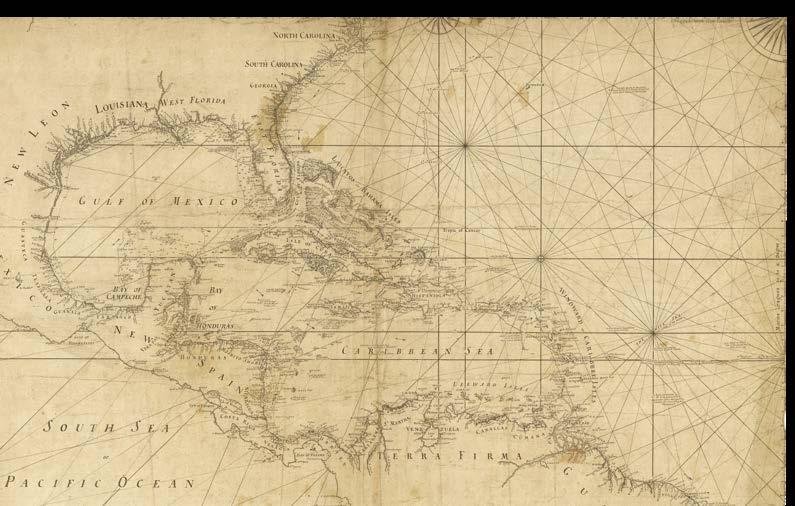
SAYER, Robert; and John BENNETT
A New General Chart of the West Indies from the latest Marine Journals and Surveys. Regulated and Ascertained by Astronomical Observations.
Publication
London, Printed for R. Sayer and J. Bennett Fleet Street, as the Act directs, July 1st, 1779.
Description
First edition. Large folding engraved map, dissected and laid down on linen, with contemporary hand-colour in part and in outline, with pink shield-shaped paper labels on the verso inscribed “West Indies”.
Dimensions
730 by 1035mm (28.75 by 40.75 inches).
Including the Gulf of Mexico and New Spain
An elegant and detailed chart of the West Indies, first published by Sayer and Bennett in 1779, as here, and again in 1790, followed by updated issues by Laurie and Whittle in 1794, 1799, and again in 1802. It is worth noting that the ‘A New General Chart of the West Indies’ (1799-1802) is quite distinct from the charts of the West Indies inherited from Thomas Jefferys by Sayer and Bennett, on his death in 1771, and posthumously published as the ‘West India Atlas’ from 1775 (see items 21).
ROMANS, Bernard; and Captain N. HOLLAND [possibly pseudonym for Samuel Johannes HOLLAND, or others]
A New General Chart of the West Indies From the several Surveys, made and regulated By Captn. N. Holland, Capt. B. Romans, &c. &c. and Corrected from the Spanish Survey of The Antillas, Publish’d in 1799.
Publication
London, Improved to 1st. Jany. 1802.
Description
Engraved chart, joined on two sheets, small plate crack affecting text to Puerto Rico, three tears in bottom margin skilfully repaired, not affecting text.
Dimensions 715 by 1020mm (28.25 by 40.25 inches).
Updated with new information based on Spanish charts
First published by Sayer and Bennett in 1779 (see item 22), Laurie and Whittle’s updated chart is significantly altered even from their own initial edition of 1794, to include the results of a very recent Spanish survey of the Antilles (1799) which had been acquired by Laurie and Whittle (see items 29, and 32).
Areas where the chart has been completely reworked include most of the coastline of southern Florida, from Tampa Bay to Chatham Bay and Cape Sable on the west coast, the Florida Keys, and up the east coast to Cape Canaveral. All the banks and islands of the Bahamas have been completely revised.
It is worth noting that ‘A New General Chart of the West Indies’ (1799-1802) is quite distinct from the charts of the West Indies inherited from Thomas Jefferys by Sayer and Bennett, on his death in 1771, and posthumously published as the ‘West India Atlas’ from 1775.
Of the identity of “Captain N. Holland” Wooldridge writes, “there is no record of a hydrographer named N. Holland in the imprints produced by any other firms; this may be an erroneous reference to Samuel Holland, who was a contemporary of Des Barres, an associate of Captain James Cook, and a notable figure in Canadian marine surveying. The ‘error’ if such it were, is unaccountably repeated on other maps by [Sayer and Bennett and] Laurie and Whittle, who certainly knew better”. Others suggest that “Captain N. Holland” is a deliberate pseudonym, to conceal the identity of one, or more, official cartographers moonlighting their government funded maps to the highest private bidder.
Many institutions, however, credit the chart to Captain Nathaniel Holland, without any other information.
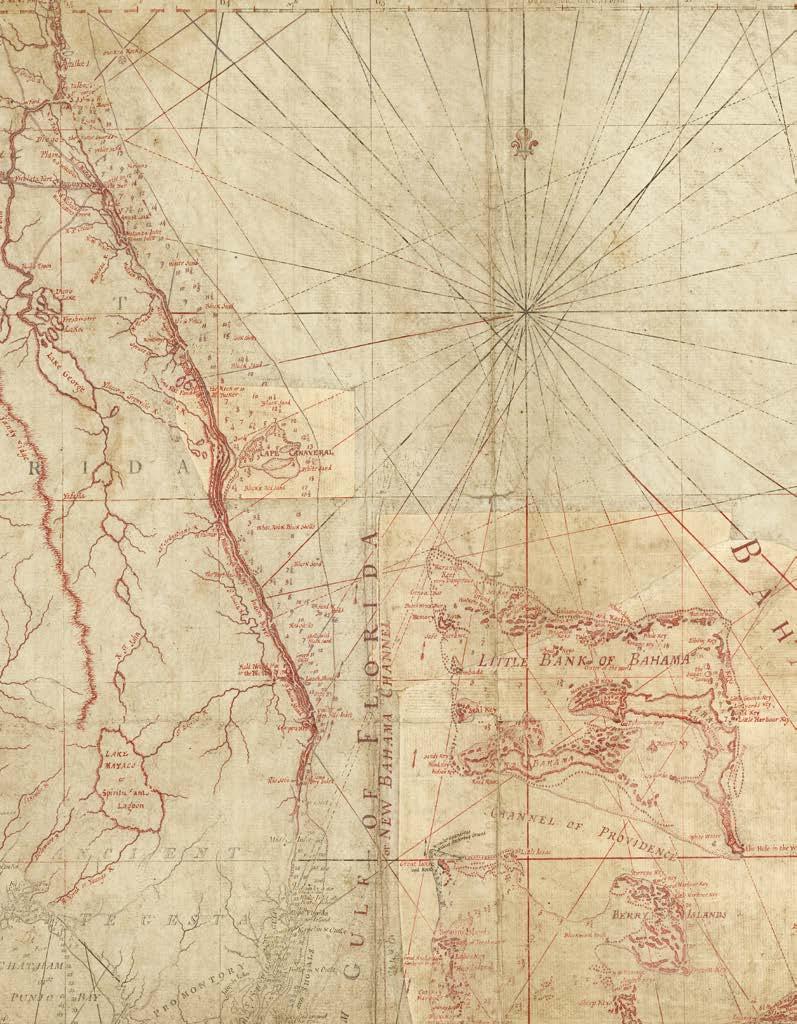
[SAYER, Robert; and John BENNETT; after Bernard ROMANS, credited as “A. Romans”; and Gerrard de BRAHM]
A New Chart of the Gulf Passage from Cape Antonio in the Isle of Cuba to the 30th Degree of North Latitude in the Ocean, through The Gulf of Florida, or New Channel of Bahama; with an Exact Delineation of the Islands, Shoals, and Reefs on the Coasts of East Florida, as well as of the Northern Shores of Cuba, and the Bahama Banks and Islands: in which is also included The Old Channel of Bahama. From the Large Survey taken by the Order of Government by A. [sic] Romans, compared with the Spanish Charts and Surveys, Ascertained by the Astronomic Observations of Wm. Ger.r.ard de Brahm, Surveyor General for the Southern District of North America, and Others.
Publication London, Printed by Robert Sayer and John Bennett, Map and Chartsellers, No. 53 Fleet Street, as the Act Directs, 1778.
Description
Large original working manuscript chart on six sheets, pen and black ink on paper, inscribed “181” in one lower corner of each sheet, lower left-hand corners of sheets two and three skilfully repaired, some marginal repairs.
Dimensions
Each sheet 735 by 535mm (29 by 21 inches).
References Harley, ‘Bernard Romans’s Map of Florida Engraved by Paul Revere’, 1930; Library of Congress 75692297 (1781 issue); Phillips, ‘Notes on the Life and Works of Bernard Romans’, 1924; Royal Museums Greenwich G246:2/47B (1786 issue); University of Florida (OCoLC 25145164).
The Manuscript for Bernard Roman’s Treasure Map of Florida and the Bahamas
A monumental manuscript chart of great significance, rarer than, but just as precious as, the sunken treasure hidden in the waters off its shores. This manuscript (1778), and its printed counterpart (1779), predate the publication of Bernard Romans’s original chart (New York, 1781) known in only one example, at the Library of Congress. In turn, Sayer and Bennett’s chart is the earlier state of another with a slightly different title: ‘A Mercator’s chart of the Gulf passage, from Cape Antonio in the Island of Cuba, to the 30th degree of North Latitude, including the old Channel of Bahama’, known in only two examples. One is housed at the Royal Museums Greenwich (Robert Sayer, 1786), the other is found in the only known copy of ‘Romans’ Gulf and Windward Pilot’ (Laurie and Whittle, 1794) at the University of Florida.
This latter example is well-known to treasure-hunters worldwide because of a legend that was spotted on it (and which also appears on this chart), near the St. Sebastian River, just to the South of Cape Canaveral: “Opposite this River Perished the Admiral of the Plate Fleet in 1715. The Rest of the Fleet 14 in number were lost between this and the Beach Yard”. In 1961, and on the basis of this information, Kip Wagner, Mel Fisher, and the Real Eight Corporation located eight submerged wrecks from the fleet, and recovered some $4 million in gold, silver, and other artefacts: at that point the largest salvage haul in history and only superseded by recovery of the ‘Nuestra Señora de Atocha’ in 1985 by the same team.
Bernard Romans’s own iconic chart of Florida (1781), the sole surviving printed example of which is one of the treasures of the map and atlas division at the Library of Congress, is described as two maps on three sheets, each with a dedicatory cartouche. The first shows the top of the Florida panhandle and western coastline extending beyond the bounds of the current chart, and is dedicated “To the Marine Society of the City of New York, in the province of New York, in North America, this chart is Humbly inscribed, by their most Obedt. Servant. B. Romans”. This section was engraved by Paul Revere for Romans, as recorded in Revere’s ledger for the 4th of May 1774, “To Engraving a Plate for a Map of East Florida-ten pounds”, and another entry on July 9th, 1774, charges Captain Bernard Romans, “To Engraving on Copper-plate Part of a Map of Florida seven pounds” (Harley). The other two sheets are dedicated “To the Hon.ble the Planters in Jamaica - and all Marchants [sic] concerned in the trade of that Island being the two societies chiefly interested in the Navigation herein explained, this Chart is most respectfully dedicated by their very tible [sic] Serv.t. B. Romans”, and “To all Commanders of Vessels round the globe. This chart is respectfully dedicated by their very humble Servant. B. Romans. B. Romans inv.t et sculpt. 1774”, clearly stating that Romans engraved at least the last of these plates himself, undoubtedly because of a lack of funds.
“Opposite this River Perished the Admiral of the Plate Fleet in 1715. The Rest of the Fleet 14 in number were lost between this and the Beach Yard”.
Romans struggled to find a publisher for his extensive survey of Florida, ‘A Concise Natural History of East and West Florida’ (1775), that his chart was supposed to, but never did, accompany: “subscribers were urged to make payment in advance of publication, due to “the vast Expense and bodily Fatigue of the advertiser”, coupled with the fact that “for eight years past he has done it at his own cost” and “now throws himself on a generous public”” (Harley). Heading to New York, “Romans scoured the colonies from Boston to Philadelphia for supporters to help finance the publication of his Florida maps and ‘Concise History’. With the assistance of a handful of patrons and a small network of learned societies, Romans enlisted subscribers to his publications, in the process becoming better known to the American Philosophical Society. He was elected a member in January, 1774, one year before the first volume of his book appeared in print. Although this first volume was reissued in 1776, the second volume never appeared... That the second volume of the ‘Concise History’ never appeared was, in part, a result of timing. Writing just as the revolutionary tide was cresting, Romans was able to secure only 199 subscribers, and the number of additional purchasers was surely hampered by its date of completion: April 25, 1775, six days after Lexington and Concord. Romans himself was diverted by events, and at the expense of his pension, joined the American military effort. On April 29, he volunteered his services as an engineer during the expedition on Fort Ticonderoga, and continuing to serve with the American forces for four or five more years. His eventual fate, however, is uncertain. In one version, he was said to have been captured at sea in 1780 and held as a prisoner of war in Jamaica until 1784, dying on the return home; another version suggests he was captured at Stony Point in 1779, held in England, and murdered for his money while returning to the United States in 1784” (American Philosophical Society online).
The original manuscript draft of Bernard Romans’s own chart (before 1774) is some 21 feet in length, is held at the National Archives in Kew, London.
We know of only one printed example of the present chart, part of large and sumptuous composite atlas, Daniel Crouch Rare Books in 2011.”
[LAURIE, Robert; and James WHITTLE; after Bernard ROMANS, credited as “B. Romans”; and Gerrard de BRAHM]
A Mercator’s Chart of the Gulf Passage, from Cape Antonio in the Isle of Cuba, to the 30th Degree of North Latitude in the Ocean, through the Gulf of Florida, or New Channel of Bahama; with an Exact Delineation of the Islands, Shoals and Reefs on the Coasts of East Florida, as well as of the Northern Shores of Cuba, and the Bahama Banks and Islands: in which is also included the Old Channel of Bahama. From the Large Survey taken by the Order of Government by B. Romans, compared with the Spanish Charts and Surveys, Accompanied by the Observations of Latitude taken by Wm. Gerrard de Braham, Surveyor General for the Southern District of North America, and Others, & regulated in respect to the Longitude, according to the Tables Published by Order of the Commissioners of Longitude, and according to the Spanish Survey of the Antillas published in 1799.
Publication
London, Publish’d... by Laurie & Whittle, No. 53 Fleet Street, 12th May 1802.
Description
Large engraved chart on six sheets, with pencilled office amendments
Dimensions
Each sheet 730 by 520mm (28.75 by 20.5 inches).
Romans: Venice, Vero, Volusia
This unrecorded issue of Laurie and Whittle’s magnificent chart of the waters around the Florida peninsula, was first published by Sayer and Bennett in 1779 under a slightly different title: ‘A New Chart of the Gulf Passage’, and has been significantly updated to include the results of a very recent Spanish survey of the Antilles (1799) recently acquired by Laurie and Whittle (see items 29, and 31).
The areas most altered involve the complex network of Keys and Reefs, now collectively known as the Florida Keys. Also the treatment of Grand Cayman, within the inset Cayman Islands at the bottom of the chart, is more elaborate. The bottom right-hand sheet has been completely reworked, particularly the islands and shoals of Nicholas Channel, and the island of Punta de Ycacos. “Old Channel of Bahama” has been changed to “Old Bahama Channel”. The waterway between the “old” channel and the eastern end of the Great Bank of Bahamas is now full of soundings, and the visible stretch of the northern coastline of Cuba is presented in much more detail. “The West End of Cuba” is reshaped, and a new coastal profile of the “High Land over Cape Buenavista” added.
Only two other examples of ‘A Mercator’s chart of the Gulf passage’ [as here] are known. One is housed at the Royal Museums Greenwich (Robert Sayer, 1786), the other is found in the only known copy of ‘Romans’ Gulf and Windward Pilot’ (Laurie and Whittle, 1794) at the University of Florida.
The original manuscript of Romans’s chart (before 1774), some 21 feet in length, is held at the National Archives in Kew, London. For Sayer and Bennett’s original working manuscript (1778) for the first 1779 issue of this chart, see item 24. The first (1779) issue is known in only one printed example, as part of large and sumptuous composite atlas, Daniel Crouch Rare Books in 2011.
[SAYER, Robert]
A New and Accurate Chart of the Windward Passage from Jamaica with the Several Passages Northward of Hispaniola, and Part of the Old Channel of Bahama. Drawn from Actual Surveys made by the English & the French.
Publication London, Printed for Robert Sayer and John Bennett Fleet Street, as the Act Directs, [before 1785].
Description Original working manuscript chart, pen and black ink on paper, right-hand sheet only.
Dimensions 525 by 705mm (20.75 by 27.75 inches).
Windward of Hispaniola
The Royal Collections at Greenwich record an example of this chart printed by Robert Sayer in 1787, and the Biblioteca National Espana an example, with addition of an inset beneath the title-cartouche, printed by Laurie and Whittle in 1794.
It is possible that the chart was not published at all until after the separation of Sayer and Bennett in 1785, with the latter’s name removed from the imprint.
[LAURIE, Robert; and James WHITTLE] Laurie and Whittles
New Chart of the Windward Passages and Bahama Islands, with the Islands of St Domingo, Jamaica, Cuba etc. Compiled from a great variety of topographical surveys and nautical details... Officers in the Spanish, French and English Navies. Engraved by W West.
Publication
London, Published by Robert Laurie and James Whittle, 2 September 1811.
Description Engraved chart, some folds strengthened on verso, some offsetting.
Dimensions 985 by 1265mm (38.75 by 49.75 inches).
The Windward Passages
Apparently a completely new chart of the Windward Passages, we cannot find an earlier example with this title, although other more simplified charts of the ‘Windward Passage’ were issued by Jefferys, and Sayer and Bennett. The chart includes an inset of the ‘Harbours of Kingston and Port Royal, Jamaica’; and 27 coastal profiles. Only one other example of this 1811 issue is known, but it was reprinted, with additions for another two decades.
[LAURIE, Robert; and James WHITTLE; after Thomas JEFFERYS and Robert SAYER]
An archive of manuscript charts for a ‘Collection of Accurate Hydrogaphic [sic] Plans, on a large scale, of the Principal Ports, Bays, Roads, and Harbours, in the WestIndies’.
Publication [London, Laurie and Whittle, 1794].
Description
23 (of a possible 40) original working manuscript charts, pen and black and red ink on paper, inscribed on the rectos with page numbers, occasional measurements, and other office comments; with one related office fair copy manuscript.
These charts were prepared for Laurie and Whittle’s abridged edition of Robert Sayer’s ‘West India Atlas’ published in 1794. The atlas, the brainchild of Thomas Jefferys, was first published in 1778, and designed to aid the highly lucrative sugar trade, which by this point accounted for around one-fifth of all imports to Europe, 80% of which was supplied by French and British colonies in the West Indies.
Unfortunately, Thomas Jefferys would not live to see the publication of his ‘West Indian Atlas’, and it was left to Robert Sayer who, in partnership with John Bennett, acquired his materials and published the atlas posthumously under Jefferys’s name. The work was evidently a commercial success as there were five subsequent editions under the Sayer and Bennett imprint. In 1794 an expanded and modified version with 61 plates was published under Sayer’s sole imprint. In the same year Laurie & Whittle acquired Sayer’s plates, and they published a further version with the same title-page, but with their imprint.
The charts:
8. ‘A Draught of the Bahias del Almirante named the Buccaniers Bocatoro’
9. ‘A Draught of Blewfields lagoon on the Moskito Shore’
10. ‘A Plan of Truxillo Bay, called also St. Giles’s Bay’
11. ‘A Draught of the Harbour of San Fernando de Omoa’ - (Inscribed “See Smith Speer page 29”)
12. ‘Plan of the Road and Port of La Vera Cruz’
14. ‘A Draught of the Entrance of Mobile’
16. ‘Plan of the Harbour of Pensacola’
17. ‘A Plan of the Entrances of Tampa bay, on the West Coast of Florida’
18. ‘Plan of Lucia Harbour and Mantega Bay’
19. ‘The Harbours of Port Antonio, in Jamaica’
23. ‘Plan of the City and Harbour of Havanna’
25. ‘Plan of the Nuevitas Harbour in the Island of Cuba’
27. ‘Plan of Barracoa in the Island of Cuba’
30. ‘The Harbour of St. Yago in the Island of Cuba’
32. ‘Petit Guave in the Island of Hispaniola’
33. ‘Leogane and Port au Prince in the Island of Hispaniola’ (Inscribed “Not at all like”)
35. ‘A Plan of the Road of Port Paix in the Island of Hispaniola’
(Inscribed “London, printed for R. Sayer and J. Bennett, 53 Fleet Street, as the Act directs, July 1779”)
36. ‘A Plan of the Town and Harbour of Cap Francois in the Island of St. Domingo’
39. ‘A Survey of the West Road of Portico, named by the Spaniards Aguada Nueva or New Watering Place’ corrections in red ink
40. ‘A Plan of the Forts and Harbour of San Juan de Portico’ corrections in red ink
[with]: an office fair copy manuscript “Commissioner Caye Comfite in the Old shails of Bahama. Capt. Dundas”; pen and black ink and pencil on paper.
[ANONYMOUS; and Bernard ROMANS]
Gulf of Mexico.
Publication [Madrid, Direccion de Hidrografia, before 1801].
Description
A collection of four original manuscript charts, pen and black ink, and colour wash on paper, early pencilled annotations, the chart of the Gulf inscribed “Gulf of Mexico” on the recto, and sequentially numbered: “No. 2”, “No. 3”, “No. 6.”, “No. 7” in the lower margin; and on the versos: “No. 38 B” - “Spanish Charts”, “No. 39 B” - “... Admiralty: 8 Aug. 1801 Rec.d from Mr. Coppinger by Mr. Tucker, Spanish S: America”, “No. 40 B”, “No. 41 B”.
Dimensions
Each sheet 940 by 640mm (37 by 25.25 inches).
A “Spanish Survey of the Antillas” [sic]
This small archive of simple and elegant charts, created by an unknown Spanish hydrographer, of the coast of New Spain and some of the islands of the West Indies, is that credited by Laurie and Whittle for the updates to their ‘A New General Chart of the West Indies from the several Surveys, made and regulated By Captn. N. Holland, Capt. B. Romans, &c. &c. and Corrected from the Spanish Survey of the Antillas’ (1799); and their magnificent.... (see item 25) Improved to 1st. Jany. 1802’; and their magnificent update of the Romans ‘A New Chart of the Gulf Passage’ (1779), ‘A Mercator’s Chart of the Gulf Passage, from Cape Antonio in the Isle of Cuba, to the 30th Degree of North Latitude in the Ocean, through the Gulf of Florida, or New Channel of Bahama’ (1802), item 25.
The inscription on the verso of chart “No.3” implies that the charts were all received from the Admiralty, who did not engage in publishing their own charts until 1808.
The charts are numbered sequentially, although clearly not all are present. Annotations indicate that astronomical observations were taken at Barbuda; Porto Velho, P. Canoa near Cartagena, and Sta Marta on the coastline of Bogota; and at Havana, Cuba. Fortifications are also marked.
JEFFERYS, Thomas
Ysla de Cuba hydro.
Publication [London, Laurie and Whittle, 1794].
Description
Fair office copy chart on two separate sheets, and one sheet of pilotages, pen and black ink on paper, with pencilled gridlines for copying.
Dimensions
Sheets one and two: 530 by 410mm (21 by 16 inches); sheet three: 265 by 410mm (10.5 by 16 inches)
Spanish chart of ports in Cuba
A collection of fair copy manuscripts of Spanish charts of Cuba. The first is another version of item 23815, ‘Plano de Isla de Cuba’ (before 1771), a close copy of one in the British Library, ‘Plano de Isla de Cuba’ (1760), on three sheets, which in turn is described as a fair manuscript copy of a Spanish map dating from the 1730s. Each includes the location of properties, waterways, and roadways.
With two charts of ports as found in English versions in Jefferys’s ‘A Collection of Accurate Hydrogaphic [sic] Plans, on a large scale, of the Principal Ports, Bays, Roads, and Harbours, in the West-Indies’ (1794).
‘Puerto de la Havana’ - plate 23. ‘Plan of the City and Harbour of Havanna’
‘Puerto de Matanzas’ - plate 24. ‘Plan of the Bay of Matanzas, on the North Side of Cuba’
‘Puerto Las Nuevitas’ - plate 25. ‘Plan of the Nuevitas Harbour in the Island of Cuba’
‘Puerto y Praya Baracoa’ - plate 27. ‘Plan of Barracoa in the Island of Cuba’
And:
‘Puerto Baya Honda’ - plate 20. ‘Plan of Bahia Honda, on the North Side of Cuba’
‘Puerto del Mariel’ - plate 22. ‘Plan of Port Mariel on the North Side of Cuba’
[ANONYMOUS]; and Thomas JEFFERYS
Plano de Isla de Cuba.
Publication [London, before 1771].
Description
Fair copy manuscript map, pen and black ink, and colour wash on five sheets of paper.
Dimensions
Sheet one: 320 by 385mm (12.6 by 15 inches); sheet two: 390 by 320mm (15.4 by 12.6 inches); sheet three: 530 by 385mm (20.8 by 15 inches); sheet four: 530 by 370mm (20.8 by 14.5 inches); sheet five: 270 by 410mm (10.6 by 16 inches).
A Spanish chart of Cuba
This detailed chart appears to be a very close copy of one in the British Library, ‘Plano de Isla de Cuba’ (1760), on three sheets, which in turn is described as a fair manuscript copy of a Spanish map dating from the 1730s. Both include the location of properties, waterways and roadways. This chart would have informed the charts of Cuba in the ‘West India Atlas’ (from 1775), and may be amongst the charts inherited by Sayer and Bennett from Thomas Jefferys when he died in 1771.
[ANONYMOUS]
[Untitled chart of Cuba].
Publication [Madrid, before 1799].
Description Original surveyor’s fair manuscript chart, inscribed on the verso “Drawings - Island of Cuba”.
Dimensions 710 by 530mm (28 by 20.75 inches).
An elegant Spanish chart of the western end of the island of Cuba, and the west coast of Florida. The chart extends west to include the eastern coast of Cancun, north to Tampa Bay on the coast of Florida, and south and east to Cape Coral. The chart appears to have informed Laurie and Whittle’s similarly elegant ‘A New General Chart of the West Indies From the several Surveys, made and regulated By Captn. N. Holland, Capt. B. Romans, &c. &c. and Corrected from the Spanish Survey of The Antillas, Publish’d in 1799.... Improved to 1st. Jany. 1802’, and ‘A Mercator’s Chart of the Gulf Passage, from Cape Antonio in the Isle of Cuba, to the 30th Degree of North Latitude in the Ocean, through the Gulf of Florida, or New Channel of Bahama’ (item 25).
It is worth noting that ‘A New General Chart of the West Indies’ (1799-1802) is quite distinct from the charts of the West Indies inherited from Thomas Jefferys by Sayer and Bennett, on his death in 1771, and posthumously published as the ‘West India Atlas’ from 1775 (see items 21).
OXHOLM, P[eter] L[otharius]
Plan of the Island of St Croix. From an Actual Survey 1794-1799.
Publication [London, c.1800].
Description Original working manuscript plat map, pen and black ink, and colour wash on paper, inscribed on the verso “Drawing of St. Croix Engraved by Baker”.
Dimensions 510 by 675mm (20 by 26.5 inches).
Charting slavery: where slaves outnumber white inhabitants by 10:1
A very detailed plat map, showing the location of about 200 properties, including plantations, sugar mills, the main towns of Christiansted and Frederiksted. A “Table of Population and Cultivation” upper-right includes statistics related to ethnicity, and produce compared to acreage. Oxholm (1753-1827), who eventually became governor of the Danish West Indies, surveyed the island shortly after his wife died in 1794. It was published by Laurie and Whittle in 1804.
KING, George
Virgin Islands by George King head Surveyor of those Islands. Where you see the Sailing Line drawn through the Channels stand in, fear no danger, you will find in general from 12 FM to 20 FM. SR. means Sunk Rock, ft - feet, and FM Fathoms, ~ A Current.
Publication [London, c.1800].
Description Surveyor’s fair copy manuscript chart, pen and black ink and colour wash on paper.
Dimensions 720 by 515mm (28.25 by 20.25 inches).
“Stand in, fear no danger”!
This beautiful chart, prepared with care and passion, includes a number of very heartfelt instructions: of the shoals around Anagada “The best advice concerning this dangerous place is Keep clear of it”; of St. Thomas, it “is not nicely measured, but is very sufficient to direct a stranger”. With a coastal profile of ‘The east view taken on the South side of the Road harabour, shews the general make of the Virgin Islands’.
A note in a separate, slightly later hand, says that “Some people have mistaken the High Land of Spanish Town for “Portorica”, and so run on Anegada”.
This chart is known in only one printed example, in the British Library, published by D. Steel in 1802. The National Archives record another manuscript example, dated 1800.
George King is credited with one other published chart, ‘To Isaac Pickering Esqr of Fox Lease Hants this Plan of Tortola From actual Survey by George King is dedicated by His most obedient humble Servant Robt. Wilkinson’ (1798).
The chart will have informed the new edition of Thomas Jefferys’s ‘West India Atlas’, published by Laurie and Whittle from 1807.
JEFFERYS, Thomas
Carte de l’Isle de la Grenade, cedee a la Grande Bretagne par le dernier Traite de Paix. Granada divided into its parishes, surveyed by order of his excellency Governor Scott, and engraved by Thomas Jefferys, Geographer to the King.
Publication [London, before 1775].
Description Office working manuscript map, pen and black and red ink on paper.
Dimensions 500 by 650mm (19.75 by 25.5 inches).
“Neither are there any Serpents or other Venomous Animals found here” (Observations)
An extremely detailed manuscript draft of the island of Granada created in preparation for Thomas Jefferys’s ‘West Indian Atlas’ (1775), with copious amendments throughout, including to the title, which had previously been spelled “Grenada”. Most changes are in red ink, and the French title has been supplied on an overslip.
The “Observations” lower left, here added in red ink, pronounce the suitability of the island for the production of sugar: “a great number of fine Rivulets which facilitate the Constructions of Water-mills for the use of the Sugar Plantations, The Eastern Part Called the Cabesterre has the Best Soil,... The Hurricanes which make such frequent and dreadful devastations in the Antilles are not so Common in this Island... Neither are there any Serpents or other Venomous Animals found here”.
JEFFERYS, Thomas
Tobago.
Publication
London, Published Jan. T. Jefferys, 1765.
Description
Engraved chart, with contemporary handcolour in outline, margins a little frayed.
Dimensions 505 by 650mm (20 by 25.5 inches).
A decorative chart of Tobago with two insets: ‘Man of War Bay’, and ‘A survey of Great & Little Courland Bay’s’.
One of only two charts of the West Indies published in the year before Jefferys was declared bankrupt in November 1766, the other being of Dominica. Much of his stock-in-trade sold in a ten-day auction in February 1767. It was subsequently published by Sayer and Bennett in the ‘West India Atlas’ (1775). One of only two
JEFFERYS, Thomas
Curacao from the Dutch Originals of Gerard van Keulen. Regulated by Astronomical Observations.
Publication [London, before 1775].
Description
Original working manuscript map, pen and black ink on paper, inscribed “203” lower right-hand corner, ink stains.
Dimensions 500 by 640mm (19.75 by 25.25 inches).
CuraÇao
An extremely detailed engraver-ready manuscript map of the island of Curaçao, with an inset of ‘Fort Amsterdam’, and four coastal profiles created in preparation for Thomas Jefferys’s ‘West Indian Atlas’ (1775).
Curaçao, unlike many of the other islands in the West Indies, was an island whose utility was not due to its sugar production, but rather the less palatable trade in slaves. The current map is based on an earlier chart by the great Dutch cartographer Gerard van Keulen.
SAYER, Robert; and John BENNETT
A New Chart of the Coast of Guayana.
Publication
London, Printed for Rob.t Sayer and J. Bennett, [before 1785].
Description
Original working manuscript chart, pen and black and red ink on paper.
Dimensions 720 by 510mm (28.25 by 20 inches).
Sayer and Bennett’s new chart of Guayana updated for the new edition of the ‘West India Atlas’, but not published until after the separation of Sayer and Bennett.
WHITTLE, Robert; and James WHITTLE
A New Chart of the Coast of Guayana from Rio Orinoco to River Berbice, Containing the Dutch Colonies of Poumaron, Issequibo and Demerary, and Berbice.
Publication London, Published by Laurie & Whittle, No. 53 Fleet Street, as the Act directs, 1795.
Description
Original working manuscript chart, pen and black and red ink on paper.
Dimensions 725 by 515mm (28.5 by 20.25 inches).
Guayana 1794
Updating Robert Sayer’s chart of 1787, published for the new edition of the ‘West India Atlas’.
The peace of 1801
GOODALL, Captain Thomas
A New Chart of Surinam [sic] River from the eastern edge of Soundings to Parimarabo [sic]. Accompanied with Sailing Directions, Views of the Land &c. Publication [London], 1801.
Description
Surveyor’s fair copy manuscript chart, pen and black ink and colour wash on paper, inscribed 208 lower right, and on verso “208” and “Drawing of Surinam River to Parimarabo by Capt. Tho.s Goodall”.
Dimensions 475 by 605mm (18.75 by 23.75 inches).
A beautiful chart of the entrance to the Surinam River by Captain Thomas Goodall (1767–c.1832), eventually Admiral of Haiti, but who also ran away from school at 13 and “shipped on board a privateer bound for the West Indies, which was cast away on St. Kitts in the hurricane of Oct. 1780. He was so fortunate as to fall into the hands of a merchant there who was acquainted with his father, and passed him on to an uncle in Montserrat... [after many adventures at sea, and]...having no prospects in the navy, he obtained command of a merchant ship bound to the West Indies. During his absence the war with France began, and on his homeward voyage he was captured by a French privateer and carried into L’Orient. He was, however, fortunate enough to win the good will of his captor, who found an opportunity to let him escape on board a Dutch timber ship then in the port. On his return to England, he is said to have been appointed to the Diadem frigate; but he does not seem to have joined her; he was certainly not entered on the ship’s books [Pay-Book of the Diadem]. He accepted the command of a small privateer, and continued in her till the peace of 1801, ‘during which time he is said to have made more voyages, fought more actions, and captured more prizes than ever before were effected in the same time by any private ship’” (Laughton for DNB).
One of the first lands spied in the New World
[WIC - Geoctrooieerde Westindische Compagnie]
Ilje Ferdonando [sic] de Noronho.
Publication [Brazil, after 1733].
Description Original manuscript chart, pen and black ink, and colour wash, numbered “108” lower right, on paper watermarked with a Strasbourg Lily (Churchill 406, 1733) torn with loss to the upper right-hand corner, without affecting the image.
Dimensions 410 by 520mm (16.25 by 20.5 inches).
References Zandfliet, ‘Mapping the Dutch World Overseas in the Seventeenth Century’, in ‘The History of Cartography’, volume III.
The strategic island of Noronho in the western Atlantic was first included on Spanish charts of the area in 1500. It may be the “Quaresma” of the ‘Cantino Planisphere’ (1502). Amerigo Vespucci stepped foot on Noronho on August 10th, 1503, calling it St. Lawrence in honour of the saint whose feastday it was. It was a source for the lucrative commodity of Brazilwood, and the hideout of the pirate “Black Bart” in 1719.
Despite its losses, this is still an elegant example of a Dutch West India Company - WIC – manuscript chart possibly from their Brazil workshop.
The distinctive compass rose, by which cartographers of the VOC and WIC identified themselves, is unrecorded.
The island, situated below the equator, was not one of those on the “Waage Weg”, or “Karrepad” route, prescribed by the VOC and WIC to navigate the doldrums between Africa and Brazil.
The West India Company (WIC), was founded in 1621 to “control trade in the West African and American coastal lands. Between 1602 and 1795, when these chartered companies existed, hundreds of mapmakers produced topographical maps of Dutch overseas territories and charts for navigating to and from them. Some mapmakers were based in the Netherlands, while others worked in the overseas territories.... After its capture by the Dutch in 1630, Recife in Brazil became the WIC’s overseas administrative center to coordinate military and exploratory expeditions and hydrographic surveys. Whereas the equipagemeester and the Governor General directed cartographic work in Batavia, the admiral was responsible for hydrography in Brazil... For military engineers working for the WIC in Brazil in the 1630s, reconnaissance of Portuguese fortresses was a routine matter: before an attack was launched, they would usually prepare a map to inform the commanders. Such maps were usually reconnaissance survey based on estimates and not surveyed measurements. Military engineers were also present on Dutch naval fleets sailing in European, Mediterranean, and Atlantic waters” (Zandfliet).
SAYER, Robert
Plan of the Island of Fernand [sic] de Noronha. From a French Survey. Compared with the Survey made by The Colchester man of war in 1760.
Publication London, Printed for Robert Sayer, Fleet Street, [c.1785, or later].
Description Original working manuscript chart, pen and black ink on paper, inscribed “108” lower right.
Dimensions 505 by 630mm (20 by 24.75 inches).
The strategic island of Noronho was surveyed by Alexander Dalrymple, and published as a ‘Plan and View of the Island Fernando Noronha’ in his atlas of 1783. As no published example of a separate chart dedicated to Noronha can be found published by Robert Sayer, it is possible he put it aside after the success of Dalrymple’s charts.
LEVANTADO, Pedro
Carta redicida desde el Puerto de Maldonado hasta el Rio Grande des.n Pedro Levantado p.r les Gegfra.s de la Demar.n de Limit.s entre les Dominin.s de Espana, y Portug.l g.e dio principio en el Arroyo del Chuy el ano de 84...
Publication [Madrid, 17]84.
Description
Surveyor’s fair copy manuscript chart, with office amendments in pencil, inscribed on the verso “No. 12 B”.
Dimensions 510 by 630mm (20 by 24.75 inches).
A Spanish chart, by an otherwise unknown cartographer, who surveyed the area not very long after Maldonado was founded as a city in 1757. It was probably acquired by Robert Sayer shortly after it was drawn.
New Spain: source map for Bauza y Canas’s chart of the Rio de la Plata estuary
[ANONYMOUS; BAUZÁ Y CAÑAS, Felipe; Alessandro MALASPINA]
Carta esferica del Rio dela Plata emendata la mayor parte de la Costa N,S, Sorida, y C[ap]o. Sn. Antonio p.r el Cap.n de Navio dela Real Armada Dn. Alexandro Malaspina el Ano de 1789 [obscured text] Nota Los Numeros de la Sonda son Brazas de dos Baxas Castallanaz.
Publication [Rio de la Plata, 1789-1794].
Description
Original manuscript chart, pen and brown ink and colour wash, on paper, inscribed in pencil in a nineteenth century hand lower left “A.L.”, and “River Plate” on verso.
Dimensions 570 by 860mm (22.5 by 33.75 inches).
An original manuscript chart from Alessandro Malaspina’s celebrated expedition to circumnavigate the world for the Spanish crown at the height of Spanish Empire in the Americas. The chart shows the entrance to the Rio de la Plata – River of Silver - extending on the east coast to Uruguay, and on the south coast from Cabo San Antonio to Buenos Aires. The river’s estuary is the confluence of the Uruguay and Parana Rivers where they empty into the Atlantic Ocean, which now marks the border between Argentina and Uruguay. Then, it was the first significant stop of Malaspina’s voyage.
This chart is clearly source material for a more sophisticated chart, drawn by Felipe Bauzá y Cañas, with the addition of insets and views, engraved by Fernando Selmala, and published as ‘Carta esférica del Río de la Plata desde su desembocadura hasta Buenos Aires levantada de Orden del Rey en 1789 y rectificada en 1794 por varios oficiales de su R[ea]l Armada, Presentada a S.M. por mano del Excmo. Sr. D. Juan de Langara Secretario de Estado y del Despacho Universal de Marina’ (1798).
Robert Laurie probably acquired this chart, and another in the collection, from Felipe Bauzá y Cañas, the official hydrographer to the Malaspina expedition, who fled to London in 1823, bringing his papers and charts with him. The two would have undoubtedly known each other.
See item (45) for a later version of this chart.
Any contemporary chart related to the Malaspina expedition is exceptionally rare.
[LANGARA, Don Juan de; Felipe BAUZÁ Y CAÑAS, Felipe; and Alessandro MALASPINA]
[Carta esferica del Rio dela Plata desde su desembocadura hasta Buenos Aires levantada de Orden del Rey en 1789 y rectificada en 1794 por varios oficiales de su R[ea]l Armada, Presentada a S.M. por mano del Excmo. Sr. D. Juan de Langara Secretario de Estado y del Despacho Universal de Marina].
Publication [Madrid, Depósito hidrografico de la Marina. Cartographe, after 1798].
Description
Surveyor’s fair copy manuscript chart, pen and black ink on paper, with pencilled gridlines for copying, and inscribed on verso “Spanish M.S. of the River Plata”.
Dimensions 940 by 615mm (37 by 24.25 inches).
References Barber, ‘‘Riches for the geography of America and Spain’: Felipe Bauzá and his topographical collections, 1789-1848’, 1986.
Preparatory manuscript chart for Bauza’s chart of the Rio de la Plata estuary
A manuscript chart, probably in the hand of Felipe Bauzá y Cañas, official hydrographer to Alessandro Malaspina’s celebrated expedition to circumnavigate the world for the Spanish crown at the height of Spanish Empire in the Americas. The chart shows the entrance to the Rio de la Plata – River of Silver - extending on the east coast to Uruguay, and on the south coast from Cabo San Antonio to Laguna de Rocha. The river’s estuary is the confluence of the Uruguay and Parana Rivers where they empty into the Atlantic Ocean, which now marks the border between Argentina and Uruguay. Then, it was the first significant stop of Malaspina’s voyage.
The chart is a more sophisticated version of the central part of Felipe Bauzá y Cañas’s earlier chart, engraved by Fernando Selmala, and published as ‘Carta esférica del Río de la Plata desde su desembocadura hasta Buenos Aires levantada de Orden del Rey en 1789 y rectificada en 1794 por varios oficiales de su R[ea]l Armada, Presentada a S.M. por mano del Excmo. Sr. D. Juan de Langara Secretario de Estado y del Despacho Universal de Marina’ (1798). It is possible that it was source material for William Heather’s ‘Survey of the River Plate, Presented to the King of Spain By Don Juan de Langara’ (1806); subsequently revised and issued as ‘Don Juan de Langara’s Survey of the River Plate, Made By Order of the King of Spain, with Additions and Improvements, By J.W. Norie, Hydrographer’ (1824).
Leaving Cadiz in July of 1789, the ‘Descubierta’ and ‘Atrevida’ sailed up the Rio de la Plata to survey the estuary, with the help of a convoy of local navigators, and to report on the state of the Viceroyalty of Rio de la Plata, which extended to include the whole of the Rio de la Plata basin, including Argentina, Chile, Bolivia, Paraguay, and Uraguay - an enormous but very short-lived and tumultuous arm of the Spanish Empire (1776-1825). The expedition was there a few months, before heading south to the Falkland Islands.
Returning to Cadiz in 1794, the expedition was a hailed a resounding success, but Malaspina was too outspoken in his opinions for the successful governance of the Spanish Empire abroad, and he fell foul of political intrigue, lost the favour of the King, was tried, convicted, imprisoned in 1795, and the results of his expedition were essentially suppressed, which is why published charts related to the Malaspina expedition are so rare. Malaspina’s papers in the archives of the Dirección de Hidrografia were only edited and published in Madrid by Don Pedro de Novo y Colson as ‘Viaje politico-científico alrededor del mundo’ in 1885.
Initially, Bauzá fared better. He had a very successful career, first in the hydrographic office in Madrid, then he succeeded Espinosa y Tello as director of the Depósito Hidrográfico, and was elected to the Royal Society (Britain) in 1819. However, in 1823, he too found himself on the wrong side of royal favour and fled to London, taking all his papers with
him, including this chart. During his lifetime he made good use of his own archive, and the Admiralty published some of his charts, but after his death in 1833, his family sold much of what was left, to various interested institutions, including the Admiralty Office, the British Library, “one of the largest collections of maps and official papers on colonial Latin America outside the Iberian Peninsula (now Add. MSS. 17556-676). Commonly known as the ‘Bauza Collection’, its story before December 1848, when it was acquired by the British Museum” (Barber).
Robert Laurie, probably acquired this chart, and another in the collection, from Felipe Bauzá, the official hydrographer to the Malaspina expedition, who fled to London in 1823, bringing his papers and charts with him. The two would have undoubtedly known each other.
See item (44) for an earlier version of this chart.
SAYER, Robert
A New Chart of the Coast of Brazil From the Banks of St. Roque, to the Island of St. Sebastian with the Islands and Soundings in the Offing from the Portuguese and Dutch Draughts and the Journals of The British Navigators.
Publication London, Published for Robert Sayer, London, as the Act directs, [before 1792].
Description Original working manuscript chart, pen and black ink on paper, inscribed on “106” lower left-hand corner, and on the verso “Coast of Brasil, engraved by Neele, 1792”.
Dimensions 925 by 610mm (36.5 by 24 inches).
A decorative chart of Brazil with three insets: ‘The Coast of Brazil, between St. Ann’s Islands, and Point Joatinca, from the Chart drawn for the Use of the Portuguese Ships, by Sim. Ant. de Rosa Pinheiro, with several Additions from English and French Draughts’, ‘Bahia de Todos os Santos, or the Bay of all Sants, with the Coast to the Southward, as far as Camamu River on a Large Scale’, ‘A Sketch of Ascensaõ or Portuguese Ascension from Manoel Pimentel’.
One of the last commissions of Robert Sayer before he passed his business on to Laurie and Whittle, who re-published the chart in 1794.
The printed Sayer chart of 1792, engraved by Samuel John Neele, is exceptionally rare, with no examples appearing in commerce in available records, and known in only two institutional examples, at the Biblioteca Nacional España.
GRANT, William
Draught of the Bay of St Fondi in South America & all of Mid Channel.
Publication [London], 1802.
Description
Surveyor’s fair copy manuscript; engraved chart of ‘A Correct of the Caribbee Islands’ by Mount and Page on the verso, also inscribed on the verso “No. 16B”.
Dimensions 440 by 535mm (17.25 by 21 inches).
Rio Negro Province, Argentina
A very basic sketch of the strategic Bay of St. Fondi, by whaler William Grant, of whom nothing else is known.
With a long and informative note on how to navigate the treacherous waters around the entrance of the natural harbour:
“Remarks on this Draught:
As this sketch of the Bay St. Fondi was taken merely from amusement, and not with a design that it (if it should fall into other hands) should be trusted to altogether, it is necessary to point out some errors, and likewise make some remarks on the Bay whose dangerous entrance has prevented the Greatest part of our South Sea Whalers & Sealers form going into it on account of the variety of soundings in standing in for the Land,.... for if the Current Sets to the Norward it will take you over to the North Caper near River Negro, which Coast as I am well informed is very dangerous and what makes it still more so, it has not been explored by our English navigators the Spaniards have a Small Settlement at the mouth of the River and Carry in a Trade to Monte Video in Small Coasting Smacks...”
Boat Song
Mingulay
The Longest Johns
The North & Irish Seas
There is not much of the world that Joseph Huddart did not chart... some of his most detailed are of the coastlines of the British Isles, and how to safely access the most important seaports: Bristol and Liverpool on the west coast. In the far north how not to run aground on one of the numerous islands that can hamper a successful whaling expedition. And, on the east coast, the nearest ports to the corresponding ones on the coasts of Holland and Germany, during the Napoleonic Wars.
[PHIPPS, Constantine John; and Lutwidge SKEFFINGTON]
A New Chart for the Whale Fishery and the Archangel-Traders or the Navigation in the Northern Seas from Great Britain and Ireland to Spitsbergen and the White Sea. Drawn from the most accurate surveys regulated by the latest Astronomical Observations.
Publication London, By R. Laurie and J. Whittle, No. 53 Fleet Street, [1796].
Description
Original working manuscript chart on two separate sheets, pen and black ink on paper, with inset corrections, inscribed “77” in each lower right-hand corner, and “White Sea, engraved by Geo. Allen 1796”.
Dimensions 500 by 720mm (19.75 by 28.25 inches).
Whaling
nation: bombing through to a polar sea
An expansive yet detailed chart of the northwestern coast of Europe, including the British Isles, the eastern coast of Iceland, Norway, and Greenland. With numerous insets, including a large ‘Particular Chart of the White Sea. From the Late Russian Survey’, and several coastal profiles.
Including the results of the Phipps voyage to the Arctic circle in the “bomb” vessels HMSs ‘Racehorse’ and ‘Carcass’ of 1773, in search of an Open Polar Sea.
The chart was first published by Laurie and Whittle in 1796.
[HUDDART, Joseph]
[A Chart of the West and SouthWest Coast of Ireland from the Mouth of the River Shannon to Waterford Haven on the same Scale as the Chart of St. George’s Channel. By Capt. Jos. Huddart].
Publication [London, c.1795].
Description Original working manuscript chart, pen and black ink on paper, inscribed “35” lower left-hand corner.
Dimensions 830 by 525mm (32.75 by 20.75 inches).
The western sheet
The western sheet of an extremely detailed and large-scale chart of the southwest coast of Ireland, including part of the coastline of Clare, all of Kerry, and part of Cork counties. First published by Robert Sayer in 1786, and here revised by Laurie and Whittle in 1795 for ‘The Coasting Pilot, for Great-Britain and Ireland’.
The Atlantic coast of Ireland
HUDDART, Joseph
A New Hydrographical Survey of the West Coast of Ireland, from the Shannon Mouth to Urris Head, with part of the North coast from Urris Head to Milk Haven; being a Continuation of the Marine Surveys made by Capt., Joseph Huddart.
Publication London, Printed for Rob.t Sayer and J. Bennett, Fleet Street, as the Act directs. [c.1781].
Description
Original working manuscript chart, pen and ink on paper, inscribed “37” lower left.
Dimensions 805 by 550mm (31.75 by 21.75 inches).
Huddart’s chart of part of the Atlantic coast of Ireland, taking in Sligo Bay, Galway Bay, and Shannon mouth, published on September 19th, 1781, and included in early editions of the ‘The Coasting Pilot, for Great-Britain and Ireland’.
OUTHET, J.
“Bristol to Cork &c” [verso].
Publication [London], 1813.
Description
Original working manuscript chart on two separate sheets, pen and black and red ink, and pencil and colour wash, on paper, inscribed “28*” on a lower corner of each sheet, and on the verso “Bristol to Cork &c by J. Outhett 1813 Engraved by W. West”, title cartouche excised.
Dimensions
Sheet one: 980 by 650mm (38.5 by 25.5 inches); sheet two: 990 by 650mm (38.9 by 25.5 inches).
A very large-scale map of the busy shipping lanes of St. George’s Channel, between the ports of Bristol, England, and Cork Harbour, Ireland; extending to include Dorset in the east, northwest to Wexford, and northeast to Aberystwyth. The chart also includes the Scilly Isles and a large detailed inset ‘The Scilly Isles from the Survey of Mr. Graeme Spence, with their Position as determined by the Grand Trigonometrical Survey’, and indications that an inset of the ‘Entrance of Cork Harbour’, and others would be supplied.
The title cartouche has been removed, by the mapmakers, presumably with the intention of replacing it with an inset correction, and for publication in the 1813 edition of Laurie and Whittle’s ‘A Coasting Pilot for the Western Seas of Great Britain’. The chart updates the lower sheets of ‘A New and Original Hydrographic Survey of the North and St. George’s Channels’ (1808).
[HUDDART, Joseph; Robert Fulke GREVILLE; J. OUTHET; and others]
A New Chart of the Coast of Pembrokeshire between Strumble Head & Lenny Head including the adjacent islands, rocks, &c, compiled from the Surveys of Messrs Mackenzie, Huddart, Morris, &c and regulated by The Grand Trigonometrical Survey.
Publication
London, Published by Rob.t Laurie and Ja.s Whittle, Chart-Sellers to the Admiralty, &c &c No. 53 Fleet Street, 1812.
Description Original working manuscript chart, pen and black and red ink on paper, inscribed on the verso “Coast of Pembrokeshire 1812 J Outhet 31*”.
Dimensions 725 by 540mm (28.5 by 21.25 inches).
Including the observations of “Colonel Wellbred”
This chart includes the most up-to-date information, including that supplied by the Hon. Robert Greville of “The Porgus or Turbot Bank” in 1812, who was, at the time, master of King George III’s bedchamber at Windsor. He may have known about the bank as a result of visiting his brother, Charles Francis, who with Sir William Hamilton had helped to establish the port of Milford Haven, shown on the chart. It was Fanny Burney who first called Greville “Colonel Wellbred”.
[HUDDART, Joseph]
A New chart of the West Coast of England from the Point of Lynus in Anglesea to Formby Point in Lancashire. Including the Rivers of Chester and Liverpool.
Publication London, Published by Laurie & Whittle, 53 Fleet Street, A New Edition, considerably improved, 1st January, 1811.
Description
Large engraved bluebacked chart on two separate sheets, with extensive manuscript amendments on insets in red ink, each sheet inscribed “32” lower right.
Dimensions
Each sheet 555 by 725mm (21.75 by 28.5 inches).
Liverpudlian expansion
The extensive revisions to this new edition of Laurie & Whittles’s chart include the busy international port of Liverpool and the surrounding area. Published in the new edition of ‘A Coasting Pilot for the western seas of Great Britain’ (1811).
PRESTON, Captain Thomas; and “an Ingenious Officer of the Royal Navy”
A New Hydrographical Survey of the Islands of Shetland by Capt.n Thomas Preston, with many Improvements and Additions, and the Sailing Directions.
Publication London, Printed for Robert Sayer and John Bennett No 53 Fleet Street, as the Act directs, [1781].
Description
Original working manuscript chart on two separate sheets, with a surveyor’s fair copy manuscript chart, pen and black ink on paper, each inscribed “63” in a lower corner.
Dimensions
Sheet one: 490 by 620mm (19.4 by 24.4 inches); sheet two: 485 by 620mm (19 by 24.4 inches); sheet three: 230 by 615mm (9 by 24.2 inches).
Whaling
From the 1780s to the mid-nineteenth century, Shetland played an important part in the Arctic-Greenland whaling industry. This detailed chart of the numerous islands and the ways between them would have been an invaluable resource.
The two sheets of the main chart were first published in 1781, and included in early copies of Huddart’s ‘The Coasting Pilot for Great Britain and Ireland’. They are accompanied by a chart by “an Ingenious Officer of the Royal Navy” of the sound between the mainland and the Isle of Brassa, which will have informed the main chart. It is also possible that the Officer was “indigenous” rather than “ingenious”, or perhaps both?
[HUDDART, Joseph]
A New Chart of the North Coast of Scotland from Cape Wrath to Duncansby Head, with Pentland Firth, and the Orkney Islands.
Publication London, Printed for Robert Sayer and John Bennett Fleet Street, as the Act directs, [c.1781].
Description
Original working manuscript chart on two joined sheets, pen and black and green ink on paper, inscribed “62” lower right, and on the verso “North Coast of Scotland”.
Dimensions 630 by 955mm (24.75 by 37.5 inches).
Whaling nation: “NB. All the small islands are called Homs”
A superb chart of the northernmost coastline of mainland Scotland, and the Orkney Islands, with an inset of “Burra”, numerous coastal profiles, and very detailed instructions on how to navigate the Pentland Firth.
The green lines show “the common” ways to navigate between all the little islands, or “Homs”.
The chart was first published in 1781, in Huddart’s ‘The Coasting Pilot for Great Britain and Ireland’ and reprinted many times without change until at least 1794, after which the title cartouche was changed.
The Western Isles
[HUDDART, Joseph]
A New Chart of the West Coast of Scotland from the Point of Ardnamurchan to Cape Wrath, including the Western Islands of Lewis and Harris, North Uist, Benbecula, South Uist, Barra, Sky, Rum &c. c a.
Publication
London, Printed for Robert Sayer and John Bennett Fleet Street, as the Act directs, 1781.
Description
Original working manuscript chart on two joined sheets, pen and black in on paper, with the title cartouche on an engraved inset, inscribed “41” lower left, and on the verso “West Coast of Scotland”.
Dimensions
940 by 625mm (37 by 24.5 inches).
A beautiful chart of the west coast of Scotland and the Western Isles, showing the route to Norway.
The chart was first published in 1781, and was included in early copies of Huddart’s ‘The Coasting Pilot for Great Britain and Ireland’.
HUDDART, Joseph; Captain William BLIGH; and others
Laurie and Whittle’s New Chart of the North Sea; compiled and reduced from the great national and topographical surveys of Britain, France, Holland, Germany, and Denmark; and from the Nautical Surveys of the most Scientific and Experienced Navigators; regulated by the Astronomic Observations of Captain Joseph Huddart; Captain W.m Bligh;...
Publication
London, Published,... by Robert Laurie and Jas. Whittle, No. 53 Fleet Street, 1805.
Description
Original working manuscript chart on two (of three) separate sheets, pen and black ink on paper, with inset corrections, each inscribed “42” on a lower corner, and on the verso “Drawing of the North Sea. I. Purdy engraved J. Bye, 1806”.
Dimensions
Sheet one: 960 by 635mm (37.8 by 25 inches); sheet two: 985 by 645mm (38.7 by 25.4 inches).
A complex Napoleon effect: pre-empting trading woes
This large-scale chart, oriented with west to the top, and based on numerous surveys of British, French, and Danish navigators was published from 1806, just as Napoleon implemented his continental blockade, when the sea routes of the North Sea would become of paramount importance to the health of the British economy.
Published by Laurie and Whittle on March 25th, 1806, and included in their ‘Pilot for the Eastern Coasts of Great Britain’.
GROVE, Captain [Carl Frederik]; WIBE, Ober Krig-Commissaire; and Lieutenant [Benoni] D’AUBERT
Speciel Kaart over den Deel af Den NorskeKust fra Stadt-Land og til Blomöe.
Publication [Denmark], Royal Danish Navy, 1795.
Description Engraved chart on four joined sheets, with two manuscript pasted overslips, torn along central fold.
Dimensions 605 by 910mm (23.75 by 35.75 inches).
The westernmost point of Norway
A chart by Captain Grove showing the western coast of Norway from the Stadlandet peninsula (“Stadt-Land”) southwards to the island of Blomøyna (“Blomöe”) just north of Bergen. This stretch of the coast includes the small island of Holmebåen, Norway’s westernmost point. No soundings are provided in the North Sea, but the intricate waterways created by Norway’s many islands are presented in great detail, with suggested passage through them indicated by dashed lines.
THE DANISH ADMIRALTY
A chart of the northern coast of Norway from the Halten Islands to Christiansund including the Need or Channel of Drontheim surveyed by order of the Danish Admiralty and published at Copenhagen in 1791.
Publication London, Laurie and Whittle, 1797.
Description Original working manuscript map on two joined sheets, pen and black ink on paper, with two insets.
Dimensions 625 by 925mm (24.5 by 36.5 inches).
A manuscript chart of the western coast of Norway between Kristiansund (“Christiansund”) and Frohavet, the stretch of water on the west coast of the Trøndelag region.
Norway’s countless islands are depicted in detail, with obstacles and hazards highlighted by symbols, and routes through the many channels and inlets shown as dashed lines. Mountainous areas are also represented pictorially.
The first printed edition of the chart was published in 1797 by Laurie and Whittle, but without the coastal views added to the manuscript here.
GROVE, Captain [Carl Frederik]; WIBE, Ober Krig-Commissaire; and Lieutenant [Benoni] D’AUBERT
Speciel Kaart over den Deel af Den NorskeKust fra Christiansund og til Stadt-Land.
Publication [Denmark], Royal Danish Navy, 1793.
Description Engraved chart on two joined sheets, with manuscript pasted overslip, clipped to corners, torn along central fold.
Dimensions 610 by 910mm (24 by 35.75 inches).
A Danish chart of Norway by a Norwegian Dane
A Danish chart of a central stretch of Norway’s west coast, from the Stadlandet peninsula (“Stadt-Land”), which separates the Norwegian Sea and the North Sea, up to the town of Kristiansund (“Christiansund”), a major exporter of salted cod since the seventeenth century.
Between 1788 and 1802, Danish-Norwegian naval officer Carl Frederik Grove undertook a survey of the coast of Norway, assisted by his colleagues, Benoni d’Aubert, and N.A. Wibe. The sea charts produced by Grove, known as the ‘Groveske drafts’, remained for a long time the only available charts of Norway, and won him the King’s Medal of Honour. Although Grove does not give soundings in the waters of the Norwegian Sea, the innumerable islands, inlets, rocks, and fjords are depicted with great precision. Dashed lines indicate safe passage through the many obstacles. Pasted along the upper edge of the chart are two manuscript views of the land, as seen from the water, to help sailors identify their location.
GROVE, Captain [Carl Frederik]; WIBE, Ober Krig-Commissaire; and Lieutenant [Benoni] D’AUBERT
Speciel kaart over en deel af den Norske Kyst indbefattende noget af nord leedene, samt heele syd leedet til Berget tilligemed indtobet til Stavanger.
Publication [Denmark], Royal Danish Navy, 1798.
Description Engraved chart on two joined sheets, with manuscript pasted overslip, clipped to corners.
Dimensions 920 by 625mm (36.25 by 24.5 inches).
Up to Ooe Öe
A Danish chart of a southern stretch of Norway’s west coast, from Stavanger in the south to Ona Island (“Ooe Öe”) in the north, including the city of Bergen.
As on all of Grove’s charts, soundings are not provided, but the country’s many islands are shown in precise detail, and lines suggest routes through its numerous fjords. On the left-hand side are two long vertically-drawn views of the land, as seen from the sea. Various points are labelled with a letter, but there is no alphabetical key, nor do the same letters appear prominently anywhere on the chart. Toponyms are all underlined in red ink, which may reflect where someone has checked them off when studying or reviewing the chart.
My Mother Told Me
A Viking Sea Shanty
Þat mælti mín móðir, at mér skyldi kaupa fley ok fagrar árar, fara á brott með víkingum, standa upp í stafni, stýra dýrum knerri, halda svá til hafnar hǫggva mann ok annan, hǫggva mann ok annan.
The Baltic Sea
The icy waters of the Baltic Sea have been of primary importance to the surrounding countries of Scandinavia, Central and Eastern Europe, as offering access to the waters of the Atlantic to the west. During the Middle Ages, the sea was dominated by Norse merchants, or Vikings, who built a trade empire that reached as far south as the Black Sea via the rivers of Russia. Some centuries later the Baltic became an arena of conflict as various powers, including the Dutch, Swedish, Danish, Polish and German, in the form of the Hanseatic League, fought for power over its waters.
Dominance was quickly gained and quickly lost, with Sweden rising to pre-eminence during the seventeenth century only to lose it to Russia in the Great Northern War of 1700 to 1721, of which the Baltic Sea was the central theatre of conflict. Indeed, the city of Saint Petersburg was founded in 1703 on the site of a captured Swedish fortress, with the aim of improving Russia’s trading opportunities with the wider world.
Such conflict gave rise to a great number of surveys of the Baltic during the seventeenth, eighteenth and nineteenth centuries. Hydrographers were charged with the great task of charting the waters’ innumerable islands, inlets, hazards and currents, information with which their states could give themselves the greatest chance of success in naval skirmishes as well as trade. Much of the hydrographical material published by English chart-makers drew heavily on the work of their Scandinavian and Russian counterparts, although Royal Navy expeditions during the Great Northern War, War of the Austrian Succession and Seven Years’ War did yield new information which was then added to sea charts of the Baltic.
PRICE, William; and Capt. George WATSON
A New Chart of the Skager Rak, or Skaw Reach between the East Coast of Norway and the North Coast of Jutland, from the Naze to the Skaw, with the West Coast of Norway from Bergen to the Naze. According to the latest Danish surveys. Improved from the Remarks and Observations made by Cap.t William Price and Cap.t George Watson.
Publication
London, Printed for Robert Sayer, Chart Seller, Fleet St. Aug.st 28th, as the Act directs, 1791.
Description
Engraved chart with large sections of inset manuscript corrections, annotated throughout with office amendments in red ink, and with “North Jutland” excised from the lower right-hand corner.
Dimensions
720 by 545mm (28.25 by 21.5 inches).
Whaling nation: cutting out North Jutland
The mapmakers are clearly preparing for the new issue of this chart, published with the imprint of “Rob.t Sayer & Co.,... 15th July, 1793”, indicating that while Laurie and Whittle were now partners in the firm, they had not yet assumed control.
Already a well-used mapsheet, printed on the verso of a chart of the Mouth of the Humber, this proof has been comprehensively chopped up, with new insets supplied, and some just missing altogether...
PRICE, Captain William; and Captain George WATSON
A new chart of the coast of South and North Jutland from the Isle of Heilgeland to the Skaw, with all the banks and soundings; according to the Dutch and Danish surveys improved from the observations made by Captain William Price and Captain George Watson.
Publication London, Robert Sayer and John Bennett, [c.1778].
Description
Original working manuscript chart on two joined sheets, pen and black and red ink, with grey wash on paper, “Drawing of South and North Jutland” inscribed to verso.
Dimensions
750 by 540mm (29.5 by 21.25 inches).
The waters of western Denmark
A manuscript map of western Denmark, extending from its northernmost point at Skagen (“the Skaw”) down to the Eider River in the south of the country.
Towns, cities, and forts are identified on the coast, and five views display the lay of the land, as seen from the waters of the North Sea to the west. Soundings are provided, as well as maritime obstacles such as reefs, banks, and shoals. Further detail has been added to the chart in red, mainly to the many islands of South Jutland, but also in the north, where “the Jutland Reef” is depicted. The first printed edition of the chart, with these updates incorporated, was published in 1778 by Sayer and Bennett.
[ANONYMOUS]
A new chart of the passage of the Sound from the survey published at Copenhagen in 1770 for the use of the Royal Pilots.
Publication London, Robert Sayer and John Bennett, c.1778].
Description
Manuscript chart on two joined sheets, inscribed on verso in contemporary ink manuscript “Passage of the Sound”, two small tears without loss, some light surface soiling.
Dimensions 555 by 740mm (21.75 by 29.25 inches).
An eastward-oriented chart of The Sound that runs between southern Sweden and the northern coast of the largest Danish island of Zealand.
The Swedish coast is shown from Kullen (“Kullens or Kol Point”), where “Kullens Light House” is illustrated, to the city of Helsingborg at Sweden’s closest point to Denmark. The Danish coast extends from the fishing town of Gilleleje (“Gilleleye”), which marks Zealand’s northernmost point, to Helsingør (“Elseneur”) where “Cronenburg Castle and Lighthouse” are featured. Such towns and cities are represented pictorially as idyllic collections of houses.
The waters of The Sound are populated with soundings, and the sandbanks that extend along much of the shoreline are depicted. In the lower right-hand corner of the chart are “directions for sailing through The Sound in the night-time” which warn sailors that “with an Easterly Wind you must not bring the Nakkehovet Lights entirely in one, but you are to let them a little open to the eastward, in order to avoid the Coast of Zeeland”.
LOUS, Christian Charles
A new chart of the Cattegat published at Copenhagen in the year 1776 with the King’s Priviledge, by Christian Charles Lous, translated and inlarged from the Danish with useful additions.
Publication
London, Robert Sayer and John Bennett, July 1st 1778.
Description
Original working manuscript chart on four sheets joined to make two, pen and black ink on paper, “Cattegat” inscribed to verso.
Dimensions
Each sheet 540 by 690mm (21.25 by 27.25 inches).
Lous sight of the Kattegat
A chart of Kattegat (“Cattegat”) by Danish hydrographer Christian Charles Lous.
Between 1761 and 1791, Lous undertook extensive surveys of the coast of Demark for the Royal Danish Navy, producing the most accurate charts of the waters yet made. His chart of the Kattegat extends from Orust, Sweden’s third largest island, situated in Bohuslän (“Bahuslan”), down to Copenhagen on the Danish island of Zealand (“Zeeland”). The Swedish and Danish coasts feature towns, cities, moutains, ports, woodlands, and rivers.
The waters of the Kattegat are filled with soundings, symbols of maritime obstacles, and notes describing, for example “red-gray sand with white shells and some big stones”. Such information is also found in some larger rivers and fjords. A note in the upper left-hand corner advises that “the Rumb-lines in this chart are laid down according to the Magnetical Meridian, and so ordered that considering the Annual alteration of that Meridian, the chart may serve for 30 years without any notable error in the courses”. Three insets along the right-hand side show larger-scale charts of Marstrand Haven, the entrance to Gothenburg, and the island of Malön (“Malo”).
Sayer and Bennett published this enlarged and translated version of Lous’s chart in 1778, including it in their ‘Baltic Pilot’ of 1779.
LOUS, Christian Charles
A new chart of the entrance of the Baltic comprehending The Sound, with the Two Belts and all the Danish Islands: translated with additions and emendations from the original survey published by the authority at Copenhagen in 1777 by Professor Christian Charles Lous.
Publication London, Robert Sayer, [c.1794].
Description
Original working manuscript chart on four sheets joined to make two, pen and black and red ink on paper, with insets, partly backed on blue paper.
Dimensions
Sheet one: 625 by 550mm (24.6 by 21.6 inches); sheet two: 625 by 400mm (24.6 by 15.7 inches).
Below the Belts
A highly-detailed chart of the western Baltic Sea, from the Danish peninsula across to the island of Bornhold north of modern-day Poland (“Prussian Pomerania”), based on an original survey by Christian Charles Lous.
Topographical information is provided around the Danish, Swedish, German, and Polish coasts, with some major cities identified further inland. The waters of The Sound, the Great Belt and Little Belt, through which the Baltic drains into the Kattegat, the Bay of Mecklenburg and the eastern Baltic Sea are depicted in great detail. Densely-packed soundings, descriptions of the seabed, anchorages, and hazards such as banks, rocks, cliffs, and shoals are all provided. Additional information or corrections have been added in red ink, including vertical scale bars showing Dutch and Danish miles.
In the lower left-hand corner of the chart are two insets of “the Harbour of Kiel” and the “Course of the Oder from Stettin”. The Oder had been modified in the mid-eighteenth century on the orders of Frederick the Great, with marshland excavated and canals established, in order to improve the navigation of the river which offers passage from Central Europe to the Baltic Sea.
Although it bears Robert Sayer’s imprint, the first printed edition of this chart, incorporating the revisions shown here, was published by Laurie and Whittle in 1794.
DESSIOU, J[oseph] F[oss]
[A chart of Cattegat].
Publication [London, 1813].
Description
Original working manuscript chart on four sheets, pen and black ink and pencil on paper, one being an alternative overslip, “Cattegat Sound & Belt, J. F. Dessiou Jan.y 1813 Engraved by Geo. Allen” inscribed to verso.
Dimensions
Sheets one, two, and three: 645 by 105mm (25.3 by 4.1 inches); sheet four: 640 by 730mm (25.1 by 28.7 inches).
A magnificent manuscript chart of the Kattegat, with parts of Germany, Denmark, and Sweden.
Although small-scale, the chart is incredibly detailed, showing the Danish Straits, including the Kattegat (“Cattegat”) and Skaggerak (“Skagerrack or the Sleeve”), the Bohuslän coast of Sweden (“Bay of Bohus”), and the western Baltic Sea. Maritime information is given throughout the waters, in the form of soundings, hazards, and anchorages, with the region’s distinctive islands and fjords precisely depicted. Topographical information is given on the land, including settlements, lighthouses, woodlands, and mountains.
On the upper sheet two empty insets await a chart of ‘Winga Soung & Gothenborg’ and ‘Paternosters Swedish Copy’, a reference to a small collection of islands on the Bohuslän coast. Two views of the islands are presented along the lower edge of the whole chart. The central sheet has four insets showing larger-scale charts of ‘the passage of the Sound’, ‘Kongsbacka Fiord, and the anchoring-places between Lerkil and Batefiord’, ‘Chart of the Little Middle Ground’ and ‘the anchorage within Hallands Wader Ö’. On the final sheet there is a pasted overslip showing Copenhagen, and the islands of Amager (“Isle Amag”) and Saltholm.
Alongside the three main sheets is an additional one, likely made to be pasted over the lower sheet, with the German coast redrawn, and part of southern Sweden, a host of new views, and a vignette of boats sailing into a harbour on the northern Germany island of Rügen.
Interestingly, there is no title cartouche provided on the manuscript, but a note to the verso attributes it to Joseph Foss Dessiou, scion of the prolific hydrographic family, and states that it was engraved by George Allen in January 1813. A six-sheet general chart of the North Sea including the Kattegat, with contributions from Dessiou, was published in 1812, and a French chart of the same waters by the hydrographer in 1836, but it does not seem that this particular manuscript chart was printed and widely published.
WATSON, Captain George
A new and accurate chart of the Baltic or East Sea shewing the islands, rocks and shoals with their marks, light-houses, soundings, sailing channels &ca. Drawn from the observations of the most experienced pilots and chiefly from those made by Capt[ai]n George Watson rectifyed according to the maritime surveys collected in the Russian Atlas performed and published by the order of the Empress of all the Russias.
Publication
London, Robert Sayer and John Bennett, 3rd July 1778.
Description
Original working manuscript chart on four separate sheets, pen and black and red ink on paper, extensive insetting.
Dimensions
Each sheet 500 by 615mm (19.75 by 24.25 inches).
All eyes on the Baltic
A magnificent manuscript chart of the Baltic Sea from Denmark to Estonia. Topographical information is given along the shores of the many states shown, especially regarding the location of light-houses, and in the waters soundings, maritime hazards, and anchorages are presented. There are five insets, three of which offer further, larger-scale charts and plans of important places, namely Stockholm, The Sound, and Rogerwick Bay; the other two remain empty but would later contain charts of Gotland (“Isle of Gothland”) and the Latvian city of Riga at the entrance of the Düna (“Dune”). Heavy annotation in red ink shows where details of the chart have been redrawn, revised or added, for the engraver to incorporate.
The title of the chart indicates that one of the hydrographical sources was the ‘Russian Atlas’ compiled on the orders of Catherine the Great, whose imperialist ambitions for Russia was a significant factor in the partitioning of Poland and the Russo-Swedish War. Indeed, at the time that this chart was produced, there was great contention over the Baltic, with the surrounding states all vying for power over its waters.
Although the date given by hand on the chart is 1778, the printed edition did not appear until the following year.
RUCKERT, Frederick
[A chart of the Vinga Sound].
Publication [London], 1812.
Description
Original working manuscript chart, pen and black ink and pencil on paper, “Wingo Sound & Directions” inscribed to verso, with three leaves of correspondence from Frederick Ruckert.
Dimensions
Chart: 385 by 555mm (15.25 by 21.75 inches). Letter sheet one: 335 by 390mm (13.25 by 15.25 inches); sheet two: 335 by 200mm (13.25 by 7.75 inches); sheet three: 325 by 205mm (12.75 by 8 inches).
“I have laboured at it two years”
A manuscript chart of the Vinga Sound in Kattegat close to the city of Gothenburg.
The chart was made by Frederick Ruckert, master of the HMS ‘Ardent’, who surveyed the waters in 1810, and sent the results to “Mr Whittle” in 1812, along with a letter that includes sailing directions for the Sound. The part of the Swedish mainland that appears in the upper right-hand corner of the chart bears no toponyms, but the many islands in the Sound are either directly named, or labelled with a letter that is identified in Ruckert’s accompanying correspondence. “Irregular soundings” are given, along with anchorages and maritime hazards such as rocks and “soul ground”.
In his letter to Laurie and Whittle, Ruckert is keen to determine “what benefit there may arise from [the publication of the chart] in my favour, [as] I have laboured at it two years”. Ultimately, however, Laurie and Whittle do not appear to have gone forward with the publication of Ruckert’s chart, which was later included in a sailing directory of 1854.
PURDY, J[ohn]
A chart of the coasts of Batavia and Germany from Camperdown to the River Hever including the River Ems to Emden with the Elbe and the Weser to Hamburg and Bremen: and in which the positions of the different points are founded on the basis of the most accurate trigonometrical surveys, corrected and regulated throughout by numerous and authentic astronomic observations.
Publication London, Laurie and Whittle, August 1st 1805.
Description
Original working manuscript chart on four sheets joined as two, pen and black ink on paper, “Drawing of the Coasts of Batavia & Germany by J. Purdy Engraved by E. Jones Dec.r 1805” inscribed to verso.
Dimensions
Each sheet 775 by 640mm (30.5 by 25.25 inches).
The Wadden Sea
A manuscript map of the northern coast of western Germany and the eastern Netherlands by John Purdy.
The chart extends from the Dutch port of Texel in the west to Schleswig-Holstein (“Holstein”), the northernmost state of Germany, in the east, including many of the Frisian Islands. The shallows of the Wadden Sea, the intertidal zone between the North Sea and the coast of the mainland, are represented according to the type of seabed, ranging from sand to reef to rocks. Soundings are given in the water, and grow more concentrated around important anchorages, ports, and harbours. The course of the Elbe and Weser rivers are shown flowing inland to their major cities of Hamburg and Bremen, respectively. Various coastal views show different stretches of the shore, as seen from the North Sea. In the lower righthand corner of the chart is an inset showing a plan of “Heiligeland”. The Heligoland archipelago had been one of the crucial harbours of the Hanseatic League, but in 1714 was conquered by Denmark-Norway and remained under Danish control until 1807.
PURDY, J[ohn]
Laurie and Whittle’s chart of the coasts of Batavia and Germany from Camperdown to the River Hever including the River Ems to Emden, with the Elbe and the Weser to Hamburg and Bremen: and in which the positions of the different points are founded on the basis of the most accurate trigonometrical surveys, corrected and regulated throughout by numerous and authentic astronomic observations.
Publication
London, Laurie and Whittle, Dec[embe]r 12 1805; improved from a recent survey, 1809; 1811 [in manuscript].
Description
Original working manuscript chart on four sheets joined to make two, pen and black ink on paper, “Elbe & Weser - corrected 1811” inscribed to verso.
Dimensions
Each sheet 765 by 640mm (30 by 25.25 inches).
The manuscript for a later edition of Laurie and Whittle’s chart of the North Sea, Wadden Sea, and German and Dutch coast (item 70) with updates to 1811, including the 1809 survey by John Bates, Master of ‘HMS Cerberus’. Additions include revisions to the coastline, explanatory notes, empty boxes for two new insets of a ‘Plan of Hamburg’ and ‘Plan of Cuxhaven And Ritzebuttel’, and extensions to the inset chart of “Heiligeland”.
PRICE, Captain William; and Captain George
WATSON
A New Chart of the Coast of Germany from Norderney Island to the Eyder with the entrances of the Weser and the Elbe and their respective course from Bremen and Hamburgh.
Publication London, Robert Sayer and John Bennett, [c.1778].
Description
Original working manuscript chart on two joined sheets, pen and black and red ink, with grey wash on paper, “Coast of Germany” inscribed to verso.
Dimensions 530 by 745mm (20.75 by 29.25 inches).
A chart showing the German Bight and the coast of north-west Germany. The chart extends inland along the paths of the Elber and Weser rivers, all the way to their with their prominent cities of Hamburg and Bremen, respectively, and also presents the Jade Bight (“The Brack”) just west of the Weser. Naturally, the main focus of the chart is the Frisian Island chain that spans this stretch of the German coast, as well as the sandbanks that extend far out into the North Sea from the shore. Among these are given soundings, arrows indicating currents, and points of safe anchorage. In the lower left-hand corner “directions for sailing into the Elbe” inform sailors of how to use differently coloured buoys to navigate the treacherous waters.
Although the names of both Robert Sayer and John Bennett are given here, the first printed edition of the chart does not seem to have been published until 1786, a year after the latter’s name was removed from the imprint.
[LAURIE, Robert; and James WHITTLE
A New Chart of the German Ocean, or the South Part of the North Sea adapted to the Navigation between the ports of London, Amsterdam, Bremen and Hamburg, as well as between the South-east coast of Great Britain, and the Coasts of Flanders, the United Provinces and Germany.
Publication London, Published by Laurie and Whittle, Fleet Street, [c.1810].
Description
Large original working manuscript chart on three separate sheets, pen and black ink on paper, with inset corrections, inscribed “67” on a lower corner of each sheet.
Dimensions Each sheet 740 by 515mm (29.25 by 20.25 inches).
A complex Napoleon effect: circumventing the continental blockade
A sweeping chart showing the way to boom and bust during Napoleon’s trade embargo. In 1807 Britain had helped rescue the Portuguese royal family from Napoleon’s advance. As a reward, Britain was given the right to trade with Portugal’s colonial assets in the Americas. British merchants were then able to successfully sell their foreign goods by way of Dutch and German ports accessed via the North Sea, and so avoiding Napoleon’s land blockades. Speculative trading was rife, and the bountiful years of 1808 and 1809 soon came to a rapid halt when the French disrupted the North Sea routes during the summer of 1810. Expensive produce could no longer reach European customers, and fortunes were lost as quickly as they had been gained.
Napoleon eased the blockade somewhat when his foreign trade policies began to bite harder at home than abroad.
Spanish Ladies
Traditional British naval song
OCEAN ALTEA GALLERY & DANIEL CROUCH RARE BOOKS
The Channel
Throughout the eighteenth century, the Industrial Revolution had greatly increased the coastal traffic of the British Isles. Much of the increase was the shipping of bulky raw materials and farm produce to the great urban centres of Glasgow, Liverpool and Bristol on the west coast and London, Hull, Newcastle, and Edinburgh on the east. Transport over land with no proper roads was still arduous and expensive, with coastal shipping proving cheaper and more reliable.
Globalisation also meant more ships in Britain’s waters, from both the Royal Navy, whose number of ships had doubled to 600 over the course of the eighteenth century, and trade, with newly-available goods arriving from around the world, such as sugar from the Caribbean, and British wares being shipped abroad. Other global events, naturally including wars, resulted in even further maritime traffic.
Consequently, major shipyards, docks, ports and fortifications along Britain’s south coast were built or expanded to accommodate the influx of new vessels, with those at Portsmouth and Plymouth of particular importance for the Royal Navy, and others further west in, for example, Cornwall, of significance for Britain’s heavy industry and trade. There was also, of course, the ever-present threat, or nuisance, of France to take into account, and Britain’s increased hydrographical efforts to chart the Channel during the eighteenth century reflects the ongoing concern over conflict with their European neighbours.
[VAN DER NEER, Cornelius; after Willem BLAEU]
A new chart of the coast of Holland, Zeeland, and Flanders.
Publication [London, c.1781].
Description
Original working manuscript map, pen and black ink, on five sheets, one an alternative, with extensive insets, partially backed with blue paper.
Dimensions
Sheet one: 715 by 515mm (28.1 by 20.2 inches); sheet two: 720 by 530mm (28.3 by 20.4 inches); sheet three: 690 by 500mm (27.1 by 19.6 inches); sheet four: 715 by 515mm (28.1 by 20.2 inches); sheet five: 710 by 330mm (27.9 by 12.9 inches).
Neer the North Sea
A manuscript chart of the southwestern waters of the North Sea, including the coast of the Netherlands and Belgium.
The chart’s orientation to the south-east means that the coastline runs along the upper half, with Texel island on the left-most sheet and Calais, 120 miles to the west, on the right. The importance of these two ports to maritime activity in the North Sea make them apt boundaries for the chart. Other significant cities including Amsterdam, the Hague, Rotterdam, and Dunkirk are also shown, along with a host of smaller towns, ports, and coastal buildings such as lighthouses and forts. Many of these are triangulated with points on the sea.
Sailing obstacles such as banks, shoals, and rocks are identified in the North Sea, with anchorages, soundings, and currents also represented. A large area on the left-hand side of the chart is marked as “The Bree Veertien”, showing the large sweep of the North Sea that is almost entirely 14 fathoms deep, known in English as the “Broad Fourteens”.
Extensive additions and revisions have been made to the chart in red ink, including the redrawing of many areas, new notes about tides, sailing directions, and an inset ‘Continuation of the Wester Scheld to the city of Antwerp on the same scale (from the new survey of M. Beaupre)’.
The main chart is based on an early-seventeenth century chart by Willem Blaeu, entitled ‘Pascaarte van Hollandt Zeelandt ende Vlaanderen’, and updated with more recent information, sourced in part from a Dutch survey by Cornelius Van der Neer. In 1781, Sayer and Bennett published the printed edition of the map under the title ‘A new chart of the coast of Holland, Zeeland and Flanders, from the Texel to Calais. Done from an actual survey made by Cornelius Van der Neer, Pilot of Amsterdam’.
HOLDITCH, George; and Joseph
HUDDART
A New Chart of the Eastern Coasts of England from Orfordness to Flamborough Head; Including Lynn and Boston Deeps, the River Humber &c Constructed partly, from the [most] recent Surveys made by Order of the Honourable Corporation of Trinity House, but, principally, from the Surveys and Remarks of Mr. Geo. Holditch, of Lynn-Regis.
Publication London, Published by Rob.t Laurie and Ja.s, Chart-sellers to the Admiralty, &c &c. No 53 Fleet Street, 1st March, 1810.
Description
Original working manuscript chart on four sheets joined to make three, pen and black and red ink on paper, with engraved coastal profiles on three engraved insets, and numerous office amendments.
Dimensions
725 by 510mm (28.5 by 20 inches).
A complex Napoleon effect: the sandy beaches of
Norfolk
A very busy chart of this stretch of the coastlines of Norfolk, Lincolnshire, and Yorkshire, which takes in the major fishing ports of Yarmouth, Kings Lynn, and the Humber, as well as the now-popular sandy beaches of Norfolk.
Importantly this coastline was the closest to the ports of Holland and Germany that during 1810 were allowing British traders access to the European market during the Napoleonic continental blockade.
The coastal profiles by Huddart are of ‘Cromer to Winterton Ness’, Felby to Castor including Yarmouth, two of ‘Flamborough Head’, and others of ‘Gorleston’, and ‘Spurn to Kilnsey’.
This chart was first published in 1810, and then reprinted until at least 1816.
ALTEA GALLERY & DANIEL CROUCH
DODD, R[alph]
A New chart of Hartlepool Bay. Surveyed, by order of the corporation, by R. Dodd, Engineer, with the Projected Improvements.
Publication London, Published by Laurie & Whittle, No. 53 Fleet Street, 12 May, 1800.
Description
Original working manuscript chart, pen and black ink, and colour wash, on paper, inscribed “58” lower left.
Dimensions 610 by 500mm (24 by 19.75 inches).
A complex Napoleon effect: preparing for invasion
In a direct response to the potential threat of Napoleonic invasion, in 1795, Ralph Dodd published a vital work, a ‘Report on the Various Improvements, Civil and Military, That Might be Made in the Haven or Harbour of Hartlepool: As Surveyed, at the Request of the Corporation’. As a result, the corporation agreed to strengthen the port’s defences. This chart shows the new batteries.
Ralph Dodd is best known for building the first tunnel under the Thames, in 1798.
[ANONYMOUS]
A chart of the coast between Orford Ness and Hasbrough wherein are particularly described the roads of Leostoff and Yarmouth.
Publication London, Robert Sayer and John Bennett, [1782].
Description
Original working manuscript chart on two joined sheets, pen and black ink on paper, “Leostoff to Yarmouth” inscribed to verso.
Dimensions
Each sheet 720 by 540mm (28.25 by 21.25 inches).
Suffolk the consequences
A westward-oriented chart of the North Sea (“German Ocean”) along the coast of Suffolk and Norfolk, from Orford to Happisburgh (“Hasbrough”).
On the land, features such as churches, woods, towns, mills, and “loose and shifting sand hills” are presented. Some of these are triangulated to buoys in the water. The sea is described in great detail, with soundings, maritime obstacles, and currents provided. Sailing directions flank the ornamental title cartouche found at the centre of the lower edge.
Along the upper edge of the chart are two views: “East prospect of the town of Leostoff”, now Lowestoft, and “East prospect of Gorleston Town”, in Great Yarmouth. The printed chart would be published by Sayer and Bennett in 1782.
BEAN, John
A new hydrographic sketch of the North, South, and Middle Channels taken January the First 1782 by John Bean Master of the Buoy Yacht.
Publication
London, Robert Sayer and John Bennett, January 1st 1782 [but 1783].
Description
Original working manuscript chart on two joined sheets, pen and black ink on paper, “North, South & Middle Channels” inscribed to verso.
Dimensions 535 by 720mm (21 by 28.25 inches).
The Thames Estuary
A manuscript chart of the Thames Estuary, awaiting the date of publication but otherwise ready for engraving.
Trinity House was founded in 1514 “to improve the art and science of mariners”, a commission extended under Elizabeth I to include the responsibility to “make, erect and set up such and so many beacons, marks and signs for the sea...whereby the dangers may be avoided and escaped, and ships the better come into their ports without peril”. Throughout the following centuries Trinity House established and maintained navigational aids including lighthouses, buoys, and communication systems. In 1782, John Bean, their local agent at Harwich, undertook a survey of the mouth of the Thames into the North Sea.
Bean’s chart shows the many sandbanks and inlets along the coast of Essex and Kent, with the lighthouses and beacons set up by Trinity House identified on the shore. Interestingly, the chart uses a rather unique system by which depths in fathoms are given as Arabic numerals, and depths in feet as Roman.
The printed chart would be published by Sayer and Bennett on July 10th 1783 with the addition of a dedication to the Master and Wardens of Trinity House.
COLLINS,
Christopher
A survey of the Ridge and Varne in the Straits of Dover taken by Order of John Macbride Esqr. Read Admiral of the Blue and Commander in Chief in the Downs &ca. &ca. &ca. by his most obedient and obliged humble servant Christ[ophe]r Collins Master of H.M. Ship Cumberlande May 1793.
Publication [London], June 1793.
Description
Original working manuscript chart on two sheets, pen and black and red ink, with grey wash, on paper.
Dimensions
390 by 530mm (15.25 by 20.75 inches).
A manuscript chart of the Varne Bank in the Strait of Dover, a sandbank almost six miles in length which produces rough waters during strong tides. “The Ridge”, or Colbart bank, lies slightly further out to sea, almost parallel with “the Varne”. Soundings are given around and between the two banks, with a few figures provided closer to the shore. Buildings on the land, including a church and a castle, are triangulated with positions in the sea, mostly at the end of the sandbanks. The printed chart was published in 1794 by Laurie and Whittle with the title slightly adapted and housed in a decorative cartouche.
[STEPHENSON, John]
[Chart of the southern coast of Kent].
Publication London, Robert Sayer, [c.1785].
Description
Original working manuscript chart on two joined sheets, pen and black and red ink on paper, with insets, “Dungeness on the Kentish coast by John Stephenson” inscribed to verso.
Dimensions 515 by 735mm (20.25 by 29 inches).
A manuscript map of the south Kent coast from Rye to Dymchurch (“Dim Church”), with manuscript corrections written in red.
In addition to towns, a lighthouse and “fishermens hutts” are shown on the land, while in the waters of the Dover Strait and River Rother are soundings and sandbanks. Two views show the “appearance of the land of Beachy Head and Fairleigh when on Dungeness Shoal” and the “ruins of Chapel at street about 11 miles up the country”. The editor includes several instructions for the engraver: “no rhumb lines to be engraved but the red ones” and “not to engrave the scale”.
The first printed edition of the chart would be published by Sayer in 1787 under the title ‘An actual survey of the coast of Kent from Dim Church to Rye Harbour, with the new shoal to the westward of Dungeness by John Stephenson a Master in the Royal Navy’. The published chart incorporates the changes made in red ink here, and has “directions for sailing” on the left-hand side.
ROSS, Joseph
A chart of the Downs with the flats of the North and South Forelands from the observations of Joseph Ross a Pilot belonging to Trinity House.
Publication London, Robert Sayer and John Bennett, [c.1779].
Description Original working manuscript on two sheets joined, pen and black ink on paper, “The Downs” inscribed to verso.
Dimensions 535 by 725mm (21 by 28.5 inches).
A westward-oriented map of the Downs off the coast of Kent, where the natural safe anchorage has made the town of Deal an attractive port since the seventeenth century.
The chart extends from the white cliffs of Dover on the South Foreland across to the North Foreland and its town of Margate. The larger settlements of Deal, Sandwich, Ramsgate, and Margate are represented as simple isometric plans, and the various mills and churches scattered along the coast are likewise pictorially illustrated. Many on-land features such as “Upper Deal Mill” and “St. Peters Church” are triangulated with buoys or specific points in the sea. The waters of the Downs are described in detail with soundings and maritime hazards shown and arrows indicating the directions of currents.
OWEN, Fra[nci]s
A chart of Spithead from the east end of Hayling Island to Stokes Bay surveyed in May 1800 by Fra.s Owen, Master in the Royal Navy.
Publication [London], 1801.
Description
Original working manuscript chart on two joined sheets, pen and black ink on paper, “Owen’s Spithead” inscribed to verso, with one sheet of manuscript sailing directions, with ten-leaf sewn unbound booklet (210 by 165mm).
Dimensions 785 by 620mm (31 by 24.5 inches).
A manuscript chart of the eastern waters of the Solent and the English Channel off the shore of Hampshire, including Portsmouth Harbour and Hayling Island.
Soundings appear in the water, along with buoys, anchorages, and banks, and a key in the upper left-hand corner identifies features such as “clay shore” and “steep rocky clift”. There is also a great deal of cartographical information presented on the land, with the various towns depicted as simple aerial plans and roads between them as double dashed lines. Individual buildings such as the “military hospital”, “Cumberland fort”, and “magazine” are identified, and beacons, windmills, and lighthouses are pictorially represented.
The hydrographer Francis Owen master of the HMS ‘Agincourt’, who soon after this set off to survey Newfoundland, explains in the accompanying booklet that he “intended to have made a complete survey of Spithead from the Needles to the Owers, on four large sheets but as time would not permit me to execute charts on so extensive a scale and I am now going out of the Kingdom any probably may never have it in my power to finish what I have intended, I have confined myself to the most material part, that is to say Spithead with the sailing directions thereto”. Indeed Owens follows this with extensive sailing directions and tide tables. He also states that he began the survey on January 22nd, 1799, and took his last observations in January 1801.
The printed chart would be published by Laurie and Whittle on August 12th, 1801.
PRICE, J. [William]
A chart of the Isle of Wight with the adjacent coast of Hampshire wherein are particularly described the roads of St Helens, Spithead &ca. by J. Price Master of His Majesty’s Ship Theseus.
Publication London, Laurie and Whittle, 1798.
Description
Original working manuscript chart on two joined sheets, pen and black ink on paper, clipped to corners.
Dimensions 660 by 825mm (26 by 32.5 inches).
A manuscript chart of the Hampshire coast and the Isle of Wight by Royal Navy master William Price.
The waters of the Solent are populated with soundings, anchorages, maritime hazards, and arrows indicating tides and currents. Such information is found along the coast of the mainland too, where “fishing houses”, lighthouses, and ports are identified. Above the circular title cartouche is a “description of the buoys”. Beneath the chart are five insets showing different buoys triangulated to sites on the land such as beacons or hills.
On land, towns and cities appear, with rivers depicted and elevation represented by hachures. A few details are added in pencil, one a line running southeast of the Isle of Wight and another a group of trees near Chichester. Along the lower edge of the chart there are seven views of different stretches of land as seen from the sea, including the Needles and Ash Down Beacon.
[ANONYMOUS]
A chart of the isle, road and Race of Portland with the Shambles &ca.
Publication London, Robert Sayer and John Bennett, [c.1779].
Description
Original working manuscript chart, on two joined sheets, pen and black ink on paper, “Race of Portland” inscribed to verso.
Dimensions 530 by 730mm (20.75 by 28.75 inches).
What a Shambles
A manuscript chart of the Isle of Portland and the coast of Weymouth, in Dorset.
The Isle of Portland is shown to be connected to the mainland by the shingle bank known as “Chesil Beach”. Windmills, churches, lighthouses, piers, the castle, and the poor-house appear on the island, alongside the villages of “Chisel” (Chiswell), “Southwell” and “Wakeham”. The chart shows the island before the construction of Portland Harbour, one of the largest man-made harbours in the world, which began 70 years later in the area marked on the chart as “the Mare”. Nonetheless, the spot is still marked out as “the best anchorage” available in the area.
In the waters of the Channel west of the island, known as Lyme Bay, are two major maritime obstacles, the “Portland Race”, a swift tidal flow caused by underwater stone, and “the Shambles”, a large sandbank. Both are described further in the “sailing directions” provided in the lower right-hand corner, and numerous labelled routes are illustrated on the chart.
Devonshire
PRICE, John [sic] William
A [new] chart of the coast of Dorsetshire and Devonshire from St. Albans Head to Sidmouth containing chiefly Portland and Weymouth roads, with the Point and Race of Portland by John [William] Price Master of his Majesty’s Ship Theseus.
Publication [London, c.1798].
Description Original working manuscript chart on two joined sheets, pen and black ink on paper.
Dimensions 655 by 830mm (25.75 by 32.75 inches).
A manuscript chart by William Price showing the coast of Devonshire and Dorsetshire, to be engraved and published by Laurie and Whittle. The chart extends from Sidmouth, where both a “granary” and a “pleasure house” are to be found, eastwards past Weymouth to Poole Harbour. Soundings are given rather sparsely, and only major hazards such as the Portland Race and Shambles are depicted. Along the lower edge of the chart, numerous views illustrate the appearance of the land from the waters of the Channel. As in item 89, Price’s name has been mistakenly written as “John” and corrected to “William”; here too the word “new” has been inserted into the title in pencil.
PRICE, W[illia]m
Plymouth Sound, Hamoze and Catwater with the leading marks and views of land by W[illia]m Price, Master in the Royal Navy 1798.
Publication [London], 1798.
Description
Original working manuscript chart on four sheets, joined as two, pen and black ink and grey wash, with pasted overslip, on paper.
Dimensions
Sheet one: 455 by 665mm (17.9 by 26.1 inches); Sheet two: 535 by 665mm (21 by 26.1 inches).
Sayer and Bennett’s ‘A Complete Channel Pilot’ of 1779 contained a chart of ‘Plymouth Sound, Hamoaze and Catwater surveyed in 1770’. This manuscript is an updated version of the chart with revisions and additions provided by William Price, and was first published by Laurie and Whittle in 1800.
The chart is in two sheets. The port city of Plymouth appears on the upper sheet, with numerous civic and maritime features depicted, and the two stretches of water that flank it: to the west the “Hamoaze”, which connects the River Tamar to the sound, and to the east the Cattewater (“cat water”), where the river Plym merges with the Sound.
Being of key importance for both the Royal Navy and trade, the waters of the Sound are described in detail, with soundings and obstacles shown, and numerous different routes highlighted. There are also many views that show the appearance of the shore from approaching boats and ships.
Within the Yealms of possibility
[THE COMMITTEE]
An eye sketch of the entrance of the Yealme River with the depth of water.
Publication [London, 1795].
Description
Original working manuscript chart on two sheets, pen and black ink with colour wash, on paper, pencil sketch and “Yalm River” inscribed to verso.
Dimensions 490 by 375mm (19.25 by 14.75 inches).
A manuscript chart of the River Yealm in Devon where it empties into the English Channel at Wembury.
Wembury Bay appears as “fields of corn” with a small illustration of what appears to be a factory, although Wembury was never significantly industrialized. In the waters of the bay appears the small island of “Mewstone”; in the eighteenth century some prisoners destined for Australia were given the option of being interned on the Mewstone instead. Soundings are provided along the river, and in the bay along the tracks of “the yacht”. In the lower left-hand corner of the map are “references” by the “hon[oura]ble the Committee”, explaining that “the red figures show the depths at Spring floods, the black figures at Neap floods”.
[ANONYMOUS]
An hydrographical survey of the coast of Devonshire from Exmouth Bar to Stoke Point containing the River Ex, Torbay, Dartmouth, Start Bay and Bigbury Bay.
Publication [London], Robert Sayer and John Bennett, [c.1779].
Description
Original working manuscript chart on two joined sheets, pen and black ink on paper, “River Exe Torbay &c.” inscribed to verso.
Dimensions 715 by 530mm (28.25 by 20.75 inches).
Devon on earth
A manuscript chart of the Devonshire coast, which would appear in print in Sayer and Bennett’s ‘A Complete Channel Pilot’.
The south coast is shown from “Stoke Point” on the mouth of the River Yealm up to the Exmouth Bar, where the River Exe leads up to the city of Exeter. Rocks are represented along much of the coast, but soundings and anchorages are concentrated in the northern waters.
An inset in the upper right-hand corner of the map shows Dartmouth Haven and the lower course of the River Dart, with soundings, anchorages, and hazards highlighted, and the town presented as a simple aerial plan. Beneath the inset are views showing how Dartmouth appears from the sea.
“marks to keep clear of the Scaries”
PRICE, John [sic] William
A chart of the coast of Devonshire from Exmouth to Rame Head containing Tor Bay, Start Bay, Plymouth Sound &ca. by John [William] Price Master of his Majesty’s Ship Theseus.
Publication London, [c.1798].
Description
Original working manuscript chart on two joined sheets, pen and black ink on paper, number “14” in contemporary ink manuscript on verso.
Dimensions 655 by 835mm (25.75 by 32.75 inches).
A manuscript chart by William Price showing the Devonshire coast from Plymouth to Exeter, with numerous insets.
The main chart shows several of the most important harbours on Britain’s south coast, with views illustrating their appearance from sea. The chart is dominated, however, by individual insets showing different maritime sites, marked by buoys or wrecks, triangulated with on-shore locations. Seven show the Plymouth Sound, and the remaining two show Tor Bay and Start Bay, with suggested routes and, helpfully, “marks to keep clear of the Scaries”. The maker’s name has been given as “John Price”, but corrected in pencil to William.
PRICE, W[illia]m
Plymouth Sound, Hamoaze and Catwater with the leading marks and views of land by W[illia]m Price, Master in the Royal Navy 1798.
Publication London, Laurie and Whittle, 12th Oct[obe]r 1800.
Description Engraved chart on two joined sheets, two pencil annotations with bearings on chart indicating shallows, three lines of faint pencil manuscript on verso referencing the Mew Stones, light staining to south-east corner, light fraying along creasefolds with associated tiny losses.
Dimensions 955 by 695mm (37.5 by 27.25 inches).
The first printed edition of William Price’s chart of Plymouth Sound, with all the details included on the manuscript version (item 86) now incorporated. Several new views have been added beneath the title cartouche, and the compass and rhumb lines have been drawn.
[ANONYMOUS]
Plan of the bays of Polkerris and Mevagizey in Cornwall.
Publication London, Robert Sayer and John Bennett, [c.1779].
Description
Original working manuscript chart on two joined sheets, pen and black ink on paper, “Polkerris” inscribed to verso.
Dimensions 685 by 495mm (27 by 19.5 inches).
Polkerris and Mevagizey
A manuscript chart of Polkerris and Mevagissey (“Mevagizey”) bays at the centre of the southern Cornish coast. Coastal villages are identified along the coast and two views on the left-hand side of the chart show the appearance of the land from sea. Soundings are given, rather sparsely, and maritime obstacles are idenfied in the shallows. To the north of the chart is Par, which would be transformed into a new harbour in the 1820s through the efforts of Joseph Treffry (see item 92). The printed chart was first published in 1779.
[TREFFRY, Joseph]
Par Harbour and Canal.
Publication [London, 1828].
Description
Original working manuscript chart on two joined sheets, pen and black ink with colour wash, on paper, “Left by Mr Pease agent of Mr Austen of Fowey for use of the Hydr on 5 Oct 28” inscribed to verso, loss to corner.
Dimensions 465 by 580mm (18.25 by 22.75 inches).
A manuscript chart of Pal harbour and canal in Cornwall, which were constructed by industrialist and engineer Joseph Treffry to transport copper ore from his nearby mines.
Treffry, born Austen, had taken over the Fowey Consols mines in 1822, and to facilitate transportation of the valuable ores excavated there, he prepared plans for a new harbour at Par in 1828. Just a year later he had constructed a huge breakwater, at the cost of three of his own ships, and by 1833 the first ship was able to safely dock in Par Harbour. Treffry also constructed a canal, which was itself linked to a tramway.
The present chart, drawn in October 1828, was part of the plans drawn up by Treffry at the outset of the harbour’s construction. It shows the harbour, with soundings in the water, and plans for buildings and a pier drawn. The “canal to Lanescot Fowey Consols” is also presented. The note on the verso states that it was given by William Pease, Treffry’s agent and engineer, to the Hydrographical Office, presumably to update their charts of the Cornish coast.
[THOMAS, John; and William DENYS]
A ne[w] chart of Mounts Bay in Cornwall with the adjacent coast.
Publication [London, c.1780].
Description
Original working manuscript chart on two joined sheets, pen and black ink on paper, “Mounts Bay” inscribed to verso, with title partly excised, clipped at corners.
Dimensions 495 by 720mm (19.5 by 28.25 inches)
Mount’s Bay
A manuscript chart of Mount’s Bay on the southern Cornish coast. The title has been partly excised but the final printed edition, first published by Sayer and Bennett in 1780, would show that it was made by John Thomas and William Denys.
Although Cornwall’s largest bay, and naturally sheltered from westerly winds off the Atlantic, Mount’s Bay does not offer protection from southerly and south-easterly gales. Nonetheless, numerous anchorage points are represented on the chart, with soundings provided and arrows to “shew the setting of the currents, and the figures along them the quantity of time”. The two largest settlements - Penzance and Marazion - are shown on the shore, alongside a number of smaller villages. “Market Jew” is given as an alternative and somewhat misleading toponym: it derives not from any significant Jewish presence, but from the Latin name for Marazion, ‘Forum Jovis’, which developed into ‘Marketjew’.
Further anchorages are identified along the western coast from Land’s End to Cape Cornwall, with “passage for the largest ships” marked out. In the lower left-hand corner of the chart is “the Gulf, commonly the Wolfe, a sharp rock above water at half tide”. Seven views on the land illustrate how stretches of the shore appear from the Channel.
[COLLINS, Captain Greenvile, after]
A chart of the entrance into the Channel containing the west coast of Cornwall, and the Scilly Islands, with all the soundings.
Publication London, Robert Sayer and John Bennett, [c.1779].
Description Engraved chart with manuscript annotations in black ink, on two joined sheets of paper with multiple insets and extensions, loss to margin.
Dimensions 530 by 720mm (20.75 by 28.25 inches).
A chart of the eastern English Channel, with the southernmost tip of Cornwall and the Scilly Isles, covered in manuscript revisions and updates in preparation for publication.
The chart appears to be based on the seminal work of Captain Greenvile Collins, a seventeenth-century hydrographer who compiled ‘Great Britain’s Coasting Pilot’ in 1693. The maker of the present chart has updated the Cornish coast, adding new toponyms and soundings. In the Scilly Isles, sandbanks and rocks are presented more clearly, and the conditions of the seabed are described as, for example, “sand like ground wheat” and “oaze with Queen shells”. A note to the west of the islands identifies “Thompson’s Rock, discovered November 17th 1775”.
In the upper right-hand corner of the chart, seven views have been added, showing the appearance of key locations around Cape Cornwall, Lands End, and The Lizard as seen from the Channel. The printed chart was first published in 1779, and was later included in a number of navigational pilots by Sayer and Bennett, and then Laurie and Whittle.
[ANONYMOUS; after Thomas JEFFERYS]
[Five charts showing parts of the English Channel].
Publication [London, c.1775].
Description
Five working manuscript charts, pen and black ink, all on two joined sheets of paper, one with inset.
Dimensions
Each sheet 525 by 720mm (20.75 by 28.25 inches).
Preparing to chart the Channel
Five manuscript charts showing different stretches of the English Channel, likely made in preparation for Sayer and Bennett’s expanded chart of the Channel after Thomas Jefferys.
The charts, though non-contiguous, show much of the Channel, from where it join the Atlantic Ocean south of Ireland to its meeting with the North Sea off the coast of Kent and Suffolk. Although notably different in style, with hachures found along much of the coastline and rivers depicted in greater detail, the charts seem to have been drafted in preparation for the expanded chart of the Channel published in 1777. The five charts here cover areas included on that chart, and the soundings and other navigational data provided also match. The lack of any title, imprint, sailing directions or rhumb lines also point strongly to this group of charts being preparatory material.
[JEFFERYS, Thomas, after]
A new hydrographical survey of the British Channel with part of the Atlantic Ocean as far as Cape Clear, improved form the large chart of the late Thomas Jefferys, Geographer to the King.
Publication
London, Robert Sayer and John Bennett, 1st November 1776.
Description
Original working manuscript chart on eight sheets joined to make four, pen and black ink on paper, one with extension to margin, with six insets.
Dimensions
Sheet one: 725 by 530mm (28.5 by 20.8 inches); sheet two: 720 by 530mm (28.3 by 20.8 inches); sheet three: 720 by 520mm (28.3 by 20.4 inches); sheet four: 730 by 280mm (28.7 by 11 inches).
The Channel, from the Atlantic to the North Sea
A magnificent manuscript chart of the entire Channel, from the eastern Atlantic to the North Sea (“German Sea”).
When Thomas Jefferys died in 1771, his materials were acquired by Sayer and Bennett and many of his charts posthumously published. Among these was his chart of the Channel, which has here been expanded and revised with new information and insets. The waters are presented with great detail and precision, with soundings, maritime hazards, and currents all represented. Particularly in the Atlantic, the condition of the seabed is described as, for example, “red sand”, “hard bottom”, “glittering shells with red and black sand”, and “middling soft bottom”.
There is also topographical information along the English south coast, as well as parts of southern Ireland, south Wales, France, and Belgium. New insets show important areas on a larger-scale, namely Portsmouth and the Isle of Wight, the Downs, Falmouth, the Plymouth Sound, and Portland. Each of these are reduced versions of individual charts.
Although a provisional date of November 1st, 1776 has been added in pencil to the imprint, the first printed edition of the chart would be published by Sayer and Bennett on August 15th, 1777.
STEPHENSON, J[ohn]
British Channel by J. Stephenson.
Publication [London, 1786].
Description
Original working manuscript chart on three sheets joined as two, pen and black ink on paper, “Original drawing of Stevenson’s British Channel” inscribed to verso, minor loss to margin.
Dimensions
Sheet one: 570 by 730mm (22.4 by 28.7 inches); sheet two: 550 by 365mm (21.6 by 14.3 inches).
The British Channel
A chart of the English Channel extending from the Scilly Islands west of Cornwall, across to the Straits of Dover.
In 1786, Captain John Stephenson of the Royal Navy produced this comprehensive and detailed survey of the Channel, which was published in Robert Sayer’s ‘The Channel pilot’ (1789) as the first chart. In this pilot, it bears the title ‘A new chart of the British Channel from the mouth of the Thames to Ushant’ and shows the position of the Battle of Ushant, which took place in July 1778.
Along the coast of England and France, counties and regions are named, but topographical information otherwise extremely limited, with only those places and features relevant to navigation identified, including
“Plymouth Dock”, “Portsmouth”, and “Dunkirk”, as well as lighthouses and beacons. Soundings are given extensively, and rocks and sandbanks represented. Furthermore, arrows “shew the direction of the currents produced by the tides”, as explained in the “remarks”. The waters of the Bristol Channel north of the Cornish peninsular are also described in detail. The decorative title cartouche, which is set against a maritime background, still awaits the chart’s title and publication imprint.
DESSIOU, J[oseph]
[Chart of the Channel Islands and French coast].
Publication [London], 1805.
Description Original working manuscript chart on two joined sheets, pen and black ink, on paper, “Drawing of Jersey, &c. by J. Dessi[ou] Engraved by Stevenson 1805” inscribed to verso, damage and loss to left margin.
Dimensions 795 by 650mm (31.25 by 25.5 inches).
The Channel Islands
A manuscript chart of the Channel Islands and northeastern coast of France, drawn by the prolific hydrographer Joseph Dessiou.
The larger islands of Jersey and Guernsey are depicted in detail, with their towns, rivers, and ports shown; information about the smaller islands of Sark, Herm, and Alderney is limited to the rocks that surround them, which could prove treacherous for sailors. Other maritime obstacles and soundings are also provided, although somewhat sparsely in the waters southeast of the islands, since boats and ships from France typically approached from the west. Latitude scales are given in the vertical margins, but no longitude scales in the horizontal margins.
The printed chart would be included in Dessiou’s ‘Le Petit Neptune Français’ of 1805 under the title ‘Coast of France from Cape la Hague to Isle Brehat, with all the adjacent Islands and Dangers’, and later appeared in Laurie’s pilots as ‘The Coast of France, from Cherbourg to Brehat; including the Islands of Guernsey, Jersey, Alderney, &c.’.
DOBREE, Captain [Nicholas]
A general chart of the islands of Guernsey and Jersey, Sark, Herm, Jethou and Alderney, with Cape la Hague and the Caskets: wherein the banks, shoals, rocks and soundings round them are faithfully expressed by Capt[ain] Dobree.
Publication [London, Robert Sayer and John Bennett, c.1779].
Description
Original working manuscript chart, pen and black and red ink, with extensive insets and extensions, “Guernsey & Jersey” inscribed to verso.
Dimensions 725 by 515mm (28.5 by 20.25 inches).
The Channel Islands by a Guern
A manuscript chart of the Channel Islands prepared by Captain Nicholas Dobree, a Guernsey native.
The Huguenot Dobrée family fled to Guernsey to escape the persecution of protestants in France in the mid-sixteenth century, and over the centuries became a prominent family on the island. The Captain Dobree referred to in the title is Nicolas Dobree, who was commissioned by the Lord High Admiral of Great Britain to produce a set of accurate sea charts detailing the waters around the Channel Islands following the loss of the HMS ‘Victory’ in 1744.
Dobree set about his surveying with great haste, and by 1746 he had produced three charts of the Channel Islands: ‘A General Chart of the Islands of Guernesy and Jersey...’; ‘An accurate chart of the Island of Alderney and Burhou’; and the present chart ‘A New and Exact Chart of the Islands of Guernsey, Sercq, Herm & Jethou’.
In the sailing directions ‘Observations on the charts of the islands of Guernsey, Alderney’, that accompanied the charts, Dobree provides details on how the charts were to be used:
“The general chart of the Islands is only useful to show the bearing and the distance of each of these from one another, and what course to keep to approach them; so that when you come near Alderney or Guernsey, make use of the particular Charts of those Islands.”
And how the survey was undertaken:
“He has been on the rocks and dangerous places, have taken all the soundings, and examined the ebbing’s and flowing’s of the tide, in order to place them all in the most exact manner; and that strangers might the more easily come to, or go from Guernsey or Alderney, he has drawn the following instructions, by the help of which they may come to these Islands without the least fear”.
The chart describes the waters of the Channel around the islands, including maritime obstacles such as rocks and banks, as well as soundings. The islands themselves are not presented here in great detail, with only a few settlements named, including St. Peter Port on Guernsey which is simply labelled “town”. An inset chart along the upper edge, however, presents Alderney and the smaller surrounding islands on a larger-scale. Arrows indicate tides and small anchor symbols suggest safe spots for vessels. The French toponyms are evidence of the linguistic influence of both France and Britain on the Channel Islands.
Sayer and Bennett would include Dobree’s charts in ‘A Complete Channel Pilot’ of 1779.
DOBREE, Capt[ain]
A new chart of the island of Guernsey, with those of Sark, Herm and Jethou; shewing all the Rocks, Shoals, and other Dangers; the Channels, Soundings and Run of the Tides &c. Improved from the survey made by Capt. Dobree.
Publication
London, Robert Sayer and John Bennett, [c.1779].
Description
Original working manuscript chart on two joined sheets, pen and black and red ink on paper, with extensive insets and extensions, “Guernsey” inscribed to verso.
Dimensions 525 by 725mm (20.75 by 28.5 inches).
The most detailed eighteenth-century chart of Guernsey
The manuscript for the most detailed chart of Guernsey’s waters published in the eighteenth century.
The chart is superbly detailed with soundings, and hazards including rocks, reefs, and sand banks are clearly marked; safe anchorages are also shown as are the safe approaches to St. Peter Port (“St. Pierre Port”). On the land appear the principal towns, villages, and windmills. So accurate was it that it would become the standard work until well into the nineteenth century.
Dobree’s original title, scale bar, and view of Castle Cornet have been covered with pasted overslips, and a new title cartouche added. Furthermore, manuscript annotations in red ink appear across the chart, adding new roads and toponyms to the islands. Along the lower edge the editor has also written a note to the engraver insisting that “the shading of hills round that coast must be engraved of the same size and strength as they are, only better expressed”.
Dobree’s chart of Guernsey would be featured alongside his other charts of the Channel Islands in Sayer and Bennett’s 1779 ‘A Complete Channel Pilot’.
LEMPRIERE, Captain [Clement]
A chart of the island of Jersey from the survey made by Capt[ain] Lempriere.
Publication
London, Robert Sayer and John Bennett, [c.1779].
Description
Original working manuscript chart on two joined sheets, pen and black ink on paper, “Jersey” inscribed to verso.
Dimensions 525 by 725mm (20.75 by 28.5 inches).
Jersey Shore
A manuscript chart of the island of Jersey, made by a local captain. Born in St. Helier, the capital of the Bailiwick of Jersey, Captain Clement Lempriere (1683-1746) was a military engineer, draughtsman, cartographer, and engraver, whose most important work was for Henry Popple’s 1733 map of the British Colonies of North America. In 1741, Lempriere was appointed Chief Draughtsman at the Ordnance Office. His ‘New and accurate map of Jersey’ was first published posthumously in 1755, and is replicated in the present manuscript for inclusion in Sayer and Bennett’s ‘A Complete Channel Pilot’ of 1779. With anchorages and hazards, but few soundings, in the surrounding waters, Jersey is mapped in detail. A network of roads extends between the island’s towns, and the land is divided into cantons. Churches, manor houses and batteries appear across the island, and the “town of St. Hellier” is depicted as a collection of buildings viewed from above. The key in the “remarks” differentiates between “rocks seen above water”, “rocks always under water”, and “rocks seen at low water”.
[JEFFERYS, Thomas]
The Harbour of St Malo and Road of Rance.
Publication [London, after 1761].
Description Original working manuscript chart, pen and black and red ink on paper.
Dimensions 280 by 210mm (11 by 8.25 inches).
A chart of the harbour of St. Malo in northern France, made by Thomas Jefferys in around 1761.
Boats and ships travelling between the Channel Islands and France have historically used the port of St. Malo on the English Channel. In the sixteenth century the walled city declared itself an independent stateLa République de Saint-Malo - and later became a hub for French corsairs. It sits on the estuary of the Rance river, opposite Dinard on the west shore. In addition to sandbanks, rocks, anchorages, and sparse soundings, Jefferys drew the lines of four channels in the bay, which the editor of the manuscript has crossed out in red pen. We have been unable, however, to trace any example of a later printed edition of the chart.
PRICE, William
A Chart of Quiberon Bay including the islands of Houat, Hedic, and Cardinals Rocks, also Theseus’s Bank discovered and surveyed in November 1795, by W[illia]m Price, Master of His Majesty’s Ship Theseus.
Publication London, Laurie and Whittle, 1796.
Description
Original working manuscript chart, pen and black ink, on two joined sheets of paper, “Quiberon Bay Engralved by Neele Sep. 1796” inscribed to verso.
Dimensions 535 by 725mm (21 by 28.5 inches).
Quiberon Bay
An engraver-ready manuscript chart of Quiberon Bay off the south coast of Brittany, site of the decisive Battle of Quiberon Bay in 1759.
Thwarting any French plans to invade Great Britain during the Seven Years’ War, Britain’s victory in the battle marked the emergence of the Royal Navy as the world’s predominant naval power. Although this chart does not show the tracks of the fleets, or any ships, involved, it presents the stage of the battle in great detail, including the minor and major islands through which the vessels sailed, namely the Hoedic Islands (“Hodic”) and Le Four (“Fouk”), as well as the larger Belle Isle, which was captured by the British in 1761. Two years later it was returned to the French in exchange for the island of Menorca.
Another central feature of the chart is “Theseus’s Bank”, which the maker, William Price, claims to have discovered during his 1795 survey of the waters. The bank is triangulated with a number of sites and soundings concentrated around it, but also given extensively across the chart in general. Towns and villages on land are illustrated pictorially, as are windmills, churches, and forts, such as “Fort Penthievre” on the Quiberon Peninsula.
Along the lower edge of the chart, a variety of additional information is presented, including a view of the bay when entering from the south and of the land “when lying at anchor in Quiberon Bay”. There are also “bearings by compass from the Theseus Quarter deck in the anchoring ground”, as well as a series of coastal illustrations drawn both horizontally and vertically. In the right, the legend identifies maritime features such as “best anchoring ground”, “set of the tides”, “rocky cliffs”, and “banks under water”.
The printed chart was included in Laurie and Whittle’s 1796 ‘The Coasting pilot for Great-Britain and Ireland’ (see item 221), and later published by William Faden in 1810.
Pique la baleine
Arrangement Brunet Mélissa
Mediterranean
The earliest seafaring vessels ever constructed were launched upon the waters of the Mediterranean, and thus began international maritime trade. Throughout antiquity, sea power proved crucial for maintaining civilisations, with the Egyptians, Phoenicians, Greeks, Persians and Romans all asserting their dominance through the force of their fleets. After hundreds of years of Roman monopoly, Islam arose, and the Umayyad Caliphate gradually came to control the southern and eastern Mediterranean, as well as the waters surrounding the Iberian Peninsula. The Sea continued as the stage of both war and trade during the following centuries, as new and competing empires emerged and expanded.
During the eighteenth century, the European states gained power, as the circumnavigation of Africa meant that exotic goods could be shipped directly into their ports on the Atlantic and Mediterranean coasts, rather than being transported through the east. Between the European powers themselves, the Sea remained a theatre of war, with the War of the Spanish Succession, the War of the Austrian Succession, the Seven Years’ War, the French Revolutionary and Napoleonic Wars all involving naval battles in its waters.
As such, accurate and up-to-date hydrographical information remained extremely important, and a number of extensive surveys were undertaken to chart the Mediterranean during this period, most notably by the French and British. Much of the new and revised information that result from the expeditions of this significant period are evidenced on the sea charts presented here.
A complex Napoleon effect: what Napoleon had in his sights
TOFIÑO
DE SAN MIGUEL, Vicente
Laurie and Whittle’s New Chart of the Coast of Spain, Portugal, and Barbary from St. Sebastian to Cape Blanco North; with part of the Mediterranean Sea, including particular plans and principal harbours, etc. Compiled and reduced from the Surveys and Determinations of Don Vicente Tofino, and other Modern Navigators.
Publication London, Published by Rob.t Laurie and Ja.s Whittle, Chart-sellers to the Admiralty, &c &c., No 53 Fleet Street, 1st September, 1810.
Description Original working manuscript chart on two separate sheets, pen and black ink on paper, some marginal losses.
Dimensions 640 by 1000mm (25.25 by 39.25 inches).
A magnificent chart of the Iberian Peninsula at the height of the Peninsula War (1807-1814). Undoubtedly based on the monumental surveys of Vicente Tofiño published in his ‘Atlas Maritimo de España’ (1789).
The chart is incomplete, lacking some of the detail for the inset of the ‘Bay and Harbour of Cadiz’, but including insets of ‘The inlets of Ferrol, Corunna, and Betanzos’, ‘Lisbon Harbour’, ‘The inlet of Vigo’, ‘Bay of Gibraltar’, and ‘The Strait of Gibraltar’. Library of Congress holds an example published in 1811 which credits John Purdy as one of the “modern navigators” of the title.
[DESSIOU, Joseph Foss]
[Mediterranean Sea].
Publication [London, 1807].
Description
Original working manuscript chart on three sheets, pen and black ink on paper with five insets, laid down on linen, “Mediterranean drawn by I. Dessiou 1807” inscribed to verso, with eight further manuscript charts, in black and red ink and pencil, in different sizes.
Dimensions
Various sizes. Sheet one: 805 by 615mm (31.75 by 24.25 inches); sheet two: 800 by 585mm (31.5 by 23 inches); sheet three: 795 by 595mm (31.25 by 23.5 inches); sheet four: 160 by 180mm (6.25 by 7 inches); sheet five: 175 by 260mm (7 by 10.25 inches); sheet six: 165 by 295mm (6.5 by 11.5 inches); sheet seven: 520 by 615mm (20.5 by 24.25 inches); sheet eight: 480 by 620mm (19 by 24.5 inches); sheet nine: 470 by 610mm (18.5 by 24 inches); sheet ten: 95 by 180mm (3.75 by 7 inches); sheet 11: 130 by 205mm (5 by 8 inches).
One of the most important early charts of the Mediterranean
The magnificent manuscript map of the Mediterranean prepared by Joseph Dessiou for publication by Laurie and Whittle, to accompany their ‘New Sailing Directions for the Mediterranean Sea’.
Joseph Dessiou came from a family of hydrographers who all shared the same name as well as the same profession. Together the Joseph Dessious published over 100 hydrographical publications between 1770 and 1851, including the first published tide tables. Joseph Foss Dessiou I had served on numerous ships in the late-eighteenth century, and after he turned his hand to surveying, became the early-nineteenth century’s most prolific hydrographer. The majority of his charts were published by William Faden, often as pilots, and in 1828 he joined the Hydrographical Office, where he contributed to the first volume of the Admiralty Pilot.
His chart of the Mediterranean extends from the Straits of Gibraltar in southwest Spain across the intervening 2400 miles to the coast of the Levant. Topographical information on the land is minimal, with features limited to coastal towns and ports, although important cities further inland such as Rome and Cairo are represented. Soundings are also somewhat scarce, except in some of the most well-surveyed and strategic waters, such as those in the Gulf of Cadiz, the south coast of France, the Adriatic, and the Gulf of Alexandretta.
The greatest level of detail can be found in the nine insets that show various important locations on a larger scale. Those on the first sheet show Cadiz and the Straits of Gibraltar, with soundings and tracks given, as well as a view showing “the appearance of the land on the coast of Barbary in the Gulf of Gibraltar”, which has been drawn on a pasted overslip. There is also a further empty inset box on the first sheet which would eventually contain a plan of the Harbour of Toulon. The circular title cartouche has also been left empty here.
The central sheet has insets, again on pasted overslips, showing the islands of Malta and Gozo, with topographical details such as roads and the “subterraneous aqueduct” featured, the Strait of Messina, with soundings and tides highlighted, and the Esquerques rocks off of Sicily, on which the HMS ‘Athenienne’ had been wrecked in 1806.
The final sheet has four insets, of which three are very large. One features southern Sardinia, with the Gulf of Palma populated with soundings, another the Strait of Bonifacio which separates that island from Corsica to the north. The third large inset presents the Gulf of Izmir (“Gulf of Smyrna”); four of the hills depicted, including one labelled “Old Fort in ruins”, have been crossed out in pencil and indeed are omitted from the printed version of the chart. Besides this is a smaller inset showing ‘the Gulf of Yasso or Bay of Scanderoon’, or Alexandretta at the very northeastern point of the Mediterranean. On this sheet the island of Cyprus has also been drawn on a pasted overslip.
The first printed edition of the chart was published in 1811, under the title ‘Laurie and Whittle’s New Chart of the Mediterranean Sea Comprehending the Coast from Cape St. Mary, (in Portugal) to Constantinople, and from Rabat, in Africa, to Alexandretto, or Scanderoon in Asia’. There would be further editions, including a pirated one, all of which are exceedingly rare; the two known extant examples of the 1811 edition are held by McMaster University and University of Amsterdam. In 1826, the map would be extensively updated with information garnered from the surveying expeditions of William Henry Smyth, and come to be considered the first scientific general chart of the Mediterranean Sea.
The chart is accompanied here by a selection of manuscript hydrographical and cartographical material used during its production. On three large sheets, the outlines of different parts of the Mediterranean coast are sketched in red ink, with some sparse hydrographical information in the surrounding waters. There are also two excised charts from which insets on the chart - those of Scanderoon and the Esquerques - are drawn, as well as a plan of Cartagena, which would replace the inset of Cadiz on the 1811 printed edition. Finally, there is a chart of the Sea of Marmara and the northern Aegean on the same scale as the main chart, much like the overslip of Cyprus. It is not clear why it was not pasted on, since the numerous additional toponyms and soundings that it bears were incorporated for the 1811 edition.
This collection of material provides a fascinating glimpse into the process that went on before charts were engraved and printed, here culminating in one of the most important general charts of the Mediterranean ever made.
[ANONYMOUS]
The seat of war between the Alps and the Pyrenees including the southern parts of Provence and Languedoc, with the province of Roussillon.
Publication London, Robert Sayer & Co., Sept[ember] 1793.
Description Original working manuscript, pen and black ink / engraved chart, on two joined sheets of paper, “South of France and small seat of war engraved by Neele Oct. 2 1793” inscribed to verso.
Dimensions 265 by 610mm (10.5 by 24 inches).
The War of the Pyrenees
A map of the south coast of France during the War of the Pyrenees that began in March 1793, and would last two years.
The war began when the Spanish army invaded the province of Roussillon, and besieged the port of Toulon alongside their British allies from September to December 1793. They would eventually abandon the siege when Napoleon Bonaparte, then a 24-year-old officer, brought the anchored allied fleet under fire, thereby enabling the capture of the harbour’s fortifications.
Toulon is shown on the map connected by road to other major towns, cities, and ports including Marseilles, Aix, and Grasse. This road network extends across the region, even reaching into Spanish Catalonia. Remarkably, there does not appear to be any record of a printed edition of this map, nor of a map published by Sayer under a similar title, or indeed of this region at all. It seems that for some reason, although the chart was engraved by Samuel Neele a month after this example was annotated with the date, it was never printed and sold.
The Coast of High Barbary
The charts of the west coast of Africa were principally of interest to the international plyers of the slave trade. Several charts detail the long and a very strategic coastline, the first leg of the infamous “Middle Route” route between West Africa, the West Indies, and the Americas, by which ships crossed the Atlantic Ocean with their cargo of slaves. Many of the charts cite as their source some notorious slave-traders: Robert Noms, William Woodville, and Archibald Dalzel.
MAYNE, J[ohn] W. Pantellaria.
Publication 1817.
Description
Manuscript plan in pen ink and colour wash on paper, extensive manuscript notes to verso, minor loss.
Dimensions 260 by 275mm (10.25 by 10.75 inches).
The Mayne attraction
An interesting manuscript plan of Lake Pantelleria on the eponymous island. The small Italian island of Pantelleria, known in antiquity as Cossyra, is situated in the Strait of Sicily, 35 nautical miles east of the Tunisian coast. Its strategic location made it an attractive base for the British during the Napoleonic Wars, and investigations were launched into the feasibility of occupying the island, but the proposal was ultimately rejected in 1812. Five years later, according to the manuscript account written on the back of the plan, Captain John Mayne and a Mr. Holland visited the island and were hosted by one Mr. Bocanagras, who owned a plantation there. The plan shows the sites they visited, labelled with letters corresponding to a key above. These include “B. very fine cultivated land and buildings”, “E. perpendicular cliffs about 80 or 100 feet” and “G. cotton fields bordering on the lake”. This lake dominates the centre of the plan and, according to Mayne, “boils and has a sulphurous brackish taste”. Indeed, the Specchio di Venere (‘Mirror of Venus’) is a soda lake, and lies in a crater formed by previous volcanic activity on the island.
The plan does not appear to have ever been engraved and printed.
GLAS, Captain George; and Charles Pierre Claret, Comte de FLEURIEU
A Chart of the Coast of Africa from the Streights of Gibraltar to Cape Blanco, with Madera and the Canary Islands, From the Observations of Capt. George Glas in 1759 and 1760, and those of Monsr. De Fleurieu made by order of the French.
Publication
London, Printed for Robert Sayer and John Bennett, Fleet Street, as the Act directs, [c.1781]
Description
Large original working manuscript chart on two separate sheets, pen and black ink on paper, inscribed “94” in each lower righthand corner, and “Coast of Africa” on the verso, some losses to margins repaired.
Dimensions
Each sheet 515 by 725mm (20.25 by 28.5 inches).
Charting slavery: the first leg of the infamous “Middle Passage”
A long and very strategic coastline is relevant here as the first leg of the infamous “Middle Passage” route between West Africa, the West Indies, and the Americas, by which ships crossed the Atlantic Ocean with their cargo of slaves.
Though published in 1781, as here, with numerous and significant coastal profiles, it was soon updated by Sayer’s ‘A New Chart of the Coast of Africa from the Straits of Gibraltar to Cape Blanco with Madeira and the Canary Islands’ (1789), when it was included in Robert Sayer’s ‘The African Pilot’ (1794).
[ANONYMOUS]
Cape Sierra Leon Harbour.
Publication [c.1790].
Description Original surveyor’s working manuscript chart, pen and black ink on paper, office amendments in pencil on both sides.
Dimensions 340 by 315mm (13.5 by 12.5 inches).
Charting slavery: influencing ‘The African Pilot’
Oriented with east to the top, this is a fairly rough sketch of Freetown in Sierra Leone, from what is now Fourah Point, then Farran Point, to Cape Sierra Leone, taking in White’s Bay and Pirates Bay.
The chart may have influenced the inset of the entrance to the River Sierra Leone on Robert Sayer’s chart ‘A New Survey of that coast of the part of Africa comprised between Cape Verga and Cape Formoso, including chiefly the Windward and Gold Coasts’ (1794) for his ‘The African Pilot: Being a Collection of New and Accurate Charts, on a Large Scale, of the Coasts, Islands, and Harbours of Africa, from the Straits of Gibraltar to Cape Negro’, the earliest known example of which was published by Sayer in 1794.
FISHER, Ralph
A plan of the River Sherbro with Yawry Bay by Ralph Fisher in the Sloop Polly, in February and March 1773.
Publication London, Robert Sayer, [c.1789].
Description Original working manuscript chart, pen and black ink on paper, “Drawing of the river Sherbro from Mr. Norris” inscribed to verso.
Dimensions 545 by 380mm (21.5 by 15 inches).
Charting slavery: Sherbro
A manuscript chart of the River Sherbro in Sierra Leone, ready to be engraved.
Soundings are given in Yawri Bay (“Yawry Bay”) where the Sherbro empties into the Atlantic Ocean, and along the river’s course. Obstacles such as concealed banks and islands, as well as “some places dry at low water” are identified. Some smaller rivers are represented and labelled, but few settlements appear, although on Sherbro Island “Pow Grande”, “Sarro”, “Jenkins”, “Kildare”, “Jamaica Point”, and “Cuckolds Point” are to be found. After Britain’s 1808 abolition of the international slave trade, the former Royal African Company trading post on Sherbro Island became a base for the battle against illegal slave trading.
Above the island are shown four horizontal views showing how the land appears from the water. At the bottom of the chart are “directions for sailing into the River Sherbro to Jenkins where shipis of a great draught of water generally anchor”, as well as instructions “for sailing up the River Sherbro to York Island”.
A manuscript note to the verso states that the drawing of the river was taken “from Mr. Norris”; this likely refers to Robert Norris, British navigator, slave trader, and amateur historian with a special interest in west Africa.
NOMS, Robert; William WOODVILLE; and Archibald DALZEL
A New Chart of the Coast of Africa between Cape Formosa and Cape Negro, With the Adjacent Islands; Composed From the Draughts, Observations, journals &ca. of Mess.rs Rob.t Norris, Will.m Woodville, and Arch.d Dalzel of Liverpool and under their inspection.
Publication London, for Robert Sayer, as the Act directs, [c.1790].
Description
Large original working manuscript chart on three separate sheets, pen and black ink on paper, with a correctional inset, inscribed “102” in the lower right-hand corner of each chart, some marginal losses.
Dimensions Each sheet 540 by 740mm (21.25 by 29.25 inches).
Charting slavery: the slavers chart
A continuation of item 108, this extensive and detailed chart continues its deliberate and grim progress down the west coast of Africa, illustrating with insets the lucrative trading ports of Anna de Chaves Bay, Bonny River, Old Calebar, Bimbia, Cameroons River, Mayumba Bay, Ambriz Road, Fish bay, and Benguela, and the Catumbela Roads.
The chart was compiled from information provided by the notorious slave-traders: Robert Noms, William Woodville, and Archibald Dalzel, who retained supervisionary rights over the finished product.
It was published by Robert Sayer, on November 1st, 1792, and then again on May 12th, 1794, when it was included in Robert Sayer’s ‘The African Pilot’ (1794).
MAXWELL, Geo[rge]
To Thomas Leyland Esq.re Liverpool This draught of the River Congo Is most Respectfully dedicated, by His much Obliged Hble Servt. Geo Maxwell.
Publication [London, c.1793].
Description Original surveyor’s fair copy manuscript chart on two separate sheets, pen and black, with colour wash, on paper.
Dimensions
Each sheet 745 by 535mm (29.25 by 21 inches).
Charting slavery: how to cure “a very malignant Putrid fever” - in the Congo
The most detailed navigational chart of the Congo River, which retained its currency until the explorations of Sir Henry Morton Stanley in the 1870s.
Captain George Maxwell (1762-1812), on his exceedingly detailed and elegant chart of the Congo River has provided a lengthy legend full of much good advice on how to safely navigate the dangerous waters around the mouth of the river. However, he also provides a few extra and very practical tips from one who has made ten voyages there: “Vessels intended for Congo - should be provided with a mooring chain - that water having the quality of rotting cables in a short space of time”; “The health of seamen being of the utmost importance in foreign voyages, the following observations; the result of ten voyages to Congo may be of use. The most prevailing disorder in the River, is a very malignant Putrid fever - which if treated in the usual manner of evacuants [sic] - either proves fatal in a short time - or leaves the patient labouring under a Tedious and disturbing Intermittent [sic]”; the cure for which is “Pourian Bark [i.e. Jamaican Puron Bark - ed] and Port wine - given on its first appearance... seldom fails to remove every symptom in two days - the Patient having recourse to castor oil & limes - and keeping warm with flannels - so very essential is that article of dress to seamen in this river that very few have experienced sickness, that wore flannel shirts”; don’t swab the decks at night, as sailors inveterately sleep out on them overnight and suffer bad-effects from the evaporation; always boil water, intended for drinking, from the Congo, “as it abounds with dangerous animaliculee”; “should the Scurvy should make its appearance there is plenty of Purslain - Palm Cabbage - limes, to be procured - and perhaps what is superior to any, a Red fruit, in bunches like grapes, the natives call Phoata [probably Sapotaceaeed], of a delicious acid taste”.
The chart extends inland to about 200 miles, and includes several coastal profiles, as well as information about the topography, and much gleaned from the local native population. It was published, after a few edits to the legend, as ‘A New Survey of the River Congo’, by Laurie and Whittle in 1795.
HUDDART, Joseph; and Mr FOWNES
An Hydrographic Survey of False Bay or Bay False, including a Sketch of the Cape of Good Hope by Captn. Jos: Huddart, with several Additions and Improvements [Presented] Communicated by Mr. Fownes.
Publication
London, Published by R.t Laurie and J.s Whittle Fleet Street. 1st June 1798.
Description
Engraved chart, with office amendments in red ink, inscribed lower left “34”, and on the verso “False Bay Improved Mr Neele”.
Dimensions 690 by 495mm (27.25 by 19.5 inches).
Mr. Neele improves
A detailed chart of False Bay, illustrated with numerous coastal profiles, and including lengthy instructions from Huddart: “Simon’s Bay is the only safe harbour in Bay False”.
Showing the tracks of the East Indiamen ‘Asia’ and ‘Royal Admiral’ (commanded by Huddart), and the foundering of the ‘Colebrook’ on August 24th, 1778, and published in ‘The Oriental pilot; or, East-India directory’ (1799). No issue with the title altered to indicate that Mr. Fownes “communicated” his improvements, rather than “presented” them, has been located.