5 minute read
Taking stock: using the BEPI to organize your energy management plan
Taking stock
Using the BEPI to organize your energy management plan
By Matthew Redekopp, P.Eng., CEM, LEED AP
Getting started with an energy management program in your district or across your campuses can be a daunting task. Of your many buildings, on which do you begin focusing your efforts? What improvements do you make and which do you start with? The simple and straightforward starting point is to organize your efforts and benchmark your facilities using a metric called the Building Energy Performance Index (BEPI), a.k.a. the Energy Utilization value (EU).
The BEPI uses the units of energy divided by area and is commonly seen in the form ekWh/m2, ekWh/ft2, and eGJ/m2. Provincially you can expect to see the first, and federally the last. The “e” prefix identifies the energy unit as encompassing many energy types including electricity and fuels (e.g., natural gas). It is shorthand for “equivalent” and it tells the reader that one energy type’s units of measure has been converted into that of another for the purpose of comparison. By this approach you can speak of kilowatts of propane without offending the convention of measuring propane in litres or cubic feet. DGMAd_D.G. MacLachlan Ltd_ad.qxd 12-03-30 9:44 AM Page 1
D.G. MACLACHLAN LIMITED
WHOLESALE LOCKSMITH SUPPLIES & HARDWARE KEY BLANKS • KEY CABINETS • PADLOCKS KEY MACHINES • HIGH SECURITY LOCKS
4050 Grant Street Burnaby, B.C. Canada V5C 3N5 TEL: 604-294-6000
1-800-665-0535
FAX: 604-294-3333
sales@dgmac.com
EVERYTHING FOR
THE LOCKSMITH
There are two types of information embodied in the BEPI – total energy and total size. The recipe is simple: for each building under your care, gather all the energy records for a sample year, convert all units to a common equivalent unit, combine them, and divide the result by the total conditioned floor area. The result is a number that is rendered independent of building size and therefore useful for comparison. Thus your largest and smallest buildings now share common ground.
Building a BEPI chart is a simple task if you are a fluent in spreadsheets. You first order the data, then sort it, and lastly combine the sorted data into a graphic. Recognizing that spreadsheets are foreign to some readers, I will provide a brief overview of the process and have gone so far as to host a sample file for download at tinyurl.com/8xxvcm9.
Step 1 - Open your earliest SMART tool Excel file and save it as a new file. Open each successive SMART file and copy/paste the rows from below the header down into this new file. Once complete, you should have a spreadsheet listing every building for two to three years of monthly records.
Step 2 - Highlight the building name column and copy/paste it to a blank column. Highlight this new column and select the function “Remove Duplicates” from the data ribbon menu. Sort the remaining list of building names alphabetically with the “A-Z” button.
Step 3 - Create a table on the same sheet as the data from the list of names. Add, as headers to the table, the number of years for which data is available and each type of energy unit (see Figure 3). Use the “Sumifs” Excel function (a multiple-condition sum function) to add up all the entries based on the building name, year and unit.
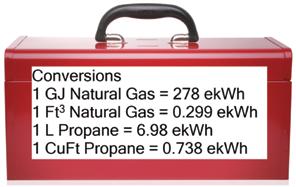
Step 4 - Convert the non-kWh units to ekWhs using the conversion factors listed in the Toolbox (Figure 4). For example, natural gas is converted to ekWhs by multiplying the total GJs by a factor of 278. PrecisionAirQuality_Ad_PrecisionAirQuality.qxd 12-03-30 9:58 AM Page 1


PRECISION AIR QUALITY CORPORATION John Oort | Dave Oort HVAC Consulting, Western Regional Manager Design & Sales #181, 22112 - Twp. Road 531 Ardrossan, AB Tel: (780) 922T8E 7120 2E4 Packaged Unit Ventilators Fax: (780) 922-7150 Cell: (780) 970-3790 Email: john@oortsenterprises.com Dedicated better to provi working ding and
www.changeair.com learning environments!

Figure 1: Absolute Energy Use per Campus

Figure 2: BEPI per Campus

Figure 3: Header for Table
Building Name Area
m2 2010
KWH 2010
GJ 2010
eKWH 2011
KWH 2011
GJ 2011
eKWH Average BEPI
eKWH eKWH/m2
Figure 4: Conversion Toolbox

Step 5 - Add up all the kWhs and ekWhs and divide by the total floor area. Chart using the Bar Chart option.
Step 6 - Show the final chart to someone you want to impress.
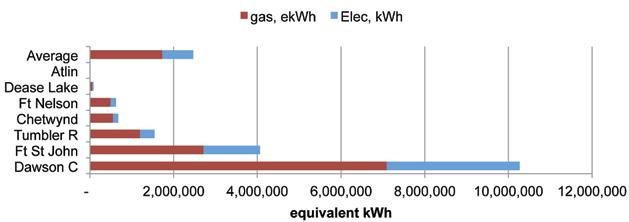
In my relatively new role as the energy manager for Northern Lights College, I recently benchmarked our seven campuses for presentation to the executive. Coming in as a total stranger to the college, I had to make heads from tails of the building stock before I could make any total equivalent energy to get some sense of magnitude. Figure 1 is the by-product of that effort. My audience responded with gratitude for this first perspective as it succinctly summarized an important aspect of the college that had hitherto been hidden. All concluded that the Dawson Creek campus (the largest campus) was the obvious starting point for our energy management efforts. This is an accurate assessment from a total energy perspective, but not so from one of performance.
The next slide (Figure 2) revealed what the first could not: the effect of size on energy use. What took everyone by surprise is that the Tumbler Ridge campus, the second smallest campus, is the largest energy user per floor area, followed by Fort St. John (the second largest), and then Dawson Creek. With this entirely different perspective, we turned our attention to Tumbler Ridge and are in the process of discovering the reasons for the inexplicably high energy intensity.
The lesson is self-evident: the BEPI is a powerful equalizing tool plans. Taking the SMART utility records for three years, I averaged the
that puts energy performance in perspective. Compiling a BEPI chart is one of the first steps required by BC Hydro-sponsored energy manager and it should be the first consideration for you, too. When it comes to using a consultant for energy auditing services or allocating limited resources towards energy-related projects you should consult your BEPI chart first and target the facility with the largest BEPI. Start with the highest user and work backwards.
About the Author
Matthew A. Redekopp, P.Eng., CEM, LEED AP, is owner of Rede Energy Solutions, Ltd. and energy manager for School District 59 and Northern Lights College. b


