First Break June 2024 - Technology and Talent for a Secure and Sustainable Energy Future

Page 1


FIRST BREAK ® An EAGE Publication

CHAIR EDITORIAL BOARD

Gwenola Michaud (gmichaud@gm-consult.it)

EDITOR Damian Arnold (arnolddamian@googlemail.com)

MEMBERS, EDITORIAL BOARD

• Lodve Berre, Norwegian University of Science and Technology (lodve.berre@ntnu.no)

Philippe Caprioli, SLB (caprioli0@slb.com) Satinder Chopra, SamiGeo (satinder.chopra@samigeo.com)

• Anthony Day, PGS (anthony.day@pgs.com)

• Peter Dromgoole, Retired Geophysicist (peterdromgoole@gmail.com)

• Kara English, University College Dublin (kara.english@ucd.ie)

• Stephen Hallinan, CGG (Stephen.Hallinan@CGG.com)

• Hamidreza Hamdi, University of Calgary (hhamdi@ucalgary.ca) Clément Kostov, Freelance Geophysicist (cvkostov@icloud.com)

Fabio Marco Miotti, Baker Hughes (fabiomarco.miotti@bakerhughes.com)

• Martin Riviere, Retired Geophysicist (martinriviere@btinternet.com)

• Angelika-Maria Wulff, Consultant (gp.awulff@gmail.com)

EAGE EDITOR EMERITUS

Andrew McBarnet (andrew@andrewmcbarnet.com)

PUBLICATIONS MANAGER

Hang Pham (eagepublications@eage.org)

MEDIA PRODUCTION

Saskia Nota (firstbreakproduction@eage.org) Ivana Geurts (firstbreakproduction@eage.org)

ADVERTISING INQUIRIES corporaterelations@eage.org

EAGE EUROPE OFFICE

Kosterijland 48 3981 AJ Bunnik

The Netherlands

• +31 88 995 5055

• eage@eage.org

• www.eage.org

EAGE MIDDLE EAST OFFICE

EAGE Middle East FZ-LLC Dubai Knowledge Village Block 13 Office F-25 PO Box 501711

Dubai, United Arab Emirates

• +971 4 369 3897 middle_east@eage.org

• www.eage.org

EAGE ASIA PACIFIC OFFICE

UOA Centre Office Suite 19-15-3A No. 19, Jalan Pinang 50450 Kuala Lumpur

Malaysia +60 3 272 201 40

• asiapacific@eage.org

• www.eage.org

EAGE AMERICAS SAS Av. 19 #114-65 - Office 205 Bogotá, Colombia

+57 310 8610709

• +57 (601) 4232948

• americas@eage.org

• www.eage.org

EAGE MEMBERS CHANGE OF ADDRESS NOTIFICATION

Send to: EAGE Membership Dept at EAGE Office (address above)

FIRST BREAK ON THE WEB www.firstbreak.org

ISSN 0263-5046 (print) / ISSN 1365-2397 (online)

Integrated geothermal asset understanding — The next generation of geothermal simulation

35 Generalised survey optimisation with constraints

Rajiv Kumar, Massimiliano Vassallo, Alexander Zarkhidze, Franck Le Diagon, Gary Poole, Tristan Allen, Robert Bloor and Luis Arechiga Salinas

41 Contribution of frequency and training model on AI-based velocity prediction

Junxiao Li, Herurisa Rusmanugroho and Muhamad Alif Jamaluddin

47 Seismic-led exploration and characterisation of carbon storage sites

Julien Oukili, Nick Lee, Martin Widmaier, Omar Baramony, Roberto Ruiz and Eric Mueller

55 Upgrading vintage data in the Punta del Este and Pelotas basins offshore Uruguay and Southern Brazil

Kyle Reuber, Bruno Conti, Milos Cvetkovic, Pablo Rodriguez and Henri Houllevigue

65 Preliminary remote spatial analysis of fairy circles : an approximation of hyperspectral and geophysical data from hydrogen seeps

Juan Esteban Mosquera-Rivera, Juan Manuel Jiménez-Vergara, Carlos Alberto Vargas-Jiménez, Philip Ball and Hans Morales

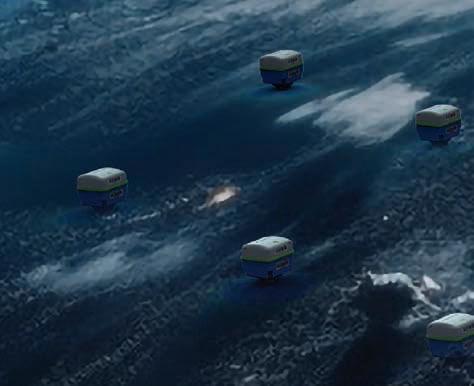
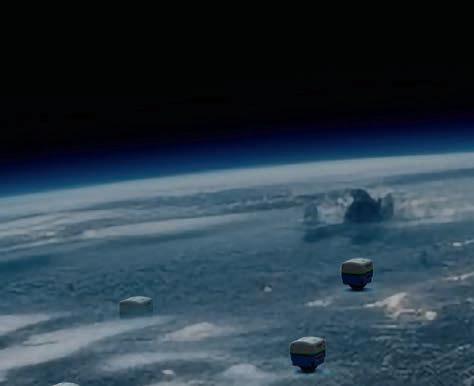
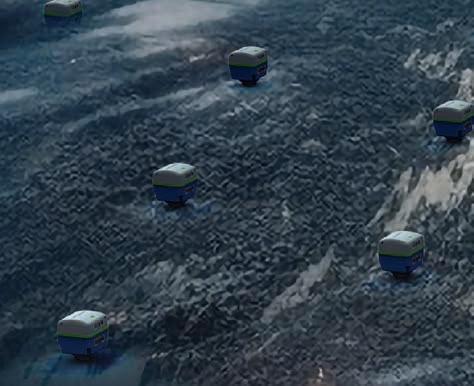
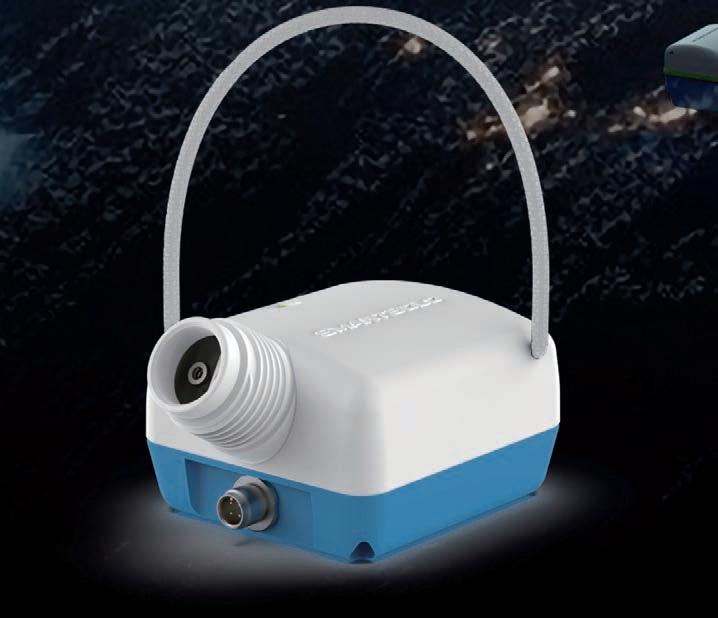
79 Seisnode – A view on ocean bottom nodes from the geophysical side Jeroen Hoogeveen, Per Helge Semb and Wietze Eckhardt

85 Integrated geothermal asset understanding — The next generation of geothermal simulation

Jonathon Clearwater, Aygün Güney, Melike Sultan Yılmaz , Deniz Özbek, Ali Bas˛er, Önder Saraçogˇlu and Jeremy O’Brien

91 Drone-based methane leak screening in energy infrastructure

Alexei Yankelevich

97 From black to green gold: Leveraging diversity and innovation in the CCS era Élodie Morgan and Habib Al Khatib

103 Empowering sustainable geoscience exploration through technology and academic collaboration Nick Tranter

106 Calendar

cover: The energy industry will take stock of the energy transition at the EAGE’s Annual Conference and Exhibtion in Oslo this month.

European Association of Geoscientists & Engineers Board 2023-2024

Near Surface Geoscience Circle

Esther Bloem Chair

Andreas Aspmo Pfaffhuber Vice-Chair

Micki Allen Contact Officer EEGS/North America

Adam Booth Committee Member

Hongzhu Cai Liaison China

Deyan Draganov Technical Programme Officer

Wolfram Gödde Liaison First Break

Hamdan Ali Hamdan Liaison Middle East

Vladimir Ignatev Liaison CIS / North America

Musa Manzi Liaison Africa

Myrto Papadopoulou Young Professional Liaison

Catherine Truffert Industry Liaison

Mark Vardy Editor-in-Chief Near Surface Geophysics

Florina Tuluca Committee Member

Oil & Gas Geoscience Circle

Yohaney Gomez Galarza Chair

Johannes Wendebourg Vice-Chair

Lucy Slater Immediate Past Chair

Wiebke Athmer Member

Tijmen Jan Moser Editor-in-Chief Geophysical Prospecting

Adeline Parent WGE & DET SIC liaison

Matteo Ravasi YP Liaison

Jonathan Redfern Editor-in-Chief Petroleum Geoscience

Robert Tugume Member

Anke Wendt Member

Aart-Jan van Wijngaarden Technical Programme Officer

Sustainable Energy Circle

Carla Martín-Clavé Chair

Giovanni Sosio Vice-Chair

SUBSCRIPTIONS

First Break is published monthly. It is free to EAGE members. The membership fee of EAGE is € 80.00 a year including First Break, EarthDoc (EAGE’s geoscience database), Learning Geoscience (EAGE’s Education website) and online access to a scientific journal.

Companies can subscribe to First Break via an institutional subscription. Every subscription includes a monthly hard copy and online access to the full First Break archive for the requested number of online users.

Orders for current subscriptions and back issues should be sent to First Break B.V., Journal Subscriptions, Kosterijland 48, 3981 AJ Bunnik, The Netherlands. Tel: +31 (0)88 9955055, E-mail: subscriptions@eage.org, www.firstbreak.org.

First Break is published by First Break B.V., The Netherlands. However, responsibility for the opinions given and the statements made rests with the authors.

COPYRIGHT & PHOTOCOPYING © 2024 EAGE

All rights reserved. First Break or any part thereof may not be reproduced, stored in a retrieval system, or transcribed in any form or by any means, electronically or mechanically, including photocopying and recording, without the prior written permission of the publisher.

PAPER

The publisher’s policy is to use acid-free permanent paper (TCF), to the draft standard ISO/DIS/9706, made from sustainable forests using chlorine-free pulp (Nordic-Swan standard).

Socco
Edward Wiarda President
Aart-Jan van Wijngaarden Technical Programme Officer
Esther Bloem Chair Near Surface Geoscience Circle
Maren Kleemeyer Education Officer
Yohaney Gomez Galarza Chair Oil & Gas Geoscience Circle
Carla Martín-Clavé Chair Sustainable Energy Circle
Caroline Le Turdu Membership and Cooperation Officer
Peter Rowbotham Publications Officer
Pascal Breton Secretary-Treasurer

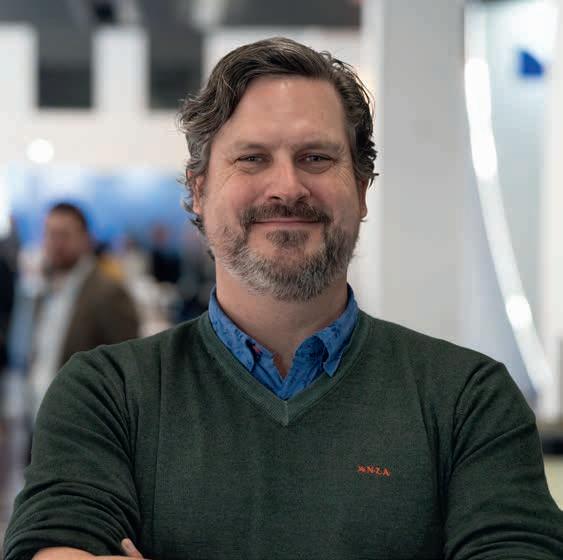
Setting us on the right path to energy transition

EAGE president Edward Wiarda (2023-24) recaps his year in office.

Transition and transformation seem to be words on everyone’s lips these days in the industries and institutions in which the members of our Association are involved.

I believe we can claim that EAGE itself has been an integral part of that process, not just as a participant but as a leader among its peer professional societies in acknowledging the need to adapt and innovate to meet the challenge of energy transition and how this affects our working lives.

One way for the EAGE to facilitate the necessary acceleration of the Energy Transition is to remove and/or reduce obstacles, risks, and uncertainties. The EAGE’s recognition of the non-technical set of challenges to the Energy Transition is reflected by the inclusion of more strategic, investor, community/ society, regulation/ policy programmes, and workshops in our events, and an increasing effort to actively invite and reach out to wider non-technical audiences to attend these programmes.

I am proud to have served as president of your Association during this period of profound change in how we view the services we provide not just for those of you in the energy resources industries but all the activities involving geoscience and related engineering expertise. Of course

anything we have achieved during my term as president results from collaboration between my colleagues on the Board, our leadership team in the office, all our hardworking staff in the Netherlands and regional offices, and of course all those of you who volunteer. I can’t say enough about how much it means when people give of their time to support our conference, education and publication programmes, without which we could not function. I thank you all.

Restructuring the professional interest areas of the EAGE membership to better serve members’ needs in this evolving energy transition era has been a highlight for me in the last 12 months. I took office just as we were embedding the new Circle organisation and am pleased to report that this has received wide acceptance. Members now have the choice of the Oil and Gas Geoscience Circle (OGGC), the Near Surface Geoscience Circle (NSGC), and the Sustainable Energy Circle (SEC). Registering for multiple Circles is now a highly recommended option. This is an important feature recognising that overlap in interests frequently occurs and has tremendous value in sharing knowledge, data, ideas, solutions, business models, best practices, and technologies across disciplines and between our members.

Indeed it is an integral part of our mission to enable a multi-disciplinary approach which is desirable in so many geoscience and engineering problem-solving environments.

At the same time we are catering for the specialist professional interests of our members by building an increasingly comprehensive portfolio of self-regulating communities, populating our overlapping three-circle framework. We now have ten Technical Communities alongside our longstanding Women in Geoscience & Engineering and Young Professionals

EAGE president Edward Wiarda.

Special Interest Groups. In a sign of our changing times, our Decarbonization and Energy Transition (DET) Technical Community recently took a decision welcomed by the Board to divide itself into five new Technical Community categories – Carbon Capture & Storage (CCS), Geothermal Energy, Wind Energy, Hydrogen & Energy Storage, and Critical Minerals. This is a logical step given how each of these areas has a significant and growing presence in their own right. At this stage members wishing to serve on the committees being created for these new Technical Communities are encouraged to apply.

No doubt more Technical Communities will emerge ‘organically’ to reflect changes in our various industries, and if there is sufficient support and activity levels, the Association can only benefit from what such groupings can offer in terms of sharing knowledge, collaborating, and networking, both internally and jointly with other communities.

Another encouraging development has been the continuing growth in Local and Student Chapters. My compatriots from The Netherlands, for example, have developed an impressive Local Chapter profile in just a few years winning EAGE awards in the process, and the same could be said of our relatively new branches in Aberdeen, Oslo and Houston, all hailing from countries traditionally associated with oil and gas E&P but now grappling with the huge implications of energy transition. Especially useful and enterprising is that these Chapters make their meetings accessible online, allowing members around the world to gain valuable professional insights.

Our body of Student Chapters is also steadily growing as the next generation of

geoscience and engineering professionals realise the value of working together in preparing for professional careers and in many cases reaching out to other educational institutions. The enthusiasm is evident judged by the increasing international participation in our three major student contests – the Laurie Dake Challenge, the Minus CO2 Challenge, and of course the ever popular GeoQuiz competitions held at the Annual, other regional events, and online. We continue to be grateful to the EAGE Student Fund and PACE Event Support for enabling many of these student activities around the world.

Improved relationships between EAGE and universities with geoscience and engineering faculties around the world will be key to participating in any future reach-out programme to highschool students, their teachers in STEM courses, and even guidance counsellors and other influencers. This Herculean task is obviously daunting and too big to accomplish within a single presidential tenure. I am certain that my successor Valentina Socco, as a university professor, will embrace this high-school outreach to attract new generations of geoscientists and engineers, and I wish her all the best in her endeavours.

In this light, I should also mention that this year we are introducing an award for initiatives by young professionals which might advance energy transition to be named after the remarkable American geologist and oceanographer Marie Tharp, whose drawings helped to reveal mid-ocean ridges and advance previously suspect tectonic plate theory.

In many respects EAGE is getting back into its stride following the very difficult Covid pandemic period. To reflect the interests of our professional community, we now have four flagship events. In addition to our Annual meeting, we have our Near Surface Geoscience conference, held very successfully in Edinburgh last year and destined for Helsinki in September. There is our annual Digitalization event (held in March with great feedback), now considered the most authoritative of its kind in discussing the way forward in digital applications to make possible more efficient and sustainable oil and gas operations. I am encouraged to hear that some major energy and service companies

are embracing the OSDU initiative, an Open Source, standards-based, agnostic data platform, so helping to develop a new-generation workforce that is savvy in both geosciences and data science.

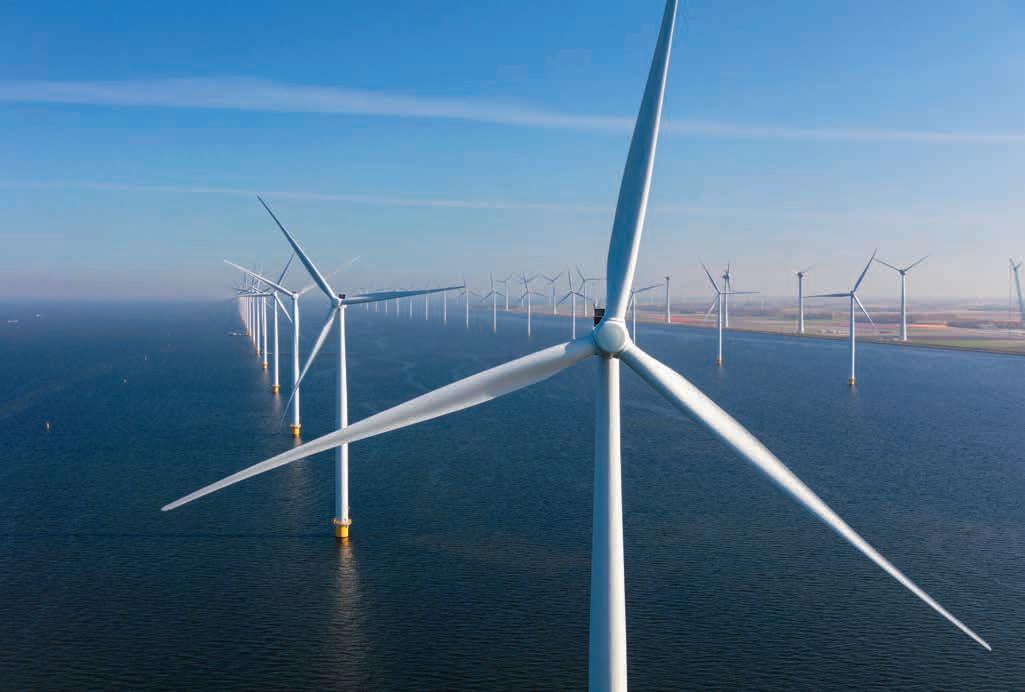
Meanwhile, the Global Energy Transition Conference & Exhibition (GET in November) is becoming very much a signature event for us underlining our support for geoscience and engineering applications relevant to reaching Net Zero emissions. This year we see the meeting broken down into four technical conferences – Offshore Wind Energy, Carbon Capture & Storage, Geothermal Energy, and Hydrogen & Energy Storage – with a unifying Strategic Programme bringing together experts to discuss the issues which touch on all these areas. In this context the launch at the Annual of a new energy transition skills tool, developed by the Education Committee and DET Communities to navigate members’ personal energy transition journeys, makes a lot of sense.

Our staff in the regions have very successfully been taking a selective approach to holding conferences and workshops, only staging those that can attract serious interest. This is essential in a period when EAGE is constantly challenged by the financial implications of changes in our professional membership, particularly in view of the reductions in the marine and land seismic sectors. To date, our conservative approach to event investment, staffing and running costs has kept us afloat. However, areas such as publications have to be kept under continual review as online possibilities test the economic model. Having said that, the first year of Geoenergy launched jointly with the Geological Society of London has been a success and opens the possibility of establishing the benchmark for publications focused on energy transition.

I trust that I am right in concluding that our Association with all its various event, education, publishing, and worldwide communication endeavours is in good shape to support you, the membership, as together we negotiate the energy transition future. Finally, I hope that during the great upcoming Annual in Oslo I can meet as many of you as possible to thank you personally for allowing me the honour to serve the Association as your president.

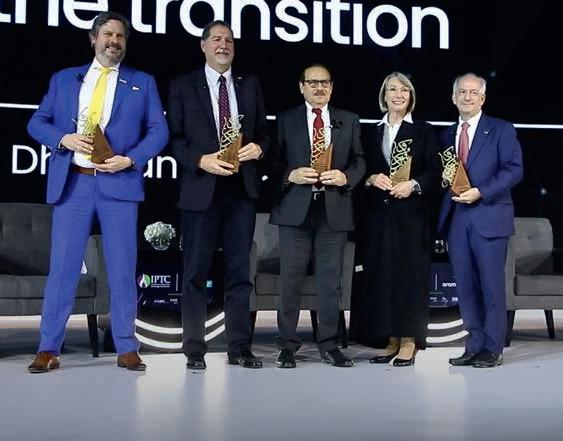
Wiarda (first from left) at IPTC 2024’s Society Presidents Panel.

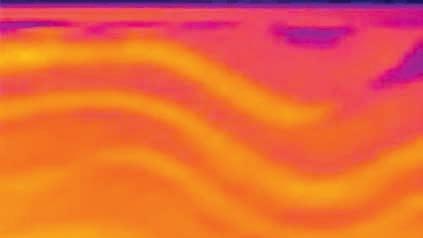
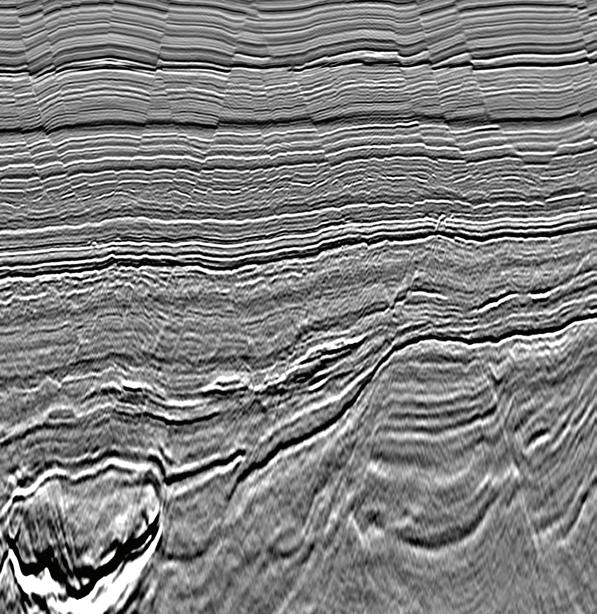
What the MP-FWI Imaging

See the latest jaw dropping DUG MP-FWI IMAGING results for yourself at EAGE 2024.

DUG MP-FWI Imaging completely replaces the conventional processing and imaging workflow, delivering high-resolution reflectivity images for both structural and quantitative interpretation using field-data input. Superior physics. Faster turnaround. Unsurpassed imaging. Now that’s game changing! We’ll be showcasing all the latest results at EAGE 2024 from booth #3200. Reach out to sales@dug.com to connect with our team or drop by to see the daily presentation schedule.

dug.com

Preview our latest showcase for yourself here or visit dug.com

Highlights of what you can expect at this year’s Annual in Oslo

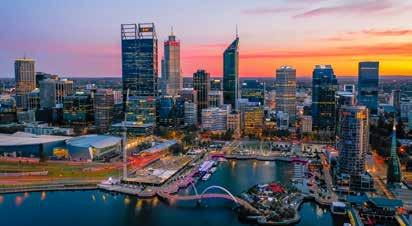
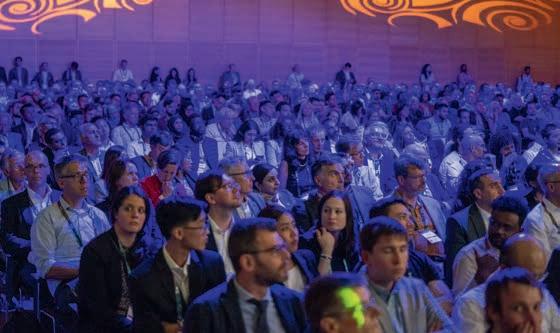
On 10-13 June 2024, the geoscience and engineering community will gather in Oslo for the 85th EAGE Annual Conference & Exhibition, a pivotal event known for its rich history of fostering innovation and collaboration. This year’s conference theme ‘Technology and Talent for a Secure and Sustainable Energy Future’ perfectly encapsulates our purpose and the critical discussions expected at the event being held in Norway, a leader in energy transition initiatives.

Key features at EAGE Annual 2024

Opening Session with industry leaders

Main feature of the Opening Session will be a live interview with Anders Opedal, president and CEO of Equinor, who will talk about his company’s role on the Norwegian Continental Shelf and energy transition initiatives. A discussion on energy transition challenges by a panel of young professionals and the presentation of our annual EAGE Awards are also part of the launch of this year’s event.

Exhibition

With over 90% of the Exhibition space already booked, attendees are assured of encountering an all-in-one dynamic marketplace: get to see the latest advances in many disciplines and interact with industry leaders, innovative start-ups, and representatives from global energy companies and academic institutions. At the same time, exhibitors gain an unparallel opportunity to showcase their technologies and services while engaging with a high-level audience, including key decision-makers actively seeking new solutions and potential investments.

Technical sessions

With an extensive schedule that showcases the breadth of our field, the Technical

Programme will cover everything from traditional oil and gas topics to low carbon solutions like offshore wind, hydrogen, carbon capture and storage (CCS), and more. Attendees will have the opportunity to find out about and discuss the latest research and case studies presented by some of the foremost experts in our industry.

Strategic Programme

This series of open discussions during the week provide delegates with the opportunity to focus on strategic and regulatory challenges involving the energy transition. Topics such as attracting talent, exploration strategy and the technological advancements driving the industry forward are on the agenda, with panels featuring top executives and thought leaders.

Learning opportunities

Look for our expert-led short courses from microseismic monitoring and geologic hydrogen exploration to geothermal energy production and CO2 storage. These sessions offer valuable CPD points and are led by world authorities such as Dr Leo Eisner and Prof Philip Ringrose. Whether you’re looking to enhance your technical knowledge or explore new areas within geoscience, these courses provide a comprehensive learning experience on crucial industry topics.

Hackathon challenge

This year’s Hackathon challenges participants to creatively apply Natural Language Processing (NLP) to geoscience, offering a unique opportunity for professionals and tech enthusiasts to collaborate, innovate, and demonstrate their coding skills in real-world applications.

Interactive workshops and field trips

Experience hands-on learning through our diverse range of workshops and field trips. Confirmed outings include a visit to the ECCSEL Svelvik CO2 Field Lab and the geological wonders of the Oslo region.

Networking opportunities

From the Icebreaker Reception in the Exhibition Hall to the Conference Evening at Bygdøy with its historical museums, the Annual is set to be a hub of networking opportunities. These gatherings are perfect for making new contacts and friends, discussing potential collaborations, and sharing ideas with peers from around the world.

Community engagement

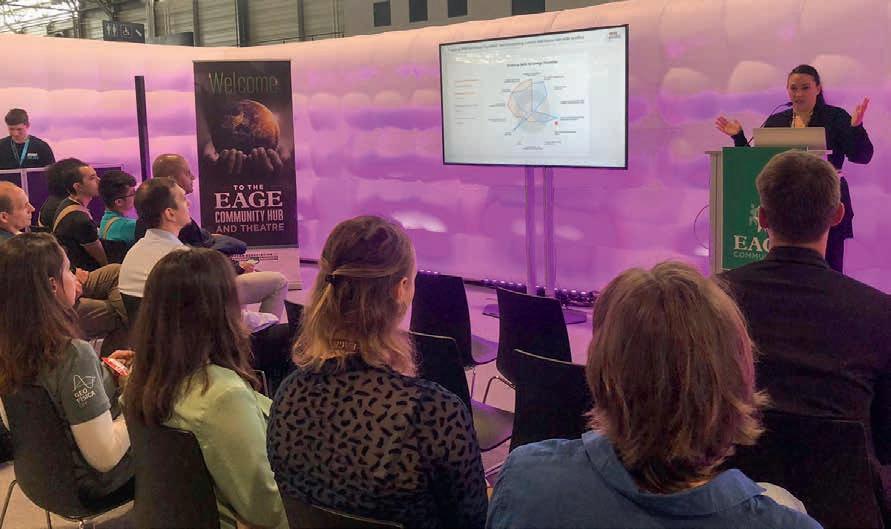
The EAGE Community Hub will be buzzing with activities throughout the conference. Engage with local chapters, special interest groups like students and technical communities, and participate in sessions aimed at career development and industry trends.

Make the most of your visit

As a delegate you can download the EAGE Event App to customise your schedules, access abstracts and presenter bios, and navigate the conference venue efficiently. Be sure to check out the exhibitors showcasing cutting-edge technologies and services that are driving our industry forward.

For more details and last-minute registration, please visit our conference website at eageannual.org. We look forward to welcoming you and exploring the many facets of geoscience and engineering together.

Opening in Vienna.

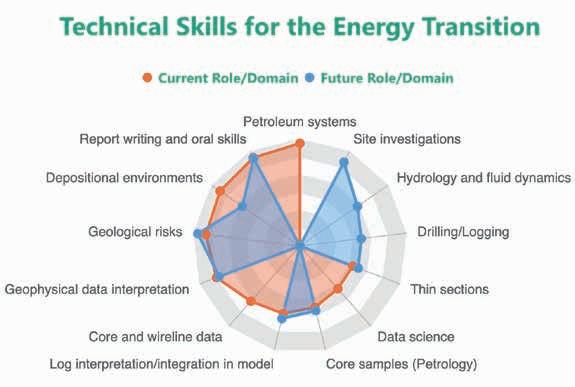
Energy Transition skills tool to be launched at EAGE Annual

For the past few months, representatives from the EAGE Decarbonization and Energy Transition (DET) Communities, in collaboration with the Education Committee, were committed to the task of developing an interactive tool aimed at delineating the requisite skills for successfully navigating a career in the evolving energy landscape. We have great news. The tool is now available to be used by all members.

Wondering how it works? By comparing current and future role skill profiles, the tool attempts to provide our members with valuable insights for their professional development. To begin, simply choose your current and desired future role from a dropdown list. Once you’ve made your choices, the tool will reveal the relation-

ships between the two roles, the technical skills required, and offer recommendations for EAGE educational programmes to acquire necessary competencies. Take into account that the tool will show you the top 10 skills common to both your current and the chosen future role.

Jean-Jacques Biteau, committee member and former EAGE president, explains: ‘All disciplines and skills related to hydrocarbon exploration and production can be directly transferred, slightly or in depth re-adapted. Those professionals wishing to move on the energy transition paths will rapidly identify the skills they need to acquire to achieve this objective and choose accordingly the adapted training programme, so the tool will definitely become a very useful and user-friendly progress for geoscientists.’

Developing the tool, however, was not an easy task. Representatives from the DET communities created an initial list with the disciplines involved in the energy sector, the roles associated with each one of them, and the technical skills needed to perform these roles. The information allowed the team to identify the competencies that could be transferred to energy transition applications, such as CCS, geothermal, wind energy, etc. ‘The Education Committee then undertook the task of linking each EAGE short course to those specific skills, assessing whether

they were fully or partially addressed. This labour-intensive effort will not only benefit the users of the tool, but also provide us with an up-to-date overview of all courses and the opportunity to identify gaps’, Maren Kleemeyer, chair of the Education Committee, says.

In order to ensure that the insights provided by this tool aligned closely with the needs of our members, a survey was prepared to better understand the domains in which they were currently working in and the skills’ mastery required to thrive in their roles. Thanks to the feedback received, the team was able to improve the skills mapping and identify additional areas where geoscientists and engineers could play a role in the energy transition. Thank you to all the members who supported this initiative by answering the survey in the last few months.

Committee member Dr Maximilian Haas recalls that some of the challenges the team had to face included ‘staying abreast of industry trends, integrating diverse skill sets, and creating a user-friendly interface. Moreover, the development process required overcoming the complexities associated with gathering data on emerging technologies and forecasting the skills that would be in demand. Striking a balance between comprehensiveness and practicality in the tool’s offerings demanded meticulous planning and continuous refinement’.

The tool will be in constant development – just like the energy sector – as new skills and roles may be added in the future. The input of members who have not filled in the survey yet will be useful for its improvement.

The tool will be presented at the 85th EAGE Annual during the ‘Interactive Session: Skills for the Energy Transition’, taking place at the Energy Transition Theatre on Tuesday 11 June, at 16:00 CEST.

Check out the tool here

By comparing current and future role skill profiles, this interactive tool aims to aid our members in navigating their personal energy transition journeys.
The idea was presented at last year’s Annual.

Five new Technical Communities focused on the energy transition to choose from

Those attending the 85th EAGE Annual in Oslo will get a chance to hear first-hand why the Decarbonization and Energy Transition (DET) Technical Community has divided itself into five specific topic areas. Look out for the meeting on Thursday 13 June at 14:30 CEST at the Dedicated Session ‘Decarbonization and Energy Transition’.

One of the five new technical communities is Carbon Capture and Storage (CCS). It is a network of members inter-

are included within the remit of the community: electrochemical, chemical, thermal and mechanical, together with discussions and contributions covering the broader elements of natural hydrogen systems, stimulated geological hydrogen production, policy, and emerging energy value chains. ‘EAGE members will gain access to cutting-edge insights and best practices in these dynamic sectors,’ says Dr Maximilian Haas, committee member.

resources, and expanding professional networking opportunities within the wind energy sector,’ committee members Katie Ireland and Benjamin Bellwald say.

Finally, reflecting a broadening of interests and some of the most pressing challenges in the energy landscape, the Technical Community on Critical Minerals was created by joining forces with members from the former Community on Mineral Exploration Geophysics.

ested in all actions (lab research, site analysis, tech innovation, regulations, etc.) enabling greater, faster, and safer CO2 geological reservoirs for achieving negative emissions. Committee member Audrey Ougier-Simonin invites members to get engaged with the group: ‘We’ll share our knowledge (geoscience, engineering, policy…), create a hub for all related skills, and endeavour to become a key network to shape and influence this critical pillar of climate actions.’

The Hydrogen and Energy Storage Technical Community reflects a vital element in addressing the challenges of rising energy demand, intermittent renewable power generation and the requirement to reduce global GHG emissions. The full range of energy storage technologies

The new Technical Community on Geothermal Energy covers advances, trending topics, case studies, and novel geothermal applications, whether shallow or deep, for heat or power production, conventional or not. This includes the cross-uses of technologies and skills from other subsurface uses, and the joint exploitation of geothermal energy and other resources.

An additional perspective is presented by the Technical Community on Wind Energy, a network of members interested in harnessing wind power for renewable energy.

‘We are excited to launch a pioneering community that will foster a collaborative environment for sharing knowledge, accelerating career development with industry-specific

Dr Anna Lim, committee member, emphasises that ‘our intentional multi-disciplinary approach not only reflects members’ diverse interests but also fosters creation of new ideas and a balanced understanding of this complex field. We aim to leverage the committee’s diverse expertise to offer community members thorough insights into the ever-changing realm of critical minerals, covering the entire value chain, especially in energy transition applications’.

To be part of one of our new technical communities, make sure you update your affiliations by scanning the QR code.

Join the new communities

Get up to speed with the evolving energy transition landscape by joining the new EAGE Technical Communities.

Changes at the top for our journals

EAGE is pleased to announce the three new editorial leadership roles appointments for our journals F irst Break , Geophysical Prospecting and Geoenergy, effective from June 2024.

First Break

Clément Kostov takes over from Gwenola Michaud as the new chair of First Break Editorial Board.

Clément Kostov is a consulting geophysicist, based in France, and has served as associate editor for EAGE’s First Break and Geophysical Prospecting and for SEG’s Geophysics. He has co-organised several research workshops and technical sessions at EAGE and SEG conferences. In 2021, Kostov received the ‘Geophysics Reviewer of the Year’ Award from SEG. Kostov has had a 30+ years career with SLB in research and technology development, with assignments as technical expert and as manager, working in the UK, US, France and Russia. Kostov’s interest in applied geosciences began during his undergraduate studies at the École des Mines de Paris and developed through graduate degrees from Stanford University in Applied Earth Sciences (MSc ’85) and in Geophysics (PhD ’90).

Geophysical Prospecting

Alireza Malehmir takes over from Tijmen Jan Moser as the new editorin-chief of Geophysical Prospecting

Alireza Malehmir is professor of applied geophysics at Uppsala University and research director of Smart Exploration Research Centre. He has an undergraduate degree in mining engineering with specialisation in mineral exploration and a PhD in geophysics. He has conducted more than 20 projects for near-surface and CCS applications in Sweden, Denmark, Norway, Portugal, South Korea, etc. Malehmir was the project leader of the award-winning Smart Exploration project and is a co-leader of FUTURE, a European-South African tech-type mineral exploration collaborative project. Malehmir has (co)authored 130+ peer-reviewed journal publications. Occasionally, Malehmir acts as a consultant, through his Nordic Geophysics startup, for utilising innovative seismic imaging solutions for societal applications.

Geoenergy

Sebastian Geiger takes over from Jonathan Redfern as the new editor-in-chief of Geoenergy, our co-owned journal with the Geological Society of London.

Geiger is professor for sustainable geoenergy and Energi Simulation chair at the Department of Geoscience and Engineering at the Delft University of Technology (TU Delft). He worked for 16 years at Heriot-Watt University in Scotland as an Energi Simulation chair. Geiger received a PhD from ETH Zurich in Switzerland and holds graduate and undergraduate degrees from Oregon State University in the US and the University of Freiburg in Germany. Geiger received the EAGE’s Alfred Wegener Award in 2017. He is an elected fellow of the Royal Society of Edinburgh, Scotland’s national academy of science and letters (from 2020), and the Royal Academy of Engineering in the UK (from 2022).

Welcoming the new editors-in-chief, Peter Rowbotham, EAGE Publications Officer said: ‘Journals are recognised as a key benefit to our members. EAGE prides itself on the quality of our journals, which always score highly in Impact Factor assessments. I am delighted to see continued focus on review duration and valuable feedback

to authors for paper enhancements. This is only possible through the voluntary efforts of the whole editorial and reviewer teams who I thank sincerely, and call on all members to consider volunteering their time for the future success of our journals.’

Congratulations to Clément Kostov, Alireza Malehmir and Sebastian Geiger

Our publications for you

and wishing them all the best as they embark on their new positions. Meanwhile our sincerest of thanks go to Gwenola Michaud, Tijmen Jan Moser and Jonathan Redfern for all the tremendous work over the years they have contributed to First Break, Geophysical Prospecting and Geoenergy, respectively.

EAGE prioritises disseminating cutting-edge research and industry insights to its members. Our members benefit from a wealth of resources, including the monthly distribution of First Break, the Association’s flagship publication. In addition, EAGE offers authoritative peer-reviewed journals like Geophysical Prospecting and Geoenergy, alongside Basin Research, Near Surface Geophysics, and Petroleum Geoscience which are available in an online-only format. EAGE members have the option to subscribe

to these journals as part of their membership benefits, ensuring access to the latest developments and advancements in the fields of geoscience, engineering, and energy.

Petroleum Geoscience Geoenergy

GET short courses on the road to energy transition

EAGE Short Courses will play a key part in providing a comprehensive programme at the 5th EAGE Global Energy Transition Conference & Exhibition (GET2024). To coordinate with the themes of GET2024, our short courses will offer an invaluable supplement to the four technical conferences.

In the Exploration of Subsurface Natural Geologic Hydrogen and Stimulation for Its Enhanced Production course, Dariusz Strąpoć will cover the exploration of subsurface natural geologic hydrogen, contrasting its carbon footprint against the price of various hydrogen sources.

EAGE Online Education Calendar

In the Reservoir Engineering of Geothermal Energy Production course, Dr Denis Voskov will lead participants through the fundamentals of geothermal energy production and reservoir simulation techniques, accompanied by practical exercises in Jupyter Notebooks using an open-source simulator.

In his An Introduction to Offshore Wind , Jeroen Godstchalk will offer a comprehensive introduction to offshore wind energy, emphasising the crucial role of geoscientists and offering insights into offshore wind farm development, design factors, and the business case surrounding such projects.

Finally, Prof Philip Ringrose will guide attendees through the intricacies of CO2 storage project design with a focus on saline aquifer systems in the CO2 Storage Project Design and Optimisation (Saline Aquifers) course. From project timelines to monitoring methods, this course provides a holistic understanding of CO2 storage optimisation.

These authoritative short courses are just one more reason to join us at the 5th EAGE Global Energy Transition Conference & Exhibition.

is wind power.

GET2024: An exceptional programme awaits you this November in Rotterdam

Set to take place in Rotterdam on 4-7 November 2024, the EAGE Global Energy Transition Conference & Exhibition (GET2024) is expected to be an event of unprecedented scale and importance.

Attendees are promised an outstanding programme that includes four technical conferences focused on Carbon Capture and Storage, Geothermal Energy, Hydrogen and Energy Storage, and Offshore Wind Energy. This setup will ensure an extensive programme for each of the individual key topics, without compromising GET’s unique focus on cross-uses and integration between energy transition

applications. The event serves as an ideal forum for professionals, geoscientists and engineers, to gather, exchange insights on the latest advancements, and deliberate on the persisting hurdles in these crucial fields.

We invite you to contribute to the Technical Programme and engage with key stakeholders in discussion of the energy transition landscape. The call for abstracts is open until 30 June 2024. Additionally, to make the event more

You are invited to GET2024

accessible, GET2024 will, for the first time, offer free exhibition visitor passes, allowing an even broader audience to engage with major players from the global energy sector. Registration is open, with early bird rates available until 1 September 2024. For more information on the conference, including technical conferences, registration details, topics, and sponsorship opportunities, please visit the website at www.eageget.org.

Yolande Verbeek, chair of the GET2024 Executive Committee and COO of Energy Beheer Nederland (EBN), extends this invitation.

Our chosen conference theme, ‘Accelerating the Path to a Sustainable Energy Future’, encapsulates the essence of our collective mission. It underscores the urgency of our actions and emphasises the pivotal role played by the EAGE community in shaping societies worldwide. Together, we are architects of change, stewards of innovation, and guardians of the well-being of generations to come.

Allow me to highlight two fundamental imperatives:

1. Balancing short-term needs: Ensuring secure and affordable access to natural gas remains a cornerstone of a stable energy system. As we navigate this transition, we recognise the importance of maintaining reliability while simultaneously advancing toward a renewable-based energy.

2. Mitigating carbon emissions: Our commitment extends beyond the present. We acknowledge that a carbon-neutral

society is not a distant dream but an urgent necessity. The geoscientists and engineers among us play a pivotal role in this dual journey – navigating both the fossil fuel landscape and the carbon-free future.

In my capacity as a board member of EBN, I witness first-hand the cacophony of voices in the media – each claiming expertise, each advocating for a different path. I am convinced that our collaboration, knowledge-sharing, and commitment to sustainability will move us ahead.

GET2024 provides a unique platform to engage, interact, and exchange ideas. Let us connect, challenge assumptions, and lay the groundwork for a resilient future. Anticipate a robust Technical Programme – one that bridges disciplines, integrates knowledge, and helps to set a direction toward global decarbonisation.

As we gather in Rotterdam, I look forward to engaging in lively discussions that will influence the field of geosciences in our dynamic and constantly changing world.

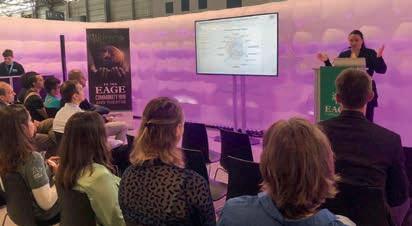
A session at last year’s event.
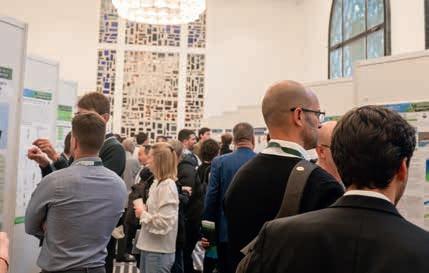
Full poster programme expected.

Stand by for the Laurie Dake Challenge final

We’ve got down to the final six teams who on Sunday 9 June will fight out the final of the Laurie Dake Challenge 2024 in Oslo. The competition began with 28 teams employing their ingenuity to come up with the best net-zero emissions development plan for the Volve field offshore Norway using a data set provided generously by Equinor.

The finalists for the Laurie Dake Challenge 2024 have been announced as University of Stavanger, The University of Manchester, TU ClausthalI, IFP School, Universidade Federal Fluminense and University of M’hamed Bougara Boumerdes.

These top-tier teams have demonstrated exemplary skills, dedication, and creativity throughout the challenge, earning them a spot in the final round. Their final reports

will not only highlight their technical prowess but also underscore their commitment to sustainable energy solutions and net-zero emissions strategies.

Thanks go to Equinor for their invaluable contribution to this challenge, and to the distinguished members of the jury panel – Hedda Elise S. Svendsen (Local Advisory Committee - Equinor), Philip

Ringrose (Local Advisory CommitteeNTNU), Egil Tjåland (Local Advisory Committee - NTNU), Odd Petter Skogly (Local Advisory Committee - Shell), Floriane Mortier (Local Advisory Committee - Equinor), Bill Richards (Chair, EAGE Students Affairs Committee - Dalhousie University), Thomas Finkbeiner (Co-chair, EAGE Students Affairs Committee - King Abdullah University of Science and Technology (KAUST)), Giancarlo Bernasconi (EAGE Students Affairs Committee - Politecnico di Milano), and Clairet Guerra (EAGE Students Affairs Committee - SLB).

The winners of the Laurie Dake Challenge 2024 will be announced during the Opening Session of the Annual on Monday 10 June.

Minus CO2 Challenge 2024 calls upon students to bring geothermal solutions for power generation

This year our Minus CO2 Challenge for students will focus on geothermal electrical power generation in the Netherlands. The

challenge invites students from all over the world to showcase their creativity, problem-solving skills, and geoscience knowledge in developing innovative solutions for geothermal power generation. Whether you’re a budding geoscientist, engineer, or environmental enthusiast, this challenge offers a unique platform to make a real impact on the energy transition landscape.

Participants will have access to valuable resources, expert guidance, and a supportive community throughout the challenge. Detailed information about the challenge, including rules, guidelines,

and submission criteria, can be found on our website at eage.org/students/minusco2-challenge. The application deadline is 21 June 2024.

We encourage students from diverse backgrounds and disciplines to join forces and tackle the pressing challenges of reducing CO2 emissions through geothermal energy. The winning team will not only gain recognition for their innovative ideas but also have the opportunity to present their final report at our prestigious 5th EAGE Global Energy Transition Conference & Exhibition (GET2024).

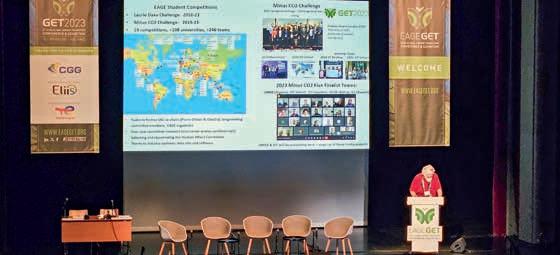
Bill Richards (EAGE Students Affairs Committee chair) recapped last year’s challenge at GET2023 in Paris.
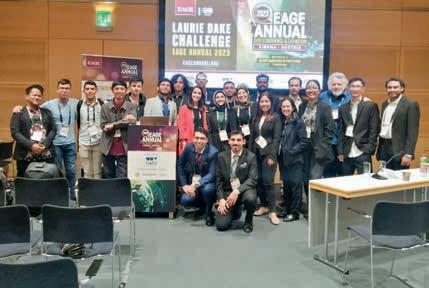
Finalist teams Laurie Dake Challenge 2023, Vienna, Austria.

Mineral Exploration and Mining gets the spotlight at NSG2024

Our 5th Conference on Geophysics for Mineral Exploration and Mining will be an important feature at this year’s Near Surface Geoscience Conference & Exhibition (NSG2024) being held in Helsinki on 8-12 September.

For delegates this will be an occasion to update on the exciting potential of mining interests of Fennoscandia covering several countries. The region, known for its vast natural resources, faces unique challenges in mineral exploration, notably the exploration of new significant discoveries of base

metals and rare earth elements (REE) critical for advancing green technologies and achieving the Net Zero By 2050 target.

Fennoscandia’s unique geological features and potential for significant mineral discoveries make it a focal point for the conference. Discussions will cover not only the technical aspects of mineral exploration but also the environmental and safety considerations that accompany mining in such a diverse region. The blend of academic insight, industry innovation, and regulatory perspectives promises a comprehensive overview of the current state and future possibilities

of mineral exploration and mining in Fennoscandia.

This year’s NSG2024 full programme includes: three parallel meetings (30th European Meeting of Environmental and Engineering Geophysics, 4th Conference on Airborne, Drone and Robotic Geophysics, and 5th Conference on Geophysics for Mineral Exploration and Mining), three workshops (Digital Outcrop Modelling, Transient Electromagnetic, and Hard Rock Physics). Field trips are being planned, more details will be released soon.

Register now via eagensg.org and join us in forging new frontiers in geophysics and mining.

First Symposium on Geosciences for Sustainable Energy in America provides much to experience

The First EAGE on Geosciences for New Energies in America is set to take place in the vibrant city of Mexico City during the second semester of 2024. This ground-breaking event will encompass dedicated sessions on key topics, including Geothermal Energy, CCS, Water Management (with a focus on water footprint), and the pivotal role of Mineral Exploration.

The symposium will also offer valuable opportunities for professional development with the inclusion of the Third EAGE Workshop on Near Surface Geoscience & Mineral Exploration in Latin America and the Third EAGE Workshop on Geothermal Energy in Latin America. These workshops invite researchers, scientists, and industry professionals to

submit abstracts and contribute to the advancement of knowledge and innovation in these critical areas.

A bonus will be the planned additional side event activities, such as short courses and an interesting field trip, which promise to enhance the overall symposium experience.

This first symposium will be offering valuable exhibition opportunities for companies operating within the geosciences and renewable energy sectors. The exhibition space will serve as a hub for companies to demonstrate their contributions to advancing the field and promoting sustainable energy solutions in the Americas. As an exhibitor you can showcase your organisation’s innovations, projects, and

services to a diverse audience of industry leaders, researchers, and decision-makers.

The First EAGE Symposium on Geosciences for New Energies in America is not just an event; it intends to be a significant milestone on the journey towards a sustainable and resilient energy future. Save the date and join us in Mexico City.

Beautiful sunset over a field in Santa Fe, New Mexico.
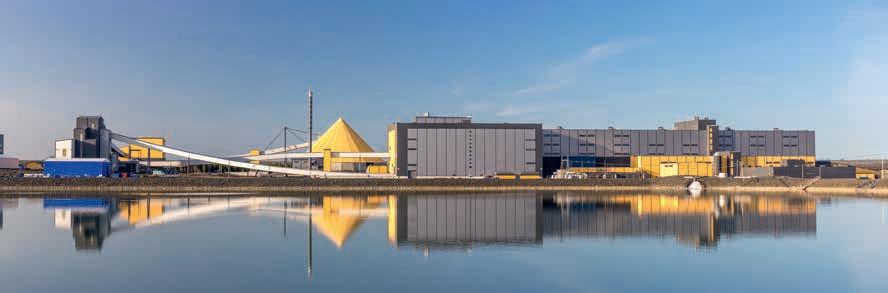
Boliden Kevitsa is a multimetal open pit mine operating in one of Finland’s biggest mineral deposit areas.
Blötberget iron-oxide mine (Ludvika Mines) in central Sweden is a subject of a renewed exploration for iron ores and associated rare earth elements (REE).

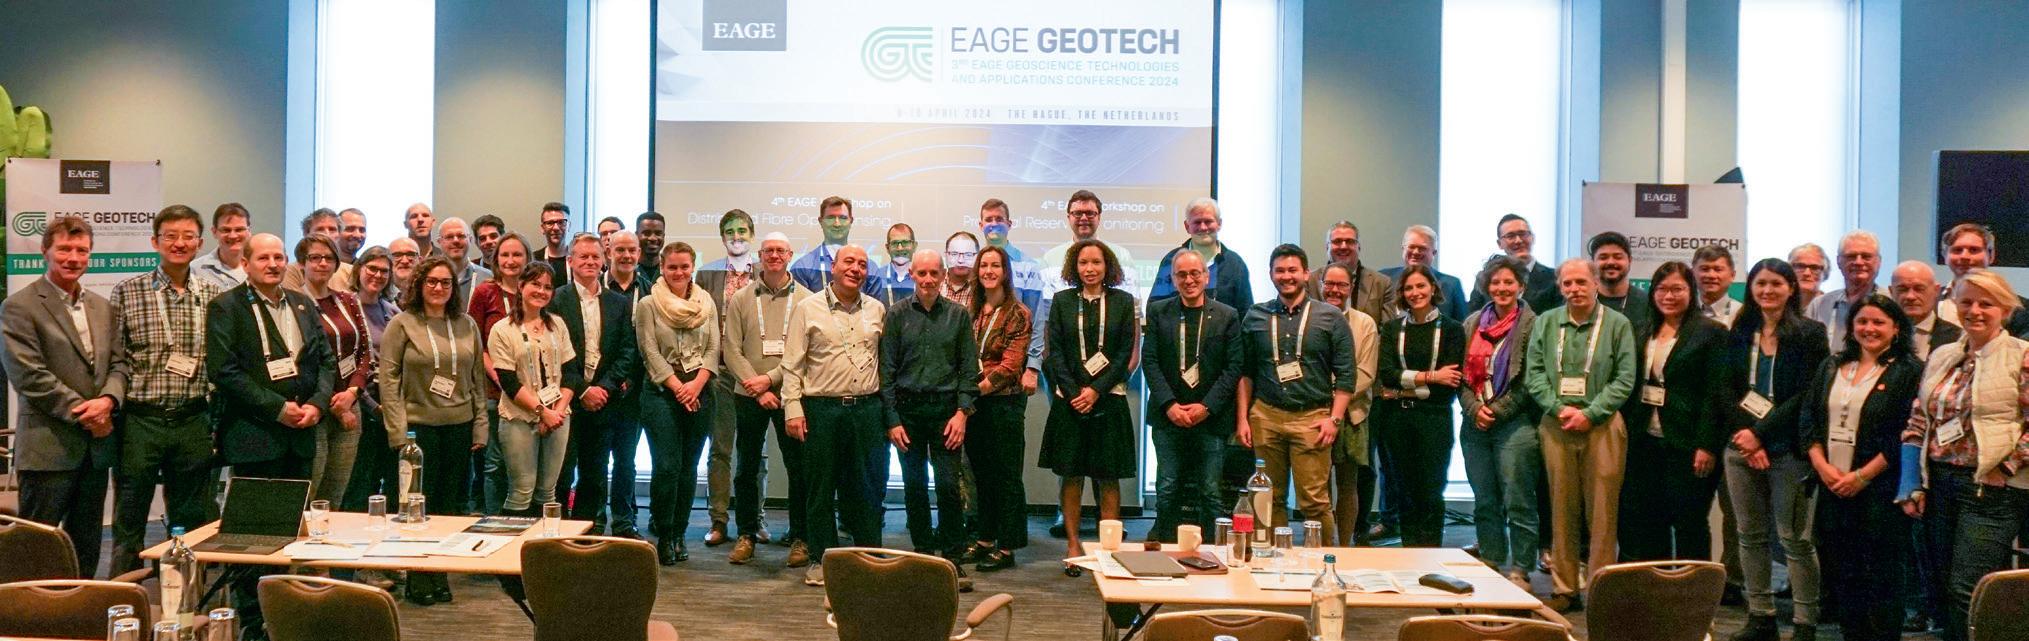
Fibre-optic sensing and practical reservoir monitoring prove rewarding topics for GeoTech 2024

Mahmoud Farhadiroushan (Silixa) and Mark Thompson (Equinor) report on the Third EAGE Geoscience Technologies and Applications Conference (EAGE GeoTech 2024), held on 8-10 April in The Hague, the Netherlands.

While GeoTech was originally conceived during the time of the Covid pandemic, in 2021, whereby three workshops were run online and in parallel, the most recent edition of GeoTech investigated the potential to join two separate topics, but with overlapping interests. So this time we ran the 4th EAGE Workshop on Distributed Fibre Optic Sensing and the 4th EAGE Workshop on Practical Reservoir Monitoring coalescing around one joint event.

We had over 70 participants, from over 15 countries, and over 30 presentations and posters, representing academia, the vendor community and operators meeting for three days. They were able to

share, discuss, and investigate learnings and ideas in the intimate format that a workshop can provide.

The initial one-day course on distributed fibre optic sensing (DFOS) covered a wide range of topics including the fundamental principles of the physics behind the technology, the manufacturing processes for fibre optic cables, by Bill Jacobsen (AFL) and investigated potential applications of the technology by Mahmoud Farhadiroushan (Silixa). Live demonstrations of fusion splicing and OTDR testing of optical fibres were kindly provided by Vincent Volmer and Coen Vandal from Maunt Netherlands and for measuring strain curvature using DFOS by Vincent Lanticq (enabled by video conferencing from the FEBUS Optics test centre in Pau).

After the course, the workshop kicked off with three keynote speakers setting the scene for the rest of the workshop.

Alex Calvert (TotalEnergies) discussed, with examples, the potential for seabed based distributed acoustic sensing (DAS) to provide cost effective passive and active monitoring solutions for both carbon capture and storage (CCS) and oil and gas business cases. Hilde Nakstad (Alcatel Submarine Networks) presented the broader range of applications that fibre optic sensing can serve, while David Kessler (Seismic City), rounding off the

day, demonstrated the potential for imaging uplift of seismic data using advanced imaging techniques.

The second, fully packed, day started with a session investigating the broad application space that DFOS can be applied to, connecting the themes of temperature, borehole, and water. Athena Chalari (Silixa) started the session with a range of examples where fibre has been used for geothermal applications. Keeping to the theme of temperature Maciej Kłonowski (PGI) shared his experiences using distributed temperature sensing (DTS) to log geological boreholes in Poland. With the borehole of continued interest, Isabelle Pellegrini (Ziebel) presented how DAS could be used for profiling two-phase water-oil flow in a horizontal well, while Destin Nziengui Bâ (Institut des Sciences de la Terre) presented an experiment that has used seismic interferometry on DAS data acquired, passively, to monitor a water storage basin in Lyon. Broadening the theme beyond DAS, Chin Tee Ang (Herriot Watt University) shared experiences using advanced machine learning to predict structural and stratigraphic elements from seismic data. Evolving the theme and focusing in on the use of DFOS for seismic in borehole applications, an extended session was started by Brett Bunn (Geospace) who

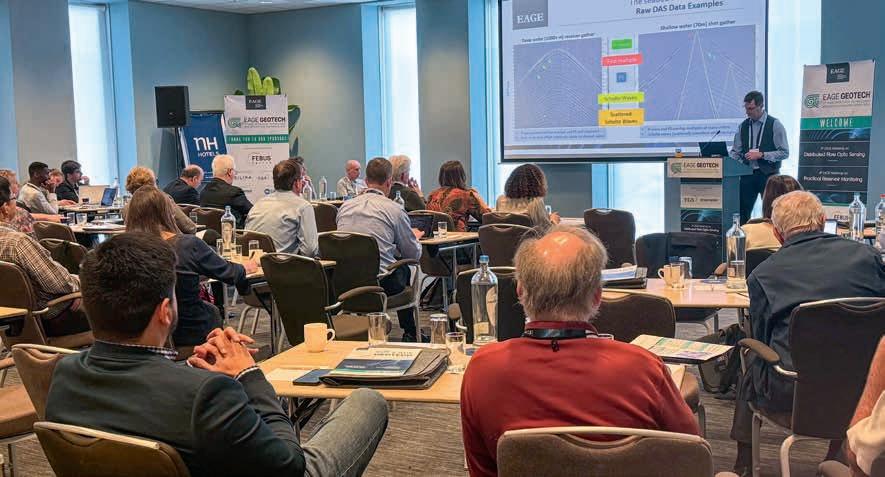
The conference was a great success with lots of fruitful discussions.
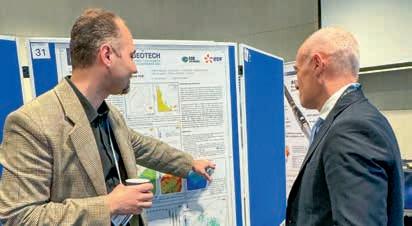
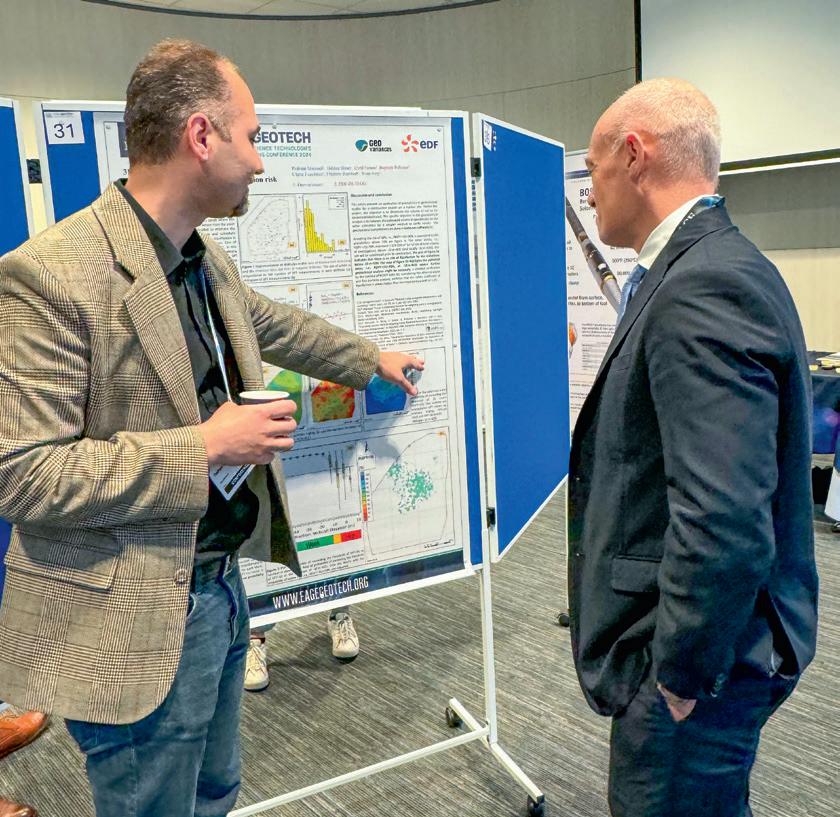
A delegate presenting his research at the poster session.

shared results from a newly developed fibre optic multi-component point sensor deployed for vertical seismic profiling. This was followed up by a presentation from Sebastien Soulas (Avalon Sciences) who showed the results of a comparative test of different DAS interrogators against multi-component VSP in controlled experiments at their borehole test facility in Southwest England. Next, Rafael Guerra (SLB) demonstrated the use of DFOS integrated into a suite of logging tools such that VSP could be acquired in a vertical exploration well in the North Sea without the need for a dedicated VSP operation. Harry Moore (CGG) refocused the session towards monitoring by presenting results of the use of DFOS for timelapse (4D) VSP at the Johan Sverdrup field. Keeping to the theme of monitoring, Boris Boullenger (TNO) showed how DAS could be used for seismicity, investigating the ability to derive moment magnitude from strain measurements in a borehole. Bringing the session to a close, Mirko Van Der Baan (University of Alberta) shared insight into the use of low frequency DAS, in a monitoring well, to observe the behaviour of fracture propagation during hydraulic fracturing treatments.

The third and final day of the workshop saw, again, three keynotes starting the day. This time from the operators, Equinor, Petrobras and Shell. Mona Hanekne Andersen (Equinor) reflected on the ever-changing role of reservoir monitoring in response to the energy transition. Paolo Schroeder Johann (Petrobras) followed on with the history of the broad deployment of ocean bottom seismic in Brazil, especially for pre-salt carbonate reservoirs in ultra deep water. Closely following Paolo, Samantha Grandi (Shell) detailed the concept for On Demand Ocean Bottom Nodes (OD OBN).

Measurements on the seafloor were further investigated by presentations encompassing gravity measurements, seafloor deformation and ocean bottom seismic measurements using DFOS. Hugo Ruiz (Reach Subsea) presented the experiences of using timelapse gravity to monitor gas fields and CCS. Filipe Borges (Reach Subsea) followed on from Hugo with a complementary presentation on the accurate measurement of seafloor deformation in the Gulf of Mexico to correct for errors in deriving water depth for seismic ocean bottom nodes. Finally in this session Risto Siliqi (Alcatel Subsea

Harry Moore (CGG) again took to the floor as a keynote speaker sharing his experiences gained from seismic imaging and processing of DFOS data. He used the keynote opportunity to describe challenges he has observed in the data he has worked with. Tone Holm-Trudeng (TGS) gave a further keynote on her experiences providing monitoring services while navigating the changing business environment during the energy transition.

Networks) presented investigations into the use of DFOS as an ocean bottom seismic sensor.

The final presentation session started with a talk from Arvid Nottveit (NORCE) who presented a framework to assess the requirements for monitoring of CCS. Continuing on with the theme of CCS, Sandrine David (TGS) showed the potential to use the extended high resolution (XHR) mini-streamers for monitoring the

CO2 plume at the Sleipner field while Cian Ryan (CGG), complementing Sandrine’s presentation, showed not only the challenges encountered in processing such a short offset data, but also the solutions available, again proving that ‘it can be fixed in processing’. Camille Chapeland (TU Delft) presented fibre optic shape sensing that measures strain curvature to derive geometry on a UHR seismic streamer. Mark Schons (Shearwater) rounded off the session with a presentation highlighting 4D QC of streamer seismic data during the acquisition where the QC results were also delivered to the client for ultra-fast track interpretation.

The workshop was characterised by informality and a willingness to investigate and openly discuss the themes and topics presented. Each session was summarised by a discussion with two dedicated panel debates, one investigating how DFOS products could be delivered with quality and at speed, while the second panel debate investigated how the competing needs for oil and gas, CCS and renewables could be addressed in an ever-congested offshore environment. The workshop ended with a poster session combined with farewell refreshments, enabling continued discussions in an informal setting.

We would like to thank everyone who made this edition successful: EAGE event coordination team, the committee members, the staff at the venue, all our sponsors and especially all our keynote speakers, presenters and attendees who showed a lot of enthusiasm and were involved in several interactive discussions.

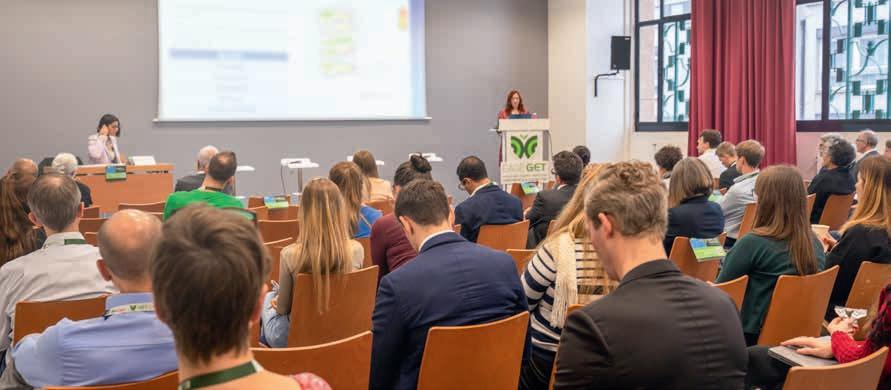
Sharing knowledge during a technical talk.
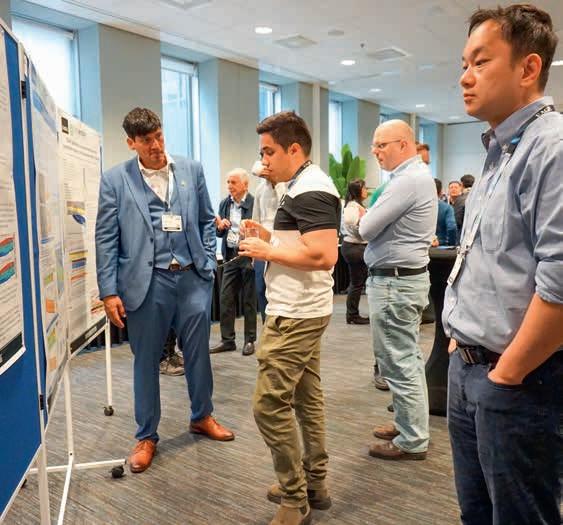
High attendance at the poster session.

Make Perth your August events destination

If you’re looking for a week of events to keep you up to date with the status of the geosciences in the era of energy transition, then Perth, Western Australia this August will be the place to be.

That’s when EAGE is pulling out all the stops starting with the 3rd EAGE Conference on Carbon Capture & Storage Potential from 12-13 August. This promises to be an occasion of critical

discussions around the potential, innovations and strategies related to CCS.

Then we are following up on 14-15 August with two parallel workshops on highly topical themes. The 4th EAGE Workshop on Fibre Optic Sensing for Energy Applications will explore the latest advances including technology trends and case studies. At the same time, we will be introducing the 1st EAGE/SUT Workshop on Integrated Site Characterisation for Offshore Wind in Asia Pacific, part of a global series in collaboration with the Society for Underwater Technology, which will focus on offshore wind development in the region.

These three events set the stage for a knowledge-rich and interactive month in Perth for industry professionals committed to advancing their expertise.

Learn more details

Vlastislav C ˇ ervený student prize applications invited

It is with great pleasure that the EAGE Local Chapter Czech Republic announces the 12th edition of the Vlastislav Červený Student Prize. Since 2011 this student competition has celebrated brilliance in theoretical and applied geophysics with two prize categories for Best Master and Best Bachelor Thesis. New candidates are now welcome to apply until 11 October 2024.

Eligible applications must refer to thesis works defended within the period between 5 October 2023 and 10 October 2024 at any university from the Czech Republic, Slovakia, Austria, Hungary, Germany, Switzerland, Slovenia, Croatia or Poland. The aim of the competition

is to encourage application of scientific knowledge to real problems and innovation. The evaluation criteria include thesis

innovation, presentation of the results and applicability to industry.

The prize is sponsored by the main sponsor Inset and additional sponsors are EAGE (PACE programme), Seismik s., G IMPULS Praha spol and the Faculty of Mathematics and Physics, Charles University. EAGE also contributes to the prize by supporting the prize ceremony in Prague and offering a free online course to each winner from its vast LearningGeoscience education library, to pursue new knowledge and skills.

For more information and applications, make sure to connect with LC Czech Republic or visit www.eagelc.cz/ prize.html.

The EAGE Student Fund supports student activities that help students bridge the gap between university and professional environments. This is only possible with the support from the EAGE community. If you want to support the next generation of geoscientists and engineers, go to donate.eagestudentfund.org or simply scan the QR code. Many thanks for your donation in advance!

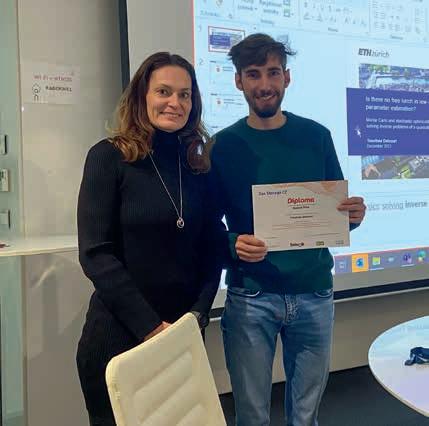
Timothée Delcourt (ETH Zurich) secured the first prize in the 2022-2023 competition with an innovative thesis on low-dimensional parameter estimation.
Perth skyline, Western Australia.

Skiing was not the way to the top Personal Record Interview

Assuming the merger with PGS is approved, Kristian Johansen as CEO of TGS will be heading the largest remaining company in the marine seismic business. From small town northern Norway, his journey to the top has encompassed a potential professional skiing career, study in the US, marrying the boss and experience in the investment banking world.

Upbringing in Norway

I grew up in a small town in Northern Norway called Narvik. My hometown is north of the Arctic circle, which means that I got used to cold and dark winters, but with spectacular nature and midnight sun for a few months every summer. When I was younger, I never understood why people would travel from all over the world to see the Northern Lights, it felt quite normal to me. I grew up in what I would consider an academic home with a dad who was a civil engineer building bridges and tunnels and a mom who was a school administrator and politician. She became the first female mayor of my hometown, which is something I’m still quite proud of.

Skiing aspirations

Sports and particularly cross-country skiing were an important part of my childhood and although I never made it to the Olympics, I represented my country in several international events. I never regretted spending so much time pursuing my skiing career and even today I use a lot of learnings from sports in managing people, performance and understanding the importance of hard work. If you’ve ever competed in a 50 km cross country skiing race, you will realise that most other physical and mental challenges can be managed.

Student years

Recognising that I could never make a good living out of skiing, I was lucky to get a full scholarship from the University of New Mexico to combine university

studies with sports. While climate change was somewhat of a shock, I found school and particularly business studies to be very interesting and I realised that I could use some of my key skills from sports such as endurance, focus and dedication to build a career in business

Early career

I was offered a job with Exxon in Norway before graduating with my MBA and I met my wife (who was actually my first boss) at work. Not sure if that would pass Exxon’s current ‘me too’ guidelines! My career developed fast after a brief career with Exxon and I worked in investment banking in Oslo and London and had two CFO positions with public companies in Norway before joining TGS in 2010.

TGS first impressions

While I had some knowledge about the oil and gas industry from my time at Exxon and working in investment banking, I had a steep learning curve in terms of learning the seismic industry. However, I joined a fantastic company with great people who were extremely supportive and included me in the decision-making processes from day 1. I have come across a lot of companies over the years, but I’m truly convinced that TGS is something very special. I still feel like we’re a big family willing to go above and beyond to help each other succeed.

Difficult times

I’ve been with TGS for more than 13 years and have experienced multiple

up-and-down cycles. While I’m triggered by the competitive nature of the industry and the fact that market conditions change rapidly, I find downsizing and restructurings to be very stressful. Both in 2016 and in 2020, we had to carry out significant right-sizing of the workforce due to external factors and while most people understand why this is needed, it’s always extremely painful for everyone involved.

Way forward

The seismic industry is getting smaller and there are not many companies left. My hope is that we can develop closer partnerships with our clients, think longer term and gradually move from the transactional nature of our relationships today. I strongly believe everyone would benefit from that in the future.

Beyond work

A lot of my time is spent in the office or travelling around the world to see employees, clients and investors. While my 16-year-old daughter still lives at home, my 18-year old son moved to California last year to attend Pepperdine University and play sport on a scholarship (golf in his case), just like his dad. Whenever I have spare time, I love watching him play golf tournaments, play golf with friends or simply spend time with my family. We love the US and our daily life in Houston, and have no plans to move back to Europe. We are privileged to be able to spend our summers in Norway, when Houston gets too hot.

Kristian Johansen

CROSSTALK

BUSINESS • PEOPLE • TECHNOLOGY

Spare a thought for Norway’s early days

A meeting in Norway for our Annual Conference & Exhibition was long overdue. The last time was 2003 in Stavanger, so this year in Oslo is a good moment to remind ourselves of the country’s continuing achievements in the energy resources field not just in the past two decades but focusing much earlier when the possibility of commercial oil and gas offshore was first mooted. Who would have thought that Norway would become such an energy powerhouse, least of all Norwegians themselves.

There are many storylines. For example, sparing no blushes, a number of historians including well-known geology professor Knut Bjørlykke in the Norwegian Journal of Geology have brought up the instance in 1958 when the Geological Survey of Norway at short notice advised the Foreign Office during negotiations on the Law of the Sea that there was no chance of finding oil and along the Norwegian coast. The conclusion was excusable based on conventional wisdom of the time, as per Prof Hans Holtedahl (University of Bergen) who had written in 1955 that that at least part of the nearshore shelf below the thick Quaternary sediments was underlain by basement rocks, a continuation of those on land. In retrospect, according to Prof Bjørlykke, it would have been better to state that there was no information to support or disprove the prospects for oil offshore Norway. He noted that in his student days at the University of Oslo (1957-63) the geology of the North Sea and offshore Norway was barely mentioned in lectures, i.e., petroleum geology was not on the curriculum.

and the UK (allowing subsequent major fields such as the Frigg and Stafjord in the middle of the North Sea to be developed on a shared basis). On April 13 the same year 78 offshore blocks were announced in the first round of licensing.

The oil adventure could not have happened at a better time for Norway. Economic historian Helge Ryggvik in A short history of the Norwegian oil industry (jstor.org) points out that the country was heading for a crunch as cheaper manufacturing in Japan and South Korea was threatening its shipbuilding and shipping interests, a major contributor to the country’s post-war growth. Happily both the capital from Norwegian shipping circles and related technological skill in the shipbuilding industry played an important role when Norwegian firms converted themselves to serve the new oil sector.

‘No chance of finding oil and gas’

Just four years later, doubtless inspired by the discovery of the discovery of the Groningen gas offshore the Netherlands in 1959, Phillips Petroleum came knocking on the Norwegian government’s door seeking exclusive rights to license those parts of the North Sea likely to be included in the Norwegian shelf – with an offer of $160,000 a month.

The idea did not wash with the government which in May 1963 asserted its sovereignty over the Norwegian Continental Shelf and by March 1965 had agreed median lines with Denmark

This has certainly been true for the ownership and supply of vessels to the Norwegian marine seismic business over several decades. The country’s fishing industry was quick to adapt to the technical demands of towed-streamer seismic vessels. Anders Farestveit, legendary CEO of GECO until its takeover by Schlumberger in 1986, and serial investor in Noregian business and technology, said in an interview with First Break in December 2006: ‘Today you can argue that something like 75% of the activity emanates in some way from Norway in terms of operations, research, and equipment manufacture’. The situation is even more marked today with the expectation that a newly merged TGS and PGS will dominate the market with Shearwater GeoServices. What has never been properly appreciated is that Norway’s marine seismic contractors and suppliers did much to facilitate the international oil industry’s push into frontier areas and ability to maximise production from existing resources.

Norway’s oil path was also determined by early political decisions to keep a measure of control over developments. The Norwegian Petroleum Directorate and Statoil (as a participant in all licences) were established as early as 1972. Through various

devices the government in the early days was also able to favour Norwegian suppliers as they entered the market.

Who knows, the referendum in 1972 rejecting membership of the European Community may also have provided more latitude for successive governments in making oil policy in the long-term national interest compared with the UK. which opted to maximise its revenues early (admittedly in different economic and political circumstances). One can only applaud the creation in 1990 of Norway’s oil fund, officially, the Government Pension Fund Global, the largest sovereign wealth fund in the world, now worth some $1.6 trillion and owning 1.5% of all stocks worldwide

First oil in the Norwegian sector was found in 1967 by Esso drilling on block 25/11-1 in 125 m water depth 165 km west of Haugesund. Years later after further drilling this became the Balder field.

The Ekofisk discovery in 1969 on block 2/4 really kicked off Norway’s involvement in the oil business with first oil production in 1971. Today production licences in the Greater Ekofisk Area with numerous satellite field extensions operated by ConcoPhillips have been extended to 2048. Over its life so far, the development’s history has provided something of a microcosm of the achievements, technology challenges and hazards that Norway’s offshore oil industry has had to face. The field was discovered by the ODECO Ocean Viking, a semi-submersible drilling rig, one of the first in the world, built by Norwegian company Aker.

towed out and installed separately at sea. In 1995 the Troll A platform was the last Condeep. At 472 m from lowest point to the top of the flare boom, it was said to be the tallest sructure every towed by mankind.

Over time Ekofisk, or events associated with the field, would be a reminder of the hazards offshore along with the revenues from production.. The original development concept proved fallible. In 1984, Phillips Petroleum found that the platforms and collecting tank in its largest North Sea oil field Ekofisk had sunk 20 feet into the sea bed. To protect the field’s central storage tank, a massive sea wall, a circular concrete structure more than 460 ft in diameter and 350 ft high was built and installed. Measures were also taken to elevate seven of the steel platforms of the production complex.

‘Rig construction was one of Norways’s first successes’

The Ekofisk storage tank also raised the decommissioning issue for these enormous structures, optimistically designed to be refloatable and brought ashore for demolition. That was probably never going to happen, so the tank like the concrete of abandoned Brent and Frigg field platforms is being left in situ. Earlier in April 1977 the worst oil well blowout in the North Sea occurred at the Ekofisk Bravo platform, due to an incorrectly installed downhole safety valve. It caused a leak of an estimated 80,000-126,000 barrels of oil and famously added to the legend of Red Adair and his team who helped to cap the well.

Economic historian Helge Riggvik in The Business History Review, Vol. 89, No. 1 (Spring 2015) identifies rig construction as one of Norways’s first successes once the oil and gas potential offshore Norway was appreciated. In 1974 The first Aker H3 rig was built at a newly established shipyard in Verdal, inside the Trondheim fjord and that year had orders for building 25 rigs, 11 of them on licence from other groups, several in other countries. The majority of that generation of Aker’s semi-submersibles were bought by Norwegian shipowners who also placed orders for different kinds of rig concepts in several European shipyards, thereby building the capacity to dominate the rig market on both the Norwegian and British continental shelves.

The other extraordinary technology innovation in the early development of Ekofisk was the introduction of a massive 236,000-ton concrete tank (designed by French engineering company CG Doris, built in Norway) to store oil when bad weather prevented offshore loading and before a pipeline to Teeside, UK was operational. The concept did not seem so outlandish to many Norwegian firms used to building hydroelectric dams using concrete as the main material.

Norwegian Contractors effectively took over the North Sea market (apart from three ANDOC designs built in Scotland) and over 25 years built 17 of the distinctive Condeep gravity-based production bases with storage upon which topsides could be

Tragedy was to follow on 27 March 1980 when the Alexander Kielland accommodation platform serving the Ekofisk field capsized in stormy seas resulting in the death of 123 of the 212 on board at the time. The accident prompted a major review of structural safety and emergency response. One outcome was the testing of the now well-established free-fall lifeboat at the NUTEC facility, Bergen.

Fifty years or so since that first production started from Ekofisk in 1971, Norway’s achievement in offshore governance, operational competency and advancing technology can be measured by oil and gas having been produced from a total of 123 fields on the Norwegian shelf. At the end of 2023, 92 fields were in production: 67 in the North Sea, 23 in the Norwegian Sea and two in the Barents Sea. Four new fields started production in 2023. The sector accounts for 24% of GDP, 19% of total investments, 36% of state revenues, and 52% of total exports (not including the service and supply industry). Indirectly, the petroleum sector contributes around 200,000 jobs throughout Norway. The country also features a strong energy-related research and academic base.

The challenge now is Norway’s next step – how to fulfil its ambition to be an international leader tackling climate change, reconciling this with its status as one of the world’s largest oil and gas producers and recently one of Europe’s saviours after interruptions to gas supplies following Russia’s invasion of Ukraine.

Views expressed in Crosstalk are solely those of the author, who can be contacted at andrew@andrewmcbarnet.com.

INDUSTRY NEWS

Energy industry confidence remains high despite uncertainty, says DNV

DNV’s annual Industry Insight survey shows that 73% of senior energy professionals are confident about industry growth in 2024, a figure that has remained steady at around 74% since 2022.

However, political uncertainty, as the world readies for a slew of election this year, has been highlighted by the energy sector in DNV’s analysis of the views of nearly 1300 senior energy professionals around the globe.

Rising costs and supply chain disruptions are also threatening the viability of many projects, dampening short-term optimism for electrification and renewables.

The oil and gas sector, in contrast, is witnessing a resurgence in confidence, reflecting the industry’s pivotal role in meeting global energy demand while navigating the transition to cleaner fuels.

Oil and gas sector confidence has risen from 58% in 2022 to 68% in 2024. This recovery reflects the industry’s pivotal role in meeting global energy demand while navigating the transition to cleaner fuels. Established oil and gas companies have also gained from branching out into decarbonisation and renewable energy.

Ditlev Engel, CEO energy systemsat DNV said. ‘Key drivers of optimism include the relentless march toward decarbonisation and electrification, offering

long-term clarity amid near-term uncertainty. The industry’s optimism about the path ahead is well-founded – especially since the requisite technologies are already within our reach.’

While the industry as a whole maintains a positive outlook, specific sectors, such as electric power and renewables, have witnessed notable declines from previous peaks.

DNV’s survey stresses that nearly twothirds of the energy sector views global political uncertainty as the primary threat to success over the coming year. Specifically, DNV’s study reveals that nearly two-thirds (62%) of respondents perceive the 2024 wave of elections and potential policy shifts as one of the steepest barriers

to growth. Political uncertainty, which ranked as the 13th major concern in 2022, surged to sixth place in 2023.

2024 marks a record year for elections, with over two billion people heading to the polls. The prospect of continued policy upheaval is of particular concern in the Americas, with 71% of Latin American and 67% of North American energy professionals highlighting political issues, reflecting the polarised landscape of energy and climate politics. Given its importance to the global energy sector, the outcome of the upcoming elections in the United States holds particularly significant implications for energy industry sentiment and strategic planning, said DNV.

Respondents said cost is the biggest barrier to achieving energy transition.

‘For decades, the energy sector has faced enduring political risks, evolving from localised tensions to global challenges affecting every aspect of the industry’, added Engel. ‘Amidst fluctuating prices, disruptions in supply chains, wavering investor confidence, and shifting regulations, stakeholders stress the importance of maintaining a long-term perspective, anchored in stable supply contracts. A key challenge is to secure lasting regulatory support and clear visibility into the future to rapidly deploy existing technologies.’

Optimism among respondents in electrical power has dipped from 87% to 76%, while renewables have experienced a similar downward trend, from 87% to 78%. This decline mirrors a broader shift in industry growth expectations and organisational confidence, with rising costs and supply chain disruptions posing significant hurdles to project viability and the pace of energy transition. Notably, the electric power industry faces a pronounced shortage of skilled talent, hindering progress in energy transition and digital initiatives, said DNV. Meanwhile, renewables grapple with regulatory hurdles and intensifying market competition.

There has also been a fall in optimism regarding organisational decarbonisation targets, with 62% believing that financial costs are the greatest barrier to reaching the goals of the Paris Agreement.

‘The price of carbon is still too low globally, and the political difficulty of having energy consumers face the cost of carbon in their everyday decisions is one of the reasons why the energy transition will move slower than many people hope,’ said Eirik Wærness, senior vice-president and chief economist, head of global external analysis at Equinor. ‘Carbon border adjustment mechanisms are needed to encourage every government around the world to put a price on carbon. That is easier said than done, particularly in emerging market democracies, where there are so many urgent priorities.’

TGS/PGS merger moves closer

TGS and PGS have confirmed that the Norwegian Competition Authority cleared their proposed merger.

With respect to the UK, the UK Competition Market Authority is still in its phase I review. The deadline for the CMA to announce clearance or phase II review is 11 June 2024.

Kristian Johansen, CEO of TGS said: ‘TGS has had a good dialogue with the Norwegian Competition Authority since announcement of the transaction and is pleased to have received the required clearance. We now look forward to receiving clearance also from the UK authorities in due course, and moving towards completion of the merger’.

Shearwater

Rune Olav Pedersen, president and CEO of PGS said: ‘The Norwegian competition authorities decided in mid-February to assess the TGS-PGS merger transaction in a more detailed phase II review. We are pleased they have now approved the merger’.

The parties continue to expect and work towards completion of the merger occurring during the second quarter of 2024.

Completion of the merger otherwise remains conditional on the closing conditions described in the merger plan. The statutory creditor notice period for the merger has expired, and the shareholders of both parties have approved the merger.

enhances full waveform inversion software

Shearwater Geoservices and Mondaic have entered a strategic collaboration for development and use of full waveform inversion solutions to enhance high-resolution subsurface imaging.

As part of the agreement, Shearwater has acquired exclusive and perpetual rights for the use and further development for subsurface applications of Mondaic’s wavefield simulation and inversion codes. Shearwater has also acquired an equity stake in Mondaic.

‘Holding position as a processing and imaging service provider and further expanding the capabilities of our proprietary processing and imaging software Reveal are central components of Shearwater’s strategy,’ said Simon Telfer, Shearwater’s SVP software, processing and imaging.

Full waveform inversion is expected to play a strategic role for characterisation and monitoring of subsurface carbon storage sites and in site surveys for wind farms, the company added.

Mondaic will be furthering the application of the jointly developed

codes for ultrasonic non-destructive testing, material characterisation, medical imaging, and other non-subsurface applications. During 2024 Shearwater’s acoustic finite differences full waveform inversion will be gradually replaced by Mondaic’s elastic spectral elements code that can model subsurface wavefield and waveforms to the highest level of precision.

‘Due to its unlimited modelling capabilities, this technology offers a higher level of inversion precision than conventional approaches. It is not only computationally efficient but also scalable, catering to a wide range of needs and complexities,’ said Sergio Grion, chief geophysicist – processing technology of Shearwater

TGS will use Mondaic software.

3D Energi wins approval for 3D survey offshore Australia

3D Energi Sauropod 3D seismic environmental plan covering 3447 km2 offshore Western Australia has received regulatory approval from the country’s National Offshore Petroleum Safety and Environment Management Authority (NOPSEMA).

The acquisition and processing of ≥510km2 of 3D seismic data over the most prospective areas of the permit forms a minimum commitment for the primary term work program of WA-527-P.

The approved EP allows for a maximum full-fold acquisition area of 3447km2 over the western half of WA-527-P and provides for acquisition in 2024 or 2025, between January-May (inclusive). The survey acquisition is anticipated to take approximately two months.

Noel Newell, executive chairman of 3D Energi, said: ‘The approval of the Sauropod MC3D Environmental Plan represents an important step forward for the project given the recent regulatory uncertainty surrounding environmental permitting.

3D Energi holds a 100% participating interest in WA-527-P exploration permit, which covers an area of 6580 km2 over shallow Commonwealth waters of the Bedout Sub-Basin, where water depths generally range from 100 to 150 m.. The permit is located 195 km west of Broome, on the Northwest Shelf, adjacent to the 2018 Dorado Discovery and along trend from the recent 2022 Pavo oil discovery.

‘We have long recognised the exploration potential of the Bedout and remain excited about the exploration potential of WA-527-P and the Dorado lookalike features identified within the permit on reprocessed 2D seismic data.

The recent 2022 Pavo discovery along trend from the permit further highlights the prospectivity of these plays along the basin margin, and the prolific nature of the greater petroleum system offshore Western Australia.. The Sauropod 3D will be critical to the full

evaluation of the prospectivity recognised to date and the further delineation of potential drilling targets.’

The Sauropod MC3D is critical to the evaluation of the full prospectivity of WA-527-P, especially for the delineation of potential Dorado lookalike traps identified on reprocessed 2D seismic within the permit,’ said 3D Energi. The Dorado oil discovery in 2018 was the largest oil discovery on the Northwest Shelf in 30 years and has spurred a resurgence in exploration activity in the basin. The trapping mechanism at Dorado involves the erosional truncation of the Archer Formation sandstone reservoirs by large channels, subsequently backfilled with shales during a rapid rise in sea level, and there are strong indications for a northern extension to the Dorado channel system into WA-527-P.

WA-527-P exploration permit and approved Sauropod 3D EP area (red dotted outline).

The EP area for the Sauropod 3D survey also covers several large leads on the western side of WA-527-P, including Salamander which is the third largest undrilled structure in the basin. Some 349 MMbbls of prospective resources (best estimate) has been identified across three main leads, including Salamander, Whaleback and Jaubert. Further exploration appraisal and evaluation is required to determine the existence of a significant quantity of potentially moveable hydrocarbons.

The company is continuing discussions with interested farm-in parties and is collaborating with CGG around vessel availability.

Global M&A activity is set to top $200 billion in 2024, says Rystad

After the biggest first quarter for global upstream dealmaking in five years, the industry could see another $150 billion of merger and acquisition (M&A) deals in the remainder of 2024, says Rystad Energy.

Its research shows that global M&A deal value has crossed the $64 billion mark already this year, representing the strongest first-quarter performance since 2019 and a 145% increase on the first quarter of 2023, fuelled primarily by consolidation in the US shale sector.

Deals in North America totalled $54 billion in the first quarter of the year, about 83% of the worldwide total, with the region continuing to be the driving force for the remainder of 2024, with nearly $80 billion of assets still on the market. The US shale sector is expected to be the engine driving this activity, accounting for 66% or slightly more than $52 billion of assets on the market.

The Permian Basin has dominated recent dealmaking, but other shale plays look set to attract significant investments in the near future, with about $41 billion of non-Permian opportunities on the market. This includes the potential sale of Bakken-focused Grayson Mill Energy, Uinta-focused XcL Resources, ExxonMobil’s Bakken portfolio, EQT’s remaining non-operated Marcellus portfolio and certain Haynesville assets from Shell and BP.

ExxonMobil, Chevron, Occidental Petroleum (Oxy) and Diamondback Energy’s portfolio adjustments are set to invigorate short-term M&A activity. These companies have all made significant recent acquisitions and now plan to divest non-core assets, paving the way for growth among regional upstream players. For instance, Chevron intends to divest approximately $10 billion to $15 billion of assets by 2028, while Oxy plans to divest between $4.5 billion and $6 billion.

Atul Raina, vice-president of upstream research, Rystad Energy, said: ‘The Permian has been the focal point for M&A activity in recent times, but that focus is waning as available assets in the basin become scarce. But with appetite still strong, deal-hungry players are looking outside the basin for acquisitions. A power

shift could be on the cards, with non-Permian assets taking centre stage in the future North American deals pipeline.’

Outside the US, deal activity also remained strong in the first quarter of this year, with $10.5 billion changing hands, a 5% yearon-year increase. This was dominated by oil and gas upstream majors BP, Chevron, Shell and TotalEnergies, which collectively accounted for $5.2 billion. Demand for gas-producing resources is high, representing about 66% of total resources bought and sold in the first quarter of 2024.

Although North America dominated the global M&A landscape, there was notable activity in Africa, with transactions surpassing $5.3 billion, fuelled by oil and gas upstream majors. The largest deal was Shell’s divestment of its 30% stake in the SPDC joint venture in Nigeria to the Renaissance consortium, which includes about 520 million barrels of oil equivalent (boe) of gas resources, for $2.4 billion. The region also witnessed oil and gas majors’ appetite for exploration opportunities, with TotalEnergies acquiring a 33% operated stake in Block 3B/4B offshore South Africa and an additional interest in two blocks offshore Namibia.

South American M&A ticked up in the first quarter of 2024, with a total of $752 million-worth of assets changing hands, said Rystad. This follows a quiet period of dealmaking as only $790 million was spent in the full year of 2023, excluding Chevron’s $53 billion acquisition of US independent Hess. This decline was primarily due to a divestment halt at Brazilian national oil company Petrobras.

However, this halt has fuelled regional growth opportunities, as Brazilian upstream companies are pursuing alternative expansion plans, said Rystad. Merger negotiations involving four of Brazil’s top 10 independents — 3R Petroleum, PetroReconcavo, Enauta and Seacrest Petroleo — are contnuing, indicating a possible consolidation wave to come.

In light of continued fossil fuel demand, Middle Eastern NOCs, including ADNOC, Saudi Aramco and QatarEnergy, are bolstering their gas and liquefied natural gas (LNG) portfolios, allowing them to cut emissions and diversify their domestic economies away from a reliance on oil revenues. ADNOC and Aramco are actively exploring further expansion opportunities in the LNG sector, including potential investments in the West.

QatarEnergy announced the North Field West (NFW) development earlier this year, aimed at boosting Qatar’s LNG capacity to 142 million tonnes per annum (Mtpa), surpassing the previous target of 126 Mtpa. Echoing QatarEnergy’s approach with previous expansion projects like the North Field East and North Field South, the NOC is expected to seek international operators’ participation in the NFW project. Simultaneously, ADNOC and QatarEnergy are pursuing international expansion alongside their longstanding partners, BP and TotalEnergies.

Horisont Energi’s Gismarvik CO2 Hub has been included in the EU list of Projects for Mutual Interest (PMI) as part of the European Nautilus CCS network. The PMIs are cross-border energy infrastructure projects between the EU and non-EU countries.

Consolidation in the shale sector is driving growth.

BRIEFS

German prosecutors are investigating allegations that oil and gas company Wintershall Dea misled the public about its sustainability efforts. The Frankfurt prosecutors’ office has opened a proceeding, which Wintershall Dea claims is unfounded. The group Environmental Action Germany (DUH) filed a criminal complaint in February claiming that Wintershall Dea violated its reporting duties regarding its environmental and climate impact. Wintershall Dea either misrepresented or omitted legally required elements in its annual report, the DUH alleged.

Eni is combining its upstream oil and gas business in the UK with Ithaca Energy in a transaction expected to give the Italian energy major a leading position in the UK Continental Shelf. The merger will close in the third quarter, creating a company with production of more than 100,000 boepd and potential to grow to more than 150,000 boepd in the early 2030s.

The Biden administration has finalised a plan to prevent oil development across more than half of the US government’s petroleum reserve in Alaska.

Petrobras and bp have signed an agreement to promote discussions and collaboration on sustainable fuels, carbon credits, refining and exploration and production. The companies will also collaborate on research and development.

TotalEnergies is acquiring the remaining 50% stake in Malaysian independent gas producer SapuraOMV for $530 million. In January the energy major signed an agreement with OMV to acquire its 50% interest in SapuraOMV for $903 million.

The UK North Sea Transition Authority (NSTA) has fined Perenco $280,000, the highest ever financial penalty it has handed out, for venting 59 tons of gas for more than a month from its onshore gas processing plant at Dimlington on the UK east coast. ‘The company had permission to vent 235 tons from January 1-December 31, 2022, but exceeded that limit on November 6,’ said the NSTA.

European countries sign CCS collaboration agreement

Denmark, Norway, Belgium, the Netherlands, and Sweden have agreed to collaborate on building an infrastructure for cross-border transport and geological storage of captured CO2.

In 2021, Norway and the Netherlands signed an arrangement on energy cooperation around the North Sea, including carbon capture and storage. Similar arrangements are in place between Norway and Belgium (2022) and Norway and Denmark (2023), as well as a joint declaration between Norway and Sweden in 2022. In addition, in 2022 and 2023 Denmark, Belgium as well as Netherlands signed arrangements for the transport and storage of captured carbon across borders.

Now, Denmark, Belgium, the Netherlands and Sweden have established an arrangement on cross-border transport of CO2 with Norway, while Sweden has signed an agreement with Denmark,

‘This removes some of the obstacles on the way to a well-functioning carbon capture and storage-market in the wide North Sea region,’ said the partners in a statement.

‘Storage of CO2 is a cost-effective means of reducing emissions on time to reach the EU climate targets. This cooperation between Norway and the Netherlands on cross-border CO2 transport, is an important step in the development of an open European CCS market. I am

hopeful that this declaration will soon be followed by concrete project between the Netherlands and Norway,’ said Rob Jetten minister for climate and energy in the Netherlands.

Norway’s minister of energy Terje Aasland, said: ‘The capacity is enormous. It is crucial that we put in place solutions for transport of CO2 across national borders. This is an important day for the first full-scale European CCS project ‘Longship’.’

Denmark’s minister for climate, energy and utilities Lars Aagaard, said: ‘In order to decarbonise hard-to-abate sectors, we need carbon capture and storage. In order to reach climate neutrality by 2050 in Europe, we need carbon capture and storage on a larger, international scale. Today’s arrangements are two great steps in the right direction.’

Sweden’s minister for climate and environment Romina Pourmokhtari, said: ‘Beside extensive mitigation, the capture and storage of CO2 will be necessary to curb the climate crisis. CCS and BECCS will play a key role towards the EU’s objective for climate neutrality in 2050 and negative emissions thereafter. Sweden has a great potential för BECCS and we already have projects underway. These agreements are essential for Sweden and its industry in realising a fossil free future.’

Fugro’s net-zero target validated by Science Based Targets initiative

Fugro’s near- and long-term emissions reduction targets have been approved by the Science Based Targets initiative (SBTi). Fugro’s net-zero target spans all three emission scopes towards net-zero greenhouse gas (GHG) emissions across the value chain by 2050.

Fugro’s targets include, among others, an absolute near-term reduction target for scope 1 and 2 of 55% by 2033 compared to 2022, and an engagement commitment

to ensure that 60% of suppliers by spend will set SBTs targets by 2028.

Fugro said it remains ‘dedicated’ to its roadmap, introduced in 2020, to achieve net-zero carbon emission operations by 2035 for scope 1 and 2¹. Examples are the roll-out of Fugro’s uncrewed vessel fleet, and the conversion of its vessel, Fugro Pioneer, to green methanol. www.fugro.com/about-us/sustainability/roadmap-to-net-zero

ENERGY TRANSITION BRIEFS

TotalEnergies and Vanguard Renewables are creating a joint venture to develop, build, and operate renewable natural gas (RNG) projects in the US. The companies will advance 10 RNG projects over the next 12 months, with a total annual RNG capacity of 0.8 TWh (2.5 Bcf). The partners will consider investing in some 60 projects with total capacity of 5 TWh (15 Bcf) per year.

The Danish Energy Agency has awarded contracts to three companies for CCS projects. Together, the projects will ensure the capture and storage of 160,350 tonnes of CO2 annually during the period 2026 to 2032. The agency has entered into a contract with BioCirc CO2 ApS and Bioman ApS for the capture and storage of CO2. The Danish Energy Agency has also awarded a contract to Carbon Capture Scotland Limited.

Horisont Energi’s Gismarvik CO2 Hub has been included in the EU list of Projects for Mutual Interest (PMI) as part of the European Nautilus CCS network. The PMIs are cross-border energy infrastructure projects between the EU and non-EU countries.

CO280 and Aker Carbon Capture have signed an agreement with Microsoft to explore opportunities for scaling the value chain of carbon removal in the US and Canada. The companies will deploy large-scale projects to meet global net zero targets. They will also collaborate to address the technological, regulatory, and commercial challenges and opportunities for creating carbon removal.

The US has announced two offshore wind energy auctions off the coast of Oregon and in the Gulf of Maine.The two sales proposed by the Bureau of Ocean Energy Management (BOEM) have the potential to generate more than 18 GW of offshore wind energy.

AGR has won a contract from geothermal energy supplier Innargi to provide technical consultancy for three geothermal appraisal wells that are being drilled in Aarhus, Denmark.

Canada launches licensing round offshore Newfoundland

The Canada-Newfoundland and Labrador Offshore Petroleum Board (C-NLOPB) has launched a licensing round for the Eastern Newfoundland Region.

Call for bids No.NL24-CFBO1 (exploration licences, eastern Newfoundland Region) consists of 41 parcels and a total of 10,287,196 hectares, 32 of which have been made available under previous calls for bids or relinquishment of lands that have subsequently reverted back to Crown reserve. The remaining nine parcels are new and were designed over Sector NL06-EN, with consideration given to stakeholder input from a previous call for nominations.

Bidding deadline is 6 November, 2024. Licences are expected to be awarded in early 2025. The sole criterion for selecting a winning bid will be the total amount of money the bidder commits to spending on exploration of the parcel during Period I (the first six years of a nine-year licence). The minimum bid for the parcels offered is $10,000,000 in work commitments.

Some of the parcels in this 2024 Call for Bids overlap the Northeast Newfoundland Slope Marine Refuge. The C-NLOPB will continue to work closely with Fisheries and Oceans Canada (DFO) and others in the protection of environmentally significant areas. ‘Emissions-related considerations will be assessed as part of the regulatory review process when companies propose specific plans,’ said C-NLOPB.

The C-NLOPB said it will continue to engage with fisheries stakeholders, DFO, other federal and provincial agencies and other affected stakeholders throughout the land tenure process. ‘Any companies acquiring exploration licences pursuant to this Call for Bids will be required to engage with fishing interests before any oil and gas activities are authorised.’

Based on an assessment of nominations and land tenure considerations, the C-NLOPB has decided not to proceed with a Call for Bids in the Jeanne d’Arc Region in 2024.

Canada is hoping for more deep-water oil and gas exploration offshore Newfoundland.
Photo: Geoff Greenway.

Nigeria launches offshore leasing round

Nigeria has opened its 2024 Bid Round with 12 blocks on offer, six on the continental shelf, four deep offshore blocks and two onshore blocks in the Niger Delta.

PGS is offering multi-client seismic data over 10 of the blocks, from MegaSurvey full-stack PSTM to the currently in-processing Nigeria Vision, a fully reprocessed PSDM dataset, which is accompanied by pre-stack products, and will be available to license in Q3, 2024.

Through depth reprocessing, enhanced imaging of targets can be achieved with improved illumination of complex structures associated with the diapiric movement of the Akata Shale Formation. New modern broadband reprocessing results in seismic data rich in frequency content, with velocity

model building enabling clearer imaging of structures, faults, and traps.

PGS is also offering several recently reprocessed PSTM datasets, including the Nigeria MegaSurveyPlus.

Oil and gas round-up

Equinor has completed appraisal well (7324/7-4) on the Wisting discovery in the Barents Sea. The objective was to acquire data on the reservoir and cap rock, for use in evaluation and development of the discovery. The Wisting discovery was proven in Middle Jurassic and Upper Triassic reservoir rocks in the Realgrunnen Subgroup in 2013. The discovery is being evaluated for development along with the Hanssen discovery in the same production licence. Well 7324/7-4 encountered the reservoir in the Stø and Nordmela formations with a total of 39 m, with good reservoir quality. Extensive data acquisition and sampling have been carried out. Appraisal well 7324/7-4 was drilled to a vertical depth of 870 m below sea level and was terminated in the Fruholmen Formation in the Upper Triassic. Water depth is 396 m.

Shell has reported first quarter earnings of $7.7 billion, reflecting strong operational performance across the business. CFFO of $13.3 billion for the quarter includes a working capital outflow of $2.8 billion. Commencing a $3.5 billion share buyback programme, expected to be completed by

Q2 2024. Cash capex outlook remained unchanged at $22-25 billion.

Vår Energi has discovered oil in the Balder area of the Central North Sea, with estimated recoverable resources of between 13 and 23 million barrels of oil. The discovery has the potential to be tied into nearby existing infrastructure in the Balder area. The Ringhorne North discovery also de-risks more drillable prospects in the area and opens up potential development synergies with other nearby Vår Energi-operated discoveries such as KingPrince and Evra-Iving. The Ringhorne North exploration well and two additional side-track/appraisal wells were drilled by the semi-submersible rig Deepsea Yantai in the Central North Sea, 8 km north of the Vår Energi-operated Ringhorne field, about 200 km northwest of Stavanger. Licence partners are Vår Energi (50%), Aker BP (20%), Harbour Energy (15%) and Sval Energi (15%).

ExxonMobil has made a final investment decision for the Whiptail development offshore Guyana, after receiving government and regulatory

AVO compliant pre-stack data can be licensed as part of these datasets and helps to reveal subtle depositional features, significantly derisking exploration.

approvals. Whiptail, the sixth project on the Stabroek block, is expected to add approximately 250,000 barrels of daily capacity by the end of 2027. The $12.7 billion Whiptail project will include up to 10 drill centres with 48 production and injection wells. ExxonMobil holds a 45% interest in the Stabroek block. Hess holds 30% and CNOOC holds 25%.

Canacol Energy has discovered gas at Chontaduro-1. The Chontaduro-1 exploration well, located on the 100% operated VIM21 exploration and production contract, encountered 123 ft of net gas pay. The well reached a total depth of 9625 ft measured depth. The well encountered 123 ft true vertical depth of net gas pay with average porosity of 21% within the primary Cienaga de Oro sandstone reservoir.

Hibiscus Petroleum’s Bunga Aster-1 exploration well has encountered 17.5 m of oil-bearing sandstone with up to 46 m of potential oil column. Initial assessments indicate good reservoir characteristics. This marks the second significant discovery within a 12-month period, after the discovery of Bunga Lavatera in 2023.

PSTM reprocessing provides a significant uplift in imaging across the structurally complex Niger Delta, said PGS.

Generalised survey optimisation with constraints

Summary

The ultra-long offset ocean-bottom node (OBN) acquisition technique to stabilise full-waveform inversion has already been used successfully in the deep-water US Gulf of Mexico (GoM) characterised by shallow salt bodies hindering accurate earth model building, which is critical for the imaging of otherwise obscured deep geologic structures. Multi-client data acquisition at a large scale in the US GoM are typical and provide a unique opportunity for emerging seismic technologies to be deployed, tested, and developed at scale. One such technology, full-waveform inversion (FWI), has delivered significant improvements in velocity and image quality but can be compromised due to the acquisition parameters and associated costs required to optimise FWI. To reduce the acquisition cost, simultaneous acquisition is preferable, which requires a source separation framework. We propose generating an optimal survey design using the spectral-gap-based rank minimisation, termed as generalised survey optimisation with constraints. The proposed technique is computationally efficient and uses realistic environmental and instrumental constraints to generate source and/or receiver locations, where the acquisition is constrained with random time dithers. Using both synthetic and real OBN data examples from the Gulf of Mexico, we demonstrate the efficacy of the proposed technology over the standard acquisition practices.

Introduction

Seismic data acquisition in the land and marine environments represents a significant investment; thus, producing a cost-effective survey design. Moreover, due to regulatory constraints, we may also need to maintain a separation between subsequent sources while acquiring data in inline or crossline directions. Recent advancements in simultaneous-source acquisition (SSA) have tremendously improved data acquisition efficiency (Beasley et al., 1998, Berkhout, 2008, Moore et al., 2008, Akerberg et al., 2008, Abma, 2010, Hays et al., 2014, Mosher et al., 2014). More recently, SSA has been used to acquire ultra-long offset data (~40-60 km km) with ocean-bottom nodes (OBN). Figure 1 illustrates the survey configuration in the ocean bottom node scenario.

Although the simultaneous source design reduces the cost of surveys significantly, two key challenges remain. The first one is the separation of signal from different sources, also known as deblending, the success of which relies upon the randomisation of interference noise (also known as blending noise) in the timespace domain. The robustness of source separation relies heavily on the differentiation of coherent signal from the interference noise in a sparsity or low-rank-promoting transform domain. Here, low-rank-promoting transformation means a domain where underlying fully sampled seismic data exhibit low-rank characteristic, i.e., fast decay of the singular values. This differentiation is highly controlled by the survey design, which brings us to

1 SLB

* Corresponding author, E-mail: rajmittal09@gmail.com

DOI: 10.3997/1365-2397.fb2024043

our second challenge. Often the survey design is sub-optimal; thus, different sources can either generate strong interference noise overlying the strong coherent signal, termed as a strongover-strong phenomenon, or the strong interference noise on the weak coherent signal, termed as strong-over-weak phenomenon (Kumar et al., 2021). Optimising the survey design to increase the randomisation in interference noise is key to successful source separation and especially important for the preservation of the low frequencies that are actively used by full-waveform inversion (FWI). Here, we address the second challenge of producing an optimal survey design for simultaneous source acquisition following the principle of compressive sensing (Cand`es et al., 2006). Our method exploits the fact that dense seismic data

Figure 1 Illustration of ocean bottom node survey.

exhibit sparse or low-rank structures in a transform domain. When we subsampled the underlying dense data, depending upon the sub-sampling pattern, data should exhibit less sparse or high-rank structure in the transform domain (Kumar et al., 2015).

From a sampling perspective, this translates to improving the connectivity of edges of a bipartite graph; thus, a large spectral gap (i.e., the gap between the first and the second singular value), guarantees the optimal signal recovery using sparsity or rank minimisation techniques under certain incoherence properties (Bhojanapalli and Jain (2014)). Here we propose a global optimisation strategy to minimise the spectral gap to generate regular or irregular seismic survey design with random time dithers, i.e., optimising off-the-grid sources and/or receiver locations for seismic data acquisition.

The proposed method is inspired by the recent work of Zhang et al., 2022, 2023 where authors demonstrated a rank minimisation framework to optimise on-the-grid survey design. The underlying idea is to evaluate the spectral gap of the sampling matrix organised in a domain where we expect seismic data to exhibit low-rank property. Here, we create a sampling matrix by assigning one at the locations where we acquire the data and zero at the locations where we are missing the data. Note that the computation of spectral gap involves performing singular value decomposition (SVD) over the sampling matrix. Even though the optimisation framework generates optimal grid locations, one needs to project these locations on a periodic grid to evaluate the survey design. The sampling of the periodic grid depends upon the minimum interval between two subsequent sources among all possible sources present in the optimised design. For example, during the survey design, if the minimum sampling between two subsequent sources is 0.5 m, then the underlying periodic grid needs to be sampled at 0.5 m to evaluate the survey design. The design of denser sampling grid to compute spectral gap becomes computationally expensive when we are designing a survey over hundreds of kilometres of survey area. Apart from the computational burden, in practice we face instrumental constraints, such as not being able to activate sources that are close to each other due to the limitation of the compressor, or not being able to change the distance between multiple air guns separated in the crossline direction situated on the same boat during the acquisition. We also see environmental constraints, i.e., restriction on the amount of energy generated at any point during acquisition; therefore, we are unable to activate multiple sources together. We call our method Generalised Survey Optimisation with Constraints (GSOC), which we explain in the next section.

Generalised Survey Optimisation with Constrains (GSOC)

To overcome the computational burden of evaluating the survey design with the practical constraints, we propose to solve the following non-convex combinatorial optimisation problem for off-the-grid subsampling mask :

The underlying framework follows the fact that an optimal survey design exhibits a small spectral gap ratio (SNR), which is the ratio of the first to second singular values (López et al. (2022)). As the ratio becomes smaller, the underlying design has larger spectral gaps, which means the underlying sampling design exhibits maximum randomisation in the transform domain. Here, is source locations, is receiver locations along x and y-directions, respectively, and r represents the underlying subsampling ratio for sources and receivers. In equation (1), represents the singular value of the underlying mask in the transform domain ( ), where the data exhibit sparse or low-rank structure, represents a multidimensional, off-the-grid Fourier transform, which maps data from an unstructured subsampling grid to a dense periodic grid. The first reason behind using the offthe-grid Fourier transform is that the spectral gap ratio of the underlying grid does not change if evaluated in physical domain or Fourier domain, as the Fourier transform conserves energy and is orthogonal in nature. The second reason is that we need to form a matrix to estimate the singular values; it is impossible to construct a matrix using off-the-grid locations in the physical domain as compared to the wavenumber domain, where the off-the-grid Fourier operator generates a regular grid. If we want to construct a matrix in the physical domain obeying offthe-grid locations, we need to create a highly dense sampling grid as proposed in Zhang et al., 2022, 2023, which makes the evaluation of equation (1) computationally expensive.

subject to

While solving equation (1) to find optimal unstructured grid locations, we impose a couple of constraints. The first one, i.e., imposes the fact that the outcome of the optimisation problem should maintain the desired number of subsampling ratio r, denoting the rounding off operation. The second constraint constitutes a couple of spatial sampling constraints, such as (i) the idea of jittered sampling (Hennenfent, & Herrmann (2008)), which is defined to control the gap size between the source-receiver locations during the survey design process; (ii) random dither spatial location to incorporate off-the-grid randomness within spatial distance from the underlying on-the-grid locations, where off-the-grid randomness could be inline or crossline; (iii) user-defined spatial location constraints, i.e., and to ensure that two sources along a sail line or two source lines next to each other in the field are never activated within spatial distance or , respectively; (iv) The third constraint ensures that the underlying mask is a binary mask with a value of either zero or one at each of the survey locations. Ultimately, the optimal survey design lies at the intersection of all these constraints. We can also add different constraints as we face different acquisition obstacles in equation (1). Note that, although equation (1) optimises the survey design on spatial locations, given a boat speed, the same parameters can be optimised over acquisition time also. To solve equation (1), we use the simulating annealing (SA) algorithm (Kirkpatrick et al., 1983; Zhang et al., 2022), which can approximate the global optimum of a combinatorial optimisation problem within a com-

Figure 2 (a) Periodic source locations (red dots) and (b) optimised source locations (blue dots) using the proposed technology. (c, d) Point spread function in the Fourier-wavenumber domain for the survey design shown in (a, b) respectively. Note that the green line in (c) represents the location of true signal in the Fourierwavenumber domain.

putational budget using probabilistic techniques. Figure 2a shows the sampling pattern where sources are activated on a periodic grid and Figure 2c shows its corresponding point-spread function representation in the Fourier-wavenumber (FK) domain. As evident, due to the periodic sampling, we observe aliasing artefacts in the FK-domain. Figure 2b shows the optimised survey design

using the proposed methodology where red dots show the new locations after optimisation and Figure 2d shows the associated FK spectrum. As evident, randomisation in the source locations turns aliasing into noise, thus stabilising seismic data processing (Hennenfent et al., 2010).

Experiments and results

To demonstrate the benefits of the proposed methodology to create an off-the-grid survey design for simultaneous source acquisition, we evaluated it on both synthetic and real field data scenarios from the Gulf of Mexico. In both acquisition scenarios, we design the survey as consisting of a two-vessel acquisition, with three sources (i.e., triple source) on each vessel. The underlying sampling assumption for nodes is 1200 m by 1200 m, whereas the sources are acquired with 50-m by 100-m sampling in inline and crossline directions. Conventionally, three sources on each vessel are either activated approximately every 16.66 m in a flip-flop-flap manner or simultaneously in a flip-flip-flip manner with 1 s of time dither. In flip-flip-flip acquisition, we also impose a constant time delay of 500 ms, which is applied between sources to ensure that multiple sources are not activated simultaneously in the field. We compare the flip-flop-flap and flip-flip-flip models with the optimised survey design using the proposed technology. We call flip-flop-flap model I, flip-flip-flip model II, and the optimised survey design model III in the rest of the paper. In this survey, a 2-km distance is maintained between vessels.

Figure 3 Survey design evaluation of the synthetic model generated using the Gulf of Mexico model. (a, b, c) Input blended, (d, e, f) source separated results and (g, h, i) difference between ground truth and source separated signal for model I, II and III respectively.

Figures 3a, 3b and 3c show the blended data generated using models I, II and III, respectively, using a complex synthetic model from the Gulf of Mexico. We can see that model I generates a strong-over-weak phenomenon (Figure 3a), where strong coherent noise overlies weak signal in the deeper time section, whereas model II generates a strong-over-strong phenomenon (Figure 3b), where strong coherent noise overlies strong signal in shallow time sections and weak coherent noise is imposed over weak signal in deeper time sections. Kumar et al. (2021) showed that models I and II result in the most difficult deblending tasks and describe how and why standard sparsity-promotion-based deblending technologies may struggle in such scenarios. Moreover, the authors presented a novel multistage deblending solution based on prior information about the wavefield that can reduce the sensitivity to the shooting strategy and produce stable source-separation results. In this experiment, we want to compare the quality of source separation by comparing it to the ground truth and show

how the improvement in survey design impacts the preservation of strong and/or weak coherent signal buried beneath the strong interference noise. Figure 3c shows that producing the optimal source location with the lowest SNR makes a drastic difference in how the interference energy appears over the coherent signal of interest, i.e., the interference energy becomes randomised and no longer localised in the temporal-spatial window. Therefore, it increases the chances of producing an optimal source separation result. Figures 3d, 3e and 3f show the source separation results, whereas Figures 3g, 3h, 3i show the difference between ground truth and source separated data. We can clearly see the signal leakage generated by model I (Figure 3g) and II (Figure 3h), whereas the proposed survey design mitigates the signal leakage (Figure 3i).

We finally tested the optimised survey design by acquiring test data in the Gulf of Mexico. The survey consists of a similar configuration of sources as demonstrated in the synthetic study.

Figure 4 Real seismic data acquired in the Gulf of Mexico using (a) flip-flop-flap and (b) the proposed survey design. The proposed survey design randomises the interference noise and overcomes the strong-over-weak phenomenon evident in (a).

Figure 5 Source separation results on the real seismic data acquired in the Gulf of Mexico using (a) flipflop-flap and (b) the proposed survey design. (c, d) Modelled interference noise after source separation for (a, b) respectively. As seen, the proposed survey design provides a better signal-to-noise ratio after separation.

For comparison purposes, we also acquired the data using flip-flop-flap design where we impose 1 s of time dither. Moreover, one of the constraints in the proposed GSOC design is not activating two subsequent sources within 3 seconds, which is because of both the software and hardware constraints from the acquisition system. As a result, we are restricted with creating complete randomisation as suggested by the theory of compressive sensing. This time limitation is known as cycle time in the acquisition system. Note that, as we reduce this cycle time or completely remove it from the design, we can achieve optimal randomisation as per the Compressive Sensing theory. There is one unknown in equation 1 associated with finding the randomised dither values on the spatial locations. We solve the optimisation problem (equation 1) for 10 iterations. The computation burden of finding the optimal grid is small as we are only minimising the survey design without evaluating it using interpolation or source separation technique. Figures 4a and 4b show the data acquired using flip-flop-flap and the optimised survey design generated using equation (1). As evident from Figure 4, we can randomise the interference noise by optimiing the source locations; thus, overcoming the strong-over-weak phenomenon caused by the flip-flop-flap survey. Figures 5a, 5b show the source-separation results using the multi-stage iterative source separation with prior framework (Kamil et al., 2021) and Figures 5c, 5d show the interference noise removed after source separation. The coherent signal after source separation using the optimised survey exhibits a better signal-to-noise ratio (Figure 5b) as compared to the flip-flop-flap design (Figure 5a). Finally, Figure 6 shows a 12-Hz RTM image on the raw data before source separation. The idea is to perform acquisition QC to understand the level of interference noise, which appears as coherent patches. This helps us in improving our understanding of how aggressive we need to be in source separation. As evident, the proposed GSOC design, despite both environmental and instrumental constraints (3 sec cycle time limitation), creates enough randomisation; thus, supporting that GSOC can create optimal survey design for source separation.

Conclusions

The success of the source separation technique relies on the fact that interference noise should appear random in nature in the transform domain. This becomes even more important when interested in the refracted and weaker reflection energy, especially in a salt environment. Current standard simultaneous acquisition generates sub-optimal interference randomisation; thus, extra attention is needed during the source separation process. Here, we

Figure 6 (a) Input data from field, Gulf of Mexico. (b) 12Hz RTM applied using legacy velocity model after basic processing and no deblending for a quick acquisition QC. We do not see any cluster of noise generally created by standard flip-flop-flap acquisition with small dithers. Thus, the proposed design significantly reduces the coherent cluster of noise, a requirement of source separation to preserve weak signal buried beneath the interference noise.

proposed a novel off-the-grid acquisition design termed as Generalised Survey Optimisation with Constraints (GSOC) where we use a rank minimisation technique to generate the optimal acquisition geometry. The new design complements the existing or advanced source separation technique to predict robust signal models. Both synthetic and real data examples from the Gulf of Mexico demonstrate the potential of the proposed survey design technique compared to the standard practice of acquiring seismic data. GSOC technology is now used in production for multiclient surveys in the GoM and has proven to be very important in producing efficient deblending and generating high-quality data for FWI and imaging.

Acknowledgements

We thank Peter Watterson for providing valuable feedback, which improved the quality of this paper. We also thank SLB Multiclient for permission to publish this work.

References

Akerberg, P., Hampson, G., Rickett, J., Martin, H. and Cole, J. [2008]. Simultaneous source separation by sparse Radon transform. 78th Annual Meeting, Society of Exploration Geophysicists, Expanded Abstracts, 2801-2805.

Abma, R.L. [2010]. Method for separating independent simultaneous sources. U.S. patent 2010/003984.

Beasley, C.J., Chambers, R.E. and Jiang, Z. [1998]. A new look at simultaneous sources. 68th Annual Meeting, Society of Exploration Geophysicists, Expanded Abstracts, 133-135.

Berkhout, A.J. [2008]. Changing the mindset in seismic acquisition. The Leading Edge, 27, 924-938.

Bhojanapalli, S. and Jain, P. [2014, June]. Universal matrix completion. International Conference on Machine Learning, 1881-1889. PMLR. Candès, E.J. [2006, August]. Compressive sampling. Proceedings of the international congress of mathematicians (3, 1433-1452).

Hennenfent, G. and Herrmann, F.J. [2008]. Simply denoise: Wavefield reconstruction via jittered under sampling. Geophysics, 73(3), V19V28.

Hennenfent, G., Fenelon, L. and Herrmann, F.J. [2010]. Nonequispaced curvelet transform for seismic data reconstruction: A sparsity-promoting approach. Geophysics, 75(6), WB203-WB210.

Hays, D.B., Walker, C.D.T. and Mahdad, A. [2014]. Blended acquisition and deblending processing of 3D ocean bottom node data. EAGE Workshop on Land & OVN survey. European Association of Geoscientists & Engineers.

Kirkpatrick, S., Gelatt Jr, C.D. and Vecchi, M.P. [1983]. Optimization by simulated annealing: Science, 220, 671-680.

Kumar, R., Da Silva, C., Akalin, O., Aravkin, A. Y., Mansour, H., Recht, B. and Herrmann, F. J. [2015]. Efficient matrix completion for seismic data reconstruction. Geophysics, 80(5), V97-V114.

Kumar, R., Amin, Y.K., Mahdad, A., Narayan, A., Brouwer, W. G., Misbah, A. and Vassallo, M. [2021, October]. Inherent Challenges of Randomized Shooting Strategies on Deblending and a Robust Multistage Prior Based Solution. In 82nd EAGE Annual Conference & Exhibition (Vol. 2021, No. 1, 1-5). European Association of Geoscientists & Engineers.

Kamil, Y. I., Kumar, R., Mahdad, A., Narayan, A., Brouwer, W. G., Misbah, A. and Vassallo, M. [2021, October]. Robust multistage separation of simultaneous sources using priors. In 82nd EAGE Annual Conference & Exhibition (Vol. 2021, No. 1, 1-5). European Association of Geoscientists & Engineers.

López, O., Kumar, R., Moldoveanu, N. and Herrmann, F. J. [2023].

Spectral Gap-Based Seismic Survey Design IEEE Transactions on Geoscience and Remote Sensing

Moore, I., Dragoset, B., Ommundsen, T., Wilson, D., Ward, C. and Eke, D. [2008]. Simultaneous source separation using dithered sources. 78th Annual Meeting, Society of Exploration Geophysicists, Expanded Abstracts, 2806-2810.

Mosher, C., Li, C., Morley, L., Ji, Y., Janiszewski, F., Olson, R, and Brewer, J. [2014]. Increasing the efficiency of seismic data acquisition via compressive sensing. The Leading Edge, 33(4), 386391.

Zhang, Y., Louboutin, M., Siahkoohi, A., Yin, Z., Kumar, R. and Herrmann, F.J. [2022]. A simulation-free seismic survey design by maximizing the spectral gap. Society of Exploration Geophysicists, 2022.

Zhang, Y., Yin, Z., Lopez, O., Siahkoohi, A., Louboutin, M., Kumar, R. and Herrmann, F.J. [2023]. Optimized time-lapse acquisition design via spectral gap ratio minimization. Geophysics, 88(4), 1-27.

ADVERTISEMENT

Contribution of frequency and training model on AI-based velocity prediction

Abstract

Velocity model building is important in providing subsurface velocity models for workflows such as seismic imaging and interpretation. Velocity model building techniques, such as ray-based tomographic approaches are not very effective in complex geological settings. Full waveform inversion (FWI) approaches are computationally intensive and sensitive to an initial model. The physics-guided deep learning-based velocity model building, that involves deterministic, physics-based modelling and data-driven deep learning components, is designed to capture the subsurface salt body shapes and locations, with a small amount of training models. In this paper, we discuss the influence of dominant frequency and training models on the velocity prediction by using a hybrid physics-guided neural network method. Our results show that, the higher the dominant frequency, the more accurate the prediction accuracy of the salt body shapes and background information. For more complicated velocity models and real datasets, simple synthetic training models are not capable of capturing the salt body shapes, nor the background information. A more practical synthetic training set with much more smoothed background layered structures is more suitable for predicting complicated models.

Introduction

Velocity model building (VMB) is one of the key steps in hydrocarbon exploration, which is extensively used to build subsurface velocity models for seismic exploration workflows such as seismic imaging and seismic interpretation. As the most desired technique, Full Waveform Inversion (FWI) (Tarantola, 1984; Pratt et al., 1998; Shin and Min, 2006; Pan et al., 2016) approaches are subject to parameterisation and sensitive to the initial models, especially when the low frequency components are missing. The results from FWI can also suffer from cycle-skipping (Leeuwen & Herrmann, 2013; Wu et al., 2014; Borisov and Singh, 2015; Pan et al., 2018; Li et al., 2023). Another commonly used method is ray-based tomographic VMB, which is not very effective in complex geological settings (especially when salt and gas clouds are present) and requires extensive human intervention.

There is a growing influence of artificial intelligence (AI) and deep learning (DL) on geophysical research, particularly in areas such as seismic VMB (Velocity Model Building) and seismic imaging. Convolutional neural networks (CNNs) have gained widespread recognition for their exceptional ability to extract meaningful patterns and features not only from images but also from various structured and grid-like data formats. Specifically, it is extensively used in geophysical imaging processing (Long et al., 2015; Häggström et al., 2019). Nevertheless, a significant challenge in the context of VMB, particularly in the case of 3D VMB, lies in the substantial need for extensive training datasets,

1 PETRONAS

* Corresponding author, E-mail: junxiao.li@petronas.com.my DOI: 10.3997/1365-2397.fb2024044

often numbering in the tens of thousands of 3D training models. Physics-guided techniques have been introduced to limit the network’s behaviour, enabling reasonably accurate predictions to be achieved with a smaller set of training models. For example, Wu and McMechan (2019) introduced a framework where FWI is incorporated into a CNN structure, employing a multi-layer neural network. Sun et al., (2020) presented a theory-guided approach to waveform inversion, utilising a deep recurrent neural network (RNN) designed to simulate wave propagation. Building upon this work, Sun et al., (2021) proposed a hybrid physics-guided neural network (H-PGNN) design, which combines deterministic physics-based modelling with data-driven deep learning components. They demonstrated that H-PGNN is capable of producing satisfactory results with a reduced need for extensive training models when compared to fully data-driven networks. Rusmanugroho et al., (2022) used a similar approach involving 3D CNN and 3D wave equation-based RNN to improve the velocity prediction in the complex salt structures.

In this study, we delve deeper into the impact of dominant frequency and the training models on velocity predictions using the H-PGNN framework. Our investigation reveals that the dominant frequency has no significant effect on the loss function of data-driven CNN models. However, in the case of physics-based RNN models, we observe that higher dominant frequencies lead to improved predictions regarding properly positioned information such as time/space interval for forward wavefield simulation.

In terms of the training dataset, we employed two distinct sets with varying background layers. Training Set 1 featured fewer background sedimentary layers, while Training Set 2 included a more smoothed background sedimentary structure. Training Set 1, with its simpler background information, was effective in capturing salt body shapes and boundaries under uncomplicated geological conditions. However, for more complex velocity models and real datasets, the simplicity of Training Set 1 rendered it ineffective in capturing salt-related information. In such scenarios, a more practical synthetic training dataset, exemplified by Training Set 2, proved to be better suited for velocity model predictions, particularly in complex geological settings.

Method

The seismic inversion in data-driven deep learning CNN can be expressed as:

where, in the given context, the variables are defined as follows: ‘k’ represents the number of velocity models, ‘d’ stands for the observed seismic shot gather, ‘T’ corresponds to the total recording time, ‘t’ denotes the time step within the recurrent neural network (RNN); signifies the number of sources per subsurface model, and represents the forward propagation of the waveform RNN. The variable is a minute value employed to prevent division by zero.

The objective function for the H-PGNN is thus expressed as (4)

where, denotes the observed seismic data. The function represents the nonlinear connection between the input data and the estimated subsurface property, denoted as . This function encompasses a series of nonlinear transformations with trainable weights . As outlined by Sun et al. (2020), the objective function used to quantify the disparity between the estimated velocity and the true ground-truth velocity model m) is expressed as follows:

where, and are the trade-off parameters for the model and data misfits, respectively. Based on equation (3), the waveform RNN forward propagation is related to the wave propagation parameters such as source wavelet, dominant frequency, time and space step and so on. In the following session, we will test the influence of the dominant frequency on the velocity model prediction.

Impact of dominant frequency on velocity model prediction

where, the subscript ‘m’ serves as a notation indicating that the function is related to the model, while ‘n’ represents the number of paired samples within the training data distribution. In equation (2), the estimated surface models are derived by inputting shot gathers ‘d’, with no dependency on the dominant frequency. In the context of the physics-based recurrent neural network (RNN), as described by Sun et al. (2021), the objective function can be formulated as follows:

To assess the performance of networks trained with varying dominant frequencies, we generated a dataset consisting of 2000 synthetic velocity models, referred to as ‘synthetic training set 1’. Within this set, 1500 models were allocated for training, while 400 models were designated for testing in each training cycle, leaving the remainder for validation.

In Figure 1, we showcase ten velocity models extracted from the validation set as representative ground-truth examples in the top row. In this representation, the colour in red denotes the presence of salt bodies. The subsequent rows display velocity predictions corresponding to dominant frequencies of 10 Hz, 15 Hz, and 20 Hz, respectively. Notably, Figure 1 demonstrates that the approximated locations of salt bodies and their internal

Figure 1 Comparison of the ground-truth (the first row) and the estimated velocity models using dominant frequency of 10 Hz, 15 Hz and 20 Hz (from second to the bottom row), respectively.

velocity values are accurately predicted for each dominant frequency estimation.

However, it is evident that when the dominant frequency is set at 10 Hz, the model struggles to accurately predict the shape of salt bodies. A substantial improvement in salt body boundary prediction is observed as the dominant frequency is increased to 15 Hz. In the bottom row, where the dominant frequency reaches 20 Hz, both salt boundary prediction and background information predictions are notably enhanced.

This analysis leads to the conclusion that a higher dominant frequency corresponds to improved accuracy in property and positioning information prediction.

Impact of training model on velocity model prediction

The synthetic training set 1 comprises velocity models featuring salt formations overlying relatively simple background sedimentary layers. To assess the effectiveness of velocity model predictions under varying sedimentary structures, we applied training set 1, characterised by a dominant frequency of 15 Hz, to a collection of 2D velocity models extracted from the 3D SEAM velocity model.

As illustrated in Figure 2, the top row displays ten groundtruth SEAM velocity models. The subsequent row presents the corresponding velocity predictions using a dominant frequency of 15 Hz. Notably, neither the approximate locations of the salt bodies nor the internal velocity values are accurately predicted in this case.

To address these limitations, we generated another synthetic training set, referred to as ‘synthetic training set 2’, which incorporates more smoothly layered background structures. A comparison between these two training sets is depicted in Figure 3. The top row showcases ten representative groundtruth velocity models from synthetic training set 1 (5-15 layers of sedimentary structures, which means the velocity model is coarse vertically), while the velocity models in the second row originate from synthetic training set 2. Despite similar salt body configurations in both sets, training set 2 exhibits more refined

and smoother background sedimentary structures (more than 30 layers of sedimentary structures, which means the velocity model is smoother vertically) in contrast to the relatively simpler backgrounds of training set 1.

In Figure 2, the third row presents the estimation results obtained when training set 2, featuring a dominant frequency of 15 Hz, is utilised. In comparison to the second row, the predictions notably improve, especially in capturing the shapes of the salt formations, particularly in the upper portion.

The bottom row of Figure 2 displays the predicted results when a dominant frequency of 20 Hz is employed for training set 2. These results exhibit even greater fidelity to the details of the SEAM model, particularly in its deeper regions. Training models with smoother background layers can yield more accurate prediction results. This phenomenon is likely to be attributed to the smooth vertical background velocity layers present in the ground truth of SEAM. In this context, the velocity undergoes gradual changes in the vertical direction, a characteristic commonly observed in real velocity datasets. Consequently, the misfit calculated from the shot gathers generated using a training set with smoother background layers is considerably smaller compared to that from a set with coarser background layers. As a result, the contribution of the physics-guided term to the misfit is significantly reduced, leading to improved prediction outcomes.

In order to demonstrate the quality of data reproduction using the estimated velocity model depicted in the final row of Figure 3, we conducted a forward wave propagation simulation and presented the results in Figure 4. In this visualisation, the top row displays the authentic shot gathers derived from the ground-truth velocity models. The second row exhibits the estimated shot gathers derived from the velocity models predicted in the last row of Figure 3. The bottom row illustrates the discrepancy between the ground truth and the estimated shot gathers. Overall, most of the main events can be matched with the ground truth shot gathers. The events at the bottom for both ground truth and predicted shots are artificial reflections from boundaries.

Figure 2 Comparison of the SEAM data ground-truth (the first row) and the second row are the estimated velocity models using training set 1 with a dominant frequency of 15Hz, the estimated velocity models using training set 2 with a dominant 15 Hz and 20 Hz are shown in third and last row.

Velocity model prediction for real data set

Subsequently, training set 2 was employed in Velocity Model Building (VBM) for a real dataset. In Figure 5, we present a series of 2D velocity models extracted from the 3D Mexico Block 26 salt velocity model, which serves as a benchmark, displayed in the top row. These models were obtained through extensive processing, including pre-stack time migration and Full Waveform Inversion (FWI), utilising conventional velocity model building techniques that often require significant human intervention.

The second row showcases the prediction results when synthetic training set 1 is applied, while the third row displays the

estimated velocity models when synthetic training set 2 is utilised, both with a dominant frequency of 20 Hz. In the outcomes obtained using training set 1, the delineation of most salt areas falls short when compared to the ground truth in the first row. This limitation can be attributed to the presence of coarser background layers (5-15 background geological layers). However, it is noteworthy that a remarkable improvement is observed in row 3 when training set 2 is employed. This set incorporates more refined and smoother background sedimentary structures, consisting of more than 30 background geological layers, leading to accurate predictions of a significant portion of salt bodies in each velocity model. In this real data example, we leveraged a total of 2000 synthetic models for

Figure 3 Comparison of the ground-truth velocity models from synthetic training set 1 (the first row) and synthetic training set 2 (the second row), respectively.
Figure 4 Comparison of the ground-truth (the first row) and the estimated shot gathers using training set 2 with dominant frequency of 20 Hz. The last row shows the differences.
Figure 5 Comparison of the conventional velocity models (the first row) and the estimated velocity models using training set 1(second row) and set 2 (third row) with dominant frequency of 20 Hz.

training, with 500 models allocated for testing. The computations were performed using four GPUs, each equipped with 12 GB of memory, and the entire process was completed in approximately two days, spanning 100 epochs.

Comparing the results with the conventional VBM depicted in the top row, the physics-guided deep learning VMB approach yields reasonable predicted velocity models within a relatively short timeframe and with reduced human intervention. It is envisaged that the predictive performance can be further enhanced with the inclusion of additional training models.

Conclusions

The physics-guided deep learning Velocity Model Building (VMB) approach has been developed to effectively capture the shapes and locations of subsurface salt bodies using a limited number of training models. While the fully data-driven CNN term within the loss function remains independent of the dominant frequency of the shot gathers, its impact on the physics-guided RNN term cannot be underestimated.

Our findings indicate that higher dominant frequencies lead to more accurate predictions of salt body shapes and background information. In the case of complex velocity models and real-world datasets, simple synthetic training models struggle to capture salt body shapes and background details. Therefore, a more pragmatic synthetic training dataset characterised by smoother background layers is better suited for predicting complex models.

The physics-guided deep learning VMB has demonstrated its ability to generate reasonably accurate velocity models for both synthetic SEAM data and real datasets, all while requiring less human intervention and a shorter processing period.

Acknowledgement

The authors would like to thank Petronas for the permission to publish this paper.

References

Borisov, D., and Singh, S.C. [2015]. Three-dimensional elastic full waveform inversion in a marine environment using multicomponent ocean-bottom cables: A synthetic study. J. Int. 201, 1215-1234.

Häggström, I., Schmidtlein, C.R., Campanella, G. and Fuchs, T.J. [2019]. DeepPET: A deep encoder-decoder network for directly solving the PET image reconstruction inverse problem: Medical Image Analysis, 54, 253-262.

Leeuwen, T. and Herrmann, F. J. [2013]. Mitigating local minima in full-waveform inversion by expanding the search space. Geophys. J. Int 195, 661-667.

Li, J., Rusmanugroho, H., Kalita, M., Xin, K. and Dzulkefli, F.S. [2023]. 3D anisotropic full-waveform inversion for complex salt provinces. Frontiers in Earth Science, 11, 1164975.

Long, J., Shelhamer, E. and Darrell, T. [2015]. Fully convolutional networks for semantic segmentation: Proceedings of the IEEE Conference on Computer Vision and Pattern Recognition, 3431-3440.

Pan, W., Innanen, K.A., Margrave, G.F., Fehler, M.C., Fang, X. and Li, J. [2016]. Estimation of elastic constants for HTI media using Gauss-Newton and full-Newton multiparameter full-waveform inversion. Geophysics, 81(5), R275-R291.

Pan, W., Innanen, K.A., and Yu, G. [2018]. Elastic full-waveform inversion and parametrization analysis applied to walk-away vertical seismic profile data for unconventional (heavy oil) reservoir characterization. Geophys. J. Int 213, 1934-1968.

Pratt, R.G., Shin, C. and Hick, G. [1998]. Gauss–Newton and full Newton methods in frequency–space seismic waveform inversion. Geophys. J. Int 133, 341-362.

Rusmanugroho, H., Li, J., Daniel Davis Muhammed, M. and Sun, J. [2022]. 3D velocity model building based upon hybrid neural network, Second International Meeting for Applied Geoscience & Energy, 1634-1638

Shin, C. and Min, D-J. [2006]. Waveform inversion using a logarithmic wavefield. Geophysics, 71(3), R31-R42.

Sun, J., Niu, Z., Innanen, K.A., Li, J. and Trad D.O. [2020]. A theory-guided deep-learning formulation and optimization of seismic waveform inversion: Geophysics, 85(2), R87-R99.

Sun, J., Innanen, K.A. and Huang, C. [2021]. Physics-guided deep learning for seismic inversion with hybrid training and uncertainty analysis. Geophysics, 86(3), R303-R317.

Tarantola, A. [1984]. Inversion of seismic reflection data in the acoustic approximation. Geophysics, 49, 1259-1266.

Wu, R.S., Luo, J. and Wu, B. [2014]. Seismic envelope inversion and modulation signal model. Geophysics, 79(3), WA13-WA24.

Wu, Y. and McMechan, G.A. [2019]. Parametric convolutional neural network-domain full-waveform inversion: Geophysics, 84(6), R881-R896.

ADVERTISEMENT

EDUCATION PACKAGES

TECHNOLOGY AND TALENT FOR A SECURE AND SUSTAINABLE ENERGY FUTURE

Submit an article

This month we present an array of papers that demonstrate the industry’s commitment to providing technology and talent for a secure and sustainable energy future.

Julien Oukili et al discuss the value of recent technological advances in seismic acquisition and processing for CCS site screening projects, using multiple case studies from offshore North-West Europe.

Kyle Reuber et al present the seamless merge and calibration of >25,000 km² from four separate, vintage 3D seismic volumes into a single volume interpretation tool.

Mosquera-Rivera et al present a remote sensing analysis to identify potential concentrations of natural hydrogen by observing fairy circles.

Jeroen Hoogeveen et al present a methodology for bringing down the costs of OBN surveys through access to larger numbers of compact nodes with sufficient endurance to allow more efficient survey designs, negating the need for rolling and reducing source effort.

Jonathon Clearwater et al present 3D geological models to define the spatial distribution of rock types in the resource and using insights from geochemistry, geophysics and reservoir engineering data, to indicate reservoir boundaries, flow paths and other key features of the geothermal system.

Alexei Yankelevich analyses legislation and technology options and explains dronebased methane screening, which may significantly optimise current methane detection and quantification surveys.

Élodie Morgan et al explore the relationship between technology and talent in advancing carbon capture and storage solutions while leveraging skills developed in the oil and gas sector.

Nick Tranter discusses how STRYDE is working with global academic institutions to support research in science and sustainable energy.

First Break Special Topics are covered by a mix of original articles dealing with case studies and the latest technology. Contributions to a Special Topic in First Break can be sent directly to the editorial office (firstbreak@eage.org). Submissions will be considered for publication by the editor.

It is also possible to submit a Technical Article to First Break. Technical Articles are subject to a peer review process and should be submitted via EAGE’s ScholarOne website: http://mc.manuscriptcentral.com/fb

You can find the First Break author guidelines online at www.firstbreak.org/guidelines.

Special Topic overview

January Land Seismic

February Digitalization / Machine Learning

March Reservoir Monitoring

April Underground Storage and Passive Seismic

May Global Exploration

June Technology and Talent for a Secure and Sustainable Energy Future

July Modelling / Interpretation

August Near Surface Geo & Mining

September Reservoir Engineering & Geoscience

October Energy Transition

November Marine Acquisition

December Data Management and Processing

More Special Topics may be added during the course of the year.

Seismic-led exploration and characterisation of carbon storage sites

Julien Oukili1*, Nick Lee1, Martin Widmaier1, Omar Baramony1, Roberto Ruiz1 and Eric Mueller1 discuss the value of recent technological advances in seismic acquisition and processing for CCS site-screening projects, using multiple case studies from offshore north-west Europe.

Introduction

In many ways, subsurface projects for offshore carbon storage follow the same principles and geophysical methods that have been employed for decades in the oil and gas industry (O&G). One example of this is the adoption of seismic time-lapse technology to monitor changes in fluid saturation and migration in the subsurface, a technology that has been adopted in both oil field reservoir management and carbon storage monitoring. However, the search for more suitable storage sites does present new challenges and opportunities to the subsurface community, whether that be searching for sites that consider different storage and trapping mechanisms without the need for discrete trap geometries (so-called migration assisted storage) or re-examining areas with no expected access to petroleum charge in underexplored, data-lean areas.

In recent years, north-west Europe there has been more co-located petroleum and CCS (carbon capture and storage) activities, with increased near-field O&G exploration co-existing alongside CCS site evaluation. Northern Lights is probably the best-known example of this, with its close geographical association with the giant Troll field (Furre et al., 2019). The increasing pressure to develop oil and gas reserves has resulted in significant advancements in seismic acquisition and processing technology. This progress has been particularly instrumental in supporting exploration efforts in mature basins, where enhancing the quality of seismic information has been crucial. These advances have spurred the emergence of a growing number of CCS projects.

Using seismic information for site selection

3D seismic data plays a critical role in both the understanding and mapping of the subsurface geology as well as quantifying properties that are relevant to CO2 storage, such as injectivity, trap mechanisms, and fluid migration. Whilst the source rock identification and hydrocarbon migration history may not be as relevant for CCS, many aspects other than trap mechanisms require a far more extensive basin-scale and reservoir-scale understanding such as derisking seals and the complete characterisation of the overburden. Screening for CCS sites using seismic data benefits from large amounts of spatial 3D data points, especially when considering saline aquifers, and from appropriate illumination

1 PGS

* Corresponding author, E-mail: Julien.Oukili@pgs.com

DOI: 10.3997/1365-2397.fb2024045

from the seabed down to the lowest potential injection point, but not as deep as is typical for hydrocarbon source rocks. Fortunately, in the mature Europe basins a large amount of seismic data is available for repurposing.

The seismic industry has already demonstrated that rejuvenating legacy datasets can provide valuable insight for early storage concept studies. Processing technologies have come a long way in reducing the differences in the end results due to different acquisition systems and configurations. However, further developing a CCS site may require more information than is adequate for screening purposes. Still, in some cases, new data acquisition may be required either for more accurate quantification of capacity, further derisking of seals, or for establishing a new reference for storage models and subsequent requirements for monitoring. We review three different case studies from the UK Southern North Sea, the Norwegian North Sea, and the Norwegian Sea, in which data were (re)processed with modern imaging technology. We will highlight the value of the new datasets by focusing on various CCS storage concepts, based on saline aquifer models, but also identify possible areas for improvements as well as mitigating factors and processes.

Reprocessing legacy data at a regional scale for efficient CCS screening

The Southern North Sea (SNS) has a long history of petroleum exploration with production starting in the 1960s (Cameron et al. 1993), and with recent exploration successes it has been identified as a key area to achieve net zero objectives. The SNS Vision project, initiated by PGS in late 2022, exemplifies how the seismic imaging quality from rejuvenated multi-survey vintage data, can be enhanced to provide new products fit for both O&G exploration and CCS screening.

The common final Kirchhoff pre-stack depth migrated (KPSDM) products cover 26 legacy seismic surveys acquired between 1988 and 2006. It consists of approximately 12,000 km2 of 3D seismic data predominantly located in the UK sector and with parts in the Dutch sector, and provides a regionally consistent dataset for both structural, stratigraphic and quantitative interpretation purposes. Both pre- and post-salt intervals, whose depths vary greatly, were the main objectives of the reprocessing,

Incoherence attribute extraction at the top of the Bunter sandstone horizon, from the legacy KPSTM full stack (left) versus the reprocessing results (right) over the Endurance area. The strong incoherence response (orange to white) on the legacy KPSTM is not necessarily consistent with geological events and adds uncertainty to the interpretation of faults and fractures. The phase reversal is better outlined on the latest SNS dataset, as well as the fault system towards the north (arrows).

On the left: porosity prediction rendered in a 300-m interval from Top Bunter, co-rendered with the reprocessed final KPSDM stack (a) and legacy KPSTM stack (b) showing significant changes in the distribution and variation across the sand units and structures. The porosity is extracted over the same interval and rendered in 3D over the full 12,000 km2 reprocessed area (c) with an outline of structures of interest, which are represented in a 3D model (d).

including an extensive velocity model building (VMB) sequence. The reprocessing, on a common grid of 12.5 m x 12.5 m and 2 ms temporal sampling, also addressed several challenges due to the different acquisition systems and geometries, which were amplified by the very shallow water depth (approximately 12-95 m) and the complex geology, all reviewed in detail by Rumyantsev et al. (2023).

Quality improvements were significant at all depths, notably in the modeling and imaging of intra-salt heterogeneities and base salt anhydrites/dolomites, as well as at the deeper pre-salt Rotliegend which is mainly a target for gas exploration. The step change is even more significant in the post-salt section where a significant

focus for CCS ventures is currently put on the Triassic Bunter sandstones and the overburden. Indeed, those intervals were historically poorly focused and therefore insufficiently imaged. The latest improvements are further emphasised by greater clarity of faults, some of which extend from top salt to near surface, a component that is critical for fully assessing containment risks.

Figure 1 shows a significant change in the incoherence attribute extracted at the top of the Bunter sandstones over the Endurance area. The high incoherency response (white values) is spread across the area on the legacy data, likely caused by random noise. The higher signal-to-noise ratio (SNR) in the reprocessed dataset considerably reduces the background trend (blue values)

Figure 1
Figure 2

revealing a clear outline of the Endurance closure which is associated with the phase reversal present in the area. This phase reversal is postulated to be associated with the plugging of the reservoir sand with halite (Gluyas and Bagdu, 2020) and is an important geological feature to map as this has some effect on the site capacity and the CO2 migration.

The main KPSDM results provide reliable amplitudes for quantitative interpretation, which still proves to be a challenge in this post-salt environment due to the scarcity of available well data. Fortunately, a novel approach based on machine learning (Ruiz et al., 2021) allowed the reconstruction of missing overburden well information to support the generation of reliable rock properties (Reiser et al., 2023), in particular for the Triassic Bunter Sandstone Formation BC28, as illustrated in Figure 2.

The geometries of the legacy surveys did not allow a proper imaging of the very shallow near surface (seabed and up to several hundred metres below) in the KPSDM products, due to the inherent lack of very near offset information. Accurate imaging of the overburden is essential for a complete evaluation of CCS sites. Advanced imaging techniques, such as Separated Wavefield Imaging (SWIM, Whitmore et al., 2010) have demonstrated value for exploration (Rønholt et al., 2015) and operation derisking (Oukili et al., 2019), though in the given case studies, the data were acquired using modern multi-sensor towed-streamer systems. Similar applications have been adapted and proven for shallow water ocean-bottom seismic datasets (Anderson et al., 2022), even though the technology was not originally designed for this purpose. The principle assumes a clear separation of

the up- and down-going wavefield which in the case of hydrophone-only streamer systems, may be approximated by making certain assumptions of the free surface and sensor depths and/ or using advanced deghosting methods. Upon generating pseudo up- and down-going wavefields, the imaging technique may be applied in the same fashion to any type of streamer data, to reconstruct shallow, virtually zero-offset, reflectivity information.

The methodology was validated on a subset of the data and the results are illustrated in Figure 3. We can observe an improved resolution compared to the Kirchhoff image and illumination is indeed greatly recovered, revealing structures and amplitude changes of critical value for a more complete derisking of the CCS concepts in this area. We postulate that some of the assumptions in the wavefield separation, such as free surface characteristics, have an impact on the recoverable bandwidth using multiple reflection signals if those characteristics are subject to high variations caused by poor weather conditions that occurred during the acquisition.

The complementary work achieved over the great SNS area, with the inclusion of the near-surface imaging feasibility work, illustrates the significant information that can be extracted from existing data for a comprehensive CCS site screening study, as well as the adaptive thinking that is required to address the challenges with both deep, overburden and near-surface interpretation. Even so, the resolution of the near-surface image provided by this novel workflow is somewhat inferior to more modern fit-for-purpose high-resolution seismic solutions (such as ultra-high resolution or site survey) and the significant age of the dataset introduces

Figure 3 Cross-section and time slices (112 ms) of the KPSDM stack (a and c) and SWIM image (b and d), highlighting the complexity of the structures all the way to the seabed. The clearest sub-horizontal event in the KPSDM section (a) with the white-black-white sequence is not the seabed but a residual imprint of its first surface-related multiple reflection. This artefact has a major impact on the time slice (c). The larger folding is better outlined in the SWIM images (b, d) as well as smaller-scale folding, terminations, and possible faults within, especially on time slices.

uncertainties for accurately quantifying shallow hazards. However, it still provides critical and early insights into the containment risks, in addition to providing a more relevant basis for future work which may include new seismic acquisition and processing programs.

Focusing on new details for CCS storage definition using legacy data

In this second case study, we shift to the Norwegian sector, in the Egersund Basin, located southwest of Stavanger, which is a local deepening between the Norwegian-Danish Basin and the Stavanger Platform in the North Sea. The southern part of the basin has been more recently a high focus for CO2 storage and was included in recent CCS licensing rounds with two awards in 2023.

The Egersund Basin has a small local oil kitchen to the northwest, charging the Yme Field which is situated in the northern part of the basin. The development of lower and middle Jurassic sandstones is partly influenced by the tectonic structuring and salt movement. Later, the Upper Jurassic-Lower Cretaceous tectonic development created a series of NW-SE faults. In the late Neogene period the basin was lifted obliquely eastward and up towards the Norwegian mainland. This is a promising area with good reservoir sands, well suited for containment of substantial volumes of CO2, though with risks associated with the various tectonic episodes.

3D seismic data acquired in 2005, with a hydrophone-only streamer system, was reprocessed in 2013 focusing on gas exploration. The objectives of the recent 2023 reprocessing were to achieve high-quality subsurface imaging for shallow gas exploration purposes down to 4-5 km and CCS. Once again, the

final Kirchhoff pre-stack depth imaging results, supported by a detailed velocity model principally derived using Full Waveform Inversion (FWI), provided significant uplifts in quality for detailed interpretation of seismic amplitudes.

A major difference compared to the previous case study lies in the thick succession of sub-parallel sequences from the overburden down to Triassic intervals, as illustrated in Figure 4. As expected, shallow water depths (around 80-90 m) and a near flat seabed complicate the processing and imaging of primary events whose structures were overlapping with multiples over large extents. In addition, a distinct chalk package with high reflective top and base interfaces generated extra weak periodical interference, mainly in the Jurassic interval. Although the amplitude of those internal multiple reflections is weak compared to water layer multiples, their impact on stratigraphic analysis and amplitude-driven interpretation becomes evident once the latter are well attenuated. Therefore, a comprehensive processing sequence including surface-related and internal multiple attenuation workflows was critical in providing necessary uplifts for CCS characterisation. When comparing the reprocessing to the legacy results, not only is thin layering much better resolved, but fault patterns are also much clearer and better reveal potential leakage pathways across the storage units in various intervals and through the seals.

The seabed and the first 200-300 ms showed distortion due to poor near-offset coverage, as shown in Figure 5. Similar to the first case study, separated wavefield imaging of the near-surface using primaries and multiples aided the processing itself, and effectively removed more interfering multiple energy (Oukili et al., 2015), and now provides a more complete image for overburden derisking (Figure 5).

Figure 4 Intercept (2-term Shuey) volume from the 2013 KPSDM reprocessing (top) and 2023 reprocessing (bottom) illustrating the large successions of sub-parallel packages, from the chalk layer to Triassic units, with a complex Zechstein geometry in the lower part of the images. Residual surface and internal multiple reflections appeared with lower-frequency content and locally high amplitudes in the previous results. The new data show increased resolution, more accurate amplitudes and better clarity of faults, for example at the locations denoted by the blue arrows and in the crops (middle Jurassic intervals).

Figure 5 Time slices at 166 ms of the 2023 final KPSDM stack (a) and 2023 SWIM image (b). Acquisition footprint is no longer visible in the SWIM results. Many features appear different in the two volumes and can be explained by the cross-section displays, KPSDM stack (c) and SWIM (d), where many details are smeared in the KPSDM image (based on primary reflections only) and leave incorrect amplitude signatures, especially along the vertical axis. The SWIM image appears more accurate both spatially and vertically (arrow).

Figure 6 Chair diagram showing a combined spectral decomposition display from the Ile Formation aquifer highlighting the spectacular strand plain geomorphology that can be extracted from the Elephant seismic dataset. Understanding the depositional fabrics allows informed decisions to be made on the orientation of horizonal permeability distributions among other parameters, vital for understanding the behaviour of CO2 in the subsurface.

The prior processing efforts in 2013 achieved substantial improvement for gas exploration, where the requirements were somewhat more isolated and distinct in terms of detection and mapping of seismic amplitude anomalies. The CCS potential in this basin lies in the storage capacity over the thick units of sub-parallel layering where more comprehensive imaging becomes a necessity. Whilst further analysis may reveal the need for additional information and possibly the addition of newer seismic data, the time and costs associated with the extra processes applied in the latest imaging efforts are both insignificant and invaluable for this type of CCS validation project.

Developing new CCS concepts from modern high-quality seismic data

The third case study draws our attention to the Norwegian Sea, an area with continuing O&G exploration. In 2019, a large

multi-client program employed a modern acquisition system with dual-sensor towed-streamer technology and a triple-source setup. Combining the triple-source setup with the high-density streamer spread geometry provided the necessary high level of subsurface detail, that could reveal the potential of the Trøndelag platform. The focus area is located east of the prolific basins of the Halten Terrace and Vøring basin, in intermediate water depth (around 250 m) and closer to the Norwegian shoreline.

The Elephant project, a metaphoric name associated with the actual outline of the survey which may as well represent its size and ambitions, utilises a very extensive (>10 000 km2) high-quality PGS broadband GeoStreamer 3D seismic dataset. It is an excellent example of frontier CCS exploration in practice, where the area in question has not had significant success for petroleum exploration and is relatively sparse in well data. However, the quality of this seismic data is exceptional and ideal for assessing critical

subsurface risks associated with storage site definition. The site itself is focused on up to four lower and middle Jurassic aquifer units and invokes multiple storage mechanisms (solution, residual/ capillary, and local structural/stratigraphic trapping) to target a large gigatonne-scale potential storage site.

Lloyd et al (2021) demonstrated how integrated seismic-stratigraphic mapping can be used for effective seal assessment. Their workflow highlighted the need for high-resolution seismic data to effectively identify and map the immediate seal units overlying the aquifer with separate mapping for the remainder of the overburden (the units >50 m above the top aquifer surface). Figure 6 illustrates both the high-quality and the resolution of this data, which is sufficient to complete accurate and detailed mapping of the seal and overburden units above the top Garn, the uppermost store unit in the Elephant area. Toesets, onlaps and clinoform geometries can all be clearly identified in the overburden and assessed for their capacity to create configurations that might compromise integrity or create future bypass zones for any CO2 that might migrate out of the complex into the overburden. Similarly, faults are extremely well imaged, and these can be mapped with confidence and their impact on top seal and overburden integrity confidently assessed. This data also demonstrates how attributes can be generated to create critical insights into other aspects of the store definition. Particularly relevant in data-lean saline aquifers is the ability to obtain reliable aquifer characterisation insights, which can then be used to constrain geological and simulation models.

Figure 6 shows the presence of a clear strand plain morphology within the Ile Formation, the next aquifer down from the Garn. Reliable ties to cored offset wells mean that integrated seismic and core data provide a robust understanding of reservoir characteristics that can then be applied with high confidence to geological modelling concepts, demonstrating that state-of-the art 3D seismic data and imaging have a crucial role to play in carbon storage site evaluation alongside more traditional methods.

Due to the higher requirements in seismic quality for exploration, especially in the near-field context, and thanks to significant

advances in acquisition and imaging technologies, 3D data that have been acquired and processed in the most recent years are likely to be sufficient for CCS exploration, at least for concept development and screening purposes.

New acquisition designs and baseline considerations for future monitoring

As demonstrated by the case studies above, reprocessing of legacy seismic data can play a major role in CCS site screening and development. However, repurposing existing seismic data may not always be sufficient, especially if the legacy data was acquired with very different imaging objectives in mind, is poorly sampled, and does consequently not lead to a more detailed characterisation of the potential CO2 storage site. Acquisition geometries for tailored new CCS marine seismic projects are constrained by the necessity to image the overburden including the near-surface and, in some cases, also by a shallow water environment. Advanced towing configurations that combine wide-tow multi-source configurations with multi-sensor streamers enable high-resolution imaging from the very shallow subsurface to deeper geological structures in a cost-effective manner. These modern seismic acquisition solutions, originally designed for hydrocarbon exploration with a focus on shallow reservoirs, have been quickly adapted for CCS development surveys (Figure 7) and on a smaller scale for ultra-high resolution 3D site surveys for offshore wind (Cooper et al. 2023; Widmaier et al., 2023).

The relatively shallow targets in typical CCS projects make it possible for new seismic surveys to routinely record the refracted wavefield needed for FWI velocity model building in addition to seismic reflections for reflection imaging. This can be achieved by using longer uniform streamer spreads or high-density spreads in combination with sparse streamer tails. Such solutions are feasible with neither significantly increasing survey cost nor compromising turnaround and have been deployed in recent CCS-related seismic surveys.

Figure 7 Ramform Atlas acquiring a high-resolution seismic survey for Aker BP (operator) and OMV over the Poseidon CCS licence in the Norwegian North Sea in 2023. The configuration consisted of 16 multisensor streamers (less floats than streamers) with 50-m separation and 6000-m length. The wide-tow quad source (floats on the right-hand side) was towed over the front end of the streamer spread.

In the longer term, CCS exploration and development surveys will likely serve as baseline surveys for seismic monitoring of the CO2 storage site. Seismic monitoring is key to detecting the migration of the CO2 in the reservoir and studying the integrity of the seal over time. Densely sampled baseline surveys that provide optimal sampling from near to far offsets can derisk future monitoring objectives and enable seismic monitoring methods based on high-resolution imaging, full waveform inversion, as well as quantitative interpretation. Traditional baseline surveys for monitoring of hydrocarbon reservoirs were often acquired with standard single or dual source arrays and short offsets only. Thus, direct experience transfer from hydrocarbon reservoir to CO2 storage site monitoring for wide-tow multi-source and longer offset streamer acquisition solutions are not necessarily possible. 4D repeatability and detectability requirements in the context of CCS are currently the subject of a major research effort in the industry with a rapid progress in technology development and improved understanding.

Conclusions

Today, seismic exploration for CCS benefits from both the historical data acquired for the O&G industry and the technological progress made for launching new, more complex offshore development projects. In north-west Europe these two industries work hand-in-hand in many areas already. However, there are divergences to be seen, most notably due to the fundamentals of the economics and the scale of currently planned CCS projects and their expected lifespan.

There is yet to commence a large dedicated CCS screening program, where the industry combines technology and resources from both traditional hydrocarbon exploration with the CCS effort for cost-effective screening of large and/or multiple sites. There is no doubt that CCS will play a critical role in achieving net-zero targets, albeit the negative public perception associated with the industry’s own CO2 emissions needs to be addressed with more focused decarbonisation efforts. As such repurposing legacy data from traditional hydrocarbon exploration for CCS is less about shaping a positive legacy of the O&G industry and more about diversification and evolving the industry.

Acknowledgements

The authors would like to thank the SNS Vision, EGB, and Elephant project teams in particular, Dmitry Rumyantsev and Terje Kultom Karlsen for sharing their insights, the many colleagues who participated in discussions on this topic and provided valuable input, and PGS for the permission to publish this article.

References

Anderson, D., Svetlichnyy, A., Zhelanov, V., Oukili, J., Schreuder, S., Taikulakov, Y., Chikichev, I. and Baumstein, A. [2022]. 3D demultiple techniques dramatically improve the imaging of a giant Kashagan reservoir in the ultra-shallow North Caspian Sea. First Break, 40(9), 51-57. Cooper, C. [2023]. 3DHR Seismic Acquisition for CCS and considerations for Windfarm UHR. Seismic 2023, SPE, Aberdeen.

Furre, A.-K., Meneguolo, R., Ringrose, P. and Kassold, S. [2019]. Building confidence in CCS: From Sleipner to the Northern Lights Project. First Break, 37(7), 81-87.

Gluyas, J.G. and Bagudu, U. [2020]. The Endurance CO2 storage site, Blocks 42/25 and 43/21, UK North Sea. Geological Society, London, Memoirs, 52, 163-171.

Lloyd, C., Huuse, M., Barrett, B.J. and Newton, A.M.W. [2021]. Regional Exploration and Characterisation of CO2 Storage Prospects in the Utsira-Skade Aquifer, North Viking Graben, North Sea. Earth Science Systems and Society.

Oukili, J., Jokisch, T., Pankov, A., Farmani, B., Ronhølt, G., Korsmo, Ø., Raya, P.Y. and Midttun, M. [2015]. A novel 3D demultiple workflow for shallow water environments – a case study from the Brage field, North Sea. 77th EAGE Conference and Exhibition, Expanded Abstracts, N114.

Oukili, J., Gruffeille, J.-P., Otterbein, C. and Loidl, B. [2019]. Can high-resolution reprocessed data replace the traditional 2D high-resolution seismic data acquired for site surveys? First Break, 37(8), 49-54.

Rønholt, G., Korsmo, Ø., Naumann, S. and Marinets, S. [2015]. Complete wavefield imaging for lithology and fluid prediction in the Barents Sea. 85th SEG Annual Technical Program, Expanded Abstracts, 4070-4074.

Reiser, C. and Ruiz, R. [2021]. Interactive rock physics for CCS and near field exploration, a UK Southern North Sea case study. EAGE Annual 2023, 84th Conference And Exhibition, Expanded Abstracts

Ruiz, R., Roubickova, A., Reiser, C. and Banglawala, N. [2021]. Data mining and machine learning for porosity, saturation, and shear velocity prediction: recent experience and results. First Break, 39(7), 71-76.

Rumyantsev, D., Mueller, E., Ahmed, M. and Georgy, M. [2023]. Addressing Subsurface Imaging Challenges for Conventional and Energy Transition Ventures in the South North Sea Using Modern Processing Workflows on Merged Legacy 3D Seismic Data. 2023 International Conference and Exhibition (ICE).

Widmaier, M., Roalkvam, C. and Orji, O. [2023]. Advanced 3D seismic crossover technologies between hydrocarbon exploration, CCS development, and offshore wind. First Break, 41(11), 53- 58.

Whitmore, N.D., Valenciano, A.A., Söllner, W. and Lu, S. [2010]. Imaging of primaries and multiples using a dual-sensor towed streamer. 80th SEG Annual Technical Program, Expanded Abstracts, 31873192.

Upgrading vintage data in the Punta del Este and Pelotas basins offshore Uruguay and Southern Brazil

Kyle Reuber1*, Bruno Conti2, Milos Cvetkovic1, Pablo Rodriguez2 and Henri Houllevigue1 present the seamless merge and calibration of >25,000 km² from four separate, vintage 3D seismic volumes into a single volume interpretation tool.

Abstract

The offshore basins of Uruguay and Southern Brazil have a limited oil and gas exploration history. Since the announcements of light oil discoveries on the conjugate margin of Namibia, this area has become an epicentre of interest for hydrocarbon explorers. The Punta del Este and Pelotas basins are considered underexplored and, as such, possess an elevated risk profile. Identifying analogous, conjugate petroleum system elements is a component in the framework to reduce that risk. Additionally,

the calibration and integration of subsurface data in the search for the next hydrocarbon discovery is paramount to a successful wildcat. Here, we highlight the seamless merge and calibration of >25,000 km² from four separate, vintage 3D seismic volumes into a single volume interpretation tool. This allows interpreters to gain a contiguous and unobstructed view and, therefore, an understanding of the regional geologic framework. When integrated with existing 2D data, the merged volume has permitted an improved understanding of the basin’s evolution,

1 TGS | 2 ANCAP

* Corresponding author, E-mail: Kyle.Reuber@tgs.com

DOI: 10.3997/1365-2397.fb2024046

Figure 1 Location map showing the offshore basins of Uruguay and Southern Brazil. Regional structural elements, wells and exploration blocks are also highlighted.

the tectonostratigraphic history and elements of the prospectivity for the region. As oil companies continue to flock to the region looking for the next discovery, advancing tools in the explorer’s toolkit is the key to success.

Introduction

Recent South Atlantic hydrocarbon discoveries on the Namibian margin have drawn the attention of oil and gas explorers back to the basins of Uruguay and southern Brazil. Since 2022, a string of multi-billion-barrel discoveries in the Orange Basin has confirmed functioning world-class Cretaceous petroleum systems. Because early basin histories of conjugate margins are analogous, the South American basins of Uruguay and Southern Brazil (Figure 1) are now considered to contain many of the same petroleum system elements and be equally prospective. A favourable economic and political environment in Uruguay, combined with this new perspective, has led to the entirety of the offshore licence acreage being secured by major global

Survey YF13 (A)

energy players. The December 2023 Brazilian bid round also revealed optimism by operators in the region. In this high-stakes game of hydrocarbon exploration, oil companies seek data and methods to reduce their risk profile while searching for the next giant oil and gas discovery.

This article summarises our regional 3D reprocessing and calibration project results and our observations from the available data library. The results of this study illustrate the importance of regional integration of subsurface data and the application of analogous play concepts that highlight the potential for an oil and gas boom along this margin segment.

Importance of regional data synthesis

Effective interpretation and interrogation of available data involves applying modern seismic processing techniques to extract as much information from the data as possible. The chief goal of calibrating a seismic data library is to permit geoscientists to gain the most accurate understanding and interpretation of the

(B) TO12 (C)

(D)

Figure 2 Map showing licence blocks, layout and acquisition direction (in degrees) of different 3D legacy surveys used in the 3D mega-merge project.
Table 1 Acquisition parameters for 3D legacy surveys.

subsurface, thereby reducing exploration risks. Over a period spanning decades, a reasonably dense grid of 2D seismic reflection data has been acquired in offshore Uruguay and Southern Brazil (Figure 1). Some of these have been renewed through modern processing. Three-dimensional seismic reflection data, by nature, is typically acquired over smaller, high-graded areas or limited to lease block footprints. Offshore Uruguay has four mixed-vintage, mixed-azimuth legacy 3D surveys that were used for this project. These previously discrete volumes have recently been seamlessly merged and calibrated into a single depth-migrated volume. All available seismic and non-seismic data were leveraged throughout the processing and interpretation phases to achieve the most thorough understanding of petroleum systems. This is key as Uruguay and Southern Brazil’s offshore basins can still be considered ‘frontier’ (Figure 1).

Data overview and processing workflows

For this study, we use a comprehensive library of seismic data consisting of 2D and 3D regional datasets for interpretation and attribute analysis. The acquisition of 2D data was sourced from various vintages and most recently reprocessed using modern workflows in 2016. As for the 3D datasets, we have merged and normalised four legacy survey volumes acquired between 2012 and 2017, which were subsequently reprocessed as a standalone, single volume in 2023 (Figures 1 and 2). Details of the main acquisition parameters for each of the four surveys are detailed in Table 1. This table highlights the variability of the parameters and the value derived from a regularised volume for interpretation. Reprocessing aimed to obtain the maximum quality from the data, minimise the noise, and extract the full bandwidth, with specific attention to recovering the lower frequency signal, compared to the legacy processing. This ensured that we had a

sufficiently high signal-to-noise ratio to support velocity model building and imaging. This was achieved by first focusing attention on effectively attenuating noise on the pre-stack gathers and then addressing the source and receiver side ghosts. Attenuating the noise prior to de-ghosting ensures that the various signal processing steps to extend the bandwidth of the data only boost the signal. The reprocessing of the 3D data is described in further detail by Reuber et al. (2023). The result of these mega-merge projects produces a single, high-resolution interpretation volume that greatly reduces risk.

The approach of modern pre-processing workflows utilised de-ghosting and extensive de-multiple passes. The four surveys were normalised in terms of amplitude and phase, using the 2012 survey ‘C’ (Figure 2) as the benchmark. The vintage data quality of this survey was deemed higher than the remaining three and, therefore, served as the reference volume. Offshore Uruguay is well-known to have challenging acquisition conditions involving rough weather and strong currents, and as such, additional de-noising efforts were required.

Seismic velocity model building was employed through a tomography-based approach. For the initial phase of this process, the water velocity function is derived from onboard direct temperature and salinity measurements and then laterally smoothed and averaged across the volumes. This function is then laterally smoothed and averaged. For this project, this vertically varying function with lateral variations has initially failed to flatten gathers at the water bottom level sufficiently. Consequently, long-wavelength water column tomography was introduced to enhance gather flatness and improve imaging at the water-sediment interface. The initial vertical transverse isotropy (VTI) model was derived from underlying 2D data (Figure 1). Interpreted regional surfaces guided this stage of

3 Kirchhoff PSDM stacks and velocity overlays showing: A) ‘before’ DM FWI application and B) ‘after’ DM FWI updates.

Figure

the model building: 1) water bottom; 2) Eocene unconformity; 3) Top Cretaceous; and 4) regional ‘economic’ basement. These underlying 2D models were constrained by satellite and marine gravity and magnetic data, providing an appropriate starting model for the regional-scale size of the survey. The next steps involved two passes of reflection-based tomography, aided by interpretation-driven edits around several large submarine canyons. Reflection-based tomography remains the primary tool in our model-building workflow because it facilitates gradual, geologically plausible data-driven updates with short turnaround times. Extensive post-processing techniques are applied in the conventional Kirchhoff Tilted Transverse Isotropy (TTI) Pre-Stack Depth final migration and post-processing phases. Quality control checks are performed on these models and migration results at each stage of the workflow in order to maintain AVO fidelity. These steps ensure a seamless, high-density, high-resolution dataset suitable for exploration and development purposes.

Dynamic matching full waveform inversion

With the intent to deliver ‘drill-quality’ data, a subset of data is extracted for testing purposes in a more detailed model-building phase. This smaller volume is processed via a proprietary dynamic matching full waveform inversion (DM FWI) model-building phase. This stage also includes high-resolution shallow hazard imaging. The subset cube is positioned between surveys A and B (Figure 2) (Pralica et al., in review). To test the effectiveness of the workflow, the area selected was identified as a ‘worst-case’ scenario due to its relatively shorter maximum offsets of 6 km and 7 km, respectively. Additionally, this region is characterised by strong seasonal currents and complex bathymetry, resulting in the lowest Signal-to-Noise ratio (SN) compared to the rest of the survey area.

The DM FWI workflow was implemented across four frequency bands, progressively working from the lowest usable frequency up to 15 Hz. The initial velocity model for FWI is derived from a tomography model, which is regionally constrained and guided by interpretation. Borehole and drilling data from the Raya X-1 well (Figure 1), the only well within the 3D coverage, is also integrated at this stage. Limitations due to acquisition offset and azimuth required additional updates in the final band of DM FWI with post-DM FWI long-wavelength tomography alongside additional model conditioning.

A clear uplift can be observed when comparing the before and after results between Kirchhoff Pre-Stack Depth Migration (PSDM) stacks with velocity overlays and the application of DM FWI (Figure 3). Arrows within Figure 3 indicate where DM FWI updates have notably enhanced imaging quality, predominantly coming from fine-scale adjustments throughout the sediment overburden. Detailed improvements are also noted in the shallow basement section, which is thought to be composed of basalt flows with intercalated sedimentary units. Neither standard tomography applications nor detailed interpretation can produce the details revealed by DM FWI (Seet Li et al., 2023).

In addition to resolving shallow gas accumulations and Bottom-Simulating Reflectors (BSR), the updated models provide vertical and lateral delineation of deep marine sediment systems in terms of velocity contrasts and lithologies (Figure 4). Enhanced imaging within the subset cube is also visible in the deeper Cretaceous section, where a higher frequency of faults, primarily polygonal, is apparent due to slower velocities. In the deeper section, while similar vertical updates are observed, some of these details were smoothed out as they may represent artifacts rather than real geological features. Similar steps to scale back details were taken in the deepest part of the subset model, particularly at the top of the basement. At that interval, updates do not markedly improve or degrade the image or gather flatness.

Seismic attributes

The analysis of seismic attributes has been shown to be effective as an interpretation tool to resolve subtle geological features, lithologies, complex structural trends and prospective sweet spots within the data. They often reveal features and patterns that might otherwise go unnoticed. In this project, geometrical and amplitude attributes were used in two different ways: 1) for quality control (QC) of data and models during the processing stage and 2) as advanced interpretation tools.

AVO attributes, such as RMS amplitude and various combinations of angle stacks (Figure 5), were derived at multiple stages of processing for analysis. The first rounds of attributes were calculated on the preliminary intermediate Pre-Stack Depth Migration (PSDM) datasets. These attributes were essential in identifying prospective AVO (Amplitude Variation with Offset) play types II and III, allowing us to enhance their imaging throughout the project lifecycle. The final data

Figure 4 Lithology interpretation aided by highresolution DM FWI model. Seismic facies inference of channel complex elements, shelf incisions and channel lobes are highlighted by detailed velocity model.

migration showed significant improvement in resolution and certainty for identifying seismic facies representing potential reservoir packages.

Coherency (or ‘semblance’) attributes were crucial in highlighting discontinuities in the data, such as faults, fractures and channel boundaries. These attributes were used for quality control steps during processing to ensure a seamless volume merge between different surveys. Coherency and curvature attributes were also utilised to optimise migration aperture, as larger apertures may increase noise levels without necessarily improving dip imaging in the deep section. Amplitude and phase extractions along key regional horizons were also checked at each stage.

Regional geologic overview

The offshore regions of Uruguay and southern Brazil share similar basin evolution stages and stratigraphic sequences. In the deepwater, sub-basin divisions are made into the Punta Del Este (PdEB) and Pelotas Basins (PB) (Figure 1). The Punta Del Este

Basin (~50,000 km2) contains a margin segment with a 140 km wide region of syn-rift horsts and grabens in southwestern offshore Uruguay (Figure 1). The PdEB is limited in the south by the Salado Fracture Zone and to the north by the Polonio basement high and the Rio de la Plata Transfer system (RdlPTS) (Figure 1). The RdlPTS (Soto et al., 2011) is a complex structural region that marks the boundary between the Punta del Este and Pelotas Basins. The PB spans offshore acreage (~300,000 km2) of Uruguay and southernmost Brazil. This region is positioned between the Florianopolis and Austral-Malvinas Fracture Zones (Figure 1). These fracture zones can be traced across the South Atlantic to link the conjugate margins of western Africa and South America. Plate reconstructions restore the sub-basins of Namibia to the sub-basins of Uruguay and southern Brazil. The Early-Cretaceous development of the South Atlantic basin occurred in a magma-rich setting. The scissor-like opening occurred from south to north along zones of pre-existing weakness in the South American and African Plates. During this phase, variable basement architectural fabrics produced

Figure 5 Combination of angle stacks used as a QC amplitude attribute. A) Section illustrating the use of all available offsets for angle stack generation. Resulting seam in the shallow region is highlighted. B) Demonstrating of ‘seamless’ merge utilising same ranges of nearest offsets.
Figure 6 Representative 3D inline example from the seamlessly merged 3D volume in offshore Uruguay. Aptian and Cenomanian-Turonian source interval are interpreted in the basin and overlying Late Cretaceous-Tertiary units contain an array of seismic facies favorable for accumulations of oil and gas.

differing magnitudes of continental syn-rift extension and the location of oceanic transforms. As extension continued, igneous intrusions at rift shoulders eventually progressed to final crustal rupture with excess magmatic production at the incipient spreading ridge. At this transitional phase, seaward dipping reflectors (SDRs) (Figure 6) are formed as subaerial flow originating from the newly formed spreading centre. These sub-aerial SDRs progressively rotated basinward as the spreading at the axis continued and the distance between the two continental domains increased. Eventually, the magmatic supply waned, and the once super-charged spreading ridge began to produce normal oceanic crust.

The progression to the Volcanic Passive Margin (VPM) phase described above pre-dated the deposition of the prolific source rocks that have forever changed the oil and gas landscape in the conjugate margin of Namibia. Analogous basin elements such as 1) deposition of thick passive margin stratigraphic packages, 2) sufficient burial for maturation, and 3) an effective seal deposition. All appear to be present in the Punta del Este and Pelotas Basins.

Punta del Este and Pelotas Basin stratigraphy

PdEB and PB exhibit a geological evolution mirroring that of other South Atlantic margin basins, progressing through pre-rift, syn-rift and post-rift stages (Conti et al., 2017; Morales et al., 2017).

During the pre-rift phase, remnants of a volcano-sedimentary sequence were deposited within a western Gondwana intracratonic basin during the Paleozoic era. Its distribution is primarily associated with the shallower segment of PdEB and PB, predominantly preserved within half-graben structures, albeit partially eroded on the highs. This sequence, consisting of interbedded shales and sandstones, was drilled in PdEB and the Brazilian portion of PB (Ucha et al., 2004; Bueno et al., 2007.)

The Late Jurassic to Early Cretaceous syn-rift phase consisted of the infilling of grabens and half-graben structures with a mix of alluvial-fluvial and lacustrine deposits, interbedded with volcanics and volcaniclastics (Bueno et al., 2007). Units

from this sequence were drilled in the shallower segment of PdEB and PB. However, the main syn-rift depocentres remain undrilled. While the half-grabens in PdEB trend mostly in the NW-SE direction, those in the Pelotas Basin exhibit an NE-SW orientation (Morales et al., 2017). Moreover, in the deepwater segments of both basins, the syn-rift phase is characterised by thick SDR packages (Figure 6 & 7), with a notable gap between the SDRs wedges of PdEB and PB corresponding to the RdlPTS (Figure 6). This gap between SDRs wedges is constituted by a depocentre that controlled the sedimentation of that sector during the Cretaceous post-rift and was an important influence for the deposition of organic-rich source intervals and reservoir rocks (Figure 6).

The post-rift phase represents the sequence with the highest sedimentary thickness, commencing in the Early Cretaceous period under newly formed marine conditions (Figures 6 and 7). It can be divided into a Barremian-Aptian transition phase, predominantly recognised in PdEB, and a subsequent drift phase. The transition phase, deposited during a stage of thermal subsidence immediately after the syn-rift, is marked by sedimentary sequences lacking shelf and slope geometries in seismic facies (Morales et al., 2017). The Aptian-present drift phase is characterised by a sedimentary wedge shaped by sediment supply, basin subsidence, and eustatic changes. Notably, this phase sees the developments of prograding geometries associated with the establishment of paleo-shelves and paleo-slopes (Morales et al., 2017) (Figure 7).

Petroleum systems discussion

Utilising the existing data and current understating of the basin, the analysis of each PdEB and PB tectonostratigraphic phase in terms of petroleum systems indicates that the pre-rift sequence presents the highest exploration risks. This designation is asserted primarily due to its high burial depth. This assessment leads to potential source rocks being overmature and reservoir intervals exhibiting low porosity and permeability. The syn-rift phase has been tested in two exploration wells (Lobo X-1 and Gaviotin X-1, Figure 1), with no success in PdEB and PB (Brazil). Across the South Atlantic, this same sequence has produced

Figure 7 Representative 3D Crossline example from the merged 3D volumes, showing similar elements to Figure 6.

moderate successes in the Orange Basin. On the African margin segment, proven lacustrine source rock and a discovery (AJ-1 well) offshore South Africa have been recorded (Paton et al., 2007). Attempts to test an extension of this play in a recent exploratory well resulted in a non-commercial accumulation. In Uruguay, the most recent post-rift exploration target in the PB was carried out in 2016 with Raya X-1 (Figure 1), in a water depth of 3304 m. Results from this well were highly anticipated, as the water depth at the borehole was a world record at the time. This wildcat targeted an Oligocene turbidite system, but unfortunately, the results indicated that the well was dry and lacked hydrocarbons. Similar outcomes along the

margin highlight the risk of plays associated with the Cenozoic post-rift sequence due to the lack of effective migration pathways connecting Cretaceous source rocks with the Cenozoic reservoirs.

Subsurface data in the Punta del Este and Pelotas Basin show many direct and indirect hydrocarbon indicators, including fluid inclusions, gas shows, AVO anomalies and CSEM anomalies. The analysis of micro-seeps and oil slicks further supports evidence of a functioning petroleum system(s). These data points and the recent high-quality oil discoveries in the Orange Basin (Venus, Graff, Jonker, Mopane, etc.) highlight the Cretaceous post-rift sequence as the most prospective (Conti

Figure 9 Examples (A and B) of the merged 3D volume showing early basin-fill distribution of stratigraphic features (contourites, channels, levees) to the Aptian and Cenomanian Source Units. 3D volume views are composed of RMS (Root Mean Square) seismic attribute and raw-stack data.

Figure 8 Representative 2D dip line from the Pelotas Basin, offshore Brazil. This line shows the extension of the depositional systems into southern Brazil.

et al., 2023). From here, we highlight the details of the largely unexplored Cretaceous post-rift sequence petroleum system of PdEB and PB.

Multiple boreholes in West Africa confirm that source rocks associated with the Cretaceous post-rift megasequence are marine shales from the Aptian (OAE 1) and Cenomanian-Turonian (OAE 2) ages. Although the Aptian sequence has not yet been drilled in the conjugate region, it is correlated with its Namibian counterpart, identified by seismic facies correlation in seismic data as the first marine transgression of the basins. The Aptian sequence reaches up to 1000 m in a Cretaceous central depocentre area offshore Uruguay, associated with the RdlPTS. This interpreted thickness suggests that the hydrocarbon generation potential in this interval is highly significant, assuming the organic properties are comparable to those documented in the source interval on the conjugate margin.

The BPS-6a well in the Brazilian side of the Pelotas Basin, drilled in 1995, reached a thin organic-rich Cenomanian-Turonian (C-T) sequence with high TOC values (ANP, 2004) in the younger interval. It is likely that the quality, thickness, and maturity of this source rock will increase in the deep sector of the basin. In that regard, a recent work by Rodríguez et al. (2023) identified its potential as a source rock in the deepwater segment offshore Uruguay. Here, the C-T source rock was associated with an AVO type IV anomaly response in seismic data and an extensive but subtle high resistivity response within the CSEM data.

The presence and quality of reservoirs for the Cretaceous post-rift sequence have been confirmed as high-quality sandstones. These sand-rich intervals have been documented in the PdEB and PB through exploration well data. For instance, the Lobo X-1 and Gaviotin X-1 (Figure 1) wells of PdEB demonstrate porosity values ranging between 18% to 25% in Cretaceous post-rift reservoirs (Conti et al., 2023).

Numerous channel systems and turbidites throughout the thick Cretaceous post-rift column in the central to distal segment of PdEB and PB have been identified with 3D seismic data (Figure 9), some of them showing strong analogies with the Orange Basin Namibian discoveries. Offshore discoveries in the Orange Basin have confirmed the existence of at least two highly effective play types (Hedley et al., 2022), one associated with Lower Cretaceous reservoirs (e.g., Venus-type) and another with Upper Cretaceous reservoirs (e.g., Graff-type). Both essentially stratigraphic play types, consisting of submarine fans and channel systems, appear to be fed by the Aptian Source rock, although the contribution of the Cenomanian-Turonian source rock to the Upper Cretaceous play cannot be ruled out.

Many of the identified prospects recognised in PdEB and PB for the Cretaceous post-rift sequence are connected through faults to the Aptian source rock, ensuring an effective migration pathway. This is illustrated in Figure 9 by the extension of faults into the lowermost basin fill above a rugose basement expression. Finally, it is worth noting that the Cretaceous post-rift sedimentary package is overlain by a thick transgressive marine Paleocene shale, acting as a regional seal for hydrocarbons, as supported by well data (Conti et al., 2023).

Underexplored region

Most of the 20 exploratory wells drilled in PB (Brazil) were located either in the emerged part of the basin or in shallow waters over the continental shelf, targeting various proximal Cretaceous or Tertiary reservoirs. On the other hand, of the three wells drilled offshore Uruguay, two of them (Lobo X-1 and Gaviotin X-1) located in shallow waters of PdEB, targeted syn-rift structures and the other (Raya X-1), located in the ultra-deep sector of PB (3404 m water depth) only reached the Cenozoic post-rift sequence, targeting an Oligocene turbidite. Thus, none of the 23 wells of the region of PdEB and PB tested the Cretaceous post-rift in the deepwater sectors, remaining a largely unexplored area. This is important to note because, as mentioned before, the Cretaceous post-rift sequence in the deepwater sector is where most of the exploration success in the Orange Basin is concentrated and will be a key region of future exploration in both PdEB and PB. Despite the lack of wells, the significant coverage of high-quality 3D seismic data in the area will help to mitigate geological risks and facilitate decision-making for new drilling operations.

Summary

Although much of the area remains underexplored, the conjugate discoveries on the Namibian margin have prompted operators to capture acreage in a ‘gold rush’ fashion, with the aspirations to replicate those successes on the South American equivalent. This is demonstrated by explorers capturing 100% of the Uruguayan lease blocks and record-breaking results in Brazil’s 2023 Permanent Offer lease round.

A thorough analysis of available data in the region has resulted in a library of leads and prospects across various play types. The play elements span various seismic facies from a recognisable Aptian source interval, including a potential Cenomanian-Turonian organic-rich shale, to mapped depositional fairways along the margin. Additionally, the Namibian-type plays targeting Cretaceous channels and fans on this margin are similar in age and position relative to the paleo-shelf. Seismic facies related to channel complex and fan deposition overlie the Aptian source interval and are common within these basins. Leads have also been identified at fault-bounded traps, where the faults originate from the economic basement into overlying Mid-Late Cretaceous units. An inventory of DHIs has also been compiled where amplitude anomalies and angle-stack response suggest hydrocarbon accumulation in subtle structures.

Industry experts are anticipating great successes in offshore Uruguay and Southern Brazil. As exploration and drilling programs are drafted data providers race to provide the technology and data coverage needed ahead of this expected oil boom in this emerging hotspot.

References

ANP (Agencia Nacional do Pétroleo, Gas Natural e Biocombustíveis). Brasil round 4: Pelotas basin [2004].http://www.anp.gov.br/brasilrounds/round4/round4/workshop/restrito/ingles/Pelotas_ing.pdf. Bueno, G.V., Zacharias, A.A., Oreiro, S.G., Cupertino, J.A., Falkenhein, F.U.H. and Neto, M.A.M. [2007]. Boletim de Geociências Petrobras, Rio de Janeiro, 15(2), 551-559.

Conti, B., Perinotto, J.A.J., Veroslavsky, G., Castillo, M.G., de Santa Ana, H., Soto, M. and Morales, E. [2017]. Speculative Petroleum systems of the Southern Pelotas Basin, offshore Uruguay. Marine and Petroleum Geology, 83, 1-25.

Conti, B., Novo, R., Marmisolle, J., Rodríguez, P. and Gristo, P. [2023]. Offshore Uruguay: Big Hopes (and Supporting Geology) for the Cretaceous. First Break, 4 (9), 45-47.

Hedley, R., Intawong, A., Winter, F. and Sibeya, V. [2022]. Hydrocarbon play concept in the Orange Basin in the light of the Venus and Graff oil discoveries. First Break, 40, 91-95.

Morales, E., Chang, H.K, Soto, M., Santos Correa, F., Veroslavsky, G., de Santa Ana, H. Conti, B. and Daners, G. [2017]. Tectonic and stratigraphic evolution of Punta del Este and Pelotas basins (offshore Uruguay). Petroleum Geoscience, 23, 415-426.

Pralica, N., Cvetkovic, M., Yong, S., Davies, D. and Rogers, J. [2024]. Resolving geological complexity with legacy streamer survey, part 2: Application of DM FWI to sub-optimally acquired data, SEG Technical Program Expanded Abstracts, in review

Paton, D.A., Di Primio, R., Kuhlmann, G.; Van Der Spuy, D. and Horsfield, B. [2007]. Insights into the Petroleum Systems Evolution of the southern Orange Basin, South Africa. South African Journal of Geology, 110, 261-274.

Missing reference-

Reuber, K., Etherington, R. and Cvetkovic, M. [2023]. Regional synthesis of South American Basin Development and Early Cretaceous Passive Margin Sequences in the Austral Segment of the South Atlantic. First EAGE Conference on South Atlantic Offshore Energy Resources, 2023(1), 1-3.

Rodríguez, P., Marmisolle, J., Helland-Hansen, D., Nerland, E. and Rodriguez, K. [2023]. Punta del Este Basin Seismic and CSEM Turonian Source Rock Evaluation. First EAGE Conference on South Atlantic Offshore Energy Resources, 2023(1), 1-6. https://doi. org/10.3997/2214-4609.202381029.

Yong, S., Cvetkovic, M., Johnson, T., Soelistijo, B. and Ge, L. [2023]. Resolving geological complexity with legacy streamer survey: Potiguar 3D offshore Brazil case study, SEG Technical Program Expanded Abstracts: 536-540.

Soto, M., Morales, E., Veroslavsky, G., de Santa Ana, H., Ucha, N. and Rodríguez, P. [2011]. The continental margin of Uruguay: Crustal architecture and segmentation. Marine Petroleum Geology, 28, 16761689.

Ucha, N., de Santa Ana, H. and Veroslavsky, G. [2004]. La Cuenca Punta del Este: Geología y Potencial Hidrocarburífero. In: Veroslavsky, G., Ubilla, M. and Martínez, S (Eds), Cuencas Sedimentarias de Uruguay: Geología, Paleontología y recursos naturales – Mesozoico. DIRAC, Montevideo, 171-190.

FEATURES

2-5 SEPTEMBER 2024 I OSLO, NORWAY

Preliminary remote spatial analysis of fairy circles : an approximation of hyperspectral and geophysical data from hydrogen seeps

Juan Esteban Mosquera-Rivera1*, Juan Manuel Jiménez-Vergara1, Carlos Alberto VargasJiménez1 , Philip Ball2 and Hans Morales1 present a remote sensing analysis to identify potential concentrations of natural hydrogen by observing fairy circles.

Abstract

We present a remote sensing analysis to identify potential concentrations of natural hydrogen by observing fairy circles Utilising Principal Component Analysis (PCA), distinct features of these formations were delineated, indicating their differentiation from the surrounding environment. It was noted that such distinctiveness occasionally arose from the presence of water and similarities in topography, which also manifested in the PCA contours of the fairy circles. The role of water or humidity emerged as significant in the Thermal Infrared (TIR) response of fairy circles, typically displaying negative anomalies. However, this correlation appeared less straightforward in specific cases such as Brazil. Band ratio methods revealed a pronounced association with ferric iron (Fe+3) and a less conspicuous link with Alunite-Kaolinite.

Additionally, vegetation indices primarily correlated with Normalised Difference Vegetation Index (NDVI) and Moisture Stress Index 1 (MSI1) in agricultural areas, and MSI1 and Water Index 1 (WI1) in water body regions, with other indices (e.g., OCVI, NDWI, and CIG) proved beneficial. Radiometric analysis suggested that low K/Th values were associated with this anomaly in Western Australia, whereas other radiogenic elements did not exhibit clear patterns in the areas studied. Future research directions are proposed, advocating utilising high-resolution geophysical data to gain deeper insights into the associations linked to fairy circles. The implementation of unsupervised and supervised classification algorithms was deemed crucial for identifying new formations, while longitudinal analysis would aid in understanding the evolving nature of these phenomena over time.

Introduction

Hydrogen has a notable role in supporting announced government climate commitments and enhancing energy security plans. Hydrogen demand has grown to 95 Mt in 2022 and could reach 115 Mt by 2030, being 38 Mt low-emission hydrogen. However, this trend is still below the Figures for existing climate pledges and far from the need for net zero by 2050 (IEA,

2023). ‘White hydrogen’, ‘native hydrogen’ or ‘natural hydrogen’ takes advantage of the hydrogen that exists in the subsoil in its natural state. Its exploitation may require fewer resources than other conventional alternative clean energy sources and other kinds of hydrogen.

Fairy circles or witch circles, are circular topographic depressions where vegetation struggles to develop (Rigollet and Prinzhofer, 2022). These phenomena have primarily been observed in various regions, including the deserts of Namibia, Australia, and the United States, and they are commonly mapped as indicators of natural hydrogen seepage (e.g., Ball & Czado 2024, Darrah et al. 2024) (Figure 1). Fairy circles are hypothesised to result from underground sources of hydrogen and other gases such as helium and methane, likely generated by microbial activity, leading to inhibited plant growth and the characteristic circular pattern due to competition for resources among nearby plants. While the connection to radiogenic sources is less explored in literature, some studies suggest that radiogenic processes might contribute to forming fairy circles by releasing light gases (Getzin et al. 2016; Cramer and Barger, 2013). Detection methods for fairy circles involve aerial surveys, satellite imagery, ground surveys, and soil sampling, with studies revealing elevated hydrogen concentrations within these formations and distinct soil characteristics (Juergens, 2017; Meyer and Juergens, 2019).

Already scrutinised across diverse global regions utilising remote sensing methodologies combined with comprehensive geochemical, geophysical, and geological datasets (Moretti et al. 2021), this investigation aims to elucidate, through an initial hyperspectral analysis and supplementary geophysical datasets, the discernible patterns characterising fairy circles and their associations with mineral, vegetation, and thermal spectral indices within six locations previously examined in scholarly discourse: North Minas Gerais, Brazil; North Carolina, US; Bourakebougou, Mali; Voronezh Oblast, Russia; as well as Yorke Peninsula and North Perth Basin, Australia.

1 Universidad Nacional de Colombia at Bogotá | 2 School of Geography Geology and the Environment, Keele University

* Corresponding author, E-mail: jumosquerar@unal.edu.co

DOI: 10.3997/1365-2397.fb2024047

Methods

PRISMA Hyperspectral Imagery

PRISMA (PRecursore IperSpettrale della Missione Applicativa) is an advanced hyperspectral satellite system launched by the Italian Space Agency (ASI) on 22 March, 2019. Operating in a sun-synchronous low-Earth orbit at an altitude of 615 km, it features a 29-day repeat cycle, providing rapid revisit capability for specific targets (Chabrillat et al. 2022). Equipped with two

hyperspectral sensors and a panchromatic camera, PRISMA captures images across 239 spectral bands ranging from 400 to 2500 nm, with a spatial resolution of 30 m. It achieves a nominal spectral sampling interval of less than 11 nm and a bandwidth of less than 15 nm (Shaik et al. 2023). A total of six PRISMA scenes were successfully acquired and analysed in this study.

Spectral band rationing divides the brightness values of the reflectance curve at its highest and lowest points after mitigating

Figure 1 Localisation and satellite images of the study zones where Fairy circles were reported. (a): Global map showing the locations. Other occurrences reported by Zgonnik (2020) are also presented. (b): North Carolina, USA. (c): North Minas Gerais, Brazil. (d): Bourakebougou, Mali. (e): Voronezh Oblast, Russia. (f) & (g): Yorke Peninsula and Perth Basin, Western and Southern Australia respectively.

the effects of atmospheric and sensor noise. This technique enhances the information regarding the composition of materials while minimising the influence of other factors, such as terrain slope and grain size (Jensen,1996; Vincent, 1997).

The mineral band ratios from (Kalinowski and Oliver, 2004) were employed to identify different minerals within the study area. For the evaluation of vegetation conditions, the EnMAPBox QGIS plugin (Jakimow et al. 2023) was utilised, enabling the calculation of various vegetation indices sourced from the Awesome Spectral Indices database (Montero et al. 2023).

Adjacent bands in hyperspectral data often exhibit high correlation and may convey similar information about the target. PCA aims to transform the original data into a new set of bands that alleviate their correlation. This is accomplished by determining the optimal linear combination of the original bands that encapsulate the variation of pixel values in an image. Generally, PCA leverages the statistical properties of hyperspectral bands to evaluate their dependency or correlation (Rodarmel and Shan, 2002).

Landsat

For TIR analysis, six Landsat Level-2 scenes were utilised, employing ten reflectance bands spanning the range of 10.60–

30 m resolution

VNIR: 400–1100 nm (66 bands)

SWIR: 920–2500 nm (173 bands)

LANDSAT LEVEL-2 100 m resolution 10.60–11.19 μm (10 bands)

Geoscience Australia

USGS Mineral Resources Online Spatial Data

11.19 μm with a 100m resolution (Roy et al. 2014), obtained from the EarthExplorer website service. Subsequently, the reflectance values were transformed into temperature values using the SCP QGIS plugin (Congedo, 2021). This conversion enabled the integration of the TIR band for soil moisture estimation at a significantly enhanced spatial resolution compared to the microwave band. Although the microwave band is sensitive to soil moisture, it exhibits a lower resolution (Anderson et al. 2012).

Elevation data

The elevation data utilised comprised the Copernicus Global Digital Elevation Model at a 30 m resolution (European Space Agency, 2021), and the United States Geological Survey 3D Elevation Program at a 1/3 arc-second Digital Elevation Model (United States Geological Survey, 2021), accessed through OpenTopography.

Geophysics

We comprehensively analysed radiometric, gravimetric, and magnetic data across three of the six study areas based on data accessibility (open access) and resolution (the other locations had low-resolution data or restricted access): South and Western

PRS_L2D_STD_20230908110932_20230908110936_0001

PRS_L2D_STD_20230921131819_20230921131823_0001

PRS_L2D_STD_20230922021908_20230922021912_0001

PRS_L2D_STD_20230922082514_20230922082518_0001

PRS_L2D_STD_20230923005950_20230923005955_0001

PRS_L2D_STD_20231008161147_20231008161151_0001

LC09_L2SP_174024_20230809_20230811_02_T1

8/10/2023

9/8/2023

LC08_L2SP_198051_20230825_20230905_02_T1 Mali 25/8/2023

LC09_L2SP_113081_20230830_20230901_02_T1

LC09_L2SP_098084_20231008_20231009_02_T1 South Australia 8/9/2023

LC08_L2SP_219072_20230913_20230919_02_T1 Brasil 13/9/2023

LC09_L2SP_015036_20231002_20231003_02_T1

Radiometric Grid of Australia (Radmap) v4 2019, filtered ppm uranium

Radiometric Grid of Australia (Radmap) v4 2019, filtered ppm thorium

Radiometric Grid of Australia (Radmap) v4 2019, filtered pct potassium

Australia gravity grid 2016 (complete spherical cap Bouguer anomaly)

National Gravity Compilation 2019 includes airborne DGIR 1VD grid

Total Magnetic Intensity (TMI) Grid of Australia 20197th edition, First Vertical Derivative (1VD)

USGS Aero-radiometric grids for North America

Residual total intensity data obtained from the USGS Magnetic anomaly maps

Gravity anomaly grids for the conterminous US - Bouguer

States 2/10/2023

Western & South Australia

Western & South Australia

Western & South Australia

Western & South Australia

Western & South Australia

Western & South Australia

United States

United States

United States

Table 1 Summary of PRISMA (Shaik et al. 2023) and LANDSAT Level-2 (Roy et al. 2014) scenes accessed from Earth Explorer website scenes data. Geophysics source and acquisition acceded from Geoscience Australia and USGS Mineral Resources Online Spatial Data.

PRISMA

Australia and North Carolina, US. In the case of Australia, for the radiometric data, we utilised a detailed grid comprising potassium (K), uranium (U), and thorium (Th) concentrations (Poudjom Djomani & Minty, 2019a, 2019b, 2019c). These grids were derived from Australia’s 2019 radiometric or gamma-ray grid, featuring a spatial resolution of approximately 100 m (0.001 degrees). To assess the Bouguer anomaly, we employed the Complete Spherical Cap Bouguer Anomaly grid (Nakamura, 2016) sourced from the Australian National Gravity Database (ANGD), supplemented by data from the 2013 New South Wales Riverina gravity survey. Additionally, the first vertical derivative of gravity data was obtained from the National Gravity Compilation 2019 DGIR 1VD, with a spatial resolution of about 0.00417 degrees (equivalent to 435 m). Station spacing varied from 1 to 11 km (Nakamura, 2016). The computation of the first vertical derivative involved utilising a Fast Fourier transform (FFT) process. Regarding magnetic data analysis, we used the First Vertical Derivative of Total Magnetic Intensity, derived from

the 2019 Total Magnetic Intensity Grid of Australia (Poudjom Djomani & Minty, 2019d). With a cell size of approximately 80 m, this derivative emphasises shorter wavelengths by applying a high-pass filter to the magnetic field data.

In the case of the US, the radiometry data were extracted from the USGS Aero-radiometric grids for North America (Duval et al. 2005; Hill et al. 2009). For magnetic anomalies, we utilised the residual total intensity data obtained from the USGS Magnetic anomaly maps and data for North America. This process involved removing the declination, inclination, and total field (DIT) reference field, updating data to the survey date, and converting flight elevation to an equivalent magnetic field 1000 ft above the terrain. The data underwent thorough error correction, and x-y locations were computed for the DNAG projection described. Subsequently, the data were gridded at 1/3 to 1/4 of the flight-line spacing and gridded to a 1-km resolution (Bankey et al. 2002; Hill et al. 2009). Regarding gravimetry, we utilised the Bouguer gravity anomaly data grid covering the conterminous

Figure 2 Spectral signature of fairy circles at different distances. (a) &

& (d):

&

& (h):

& (j); (k) & (l): Yorke Peninsula and Perth Basin, Western and Southern Australia respectively. Coloured lines correspond to colored dots in satellite image.

(b): Ségou Region, Mali. (c)
North Minas Gerais, Brazil. (e)
(f): North Carolina, USA. (g)
Voronezh Oblast, Russia. (i)

United States. This dataset, derived from National Information Mapping Agency (NIMA) gravity data files spanning 1998 to 1999, encompasses both onshore and offshore regions, including adjacent marine areas (Kucks et al. 1993). This USGS data have a spatial regridded resolution of 1 km.

Results

The spectral signatures reveal heightened reflectance (Figure 2) within the fairy circles, primarily attributed to their

vegetation-free or sparsely vegetated nature. Various methods have been employed to discern differences and potential associations in confirmed hydrogen seeps, including PCA, TIR imaging, mineral indices, vegetation indices, and topographic analysis, along with the integration of geophysical data from gravimetry, magnetometry, and gamma-Ray. These analytical approaches aim to unravel the intricate patterns and underlying factors influencing the observed phenomena within and around the fairy circles. By integrating diverse methodologies, a

Figure 3 Yorke Peninsula, Southern Australia. (a) PCA. Fairy circles identifiable by their edges (b) Topography. (c) TIR. (d) Radiometric RGB (K, Th, U). (e) Total Magnetic Intensity (TMI) - First Vertical Derivative (1VD). (f) Complete spherical cap Bouguer anomaly. (g) National Compilation - DGIR 1VD grid.

comprehensive understanding of the fairy circles’ spectral, thermal, mineralogical, topographic, and geophysical characteristics can be achieved, facilitating their identification and interpretation.

PCA

The PCA method was employed to tackle the complexity of the scenes, attributed to the large number of spectral bands. The results derived from PCA unveiled a significant response from the fairy circles, rendering them easily discernible using this technique, particularly when utilising bands RGB (PC3, PC2, PC1) for enhanced visualisation. The amalgamation of the response acquired with the shape of the fairy circles yields optimal approximations for their identification.

It was observed that the water present inside the fairy circles is also clearly distinguishable in the PCA results, serving as a valuable indicator for identifying potential new hydrogen seeps. Furthermore, the edges of the fairy circles emerge as the most prominent areas, characterised by consistent colours across different fairy circles within the same vicinity.

In addition to the anomalies directly observed within the fairy circles, anomalies were also detected in the surrounding areas. These anomalies can manifest as larger-scale phenomena or as anomalies encompassing the fairy circles, as observed in Brazil (Figure 8a).

The response obtained by PCA is more evident in areas with sparse vegetation. In contrast, the response can be more ambiguous in areas with dense vegetation, as observed in Russia and North Carolina (Figure 5a, Figure 6a). In regions with relatively low vegetation, such as Southern Australia (Figure 3a), areas characterised by uniform vegetation and fairy circles nearly entirely submerged in water pose challenges for identification using this method.

Mineral Index

Based on mineral exploration and anomaly detection for hydrocarbon detection, it was discovered that utilising multiple indices unveils the presence of certain minerals within the fairy circles, particularly in regions where vegetation is scarce or absent. The most prominent anomalies are observed in iron, characterised by

Figure 4 Perth Basin, Western Australia. (a) PCA. Fairy circles with violet response (b) Topography. (c) TIR. (d) Mineral Index RGB (Alunite, Ferric iron (Fe +3), Ferrous iron (Fe +2)), with blue-green response representing areas potentially related to fairy circles. (e) Radiometric RGB (K, Th, U). (f) Total Magnetic Intensity (TMI) - First Vertical Derivative (1VD). (g) National Gravity Compilation - DGIR 1VD grid.

an enrichment of Fe+3 within the fairy circles and their surrounds. These anomalies can extend over extensive areas, as evidenced in Western Australia and Brazil (Figure 4c, Figure 4d, Figure 7d, Figure 8c, Figure 8d). Conversely, Fe+2 exhibits less conspicuous anomalies or even negative anomalies within the fairy circles, aligning with those observed for Fe+3

The Alunite-Kaolinite-Pyrophyllite anomalies exhibit positive values along the margins of the fairy circles and negative values within them. However, it is important to note that this index may yield erroneous readings in the presence of water inside the fairy circles. Conversely, the anomalies associated with Sericite-smectite-illite-muscovite are distinct around the fairy circles, particularly prominent in Brazil and Western Australia, albeit less conspicuous in Mali.

Carbonate and Chlorite-Epidote anomalies vary greatly and can interfere with vegetation and water, making their association with fairy circles difficult. In summary, the analysis of multiple indices reveals the presence of various minerals in the fairy circles, providing valuable information on the soil composition and geological characteristics of these geomorphological formations. Thus, the indices with the best response for RGB visualisation (Alunite-kaolinite, Fe+3, Fe+2), where the associated response is observed in green, is sometimes subtle compared to its surroundings.

Moisture-Water-Vegetation Index

The analysis encompassed 122 vegetation indices and related metrics, underscoring their considerable utility, particularly in

regions characterised by moderate-to-high vegetation cover, such as Russia and North Carolina (Figure 5d, Figure 6d). Notably, the fairy circles exhibited a significant response concerning the Moisture Stress Index (MS1 and MS2), displaying negative responses within their interior and positive responses along their edges, followed by the water indices (WI1 and WI2). These anomalies are attributed to soil-water interactions and have been documented in prior studies emphasising soil and vegetation dynamics (Getzin & Yizhaq, 2019; Groengroeft & Jürgens, 2022).

These anomalies typically manifest near the structures and exhibit variability, ranging from positive to negative. Additionally, a strong correlation is observed, particularly positive anomalies, among the vegetation indices (NDVI, GVMI, OCVI, NDWI, CIG and OSAVI), consistent with findings reported in other studies (Aimar et al. 2023; Carrillo Ramirez et al. 2023; Noy et al. 2023).

The observed contrasts primarily stem from the vegetation surrounding or within the fairy circles. Nonetheless, distinguishing the vegetation associated with these formations from that which is not can present challenges, with the rounded morphology of fairy circles being the most distinctive feature. The RGB composite, utilising the most representative indices (MS1 for moisture stress 1, WI1 for water index 1, and NDVI for normalised difference vegetation index), amplifies the response and streamlines the visualisation of the fairy circles (Figure 5d, Figure 6d, Figure 8d).

While the responses derived from these indices may not exhibit the same level of clarity as those obtained through

Figure 5 Voronezh Oblast, Russia. (a) PCA. Fairy circles with violet response (b)Topography. (c) TIR. (d) Vegetal index with light green response.

mineral analysis, they remain highly valuable in delineating and occasionally accentuating fairy circles, particularly in agricultural and grassland settings. Notably, the presence of fairy circles can impact the distribution and composition of the surrounding vegetation. Across most vegetated regions, greater plant density has been observed near fairy circles, indicating a potential interaction between these patterns.

Significant anomalies are not readily discernible in southern Australia, which is characterised by uniform vegetation and fairy circles submerged in water. Thus, it is advisable to integrate multiple responses and utilise additional analytical methods to validate the existence of fairy circles and understand their association with soil conditions and surrounding vegetation.

TIR

Across all examined sites, uniform negative temperature anomalies are consistently identified within fairy circles (Figure 3c, Figure 4c, Figure 5c, Figure 6c, Figure 7c), except for Brazil (Fig-

ure 8c), where a positive anomaly is documented. This variance could be ascribed to specific climatic conditions, such as recent precipitation or increased soil moisture levels. This supposition is substantiated by the comparatively lower temperatures observed in the surrounding vegetation (Groengroeft & Jürgens, 2022).

Moreover, the analysis of Landsat Thermal Infrared (TIR) images accentuates the uniformity of the rounded configuration of fairy circles, which indicates significant thermal contrast relative to the surrounding terrain. Remarkably, the presence of water mirrors within the fairy circles enhances the thermal anomaly, implying a direct correlation between water presence and temperature fluctuations within these geomorphological features, as reported by previous studies (Groengroeft & Jürgens, 2022).

Topography

The topography and configuration of fairy circles, with their elevated surrounding edges (Figure 3b, Figure 4b, Figure 5b, Figure 6b, Figure 7b, Figure 8b), typically higher than their

Figure 6 North Carolina, USA. (a) PCA. Fairy circles have light blue response (b) Topography. (c) TIR. (d) Vegetal index. (e) Radiometric RGB (K, Th, U). (f) Residual Magnetic Intensity (RMI). (g) Bouguer Anomaly.

interior as shown in (Moretti et al. 2021). are associated with anomalies detected through various methods, including infrared thermography (TIR), vegetation-water-moisture indices, mineral indices, and principal components (PCA). Although a direct causal relationship between topography and these anomalies has not been established, there is an observed association between the shape and distribution of the fairy circles and the characteristics detected in these measurements. It implies that topography may significantly generate and manifest these anomalies, underscoring the importance of considering relief influences in interpreting remote sensing data for studying fairy circles.

Geophysics

In Southern Australia, negative or low local and regional anomalies in Th (~1-3 ppm), U (~0.4 ppm), and K (~0.2%) are observed in the fairy circles delineated (Figure 3d). Within the regional context, particularly on the Yorke Peninsula, these anomalies are below the average crustal values (Minty, 1997). Structural controls do not govern these anomalies but are instead associated with lake deposits and water bodies (Raymond et al. 2012).

Concerning the gravity data, the complete spherical cap Bouguer anomaly reveals a pattern characterised by poor local but high regional negative gravity anomalies, mirroring their first derivative (Figure 3f,g). This regional anomaly is restricted in the north by a neotectonic feature running in the NW-SE direction, identified as the Coobowie Scarp, which delineates the division

between the Stansbury Basin (where the hydrogen seeps are situated) and the Olympic domain (a component of the Gawler Craton geological province). Although there may be a correlation with the Yorketown Scarp in the south, it is not distinctly evident. Similarly, the magnetic first vertical derivative (1VD) follows the Coobowie Scarp and the Yorketown Scarp, albeit without distinct positive or negative anomalies (Clark & McPherson, 2012; Korsch & Doublier, 2015; Raymond et al. 2012). Instead, a pattern emerges characterised by a high anomaly in the centre and negative anomalies in the surrounding areas (Figure 3e).

Clear local first vertical derivative (1VD) gravity anomalies (Figure 4g) are absent in Western Australia. In contrast, 1VD magnetics (Figure 4f), Th (~8-18 ppm, except for ~1.9 ppm), and U (~1.6-2.2 ppm, except for ~0.4 ppm) exhibit limited positive local anomalies (Figure 4e) based on average radiogenic crustal values (Minty, 1997). However, a notable regional structural control is evident, delineated by the Darling Fault, which separates the Pinjarra Orogen from the Yilgarn Craton (Korsch & Doublier, 2015; Raymond et al. 2012). A transition zone characterises this division. Similarly, K (~1.6-1.8%, except for 0.01%) anomalies also align with this orientation, displaying stronger and predominantly positive local anomalies but below the average crustal values (Minty, 1997).

The fairy circles in North Carolina Bay present a distinctive Bouguer anomaly profile (Figure 6g). While the regional Bouguer anomaly is notably low, it is surrounded by localised high or

Figure 7 Bourakebougou, Mali. (a) PCA. Fairy circles have light-blue response. (b) Topography. (c) TIR. (d) Mineral Index RGB (Alunite, Ferric iron (Fe +3), Ferrous iron (Fe +2) with green response representing areas potentially related to fairy circles. (e). Mineral Index (Alunite, kaolinite Pyrophyllite). (f) Ferric iron (Fe +3). These alterations usually indicate a ring around the fairy circle.

positive anomalies. Moreover, both Th (~0.4-2.9 ppm) and U (~0.1-0.9 ppm) exhibit low anomalies at both regional and local scales (Figure 6e), prominently aligning along the NW-SE direction, reflecting the primary drainage pattern of the area. Nevertheless, a pronounced transitional zone is evident at the regional level. Similarly, K (~0.1-0.35%) regionally manifests a low or negative anomaly. At the same time, at the local scale, it aligns with a zone of high anomalies that run parallel to significant drainage systems, resembling the patterns observed for Th and U. Additionally, these locations generally correspond to areas with low magnetic anomalies (Figure 6f), although the specific pattern remains somewhat ambiguous.

Discussion

Our results suggest that temperature anomalies could have a reliable associative response to the fairy circles, as their positive relationship with the Water Index and negative relationship with the Moisture Stress Index indicate the presence of water, even if it is not visible satellite imagery. The origin of the water in these

sites is unclear since the typical topography of the fairy circles encourages its accumulation, which could come from surface sources or natural run-off.

However, the transport of water associated with hydrogen mobilisation mechanisms is not ruled out, mainly due to the presence of Fe+3 and Alunite-Kaolinite anomalies on the contours of these structures, whose origin is unclear but could be linked to the transport of these minerals associated with hydrogen. It is also not ruled out that they are the product of a reaction of hydrogen with the surrounding rock. Given the marked Fe3+ anomalies compared to the Fe2+ anomalies in the surrounding areas, oxidation associated with these anomalies could be inferred. These anomalies (Figure 9c) are remarkably similar to those related to oil and gas seepage, such as those mentioned in (Guo et al. 2019). Further investigation into this issue will be necessary.

Radiogenic effect

Significantly, local and regional anomalies concerning radiometric data are observable across the three case studies. However,

Figure 8 North Minas Gerais, Brazil. (a) PCA. Fairy circles have light-blue response. (b) Topography. (c) TIR. (d) Mineral Index RGB (Sericite, Smectite, Muscovite). (e) Vegetal index. dark green related to fairy circles (f) Mineral Index RGB (Alunite, Ferric iron (Fe +3), Ferrous iron (Fe +2) with light-green-blue response representing areas potentially related to fairy circles.

they lack a definitive pattern. Particularly noteworthy are the fairy circles in Western Australia. K exhibits positive regional and local anomalies (based on the surrounding data). At the same time, Th and U display anomalies to a lesser extent. This observation could be linked to a low K/Th ratio in the vicinity of the fairy circles, as suggested by several authors in the domains of the study area (Dauth, 1997; Gunn et al. 1997; Wilford, 2002), possibly associated with strongly weathered and/or ferruginous saprolites. These anomalies correlate with iron (Fe+3) anomalies identified through hyperspectral analysis and surface geology (Raymond et al. 2012).

Similarly, positive K regional and local anomalies aligned with the preferred drainage direction in North Carolina suggest a potential correspondence, albeit not entirely clear, as the anomalies are not uniformly manifested across all fairy circles. In the case of Southern Australia, pronounced local negative anomalies are observed, with a minimal trend towards K. This negative correspondence remains unexplained by the data obtained in this study, possibly attributed to the strong influence of biological, meteorological, and pedological processes on radiometric measurements, masking the signal (Lefeuvre et al. 2022) or the absence of processes related to regolith, a layer susceptible to these measurements (Wilford, 2002). Additionally, the positioning of salt lakes associated with these fairy circles is crucial, potentially explaining the slight tendency towards K (Aimar et al. 2023; Raymond et al. 2012). However, their genesis in this area remains unclear, as it lacks the pronounced contrast observed in the locations (Moretti et al. 2021). Although the literature has endeavoured to provide theoretical (Lin et al. 2005), comparative, and empirical support (Lefeuvre et al. 2022) for these anomalies (e.g., microbiotic communities, He, and Radon gas emissions, respectively) within the framework of origin by radiolysis (Smith et al. 2005), the

preferential trend of the anomaly remains unclear in these cases, yet a robust spatial contrast is evident. In the three cases, only Th in Western Australia are above crustal average values (Minty, 1997).

Potential fields

Concerning potential fields and their association with fairy circles, they appear to delineate patterns correlated with regional faults (e.g., Western Australia), structural controls or alignments (e.g., South Australia and North Carolina.), or crustal or terrane limits (e.g., Western Australia) (Figure 9a, Figure 9b), supporting the hypothesis that faults serve as conduits for H2 in favourable geological settings (Donzé et al. 2024; Lefeuvre et al. 2022; Myagkiy et al. 2020; Zgonnik, 2020). With the resolution utilised in this study, no discrete anomalies in potential field data associated with each fairy circle in a specific area are identified. However, negative gravity anomalies are consistently observed in all cases, aligning with the boundaries between sedimentary basins and cratons (Moretti et al. 2021). In these instances, unless higher-resolution information is available, the anomalies established tend to be more regional than local. Finally, the performance results of each method are summarised in Table 2.

Suggestions for further study

Future research directions could be to explore various spectral algorithms such as Continuum Removal (CEM), Spectral Unmixing, and segmentation, as well as Supervised and Unsupervised ML Classification techniques or algorithms to deepen the analysis of fairy circles’ spectral signatures. For example, consider developing algorithms integrating morphology-based features such as Digital Elevation Models (DEMs), shape, density, lineaments, and geophysical and geochemical data. These enhancements aim to provide a clearer understanding of fairy circle structures and

Figure 9 Hydrogen seeps conceptual model. (a) Hydrogen origin scheme classified by tectonic configuration. (b) Association with regional structures in cratonic zones and sedimentary basins. (c) Typical fairy circle anomalies with active hydrogen emanation, modified from (Guo et al. 2019).

North Carolina, USA

North Minas Gerais, Brazil

Bourakebougou, Mali

Voronezh Oblast, Russia

Yorke Peninsula, Australia

Perth Basin, Australia

enhance their relation with other data, such as water (variations of its signature based on changes in H2).

Moreover, expanding the study area coverage and incorporating multiple temporal stages broadens the scope of InSAR (Interferometric Synthetic Aperture Radar) analysis. This approach will facilitate the extraction of more precise insights. Furthermore, investigation and testing of methods that aid the extrapolation of spectral signatures within fairy circles using multispectral satellite imagery could be beneficial. This extension enables broader-scale analysis, continuous monitoring of these phenomena, and a reduction of raw data consumption.

Spatial analysis could also be explored to understand the relationship between each potential factor contributing to fairy circle formation, incorporating considerations such as Moho depth, heat flow, crust thickness, surface earthquake data, and Curie depth. Exploring parameters such as stress state, b-value estimation, seismic velocities, and anisotropies may also reveal additional insights. Finally exploratory investigation is particularly valuable for addressing one of the most uncertain variables in H2 prospecting: volume. Given the constraints of solely possessing surface footprint data and unknown dimensions of the structures, this analysis can provide crucial insights.

Conclusion

Remote sensing analysis of fairy circles reveals promising indicators for identifying areas with potential concentrations of natural hydrogen. These formations exhibit distinguishable features through PCA, indicating their distinctiveness from the surrounding environment. However, this distinctiveness occasionally stems from water presence and similarities in topography, which can also manifest in the PCA contours of the fairy circles.

grassland, dense vegetation

and rock

dense vegetation , lakes

, lakes

"grassland, dense vegetation, lakes"

The role of water or humidity appears to be significant in the Thermal Infrared (TIR) response of fairy circles, typically showcasing negative anomalies. Yet, in specific cases like Brazil, this correlation seems less straightforward.

Band ratio methods unveil a pronounced association with ferric iron (Fe+3) and a less conspicuous link with Alunite-Kaolinite. Moreover, vegetation indices primarily correlate with NDVI and MSI1 in agricultural areas and MSI1 and WI1 in water body regions. Additional indices (OCVI, NDWI, and CIG) also prove beneficial. Radiometrics suggest, at least in Western Australia, that low K/Th values are associated with this anomaly. Other radiogenic elements don’t have a clear pattern in the areas studied.

Future research should leverage high-resolution geophysical data to gain deeper insights into the associations linked to fairy circles. Implementation of unsupervised and supervised classification algorithms will be crucial for identifying new formations, while longitudinal analysis will help us to understand these phenomena evolving nature over time.

Acknowledgements

We would sincerely like to thank the Italian Space Agency (ASI) for generously providing the hyperspectral images utilised in this study. Additionally, we appreciate the USGS and Geoscience Australia for granting free access to the TIR 10 Landsat images through the Earth Explorer platform and geophysical data of the contiguous United States and Western and Southern Australia. We appreciate the partial funding from MINCIENCIAS for the project with grant 80740-182-2021 and the Universidad Nacional de Colombia through the Hermes projects 51307, 51929 and 57879.

Table 2 Summary of performance response for each method applied per location.

ChatGPT (GPT-3.5) was utilised to refine the writing style in the results, discussion, and further studies sections.

References

Aimar, L., Frery, E., Strand, J., Heath, C., Khan, S., Moretti, I. and Ong, C. [2023]. Natural hydrogen seeps or salt lakes: how to make a difference? Grass Patch example, Western Australia. Frontiers in Earth Science, 11. https://doi.org/10.3389/feart.2023.1236673

Anderson, M.C., Allen, R.G., Morse, A. and Kustas, W.P. [2012]. Use of Landsat thermal imagery in monitoring evapotranspiration and managing water resources. Remote Sensing of Environment, 122, 50-65. doi:10.1016/j.rse.2011.08.025

Ball, P.J. and Czado, K. [2024]. Natural hydrogen: The race to discovery and concept demonstration. Geoscientist 34(1), https://geoscientist. online/sections/unearthed/natural-hydrogen-the-race-to-discovery-and-concept-demonstration/

Bankey, V., Cuevas, A., Daniels, D., Finn, C., Hernandez, I., Hill, P., Kucks, R., Miles, W., Pilkington, M., Roberts, C., Roest, W., Rystrom, V., Shearer, S., Snyder, S., Sweeney, R., Velez, J., Phillips, J. and Ravat, D. [2002]. Digital data grids for the magnetic anomaly map of North America. https://pubs.usgs.gov/of/2002/ofr-02-414/.

Clark, D. and McPherson, A. [2012]. Neotectonic Features Database. Geoscience Australia, Canberra.

Congedo, L. [2021]. Semi-Automatic Classification Plugin: A Python tool for the download and processing of remote sensing images in QGIS. Journal of Open Source Software, 6(64), 3172. https://doi. org/10.21105/joss.03172.

Cramer, M.D. and Barger, N.N. [2013]. Are Namibian fairy circles the consequence of self-organizing spatial vegetation patterning? PLoS ONE, 8[8], e70876.

Darrah, T., Howat, I., Moortgat, J. and Whyte, C. [2024]. Systems and methods for discovering and recovering subsurface fluids and verification of subsurface storage fluids. US Patent App. 18/528,434.

Dauth, C. [1997]. Airborne Magnetic, Radiometric and Satellite Imagery for Regolith Mapping in the Yilgarn Craton of Western Australia. Exploration Geophysics, 28(2), 199-203. https://doi.org/10.1071/EG997199.

Donzé, F.V., Bourdet, L., Truche, L., Dusséaux, C. and Huyghe, P. [2024]. Modeling deep control pulsing flux of native H2 throughout tectonic fault-valve systems. International Journal of Hydrogen Energy, 58, 1443-1456. https://doi.org/10.1016/J.IJHYDENE.2024.01.178.

Duval, J., Carson, J., Holman, P. and Darnley, A. [2005]. Terrestrial Radioactivity and Gamma-ray Exposure in the United States and Canada. https://pubs.usgs.gov/of/2005/1413/.

European Space Agency, Sinergise. [2021]. Copernicus Global Digital Elevation Model. Distributed by OpenTopography. https://doi. org/10.5069/G9028PQB. Accessed: 2024-03-14.

Getzin, S., Yizhaq, H. and Bell, B., et al. [2016]. Discovery of fairy circles in Australia supports self-organization theory. Proceedings of the National Academy of Sciences, 113(12), 3551-3556.

Gunn, P.J., Minty, B.R.S. and Milligan, P.R. [1997]. The Airborne Gamma-Ray Spectrometric Response Over Arid Australian Terranes. In A. G. Gubins [Ed.], Proceedings of Exploration 97: Fourth Decennial International Conference on Mineral Exploration, 733-740.

Guo, J., Fan, H., Wang, X., Zhang, L., Ren, L., He, Y., Ma, F., Meng, W., Bai, X. and Yin, J. [2019]. Integrating Geochemical Anomaly and Remote Sensing Methods to Predict Oil- and Gas-Bearing Areas in the Yanchang Oil Field, Ordos Basin, China. Earth

Sciences Research Journal, 23(1), 79-86. doi:10.15446/esrj.v23n1. 57544.

Hill, P., Kucks, R. and Ravat, D. [2009]. Aeromagnetic and Aeroradiometric Data for the Conterminous United States and Alaska from the National Uranium Resource Evaluation [NURE] Program of the U.S. Department of Energy. https://pubs.usgs.gov/of/2009/1129/.

IEA. [2023]. Global Hydrogen Review 2023. IEA, Paris. https://www. iea.org/reports/global-hydrogen-review-2023. License: CC BY 4.0. Jakimow, B., Janz, A., Thiel, F., Okujeni, A., Hostert, P. and van der Linden, S. [2023]. EnMAP-Box: Imaging spectroscopy in QGIS SoftwareX, 23, 101507.

Jensen, J.R. [1996]. Introductory Digital Image Processing: A Remote Sensing Perspective. 2nd Edition, Prentice Hall, Inc., Upper Saddle River, NJ. Juergens, N. [2017]. The biological underpinnings of Namib Desert fairy circles Science, 355(6321), 181-182.

Kalinowski, A. and Oliver, S. [2004]. ASTER Mineral Index Processing Manual. Geoscience Australia, Canberra. https://pid.geoscience.gov. au/dataset/ga/67973.

Korsch, R.J. and Doublier, M.P. [2015]. Major crustal boundaries of Australia. http://dx.doi.org/10.4225/25/555C181CC0EAE.

Kucks, R., Phillips, J., Duval, J. and Ambroziak, R. [1993]. Bouguer gravity anomaly data grid for the conterminous U.S. https://mrdata. usgs.gov/metadata/usgravboug.txt.

Lefeuvre, N., Truche, L., Donzé, F.V., Gal, F., Tremosa, J., Fakoury, R.A., Calassou, S. and Gaucher, E.C. [2022]. Natural hydrogen migration along thrust faults in foothill basins: The North Pyrenean Frontal Thrust case study. Applied Geochemistry, 145, 105396. https://doi. org/10.1016/J.APGEOCHEM.2022.105396.

Lin, L.H., Hall, J., Lippmann-Pipke, J., Ward, J.A., Lollar, B. ., DeFlaun, M., Rothmel, R., Moser, D., Gihring, T.M., Mislowack, B. and Onstott, T.C. [2005]. Radiolytic H2 in continental crust: Nuclear power for deep subsurface microbial communities. Geochemistry, Geophysics, Geosystems, 6(7). https://doi.org/10.1029/2004GC000907.

Meyer, J. and Juergens, N. [2019]. Microbial Communities and Their Primary Response to Conditions in Namib Desert Fairy Circle Soils. Microbial Ecology, 77(1), 171-185.

Minty, B.R.S. [1997]. Fundamentals of airborne gamma-ray spectrometry. AGSO Journal of Australian Geology and Geophysics, 17(2), 39-50. http://inis.iaea.org/Search/search.aspx?orig_q=RN:28049082.

Montero, D., Aybar, C. and Mahecha, M.D. et al. [2023]. A standardized catalogue of spectral indices to advance the use of remote sensing in Earth system research. Sci Data 10, 197. https://doi.org/10.1038/ s41597-023-02096-0.

Moretti, I., Brouilly, E., Loiseau, K., Prinzhofer, A. and Deville, E. [2021]. Hydrogen Emanations in Intracratonic Areas: New Guide Lines for Early Exploration Basin Screening. Geosciences 2021, 11(3), 145, https://doi.org/10.3390/GEOSCIENCES11030145.

Myagkiy, A., Moretti, I. and Brunet, F. [2020]. Space and time distribution of subsurface H2 concentration in so-called “fairy circles”: Insight from a conceptual 2-D transport model. Bulletin de La Société Géologique de France, 191(1), 13. https://doi.org/10.1051/BSGF/ 2020010.

Nakamura, A. [2016]. Complete Bouguer Gravity Anomaly Grid of Onshore Australia 2016. Geoscience Australia, Canberra.

Poudjom Djomani, Y. and Minty, B.R.S. [2019a]. Radiometric Grid of Australia [Radmap] v4 2019 filtered pct potassium grid. Geoscience Australia, Canberra. http://dx.doi.org/10.26186/5dd48d628f4f6.

Poudjom Djomani, Y. and Minty, B.R.S. [2019b]. Radiometric Grid of Australia [Radmap] v4 2019 filtered ppm thorium. Geoscience Australia, Canberra. http://dx.doi.org/10.26186/5dd48e3eb6367.

Poudjom Djomani, Y. and Minty, B.R.S. [2019c]. Radiometric Grid of Australia [Radmap] v4 2019 filtered ppm uranium. Geoscience Australia, Canberra. http://dx.doi.org/10.26186/5dd48ee78c980.

Raymond, O.L., Liu, S., Gallagher, R., Zhang, W. and Highet, L.M. [2012]. Surface Geology of Australia 1:1 million scale dataset 2012 edition. https://dx.doi.org/10.26186/74619.

Rigollet, C. and Prinzhofer, A. [2022]. Natural hydrogen: a new source of carbon-free and renewable energy that can compete with hydrocarbons. First Break, 40(10), 78-84.

Rodarmel, C. and Shan, J. [2002]. Principal Component Analysis for Hyperspectral Image Classification. Surv Land inf Syst 62

Roy, D.P., Wulder, M.A., Loveland, T.R., Woodcock, C.E., Allen, R.G., Anderson, M.C., Helder, D.L., Irons, J.R., Johnson, D.M., Kennedy, R.E., Scambos, T.A., Schaaf, C.B., Schott, J.R., Sheng, Y., Vermote, É., Belward, A., Bindschadler, R., Cohen, W.B., Gao, F., Hipple, J.D and Zhu, Z. [2014]. Landsat-8: Science and product vision for terrestrial global change research. Remote Sensing of Environment , 145 , 154-172. https://doi.org/10.1016/j.rse.2014.02.001.

Shaik, R.U., Periasamy, S. and Zeng, W. [2023]. Potential Assessment of PRISMA Hyperspectral Imagery for Remote Sensing Applications Remote Sensing, 15(5), 1378.

Smith, N.J.P., Shepherd, T.J., Styles, M.T. and Williams, G.M. [2005]. Hydrogen exploration: A review of global hydrogen accumulations and implications for prospective areas in N.W. Europe. Petroleum Geology Conference Proceedings, 6(0), 349-358. https://doi. org/10.1144/0060349.

United States Geological Survey. [2021]. United States Geological Survey 3D Elevation Program 1/3 arc-second Digital Elevation Model. Distributed by OpenTopography. https://doi.org/10.5069/G98K778D. Accessed: 2023-11-08.

Vincent, R.K. [1997]. Fundamentals of geological and environmental remote sensing. Prentice Hall Series in Geographic Information Science. xiii 370 pp. Hemel Hempstead: Prentice Hall. Price £25.95 [hard covers]. ISBN 0 13 348780 6. Geological Magazine. 1998, 135(6), 819-842. doi:10.1017/S0016756898391505.

Wilford, J. [2002]. Airborne gamma-ray spectrometry. Geophysical and Remote Sensing Methods for Regolith Exploration, CRCLEME Open File Report, 144

Zgonnik, V. [2020]. The occurrence and geoscience of natural hydrogen: A comprehensive review. Earth-Science Reviews, 203, 103140. https://doi.org/10.1016/J.EARSCIREV.2020.103140.

ADVERTISEMENT

15-16 OCT. 2024

KUALA LUMPUR / MALAYSIA

Seisnode – A view on ocean bottom nodes from the geophysical side

Jeroen Hoogeveen1,2*, Per Helge Semb3 and Wietze Eckhardt1 present a methodology for bringing down the costs of OBN surveys through access to larger numbers of compact nodes with sufficient endurance to allow more efficient survey designs, negating the need for rolling and reducing source effort.

Introduction

Ocean Bottom Nodes (OBN) are recognised for delivering good quality data and are increasingly relevant now that increased computer power is allowing for better use of the full wavefield. As the cost of computing power reduces in line with Moore’s Law, geophysicists are able to implement ever more correct implementations of the wave equations.

Though often already considered a good value investment, OBN surveys remain relatively costly, mostly due to challenges in deployment and recovery.

Access to larger numbers of compact nodes with sufficient endurance would allow more efficient survey designs, negating the need for rolling and reducing source effort – which is also positive from an environmental perspective. If at the same time node handling costs could be reduced, then clearly this would make a profound difference, when deciding on the use of OBN technology for a seismic acquisition project.

So how to get there? Throughout the history of the seismic industry many attempts have been made at bringing down the costs of OBN surveys, with varying degrees of success. Around 2019 several factors came together that opened a new window of opportunity. Sufficient experience had been gained in OBN surveys to realise that the technology was delivering significant value, as Full Wavefield Inversion (FWI) became increasingly available, and processing of node data continued to improve. Design and manufacturing technology had become accessible outside big companies. Semiconductor technology, evaluation boards and software ecosystems were all mature and readily available. But what sparked the Seisnode venture, which made the development compact was the realisation that the seismic data itself could be used to calibrate timing. This insight solved

1 Seisnode BV | 2 Geoex MCG | 3 Seismic Partner

a fundamental problem of keeping time underwater as every shot effectively could be seen as a calibration point. Precise timekeeping is vital to correct and accurate data processing. As GPS signals attenuate very quickly in water, power-hungry clocks such as Chip Scale Atomic Clocks (CSAC) or similar devices are traditionally used to ensure the required accuracy.

Solving for time and position

Initially, efforts were focused on understanding the issues associated with clock error. There are many types of electronic clocks with many compensation schemes built in to improve stability. These compensation schemes invariably have a negative impact on the power usage of the clocks. Modern high-end electronic clocks, also used in similarly demanding applications such as telecommunication and networking, are very stable indeed, but still have a cumulative error exceeding requirements imposed by the physics of the seismic experiment. However, the best electronic clocks may be designed for sufficient stability under normal usage conditions, such that the cumulative clock error, expressed as an error in arrival time, is predictable.

Many external factors influence the observed arrival times of events on a seismic recording that have nothing to do with the clock, notably water column velocity changes, tidal height, navigation error, currents, waves etc. as shown in Table 1.

These factors all affect data recorded by a marine node no matter how accurate a clock is implemented. Consequently, many processing methods have been developed to deal with these factors, which are especially relevant for 4D surveys.

Picking method Y 1.5 ms Systemic Array dimensions Y 1.5 ms Systemic Crab angle Y 0.5 ms Systemic

Source mis-timing Y 1.0 ms Random

Tidal heights Y 0.5 ms Systemic Water column approx. 0-5 ms Systemic Currents approx. 1.0 ms Systemic Table 1 External factors perturbing arrival times.

* Corresponding author, E-mail: jeroen.hoogeveen@seisnode.com DOI: 10.3997/1365-2397.fb2024048

Figure 1 Seisnode compact node design.

It was noted that there are analogous timing challenges in land seismic data acquisition – although these issues have different causes primarily associated with unconsolidated ground and shallow velocity anomalies. As with marine seismic, many techniques have been developed to handle these types of issues.

Nevertheless, the fundamental problem of extracting timing information from seismic data is unconventional. It may be considered as 'needing the solution before starting to solve the problem' However, taking the travel time equations and looking at the problem from a purely mathematical perspective, there is much information in the recorded data that we may use to solve the problem. Starting from first principles, travel time of a wave is governed by the distance travelled and the velocity of the wave propagation through the traversed medium. In the simple situation of the direct wave, the medium is water, and the position of the source is known with a reasonable degree of accuracy.

The distance between source and receiver can be calculated from their positions as follows:

need to incorporate the seismic velocities of the layers, thus a model of the shallow geology would need to be built. This in turn introduces more variables, but also gives rise to more equations. Such an approach has been done by Zinn (2015) for first break positioning and can be extended to solve for timing. Similarly, one may also extend the method to make use of the geophone (or accelerometer) data.

On synthetic data this process worked very well, but once applied to real data it became clear that the problem was not so easily solved. Initially, a single six parameter least squares solver was used, but this proved to be difficult to manage in practice and unstable in many situations.

A cascaded solver method was developed which was subsequently patented. This method allowed the problem to be broken down into several steps as each individual step could then be controlled.

Dedicated software was also developed to split the data into SEG-Y frames according to the source times, followed by a Seismic Unix-based process to pick direct arrivals past the refractions including logic to clean up mis-picks. The sampling rate was 1 ms which made a positive difference, as trial with data resampled to 2 ms showed worse results.

The distance can also be calculated as the product of the observed travel time and the water velocity plus some eternal factors and noise:

An important part of the method is ensuring that the information supplied to the solver is clean. This information consists mainly of direct arrival times as observed on the hydrophone data as recorded by the receiver node. Figure 2 shows a receiver gather, consisting of one sail-line pass with several hundred shot points (SP) worth of source events of a penta–source marine airgun survey. The green line indicates arrival times of the direct wave as detected by the picking method. The lower image is a zoom showing the individual picks corresponding to each source event, which should be at the first rise of the direct wave event as registered by the node. Where the method does not detect a valid pick, it defaulted to a value of zero, which stand out as vertical green stripes in Figure 2.

An important diagnostic tool was linear moveout (LMO) plots. Application of linear moveout correction subtracts the travel time from the observed arrival time. Hence, if the timing,

In the above equations the highlighted variables: receiver position rx ,ry ,rz, the clock drift C, clock offset D and the water velocity v water, are all unknown. However, we have such a set of equations for the range at each observed shot point. There are usually hundreds if not thousands of shots where the direct arrival may be observed in the data, making for a very over-determined system of equations.

Further investigation revealed that the variables are indeed independent, meaning that they can be individually resolved. In certain cases, especially when there are a limited number of observations from far offsets only, certain variables exhibit co-dependency, rendering the method unstable without further a piori input.

It is easy to imagine that this approach may be extended to refracted and reflected arrivals, The travel time equations would

Equation 1 Range calculation from positions.
(2)
Equation 2 Range calculation from observed arrival time
Figure 2 Receiver gather with picked direct arrivals in green; lower image is a zoom of the upper image, mis-picks shown as vertical stripes.

positions, and velocities are correctly accounted for, all LMO corrected direct arrivals for a node should be corrected to T = 0.

Figure 3 shows the effect of applying the right corrections to the data. In the top image, the receiver position was perturbed by a few metres only, and the clock drift was off by 0.1 ms/day.

The cascaded solver method enables one to solve the position to within 1 metre and the timing to within 1 ms. Should the node position inadvertently have moved during the survey, the change in location will be immediately apparent on the LMO plots.

One should recognise that the marine environment is very dynamic with ocean currents, tidal currents, changes in seawater temperature, changes in salinity, and changes in sea surface height over time. However, over the timespan of a few hours the environment is relatively stable, and the clock is also likely to have little drift. For these reasons it is meaningful to estimate water velocity and drift over the span of a few hours, which corresponds nicely with the duration of a conventional sail line in marine acquisition. Thus, an estimate of instantaneous clock error defined as [clock drift × elapsed time + clock offset], which expresses itself in the data as a static error, may be estimated for each sail line. For very far offsets it is possible to stack LMO corrected gathers from one sail line and thus still get an estimate of static error at that sail line. This is shown in Figure 4.

In the case of the clock used in the Seisnode units, the drift is well behaved and linear. This is as expected according to the specifications of the clock crystal. It is conceivable that due to

large temperature variations a non-linear correction could be required, however this does not pose a problem. The net result allows the effect of the clock drift to be removed as shown in Figure 5, which is done before delivering the data.

The velocity of pressure waves in water is not constant: we know it depends upon salinity and temperature. We may estimate this velocity from the moveout of the data. An example of the resulting estimates of water velocity per acquisition sequence is shown below in Figure 6. Should it be required, it is relatively easy to build in a more complicated water column model.

Special cases

The method also works when there is non-uniform source coverage over a node. In this case the solution needs to be stabilised by using prior knowledge of node position and depth. A simulation whereby the data used for the solver method was restricted to offsets greater than 2500 m from only one side was done to get a better understanding of the sensitivity. In this simulation the unconstrained solution started to mix the depth correction and the drift correction, which may be explained as consecutive sail lines in increasing lateral offset also happened to be acquired sequentially in time. Thus, the increase in static observed could either be due to an increase in node depth, or an increase in the drift. This uncomfortable result could easily be stabilised by fixing the node depth at a known measured value. After all the node depth was logged at deployment and recovery, and in addition the bathymetry was well known.

Another interesting situation may arise when the nodes are not synchronised with GPS time before and after the survey. In such a case the node start time (equivalent to the clock offset variable mentioned earlier) and clock drift would be completely unknown. In the case of a conventional seismic survey, it is possible to correlate the end of sail lines as observed in the data, with the time of the last shot point of each sail line. We focus on the last shot point because we assume that the seismic sources are activated prior

Figure 3 LMO gathers with overlaid picks. Upper image: LMO gather with incorrect position. Lower image: LMO gather with corrected position and timing.
Figure 4 Static error due to clock drift observed on each sail line versus elapsed days. Figure 6 Water velocity as estimated for each sail line.
Figure 5 Clock drift removed.

to line start as part of ‘soft start procedures’ normally in place to protect marine mammals. It is also possible to recognise the portion of a sail line closest to a node by viewing the amplitudes. Figure 7 shows such a recording over three days (72 hours).

At this point it is possible to know the clock offset to with a few seconds. Further refinement is then possible by cross-correlating proximal shot point arrival times – as observed in the data – and shot points times as registered by the navigation system.

In the case of a non-conventional survey such as a passive monitoring survey, it is possible to use techniques borrowed from land seismic processing such as surface consistent static analysis to synchronise timing across nodes.

The adage that field acquisition problems should not be sorted by processing is relevant, but in this case, we believe that using the inherent data redundancy to synchronise the node data with the source timing is justified. The accuracy of the method is proven, and the time and cost of the method is minimal. The benefits of simplicity, compactness and extended endurance of the node design are significant.

The solver method is node agnostic and may be applied to any recorded node data, allowing timing and positioning to be resolved in case a node failed to synchronise on deployment, or if the node moved during the survey.

We should bear in mind that the external factors mentioned in Table 1 still need to be dealt with in processing, especially in the case of 4D. See for example Holden et al (2013), and many other case studies.

Node design

The starting point for the node design was that the node needed to be safe, compact, have good weight-to-volume ratio to ensure coupling, incorporate very good sensors and be able to record reliably for months at high resolution.

As proof of concept and to do some early sensor tests a simple data logger was built. This also allowed for some short shallow lake tests to get data for the solver method.

Omni-directional geophones were chosen to measure particle motion, as these sensors perform well, are robust, are industry proven and do not require power. Once again a data driven approach allowed us to simplify the design, as a method was developed to extract the orientation of the node directly from the data. The orientation extraction method was broadly based on thesis work done by Patterson (2016). An example of rotated geophone data from Seisnode field data is shown below in Figure 8.

Next the electronics design was optimised using low-power Micro Control Units (MCU) and high specification Analogue to Digital Converters (ADC) as a basis. The whole design was minimalistic in line with the overall design philosophy. The first prototypes used

off the shelf battery solutions, but it was necessary to optimise the battery pack shape factor to the cylindrical design. Lithium-ion cells that are mass produced for the electric vehicle industry were chosen and embedded in the design with full protection circuitry.

Other design challenges were overcome, resulting in a simple cylindrical design.

The design was subjected to hyperbaric trials at NIOZ (Netherlands Institute for Marine Research), field trials in Norway and instrument tests at Verif-I. The cylindrical design as shown in Figure 1 was patented.

Further extended survey trials were conducted in survey conditions, which also allowed comparison with nodes from other manufacturers. This culminated in sufficient confidence to invest in a larger production run of 1000 units which was later extended to 2000 units.

Application in the field

In parallel with the node design, the supporting hardware and software to enable large-scale field operations were developed in-house. These consisted of software to interact with the nodes and download data, a fast switch connected to a server with large data storage, power supplies and a GPS time server. The GPS time server enabled us to establish internal node time, as registered by the internal clock, to GPS time.

A lightweight portable field kit, transportable as carry-on luggage on commercial flights was developed for small scale operations and compliments the larger field set ups developed for operations exceeding 100 nodes. All peripheral equipment is designed under the same philosophy with the addition of scalability to quickly expand for projects requiring several thousand nodes. The goal of downloading all data from a node and recharging the node in 12 hours was achieved, with only the longest of surveys requiring download and recharge times outside this spec prior to direct redeployment.

The compact node design allowed us to consider pallet-based transport as illustrated in Figure 9, and further development is continuing to reduce the total footprint on board as well as transportation costs.

The solver flow uses raw binary data from the node, navigation data containing source event information, GPS synchronisation data, bathymetry data, water velocity information and node receiver positions as registered in the field. The flow has been optimised to run in batch mode, so solutions could be calculated and applied during the process of outputting the data as navigation merged SEG-Y data. Normally the flow can be run upon node recovery as long as the navigation data is available to the field engineer.

Quality Control (QC) of the solution is considered very important and thus a quality factor was built into the solver

Figure 7 72 hours of hydrophone data showing five sail line sequences.
Figure 8 Smily plots showing data-driven rotation to Northing, Easting and vertical. The plots show local timeslices through LMO corrected rotated data.

to estimate the quality of the solution. This is essentially the normalised sum of the calculated arrival time minus the corrected observed arrival time.

Visual QC was implemented by outputting LMO gathers inline (for example as shown in Figure 3), LMO gathers crossline as well as time slices through LMO gathers.

To date the seisnodes have been exposed to high-pressure testing, fridge and freezer tests, endurance tests operating at depth in a fjord, several pilot projects and 452 units are currently deployed for a well monitoring survey for an IOC. An inventory of 2000 nodes has been built up, an ultra-deep water and a high-resolution version are under development and we are working together with partners to develop efficient ROV-based operations.

Survey design options

To optimise OBN surveys in terms of amount of data recorded and avoid unnecessary vessel time, it is advantageous to deploy all node locations ahead of acquisition startup.

Traditional OBN surveys require a significant number of nodes to fill all receiver preplot-locations. Due to factors including battery endurance, node inventory, node handling infrastructure, etc. it is often difficult to achieve this. Instead, alternative acquisitions configurations have been developed which in most cases increase survey duration and cost, and result in less data recorded.

There are mainly two ways to overcome being limited by the number of nodes: roll the nodes through the survey area or acquire the survey in patches (Figure 10). A rolling operation will require close collaboration between the node handling vessel and the source vessel. For most operations this results in more vessel time, longer duration, and increased costs.

A patch operation, on the other hand, will require significant parts of the survey to be acquired twice to ensure the required offsets are met, as illustrated by the grey area in Figure 10. This, again, will increase both the duration and costs. For both configurations, crossline offset are compromised which significantly reduces the number of data points recorded.

Deploying all nodes before the start of the source operation avoids reshoots and time-consuming rolling operations. This

approach will also increase the number of source points recorded, as shown in Figure 11.

With access to large quantities of small and cost-efficient nodes with long battery life it is possible to minimise vessel time by avoiding rolling or patch operations. This will have the potential for significant cost savings. In addition, significantly more data is recorded which will contribute to a better product.

Conclusion

Having done the design and testing, we have shown that geophysical data driven methods may be relied upon to determine node time and position to a high degree of accuracy that is on par with other methods. The method is flexible and allows one to monitor position and timing during the survey.

This insight has allowed Seisnode to build a compact, long endurance node that will allow more efficient survey designs, reducing node handling effort and reducing the cumulative sound emissions necessary for a survey.

Acknowledgements

The data shown in this article were recorded during hybrid streamer and node multiclient survey on Q35 and Q35N in Norway acquired by PXGEO for Geoex MCG Ltd. and Seismic Partner AS.

References

Holden, J.P. et al [2013] Deep water Ocean-Bottom Node processing; a West of Shetland case study, 75th EAGE Conference. Patterson, F. [2016] Data driven Orientation Determination of Multicomponent Seismic Sensors, Master Thesis, Delft University of Technology, ETH Zürich, RWTH Aachen University. Zinn, N.D. [2015]. Reintroducing (refracted) first breaks into ocean-bottom seismic positioning, SEG Annual Conference.

Figure 9 216 Seisnode nodes ready for shipping.
Figure 10 Rolling operation versus dual patch.
Figure 11 Left: CMP fold plot with limited xline offset. Right: CMP fold plot of the same configuration where all receivers are deployed for the entire duration of the survey.

Integrated geothermal asset understanding — The next generation of geothermal simulation

Jonathon Clearwater1*, Aygün Güney 2 , Melike Sultan Yılmaz 2 , Deniz Özbek2, Ali Bas˛er3, Önder Saraçogˇlu3 and Jeremy O’Brien1 present a new, model-based approach for addressing key challenges in developing geothermal resources.

The geothermal challenge

Geothermal resources are fascinating systems. They’re wonderfully complex, each one is unique, and they require a wide range of scientific disciplines and creative thinking to understand. Fluid flow in these systems is influenced by thermodynamics and permeability is controlled by a subtle interplay between structures, lithology, fracturing and alteration. They can exhibit nonlinear behaviour, with transient changes in phase from liquid to steam as a system responds to development. They’re highly uncertain and sparse in data when compared with their hydrocarbon peers, with each new well or field survey updating our conceptual understanding of the geothermal system. All of which is why, scientifically, we love them, and they hold geoscientists in thrall for their careers as we seek to unravel their mysteries. Commercially though, this level of intrigue is less than ideal. We need the right data, tools and process to manage and understand them.

A key tool in enabling the sustainable, cost-effective development of geothermal resources is reservoir simulation. A good reservoir model is based on insight from geology, geophysics, geochemistry, and reservoir engineering. Unfortunately, many of the modelling tools used by geothermal operators lack key features that limit their effectiveness in assessing and managing geothermal systems. In order to use models to make better decisions, operators need modelling tools that are easy to use, fast to run and include the functionality to link reservoir con-

ditions through to fuel supply forecasts at surface. Historically, geothermal scientists have tried various approaches to manage the complexity of these systems by combining separate models.

For example, a 3D geological model will be developed to define the spatial distribution of rock types in the resource and a conceptual model will expand on this, using insights from geochemistry, geophysics and reservoir engineering data, to indicate reservoir boundaries, flow paths and other key features of the geothermal system. This conceptual model forms the basis of the reservoir flow simulation model. A reservoir flow simulation model needs to be developed and calibrated to measured data. A wellbore model is required to simulate how fluid is extracted from the reservoir to predict production flows at operating wellhead pressures, and the key constraints and processes in surface networks and power plants need to be taken into account to make a realistic forecast of power generation. Historically in the industry this had led to all sorts of approaches linking numerous software packages, spreadsheets, old codes and various scriptbased solutions to pull together different components.

Introducing coupled geothermal simulation — Volsung

Volsung is an integrated solution to comprehensively model and simulate geothermal processes, from subsurface reservoirs to surface systems. This holistic simulation combines reservoir,

1 Seequent | 2 Sanko Enerji | 2 Flux Energy Solutions

* Corresponding author, E-mail: Jonathon.Clearwater@seequent.com DOI: 10.3997/1365-2397.fb2024049

Figure 1 Performance benchmarking using different CPU and GPU architectures for Volsung from Franz et al 2019.

wellbore and surface network simulators, along with helpful applications to support uncertainty analysis, detailed reservoir engineering analysis and 3D data visualisations. This end-to-end analysis, and the ability to integrate every element of the science in a single package, offers major advantages to geothermal teams. The software has now been applied to real world problems in New Zealand (Franz et al. (2019), McLean et al. (2020), Quiano, et al. (2020)), United States (Gold, et al., (2024)), Indonesia, Philippines (Cinco et al. (2020)), Japan and Türkiye (highlighted in this paper).

Reservoir simulation

The reservoir simulator is the computational engine of the Volsung software package. It simulates multi-phase, multi-component flow through porous and fractured media. The Volsung reservoir simulator has been optimised by utilising parallel computing methods on both CPU and Graphical Processing Unit (GPU) architectures. By doing this it reduces model run times by about an order of magnitude, depending on the memory bandwidth of GPU as shown in Figure 1.

A key input to the reservoir simulation model is a robust conceptual model. This helps the numerical modeller assign the distribution rock properties and boundary conditions in the model in a way that is consistent with geoscience. Simulation models that are based on a robust conceptual model are developed in less time and lead to a greater confidence in model predictions. Improvements in the workflow of transferring conceptual model information into the simulation modelling framework are therefore significant in leading to the better use of models in the geothermal industry and better management of geothermal resources. In 2023 functionality was added to Volsung for quickly transferring model outputs from Leapfrog Energy to import conceptual model elements into Volsung. This workflow is based on using volumes and faults from the Leapfrog Energy model to define numerical model regions and adding qualitative conceptual model elements using geo-referenced cross-section image files. Well track information can also be exported from Leapfrog Energy to Volsung. All data are represented and transferred independent of a particular explicit grid structure. Outputs from the numerical model simulation, such as the time-dependent spatial distribution of pressure and temperature, can be exported from Volsung and imported back into Leapfrog Energy to be visualised in conjunction with other multi-disciplinary geoscience data. Any revision to the geological or conceptual model can easily be transferred to Volsung to update the associated reservoir numerical model, leading to a robust system for updating and maintaining models over the duration of a geothermal resource development.

This workflow is a practical and efficient methodology for fast-tracking the development of a simulation model. It reduces simulation model development time and enables teams of

geoscientists to collaborate to produce better numerical models, leading to higher confidence in simulation model predictions and improved geothermal reservoir management.

Wellbore simulation

Volsung’s wellbore simulator, as shown in Figure 3, features as a standalone GUI to model individual wells and as a fully integrated simulator to run coupled reservoir-wellbore-surface network simulations.

The wellbore simulator is based on solving the ordinary differential equations for mass and heat along a wellbore. Several different wellbore simulation modes are available. The most common ones allow the modeller to simulate single wellbore conditions — for example when comparing to PTS (pressure, temperature and spinner) surveys — or for determining the wellhead characteristics such as a deliverability curve plot of production rate versus wellhead pressure.

Several properties of the wellbore model can be time dependent, such as the casing diameter or rugosity, feedzone productive indices and reservoir conditions. This allows the user to predict changes in well production associated with scaling, cleanouts, or changes in reservoir conditions.

A key feature of the Volsung system is that flow from the reservoir simulation can be coupled to a wellbore model. The standard approach when simulating production from a well is to extract a certain amount of mass from a reservoir model block coincident with a well’s feedzone. However, unless the thermodynamic conditions at the model block are fed through a calibrated wellbore model there is no guarantee that the feedzone could actually produce the amount of fluid being asked of it. This motivates the requirement for some type of check that conditions at the feedzone are sufficient to produce. An additional complication takes place when a well has multiple feedzones. If a well has one feed in a deep liquid zone and another feed in shallow steam zone these two zones may evolve differently during a forecast scenario and the relative contribution from each feedzone may change drastically. If this process is not modelled properly then forecasts can become inconsistent with physics.

Surface network modelling

Another motivator for the coupled wellbore simulation approach is so reservoir modellers can provide the right answers through to operators. Typically, a manager or plant operator will want forecasts of fuel availability at plant operating pressures or makeup well requirements. This is very difficult to answer accurately with a reservoir model that only forecasts reservoir conditions (like reservoir pressures and temperatures). Coupling a wellbore model to the reservoir model enables wellhead deliverability curves for mass flow and enthalpy to be calculated from reservoir

Figure 2 A conceptual model in Leapfrog Energy (left) and the numerical model after the relevant data has been imported in Volsung (right).

conditions. These deliverability curves can then be linked to power plant requirements via a surface network model. This has the advantage that the full feedback loop between reservoir conditions, fuel availability, plant requirements and injection load is accounted for. The reservoir model can then be used to forecast power generation and make-up well requirements.

Calibration and uncertainty

Calibrating complex non-linear models to data available through field surveys can be a laborious and expensive task. The modeller needs to select a parameter set, prepare model input files, run the model and generate adequate output charts. After analysing the model outputs, updates to parameter values are made to attempt to improve the model match to measured data. This process is repeated numerous times until the output of the model matches the field data adequately. The process could be sped up by running multiple parameter sets in parallel. However, it is hard for the human mind to keep oversight when quickly switching between various model outputs and parameter sets.

With modern advances in artificial intelligence, it is plausible that the human modeller could soon be replaced by an artificial modeller who would be cheap to run and who would never require to sleep or rest. This is of course not currently possible, but nor would it be desirable to blindly trust a solution an artificial machine would come up with. Hence in the real world we must aim for a somewhat smaller target: we want to have an automated process which can improve solutions in a cost-effective way. The human modeller is still required. However, the human’s task is now to keep oversight over the calibration process rather than performing repetitive menial tasks. In mathematics, the field of inverse modelling techniques is used for this purpose. The principle is simple: Calculate a quantity (objective function)

describing the mismatch between a real-world observation and its modelled value then select an adequate algorithm which changes the model’s input parameters in such a fashion as to minimise this objective function. However, inverse modelling techniques go beyond simply finding an optimal parameter set for a model. They can provide parameter sensitivities, i.e. how much a model output changes for a change in given input parameters. They can also be used to provide constraints on model outcomes, i.e. in what range a modelled observation can change in a scenario for a given accuracy of the field data on which the calibration is based. This predictive uncertainty analysis can be a key model output for geothermal operators who want to minimise risk in geothermal developments and gain confidence in model predictions.

Inverse modelling techniques have been underutilised in the geothermal modelling context. The reasons for this are manifold. Chiefly, traditional reservoir simulators run very slowly. Since inverse modelling requires that a model is run many hundreds or thousands of times, it is easy to see that the inverse modelling runtime is prohibitive if a single model run takes in the order of many hours to even days. Secondly, it has been very hard to set up inverse modelling problems. Take, for example, a reservoir temperature survey along a well track. Extracting comparable data from a traditional reservoir simulator would require the modeller to interpolate modelled temperature from the grid block outputs, most likely requiring the modeller to write auxiliary scripts to perform this 3D interpolation. Once this is done an additional interpolation over time is required if the temperature survey falls between print times.

How to handle uncertainty in model forecasting is the flipside of dealing with uncertainty in model calibration. After calibrating a model some input parameters remain uncertain. These may be quantified by an automatic model calibration process or identified

Figure 3 A Volsung wellbore model presented in Quinao et al. (2020) that was used to assess well performance and predict future production based on changes in reservoir conditions.

qualitatively by expert domain knowledge. We want to reflect that uncertainty in the forecasts. To do this a common method is to make use of Monte Carlo forecasting, whereby the forecast is run multiple times and parameter values are sampled from an uncertainty distribution of possible parameter values.

Volsung enables both inverse modelling and uncertainty forecasting using Monte Carlo methods in a convenient package to encourage greater use of these approaches in the geothermal industry. An example of a Monte Carlo forecast from Volsung is shown in Figure 4, indicating the uncertainty in a power generation forecast as a result due of uncertainty in underlying model parameters.

Optimised simulation — Turkey

The application of the fully integrated package is highlighted by its use on the Caferbeyli geothermal field, located in Manisa, Turkey (now officially known as Türkiye), and operated by Sanko Enerji. Caferbeyli is characterised by distinct geological features and faulting events with fluid flow paths and heating closely linked to major faults and fractured zones. In the field, geothermal energy is stored in metamorphic rocks due to their heat retention capability and fracture formation characteristics. This characteristic has resulted in a highly fractured, liquid-dominated reservoir with high enthalpy, exceeding temperatures of 200°C.

The Caferbeyli geothermal field was first explored in the early 1970s, and along with various geological studies, an exploration well was drilled in the 1980s. Subsequently, in 2010, Sanko Enerji drilled additional exploration wells and obtained various data from both the field and the wells. As a result of these efforts, the first power plant, with installed power of 14 MWe, was established in 2017, with additional power plants added in 2019 to bring the total installed capacity to 70 MWe. Currently, geothermal fluid is produced from 10 wells and reinjected into the reservoir through 20 wells. Additionally, there are two observation wells in the field.

Sanko Enerji Group, one of the leading investors in the Turkish Energy market, develops, installs, and operates 100% renewable energy power plants and then sells and trades the electricity generated by these power plants. With an annual production capacity of 3.4 billion kWh all from renewable resources, the Sanko Enerji Group has a total installed capacity around 1000 MW with a portfolio of 15 power plants including six hydroelectric, six wind, three geothermal, two solar power plants.

Flux Energy Solutions is a company focused on bringing state-of-the-art modelling solutions to geothermal companies by implementing machine learning and AI into the workflow. Based in METU Technopolis, it provides services to major geothermal companies in the region. With a team of reservoir simulation

Figure 4 An example of power generation forecast from Volsung using Monte Carlo methods based on the uncertainty in input parameters.
Figure 5 Simplified geological map of the Salihli geothermal area (Aykaç et al., 2015)

experts with experience in oil and gas and geothermal, Flux strives to provide consultancy services using innovative technologies.

Sanko Enerji has partnered with Flux Energy Solutions to develop integrated wellbore and reservoir models of Caferbeyli, as well as machine learning applications to support reservoir management of the field. Sanko and Flux were looking for a modern modelling solution that was reliable, easy to use, and with a specific functionality to enable coupled well and reservoir simulations. They started working with Volsung in 2023 to address these requirements.

The first task for the team was to develop robust wellbore models. Wells with multiple feed zones were modelled and calibrated to data to identify the contribution of flow from each of them. Wellbore models are then run and compared with both the actual well performance data from wellhead and pressure and temperature surveys along the wellbore, as shown in Figure 6. Having reliable wellbore models enabled them to understand the behaviour of the wells under different production dynamics, which leads to reduced time for operational decisions and well downtime.

The second task the team has been working on is developing a natural state model of the resource and calibrating this to measured field data. Since Volsung includes a 3D viewer for creating and visualising reservoir models interactively, adding different formations, surfaces, and faults to the model was easy. In

Volsung, geometric shapes can be updated and edited within the software to introduce regions of heterogeneous rock properties or boundary conditions.

During natural state modelling, it is a common practice in industry to use different grid sizes. Using larger grids helps to capture the general dynamics of the field in earlier stages of modelling, while small grid sizes can model complex interactions between wells. It is often required to carry the results from the coarse to finer models. Since Volsung has its own interpolation interface, Sanko and Flux have also used this functionality within the software where the initial conditions for a simulation can be transferred from one model to another, even if the models have a different grid structure.

The next step will be calibrating the model to production history data, including tracer tests. During this phase, the calibrated wellbore models will be coupled with the reservoir simulator. This will ensure that the physics of wellbore flow, feed zone contributions, and feedback between well operations and reservoir response are considered during the calibration process. The calibrated model will then be forecasting future responses, and in this phase, the use of coupled wellbore models will ensure well deliverability is taken into consideration appropriately to predict future power generation and make-up well requirements.

The final step in this study is creating the machine learning models to help optimise the production and reinjection strategies thus, enhancing the reservoir management. In this stage, Volsung’s human readable XML input format helps to generate many scenarios easily. The ability to change all the production and reinjection rates in Python and then being able to run the software automatically is an excellent feature in creating the machine learning datasets. Since the output files are generally very big, especially in forecasts, in many other software it is usually an incredibly challenging task to parse these files to collect the simulation results as a batch. In Volsung on the other hand, each and every property can be read from HDF5 file specifically. For example, reading the temperature values of specific cells in many different time steps from 10 GB of output data can be done in milliseconds, which is a gamechanger when dealing with huge datasets.

In reflecting on Flux and Sanko’s Volsung journey so far, the team noted that Volsung’s user-friendly and intuitive interface has been a significant advantage. Understanding complex

Figure 6 A 3D representation of a Caferbeyli well in Volsung, with the wellbore model calibration to flowing PT data.
Figure 7 A conceptual model of the Caferbeyli geothermal field.

mathematical concepts and applying them to real-world scenarios has been a straightforward and natural process.

Summary

Harnessing geothermal energy’s significant potential requires modelling tools that are up for the task. They need to handle the complexity of geothermal systems but be easy to use and enable teams of geoscientists and stakeholders to communicate and collaborate. A key aspect of this is technology to provide robust analysis and reliable forecasts to optimise existing geothermal operations and support decision making on future developments. In this article, we have presented Volsung, a software package specifically designed for the geothermal industry and highlighted the use of Volsung in Turkey.

References

You can learn more about Sanko Enerji at https://www.youtube.com/ watch?v=j3iSadMFaNs, https://sankoenerji.com.tr/en.

Aykaç, S., Timur, E., Sari, C. and Caylak, C. [2015]. CSAMT investigations of the Caferbeyli (Manisa/Turkey) geothermal area. Journal of Earth system science, 124, 149-159.

Baxter, C., Clearwater, J., Franz, P., O’Brien, J. and Williams, B. [2023]. Fast-tracking numerical modelling projects using Volsung and Leapfrog Energy Proceedings of 45th New Zealand Geothermal Workshop.

Cinco, F., Framz, P. and Menzies, A. [2020]. Testing the Volsung Suite as a Reservoir Simulation software by comparing it with the TOUGH2 Tiwi Model. NGAP Webinar Series: Digital Applications.

Clearwater, J. and Franz, P. [2019]. Introducing The Volsung Geothermal Simulator: Features and Applications. Proceedings of 41st New Zealand Geothermal Workshop.

Duggal, R., Rayudu, R., Hinkley, J., Burnell, J. and Ward, S. [2021]. Performance of a Geothermal System in Petroleum Fields of the Taranaki Region, New Zealand. Proceedings 43rd New Zealand Geothermal Workshop.

Franz, P., Clearwater, J. and Burnell, J. [2019]. Introducing The Volsung Geothermal Simulator: Benchmarking and Performance Proceedings of 41st New Zealand Geothermal Workshop.

Franz, P. and Clearwater, J. [2021]. Volsung: A Comprehensive Software Package for Geothermal Reservoir Simulations Proceedings of World Geothermal Congress.

Franz, P. and Clearwater, J. [2021]. Volsung: Inverse Modelling And Uncertainty Analysis Using PEST Proceedings of 43rd New Zealand Geothermal Workshop.

Gold, A., Davalos Elizondo, E. and Kutun, K. [2024]. Evolution of a Complex Conceptual Geological Model for Co-Producing Electricity at the Blackburn Oil Field, Nevada Proceedings of 49th Workshop on Geothermal Reservoir Engineering, Stanford University.

McLean, K., Franz, P. and Clearwater, J. [2020] Swanhild: Numerical Pressure Transient Analysis Using the Volsung Geothermal Reservoir Simulation Package Proceedings of 42nd New Zealand Geothermal Workshop.

Quinao, J., Franz, P. and Clearwater, J. [2020]. Well Performance Diagnostics and Forecasting Using The Gudrun Wellbore Simulator – Case Studies From Kawerau, New Zealand Proceedings of 42nd New Zealand Geothermal Workshop.

Figure 8 The reservoir simulation model of the Caferbeyli geothermal field in Volsung.

Drone-based methane leak screening in energy infrastructure

Alexei Yankelevich1* analyses legislation and technology options and explains drone-based methane screening, which may significantly optimise current methane detection and quantification surveys.

Abstract

Methane is the second most potent greenhouse gas in the atmosphere, and emission reduction plans are reflected in most countries’ legislation. Though official plans for reducing fossil fuel usage or solid waste management may sometimes sound over-optimistic, the general vector for better control of methane leaks is obvious. It requires relevant methodology and technology to be spread widely. This article analyses legislation and technology options and explains drone-based methane screening, which may significantly optimise current methane detection and quantification surveys.

Legislation analysis

The adoption of technology significantly depends on legislation, as stated by the European Commission (2023) in Proposal for a Regulation of the European Parliament and of the Council on

methane emissions reduction in the energy sector and amending Regulation (EU) 2019/942.

The document imposes new duties on the energy sector and stimulates the use of technology for timely Leak Detection and Repair (LDAR) measures. Here are the key takeaways from the document:

• Submission of an LDAR plan is the responsibility of an asset owner

• LDAR plans should be different for above-ground, underground, distribution and transmission, and offshore (including below sea level and the seabed) types of components

• The LDAR survey can be of Type 1 or Type 2:

- Type 1 is a rougher survey that can be held more often with advanced technologies

- Type 2 is a more accurate survey with stricter requirements for leak levels

1 SPH Engineering

* Corresponding author, E-mail: ayankelevich@ugcs.com

10.3997/1365-2397.fb2024050

Table 1 Survey frequency. Source ‘Emils Lagzdins, IOGP, Senior Policy Officer, Methane Mondays Webinar, 11 December 2023’.

- Survey frequency depends on the survey type, inspected component type, and component material and may vary from 3 to 36 months. Below is a chart explaining frequencies depending on the parameters mentioned above.

• The leak repair threshold depends on the LDAR Type:

- In the case of type 1 leak detection and repair surveys, 7000 parts per million in the volume of methane or 17 grams per hour of methane;

- In the case of type 2 leak detection and repair surveys:

- 500 parts per million in the volume of methane or 1 gram per hour of methane for aboveground components and offshore components above sea level;

- 1000 parts per million in the volume of methane or 5 grams per hour of methane for the second step of underground components

- 7000 parts per million in the volume of methane or 17 grams per hour for offshore components below the sea level and below the seabed.

Fulfilling reporting requirements for asset operators means rapidly adopting new technologies and significantly reworking internal monitoring workflows on site, equipment, and component levels.

Industry practices

Building the optimal trajectory for making LDAR surveys is crucial to the corporate emission mitigation strategy. The following general decision tree can be applied to developing the organisation-wide LDAR program suggested by Carbon Limits AS (2023) in the report ‘Recommended practices for methane emissions detection and quantification technologies – upstream’. They divide quantification and screening into separate activities, which makes sense due to the lower cost of fast screening than quantification. To avoid any confusion:

• Screening is an activity of locating emission sources and ranging them by relative intensity for further analysis

• Quantification determines an emission rate, such as mass per time or volume per time. This can be done directly through

emissions measurement or indirectly through estimations, calculations, and modelling.

Speaking about emission reduction plans from the financial perspective in the long run, there are the following types of costs that can be reduced with a proper emission mitigation workflow:

• Cost of labour required to perform screening or quantification activities. In most cases, that has a linear dependence on the amount of man/hours spent

• Fines from regulators for missed emission sources, exceeding minimal repair limits

The suitable screening method should conform to the essential requirements:

• High speed of data collection

• Low dependence on the geometry and location of inspected equipment: landscape, vegetation, vertical structures

• Ability to collect data remotely to ensure the safety of personnel and reduce the chance of methane ignition

• Low false positive and false negative rates to minimise data verification effort

Technologies for screening

There are three popular technologies for screening:

• TDLAS remote laser sensors

• Optical Gas Imaging (OGI) cameras

• Sniffers

Table 2 compares the technologies for screening that may simplify the selection of technology for the application.

Drones introduce a good trade-off for some special cases when other carriers, handheld surveys, or stationary sensor deployment are not applicable. Table 3 is an analysis and decision matrix.

Most of the sensors (except OGI) are compact enough (under 1kg) to be placed on a small consumer drone, like DJI M300/ M350 or Inspired Flight 800 (Tomcat).

Figure 1 Part of the general decision tree, by Carbon Limits AS under the supervision of the IOGP Environment Committee.

Criterion TDLAS remote OGI Sniffers

Measurement type ppm x m Picture with highlighted leak area, sometimes flow rate ppm

Possible distance from sensor to the gas cloud More than 15 m More than 15 m Less than 15 m or enter the plume

Leak location Yes Yes Yes

Quantification Some cameras have algorithmic calculation Algorithmic calculation

Screening speed High Low Low or Medium

Implementation / Usage types

Handheld Often Often Often

Stationary mounted Rare Often Often

Car-based Rare Rare Often

Helicopter-based Often Rare Rare

Drone-based Often Rare Medium

Table 2 Comparison of the technologies for screening to help simplify the selection of technology for the application.

along the prepared roads

along any type of landscape or vegetation

Leak source on the earth’s surface location quality

Leak source of the vertical infrastructural object location quality

Large atmospheric pollution mapping convenience

Usage by ATEX zones

Drone-based solution applicability by equipment type

Speaking about the oil and gas industry, including biogas generation, we analysed sensor capabilities based on the efficiency of usage on drone-based platforms. The spreadsheet below shows the applicability of different drone-based solutions for various oil and gas equipment types.

One of the main takeaways from the spreadsheet is that drone-based solutions can be efficient with TDLAS remote laser methane detectors that are efficient for segments of transmission, distribution lines, or large landfill/biogas collection areas, filling the gap between foot search, a car-based survey, and helicopter. OGI cameras are beneficial when a bird’s-eye view of the facility

Table 3 Analysis and decision matrix of different tools used for screening.

* without entering the gas cloud

is needed or when it’s not safe to enter the area with a potential gas leak.

Project examples

Example 1

Source: www.sphengineering.com/news/laser-falcon-sensor-used-to-detect-methane-leaks-in-the-landfills-in-thenetherlands.

The consulting and engineering company Antea Group Nederland and drone service provider Aerial Intelligence conducted several tests on a project basis for measuring methane emissions at landfills in the Netherlands using the drone-based methane detection solution.

Handheld Car Drone (multirotor electric-powered) Helicopter

This inspection aims to obtain information about possible defects in the cover, detect differences in the landfill, and, in the future, even calculate annual emissions. After conducting several tests, the outcome turned out to be interesting. This encouraged them to fly into an entire landfill site for detailed and accurate analysis. Twenty four flights of approximately 25 minutes each were performed to measure the area in a flat terrain. In total, they recorded about 55,000 measuring points in three days. After collection, this data was processed into highly detailed emission maps. In addition, an orthomosaic was obtained of the current situation of the landfill.

Example 2

Source: https://pergam-suisse.ch/tpost/n5mvk6bhc1-skyebase-sph-engineering-and-pergam-repo.

SkyeBase’s DJI M600 drone was equipped with a Pergam Laser Falcon methane/natural gas detection laser-based sensor payload to perform the natural gas pipeline and facilities leak inspections. The drone mission was planned using SPH Engineering’s UgCS software, with data being accumulated onboard the SkyHub computer. The detection distance was between 30 and 50 m with a minimum measured value of 125 ppm×m* and 225 ppm×m. The device can measure methane (CH4) and gas containing methane (natural gas).

As a result, hard-to-reach locations were inspected and mapped safely and correctly, including hard-to-measure wet,

wooded, and densely built locations. ‘The measured methane emissions can be coherently captured and processed into useful insights to be displayed on a platform and in a report. This generates a quantitative insight into taking action, improving the return on investment, extending usage, and reducing environmental risks,’ said Bart Daniels, COO at SkyeBase.

Example 3

Source: www.sphengineering.com/news/drone-technology-enables-three-times-faster-methane-emissions-monitoring-in-landfills.

Symbiotica sets its sights on solid waste landfills, oil and gas plants, and wastewater treatment facilities, confronting the intricate challenge of surveying emissions from these sites.

The deployment of drone technology marked a significant leap forward, introducing improvements in speed, safety, precise emissions mapping, and the automation of monitoring processes.

According to Maurizio De Molfetta, the UAV activity manager at Symbiotica: ‘Up to 60 hectares of surface can be probed in a working day. It is an impressive demonstration of the time-saving capabilities of drone-based methane emissions monitoring.’

In contrast, the prevailing conventional approach involves a walkover survey employing a Flame Ionisation Detector (FID) instrument. This traditional method demands a minimum of three

Table
Figure 2 Flight plan covering the landfill area with UgCS software (Antea Group).
Figure 3 TDLAS methane detector Pergam Falcon mounted on DJI M300 drone (Antea Group).

full days of work to achieve coverage and resolution comparable to that of drones.

Figure 6 demonstrates emissive areas obtained by short-range interpolating of the detected emission points. Several emission points in a small area indicate how that area can be defined as emissive. As shown in the screenshot, the result is not about a single emission point found, such as a badly closed biogas well, but an area with widespread emission.

Conclusion

In conclusion, implementing efficient methane leak screening methods can significantly streamline the efforts required for on-site emissions quantification. Although drone-based methane screening solutions have yet to be adopted, formal regulatory approval and their role as complementary tools to established methods are evident in most cases. Drones can effectively replace ground personnel for initial inspections, supplement vehicular surveys in challenging terrains, and offer a more cost-effective

alternative to helicopter surveys for linear objects shorter than 600 km. Their ability to access hard-to-reach locations and provide rapid preliminary data makes them an invaluable asset in the layered approach to methane leak detection. As regulatory frameworks evolve, these innovative screening solutions are anticipated to become integral to standard practice, reflecting a continuing commitment to enhancing environmental monitoring through technological advancement.

References

Proposal for a Regulation of the European Parliament and of the Council on methane emissions reduction in the energy sector and amending Regulation (EU) 2019/942 https://data.consilium.europa.eu/doc/ document/ST-15927-2023-INIT/en/pdf.

Emils Lagzdins, IOGP, Senior Policy Officer, Methane Mondays Webinar, 11 December 2023: https://www.energy-community.org/dam/ jcr:da7cb018-cab7-4b8c-a603-713ac5eda812/3_MM%23&-2023_ IOGP%20Europe.pdf.

Recommended practices for methane emissions detection and quantification technologies – upstream https://www.ogci.com/wp-content/ uploads/2023/10/661.pdf.

World emissions map for oil & gas and coal https://www.iea.org/reports/ global-methane-tracker-2023/overview.

The Pipeline and Hazardous Materials Safety Administration (PHMSA) written clarification of the pipeline safety regulations (49 CFR Parts 190-199) in the form of frequently asked questions (FAQs) https:// www.phmsa.dot.gov/sites/phmsa.dot.gov/files/docs/technical-resources/pipeline/gas-transmission-integrity-management/62271/ faqsgas-transmission-integrity-management201904.pdf.

Figure 4 Methane concentration ppm x m along the road (SkyeBase).
Figure 5 Landfill methane collection system (Symbiotica).
Figure 6 Emission map (Symbiotica).

EAGE Workshop on Advanced Petroleum Systems Assessments

Embark on a journey towards mastering Advanced Petroleum Systems Assessments. Secure your spot now to unlock invaluable insights into the cutting-edge methodologies, technologies, and research driving today’s industry forward. Don’t miss out on this opportunity to expand your knowledge and skills. Register today and chart your course towards success!

From black to green gold: Leveraging diversity and innovation in the CCS era

Élodie Morgan1* and Habib Al Khatib1 explore the relationship between technology and talent in advancing carbon capture and storage solutions while leveraging skills developed in the oil and gas sector.

Abstract

In the effort to combat climate change and meet sustainable development objectives, the energy sector is facing a critical juncture. Over the past few decades, the oil and gas industry has played an indisputable role in driving economic growth and technological progress, significantly contributing to the development and modernisation of contemporary societies while ensuring energy accessibility for diverse populations. Amid the current challenges of energy transition, the oil and gas industry holds a central position. It now must shift towards sustainable practices and decarbonisation, all while maintaining energy security and affordability.

Moreover, it is also easy to recognise that historically the oil and gas industry has been heavily skewed towards male representation. Yet, amidst these challenges lies a unique opportunity for the subsurface industry to transition towards greater gender equality. Subsurface green business is a unique opportunity to actively promote diversity and inclusion initiatives, to effectively address the imperative for innovation in the energy transition. By breaking down barriers and creating equal opportunities for all genders, the sector can benefit from a broader talent pool and a range of perspectives, ultimately driving innovation and success in the transition towards sustainable energy solutions.

This article explores the interdependent relationship between technology and talent in advancing carbon capture and storage (CCS) solutions while leveraging skills developed in the oil and gas sector. By integrating insights from CCS requirements and constraints alongside the impact of diversity on innovation and performance, we aim to underscore the pivotal role of cultivating diverse talent pools in driving transformative change within the energy sector.

Introduction

Let’s start on a very positive note: a noteworthy trend within the CCS industry is the composition of teams, which tend to be younger, more diverse, and deeply committed to innovation and pioneering within this nascent field. This reflects a strong inclination among the younger and diverse generation to engage in environmental causes and align their professional roles with personal values.

1 SpotLight

* Corresponding author, E-mail: Elodie@spotlight-earth.com

DOI: 10.3997/1365-2397.fb2024051

Extensive research consistently underscores the positive link between diversity and innovation, as well as overall business performance. Numerous studies, among them some from McKinsey and Company, Harvard Business Review, and Deloitte highlight the benefits of diverse teams, demonstrating heightened levels of creativity, problem-solving, and financial success. Recognising this, forward-thinking organisations across various industries are actively investing in inclusive workplaces that harness the full spectrum of human potential.

However, in such a technically demanding arena, experience may sometimes present challenges to innovation, as new rules – both financial and environmental – come into play. Nevertheless, this fusion of diversity, energy transition, and novel challenges presents a golden opportunity for the oil and gas industry to reinvent itself sustainably, delivering affordable energy while concurrently sequestering carbon dioxide to meet net-zero objectives.

As we move forward, a pioneering era must emerge in the oil and gas industry. This requires talent, audacity, and agility to test and iterate for the better.

Tackling greenhouse gas emissions: the imperative of carbon capture and storage (CCS)

The 21st century has witnessed a troubling surge in global greenhouse gas (GHG) emissions, exacerbating the atmospheric concentration of these gases and intensifying the natural greenhouse effect, posing grave threats to life on Earth. Despite a temporary decline during the peak of the pandemic, global GHG emissions swiftly rebounded, surpassing pre-pandemic levels. In 2022, emissions soared to 53.8 Gt CO2eq, marking a 2.3% increase from 2019 and a 1.4% rise from 2021 (Crippa, M. 2023).

In the United States, a striking paradox emerges in the context of climate change mitigation efforts. While the nation’s projected target for 2030 should entail a reduction of 45% in greenhouse gas emissions to align with global climate targets, the United States finds itself with a concerning increase, standing at a staggering 9% (Figure 1). This significant disparity underscores the urgent need for decisive action to curb emissions and steer the country toward a trajectory that aligns with international climate objectives by 2030.

A new consensus is emerging: In order to align with the carbon budget required for the 1.5°C pathway, a significantly more aggressive reduction in emissions is imperative, especially within the next decade. The latest IPCC assessment report emphasises the necessity of deploying CCS as a crucial technology to achieve net-zero emissions. This sentiment is echoed in the final statement on CCS from COP28. CCS offers the most cost-effective option for deep decarbonisation across various hard-to-abate industries such as iron, steel, and chemicals.

A global perspective reveals a significant trend: CCS development has gained substantial momentum in recent years, propelled by heightened climate targets and increased policy support worldwide. The United States leads in CCS projects, with its landmark Inflation Reduction Act of 2022 expected to further drive technology deployment in the coming years. In Europe, countries like the UK, Netherlands, and Norway are exploring CCS development in regional industrial clusters, where multiple emitters can economically benefit from shared transportation and storage infrastructure. Moreover, the EU Net-Zero Industry Act reinforces its will to be a leading force for decarbonisation. In 2022 alone, 61 new CCS facilities were added to the project pipeline globally, bringing the total number of CCS projects to 30 in operation, 11 under construction, and 153 in development with a tremendous growth, of projected Mtpa (Figure 2).

This remarkable increase underscores the growing momentum behind CCS as a vital decarbonisation tool in the global fight against climate change. To fully leverage the potential of this pivotal industry, we must capitalise on existing resources.

The expertise and skills within the oil and gas industry will play a pivotal role in the success of this burgeoning green industry.

The oil and gas industry and its green skill intensity

The oil and gas industry has wielded considerable influence over the global economy, shaping geopolitical landscapes and modern lifestyles. Through innovations like hydraulic fracturing and deepwater drilling, the industry has pushed the boundaries of exploration and extraction, driving advancements in engineering and geology. Additionally, the sector’s extensive capabilities have fuelled the development of cutting-edge technologies, spanning drilling, underground monitoring, production optimisation, and digital twins. These advancements not only enhance efficiency and safety within the industry but also foster innovation across various sectors, from renewable energy to healthcare.

When it comes to CCS, the project lifespan closely resembles that of an oil and gas project. Initially, a characterisation phase is conducted to assess the long-term storage capacity. Subsequently, dynamic modelling, reservoir characterisation, well analysis, permitting, monitoring strategy, decommissioning, and considerations for wildlife and stakeholders are addressed (Figure 3). These steps mirror processes commonly encountered in the oil and gas industry, highlighting the transferability of expertise from one sector to another. This overlap underscores the potential for leveraging existing knowledge and infrastructure to expedite CCS development and implementation.

Figure 1 Predicted increase in global emissions in the United States (from UN).
Figure 2 CCS market evolution, US and EU (from IEA, 2024).

In today’s climate-focused era, the role of the oil and gas sector is evolving significantly. Green jobs and a skilled workforce are increasingly recognised as pivotal in meeting climate objectives. The World Economic Forum’s Future of Jobs Report 2023 indicates a notable rise in green job opportunities within the sector. LinkedIn data further highlights the manufacturing and oil and gas sectors as exhibiting the highest levels of green skill intensity. This underscores the potential for a green-skillsdriven approach to decarbonising these emissions-intensive industries.

Amidst this transformation, CCS emerges as a key player. With its potential to reduce carbon emissions and mitigate climate change, CCS represents a bridge between the traditional oil and gas sector and a sustainable future.

Despite the expertise transferable from the oil and gas industry to CCS, a notable discrepancy arises in economic constraints. As of 2 April, 2024, the price of Brent crude oil stood at $88.92 per barrel, while the SparkChange Physical Carbon Eua ETC per ton of CO2 was $61.92 where a European Union Allowance ‘EUA’ is a “permit to pollute 1 ton of CO2”. (Figure 4).

Converting these prices into tons, we observe that the price of a ton of Brent crude oil is approximately 10.57 times higher than the price of a ton of CO2 (Table 1).

This significant difference underscores the financial constraints of the emerging CCS market, despite the shared geological expertise. It emphasises the necessity for innovation and thinking beyond traditional oil and gas paradigms to effectively navigate the transition to a sustainable future. We believe incremental innovation on O&G technologies can’t match a factor 10 in cost reduction, therefore, disruptive innovation seems unavoidable, and will open an avenue for new talents and new companies to propose game changers.

Diversity drives innovation: Transforming the energy sector

In the CCS industry, where innovation is paramount, diversity is key; research by BCG reveals that companies with greater diversity outperform others in both innovation and EBIT. Urgent action is required from companies to enhance diversity among their employees and elevate diversity as a strategic priority.

Despite efforts to promote diversity, the percentage of women working in the oil and gas industry has remained stagnant at 22%, the same level reported in 2017 (Figure 5).

According to the World Petroleum Council’s 2020 Youth Survey, approximately one-third of respondents consider the energy transition as one of the most appealing aspects of their careers (Figure 6). Highlighting a company’s commitment to advancing the energy transition will increasingly become essential for attracting diverse talent.

Recent studies have shown that 80% of young professionals in the oil and gas sector are willing to transition to sustainability-aligned careers (Les Échos, 2023). The energy transition and the CCS opportunity present a golden opportunity to attract new entrants and diversify the existing talent pool.

Seizing this motivated talent pool for the energy transition could be the most effective way to tackle the challenges of the energy transition and drive innovation and change. Recent studies

Figure 3 Measurement Monitoring and Verification plan process flow for CCS (courtesy of Baker Hughes).
Table 1 Oil production versus
Figure 4 SparkChange launches world-first physical carbon ETC (from Google Finance).

underscore a significant willingness among young professionals in the oil and gas sector to pivot towards sustainability-aligned careers. Leveraging this talent pool and fostering diversity in CCS implementation are crucial steps towards accelerating innovation and progress.

Pioneer era: who can dare first?

The convergence of cutting-edge technology and diverse talent holds immense promise for realising a secure and sustainable energy future. By harnessing innovation and mobilising talent from various backgrounds, we can accelerate progress towards achieving climate goals and ensuring a prosperous future for generations to come (Figure 7).

Innovation alone can’t be enough, we need to try it, we need to fail it and to improve it. And taking into account the incredible CCS challenge ahead, there’s an urgent need for pioneers in the energy transition. A pioneer, by definition, is someone who leads the exploration and development of a new field of knowledge or activity. Yet, resistance to change in long-established industries like oil and gas remains strong. Companies comprised of experts deeply entrenched in oil and gas standards may struggle to be pioneers in the field of CCS.

Moreover, while skills may be transferable, the needs of CCS differ significantly from those of traditional oil and gas operations. Environmental concerns, public acceptance, financial considerations, and agility all pose unique challenges. Establishing trust and ensuring safety in carbon storage are paramount to the widespread adoption of CCS technology. Despite its potential, its high cost underscores the need for adherence to strict constraints.

In this context, diversity emerges as a critical asset. A pool of talent ready to transition from the oil and gas industry to the energy transition exists. However, attracting and retaining diverse talent, including women, remains crucial to achieving parity and driving innovation. CCS stands as a golden opportunity for the industry to reinvent itself, leveraging the potential of diverse talent and pioneering efforts to navigate the challenges of the energy transition successfully.

Pioneer experience

When I founded SpotLight, 7 years ago, I could not have imagined the impact we would have.

As a geophysicist, in an industry led by O&G players, we were using millions of sources and receivers pairs for subsurface monitoring.

Figure 5 Female representation in major industries in 2020 (from Future of Jobs Report 2023).
Figure 6 Energy Transition attractiveness (from Future of Jobs Report 2023).

Well, I demonstrated a groundbreaking frugal solution – by leveraging machine learning and large data modelling methodologies, we can use just one source and one receiver to monitor key subsurface areas one or two kilometres beneath your feet. This technological innovation drove Predictive Maintenance as a new frequent, agile, cost-effective and environmentally friendly surveillance solution for CCS.

Who will become CCS industry leader?

The economics of CCS are shaking up opportunities across the entire CCS chain, from capture to transport, storage, and monitoring. A group of companies is emerging as pioneers, offering innovative solutions tailored for CCS systems.

Historically, risk and societal acceptance have hindered CCS adoption. Any solution in this space must address these challenges swiftly to gain traction. In the early days of CCS two decades ago O&G players took up the challenge carbon dioxide storage. Successful projects like Sleipner opened the way. But this first wave went down, and no market emerged at that time. Therefore, many companies dismantled their CCS teams.

This new CCS wave is much bigger than the previous one and the market is almost there. In this new wave smaller independents in the US and Canada are joining the scene, reshaping the CCS landscape.

In the EU, projects like the first transborder CCS injection project GreenSand led by INEOS and Wintershall DEA, along with the Perenco UK, Carbon Catalyst and Wintershall DEA Poseidon upcoming offshore venture, showcase innovative approaches and pioneering spirit. These projects are the first of their kind and come sooner than other projects led by IOC. Furthermore, successful projects like GreenSand highlight how innovation and pioneering spirit can drive CCS progress and set new standards.

Some of these new projects aim to sequester more CO2 than those by the big players, signalling a shift in CCS leadership. This diversity marks the start of a new era, revolutionising how we approach carbon capture and storage.

In the dynamic domain of the CCS industry, I’ve witnessed a notable increase in diversity and a prevailing pioneer spirit, in stark contrast to my experience in the oil and gas sector. The shift from resource exploitation to waste management necessitates a comprehensive reassessment of our approaches,

advocating for a minimalist stance to fortify security and public confidence in underground CO2 storage. This return to fundamental principles, alongside insights garnered from the oil and gas industry and the wealth of subsurface data amassed over years of exploration and research, provides a fertile ground for innovation.

With a strong belief in the limitless potential for innovation in this transition from black to green gold, I am convinced that through collaborative endeavours encompassing major corporations, small enterprises, and start-ups, we can shape this nascent industry. By uniting under the banner of collaboration, we can collectively contribute to realising net-zero emissions and spearheading the pioneering efforts necessary to address the climate crisis (Figure 8).

Conclusion

To truly propel the CCS industry forward, we must harness the full spectrum of talent available – men and women, experienced professionals, and novices alike – all working towards the common goal of cost-effectiveness and long-term project sustainability. This entails developing user-friendly, environmentally conscious technologies that increasingly operate autonomously to ensure the safety of subsurface activities. Leveraging our collective talents, honed through extraordinary accomplishments in the subsurface industry, we can demonstrate how this subsurface expertise benefits the energy transition, adapting swiftly and effectively.

Quick note about climate change scepticism: the key may lie in embracing the younger technical generations, who are overwhelmingly driven by environmental values as well as diverse scientific profiles. By inclusively incorporating their perspectives and enthusiasm, along with industry expertise, we can forge a path forward towards a more sustainable future. Moreover, rather than losing talents to other sectors due to the misalignment of fossil fuel industries with their values, this transition of knowledge

Figure 7 Pioneers — First inter-country CCS project — Project Greensand.
Figure 8 CCS pioneer collaboration between start-up SpotLight and independant oil and gas company, Perenco. From left to right: Habib Al Khatib, Marta Puig, Elodie Morgan and Chris Furby.

can enable the industry to capitalise on its existing pool of talents while offering new career perspectives.

As we navigate the complexities of climate change and energy transition, the integration of technology and talent emerges as a cornerstone for success. By embracing innovation, fostering diversity and collaboration, we can unlock the full potential of CCS and pave the way for a resilient and sustainable energy future. Pioneers, innovation, defining leaders, and creating new standards are the opportunities presented by this new industry. This is not just a moment to witness; it’s a call to action.

At SpotLight, we are actively implementing predictive maintenance as a surveillance standard for CCS. This endeavour is a commitment to shaping a better tomorrow, where technology and talent converge to tackle the pressing challenges of our time.

Acknowledgements

I would like to warmly thank the pioneers I had the chance to encounter and work with: Cecilie Dybbroe Tang and Tillmann Roth from the Greensand Project, as well as Marta Puig and Chris Furby from the Poseidon Project. Additionally, I extend my gratitude to inspiring individuals from our industry, including Bruce Webb, Olivier Point, Heather Baily, Sandy Chen, Marco Guirola, Christopher Walker, and Herlinde Mannaerts. Their expertise in the subsurface industry and their adaptability to new challenges are truly remarkable. These individuals

exemplify not only audacity and a pioneering spirit but also the vision necessary to shape the energy future.

References

Air Liquide [2024]. Towards carbon neutrality: the role CCS will play in decarbonizing industry

Boston Consulting Group [2021]. Untapped Reserves 2.0 Driving Gender Balance in Oil and Gas, December 7th, 2021.

Corinne Dillenseger [2023]. 80% des jeunes salariés du secteur pétrolier et gazier prêts à se reconvertir, Les Échos

Crippa, M., Guizzardi, D., Pagani, F., Banja, M., Muntean, M., Schaaf E., Becker, W., Monforti-Ferrario, F., Quadrelli, R., Risquez Martin, A., Taghavi-Moharamli, P., Köykkä, J., Grassi, G., Rossi, S., Brandao De Melo, J., Oom, D., Branco, A., San-Miguel, J. and Vignati, E. [2023].

GHG emissions of all world countries, Publications Office of the European Union, Luxembourg, 2023, doi:10.2760/953322, JRC134504.

Di Filippo, V., Barton, C. and Basu, P. [2024]. Comprehensive measurement, monitoring, verification planning enables safe CO2 storage, risk reduction, and operating cost optimisation, First break, 42.

IEA [2024]. It is time for CCUS to deliver

The London School of Economics and Political Science [2023]. What is carbon capture, usage and storage (CCUS) and what role can it play in tackling climate change?, 13 March, 2023.

McKinsey and Company [2023]. Global Energy Perspective 2023, Report.

World Economic Forum [2023]. Future of Jobs Report 2023

Empowering sustainable geoscience exploration through technology and academic collaboration

Nick Tranter1* discusses how STRYDE is working with global academic institutions to support research in science and sustainable energy.

In an era defined by the imperative of sustainability, STRYDE is emerging as a pivotal player in driving geoscience exploration toward a greener, more equitable future. By harnessing cutting-edge technology and fostering collaboration between academia and industry, STRYDE is pioneering seismic data acquisition solutions that propel ground-breaking scientific discovery and innovation through strategic partnerships, affordable solutions, and a commitment to nurturing talent.

Originally developed by expert geoscientists from the oil and gas industry, STRYDE was created to make high-trace-density seismic affordable for any industry. Since its inception four years ago, STRYDE has built a customer base that has undergone a remarkable transformation. By 2023, approximately 70% of the company’s projects were geared towards exploration and research in the new energy sector, signalling a notable shift from the typically high uptake of projects in the oil and gas sector. This transition has been fuelled in part by collaborative ventures with universities, underscoring STRYDE’s dedication to providing cost-effective seismic solutions that foster both innovation and sustainability.

Bridging the gap between academia and industry

STRYDE’s philosophy revolves around the belief that true innovation blossoms at the intersection of academia and industry. Over the past four years, STRYDE has cultivated partnerships with more than 20 leading universities from around the globe, including esteemed institutions such as King Abdulah University of Science and Technology (KAUST), University of Oxford, Rice University, University De Toulouse, and Virginia Tech.

These partnerships serve as catalysts for advancing scientific research and development, driving strides in renewable energy and sustainability. Tom Kettlety, a research fellow at the University of Oxford, highlighted the transformative impact of STRYDE’s innovative technology on their research at the Eden Geothermal site in the UK. He remarked, ‘I’ve previously worked with bulky and more expensive nodal devices, facing limitations in both affordability and deployment speed. As a seismologist, the ability to utilise and deploy a large quantity of miniature, cost-effective instruments has completely revolutionised our approach to microseismic monitoring.’

1 STRYDE

* Corresponding author, E-mail: nick.tranter@strydefurther.com

DOI: 10.3997/1365-2397.fb2024052

Recent projects with Rice University and KAUST also underscore STRYDE’s commitment to advancing geothermal research.

In January 2024 in the deserts of Saudi Arabia, a geothermal drilling research initiative commenced with KAUST, in collaboration with TAQA Geothermal. This inaugural pilot geothermal well aims to investigate the subsurface before embarking on a broader drilling campaign. Utilising STRYDE technology alongside Distributed Acoustic Sensing (DAS) systems, the project will acquire Seismic While Drilling (SWD) data to provide crucial insights into the subsurface to pinpoint future well locations.

In spring 2024, on the opposite side of the globe, STRYDE partnered with Rice University in Houston to deploy 720 nodes at the renowned Utah FORGE geothermal site in the US. This collaboration aims to explore enhanced geothermal system reservoirs, using novel machine-learning algorithms to analyse microseismic events. In addition to this, passive imaging techniques will be employed to study structures surrounding the reservoir, enhancing their understanding of geothermal systems.

The seismic market in geothermal energy holds promising potential for rapid expansion in the coming years, driven by the increasing availability of private capital and government funding directed toward exploration efforts. Insights gained from geothermal sites like Utah FORGE and TAQA Geothermal play a

Figure 1 Students from KAUST’s Deep Imaging Group (DIG) deploying STRYDE technology in Saudi Arabia for geothermal exploration. Photo courtesy of Claire Birnie, Research Scientist at KAUST.

pivotal role in steering the industry toward sustainable practices for a greener future.

Empowering academic exploration through affordable solutions

Recognising the financial constraints faced by academic institutions, STRYDE democratises access to conventional and high-trace-density seismic data acquisition. STRYDE enables research teams to explore diverse fields of study unhindered by costly technology, thanks to its affordable solutions.

The partnership with Virginia Tech exemplifies how STRYDE’s affordable technology enables innovative approaches to understanding the Earth’s diverse subsurface dynamics. From June to November 2023, Virginia Tech’s up-and-coming geoscientists deployed STRYDE’s seismic nodes on six different research projects. These have ranged from time-lapse imaging for the measurement of seismic velocity changes associated with soil moisture variations to examining the influence of the world’s largest trees on bedrock weathering.

Sean Bemis, research scientist at Virginia Tech commented on the impact that new, affordable technology has on academic institutes: ‘The technology of these nodes is just remarkable. The ease at which we’ve been able to upscale and increase the densify of our seismic surveys has been a game-changer.’

In 2024, the university’s Department of Geosciences team has ambitious plans to persist in their research of the subsurface using STRYDE in the Critical Zone.

A game-changing energy alternative tested by industry and academia

A potentially game-changing alternative has emerged on the horizon: natural hydrogen. Produced primarily through geological processes, natural hydrogen has been detected in varying degrees of purity, often as surface seepages or sporadically in wells drilled for other resources. While certain natural processes are recognised for producing hydrogen, the pursuit of its exploration and comprehension of its presence pose considerable challenges, primarily due to the absence of comprehensive geological models and geophysical data.

Natural hydrogen gas emanations have been observed and measured along the North Pyrenean Frontal Thrust and other related faults rooted in the mantle body (Lefeuvre et al., 2021). These findings, coupled with a favourable geological context and indications of deep fluid migration, indicate that natural hydrogen

Figure 2 Deployment of STRYDE’s miniature nodal seismic sensors at the Utah FORGE site in the US by Rice University. In this photo, you can see 720 nodes that were loaded into a single vehicle (on the left), a student deploying the nodes with a bespoke deployment backpack (in the centre), and the deployment of a STRYDE Node™ in the field (on the right). Photo courtesy of Jonathan Ajo-Franklin, Professor: Dept of Earth, Environmental and Planetary Services at Rice University.

is likely to have originated from mantle rock serpentinisation and is transported to the surface via major thrust faults.

To test this theory, STRYDE partnered with the University of Toulouse and CNRS (the French National Centre for Scientific Research) to acquire passive seismic data on a 3D grid using STRYDE’s autonomous nodes. The challenging terrain, vast survey area (10x10km), and constrained budgets made the utilisation of STRYDE’s technology a significant enabler in the project.

The area was selected due to its high natural seismic activity and its location above the anticipated area of serpentinisation. Additionally, the area benefited from a number of permanent seismological stations, which will serve for calibration purposes.

Figure 3 The world’s smallest nodes (STRYDE Nodes™) deployed under the world’s largest trees at Yosemite National Park, California, USA by Virginia Tech students to create a 3D velocity model beneath the Mariposa Sequoia grove.

A team of ten students working in pairs commenced the deployment of 900 nodes. Each station consisted of two horizontal components oriented in north and west directions, along with one vertical component. The deployment of the 100 stations across the 10x10km area and an additional N-S 2D line was completed in just five days and the nodes recorded continuously for one month.

The velocity model depicted in Figure 4 illustrates two distinct domains with contrasting velocities, roughly delineated by the isovelocity of 5.6 km/s for P waves and 3.3 km/s for S waves. Lower velocities, indicative of sedimentary rocks (measuring less than 5.6 km/s), denote the decollement level of the Aquitaine Basin. Below this, there is a discernible Vp range between 6.0 and 6.4 km/s, characteristic of Hercynian basement rocks.

Overall, the dense deployment of small, light, and low-cost autonomous seismic nodes presents significant opportunities for advancing research into both crustal structure and seismic activity, critical areas for comprehending the underlying mechanisms behind the production of natural hydrogen.

Shaping safe and sustainable solutions for tomorrow

By offering tailored solutions to academia and investing in the upskilling of future geoscientists through hands-on training and exposure to cutting-edge technology, STRYDE’s collaborative research projects empower the next generation to lead the charge toward a brighter, and more sustainable future.

Another instance of this is the continuing collaboration with the University of North Dakota, which is dedicated to refining

Figure 4 Cross sections along the local earthquake tomography (LET) velocity model derived from the picked events. The dataset consists of 209 earthquakes and 14673 P and S picks. On average for each event, more than 70 stations reported P and S picks.

methods that are both more efficient and cost-effective for monitoring CO2 at CCS (carbon capture and storage) sites using sparse seismic arrays. The project is being led by the Energy and Environmental Research Centre at the university, taking place at an active CCS site in North America involving partners from industry. The results, when published in the summer of 2024 will provide further guidance on best practices for effectively monitoring onshore CCS sites using seismic data for a safe and sustainable future.

Looking forward

In the pursuit of sustainability, STRYDE emerges as a trailblazer, pioneering affordable and reliable seismic data acquisition solutions that transcend conventional boundaries. By fostering collaboration, driving innovation, and nurturing talent, STRYDE propels geoscience exploration toward a greener tomorrow.

Looking ahead, STRYDE is poised to continue its support for academic projects aimed at promoting sustainability and innovation. In the upcoming northern hemisphere summer, STRYDE will collaborate on diverse initiatives with academia, including regional natural hydrogen exploration in southern Europe, exploring sustainable mining approaches in Scandinavia, and enabling soil health research projects in the UK.

References

Chevrot, S., Sylvander, M., Derode, B., Pauchet, H., Ourabah A. and presenter: Ourabah, A. [2022]. Natural hydrogen exploration under the Pyrenees using a 3D multicomponent seismic array with autonomous nodes, AGU 2022. Abstract ID: 1240016 , Paper # NS13C-053.

CALENDAR OF EVENTS

10-13 Jun 85 th EAGE Annual Conference and Exhibition www.eageannual.org

25-26 Jun GeoDays 2024 geodays-2024.b2match.io

July 2024

30-31 Jul EAGE Workshop on Advanced Petroleum Systems AssessmentsIn Pursuit of Differentiated Barrels www.eage.org

2024 12-13 Aug 3 rd EAGE Conference on Carbon Capture & Storage Potential www.eage.org

14-15 Aug 4th EAGE Workshop on Fiber Optic Sensing for Energy Applications www.eage.org

14-15 Aug 1st EAGE/SUT Workshop on Integrated Site Characterization for Offshore Wind in Asia Pacific www.eage.org

18-23 Aug Goldschmidt 2024 conf.goldschmidt.info/goldschmidt/2024/meetingapp.cgi

2-4 Sep Fourth EAGE Marine Acquisition Workshop www.eage.org

2-5 Sep ECMOR 2024 - European Conference on the Mathematics of Geological Reservoirs www.ecmor.org

3-5 Sep SGI - SIMP Congress www.geoscienze.org/bari2024

8-12 Sep Near Surface Geoscience Conference and Exhibition 2024 www.eagensg.org

30 th European Meeting of Environmental & Engineering Geophysics

5 th Conference on Geophysics for Mineral Exploration & Mining 4th Conference on Airborne, Drone & Robotic Geophysics

4-7 NOVEMBER 2024

Fifth EAGE Global Energy Transition Conference and Exhibition

4 Technical Conferences:

• Carbon Capture & Storage

• Geothermal

• Hydrogen & Energy Storage

• Offshore Wind Energy

Rotterdam, The Netherlands www.eageget.org

12-13 Sep First EAGE Workshop on The Role of AI in FWI www.eage.org

16-18 Sep Eighth EAGE High Performance Computing Workshop www.eage.org

17-19 Sep Fourth EAGE Conference on Pre-Salt Reservoir www.eage.org

2024

1-4 Oct 18 th SAGA Biennial Conference & Exhibition www.sagaconference.co.za

3-4 Oct Third EAGE Workshop on EOR www.eage.org

6-8 Oct EAGE Workshop on Naturally Fractured Rocks (NFR) www.eage.org

7-9 Oct GeoTerrace 2024 - International Conference of Young Professionals www.eage.org

14-16 Oct Third EAGE Conference on Seismic Inversion www.seismicinversion.org

15-16 Oct EAGE Conference on Energy Excellence: Digital Twins and Predictive Analytics www.eage.org

16-17 Oct Third EAGE Workshop on Advanced Seismic Solutions in the Gulf of Mexico www.eage.org

21-24 Oct GEO 4.0: Digitalization in Geoscience Symposium www.eage.org

29-30 Oct EAGE Workshop on Borehole Technologies - Pioneering Sustainable Solutions in Energy www.eage.org

2024

4-7 Nov Fifth EAGE Global Energy Transition Conference and Exhibition www.eageget.org

Rotterdam The Netherlands EAGE Carbon Capture and Storage Conference Part of GET 2024 (Fifth EAGE Global Energy Transition Conference and Exhibition)

CALENDAR OF EVENTS

Xi’an

Turn static files into dynamic content formats.

Create a flipbook
Issuu converts static files into: digital portfolios, online yearbooks, online catalogs, digital photo albums and more. Sign up and create your flipbook.