
SPECIAL TOPIC


SPECIAL TOPIC
EAGE NEWS Presidential Address
CROSSTALK Decision time for Energy Transition
TECHNICAL ARTICLE Acquiring DAS VSPs in vertical wells


CHAIR EDITORIAL BOARD
Clément Kostov (cvkostov@icloud.com)
EDITOR
Damian Arnold (arnolddamian@googlemail.com)
MEMBERS, EDITORIAL BOARD
• Lodve Berre, Norwegian University of Science and Technology (lodve.berre@ntnu.no)
Philippe Caprioli, SLB (caprioli0@slb.com)
S atinder Chopra, SamiGeo (satinder.chopra@samigeo.com)
• A nthony Day, PGS (anthony.day@pgs.com)
• Peter Dromgoole, Retired Geophysicist (peterdromgoole@gmail.com)
• Kara English, University College Dublin (kara.english@ucd.ie)
• Stephen Hallinan, Viridien (Stephen.Hallinan@viridiengroup.com)
• Hamidreza Hamdi, University of Calgary (hhamdi@ucalgary.ca)
Fabio Marco Miotti, Baker Hughes (fabiomarco.miotti@bakerhughes.com)
Susanne Rentsch-Smith, Shearwater (srentsch@shearwatergeo.com)
• Martin Riviere, Retired Geophysicist (martinriviere@btinternet.com)
• A ngelika-Maria Wulff, Consultant (gp.awulff@gmail.com)
EAGE EDITOR EMERITUS Andrew McBarnet (andrew@andrewmcbarnet.com)
PUBLICATIONS MANAGER Hang Pham (publications@eage.org)
MEDIA PRODUCTION
Saskia Nota (firstbreakproduction@eage.org) Ivana Geurts (firstbreakproduction@eage.org)
ADVERTISING INQUIRIES corporaterelations@eage.org
EAGE EUROPE OFFICE
Kosterijland 48 3981 AJ Bunnik
The Netherlands
• + 31 88 995 5055
• eage@eage.org
• www.eage.org
EAGE MIDDLE EAST OFFICE
EAGE Middle East FZ-LLC Dubai Knowledge Village PO Box 501711
Dubai, United Arab Emirates
• +971 4 369 3897
• middle_east@eage.org www.eage.org
EAGE ASIA PACIFIC OFFICE
EAGE Asia Pacific Sdn. Bhd.
UOA Centre Office Suite 19-15-3A No. 19, Jalan Pinang 50450 Kuala Lumpur Malaysia +60 3 272 201 40
• asiapacific@eage.org
• www.eage.org
EAGE LATIN AMERICA OFFICE
EAGE Americas SAS Av. 19 #114-65 - Office 205 Bogotá, Colombia
• +57 310 8610709
• americas@eage.org
• www.eage.org
EAGE MEMBERS’ CHANGE OF ADDRESS
Update via your MyEAGE account, or contact the EAGE Membership Dept at membership@eage.org
FIRST BREAK ON THE WEB www.firstbreak.org
ISSN 0263-5046 (print) / ISSN 1365-2397 (online)
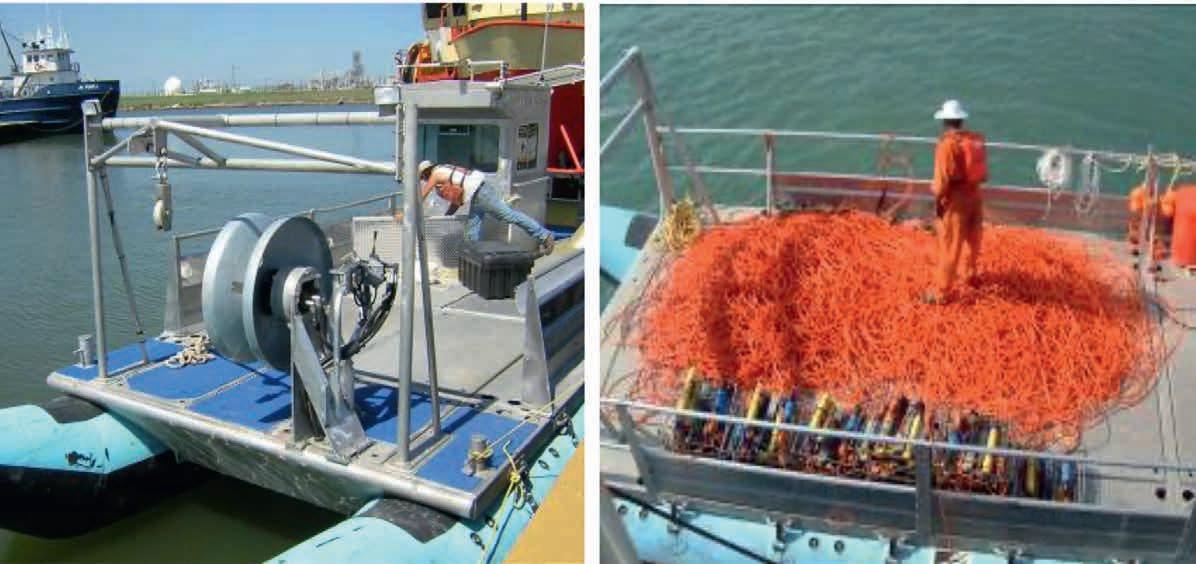
Developments in nodal data acquisition in the transition zone and shallow water
3
23
27 Industr y
35 Progress in acquiring DAS VSPs in vertical exploration wells
Rafael Guerra, Haroon Bajwa, Peter MacLeod, Rigelesaiyin Ji and Bosung Lim
43 A novel approach to predict 3D pressure cubes, Sapphire Field, offshore Nile Delta, Egypt
Mohamed Ahmed Abdelhay, Abdel Nasser Helal, Abdel Aleem Elessawy and Amir Lala
51 Developments in nodal data acquisition in the transition zone and shallow water
Andrew Clark, Jerzy Trela , Piotr Pote¸pa, Sławomir Ziółkowski and Dennis Pavel
57 High resolution mini-3D seismic surveys as a rapid and cost-effective method for detailed structural mapping
Tim Dean, Matt Grant, and Justin Hooi
63 From statics to dynamics: enhancing onshore velocity models with full waveform inversion
Terence Krishnasamy, James Beck and Cristina Reta-Tang
69 Processing on the edge, the evolution of in-field processing in modern land seismic surveys
Amine Ourabah
75 The vibrator and its interaction with the ground
Spencer L. Rowse and Bob Heath
83 The unappreciated importance of Refraction Echoes or Guided Waves in causing bad land seismic data
Christof Stork
89 Land 3D acquisition design: Theory of wavefield sampling.
Part 2: Present 3D design tests for environmentally sustainable sparse perturbed parallel geometries
Bill Goodway, Andrea Crook, Raul Cova, Mostafa Naghizadeh, Michael Hons, Maximo Rodriguez, Cameron Crook and Wendell Pardasie
Feature: Minus CO2 Challenge 2024
101 Student team develops an ultra-deep geothermal (UDG) project with closed loops to produce electricity and heat from Dinantian carbonates, The Netherlands
Maitena Daguerre, Lubin Daumard, Emeline Di Pasquale, Quentin Garcin and Thibault Drulhe
106 Calendar
cover: Sercel’s WiNG node, featuring the ultra-sensitive broadband digital MEMS QuietSeis® sensor, which delivers subsurface imaging (image courtesy of Sercel).





Andreas Aspmo Pfaffhuber Chair
Florina Tuluca Vice-Chair
Esther Bloem Immediate Past Chair
Micki Allen Contact Officer EEGS/North America
Hongzhu Cai Liaison China
Deyan Draganov Technical Programme Officer
Eduardo Rodrigues Liaison First Break
Hamdan Ali Hamdan Liaison Middle East
Vladimir Ignatev Liaison CIS / North America
Musa Manzi Liaison Africa
Myrto Papadopoulou Young Professional Liaison
Catherine Truffert Industry Liaison
Mark Vardy Editor-in-Chief Near Surface Geophysics
Yohaney Gomez Galarza Chair
Johannes Wendebourg Vice-Chair
Lucy Slater Immediate Past Chair
Wiebke Athmer Member
Alireza Malehmir Editor-in-Chief Geophysical Prospecting
Adeline Parent Member
Jonathan Redfern Editor-in-Chief Petroleum Geoscience
Xavier Troussaut EAGE Observer at SPE-OGRC
Robert Tugume Member
Timothy Tylor-Jones Committee Member
Anke Wendt Member
Martin Widmaier Technical Programme Officer
Carla Martín-Clavé Chair
Giovanni Sosio Vice-Chair
SUBSCRIPTIONS
First Break is published monthly. It is free to EAGE members. The membership fee of EAGE is € 80.00 a year including First Break, EarthDoc (EAGE’s geoscience database), Learning Geoscience (EAGE’s Education website) and online access to a scientific journal.
Companies can subscribe to First Break via an institutional subscription. Every subscription includes a monthly hard copy and online access to the full First Break archive for the requested number of online users.
Orders for current subscriptions and back issues should be sent to First Break B.V., Journal Subscriptions, Kosterijland 48, 3981 AJ Bunnik, The Netherlands. Tel: +31 (0)88 9955055, E-mail: subscriptions@eage.org, www.firstbreak.org.
First Break is published by First Break B.V., The Netherlands. However, responsibility for the opinions given and the statements made rests with the authors.
COPYRIGHT & PHOTOCOPYING © 2025 EAGE
All rights reserved. First Break or any part thereof may not be reproduced, stored in a retrieval system, or transcribed in any form or by any means, electronically or mechanically, including photocopying and recording, without the prior written permission of the publisher.
The publisher’s policy is to use acid-free permanent paper (TCF), to the draft standard ISO/DIS/9706, made from sustainable forests using chlorine-free pulp (Nordic-Swan standard).


Valentina Socco, EAGE president, welcomes members to a year of opportunity in 2025.
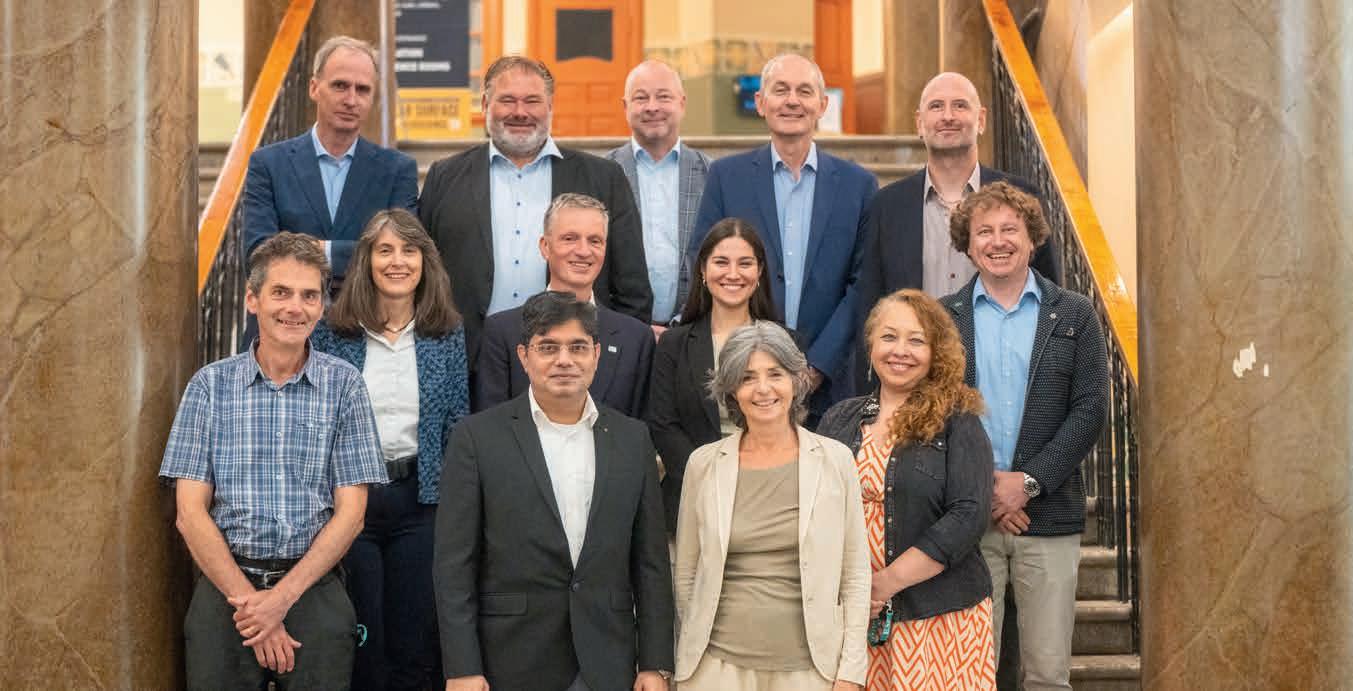
Approaching the end of the year it is natural habit to reflect on the past year’s activities and achievements while looking ahead to future evolutions. Despite the challenging geopolitical situation the world is facing, 2024 has been a successful year for EAGE.
The year witnessed the flourishing of about 60 EAGE events, covering a broad band of established and emerging topics. These were complemented by a plethora of online short courses and e-lectures and a wide set of initiatives organised by Local Chapters. The success of most of these events highlights
the vitality of our community and our Association’s ability to effectively respond to its members’ needs. The 2024 Annual Conference and Exhibition was extremely successful, with a vibrant atmosphere and a strong focus on innovation aimed at tackling the energy trilemma.
In addition, the 5th edition of the Global Energy Transition Conference (GET 2024) in Rotterdam really bloomed this year, attracting six times the number of delegates and exhibitors of the previous editions. This is clear evidence that the efforts and investments in the direction of a more sustainable energy pro-
duction are bearing fruit and are in alignment with evolution of our community, represented by the recently formed Sustainable Energy Circle and related Technical Communities. Your Board is determined to continue along this path and reinforce the efforts toward energy sustainability to offer new opportunities to our longstanding members and attract the interest of new ones.

Sustainability, however, goes beyond energy production: infrastructure design and maintenance, raw material supply for green technology, water resources management, resilience to geohazards, and environment protection, are all challenges that have become crucial for a safe development of humanity under the pressure of climate change impacts. Engineers and geoscientists play a major role in addressing these challenges and the Board views the strengthening of activities within the Near Surface Geoscience Circle as a significant opportunity for growth in these crucial areas.
The Board is also consistently and tirelessly committed to maintaining and enhancing diversity and inclusion within our Association. This commitment applies not only to our community and its activities but also, during such a significant phase of transition, to the themes and disciplines we address.


Furthermore, the need to address the topic of communication aimed at society as a whole and the engagement of stakeholders is becoming a key focus. This is particularly important for all activities involving interaction with our earth environment and the subsurface, where engagement of the public is vital. The Board is actively working in this direction by encouraging the creation of events and interest groups that can define high-level communication strategies. This initiative aims to position EAGE as a point of reference not only for the scientific and professional community but also for society and policymakers who require accurate, science-based communication on the complex topics of geosciences.
Improving our ability to communicate the importance of geosciences and engineering will also be able to help attract talent in the younger generation who can bring the passion and creativity that has always characterised our work. We will work, as an association, to support these young talents in their transition to the job market and to provide them with the opportunities that the younger generation deserves.
Most of our achievements and activities would not be possible without the commitment of our members who put their skills, time and energy into the service of the Association. To all these people go our warmest thanks and the deep appreciation of the entire Association and the Board. Our volunteers are supported by the professionalism and commitment of our head office staff, who approach their work with a profound sense of belonging and helpfulness. Our heartfelt thanks go to them as well.
I am personally grateful to the Board members and Board of Directors for their commitment and for the open and constructive attitude that defines the work we are doing together.
I hope to have the opportunity to meet many of you in person during coming EAGE events or at the 2025 EAGE Annual Conference and Exhibition, which will be held in Toulouse from the 2nd to the 5th of June.
I wish to you and your beloved ones a peaceful, creative, and rewarding 2025!












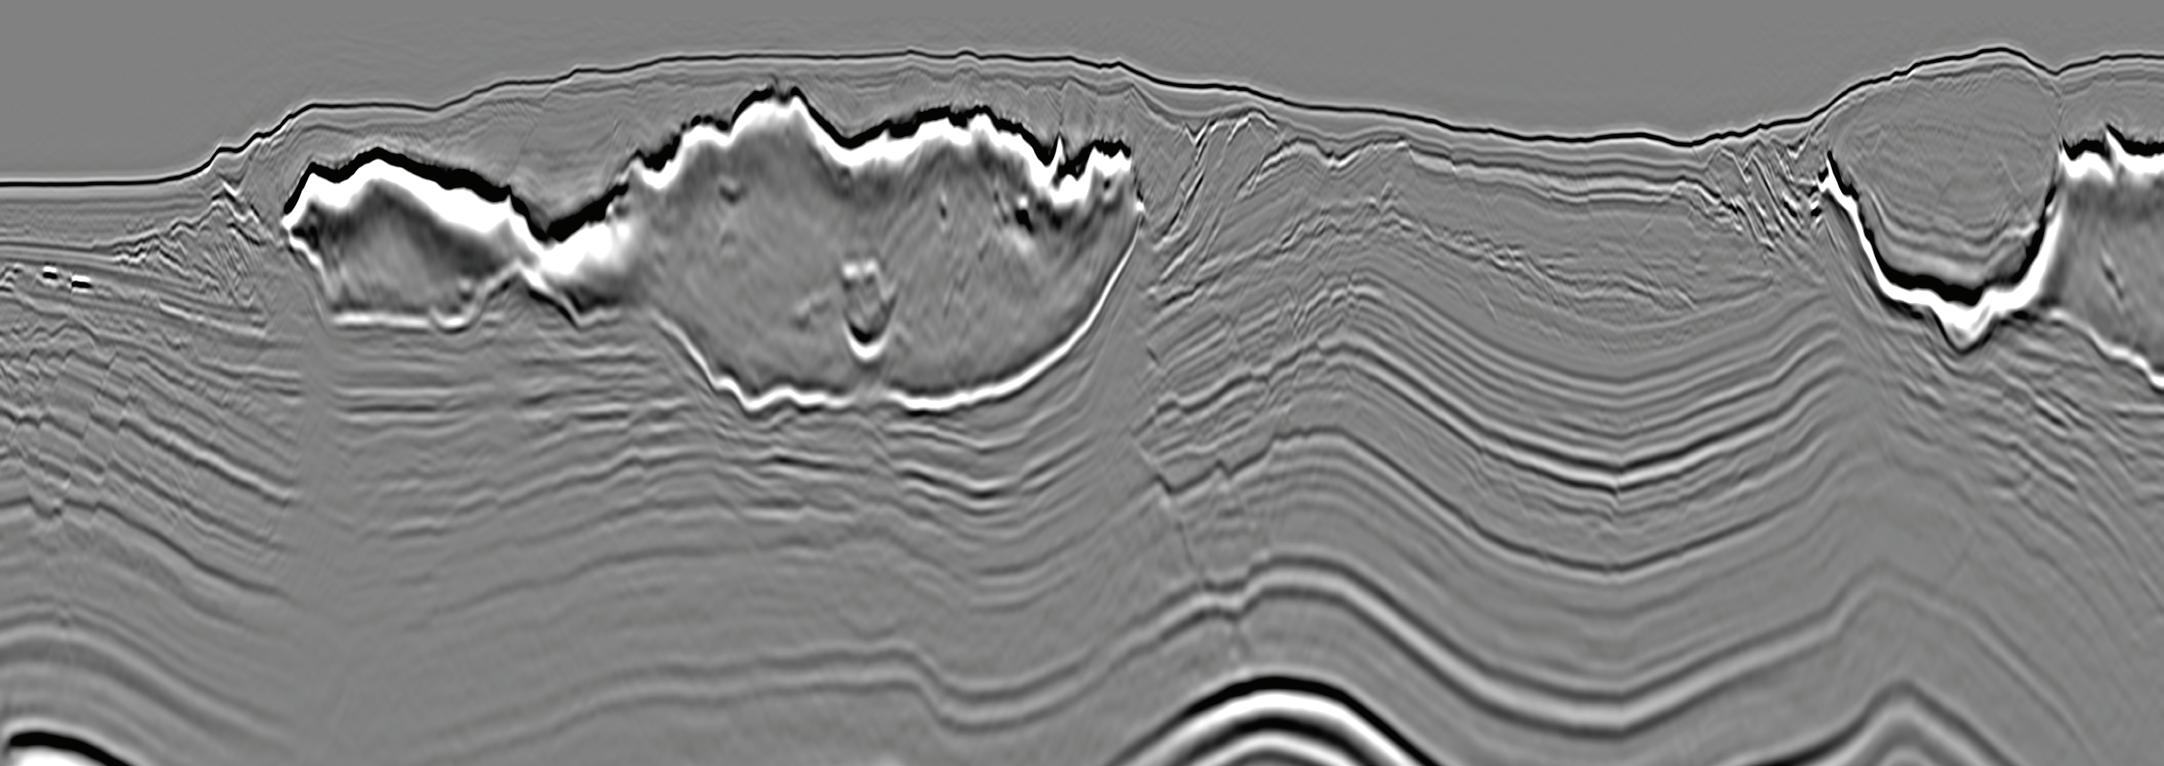
DUG Elastic MP-FWI Imaging solves for reflectivity, Vp, Vs, P-impedance, S-impedance and density. It delivers not only another step change in imaging quality, but also elastic rock properties for quantitative interpretation and prestack amplitude analysis — directly from field-data input. A complete replacement for traditional processing and imaging workflows — we talk the talk and walk the walk!
info@dug.com | dug.com/fwi

Our latest Technical Community to represent members’ special interests has been formed on Enhancing Hydrocarbon Recovery for Sustainability. It intends to connect geoscientists and engineers working on Improved and/or Enhanced Oil Recovery (EOR/IOR) projects, technologies and carbon footprint optimisation to exchange knowledge and upgrade their skills.
Even though we are embarking on a journey towards the use of sustainable resources, oil and gas will still make up some portion of the energy mix for some time. Therefore, it is imperative that it is produced as cleanly and efficiently as possible. According to committee member, Alan Beteta (Heriot-Watt University), ‘this can be achieved through EOR/IOR techniques, which can recover a larger percentage of the hydrocarbons in place, at a lower water cut and over a
shorter period of time resulting in a lower carbon footprint of the operation’.
As EOR/IOR are technically challenging, Eric Delamaide (IFP Technologies), another committee member, says ‘the new community will be an important platform for sharing knowledge and collaborating to improve project economics and multiply the field projects.’
The EOR/IOR Technical Community will kickstart its activities at the EAGE Annual 2025 with the Dedicated Session ‘EOR During the Energy Transition’. Stay tuned for more details soon. Those interested in being part of the community should update their affiliations at eage.org.
EAGE starts the year with 95 associated societies, including five new cooperation agreements established last year with international professional associations.
Recognising that digital technologies are essential for the advancement of the energy sector, we joined forces with the Society of High Performance Computing Professionals — SHPCP (US).
As part of the mission to connect the HPC and AI user community, SHPCP was invited to participate at the EAGE Annual 2022 (Madrid) and 2024 (Oslo) to lead panel discussions about the cross-sharing of learnings, trends, best practice, and workforce development.
Doug Norton, SHPCP president, said: ‘For the last several years, our society and EAGE have invested in a longstanding relationship and have found it to be a benefit for both organisations.’
Also in the US, we agreed to partner with Geothermal Rising (GR). Since 1972 GR has been advocating for the use of geothermal energy as a crucial
source for the energy transformation. Our partnership will serve to disseminate the latest research, technologies, and applications of geothermal energy.
Expanding our cooperation network in the Middle East, we signed an associated societies agreement with the Kuwait Geosciences Society — KGS (Kuwait) during its inauguration event in early 2024. Dr Mubarak Al-Hajeri, KGS president, said: ‘Looking ahead, KGS is keen to collaborate with EAGE to further enhance practical knowledge in geosciences and engineering, bringing more educational opportunities, workshops, and seminars to the geoscientific community in Kuwait.’
New alliances were also forged in South America. Supported by the Association of Oil, Gas and Renewable Energy Companies in Latin America and the Caribbean — ARPEL (Uruguay), we are connecting with local and international energy companies operating in the region, to share best practice and lessons learned
towards the competitive growth of the industry and its sustainable development.
This cooperation started with ARPEL’s participation at two EAGE events — the First EAGE Conference on South Atlantic Offshore Energy Resources (Montevideo, Uruguay, 2023) and the Third EAGE Workshop on EOR (Buenos Aires, Argentina, 2024). Formal agreement was ratified with our attendance at the ARPEL Naturgas Week 2024 in Cartagena, Colombia.
With the Geological Society of Chile — SGCh (Chile), we are paving the way for leading innovative conversations about the challenges and opportunities of mineral exploration in the region, including the latest advancements and applications in critical minerals, geohazards, geochemistry and hydrogeophysics.
We look forward to collaborating with our associated societies to ensure the continuous professional development of the earth sciences community worldwide.
Message from Marcel van Loon, EAGE CEO.
As the calendar turns, we’re reminded that every new beginning is a chance to set intentions and commit to making an impact.
The global geoscience and engineering community is facing both challenges and opportunities in equal measure. Recent conversations at EAGE meetings including the GET conference have highlighted the worrying trend of geoscience university programmes being discontinued in various countries. This causes a knowledge gap that could hinder the energy transition and broader scientific progress. It is a moment that calls for action to which you can contribute.
EAGE is committed to supporting the next generation of professionals by facilitating the transfer of skills — across sectors, disciplines, and generations. Whether it’s transferring expertise from established energy sectors
to emerging ones, or welcoming skills from other fields, such as communications and data science, our goal is to empower professional journeys towards success and a sustainable future.
This mission is brought to life through the incredible work of you, our members. Year after year, you embrace every opportunity for innovation, making our Association a dynamic and progressive space. Your contributions, alongside the guidance of technical communities and expert volunteers worldwide, help us evolve and expand. New topics are introduced regularly in our conferences, publications, courses and communities to address the most pressing challenges and offer fresh opportunities for engagement. Later this year, for example, geohazards, UXO, and object detection will feature prominently on the agenda of

the EAGE Near Surface Geoscience Conference.
Make it one of your New Year’s resolutions to be part of EAGE. Spread the word and help us make sure no one is left behind. Various support programmes allow current and new members to stay connected, even during difficult times. Meanwhile students can apply for their first year of membership for free and benefit from discounted rates thereafter. Together, we can build a resilient, innovative, and forward-thinking community that’s ready to tackle the challenges ahead.

Calling all geoscience and engineering students: Inspire change, grow your network, and shape your career with EAGE! Renew or start your EAGE Student Chapter today and embark on a journey filled with learning, collaboration, and discovery. As a member of a student chapter, you gain access to EAGE events and webinars at discounted rates or even
for free. These events are designed to enhance your academic journey and professional growth while connecting you with a global network of peers and industry experts.
‘As a student chapter, it is extremely important for us to foster connections with the EAGE community and other student chapters around the world.’ — Best EAGE Student Chapter 2023-2024: Universidad Autónoma del Carmen, México.
‘At the EAGE student chapter, we strongly believe in teamwork and the pursuit of a common goal: to facilitate an enriching transition from student to professional for our members. We invite all students with a passion for geoscience and professionals in the field to join us on this journey.’ — EAGE Student Chapter Universidad Nacional de La Plata (UNLP), Argentina.
With support from the EAGE Student Fund, each new or renewed chapter can apply for 15 FREE memberships to jumpstart activities, ensuring that students from all backgrounds can join the EAGE community without financial barriers. Additionally, EAGE offers funding for grants and sponsorships to support student-led initiatives and local activities. To form or renew your chapter, all you need are four core members – a president, vice-president, secretary, and treasurer – and a commitment to promoting geoscience and energy education within your university.
Scan for more information
Explore an exciting line-up of EAGE events across the world this year. From innovative launches to impactful gatherings, each event brings its own unique excitement. Save your favourites and make plans to join today!
26-28 Feb First EAGE Workshop on Triassic and Jurassic Plays in Northwest Europe Sunbury, United Kingdom
2-4 Apr IOR+ 2025 Edinburgh, United Kingdom
1-4 Sep World CCUS Conference Bergen, Norway
7-12 Sep IMOG 2025 Porto, Portugal
14-18 Sep Seventh International Conference on Fault and Top Seals

Bucharest, Romania
21-22 Oct First EAGE Workshop on Geophysical Techniques for Monitoring CO2 Storage Toronto, Canada CHECK
8-9 May First EAGE Workshop on Land Seismic Acquisition Calgary, Canada
21-22 May First EAGE/SBGf Workshop on Marine Seismic Acquisition Rio de Janeiro, Brazil
9-11 Sep Second EAGE Conference and Exhibition on GuyanaSuriname Basin Georgetown, Guyana
14-16 Oct First EAGE Conference on Challenges and Opportunities in the Future of Mineral Exploration Santiago de Chile, Chile
24-26 Mar 5th EAGE Digitalization Conference and Exhibition Edinburgh, United Kingdom
2-5 Jun 86th EAGE Annual Conference & Exhibition Toulouse, France
7-11 Sep Near Surface Geoscience 2025 (NSG) Naples, Italy
3-7 Nov 6th EAGE Global Energy Transition Conference & Exhibition (GET) Rotterdam, The Netherlands
3-4 Feb EAGE Workshop on Carbon Capture and Storage (CCS) in Basalts Gandhinagar, India
18-20 Feb International Petroleum Technology Conference (IPTC) 2025

Kuala Lumpur, Malaysia
13-15 May 7th Asia Pacific Meeting on Near Surface Geoscience & Engineering Xi’an, China
30 Jun2 Jul 4th Carbon Capture & Storage Conference Asia Pacific
15-16 Oct 4th EAGE/SUT Workshop on Integrated Site Characterization for Offshore Renewable Energy
13-16 Apr Fifth EAGE Well Injectivity & Productivity in Carbonates (WIPIC) Workshop Doha, Qatar
5-7 May First EAGE Atlantic Geoscience Resource Exploration & Development Symposium (AGREDS) Marrakech, Morocco 29 Sep - 1 Oct Eighth EAGE Borehole Geophysics Workshop Al Khobar, Saudi Arabia 10-12 Nov Seventh EAGE Rock Physics Workshop Cape Town, South Africa 24-26 Nov
Kuala Lumpur, Malaysia
Melbourne, Australia

Five field trips, lasting from half a day to two days, are being planned for this year’s Annual in Toulouse, and as ever they will be a major addition to the programme of events.
World-renowned for its aerospace industry and pioneering companies in health, biotechnology, nanotechnology, and robotics, Toulouse and its surroundings offer a fantastic playground for field trips. From delving deep into the earth at the core house in Boussens to reaching for the stars at the Cité de l’Espace, these
field trips will connect participants with both natural and engineered solutions for energy challenges.
Outcrop visits will also allow delegates to experience the beauty of the Pyrenees up close while exploring ‘natural hydrogen potential’ and ‘clastic and fractured reservoir analogues’.
EAGE Annual field trips are designed to inspire and provide a rich, hands-on learning experience where practical knowledge meets the local landscape. Each itinerary underscores
the critical role of integrated disciplines, such as geoscience, reservoir engineering, and technological innovation, in achieving sustainable transition goals. These experiences also offer a unique opportunity to build connections and expand knowledge in an immersive environment.
With limited spots available, interested participants are encouraged to register early to secure their place. Visit eageannual.org/field-trips to learn more details.

There’s no doubt about it. Our GET 2024 Conference and Exhibition in Rotterdam in early November — the fifth in the series — was an outstanding success. It demonstrated that the geoscience community is eager to meet the challenges of energy transition and has the tools to accelerate the process.
Fifteen hundred participants, by far the largest attendance to date, were treated to our most ambitious programme yet, founded on separate conferences on CCS, Geothermal, Hydrogen, and Offshore Wind Energy plus a Strategic Programme linking the many issues involved in energy transition policy, business and technology.
Yolande Verbeek, chair of GET 2024 and COO of EBN, probably best summed up how the week transpired: ‘The beauty of this conference lies in its technical pillars and programmes, which give people the option to dive deeply into their own technology while also stepping out of their bubble to explore other technologies, making cross-sharing of knowledge truly effective here.’
The quality and tone of the conference was set by the two excellent opening Ted Talks style addresses by Floris Alkemade, an architect, urban designer and well-known public speaker, on the transformative power of innovation and Remco de Boer, Dutch energy analyst and podcaster, on Europe’s vulnerability in the global energy transition. Between them they offered contrasting visions of hope and realism. Alkemaden talked inspiringly about the ‘survival pattern’ which marks human history. In his optimistic view ‘imagination trumps technology’ and will be key to change as it has been in the past.
Taking a different tack, de Boer claimed that Europe was too focused on energy transition and needed to change course. The gist of his argument was that EU countries have a good record on curbing emissions and take-up of renewables on a global basis, but net zero targets come at a cost, e.g., continuing reliance on energy imports, lack of criticial minerals, high price of natural gas compared with US and Asia, and decline in manufacturing (itself a cause of falling emissions). To sustain its energy transition goals, de Boer argued that the EU must focus more on having a strong economy.
In a nice recognition of the future faced by the next generation of geoscientists, the Opening brought on stage the student winners of the Minus CO2 Challenge (UniLaSalle, France) and the Marie Tharp Sustainable Energy Young Professionals Award (Samuel Zappalà, Uppsala University) to receive their prizes.
Just what went down in each conference is impossible to summarise here, but feedback has been overwhelmingly positive. Predictably, the CCS programme captured the most attention, this time featured business value chains; the Geothermal programme highlighted advances in the Netherlands but also discussed the
global perspective such as Oman’s Vision 2040; Hydrogen and Energy Storage discussed ongoing pilot activities reflecting growing confidence in the technical feasibility of these initiatives; Offshore Wind Energy talks spanned topics such as geohazards, offshore wind case studies, object detection methods including UXO, seismic data processing, and innovative approaches to ultra-high-resolution (UHR) seismic inversion.
The conference programme was bolstered by the Strategic Programme notable for its emphasis on collaboration across sectors exploring topics like digitalisation, resilient value chains, and public engagement. Throughout the event, the Exhibition area and the EAGE’s own Community Hub provided a continuous focus for engagement and animated discussion. Meet & Greets by the EAGE Sustainable Energy Circle and Local Chapter Netherlands were a highlight. Sessions by Women in Geoscience and Engineering and Young Professionals continued the work of promoting the

Panel discussion at the Opening.
importance of diversity and fresh talent in the energy transition. Student attendees were well catered for with an enthusiastically received four-day Energy Transition Student Days led by industry experts Raymond Franssen (Synergeo) and Manuel Willemse (Utrecht University).
Beyond its main programme, GET 2024 included workshops, short courses, and field trips. A standout was the Porthos Project tour, showcasing CO2 capture from industries in the Port of Rotterdam and its storage in depleted North Sea gas fields.
Social activities maintained the energy of the meeting with a Speakers’ Reception at Rotterdam City Hall, a lively Icebreaker Reception and a Conference Evening aboard an iconic Holland-America Line cruise ship which brought 850 attendees together to enjoy restored decks, stunning harbour views, lively entertainment, and exceptional cuisine.
We will be back for GET 2025 at the same venue in Rotterdam on 3–7 November 2025. Stay informed and updated by visiting eageget.org.







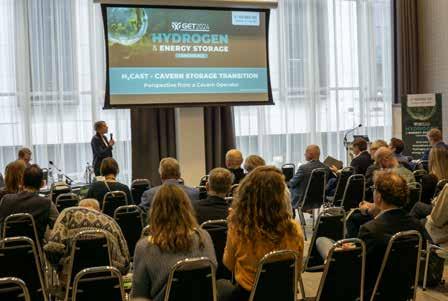
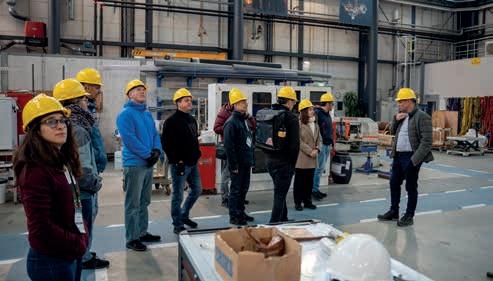
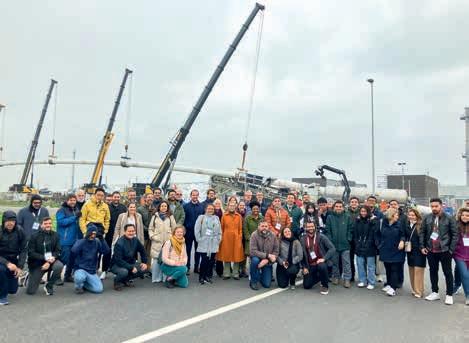
Insightful presentations on CCS, hydrogen, wind, and geothermal innovations ignited engaging discussions.

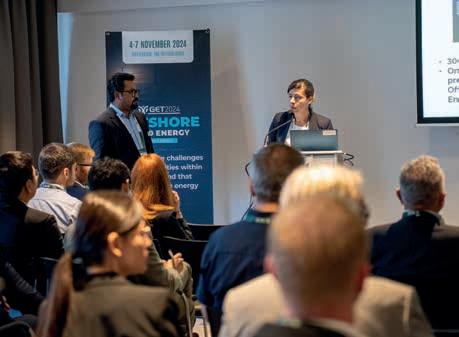



Getting to learn from peers through workshops, short courses, field trips, and exhibition.




EAGE offered a short course on Geoscience Communication and Public Engagement led by Professor Iain Stewart during GET 2024 held in November in Rotterdam. Emer Caslin, business development manager at iCRAG, offers this review of the course which underscored the importance of communication skills in fostering trust, securing project approvals, and bridging the gap between technical expertise and public understanding.
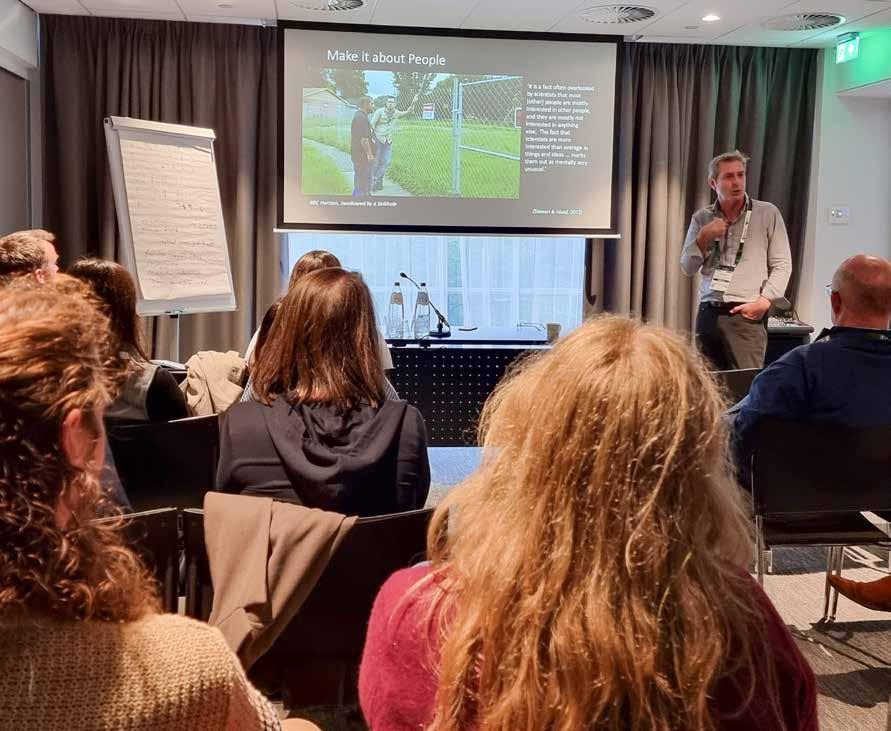
While there is a growing consensus that engagement with the public is of crucial importance for project enablement and to enhance the reputation of geoscience, we as a discipline, as a sector, are poorly equipped to address this. Every panel session, article, and podcast emphasises the critical importance of effectively commu-
nicating the science of our subsurface to drive the low-carbon energy transition but our current toolkits fall short in providing these essential skills.
The short course on geocommunication offered attendees an excellent introduction to the subject, serving as their first opportunity to explore it. Prof
EAGE is committed to fostering these critical skills among geoscientists. Building on the momentum from GET 2024, plans are underway to include this inspiring course at the EAGE Annual 2025, ensuring more members can benefit from Prof Stewart’s insights.
By prioritising communication, geoscientists can not only dispel misconceptions but also foster trust and collaboration with stakeholders, securing the social license to operate. Together, we can transform the way geoscience connects with society, paving the way for a sustainable energy future.
at the EAGE Annual 2025
Stewart didn’t hold back on delving into the science of communication and its evolution over the past 40 years from deficit to dialogue through to participation models. We discussed the process of engagement through a model adapted from disaster risk communication, which is broadly applicable to all engagements where the public becomes part of the solution, rather than the problem, through guided and co-created communication.
The course equipped us with tools and techniques to be better communicators from simply reframing how we address our audience based on who is in the room to practical exercises using techniques such as the communication bowtie, the Freytag pyramid, the three act structure and audience segmentation. Prof Stewart weaved in and out of communication theory and visual, resonant application of geoscience. Frequently incorporating funny examples from pop culture, the course takes us outside of ourselves to show we are rarely the ‘rock stars’ we think we are and often reduced to the bottom shelf of a bookstore analogy where so many other topics in the public domain trump geoscience.
Prof Stewart is passionate about the power of storytelling. Geoscience is so vast and visual that it can really capture awe and wonder and bring the public in, in a way no other science can. Human-centred stories will always resonate more and the course underlines the pivotal importance of understanding the human psyche. As scientists, we have a distinct way of looking at things and this means we are often outliers when it comes to public perception. Prof Stewart takes us through examples of a range of subsurface projects (fracking, CCS, geothermal, etc.) where opposition was rarely about the science. There is a need to shift our focus from ‘matters of fact to matters of concern’ and get a

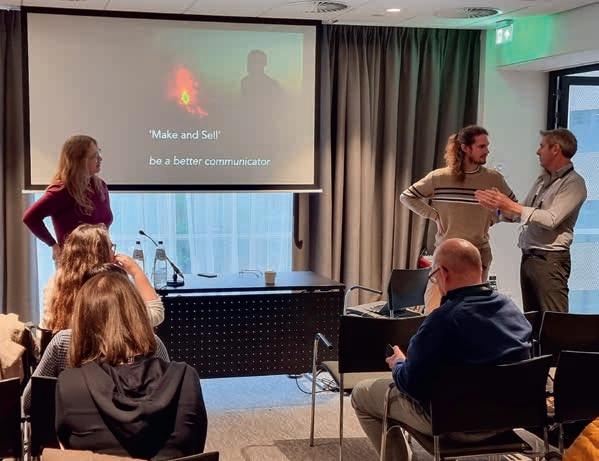
better handle on risk psychology; what is behind the public outrage that can threaten project execution and how can we better address this risk?
One slide that focused on risk perception for CCS was particularly telling about public misconceptions of the subsurface. One finding revealed that nearly half of the public surveyed on this technology believed that injecting CO2 into the subsurface ‘is like pumping up a huge balloon underground’. A clear example of why public perception poses such a significant risk.
The slide should perhaps have been shared with the participants on the parallel course on CCS risk assessment that morning!
This course proved an ideal way to conclude GET 2024. We left the room that Friday evening feeling inspired, invigorated, convinced of the growing importance of geocommunication skills and eager to learn more. There was a sense of empowerment by attendees to be able to take back control of our narrative by communicating as individuals rather than corporations.
Our CO2 Storage Masterclass is back, this time in Utrecht, Netherlands, from 11-14 March 2025 providing another opportunity for professionals worldwide with a comprehensive programme on geological CO2 storage, a cornerstone of the energy transition.
The 2024 event featured three intensive courses led by renowned experts Philip Ringrose, Andreas Busch, Eric Mackay, and Florian Doster with participants praising the technical depth and practical applicability of the sessions, with one stating, ‘It was an eye-opening session on CO2 migration and mechanisms, especially useful for monitoring and planning.’
For the 2025 edition, the programme in Utrecht will continue to offer a focused learning environment, addressing the critical aspects of CO2 storage. This time, a new course by Martin Landrø on Geophysical Monitoring of CO2
Participants from the 2024 edition highlighted the unique value of the Masterclass’s interactive format and its role in fostering connections. One attendee remarked, ‘The interaction with others is a real value. You can’t beat that.’ Another lauded the course for offering ‘a good state-of-the-art understanding of
CO2 storage risks, invaluable for project planning’.
Mark your calendar for 11–14 March 2025 in Utrecht, and stay tuned for more details on this Masterclass.
For more information


EAGE Digital 2025 in Edinburgh from 24-26 March hosted by BP is set to be a landmark event showcasing the transformative power of digital technologies in energy. Once again, the event will feature a range of dedicated sessions highlighting the latest developments and applications in the digital sphere.

Participants can choose from numerous topics:
Digitalization for Geothermal and CCS: How digital solutions can reduce costs, streamline processes, and contribute to sustainability goals.
Generative AI applications in dayto-day environment - Use cases, benefits, and challenges: Focus on challenges in adapting AI to specific problems,

ensuring data security, and evaluating the value of AI solutions with real world examples.
Data driven production forecasting: With machine learning and hybrid models enhancing forecasting accuracy, case studies will demonstrate the integration of advanced neural networks and traditional physics-based models to improve efficiency and decisionmaking.
Remote sensing and the integration of data forecasting in the energy transition: Showcasing remote sensing technologies tools being used to assess environmental impacts and optimise renewable energy operations, including geothermal and CCS.
Business implementation and value in OSDU: Improving interoperability and operational efficiency of Open Surface Data Universe (OSDU) through collaboration and enhanced decision making.
OT, AI and GenAI in practice across the energy sector: Exploration of realworld examples of how these technologies are optimising exploration, production, and decision-making processes.
Calibrating machine learning predictions: Techniques for calibrating models to meet operational needs while ensuring reliability including discussion of challenges of validation and the importance of aligning model outputs with end-user expectations.
Tracking value in digitalization: Evaluating methods for assessing the impact of digital technologies on productivity, cost savings, and operational improvements.
Embarking on digital projectsA beginner’s guide for geoscientists: A breakdown of the fundamentals of digital project management, from understanding basic concepts to executing and scaling solutions with practical advice, case studies, and best practices.
Special Sessions by PPDM: Two additional sessions organised by PPDM (the global energy data professionals) will focus on the management of seismic data and emission data, with perspectives on optimising data practices to support sustainability and operational efficiency.
Make sure to take advantage of the early bird discount by registering before 10 January.














After the tremendous success of the 2023 edition in Milan, we’re excited to host this prestigious gathering in the Kingdom of Saudi Arabia – the origin of this global event series.
The upcoming 8th Borehole Geophysics Workshop scheduled to take place in Al Khobar, Saudi Arabia from 29 September to 1 October 2025, promises to continue shedding light on the impact of borehole geophysical measurements in the oil and gas industry. For years, these innovative techniques have empowered geoscientists to tackle complex challenges, from pinpointing exact wellto-seismic correlations and fine-tuning velocity models for seismic analysis, to
informing drilling decisions and meticulously monitoring reservoir dynamics.
The workshop takes place against the backdrop of a rapidly shifting energy landscape, driven by the pressing need for sustainable solutions, the importance of precision in reservoir monitoring cannot be overstated. Extending far beyond the confines of traditional hydrocarbon extraction, this pursuit of accuracy also resonates deeply in the growing sectors such as geothermal prospecting, and

pioneering of carbon capture, utilisation, and storage (CCUS) initiatives.
A new era of technological advancement is unfolding, spearheaded by groundbreaking developments in affordable fibre optic solutions – notably Distributed Acoustic Sensing (DAS) and 4C optical point sensors. In tandem, revolutionary leaps forward in surface seismic data gathering via nodal arrays and DAS have enabled synchronised survey captures spanning both subterranean and terrestrial domains. As the symbiosis between surface and subsurface monitoring methodologies deepens, their collective potential for illuminating and overseeing reservoir performance within nascent green energy frameworks continues to captivate professionals worldwide.
For more information
A short course at this year’s upcoming 5th EAGE Digitalization Conference & Exhibition in Edinburgh, Scotland offers an unparalleled insight into the value of data visualisation. On 27 March 2025 Dr Steve Horne (Silixa) will be presenting a foundational short course on Data visualisation principles for scientists.
This one-day classroom course promises to equip participants with essential skills to transform raw data into impactful visuals. Dr Horne, a seasoned research physicist with over three decades of experience in seismic and defence industries, will discuss best practices in scientific visualisation ranging from selection of appropriate chart types to design.
A highlight of the course will be a deep dive into human visual perception. Attendees will learn how to harness biological traits, such as pre-attentive attributes and Gestalt principles, to design intuitive visuals. For example, topics like colour perception and palettes address inclusivity, ensuring visuals are accessible to those with colour vision deficiencies. Dr Horne also tackles common pitfalls, including the misuse of 3D effects, and explains why simplicity often leads to clarity.
The day culminates in a hands-on session where participants will apply the principles covered, redesigning flawed visuals to improve their effectiveness. Whether you work with Excel, MATLAB,

Python, or other tools, this course should help you refine your data visualisation practices to communicate more clearly and effectively.
For more details, visit eagedigital.org.
EAGE’s first Land Seismic Acquisition Workshop, due to take place in Calgary, Alberta, Canada on 8-9 May 2025 is designed to help both operators and vendors meet the challenges of taking today’s technology to the next level in terms of seismic resolution and field efficiency.

In some areas of the world, high density Vibroseis operations combined with the deployment of nodal equipment systems is commonplace, but in other areas, terrain challenges and equipment limitations abound. Four sessions at the workshop will focus on the latest advances in sampling, sensors, sources, and field implementation so that everyone who attends will hopefully come away with not just a full understanding of the problems facing land seismic acquisition, but also of the solutions that can be immediately implemented on upcoming land seismic acquisition programmes.
Despite our industry’s best efforts, most 3D seismic acquisition geometries still under sample the wavefield. As processing and quantitative analysis methods continue to advance, seismic acquisition
geometries must also be improved to ensure the data acquired will be applicable to the full geophysical lifecycle. The sampling session will explore both conventional and alternative (carpet grid, parallel linear, etc.) seismic acquisition geometries as well as mixed geometry surveys. Case studies will be invited to illuminate how seismic acquisition sampling impacts processing, interpretation, and inversion.
In the sensor space, both advances in analogue geophones and digital sensors will be explored. Case studies examining best practices for transitioning from cabled to nodal systems, including in areas of the world that have limited access to new nodal technologies, will be presented. Methods for addressing ambient noise will be discussed to identify new ways of
accurately and efficiently conducting QC of data while in the field.
Recent advances in new source technologies are enabling surveys in not only more rugged terrains, but also in highly populated areas where traditional sources may be restricted. One session will explore how mixed source surveys can enable innovative solutions for acquiring more effective seismic surveys with lower survey land footprint.
In the implementation session, various case studies will address the challenges of taking a theoretical design into the real world. For example, methods for increasing operational efficiency while maintaining data quality and reducing environmental impact. In all sessions, panels comprising industry experts will discuss the latest technologies and applications.
The EAGE Student Fund supports student activities that help students bridge the gap between university and professional environments. This is only possible with the support from the EAGE community. If you want to support the next generation of geoscientists and engineers, go to donate.eagestudentfund.org or simply scan the QR code. Many thanks for your donation in advance!
We would like to thank our sponsors for their generous support to EAGE in 2024!


We thank all our valued advertisers for their loyal support in 2024!


We would like to thank our exhibitors for their generous support to
in 2024!
3DHISTECH A Advanced Geosciences Europe S.L. • AeroDelft • Alcatel Submarine Networks. • Allton • Ampseis • Applied Acoustic Engineering Ltd • Aramco • Argeo • ArianeLogix • ARK CLS Ltd • AspenTech • Atlas Fluid Controls • Avalon Sciences Ltd B Baker Hughes • Beicip-Franlab • Bell Geospace • BGP Inc. • Bluware AS • BLUWARE INC. C Canopus Drilling Solutions Geothermal BV • Carbon Guardian LLC • Cegal AS • China Oilfield Services Limited • Chongqing Gold Mechanical & Electrical Equipment Co.,Ltd • Curtin University • CVA Europe Holding D Delft Inversion • Dell Computer S.A. • dGB Earth Sciences • Dhahran Geoscience Society (DGS) • DownUnder GeoSolutions (London)Pty Ltd • Dynamic Graphics Ltd E E&P Consulting Ltd • Earth Science Analytics • Earth Signal Processing Ltd. • EBN BV • Eco-Runner • EIF Geosolutions • EIWT • Eliis SAS • EMerald Geomodelling • EMGS ASA • Engenius Software • Entreprise Nationale de Géophysique, ENAGEO SPA • EOST Strasbourg • EPI Ltd • Eriksfiord • ESRI • ET Works AS • Evotec AS • Excellence Logging F Fibron • Fraunhofer IWES • Fugro GB Marine Ltd. G Gaia Exploración S.L • GEM Systems Advanced Magnometers • Geo Ex Machina • Geoactive Limited • Geocap AS • Geofizyka Torun S.A. • Geological Survey of Finland (GTK) • Geology Without Limits Overseas • Geometrics Inc • Geomind AS • Geopartner Geofizyka sp. z o.o. • Geophysical Insights • GeoSoftware • Geospace Technologies Corp. • Geosurveys - Consultores em Geofisica, Lda • Geoteric • GeoTomo LLC • Geovariances • Geovista Ltd • Gesteinslabor Dr. Eberhard Jahns e.K. • GK Processing • Glex • GRM-services Oy • Guideline Geo H Halliburton Landmark • Hampidjan Advant AS • Hefei Guowei Electronics Company Limited • Heriot-Watt University • HGS Products B.V. I I-GIS A/S • Ikon Science Ltd • Imaged Reality • ImpulseRadar Sweden AB • InApril AS • Indalo International Limited • INOVA Geophysical • INT Inc. • International Seismic Co (iSeis) • IRIS Instruments K Kadme AS • Kalkulo AS • Kappa Offshore Solutions • Katalyst Data Management • King Fahd University of Petroleum and Minerals • Kongsberg Discovery AS • Kongsberg Satellite Services L Leobersdorfer Maschinenfabrik GmbH • Lim Logging • LMK Resources Inc. • Lobster Robotics M Marac Enterprises Inc. • Math2Market GmbH • Medusa Radiometrics BV • MIND Technology, Inc • Moveout Data Services Ltd. N Nimbuc Geoscience • Nissan Chemical Corporation • Norsk Elektro Optikk AS • Nova Scotia Department of Natural Resources and Renewables • NTNU O Omaten • Onward • OPENGOSIM LTD • OvationData Ltd. • Ovun AS • OYO Corporation P PanTerra Geoconsultants BV • Paradigm Geophysical UK Ltd • PE Limited • Petroskills • PetroStrat Limited • PJSC Ukrnafta • Project Geminae • Prores • Prospectiuni SA • PXGEO Services DMCC. Q Qeye • Qeye Labs Canada Ltd. R Radai • RadExPro Seismic Software LLC • Ragnarock Geo • Resman AS • Rezlytix Technologies Pvt. Ltd • Rock Flow Dynamics • RockWave Ltd • ROGII Inc • RoQC Data Management • Roxar Software Solutions AS • RPS Energy S S&P Global Commodity Insights • S3 (cube) Smart Seismic Solutions • SAExploration • Saudi Geophysical Consulting Office • Scanseis Consulting Group AS • Seagate Technology • Searcher Seismic • Seequent • Seisgate • Seismeq AS • Seismic Image Processing Ltd • Seismic Partner • Seismic Source Co • Seismik • Sensys GmbH • Sercel • Sharp Reflections AS • Shearwater Geoservices Limited • Silixa Ltd • Sinopec Geophysical Corporation • Sintef • SkyTEM Surveys ApS • SLB • SmartSolo Inc. • SNF S.A • Solgeo srl • Sonardyne International Ltd • Sound Oceanics LLC • Sound QI Solutions Ltd. • SPH Engineering • Spotlight • STEMA Systems • Stiftelsen NORSAR • Stryde Limited • Subsurface AI inc. • Suzhou Geophysical Deep Sensing Technology Co., Ltd • SYRLINKS T Task Fronterra Geoscience Limited • TDIBrooks International Inc. • Tech Limit • Teledyne Marine • TEMcompany ApS • TERRASYS Geophysics GmbH & Co. KG • TGS ASA • The EasyCopy Company • The Open Group • Tianjin QuikSeis Equipment Co., Ltd • TotalEnergies S.E. • TRE ALTAMIRA • Troika International Ltd U Ulmatec • University of Alberta • University of Stavanger V Verif-i Limited • Viridien • Vr2planets • VRGeoscience Limited • VSProwess Ltd W Weihai Sunfull Geophysical Exploration Equipment • Wintershall DEA AG Z Zhaofeng Sensor Equipment Co Ltd • ZZ Resistivity Imaging Pty. Ltd.

One of few Black geoscientists in the UK, Chris Jackson reflects on a remarkable career to date that includes early geological work in Norway and professorships at Imperial College and University of Manchester before leaving, in part due to perceived institutional racial discrimination in higher education. Now active in energy transition-related work in the private sector, he has emerged as an increasingly wellknown public figure advocating for geoscience and science generally in broadcast media, podcasts and print.
My parents arrived in the UK from Jamaica (Mum) and St Vincent (Dad) in the late1960s, towards the end of the so-called Windrush generation. They met at nursing school in Derby, where I was born. I had a nice childhood, and despite being academically able, I was largely distracted by sports. I played a lot of football and did athletics.
Even as a young person competing in several sports to a fairly high-level, I realised the chances of becoming a professional sports person were very slim. I chose geology by accident, having stumbled across it at an A-Level open day at my local city college. A geology undergraduate degree at university was then an obvious choice, with a subsequent PhD.
My first post-PhD job was for Norsk Hydro (now Equinor) in the research centre in Bergen providing in-house consultancy on a range of structural and stratigraphic projects. The job was fun, and I learned a lot of geoscience, but the best thing was the lifestyle balance. I skied, fished, and visited many exciting places in the mountains.
I left Norway and took an initially part-time academic position in the UK for personal reasons. I never wanted to be an academic, and assumed I’d leave shortly after for another industry job. What little I knew. In my 17 years in academia, teaching was and remains
a huge honour; people are investing their time and money to listen and learn from you.
As Nelson Mandela said, ‘Education is the most powerful weapon which you can use to change the world.’ Swap out ‘education’ for ‘knowledge’, and this effectively outlines my motivation for trying to make access to scientific information more widely and freely available, and for science to be more transparent. In 2017 I co-founded EarthArXiv, the first preprint server for the earth and planetary sciences. Our research group increasingly targets Open Access (OA) journals, or at least those that support professional societies. I also refuse to review for, or submit first-author papers to journals that have OA-hostile policies.
I am technical director (subsurface storage) at the engineering consultancy WSP. I work on a range of geoenergy and geostorage projects. The basic science does not differ between academia and industry, i.e., we collect, describe, and interpret data, with the aim of improving our collective knowledge. However, in my experience, they differ in how success is measured and shared, i.e., individualism in academia vs. a more team-based recognition system in industry. I ultimately left university life for a combination of reasons, including the increasingly hyper-competitive nature of higher education, the desire to apply some of my geoscientific skills to realworld problems, and a specific incident at the University of Manchester. Basically I
wanted to return to a technical rather than administrative position.
Broadcasting career
I fell into (geo)science communication having been asked to give a public lecture at the Geological Society in 2014. Subsequently, the BBC invited me to contribute to BBC2’s Expedition Volcano in 2017. It was all very fortuitous, but having now undertaken science communication via podcasts, radio, TV, and print media, I now realise its value, i.e., we need to clearly communicate how important geoscience is (and who we are) to the public and politicians.
In the UK at least, geoscience is notoriously un-diverse. Yet numerous studies indicate that diversity brings many benefits to organisations. My personal experience has been broadly positive. There have been times, however, when I have been subject to racial discrimination and hostility; this has arisen, at least partly, due to a general lack of diversity in geoscience and related preconceptions of what a geoscientist looks like, i.e., a white man.
I run a lot, having completed 15 marathons, almost 50 half-marathons and last summer, two ultra marathons. Along with cycling, rock climbing, and walking, this keeps me physically and mentally fit. I recently learned to play the guitar, which is very relaxing. Around all this, I enjoy spending time with my family, whether that’s walking in the hills or watching a movie.
Chris Jackson
BY ANDREW

We are entering 2025 with continuing questions if not unease over the progress and direction of the global energy transition agenda. It’s a conclusion based on the generally agreed assumption that only cooperative undertakings between countries everywhere will get us to Net Zero in a desirable timeframe.
This should not come as too much of a surprise, especially for visitors to EAGE’s outstandingly successful GET 2024 Conference and Exhibition in Rotterdam in November. Many presentations at the event demonstrated without a doubt that the geoscience community is enthusiastically embracing research and development of current technical solutions where it can help provide pathways to Net Zero, e.g., wind, geothermal, hydrogen and carbon capture and storage (CCS).
Unfortunately, scientific endeavour can only take us so far. The report card of meaningful take-up of many of these technologies still remains sketchy. Wind turbines are of course the big success story to date with their contribution to total electricity generation worldwide closing in on 10%. Even here in the short term, prospects of continued rapid expansion may be faltering due in some cases to government withdrawal of subsidies, regulatory hurdles and some environmental pushback, all factors affecting the investment model. The US, Sweden and Denmark, countries that have up to now welcomed windpower projects, provide examples of weakening interest, notably the latest offshore wind licensing round in Denmark which did not attract a single bid.
billion tonnes (Gt). This compares with an increase of 490 Mt in 2022 (1.3%).
That said, many countries are increasing efforts to develop new CO2 capturing techniques in order to lower greenhouse gas emissions. According to energy analyst Statista, there were 628 projects in the commercial carbon capture and storage (CCS) facilities pipeline worldwide; 50 of these were operational, while almost 290 were in early development with the majority of upcoming projects confined to North America.
Meantime geothermal has still to deliver power generation at scale, and is currently responsible for less than 1% of global electricity generation. Hydrogen power is even more nascent.
Investment trends tell the renewables story so far. Solar PV and wind power continued to dominate, according to REN21 based on multiple sources. Solar PV accounted for 63% of the 2023 total and wind power for 35%, almost mirroring the 2022 figures. China, the US and the UK together accounted for 66.5% of global wind power investment in 2023. Investment in geothermal energy did expand by nearly 27-fold in 2023 to $8 billion, with more than half of this in the US ($4.3 billion).
‘Scientific endeavour can only take us so far’
CCS was a major focus of GET, understandable as much geoscience technology experience from the oil and gas industry is directly transferable, so feasibility as such is not so much in question. Exemplary European projects such as Northern Lights (Norway) and Porthos (Port of Rotterdam) have to be set against a frustrating reality. Global capture capacity of operational commercial carbon capture and storage (CCS) facilities totalled 51 million metric tons (MT) as of July 2024, a fraction of what is needed given global energy-related CO2 emissions grew by 1.1% in 2023, increasing 410 Mt to reach a new record high of 37.4
Renewable power installations attracted far more investment than fossil fuel power plants in 2023. Investment in new renewable power capacity accounted for 82% of the total global investment in new power generation, including fossil fuels and nuclear but excluding grids and storage. Leaving aside power infrastructure, REN21 estimates that when both upstream and downstream oil, gas and coal and related infrastructure investments are considered, the combined total annual investment in fossil fuels dwarfs that in renewable power and fuels. Investment in upstream oil and gas increased 9% in 2023 to around $538 billion with national oil companies in the Middle East and Asia responsible for nearly all of the increase.
A test of international determination to reduce CO2 emissions will be reached next month (February 2025). This is when parties to the UN Paris Agreement are mandated to submit their climate inten-
tions via Nationally Determined Contributions (NDCs), a statement every five years outlining plans to reduce greenhouse gas emissions to help meet the 2050 Net Zero target. The UN Emissions Gap Report (October 2024) states that emission cuts of 42% are needed by 2030 and 57% by 2035 to get on track. Failure, it says, could result in a temperature increase of 2.6-3.1°C over the course of this century.
G20 nations (Argentina, Australia, Brazil, Canada, China, France, Germany, India, Indonesia, Italy, Japan, Republic of Korea, Mexico, Russia, Saudi Arabia, South Africa, Turkey, UK and US) are charged with needing to do the heavy lifting. Responsible for three quarters of current global emissions, G20 members will largely determine when global emissions reach net zero. All except Mexico and the African Union have at least set net-zero targets. But the Emissions Gap Report records limited progress on key indicators of confidence in net-zero implementation, including legal status, the existence and quality of implementation plans and the alignment of near-term emission trajectories with net-zero targets. A complicating factor for some countries like India is that climate change is actually inviting more fossil fuel consumption to counter extreme heat.
Any international agreement may also be imperilled by some potentially tectonic shifts in the world economic order. Weeks before COP29, the 16th annual international BRICS meeting held in Kazan, Russia, on 22-24 October 2024 was widely regarded as the most meaningful to date. Dismissed by some as a Russian statement of imperviousness to Western sanctions, the membership has grown from Brazil, Russia, India, China, and South Africa to also include Egypt, Ethiopia, Iran, and the United Arab Emirates summit with Saudi Arabia also close to joining. This alignment is sometimes portrayed as a formative Global North and South divide.
‘Up to society and governments to assume command |of this ship’
This bloc would represent over 40% of global oil supply. The presence of major oil exporters alongside key importers such as China and India – neither of which favoured Western sanctions on Russia – highlights the bloc’s potential to establish alternative trade mechanisms that bypass the dominance of the US dollar and the financial influence of the G7, and bring a different perspective to any energy transition initiatives.
Climate change was not at the top of the agenda at the last G20 meeting in Brazil in November., in fact it was something of a bust, convened under the cloud of President Trump’s imminent return to office threatening, among other things, a tariff war, likely opposition to the 2105 Paris climate accord and measures to boost US oil and gas production. There was no condemning of hostilities in Ukraine and Palestine/Lebanon or cautionary statements about rising protectionism worlwide and no explicit commitment to transition away from fossil fuels (despite the landmark roadmap agreement achieved at the Dubai COP28 in 2023).
Such events do not bode well for concerted worldwide action. Last November’s COP29, the foremost international gathering on climate change, didn’t exactly exude united resolve. The optics alone of holding the event in the oil and gas mecca of Baku, Azerbaijan did not bode well. What transpired was an exercise in frustration once again dividing rich and poor nations. The headline trebling to $300 billion of the pledged annual contribution to be made by wealthy nations by 2035 to help poorer nations cope with climate change was greeted as grossly insufficient. The estimated yearly figure needed to reduce emissions and build resilience in vulnerable countries is said to be some $1.3 trillion yearly by 2030. True there were some vaguish agreements on reducing methane emissions and carbon credit trading. However, energy analyst Rystad concluded ‘COP29 has set the stage for transformative change, but the focus must now shift to execution. Whether through targeted financing, aggressive methane reductions, or enhanced NDCs, the race to net-zero emissions requires actionable policies grounded in robust frameworks. The time for ambition has passed – action is now the ultimate test.’
In the blame game, the popular knee-jerk response is to paint the oil and gas industry as the villain in this disappointing climate change narrative. Topped by the US, global oil production is this year expected to reach a new peak of 103 million barrels per day, according to the International Energy Agency. Analysts are divided on future trends. No need to rehearse the energy trilemma to explain why oil companies do what they do. Of course, recent modifications to decarbonisation programmes in companies like bp, Shell and Equinor are not a good look, and it would be nice if energy companies invested more in the alternatives, but that’s not what their stakeholders want.
So, as ever, it is up to society and governments to assume command of this ship. As we can see from global trends that clearly isn’t happening yet. Nor does there appear to be much urgency in public discourse. Campaigner Greta Thunburg, Just Stop Oil, Extinction Rebellion UK, etc. have been relatively quiescent of late despite major floods, heatwaves, wildfires, etc around the world attributed to changes in our climate. One explanation for this may be the so-called issue attention cycle, a concept first articulated by economist Anthony Downs in 1972. The basic premise is that the media cannot sustain public interest for very long in any issue however important before ennui sets in. The exception occurs when the concern directly affects people. In this context climate change is not tangible or upsetting enough in our daily lives.
Public indifference or apathy can only be countered with better understanding of what’s at stake, otherwise the sensationalist claims of madcap climate deniers, doomsters and so forth will be amplified in social media and other public forums potentially drowning legitimate decision-making on CO2 emissions. This is why EAGE is right to advocate a communication policy that promotes the value of geoscience to a wider audience than the bubble of our own professional community. How this can be done is an important discussion.
Views expressed in Crosstalk are solely those of the author, who can be contacted at andrew@andrewmcbarnet.com.


• Train and Launch
• Asset Optimisation
• Operational Excellence
• Seismic Data Integrity
Are you looking to optimize quality control for seismic data accuracy, streamline operations for survey success, or integrate new technologies into your workflow? Whether you are a contractor or an energy company, we are here to help you:
• Operation Supervisor Support
• Continuous Update & Upskill
Book a meeting now!

Book a meeting with our specialist and get expert technical guidance and strategies to improve operational performance.




Equinor and Shell are combining their UK offshore oil and gas assets to form a new company which will be the UK North Sea’s biggest independent producer and ‘sustain domestic oil and gas production and security of energy supply in the UK’.
The incorporated joint venture will be equally owned by Equinor (50%) and Shell (50%), even though Equinor currently produces around 38,000 barrels of oil equivalent per day in the UK and Shell UK 100,000 barrels.
‘With the once prolific basin now maturing and production naturally declining, the combination of portfolios and expertise will allow continued economic recovery of this vital UK resource. The new company will be more agile, focused, cost-competitive and strategically well positioned to maximise the value of its combined portfolios on the UK Continental Shelf,’ said the companies in a joint statement.
Shell and Equinor claimed that the joint venture is good news for companies active in the British oil and gas industry, including seismic contractors and consultants, that were fearing a downturn of work in UK waters. ‘The new company will invest to provide a long-term sustainable future for individual oil and gas fields and platforms, helping extend the life of this crucial sector,’ the statement continued.
Based in Aberdeen, the joint venture will include Equinor’s equity interests
in Mariner, Rosebank and Buzzard, and Shell’s equity interests in Shearwater, Penguins, Gannet, Nelson, Pierce, Jackdaw, Victory, Clair and Schiehallion. A range of exploration licences will also be part of the transaction.
Equinor will retain ownership of its cross-border assets, Utgard, Barnacle, and Statfjord, and offshore wind portfolio including Sheringham Shoal, Dudgeon, Hywind Scotland, and Dogger Bank, according to the statements, which highlighted that it will also retain the hydrogen, carbon capture and storage, power generation, battery storage, and gas storage assets.
Shell UK will retain ownership of its interests in the Fife NGL plant, St Fergus Gas Terminal, and floating wind projects under development – MarramWind and CampionWind. The company will also remain technical developer of the Acorn carbon capture and storage project.
Equinor’s executive vice-president for exploration and production international, Philippe Mathieu, said: ‘Equinor has been a reliable energy partner to the UK for over 40 years. This transaction strengthens Equinor’s near-term cash flow, and by combining Equinor’s and Shell’s long-standing expertise and competitive assets, this new entity will play a crucial role in securing the UK’s energy supply.’
Shell’s Integrated gas and upstream director, Zoë Yujnovich, said: ‘Domes-
tically produced oil and gas is expected to have a significant role to play in the future of the UK’s energy system. To achieve this in a mature basin, we are combining forces with Equinor, a partner of many years. The new venture will help to play a critical role in a balanced energy transition.’
Equinor employs around 300 people in oil and gas roles in the UK, while Shell employs approximately 1000. ‘We don’t anticipate any staff reductions as a direct result of this announcement,’ a Shell spokesperson said. ’However, there are a number of reorganisations which have already been announced. We expect only limited additional job reductions ahead of this transaction.’
Equinor said that it ‘is not planning any down-manning as part of this transaction’.
Wood Mackenzie said the deal would create a UK energy ‘superpower’ that would deliver 220,000 barrels of oil equivalent a day by 2030, well ahead Harbour Energy, which delivers 130,000 barrels of oil equivalent per day.
‘The venture will create the biggest producer on the UK Continental Shelf and demonstrates the long-term attractiveness of the region,’ said Gail Anderson, a research director at Wood Mackenzie. ‘There is also potential for future fields, as both companies acquired acreage West of Shetland in the 33rd licensing round.’
The transaction was due to come into effect on 1 January 2025.
Chevron has announced an organic capex budget of $14.5-15.5 billion and affiliate capex budget of $1.7-2 billion for 2025. Restructuring and other charges are expected to be $1.1 to $1.5 billion. The company’s 2025 budgets represent a $2 billion year-over-year reduction. ‘The 2025 capital budget along with our announced structural cost reductions demonstrate our commitment to cost and capital discipline,’ said Chevron Chairman and CEO Mike Wirth.
Eni and the Ministry of Mines, Oil and Energy of Côte d’Ivoire have signed contracts for the acquisition of four offshore exploration blocks. Blocks CI-504, CI-526, CI-706 and CI-708 cover 5720 km2 with a water depth ranging between 1000 and 3500 m; their proximity to the Calao discovery, made in Block CI-205, represents a strategic opportunity to create further synergies in the area, said Eni.
EMGS has signed a $10 million contract with an undisclosed client for a CSEM survey in India. The vessel Atlantic Guardian is expected to commence transit from Norway in the fourth quarter of 2024.
ExxonMobil has notified Staatsolie that it will withdraw from Block 52 in the Surinamese offshore area on 14 November 2024. This withdrawal is part of ExxonMobil’s ongoing evaluation of assets in its global portfolio. ExxonMobil is transferring its 50% working interest to Petronas, which is the operator of the block.
SeaBird has reported third quarter revenues of $10 million with EBITDA of $4.4 million. Net interest-bearing debt is $10.7 million; utilisation of its fleet was 98%.
Petronas has won production sharing contracts (PSC) for three discovered resource opportunities clusters and one exploration block offered under the Malaysia Bid Round (MBR) 2024, which was launched earlier this year. The PSCs cover nine fields and one exploration block, featuring oil and gas discoveries located offshore Peninsular Malaysia and off the coast of Sabah.
Shearwater Geoservices has won a contract for a 15,500 line-km 2D seismic survey on the continental shelf margin off the west coast of India.
The vessel SW Thuridur will acquire the data for approximately five months, starting in Q4 2024. The project, part of India’s National Seismic Program (NSP), will play an important role advancing India’s strategic approach to map key unappraised offshore areas, said Shearwater.
Irene Waage Basili, CEO of Shearwater, said: ‘The data acquired will not only advance understanding of unappraised areas but will also lay the groundwork for future 3D seismic acquisition programs.’
Meanwhile, the company has won a 14,500 line km 2D towed-streamer seismic survey by Oil India Ltd, on the east coast of India in the Bay of Bengal. The project, scheduled to commence early 2025, forms part of India’s National Seismic Program (NSP) and is expected to last around five months.
‘This contract marks the second NSP survey, and third towed streamer project awarded to Shearwater for this season in India, emphasising our strong position in the Asia Pacific region,’ added Basili.
Meanwhile, Shearwater has won a contract from ONGC for a large 3D seismic survey off the east coast of India. The vessel Oceanic Sirius will carry out the survey, covering an area of approx. 2200 km2, which is expected to take approx. four months, commencing early 2025.
Basili said: ‘Our expertise in 3D seismic acquisition, combined with our track-record of eight consecutive seasons of India operations, ensures that we are well positioned to deliver data in line with our clients exploration needs.’

DUG Technology (DUG) has signed a partnership with PetroVision aimed at promoting and delivering specialised seismic data processing solutions in Nigeria.
PetroVision will facilitate operations within Nigeria, while DUG will supply technology and support. This includes use of the DUG Insight processing, imaging and interpretation software and remote access to DUG’s teams of geophysical experts. PetroVision will manage a local processing office within Nigeria, utilising computer resources via the DUG HPC Cloud platform.
DUG provides geoscience services, analytical software and reliable cloud-
based high-performance computing (HPC).
PetroVision is an integrated energy consultancy which advises on geoscience, engineering and economic aspects in the upstream, midstream and downstream sectors while also working on carbon capture and storage projects and providing field exploration geochemical sampling for critical minerals, such as lithium.
DUG’s managing director Dr Matthew Lamont said: ‘We are looking forward to working closely with the team at PetroVision to build a strong presence, and grow our client base in Nigeria.’
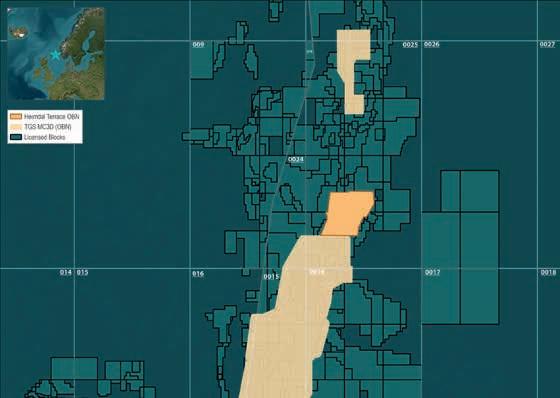
TGS and joint venture partner Viridien have completed the multi-client Heimdal Terrace Ocean Bottom Node (OBN) project in the North Sea and delivered the final processed data.
The Heimdal Terrace OBN survey, the first of two multi-client dense OBN surveys acquired in the North Sea in 2023, spans 426 km2 in a mature region that includes the Balder and Ringhorne fields as well as nearfield exploration acreage. Conducted from April to June 2023, the survey employed up to three node-handling vessels, two triple-source vessels and four support vessels. The data acquisition resulted in 28,814 node positions and nearly 1.2 million shot points, providing an extensive new dataset for the region.
Processing and imaging techniques included deblending, noise attenuation,
up-down deconvolution, and pre-stack depth migration. A velocity model was generated using least-squares diving-wave full-waveform inversion (FWI) followed by time-lag FWI, utilising the full recorded wavefield, including refractions, reflections, diving waves, ghosts, and multiples, to capture subsurface detail at all depths.
‘The imaged data shows substantial improvement in resolution and structural clarity over previous datasets, offering crucial insights into the region’s complex geology and reservoirs. This enhanced imaging, including depth-time conversion, will be valuable to explorers operating in the area for years to come,’ said the companies in a joint statement.
Meanwhile, TGS has won an OBN contract in Europe from a repeat customer
to ‘optimise resource extraction over a well-established’ producing field. The company’s node-on-a-rope crew is scheduled to commence acquisition in early April 2025 and the contract has a duration of approx. 35 days.
Seequent has signed a two-year partnership with the International Geothermal Association (IGA) to boost geothermal energy’s role as a sustainable and reliable renewable energy source.
Seequent software supports more than half of the world’s geothermal electricity production, bringing clarity to a complex unseen challenge of managing subsurface resources. The company has been involved in projects to bring geothermal energy directly to heat homes in Paris and Munich.
Its innovations include adding new physics capabilities to its software to trace fluids more accurately, ultimately leading to more efficient resource management and a more sustainable geothermal operation.
Marit Brommer, chief executive officer, IGA, said: ‘Geothermal energy has been overlooked as a reliable and sustainable energy source. Partnerships like this are essential to accelerating its growth. We are excited to partner with Seequent, whose technological innovations in subsurface modelling bring clarity to geothermal development, empowering
countries to leverage this clean energy resource and drive meaningful progress toward global net zero goals.’
Graham Grant, chief executive of Seequent, said: ‘An emerging use case for geothermal is the rise of hyperscale AI-enabled data centres which represent a rapidly emerging new form of power demand requiring reliable baseload, or consistent, power supply. Geothermal is the cleanest form of renewable energy, able to provide this baseload power and should play a key role in future data centre strategy globally.’
Seequent customer Fervo Energy is applying oil and gas technology to find new ways to produce geothermal energy
for Google’s data centres in the Nevada desert.
Jack Norbeck, chief technology officer and co-founder, Fervo Energy, said: ‘Seequent’s partnership with the International Geothermal Association marks an important step in advancing the role of geothermal in the global energy transition. At Fervo, we’ve experienced firsthand how Seequent’s technologies enhance our ability to manage and optimise geothermal reservoirs.’
The latest UN Emissions Report found geothermal energy had the potential to mitigate more energy emissions by 2035 than carbon capture and storage, or bioenergy, or the reduction of methane emissions from coal mining.
The International Renewable Energy Agency (IRENA) has said geothermal energy production in Europe could grow eight-fold by 2050, and the US Department of Energy predicts that similar advancements could drive a 26-fold increase.
The US Department of Interior has recently begun unlocking permitting constraints on public lands, said Seequent.
Viridien has announced the ‘sudden and untimely’ death of David Le Meur, research principal at its Massy Subsurface Imaging Centre in France.
Le Meur, who was 56, joined what was then CGG in 1997 after earning a PhD from Université Paris XI (now Université Paris-Saclay). His career in the company’s imaging research team included a three-year posting to its Calgary processing centre from 2004 to 2006 followed by a one-year assignment at its Muscat dedicated processing centre.
After being promoted to manager of the land processing research team in 2013, he and his team made significant technical advances in areas such as surface-con-
sistent processing, interferometry, random and erratic noise attenuation, surface- and multi-wave inversion, and, more recently, land demultiple.
Over the years, Le Meur became Viridien’s research expert on land processing, particularly the imag ing challenges of the Middle East and North Africa. In recent times, he was research principal for Viridien’s Massy Subsur face Imaging Centre in France, where he managed its land and marine processing R&D team.

‘David’s expertise, dedication and commitment to innovation meant that he was highly respected within the company and the wider technical community,’ said Viridien in a statement. ‘Playing an active role in the EAGE and SEG and communities, he was often an invited or keynote speaker and regularly participated in the leading technical workshops. Our heartfelt thoughts are with his wife and three children.’
David Le Meur died on 13 November 2024.

TGS has won a ‘significant 3D streamer contract from ONGC in the Mahanadi basin on the east coast of India. The vessel Ramform Sovereign is scheduled to mobilise for the survey
in January 2025 and the contract has a duration of approximately six months.
‘India is a hotspot for streamer seismic and ocean bottom node work and the contract award strengthens TGS’ position in the area, underscoring the company’s ongoing commitment to providing the highest quality data solutions to clients,’ said TGS in a statement.
Meanwhile, TGS has won a large 3D streamer contract in the South Atlantic. Acquisition is scheduled to commence in Q4 this year and the contract has a duration of approximately 140 days.
Kristian Johansen, CEO of TGS, said: ‘The comprehensive seismic survey is designed for enhanced subsurface imaging in a challenging geological environment. Our Ramform acquisition platform, coupled with our proprietary GeoStreamer and Gemini source technology will secure delivery of high-quality seismic 3D data.’
The UK North Sea Transition Authority (NSTA) is inviting bids to carry out two subsurface modelling projects to improve understanding of the relationships between pressure and formation fluid movement in saline aquifers that could store carbon dioxide.
For Tender 1, the NSTA is seeking proposals to help understand the impact that the movement of subsurface fluids – due to pressure changes induced by CO2 injection – may have at existing well locations.
Tender 2 is to run simulations using representative fluid properties of CO2
to investigate the subsurface factors that most influence or control the behaviour of migrating CO2.
Bidders have until 29 November 2024 to submit their applications. The project must be completed on or before 31 March 2025.
BP and JERA are combining their offshore wind businesses to form one of the largest global offshore wind developers, owners and operators.
JERA Nex bp will have a mix of operating assets and development projects with total 13GW potential net generating capacity. Combining their pipeline and bolstering access to competitive financing, the partners have agreed to invest $5.8 billion before end of 2030.
The combined companies have operating assets with around 1GW net generating capacity, a pipeline comprising around 7.5GW capacity, and further secured leases with around 4.5GW of potential capacity.
JERA Nex bp will initially focus on progressing existing projects in NorthWest Europe, Australia and Japan, and ‘mature the development pipeline of significant longer-term opportunities’.
JERA entered the offshore wind market in 2019 through investments in projects in the UK and Taiwan. In 2023 it acquired Belgium offshore wind player,
Parkwind, and used this business to form a renewables vehicle, JERA Nex. It owns and operates wind farms in Belgium, Germany, Japan and Taiwan and has a development portfolio that includes projects in Japan, Ireland, and Australia.
bp has been building a portfolio in offshore wind since 2019, and now has a development pipeline of 9.7GW net (5.7GW development projects and a further 4GW secured leases). Development projects are the Morgan and Mona schemes in the UK Irish Sea, and Oceanbeat East and Oceanbeat West in Germany’s North Sea, with secured leases off Scotland and the east coast of the US.
JERA Nex bp will be based in London. Its CEO will be nominated by JERA and the CFO by bp. On completion, offshore wind teams from both JERA and JERA Nex and staff from bp’s offshore wind business will be expected to move into the new business.
The deal is expected to be completed in Q3 2025.
Shearwater GeoServices has reported third quarter revenues of $178.7 million compared to $267.3 million in Q3 2023. Operating profit of $13.6 million compared to $52.7 million in Q3 in 2023.
Vessel utilisation of 61% (11.1 active vessels), compared to 75% in Q2 2023 (13.6 active vessels).
Irene Waage Basili, CEO of Shearwater, said high activity at the start of the quarter was followed by increased idle-time due to completion of several projects. However, the company won several contracts in Q4 2024 and backlog is $360 million.
‘The marine seismic acquisition market has been slower than expected in 2024. We saw seasonal increase in demand over the North Sea summer albeit not as prolonged as we saw last year.
Although activity levels in the fourth quarter will be low, the project pipeline
for the upcoming winter season and further into 2025 is encouraging, indicating increased demand in our core markets around the world. We have seen a recent increase in contract awards, but as expected, we also see projects move into 2025 that were previously assumed for fourth quarter execution.’
Basili called current ‘market rates’ for seismic acquisition ‘challenging’. ‘it is important that the industry maintains rates that are sustainable and reflect the value creation enabled by state-of-the art technology and high-quality subsurface data.
‘Our commitment to advancing seismic technology and our role as industry consolidator over the cycle, position us to capitalise from increased demand. As the timing of that demand remains uncertain, Shearwater is currently evaluating the optimal size of the swing capacity.’


Full-Wave Correc/on (FWCTM) Technology can address sca9ering and improve your challenging seismic data

A4E Well Spacing automates spacing measurements, offering an easy-to-use interface in Spotfire. It calculates well density using user-defined ellipses, analyses parent-child relationships and degradation over time, and provides traditional X, Y, Z spacing measurements.
TGS has announced a strategic partnership with Blue River Analytics, creators of the Analytics for Energy (A4E) Suite on the Spotfire platform. The collaboration integrates TGS’ production, completions and cost data directly into the A4E Suite, providing E&P companies with ‘a more efficient and effective approach’ to forecasting and analysing production and well data. By combining TGS’ data with Blue River Analytics’ platform, customers can now create forecasts and valuations in minutes, enabling data driven decision-making at every stage of exploration and production, said TGS.
‘As the energy sector relies on timely, reliable data for informed decisions, this integration eliminates the need for
manual data preparation and transformation,’ said TGS. ‘Users can now work with TGS datasets seamlessly within Spotfire, leveraging Blue River Analytics’ advanced valuation and forecast workflow. With capabilities like advanced decline curve analysis, type well profiles, probabilistic Markov Chain Monte Carlo (MCMC) forecasting, workover detection and reserves import/ export, all in one interface, operators can make decisions faster and with greater precision.’
The A4E Well Spacing tool automates spacing measurements, offering an easy-to-use interface in Spotfire. It calculates well density using user-defined ellipses, analyses parent-child relationships and degradation over time, and provides traditional X, Y, Z spacing measurements.
David Hajovsky, executive vice-president of multi-client at TGS, said: ‘This partnership diversifies the ways our customers can access and leverage our comprehensive data library. It saves operators weeks of time while improving the accuracy of their economic models and updates.’
John Buckley, founder and CEO of Blue River Analytics, said: ‘In today’s competitive energy market, quick and easy access to high-quality data is crucial for confident, data-driven decisions. Our partnership with TGS removes traditional barriers to data, supporting E&P companies, mineral companies, banks and private equity firms with optimised workflows that produce highly accurate forecasts in minutes.’
Viridien has signed an agreement with MS4ALL, a French start-up focused on molecular simulation. The collaboration further expands Viridien’s HPC & Cloud Solutions business by combining its expertise in sustainable HPC, artificial intelligence (AI) and cloud technologies with MS4ALL’s molecular simulation capabilities.
The agreement will accelerate the development of the new and innovative materials needed for many industrial sectors and evaluate more effective ways to reduce the environmental impact of micropollutants, both of which require computational-intensive simulation. MS4ALL will leverage Viridien’s fully managed HPC, AI and Cloud services to screen and identify the right elementary constituents of new target materials and simulate the degradation of micropollutants in their environment.
Through this agreement, MS4ALL will benefit from the support of Viridien’s dedicated technical teams and customised, optimised solutions, resulting in accelerated simulations, productivity-driven operations, and lower costs.
Additionally, Viridien’s Outcome-asa-Service model, which delivers AI and HPC Cloud with pricing based on results rather than consumption, aligns with MS4ALL’s own customer billing model, ensuring a seamless and efficient collaboration.
Agnes Boudot, EVP, HPC & Cloud Solutions, Viridien, said: ‘We are supporting MS4ALL’s mission to develop new materials and address the environmental challenge of micropollutants.’
Edouard Lété, CEO of MS4ALL, said: ‘By leveraging Viridien’s advanced HPC, AI, and Cloud services, we can accelerate our research and development
processes, ultimately bringing innovative materials to market faster and globally addressing the major issue of micropollutants.’
Meanwhile, Viridien has launched its industrial Viridien Cloud for AI and HPC production in the US, offering tailored cloud solutions and end-to-end expertise to optimise compute-intensive production workloads.
The company is introducing its cloud solutions to meet the evolving needs of sectors, including AI, life sciences, engineering, digital media and energy. The US launch of Viridien Cloud offers access to Viridien’s Outcome-as-a-Service (OaaS) model — a results-driven approach where pricing is based on outcomes, rather than consumption. OaaS provides end-to-end performance optimisation aligned with business KPIs, ensuring predictable, guaranteed costs.
Monitor Exploration and joint venture partner has completed initial processing and interpretation of the 2D seismic acquisition at PEL 93, an 18,500 km2 licence in the Owambo Basin, onshore Namibia.
Interpretation has identified an initial suite of 10 significant independent structural closures within the licence area.
‘Monitor’s initial interpretation of the 2024 2D seismic data confirms the presence of multiple significant leads in the southern area of PEL 93, each with large interpreted structural closures, with some individual leads covering up to approximately 100km2, exhibiting prominent vertical relief and clear hydrocarbon charge potential from source rocks beneath the prospects and in the kitchen to the north,’ said the joint venture partners in a statement.
to evaluate the potential of the licence since the award of PEL 93 in 2018. Ten independent structural closures were initially identified using airborne geophysical methods and later refined with newly interpreted 2D seismic data.
Further analysis of ethane (C2H6 or ‘C2’) concentrations in soil samples over these structures suggests the presence of an active petroleum system. Passive seismic anomalies also align closely with structural leads and measured alkane (C1-C5) concentrations in soil.
These results will contribute to a final prospective resource estimate, completion in the first half of 2025. The JV may conduct further geophysical activities including, acquisition of additional 2D seismic data before the next phase of the PEL93 work-programme, which

Joint venture partner 88 Energy is validating Monitor's findings and work with the will integrate all available well log data, airborne geophysics, soil geochemistry together with the 2D seismic dataset.
A prospective resource estimate for PEL 93 is targeted for completion in 1H 2025, following the internal review of Monitor's seismic interpretation.
Monitor has employed various geophysical and geochemical techniques
includes a single well commitment. Additional 2D seismic may be acquired over lead 11 which has recently emerged as a result of additional mapping by Monitor, based on existing gravity and geochemical data.
Monitor Exploration is operator of Petroleum Exploration Licence 93, with a 55% interest while 88 Energy, holds 20%. Legend Oil (15%) and the National Petroleum Corporation of Namibia (Namcor) 10%.

Aramco has signed a shareholders’ agreement with Linde and SLB, paving the way for development of a carbon capture and storage (CCS) hub that is expected to become one of the largest globally. Under the terms of the shareholders’ agreement Aramco will take a 60% equity interest in the CCS hub, with Linde and SLB each owning a 20% stake. Phase one of the new CCS hub in Jubail is expected to capture and store up to nine million metric tons of CO2 annually, and construction is expected to be completed by the end of 2027.
A consortium comprising TotalEnergies and Saudi developer Aljomaih Energy and water company (AEW) has signed a 25-year power purchase agreement with the Saudi Power Procurement Company (SPPC) related to the 300 MW solar power project, Rabigh 2. This project is part of Saudi Arabia’s Round 5 of the National Renewable Energy Program. The solar plant will be developed, built, owned and operated by the consortium with a connection to the grid planned in 2026.
DNV has certified the feasibility of ADNOC’s West Aquifer CO2 storage site in the UAE. The certificate of feasibility covers the initial subsurface assessments of the Simsima and UER saline reservoirs. The project, guided by DNV-SE-0473, is based on the ISO 27914 standard.
Block Energy has started phase 2 studies for the company’s carbon capture and storage project in licence XIB in Georgia. The studies will be undertaken in partnership with Rustavi Azot. Technical support will be provided by Oilfield Production Consultants, which originally defined the potential of the licence for carbon sequestration. Phase 2 will include desktop and laboratory studies followed by a pilot injection scheme designed to achieve a monitoring and verification plan for carbon storage. Three commercialisation options have already been identified.
BP, Equinor, Shell and TotalEnergies have announced a commitment to invest $500 million in support of the UN Sustainable Development Goal 7 (UN SDG7), which aims to ensure access to affordable, reliable, sustainable, and modern energy for all.
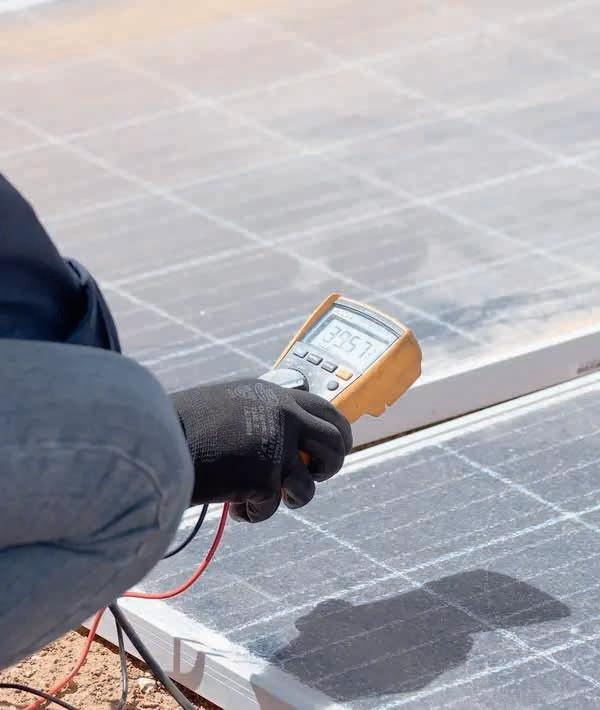
Progress towards universal energy access has stalled, particularly amid recent macroeconomic shocks and rising energy prices, the companies said in a statement. In 2022, the number of people without access to electricity globally increased by around 10 million to 685 million. Additionally, approximately 2.1 billion
people, primarily in sub-Saharan Africa and Southeast Asia, lack access to clean cooking facilities.
The fund will support projects primarily in Sub-Saharan Africa, South and Southeast Asia, aiming to help millions of people in underserved communities gain access to electricity and improved cooking conditions. Capital will be invested in solutions, including solar home systems, mini/metro grids, clean cooking solutions, and enabling technologies (such as e-mobility, energy storage and management solutions).
A global private equity firm ‘with a strong track record in impact investing’, has been selected to manage the joint investment and support the investments being strategically directed to create both social impact and financial returns, while engaging with governments, international organisations, financial institutions, the private sector, civil society, and philanthropies.
Murray Auchincloss, CEO of bp, said: ‘We hope we will be able to contribute to wider efforts to tackle the very real challenge of access to energy. Over time, we believe it can help to create a more inclusive energy future for some of the many millions of people who lack that access today.’
Viridien has completed the seismic imaging for the Selat Melaka multi-client 2D seismic program, covering the offshore area of the Langkasuka Basin, Malaysia. The available final seismic dataset clearly indicates the presence of a previously unseen Pre-Tertiary fold and thrust belt, extending offshore across the unexplored area, Viridien said.
‘The new high-resolution long-offset dataset provides extensive seismic coverage and significantly enhanced imaging over this promising area,’ said the company in a statement. Viridien’s subsurface imaging experts have applied the company’s latest high-end imaging
technologies, including full-waveform inversion and Q-tomography, for the first time in the Langkasuka Basin.
Dechun Lin, EVP, Earth Data, Viridien, said: ‘We are delighted to have completed our first multi-client project offshore Malaysia, that leverages over 40 years of experience processing seismic data from one of the country’s major basins. We are confident that this ultramodern data set will support the efforts of Petronas in promoting open acreages in Selat Melaka and spur exploration in this frontier area located near a number of proven large discoveries.’
Rafael Guerra1*, Haroon Bajwa1, Peter MacLeod1, Rigelesaiyin Ji1 and Bosung Lim2
Abstract
The applications of distributed acoustic sensing (DAS) in the energy sector are extensive and multi-disciplinary, including surface and borehole seismic. In the case of vertical seismic profiles (VSPs), DAS may replace geophones when 3-component data is not critical, thereby offering efficiency, safety and cost saving benefits. Nevertheless, one enduring challenge associated with these measurements during wireline logging operations in vertical wells is the assurance that the fibre optics cable is properly coupled to the borehole wall. This study documents the significant progress made in this most challenging data acquisition scenario. By monitoring the low-frequency DAS strain as the wireline cable is slackened or de-tensioned to buckle and improve its coupling, we can determine when it has returned to a steady state. Finite element analysis is used to determine the amount of de-tensioning required and the location of the cable buckling within the wellbore, thereby ensuring accurate depth corrections when de-tension is applied. A successful VSP survey recorded in a vertical well offshore UK demonstrates the effectiveness of the new procedures. A comparison between the DAS VSP and the sonic log and synthetic seismograms, showed that accurate DAS depth, time-depth velocities and reflectivity response of the formations drilled were obtained, thus validating the new methodology including DAS strain monitoring and numerical modelling.
Conventional wireline logging VSP surveys utilise geophone arrays and necessitate a dedicated logging run, which may take 12 hours or more to complete. On the other hand, Distributed Acoustic Sensing (DAS) data can be collected efficiently during any logging run thanks to the fibre-optic technology installed on a torque-balanced, high-performance cable. When the wireline logging toolstring is stationary at the bottom of the well for a few minutes, DAS seismic data can be recorded along the hybrid logging cable.
The objective of de-tensioning the wireline cable in vertical wells is to improve the coupling between the cable and the wellbore wall, by increasing the cable contact area. This is achieved by adding more cable length downhole. Nevertheless, the outcomes of previous studies have been inconclusive, exhibiting a combination of positive and negative results. In this study, following each de-tension test, the low-frequency DAS strain along the cable was monitored while the wireline toolstring was stationary at the bottom of the hole. This indicated that a period of approximately five minutes was required for the cable to reach a steady state, after which seismic data could be acquired. This represented a significant departure from our previous methodology, wherein the seismic source activation occurred immediately after each application of cable de-tensioning, with no waiting time, resulting in noisy DAS seismic
1 SLB | 2 Dana Petroleum
* Corresponding author, E-mail: jguerra5@slb.com DOI: 10.3997/1365-2397.fb2025001
records. Furthermore, we propose that finite-element-based nonlinear buckling analysis of the cable can predict the amount of de-tensioning required and provide more precise depth corrections in instances akin to this study, where considerable cable de-tension is applied, and wells possess varying internal diameters.
As demonstration and validation of the proposed methodology, we report on a case study offshore the UK, where the field operator selected a hybrid optical-electrical conveyance system with ultra-strength to ensure faster and safer operations in a challenging vertical exploration well. The DAS VSP data were acquired during the second wireline logging run, which integrated sonic, borehole imaging, and reservoir pressure tools, with 30 stacked shots fired from a rig source airgun array.
Hybrid optical-electrical logging heptacables have been field tested for DAS seismic applications since 2013 (Frignet and Hartog, 2014). These cables, which were originally developed for high-speed logging telemetry (Varkey et al., 2008), have seven electrical conductors for conventional wireline logging and two single-mode optical fibres for DAS measurements. The original cables had a reduced safe working load of 44-58 kN [10-13 klbf] to protect the optical fibres and were typically
used in less challenging wells (Guerra et al., 2020). More recently, an ultra-strength hybrid logging conveyance system has been developed, using fibre-optic technology mounted on a torque-balanced cable, with a safe working load of 80 kN [18 klbf] and a temperature rating of 191°C [375°F]. This system increases safety for high-tension operations, improves logging efficiency by reducing the number of runs with heavier, longer tool combinations (Guerra and MacLeod, 2024), and avoids drill-pipe conveyance and fishing.
The hybrid logging cables have made it possible to eliminate the dedicated geophone VSP descent on many projects, by recording DAS data along the optical fibres during any logging run, saving 10 or more hours of rig time, as in the case study reported later. The logging cable used for conveyance and telemetry becomes a continuous DAS sensor. A DAS laser unit interrogates the logging cable via an optical collector installed in the cable drum. Laser pulses are sent into each of the fibres at a high pulse frequency rate and the backscattered light is analysed to calculate the dynamic strain over a moving window along each fibre. The size of this window is called the gauge length (GL). Shorter values bring the distributed measurement closer to a point sensor, but at the expense of signal-to-noise ratio (SNR). Gauge lengths of 10-20 m are common in seismic surveys.
Two fibres can be simultaneously interrogated by the new quantitative phase-based DAS interrogator with different GL, with a dynamic range of 135 dB @10 Hz and 1.5 pico-strain per root-Hertz noise floor for a GL of 6.4 m, each at a pulse frequency rate of 10 kHz limited by the cable length. This means that sound waves with a frequency of 10 Hz and with a power spectral density (PSD) of 1.5 pico-strain per root-Hertz or greater can be detected. A low DAS noise floor is important for detecting small acoustic signals (e.g., weak reflectors, deep targets, microseismic events). The noise floor of a system is a critical specification of its performance as it determines that the smallest signal the system is capable of measuring (SEAFOM, 2024). The optical DAS measurements are independent of the electrical logging measurements. For each seismic shot, the DAS dynamic strain is recorded in SEGY format for further VSP data processing.
The measured depth of the end-of-fibre (EOF) at the toolstring rope socket is known from gamma-ray correlation. A line wiper device acting on the logging cable at the rig floor level allows verification of the DAS zero depth and is currently part of the standard DAS data acquisition procedure (Ryan Bidyk, 2024, personal communication), further reducing depth uncertainty. The low frequency DAS strain data is monitored during cable de-tension tests in vertical wells, to tell if the cable is creeping or in steady state. The simplest depth correction for cable de-tension is a linear distribution from the rope socket to the cable drum (Guerra et al., 2020), but this can lack accuracy for large de-tension amounts, deeper wells or in telescoping wells with varying internal diameters. Corrections based on nonlinear buckling finite element analysis of the cable de-tension are recommended, together with a comparison with the logs and synthetic seismograms, as shown in the next sections.
In this study, an implicit finite element analysis (FEA) model of cable and wellbore geometry with contact-friction interactions between cable and wellbore/casing has been created with Abaqus software (Abaqus, 2021). Due to the long cable length and the typical characteristic length of helical buckling, beam elements are used to study the cable deformation assuming that the cable is a homogeneous beam or rope. Schilke (2017) tackled a similar problem using FEA but used a simpler shear beam formulation that includes only the first-order translation term (no bending) and the second-order shear distortion term (no rotational inertia), unlike the second-order Timoshenko formulation used here, which includes all first- and second-order terms despite being computationally more expensive.
In subsea engineering, FEA has been used to analyse the dynamic response of cables in different sea states by modelling them as numerical beams subjected to hydrodynamic forces and platform motions (Thies et al., 2012). In addition, FEA has been widely used in civil engineering to assess the performance of suspension bridges, demonstrating its effectiveness and accuracy in simulating and predicting the behaviour of long cables under various loading conditions (Ren et al., 2004). These applications highlight the ability of FEA to accurately simulate and predict the dynamics of long cables in various scenarios.
The Timoshenko beam theory (Timoshenko, 1957) allows for transverse shear deformation, and it can be used for both thick and slender beams. For the application in this study the cable typically has a much greater tensile stiffness compared to the bending stiffness and it will behave like a slender beam. The 3D quadratic three-node Timoshenko beam elements (Abaqus, 2021) are chosen to simulate the cable buckling behaviour, and a coupled cross-section stiffness of beam is applied as per equation [1]: , (1)
where the N is the axial force, M1 and M2 are local bending moments along two directions, τ the torque, ε the axial strain, κ1 and κ2 the local beam curvatures along two directions, and χ is the torsion of the beam cross section, and where EA, EI and GJ are the tensile, bending and torsional stiffnesses of the cable respectively. The difference in our beam model is the inclusion of the coupling term K14 so that the unbalanced torque of the cable can be considered as well. For the cable used in this case study, K14 = 0.
To be able to simulate the cable helical buckling growth at the bottom of the wellbore and predict the de-tension and buckling length relation, a quasi-static implicit dynamic approach is implemented in FEA to simulate this buckling initiation and post-buckling process. In the FEA simulation, the cable is assumed to be stress-free and straight at initial state and gravity will be the only force acting on cable, which is fixed at the rope socket of the wireline toolstring sitting at the bottom of the well. Once the cable stabilises under gravity, the cable on top of
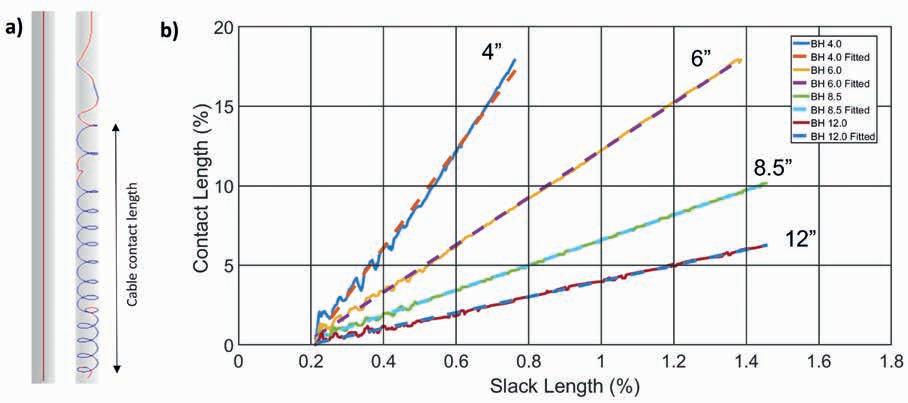
the well will be de-tensioned and trigger the helical buckling of cable at the bottom of the well to gain contact between well and cable as shown in the Figure 1a. The initiation of the helical buckling of the cable at the bottom of the wellbore is triggered entirely by the instability of the structure itself induced by gravity, without any additional assumptions about the cable properties and the applied load.
The contact-friction interactions, with coefficient of friction varying between 0.1-0.5, are considered by simulating the wellbore internal diameter (ID) as an analytical rigid wall. The cable properties such as bending stiffness, tensile stiffness and torsional stiffness are varied as well as wellbore ID, to perform the sensitivity study and a correlation between cable, these factors and final buckled cable length is investigated. FEA simulation results with different input parameters have been fitted to create a reduced order model (ROM) that can be used for a quick estimation of the buckling length. Both the FEA simulation results and the field measurements show that the cable contact length and the amount of de-tension have a linear relationship, as shown in Figure 1b. A ROM is created based on this last observation and a response surface of slope at different operational conditions has been created for de-tension estimation (to achieve a desired contact interval) and depth correction (once data have been acquired with cable de-tensioned). For boreholes with variable internal diameters, the relation between de-tension (slack) amount and contact interval becomes piecewise linear.
The FEA model is currently applicable to variable ID vertical wells and is being improved and calibrated with new field data. We plan to extend it to more general S-shaped wells. Preliminary field results indicate that the current formulation can be extended to S-shaped wells by adding a correction factor multiplier to the coefficient of friction used in vertical wells.
Figure 1b shows that it is more efficient to buckle the cable in narrower boreholes as the contact length achieved is much greater than in wider boreholes for the same amount of slacking. Larger holes require greater amounts of cable slack and if there is not enough friction on the borehole wall to hold the cable buckling, it may collapse to the bottom of the hole and can pose a hazard (see Figure 2).
In the next section we will look at a case study where these techniques were used.
In a vertical exploration well drilled offshore the UK with a maximum deviation less than 1°, the field operator selected a
Figure 1 (a) FEA model with cable before and after de-tension (blue colour means that contact has been established), the drawing is not to scale for illustration purposes; (b) The cable contact length and slack length (de-tension amount) exhibit a linear relation for different borehole IDs of 4 in, 6 in, 8.5 in and 12 in [(10.2, 15.2, 21.6, 30.5) cm]. Both plot axes have been normalised by the cable length.

Figure 2 FEA modelling results for cable de-tensioned in 16 inch [41 cm] ID borehole: (a) lower coefficient of friction (CoF = 0.1) with the cable collapsing at the bottom of the borehole; (b) higher CoF = 0.2 allows the cable buckling to hold.
hybrid optical-electrical conveyance system with ultra-strength to ensure faster and safer DAS zero-offset VSP operation. A new DAS interrogator and hybrid heptacable with a safe working load of 18 klbf [80 kN] were used (Figure 3). The VSP source was a 3x250 in3 G-gun cluster operating at 2000 psi [13.8 MPa] and 16.4 ft [5 m] depth. The DAS VSP was recorded during the first logging run (resistivity, density and neutron porosity). The de-tension amounts tested were (0, 30, 60) ft [(0, 9, 18) m], the latter providing good coupling over the bottom 1600 ft of the borehole. The final DAS data were acquired during the second logging run (reservoir pressure, borehole imaging and sonic). After gamma ray correlation, the tools were placed on the bottom of the well and cable de-tension tests were performed: (18, 30, 46, 61) m [(60, 100, 150, 200) ft]. The wireline cable contact interval, where there is good coupling, increases with de-tension amount (Figures 4 and 5): (655, 945, 1280, 1585) m [(2150, 3100, 4200, 5200) ft]. During each test, the strain was monitored using low-frequency DAS data and it was observed that it took five minutes for the cable to return to steady state (Figure 4). At this point, 20 to 30 shots were fired and stacked. This was an important lesson learned. Previously, shots were taken immediately after de-tension was applied, with the cable still creeping, resulting in poor data quality. Good DAS VSP data were obtained from near the bottom of the hole to well above the reported 9 5/8” casing top of cement, with shallower intervals showing cable and casing ringing. Figures 4 and 5 show the finite element analysis results with the estimated
piecewise linear depth corrections due to 61 m [200 ft] of cable de-tension applied and variable borehole internal diameter. The cable de-tension depth corrections are applied to the raw cable length depths to convert these to measured depths along the borehole. The correction is zero at the end of fibre, where the toolstring is stationary, and at the top of the contact region by friction is equal to the amount of de-tension length applied.
The new DAS interrogator allowed simultaneous recording of each optic fibre using different gauge lengths of 11.17 m [36.64 ft] and 20.74 m [68.04 ft]; the latter being used for real-time QC.
The data have a bandwidth of 5-80 Hz at the target, with clean first arrivals and coherent reflectors seen on the raw stacks. The smooth transit times and velocities computed from the DAS data using the method of Lizarralde and Swift (1999), with regularisation e = 0.3 and time picking error dt= 1 ms, overlay well the sonic log recorded in the same run over the target interval (Figure 6). The optimal regularisation parameter is a function of the spacing between DAS sensors and formation velocities. With this method, the original transit times are automatically corrected within their time picking accuracy of 1 ms to produce a smooth velocity profile. Data quality was monitored remotely to confirm


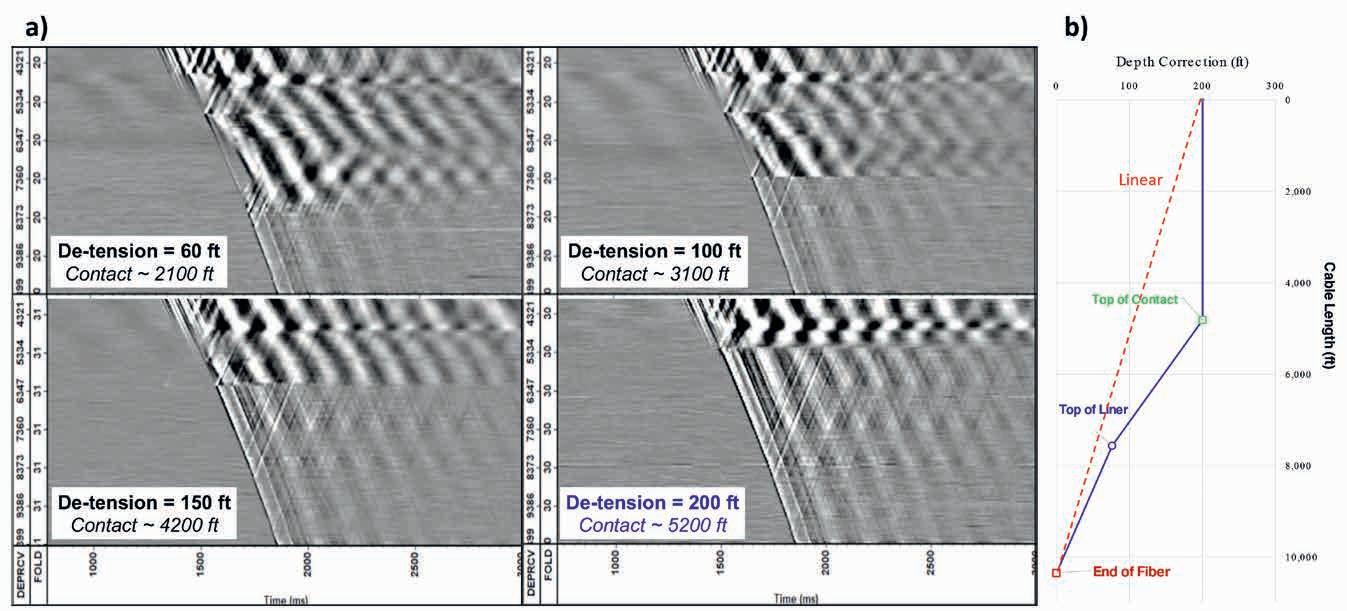

that the survey objectives were being met. The backup geophone run was cancelled, saving up to 10 hours of rig time and 30 tonnes of CO2 emissions (mainly from the rig’s diesel consumption of 25 cubic metres of diesel per day). Sound exposure to marine mammals has also been reduced due to a significant decrease in the number of shots being fired.
The DAS
a
in the
up to corridor stack, taking into account the polarity differences with geophones. The direct downgoing P-waves initial compression of fibre is recorded as negative strain numbers on SEGY files. Their upgoing reflections at acoustic impedance increases have their first motion compressing the fibre, being also recorded as negative strain numbers. The two-way well ties between log-derived synthetic seismograms and the DAS VSP corridor stack show a very good match over 5-80 Hz (Figure 7) and
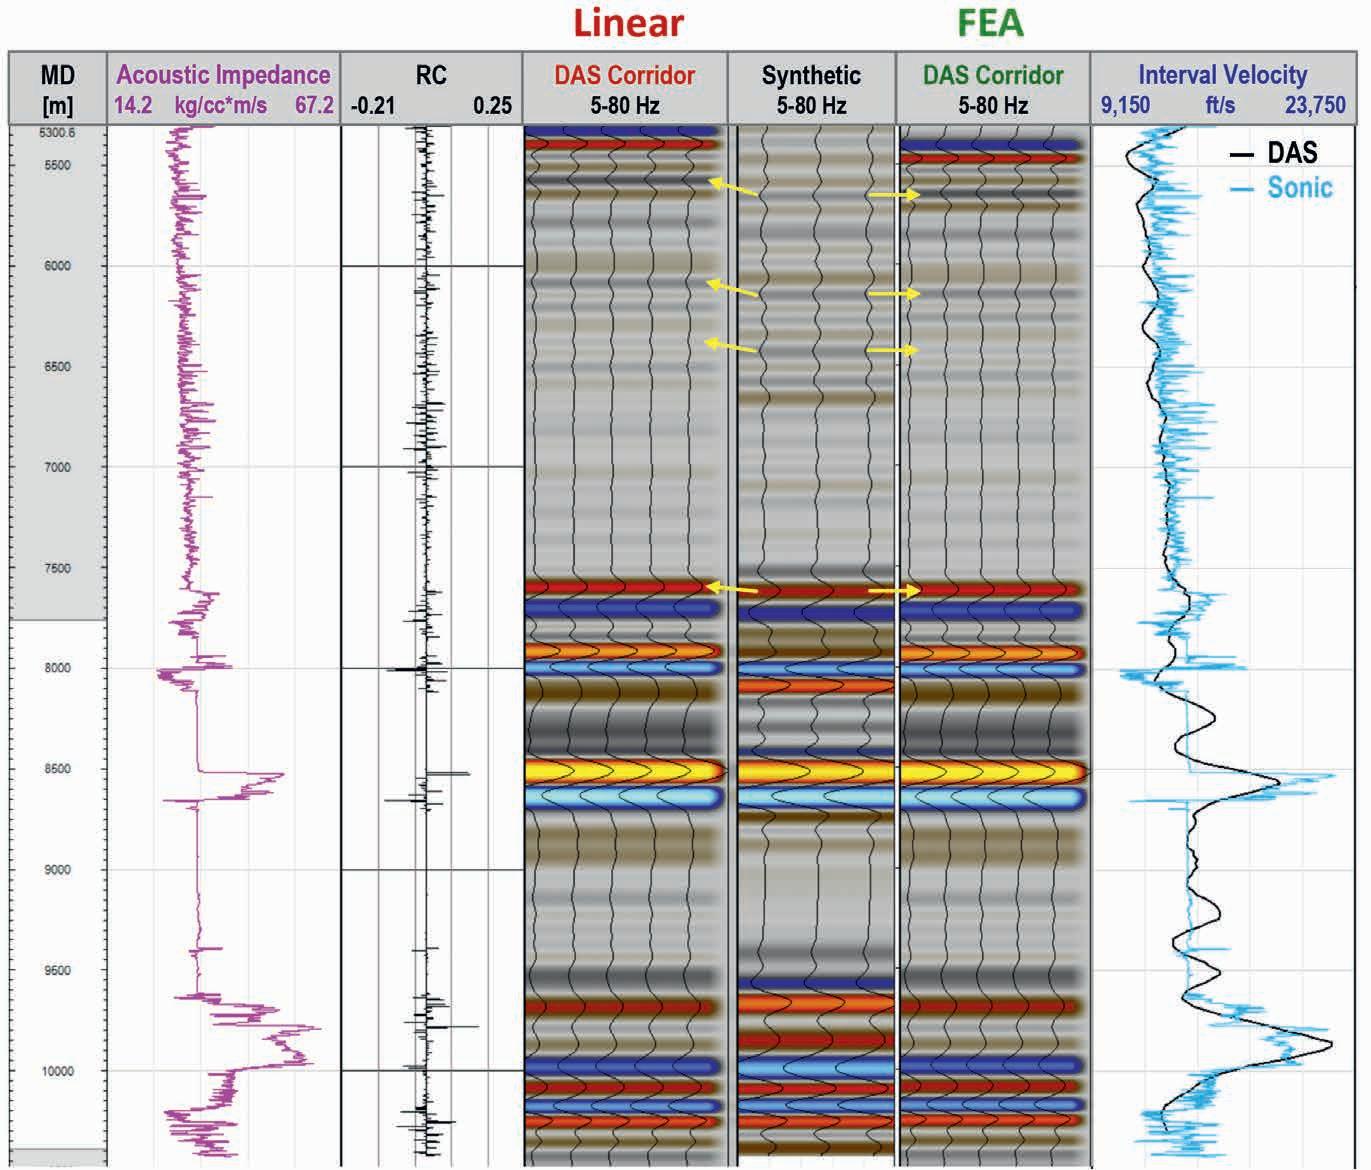
demonstrate that the FEA-based cable slack depth corrections applied to the DAS data are more accurate than the simple linear slack distribution from top to bottom (Guerra et al., 2020). During the synthetic match with the DAS corridor stack, depth mismatches on the order of 2 metres can be detected.
New methods of monitoring cable de-tension in vertical wells using low-frequency DAS strain data and of applying depth corrections due to cable de-tension based on finite element analysis have been proposed. The finite element analysis can be used to predict, with confidence, the amount of slack required to obtain good coupling and still retain accurate depth registration for the DAS sensors. These techniques were validated offshore the UK during a DAS VSP acquired in a vertical exploration well, where a new quantitative phase-based DAS interrogator was used, and an ultra-high strength hybrid logging cable was employed. Good cable coupling was achieved with 200 ft [61 m] of de-tension applied, and good data quality were
recorded over 5-80 Hz from the TD of the well up to the top of the cement, saving up to 10 hours of rig time compared to a conventional VSP using geophones. Since this study, several other DAS surveys have been successfully completed in vertical exploration wells using this methodology. We thus believe that by combining the latest technology with improved acquisition procedures, progress has been made in achieving reliable DAS VSP results in vertical wells. Operators should be able to use the service with greater confidence based on the lessons learned, with a reduced carbon footprint and rig time savings.
Dana Petroleum and its JV partners are gratefully acknowledged for permission to reproduce the data. Thanks also to the SLB wireline team: Keith Sanger, Duncan MacKay, Ryan Bidyk, Iuliana Grigorie and Hasan Gurcaglar, to former SLB geophysicist, Phil Christie, for his valuable technical advice, and to the First Break reviewers for all the comments they made to improve the article.

OptiSeis provides innovative, high-resolution seismic acquisition software and services for all types of subsurface exploration and production projects including energy, critical minerals, carbon sequestration, geothermal, wind, and nuclear. With lower environmental footprint and reduced GHG emissions as well as safe and efficient operations, OptiSeis is your collaborative solutions provider of choice.




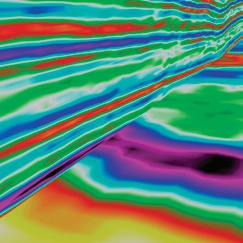


Mohamed Ahmed Abdelhay3*, Abdel Nasser Helal1, Abdel Aleem Elessawy 2 and Amir Lala1
Pore pressure is regarded as an important branch of earth science. In exploration phase, pore pressure can provide information about trap integrity. During the drilling stage, the pre-drill pore pressure prediction helps in the casing and mud design. A good pre-drill pore pressure prediction will protect the well from drilling problems such as kicks and blowouts. In the production phase, it helps in the injection process, predicting reservoir compartments.
Sapphire field is part of the offshore Nile delta which is classified as a high-pressure basin. As a result, pre-drill pore pressure prediction is an important step in the well planning process for predicting abnormal pressures along the well path and avoiding drilling problems.
The paper presents a new workflow approach for the 3D pore pressure cube for the Nile Delta basin depends on four wells to generate a cube with the full set of pressure data (overburden, effective vertical stress, and formation (pore) pressure), it is built using Eaton and Bowers equations. In addition, Eaton and Bowers were optimised to fit the Nile Delta basin, compared to the Gulf of Mexico, which used the default optimisation value. The uncertainty in the density estimation is reduced as well by using the density sonic relation.
Three cubes overburden, vertical effective stress, and pore pressure prediction are the main outputs of the research.
These three cubes almost match the actual pressure that was calculated using logging while drilling tools on the rigsite at the wells.
Introduction
Knowledge of pore pressure is of critical importance in earth science. During the exploration phase, it provides insights into trap integrity. In the drilling stage, accurate pre-drill pore pressure predictions are essential for proper casing and mud design. A reliable prediction helps prevent drilling issues such as kicks and blowouts. In the production phase, pore pressure data assists with injection processes and predicting reservoir compartments.
The Sapphire field, located in the offshore Nile Delta, is classified as a high-pressure basin. Therefore, pre-drill pore pressure prediction is an important step in well planning to anticipate abnormal pressures along the well path and mitigate potential drilling challenges.
This paper presents a new workflow for generating a 3D pore pressure cube for the Nile Delta basin, based on data from four wells. The cube includes a comprehensive set of pressure data, including overburden pressure, effective vertical stress, and formation pressure, and is constructed using Eaton and Bowers equations. These equations were optimised for the Nile Delta basin, in contrast to the Gulf of Mexico, which uses default optimisation values. Additionally, uncertainty in density estimation was reduced with the use of the density-sonic relationship.
The three main outputs of the study – overburden pressure, vertical effective stress, and pore pressure prediction cubes –
closely align with the actual pressures measured using logging while drilling (LWD) tools at the wells.
Sedimentation is the process of depositing unconsolidated grains in a basin. In the initial stages, the newly formed layer is loosely packed, characterised by high porosity, permeability, and water content. Over time, as newer layers accumulate, older formations become buried, and with increasing depth, both porosity and permeability decrease, trapping fluids within the formation. These fluids can include gases such as nitrogen, sulphur, hydrogen sulphide, and methane, as well as liquids like oil and water. Formation pressure refers to the pressure exerted in the pore spaces at greater depths (Rabia, 1985). Pore pressure specifically describes the pressure within the pore spaces of a formation. As noted by Zhang (2011), it is also influenced by the concentration of dissolved materials, such as salts, in the fluid (Storvoll et al., 2005).
Formation pressure is classified as either normal or abnormal. Normal pressure, also called hydrostatic pressure, is the pressure exerted by the weight of a water column from a certain depth to the surface. Abnormal pressure is the deviation from this normal pressure (R.E. Chapman, 1983). Overpressure occurs when formation pressure exceeds normal pressure, while subnormal pressure refers to formation pressure lower than normal. Several factors contribute to abnormal pore pressure, including under-compaction, fluid volume expansion, fluid migration,
1 Ain Shams University | 2 SLB | 3 Rashid Petroleum Company (Rashpetco)
* Corresponding author, E-mail: Mohamed.Abdelhai@Rashpetco.com, mohamed.abdelhai.saleh@gmail.com DOI: 10.3997/1365-2397.fb2025002
buoyancy, and tectonic forces (Swarbrick et al., 1999). Additional factors that influence abnormal formation pressure include tectonic activity, rapid sediment deposition, reservoir structure, clay diagenesis, shallow reservoir repressurisation, paleo pressure, salt domes, and density differences (Rubey, 1927; Rieke and Chilingarian, 1974; Fertl, 1976).
In recent years, numerous researchers have applied various methods to improve the accuracy of pore pressure prediction and estimation. Some studies use empirical equations to explore the relationship between pore pressure and interval velocity, while others introduce new techniques to develop predictive empirical models. The earliest study on pore pressure prediction was conducted by Terzaghi (1943), who aimed to investigate the effect of rock compaction on overburden pressure. His study concluded that the overburden pressure is equivalent to the pore pressure exerted by vertical stresses.
Equation 1 is commonly used to calculate overburden, while equation 2 is applied when effective stress is known to determine pore pressure.
velocities. In a subsequent study, Ugwu (2015b) applied Eaton’s and Bowers’ methods in the onshore Niger Delta using pre-stack depth migration (PSDM) velocities. Similarly, El-Werr (2017) explored how seismic interval velocity can be employed to calculate pre-drill pore pressure.
Abnormal pressure is typically identified by detecting deviations from normal compaction trends. After reviewing several studies that use empirical models for pore pressure prediction, it became clear that these empirical equations were often valid only for the specific fields from which the data was sourced (Abad et al., 2021; Naveshki et al., 2021).
Pore pressure prediction has traditionally relied on basin modelling or velocity data obtained from seismic data processing (Helset et al., 2010), with the parameters of the prediction equations needing optimisation to match the specific data under investigation. The primary objective of this paper is to develop a 3D pore pressure cube using a new workflow and to optimise the Eaton and Bowers constants for the study area located in the offshore Nile Delta.
where S over is the overburden stress, d is the density, g the acceleration due to gravity and h is the depth.
where Seff represents the effective stress and PP denotes pore pressure.
Biot and Willis (1957) proposed an empirical relationship between overburden pressure, effective stress, and pore pressure, as shown in equation 3, employing a Biot coefficient (β) that represents changes in pore fluid volume to total rock volume. Fluid can easily flow through the pores in the rock when the Biot coefficient is equal to one.
The Nile Delta region is Egypt’s most significant gas province, with an estimated 58 TCF of gas reserves (Talaat et al., 2010). The sedimentary sequence in the Nile Delta spans from the Holocene to the Mesozoic era (Figure 1). The structural framework of this area is shaped by the interaction of three major fault trends: the Temsah fault trend, oriented NW-SE; the Rosetta fault trend, oriented NE-SW; and the E-W faults, which outline the Messinian salt basin (Abdel Al, 1994; Agyriadis, 1980; Neeve, 1975).
Hottmann and Johnson (1965) predicted pore pressure using the properties of shales and the deviation in sonic velocity. Eaton (1965), Bowers (1995) and Yoshida et al. (1996) proposed empirical equations to predict pore pressure using shear wave velocity, resistivity, and compressional velocity.
Swarbrick (2002) examined the methodologies and assumptions involved in predicting pore pressure using seismic and wireline data, addressing the challenges present in certain environments. The study introduced ideas for utilising drilling measurements to predict pore pressure ahead of the drill bit by analysing seismic velocities. Chopra and Huffman (2006) briefly discussed the causes and mechanisms of overpressure and reviewed various velocity model-building methods, highlighting the strengths and limitations of each approach.
Ugwu (2015a) expanded on these factors, demonstrating how they can be optimised to improve pore pressure predictions using seismically derived velocities. Key considerations include the leakage of overpressure information, the accuracy of local parameter determination, and the quality of seismic data and

Our study focuses on the Sapphire field, one of the producing fields within the West Delta Deep Marine (WDDM) concession. The stratigraphy of this field is from the Lower Pliocene, characterised by multiple turbidite deposits located along the slope of the shelf. Structurally, the area is influenced by two major deep-seated faults: the Nile Delta Offshore Anticline (NDOA) fault, located centrally in the WDDM, and the Rosetta fault, extending to the southeast corner of the concession.
As previously mentioned, pre-drill pore pressure prediction is a critical step in the drilling, production, and exploration phases. The velocities obtained from processed seismic reflection data are essential for accurate pore pressure prediction. Consequently, the precision of these estimates depends heavily on the accuracy of the interval velocities derived from the seismic data. While there are various seismic velocity analysis methods, for well-planning purposes, velocities should be obtained using techniques that offer sufficient spatial resolution (El-Werr, 2017; Sayers, 2002).
Before discussing the theoretical background, we define a few key terms. Pressure measurements are categorised into two types: absolute pressure and pressure gradients. Absolute pressure is measured in units such as psi, bar, atm, Pa, MPa, GPa, or N/m², while pressure gradients are measured in units like psi/ft, ppg, bar/km, bar/m, or kpa/m in our study we use the psi.
Hydrostatic pressure refers to the pressure exerted by a column of water and is related to the fluid’s connection to the surface.
Lithostatic or overburden pressure is caused by the weight of overlying sediments, including pore fluids. The pressure exerted on the rock frame due to overburden stress results in effective stress, which is the average normal stress on grain surfaces.
Effective stress is the difference between overburden pressure and pore pressure.
Formation pressure or pore pressure is the pressure exerted by fluids in the pore space, which differs from hydrostatic pressure as it does not extend to the surface (Bagus et al., 2016).
interval velocity at the location of the available wells. That relationship is then used to transform the seismic interval velocity field into a density cube.
The equations given by Eaton (1975) and Bowers (1995) are used to predict pore pressure based on interval velocity. Assuming that the pore pressure is in a hydrostatic state, we can calculate the normal effective stress using equation 2, which then acts as an input in Bowers’ equation to calculate the normal velocity as shown in the following equation.
where is the compressional velocity at the mudline (usually 1524 m/s), A and B are from the parameters calibrated with offset velocity versus effective stress data (A=10 and B= 0.57) and is the effective vertical stress at the normal compaction conditions.
It is also possible to estimate the vertical component of effective stress from seismic velocities using Eaton’s equation, which is as follows:
where is the vertical-effective stress, is the vertical stress under normal compaction conditions, Vobs is the seismic in situ velocity, V n is the seismic velocity that would occur if the sediment was normally pressured, and n is an exponent which describes the sensitivity of velocity to effective stress. The value of n is normally set to 3 in the Gulf of Mexico (Equation Reference). However, the values of n in the study area range from 1.5 to 3.8.
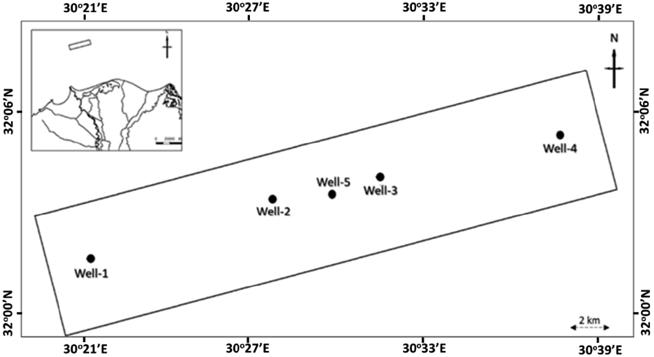
As stated earlier, equation 2 represents the Terzaghi relationship between overburden stress, effective stress, and pore pressure. Typically, the density log is used to calculate overburden stress, but many times the actual density log measurement is only recorded at the reservoir interval. To alleviate this problem, we establish a correlation between the density and the seismic Figure 2 Location of study area with the distribution of the available wells.

Figure 3 An inline section showing the model zonation. The stratigraphic zones in the broad zone of interest are sub-divided into five zones (Figure a), and each zone is further divided into fine layers (Figure b). This division is done to simplify the process of resampling the interval velocity.


Finally, after calculating the overburden stress (equation 1) and the vertical effective stress (equation 5), we can calculate the pore pressure using the Terzaghi relation (equation 2).
The workflow begins with data collection and preparation of input well data, followed by the initial stages of the pore pressure prediction process. This includes density prediction, overburden pressure calculation, optimisation of constants for Eaton and Bowers equations, and 3D model construction.
Available data is collated for input into the workflow. The dataset consists of five wells, four of which serve as model inputs, while the fifth functions as a blind well to test model accuracy. Notably, the blind well lacks wireline logs but includes pore pressure data. Wireline logs available for the other wells include density and sonic logs, as well as pressure logs like overburden stress, effective vertical stress, and pore pressure.
The first step in the process involves extracting interval velocity at the well locations from an interval velocity field gen-
erated by seismic data processing (Figure 2 shows the distribution of wells across the study area).
The second step focuses on model preparation to streamline the workflow. This involves creating a simple grid model, divided into five intervals based on velocity trends and geological age, from seabed to the top of the Messinian. Each interval is further subdivided into layers (Figure 3). Subsequently, velocity values are resampled into these model layers and cells (Figure 4).
The third step involves establishing the pore pressure workflow. This begins with predicting density in the shallow sections to support overburden prediction. To achieve this, a cross plot is created between density logs and seismic interval velocity values extracted at well locations. The observed linear relationship allows density predictions at other locations.
The relationship between density and seismic interval velocity, shown in Figure 5, is described by the equation:
where Y represents predicted density, and X represents seismic interval velocity. This equation enables density prediction across the seismic interval velocity volume.
Figure 6 shows an inline section from the density volume, where we observe consistent density patterns that align with expected geological formations, providing a reliable framework for overburden calculation.
To validate these predictions, density values along the wells are exported, and the predicted density curves are overlaid with

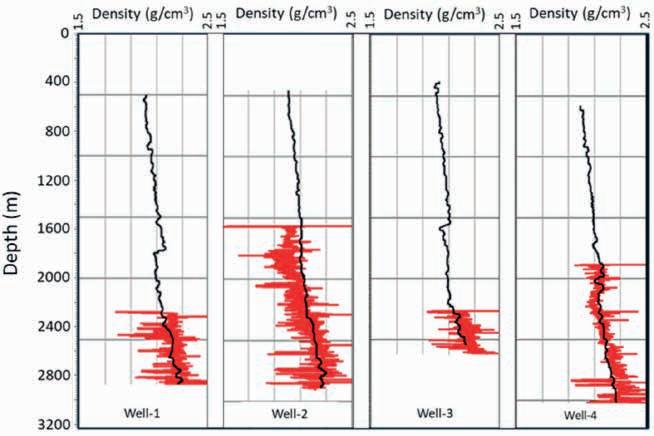
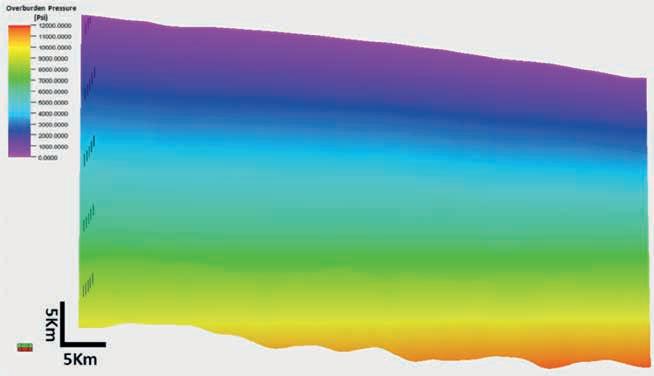
8 A crossline section extracted from the predicted overburden pressure volume shows the overburden pressure variation horizontally and vertically.
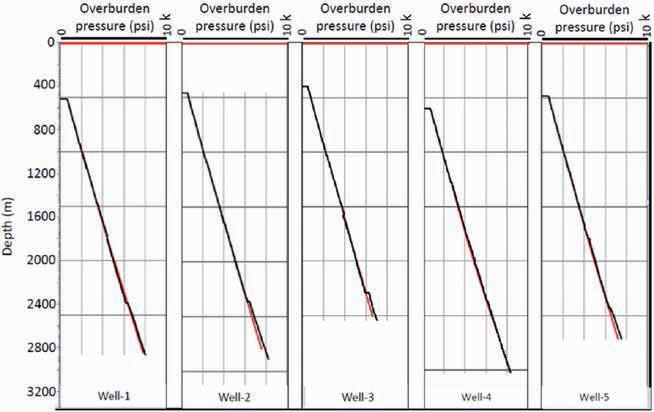
Figure 9 Comparison between the predicted overburden pressure curves (in black) and the actual or measured overburden pressure curves (in red). The prediction is carried out over an interval extending from Pleistocene to Lower Pliocene. The prediction is fully matched with the actual overburden pressure from the wells. Well-5 is used as a blind well to check the prediction accuracy, and it also shows a good match.
actual well density curves, as shown in Figure 7. This comparison demonstrates that the predicted density values closely match the actual measurements, confirming the accuracy of the predictive model and reinforcing its utility for pore pressure prediction in unlogged regions.
After predicting the density volume, the next step is to calculate the overburden pressure, a key parameter used in the Terzaghi equation (Equation 2). Figure 8 presents an inline view of the predicted overburden pressure, corresponding to the display in Figure 7. Figure 9 compares the predicted overburden pressure curves with the actual well data.
The predicted overburden pressure for the four input wells closely aligns with the overburden pressure values recorded at the rig site, following similar trends and values. To further validate the model, results from blind well 5 are also displayed. Here, the predicted overburden pressure values match those recorded at the rig site, reinforcing the model’s predictive accuracy. Figure 10 illustrates the error between the predicted and actual overburden stress values, highlighting the model’s reliability across different well locations.
Equations 4 and 5 are used to calculate vertical effective stress, the second term in Terzaghi’s equation. For Bower’s equation (equation 4), the constant parameters A=10 and B=0.57 are based on values traditionally used in the Gulf of Mexico, which, after analysis, were deemed applicable to this
study area due to similar geological conditions and overburden characteristics.
The optimised X values for Eaton’s equation (equation 5) range from 1.5 to 3.8, based on input well data. This optimisation was achieved by adjusting the constant parameter for each input well and stratigraphic level using a prediction Excel sheet, allowing for tailored predictions across varying geological intervals. Figure 11 shows an inline display from the predicted vertical effective stress volume, comparable to Figures 6 and 8. A comparison of predicted versus actual vertical effective stress values from the rig site is presented in Figure 12, corresponding to Figures 7 and 9.
In Figure 12, the predicted vertical effective stress trends align closely with the actual values from the rig site across the four input wells. Testing the model with blind well 5 also yielded predictions consistent with measurements from logging-while-drilling logs at the rig site, further validating the model’s robustness.
Pore pressure prediction is the primary goal and key outcome of this study. With both overburden pressure and vertical effective stress now calculated, the Terzaghi equation allows for straightforward pore pressure computation. Figure 13 displays an inline section from the pore pressure prediction volume, comparable to Figures 6, 8, and 11, while Figure 14 shows a comparison between the predicted and actual pore pressure data from the rig site (like Figures 7, 9, and 12).

10 The error percentage for the overburden stress determined at the five wells. The figure shows that the maximum error percentage is between + 5 % and5 % and the error at blind well is between +2 % and -2 %.
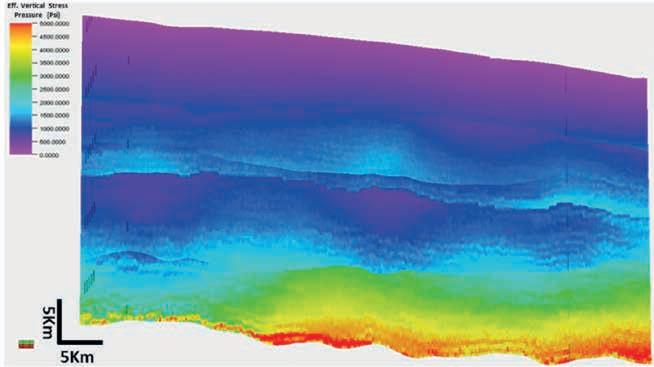
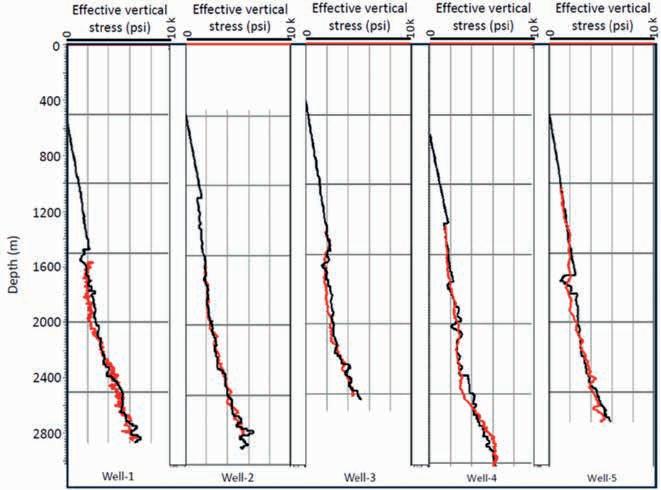
Figure 12 Comparison between predicted vertical effective stress curves (in black) and the actual or measured vertical effective stress curves (in red). The prediction is carried out over an interval extending from Pleistocene to lower Pliocene. The prediction is fully matched with the actual vertical effective stress from the wells. Well-5 is used as a blind well to check the prediction accuracy, and it also shows a good match.

13
In Figure 14, the predicted pore pressure for the four input wells closely aligns with the actual values recorded at the rig site. To further evaluate model accuracy, blind well-5 was also assessed, and predicted values were consistent with rig site measurements. Figure 15 provides an additional error analysis, showing discrepancies between the predicted and actual pore pressure, underscoring the model’s accuracy and reliability across various well locations.
This paper focuses on the prediction process for generating a 3D pore pressure volume, designed to support future drilling efforts without requiring a separate workflow for each new well. This predictive model can aid in identifying pressure behaviour across geological ages and in locating overpressure zones. The model is built using data from four wells, which serve as inputs to optimise constants in the Eaton and Bowers equations, while a fifth blind well, excluded from the model-building process, is used to verify accuracy.
A primary source of uncertainty in this workflow is the quality of the seismic velocity field, as the predicted pore pressure relies on interval velocity data from the processing centre. Since each step in the workflow builds upon the preceding one, errors
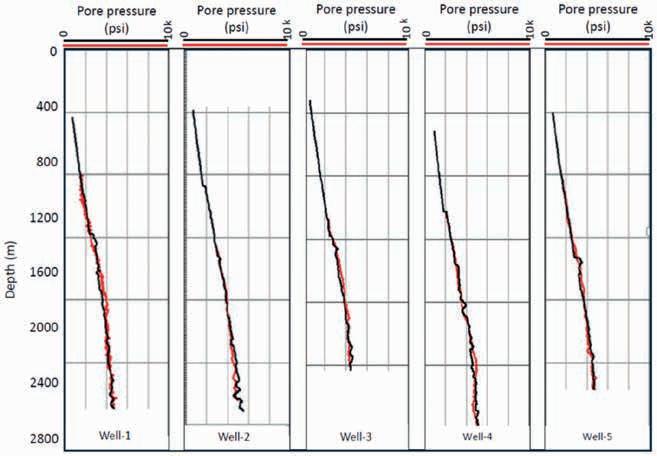
Figure 14 Comparison between predicted pore pressure (in black) and the actual or measured pore pressure curves (in red). The prediction is carried out over an interval extending from Pleistocene to Lower Pliocene. The prediction is fully matched with the actual pore pressure from the wells. Well-5 is used as a blind well to check the prediction accuracy, and it also give very good match.

15 The error percentage for the pore pressure determined at the five wells. The figure shows the most of error percentage is between + 5 % and - 5 % and the error at blind well is between +4 % and -4 %.
introduced early in the process can compound, affecting final accuracy. Additional limitations include the number of wells and the availability of comprehensive data at each well, which can impact the model’s reliability.
Abad, A.R.B., Mousavi, S., Mohamadian, N., Wood, D.A., Ghorbani, H., Davoodi, S., Alvar, M. A., and Shahbazi, K., [2021]. Hybrid machine learning algorithms to predict condensate viscosity in the near wellbore regions of gas condensate reservoirs. J. Nat. Gas Sci. Eng., 95(1), 104210. https://doi.org/ 10.1016/j.jngse.2021.104210
Abdel Al, A., Price, R.J., Vaital, J.D. and Shrallow, J.A. [1994]. Tectonic evolution of the Nile Delta, its impact on sedimentation and hydrocarbon potential. EGPC, 12th Petrol. Expl. Prod. Conf., Cairo, 1, 19-34.
Argyriadis I., Marcoux J., Ricou L., De Graciansky, Pc. [1980]. The opening of the Mesozoic Tethys between Eurasia and Arabia-Africa: Congres Geolgique International. 26/1980/Paris; Fra; Orleans: B.R.G.M.; DA., 3; 1380. (http://pascalfrancis.inist.fr/ vibad/index.php?action=getRecordDetail&idt=PASCALGEODEBRGM8020432834).
Bagus E.B.N., Susilowati, Listyobudi, M., Triyoso, K., Hariman, Y., Kurniadi, R., Hadi, R. A., Widowati, S. [2016]. Role of rock physics and poro-elastic rock-mechanics parameters for accurate pore pressure prediction. Presented at the 41st Indonesian Geophysicists (HAGI) Annual Meeting, in Bandar Lampung, Indonesia.
Biot, M.A. and Willis, D.G., [1957]. The elastic coefficients of the theory of consolidation. J. Appl. Mech., 24(4), 594-601. https://doi. org/10.1115/1.4011606
Bowers, G. L. [1995]. Pore pressure estimation from velocity data: Accounting for overpressure mechanisms besides under compaction. SPE Drilling & Completion, 10, 89-95.
Chapman, R.E. [1983]. Developments in Petroleum Science. Elsevier, 16, 303-323.
Chopra S. and Huffman A. [2006]. Velocity determination for pore pressure prediction. CSEG Recorder, 31(4), 28-46.
Dolson, J.V., Boucher, P.J., Siok, J., and Heppard, P.D. [2005]. Key challenges to realizing full potential in an emerging gas giant province: Nile Delta/Mediterranean offshore, deepwater, Egypt. Geological Society, London, Petroleum Geology Conference series, 6, 607-624. https://doi.org/10.1144/0060607
Duffaut, K. [2011]. Stress sensitivity of elastic wave velocities in granular media. Ph.D. thesis, NTNU. Accessible at Final_version_PhD_Kenneth_Duffaut_140111.pdf (ntnu.no)
Eaton, B.A. [1975]. The equation for geopressure prediction from well logs. Proceedings of the Fall Meeting of the Society of Petroleum Engineers of AIME, paper 5544.
EGPC (Egyptian General Petroleum Corporation). [1994]. Nile Delta and North Sinai: a field, discoveries and hydrocarbon potentials (A comprehensive overview).
El-Werr A., Shebl A., El-Rawy A., Al-Gundor N. [2017]. Pre-drill pore pressure prediction using seismic velocities for prospect areas at Beni Suef Oil Field, Western Desert, Egypt. J. Pet. Exp. and Prod. Tech., 7, 1011–1021.
Fertl, W.H. [1976]. Abnormal formation pressures. Elsevier, p 424.
Gardner, G.H.F., Gardner, L.W., and Gregory, A.R. [1974]. Formation velocity and density – the diagnostic basis for stratigraphic traps. Geophysics, 39(6), 770–780. https://doi.org/10.1190/1.1440465
Helset, H.M., Lüthje, M, Ojala, I., Lothe, A., Jordan, M., Berg, K. and Nilssen, I.R. [2010]. Improved pore pressure prediction from seismic data. 72nd EAGE Annual International Conference and Exhibition, Extended Abstract, F041, 1-5. https://doi.org/10.3997/22144609.201400791
Hottmann, C.E. and Johnson, R.K. [1965]. Estimation of formation pressures from log -derived shale properties. J. Pet. Technol., 17(6), 717–722. https://doi.org/10.2118/1110-PA
Li, W.J., Zhang, L.B., Liang, W. [2017]. An accident causation analysis and taxonomy (ACAT) model of complex industrial system from both system safety and control theory perspectives. Safety Science, 92(100), 94-103. https://doi.org/10.1016/J.SSCI.2016.10.001
Naveshki M., Naghiei A., Soltani Tehrani P., Ahmadi Alvar M., Ghorbani H., Mohamadian N., Moghadasi, J. [2021]. Prediction of bubble
point pressure using new hybrid computational intelligence models. J. Chem. Pet. Eng., 55(2), 203-222. https://doi.org/10.22059/ jchpe.2021.314719.1341
Neeve, D. [1975]. Tectonic evolution of the Middle East and the Levantine basin (easternmost Mediterranean): Geology, 3(12), 683-686. https://doi.org/10.1130/0091-7613(1975)3<683:TEOTME>2.0.CO;2
Rabia, H. [1985]. Specific energy as a criterion for bit selection. SPE J Pet Techn, 37(7), 1225-1229.
Rieke, H.H. III, Chilingarian, G. V. [1974]. Compaction of argillaceous sediments. Elsevier, p 423. https://doi.org/10.1016/00167142(75)90010-1
Rio, D., Sprovieri, R., and Thunell, R. [1991]. Pliocene-lower Pleistocene chronostratigraphy: a re-evaluation of Mediterranean type sections. Geol. Soc. Am. Bull., 103, 1049-1058.
Rubey, W.W. [1927]. Effect of gravitational compaction on the structure of sedimentary rocks: A discussion. AAPG Bulletin, 11(6), 621-632. https://doi.org/10.1306/3D932795-16B1-11D7-8645000102C1865D
Sayers C. M., Johnson, G. M., and Denyer, G. [2002]. Predrill pore-pressure prediction using seismic data. Geophysics, 67(4), 1286-1292. https://doi.org/10.1190/1.1500391
Storvoll, V., Bjørlykke, K. and Mondol, N. H. [2005]. Velocity-depth trends in Mesozoic and Cenozoic sediments from the Norwegian Shelf. AAPG Bulletin, 89(3), 359-381. https://doi.org/10.1306/10150404033
Swarbick, R. E., Huffman, A. R., Bowers, G. L. [1999]. Pressure regimes in sedimentary basins and their prediction. The Leading Edge, 18(4), 511-513. https://doi.org/10.1190/1.1438327
Swarbrick, R. E. [2002]. Challenges of Porosity-Based Pore Pressure Prediction. CSEG Recorder, 27(7), 75-78.
Talaat, A., Nini, C., Checchi, F. and El Blasy, A. [2010]. Depositional evolution of the Plio-Pleistocene succession as a key for unraveling the exploration potential of the post-Messinian play in the Central Nile Delta. Proceedings of Mediterranean Offshore Conference & Exhibition, Alexandria, Egypt
Terzaghi, K., [1943]. Theoretical Soil Mechanics. John Wiley & Sons, New York.
Ugwu G. Z. [2015a]. An overview of pore pressure prediction using seismically–derived velocities. Journal of Geology and Mining Research, 7(4), 31-40. https://doi.org/10.5897/JGMR15.0218
Ugwu G. Z. [2015b]. Pore pressure prediction using seismic data: Insight from Onshore Niger Delta, Nigeria. Journal of Geology and Mining Research, 7(8), 74-80. https://doi.org/10.5897/JGMR2015.0226
Vapnik, V. [2013]. The Nature of Statistical Learning Theory. Springer. Yoshida, C., Ikeda, S., and Eaton, B. A. [1996]. An investigative study of recent technologies used for prediction, detection, and evaluation of abnormal formation pressure and fracture pressure in North and South America. Proceedings of the SPE/IADC Asia Pacific Drilling Technology, paper SPE-36381-MS. https://doi.org/10.2118/36381MS
Zhang, J. [2011]. Pore pressure prediction from well logs: Methods, modifications, and new approaches. Earth-Science Reviews, 108(1-2),50-63. https://doi.org/10.1016/j.earscirev.2011.06.001.

Land seismic solutions are improving to facilitate ever more channels, more hardwearing and smaller nodes along with more cableless systems to ensure effective acquisition in all terrains, in challenging weather and with little downtime.
Andrew Clark et al discuss various deployment methods using modern nodes in TZ environment with examples from recent successful 3D surveys.
Tim Dean et al demonstrate that high-resolution mini-3D seismic surveys can be used as an alternative to drilling to quickly and can easily identify structural issues in high-priority areas and pinpoint the strike of faults identified from 2D surveys.
Terence Krishnasamy et al present an effective model-building workflow that incorporates FWI for both diving waves and reflections, utilising different cost functions.
Amine Ourabahl explores challenges in-field land seismic processing is facing and examines how modern acquisition systems and data processing techniques can potentially enable real-time imaging directly at the point of data acquisition.
Spencer L. Rowse et al dscuss the interaction between the vibrator mechanism and the surrounding media, the forces and energies generated during a sweep, re-examine the assumptions made in the ground force models and show that current source source signature estimates are not an accurate representation of the propagating wavelet.
Christof Stork proposes new approaches to address noise in acquisition and processing and highlights unique characteristics of this noise.
Bill Goodway et al present a case study of AVO and Inversion as a tool to assess the impact of sparse cost-efficient environmentally responsible land 3D survey designs on AVO amplitude fidelity.
First Break Special Topics are covered by a mix of original articles dealing with case studies and the latest technology. Contributions to a Special Topic in First Break can be sent directly to the editorial office (firstbreak@eage.org). Submissions will be considered for publication by the editor.
It is also possible to submit a Technical Article to First Break. Technical Articles are subject to a peer review process and should be submitted via EAGE’s ScholarOne website: http://mc.manuscriptcentral.com/fb
You can find the First Break author guidelines online at www.firstbreak.org/guidelines.
January Land Seismic
February Digitalisation / Machine Learning
March Reservoir Monitoring
April Underground Storage and Passive Seismic
May Global Exploration
June Navigating Change: Geosciences Shaping a Sustainable Transition
July Modelling / Interpretation
August Near Surface Geo & Mining
September Reservoir Engineering & Geoscience
October Energy Transition
November Marine Acquisition
December Data Management & Processing
More Special Topics may be added during the course of the year.
Andrew
Clark1*, Jerzy Trela2 , Piotr Pote¸pa2, Sławomir Ziółkowski2 and Dennis Pavel1 discuss various deployment methods using modern nodes in TZ environment with examples from recent successful 3D surveys.
Abstract
Single-sensor seismic nodes enable cost-effective seismic data acquisition at the high spatial receiver density demanded to meet current seismic data imaging quality requirements. Largescale seismic onshore surveys very often include transition zone (TZ) areas of varying size and water depth. These areas include tidal zones, river estuaries, marshes, swamplands, and beaches, etc. This is particularly the case as the O&G industry looks to secure the efficiencies of infrastructure-led exploration (ILX) to develop new finds close to existing infrastructure which is often in coastal areas.
A primary challenge for onshore nodes is their dependence on GPS timing signals, which cannot be received when a node is submerged. On the other hand, Ocean Bottom Nodes which do not rely on GPS for timing synchronisation are not practical and too costly for deployment in TZ environments. The use of deployment methods for modern nodes similar to those used for the first generation of cable-free recording systems enables seamless data acquisition from land to shallow water. Thus, avoiding both unnecessary omissions in onshore surveys due to inland water bodies and bridging the gap from the onshore to marine data acquisition. The authors discuss various deployment methods, with examples from recent successful 3D surveys.
Introduction
One of the greatest challenges in seismic data acquisition is in the transition zone and shallow water environment, from
dry land through tidal areas to 40-50m water depths. This is the gap area between normal dry land data acquisition and where streamer or Ocean Bottom Node (OBN) vessels can operate. For this reason, the transition zone is one of the least seismically explored areas.
Additionally, this issue arises not only in coastal areas but also inland, where large bodies of water or extensive marshy and swampy areas fall within the required data acquisition perimeter. Furthermore, deeper, landlocked water bodies without access for marine data acquisition vessels also pose challenges for seismic data acquisition operations.
The traditional solution to acquiring data in these areas has been a range of specialized TZ cable systems utilising heavy-duty cables and electronic enclosures capable of submersion in water up to 50 m or more. While these systems could be manually deployed from small to medium-sized vessels, they tended to be expensive, complex to operate, and ultimately not cost-effective. Among the various drawbacks of utilising underwater cables, power supply was a significant challenge. High power consumption required frequent battery replacements, which was time-consuming and required mobilising a large amount of equipment.
The nature of TZ cable deployment also made these operations logistically complex. Any failures, such as cable cuts or other transmission issues, led to prolonged downtime. Similar challenges applied to equipment recovery after data acquisition completion, and in many cases it was not possible to fully retrieve the equipment.

1 Inova Geophysical | 2 Geofizyka Torun’ SA
* Corresponding author, E-mail: andrew.clark@inovageo.com DOI: 10.3997/1365-2397.fb2025003
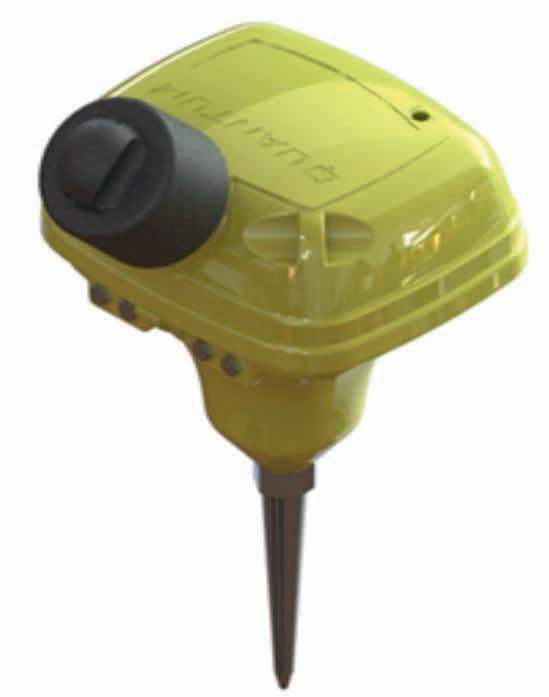
The introduction of the first cable-free recording system in the 1980s provided an alternative to the traditional cable systems. These first-generation cable-free systems relied on timing synchronisation via radio signals received from a central recorder and therefore their receiver could not be submerged. The solution was a range of buoy deployment techniques where the recording unit remained at the surface and the sensor, a marsh cased geophone or hydrophone, was deployed in the water. Ironically, the successful market for the first generation of cable-free recorders was the transition zone with, for example, much of the US Gulf Coast being acquired in the 1990s using these systems.
However, these earlier cable-free recording systems were not widely adopted for onshore operations because of the limitations of the available technology making them complex to operate and expensive and therefore uncompetitive for normal data acquisi-
tion compared to the mainstream digital cable systems. Ensuing developments in cable-free recording systems that employed GPS for timing synchronisation gained popularity onshore but consisted of separate acquisition units and batteries making them still cumbersome for TZ deployments. The resulting high cost of data acquisition in the TZ domain has made exploration in these areas less attractive with reduced activity especially during the oil price shocks of the last 20 years.
In the last five years there has been a step change in onshore data acquisition with the wide acceptance of the latest generation of cable-free recording – the single sensor node. Advances in technology have enabled great improvements in nodes, in particular their reliability, weight reduction, and battery/field endurance. By and large, the nodes commercially available now have crossed a threshold of these key performance metrics. The result has been a step change in seismic data acquisition with wide acceptance of nodal recording systems and their replacement of cable systems both on land and offshore.
However, there remain operational challenges in the transition zone and shallow water environments as land nodes cannot receive GPS timing if submerged. The use of specilised Ocean Bottom Nodes (OBN) which do not require GPS signals to continuously synchronise the internal clock during deployment is limited in this environment. The size of vessel required to deploy heavy OBNs limits their use in shallow water and some TZ areas are landlocked with no access. In addition, the unit cost of OBNs are significantly higher than for land nodes, in part due to the expensive, high stability internal clock.
A solution is to adopt the methods successfully used in the 1990s with the first generation of cable-free systems and provide the present-day seismic node with the capability to
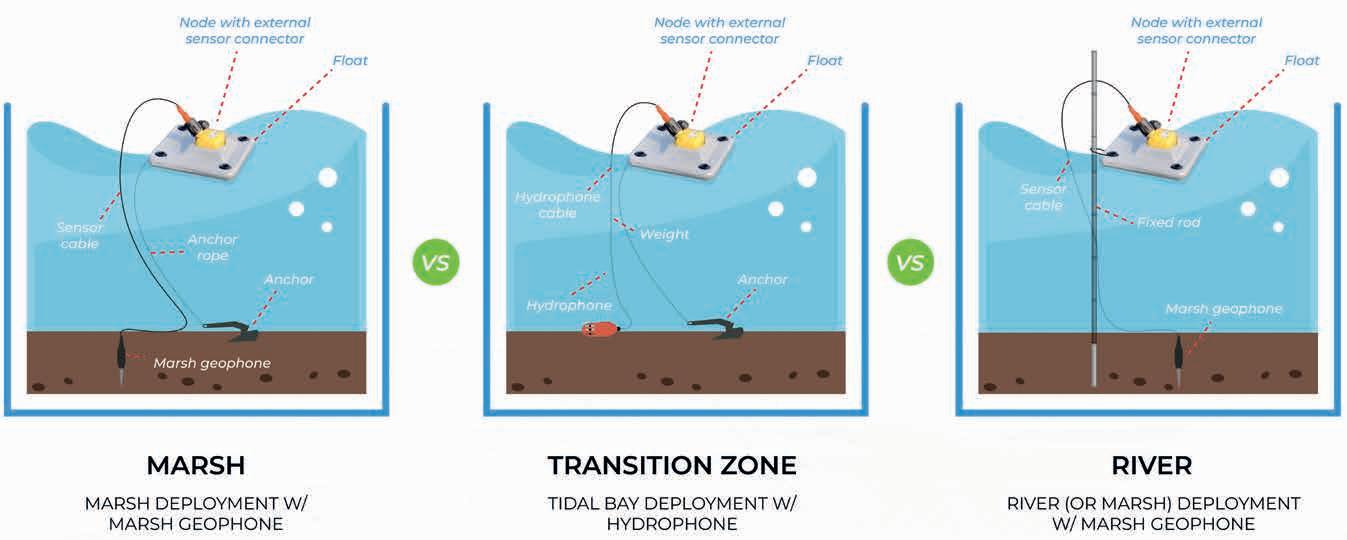

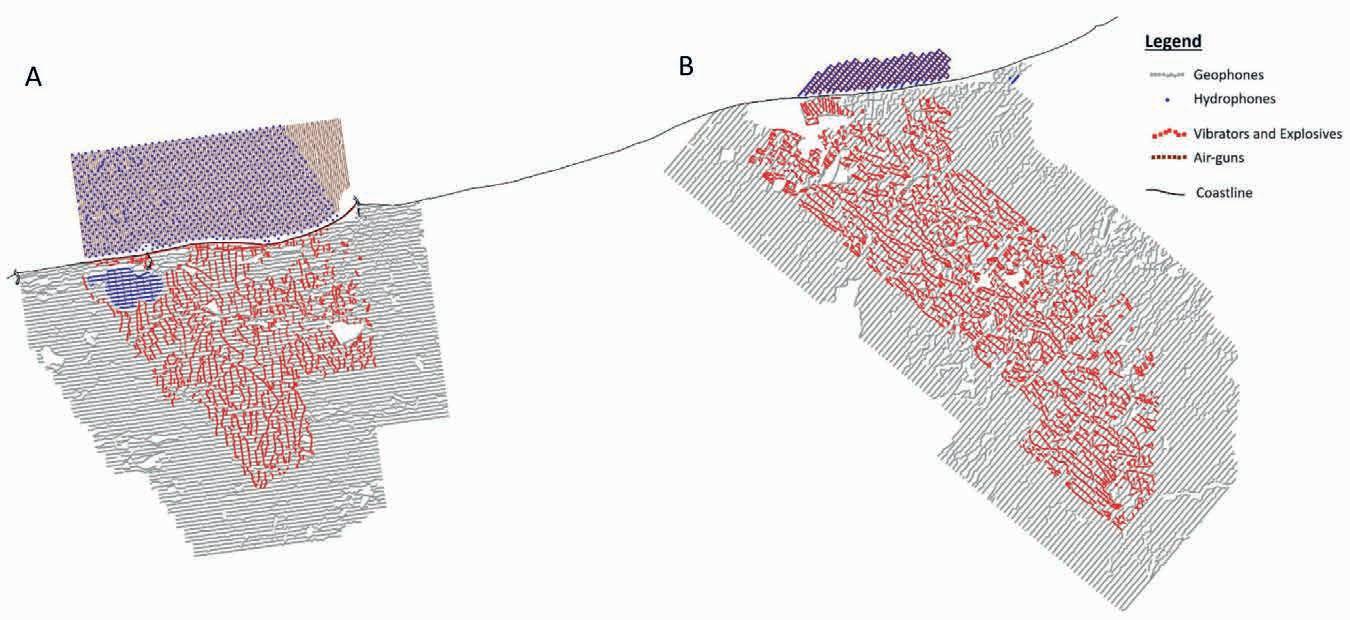
connect to an external sensor. The external sensor, marsh phone or hydrophone, can then be deployed below the water surface, either suspended or placed on the river or lakebed. By maintaining the node at the surface not only is timing synchronisation maintained but also other functionalities such as the recording of the GPS location and remote quality control, either sampled or in real time using Bluetooth and LPWAN technologies.
Recent successful nodal TZ 3D seismic surveys utilising this method have demonstrated the robustness and benefits of this technique.
The enabling feature of a node suitable for transition zone deployment is the ability to connect an external sensor, specifically either a marsh cased geophone or hydrophone. The connector obviously must be waterproof and ideally should not affect the use of the node as a ‘standard’ acquisition node, i.e. it should use the same auxiliary equipment such as charging and data harvesting racks, so that operations are seamless and avoid a hybrid or mixed acquisition complicating operations and data handling.
There are three general deployment methods that can be used when deploying land nodes in the transition zone depending on the depth of water, currents, tides, and general ‘bottom’ conditions for anchoring as shown in Figure 3.
The simplest deployment method is shown in the first diagram of Figure 3 and is used for marsh or lakes/reservoirs where water conditions are fairly benign, without strong currents or variations in water depth, and a marsh phone can be planted with the use of a planting pole. Where there are stronger currents and conditions a pole may be used to serve as an anchor as shown in the third diagram in Figure 3. In tidal areas, or where the water depth precludes the placing of marsh cased geophones then a hydrophone is used as shown in the middle diagram of Figure 3. In this traditional TZ environment, the node is deployed on a buoy to compensate for wave activity and is anchored to the seabed.
During the deployment of the nodes the position of each receiver and the depth of the water at a given location are
precisely measured by the deployment boat using GPS and depth sounder instrumentation. This position is used in data processing for bottom deployed sensors. In the example of suspended hydrophones any variation in node position is recorded within the node and available during processing. During data acquisition crew boats and antenna masts installed on the shore are used to check the recording and QC status of the nodes as in regular onshore operations.
At the end of 2023 and the beginning of 2024 two transition zone 3D seismic surveys were acquired on the Baltic coastline of Poland: Bialokury 3D and Biesiekierz 3D (Figure 5). They covered 338 km2 and 424 km2 of the operational area, respectively, across challenging terrains, from an onshore moraine upland over 20 m high comprising glacial till and sands, across coastal sand dune complexes forming elongated dune banks up to 10 m high, to water depths of 20 m up to 6 km offshore. In addition the onshore portion of the project included extensive

areas of marsh, a water reservoir, built-up areas along roads, agricultural and forested areas, mining activities, and recreational areas along the coast.
The offshore parts of the survey covered 79 km2 for Bialokury 3D and 12 km2 for Biesiekierz 3D, extending 15 km and 8 km, respectively, parallel to the coast. The farthest receiver point was 6 km from the coast and the total water depths ranged from 0 to approximately 15 m, with a relatively small tidal range of 10 to 15 cm. The offshore survey approach differed between the two projects: Bialokury 3D used a carpet-type grid, given the larger offshore area (Figure 7), while Biesiekierz 3D employed an orthogonal grid, more typical of an onshore survey layout (Figure 9).
Receivers used onshore were INOVA Quantum nodes with a high sensitivity 5Hz geophone whilst offshore a Quantum node with an external connector (Figure 2) placed on a buoy anchored to the seabed was utilised with a 10Hz hydrophone suspended from the buoy. Both vibroseis and drilled dynamite charges were used as sources onshore whilst offshore the source was airgun (Figure 6).
The sensors in the water were laid out simultaneously with the measurement of their position and depth. The positions were recorded using the GPS RTK method and water depth was acquired using sonar. During data acquisition the source location was determined by the GPS receiver placed on the source boat, also using the RTK method. Additionally, the depth of the seabed at every shot location was measured by sonar.
Quality control of the marine receivers throughout the data acquisition process was via BlueTooth and LPWAN communication with the nodes carried out by mobile units mounted on small vessels to ensure that the nodes were recording correctly. During data acquisition, the operation was temporarily paused when storms, strong winds, or heavy rain made it impossible and unsafe to continue. Small boat movement very near the coastline, where the depth of water was shallow, had to be performed very cautiously because of the risk of running aground. It is worth noting that both 3D surveys were successfully carried out during the winter, when weather conditions in the Baltic Sea are the least suitable for seismic acquisition.
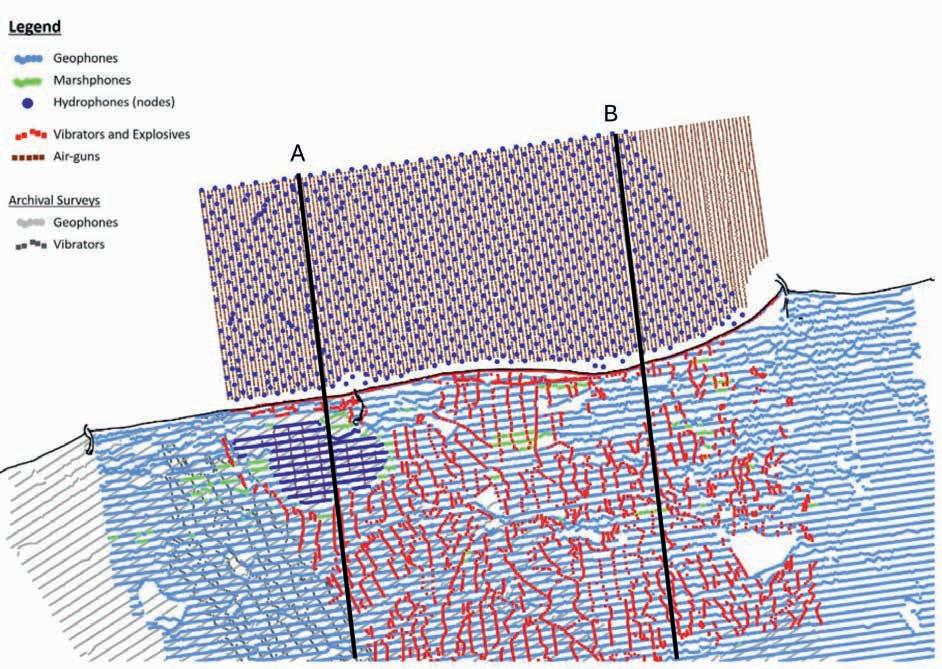

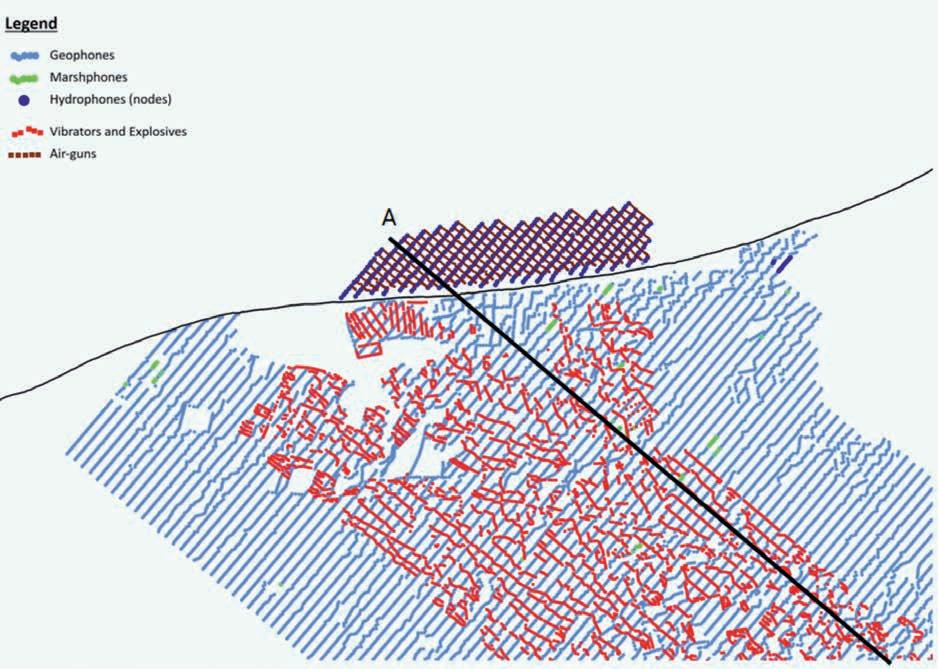

The Bialokury 3D survey, typical of a transition zone, included up to three different environments for seismic acquisition: a marine area, a land area, and a lake surrounded by wetlands (Figure 7). This posed no issues for the project, as seamless seismic imaging was achieved thanks to the adaptability of the nodal system and the dedicated seismic data processing of both acquired and archived data (Figure 8).
Although the offshore portion of the Biesiekierz 3D survey was small, it was crucial for imaging the geological target. Due to terrain restrictions and the absence of landowner permissions, the limited coverage in the coastal zone was effectively compensated for by the offshore area (Figures 9 and 10).
A similar 3D survey was successfully completed in the United Arab Emirates over an area of 615 km², of which 53 km² was offshore in shallow water with depths of 12 to 15 m. The north-
the
ern part of the onshore area encompassed a large city with over 100,000 inhabitants, while the southern onshore area extended into challenging terrain with high sand dunes, covering approximately 10% of the project. The eastern boundary of the project was defined by the Jais Mountain range, where the ends of the receiver lines were positioned. As a result, the acquisition area featured highly variable terrain, including urban areas, sandy deserts, coastal strips, flat regions, mangroves, mountains, and shallow water.
Similar to the previous survey conducted along the Baltic coast, Quantum nodes with high-sensitivity 5 Hz geophones were used onshore, while offshore nodes with external connectors and 10 Hz hydrophones were deployed. The nodes were mounted on buoys (see Figure 11), anchored to the sea floor with concrete block weights, while the hydrophones were suspended from the buoys. This solution was employed not only in seawater but also in lagoons and partially within the harbour. Vibroseis and dynamite sources were utilised onshore, while air guns were used as the source offshore.
All receivers in the marine area were laid at the same time and left in position for the duration of the survey. The same method of positioning and water depth measurement was used as in the Baltic survey.
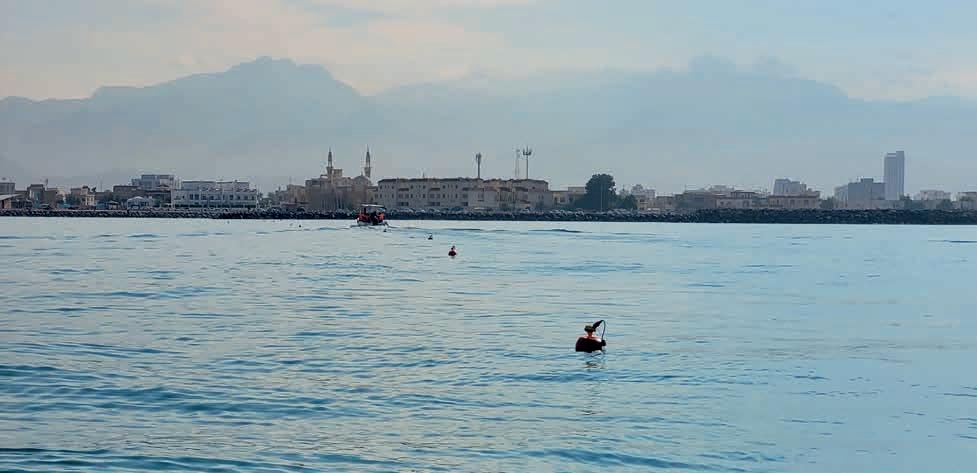
During data acquisition, quality control of the marine receiver spread was conducted to ensure proper recording operations. This was achieved through long-range QC using Low Power Wide Area Network (LPWAN) technology, which communicated with a shore-based gateway installed on a mast (see Figure 12). The LPWAN gateways received real-time QC status information directly from each deployed node.
Due to the ease of handling of the buoy deployment, only three light ‘skiff’ type boats were required which were subsequently also used for checking the QC and recording status of the deployed nodes using a short range BlueTooth QC system.
Recent projects have shown the practicality of using onshore nodal technology for data acquisition in the transition zone and shallow water environment. This solution was successfully implemented in shallow water marine areas for 3D seismic surveys in Poland and in the UAE, allowing very operationally demanding projects to be implemented on time and cost-effectively, without compromising the spatial coverage in the TZ.
The use of the onshore nodal systems for TZ acquisition offers the same scalability and flexibility as in land-based surveys, for which they were originally designed. This approach allows for both carpet-type survey layouts and traditional land-based orthogonal survey grids. Additionally, the nodes can be freely adapted to various water depth and unique characteristics of the water body where seismic data acquisition is to be carried out.
In conclusion, based on the examples of 3D seismic surveys presented, land-based nodal seismic systems, with appropriate modifications, may enable homogeneous seismic data acquisition in areas that were previously inaccessible for
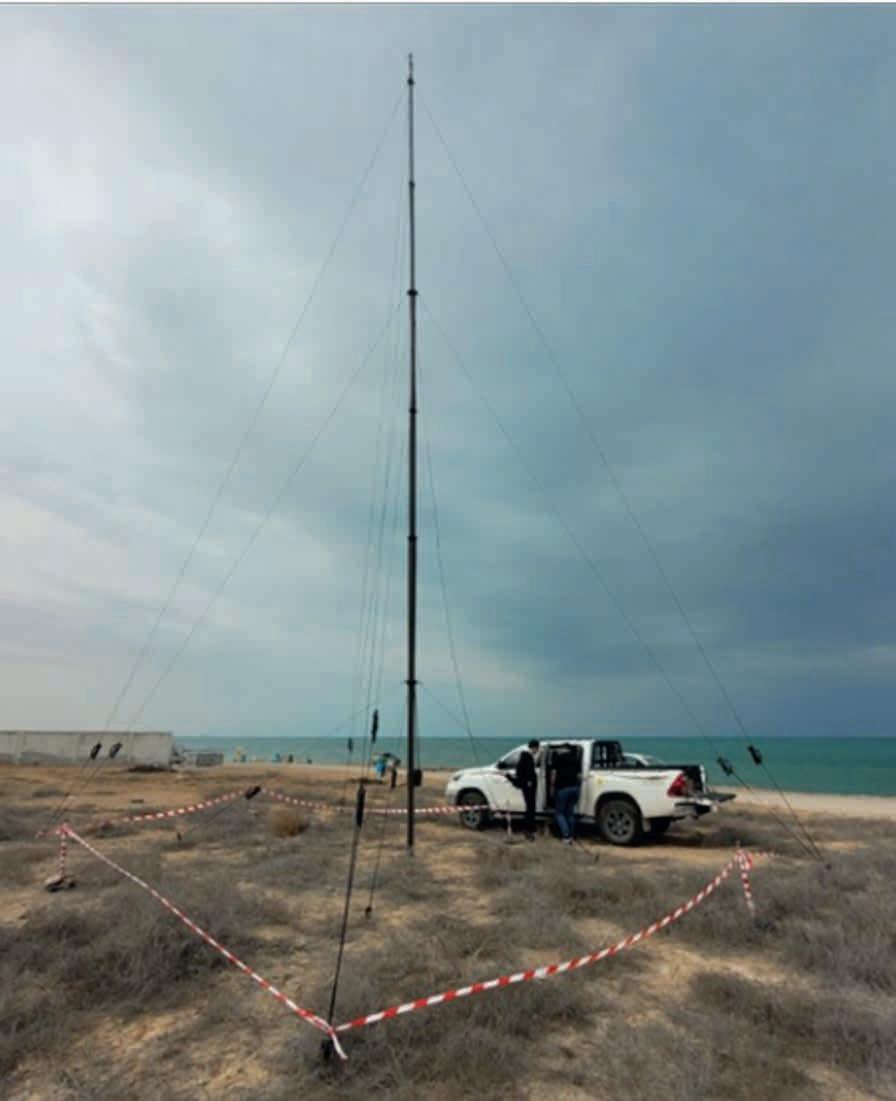
seismic operations, primarily due to operational and economic constraints.
The authors wish to thank The Orlen Group, Geofizyka Toruń SA, and Inova Geophysical for the use of pictures and data in this presentation and for their assistance in its preparation.


To serve the interests of our members and the wider multidisciplinary geoscience and engineering community, EAGE publishes a range of books and scientific journals in-house. Our extensive, professional marketing network is used to ensure publications get the attention they deserve.

Tim Dean1*, Matt Grant1, and Justin Hooi2 demonstrate that high-resolution mini-3D seismic surveys can be used as an alternative to drilling to quickly and easily identify possible structural issues in high-priority areas and pinpoint the strike of faults identified from 2D surveys.
Abstract
Unidentified structural features, primarily faults, are estimated to cost the coal mining industry in Australia alone $6 billion per year. Although seismic surveys are routinely used to characterise structures ahead of mining, these are often limited to 2D lines, with only the most recent being high-resolution 3D surveys. The most common approach for providing detailed structural definition is to drill a series of holes. In this paper we show a comparison between a full high-resolution 3D survey and a much smaller mini-survey over an area of particular structural complexity. The extracted surfaces, corresponding to three different coal seams, and the resulting structural interpretations, were consistent. Based on these results we are confident this approach can be used as an alternative to drilling to quickly and easily identify possible structural issues in high-priority areas. The method could also be used to accurately measure the strike of faults identified from 2D surveys.
Introduction
Unidentified structural features, primarily faults, are estimated to cost the coal mining industry in Australia alone $6 billion per year (Dean et al. 2021). Although seismic surveys are routinely used to characterise structures ahead of mining these tend to be limited to 2D lines, with only the most recent being the high-resolution surveys capable of detecting small-scale features (Dean et al. 2021, Dean et al. 2021, Dean, Pavlova, Grant, Bayly, Sweeney, Re and Strobbia 2021, Pavlova et al. 2021, Pranoto et al. 2022, Strobbia et al. 2021, Strobbia et al. 2021). The most common approach for providing structural definition is to drill a series of holes, narrowing in on areas of abrupt changes in seam depths, to target possible faults. This method is generally expensive, time-consuming and necessarily only capable of sampling a limited area of the subsurface. An alternative approach is to acquire a high-resolution 3D seismic survey over a small area. 3D seismic surveys are typically acquired for exploration purposes and cover areas of tens or hundreds of square kilometres. In the oil industry, small surveys can be acquired for development
purposes (Hart et al. 2007); although these still tend to be quite large (the surveys detailed in Hart et al. (2007) covered areas of 20, 16, 52 and 450 km2). So called ‘micro-surveys’, covering areas as small as 500 m2, have also been acquired for very shallow targets (Bachrach and Freeman 2002, Kaprowski and Stewart 2004, Stewart et al. 2012, Vermeer 2012). A classification system for small-scale surveys has been suggested, albeit for marine surveys, with ultra-high resolution, very-high resolution, high resolution and conventional surveys defined on the basis of their dominant frequency (Monrigal et al. 2017) rather than their geometry. Previous surveys of the scale of that suggested here include:
• A 0.8 km2 survey over a 600m-deep target (Urosevic et al. 2008).
• A survey acquired with 10 m point and 40 m line spacing over an area of 2.4 x 2.6 km (Charles et al. 2019).
• A survey acquired over an area of 300 x 660 m with a 10 x 10 m grid of 2209 10 m spaced geophones and 1909 vibroseis source positions (Ishiyama et al. 2019).
• Multiple 150 x 150 m surveys acquired using a carpet of sources and receivers, usually on a 5 x 5 m grid (Colombo et al. 2024).
In this paper, we describe the acquisition and processing of a mini-survey intended to delineate small-scale coal structures. We begin by describing the acquisition of the survey and its subsequent processing. We then show the interpreted surfaces and assess their difference to a larger-scale survey.
The data in this study was acquired in the Bowen Basin, Queensland, Australia. The primary target was a metallurgical coal seam at a depth of approximately 260 m. Figure 1 shows gamma and density logs (velocity logs were not recorded), note that metal casing affects values above 140 m. The signature of the target coal seam is clearly visible from the logs (low density), resulting in a strong reflection. Low density intervals from several other coal seams are also visible, which result in additional strong reflections in the data.
1 Geoscience, Anglo American Steelmaking Coal | 2 Velseis Processing
* Corresponding author, E-mail: tim.dean.geo@gmail.com DOI: 10.3997/1365-2397.fb2025004

Figure 1 Gamma and density logs acquired in a borehole within the survey area along with the position of the multiple coal seams. Seams of interest for this survey are those at depths of approximately 100, 133 and 260 m.

Figure 2 Diagram of the faults found within the survey area. The average throw of each fault is given next to its position along with an indication of its dip direction. The dip of all the faults was between 70 and 80°. The position of the borehole shown in Figure 1 is indicated by the black circle.
To assess the feasibility of the mini-survey approach, we extracted a subset of a much larger 3D survey. This approach enabled the effect of the smaller geometry to be established by comparing it to the results from the full survey. The area we selected for the study contained several faults (interpreted from the full dataset) with throws ranging from 3 to 15 m (Figure 2).
Area 942 x 840 m (0.79 km2)
Receiver line spacing
36 m
Receiver point spacing 6 m
Source line spacing
30 m
Source point spacing 6 m
Total number of receivers 2,120
Total number of sources 4,567
Table 1 Acquisition parameters for the min-3D survey.
The mini-survey covered an area of just 0.79 km2. Point spacing was 6 m for both source and receiver with orthogonal line spacings of 30 and 36 m respectively (Table 1) giving a natural bin size of 3 m. Source points were acquired using a single 15,000 lbf peak force IVI Envirovibe emitting a specially designed 11 second broadband 4 to 180 Hz sweep (Bagaini et al. 2008, Dean 2024, Dean et al. 2016). The receivers were a mixture of SmartSolo and AllSeis 10 Hz nodes (Dean 2024).
The receiver lines covered an area of 684 x 630 m with the source lines extending a further 120 and 105 m from the spread boundary in the inline and crossline directions respectively, giving a source area of 942 x 840 m (Figure 3). The survey was designed to minimise environmental impact (Dean 2023a, Dean 2023b) hence why the lines curve gently.
Fold maps for maximum offsets of 150 and 250 m are shown in Figure 4. These suggest that the shallower target will have fold of between 13 and 20 across the centre (excluding the outer 70 m of the survey) of the area, with the deeper target having fold of between 40 and 50. The estimated fold for both targets drops off rapidly at the edges of the survey where there are no receiver lines. As the targets are shallow, the small survey size does not affect the fold in the centre of the survey, and thus we expect to see any differences between the two datasets limited to the lower-fold areas around the survey edge.
To determine the effectiveness of pre-stack time migration, we generated the impulse response for a single trace from the centre of the survey assuming a maximum dip of 70° and a migration aperture of 500 m (Figure 5). The offsets required for successful
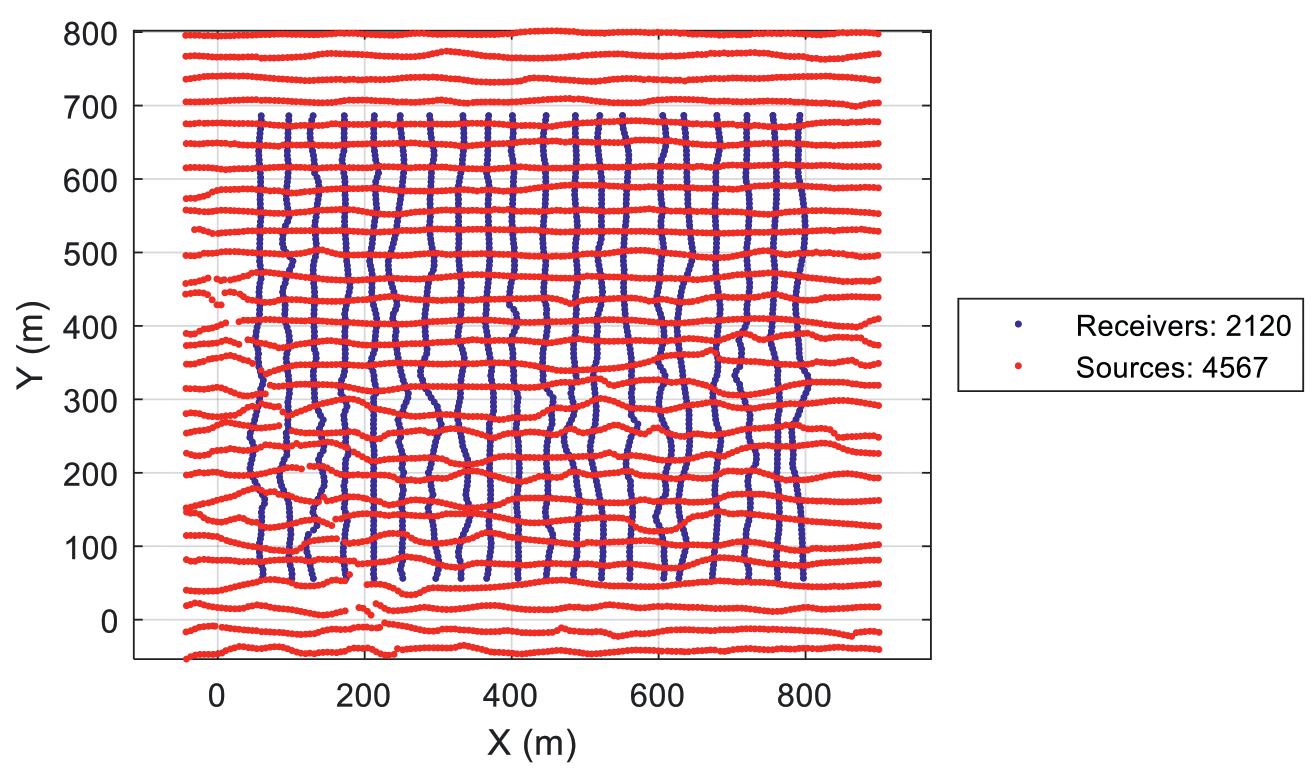
3 Geometry of the survey with receiver points in blue and source points in red.

migration of different reflectors can be established by determining the minimum offset that fully encompasses the associated ellipse on the impulse response curve. For example, a maximum aperture of 500 m allows the imaging of reflections down to ~360 ms, as shown by the dashed blue box on Figure 5. Using this approach, the shallow (160 ms) and deeper (300 ms) targets (the green and red boxes on Figure respectively) would require offsets of 160 and 300 m respectively. This is less than the extent of the source lines outside the receiver patch (105/120 m) but it was considered that these offsets would be sufficient to avoid any notable migration artefacts without significantly increasing the cost of the survey.
The mini-survey was processed using the same processing procedure as the full survey but none of the results (e.g. the

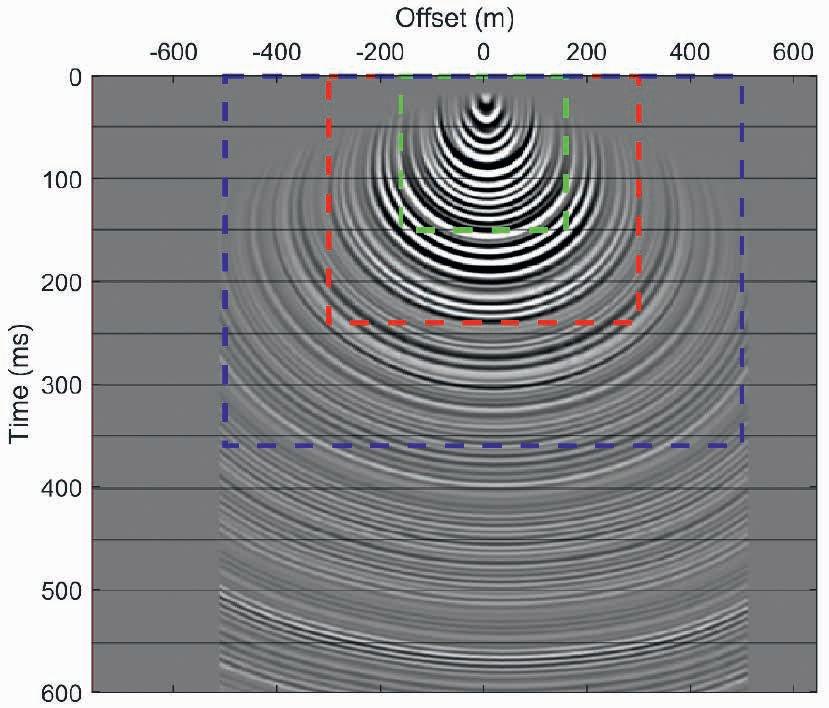
velocity picks) were shared. The pre-processing flow consisted of geometry assignment followed by two passes of velocity picking and residual statics. The data was then sorted to the cross-spread domain and noise attenuation (3D FKK and surface wave noise attenuation) applied. The data was then converted to minimum phase and surface-consistent deconvolution applied. Further noise attenuation processes were applied before 5D regularisation and PSTM velocity analysis. Kirchoff pre-stack time migration was then applied followed by high-density velocity analysis, trim statics and the final stack.
Given the smaller size of the mini-survey, we expected there to be a difference in the statics solutions, in particular the long-wavelength statics and this is indeed the case, with differences ranging by ±2 ms (Figure 6).
Figure 7 shows three inline sections from each of the two volumes. The sections vary slightly but the faults are clear in both datasets. Figure 8 shows time slices at three different levels, 143 and 230 ms, corresponding to two of the target layers, and 500 ms, to demonstrate what happens at a greater depth. The time for the mini-survey has been offset by 1 or 2 ms to ensure consistency between the two volumes. Again, these results are broadly consistent, but there are also clear differences at the edges and, in particular, the corners at later times (Figure 8e and f), where fold decreases. There are also clear migration artefacts at greater depths (Figure 9), particularly near the ends of the
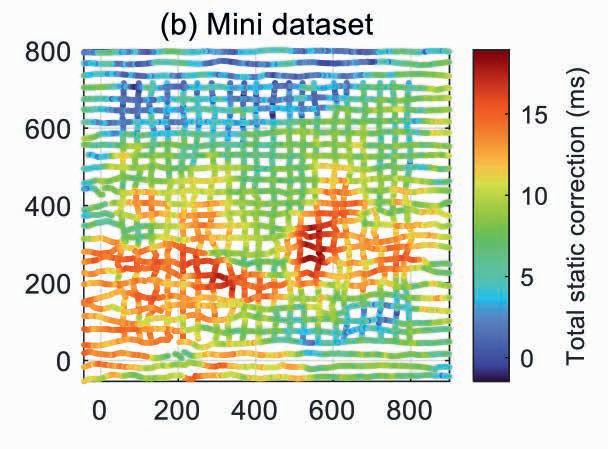

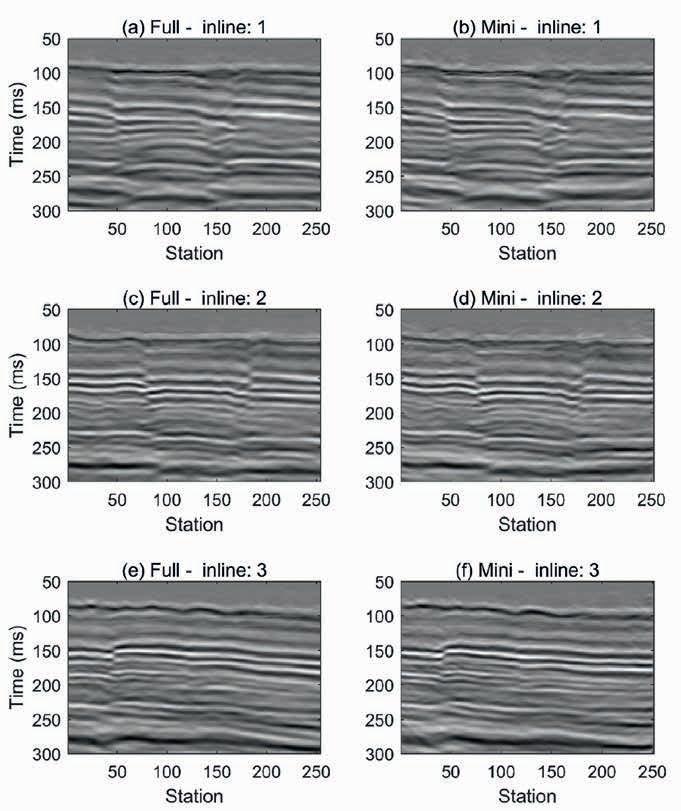


lines, although these are considerably deeper than the target of interest (230 ms).
To further compare the datasets, the three reflectors of interest were interpreted at ~150, 160 and 235 ms. The resulting surfaces are shown in Figure 10.
The differences between the three surfaces are shown in Figure 11. The larger wavelength differences are consistent with the total static differences between the two datasets (Figure 6c).
The mean difference for layer 1 picks was -1.4 ± 1.7 ms (mean ± standard deviation) and for the other two layers -1.2 ± 1.5 ms and -0.9 ± 1.5 ms respectively (Figure 12).
The surface difference plots (Figure 11), particularly layer 1, show narrow lines of significantly different values (> ±10 ms). These are a result of slight differences in the auto-picked surface, particularly at the discontinuities resulting
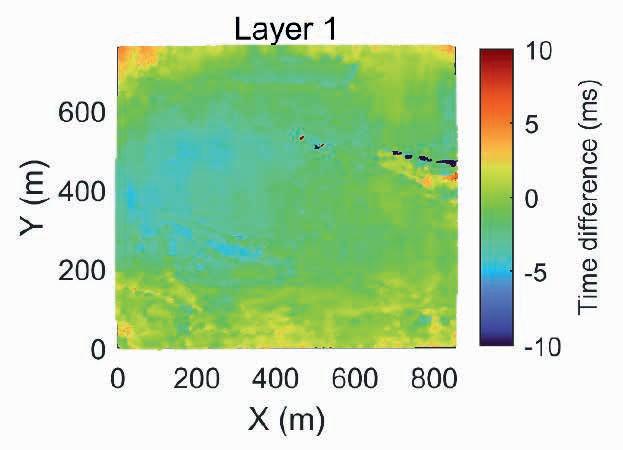
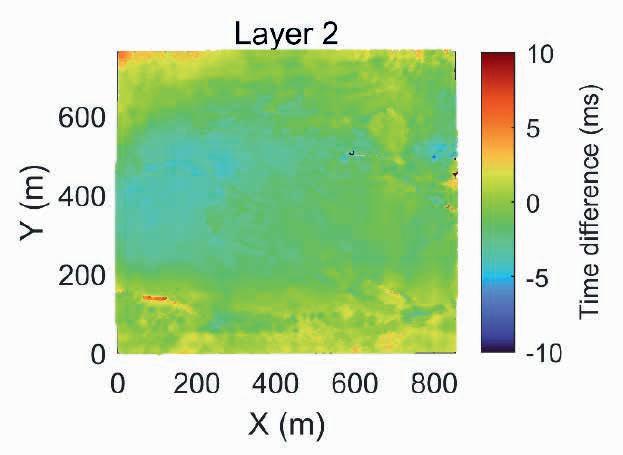
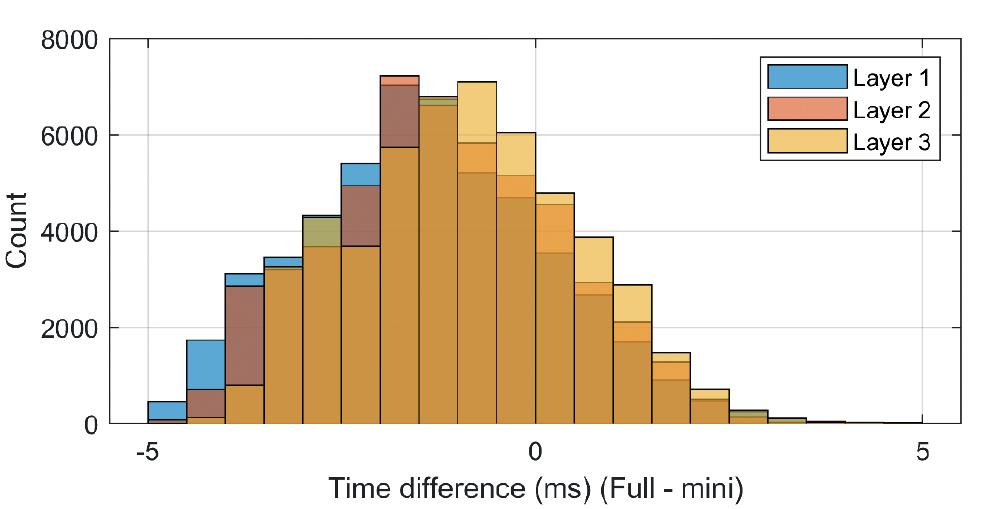
from faults where the surface is picked from different directions (Figure 13).
Although the interpreted surfaces from the two datasets showed slight differences (Figure 11), these were less than 2 ms (Figure 12) and were associated with variations in the respective static solutions (the mini-survey did not have the long-wavelength features evident in the full-survey due to their limited offset range, Figure 6).
The objective of a mini-survey is to acquire a small-scale dataset over an area that may have localised structural concerns that need to be addressed in a short timeframe. It uses a small static spread of modern lightweight nodes (Dean et al. 2018) that can be laid out by a small crew in a couple of days. Source points are then recorded into the static spread, requiring an additional couple of days before the spread is collected (easily done in a couple of hours). For the dataset here, the processing required only three days (due to its small size) and thus it is conceivable a survey could be turned around in just a single week.
The selection of the distance between the outside of the source and receiver patch requires a balance between the requirements for PSTM and the need to prevent the survey from becoming too large. In our case, although we did not acquire the full range of offsets that were theoretically required from the impulse response (Figure 5), it was still sufficient to allow imaging at the seams of interest.
As with all seismic surveys, it is important to get the survey design correct. This is, however, particularly important for mini-surveys as they are inherently low-fold and have limited offset ranges. We found the traditional fold plots (Figure 4) and the PSTM impulse response plot (Figure 5) to be particularly useful in this regard, but, in addition, the survey must be carefully positioned to ensure it covers all the possible structural features

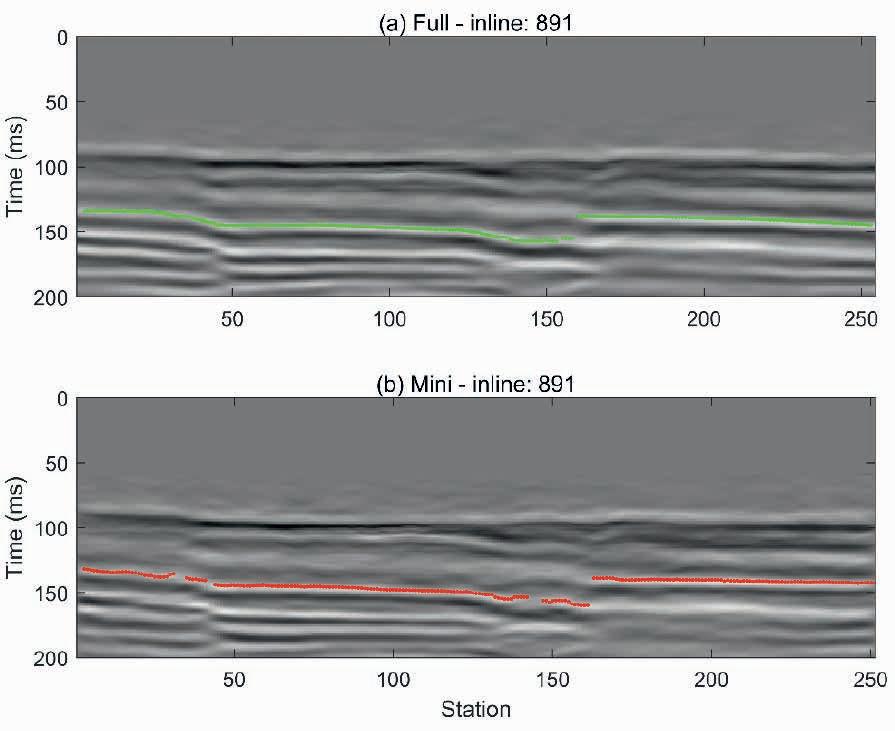
of interest. We generated the impulse response plot using a trace from the survey as we had already acquired the data, but it could also be generated using a synthetic from a nearby well if no data is available.
In this paper, we have shown a comparison between a full high-resolution 3D survey and a mini-survey over an area of particularly structural complexity. The extracted surfaces, corresponding to three different coal seams, and the resulting structural interpretations, were consistent, even at areas close to the edge of the mini-survey. The only noticeable difference being a 1-2 ms offset due to the lack of long wavelength statics in the latter. Based on these results, we are confident this approach can be used as a drilling alternative to quickly and easily identify possible structural issues in high-priority areas such as those adjacent to active mining. The method could also be used to accurately pinpoint the strike of faults identified from 2D surveys.
Bachrach, R. and Freeman, E. [2002]. Using small-scale 2D and 3D pilot surveys to evaluate the seismic response and image unsaturated sedimentary units at depths of 80 m and 20 m at the Hanford site. SEG Technical Program 2002, Expanded Abstracts, 1504-1507. Bagaini, C., Dean, T., Quigley, J. and Tite, G.-A. [2008]. Systems and methods for enhancing low-frequency content in Vibroseis acquisition. Patent WO-2007068891-A9.
Charles, S., Lin, J., Kuzmiski, R., Leung, P., Mouaki, A., Looi, S. Y. and Liu, Q. [2019]. A high-density, high-resolution joint 3D VSP–3D surface seismic case study in the Canadian oil sands. The Leading Edge, 38(1), 35-44.
Colombo, D., Sandoval-Curiel, E., Alyousuf, T., Turkoglu, E. and Rovetta, D. [2024]. Ultra-dense nodal seismic acquisition for automated geohazard analysis. The Leading Edge, 43(8), 484-493.
Dean, T. [2023a]. The application of graph theory to optimise the design of onshore 2D seismic surveys. The Leading Edge
Dean, T. [2023b]. Quantitative measurement of the environmental disturbance caused by onshore seismic surveys. Exploration Geophysics, 1-8.
Dean, T. [2024]. A comparison of two land nodal seismic recording systems. Exploration Geophysics.
Dean, T. [2024]. An Integrated Approach to Vibroseis Sweep Design. First Break, 42(1), 59-64.
Dean, T., Grant, M. and Pavlova, M. [2021]. The Efficient Acquisition of High-Resolution 3D Seismic Surveys for Shallow Open-Cut Mining. First Break, 39(8), 43-49.
Dean, T., Grant, M. and Pavolva, M. [2021]. A brief history of 3D seismic acquisition in BHP Coal and some predictions for the future. Australasian Exploration Geoscience Conference, Brisbane, Australia.
Dean, T., Pavlova, M., Grant, M., Bayly, M., Sweeney, D., Re, S. and Strobbia, C. [2021]. Imaging the near surface using velocity inversions of ultra-high-density 3D seismic data. The Leading Edge, 40(8), 584-589.
Dean, T., Quigley, J., MacDonald, S. and Readman, C. [2016]. The design of optimized broadband vibroseis sweeps. The Leading Edge, 35(8), 684-688.
Dean, T., Tulett, J. and Barnwell, R. [2018]. Nodal land seismic acquisition: The next generation. First Break, 36, 47-52.
Hart, B., Sarzalejo, S. and McCullagh, T. [2007]. Seismic stratigraphy and small 3D seismic surveys. The Leading Edge, 26(7), 876-881.
Ishiyama, T., Sato, H., Abe, S., Kawasaki, S. and Kato, N. [2019]. High-resolution 3D seismic reflection imaging across active faults and its impact on seismic hazard estimation in the Tokyo metropolitan area. Technophysics, 689, 79-88.
Kaprowski, N. and Stewart, R. [2004]. 3C-3D seismic micro-survey at a Maya plaza ruin in Belize, Central America. CSEG Recorder, 29(9).
Monrigal, O., de Jong, I. and Duarte, H. [2017]. An ultra-high-resolution 3D marine seismic system for detailed site investigation. Near Surface Geophysics, 15(4), 335-345.
Pavlova, M., Grant, M. and Dean, T. [2021]. Maximising the value of high-definition 3D coal seismic data. Australasian Exploration Geoscience Conference.
Pranoto, N., Lawell, E., Dean, T. and Grant, M. [2022]. Lighting up the dark – the use of 3D seismic to optimise mine plans at structurally complex Blackwater mine. 12th International Mining Geology Conference.
Stewart, R., Spikes, K., Sisson, J., Hall, S., Huang, J. and Danbom, S. [2012]. Outstanding in the field: Hands-on geophysical education. The Leading Edge, 31, 278-286.
Strobbia, C., Bayly, M., Sweeney, D., Dean, T., Pavlova, M. and Grant, M. [2021]. Overburden measurement for coal mine management with 3D high resolution compressional and shear velocity seismic inversion. Australasian Exploration Geoscience Conference.
Strobbia, C., Re, S., Dean, T., Grant, M., Bayly, M., Nightingale, M. and Sweeney, D. [2021]. Integrated Seismic Exploration for Open-Cut Mining: The Importance of the Near Surface. First Break, 39(8), 87-93.
Urosevic, M., Kepic, A., Sheppard, S. and Johnson, D. [2008]. Nickel exploration with 3D seismic – Lake Lefroy, Kambalda, WA. SEG Technical Program Expanded Abstracts, 3607-3608.
Vermeer, G. J. O. [2012]. 3D Seismic Survey design, 2nd Ed. SEG, Tulsa.
Terence Krishnasamy1*, James Beck1 and Cristina Reta-Tang1 present an effective modelbuilding workflow that incorporates FWI for both diving waves and reflections, utilising different cost functions.
Introduction
Near-surface characterisation plays a crucial role in accurately imaging deeper targets in onshore exploration seismic data. However, conventional model building techniques, such as reflection tomography, have limitations when it comes to updating near-surface velocities due to insufficient offset coverage at shallow depths. To overcome this, alternative methods like diving-wave or first arrival tomography have been widely used, offering updates to the shallow velocity model, albeit often lacking the necessary resolution.
In contrast, full waveform inversion (FWI) is a robust algorithm used to derive velocity models with high resolution and fidelity. FWI, based on direct solutions of the two-way wave equation, has been intensively developed in recent years because it provides a superior way to build high-resolution velocity fields, especially under complex geological settings. The inversion is performed by iteratively updating the model parameters by reducing the data differences between the observed and synthetic data. In recent years, it has been widely adopted in the industry, with successful examples of its application to marine data, especially for surveys acquired with rich azimuth long offsets and recorded with low frequency. However, onshore examples are not as abundant (Mei & Tong, 2015; Lemaistre et al., 2018; Tang et al., 2021; Masclet et al., 2021; Sheng et al., 2022, Krishnasamy et al., 2023).
There are several challenges for FWI in onshore applications. Onshore seismic data are acquired on non-flat datum (topography). As such, wavefield propagation from this non-flat surface must be addressed to achieve accurate results and be computationally efficient. Additionally, the low signal-to-noise ratio (SNR) of onshore data poses a challenge, mainly due to near-surface heterogeneity which results in strong near-surface scattering. Furthermore, recent successful applications of FWI to onshore data have shown that it remains a challenge to take full advantage of the recorded energy below 5 Hz due to the highly variable SNR, even with nonlinear sweeps starting as low as 2 Hz (Durussel et al., 2022). Lastly, the weathering layer (i.e., the layer at or near the surface, mostly made up of unconsolidated and heterogeneous material) results in strong elastic effects such as surface waves and converted waves, which are not accounted for during acoustic simulation. While one could utilise an elastic FWI workflow to address the elastic challenge, in practice it is still resource intensive, especially with very low shear velocities present in the model.
We have developed an effective model building workflow that incorporates FWI for both diving waves and reflections, utilising different cost functions. Figure 1 shows a conceptual representation of the workflow, which has been applied to many onshore surveys from a variety of geological settings. Thus far, the workflow produces geologically plausible and consistent models for data acquired with legacy/conventional onshore acquisition setups.
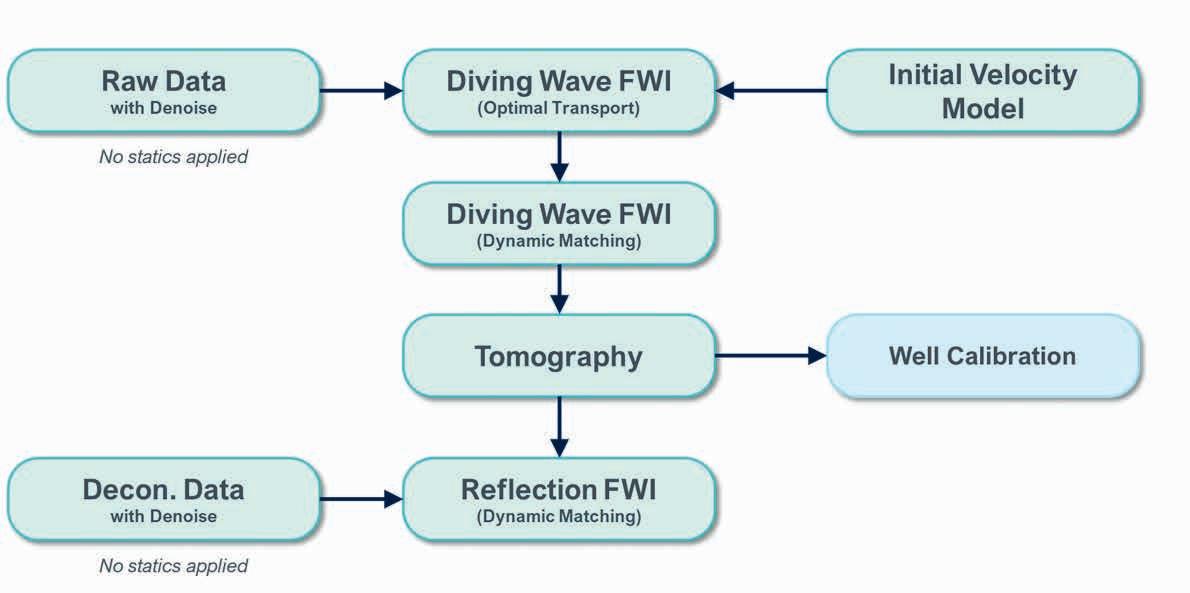
1 TGS
* Corresponding author, E-mail: terence.krishnasamy@tgs.com DOI: 10.3997/1365-2397.fb2025005
Figure 1 Conceptual representation of the FWI velocity model building workflow.

The initial near-surface model was built using diving wave tomography and, where possible, supplemented by limited shallow sonic log information. Pre-processing the data to make it suitable for full waveform inversion (FWI) is an important step. The focus of this step is mainly to remove any unwanted energy that acoustic forward modelling is unable to capture, especially in the lower frequency ranges where the SNR is low. The steps include high amplitude noise suppression, ground-roll attenuation, inverse Q corrections, and surface consistent scaling. Figure 2 shows example shots before and after preprocessing. Despite these data preconditioning efforts, the usable starting frequency for the FWI is generally limited to around 5 Hz due to the variable SNR.
It is important to note that no statics correction, including any residual statics, was applied to the data used in the FWI workflow. Our results show that by not applying any residual statics to the data, we capture more details in the velocity model that would otherwise be captured by statics corrections. Typically, residual statics computed in time are based on normal moveout correction (NMO) velocities. NMO velocities assume the moveout is near hyperbolic in shape. However, in depth, when the velocity field is not the same, the vertical static corrections derived from the seismic weathering layer have little meaning to the depth migration process and begin to pull it away from accurately predicting geologic features. Figure 3 shows a synthetic data test on the effect of applying residual statics computed in time to a depth migration, taken from the study conducted by
Ellison & Innanen (2016). In this study residual statics computed in time were applied to the input to the depth migration process. Comparing the resulting depth migrated images, the input data with residual statics computed in time have made the reflections less continuous compared to when no statics were applied to the input data.
FWI is a nonlinear inversion algorithm aimed at producing a velocity model that best explains the field data. This iterative algorithm involves forward modelling and migration of data residuals. The iteration stops when the synthetic shots sufficiently approximate the real data. It is then assumed that the resulting velocity model is a good estimate of the true model. Given the uncertainty in our initial velocity model (from refraction tomography) and limited starting frequency, diving wave FWI without cycle skipping was not initially possible. To overcome this, we utilised an optimal transport cost function using the quadratic Wasserstein distance (Engquist et al., 2016; Yang et al., 2018) that uses the trace envelope to compute the travel time information for the misfit. This cost function is less sensitive to the initial model. This approach allowed us to compute more robust travel time information for the misfit calculation and avoid cycle skipping, enabling us to update the low wavenumber background velocity model where low frequencies were deficient.
Having obtained a more accurate background velocity model, we transitioned to utilising a multi-channel dynamic matching (DMFWI) cost function, still focusing on the diving waves. The multi-channel DMFWI approach leverages normalised local window cross-correlations to quantify the time-dependent disparities between the observed and synthetic data (Mao et al., 2020; Sheng et al., 2020). This puts less weight on the amplitude discrepancy and focuses more on the kinematic difference between observed and synthetic data. Additionally, multi-channel windowing is used to mitigate the influence of noise in the input data. By doing so, we reduce the influence of noise and enhance the reliability of the inversion results. A multi-scale approach is also preferred, where the offset range and frequency bands used in the FWI updates are progressively increased. This helps to reduce the risk of cycle-skipping.
Diving wave penetration is usually limited on legacy/conventional onshore surveys. To update the deeper parts of the model, where diving waves do not penetrate, we usually utilise reflection tomography. To capture and honour the velocity heterogeneity

Figure 3 Depth migration of a synthetic dataset; a) with no residual statics and b) with residual statics from time. The arrows highlight areas where we see a significant degradation in the imaging when residual statics from time was applied (from Ellison & Innanen, 2016).
of the subsurface, multi-azimuth tomography updates were performed.
Subsequently, with this updated model, we continued the velocity model refinement using reflection FWI (RFWI) with the DMFWI cost function. At this stage of the processing, the input data has undergone further refinement. This includes surface consistent deconvolution, additional passes of noise attenuation (in different domains) and several passes of surface consistent scaling. To generate reflection events not present in the relatively smooth model obtained from diving wave FWI and reflection tomography, we introduced density contrasts using a pseudo-density model (Mao et al., 2019). This pseudo-density model is generated by migrating the input data at each RFWI iteration. This is then used to generate synthetic reflection events. Even though there may be errors in the velocity model, the near-angle times of reflection events will usually match up when comparing the actual data to the synthetic, due to the migration and de-migration effect. This will leave time differences at far angles for the RFWI to update the model with less chance of cycle-skipping. The frequency bands used in RFWI were progressively increased.
The first data example is from an onshore survey conducted in east Texas, USA. The nominal source and receiver spacing is 50 m, with a source and receiver line spacing of approximately 300 m. This survey was acquired with mixed source types, dynamite and Vibroseis, with a nominal maximum offset of around
6000 m. To accurately process the data, different source wavelets were derived for each source type. Notably, up-hole corrections were not applied to the dynamite sources, which were buried at a nominal depth of 20 m. Instead, the shot depths were supplied to the FWI forward modelling so that it can be correctly accounted for during synthetic data generation.
Diving wave FWI started at 5 Hz, employing a multi-scale approach where the frequencies were progressively increased. This multi-scale strategy helps to mitigate the risk of cycle-skipping by gradually introducing higher frequencies, allowing the inversion to converge more reliably. Figure 4 compares the results of running diving wave FWI up to 15 Hz. When comparing the velocity model from refraction tomography with that from FWI (figures 4d and 4e), we can see that the velocity model from FWI was able to capture very shallow velocity anomalies in the study area. The resulting pre-stack depth migrated (PSDM) image, utilising the velocity model from FWI (Figure 4c), shows better event continuity and a more plausible geological structure.
With this improved velocity model from FWI, we recomputed surface-consistent mid- to long-wavelength statics and the corresponding surface consistent residual statics. Comparing the residual statics derived from long-wavelength statics using refraction tomography and the depth slice of the velocity model from FWI (Figures 5b and 5c), we observed a clear correlation between the anomalies identified by the FWI velocity model and higher statics values. This suggests that these anomalies would have been missed if residual statics were applied to our

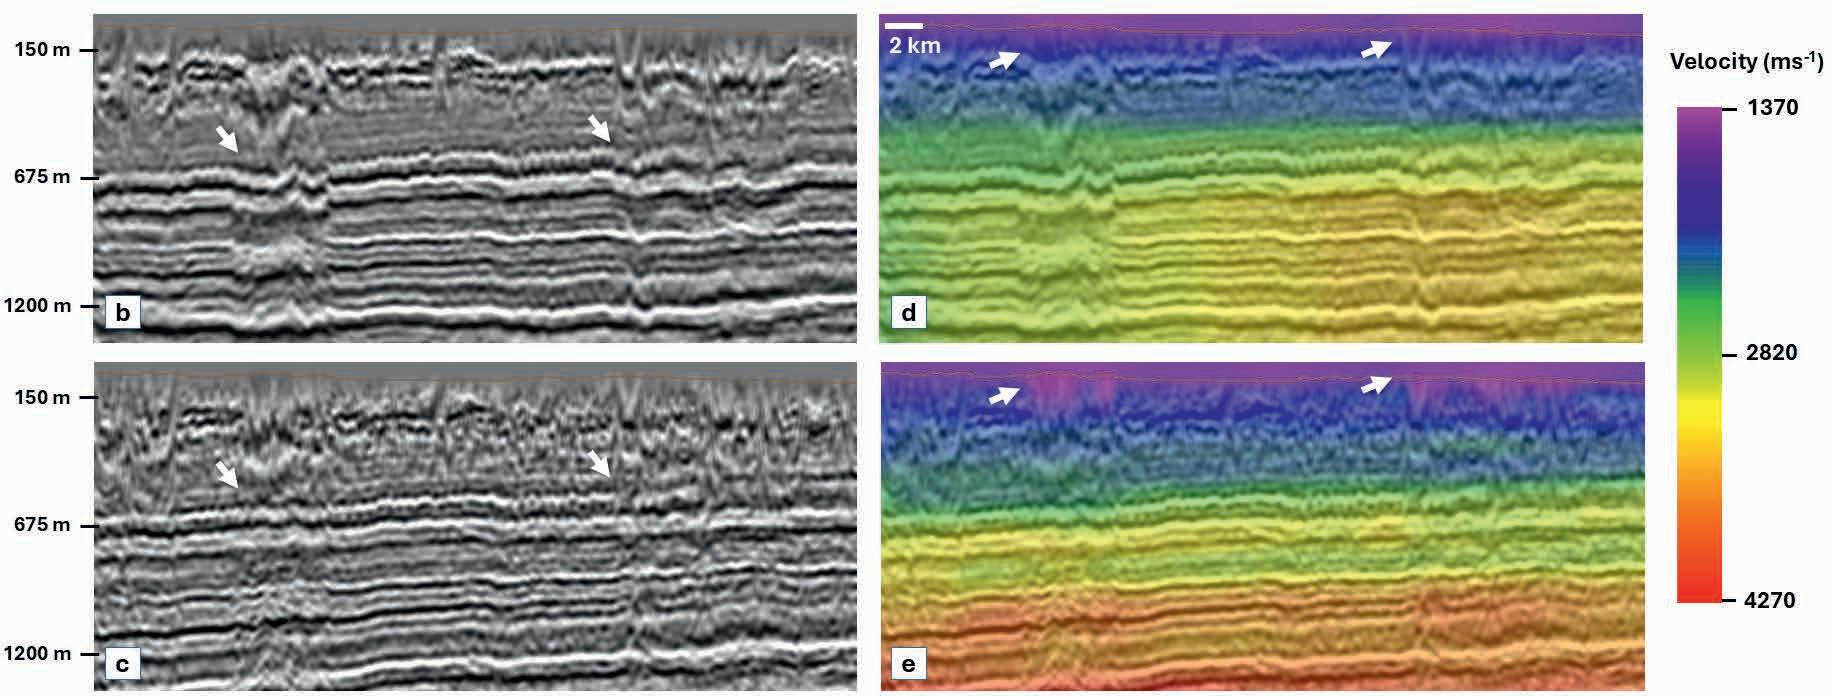
input data. Furthermore, we can clearly see a reduction in the residual statics post-FWI (Figure 5d), indicating that the FWI process was able to recover some of the mid- to short-wavelength corrections from the residual statics and transfer that to a velocity correction.
The next study area comes from the Delaware Basin (a sub-basin within the Permian Basin) in Texas, USA. The Delaware basin is characterised by complex near-surface geology with shallow thick interbedded halite and anhydrite, resulting in a high velocity layered system. These sharp velocity contrasts limit diving wave penetration, and therefore applicability of diving wave FWI to update deeper events. The very shallow Rustler formation appears to collapse in some areas due to irregular evaporite dissolution below and is subsequently filled by much slower Cenozoic deposits creating a complex zone with high lateral velocity variations. This zone is commonly referred to as the fill zone. Figure 6 shows a geological cross section of the study area and a map of the extent of the fill zone. Historically, it has been difficult to image below the fill zone, where deeper events are distorted by those shallow lateral velocity changes. The nominal shot and receiver spacing for the
data acquired in this study is 50 m, with source and receiver line spacing of 300 m, with a maximum offset of around 7000 m. The survey was acquired using Vibroseis sources exclusively, with a sweep that started at 2 Hz. However, as discussed earlier, the lowest usable frequency was only around 5 Hz.
We started the diving wave FWI using the optimal transport cost function. This allowed us to compute more robust travel time information for the misfit calculation and avoid cycle skipping so that we could update the low wavenumber background velocity model where low frequencies were deficient. Following this, we transitioned to utilising DMFWI to further refine the velocity model using the diving waves. A multi-scale approach was used in the DMFWI updates, and the frequencies were progressively increased to 12 Hz. Due to the limited penetration of diving waves into the halite and anhydrite layers, an additional tomography step was necessary. Subsequently, the model updating was continued using RFWI. The frequencies used for RFWI were progressively increased to 15 Hz.
We show the resulting Kirchhoff PSDM sections and corresponding velocity model at different stages in the FWI velocity model building process (Figure 7). The line shown cuts across
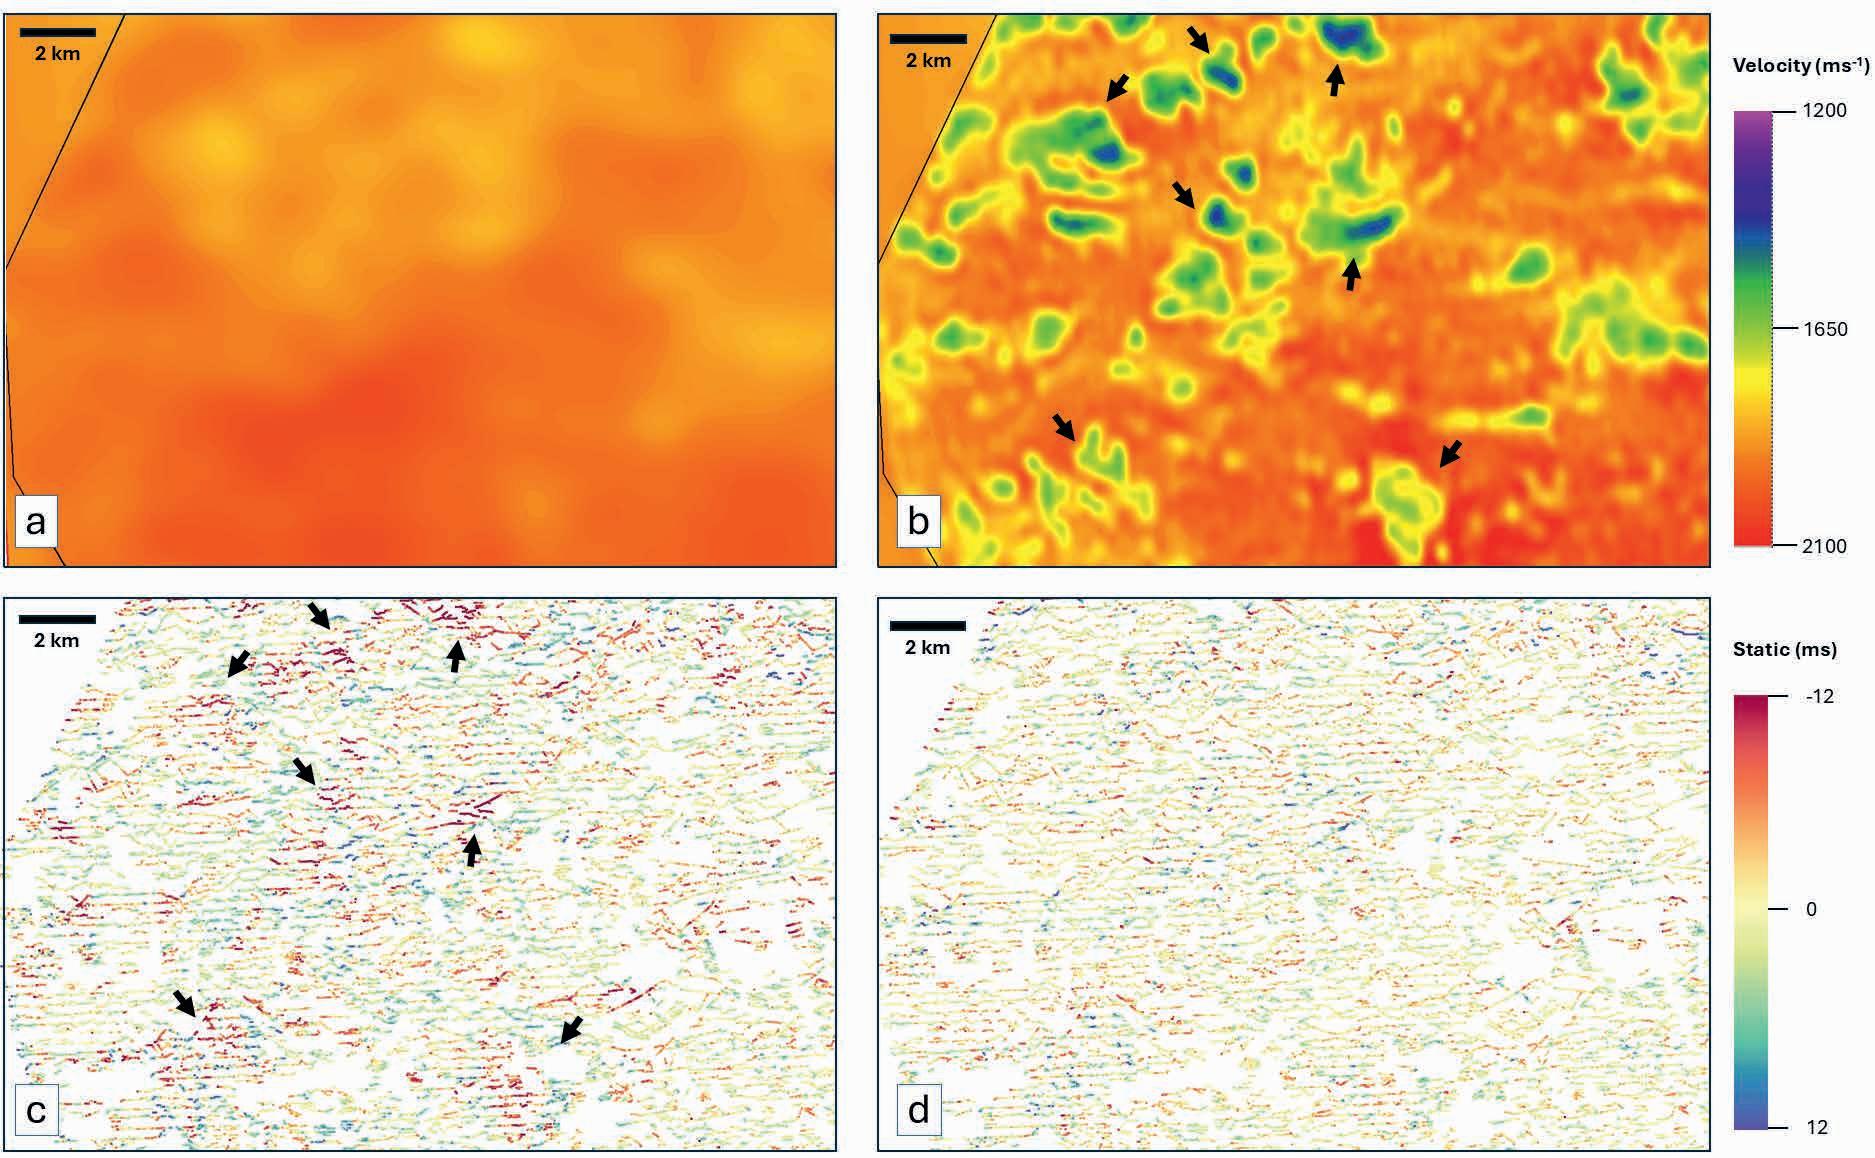
Depth slices at 150m a) initial velocity model; b) velocity model after diving wave FWI; c) residual statics map, based on refraction tomography, d) residual statics map, based on the velocity model from diving wave FWI. The arrows highlight areas where there is a correlation between the velocity anomalies captured in the FWI model and larger residual statics values.

Figure 6 a) Geological cross section of the study area in the Delaware Basin. The Rustler formation is shown in red; b) area map showing the extent of the fill zone (in blue). The black polygon shows the extent of the study area.


the fill zone (line A — A’ in Figure 6b). We can see that FWI progressively corrects for the extreme lateral velocity changes in this area, addressing the undulation present on the deeper events and improving their coherence. Residual statics were computed at different stages of the FWI velocity model updates and are compared in Figure 8. These comparisons show a progressive reduction in mid- to short- wavelength statics present in the residual statics at each stage of FWI. Suggesting that FWI recovered some of these static corrections and transferred them into a velocity correction at each stage.
The utilisation of FWI in these study areas presented several challenges that required careful consideration and strategic approaches. Our workflow was able to overcome these challenges, yielding velocity models that improve imaging quality. The successful application of our workflow to various onshore surveys, including challenging environments like the Delaware Basin, underscores its effectiveness.
We also show that it is possible to capture shorter wavelength corrections in onshore data using FWI, which are normally addressed by residual statics. This suggests that the approach of applying residual statics prior to FWI may not be the most effective strategy. Instead, allowing FWI to handle these corrections can lead to more accurate and detailed veloc-
ity models which might otherwise be obscured by the statics corrections.
References
Durussel, V., Bai, D., Ahmadi, A.B., Downie, S. and Mills, K. [2022]. The value of very low frequencies and far offsets for seismic data in the Permian Basin: Case study on a new dense survey from the Central Basin Platform: The Leading Edge, 41(1), 34-39.
Ellison, D. and Innanen K. [2016]. Improved resolution in depth imaging through reflection statics corrections derived from model-based moveout. CREWES Research Report, 28
Engquist, B., Froese, B.D. and Yang, Y. [2016]. Optimal transport for seismic full waveform inversion. Communications in Mathematical Sciences, 14, 2309-2330.
Lemaistre, L., Brunellière, J., Studer, F. and Rivera, C. [2018]. FWI on land seismic datasets with topography variations: Do we still need to pick first arrivals? 88th SEG Annual International Meeting, Expanded Abstracts, 1078–1082, Krishnasamy, T., Sheng, J., Florendo, R., Beck, J., Sierra, A., Murphy, S., Siebens, J. and Iwo-Brown, Y. [2023]. High-resolution near surface velocity model building across the Delaware basin Fill zone using FWI. 84th EAGE Annual Conference and Exhibition, Extended Abstracts.
Mao, J., Sheng, J. and Hilburn, G. [2019]. Phase only reflection full-waveform inversion for high resolution model update. 89th SEG Annual International Meeting, Expanded Abstracts, 1305–1309.
Mao J., Sheng, J., Huang, Y., Hao, F. and Liu, F. [2020]. Multi-channel dynamic matching full-waveform inversion. 90th SEG Annual International Meeting, Expanded Abstracts, 666-670.
Masclet, S., Bouquard, G. and Prigent, H. [2021]. Multi-wave and full-waveform inversion in southern Oman. 82nd EAGE Annual Conference and Exhibition, Extended Abstracts.
Mei, J. and Tong, Q. [2015]. A practical acoustic full waveform inversion workflow applied to a 3D land dynamite survey. 85th SEG Annual International Meeting, Expanded Abstracts, 1220-1224.
Sheng, J., Mao, J., Liu, F. and Hart, M. [2020]. A robust phase-only reflection full waveform inversion with multi-channel local correlation and dynamic minimum total-variation constraint. 82nd EAGE Annual Conference & Exhibition, Extended Abstracts.
Sheng, J., Reta-Tang, C., Liu, F., Vázquez Cantú, A. and Cabrales Vargas, A. [2022]. Full-waveform inversion and FWI imaging for land data. Second International Meeting for Applied Geoscience & Energy, 827-831.
Tang, Y., Gaines, D., Hefti, J., Every, Z., Neumann, E. and Pharis, R. [2021]. Land full-wavefield inversion for addressing complex near-surface challenges in the Delaware Basin. First International Meeting for Applied Geoscience and Energy, SEG/AAPG, Expanded Abstracts, 702-706.
Yang, Y., Engquist, B., Sun, J. and Hamfeldt, B. [2018]. Application of optimal transport and the quadratic Wasserstein metric to full-waveform inversion: Geophysics, 83(1), R43–R62.





Amine Ourabah1* explores the current challenges in-field land seismic processing is facing and examines how modern acquisition systems and data processing techniques can potentially enable real-time imaging directly at the point of data acquisition.
Edge computing is a distributed computing paradigm that brings data computation closer to the location where it is acquired. From enabling near-instantaneous diagnoses in medical imaging to driving real-time decisions in smart cities and autonomous vehicles, Edge computing has transformed many industries by reducing the time between data collection and decision-making, overcoming challenges related to analysis of large data volumes.
In the seismic industry, this concept more or less aligns with field seismic data processing, though the definitions of its deliverables have evolved over time, this concept was mainly constrained by the limitations of the computing hardware and the complexity of seismic processing. We also distinguish a difference between marine and land surveys in-field processing capabilities, while the former have steadily advanced their on-board processing, benefiting from a stable office environment and a relatively well-behaved dataset, land surveys have encountered greater variability in progress due to less suitable environments for computers and more processing-demanding data, limiting the ability to implement advanced processing in the field.
For a while, land seismic surveys reached a status quo where the expectation for processing in the field was limited to relatively simple tasks, varying from brute stacks, when data volume was high, to simple fast-tracks, when data volume was manageable. This approach appeared adequate for most conventional surveys.
The introduction of modern acquisition technologies, such as compact nodes, portable sources, simultaneous source shooting, and compressive sensing, has contributed to the adoption of high trace density, single-point source and receiver surveys. Consequently, the familiar look of the raw conventional data has changed, confronting the industry with a new generation of raw data that – although expected to deliver better seismic products – requires nevertheless some level of processing before it starts revealing interpretable images of the subsurface (Ourabah, 2024), making conventional quality control tools often not sufficient to deliver the level of confidence operators and other end users are familiar with. This has reignited the demand for fast imaging solutions, not only to expedite access to the final product, as was initially intended, but also to ensure the quality of the ongoing survey.
In this article, we will explore the current challenges in-field land seismic processing is facing and examine how modern acquisition systems and data processing techniques can potentially enable real-time imaging directly at the point of data acquisition.
Current in-field processing status quo challenged by modern high trace density surveys
The push for higher trace density in land seismic surveys seems to have slowed recently, even though the seismic community has widely adopted acquisition technologies that enable high trace density recording at lower costs, such as simultaneous source shooting and compact nodal systems. While the downturn in the seismic industry has undoubtedly contributed to this trend, the challenges of quality assurance and quality control (QA/QC) and processing for high trace density surveys can deter users who are more accustomed to conventional seismic data QA/QC and processing, even if this means missing out on the benefits of high trace density surveys, including higher quality images and seismic attributes (Ourabah et al, 2015).
Numerous examples of modern high trace density seismic surveys show that the processing sequence is greatly enhanced by these new acquisition designs, becoming less complex and more efficient (Ourabah et al 2014, Buriola et al, 2021), with a much more data-driven approach to the denoise stage which is the most time-consuming part of land processing. Other steps, such as refraction tomography, Surface Consistent Processing, and Migration, are also significantly improved by the redundancy of the information, yielding results typically expected from a lengthy processing sequence. However, this simplification of the processing sequence has limitations and still requires sufficient computing capability, which is usually only found in data processing centres (DPC) or cloud servers; thus, necessitating a data transfer solution, either by physical media or other remote transfer methods. High trace density surveys of ~100 million traces /km2 can produce tens of terabytes of receiver gathers and hundreds of terabytes of continuous records per 100 km2. This is a vast amount of data to push through even the most advanced broadband connections, let alone those available in remote locations. Shipping physical media containing a copy of the data
1 Stryde
* Corresponding author, E-mail: amine.ourabah@strydefurther.com DOI: 10.3997/1365-2397.fb2025006
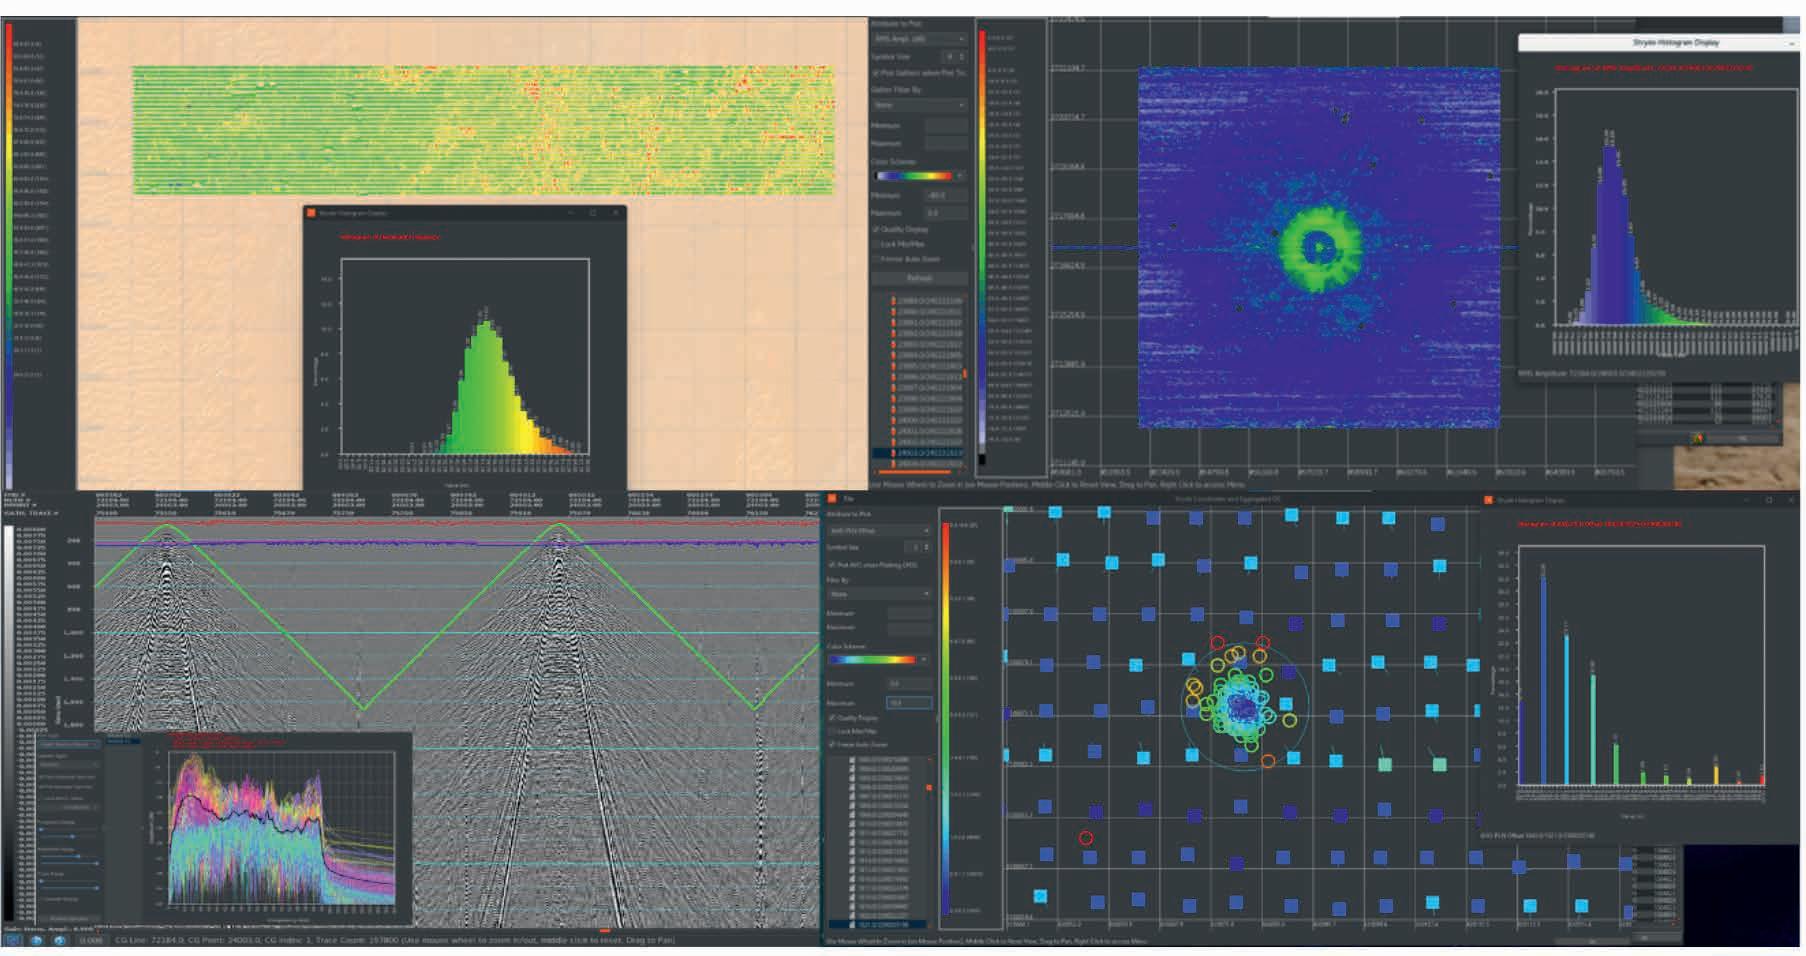
to the DPC is often the quickest way to get the data onto the processing desk but it requires logistic preparation, comes with certain data security risks, and can be limited when data export restrictions are in place. Regardless of the solution used, and in the best scenarios, it might take several days per batch before this data reaches the DPC, days that are added to the time allocated to data processing which in turn is added to the stressful waiting time of the QAQC reps in the field.
A minimum processing capability in the field is usually available to perform some traditional QAQC steps meant to provide reassurance about the quality of the data, such as visualisation of seismic headers, shot gathers or receiver gathers, refraction time overlap, and frequency analysis (Figure 1). However, in modern high-trace-density surveys, it’s not uncommon to have raw data that is unfit for this type of QAQC. For example, data acquired using heavily blended acquisition, containing high ambient noise level, strong backscattering, or a combination of any of the above, will require a minimum amount of processing to achieve a reliable subsurface image. This image can either be used to assess the success of the acquisition, provide informative feedback for the upcoming lines/swaths, or sometimes used to deliver interpretable products for urgent well planning. In these instances, an in-field processing environment where this processing can take place efficiently, is required.
Throughout the evolution of land seismic acquisition, various in-field processing solutions have emerged. These range from traditional desktop setups to new acquisition systems that can double as processing environments, each with unique benefits and limitations. We categorise these solutions into three groups:
The ‘Desktop’ solution: the most common in-field processing solution which comes in the shape of a high-end laptop or a desktop computer, often with boosted CPU/GPU hardware,
large RAM, and large and fast internal storage. Depending on the configuration, the size of the data to be processed, the efficiency of the processing software installed, and the IT prowess of the processing geophysicist, this option can provide insights into data quality that goes beyond the standard QAQC. For example, they are commonly used to run multiple stages of denoise and a pre or a post-stack migration on a relatively small volume of data, whether it involves the full survey or a subset of it.
The ‘Portable HPC’ solution: used in large seismic surveys where there is an urgent need to deliver a subsurface image for quick decision-making. This additional hardware, sometimes referred to as ‘HPC-on-the-Edge’, is usually pre-installed in a standard or purpose-built container that provides a protected environment for the expensive hardware it contains, including protection from dust, adequate cooling, stable power supply, …etc. This hardware is separate from the acquisition system but sits in close proximity and offers flexibility for processing data through sequences that are usually dedicated to processing centres. This solution reduces the turnaround time by bypassing the need for lengthy data transfer or additional copies of what is already a large volume of data. An example of such a system is the DUG Nomad system.
The ‘Edge-computing’ solution: in this option, the same hardware used to run the seismic acquisition and produce the raw seismic data is used as a processing environment. This setup is relatively new and is the result of the evolution of nodal systems that are geared towards very efficient seismic data collection. These systems require a powerful computing backbone to harvest and manage the very large volume of data recorded by hundreds of thousands of nodes (Dieulangard et al, 2022). For example, this capability is available on the STRYDE nodal system which provides a remotely accessible processing environment called Lens™ on the same hardware used to charge and harvest data from the nodes, consequently
scaling up or down according to the size of the system used on the survey. The computing time and data flow are intelligently managed to avoid interference with data harvesting, which often occurs in bursts, leaving computing power idle between harvesting cycles. Although this ‘processing on-the-edge’ is not fully automated yet, it has proven to be very efficient at delivering fast turnarounds of small to medium-sized projects, which is especially beneficial when operating in challenging environments or in countries with strict data export rules.
Aside from overcoming the challenges of the QAQC or fast turn around of modern high-trace density surveys, the availability of a processing-on-the edge solution can also impact more modest nodal surveys, especially when exceptional rapid turnaround is required. For example, during the first ever nodal seismic survey acquired in Ukraine in 2024, it was imperative to acquire, process and interpret the seismic data as fast as possible to reduce exposure to risk in a very uncertain geopolitical environment. Restrictions on data movement and the inability to deploy a land processing geophysicist in-situ was also not possible in this instance, so the use of STRYDE Lens™ allowed for remote access to the acquisition server to kick-off data processing as soon as the first shot was harvested. An evolving migrated cube was
subsequently produced during and after the end of the acquisition with images progressively reaching interpretable quality as soon as two weeks after the end of the survey (Figure 2). Although the operator continued processing the data through a more elaborate PSDM and AVO workflow, the Lens™ 3D volume already revealed Direct Hydrocarbon Indicators (DHI). This volume was used to prepare appraisal wells ahead of drilling, a task that typically takes up to eight weeks to complete. By the time the seismic analyst confirmed the target using the AVO products, the preparation was complete, and drilling began immediately. The whole process from seismic acquisition to drilling took about six months (Chris et al, 2024).
Seismic surveys in very remote or extreme environments are also scenarios where a processing-on-the-edge solution can be particularly useful, as transporting additional processing hardware and accessing skilled processors can be challenging in these environments. Additionally, producing a reassuring subsurface image in the field is particularly valuable in these hard-to-reach locations, especially if the survey design, equipment, or area is new. Figure 3 shows data examples from a STRYDE nodal system used in western Brazil. In this project, processing on-the-edge has allowed both the operator and the contractor to have confidence in the current acquisition parameters, providing interpretable subsurface images while the system is still in situ, even adapting the survey design according to processed pre-stack


3 left: STRYDE nodal acquisition system in the field (a remote location in the US), right: a pre-stack time migration image processed using STRYDE Lens™ produced within 48-hours of data harvesting. CCUS project in western Brazil (courtesy of Explor and UISA, 2024).
time migration images delivered less than 48 hours after data harvesting.
We note that the human intervention remains beneficial as it provides great flexibility to adapt processing flows to the current data requirements, as well as giving access to best-in-class processing expertise to work on the data anywhere around the world.
How can current in-field processing solutions handle modern high trace-density surveys?
Neither of the above options – in present days – can deliver, in the field and in a short time window, the ultimate depth migrated subsurface volume using the conventional DPC style of processing. However, it is possible for some of these platforms to produce fit-for-purpose products that can be surprisingly accurate in the context of high trace-density surveys. Using raw migration, for example, has proven to be a very promising route, where the sequence is stripped of the most cumbersome processing steps, leaving only migration with some pre-conditioning as the main tool in the process, an example of this approach is the TeraMig solution offered by Viridien (Cotton et al, 2016). Migration, in addition to being an imaging tool, is a very powerful denoise process when the spatial sampling of the input data is high enough. For example, migrating lightly processed raw data using wave equation-based migration, such as shot migration, can not only be a great tool to leverage the de-noise power of migration but can also avoid time consuming data resorting and intermediate pre-stack data copies (Nehaid et al, 2018). The output being a stacked image, becomes a ‘dynamic cube’ that evolves, and updates as more shot gathers (or receiver gathers) become available and are injected into the process. This evolving product provides near real-time feedback, helping teams to adjust acquisition parameters, modify the location of the following patch, or interpret critical data more quickly. Indeed, key pre-processing steps such as weathering statics, ground-roll attenuation, and deblending will certainly have an impact on the quality of this output. However, they can often be performed efficiently using a rapid process thanks to the fine spatial sampling of these surveys, or, can sometimes be by-passed if their impact is not deemed too detrimental to the purpose of the output. We also note that other more advanced migration algorithms like RTM could eventually take this concept further and bypass the de-blending stage, a lengthy and expensive process, by including the sources interference in the source propagation modelling (Zhang et al, 2015, 2024). Although these approaches still rely on pre-knowledge of the velocity field, they can bridge the gap between QAQC and imaging requirements for modern high-trace-density surveys.
Can ‘processing on-the-edge’ achieve real-time imaging?
All of the above products are not yet meant to replace the lengthy and complex processing sequences with multi-parameters model-building stages and accurate pre-stack attributes. However, current trends in processing are pushing towards revolutionising conventional approaches by inverting raw data directly to subsurface parameters using different flavours of Full Waveform Inversion (FWI) algorithms (Philips et al, 2024). Currently, all successful examples on land data still use a co-pilot conventional processing
sequence. This sequence prepares the setup for the full by-pass by FWI from raw data to seismic image which wouldn’t have worked otherwise. One would hope that this methodology will eventually give way to a ‘co-pilot free’ direct inversion of raw data, at which point the lengthy processing sequence will be replaced by few steps leading to a direct imaging solution limited only by, either a fast data transfer solution (if a DPC is used), or the computing capability in the field for an ‘imaging on-the-edge’solution.
In a proof-of-concept experiment published by Shin et al., 2024, this imaging-on-the-edge concept is pushed even closer to the nodes. By using the so-called ‘adapt-then-combine’ (ATC) technique, Full Waveform Inversion is performed on mobile nodes with limited computing power (such as Raspberry Pi devices used in the experiment), generating localised inversions to detect subsurface anomalies at each node’s location. While far from being a ready solution for large-scale seismic exploration - notably due to the reliance on network connections - this experiment still demonstrates the potential of merging modern imaging techniques, either partially or completely, with acquisition hardware.
Data reduction techniques are likely to play a key role in enabling this transition towards near real-time imaging on the acquisition system. Here again, edge computing is well suited to implementing data reduction on the fly while the raw data is being generated. For example, Digital Group Forming (DGF), can be applied during data harvesting (currently available on the STRYDE nodal system, for example) significantly reducing the amount of data going into the imaging process while increasing the S/N of both input and output, and retaining access to the full single sensor dataset for use in conventional processing at the DPC. Other conventional data reduction techniques, such as compression or decimation in time and space, could also be considered for this specific application. Other less conventional techniques such as compressive sensing – even if not used in the survey design – can enable optimised imaging with much-reduced input (Herrmann and Li, 2012).
A combination of some, or all of the above, can reduce the size of the input data by an order of magnitude or more, enabling a much more efficient use of the available hardware. In fact, most of the industries that succeeded in implementing edge computing to deliver an interpretable output, including medical imaging, have used data reduction techniques of some sort to achieve the current state of the art (Rancea et al, 2024). Observing the current trend in these industries, we can also see that the evolution of AI is impacting edge-computing considerably, not only because they have proven to beat conventional physics-based systems on speed and computing resources (when successful), but also because they can increase this efficiency even further when used with modern AI-optimised processors (AI accelerators). This could eventually dictate the type of hardware used in future generations of acquisition systems optimised for ‘processing on-the-edge’.
The evolution of in-field processing in modern land seismic surveys to an edge-computing solution represents a significant step towards achieving near real-time imaging, a goal that has long been pursued by the seismic industry. The new capability of
modern acquisition systems to provide ‘processing on-the-edge’, as demonstrated by the given examples from Ukraine and western Brazil, shows how such solutions can influence the whole value chain, from seismic design to decision-making and well drilling. While traditional processing methods remain important for producing the most detailed subsurface images and seismic attributes, processing on-the-edge addresses different challenges associated with modern high-trace-density seismic surveys, including an alternative way to QAQC the seismic acquisition as well as producing interim fit-for-purpose seismic products, faster than ever before.
By gradually replacing traditional processing flows with imaging approaches and leveraging data reduction techniques such as data compression, DGF, and compressive sensing, the industry is moving closer to achieving the vision of real-time imaging. As AI and computational technologies continue to evolve, the future of seismic surveying may see greater integration of imaging capabilities, similar to advancements achieved in medical imaging and comparable fields, such as Smart Cities, Autonomous Driving, and Industrial IoT (IIoT). This progress promises much faster scanning of the subsurface for the various industries that depend on it.
References
Buriola, F., Mills, K., Cooper, S., Hollingworth, S., Crosby, A. and Ourabah, A. [2021]. Ultra-high density land nodal seismic – Processing challenges and rewards. 82nd EAGE Annual Conference & Exhibition, Extended Abstracts, https://doi.org/10.3997/2214-4609.202112916.
Cotton, J.C, Beilles, M., Mahrooqi, S., Porter, J., Denis, M., Baris, S., Forgues, E. and Chauris, H. [2016]. Automated and Real-time Field PSTM - How to QC More Efficiently 10 Billion Traces Today and More Tomorrow. 78th EAGE Annual Conference and Exhibition, Extended Abstracts, https://doi.org/10.3997/2214-4609.201600983.
Dieulangard, D., Popham, M., Grant, C., O’Connell, K., Ourabah, A. Einchcomb, C. [2022]. Land Seismic Recording Systems in a Changing World — a 2021 Review. First Break, 40(1), 59-65, https:// doi.org/10.3997/1365-2397.fb2022004.
Herrmann, F.I. and Li, X. [2012]. Efficient least-squares imaging with sparsity promotion and compressive sensing. Geophysical Prospect-
ing, 60(4), Special Issue: Simultaneous Source Methods for Seismic Data, 696-712.
Nehaid, H., Ourabah, A., Cowell, J., Brooks, C., Stone, J., Dieulangard, D., Crosby, A., Naranjo, J., Mahgoub, M., Al Mesaabi, S, Ablyazina, D., Manning, E., Popham, M., Tough, K., Vasile, C., Quigley, J. and O’Connell, K. [2019]. Acquisition of an Ultra High Density 3d Seismic Survey Using New Nimble Nodes, Onshore Abu Dhabi. Proceedings of the Abu Dhabi International Petroleum Exhibition & Conference November 2019, SPE-197289-MS, https://doi.org/10.2118/197289-MS.
Ourabah, A. [2024]. Revisiting the Single Sensor vs Array Debate in the Light of New Nodal System Technology. First Break, 42(1), 71-77, https://doi.org/10.3997/1365-2397.fb2024006.
Ourabah, A., Bradley, J., Hance, T., Kowalczyk-Kedzierska, M., Grimshaw, M. and Murray, E. [2015]. Impact of Acquisition Geometry on AVO/AVOA Attributes Quality – A Decimation Study Onshore Jordan. 77th EAGE Annual Conference and Exhibition, Extended Abstracts, https://doi.org/10.3997/2214-4609.201413301.
Ourabah, A., Grimshaw, M., Keggin, J., Kowalczyk-Kedzierska, M., Stone, J., Murray, E., Cooper, S. and Shaw, L. [2014]. Acquiring and Imaging Ultra High Density Land Seismic Data – Practical Challenges and the Impact of Spatial Sampling. 76th EAGE Annual Conference and Exhibition, Extended Abstracts, https://doi.org/10.3997/2214-4609.20141111.
Phillips, M., McLeman, J., Avramovic, V., Rayment, T., Schmitt, S., Varner, M., Khalifeh, Y., Chahine, A. and Jersing, E. [2024]. Land seismic multi-parameter FWI imaging. Proceedings of IMAGE 2024
Rancea, A., Anghel, I. and Cioara, T. [2024]. Edge Computing in Healthcare: Innovations, Opportunities, and Challenges. Future Internet, 16, 329. https://doi.org/10.3390/fi16090329.
Rudling, C., Yevgenii, S., Iareshchenko, S., Renkas, Y., Rudnyk, B., Giersz, C., Twyford, I. and Ouacha, A. [2024]. Reducing uncertainty at pace with modern acquisition and processing at the Runovshyna salt dome: A Case Study, Onshore Ukraine. Proceedings of Petex 2024
Shin, B.-S., Patel, D., Wientgens, L., Shutin, D. and Dekorsy, A. [2024]. Multi-agent 3D seismic exploration using adapt-then-combine full waveform inversion in a hardware-in-the-loop system. IEEE International Conference on Acoustics, Speech, and Signal Processing. Zhang, Y., Duan, L. and Xie, Y. [2015]. A stable and practical implementation of least-squares reverse time migration. Geophysics, 80(1), V23-V31, 10.1190/GEO2013-0461.1.






Spencer L. Rowse1* and Bob Heath1 discuss the interaction between the vibrator mechanism and the surrounding media, the forces and energies generated during a sweep, re-examine the assumptions made in the ground force models and show that current source signature estimates are not an accurate representation of the propagating wavelet.
Abstract
Throughout the decades of its use, there has always been a requirement to obtain an accurate estimate of the propagating wave emitted by the vibrator mechanism. This is even more relevant in today’s recording environment of a low signal amplitude and high noise when employing a single source, single receiver, and ‘overlapping signals’ from simultaneous acquisition techniques. The ground force estimate (or its time derivative) is assumed by many to be a representation of the seismic wave (its source signature) that is transmitted into the surrounding medium. However, from published articles, many authors have questioned this assumption noting significant phase and amplitude differences between the ground force and the signal received at a remote sensor, especially at higher frequencies. Having an accurate source signature estimate at each location has significant ramifications beyond improving the quality of acquisition (and processing) that today is heavily reliant on ‘shooting blind’ into single channel nodes: it implies that the vibrator-earth model used is an accurate representation of the changing ground conditions at each shot-point whose properties can then be determined. In addition, an accurate vibrator-earth model may also lead to improvements in the design of vibrators for increased amplitude (greater signal) of the propagating wave. In this paper, we discuss the interaction between the vibrator mechanism and the surrounding media, the forces and energies generated during a sweep, re-examine the assumptions made in the ground force models and show that current source signature estimates are not an accurate representation of the propagating wavelet.
Introduction
In seismic acquisition, the aim of any survey has always been in acquiring the best data quality at the lowest cost using the latest acquisition techniques to obtain the highest S/N ratio of the recorded data. Over the decades, the definition of what is ‘best practice’ has changed. In the late 1980s, a high S/N ratio per shot location was the norm for both 2D and 3D, achieved by the use of source and receiver arrays and multiple sweeps (8-80Hz) at each location with relatively low fold. Today, with almost no limits on the number of recording channels that can be deployed, ‘best practice’ in acquisition is the use of a single sensor, single source and a single sweep (~2-120Hz) at each location, high fold, and some form of simultaneous recording using multiple sources
1 Private consultant
* Corresponding author, E-mail: slrowse@aol.com
DOI: 10.3997/1365-2397.fb2025007
and ‘overlapping’ sweeps. Unfortunately, the seismic data is often contaminated by various types of undesirable noise, requiring an accurate representation of the propagating wave emanating from the seismic source to separate the desired signal from noise.
For vibroseis acquisition (and processing), the aim of any survey is to record seismic reflection data with a ‘stable’ source signature, (i.e. a spatially-invariant wavelet) at each source location. Many view vibrators as being the perfect seismic source in terms of reliability, force output, selectable bandwidth, and accuracy in the control of the vibrator mechanism when reproducing the desired sweep signal (Pilot or Reference signal) forgetting that this is the result of over 50 years of research and development. Prior to the 1970s vibrator control, when compared to current controllers, was relatively crude with no standard method to control the vibrator mechanism. Force control, invented by Castanet in 1962, was first used to automatically control the output force of the vibrator mechanism by using a feedback system from the baseplate (BP) and reaction mass (RM) accelerometers to reduce the effects of ‘ground resonance’. This phenomenon, would occur at certain vibrator drive levels, ground conditions and sweep frequencies, causing a ‘decoupling’ (loss of contact) of the baseplate with the ground, restricting the maximum force that could be generated. It was also known that the phase of the RM and BP motions changes during a sweep from being ‘in-phase’ (00) at low frequencies and ~out of phase (140-1600) at high sweep frequencies, generating many spirited discussions (Sallas, Lerwill) in the technical literature as to which ‘motion’ of the vibrator mechanism best represented the P-wave signal generated by the sweep. Eventually, the de-facto ‘standard’ for vibrator control, and in use since 1985, became the weighted sum ground force (WSGF), where the ‘weighted’ sum of the RM and BP accelerations, is assumed to be the weighted sum exerted on the ground. The WSGF estimate ‘phase locked’ to the Pilot signal (also known as the Reference sweep) produces ‘a more consistent downhole wavelet than the other methods studied’ (Sallas, 1984). For an era of recording sweeps of 8-80Hz, a high S/N at each source location and limited processing power, WSGF was an acceptable representation of the propagating seismic signal to use in the correlation process.
Over the decades, the many articles written on either, vibroseis operation, the discrepancies between the ground force estimate and the actual signal transmitted, or methods to improve the ground
force estimate are an indication that the commonly accepted model of the vibrator-earth/ WSGF model is, at best outdated, incomplete, or wrong. Often this discrepancy is attributed to various causes such as ‘non-linear effects of the earth /near surface’, ‘distortion in the vibrator mechanism’ or ‘poor coupling’. With today’s requirements for higher resolution in acquisition surveys, the limitations of WSGF are becoming increasingly apparent.
Having an accurate estimate of the source signature can add significantly to the quality and resolution of a seismic survey by, amongst others, deterministic deconvolution at each shot-point, attenuation of multiples, improved full wave inversion techniques, and improved knowledge of the phase for more accurate stratigraphic interpretation. In addition, if known accurately, the changes in the source signature between each shot location should indicate changes in the earth properties. Unfortunately, some 50years after its introduction, there is still no definitive consensus on what energies or forces in the opposing motions of the RM and BP mechanism are an accurate representative of the source signature. In this paper, we examine some of the different vibrator-earth models and their limitations, the vibrator mechanism, and its interaction with the ground.
The majority of papers written on the subject of the vibrator ground force, source signature etc., often cite the classic papers of Miller & Pursy (1954, 1955) who proposed a theory on the field radiation patterns and energy distribution, generated from the mechanical vibrations of a plate ‘on the free surface of a semi-infinite, isotropic solid’ (1/2 space). While these papers probably aided in the development of the vibroseis method, this theoretical model of the earth is not a realistic representation of the various surface conditions commonly encountered during a seismic survey. Another often-cited paper is Sallas’s (1984) theory of the operation and control of a vibrator and the down going P-wave using masses, springs and dampers to represent both the vibrator mechanism and a mechanical impedance model for the ground (Figure 1). In this model, the force, Fa, act equally against both the rigid masses, RM and BP, with the sum of the RM and BP forces being in opposition to the ground force, Fg. From this paper, what became known as the WSGF estimate (equation A) became the de facto standard as an estimate for the ground force applied to the ground and a representation of the transmitted signal.
Almost since its introduction, discrepancies between the estimated WSGF and the transmitted seismic signal have been observed especially at higher frequencies. Many methods have been attempted to obtain a more accurate ground force estimate. These include: the use of load cells to measure the ‘true ground force’, (Shan et al), ‘stiffening’ the base plate to reduce harmonics (Wei)), improvements /additions to the vibrator earth model (Wei, Bouchard, 2010) to account for the ‘earth mass’ (captured mass) or the effects of ground ‘coupling’ or ‘filtering’. These methods have not gained much acceptance in the geophysical community with the ‘ground force’ or its derivative, still regarded by many as being the best representation of the transmitted seismic signal.
Although little mentioned in the geophysical literature, Lysmer (1966) developed a civil engineering model for a structure attached to a ‘footing’ (foundation) in firm contact with the ground represented by a mass, spring and damper. Unlike most ground force models, Lysmer treats the earth and any structure in firm contact with it, as a single combined damped harmonic oscillator (DHO). By measuring the earth properties, (mass density, shear modulus, Poisson’s ratio) and knowing the mass of the structure, (m), and the area of the footing in contact with the ground, expressions for the static spring constant (kg) and damper (dg) of the ground can be derived. From Lysmer’s studies, (and that of others) the vibrational response of structures such as multi-story buildings to either, earthquakes or the vibrations induced by operating machinery within the structure, can be accurately determined and has led to safer designs for new buildings and retrofitting of older structures in earthquake prone areas to withstand excessive movement. If we assume the vibrator and earth is a single system represented by a DHO, both the vibrator operation and the frequency response of the DHO model must be known in order to estimate the propagating seismic signal.
For most vibroseis operations, a seismic signal (or sweep) is generated by applying a sinusoidal hydraulic force via an actuator connected to two masses, a Baseplate (BP) and a Reaction mass (RM) mounted vertically above it. The vehicle weight (or ‘hold down’ force) pressing down on the BP keeps it in firm contact with the ground during the sweep and is a limit to the maximum force output of the vibrator. A controller generates an electronic representation of the desired sweep (the Reference or Pilot sweep) that is used as an input to a servomechanism in controlling the timing and flow rate of the high-pressure hydraulic


fluid into the actuator. Accelerometers mounted on the masses, as well as other sensors and mechanisms, are used to monitor and control the motions of the RM and BP during the sweep. Usually a ‘feedback’ system of force and phase control from the various sensors is used to ensure that the motions of the vibrator mechanism (the ground force) ‘mimic’ the desired electronic Pilot signal, that the BP is in firm contact with the ground, and the vibrator is operating within specified limits. Although the design of vibrators have changed significantly over the decades in size, force output and BP dimensions, a typical ‘heavy’ vibrator will weigh 60-80klb (28,000-36,000kg) with a BP of 2-4 tonnes and RM/BP ratio of between 2 and 4. Displayed in figure 2 are the Pilot (dashed black line), RM (red), and BP (blue) and WSGF (black) force estimates, of a 60,000lb vibrator for selected regions of a linear sweep (8-120Hz).
These traces display the same commonalities seen on many vibrators where, at low frequencies, a low BP force amplitude and high RM force, with WSGF ≈ RM are seen. As frequency increases, the BP force also increases until BP force ≈ RM force (at ~ 25-26Hz in example) with the WSGF trace being the vector sum of RM and BP force. An increasing phase separation between BP and RM accelerations can be observed with frequency being ~ ‘in-phase’ (travelling in same direction) at low frequencies and ‘stabilising’ at 140-160 degrees phase difference at high frequency (~opposite directions). The response of a 4.5Hz
downhole geophone to the sweep (green trace) located ~30m vertically below the source is also displayed. This response is a result of several processes: the generation of the input signal by the source mechanism, the ground’s interaction with this input signal in generating the seismic wave, the attenuation, refraction, reflection etc., of the propagating wave through the local geology, and the impulse response of the geophone and recording system. Of these processes, only the impulse response of the recording system is known accurately. However, the examination of all traces and their relationships to each other, can offer insights into the source operation and its interaction with the ground in the generation of the seismic signal.
In the chart, direct comparisons between the phase of the vibrator traces and the propagating signal cannot be easily made as the geophone response is velocity, the vibrator traces are in force units (acceleration), with an unknown travel time from surface to sensor. With this caveat, examination of the geophone traces in figure 2, show the phase of the geophone response ‘drifting’ with sweep frequency, exhibiting ~180 degrees phase shift between the low frequencies and ~28Hz, and also displaying large amplitude changes with respect to the constant WSGF signal. The cause of the geophone amplitude variations and phase drift is unknown being due to either a change in the source input signal or source interactions with the ground DHO. However, it demonstrates that the WSGF is not representative of the seismic signal.
Many in the geophysical industry are aware that a geophone consists of a ‘moving coil’ (mass, m) mounted vertically on a spring (k) and surrounded by a magnetic field whose output is proportional to ground velocity. Few know that a geophone is an example of a DHO, with a specific natural frequency and damping, whose response is proportional to the relative ‘motion’ between the moving coil and a magnetic field. As the theory underlying a geophone’s design is applicable to any DHO consisting of a mass, spring, and damper attached to a ‘support’, knowing the changing phase-amplitude relationships with frequency between the various components of a DHO is beneficial in the understanding the vibrator/ ground interactions.
In the vibroseis system, force is used as a measure of the vibrator’s performance. A more useful metric, in analysing the response of a DHO, is transmissibility, (Figure 3) defined (Rowse et al) as the ratio of the force observed at the support (Ft) compared to the input force (Fo) plotted against normalised frequency (ratio of forcing frequency, ω0 to natural frequency, ωn). Mathematically it can be shown that the force transmissibility ratio, Tf, is equivalent to displacement transmissibility, Ts, the ratio of the displacement observed at the mass (St) to the input displacement of the support (So) (see insert in chart). The curves displayed in figure 3 are plotted from the equation for Tf, representing the theoretical response of an ideal DHO system, for different values of damping under steady
state oscillations and constant input amplitude. The red curve in both charts of figure 3, represents a DHO with a damping value of 70% of critical (same as most geophones). Note that, unlike transmissibility, geophone specifications are usually displayed in graphs of relative motion of the ouput versus input.
In figure 3, as the input frequency increases and ‘passes through’ the system’s natural frequency, a ‘resonance effect’ is seen for all damping values with a peak amplitude when ω0 ≈ ω n indicating amplified motions in the mass and spring elements of the DHO due to less damping losses in the system. The phase difference between input and output also changes with frequency, being 0° when ω <0.1ω n , 90° at ωn for all values of damping, and → 180o with increasing frequency indicating that the motions of the mass and spring are now in opposition at higher frequencies. Note that above 1.414ωn, the transmissibility decreases with frequency with the ‘roll-off’ rate dependent on the damping. For any DHO, at low frequencies, there is little relative motion (displacement /acceleration) with ~ zero phase difference indicating that, for a geophone, the moving coil and magnetic field are moving in the same direction at ~ the same velocity, resulting in few lines of magnetic flux being ‘cut’.
From Newton, force is ‘that which causes, or tends to cause, acceleration in a body’. For a mass, m, the magnitude of the force
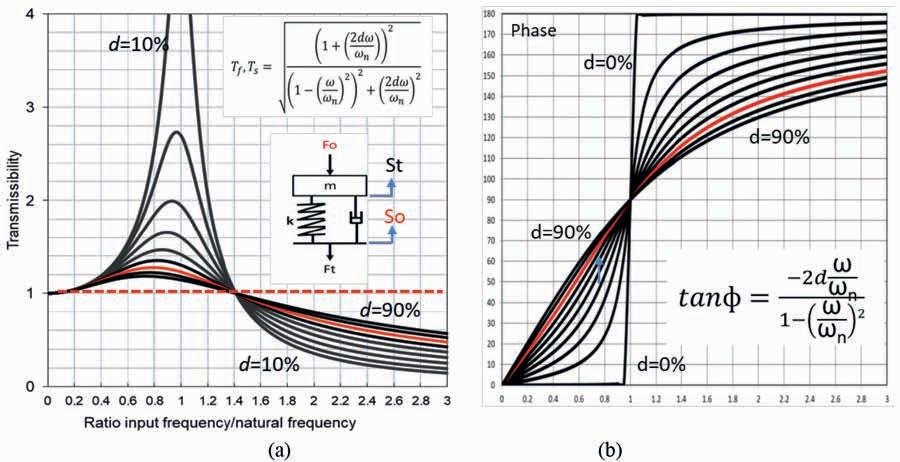

Figure 3 (a) Transmissibility and (b) Phase response of a DHO with frequency for various viscous damping values. Note: red curves in (a) and (b) are at 70% damping (typical for geophones).
Figure 4 a) representation of a Weight Drop impacting on elastic ground b) representation of vibrator mechanism and forces acting on elastic earth volume.

is defined as the rate of change of momentum, mdv/dt, or more usually, as F= ma. However, for a spring under compression or extension, the spring force is given as F= kx where k= spring rate and x= the distance compressed or extended of the spring. In addition, average force can be expressed in terms of energy and distance (force multiplied by distance= potential or kinetic energy) where energy is the ‘capacity of a body to do work’. From this, force can be viewed as a mechanism to transfer/ transform energy over a distance or from one body to another.
In a simple Weight Drop system (Figure 4a) a mass, M, raised a distance, s, against gravity, g, gains a potential energy of Mgs. On release, under the acceleration of gravity, potential energy of M is transferred into kinetic energy (1/2mv2). When mass, M, with velocity v, impacts the ground directly, or via a baseplate, it generates an impulsive ‘excitation’ force, Fo= Mdv/dt, that acts simultaneously to decelerate the mass and compress an interacting ground volume beneath the impacting mass. In this system, the generation of the seismic wavelet can only be associated with the single impacting mass and its interactions with the earth DHO; however, it is unknown whether it is the impact force or the energy transfer to the earth DHO that is the major factor in determining the amplitude and frequency of the seismic wave.
Unlike a Weight Drop, the excitation signal for a vibrator, is a frequency varying sinusoidal force (Fo=Asin(ωt)) and is generated by the vibrator’s hydraulic actuator (Figure 4(b)) acting against the RM and BP /DHO to cause opposing momentum changes in both bodies. This Drive force also supplies/transfers energy from the high-pressure hydraulic system into kinetic energy of the RM and potential/kinetic energies of the BP/earth DHO. As the phase of the RM and BP change with frequency, not all of the energy transferred is available for the generation of the seismic signal throughout the sweep.
To operate correctly, a ‘hold down force’ is applied to the vibrator’s BP that consists of the weight of the vehicle and several pressurised airbags that are connected to the BP and the frame of the vehicle. When the baseplate is lowered, the weight (Mvg) of the vibrator’s frame is acting as a force on the airbag/BP, keeping the BP in firm contact with the ground and compressing the ‘earth volume’ beneath the BP. The airbag and vehicle mass can
be considered as a DHO with mass (Mv) and spring (kv) designed to have a natural frequency of < 2Hz with low damping. As most vibrators operate above this natural frequency, the ‘hold down’ DHO has a low transmissibility that effectively isolates the vehicle from vibrations caused by the BP. In addition to the metric of force in describing the response of the vibrator-earth system to a time varying signal, the impedances and energies of the system should also be considered.
For a mechanical system, impedance (Z) is simply a body’s resistance to motion when subjected to a time varying (sinusoidal) force with energy loosely defined as ‘a body’s ability to do work’. Shown in figure 5a, are plots for the variation of impedances for an ideal DHO consisting of a rigid mass, ideal spring and viscous damping versus normalised frequency (ω0/ωn). Formulae, for mass, spring and damper impedance as well as total impedance for a DHO, are given, where (j=√-1).
Two arbitrarily chosen regions are highlighted on the chart, a blue ‘spring dominated’ region where (-jk/ω >> jωm) and a red ‘mass dominated’ region where -jk/ω<<jωm. At low frequencies, both transmissibility and phase increase with frequency, until, at the natural frequency, ω0=ωn, the transmissibility (and energy) of the system is close to its maximum value determined only by the damping in the system with phase difference being 900. Above ωn, transmissibility decreases with frequency until, in the ‘mass dominated region’, transmissibility is <1 with the phase →1800 , indicating that motions in the mass and spring elements are ~ in opposition to each other.
In the rigid body vibrator model, accelerometers, mounted on the RM and the BP, are used to estimate the Ground Force from the formula, F = ma. Modern vibrator control systems incorporate this GF estimate, together with other sensors, to monitor and control the motions of the two masses in mimicking the Pilot force, ensure the vibrator is operating within specified operating limits and keep the BP in firm contact with the earth throughout the sweep. By using a feedback system, the phase and amplitude of the Pilot and GF estimates are compared and adjustments made to the input of the actuator so that the GF is identical to the Pilot signal. Due to the ‘hold down force’, the BP is in firm contact with the ground, and any motions in the ground (caused
by the hydraulic actuator force or the transmissibility force of the ground DHO) will also generate motions in the BP. Although the BP accelerometer is physically mounted on a mass, any acceleration recorded by this sensor, is the response of the BP to the vector sum of the actuator (drive) force and the earth DHO transmissibility force.
Vibrator — Earth: A coupled interacting system?
Most discussions of the Ground Force estimate are in terms of the forces generated by the separate BP and RM motions. From Wei, (2010), at normal sweep frequencies, ‘the impacts of the hydraulic oil stiffness (Hs) and viscosity (Hv) are negligible due to incompressible hydraulic flow’. Due to this incompressible fluid, the components of the vibrator mechanism (BP and RM) are ‘coupled’ by the actuator and should be regarded as a single body of mass mRM+mBP that interacts with the ground. From this, the momentum change of the combined RM+BP system (and its associated energy) is a better representation of the excitation force applied to the ground. As the energy gained by (transferred to) the earth DHO is acquired during the application of the ‘ground force’, any model of the vibrator should consider the vibrator mechanism and earth DHO as an interacting system, whose properties change with frequency
Displayed in the graph of figure 6, are the impedance values of the components present in a vibrator/earth system plotted against frequency (0-100Hz). The RM and BP masses chosen (8klbs and 4klbs) are typical for a 60,000lb vibrator. In this example, the mass of the DHO system is the sum of RM+BP with the spring rate, k, chosen to give a natural frequency of 27.5Hz for the vibrator-earth DHO (indicated by dashed blue
line). For this example, an arbitrary damping value of d = 0.35 is shown.
Unlike the ideal DHO, depicted in figure 5, the hydraulic actuator applies equal and opposite momentum changes to both the RM and BP/DHO during a sweep. However, the magnitude of the ‘motions’ (displacement, acceleration, velocity) and energies gained by/ transferred to each body are not equal and is determined by the impedance ratio between the two bodies connected by the hydraulic actuator. The red trace, in figure 6, represents the variation of the RM impedance and the magenta trace, that of the total impedance of the BP, spring and damper. At low frequencies, the impedance of the ‘earth spring’, damper, and BP mass is much greater than the RM impedance (-jke/ω+jωmBP +d >> jωmRM) resulting in a greater percentage of available energy being converted into large displacements and kinetic energy of the RM and little into the energy of the BP and ‘stiff’ earth spring. Under these conditions, the hydraulic force generates a net energy gain in the RM, (RM kinetic energy minus energy of the BP/DHO) and is the energy available to ‘do work’ to the vibroseis/earth system causing compressions or expansions in the earth spring. At low frequencies, motions of the RM are approximately representative of the ‘driving force’ of the actuator system acting on the BP/ earth. This can be observed when a vibrator is operating on firm ground at low frequencies, where large displacements of the RM are seen with comparatively little motion in the BP/earth. With increasing frequency, the impedance ratio decreases, until, at ~38Hz (dashed red circle) the input force is acting against two impedances of equal magnitude (Figure 6(b)). Above this ‘transition frequency’, ZRM>ZBP-DHO , with the actuator force now transferring a greater percentage of available energy to the


BP-DHO compared to that of the RM. ‘Net energy’ is now associated with the BP/DHO motions whose polarity is now ~1400-1600 to that of the Pilot force.
In addition to changes in impedance throughout the sweep, there are changes in transmissibility. For the classical DHO theory, at low frequencies, Tf >1 and increases to a maximum at ~ ω0=ω n, then decreases until, above 1.414ωn, transmissibility is <1. Phase also changes during a sweep with the phase difference between input and output being 00 at low frequencies, 900 at ω0=ω n and→1800 at high frequencies. Phase control, by means of ‘feedback’ from the RM and BP signals, is used to vary the input to the actuator mechanism to compensate for any phase differences between the Pilot and Ground Force.
In WSGF estimations, surface measurements (the outputs from sensors, mounted on the vibrator mechanism) are used to estimate the ground force with the assumptions being that the RM and BP are rigid bodies and only the Pilot/Drive force is acting on the system. This is incorrect, as in addition to the Drive force, the transmissibility of the earth DHO also acts on the BP and, due to the incompressible hydraulic fluid in the actuator mechanism, on the RM. As the output of the BP and RM accelerometers are each responding to the vector sum of two forces, the Pilot and transmissibility, the force estimates in a rigid body model cannot be an accurate representation of the ‘Ground Force’ or source signature.
The propagating seismic signal is the output (transmissibility) of a coupled system consisting of the vibrator mechanism and an interacting volume of earth that acts as a DHO. The amplitude and phase of the transmissibility force will change with respect to the input signal and the earth-DHO properties. In order to obtain an accurate representation of the source signature, it is necessary to understand the complexities of the vibrator and its interaction with the ground, in particular, the transmissibility and phase response of the earth DHO at each location.
The current rigid mass model of WSGF was developed in an era of high S/N achieved by source and receiver arrays and multiple
synchronised sweeps of 8-80Hz at each source location. Modern acquisition systems rely heavily on single channel nodes ‘shooting blind’ (little or no ‘real time’ QC of the recorded data) and operating in a low signal-to-noise environment with sweep frequencies in the range ~2-128Hz. Clearly, an accurate representation of the seismic wavelet generated at each location could have significant ramifications in acquisition and processing. In addition, this knowledge may lead to improvements in the design of vibrators for increased amplitude and control of the propagating wave.
Mustafa AL-ALI et al. Vibrator attribute leading velocity estimation. The Leading Edge, May 2003.
D. Boucard and G. Ollivri, Developments in vibrator control, Geophysical Prospecting, 2010, 58, 33–40.
Castanet, A. etal USPTO 3208550, September 28, 1962, Vibrator controlling system.
Lerwill W, .E. 1981, The Amplitude and Phase Response of a Seismic Vibrator, Geophysical Prospecting 29, 503-528.
Miller, G.F. and Pursey, H. (1954) The Field and Radiation Impedance of Mechanical Radiators on the Free Surface of a Semi-Infinite Isotropic Solid. Proceedings of the Royal Society of London, 223, 521-541.
G. F. Miller and H. Pursey, (1955) On the Partition of Energy between Elastic Waves in a Semi-Infinite Solid. Proceedings of the Royal Society of London. Series A, Mathematical and Physical Sciences Vol. 233, No. 1192 (Dec. 6, 1955), pp. 55-69.
Lysmer & F. E. Richart Dynamic Response of Footing to Vertical loading. Proc. ASCE 1966 S.L Rowse & Bob Heath. WSGF – Time for a change part 1: Damped Harmonic Oscillators and the Vibrator/ Ground model, First Break, 38, January 2020.
SaIlas J. J. Seismic vibrator control and the downgoing P-wave. Geophysics 49(6), (JUNE 1984); P. 732-740.
Wei, et al, Harmonic distortion reduction on seismic vibrators, The Leading Edge, March 2010.
Wei, Z. Design of a P-wave seismic vibrator with advanced performance. GeoArabia, 13(2), 2008.


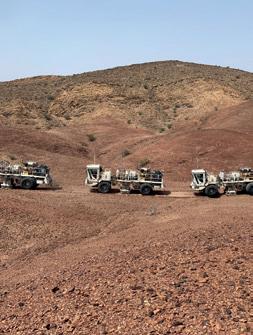





CALL FOR AB STRACTS IS OPEN

31ST EUROPEAN MEETING OF

ENVIRONMENTAL AND ENGINEERING GEOPHYSICS

UXO AND OBJECT DETECTION
1ST CONFERENCE ON INFRASTRUCTURE PLANNING, MONITORING AND BIM
4TH CONFERENCE ON

6TH CONFERENCE ON
1ST CONFERENCE ON 7-11 SEPTEMBER 2025 | NAPLES, ITALY
MINERAL EXPLORATION AND MINING
GEOHAZARDS ASSESSMENT AND RISK MITIGATION
JOIN THE CONVERSATION AT EAGE NSG 2025!
This year, we’re spotlighting new topics in Geohazards Assessment & Risk Mitigation and UXO & Object Detection. Showcase your cutting-edge research and help drive the next wave of innovation in geoscience.
Christof Stork1* proposes new approaches to address noise in acquisition and processing and highlights unique characteristics of this noise.
Introduction
In my experience with bad seismic data around the world, I see a consistent theme that they nearly all have strong Refraction Echoes (or Guided Waves), such as in Figure 1. This noise manifests itself as apparent echoes of the first arrival refractions. It exists often in foothills, karsted, and other areas. The noise can be 20-200x stronger than signal and is a major cause of ‘no signal zones’. I have seen this strong noise in Colombia, China, US Texas Delaware Basin, Romania, Algeria, Egypt, Oman, UAE, Saudi Arabia, Hungary, Azerbaijan, Kazakhstan, Bolivia, India, Pakistan, Netherlands, and probably more places. I estimate that this noise is a bigger problem than pure surface scattering, appropriately called speckle noise by Andrey Bakulin et al (2022).
Curiously, this noise is not well understood and not well documented! It shares significant properties with and
is occasionally called Guided Waves, such as in Figure 2, documented by Robertsson et al. (1996) and Roth et al (1998) and also mentioned by Sheriff & Geldart (1995). Robertsson, Roth, Holliger, Green, and the research group at ETH-Zurich deserve considerable credit for identifying and describing this energy — their work is still relevant today. But I propose that Refraction Echoes are more complex than pure Guided Waves and deserve further classification and understanding. Since this noise is not well understood, the industry does not have effective custom tools to address this noise type in acquisition and processing besides expensive acquisition and stacking. FK and linear radon are only partially effective at addressing this noise. A key concern is that when this noise is strong, there are also strong corrupted reflections that are not as obvious and cannot be removed by FK or linear radon.
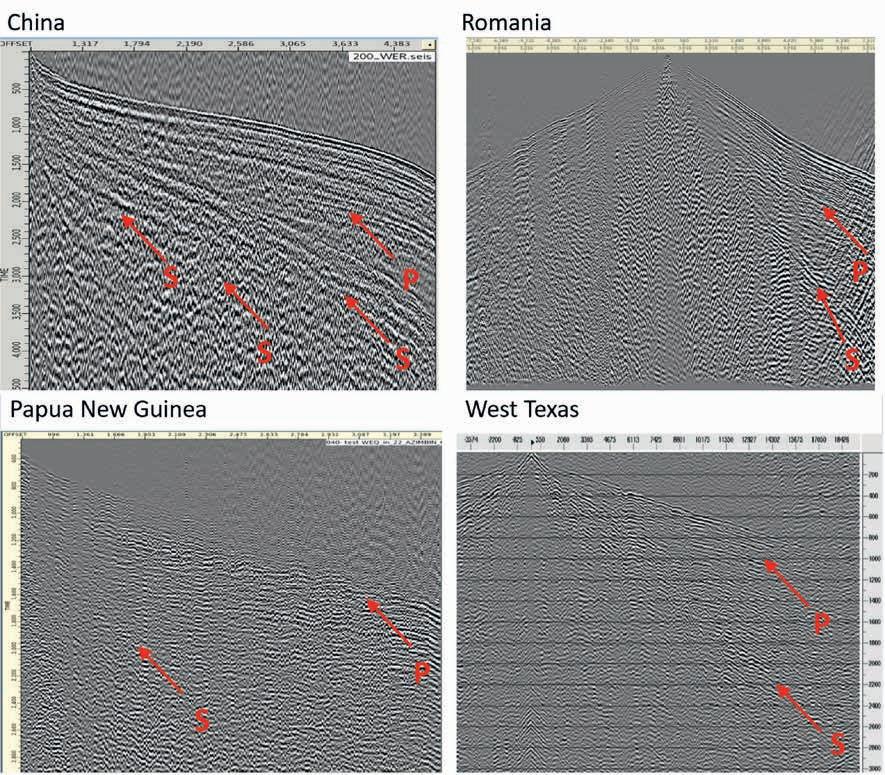
1 Land Seismic Noise Specialists
* Corresponding author, E-mail: christof@landnoise.com
DOI: 10.3997/1365-2397.fb2025008
Figure 1 Several sample shot gathers with Refraction Echoes from around the world. Nearly all the visible energy is P & S Refraction Multiples. There are very few academic surface waves since they have been leaked in the first 100-400 m into refraction and later reflection energy. The shear Refraction Multiples are strong. Very little energy (<4%) has propagated from the source down as primary P reflection signal. This problem noise exists around the world. Because of the irregularity of the noise, linear radon velocity filtering is only partially effective.
I explain the physics behind this noise. I propose some new approaches to address this noise in acquisition and processing and hope by highlighting the unique characteristics of this noise, the industry can put more focused effort into addressing this noise that causes big problems in many areas.
It is well documented that a vast amount (>95%) of surface and shallow seismic source energy goes into and is initially trapped in the very near surface, about less than 50 m. (We use the term ‘very near surface’ for the 0-50 m depth since some publications refer to the near surface as 0-500m or deeper.) Only a small amount of energy (<5%) transmits down as primary reflection energy. Key characteristics of the very near surface that aid this strong trapping of source energy are the often very low velocity (~100 m/sec for Vs, 500 m/sec for Vp) of the very near surface and the high Vp/Vs ratios (4-10).
For a 1D model, this trapped energy manifests itself as strong academic surface waves which we see in some data. If this strong
trapped energy remains as surface waves, we can filter out the surface waves with adequate inline sampling and filtering and they often arrive after the main reflections of interest.
However, the very near surface is often not 1D and is strongly heterogenous in several ways. This heterogeneity serves to leak and scatter the strong energy out of the very near surface. The leaked energy transmits deeper and becomes later refractions (hence refraction echoes) and later reflections. In effect, the leaked energy nearby becomes a virtual source that can be 10-20x stronger in total than the initial primary reflection energy from the source, as schematically demonstrated in Figure 3. The dramatic effect on the wavefield is shown in Figure 4. These secondary virtual sources can be 100-1000 msec after the primary source. With surface velocities of 100-200 m/sec, the energy only has to travel 100-200 m from the source before leaking and causing problems.
Crucially, this noise generation process also occurs at the receiver further reducing signal quality. An illuminating example of the strong impact of the very near surface on trapped energy
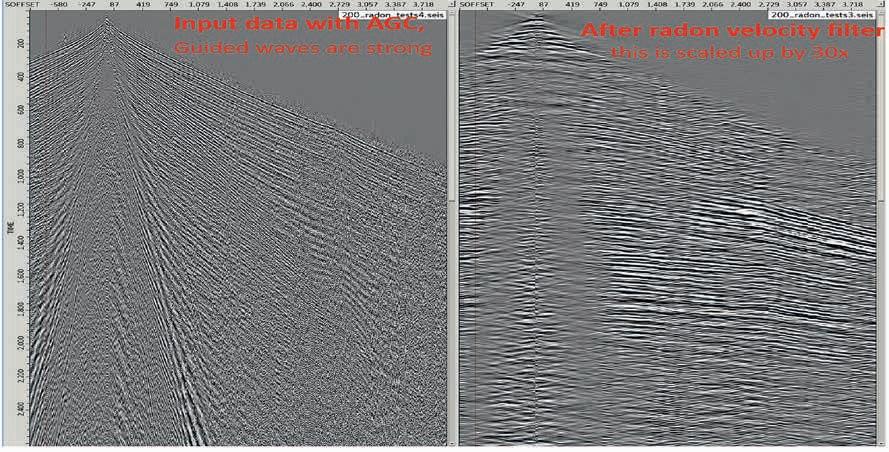

Figure 2 Example of clean Guided Waves on the left. The academic surface wave is still visible. The Guided Waves are strong but regular and well behaved. Linear Radon velocity filtering is very effective here and recovers reflection signal that is 30x weaker than the noise, as seen on the right. This is an example of how strong the Guided Waves can be. If the Guided Waves have some irregularity, the velocity filtering can be much less effective.
Figure 3 Demonstration of how energy initially trapped in the very near surface wave guide is scattered or leaked. These scatterers are later virtual sources and can be stronger than the primary P energy. Undulation in the surface layer boundaries can also cause scattering. The very near surface is often a very heterogenous place that causes significant surface wave leaking.
Figure 4 Comparison of a wavefield snapshot with a simple very near surface on the top and a complex very near surface on the bottom. This is a crosssection of a 2D wavefield simulation in depth. There are many strong virtual sources in the complex near surface in the bottom Figure which produces junk energy that becomes refraction echoes and later reflections.
near the receivers is in Figure 5. The heterogeneities in the very near surface cause the upcoming reflection and refraction energy to be converted to surface waves near the receiver, as shown in Figure 6. This noise is a multiplicative process where a 10-20x noise generation at the source and 10-20x noise generation at the receiver produces overall noise generation of 100-400x, producing bad land seismic reflection data.
In summary, this physics creates a basic problem: Little source energy becomes primary reflection energy with the rest being junk energy, and the strong remaining junk energy becomes fast, irregular refractions and reflections that are difficult to filter out. This suggests that the biggest opportunity to reduce this noise is to focus source energy downward and produce less trapped energy, and for receivers to focus on downward energy to be less sensitive to trapped very near surface energy.
A key part of the process is the leaking of the trapped energy by heterogeneities of the very near surface. Scattering from small heterogeneities and topography is one process of leaking, but another is likely undulations of the bottom of the low velocity surface wave guide. My tests show that even mild undulations at the bottom will cause much energy to leak.
The very near surface is a messy place with complex wave propagation
Overall, the wave propagation in the very near surface (<50m) is often a complex process with much multi-pathing and scattering. The very low velocities cause the very near surface to be a strong wave guided trapping much energy. (Wave guides are a multi-pathing phenomena). The characteristics of P and S vertical velocity profile play a big role in the wave guide characteristics. Much energy (>90%) is converted to shear energy.
This surface zone is often very heterogenous with many water, wind, vegetative, sedimentation, and human processes affecting it. It will have strong variations (>400%) in P, density, Q, and especially shear modulus. With the slow velocities, physical variations on a scale of 1m can have a significant effect on the wave propagation. Accurate modelling of a given shot record is difficult since the wave propagation has strong multi-pathing, very low velocities, and strong variations on a small scale. Small changes of the model can have a big unpredictable effect on the data. All these characteristics challenge current practices of FWI on a large scale needed for a typical reflection survey.
Not surprisingly, surface geology and the wave properties of the surface vary dramatically around the world. However, a common theme seems to be that of a low velocity surface trapping much energy which then leaks out to become later refractions and reflections.
Guided Waves and Refraction Multiples are similar in that they both involve leaking of strong surface wave energy into faster refractions. The difference is in how the leaking occurs. For Guided Waves, as proposed by Robertsson et al (1996), Roth et al (1998), Haddon (1984), Robertsson et al (2012), Sun et al (2021), the leaking is caused by a unique 1D model that allows the strong surface wave energy to leak into refractions, as shown in Figure 2. For Refraction Echoes, the leaking can be caused by a number of processes, including heterogeneities of different types, such as scattering and undulation of the layers, and including leaking of a 1D model. I surmise that the leaking caused by heterogeneities occurs more often and is a stronger process than the 1D leaking. The result on the data is similar, except for that leaking caused
Figure 5 Fascinating example showing the difference between the wavefield at the surface and at depth of only 9 m. In this case, the very near surface complications were limited to the top 9 m, but they often go deeper in other cases. This noise Figure is reproduced from the paper Peter Cary, et al (2016).
Figure 6 Wavefield snapshot from a deep source shows how a heterogeneous near surface traps much upgoing energy, which becomes strong noise in the form of local surface waves near the receiver. These local surface waves may only exist for 100400, before they get scattered again. This is a demonstration of how reciprocity creates similar noise at the receiver as at the source.
by heterogeneities may be stronger and has more irregularity and that cannot be effectively removed by FK or radon filtering. We seek filtering effectiveness of 10-20x, but often only achieve 2x. I propose that the term Refraction Echoes is more descriptive of what we see on the data and is less ambiguous since the term Guided Waves can refer to other types of wave guide energy.
When 95% of source energy is initially trapped in the very near surface, much of this energy is actually shear energy. Surface Waves are mostly a shear phenomenon. Indeed, where refraction multiples are a problem, we often see the shear refraction and subsequent echoes being stronger than the P refraction. The scattering serves to convert energy freely between S & P. The role of the shear energy is important because surface shear velocities are often as 100m/sec and the shear modulus can vary dramatically in the very near surface, producing more leaking and small scale scattering. The amount of shear energy recorded can serve as proxy for the amount of leaking surface wave effects on the data.
The physics of this very near surface noise generation presents several big challenges for FWI:
1. The noise generation is inherently a strong multi-scattering process where it is difficult to produce a close-enough starting model to satisfy the single-scattering theory of FWI. A small change in the model can have a big impact on the data waveforms.
2. The noise generation process is inherently elastic.
3. Key physical processes occur with very slow velocity (~100m/sec) which requires ultra dense gridding and dramat-
ically increases the costs. The cost of the wave propagation in FWI goes by the 4th power of the inverse of the velocity. If you decrease the velocity by 10x, the cost may go up by 10,000x. With the slow velocity, heterogeneities of ~1m play a role.
4. Successful FWI to resolve the small scale very near surface properties will probably require tight acquisition source and receiver spacing with a data density of ~1,000,000 traces per sq. km or greater with offsets <1000 m.
5. Modelling noise with the intent of subtracting it is inherently a difficult process since FWI is challenged to model data to the >95% accuracy we desire for effective subtraction.
Indeed, this is the experience of Yilmaz et al (2022). FWI is clearly an effective process for many purposes using signal. It can especially play a key role in resolving an accurate velocity model for PSDM. But often with land data, the biggest problem and opportunity is addressing the noise.
The basic problem with this noise is that little source energy becomes primary reflection energy with the rest being junk energy that turns into Refraction Multiples and can be difficult to filter out. The main way to address this noise is to reduce the amount of source energy that becomes near surface junk energy or to make the receivers less sensitive to the near surface junk energy. One clear way of doing this is by placing source and/ or receivers below the heterogeneous zone. This zone is usually 10-100m deep, which can create considerable expense to go beneath. Deep shot holes have been shown to significantly help in some places.
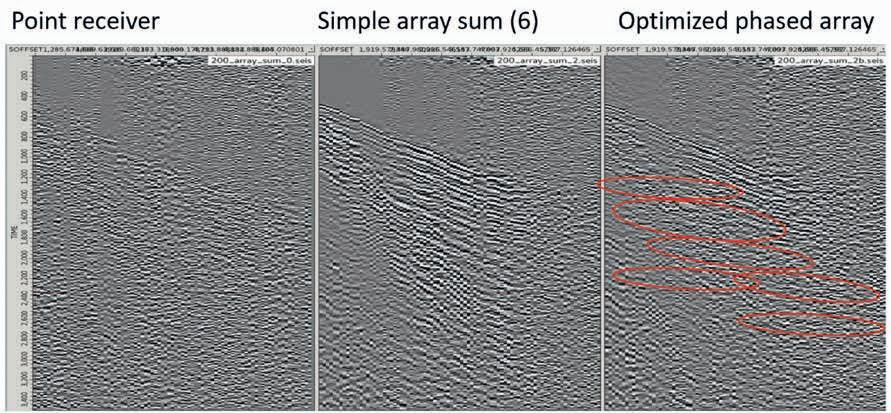
Figure 7 Demonstration of datuming point receivers of a digital virtual array through a complex very near surface to reduce the energy trapped in the surface layer and create a cleaner, stronger downgoing wavefield. If the very near surface is constant velocity, there would be nearly no corrections made to the individual receivers — the array datuming process would be similar to a straight sum. But, to correct for the significant distortion effects of the very near surface, wavelet correction methods must be applied to each point receiver in the array. The challenge is determining the optimal corrections of each receiver without knowing the velocity of the very near surface. This is done using specular optimisation concepts from astronomy to correct for atmospheric distortion.
Figure 8 Demonstration of the application of optimised phase arrays on a dense 1D receiver from the public data of the EBN program of the Netherlands. On the left is a point receiver gather showing much noise, including significant refraction echoes. The centre is a simple sum of six neighbouring receivers which had a spacing of 4 m. This is similar to what the old analogue arrays would produce. Centre signal quality is clearly better than in the left figure, but the refraction multiples are still strong since they have fast velocity. On the right is the gather after creating an optimal phase array with the same receivers. The refraction echoes are diminished, and reflections are more visible, marked by the red circles.

Figure 9 Two potential acquisition geometries using digital optimised phase array for the receivers. On the left is a conventional perpendicular inline geometry where optimised phase arrays can be created with sources and receivers when spacing is dense, nominally less than 30 m spacing. On the right is a more irregular geometry where the receiver arrays are 5x5 layout with distance between neighbouring receivers being 5-10 m. The exact shape of the digital array is not crucial except for the approximate size. In this case, these closely spaced receivers may more optimally attenuate the noise than larger more evenly distributed receivers. These digital arrays may be easier to lay out in the Foothills areas when access is restricted and bunching receivers are efficient. Arrays can also be created with the sources.
An interesting potential alternative is to use digital optimised phase arrays of linear geometry or 2D geometry of 3x3 or 5x5 or greater to datum down through the heterogeneous zone. The virtual datuming reduces the amount of junk energy that turns into Refraction Echoes and increases the primary reflection energy. The challenge with this approach is that the datuming requires complex phase corrections to correct for the heterogeneities of the very near surface, schematically shown in Figure 7. If the very near surface is constant velocity, then the datuming would be simple. But of course, we only need to use the digital optimised phase arrays when the very near surface is heterogeneous. Computing the proper phase corrections for each point receiver in the array is crucial for the arrays to work well. This is a complex computation near the beginning of the processing flow. Understanding the physics of the noise generation points to the optimisation process, which is similar to specular optimisation concepts from astronomy to correct for atmospheric distortion. An example of the process on a receiver gather is shown in Figure 8.
The phase arrays can be formed with dense inline sources or receivers or with 2D arrays as shown in Figure 9. The number of elements in the arrays, the spacing of the elements, and the use of 1D or 2D arrays is dependent on the noise characteristics, the improvement desired, the economics, and the character of the very near surface. In our limited experience, we find a 3x3 or 5x5 array with spacing of 5-10 m between elements to be often effective. We think more investigation can be done here.
The strong noise of Refraction Echoes or Guided Waves are a complicated very near surface process that disrupts much land seismic data, is difficult to remove, causes considerable expense in increased acquisition, and can cause poor images. The basic problem is that most source energy is trapped in the very near surface but is leaked out to become junk energy of various forms, notably later refractions and reflections that are difficult to filter out. Conversely, the very near surface causes upgoing energy to be trapped which creates strong noise at the receivers. For various reasons, FWI is unlikely to solve this noise problem in the immediate future. We think the industry would benefit from more
creative approaches to address this noise to reduce the amount of source energy trapped in the near surface or to reduce the sensitivity of the receivers to upgoing trapped energy.
Bakulin, A., Neklyudov, D. and Silvestrov, I. [2022]. Seismic speckle as multiplicative noise explaining land reflections distorted by near-surface scattering. SEG Technical Program Expanded Abstracts, 2601-2605, https://doi.org/10.1190/image2022-3735790.1
Cary, P., Alvarez, H., Vermeulen, P., Li, G. and James, G. [2016]. Using buried receivers for multicomponent, time-lapse heavy oil imaging. SEG Technical Program Expanded Abstracts, 11-15, https://doi. org/10.1190/segam2016-13883663.1
Haddon, R.A.W. [1984]. Computation of synthetic seismograms in layered earth models using leaking modes. Bull. seism Soc. Am., 74, 1225–1248, https://doi.org/10.1785/BSSA0740041225
Roth, M., Holliger, K. and Green, A.G. [1998]. Guided waves in near-surface seismic surveys. Geophysical Research Letters, 25(7), 1071-1074, https://doi.org/10.1029/98GL00549
Roth, M. and Holliger, K. [1999]. Inversion of source-generated noise in high resolution seismic data. The Leading Edge, 18, 1402-1406, https://doi.org/10.1190/1.1438230
Robertsson, J.O.A, Blanch, J.O., Nihei, K. and Tromp, J. [2012]. Numerical Modeling of Seismic Wave Propagation: Gridded Twoway Wave-equation Methods. Society of Exploration Geophysicists, https://doi.org/10.1190/1.9781560803089
Robertsson, J.O.A., Holliger, K., Green, A.G., Pugin, A. and De Iaco, R. [1996]. Effects of near-surface waveguides on shallow high-resolution seismic refraction and reflection data. Geophysical Research Letters, 23(5), 495–498, https://doi.org/10.1029/96GL00384
Sheriff, R.E. and Geldart, L. P. [1995]. Exploration Seismology. Cambridge University Press, https://doi.org/10.1017/CBO9781139168359
Sun, C., Wang, Z., Wu, D., Cai, R. and Wu, H. [2021]. A unified description of surface waves and guided waves with relative amplitude dispersion maps. Geophysical Journal International, 227(3), 14801495, https://doi.org/10.1093/gji/ggab284
Yilmaz, Ö., Gao, K., Delic, M., Xia, J., Huang, L., Jodeiri, H. and Pugin, A. [2022]. A reality check on full-wave inversion applied to land seismic data for near-surface modeling. The Leading Edge, 41, 40–46, https://doi.org/10.1190/tle41010040.1




Engage with industry experts and researchers in a collaborative environment, exploring cutting-edge advancements shaping the future of near-surface geoscience and engineering. Register now to secure your spot at this premier event in scenic city of Xi'an, China!


Bill Goodway1*, Andrea Crook 2*, Raul Cova1, Mostafa Naghizadeh2, Michael Hons2, Maximo Rodriguez3, Cameron Crook 2 and Wendell Pardasie1 present a case study of AVO and Inversion as a tool to assess the impact of sparse cost-efficient environmentally responsible land 3D survey designs on AVO amplitude fidelity.
In the previous paper (Part 1 companion article in First Break September 2024), we compared cross-spread to parallel geometries and presented how Fresnel Zone sampling can provide an alternative to conventional sampling based on the Nyquist limit. Decimation examples from the 1990s in part 1 show that the crossspread deficiency in amplitude fidelity-continuity, S/N, and aliased scattered noise interference are due to the lack of ‘stack array’ in the standard orthogonal 3D design concept. Indeed, all practical and cost-effective 3D designs are subsets of the ideal full-stack array, which we view as sampling according to Nyquist in all four spatial dimensions (S(x), S(y), R(x), and R(y)). Orthogonal land surveys are designed with tight sampling in only two of the four spatial dimensions. For example, the source station interval, S(x), is Nyquist sampled, but the source line interval, S(y), is not. The same applies to receivers where the receiver station interval, R(y), is Nyquist-sampled but the line interval, R(x), is not.
A perceived advantage of orthogonal cross-spread designs is that a complete set of single-fold common offset vector gathers can be fashioned from orthogonal geometries with no empty bins (Cary, 1999; Vermeer, 2000). Interpolation (either pre-stack or post-stack) was thus not applied to the 3D orthogonal crossspread geometries when they were initially adopted. In parallel geometries, some crossline bins are necessarily empty and require interpolation to reconstruct an adequate dataset for imaging.
Interpolation was initially rejected as being unable to reconstruct the wavefield beyond the strict Nyquist sampling limit in any given dimension (Vermeer, 1994, 1995). However, interpolation development continued, and now the interpolation of orthogonal geometries has become commonplace. As a result, since the early to mid 2000s, 5D interpolation and regularisation algorithms (Sacchi and Liu, 2004; Trad, 2005; Trad, 2009; Naghizadeh, 2010; Vassallo et al, 2010; Naghizadeh and Sacchi, 2013; Naghizadeh, 2015; Jiang et al, 2020; Pawalec and Sava, 2024) have been developed to overcome this coarse shot/receiver
1 Qeye Labs | 2 OptiSeis Solutions Ltd. | 3 MEG Resources
line cross-spread violation of the full 3D ‘stack array’ sampling requirement. Practical results in industry have demonstrated the utility of interpolation in most scenarios, making it a common step in most processing flows and eliminating that objection to use of the same interpolation in parallel geometries.
We propose AVO fidelity as a sensitive measure of successful interpolation. Actual quantifiable AVO fidelity and pre-stack imaging from the un-interpolated fully sampled ‘stack array’ dataset, compared to various 5D interpolated standard crossspread and parallel geometries, remains untested in practice with a few exceptions (Goodway and Ragan, 1996, Duncan et al, 2014, Ourabah et al, 2015). This is in part because very few examples of fully sampled real datasets exist in the world. As in Part 1 (Goodway et al., 2024), AVO fidelity can be simulated by decimating a fully sampled dataset into various orthogonal cross-spread and parallel geometries, and then processing each geometry through identical 5D interpolation flows.
Results from prior 3D geometry decimation tests (e.g. Duncan et al., 2014) show that often 5D interpolation is unable to recover the imaging and AVO fidelity of the fully sampled, best 3D dataset stack-array’s un-interpolated volume. The evidence suggests orthogonal cross-spread geometry footprint contamination from high wavenumber surface noise and interbed multiple interference that contaminates the signal, despite the application of 5D interpolation. As a result of these decimation tests, most land 3D orthogonal cross-spread geometries are now designed with reduced line intervals, often on the order of just two to four times the station interval (Duncan et al., 2014; Ourabah et al., 2015; Crook, 2022; Vermeulen et al., 2022; Naghizadeh et al., 2023).
Ideally, new 3D seismic surveys would be acquired with continuous grids of source and receiver stations (full grid geometry), and several advances in equipment miniaturisation (Crook et al., 2021, 2023) and acquisition methods (Crook, 2018, 2019) are enabling new 3D surveys to approach a fully sampled dataset. However, full grids of source and/or receiver stations face cost
* Corresponding author, E-mail: bg@qeye-labs.com, andrea.crook@optiseis.com DOI: 10.3997/1365-2397.fb2025009
limitations along with other challenges in areas with surface constraints. For example, in forested areas, high density orthogonal 3D surveys (with station to line ratios of 2-to-4:1) may result in the clearing of trees from 10% to 25% of the total program area (Larson et al., 2020) for safe access along the seismic lines. The resulting interconnected, orthogonal seismic cutlines increase anthropogenic footprint, which can negatively affect sensitive species and habitats. Parallel geometries, however, have the potential to significantly reduce the land footprint associated with seismic acquisition with some methods, such as EcoSeis™ achieving up to a 50% reduction in seismic cut lines (Crook, 2022; Naghizadeh et al., 2023).
Given pressure to optimise for cost and land impacts, and that interpolation can and should be used to improve inadequate spatial distributions, the primary questions are:
• Is Fresnel Zone Binning in practice a predictive metric of successful interpolation as proposed in Part 1?
• Which geometries can best produce a successful interpolation of the stack array for the lowest cost and impact?
Although orthogonal geometries benefit from 5D interpolation during processing, parallel geometries require 5D interpolation to infill empty bins. Despite the near ubiquitous use of pre-stack 5D interpolation in land 3D since the early-to-mid 2000s (Sacchi and Liu 2004; Trad, 2009; Naghizadeh, 2012; Naghizadeh and Sacchi 2013; Naghizadeh 2015), some authors still reject the ability of interpolation to successfully de-alias coarse sampling due to strict adherence to Nyquist theory (Vermeer, 2022). It should be noted that development of 5D interpolation and regularisation algorithms were not specifically intended for parallel geometries but were rather developed to overcome the violation of both the strict Nyquist aliasing limit and the full 3D ‘stack array’ sampling imposed by the coarse shot and receiver lines in cross-spread geometries.
Notable advances in interpolation included Spitz (1991) and Claerbout (1998) who showed that the spatial Nyquist limit when viewed as a wavenumber bandwidth can be overcome, i.e. de-aliased, by assuming that the un-aliased, low temporal frequencies share the same linear velocity or plane as the aliased, higher temporal frequencies. In addition, this spatial bandwidth need not be contiguous, i.e. the wavefield may contain a few planes with wavenumbers both below and well above the Nyquist limit as long as the sum of these wavenumbers did not exceed Nyquist. Both authors concluded that the assumption of a smoothly varying linear model for the wavefield (or a plane wave decomposition in a limit-
ing sense), permits a reasonable reconstruction of the pre-migrated wavefield at finer spatial sampling, by using FX spatial prediction.
Despite these exceptions, the discussion for land 3D sampling theory continues to be driven by the Nyquist limit as formulated by Shannon’s (1949) sinc interpolation. This theorem states that a wavefield P(y) can be exactly reconstructed by uniformly spaced samples when the sample rate is equal to or smaller than the Nyquist rate, which is twice the spatial bandwidth of the wavefield, through Shannon’s 1949 interpolation formula (equation 1).
(1)
This applies to a 1D signal where there is no information available from other adjacent measurements, which is not applicable to the 3D seismic problem with a sampling distribution in four spatial dimensions. Satisfying the Nyquist-Shannon criterion in one or two spatial dimensions does not provide any clarity on adequate sampling in the remaining dimensions. As a result, a criterion related to the full spatial distribution is needed to establish if the wavefield has been correctly sampled.
What has rarely appeared in the land 3D debate is the concept of Seismic Wavefield Gradiometry to accurately reconstruct both the aliased signal and noise wavefields beyond Nyquist by factors of 2 to 6 times according to the multichannel signal sampling theorem of Linden (1959). This sampling theorem of Linden is a Taylor series generalisation of the 1st order truncated Shannon/ Nyquist formula and shows how to accurately reconstruct the wavefield’s aliased wavenumbers by simultaneously exploiting point sampling and its various higher order derivatives or gradients using sinc interpolation as a Taylor series expansion shown in equation 2 for half Nyquist sampling reconstruction.
(2)
The sampling comb of the sinc functions proposed in Part 1 can be representative of the multi-dimensionality of a 3D seismic dataset, as will be shown below. Applying the 1D scenario envisaged in equation 1 is analogous to applying a one-term NMO to seismic signals, which is far too simple a model to be representative of the actual data.


A new technology category of wavefield recovery and imaging through Seismic Wavefield Gradiometry was introduced by WGECO termed ‘IsoMetrix’ to overcome coarse crossline marine data sampling, by enabling the accurate reconstruction of the seismic wavefield at fine spatial sample intervals (thus far only possible in the inline direction). The result is a reliable, continuous measure of the full seismic wavefield sampled at a finer (e.g. 12.5 m x 12.5-m) point-receiver surface grid (Vassallo et al., 2010).
The same application of the Linden multichannel signal sampling theorem that replaces Nyquist, was successfully field tested on a land parallel geometry MegaBin 3D by Apache (Goodway et al., 2013). The results in Figure 1, show a decimated shot record sampled at 80 m (Figure 1a) with aliased ground roll interpolated down to 10 m (Figure 1b) thorough a Fourier matching pursuit algorithm that recovers the aliased ground roll beyond the input 80 m Nyquist sample rate.
However, despite these clear examples of both theoretical and practical implementation of 5D reconstruction beyond Nyquist, the question of why interpolation can overcome the stringent two samples per wavelength Nyquist restriction at all offsets, was not adequately justified until the concept of ‘Fresnel Zone Binning’ (FZB) was introduced by Monk (2009, 2010, 2020). With Fresnel Zone Binning, an adequate three samples per Fresnel Zone sample rate replaces and relaxes the strict Nyquist limit of two samples per wavelength for interpolation (see Part 1 of this paper, First Break September 2024 for a detailed explanation).
Figure 2 a) Full grid with 20x20 m source and receiver distribution (from a real seismic survey), Orthogonal surveys with b) 40x40, c) 60x60, and d) 80x80 m line intervals, respectively. e) MegaBin with 40m line interval, f) EcoSeis™ with 60 and g) 80 m line intervals, respectively.
Note that we are not proposing to utilise this adjustment to design sparser surveys. Rather, we propose using the Fresnel zone binning criteria to clearly define the limits on how far apart 3D seismic lines can be, whether orthogonal or parallel, before AVO fidelity and pre-stack imaging begin to break down. The following section illustrates how even with 5D interpolation applied, as the station-to-line interval increases from only 2:1 to 4:1 for an orthogonal geometry, the AVO and inversion results begin to fail, even though cross-spread geometry is maintained.
Initiated and motivated by the EcoSeis™ design study first published by Crook (2022), and in more detail by Naghizadeh et al., (2023), the following assessment presents the results from various geometry decimations of a fully sampled dataset. The purpose of developing these EcoSeis™ parallel geometries was to advance land 3D design towards environmental and ecologically responsible seismic surveys focused on maximising 5D interpolated pre-stack migration resolution and preserving AVO fidelity, while minimising the surface footprint.
In this study, a fully sampled dataset (full grid) with 20 m stations and 20 m lines (Figure 2a) was decimated into three orthogonal (Figures 2b-d) and three parallel (Figures 2e-g) geometries. Then each individual decimation was 5D interpolated and PSTM-migrated, all with the same optimised velocity field. The decimations include an expanding line spacing for the orthogonal cross-spread geometries (40 m, 60 m, and 80 m) all with the same
20 m station intervals, as well as a true MegaBin 3D (designed according to the patent, Goodway and Ragan, 1996) with a 20 m receiver station interval and both a 40 m source station and line interval (Figure 2e), and two novel EcoSeis™ geometries, one with 20 m station intervals and 60 m line intervals (Figure 2f) and one with slanted 20 m station intervals and 80 m line intervals. Although it was not possible to maintain equivalent trace density between all the designs, the geometries with 60 m line intervals all have the same trace density, as do both the 80 m geometries, albeit at a lower trace density than the 60 m geometries. The 40 m MegaBin, however, has slightly lower trace density than the 40 m orthogonal due to its larger source station interval (a characteristic of MegaBin). Finally, it should be noted that in this
study area, geometries with either 60 m or 80 m line intervals are routinely used to image the subsurface target (McMurray Formation located at a depth of approximately 200 m).
Figures 3a-3g show fold plots (top) for offset range 0 to 100 m and Fresnel fold plots (bottom) for offset range 0 to 100 m, depth of 150 m, frequency of 150 Hz, and 2000 m/s velocity for the geometries shown in Figures 2a-2g, respectively. The Fresnel fold plots show the level of footprint in the sampling of a flat subsurface reflector. This contrasts with CMP fold plots, which show the distribution of source-receiver pairs at the surface and is not dependent on any target parameters. CMP fold is consistent for geometries in Figures 3b through 3d but has significant footprint in terms of zero-fold bins for all parallel geometries as

Figure 3 a-g) Fold plots (top) for offset range 0 to 100 m and Fresnel fold plots (bottom) for offset range 0 to 100 m, depth of 150 m, frequency of 150 Hz, and 2000 m/s velocity for the geometries shown in Figures 2a-2g, respectively.
shown in Figures 3e through 3g. If only CMP fold is used for evaluation, all geometries in Figures 3b through 3d would be assumed to outperform all geometries in Figures 3e through 3g. Fresnel fold plots, as shown in the lower plots in Figure 3, show a more realistic view of the data density pattern from a target reflector, with the footprint dominated by the nearest traces with the smallest Fresnel zones. From these results, we would predict that Figures 3b and 3e would be closest to the fully stack array in Figure 1a. The other geometries begin to show some footprint with the most severe footprint in geometry d), which is noticeably worse than geometry g). This footprint in Fresnel fold is directly related to the sampling in all four spatial dimensions and is tied to the depth and frequency content of the reflector.
Since closer approximations to the full grid will provide more near offset traces and reduce the Fresnel footprint, reduced Fresnel footprint is indicative of improved coverage of near-offset information. As a result, Fresnel footprint can be used to predict AVO inversion results, which require improved information in the near-offset for calculating an accurate AVO intercept. AVO analysis can thus assess which survey geometries can be interpolated accurately relative to the full grid – those with complete single fold gathers (orthogonal cross-spread geometries) vs. those with more complete near-offset coverage and Fresnel sampling (parallel geometries).
All geometries were assessed through a controlled/quantifiable AVO inversion and elastic QI for the ability of each decimation to recover the full ‘stack array’ amplitude fidelity of the fully sampled, full grid dataset. Figure 4 shows the full-grid dataset’s optimally desired ‘stack array’ statistics in a polar plot and fold vs. azimuth display. This real data ‘stack array’ acquisition will be the reference to which the various cross-spread and parallel geometry design decimations will be quantifiably compared.
The complete 3D design decimation assessment methodology was developed using pre-stack AVO elastic inversion (Cova et al., 2023). The accuracy of the various decimated 3D volumes was compared through a relative correlation to the fully sampled un-decimated, un-interpolated input. This was done over the McMurray to Devonian interval shown in Figure 5, using both AVO intercept/gradient and QI AI-Vp/Vs-Density attributes, as well as a Kx-Ky footprint measurement.
The following results illustrate the sensitivity of each inverted AVO parameter to offset/incidence angle distributions within each decimated survey. Both horizon map displays, and correlation statistics are provided for each of the following attribute extractions:
1. AVO intercept and gradient
2. QI elastic inversion for AI, Vp/Vs and Density
3. Kx Ky footprint measurement
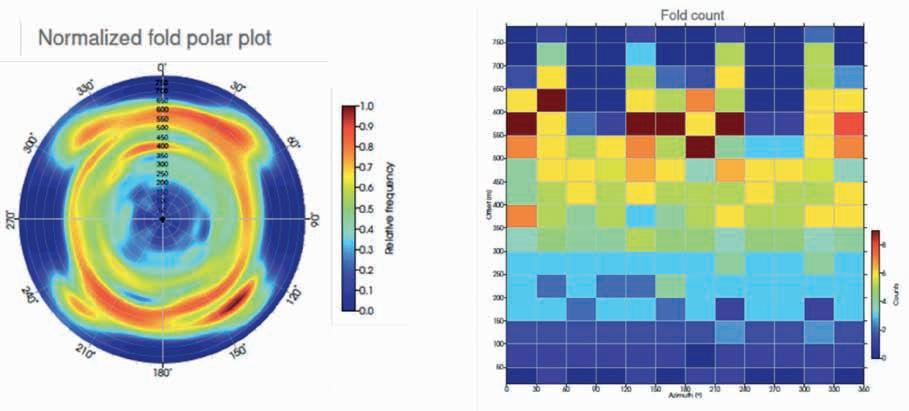
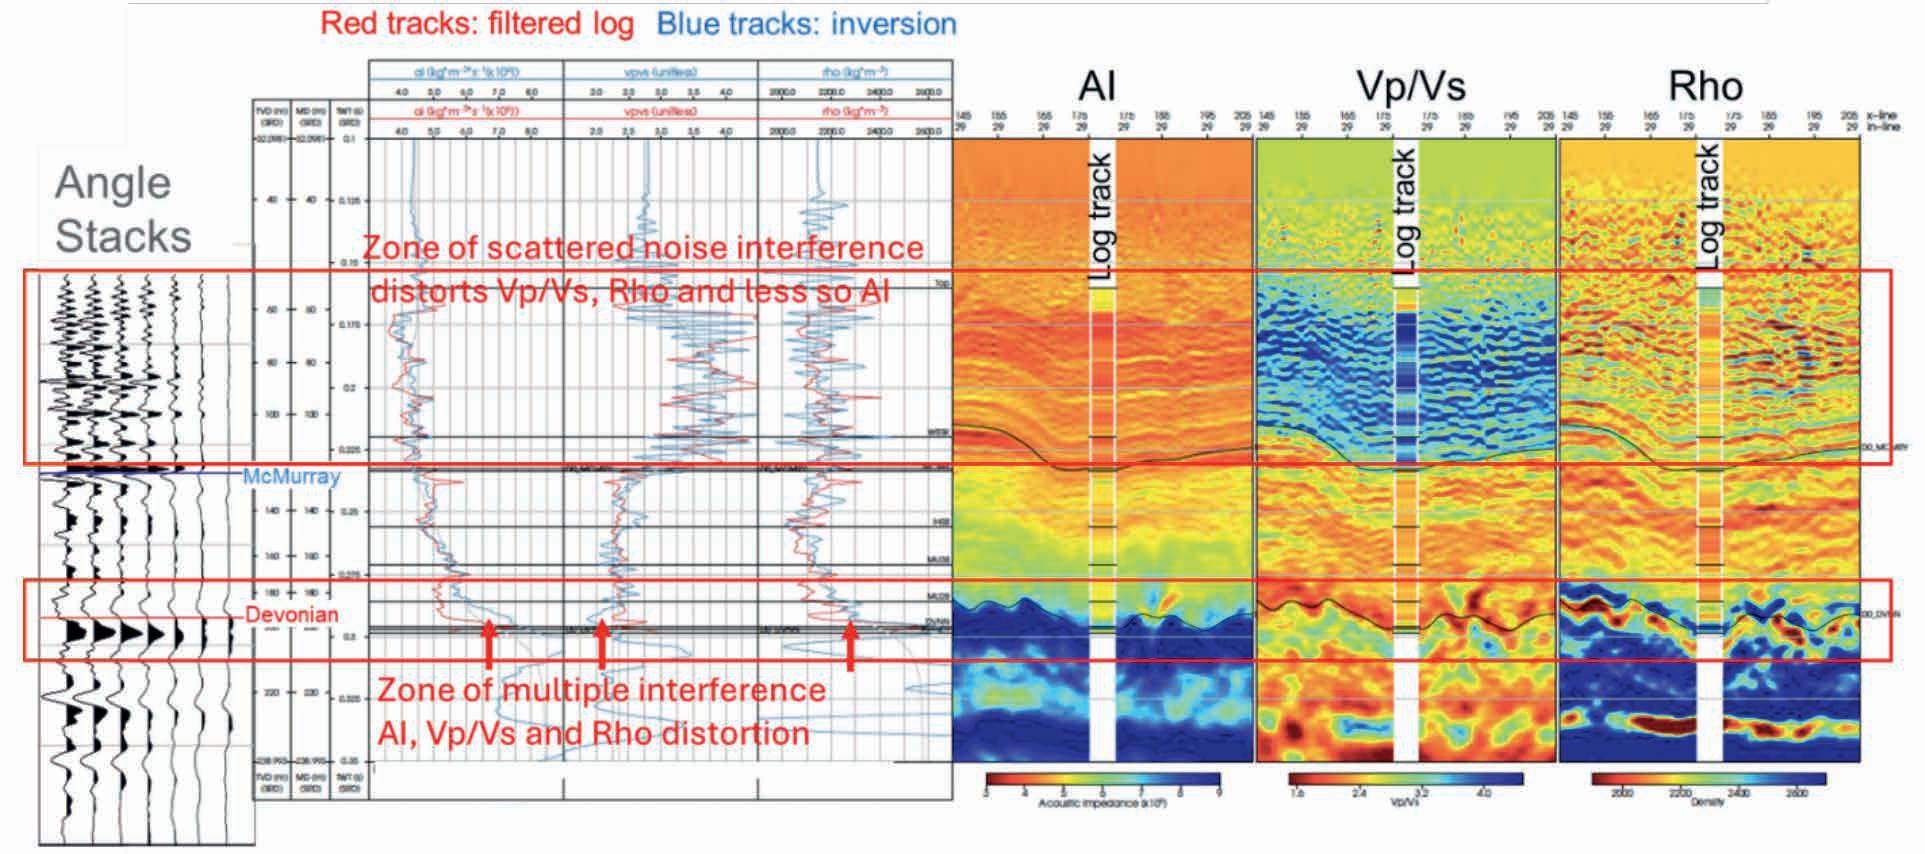

To complete the analysis, an elastic inversion for AI, Vp/Vs, and density was calculated. In this first comparison, horizon slice maps of AI for the orthogonal geometries with increasing orthogonal cross-spread line spacing decimations of 40m x 40m, 60m x 60m and 80m x 80m are compared with the full grid dataset, which has an effective cross-spread of 20m x 20m and a station-to-line ratio of 1:1 (Figure 6). As expected, the AVO results obtained for AI are strongly affected by the sampling of the near-offset data. (This effect is described in detail in Part 1, Figure 8c). For the orthogonal cross-spread datasets (Figures 6b-6d), the largest minimum offset in each bin increases at approximately 1.4 times the line spacing and is lowest on the fully sampled dataset.
In contrast to the orthogonal cross-spread comparisons, the AI results obtained for all the parallel geometry decimations, illustrated in Figures 6e-6g, are less affected by the sampling of the near-offset. This is due to two factors: (1) the continuous sampling of the near offset along the parallel geometry lines, which is critical for accurate calculation of the intercept, and (2) the ‘largest minimum offset’ for parallel geometries is just a function of the line spacing and not 1.4 times the line spacing as is the case for the cross-spread design (see Part 1, Figure 8d, MegaBin offset plots). A visual inspection of the AI maps in Figures 6e-6g, shows that the 40m MegaBin and 60m EcoSeisTM almost equally
match the fully sampled geometry, while the 80-m EcoSeisTM has a stronger footprint contamination, likely to be due to both the larger line interval and the lower trace density.
The Vp/Vs results, in contrast to the decimation comparisons for AI, are very sensitive to the AVO gradient and amplitude noise interference errors due to the intra-bin offset distributions or ‘stack array’ within bins to the gradient comparisons, this leads to a lack of fold within the limited angle partial stacks used for the elastic inversion. As a result, high amplitude noise outliers fail to stack out, thereby amplifying the error in the gradient and hence, Vp/Vs, which is a function of incidence angle range Dsin2(q) (Cambois, 2001).
A visual inspection of the Vp/Vs difference maps in Figure 7 shows an overall footprint contaminated degradation of all the orthogonal cross-spread decimations (Figures 7b-7d) compared to the fully sampled geometry (Figure 7a) due to the inability of the 5D interpolation to recover the fully sampled ‘stack array’ AVO response. Furthermore, as the line interval increases from 40 m to 60 m to 80 m, there is a progressively deteriorating acquisition footprint contaminating the geological elastic attributes as compared to the fully sampled dataset.
Compared to the orthogonal cross-spread decimation comparisons in Figures 7b-7d, the Vp/Vs results obtained for the 40-m MegaBin and 80-m EcoSeisTM parallel geometry decimations are similarly affected by the footprint line spacing that leaks noise
interference despite an improved ‘stack array’ within the bin. However, the 60-m EcoSeis™ parallel geometry illustrated in Figure 7f exhibits a considerably less severe footprint interference and is the best match to the fully sampled geometry. The reason for this improvement in the Vp/Vs estimate, is that the 60-m EcoSeisTM design has a more continuous ‘stack array’ sampling in both in-line and cross-line directions as compared to the 40-m MegaBin, which only has the ‘stack array’ in the in-line direction. Although the 80-m EcoSeisTM also has good in-line and x-line ‘stack array’, the 60-m EcoSeis™ has a higher trace density than the 80-m parallel geometries resulting in improved imaging.
Unlike the decimation comparisons for inverted AI and Vp/ Vs, the density estimates are entirely a function of the far-offset range angle sampling that straddles 45° (between 40° and 50°). As a result, the density estimates are only partially affected by the full continuous ‘stack array’ (or lack thereof) across the full offset range. Consequently, the various decimation test comparisons for the sensitivity of density estimates assess the coarse cross-spread line sampling at the far-offset 45° angle range. A visual inspection of the density difference maps in Figures 8a-8d, shows an overall footprint contaminated degradation of all the cross-spread decimations compared to the full grid ‘stack array’ geometry due to the inability of the 5D interpolation or extrapolation to sufficiently recover the fully sampled far-offset 45° angle range. Furthermore, as the line interval increases from 40 m to 60 m to 80 m, there is a progressively dete-
riorating acquisition footprint contaminating the geological elastic attributes as compared to the fully sampled dataset.
Compared to the equivalent dimension 40-m and 60-m line cross-spread decimation comparisons (Figures 8b and 8c), the density results obtained for the 40 m MegaBin and 60m EcoSeisTM parallel geometry decimations (Figures 8e and 8f) are considerably less affected by the increased footprint noise interference on the far-offset 45° angle range, and therefore more closely match the full grid geometry of 20 m x 20 m. This is related to the ‘stack array’ being maintained in the inline direction on the parallel geometries. However, despite an improved in-line ‘stack array’ and hence far-offset sampling, the parallel 80-m EcoSeisTM (Figure 8g) exhibits comparable footprint noise interference to the 80-m cross-spread decimations in Figure 11d. This may be due to both the lower trace density obtained with 80-m lines and, due to the rotation of the parallel geometry lines relative to the 60-m EcoSeis™ geometry. This rotation results in a slightly larger in-line station interval. These results show that not only does a survey design need correctly sampled station intervals, but it must also have good trace density.
The Kx, Ky methodology can be utilised to assess the S/N footprint interference from the various cross-spread and parallel 3D decimations (Cova et al., 2023). Figure 9 illustrates ‘slices’ for
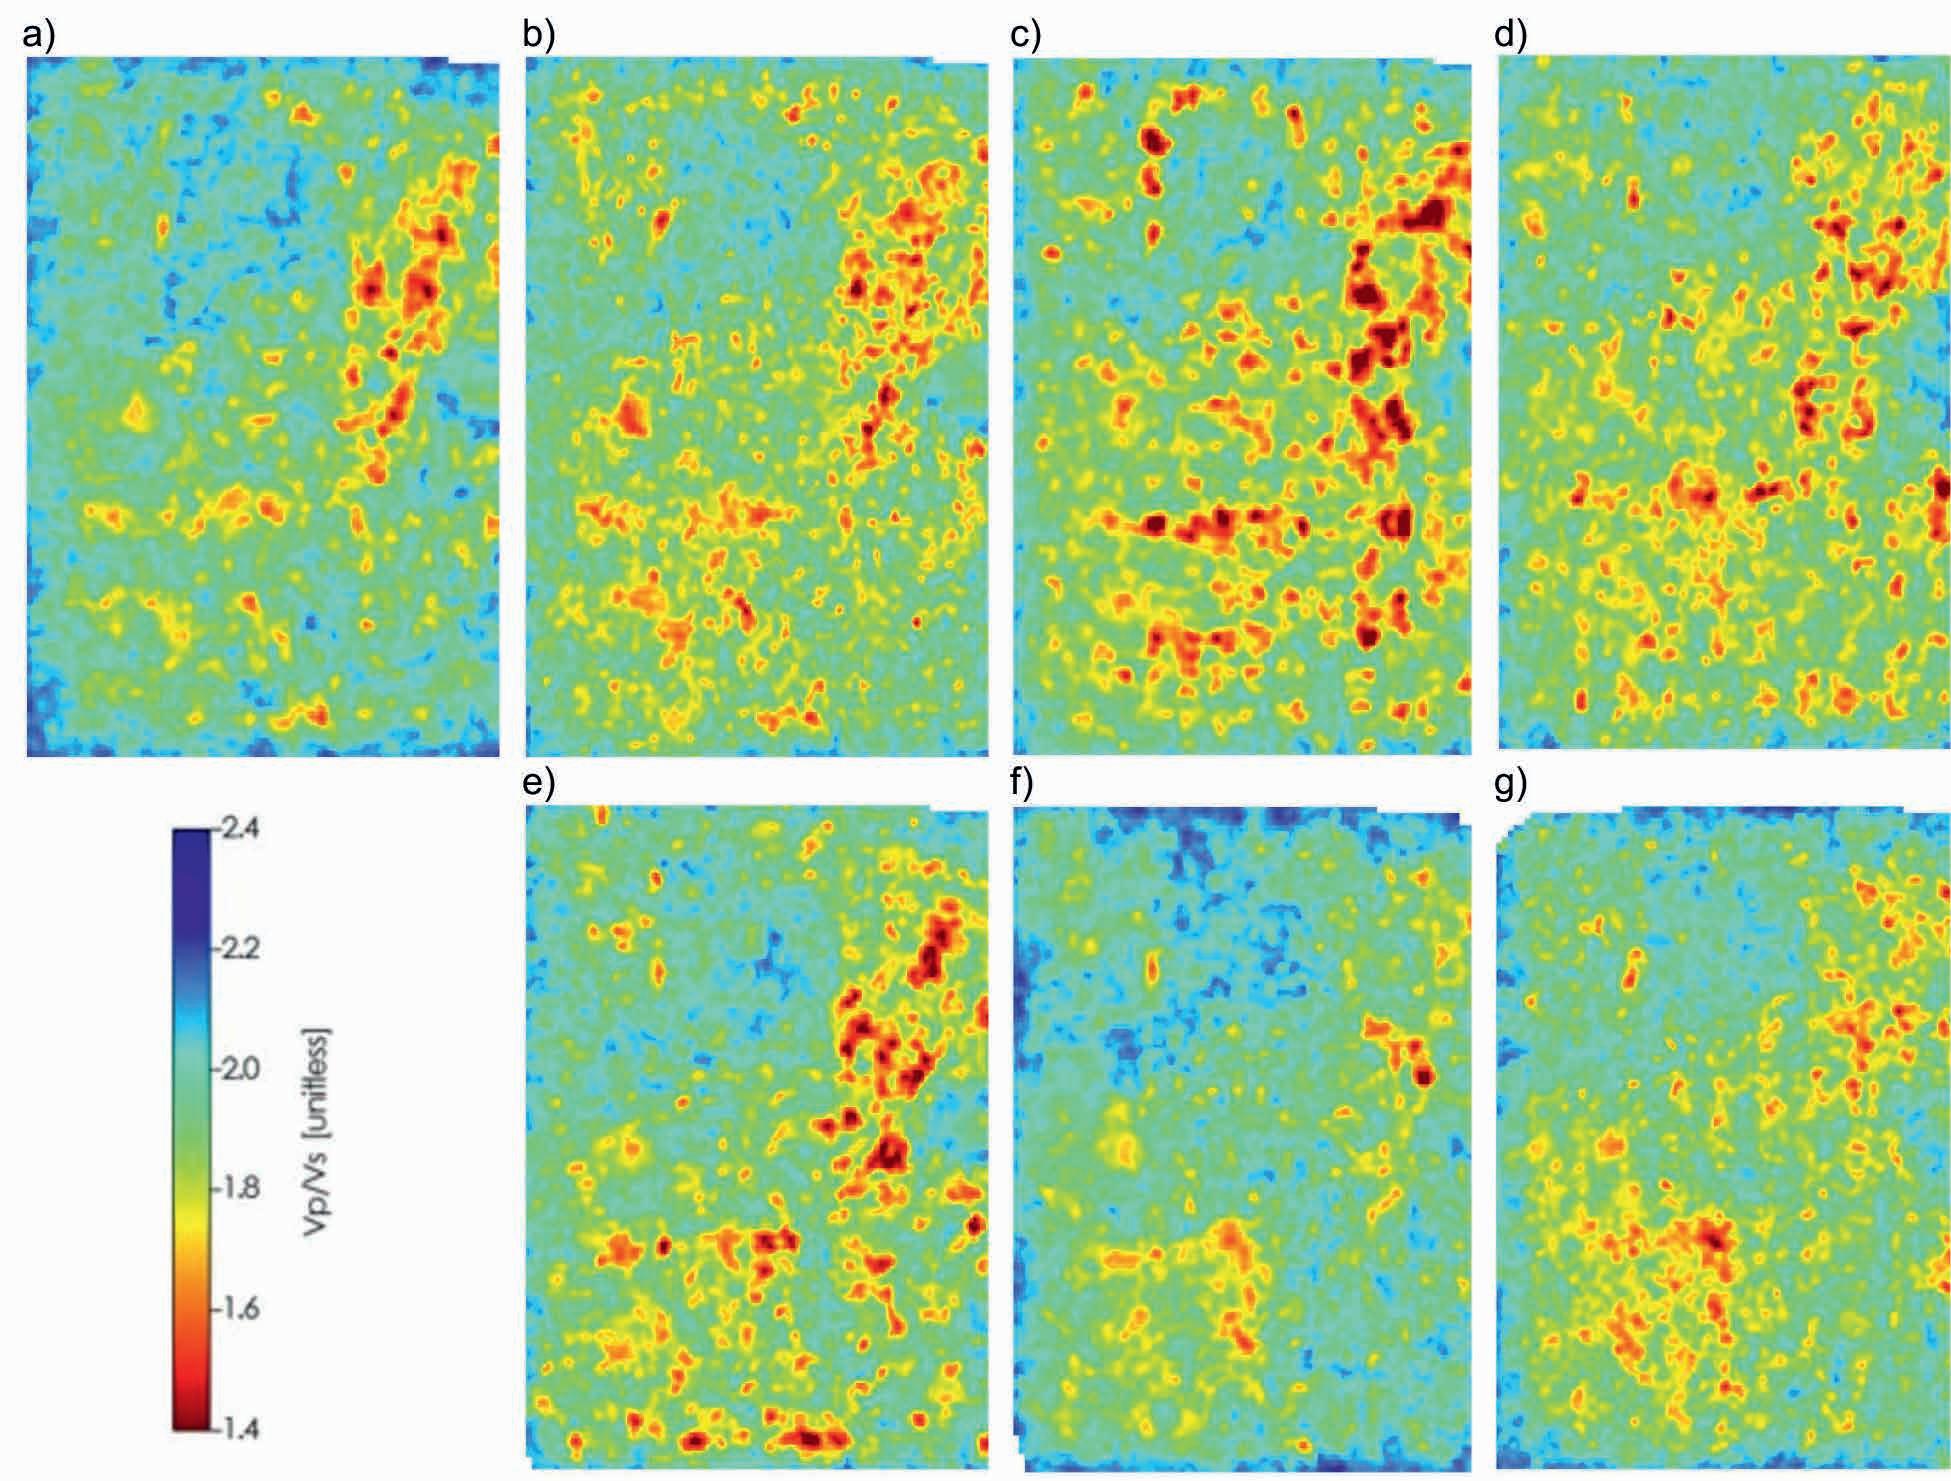
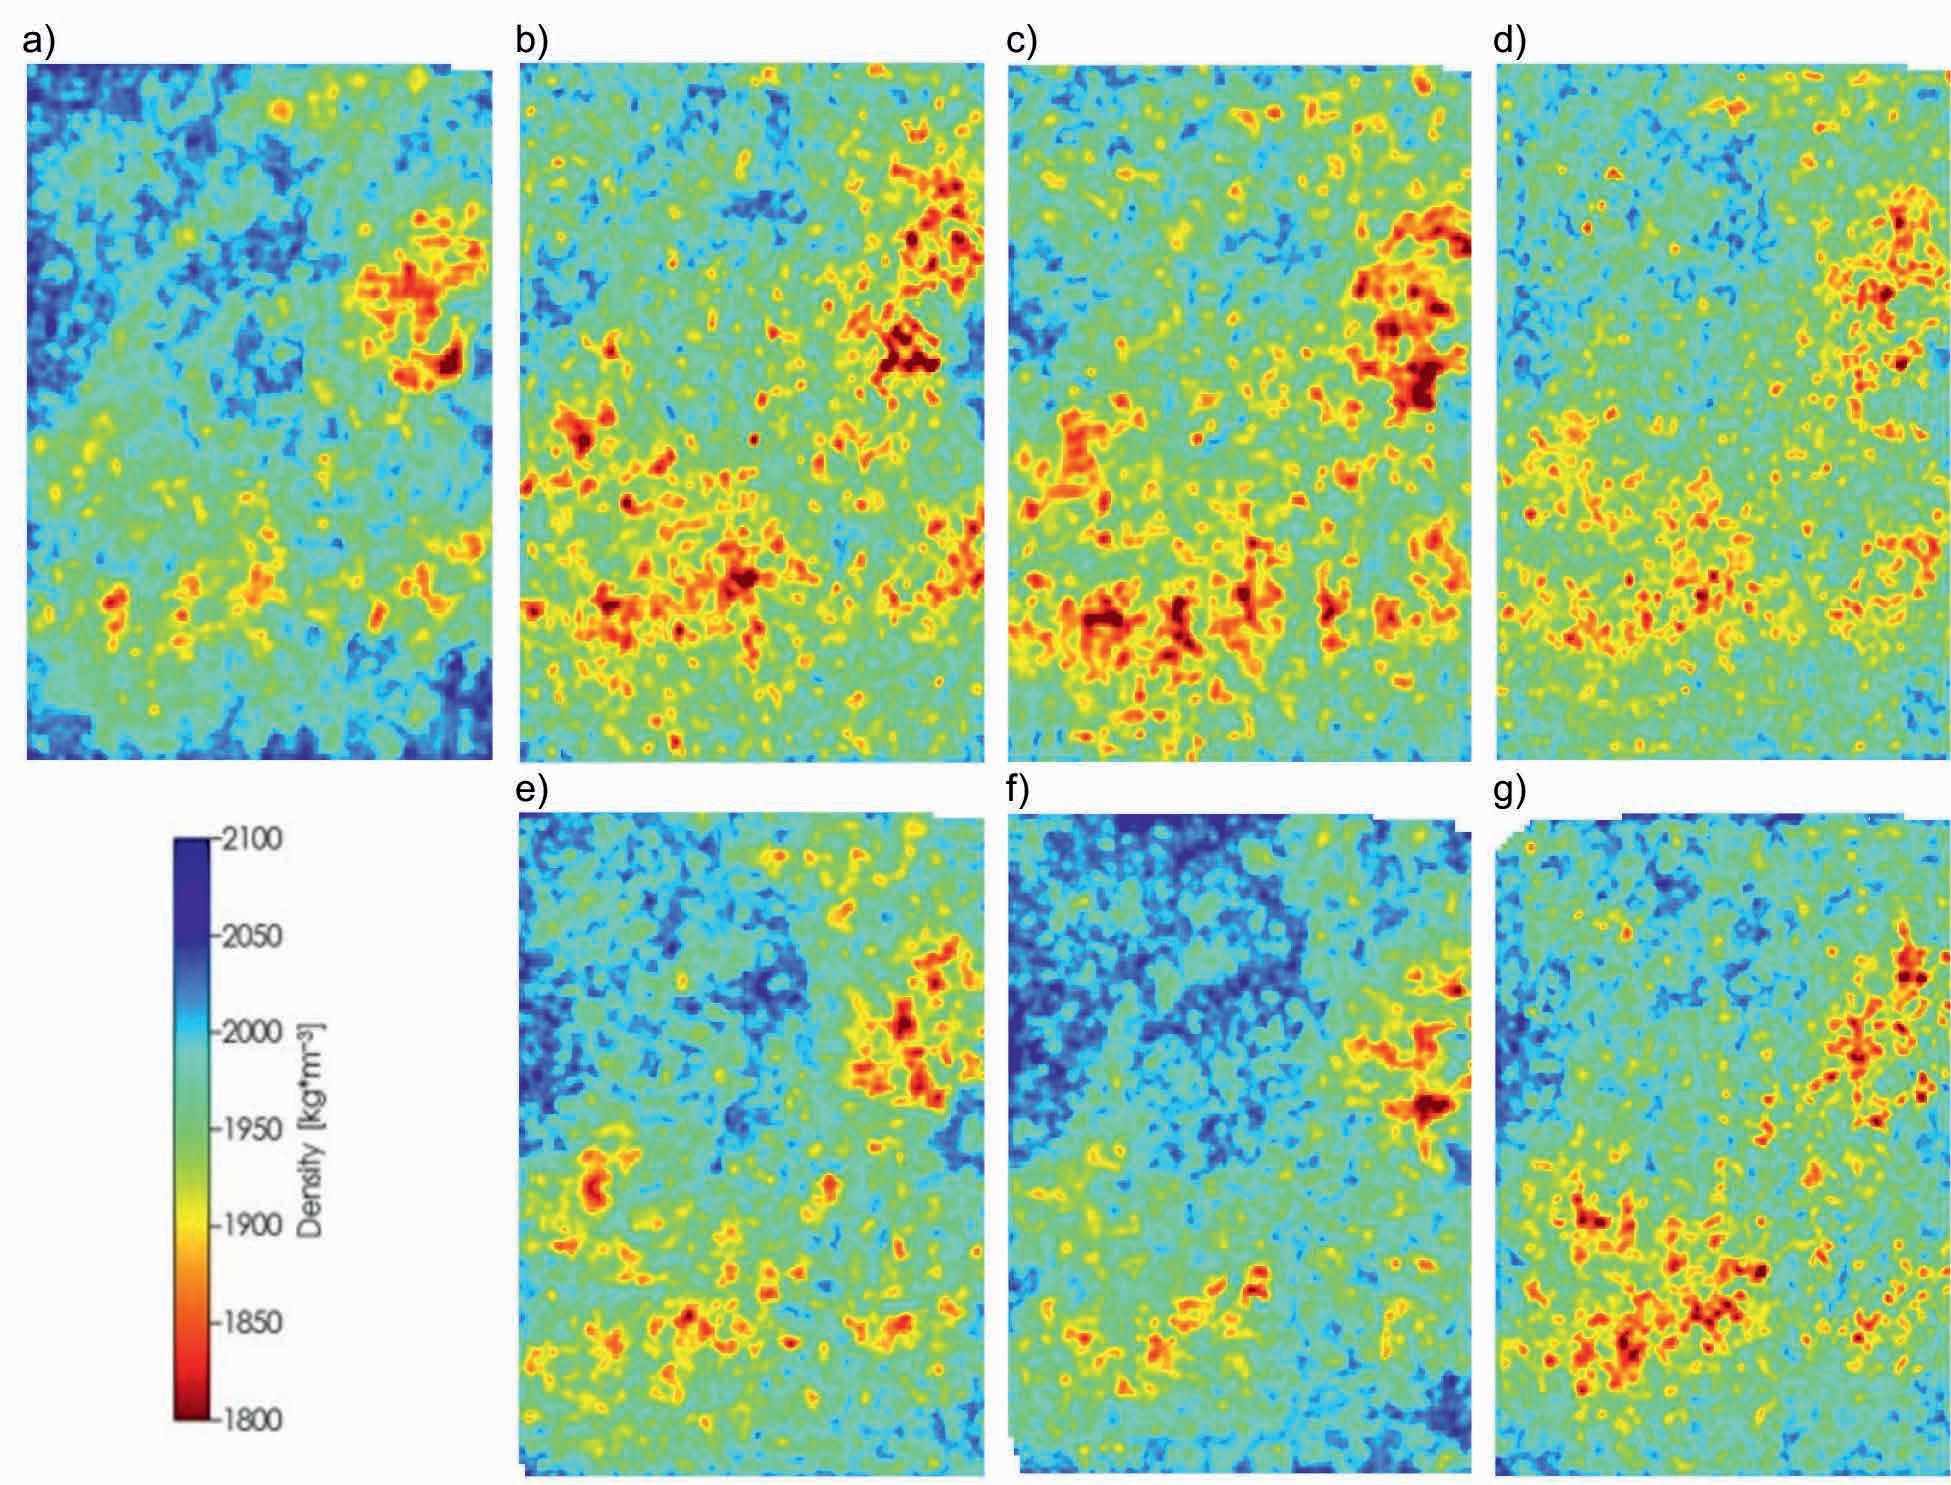

‘footprint noise’ interference due to the 3D design line sparsity decimation, evaluated to determine which geometries will effectively interpolate the easiest. The left-most slice is the ideal fully sampled point diffractor Kx, Ky slice, having the largest Nyquist bin dimension wavenumber area that is free of footprint sampling impulse responses that are seen on the coarser decimated 3D design line spacing patterns. The middle slice shows the Kx, Ky impulse response alias spike footprint patterns, due to the line spacings for any of the various 3D design decimations. The rightmost slice is just the total diffractor plus footprint Kx, Ky
9 3D design S/N assessment using Kx, Ky
response obtained by the addition of the ideal uncontaminated fully sampled slice to the specific 3D design’s footprint impulse response due to the various line decimations.
In the following examples (Figure 10), the data is transformed into the Kx, Ky domain. However, in practice, this evaluation can be done prior to acquiring data, making it a useful tool for designing seismic surveys. Figure 10a, shows the windowed (McMurray to Devonian) time horizons and Kx, Ky slices for a range of partial angle stacks for the best full grid ‘stack array’ geometry. This is used as a reference for the 3D design decimations that follow in Figures

Figure 10 The windowed (McMurray to Devonian) time horizons and Kx, Ky slices for a range of partial angle stacks for a) fully sampled grid, b) 60 m Orthogonal, c) 40 m MegaBin and d) zig-zag EcoSeisTM
10b to 10d. Notice that the signal diffractor energy occupies a small area in the angle stack Kx, Ky slices at the zero-wavenumber origin (centre of kx, ky plot). Here, only the three best design decimations in terms of cost and correlation (60-m orthogonal cross-spread, 40-m MegaBin and 60-m EcoSeisTM) are assessed by a footprint index (FP). This is computed by taking the ratio of the energy in the Kx, Ky space within the area around the zero-wavenumber origin, to the rest of the spectrum slice.
Comparing the 60 m orthogonal cross-spread (Figure 110b), 40-m MegaBin (Figure 10c), and 60-m EcoSeisTM (Figure 10d) to the full grid geometry (Figure 10a) as reference, shows that the 60-m orthogonal cross-spread has the most contaminating footprint alias energy outside the central zero wavenumber origin’s diffraction signal space while the 40-m MegaBin and 60-m EcoSeisTM have considerably less footprint energy outside the central zero wavenumber origin, indicating a better

preservation of the true signal shown in the full-grid geometry plots.
The quantified statistics of the parallel design decimations for a reduced environmental/ecological footprint combined with a lower Kx, Ky footprint index can be used to determine the most effective and efficient ‘fit for purpose’ 3D design. Figure 11 shows the quantitative assessment of the three of the 3D decimations (60-m cross-spread, 40-m MegaBin and 60-m EcoSeisTM) illustrated in Figure 10. The right panel shows the colour-coded FP index assessment with the 40-m MegaBin and 60-m EcoSeisTM geometries displaying the closest match to the full-grid geometry in terms of footprint index distribution across incidence angles. In contrast, the 60-m orthogonal cross-spread has the poorest match to the full-grid geometry out of all the decimated 3D design geometries. From this analysis, the optimal parallel geometry based on the ratio of the areal surface footprint reduction divided by lower Kx, Ky footprint energy, is the 60-m EcoSeisTM (16.47) followed by 40-m MegaBin (9.55).
The results can be further quantified by comparing the relative NRMS% differences calculated in a 0.2 to 0.3 second window for two cross-spread (60-m and 80-m) and three parallel (40-m MegaBin, 60-m EcoSeisTM and 80-m EcoSeisTM) 3D design decimations (Table 1). Note that the 40 m orthogonal cross-spread geometry would have the best NRMS% difference, but it is not evaluated here due to its high cost and significant environmental impact. The NRMS% difference to the fully sampled ‘stack array’ 20m x 20m full-grid geometry, is lowest for the 40-m MegaBin and then increases from the 60-m EcoSeisTM to the 60-m orthogonal cross-spread with the most differences seen in the 80-m EcoSeisTM and 80-m orthogonal cross-spread decimations. Further comparison can be made by examining the nominal
cost/100m2 for each design (as first shown in Figure 8). The relative nominal cost efficiency for the top three designs with the least NRMS% difference and the best Footprint Index shows that the 60-m EcoSeisTM has the least cost and the least ecological and environmental surface footprint impact, followed by the 40-m MegBin, and lastly the standard 60-m cross-spread.
To preserve amplitude fidelity for QI/AVO and interpretation, it is critical that all offsets/angles (especially near offsets) are continuously and consistently sampled within and between each bin. Consequently, AVO inversion is a critical (and potentially, the ultimate) tool for 3D acquisition design and amplitude fidelity assessment. This analysis has shown its usefulness for the quantitative analysis of the various orthogonal crossspread and parallel 3D design decimations in terms of AVO/QI attributes. Pre-stack analysis and inversion results demonstrate the sensitivity of inverted parameters to the offset and incidence angle distributions. Fresnel Zone Binning of near-offset traces is shown to correlate well with the ability of interpolation to improve distributions and reduce acquisition-related footprint. Acoustic impedance results are sensitive to the quality of near offset traces, which are typically impacted by the acquisition footprint of the largest minimum offset. Vp/Vs results are also impacted by the near angle acquisition sampling but more so from the intra-bin mid to far angle sampling (Crook 2022, Naghizadeh et. al., 2023). Density inversion comparisons of the parallel vs cross-spread 3D decimations showed a strong sensitivity to far offset data sampling that straddle the 45° incident angle range. AVO and inversion tests comparing the fully sampled grid geometry clearly demonstrate that the decimated 60-m EcoSeisTM and 40-m MegaBin parallel geometries perform the best with the closest quantified match to the fully sampled 3D. In contrast, the
Table 1 Relative NRMS% differences and nominal cost/100m2 assessed from inversions of AI, Vp/Vs, and Density for two cross-spread (60 m and 80 m) and three parallel (40-m MegaBin, 60-m EcoSeisTM and 80-m EcoSeisTM) 3D design decimations calculated in a 0.2 to 0.3 second window.
orthogonal cross-spread geometries with coarser line spacings had the worst match. The excellent results from the assessment analysis of the new 60-m EcoSeisTM are achieved despite a significantly reduced field acquisition cost and environmental surface footprint. A final observation from these decimation tests is that the 5D interpolation of the missing traces in the coarse cross-spread line geometries was unable to recover the imaging and AVO fidelity as shown in the full grid ‘stack-array’ un-interpolated volume. This conclusion was evidenced by the persistent crossspread geometry footprint contamination due to aliased high wavenumber surface noise and interbed multiple interference that contaminates the signal despite 5D interpolation. This is predicted by the inadequate distribution of near-offset traces in Fresnel Zone sampling, as derived in Part 1.
Since completing the analyses outlined in this paper, work has continued and an interbedded orthogonal/EcoSeis™ seismic survey has been acquired and compared, and by the time this article is published, the first independent EcoSeis™ field trial will have been completed. Additionally, further decimation tests have been completed to test the limits of various orthogonal and parallel geometries. Results from these studies are expected to be published in the next six months and potentially shared at the First EAGE Workshop on Land Seismic Acquisition in May 2025.
The authors would like to acknowledge Cenovus Energy Inc. for use of the seismic dataset as well as other project collaborators for research-funding contributions.
Claerbout, J. F. [2004]. Earth Soundings Analysis: Processing versus Inversion: Chapter 8, Missing-data restoration p 181-211.
Cambois, G. [2001]. AVO and the general inverse theory. CSEG Recorder, 26(6).
Cary, P. W. [1999]. Common-offset-vector gathers: An alternative to cross-spreads for wide-azimuth 3-D surveys. SEG Technical Program Expanded Abstracts, 1496–1499.
Cordsen, A., Galbraith, M., Peirce, J., and Hardage, B. A. [2000]. Planning land 3-D seismic surveys. Geophysical Developments, 9. Society of Exploration Geophysicists.
Crook, A. [2018]. Seismic Acquisition Innovations Applied in Canada. CSEG Recorder, 43(5), 22-29.
Crook, A., McGrory, R., Baker, N., and Westlake, A. [2019]. Transitioning to High Density Vibroseis Seismic Acquisition: A Case Study. GeoConvention conference abstracts.
Crook, A., Bossaer, S., Boutin, M., Contenti, S., Crook, C., Nwafor, K., and Sun, F. [2021]. Case study: The use of miniaturized seismic sources for reduced environmental impact. 82nd EAGE Annual Conference & Exhibition Extended Abstracts, 1-5.
Crook, A. [2022]. Evaluating seismic acquisition techniques for reduced environmental impact. Second EAGE Workshop on Near-Surface and Mineral Exploration in Latin America, Bogotá, Colombia (Abstract).
Crook, A., Naghizadeh, M., Vermeulen, P., Gagnier, D., and Reine, C. [2023]. The use of miniaturized seismic sources for reduced environmental impact. First Break, 41(1), 77-84.
Cova, R., Rodriguez, M., Goodway, B., Vermeulen, P., Crook, A., and Pardasie, W. [2023]. Sustainable subsurface imaging technology part 2: Using AVO seismic inversion as a tool to assess seismic survey designs. Recent Discoveries, Exploration Opportunities, and Sustainable Development Strategies in Caribbean Basins, AAPG Workshop Abstracts.
Duncan, E., O’Byrne, A., and Dalsin, J. [2014]. Real vs. ‘5D’ Data: An analysis of acquired vs. interpolated data in both the post-stack and pre-stack domains for parallel and orthogonal geometries. CSEG Recorder, 39(3).
Goodway, W., and Ragan, B. [1996]. “Mega-Bin”: Toward a cost-effective “near symmetric patch geometry for improved S/N & resolution from regular acquisition sampling and cooperative image processing. CSEG Convention Abstracts, 99-102.
Goodway, W., and Ragan, B. [1996]. MegaBin patent “Three-dimensional seismic acquisition” awarded to PanCanadian. Patent number 5787051.
Goodway, B., Chen, T., and Downton, J. [1997]. Improved AVO fluid detection and lithology discrimination using Lamé petrophysical parameters; “λρ”, “μρ”, & “λ/μ fluid stack”, from P and S inversions. SEG Technical Program Expanded Abstracts, 183-186.
Goodway, W. [2013]. Cost-efficient acquisition to reduce coarse land 3D line spacings through beyond Nyquist interpolation and wavefield reconstruction for signal and noise. CSEG Convention Abstracts.
Goodway, B., Cova, R., Pardasie, W., Crook, A., Naghizadeh, M., Crook, C., Hons, M., & Rodriguez, M. [2024]. Land 3D Acquisition Design: Theory of wavefield sampling. part 1: Past 3D design testing and assessment of cross-spread and parallel geometries. First Break, 42(9), 59-70.
Jiang, T., Jiang, Y., Gong, B., Li, T., Huang, C., Mondriel, S., and Garcia, V. [2020]. Shot domain seismic reconstruction with EPOCS. SEG Technical Program Expanded Abstracts 2020, 3309-3313.
Larson, A. [2020]. A review of exploration tools and techniques to support the COSIA Land Challenge: Near Zero Footprint Seismic Exploration. https://www.cclmportal.ca/resource/review-exploration-tools-and-techniques-support-cosia-land-challenge-near-zero-footprint.
Linden, D. A. [1959]. A discussion of sampling theorems. Proceedings of the IRE, 47(7), 1219-1226.
Liu, B., and Sacchi, M. D. [2004]. Minimum weighted norm interpolation of seismic records. Geophysics, 69(6), 1560-1568.
Monk, D. J. [2009]. Fresnel zone binning: Application to 3D seismic fold and coverage assessments. The Leading Edge, 28(3), 288-295.
Monk, D. J. [2010]. Fresnel-zone binning: Fresnel-zone shape with offset and velocity function. Geophysics, 75(1), T9-T14.
Monk, D. J. [2020]. Survey design and seismic acquisition for land, marine, and in-between in light of new technology and techniques. SEG Distinguished Instructor, 23. Society of Exploration Geophysicists.
Naghizadeh, M. [2012]. Seismic data interpolation and denoising in the frequency-wavenumber domain. Geophysics, 77(2), V71-V80.
Naghizadeh, M., and Sacchi, M. D. [2010]. On sampling functions and Fourier reconstruction methods. Geophysics, 75(6), WB137-WB151.
Naghizadeh, M., and Sacchi, M. [2013]. Multidimensional de-aliased Cadzow reconstruction of seismic records. Geophysics, 78(1), A1-A5.
Naghizadeh, M. [2015]. Double-weave 3D seismic acquisition — Part 1: Sampling and sparse Fourier reconstruction. Geophysics, 80(6), WD143-WD162.
Naghizadeh, M., Vermeulen, P., Crook, A., Birce, A., Ross, S., Stanton, A., Rodriguez, M., and Cookson, W. [2023]. EcoSeis: A novel acquisition method for optimizing seismic resolution while minimizing environmental footprint. The Leading Edge, 42(1), 61-68.
Nyquist, H. [1928]. Certain topics in telegraph transmission theory: Trans. Am.Inst.Elec.Eng. 47, 617- 644.
Ourabah, A., Bradley, J., Hance, T., Kowalczyk-Kedzierska, M., Grimshaw, M., and Murray, E. [2015]. Impact of acquisition geometry on AVO/ AVOA attributes quality - A decimation study onshore Jordan. Proceedings of the 77th EAGE Annual Conference & Exhibition, Extended Abstracts.
Pawelec, I., and Sava, P. [2024]. High dynamic range land wavefield reconstruction from randomized acquisition. Geophysics, 89, V563-V572.
Shannon, C. E. [1949]. Communication in the presence of noise. Proceedings of the IRE, 37(1), 10-21.
Spitz, S. [1991]. Seismic trace interpolation in the F-X domain. Geophysics, 56(6), 785-794.
Trad, D., and Deere, J. [2005]. Understanding land data interpolation. SEG Technical Program Expanded Abstracts, 2158-2161.
Trad, D. [2009]. Five-dimensional interpolation: Recovering from acquisition constraints. Geophysics, 74(6), V123-V132.
Vassallo, M., Özbek, A., Özdemir, K., and Eggenberger, K. [2010]. Crossline wavefield reconstruction from multicomponent streamer data: Part 1 — Multichannel interpolation by matching pursuit (MIMAP) using pressure and its crossline gradient. Geophysics, 75(6), WB53-WB67.
Vermeer, G. J. O. [1994]. 3-D symmetric sampling. SEG Technical Program Expanded Abstracts, 906-909.
Vermeer, G. J. O. [1995]. 3D symmetric sampling in land data acquisition. CSEG Annual Convention Abstracts, 169-170.
Vermeer, G. J. O. [2002]. 3-D seismic survey design. Geophysical Reference Series, 12. Society of Exploration Geophysicists.
Vermeer, G. J. O. [2022]. Comments on Fresnel zone binning — Can it be used to determine maximum allowable holes in coverage of long offsets?
The Leading Edge, 41(6), 418-422.
Vermeulen, P., Crook, A., Naghizadeh, M., and Ross, S. [2022]. Turn your seismic program into a lean, green, resolution machine. GeoConvention Conference Abstracts.


Maitena Daguerre1, Lubin Daumard1*, Emeline Di Pasquale1*, Quentin Garcin1 and Thibault Drulhe1
Introduction
The Minus CO2 Challenge brings together students from all over the world to tackle the challenges of the energy transition through geosciences. In 2024 17 teams participated. The topic was ‘Geothermal Electrical Power Generation in the Netherlands’.
The competition was driven by geological maps and data of the website NLOG: a regional-scale petroleum geological framework for the subsurface of the Netherlands generated by the Geological Survey of the Netherlands. It was also stimulated by an online news article from Mijnlieff (2020): ‘Introducing the geothermal play and reservoir geology of the Netherlands’. It was spurred by numerous reports of ThermoGIS, a geothermal energy information system developed by TNO (Netherlands Organisation for Applied Gesociences).
Congratulations to the five teams who prepared technical reports and gave excellent online presentations in the final round of the 2024 Minus CO2 Challenge in September. The GeoSquad team from UniLaSalle had the honour of presenting their work in person at the Global Energy Transition (GET) conference in Rotterdam in November 2024. Laura Valentina Socco, EAGE President, awarded the first prize (cf. Figure 1).
• First place: UniLaSalle, France
• Second place: Rajiv Gandhi Institute of Petroleum Technology, India
• Third place: University of Miskolc, Hungary
• Fourth place: IFP School, France
• Fifth place: University of Boumerdes, Algeria
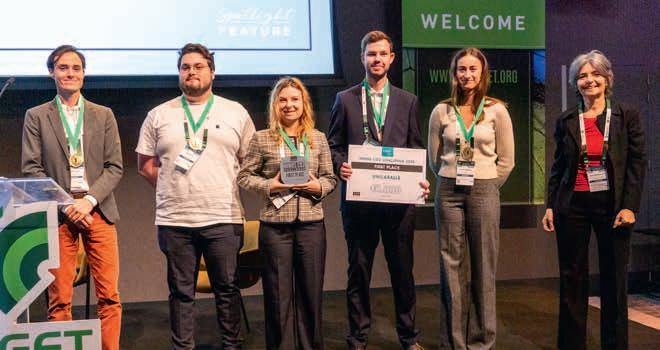
The Netherlands has numerous geothermal resources. Currently, permeable geothermal aquifers are exploited with average temperatures between 40 and 100°C. Geothermal systems produce only heat for agricultural greenhouses, district heating and balneology (Mijnlieff, 2020). In 2019 geothermal energy provides just 0.6% of the total country’s heat demand (Peeters et al., 2021).
To increase the production and to develop geothermal electrical power generation, studies are in progress to determine suitable reservoirs for deep and ultra-deep geothermal energy. These types of geothermal energy require wells with depth between 1500 and 5000 m and temperatures above 120 °C (Peeters et al., 2021).
Reservoirs parameters for different geological formations have been summarised (cf. Table 1). The main characteristics that were looked at are thickness, depth, temperatures, transmissivity, permeability, geothermal systems already installed, and the associated type of energy produced.
The Netherlands disposes of several potential reservoirs in subsurface areas.
The Cenozoic is mainly composed of sandy and clayey-marl sediments and covers almost all of the Netherlands except the small areas of Limbourg and Twente. Despite all oil and gas wells drilled through this section, there is limited information on reservoir productivity and injectivity due to data acquisition that was left to a bare minimum (Mijnlieff, 2020).
The Upper Jurassic and Lower Cretaceous sedimentary sequences are predominantly composed of claystone and sandstone deposits (Mijnlieff, 2020).
Reservoirs of the Lower Cretaceous play are a primary target for hydrocarbon exploration and production and for geothermal reservoirs.
The Upper Jurassic play corresponds mainly to reservoirs of fluvial sandstones. The thickness of these formations is laterally highly variable (Mijnlieff, 2020).
The Buntsandstein Subgroup of the Lower Germanic Trias Group is composed of various sandstones. Despite their geothermal potential, the reservoir quality of these sandstones is not
1UniLaSalle
* Corresponding author, E-mail: lubin.daumard@gmail.com, dipasquale.emeline@gmail.com
well known and some authors identify diagenetic overprint as a notable exploration risk in the Netherlands (Bertier et al., 2022).
for
The Slochteren Formation of the Rotliegend Group (Permian) is a suitable reservoir geothermal application. It encompasses nearly the entire Dutch onshore. The Slochteren Sandstone Formation is composed of perennial lake, fluvial and alluvial sediments (Mijnlieff, 2020).
The Dinantian Limestones of the Lower Carboniferous present a faulted and fractured nature that facilitate hydrothermal fluid movement and karstification in the south of Netherlands. Consequently, geothermal production wells are located near the faulted and fractured Dinantian Limestones sequence, close to the Tegelen fault (Mijnlieff, 2020). On the contrary, the northern part presents several carbonate platform deposits. Three platforms are isolated and buried at sufficient depths to be considered as potential targets for UDG exploration (Bouroullec et al., 2019).
Below the Carboniferous, few wells penetrated the Devonian and are characterised by the tight sandstones and clays of the Bosscheveld formation (Mijnlieff, 2020).
The northern part of the Dinantian reservoir appears as the most suitable for electrical geothermal generation using a closed-loop system. This technology requires a formation with low porosity and permeability.
The northern part presents several carbonate platform deposits. Three platforms are isolated and buried at sufficient depths to be considered as potential targets for UDG exploration (cf. Figure 2). Their current heat flow and thickness confirm this hypothesis (Bouroullec et al., 2019).
However, these platforms may contain petrophysical anomalies interpreted as intra-Dinantian karstified or fractured systems (Gutteridge et al., 2025). This uncertainty must be taken into
account during the project, even if the coverage of Namurian shales prevented subsequent post-Namurian karstification from occurring (Mijnlieff, 2020).
Then, in order to select the most suitable zone and ensure production, wells of the Dinantian reservoir were studied. Three wells were highlighted: UHM-02, WSK-01 and LTG-01. This last well was selected for its optimal characteristics. The others were eliminated due to insufficient information, low temperatures or poor-quality reservoirs for AGS.
The LTG-01, a deep borehole of 5162 m depth, provides data on the Luttelgeest carbonate platform (cf. Figure 3). At the top of the platform, the temperature exceeds 150 °C and the conductivity is estimated around 4.0 W/m.K (Veldkamp and Hegen, 2020). At LTG-01, the platform has a thickness of 768 m and the platform’s top is located at a depth of 4355 m (Gutteridge et al., 2025). Some studies present the platform as intact, especially in the centre (Lipsey et al., 2016). Some fractures and karsts were revealed but are cemented (Bouroullec et al., 2019; Veldkamp and Hegen, 2020). At the LTG-01, the porosity and permeability are very low with an average porosity of 1 % (Carlson, 2019).
The platform is located under several cities and agricultural greenhouses that can be considered as potential users of the future produced energy. This makes the Luttelgeest platform suitable for electricity and heat production.
Closed-loop systems (AGS technology)
The Advanced Geothermal System (AGS) is an innovative technology based on a closed-loop system to facilitate heat transfer through a direct interaction between rock and working fluid. This project draws inspiration from the engineering principles of Eavor company. Here it uses two overlayed closed-loops: one at a depth of 4500 m (TVD) and the other at depth 4800 m (TVD). Each closed loop is composed of two vertical wells and 12 horizontal
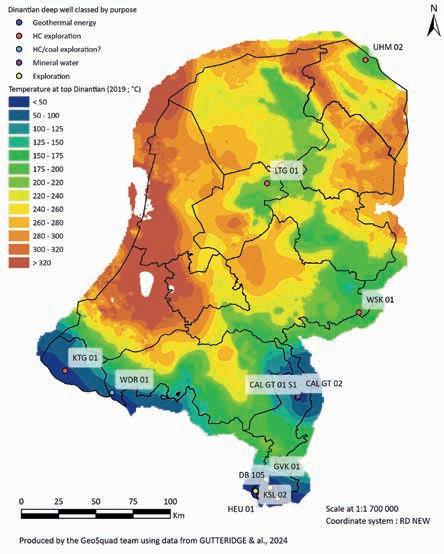

legs (cf. Figure 4). Each horizontal leg consists of two parallel wells connected at the end in order to shape mini-loops. This is achieved with magnetic ranging technology (Eavor, 2022). Furthermore, the Eavor’s Rock-Pipe technology enables us to directly seal the rock wall, allowing for efficient heat transfer through direct rock-fluid contact (Longfield, 2022). This is why these horizontal legs don’t need to be cased or cemented. Besides the circulation is powered by the thermosiphon effect (Longfield, 2022). In the injection well, the working fluid naturally goes down because it is cold and has a high density. At the bottom, it heats up by conduction from the surrounding rock, becomes less dense, and rises through the production well. This heated fluid will then be converted into electricity and warm water thanks to a power plant.
Design and development of a geothermal power plant
After heat recovery from the underground, the heat will be exchanged at the surface to create energy by an Organic Rankine Cycle power plant. The ORC circuit will use an organic fluid. First, this fluid will turn into steam thanks to a thermal energy exchange within a preheater and an evaporator, The steam will then move a turbine, which will create energy and electricity with a generator. After the turbine, the organic fluid will be condensed back into liquid, pumped, and the cycle will repeat. With the cogeneration system, the remaining heat will be recovered thanks to a second thermal energy exchange between a second circuit connected to the ORC circuit via a heat exchanger.
The estimated energy produced is around 4.4 gross MWe (3.6 net MWe) and 32.4 MWth. It will provide energy for approximately 10,000 households for towns like Emmeloord, which has 13,000 households. The heat could be distributed through a district heating network, and it could supply industries and towns around Luttelgeest. The installation should avoid around 24,000 CO2 equivalent tons per year.
Risk management, HSE, and monitoring
Risks in deep geothermal projects are numerous, but effective control measures can mitigate them. Before drilling, reservoir modelling is the essential first step in a project’s monitoring plan. This allows us to identify potential fractures, their ori-
entations, and any gas pockets. To achieve this, a 3D seismic survey combined with Formation Micro-Imager (FMI) logging is proposed to establish a Discrete Fracture Network (DFN). The 3D seismic survey provides a clear visualisation of subsurface structures and sedimentary layers, helping to interpret discontinuities such as fractures, while the FMI delivers critical data for characterising the wellbore and fracture orientations.
Additionally, well-logging techniques support reservoir modelling by assessing the risk of encountering gas pockets.
A comprehensive quality plan addresses major operational risks such as handling accidents, burns, and falling equipment. This plan also includes a preliminary impact study to assess ecosystem and groundwater safety, ensuring the project has no adverse impact on its natural environment.


During operations, protocols outlined in the quality plan help to minimise risks. Continuous wellbore monitoring allows operators to implement preventive measures and enhance safety. Real-time parameters monitoring during drilling enables immediate adjustments to optimise the process and control potential hazards as they arise.
Finally, the risk of accidents is reduced by magnetic ranging techniques and the risk of induced seismicity is not a concern for this project, thanks to AGS technology.
Wellbore conditions will be monitored using integrated measurement platforms, enabling real-time tracking of drilling and intervention activities.
For well completions and production, various intervention techniques are planned, including chemical fluids like Rock-pipe, to optimise heat transfer.
A range of equipment, such as flow measurement tools, surface trees, and wellhead systems, will be implemented to ensure smooth operations.
Pressure and temperature will be closely monitored to maintain optimal conditions, and field service operators will be deployed to manage and maintain these installations.
For the project, an investment budget of 100 M€ was available. To assure the economic viability of the project and the respect of the budget, an estimation has been made.
The estimated capex includes the following costs categories:
• Exploration and data acquisition
• Drilling (vertical wells and lateral legs)
• Power plant
• Field gathering system
• Monitoring
The estimated budget was calculated according to three economic scenarios (standard, positive and negative) for horizontal drilling. Indeed, this type of drilling at great depths is relatively new and has some uncertainties about the costs.
At the end, the estimated capex is around 72 M€ for the standard scenario, 54 M€ for the positive scenario and 108 M€ for the negative scenario. The standard scenario will be used as a reference.
The drilling part represents the main costs, especially for the lateral legs drilling. For the standard scenario, it represents 21% of capex for vertical wells and 51% for horizontal legs, so a total of 72% (cf. Figure 5). These drilling costs for horizontal wells are based on a drilling scenario with a rate of penetration of 15 m/h and a bit life of around 50 hours. According to Beckers and Johnston (2022), these drilling characteristics were achieved in the FORGE project in Utah in 2021 at similar depths than the
potential project of AGS within the carbonate platform of Luttelgeest, and in crystalline rocks (Beckers and Johnston, 2022).
Then the Levelised Cost of Electricity (LCOE) and the Levelised Cost of Heat (LCOH) were determined according to Capex and Opex. It results in a LCOE of 150,9 €/MWh and a LCOH of 15,88 €/MWh.
Considering a project lifetime of 30 years and sales prices of 70 €/MWh e and 40 MW/hth, the total sales amount should be approximately 122 M€ higher than total production costs (cf. Figure 6).
It corresponds to an average profit of 4 M€/year. Although AGS is highly promising, the LCOE is still too high to be profitable on its own. However, the heat production is highly profitable. Thanks to the principle of cogeneration and the simultaneous production of electricity and heat, the project is profitable as a whole.
Moreover, the project is eligible for European subsidies like the Geretsried project wich received 91.6 M€ from the European Innovation Fund (EIF).
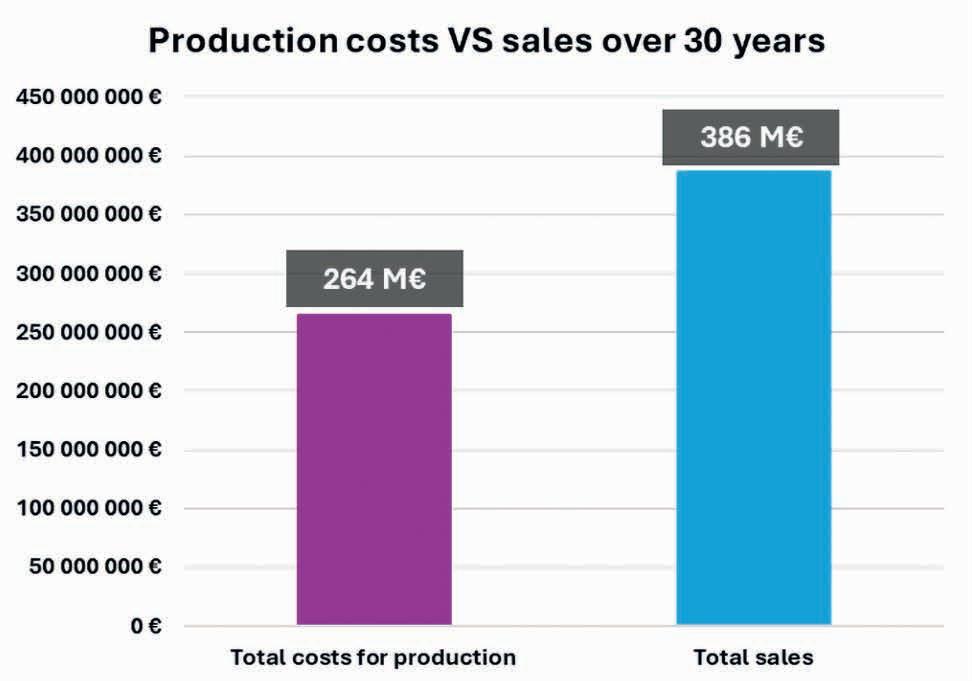

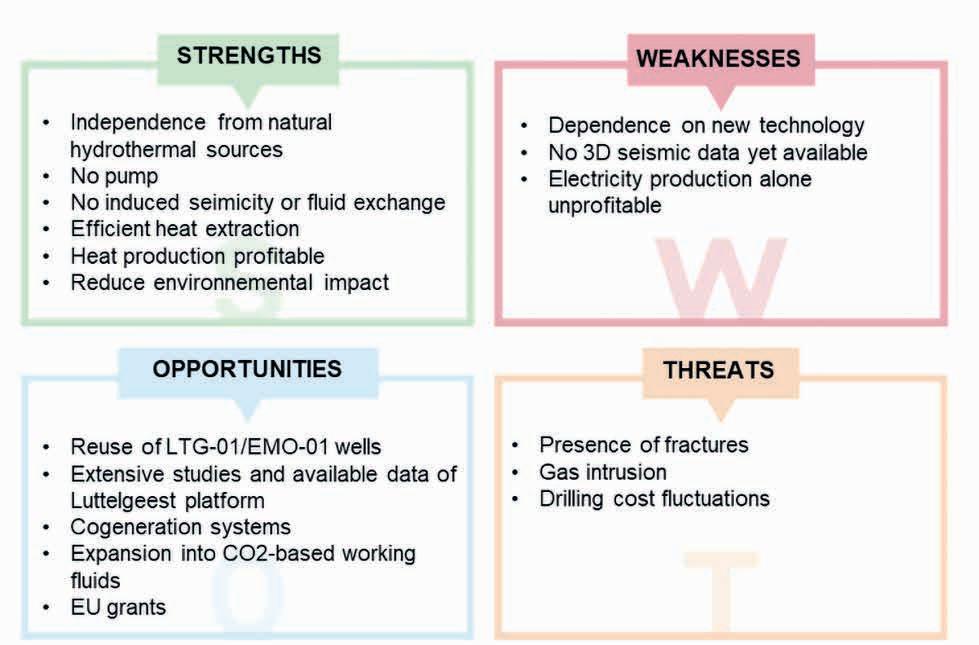
The project was classified according to the UNFC for Resources and its three criteria: Environmental-Socio-Economic Viability, Technical Feasibility and Degree of Confidence in geological knowledge. For each category, the project was classified with a score of 2 out of 3. It means that the project is potentially viable (cf. Figure 7).
Conclusion
A SWOT (Strengths, Weaknesses, Opportunities and Threats) analysis summarises well the project’s outlook (cf. Figure 8). It faces threats such as presence of fractures or karst, gas intrusion, and fluctuations in drilling costs. Some weaknesses include reliance on new technology, the lack of 3D seismic data, and the fact that electricity production alone may not be profitable.
However, key opportunities help to mitigate these issues, such as cost reductions achieved through the reuse of two existing wells, and improvement of the reservoir characterisation enabled by advanced modelling of the Luttelgeest platform. The project also has opportunities from a cogeneration system and potential use of CO2-based working fluids, with studies suggesting this could double the production efficiency even though further research is required.
The strengths of this project rely on its independence from natural hydrothermal sources, the absence of pumps or induced seismicity, and the absence of fluid exchange like in EGS systems.
References
Beckers, K.F., and Johnston, H.E. [2022]. Techno-Economic Performance of Eavor-Loop 2.0. 47th Workshop on Geothermal Reservoir Engineering, Proceedings.
Beckers, K.F., and McCabe, K. [2019]. GEOPHIRES v2.0: updated geothermal techno-economic simulation tool. Geothermal Energy, 7(1), 5. https://doi.org/10.1186/s40517-019-0119-6
Bertier, P., Swennen, R., Kemps, R., Laenen, B., and Dreesen, R. [2022]. Reservoir characteristics and diagenesis of the Buntsandstein sandstones in the Campine Basin (NE Belgium). Geologica Belgica, 25(3-4), 145-184. https://doi.org/10.20341/gb.2022.004
Bouroullec, R., Nelskamp, S., Kloppenburg, A., Abdul Fatah, R., Foeken, J., Ten Veen, J., Geel, K., Debacker, T., and Smit, J. [2019]. Burial and Structural Analysis of the Dinantian Carbonates in the Dutch Subsurface. Report for the SCAN program
Boxem, T.A.P., Veldkamp, J.G., and Van Wees, J.D.A.M. [2016]. Ultradiepe geothermie: Overzicht, inzicht & to-do ondergrond. TNO, Report 2016 R10803.
Carlson, T. [2019]. Petrophysical Report of the Dinantian Carbonates in the Dutch Subsurface. Report for the SCAN program, p. 22.
Eavor. [2021]. Eavor’s Ranging & Intersection. Retrieved from https:// www.youtube.com/watch?v=7Ig28shRjZA
Gutteridge, P., Ten Veen, J., Dewit, J., Garland, J., Riva, A., Mozafari, M., Jaarsma, B., and Van Melle, T. [2025]. Regional assessment of the ultra-deep geothermal (UDG) reservoir quality and potential of the Dinantian Zeeland Formation, the Netherlands. Geological Society, London, Special Publications, 548(1), SP548-2023–2106. https://doi. org/10.1144/SP548-2023-106
Lipsey, L., Pluymaekers, M., Goldberg, T., Van Oversteeg, K., Ghazaryan, L., Cloetingh, S., and Van Wees, J.-D. [2016]. Numerical modelling of thermal convection in the Luttelgeest carbonate platform, the Netherlands. Geothermics, 64, 135-151. https://doi.org/10.1016/j. geothermics.2016.05.002
Longfield, S., Schwarz, B., Hodder, M., Stuebing, T., Holmes, M., and Mölk, D. [2022]. Eavor LoopTM Commercial Project at Geretsried, Molasse Basin, Germany. European Geothermal Congress 2022, Conference Paper. https://www.researchgate.net/publication/366016670
Lowry, T.S., Finger, J.T., Carrigan, C.R., Foris, A., Kennedy, M.B., Corbet, T.F., Doughty, C.A., Pye, S., and Sonnenthal, E.L. [2017]. GeoVision Analysis Supporting Task Force Report: Reservoir Maintenance and Development. Sandia National Lab. (SNL-NM), Albuquerque, NM (United States).
Lowry, T.S., Foris, A., Finger, J.T., Pye, S., and Blankenship, D.A. [2017]. Implications of Drilling Technology Improvements on the Availability of Exploitable EGS Resources. 42nd Workshop on Geothermal Reservoir Engineering, Proceedings
Malek, A.E., Adams, B.M., Rossi, E., Schiegg, H.O., and Saar, M.O. [2022]. Techno-economic analysis of Advanced Geothermal Systems (AGS). Renewable Energy, 186, 927-943. https://doi.org/10.1016/j. renene.2022.01.012
Mijnlieff, H.F. [2020]. Introduction to the geothermal play and reservoir geology of the Netherlands. Netherlands Journal of Geosciences, 99(2). https://doi.org/10.1017/njg.2020.2
Mozafari, M., Gutteridge, P., Riva, A., Geel, K., Garland, J., and Dewit, J. [2019]. Facies analysis and diagenetic evolution of the Dinantian carbonates in the Dutch subsurface: overview and synthesis. Report for the SCAN program
Peeters, S.H.J., Mijnlieff, H.F., and Van Kempen, B.M.M. [2021]. Rapportage milieuhygiënische risico’s thermische vervuiling nabij geothermieputten. TNO
UNECE. [2019]. United Nations Framework Classification for Resources (UNFC). Retrieved 21 November 2024, from https://unece.org/ sustainable-energy/sustainable-resource-management/united-nations-framework-classification
Veldkamp, J.G., and Hegen, D. [2020]. Temperature modelling Dutch subsurface at depth Dinantian. Report for the SCAN program


February 2025
3-4 Feb EAGE Workshop on Carbon Capture and Storage (CCS) in Basalts www.eage.org
11 Feb Second EAGE Libyan Carbonates: Carbonate Geology and Its Role in Libya’s Exploration Success www.eage.org
17-19 Feb EGYPES 2025 www.egypes.com
18-20 Feb International Petroleum Technology Conference (IPTC) 2025 www.iptcnet.org
20-21 Feb GeoTHERM Expo & Congress 2025 www.geotherm-offenburg.de/en
26-28 Feb First EAGE Workshop on the Triassic and Jurassic Plays in Northwest Europe www.eage.org
March 2025
24-26 Mar 5 th EAGE Digitalization Conference and Exhibition www.eagedigital.org
April 2025
2-4 Apr 23 rd European IOR+ Symposium www.ior2025.org

13-16 Apr Innovative Technology for Reservoir Optimization: Fifth EAGE Well Injectivity & Productivity in Carbonates (WIPIC) Workshop www.eage.org
14-17 Apr International Scientific Conference on Monitoring of Geological Processes and Environmental Conditions www.eage.org


5-7









Join the largest multidisciplinary geoscience and engineering event as we showcase the latest solutions in oil and gas, CCS, renewables and infrastructure geosciences. REGISTER NOW AT







Technical & Strategic Programmes
Networking & Social Activities
Exhibition


Workshops, Field Trips & Courses


