Energy Transition
EAGE NEWS B iggest energy transition event is almost here
TECHNICAL ARTICLE AVO leads identified offshore South Africa CROSSTALK Geoscience in sport
With 90+ years of experience pioneering advanced technology to meet some of the world’s most complex challenges, we’re ready to face the demands of tomorrow. We are Viridien.
CHAIR EDITORIAL BOARD
Clément Kostov (cvkostov@icloud.com)
EDITOR
Damian Arnold (arnolddamian@googlemail.com)
MEMBERS, EDITORIAL BOARD
• Lodve Berre, Norwegian University of Science and Technology (lodve.berre@ntnu.no)
Philippe Caprioli, SLB (caprioli0@slb.com)
Satinder Chopra, SamiGeo (satinder.chopra@samigeo.com)
• Anthony Day, PGS (anthony.day@pgs.com)
• Peter Dromgoole, Retired Geophysicist (peterdromgoole@gmail.com)
• Kara English, University College Dublin (kara.english@ucd.ie)
• Stephen Hallinan, Viridien (Stephen.Hallinan@viridiengroup.com)
• Hamidreza Hamdi, University of Calgary (hhamdi@ucalgary.ca)
Gwenola Michaud, GM Consulting (gmichaud@gm-consult.it)
Fabio Marco Miotti, Baker Hughes (fabiomarco.miotti@bakerhughes.com)
• Martin Riviere, Retired Geophysicist (martinriviere@btinternet.com)
• Angelika-Maria Wulff, Consultant (gp.awulff@gmail.com)
EAGE EDITOR EMERITUS Andrew McBarnet (andrew@andrewmcbarnet.com)
PUBLICATIONS MANAGER Hang Pham (publications@eage.org)
MEDIA PRODUCTION
Saskia Nota (firstbreakproduction@eage.org) Ivana Geurts (firstbreakproduction@eage.org)
ADVERTISING INQUIRIES corporaterelations@eage.org
EAGE EUROPE OFFICE
Kosterijland 48
3981 AJ Bunnik
The Netherlands
• +31 88 995 5055
• eage@eage.org
• www.eage.org
EAGE MIDDLE EAST OFFICE
EAGE Middle East FZ-LLC Dubai Knowledge Village PO Box 501711 Dubai, United Arab Emirates
• +971 4 369 3897
• middle_east@eage.org
• www.eage.org
EAGE ASIA PACIFIC OFFICE
EAGE Asia Pacific Sdn. Bhd. UOA Centre Office Suite 19-15-3A No. 19, Jalan Pinang 50450 Kuala Lumpur
Malaysia +60 3 272 201 40
• asiapacific@eage.org
• www.eage.org
EAGE LATIN AMERICA OFFICE
EAGE Americas SAS Av. 19 #114-65 - Office 205 Bogotá, Colombia
• +57 310 8610709 +57 (601) 4232948
• americas@eage.org
• www.eage.org
EAGE MEMBERS’ CHANGE OF ADDRESS Update via your MyEAGE account, or contact the EAGE Membership Dept at membership@eage.org
FIRST BREAK ON THE WEB www.firstbreak.org
ISSN 0263-5046 (print) / ISSN 1365-2397 (online)
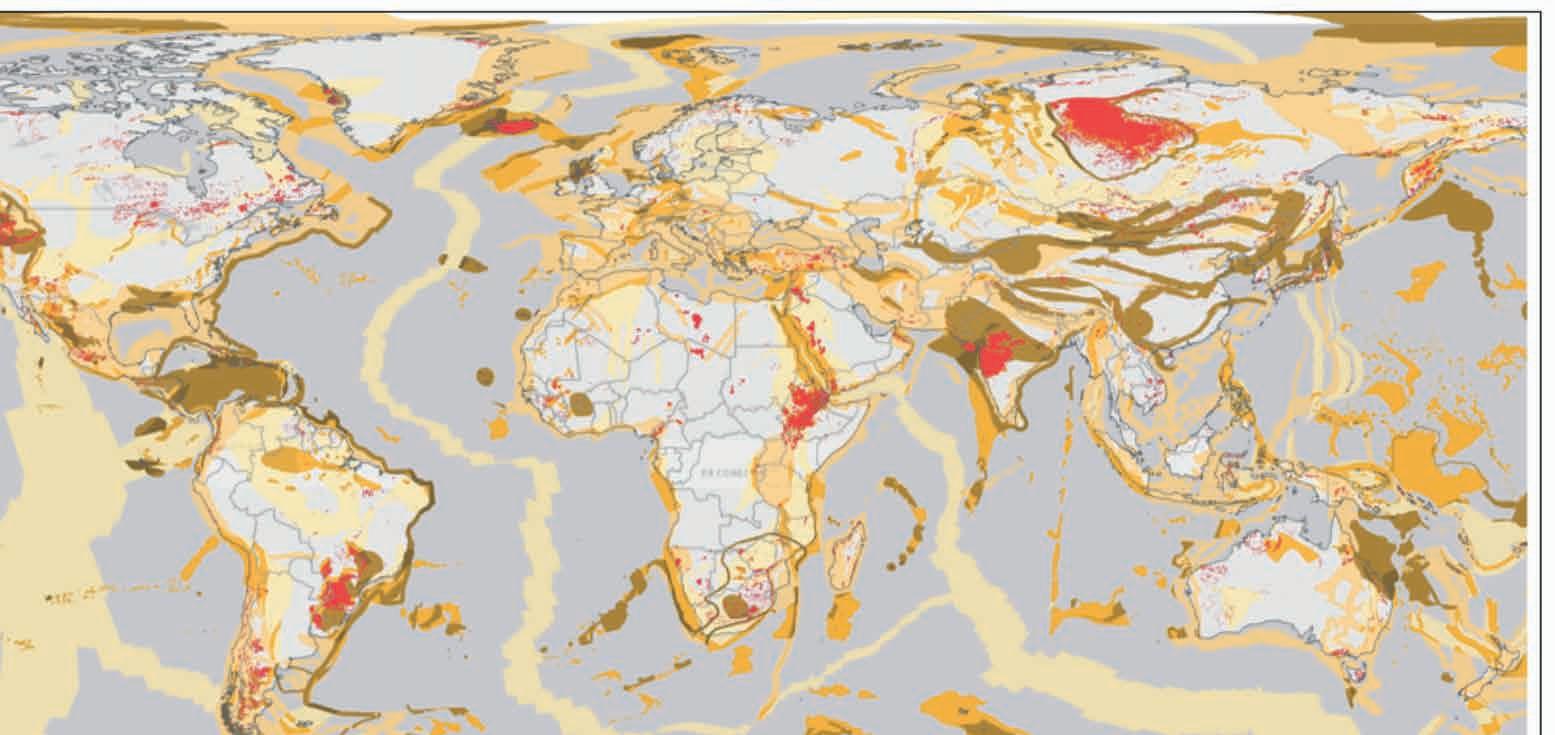
67 Mapping the potential for carbon storage in mafic and ultramafic rocks.
35 A consistent and integrated high-resolution stratigraphic framework for the Sokor Alternances in the R3 East Area, Agadem Basin, Niger Temistocles Rojas, Raul Bastante, Ed Robinson, Tim Wright and Christophe Ribeiro
43 Avo leads identified along the Natal Valley, offshore South Africa Sean Davids
Sp
ecial Topic: Energy Transition
51 The Storage Play Quality Index (SPQI): a multidisciplinary CO2 storage screening methodology
Gregor Duval, Robert Porjesz, Simon Otto, Carl Watkins, Mohammad Nassir, Alina Didenko, Pablo Cifuentes and Carolina Olivares
59 Seismic mini-streamers as a potential method for CO2 storage monitoring
Roya Dehghan-Niri, Åsmund Sjøen Pedersen, Mark Thompson, Anne-Kari Furre, Sandrine David, Harald Westerdahl and Tone Holm-Trudeng
67 Mapping the potential for carbon storage in mafic and ultramafic rocks
Paul Helps, Craig Lang and Eena Dadwal
75 Geothermal reservoir requirements for closed-loop well solutions to harvest geothermal energy
Kim Gunn Maver and Ola Michael Vestavik
81 Accelerating the energy transition using emerging geoscience skills
Philip Ringrose, Lasse Amundsen and Martin Landrø
89 A glimpse of the energy transition: Utah’s new energy corridor
Rasoul Sorkhabi, Palash Panja, John McLennan, Joseph Moore, Alan Walker, Robert Simmons and Milind Deo
95 Accelerated regional stratigraphic framework building for subsurface CO2 storage assessment
Sougata Halder, Keyla Gonzalez, Alex Fick, Vi Ly, Ben Lasscock, Zoltan Sylvester and Cameron Snow
102 Calendar
cover: Visualisation of the carbon cycle, from photosynthesis to fossil fuel combustion.
European Association of Geoscientists & Engineers Board 2024-2025
Near Surface Geoscience Circle
Andreas Aspmo Pfaffhuber Chair
Florina Tuluca Vice-Chair
Esther Bloem Immediate Past Chair
Micki Allen Contact Officer EEGS/North America
Hongzhu Cai Liaison China
Deyan Draganov Technical Programme Officer
Eduardo Rodrigues Liaison First Break
Hamdan Ali Hamdan Liaison Middle East
Vladimir Ignatev Liaison CIS / North America
Musa Manzi Liaison Africa
Myrto Papadopoulou Young Professional Liaison
Catherine Truffert Industry Liaison
Mark Vardy Editor-in-Chief Near Surface Geophysics
Oil & Gas Geoscience Circle
Yohaney Gomez Galarza Chair
Johannes Wendebourg Vice-Chair
Lucy Slater Immediate Past Chair
Wiebke Athmer Member
Alireza Malehmir Editor-in-Chief Geophysical Prospecting
Adeline Parent Member
Matteo Ravasi YP Liaison
Jonathan Redfern Editor-in-Chief Petroleum Geoscience
Robert Tugume Member
Anke Wendt Member
Martin Widmaier Technical Programme Officer
Sustainable Energy Circle
Carla Martín-Clavé Chair
Giovanni Sosio Vice-Chair
SUBSCRIPTIONS
First Break is published monthly. It is free to EAGE members. The membership fee of EAGE is € 80.00 a year including First Break, EarthDoc (EAGE’s geoscience database), Learning Geoscience (EAGE’s Education website) and online access to a scientific journal.
Companies can subscribe to First Break via an institutional subscription. Every subscription includes a monthly hard copy and online access to the full First Break archive for the requested number of online users.
Orders for current subscriptions and back issues should be sent to First Break B.V., Journal Subscriptions, Kosterijland 48, 3981 AJ Bunnik, The Netherlands. Tel: +31 (0)88 9955055, E-mail: subscriptions@eage.org, www.firstbreak.org.
First Break is published by First Break B.V., The Netherlands. However, responsibility for the opinions given and the statements made rests with the authors.
COPYRIGHT & PHOTOCOPYING © 2024 EAGE
All rights reserved. First Break or any part thereof may not be reproduced, stored in a retrieval system, or transcribed in any form or by any means, electronically or mechanically, including photocopying and recording, without the prior written permission of the publisher.
PAPER
The publisher’s policy is to use acid-free permanent paper (TCF), to the draft standard ISO/DIS/9706, made from sustainable forests using chlorine-free pulp (Nordic-Swan standard).
Our biggest energy transition event ever is almost here
With just a month to go, we are excited to be welcoming our global geoscience and engineering community, including professionals from the carbon capture storage, geothermal, hydrogen, energy storage, and offshore wind sectors, to the 5th Global Energy Transition Conference and Exhibition at the Convention Centre WTC in Rotterdam, on 4-7 November 2024. Here’s a glimpse of what you can expect.
Opening session
EAGE GET 2024 will kick off with the official opening session, where conference chair Yolande Verbeek, COO of EBN, along with EAGE president Valentina Socco, will deliver welcome addresses. The session will also include a presentation by the Minus CO2 Challenge winning team, the Marie Tharp Award ceremony recognising emerging talents committed to advancing energy system transformation, and key discussions with leading industry figures.
Technical Programme
The technical programme will feature nine distinct tracks, comprising over 340 presentations and more than 300 speakers.
These sessions are specifically structured to address critical topics across several domains. The Carbon Capture and Storage (CCS) programme will cover the entire value chain, including geological containment, advanced monitoring technologies, and reservoir modelling. Discussions on Geothermal Energy will put forward innovative potential assessments, well construction, and resource optimisation, with a particular focus on integrating geophysical techniques to enhance efficiency within the Dutch geothermal sector. The Hydrogen & Energy Storage track will cover a wide range of subjects, from the societal impacts of the hydrogen economy to the technical challenges associated with subsurface energy storage and
underground hydrogen storage, thereby positioning hydrogen as a vital component of future energy solutions. Offshore Wind Energy will feature sessions addressing risk management, geohazards, and the integration of geophysical and geotechnical data to optimise wind energy projects in increasingly complex environments. The dedicated sessions throughout the conference will address the technical, economic, environmental, and societal challenges associated with emerging energy technologies and practices. Key themes include the development and optimisation of energy resources, the integration of innovative technologies, and strategies for ensuring sustainability and safety across various sectors.

Strategic Programme
In addition to the technical sessions, the Strategic Programme will bring together top industry leaders to explore critical issues driving the global energy transition. Key topics will include building resilient value chains for the energy transition, bridging the gap between societal engagement and technological advancement, and the role of digitalisation in revolutionising technology, markets, and talent. You can look forward to joining our panellists from organisations such as the International Geothermal Association, Shell, BP, Ministry Economic Affairs & Climate, Imperial College, TGS, Viridien, Microsoft, Aker Solutions, and Utrecht University, along with many other leading companies and institutions.
Short courses, workshops, and field trips
GET 2024 participants can also look forward to an array of workshops, short courses, and field trips scheduled on the Monday before and Friday after the main conference, designed to offer a comprehensive and immersive learning experience. These side activities will explore both the technical and societal dimensions of subsurface usage and sustainable energy practices.
For example, workshops will tackle complexities like stakeholder engagement in geothermal energy, hydrogen storage, and CCS, offering a platform for discussions on innovative methods of stakeholder interaction beyond traditional expert circles. Another workshop will focus on geological risk assessment for geothermal and CCS, providing hands-on experience with core materials and specialised lab equipment at the PanTerra laboratory.
Complementing these workshops, a series of one-day short courses led by renowned instructors will cover topics such as offshore wind development, reservoir engineering for geothermal energy production, and CO2 storage project design and optimisation. For those with an interest in
communication and public engagement, a course on geoscience communication will offer expert guidance on effectively conveying complex technical issues to non-technical audiences, a skill that is increasingly vital in the energy sector.
Additionally, field trips to the HyStock hydrogen storage facility and the Porthos CO2 storage project beneath the North Sea will provide participants with an in-depth look at the practical implementation of the technologies and strategies discussed during the conference.
Exhibition
The exhibition is an essential stop for anyone looking to enhance their professional knowledge and connect with the innovators driving today’s energy transition. Here, you’ll have the opportunity to engage directly with the minds behind innovative and disruptive technologies or services across various applications in geoscience, decarbonisation, renewables, and circularity. Our diverse range of exhibitors includes major operators, universities, and industry associations. Additionally, a special zone on the exhibition floor will be dedicated exclusively to startups. EAGE is providing complimentary exhibition floor space and team registrations for selected startups to showcase innovative products and services to a global audience. It’s a chance to network, collaborate, and grow within the vibrant EAGE community. Whether you’re working on cutting-edge technology or have a new approach to sustainable energy, this platform will allow you to present your ideas to potential investors, partners, and customers.
Energy Transition Theatre
The Energy Transition Theatre in the exhibition area will host three days of dynamic discussions and interactive sessions dedicated to professionals in the energy transition sector and beyond, who play a vital role in achieving net-zero
With so much to offer, GET 2024 is shaping up to be an unmissable event for anyone involved in the energy transition. Don’t miss out on free visitor passes and early registration discount. Register by 1 October to take advantage of reduced fees. And if you want to get the full experience, opt for an all-access pass to join workshops, field trips, and short courses. For more details and to register, visit eageget.org.

emissions. This exclusive area will focus on three key topics on the three days: Finance & Insurance, Critical Minerals & Raw Materials, and the Net Zero Journey.
Energy transition student days
For students, the conference offers a unique opportunity to engage with the energy transition through the Student Days Programme which provides free entry for students and includes four days of learning lectures, offering a comparative analysis with traditional oil field projects in terms of energy content, emissions, profitability, and stakeholder perspectives. Participants will engage in hands-on experiences, analysing underground maps, well profiles, and other essential data. Working in teams, they will be tasked with proposing development plans for underground resources, tackling both technical and non-technical challenges. This immersive experience should not only enhance their knowledge but also equip them with practical skills to assess the feasibility of these projects from multiple perspectives. Students will gain particular insights into energy transition in the Netherlands, in line with the Paris Climate goals and national targets.
Social events
Networking opportunities are a key aspect of any conference, and the planned social programme. It begins with a Speaker’s Reception at Rotterdam City Hall on 4 November, providing an exclusive setting for speakers and committee members to mingle in a historic venue. The Icebreaker Reception on 5 November in the Exhibition Hall will offer all participants a relaxed environment to meet and reconnect over light refreshments. The highlight of the social programme is the Conference Evening the historic SS Rotterdam, a former ocean liner now serving as a unique event venue.
DUG MULTI-PARAMETER
FWI IMAGING UNVEILS
A LAND OF OPPORTUNITY
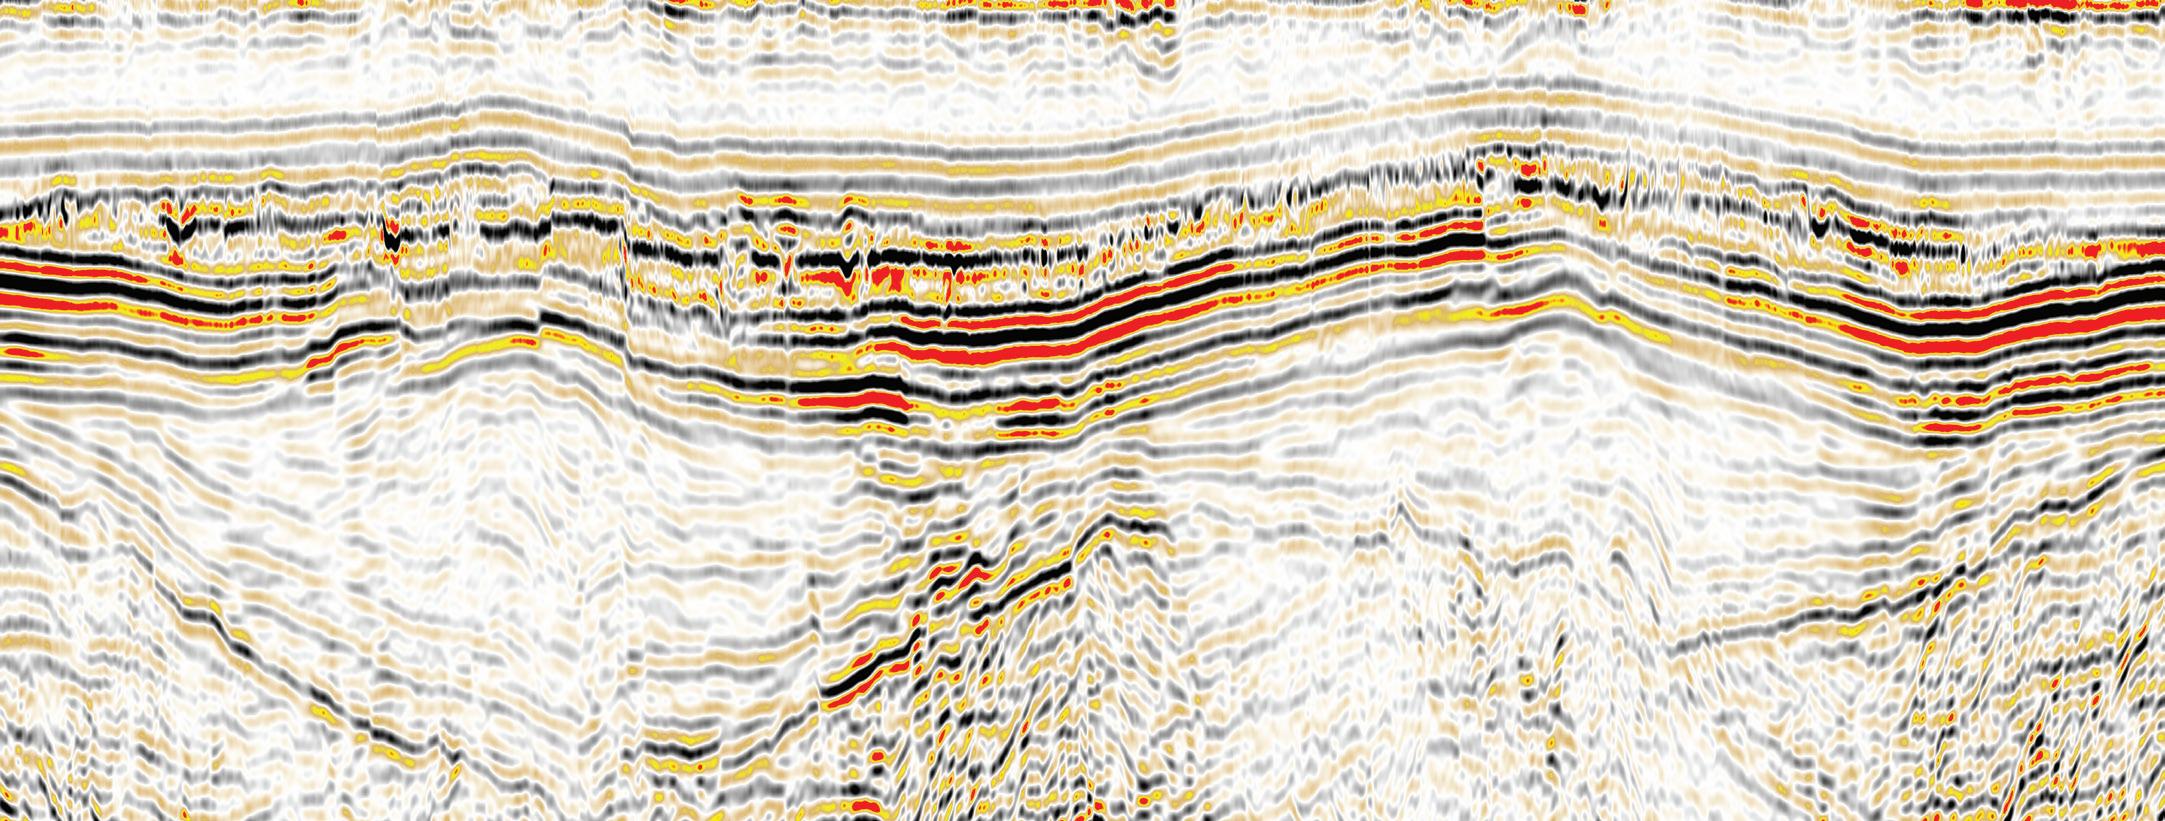
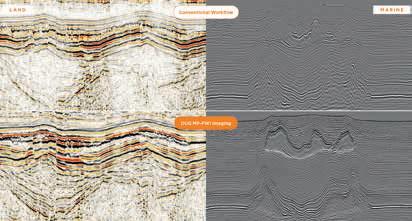
Vast opportunities await with DUG Multi-parameter FWI Imaging . Thanks to least-squares imaging of the full wavefield — including interbed multiples — DUG’s revolutionary technology achieves significantly better illumination and event continuity. It also resolves incredible near-surface detail. Superior results, in a fraction of the time — it’s an opportunity you don’t want to miss.
info@dug.com | dug.com/fwi
GET course to focus on communication skills for the transition
An exciting feature at EAGE GET 2024 conference will be the specialised course on Geoscience communication and public engagement, not least because it will be led by the high-profile geoscientist, Prof Iain Stewart, a world authority on the topic. He is currently the Jordan–UK El Hassan bin Talal research chair in sustainability, a new collaboration between the Royal Scientific Society of Jordan (RSS) and the British Academy. He is also UNESCO chair in geoscience and society, professor of geoscience communication, Sustainable Earth Institute at University of Plymouth, and an award-winning TV documentary maker on earth sciences.
The course is designed to arm participants with both the theoretical knowledge
and practical tools necessary to engage a broad audience learning how to collaborate effectively with media professionals, and discover the art of ‘storifying’ scientific data to create compelling narratives. Tailored for industry practitioners and academic researchers who are eager to enhance their communication skills, the course focuses on real-world applications. Through hands-on exercises, such as the Risk Communication Bowtie and the ABT Method (And, But, Therefore), participants will gain practical experience in crafting messages that not only inform but also engage and inspire action. This takes into account that geoscientists often work on projects that have far-reaching implications for society, from energy pro-
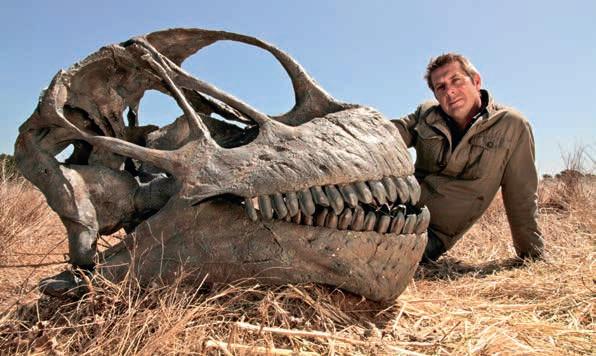
duction to environmental sustainability, which may be sources of public concern or controversy. There are no prerequisites to take part in the course, making it accessible to anyone with an interest in geoscience communication.
Prof Stewart on the communication challenge
How does this course specifically help geoscientists overcome common communication challenges?
The communication challenge that geoscience faces in connecting to the wider public is twofold. The first is simply the issue of familiarity. Most people don’t think much about geology – or the planet – much in their everyday activities and don’t encounter geoscientific issues. Of course, issues around energy are part of everyday discussions, but the association with geology, the subsurface, etc is not a topic of conversation. So, how do we make people care about our geoscientific world? For that reason, finding ways to link geoscience issues with the ‘matters of concern’ that people have is an important consideration which the course will deal with.
The second issue is that the general public has an increasingly negative view of the traditional extractive resource sector, both mining and hydrocarbons, which many see as exploitative and a major part of the climatic and ecological crisis that society is facing. By
contrast, geoscientists in those sectors see themselves as a big part of the solution to those societal issues, and so finding new narratives that highlight the important role of mining and materials is another issue that the course will address.
What role does storytelling play in shaping public perception of geoscience topics?
Storytelling is probably the single most important communication skill that geoscientists have in connecting ourselves to the outside world. The good news is that we have it. Geologists are natural storytellers, and the work we undertake in unravelling the history of the planets through the rock record is intrinsically about developing a compelling a historical narrative about humanity’s deep past. So the challenge is to remind geoscientists of this and to show how we already use storylines in communicating our technical science. We just need to develop better and more engaging storylines to draw in the non-geological audiences that we want to reach.
How important is it for geoscientists to engage with local communities and stakeholders?
Probably the most important people to reach are those local communities and stakeholders that are connected with specific energy projects and developments that we are involved with. The lazy approach is to presume a Nimby attitude amongst local people and assume that simply giving them the facts will secure the ‘social licence to operate’. In fact, social acceptance is built on multiple layers of transparent interaction and trusted relations in which the communication involves as much listening as talking. The tricky message for geoscientific specialists is that mapping the ‘community play’ is as important as mapping the ‘subsurface play’ if we want to ensure the long-term sustainability of our energy project. As a sector we need to spend a lot more time and resource on developing the communication skills to do that.
I’ll catch you on the course at GET 2024!
Toulouse is perfect setting for the EAGE Annual in 2025
There’s lots to look forward to when the EAGE Annual Conference & Exhibition convenes next year in the vibrant city of Toulouse. Renowned as the world capital of aeronautics and the European hub for the space industry, Toulouse provides an inspiring setting for a gathering focused on innovation and sustainability in geoscience and engineering. From 2-5 June 2025, the city will serve as the focal point for our global community’s efforts to explore new frontiers and drive a more sustainable future.
Our theme, ‘Navigating Change: Geosciences Shaping a Sustainable Transition’, finds a fitting stage in Toulouse. With institutions like the University of Toulouse at the forefront, the city is a leader in pioneering studies in earth sciences and environmental technologies. It is also closely connected to energy innovation in nearby regions, such as Pau. Beyond the professional landscape, Toulouse invites discovery. With its
unique blend of historical architecture and modern design, it is often referred to as ‘La Ville Rose’ or ‘The Pink City’ reflecting its distinctive pink terracotta buildings that glow warmly in the sunlight.
The Cité de l’Espace and the Aeroscopia Museum offer interactive experiences that bridge science and history, giving attendees a deeper understanding of the technological advancements shaping both the past and future of space and aviation. These attractions resonate strongly with our community, reflecting the spirit of exploration and discovery that is central to geoscience and engineering.
Walking through the city’s picturesque streets, you’ll discover a vibrant array of markets, where you can sample local delicacies like cassoulet, and Toulouse sausage. The city’s culinary scene is diverse, ranging from traditional bistros to contemporary restaurants that showcase innovative takes on French cuisine. For those interested in experiencing the
lively nightlife, Toulouse offers a host of bars, music venues, and cafes where networking can continue in a relaxed and informal atmosphere.
Toulouse’s location in southwestern France also means easy access to some of the country’s most beautiful natural landscapes. The nearby Pyrenees Mountains offer stunning vistas and diverse geological formations.
Join us for the Toulouse experience while attending the EAGE Annual Conference & Exhibition from 2-5 June 2025.
Renew your commitment to innovation in 2025
Just so you don’t miss out on all the services, events and benefits that EAGE has to offer, we encourage everyone to renew their membership early and ensure that 2025 will be a rewarding experience in the geoscience and engineering community.
And don’t forget our loyal members Recognition Programme, which acknowledges your continuous commitment by rewarding you with additional perks the longer you are a member. These include more discounted rates for events and courses, expanded access to the EarthDoc archive, and eligibility for various support programmes.
One of the most remarkable aspects of EAGE is its diverse network of communities, including technical and non-technical groups, local and student chapters. Next to these, an active global calendar of conferences, workshops and training courses,
both multi-disciplinary and specialized, empower dialogue and new ideas. This rich tapestry of opportunities allows members to connect on various levels and across many different interests.
So whether you are a seasoned professional or just beginning your journey in geoscience and engineering, the EAGE network offers you a space where you can connect, learn, and grow. As one of our members, Pedram Masoudi (senior geostatistician and geophysicist at Geovariances, and secretary for Local Chapter Paris) puts it: ‘Insightful, professional and friendly discussions. It is the magic of healthy professional associations.’ This magic is what makes EAGE a unique and valuable community for all its members.
We also take pride in supporting emerging talent and younger members.
As Tiziana Vanorio, professor at Stanford University and former chair of the EAGE Awards Committee, says, ‘Our commitment to education and research is at the heart of our efforts to advance sustainable energy solutions and responsible environmental practices. This work is crucial for nurturing the next generation of geoscientists and engineers, providing them with the tools and confidence they need to succeed’.
Hopefully early renewal of your membership will not just be a routine task but a commitment to your own continued professional development. By renewing now, you can secure uninterrupted access to the wealth of benefits that EAGE membership offers throughout 2025. We are excited about the opportunities that lie before us and look forward to the new achievements we can accomplish together.
Popular geothermal energy course now available online
With the aim of further disseminating knowledge among our members, especially regarding energy transition demands and challenges, our in-person course Reservoir Engineering of Geothermal Energy Production has been made available in an extensive online format. Starting on 12 November 2024, this new version combines self-paced learning material with interactive sessions with the instructor, providing a deep-dive learning experience that adapts to your time availability.
Guided by Dr Denis Voskov, associate professor at TU Delft with 20 years of experience in reservoir modelling, participants will deepen their knowledge on geothermal energy production and engineering by emphasising direct-use geothermal resources. He says, ‘Global energy demand is rising, accompanied by the urgent need to
address climate change. Geothermal energy is a renewable energy source that has the potential to produce electricity and heat. However, geothermal resources for electricity generation are limited and unevenly distributed across the globe. Direct-use geothermal systems are capable of covering this demand with the resources wildly available worldwide. That explains why direct heat geothermal systems are rapidly developing and can significantly reduce the application of fossil fuels for heating purposes’.
Topics being covered in the course include the physical phenomena involved in geothermal energy production, the types of geothermal resources available, and the key principles of reservoir simulation and their application to geothermal energy modelling. The learning experience is complemented with several build-forpurpose simulation exercises in Jupyter Notebooks using the DARTS (open-source Delft Advanced Research Terra Simulator) framework. The first hands-on exercise explains the development of a basic geothermal model with all important gradients, and evaluates sensitivities to numerical and physical parameters; the second, explores
the effect of overburden and realistic heterogeneity, as well as their impact on energy production, and the third, introduces a fractured reservoir and explains how different parameters of fractured systems affect geothermal production.
Upon completion of the course, you’ll be able to understand basic physical concepts of geothermal energy production; operate with the main concepts of reservoir simulation for geothermal applications; create a basic geothermal model for realistic fluvial or fractured reservoirs, and understand the importance of different numerical and physical properties to the prediction of geothermal energy production.
For geophysics or engineering (petroleum, civil, or environmental) students or professionals, with experience of basic Python programming and interested in pursuing a career in energy transition-related fields, this is an opportunity not to be missed. EAGE members benefit from discounted registration fees, so if you are not a member yet, join or renew your membership at eage.org.
LANDRØ
CCS Technical Community gets down to work in Oslo
Community chairs, Audrey Ougier-Simonin (BGS) and Matthias Imhof (ExxonMobil), present some highlights from the dedicated session held at the 2024 EAGE Annual on Offshore CCS.
Our dedicated session entitled ‘Offshore CCS: A North Sea Perspective’ was a celebration for the kickoff of the new EAGE Technical Community on CCS. Operators, service providers, researchers, and regulators joined in to share an aspect of their work, giving the audience a broad vision of the progress in the region deemed to be a major CCS hub.

Looking at the Southern North Sea, MacBeth et al modelled fluid-related seismic timelapse signals for storage scenarios in saline aquifers and depleted gas reservoirs, which are the two main CO2 storage concepts in the North Sea. For saline aquifers, they concluded that the seismic timelapse response should be large and observable even with low-cost acquisition, though intra-reservoir complexity may require more attention. For depleted gas reservoirs, the pressure response will be readily visible but swamping the saturation change. The base reservoir response may be ‘just’ detectable with dedicated towed streamer data.
Sorbier presented an overview of the Aramis project in the Dutch offshore sector. As a successor to the Porthos project, the Aramis project can use learnings from the Porthos application process. The concept is to reuse depleted gas fields for carbon storage and leverage existing infrastructure. In the presentation, Sorbier shared
aspects of the field screening process, the value chain, the impacts of the installation design and store development plan, and the MMV design. Two key learnings were the need for adoption of a learner mindset and risk perception of different stakeholders.
Using vintage data from the Sleipner storage site, Martinez et al. presented learnings from timelapse full-waveform inversions (FWI). Prior studies of timelapse FWI at Sleipner relied on the reflected wavefield only and struggled with reconstruction of low-frequency velocity trends. Here instead they combined reflected and transmitted wavefields to obtain velocities and images that help understand the multilayer CO2 system with feeders and conduits routing CO2 between layers.
Meneguolo et al reported on the influence of clay mineralogy on the reservoir pressurization capacity at Northern Lights. They presented a multi-disciplinary, multi-scale approach that combined seismic interpretation and well-based rock measurements including wireline log interpretation, extended leak-off tests and sample-based microfracture testing, and analysis of rock composition. They found that thickness and compositional variations of the top seal occur outside the critical project area.
Inspired by Greensand, Al Khatib et al proposed the concept of predictive maintenance for CCS monitoring where focused seismic data is integrated with dynamic model predictions. Dynamic models draw on geological data, well information, seismic interpretations, and legacy production parameters. These models serve as essential tools in planning and monitoring underground CO2 injection projects. Permit applications, risk assessments, and the economics of CCS projects are developed using these models. Focused seismic surveillance tests the model predictions in time and space, and either triggering no action, a model tweak, or a more detailed follow-up survey.
Archibald et al presented an overview of the Smeaheia storage site and how
the operator (Equinor) is maturing the subsurface concept toward commercial operation. Despite the abundance of data in the adjacent Troll field, the large licence area is data poor. As is typical in most saline aquifer storage projects, there is a lack of well coverage, core data, fluid samples and dynamic data. Appraisal and de-risking of key subsurface uncertainties (injectivity, permeability, time-depth conversion, formation pressure, and trap seal) is limited when compared to oil and gas projects where observed fluid contacts prove such elements as hydrocarbon migration, trap and seal integrity. The operator will drill two exploration wells to reduce the uncertainty range in current storage volume estimates and to test upside potential in reservoir intervals not currently included in the storage concept.
Also focusing on Smeaheia, Butar and Carballares showed a workflow for enhanced fault interpretation and structural framework building to reduce uncertainty and cycle time. Their workflow is based on machine learning (ML) and requires labelling a few seismic inlines and crosslines as input. The result is a fault prediction cube that improves the understanding of the extensional fault development in the storage complex. They also observed the resulting fault sticks to be more consistent than manual picks which reduces uncertainty in the structural model.
The enthusiastic discussions clearly highlighted the strong desire and need for opportunities to share experiences and learn from one another. We hope that our new community on CCS will serve as an effective platform to fulfill this need. Eager to know more? Check out the session’s proceedings in EarthDoc.
Connect with the EAGE Technical Community on CCS
Natural hydrogen: hope or hype was the question at the Annual
‘Natural hydrogen potential assessment and modelling’ was topic of a Dedicated Session at the EAGE Annual Meeting in Oslo. Session convenors Bjorn Wygrala (SLB, retired), Johannes Wendebourg (TotalEnergies), and Thomas Hantschel (Terranta) report.
Our understanding of natural hydrogen resources is at a very early stage, but there is agreement that the geological systems and modelling approach developed for petroleum systems in hydrocarbon exploration is transferable to the geologic properties and processes controlling the generation, migration and accumulation of natural hydrogen. The hydrogen systems concept provides a geoscientific framework for structured exploration risk analysis and, accordingly, the talks in the Dedicated Session followed a similar logic covering: hydrogen sources, hydrogen exploration, and hydrogen systems modelling.
Hydrogen sources
There is currently a general agreement that the dominant source of natural hydrogen in the subsurface is serpentinisation, a high-temperature (250-300°C) water/rock interaction process that occurs in iron-rich rocks. The generation process is rapid at geological time scales and recent discoveries of active hydrogen seepage in the subsurface, as found for example in coal mines, confirm our understanding of this process. Two other generation processes are radiolysis and very late maturation of organic matter such as coals.
Moretti et al from University of Pau presented pyrolysis results from coal samples in Colombia that show that hydrogen generation from organic matter starts after methane generation at about 210°C and can continue until 400°C. The conclusion was that ‘the potential of organic matter to generate H2 must be taken into account’, and ‘the resource potential of H2 is substantial’.
Horsfield et al from GeoS4 noted that the ability of organic matter to generate H2 is independent of the type of kerogen, and that the main generation occurs in the 200-300°C range. The potential H2 yields are high, and assessments have been made in many basins. ‘Organic matter is a proven source of H2, however due to the high reactivity and mobility of H2, the extent
to which H2 can be preserved remains unclear’.
Hydrogen exploration
The proof-of-concept for the existence of accumulations of producible natural hydrogen is the Bourakébougou field in Mali. Key points are documented in two recently published papers (Maiga et al, 2023 and 2024). Since 2012, production from a stacked Neoproterozoic reservoir system without any pressure decline shows that the hydrogen reservoir is a dynamic system that is being progressively recharged at the production timescale. This observation already indicates some key characteristics of H2 accumulations to guide global exploration efforts.
Brouwers et al from Getech presented technical exploration strategies using a hydrogen systems approach comparable to petroleum systems analysis used in oil and gas exploration. Initial exploration is basin-wide and includes traditional basin modelling to determine temperatures, pressures and regional and local subsurface water flow patterns. Results can then be utilised for hydrogen play-based exploration and play-to-prospect risk analysis. These must then be integrated with commercial factors to address H2-specific challenges. Brouwers concluded that while natural hydrogen resources could evolve to be a very attractive target, significant technical and commercial challenges still need to be overcome.
Lefeuvre et al from Grenoble University presented a method to access and screen legacy geoscience data bases for the occurrence of H2, most of which are non-digital. This is especially important in oil and gas bearing basins with long production histories and thousands of wells (millions in the US!). Here, hydrogen is usually neglected as oil and gas exploration is not targeting hydrogen. However, it is occasionally recorded, and this information can have significant value for hydrogen
exploration campaigns. The authors developed a practical IT solution to screen the entire French national database of the Office of Exploration and Production of Hydrocarbons (BEPH). Two basins of interest have been identified: the Aquitaine Basin where H2 occurrences align with the geological context, and the Paris Basin where H2 occurrences were unexpected. These findings have prompted further geological investigations to characterise the key elements that control the hydrogen systems.

Hydrogen systems modelling
While hydrogen systems might initially appear to have much in common with petroleum systems, there are also critical differences in the controlling properties and processes. Key topics include subsurface water flow systems, their scales and controls including faults, and the time scales on which H2 generation and migration occur. New developments in reactive transport modelling have become important tools to investigate the differences between petroleum and hydrogen systems.
Ellis et al of the USGS summarised current global activities in natural hydrogen exploration and production, including exploration in Mali, USA, France, Spain and Australia, and stimulation efforts in Oman. A central component of these activi-
ties is the development of a conceptual geological model of hydrogen systems, using elements from petroleum, mineral and geothermal systems analyses. An example was given from the Mauléon Basin in France where a hydrogen system sourced from the serpentinised mantle is modelled where migration is controlled by meteoric water infiltration and advective flow along faults to charge potential shallower reservoirs. Fault properties and water flow systems are calibrated with hydrogen seeps at the surface. For Ellis et al, the ability to analyse the overall cause and effects of properties and processes in the system demonstrates the value of reactive transport modelling to guide natural hydrogen exploration.
Cacas-Stentz et al from IFP Energies Nouvelles discussed how to model faults and their properties which are essential in modelling solute transport, e.g., lithium, and migration of free and dissolved natural hydrogen. Applications of regional scale hydrodynamic modelling to natural hydrogen systems were presented, demonstrating the sensitivity of potential accumulation sites to fault properties and scale issues, and highlighting risk factors related to migration and entrapment of hydrogen. It was further noted that new applications of these adapted simulators are not only related to hydrogen systems, but also to mineral systems.
Hidalgo et al from SLB discussed how traditional petroleum systems modelling software can be adapted to also model hydrogen systems. The dominant process
computational frameworks of reactive chemical processes. Other generation processes that can be modelled are radiolysis of water and decomposition of organic matter. Hydrogen transport is handled by PT-controlled aqueous transport. Hidalgo opined that hydrogen migration is best modelled using invasion percolation as it provides an optimum balance of accuracy and processing performance, whereas entrapment can be based on standard petroleum systems approaches.
Palmowski et al from Terranta presented a new-generation simulator specifically designed for hydrogen and mineral systems. Hydrogen generation via serpentinisation is a geologically very rapid process, especially at temperatures >200°C. Another generation process is radiolysis, a slow but continuous process which is based on the split of water by radiation from rocks containing traces of radioactive elements. Both generation and related transport processes can be simulated with fast processing tools on present-day geometries. Grids can be refined around fault zones, and processes that are controlled by H2 concentrations in source rocks as well as water availability and flow rates can be investigated. The assessment was that newly developed hydrogen systems modelling tools have reached a development stage that enables complex hydrogen-specific processes and controlling factors to be analysed from regional to local scales.
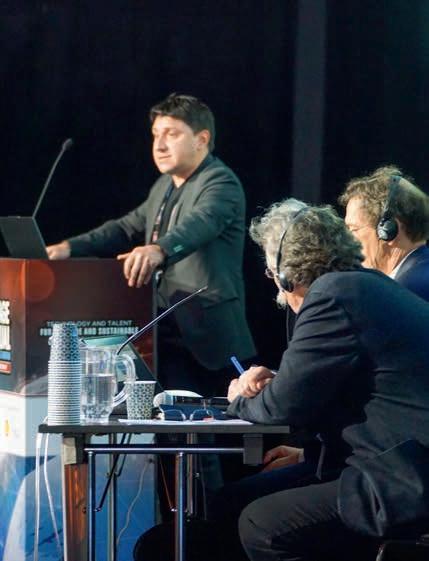
vided an excellent overview of the latest technical developments in this area and a useful range of topics and talks by speakers from research organisations and service companies. Notably absent were E&P operators. They have a wait-andsee attitude towards this new exploration paradigm as commerciality of natural hydrogen so far remains unproven. The session convenors, committee members of the EAGE Technical Community on Basin and Petroleum Systems Analysis, would like to thank all the speakers and remind readers that all extended abstracts are available on EarthDoc.
Technical Community on Basin and Petroleum Systems Analysis
EAGE Student Calendar
Thematic collections planned for Geoenergy and Petroleum Geoscience
Geoenergy and Petroleum Geoscience , two journals co-owned by the Geological Society of London and EAGE, are aiming to compile thematic collections focusing on the transferable knowledge and integration of various disciplines across the emerging energy hubs of Asia Pacific, Africa, and the Eastern Mediterranean.
Petroleum Geoscience thematic collection:
Geoscience driving the North Africa and Eastern Mediterranean energy hub
North Africa and the Eastern Mediterranean area is poised to be a critical global energy hub in the 21st century. Unlocking oil and gas resources, developing CCS and new renewable energies such as offshore wind, hydrogen/helium, geothermal, and associated critical resources will add a cyclic economy component and cross sectorial value to the needs of the region.
For this reason, Petroleum Geoscience is launching a thematic collection to further understand the complex regional geology, the development and evolution of structural styles, depositional systems and their implications for the prospectivity, and further potential of North Africa and the Eastern Mediterranean.
Guest editors are: Jonathan Redfern (University of Manchester) and Ioannis Alexandridis (Hellenic Hydrocarbons and Energy Resources Management Company).
Geoenergy thematic collection: CCS in the Asia–Pacific region
Momentum is building in the Asia Pacific (APAC) region for increased decarbonisation spurred by government policy development and cross-border industrial partnerships. Australia, Indonesia and
Malaysia for example are progressing the carbon capture and storage (CCS) hub concept where carbon dioxide can be imported from countries with less suitable geology for CCS such as Japan, Korea and Singapore. These hubs are generally aiming at storage in depleted oil and gas fields or saline aquifers in regions where infrastructure is available and government regulations are in the main supportive. Most APAC governments have set ambitious climate-related targets, although often the current goals are not entirely supported by existing plans in place. McKinsey notes that in order to deliver on the climate pledges made, >60% of the world’s future carbon abatement (>3 GT p.a. by 2050) would have to be realised in the APAC region.
The collection is looking for contributions from all aspects of geoscience related to CCS in the APAC region. The research topics include, but are not limited to: CO2-rock interaction studies on CO2 storage effects; Field-scale studies on reservoir characterisation, injectivity, and storage capacity; Advances in modelling such as multi-phase flow, AI/ML, and uncertainty analysis; Case studies from pilot or industrial storage projects; Geological and techno-economic analysis for CCS hub sites; Developments such as hydrogen or bioenergy with CCS; Cross-border CO2 storage options; and Monitoring onshore/offshore injection reservoirs.
How to submit articles
Guest editors are: Farhana Jaafar Azuddin (Petronas, Malaysia), Lisa Chisholm (Drax, UK), David Dewhurst (CSIRO, Australia), Takeshi Tsuji (University of Tokyo, Japan), and Vikram Vishal (IIT Bombay, India).
Geoenergy thematic collection: The minerals-energy nexus in Africa
Geoenergy is calling for a range of articles that recognise and demonstrate the knowledge base relating to critical and strategic raw materials for the energy transition, from an African perspective, to be published in the thematic collection. Africa has a wealth of energy-critical resources and the nature of the resources (oil and natural gas, uranium, critical metals, and bulk transition metals), their surface or subsurface location, and international demand dictate whether raw materials are a curse or a blessing. The extraction of raw materials is exchanged for environmental damages and accelerating waste generation. This ecologically unequal exchange intersects with raw materialism, which integrates global and local natural and social processes in a competition between economies, to secure access to growing volumes of raw materials at lower costs. The designation of raw materials as ‘critical’ is an action of raw materialism in industrialised economies and an admission of dependence on resource-rich nations. The
Contributions to these thematic collections are welcome until 30 April 2025. Manuscripts should be prepared according to the author’s guidelines published on the Geoenergy/Petroleum Geoscience websites and submitted using the respective journals’ online submission webpages. When submitting manuscripts, make sure to identify the thematic collection by selecting it from the ‘Section/ Category’ drop-down list. Submission is free-of-charge. For queries, please contact the Editorial Office at geoenergy@geolsoc.org.uk (for Geoenergy) and pg@geolsoc.org.uk (for Petroleum Geoscience).
Africa Mining Vision (AMV) lays out Africa’s own response to the paradox that mineral wealth does not create local and regional benefit. The AMV has the aims of increasing knowledge-based services as well as protecting mining workers and communities, and their environment.
Research approaches that will be accepted for this collection include: Petrology and geochemistry of African
ore deposits for energy-critical commodities; Geometallurgical approaches and environmental impacts; Geological and numerical modeling of ore bodies; Extractive waste alongside their risks and opportunities; Societal, economic, and policy issues in raw material exploration; Role of knowledge-based institutions in policy development; Life cycle analysis and resource management strategies for
responsible sourcing of raw materials; and Impact of global warming on extractive operations and worker safety.
Guest editors are: Annock Chiwona (Geological Survey, Malawi), Michael Musialike (Copperbelt University, Zambia), Ishmael Quaicoe (University of Mines and Technology, Ghana), and Gabriel Ziwa (Copperbelt University, Zambia).
Young professional awards announced
EAGE is proud to recognise outstanding young professionals who have become recipients of the newly established EAGE Marie Tharp Award, and the Petroleum Geoscience and Basin Research Early Career Awards 2023.

Marie Tharp Award 2024
The Marie Tharp Award is dedicated to recognising promising and creative talents among the next generation of leaders who are committed to transforming energy systems and accelerating the global energy transition. We honour Samuel Zappalà, PhD in applied geophysics at Uppsala University, as the first recipient of this prestigious award.
Valentina Socco, EAGE president, said: ‘Inspired by a talented and visionary scientist who changed our perspective of the Earth, this award is aimed at recognising a talented young professional who will contribute to make our relationship with the planet sustainable’.
Accepting the award, Samuel Zappalà said: ‘In my work with onshore reflection seismology, I focus on acquisition and processing techniques development, often optimised and applied for energy transition purposes. Two examples of this are: my master’s thesis, where advanced seismic reflection imaging methods were
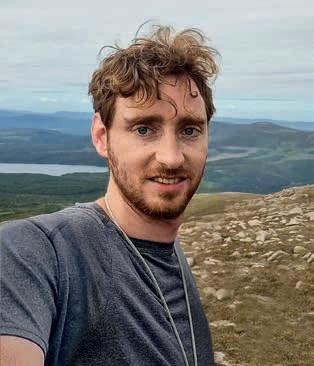
applied to increase the production of one of Europe’s main geothermal fields, and the main project of my PhD, where seismic reflection acquisition and processing techniques were developed and optimised for onshore CCS reservoir investigations. When EAGE announced the Marie Tharp Award, I immediately felt its relevance towards our community and our future. Opportunities like this help us young professionals spread our works and ideas, while encouraging more research focus towards the inevitable transition.’
Zappalà receives a grant to attend the EAGE GET 2024 Conference, taking place in Rotterdam next month, from 4 to 7 November.
Petroleum Geoscience Early Career Award
The Petroleum Geoscience Early Career Award is presented annually for the best paper published in the journal by an author in the early stages of their career. This year, we honour Dr Mateus Basso,
Congratulations to Samuel Zappalà, Mateus Basso, and Daan Beelen for their outstanding accomplishments. Their dedication, innovation, and scholarly achievements are paving the way for a more sustainable and informed approach to our industry’s challenges.
research geologist at CEPETRO-UNICAMP, for his paper ‘Characterisation of silicification and dissolution zones by integrating borehole image logs and core samples: a case study of a well from the Brazilian pre-salt’, published in Petroleum Geoscience, 29(3).
The Aptian, non-marine carbonate reservoirs of the Santos and Campos basins, offshore Brazil, are particularly known for being an unusual succession of carbonate facies affected by a complex diagenetic history. Over the past two decades, the knowledge of these pre-salt carbonates has greatly advanced, yet many scientific-frontier problems remain unsolved. Among the geological puzzles of the PreSalt, the silicification process has played a major role in creating and modifying reservoir characteristics. The study by Basso et al. (2023) focuses on the geological and petrophysical characterisation of a special well that penetrated silicified reservoir intervals in the Santos Basin. By integrating well-recovered cores with
a suite of well logs, the study provides insights into the different types of silica and their relationships with natural fractures and carbonate dissolution. The study underscores the importance of integrating borehole image logs and core samples description as well as multi-scale petrophysical approaches to properly assess the impact of silicification and carbonate dissolution.
The study contributes to our understanding of carbonate reservoirs affected by silicification and dissolution while providing support for the recognition of such processes in partially- or non-cored wells.
Mateus Basso says: ‘Being honoured with the Early Career Award is a deeply appreciated recognition for our work. The award inspires us to persist in our efforts to further advance the understanding of the remarkable carbonates in the South Atlantic provinces.’
Basin Research Early Career Award
The Basin Research Early Career Award is presented annually to recognise research published in the journal that marks a
significant step forward in our understanding of sedimentary basins and completed within three years of thesis completion. We congratulate Dr Daan Beelen (assistant professor, Utrecht University) on winning this year’s award for his paper ‘Predicting bottom current deposition and erosion on the ocean floor’, published in Basin Research, 35(5).
The deep ocean is the world’s most extensive surface type, yet it remains the least understood. In fact, most of our planet consists of the abyssal plain, yet only 15-20% of these regions have been mapped to any extent, let alone in high resolution. Although often considered relatively featureless, these areas harbour fascinating geological treasures that are largely unknown to the general public. For example, the Zapiola abyssal dunefield, located offshore of Argentina, contains giant, moving abyssal dunes that are over 120 m tall and cover an area ten times the size of England.
Daan Beelen explains: ‘These regions are not only of scientific interest but also hold significant potential for natural resources. In my paper, I aim to predict the
distribution of thermohaline bottom current deposits and zones of erosion across the entire ocean floor. Understanding these patterns could provide insights into where potential resources and scientifically important sedimentary deposits are located. For instance, zones of persistent bottom erosion can deflate surrounding sediments, isolating and locally enriching the ocean floor with mineral-rich nodules. These minerals are not only potentially profitable but also critical for technological advancement, especially as the global stock of rare earth minerals is declining faster than it is being replenished.’
Beelen adds: ‘With this award, I hope to give a small impetus to deep ocean geological research, particularly in the abyssal plain, which I believe is extremely understudied. Fortunately, the available data on deep ocean geomorphology and sedimentology is rapidly increasing, with projects like HYCOM providing state-ofthe-art model predictions and deep-sea data publication initiatives like GEBCO. I hope that future studies will build upon my work and lead to even more fascinating research.’
Fifth carbonate well injection and productivity workshop returns to Doha
The fifth edition of the EAGE Workshop on Well Injectivity and Productivity in Carbonates (WIPIC) will be held from 14 to 16 April 2025 in Doha, Qatar. It is a follow-up to the very successful fourth edition which was held from 21 to 23 March 2022 also in Doha and attracted more than 100 participants.
For optimal field development, injectivity and productivity of wells are essential, especially in heterogeneous reservoirs such as carbonates. However, incorporating other elements, such as geological modelling, reservoir simulation, reservoir management, history matching, uncertainty assessment, and enhanced recovery mechanisms, is crucial as we move towards a multi-disciplinary approach to problem-solving. Feedback from the initial WIPIC workshops had already pushed us to expand the workshop scope, instead of just focusing on well injectivity and productivity. We will therefore continue to do so for this fifth edition, whose theme will be ‘Innovative Technology for Reservoir Optimization’.
For this upcoming WIPIC workshop, we are excited to introduce new topics: digitalisation, machine learning, and
artificial intelligence. These cutting-edge technologies promise to revolutionise our approach to reservoir management by enhancing data analytics, predictive modelling, and decision-making processes.
With representatives from national oil companies, international oil companies, service providers, universities, and research institutes, this workshop is designed to appeal to subsurface specialists in well stimulation and completion, log analysis, petrophysics, pressure transient analysis, reservoir geology and geophysics, applied mathematics, data science, geo-statistics, and reservoir engineering. It will also be valuable for subsurface generalists and reservoir managers.
WORKSHOP REPORT
Middle East workshop highlights key hydrocarbon seals challenges
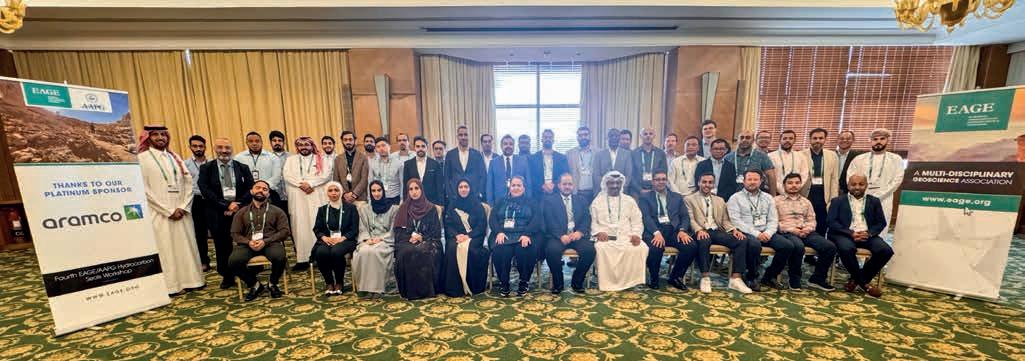
A successful Fourth EAGE/AAPG Hydrocarbon Seals Workshop was held in Al Khobar from 13-15 May 2024, sponsored by Saudi Aramco and co-chaired by Dr Ali Al-Ghamdi and Dr Hussein Al-Hoteit. This is what transpired.
The workshop saw excellent participation, with 62 attendees from the Gulf region, including Saudi Arabia, Kuwait, UAE, Oman, and Malaysia, representing both industry (e.g., Aramco, KOC, PDO) and academic institutions (e.g., KAUST, KFUPM, Khalifa University). The diverse mix enriched the discussions and facilitated valuable knowledge sharing.
Over the three days, the workshop covered a range of topics, including qualitative and quantitative seal evaluation, seal capacity, and integrity assessments. The event included interactive presentations, core displays, panel sessions, and discussions. It began with a welcome speech by co-chair Ali Al-Ghamdi (Saudi Aramco) and inauguration remarks by Dr Mohammed Al-Duhailan on behalf of Mr Hafez Al Shammery, vice president
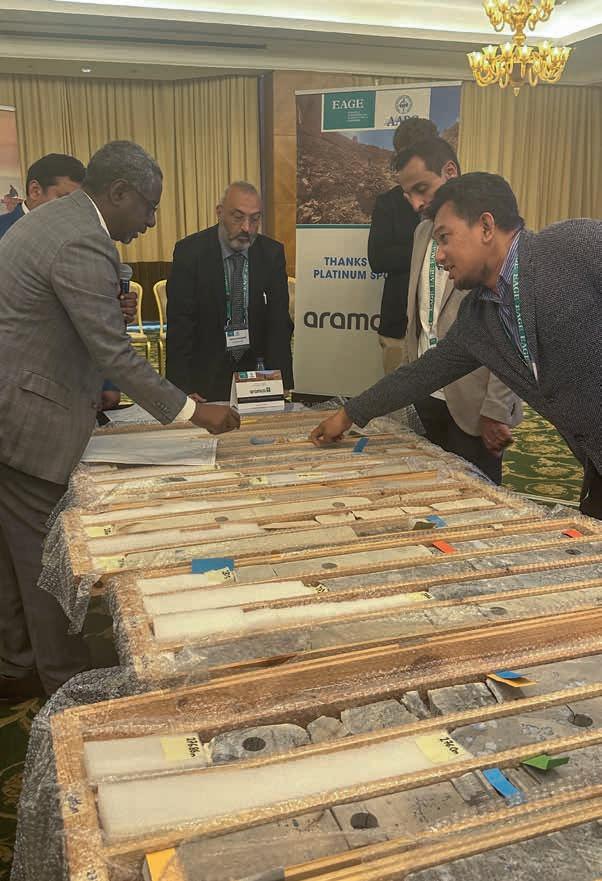
of prospect portfolio development in Saudi Aramco Exploration.
On the first day, core sections from the Jurassic and Triassic periods were displayed, with participants divided into groups to discuss and log the cores. The hands-on experience was well received, allowing participants to directly interact with the geological samples.
The second day featured a panel session focused on the critical role of seal integrity in emerging applications like CO2 sequestration and hydrogen storage. Experts shared insights from industry experiences in the North Sea and Australia, highlighting the limited knowledge in hydrogen storage. The session sparked interesting discussions on the challenges and opportunities in these areas.
The workshop also included a session on ‘Regional and intraformational seal stratigraphy’, where various presentations covered seal stratigraphy in carbonate and clastic depositions. For carbonates, discussions centred on the Hith and Arab anhydrites, key seals in the Middle East, and their mineralogical composition and rock strength, particularly in the context of CO2 storage. Challenges in mapping boundaries between porous and tight facies in carbonates were also addressed, emphasizing the importance of integrating geophysical and geological methods.
For clastic deposits, the workshop highlighted the challenges of early Silurian seal rocks, including sub-seismic resolution, poor seismic data quality, and limited penetration. The session emphasized the need to understand the lateral extent and thickness of these seals, using seismic forward modelling and sequence stratigraphy to address uncertainty issues.
A subsequent talk focused on identifying and characterising muddy fluvial elements, which are crucial for effective stratigraphic sealing. The recognition of their extent and connectivity in the subsurface was highlighted as a key tool for de-risking heterogeneous subsurface targets.
Traps and the risk of cap rock failure in CO2 storage projects were also discussed. A study examined lithological layers to assess their sealing integrity, emphasising the role of tight carbonate facies as top and lateral seals for candidate CO2 storage reservoirs.
The ‘Seal capacity evaluation’ session began with a discussion on evaluating the seal potential of the Hith formation. This research is part of Saudi Arabia’s efforts to assess the risks of carbon capture and storage (CCS) developments, aiming to mitigate global warming by preventing greenhouse gas emissions. The study explored the rock’s behaviour and reaction to CO2 exposure,
providing valuable insights for future research and applications.
Another presentation examined the influence of CO2 on carbonate rock structure, essential for well stimulation and flow assurance. The presence of CO2 was shown to trigger calcite dissolution, enhancing pore spaces and weakening rock strength, while its absence led to calcite precipitation, reducing permeability. The session also mentioned the use of mercury injection capillary pressure (MICP) analysis and artificial intelligence-powered multi-resolution graph-based clustering (MRGC) techniques to predict petrophysical rock properties and electrofacies in uncored wells.
The ‘Seal integrity evaluation via structural and fluid assessment’ session featured talks on evaluating top and fault seals using structural and fluid analysis methods. One talk focused on tracking
leakage and entrapment across faulted gas fields, using fluid data, PVT data, fault interpretation, and migration models to assess top seal integrity. Another discussed the evolution of LWD deep and ultra-deep resistivity techniques for geo-mapping highly resistive seals, emphasising the use of resistivity logs for detecting and mapping top seals. The final talk in this session explored enhancing fault seal analysis through realistic uncertainty assessment, investigating the impact of uncertainties from seismic horizon and fault picking on fault seal analysis, and proposing a more probabilistic approach.
The session on ‘Technology and sustainability of seal assessment techniques’ covered topics related to technology and sustainability in seal assessment. The first talk analysed the wettability, sealing efficiency, and storage capacity of a proxy caprock for hydrogen storage,
finding that sealing efficiency decreases with increased pressure and organic acid concentration but increases with temperature. Another presentation discussed adsorption isotherm models for CO2 and CH4 gases on tight sandstone, coal, and shale formations, identifying the BET model as the best fit for experimental data. The final talk examined the wettability of the CO2/brine/kaolinite system, showing that increased pressure and salinity raise the contact angle, reducing capillary entry pressure and making CO2 less likely to be effectively sealed beneath the shale caprock.
The workshop concluded with discussions on assessing seals for emerging applications, including CO2 sequestration, hydrogen storage, and geothermal energy. Participants identified key issues such as environmental impact, automation, simulation, and project costs.
Time to get on board 2025 EAGE Mentoring Programme
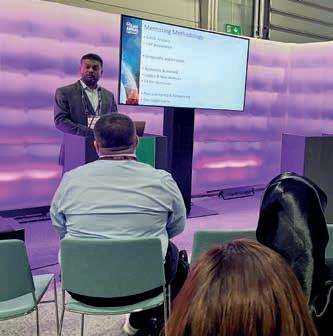
EAGE’s highly successful Mentoring Programme, open to EAGE members in all career stages, is due to begin soon. If you think you can benefit either as a mentor or mentee, sign up before 15 November to participate in the 2025 Programme.
The idea is to connect seasoned professionals with those in their early careers to share knowledge and experience and to provide advice.
For Ellie MacInnes (Viridien), the chance to participate ‘has been a wonderful opportunity to share what I’ve encountered and learned over a diverse and sometimes challenging career in the oil and renewables industry. Conversations with my mentee have also given me fresh perspectives on career outlooks and on the issues faced by mid-career professionals.’
Johan Alejandro Ibarra, undergraduate student from Universidad de Los Andes, says this from the mentee perspective. ‘The mentoring programme has significantly clarified the real
industry landscape for me. My mentor has greatly assisted me in establishing a stronger professional profile for better international exposure’.
During the Mentoring Meet-up held last June at the EAGE Annual, the mentors and mentees agreed that mentoring is a mutually enriching experience in which they could refine their leadership skills, explore new perspectives, and join forces towards contributing to the future of the field. Chandramani Shrivastava (SLB), one of the speakers, went even further: ‘Engaging with students from diverse backgrounds has been incredibly enriching for me as a mentor. It has given me unique insight into the human aspect of mentoring the next generation of leaders.’
If you are considering the next step in your career, but still not sure which would be the best way forward or you are interested in learning about a different field of expertise, taking part in the Mentoring Programme could be for you.
Fiona Dewey (Wintershall Dea), who has been a mentor for several years now, has witnessed her mentees’ growth. ‘It gives me great pleasure and pride when they finally land that job or reach their goal, knowing that I played a small part in helping someone on their career journey.’
Setting the priorities for EAGE Digital 2025
Glyn Edwards, interim subsurface transformation manager at BP and chair of the EAGE Digital 2025 conference explains the significance of the event being held on 24-26 March in Edinburgh, Scotland.

The future demand for oil and gas is highly uncertain, with forecasts differing drastically depending on whether global society transitions to a net-zero trajectory or remains on the current path. This uncertainty creates a short-term investment horizon, making it increasingly important to invest with a high likelihood of achieving expected returns.
Given the vast amounts of data we can now access, along with the volume
of historical data and learnings available, digital technologies are essential in helping us make sense of it all. These technologies not only provide access to all this information but also help us filter it down to the most relevant data, ensuring we don’t overlook any errors or biases.
To guide the discussions at EAGE Digital 2025 we will focus on three key sub-themes. First, with an ever-growing amount of data per person, we must explore how to enable geoscientists and engineers to automatically prioritise the most relevant data and distinguish the signal from the noise. Second, we will consider how our digital tools can combine this data to support timely decisions that are reliable when viewed from a portfolio perspective. Lastly, we will look at how we can leverage
knowledge capture and sharing to prevent the repetition of past mistakes, particularly in the context of the workforce changes discussed at EAGE Digital 2024.
As we explore these themes together, I encourage you to actively engage in the discussions and share your insights. The future of our industry depends on our ability to harness digital technologies to their full potential: let’s make sure we’re prepared to invest wisely and predict accurately.
The call for abstracts is open! We invite submissions on a wide range of topics that explore the advanced applications of digital technologies in our industry. For detailed information visit eagedigital.org.
Join the seismic inversion discussion this month in Naples
The 3rd EAGE Conference on Seismic Inversion on 14-16 October in Naples, Italy will mark the first-ever in-person gathering for the event series, following two successful online editions in 2020 and 2022.
The theme ‘Revealing the subsurface’ alludes to the primary objective of the conference to discuss recent advancements, breakthroughs, and future trends in seismic inversion methodologies and their applications. The aim is to foster dialogue and explore the technological advances and case studies on a diverse range of topics, such as rock physics, data conditioning and fitness, layer properties prediction, azimuthal anisotropy, thin layer property estimation, detuning, hydrocarbon saturation, direct hydrocarbon interpretation (DHI) and risk analysis, modification of prospects, and EOR drainage strategies, FWI and other methods.
This year’s conference will provide a platform for knowledge exchange and networking opportunities with top specialists in the geoscience community, bringing together experiences in conventional and unconventional resources, carbonates and clastic regions, fostering grounds for an exchange of knowledge.
The three-day programme will feature technical presentations showcasing various methodologies and applications utilised in the industry, presented through both oral and poster formats. The event will conclude with a field trip to the active Campi Flegrei caldera, offering participants a unique opportunity to observe Bradyseism in Pozzuoli’s historic centre. This volcanic field, characterised by a 12 km circular structure encompassing various volcanic features, is currently exhibiting renewed activity marked by hydrothermal anom-
alies, increased seismicity, and ground uplift centred in Pozzuoli. During the walking tour, participants will have the unmissable opportunity to visit the Roman buildings that have recorded volcano-tectonic activity over the past two millennia.
For more information on the conference programme and registration, visit www.SeismicInversion.org.
International CCUS event planned for Bergen next year to focus on engineering solutions
An inaugural World CCUS Conference is being planned for 1-4 September 2025 in Bergen, Norway, aiming to explore the latest advancements, strategies, and best practices in CCUS, and to forge partnerships that will shape the future of the field. The aim is to establish a premier, cross-organisational, and inter-disciplinary technical event, focusing on efficient solutions to address global technological and industry challenges in CCUS.
The event is a collaborative effort between the Norwegian Academy of Technological Sciences (NTVA) and the Danish Academy of Technological Sciences (ATV), with support from individual members of the National Academy of Engineering (NAE), the Royal Academy of Engineering, and the Chinese Academy of Engineering (CAE). EAGE will be acting as organiser and promoter of the event on behalf of the institutions involved.
The World CCUS Conference takes as its context the International Energy Agency (IEA)’s Sustainable Development Scenario that puts the needed CCUS capacity at around seven gigatonnes by 2050. This growth in CCUS is only one of the multiple actions needed to achieve a 50% reduction in emissions by mid-century. Expansion of renewables, significant energy efficiency measures and sustainable bioenergy will also be vital.
Guiding the conference’s strategic vision is a distinguished Board of Directors featuring seven leading representatives from both industry and academia across Europe (Equinor, Norwegian University of Science and Technology, Carbongeo, and Technical University of Denmark),
the US (Stanford University, University of Houston), and China (China University of Petroleum - Beijing). Notably, Professor Rui Zhenhua from China University of Petroleum, Beijing, who also holds the UNESCO Chair in Green Transition for Carbon Neutrality and Climate Change, serves on this Board. The Board’s expertise guarantees high-quality discussions and actionable insights, further enhancing the conference’s global impact.
Tao Yang, chief professional and senior specialist at Equinor and co-chair of the World CCUS Conference, says: ‘While geological CO2 storage currently sees the most activity, we aim to launch a new CCUS event that emphasises engineering and explores a broader spectrum of solutions. Our goal is to accelerate the implementation of CCUS technologies across all areas.’
Philip Ringrose, professor at NTNU and founding member of this initiative, goes on to explain: ‘This event is focused on speeding up decarbonisation activities globally. The world urgently needs more projects capturing, utilising and storing CO2 across all sectors - industrial emissions, energy-related emissions and in support of Carbon Dioxide Removal (CDR) projects.’
The conference programme intends to cover a spectrum of topics:
Geological CO2 storage and utilisation: Latest research on safely storing captured CO2, pioneering techniques for its utilisation in various industrial applications, geological storage capacity quantification, trapping mechanisms, and CO2 monitoring technologies.
CO2 capture and transportation : State-of-the-art technologies and logistics for capturing CO2 from emission sources and transporting it to storage facilities. Development of CCS hubs and transport networks and novel ways of reducing costs.
Emerging technologies: Updates on emerging technologies such as negative emissions, chemical and biological utilisation, AI/ML applications, and net-zero/ climate-positive systems analysis.
Policy and socioeconomics: Comprehensive discussions on public perception, business environments, regulatory frameworks, and the economic implications of CCUS strategies, as well as the necessary skillsets, communication strategies, and training opportunities to tackle global CCUS challenges.
Updates on this innovative, worldclass conference initiative can be found at www.wccus.org.
The EAGE Student Fund supports student activities that help students bridge the gap between university and professional environments. This is only possible with the support from the EAGE community. If you want to support the next generation of geoscientists and engineers, go to donate.eagestudentfund.org or simply scan the QR code. Many thanks for your donation in advance!
Personal Record Interview
From journeyman geo to multi-client vocation
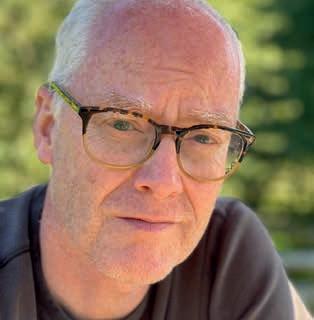
Geologist Neil Hodgson only realised his true métier was multi-client survey analysis when he began work at Spectrum and then Searcher Seismic. It has been his preoccupation ever since and subject of many articles (including First Break ). He describes himself as a journeyman geo in his previous roles at BP, Premier, and a start-up struggling to make a profit in Russia.
Dad’s unusual job
I grew up in Sandhurst, a military town 50 km from London where my dad based himself for his frequent adventures in Africa selling British radio equipment, and then new-fangled ‘computers’ the size and temperament of HAL 9000 in the 2001: Space Odyssey movie. I played a lot of sport as a kid but my world changed when I was introduced to caving. Although free diving flooded passages isn’t everyone’s gig, I found the knack for climbing in the dark, a metaphor for an explorer’s life if ever there was one. Subsequently, a bored careers advisor told me to be a geologist – and I’m still trying.
Highlights of student years
At Manchester University in the 1980s, I was frankly most interested in climbing rocks. Then at Leicester University, volcanoes, trace elements and running around ocean islands of the world looking for impossible rocks (carbonatites) filled my doctorate years, hard rock study was not ideal as a potential career path yet luckily BP was looking for an ‘eclectic’ intake, and clearly curiosity was prized more than any actual knowledge.
First job
BP changed my life. I got to work offshore at a wellsite, exposed to a colourful new language and I started to learn about critical thinking and depositional systems. Operations suited me because I was interested in improving the way drillers and geos inter-
act, especially for planning those scary, high temperature and pressure wells in the UK’s Central Graben. I was among the first BP people to be sent to Glasgow when the company got involved with Britoil. I had some great mentors who guided me through some weird geology, unravelling the salt tectonics story of the Central North Sea. Working with the great structural geologist Frank Peel was a revelation. After a few decent oil discoveries in the Diapir play fairway in the North Sea, I left to work for British Gas, becoming exploration manager in Cairo, Egypt. I loved the country and the people, although it was perhaps an adventure that I was probably not ready for. Fortunately, a bright flat-spotted anomaly jumped out of our 3D survey in the Nile Delta covering a migration shadow on the Rosetta fault. It became the Rosetta Field. Similarly, we acquired 3D over the West Delta deep marine and unexpectedly made the Scarab, Saurus, Sapphire and Saffron discoveries, all named after British pop bands (you guess which?).
Working in Russia
After BG I worked at Premier Oil on global exploration getting a chance to ‘see everything’ and then helped found a start-up oil company where the main difficulties were raising money to work in Russia. What were we thinking? Finding oil wasn’t exactly hard as the Volga Urals Basin has an astonishingly ubiquitous source rock, but making money from what you discovered was almost impossible.
Multi-client is special
Working in multi-client seismic – first in Spectrum and now very happily at Searcher – changed me from a journeyman geo. It has massive appeal compared with ‘normal’ oil and gas. I was suddenly invited to be first finding the hydrocarbon stories hidden in the exploration data and then being able to share those stories. I had found where I was supposed to be.
Whimsy in your writing
There is no point writing a detailed tightly argued case if no one reads it. So our articles are stuffed full of so much whimsy they are likely to sprout ears and sing a song. By wrapping the story up in some cultural reference, I hope the reader understands that we are not saying we are smarter or better explorers – we are just normal people, and we have the data.
Good time for exploration
There has been no better time to be an explorationist than right now. What I really love is that the industry is targeting the amazing passive margin basin floor play in deepwater that hold the world’s biggest plays. This has come together so well in Namibia/South Africa and Senegal/Mauritania, and has told us a lot of what we thought we knew was just not so. New ideas about source rock, heat flow, trapping and crustal structure are appearing on a weekly basis and the ground is shifting quickly.
New generation of Seismic instruments
Nodal Seismic data acquisition system
550,000 Seismic nodes to be delivered.
CROSSTALK
BY ANDREW M c BARNET
Spot the geoscience
in sport
Reflecting on this year’s memorable Paris Olympics and Paralympics, geoscience has not had much of a look in, not that you would expect it. Reference to studies of geology and geophysics that have much relevance to the world of sports are few and far between. Nor among the world’s active sporting stars, for example, in tennis and golf, do you find among their extensive support teams of trainers, psychologists, PRs, etc a geo of any description, no surprise there.
Yet, if you think about it, the Earth as in undulating terrain plays a huge role in numerous sports be it climbing, cycling, mountain biking, or ski-ing. The underlying geology may not concern participants but nonetheless should offer potential scientific interest. In similar vein, near-surface geophysical methods such as GPR can potentially tell the story of the subsurfaces for soccer and rugby pitches, and help golf course design and maintenance. We can safely assume any analysis of this kind never preoccupies the players in these sports.
Even in the rock climbing and bouldering fraternity, no deep-seated knowledge of geology is required. There are of course plenty of geologists who do participate but for the climber it is the nature of the challenge, not how the rocks came to be formed. They may well understand the basic difference between those walls of sandstone, limestone, granite and slate that are most regularly faced by climbers. But the devil is in the detail, i.e., the nature of the rock surface, whether it is smooth or, in the mountaineering vernacular, does it feature tiny crimper edges to grip on, big buckets, knobs, pockets, slopers, or jugs. Other considerations might include the angle of the rock face and its height, what kind of fractures may be involved (narrow vs. wide, undulating vs. parallel) all of which determine potential hand and foot holds and gear placement. Crucially, will the hand holds or rock bolts support body weight?
so when serious racers in a Grand Fondo or professional tour event review what’s ahead. Yet hills and their geology define any bike ride and in races are often the determining factor in the outcome. They can’t be avoided, so a kind of inspirational resignation is required to meet the challenge. Eddie Merckx, the greatest of them all, remarked ‘Don’t buy upgrades, ride up grades’. The philosphy of Lance Armstrong, who won the Tour de France seven times before his disgrace for having been found to have taken performance enhancing drugs, was brutal but on point observing something along the lines ‘Pain is temporary, quitting lasts forever.’ During a race or a tough ride, the nature of the view is not what is on the cyclist’s mind. It’s all about getting to the top, conserving energy, etc.
‘Underlying geology may not concern participants’
However, for some followers of the major cycling tour events, contours of the routes have become a geological opportunity. Since 2021 you can catch a brief segment during Tour de France TV coverage presented by cycling enthusiasts Douwe van Hinsbergen, professor of global tectonics and paleogeography at Utrecht University, and colleague Marjolein Naudé in which they explain the geology of the often spectacular landscapes crossed by Le Peloton. Their notfor-profit organisation Geo-Sports, supported among others by their university, has now extended its scope to covering the geo-background stories on all Tour de France and Tour de France Femmes stages, the Monument races in Italy, Belgium, France, and the Netherlands’ own Amstel Gold event. Non-cycling competitions such as the Dakar Rally have also been added.
The British Geological Survey website has got into the spirit. It includes a survey of the rocks encountered in the professional Tour of Britain race, and even delves into the natural material that goes into the construction of a bike.
Less surprising, geology doesn’t come up often or ever when a cycling group discuss the route of a day’s outing and even less
The Tour de France is the second most viewed sporting event on TV in the world, unsurprisingly topped by the FIFA World Cup of football which also attracts huge crowds of spectators at
football stadiums. Geophysicists from time to time have taken an interest in the seismic impact of these mass gatherings and similar, e.g., American football and baseball. Currently the stage belongs to Taylor Swift and the seismic activity generated by her sell-out Era Tour concerts. At her Seattle venue the commotion of fans and the recording system triggered the equivalent of a 2.3 magnitude earthquake, according to a seismology team at the city’s Lumen Field.
Such research is not as frivolous as it might seem. The impact of noise and reverbration has implications for urban infrastrucutre, according to Jordi Diaz, associate professor at the Institute of Earth Sciences Jaume Almera in Barcelona. In a presentation to the European Geophysical Union meeting a few years ago, he described the apparently inadvertent monitoring of the Nou Camp stadium, home of the famous Barcelona football team and venue for big musical concerts proving that a Lionel Messi goal does make the earth tremble.
Recordings from a seismometer that had been placed half a kilometre from the stadium ostensibly to monitor traffic and subway activity. In a match against Chelsea in which Messi scored after three minutes, the seismograph spiked like the ‘lie detector answer when the murder swears he didn’t do it’. Later when the game was largely won, Messi scored again with a more muted seismic response. By contrast big name musical concerts produced what the researchers dubbed ‘harmonic structures’, energy localised in precise amplitudes because people are dancing not jumping, so for example at a well attended Bruce Springsteen concert ‘every single song had a particular pattern.’
An Australian team of researchers in a CSIRO paper ‘The application of geophysics to the sport of cricket’ claims that the game of cricket is relatively straightforward, summarised as a batsman using a wooden bat to defend a set of three wooden stumps at one end of a pitch (ideally made from heavily compacted grass) while a bowler attempts to knock them over by bowling a hard leather ball from the other end of the pitch. The batsman aims to hit the ball in order to acquire runs without the ball being caught in-flight by a fielder. If only it was that simple!
The research focuses on the majority of balls that bounce on the pitch before they reach the batsman. The combined width of the three stumps is only 22.9 cm and the pitch is over 20 m long, so accurate bowling is very important. Because a fast bowler can bowl the ball at between 135 and 150 km/h, it is extremly difficult to judge with the naked eye where the ball has pitched. Televised cricket uses a ‘hawk-eye system’ of six or seven cameras to track the ball, and provide a pitch map, said to be prohibitively expensive. The research team found that a 48-channel seismic recording system around the pitch, coupled with basic processing, proved a cost-effective, i.e., much cheaper, method for locating where a cricket ball impacted the pitch, with an accuracy of ±10 cm.
‘A Lionel Messi goal makes the earth tremble’
No one would expect that a sport such as cricket would merit geoscientific interest. But one recent study proves the contrary. This is timely because in 2028 cricket is returning as a demonstration sport at the 2028 Olympics after an absence of 128 years. This may seem surprising when for huge swaths of the globe cricket is virtually unknown, the sport basically being a legacy of the old British Empire. However, inclusion in the Olympics does make sense when you realise that cricket is the second most viewed sport in the world after football, a statistic heavily influenced by the fanatical popularity of the sport in India.
Cricket probably didn’t catch on more internationally because of its Britishness enshrined in extraordinarily complicated rules, and old-fashioned etiquette, all exemplified by terms such as googly, silly mid-off, long-on, yorker, stumped, LBW (leg before wicket) not to mention the ritual tea interval. To be fair, the game at international level has evolved beyond recognition these days from matches lasting a stately five days to the T20 fast, furious and colourful format chosen for the Olympics that makes the game much more appealing to spectators and lasts only three hours or so.
Some of the same research team has considered how geophysics can help cricket umpires decide whether a batsman ‘nicked’ (made contact contact with) the ball with the bat on the way from the bowler to the wicket keeper behind the stumps. Any contact and the batsman is ‘out’. Their solution is to add a three-component sensor to the bat which is much more accurate than the naked eye, TV camera or audio recording used in international matches.
Something scientists are getting round to is the potential impact of climate change on sport and sport’s effect on the environment. For example, an article in the American Geophysical Union publication Eos by a research team led by climate scientist and baseball fan Christopher Callahan found a discernible increase in home runs from 1962 to 2019 in Major League Baseball attributable to increasing temperature trends.
Numerous sports organisations worldwide have signed on to the UN Sport for Climate Action framework linked to achieving Net Zero targets.
The case for more focused environmental research can be found in an article in the Journal of Sport Management entitled ‘Sport Ecology: Conceptualising an emerging subdiscipline within sport management’ by Brian P. McCullough, Madeleine Orr and Timothy Kellison. Meantime, the University of Toronto recently created what must be one of the first academic posts to further the cause of sports ecology focused on the impacts of sport on climate and the role of athletes as climate activists.
Views expressed in Crosstalk are solely those of the author, who can be contacted at andrew@andrewmcbarnet.com.
Oil and gas will still provide 75% of global energy demand by 2030, says Rystad
Oil and gas will remain central to the global energy mix for the foreseeable future with global energy demand for hydrocarbons projected to exceed 650 exajoules (EJ) in the coming years, according to research from Rystad Energy.
Rystad estimates that by 2030 more than 75% of total demand will be met by fossil fuels, with emissions climbing as a result. A significant portion of these emissions will originate from upstream activities, particularly hydrocarbon extraction (75%) and gas flaring (25%). This is expected to contribute around 1.1 billion tonnes of carbon dioxide equivalent (CO2e) annually over the next few years.
As investors and governments intensify their focus on carbon-reduction goals, identifying basins that can help to lower the overall emissions impact is becoming increasingly important, said Rystad. Premium energy basins (PEB) – a term coined by Rystad Energy – are particularly valuable because they are rich in hydrocarbon reserves and offer potential for integrating low-carbon energy sources and solutions to reduce emissions, said Rystad.
Having analysed PEBs based on their availability of remaining hydrocarbon resources, development cost, emissions and the availability of new energy sources such as wind and solar, together with their suitability for carbon storage, the Central Arabian and Rub Al Khali basins stand out as carbon-efficient, resourcerich basins with significant potential, said Rystad. ‘These Middle Eastern basins are at the forefront of PEBs and play a pivotal role in global conventional discovered volumes, especially as global discoveries decline and exploration activity peaks,’ it said in a statement. These basins also score highly in terms of renewable potential, with both offering more than 6.2 gigawatts (GW) combined of installed and upcoming solar capacity.
Since 2015, the Central Arabian and Rub Al Khali basins have contributed approximately 40 billion barrels of oil equivalent (boe) in newly discovered volumes, evenly divided between liquids and gas. Egypt’s Nile Delta, driven by Eni’s giant Zohr gas discovery in the Mediterranean Sea, ranks third with about
5 billion boe discovered during this period, followed by the US Gulf Deepwater (3.7 billion boe) and the Central Asian Amu-Darya (3.6 billion boe) basins.
With combined capital expenditure of $638 billion, the Rub Al Khali, US Gulf Deepwater and Central Arabian basins have had the highest greenfield investments since 2000. Due to the vast volumes discovered, the unit cost of development in the two Middle Eastern basins has been under $2 per boe. In contrast, the smaller average resource size in the exclusively offshore US Gulf Deepwater Basin has driven development costs to over $9 per boe, with only the Viking Graben Basin ($11 per boe) in northwest Europe having a higher development cost. Significant investments have also been made in resource development in Brazil’s Santos Basin ($153 billion) and Australia’s North Carnarvon Basin ($140 billion).
‘Several PEBs offer significant potential for carbon storage, particularly in late-life or abandoned oil and gas fields, which are suitable for enhanced oil recovery or permanent storage,’ said Rystad. ‘These basins are increasingly being utilised for carbon capture and storage due to their geological properties. Deep-seated saline aquifers are especially promising, with the US Gulf Deepwater Basin leading the way among PEBs in CO2 storage potential, boasting 750 gigatonnes of saline aquifer capacity.’
Shearwater wins contracts offshore India and Ghana
Shearwater Geoservices has launched a three-month extension to its large deepwater ocean bottom node (OBN) survey off the coast of India at depths of 100 to 2900 m.
The extension builds on the execution of the initial six-month scope using the vessel SW Tasman, Sheawater’s purpose-built seismic source and dual ROV operations vessel, and the in-house developed Pearl node.
Irene Basili, CEO of Shearwater, said: ‘Our operation in India has delivered
an impressive performance, confirming the significant operational efficiencies enabled by Shearwater’s unique vessel design and the state-of-the-art Pearl node technology.
‘We look forward to extending this important project with our client and further adding to their successful data acquisition programme this season.’
Meanwhile, Shearwater Geoservices has won a 4D seismic monitoring contract for the Jubilee field in Ghana, operated by Tullow Ghana.
The two-month survey will be conducted in early 2025, utilising capacity from Shearwater’s fleet. This will be the first contract conducted by Shearwater Ghana, in conjunction with local partner Destra Energy; and will include considerable local content participation, according to the company.
Basili said: ‘Our towed-streamer technology is an ideal fit for the Jubilee field, enabling repeatable surveys to provide Tullow and partners with high-quality data in support of better-informed reservoir optimisation.’
Twenty one companies submit APA applications in Norway
Norway has received applications from 21 companies in its Awards in Predefined Areas (APA) 2024.
By the application deadline of September 3, applications had been received from Shell, Aker BP, Concedo, ConocoPhillips, DNO, Equinor, INPEX Idemitsu, Lime Petroleum, M Vest Energy, OKEA, OMV, Pandion Energy, Petrolia NOCO, PGNiG Upstream, Repsol, Source Energy, Sval Energi, TotalEnergies EP, Vår Energi, Wellesley Petroleum, and Wintershall Dea.
‘It’s gratifying to see the continued significant interest in exploring new acreage in mature areas on the Norwegian continental shelf (NCS), even in light of the many awards in
recent APA rounds,’ said Kalmar Ildstad, director of licence management in the Norwegian Offshore Directorate.
The Norwegian Offshore Directorate is evaluating the applications, with emphasis on geological comprehension and plans for exploration of the areas. When production licences are awarded, emphasis is also placed on the companies’ technical expertise and experience, as well as financial strength.
Thirty seven additional blocks were added in May, including three in the north west Norwegian Sea and 34 in the Barents Sea.
The authorities aim to award new production licences in the announced areas in early 2025.
TGS completes CO2 storage assessment of Illinois Basin
TGS has released the Illinois Basin CO2 Storage Assessment, which identifies prime reservoirs for carbon dioxide (CO2) sequestration across a 66-million-acre region within the Illinois Basin in the US.
With data from 2500 wells and a thorough analysis of key geologic formations,
this assessment provides essential insights into reservoir quality, capacity and sealing integrity – factors crucial for advancing carbon capture and storage (CCS) initiatives.
TGS is offering an integrated evaluation of formation tops and petrophysical characteristics. Insights are then easily accessible within industry-standard workstation environments, enabling informed, data-driven decisions, said TGS.
The Illinois CO2 Storage Assessment provides attribute maps for a whole suite of key reservoir properties and petrophysical curves for thousands of wells across the basin.
This assessment features a stratigraphic framework, petrophysical anal-
ysis and log curve interpretations. It includes regional mapping of storage properties and volumetric visualisations, offering an evaluation of the area’s storage potential.
Coverage of the basin extends across contiguous areas in Illinois, Indiana and Western Kentucky.
Carel Hooijkaas, executive vice president at TGS, said: ‘The Illinois Basin Carbon Storage Assessment sets a new industry standard with its unmatched data coverage and expert analysis, pinpointing the most effective reservoir and seal formations for CO2 sequestration.’
Visit www.tgs.com/carbon-captureand-storage/storage-
Viridien completes carbon storage study in Gulf of Mexico
Viridien has released phase 2 of its GeoVerse Carbon Storage Screening Study of the Gulf of Mexico.
The final product complements Viridien’s multi-client seismic data to provide comprehensive subsurface data coverage over the US Gulf of Mexico shallow waters and coastal areas. Its delivery will accelerate the screening process to identify the high-potential areas on offer in the upcoming Texas General Land Office and School Land Board Request for Proposals for several carbon sequestration leases.
The full product provides a unique integrated package of interactive ArcGIS-compatible screening maps, digitised well data and merged legacy seismic data across the attractive shallow water shelf of the Gulf of Mexico basin where several large-scale aquifer stores are available throughout the stratigraphic section.
Dechun Lin, EVP, Earth Data, Viridien, said: ‘This new Gulf of Mexico study is located over a key area of interest for the CCUS industry with a number of licences already offered for carbon storage and more licensing rounds to come. With our growing footprint of screening studies in the world’s most promising regions, we are helping to address the global industry challenge of accelerating CCUS with our subsurface data, data
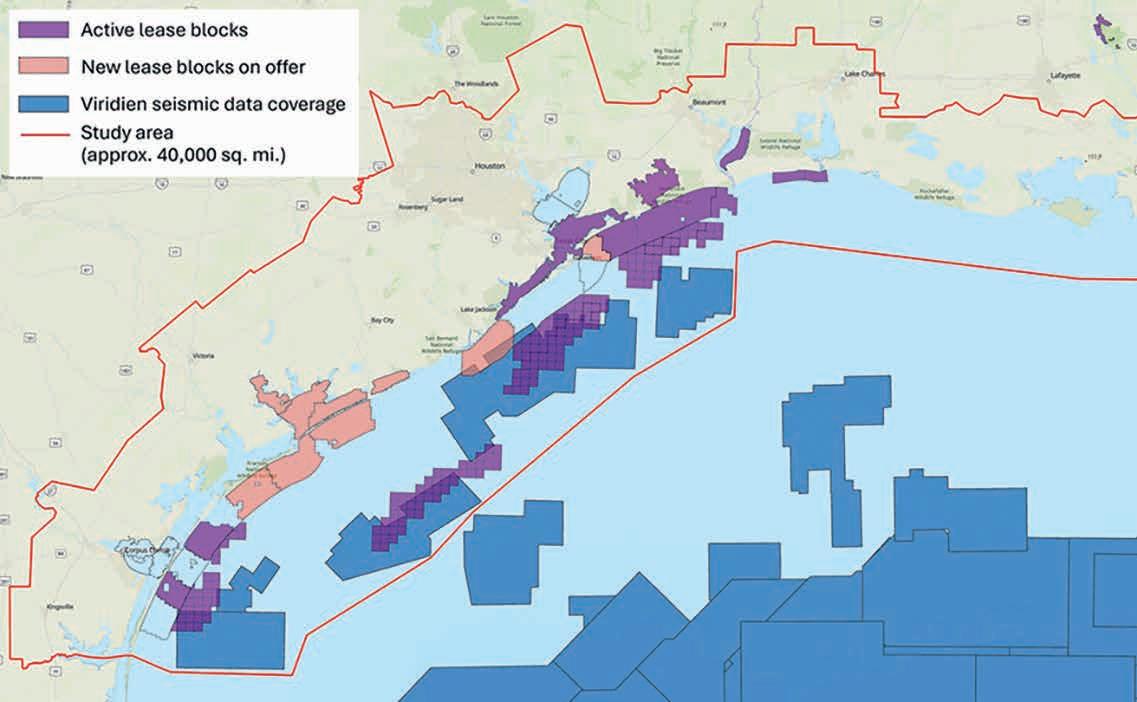
science and geoscience expertise. Viridien is committed to helping operators to identify the areas with the most potential by providing a robust and globally consistent approach to carbon storage screening.’
Both phases of the screening study are available for licensing.
STRYDE wins landmark contracts in Mexico
STRYDE has signed its first contracts in Mexico with Servicios Sísmicos de Exploración (SSE) and SeisGlobe Geoservices.
Under the first contract, STRYDE has supplied 19,080 nodes and the company’s Nimble Receiver System to SSE to enable 2D and 3D seismic surveys, across Southern Mexico.
Javier Nuñez Carbajal, managing director at SSE said: ‘For this project, our customer required high-trace density seismic data across 85 km² of challenging terrain, including tropical rainforests, lakes, and wetlands.
‘Having used other nodal equipment for previous surveys, we are impressed with how STRYDE’s nodes are enabling denser and faster data collection, at the same cost as traditional sparser surveys. In a competitive market where the speed and accuracy of acquisition are critical to the success of exploration projects, this advancement is invaluable.’
Initially, the 3D survey was planned with a 60-m spacing between receivers. However, STRYDE said that its technolo-
gy has enabled SSE to densify the survey design by reducing the receiver spacing to 30 m. The doubling of receiver density will yield significantly higher-definition seismic data, enhancing customers’ understanding of the subsurface and leading to better decision-making, the company added.
Victor Villamizar, head of business development for Latin America at STRYDE, said: ‘By eliminating the complex management of cumbersome cables and unnecessary features, we not only reduce the common logistical challenges and equipment downtime, but also lower overall project costs.’
Under the second contract, STRYDE has supplied SeisGlobe Geoservices with a 3600-node seismic system, to enable the first land 4D3C seismic survey over a field in southeast Mexico, aimed at identifying reservoir optimisation opportunities—crucial for addressing Mexico’s declining oil and gas reservoirs.
Miguel Gomez, managing director at SeisGlobe Geoservices, said: ‘We are
using the latest seismic technology to gather seismic data across a 4 km² area surrounding existing wells and oilfield infrastructure. In this challenging environment, deploying traditional cabled geophone arrays or analogic bulky nodal devices would have been extremely difficult, and expensive.
‘The high-density spatial sampling enabled by STRYDE’s small, lightweight, and cable-free nodes was crucial to the success of this one of a kind project in Mexico.’
Cam Grant, chief commercial officer at STRYDE, added: ‘Having successfully deployed our technology and data processing services across Latin America, including Brazil, Chile, Colombia, and Bolivia, we are excited to see our seismic technology now making an impact in Mexico’s energy sector.’
In addition to supplying the seismic technology for these projects, STRYDE will also provide in-field training and support at the startup of both projects, as well as remote support as needed.
US launches wind energy sales offshore Oregan
The US will hold an offshore wind energy lease sale offshore southern Oregon. The two areas to be auctioned on 15 October by the Bureau of Ocean Energy Management could generate more than 3.1 gigawatts of renewable energy.
The final sale of notice (FSN) includes details regarding certain provisions and conditions of the leases, auction details, the lease form, criteria for evaluating competing bids, award procedures, appeal procedures, and lease execution.
The recently published FSN, which includes two areas offshore Oregon. Lease Area P-OCS 0566 (Coos Bay) consists
of 61,203 acres and is approximately 32 miles from shore. Lease Area P-OCS 0567 (Brookings) consists of 133,792 acres and is around 18 miles from shore.
BOEM also recently published its final environmental assessment (EA) of the possible impacts from issuing leases for potential offshore wind energy development off the Oregon coast, including site assessment and site characterisation activities such as geophysical, geological, and archaeological surveys. The EA concluded that lease issuance would have no significant impacts to people or the environment.
TGS launches 3D survey in Brazil
TGS has launched the PAMA 3D Phase 1 Survey in the Equatorial Margin of Brazil. This survey covers an extensive area of 19,343 km2 and more than 25 future exploration blocks within the Pará-Maranhão Basin, one of the world’s largest major unexplored and highly prospective basins.
The PAMA 3D Phase 1 Survey expands TGS’ data coverage in this promising region, building on previous 3D surveys covering more than 60,000 km2. The Equatorial Margin has drawn industry attention due to prolific successes in neighbouring Guyana and Suriname. These efforts target reservoir quality sands within deepwater fan systems, sourced from Amazon River-related drainage, in a diverse range of plays, from stratigraphic pinch-outs at the paleo-slope edge to anticline structures within the fold-and-thrust belt extending along the margin.
Kristian Johansen, TGS CEO, said: ‘The Equatorial Margin represents one of the most exciting exploration frontiers today. In addition to developing and owning the survey, we will use our own high-end streamer vessels to acquire the data, as well
Meanwhile, BOEM has published a Call for Information and Nominations for a second regional offshore wind energy sale in the Central Atlantic, inviting public feedback on wind energy development 9ff the coasts of New Jersey, Delaware, Maryland, Virginia, and North Carolina.
The Central Atlantic 2 Call Area consists of 13,476,805 acres. BOEM will collaborate with the National Oceanic and Atmospheric Administration’s National Centres for Coastal Ocean Science to help identify where conflicts may exist and inform decisions regarding the most appropriate locations for WEAs.
as our own imaging capacity. Finally, the data will be delivered to customers through the TGS data management solution.’
Meanwhile, TGS has won a fourmonth OBN contract extension in the Gulf of Mexico.
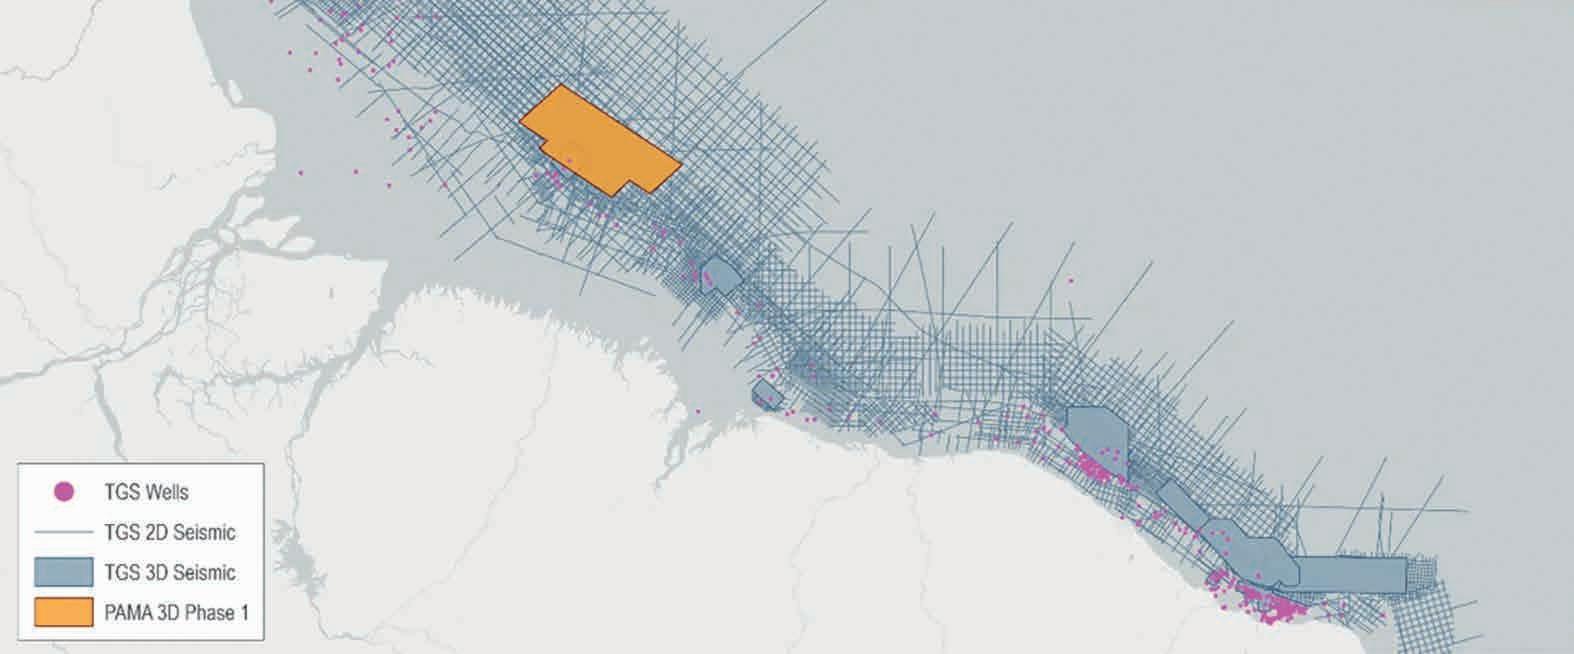
Sercel sells land seismic nodes to DMT
Sercel has sold 30,000 Sercel WiNG land seismic nodes to DMT. The engineering services and consultancy headquartered in Essen, Germany. DMT will deploy the WiNG nodes on a campaign of large-scale seismic surveys planned in urban areas to target energy resources, including geothermal.
Featuring the ultra-sensitive broadband digital MEMS (microelectromechanical systems) QuietSeis sensor, the Sercel
WiNG node delivers optimal data quality for outstanding subsurface imaging, Sercel claimed. With its field-proven Pathfinder transmission management technology, the the company’s crew can view and monitor the entire acquisition spread in real time, ensuring the most comprehensive and efficient quality control of operations, said Sercel..
Shearwater reports operating profit of $46 million
Shearwater GeoServices has reported second quarter operating profit of $46 million on revenues of $214 million, compared to operating profits of $36 million on revenues $238 million in Q2 2024.
Second quarter EBITA of $80 million was up from $66 million in Q2 2023.
Vessel utilisation of 83% from 10 active vessels compared to 83% in Q2 2024, when the company was operating 14 active vessels.
Highlights in the quarter include completion of an OBN survey in India, start up of operations in the North Sea and Canada, and a second carbon capture survey this year off the coast of the UK.
Irene Basili, CEO of Shearwater Geoservices, said: ‘Activity increased during the second quarter in line with seasonal demand. Although, so far in 2024, the marine seismic acquisition market has been slower than anticipated, we still see a positive development on EBITDA from the previous quarter and the 2nd quarter last year. A healthy pipeline of potential projects for the upcoming winter indicates increased
demand globally. However, uncertainty around timing of projects, related to permits and internal processes with our clients, could lead to projects which we earlier assumed would come in Q4 to slide into 2025.
‘Operationally, we have launched a project in a prosperous area in offshore Brazil, as well as our recently announced technology agreement with Petrobras. This month we also completed the first major OBN survey combining Shearwater’s in-house developed Pearl node and purpose-built ROV vessel SW Tasman. The survey was recently extended by the client in India continuing through Q3 and into Q4.
‘Our long-term view of the market remains positive on increased demand for our services. Recent projections by super major ExxonMobil in their ExxonMobil Global Outlook: our view to 2050, supports the strong need for more investments, in order to increase oil supply to fend off a projected natural decline of a staggering 15% annually in the period covered by the report.’
DUG launches elastic MP-FWI imaging solution
DUG Technology has launched DUG Elastic Multi-parameter Full Waveform Inversion (MP-FWI) Imaging, which it claims will offer a step change in imaging quality with its elastic rock properties for quantitative interpretation and pre-stack amplitude analysis — directly from field-data input.
Strong impedance contrasts (in particular those with high impedance
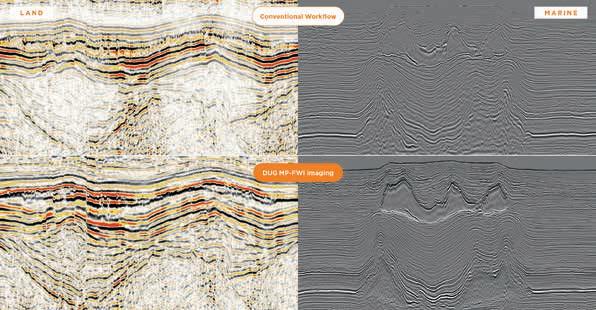
contracts produced by salt or chalk, for example) produce significant elastic effects that must be accounted for to correctly image the seismic wavefield and deliver true-amplitudes for quantitative interpretation, said DUG. Its latest elastic imaging technology solves for three-component reflectivity, Vp, Vs, P-impedance, S-impedance and density.
DUG’s managing director Matt Lamont said: ‘DUG’s foundations were built on both seismic data imaging and quantitative interpretation. Our new elastic MP-FWI imaging combines these disciplines into a single, elegant solution. The results are spectacular and we have no doubt this solution will be transformative for our clients.’
ENERGY TRANSITION BRIEFS
Norway has received applications from six companies for potential storage of CO2 in the North Sea. The Ministry of Energy is aiming to award exploration licences in the second half of 2024. By the deadline of 29 August, applications were received from Aker BP; Equinor; Harbour Energy; Horisont Energi; Storegga and TotalEnergies.
Petronas, Adnoc and Storegga have signed a joint study and development agreement to evaluate the carbon dioxide (CO2) emissions storage capabilities of saline aquifers and the construction of carbon capture and storage facilities in the Penyu basin, offshore Peninsular Malaysia. The agreement is targeting at least 5 million tonnes per annum (mtpa) of CO2 capture and storage capacity by 2030 and its scope includes a CO2 shipping and logistics study, geophysical and geomechanical modelling, reservoir simulation and containment research.
Equinor has won a lease in the US’ offshore wind energy lease auction in the US Central Atlantic region. The ~2 GW lease will have the capacity to produce enough energy to power approximately 900,000 US homes. With a bid of $75,001,001 for 101,443 acres in the Atlantic Ocean, Equinor secured one of two fixed-bottom lease areas on offer, located 26 nautical miles from the mouth of the Delaware Bay.
After the recent Nagoya CCS feasibility study, BP and Chubu Electric Power Co have expanded their collaboration to explore a CCS value chain from Port of Nagoya, Japan, to the Tangguh field in Teluk Bintuni, Papua Barat, Indonesia. Bp, as the operator of Tangguh production sharing contract, and Chubu Electric have signed an updated agreement to include evaluation on cost optimisation across the CCS value chain.
GeoMark Research, a geochemistry and PVT service provider, and Petricore, a global oil services company, have teamed up to offer an integrated suite of carbon capture and sequestration (CCS) services.
Crown Estate sets out vision for the UK’s seabed to accelerate energy transition
A vision for how the UK’s seabed can continue to support the accelerated delivery of transition to clean energy has been set out by the UK’s Crown Estate, which manages the seabed around England, Wales and Northern Ireland.
Amid increasing demand on the seabed from sectors critical to the UK economy, the Crown Estate’s Marine Delivery Routemap hopes to provide visibility and certainty for developers of offshore renewables, helping to address current pinch-points such as consenting and grid connections. The plan will also set out how to protect biodiversity and marine environments.
A Routemap was one of the key recommendations published in last year’s independent report from Electricity Networks Commissioner Nick Winser. It builds on the Crown Estate’s expertise in spatial mapping and digital capabilities, which received a global Esri award for geospatial innovation in July.
The Crown Estate has published an offshore wind and consultation alongside the Routemap. It is expected to be followed with reports on nature, carbon capture and other sectors.
The UK is a world-leader in offshore wind said the Crown Estate, with the current pipeline standing at approximately 95GW, including almost 15GW already operational. The newly formed UK government energy company Great British Energy and the Crown Estate recently announced a new partnership to bring to market an additional 20-30GW of offshore wind leasing opportunities by 2030.
The Crown Estate report Future of Offshore Wind sets out its approach to leasing this additional capacity for delivery by 2040. It is seeking input and feedback from industry and wider stakeholders to help shape its approach to seabed leasing.
Much of the new offshore wind capacity is expected to be in areas of the Celtic Sea, which lies off the coasts of South Wales and South West England, and North
East England. A number of smaller projects are also likely off the coasts of North Wales, North West England, Lincolnshire and Yorkshire.
The report sets out further details on how the Crown Estate could play a greater role in investing to support enabling infrastructure to allow the accelerated delivery of offshore wind projects. This follows the introduction of legislation in the British parliament in the past few months to modernise the Crown Estate’s borrowing and investment powers.
Gus Jaspert, managing director, marine at the Crown Estate, said: ‘Our evolving approach to offshore wind development is designed to help remove some of the barriers to deployment of important new renewable energy and provide more certainty to investors ’
RenewableUK’s chief executive Dan McGrail said: ‘Providing long-term visibility on the details of future offshore wind leasing rounds as early as possible will further increase confidence in the long-term stability of the UK’s world-leading offshore wind market, potentially leading to billions of pounds of additional private investment in the decades ahead.’
Fintan Slye, executive director of the Electricity Systems Operator (ESO), said: ‘We are already working closely with the Crown Estate, as demonstrated by our recent collaboration on the leasing round for floating offshore wind currently underway in the Celtic Sea.’
Dr Gemma Harper OBE, chief executive at Joint Nature Conservation Committee (JNCC), said: ‘We welcome the clear focus being placed on nature by the Crown Estate in the development of its Marine Delivery Routemap. The Routemap advances the critical discussion of how we value and integrate the marine environment with the many sectors with an interest in the seabed, ensuring its use is sustainable now and for future generations.’
TGS shoots 2D survey offshore Indonesia
TGS has started a 2D seismic survey in the Sumatra basin, Indonesia. The survey acquired by COSL’s HYSY 718 vessel, is expected to shoot between 5500- and 6500-line km, covering two regions.
Earlier this year, TGS completed a multi-client 2D reprocessing project in the same basin which aims to integrate
key discoveries with available open acreage.
Kristian Johansen, TGS CEO, said, ‘North Sumatra has been the site of major discoveries in the past few years. With this being our sixth consecutive acquisition project offshore Indonesia, TGS remains dedicated to advancing exploration in the region. Our high-quality seismic data continues to shed light on crucial play concepts, extending exploration potential into open acreage and unlocking exciting opportunities within the Sumatra basin.’
The seismic acquisition is expected to be completed by the end of Q4 2024.
Meanwhile, TGS has signed a Memorandum of Understanding (MoU) with Petrobras to collaborate on scientific research and technological development activities in Brazil.
The collaboration will focus on developing new technologies to increase
efficiency and sustainability in oil and gas exploration and production. Additionally, it will drive innovation in renewable energy technologies and carbon capture solutions.
Finally, TGS has announced a strategic partnership with ComboCurve to enable seamless access to TGS’ licensed production, completions, and cost data via the ComboCurve platform, with fully automated data integration that requires minimal technical infrastructure.
‘The partnership streamlines access to TGS production data by integrating it directly into the ComboCurve platform through ComboCurve’s ComboSync product, eliminating the need for time-consuming downloads and formatting,’ said TGS.
‘By leveraging ComboCurve’s advanced forecasting and economic models, and TGS’s data quality, this partnership significantly enhances endto-end deal evaluations,’ the company added.
BRIEFS
Egypt has launched the country’s Egyptian International Bid Round 2024, which includes 12 open blocks for exploration in the Mediterranean and Nile Delta. EGAS said that companies can review and purchase datasets online through the EUG portal. For bid round enquiries, contact bidround@eug.petroleum.gov.eg.
TGS has entered the software solutions market with Imaging AnyWare – a proprietary enterprise processing system designed to enhance subsurface imaging and integration projects. Its modern architecture is complemented by geophysical algorithms, ensuring users experience seamless cloud transitions and enhanced operational efficiency, the company added. Wadii El Karkouri, EVP of Imaging and Technology at TGS. ‘This expansion addresses the evolving needs of our clients, offering a versatile tool.’
Hartshead has won 10 blocks, across six licences in the UK’s 33rd Licensing Round. Five licences, consisting of nine blocks, are situated in the Southern gas basin. Two licences, consisting of three blocks, are adjacent to the P2607 Licence. The gas field redevelopments and undeveloped gas fields amount to 1187 Bcf. Most of the blocks come with commitments to carry out seismic reprocessing.
A consortium of Brazil’s state-owned Petrobras and Shell have acquired 26 concession contracts in the deepwater Pelotas basin under the fourth Permanent Concession Offer Cycle. Petrobras will hold a 70% stake in the blocks as the operator while Shell will own a 30% stake. Petrobras has secured three other blocks in partnership with CNOOC and Shell. In this partnership Petrobras will own a 50% stake, CNOOC 20%, and Shell 30%. Forty four bllocks in the Pelotas Basin were awarded. Chevron secured 15 blocks.
APA Corporation has agreed to sell noncore producing properties in the Permian Basin to an undisclosed buyer for $950 million, The properties are located in the Central Basin Platform, Texas and New Mexico Shelf, and Northwest Shelf.
UK government plans to revise environmental guidance for oil and gas projects
The UK government is planing to revise environmental guidance for oil and gas companies ‘to provide stability for industry, support investment, protect jobs, deliver economic growth, and meet its climate obligations’.
The release stated that the guidance is necessary in light of a UK Supreme Court ruling that has implications for the assessment of new development consents. It highlighted that the ‘landmark Finch ruling requires regulators to consider the impact of burning oil and gas, scope 3 emissions, in the Environmental Impact Assessment for new projects’.
The release noted that the government is acting swiftly so that decisions on oil and gas development consents can be made. ‘Crucially, oil and gas production in the North Sea will be a key component of the UK energy landscape for decades to come as it transitions to our clean energy future,’ it added.
UK Minister for Energy Michael Shanks said, ‘We will consult at pace on new guidance that takes into account the Supreme Court’s ruling on environmental impact assessments, to enable the industry to plan.’
The release stated that the government will not challenge judicial reviews brought against development consent for the Jackdaw and Rosebank offshore oil and gas fields in the North Sea, noting that this decision ‘will save the taxpayer money’. It highlighted that this litigation does not mean the licences for Jackdaw and Rosebank have been withdrawn.
The release also noted that the government will consult later this year on the implementation of its manifesto position not to issue new oil and gas licences to explore new fields. It said the government will aim to conclude its consultation by spring 2025.
Industry body Offshore Energies UK (OEUK) said: ‘Regulatory uncertainty further impacts investor confidence, and we urge the government to proceed at pace with updates to the relevant guidelines in light of the Finch ruling.’
OEUK also noted that the Labour government ‘made significant manifesto commitments not to revoke existing licences and to manage existing fields for the entirety of their lifespan’, adding that the UK uses oil and gas for 75% of its energy needs including electricity, heating, and fuel.
‘Our members are the same UK companies which will produce the energy we need in future and we are committed to a homegrown energy transition which delivers the wind, hydrogen, and carbon capture, as well as the oil and gas, the UK will need during this time.’
Meanwhile, OEUK has published a fiscal assessment showing that the UK government’s proposals to toughen the fiscal regime on oil and gas companies is impacting investment. Data revealed the removal of capital allowances will ultimately result in a £12 billion loss in tax receipts due to a rapid decline in production due to under-investment over this decade.
OEUK chief executive David Whitehouse said: ‘I fully support the build out of renewable energy at pace as vital to net zero. But today 24 million homes are heated with gas. We ignore the need for domestic gas production at our peril – you do not protect consumers or tackle climate change by importing energy at the expense of homegrown production.’
Offshore wind sector expanded in 2022 despite challenges, says Rystad Energy
Global offshore wind projects have increased by 7% in 2023 despite inflationary pressures and supply chain disruptions, exemplified by postponed permitting processes and delayed auctions, according to Rystad research.
The sector is expected to grow by 9% in 2024 to more than 11 gigawatts (GW) by the end of the year. Rystad estimates that global installations, excluding mainland China, will exceed 520 GW by 2040.
Europe will play a crucial role in this growth, relying heavily on floating wind to meet ambitious national targets. By 2040, the continent is expected to account for more than 70% of global floating wind installations. Although some project delays beyond 2030 are anticipated, there will likely be a strong push to accelerate deployment. As a result, floating wind capacity is projected to approach 90 GW by 2040, with the UK, France and Portugal at the forefront of development. Asia will also be key in advancing floating wind as a mature technology, and the region – excluding mainland China – is expected to capture a share of 20% of global installations by 2040.
While the floating wind sector has been boosted by a recent rise in project announcements, it currently grapples with supply chain constraints similar to the bottom-fixed segment, where wind turbines are installed on fixed foundations in shallow waters. These challenges could hinder the advancement of floating wind technology in the short term, with capaci-
ty estimates of less than 7GW by 2030. To overcome these hurdles, increased government support is crucial, said Rystad.
‘The global offshore wind sector is experiencing robust growth, fuelled by increased investment and auction activity. However, supply chain bottlenecks present significant challenges to the industry’s further expansion. While ambitious targets boost investor confidence, it is crucial to address logistical issues to ensure that offshore wind can successfully take a key role in the energy transition,’ said Petra Manuel, senior offshore wind analyst, Rystad Energy.
In the bottom-fixed market, the UK, Germany and the Netherlands are expected to emerge as the three dominant players. The three countries are projected to account for 150GW of installed capacity by 2040, followed by the US with less than 40GW.
Between 2025 and 2030, the Americas, led by the US, will experience significant growth, with close to 2GW of installed capacity in 2025. Asia, excluding mainland China, will follow, with 7GW in 2025 and reaching nearly 28GW by 2030, with Taiwan (China), South Korea and Vietnam emerging as big markets in the region. Europe is projected to have 41GW of installed capacity by 2025 and more than 112GW by 2030.
Looking ahead to between 2030 and 2035, an increase in growth is anticipated in Asia, excluding mainland China, followed by the Americas and Europe.
Liberia launches licensing round
Liberia has launched a direct negotiation licensing for 29 offshore blocks in the Liberia and Harper Basins The Liberian offshore sector presents diverse geological plays, ranging from the synrift Lower Cretaceous to the deepwater Upper Cretaceous, with multiple source rock intervals throughout the stratigraphy.
TGS is offering multi-client subsurface data for the available blocks, including more than 24,000 km of 2D seismic data and more than 26,000 km2 of 3D seismic data. This data set includes
During this period, Latin America, particularly Brazil and Colombia, is also expected to begin contributing to offshore wind capacity in the Americas.
From 2025 to 2030, Rystad anticipates that only Asia and Europe will be actively installing floating wind capacity. By 2030, it expects Europe to have installed almost 5 GW of floating wind, while Asia, excluding mainland China, is projected to add 2GW. From 2030 to 2035, it foresees a substantial ramp-up in installations. Europe is expected to add 20GW of floating wind capacity, and Asia, excluding mainland China, up to 5GW. It does not expect floating wind projects to be installed in other regions until the period of 2035 to 2040. By 2040, Rystad predicts that Europe will have installed more than 65GW of floating wind capacity, while installations in Asia, excluding mainland China, will have reached 17GW.

5100 km2 of newly reprocessed 3D seismic data and 12,000 km2 of 2D seismic data, both enhanced using advanced Pre-Stack Depth Migration (PSDM) technology. Gravity, magnetic data, and well data is also offered to enhance understanding of numerous prospects and identifiable leads.
This reprocessing method delivers enhanced imaging of key targets in the Cretaceous reservoirs, providing the latest insights into the region’s potential.
Denmark’s first carbon storage project completes pilot phase
Denmark has begun storage for CO2 in the North Sea subsoil after the 23 partners behind Project Greensand submitted the final report from the pilot project.
Independent technical verification carried out by DNV shows that the stored CO2 remains safely and permanently in the closed Nini West reservoir 1800 m below the North Sea seabed, as expected.
‘We now have documentation that we have a well-functioning storage for CO2 in the North Sea subsoil. We can see that the stored CO2 behaves as expected in the reservoir 1800 m below the seabed. That
confidence gives us a solid foundation to take the next steps that will be crucial for CCS in Denmark’, said Mads Gade, country manager at INEOS Denmark, the leading partner behind Project Greensand.
Project Greensand has also demonstrated that captured CO2 can be transported across borders and stored offshore to mitigate climate change. ‘We are the first in the world to succeed in developing, testing and demonstrating a well-functioning value chain for safe and efficient capture, transport and storage of CO2 across national borders,’ added Gade.
Oil and gas round-up
Equinor has proven gas/condensate in development well 6406/2-L-2 H, 260 km southwest of Brønnøysund in the Norwegian Sea. The well is close to the Lavrans discovery. The discovery is estimated to be in the range of 2-4 million Sm3 of recoverable oil equivalent. The licensees will consider tying the discovery back to infrastructure being developed for Lavrans – which is part of the Kristin field. The objective of the well was to prove petroleum in Lower Jurassic sandstones in the lower part of the Tilje Formation. Well 6406/2-L-2 H encountered a gas/condensate column of about 30 m in the lower parts of the Tilje Formation, with moderate-to-good reservoir properties. Gas/ condensate was also proven in the upper parts of the Tilje Formation in a sandstone reservoir with moderate-to-poor reservoir properties. The well was drilled to vertical depths of 6075 and 5045 m below sea level, and was terminated in the Åre Formation in the Lower Jurassic.
CNOOC has drilled a natural gas well in the ultra-deepwater Liwan 4-1 structure in the Pearl River Mouth Basin in the South China Sea. The well was tested to produce 430,000 m3 per day of absolute open flow natural gas, marking the first major exploration breakthrough in ultra-deepwater carbonate rocks offshore China. The well is located in Baiyun Sag, the largest
hydrocarbon-rich sag in the Pearl River Mouth Basin, about 300 km southeast of Shenzhen with a water depth of nearly 1640 m. The well was drilled to a vertical depth of nearly 3000 m, completed at a depth of nearly 4400 m, and encountered gas pay zone of approx. 650 m in the horizontal section. The well has revealed promising exploration prospects in the ultra-deepwater Globigerinid limestone in China.
The Joint Venture of Sinjhoro Block –comprising Oil & Gas Development Company Limited (OGDCL) as operator (76%), Orient Petroleum (19%) and GHPL (5%) – has made a gas condensate discovery at the Baloch-2 well in the exploratory zone of Sembar Formation, in Baloch Development and Production Lease (D&PL) located in District Sanghar, Sindh Province, Pakistan. Baloch-2 well was drilled to total depth of 3920 m TVD in the Sembar Formation. Based on the results of wireline logs interpretation, there is estimated to be 6.8 Million Standard Cubic Feet per Day of gas and 388 Barrels of Condensate per Day.
Eni has won approval for its plan of development (POD) of the Geng North (North Ganal PSC) and Gehem (Rapak PSC) gas fields. The integrated development will create a new production hub, called Northern Hub, in the Kutei Basin. Eni has also
INEOS and licence partners Wintershall Dea (now Harbour Energy) and Nordsøfonden have applied for final approval for Denmark’s first permanent large-scale CO2 storage facility in the North Sea by the end of 2025 or the beginning of 2026. Up to 400,000 tonnes of CO2 would be stored per year, while the plan is to store up to 8 million tonnes of CO2 per year in the area under the North Sea’s seabed from 2030.
Work is also underway to investigate whether it is possible and safe to store CO2 underground on land in Denmark.
won approval for the POD for Gendalo and Gandang fields (Ganal PSC). Additionally, Eni has been awarded a 20-year extension of the IDD licences named Ganal and Rapak. The Northern Hub POD envisages the development of the 5 TCF gas and 400 million barrels of condensates of the Geng North discovery announced by Eni in October 2023, along with the 1.6 TCF of the nearby Gehem discovery. Eni is also planning to conduct a drilling campaign in the next 4-5 years to assess the significant near-field exploration potential within the Eni-operated blocks in the Kutei Basin, amounting to more than 30 TCF of gas.
Gran Tierra Energy has discovered oil at the Charapa Block in Ecuador, just west of the recently discovered Arawana-J1 and Bocachico Norte-J1 wells. The Charapa-86 well is Gran Tierra’s third oil discovery in 2024 and fifth in Ecuador.
Melbana Energy has approved development of Unit 1B onshore Cuba, which includes two additional production wells using existing 2D seismic control targeting the highest confidence 1C resource of 16 million barrels. A 3D seismic acquisition planned for next year will allow subsequent development wells. The entire recoverable resource is estimated at 129 million boe. Melbana Energy is the operator of Block 9 PSC with a 30% interest.
A consistent and integrated high-resolution stratigraphic framework for the Sokor Alternances in the R3 East Area, Agadem Basin, Niger
Temistocles Rojas1*, Raul Bastante1, Ed Robinson1, Tim Wright1 and Christophe Ribeiro1.
Abstract
The Palaeocene-Eocene age Sokor Alternances Formation is interpreted as having developed in ephemeral lakes similar to modern-day examples in the East African Rift system. The Alternances is considered the most prolific hydrocarbon-bearing succession in the Agadem Basin. However, there have been few attempts to fully describe its stratigraphy. Previous authors have divided the Alternances into a different number of stratigraphic units using a range of lithostratigraphic and sequence-based nomenclatures. The inconsistency on the different stratigraphic frameworks presents considerable challenges when correlating the Alternances across the basin.
This paper summarises the findings of a study targeted at delivering a detailed and consistent interpretation of the Sokor Alternances stratigraphy. The study sought to integrate a basin-scale seismic stratigraphic framework with more detailed analysis of stacking patterns from well logs.
Three different seismic facies referred to as stratigraphic units were recognised across the study area. Depositional stacking pattern analysis made it possible to subdivide these three large-scale units into a high-resolution stratigraphic framework. There is evidence that this stratigraphic framework can be extended across the basin as a consistent regional stratigraphic system. Furthermore, the high-resolution stratigraphic framework demonstrates the importance of the different stratigraphic units on discovery trapping mechanisms.
Background
The Sokor Alternances, also known as the Sokor-1 Formation or simply the ‘Alternances’, are Palaeocene-Eocene in age and were formed as part of a rift phase within the Agadem Basin in Niger (Zhou et al., 2017). Clastic sediments of the Alternances were developed within an ephemeral lake system where the sands were deposited by fluvial/deltaic distributary channels and mouth bar deltaic complexes (Jilin et al., 2012, Lai et al., 2020 and Genik, 1992). Shales were formed by floodplain and prodelta to lacustrine processes. The Alternances are considered the most prolific proven hydrocarbon-bearing formation within the Agadem Basin.
Figure 1 shows the relative location of the study area and Figure 2 shows the structural and stratigraphic setting. The area of study is focused on the R3 East Area, where in 2018 Savannah Energy drilled five discoveries: Amdigh-1, Eridal-1, Kunama-1, Bushiya-1, and Zomo-1. In 2017, Savannah acquired and processed a PSTM 3D seismic volume on this area and in 2020 reprocessed the volume to a PSDM version. The 3D seismic data along with the well log information from the five discoveries and a dry hole, Ourami-1, drilled by a previous operator, were used to build the stratigraphic framework presented here. It is important to mention that Ourami-1 was drilled on 2D seismic data, and it is just outside the Eridal structural closure. However,
1 Savannah Energy
* Corresponding author, E-mail: simon.rojas@savannah-energy.com DOI: 10.3997/1365-2397.fb2024082
Ourami-1 has some oil shows reported within the top sand of the Alternances which indicates the proximity to the oil-water contact of the Eridal oil accumulation.
The structural framework (Figure 2) of the Agadem Basin is controlled by a pulsed trans-tensional regime developed during different stages of the rift evolution within the basin (Ahmed et al., 2020). The five discoveries in the R3 East Area were drilled on three-way closures against extensional faults with the structures developed during the latest stages of Cenozoic rifting in the basin dating to late Eocene to Oligocene.
The Alternances were deposited above the Late Cretaceous sand-rich Madama Formation and were succeeded by the shaly Eocene Low Velocity Shale Formation (LVS). The LVS is an important regional top and lateral seal for the hydrocarbon traps within the Alternances (Figure 2).
Internally, the Alternances have been divided into three, four or five units by previous authors e.g. Jilin et al. (2012) and Lai et al. (2020). Following on from the work of previous operators, Savannah Energy (2018) and Wilks et al. (2019) divided the Alternances into five stratigraphic units (E1 to E5) based primarily on well log responses. The use of these different stratigraphic frameworks presents some discrepancies when trying to correlate the Alternances between different fields and areas within the basin.
In order to have a consistent stratigraphic framework, a more comprehensive model was needed. A first pass description of a consistent stratigraphic framework for the Alternances was presented by Rojas et al. (2022) in the EAGE Annual Conference and Exhibition in 2022. In this paper, a detailed interpretation of the internal stratigraphy of the Alternances was performed by integrating a seismic stratigraphic framework with the stacking pattern analysis from well logs.
Three seismic facies (stratigraphic units A, B and C) were interpreted across the R3 East Area. These seismic facies were differentiated on the seismic amplitude display and with the help of different seismic attributes (instantaneous frequency, sweetness, similarity, and spectral decomposition). This stratigraphic division of the Alternances can be extended beyond the R3 East Area, indicating that there is a succession of correlatable geological events that can be used as regional stratigraphic units.
Including this stratigraphic framework into the hydrocarbon trap analysis will help geological risk assessments of potential new exploration targets in the Alternances.
High-resolution stratigraphic framework
The Sokor Alternances stratigraphic framework proposed here, was first based on the seismic responses observed on the R3 East PSDM seismic volume. It is well documented that seismic facies descriptions have previously been used to identify sedimentological and stratigraphic events in the rock record; some good examples can be found in Posamentier (2011) and Moscardelli et al. (2006).
Figure 3 illustrates the interpretation of the three main seismic units/facies in the Alternances, using the amplitude display, frequency and sweetness seismic attributes, where:
(i) The basal Unit A is characterised by continuous reflectors with bright high amplitude reflectors. Frequency and Sweetness attributes exhibit a consistent seismic response.
(ii) Unit B is characterised by discontinuous reflectors and rapid lateral and vertical variations in reflector brightness. Frequency and Sweetness attributes also present patchy
responses. The presence of multiple discontinuous seismic reflectors is interpreted as erosive surfaces.
(iii) Unit C at the top of the Alternances is described as a set of fairly continuous reflectors, less bright and with lower amplitudes than the reflectors in Unit A, but with greater continuity than the reflectors in unit B. Seismic attributes of Frequency and Sweetness show moderately continuous events similar to the response observed in amplitude displays.
Using the three stratigraphic seismic units as a foundation, a high-resolution sequence stratigraphic framework (Figure 4) was developed by integrating depositional stacking patterns from well logs with the interpreted seismic facies/units.
The high-resolution sequence stratigraphic framework was built based on the evolution of the relationship A/S; where A = accommodation space and S = sediment supply. The applied sequence stratigraphy methodology for non-marine strata is adapted from similar ones presented by Cross (1991), Allen et al. (1996), Kjemperud et al. (2008) and Fanti and Catuneanu (2010).
As described by Ramon and Cross (1997), channel sandstones deposited in low A/S conditions are amalgamated and areally continuous. The finer sand and muddy sediments composing the upper parts of channel bars and most floodplain sediment are not preserved. The resulting reservoir sandstone is more homogeneous with high porosity and reduced clay content, enhancing permeability. Higher A/S conditions result in a lower degree of channel amalgamation and increased preservation of floodplain sediment. Channel sandstones tend to be single storey, isolated bodies embedded in floodplain deposits. The geomorphic elements composing the individual channels are better preserved and more mud is deposited.
As seen in Figure 4, when the A/S relationship is higher than 1 the connectivity of channelised sandbodies is reduced and floodplain deposits (silts and clays) are more common. When the relationship A/S is less than 1, channelised sandbodies show greater connectivity generating continuous layers of reservoir
facies. An A/S relationship close to 1 can be associated with aggradational stacking patterns of sands and shales.
Based on the analysis of the evolution of the A/S relationship, it is observed that Unit A could be subdivided into three further sub-units: A1 and A3 sandy units, separated by a shaly unit (A2).
Unit B and Unit C can each be divided into two sub-units. Sub-units B1 and B2 are separated by an inflection point of the A/S relationship where the relationship changes from A/S >1 to A/S<1. Sub-units C1 and C2 can be interpreted as two cycles of
variation of the A/S relationship separated by another inflection point. The inflection points on the evolution of the A/S relationships are related to basin-wide correlatable flooding events explained in detail the following section.
Sequence stratigraphy description
An erosive surface separates the Alternances from the sandy Madama Formation and is considered a sequence boundary (SB1). Overlying SB1, the deposition of sub-units A1 and A2 occurs during a transgressive event. The top of A2 is interpreted
Figure 6 Well log correlation of Unit B including: a) SW-NE seismic line crossing Eridal-1 discovery; b) RMS amplitude extraction at the bright yellow reflector showing features that resemble an eroded channel and c) a representation of the evolution of Unit B (modified from Allen et al., 1996).
Figure 7 Well log correlation of Unit C including: a) Modern analogue – Lake Albert. Google Earth Pro v7.3.6.9345 (December 29, 2022). Lake Alberta, Uganda 3o 22’ 00.16’’N 31o 39’ 15.76’’E, eye alt 49.47km. Maxar Technologies 2021. http://www.earth.google.com [2023]. b) Spectral decomposition extraction at the top of Unit C showing features that resemble a channel and c) a representation of the evolution of Unit C (modified from Allen et al., 1996).
as a maximum flooding surface (MFS1) characterised by an inflection point of the trend of the A/S relationship. The overlying sub-unit A3 is deposited during a High Stand System Tract. The top of unit A has been interpreted as an erosive surface generating a second sequence boundary (SB2).
A second transgressive event ends at the top of the sub-unit B1 with a second maximum flooding surface (MFS2, another inflection point of the A/S relationship trend). An aggradational stacking pattern of sand and shale intercalations is observed in sub-unit B2. Unit B and Unit C are separated by a third erosive surface (SB3).
Unit C is comprised of two cycles of the A/S relationship variation and can be interpreted as two deltaic cycles (i.e. subunits C1 and C2) separated by a third flooding event (MFS3). The top of unit C is interpreted as the last sequence boundary (SB4) of the Alternances. Finally, a maximum flooding surface related the maximum lacustrine flooding event is interpreted above the SB4 and is considered part of the LVS Formation.
Depositional environment interpretation
In general, the Alternances is interpreted to have been deposited under fluvial, deltaic, and lacustrine depositional systems (Hamidou et al., 2023). These depositional systems were filled with fluvial/ distributary channels and mouthbar sandy deposits as well as shaly sediments from flood plain, prodelta and lacustrine processes.
Figures 5, 6 and 7 represent the evolution of the depositional environments of the Alternances based on the new stratigraphic framework. The figures show a correlated well log section across the Alternances, along with modern East Africa analogues from Google Earth showing the distribution of depositional environments in a rift lake. A series of seismic attribute extractions also helped to identify events that could be used to create a more detailed depositional environment interpretation.
As observed in Figures 5, 6 and 7, the evolution of the depositional environments of the Alternances within the R3 East Area is described as follows:
(i) Unit A was interpreted to be formed under deltaic condition, specifically the lower delta plain to prodelta and the unit could be subdivided into three sub-units.
(ii) Unit B corresponds to a series of sandy and silty distributary/fluvial channels embedded within a shaly matrix of flood plain and/or clay-filled channels. The channels are eroded and truncated, only preserving lenses of sand with relatively low interconnection within a shaly matrix.
(iii) Unit C can be separated into two cycles of lacustrine upper to lower delta-plain sequences.
Table 1 describes the stratigraphic unit and sub-unit characteristics of the new high-resolution framework.
Seismic Facies
C Fairly continuous reflectors with sporadic erosive events
C2
C1
B2
B Very discontinuous reflectors
A Very continuous reflectors, with bright amplitude (associated with the presence of shales with carbonaceous debris)
Beyond the R3 East area
Although the proposed framework has been fully corroborated within the R3 East Area, there is evidence that its applicability could be extended basin wide. Figure 8 is a regional seismic line where the three stratigraphic units described within the R3 East area can be clearly identified within the amplitude display as well as with the instantaneous frequency and sweetness attributes. This shows that the evolution of the depositional conditions of the Alternances were fairly constant throughout the basin. It is only towards the margins of the basin where the three stratigraphic units cannot be differentiated. More detailed work such as seismic interpretation integrated with well data, core descriptions and biostratigraphy is needed to better understand the genetic relationship of the stratigraphic framework at a basin scale, outside the R3 East area.
Controls on the geological risk analysis
As expected, most of the characterisation of the controlling factors of the hydrocarbon accumulations in the Agadem Basin have been focused on the structure, the regional seals and the hydrocarbon migration paths (Zhou et al ., 2017). By integrating the new stratigraphic framework to the hydrocarbon trapping analysis of the five R3 East discoveries, it can be noted that:
1) Hydrocarbons are very likely to be retained in Unit C, due to the closeness to the Low Velocity Shale (LVS), that works as a regional top and lateral seal.
2) The presence of hydrocarbon accumulations in Unit B is expected to be less frequent than in Unit A because there is not a regional/continuous shale seal. There is also a high risk of sand-sand juxtaposition problems through faults. Reservoir quality is reduced in this unit due to higher content of shale. On the upside, there is the possibility of finding isolated sand lenses which would be ideal stratigraphic traps in this unit.
3) Unit A represents the sands with the best reservoir properties in the Alternances. It can retain hydrocarbons when the trap is a 4-way closure, due to the presence of a continuous top
Fairly continuous interlayering of sand and shales.
Fairly continuous interlayering of sand and shales
Interfingering of sand lenses within a matrix of shales and silts
B1
A3
A2
A1
Interfingering of sand lenses within a matrix of shales and silts
Thick and clean sandy unit
Shaly unit with some layers of silts or very fine-grained sand
Clean sands with some intercalations of shaly layers
Table 1 Description of the Alternances stratigraphic units and sub-units.
Formed in lower delta plains with channels and mouth bars
Formed in an upper to lower delta plain with channels and mouth bars
Fluvial to upper delta plain with sandy channel systems embedded within a shaly matrix
Deposited under high energy shoreface conditions
Delta front to pro-delta away from an active deltaic lobe
Deposited under upper to mid delta plain conditions
shale that forms the sub-unit A2. In a three-way closure configuration this unit is very likely to have problems with sand-sand juxtaposition through the fault since the sands will be most likely in lateral contact with shallower Alternances sandy units (footwall drilling) or the deeper sandy Madama Formation (hanging wall drilling).
Results and conclusions
• The proposed consistent stratigraphic framework for the Sokor Alternances is based on an integrated approach using seismic and well log data.
• The stratigraphic framework is comprised of three main units (A, B and C) and can be recognised in the R3 East area in seismic and well log data.
• The surfaces that separate the main stratigraphic units are related to abrupt changes of the accommodation space and sediment supply relationship and were interpreted as sequence boundaries.
• The subdivision of the main stratigraphic units is consistent among the six wells drilled in the R3 East area. The stratigraphic subdivisions have been related to flooding events and can be recognised as inflection points in the evolution of the A/S relationship.
• More well data from outside the R3 East Area need to be included to clearly understand if these subdivisions are regional events or just related to localised geological events like channel avulsions, local source of sediments or minor tectonic.
• It has been observed that the three main stratigraphic units can be extended across the basin. The three seismic facies can be
interpreted on seismic data from other areas of the Agadem Basin. The units can be indicative of a sequence of geological events across the basin.
• It is recommended to include the proposed stratigraphic framework in the analysis of the hydrocarbon trapping mechanism within the Sokor Alternances, that will improve the reliability on the estimation of the geological chance of success in future drilling prospects.
References
Ahmed, K.S., Liu, K., Mioumnde, A.P., Kra, K.L., Kuttin, A.A.-A., Malquaire, K.P.R. and Ngum, K.M.M.-A. [2020]. Anatomy of eastern Niger rift basin with specific references of its petroleum systems. International Journal of Geosciences, 11, 305-324.
Allen, G.P., Lang, S.C., Muskati, O. and Chirinos, A. [1996]. Application of sequence stratigraphy to continental successions: implications for Mesozoic cratonic interior basins of Eastern Australia. Mesozoic Geology of the Eastern Australia Plate Conference. GSA, Extended Abstracts, 43, 22-26.
Cross, T.A. [1991]. High-resolution stratigraphic correlation from the perspectives of base-level cycles and sediment accommodation. In: Dolson, J. (Ed.), Unconformity Related Hydrocarbon Exploration and Accumulation in Clastic and Carbonate Settings, short course notes. Rocky Mountain Association of Geologists, 28-41.
Fanti, F. and Catuneanu, O. [2010]. Fluvial sequence stratigraphy: The Wapiti Formation, West-Central Alberta, Canada. Journal of Sedimentary Research, 8, 320-338.
Genik, G.J. [1992]. Regional framework, structural and petroleum aspects of rift basins in Niger, Chad and the Central African Republic (C.A.R.). Tectonophysics, 213, 169-185.
Avo leads identified along the Natal Valley, offshore South Africa
Sean Davids1*
Abstract
The offshore Natal valley along the east coast of South Africa is a large, underexplored frontier region. Newly acquired seismic datasets not only reveal new play and lead opportunities, but also allow the application of limited AVO analysis. Legacy seismic data were acquired during the 1970s along the narrow continental shelf only. However, the 2013 and 2018 PGS datasets expanded across the continental, transitional and oceanic crustal domains. The available seismic datasets include the full stack (5-35°), near (5-16°) and far offset (27-38°). The latter was loaded, and addition trace calculations conducted, comprising of far minus near and far minus near multiplied by far. The new data not only adds new play opportunities to this frontier basin but also identifies four leads that produce a positive AVO response. While additional seismic data is required to test the viability of the leads and derive maximum benefit from AVO analysis, the results of this study assist in de-risking the leads and provide new optimism to the frontier Natal valley.
Introduction
South Africa’s hydrocarbon potential has been thrust into the spotlight after the recent successful discoveries within the offshore Bredasdorp basin along the south coast. The success of the Brulpadda and Luiperd prospects within the Paddavissie play is built on sound regional geological analysis and through utilising new datasets to expand on existing interpretations. Davids, et al., (2018) conducted a regional interpretation of the entire east coast of South Africa that includes the Zululand basin, Durban basin, Natal valley, and parts of the Transkei basins. The report produced regional maps of the relevant seismic horizons (time and depth), isopach maps of the seismic sequences, regional sedimentological interpretations, 1D geochemical basin modelling assessment of potential source rocks and the hydrocarbon potential of new and existing plays and leads. The study area, the offshore Natal valley, is a frontier basin that has limited data and is underexplored. The nearest well is located more than 200 km to the NE within the offshore Durban basin and seismic data is sparse. The first acquisition took place during 1974; four decades later PGS conducted two multiclient surveys, during 2013 and 2018. The main challenges affecting the area are the strong currents which defected the streamer to high feathering angles especially in the shelf area between shallow and deep-water. In addition, the complexity of water bottom structure affects the accuracy of multiple modelling. A 2D surface-related multiple elimination approach was applied for the deep data, while a combined 2D surface related multiple elimination and shallow water de-multiple approach was applied for the shallow data (PGS, 2014).
1 Petroleum Agency SA
* Corresponding author, E-mail: davidss@petroleumagencysa.com DOI: 10.3997/1365-2397.fb2024083
The acquisition was conducted using the PGS GeoStreamer® broadband survey system while the latest processing technology, a conventional pre-stack time migration sequence comprising noise attenuation, multiple attenuation and 2D Kirchhoff prestack time migration, was applied to produce the best image of the sediment section and the basement structures. The resultant time and depth seismic datasets include full stack, near and far offset stacks.
The study integrates the results of the leads that were identified on the full-stack seismic data and assesses the likelihood of any amplitude variation with offset (AVO) response. The newly identified leads are additional to the existing portfolio as evaluated by Davids, et al., (2018) where the source and reservoir models were conceptualised for the entire offshore South Africa. This study introduces a novel approach to the area, utilising trace calculations and AVO to de-risk leads.
Geological setting
The tectonic development of the east coast of South Africa is contentious due to the many uncertainties resulting from data sparsity across this large-scale region. The area (from north to south) consists of the Zululand basin both onshore and offshore along the northeastern border with Mozambique, the Durban basin and the Natal valley; the Mozambique basin is within extreme deep water (>3000 m) to the east of the ridge (Figure 1). Various authors have provided a geochronological account of stages during the continental break up from Jurassic to present (McDonald, 2003; Bumby, 2005; Watkeys, 2006; Veevers, 2012; Hanyu et al., 2017). Veevers, (2012) assumes the pre-break up
Figure 2 The spatial representation of the offshore seismic leads in relation to the onshore transect X-X analysed by Brown et al., (2002) during the study of the onshore denudational history. Additional displays include the location of the four offshore wells within the Durban basin and the two 3D surveys, viz: the 2016 deepwater Durban basin and the 2018 Transkei surveys.
reconstruction as a ‘tight fit’ while Watkeys (2006) regards it as a loose fit reconstruction. The tight fit model (Veevers, 2012) considers six stages of separation of the conjugate continental masses from Antarctica by rifting and drifting. The ‘loose fit’ model of Watkeys, (2006) subdivides the analysis into five stages starting in the lower Jurassic (185Ma) at the time of Karoo volcanism while the end is regarded as the time of Falkland Plateau detachment from the Agulhas Bank in the Late Cretaceous (90Ma). Hanyu et al., (2017) proposed a new four-stage model
Jurassic
Figure 1 The water depth to seafloor (m) and the regional extent of the area includes the Mozambique Ridge along the eastern edge, Natal valley to the south and the Durban and Zululand basins in the north.
for crustal formation and the location of the continental oceanic boundary for the Natal valley. The major structural features that influenced the architecture of the offshore basins along the east coast includes the Mozambique ridge, Agulhas Fracture Zone, and the development of the Natal Valley. It is within the Natal valley where the seismic leads are identified and mapped. The offshore sedimentary fill across these vast basins is interpreted to have started during the break up (Davids, et al., 2018).
The understanding of the development of the Natal valley study area has been constrained by the tectonic structures that formed during the break up. The hinterland onshore geology was studied by numerous authors (Dingle et al., 1983; Veevers et al., 1994; Johnson et al., 1996). However, it is the work of Brown et al., (2002) that is most relevant to the study area in the Natal valley.
Brown, et al. (2002), conducted a study of the denudation history along a ~500 km transect across the Drakensberg escarpment (Figure 2). The lithology across this transect is summarised in table 1. The Carboniferous to Jurassic-aged lithology consists of good potential source and reservoir sediments supplied to the offshore areas.
According to the well completion report of onshore well SW 1/67, the Beaufort series is fine grained, clay-rich and appears very tight. This indicates poor reservoir potential. The Ecca Group is coarser grained; however, the sandstones have been intruded by dolerite intrusion and have low porosity. Mud losses in the fracture and breccia sector indicate good secondary
Carboniferous Dwyka Formation
Table 1 A tabulated summary of the hinterland lithology modified after Brown, et al. (2002).
Diamictite at their base
porosity. Small amounts of methane gas were encountered below 1050 m. However, due to the numerous fractures and brecciated zones at the well, it was difficult to determine the origin of the methane gas (van Vuuren, 1972).
Methods and results
Traditional mapping
Davids, et al. (2018) conducted a regional geological study of the entire offshore east coast area. The mapping, using IHS Kingdom® software, integrated all the available seismic and well datasets that produced various surfaces, maps and isopachs for the major seismic horizons; pseudo wells were created and 1D Petromod analysis was conducted. This work identified numerous plays and leads in the area.
The 2013 and 2018 multiclient/ speculative surveys were acquired in new untested deepwater areas of the Natal valley. In addition to the full-stack seismic data, PGS also provided near and far offset seismic data for the related surveys. The integration of the new dataset not only adds new play and lead opportunities but also provides an opportunity to apply limited AVO methods to the area. The trace calculations are only relevant to the new leads that were identified on the PGS dataset.
AVO is a common prediction method to derive lithology and fluid properties from seismic data and has been applied for decades. The great promise of pre-stack AVO of reflected compressional waves lies in the dependence of the reflectivity with increasing offset (Castagna, 2001). As different lithologies may exhibit distinct Poisson’s ratios, and gas-bearing strata usually exhibit anomalously low Poisson’s ratios, AVO has proven to be a useful seismic lithology tool and direct hydrocarbon indicator (DHI).
AVO cross plotting is another widely used technique that enables the simultaneous and meaningful evaluation of two attributes with ease. Generally, common lithology units and fluid types cluster together in AVO cross plot space, allowing identification of both the background lithology trends and anomalous off-trend aggregations that could be associated with hydrocarbons (Chopra, et al., (2003) and Veeken et al. (2006)).
The cross plotting has been successfully utilised to quantify anomalous seismic responses, i.e., deviant, or anomalous events
from well-defined background lithology trends. While initially AVO cross-plotting typically used the intercept and gradient to demonstrate its value in AVO analysis (Foster, et al. 1993), Foster, et al., (1997), and Castagna, et al., (1998); Goodway, et al, (1997) improved the petrophysical discrimination of rock properties by using derived elastic parameter cross plots.
AVO and trace calculations
The integration of the PGS dataset yields new play and lead opportunities. The zero phased datasets were acquired over the continental/transitional crust and the oceanic crust in the Natal valley. The polarity of the project dataset is SEG positive standard (positive peak red display). However, the plays and leads were identified and mapped on the full stack seismic data over the three crustal domains. The interest in the leads was amplified when the near and far offset stacks for the lines became available, were loaded into the project and trace calculations could be conducted.
IHS Kingdom® trace calculation methods included the following:
• Far offset minus Near offset (F-N) and
• Far offset minus Near offset multiplied by Far offset ((F-N) x F)
The calculation method is commonly used to highlight the variation between the far and near offsets (Castagna, 2001). The results of the following four leads give exceptional AVO responses, providing a good visual display of the data and a strong result from the trace calculations. The four leads are divided into two play types, i.e., wedge play- Lead Daisy and Lead Tulip and basin floor fan play- Lead Lily and Lead Jasmine. The leads are located within water depths of more than 3000 m along the north-western part of the basin (Figure 3). The soft signal, increasing amplitude signatures, were identified on both the near and the far offset stacks, while the seismic response from the trace calculations provides additional validation to the potential of the leads.
Seismic AVO Leads
Wedge Play on transitional/continental crust
Lead Daisy is identified on a single seismic line and most likely extends to more than 90 km2 in extent on the western slope of a
Figure 3 The location of the leads along the Natal valley, east coast SA. The leads are located within more than 3000 m of water; seismic data are sparse with line spacing more than 20 km apart.
basement high (Figure 4). The full stack amplitude anomaly is bright and dims downslope. The results of the trace calculations (F-N) and ((F-N) x F) indicate a positive AVO response for this lead.
Lead Daisy
Lead Tulip
Lead Tulip is mapped on two seismic lines and most likely covers more than 220 km2 (Figure 5). Similar to Lead Daisy, it is located on the slope of a basement high, the full stack amplitudes are bright and dim downslope and the results of the trace calculations (F-N) and ((F-N) x F) indicate a positive AVO response for Lead Tulip.
Basin Floor Fan Play on oceanic crust
Lead Lily is mapped as a basin floor fan from two seismic lines (Figure 6). It most likely extends for more than 144k m2. The full stack amplitude anomaly is bright and dims out laterally. The results of the trace calculations (F-N) and ((F-N) x F) indicate a positive AVO response for Lead Lily.
Lead Lily
Lead Daffodil
Lead Daffodil likely covers more than 420 km2 across the oceanic basement (Figure 7). This lead has the most seismic lines with positive correlation. The lead is bright and pinches our laterally. The amplitude results of the trace calculations (F-N) and ((F-N) x F) are less compelling but a positive AVO response is observed.
Limitations
The PGS 2014 processing reports indicates that the area shows some challenges for imaging, being mainly due to the complexity of the water bottom in addition to the high degree of cable feathering, complex geology and velocities for the surveys. Also, the leads that are identified are limited by the widely spaced 2D seismic datasets, lack of well calibration and access to the trace gathers to conduct any reservoir characterisation from the AVO cross plotting.
However, the AVO methodology is a common starting point when leads are identified and mapped from full stack seismic data. The cross-plotting of AVO leads has been successfully utilised to quantify seismic responses, i.e. deviant or anomalous events, from well-defined background lithology trends. Initially AVO cross-plotting typically used the intercept and gradient to demonstrate its value in AVO analysis.
Discussion
The Natal valley is a frontier region that is underexplored and has the potential to hold extensive hydrocarbon resources. The lack of offshore well information is not ideal; however, hinterland geology provides ample confirmation for sufficient potential source and reservoir sediments. The acquisition of additional seismic and relevant datasets is essential to improve the understanding of the identified leads and add to the existing portfolio in this frontier area.
Excellent examples of how additional datasets can lead to success include the Sea Lion prospect in the North Falklands Basin and the most recent discoveries offshore the Bredasdorp
basin, South Africa; within the Paddavissie play. MacAulay, (2015) recognised that comprehensive data acquisition and analysis has been key to de-risking the first commercial development in the North Falkland Basin.
The results from the regional mapping identified the seismic leads on the widely spaced full stack seismic lines that were acquired in a challenging environment. The trace calculations, (F-N) and ((F-N) x F), of this non-unique AVO method have assisted in de-risking the leads. The confidence in the identified leads multiplied when these were confirmed on the near and far offset datasets. However, the subjective ranking of the leads based on the seismic data only was not an objective. Notwithstanding the method and data limitations, globally the AVO method has proven to be successful. These opportunities should not be dismissed and must be utilised as a stepping stone to future exploration in this frontier area. South Africa is energy dependent, and the projected economic gains from the Paddavissie project are substantial. A similar successful episode along the east coast would multiply economic gains for both the region and the country.
Conclusion and recommendations
The frontier Natal valley is underexplored; there are no wells and only widely spaced sparse 2D seismic lines in the area. The offshore environment along the east coast of South Africa poses challenging conditions to seismic acquisition while the hinterland geology provides good source and reservoir rock potential to the offshore area. The regional work that was completed by Davids et al., (2018) highlighted this and provided new play and lead
opportunities. The acquisition and availability of additional seismic datasets not only expands the regional interpretation but also adds to the existing lead portfolio and introduces AVO analysis to certain leads. The four leads have a positive AVO signature on both the near and far offset stacks. The trace calculations, (F-N) and ((F-N) x F), are additional confirmation of the lead potential. This non-unique methodology is a useful DHI that is commonly used in the industry. The study is in its infancy and has several limitations, but the results have provided new optimism to the leads that was identified in this vast frontier area/region.
It is recommended that future studies include:
• The integration of the seismic gathers for the relevant seismic lines to expand on the AVO analysis.
• The creation of pseudo wells, using the hinterland lithology, and applying inversion studies that might assist with the determination of any lithological parameters that can affect the seismic as well as to determine any fluid effects that might be present.
• The application of 1D petroleum system modelling studies: continental crust vs transitional crust vs oceanic crust.
References
Beater, B.E. and Maud, R.R. [1960]. The occurrence of an extensive fault system in SE Zululand and its possible relationship to the evolution of part of the coastline of South Africa, Trans. Geol. Soc. S. Afr., 63, 51-64.
Brown, R.W., Summerfield, M.A. and Gleadow, A.J.W. [2002]. Denudational history along a transect across the Drakensberg Escarpment of southern Africa derived from apatite fission track thermochronology,
Journal of Geophysical Research, 107(B12), 1-18, doi:10.1029/ 2001JB000745. 2002.
Bumby, A.J. and Guiraud, R. [2005]. The geodynamic setting of the Phanerozoic basins of Africa. Journal of African Earth Science, 43, 1-12.
Castagna, J.P. and Smith, S.W. [1997]. Principles of AVO crossplotting, The Leading Edge, 4(16), 337-341.
Castagna, J.P., Swan, H.W. and Foster, D.J. [1998]. Framework for AVO gradient and intercept interpretations: Geophysics, 63, 948-956.
Castagna, J.P. [2001]. AVO ANALYSIS. University of Oklahoma, Institute for Exploration and Development Geosciences, School of Geology and Geophysics, U.S.A. CSEG Recorder, June 2001.
Chopra, S., Alexeev, V. and Xu. Y. [2003]. Successful AVO and Cross-plotting. Core Laboratories Reservoir Technologies Division, Calgary, Canada, 28(09).
Connolly, P. [1999]. Elastic Impedance. Leading Edge, 18, 438-452.
Davids, S., Buthelezi, T., Fielies, A. and Salomo, J. [2018]. A Regional Assessment of the Hydrocarbon Potential of the East Coast, offshore South Africa. Petroleum Agency SA, Cape Town, 1-218. ISBN9780-6399336-1-0
Davies, D.J., McInalley, A. and Barclay, F. [2003]. Lithology and fluid prediction from amplitude versus offset (AVO) seismic data. Geofluids, 3, 219-232.
Dingle, R.V., Siesser, W.G. and Newton, A.R. [1983]. Mesozoic and Tertiary Geology of Southern Africa, A.A. Balkema, Rotterdam. Eales, H.V., Marsh, J.S. and Cox, K.G. [1984]. The Karoo igneous province: An introduction, in Petrogenesis of the Volcanic Rocks of the Karoo Province, edited by A. J. Erlank, Special Publication of the Geological Society of South Africa, 13, 1-26.
Foster, D.J., Smith, S.W., Dey-Sarkar, S. and Swan, H.W. [1993]. A closer look at hydrocarbon indicators. 63rd Annual SEG Meeting, 731-733. (Abstract)
Foster, D.J., Keys, R.G. and Reilly, J.M. [1997]. Another perspective on AVO crossplotting: The Leading Edge, 16(9), 1223-1237.
Goodway, W., Chen, T. and Downton, J. [1997]. Improved AVO fluid detection and lithology discrimination using Lame petrophysical parameters, ‘λρ‘, ‘μρ‘ and ‘λ/μ‘ fluid stack from P and S inversion , CSEG, 148-151. (Abstract)
Hanyu, T., Nogi., Y. and Fujii, M. [2017]. Crustal formation and evolution processes in the Natal Valley and Mozambique Ridge, off South Africa. Polar Science, 13, 66-81.
Johnson, M.R., C.J., Vuuren, W.F., Hegenberger, R.K. and Shoko, U. [1996]. Stratigraphy of the Karoo Supergroup in southern Africa: An overview, Journal of African Earth Sciences, 23, 3-15.
MacAulay, F. [2015]. Sea Lion Field discovery and appraisal: a turning point for the North Falkland Basin. Petroleum Geoscience, 21(2-3), 111-124.
Macdonald, D., Gomez-Pereza, I., Franzese, J., Spalletti, L., Lawver, L., Gahagan, L., Dalziel, I., Thomas, C., Trewind, N., Hole, M. and Paton, D. [2002]. Mesozoic break-up of SW Gondwana: implications for regional hydrocarbon potential of the southern South Atlantic. Marine and Petroleum Geology, 20, 287-308.
Maud, R.R. [1961]. A preliminary review of the structure of coastal Natal. Transactions of the Geological Society of South Africa, 64, 247-256.
PGS, [2014]. Offshore South Africa, 2D Seismic Data Processing. Final Processing Report, December 2014, PGS Imaging and Engineering Middle East, 1-64.
Shadlow, J. [2014]. A description of seismic amplitude techniques, Exploration Geophysics, 45(3), 154-163.
Van Vuuren, C.J. [1972]. Geological well completion report of the Swartberg (SW 1/67) Borehole. Geological Survey, SV 1013, SOEKOR PetroSA Library, 1-14 (unpublished report).
Veeken, P.C.H. and Rauch-Davies, M. [2006]. AVO attribute analysis and seismic reservoir characterization. First Break, 24(2).
Veevers, J.J., D.I. Cole, D.I. and Cowan, E.J. [1994a]. Southern Africa: Karoo Basin and Cape Fold Belt. Geological Society of America Memoir 184, 223-279.
Veevers, J.J. [2012]. Reconstructions before rifting and drifting reveal the geological connections between Antarctica and its conjugates in Gondwanaland. Earth Science Review 111, (3-4), 249-318.
von Veh, M.W. and Andersen, N.J.B. [1990]. Normal-slip faulting in the coastal areas of northern Natal and Zululand, South Africa, South African Journal of Geology, 93, 574-582.
Watkeys, M.K. [2006]. Gondwana break-up: A South African perspective. In: Johnson, M.R., Anhaeusser, C.R. and Thomas, R.J. (eds.). The Geology of South Africa. Geological Society of South Africa and Council for Geoscience. 531-540.
Whitcombe, D., Connolly, P.A., Reagen, R.L. and Redshaw, T.C. [2002]. Extended elastic impedance for fluid and lithology prediction. Geophysics, 67, (1), 63-67.
Special Topic
ENERGY TRANSITION
Submit an article
This month we showcase the critical role that geoscientists are playing in developing innovations to ease the energy transition.
Gregor Duval et al present a method for the quantitative assessment of the subsurface suitability of saline aquifer CO2 storage sites using a case study from the Northern North Sea.
Roya Dehghan-Niri et al present the results from a series of 2D and 3D ministreamer operations across the Sleipner CO2 storage site, which are assessed and compared with conventional streamer seismic.
Paul Helps et al discuss CO2 mineralisation within mafic and ultramafic rocks, where carbon is incorporated into the structure of the rock through the crystallisation of new, stable carbonate minerals, potentially offering the means to store CO2 safely, rapidly and permanently in large quantities.
Kim Gunn Maver et al demonstrate that with closed-loop solutions it is possible to significantly impact the decarbonisation of district heating, district cooling, industrial heating requirements, and electricity production moving towards ‘zero’ CO2 emissions with a nearly unlimited resource of heat from the earth’s interior that is both reliable and cost effective.
Philip Ringrose et al outline the critical role that geoscientists can play in advancing projects and communicating the risks and benefits of emerging projects to society.
Rasoul Sorkhabi et al highlight recent advancements and key features within Utah’s new energy corridor, showcasing the state’s progress toward sustainable energy resources.
Sougata Halder et al present a novel workflow for developing a basin-scale stratigraphic architecture for defining the major saline reservoirs and sealing units within a basin.
First Break Special Topics are covered by a mix of original articles dealing with case studies and the latest technology. Contributions to a Special Topic in First Break can be sent directly to the editorial office (firstbreak@eage.org). Submissions will be considered for publication by the editor.
It is also possible to submit a Technical Article to First Break. Technical Articles are subject to a peer review process and should be submitted via EAGE’s ScholarOne website: http://mc.manuscriptcentral.com/fb
You can find the First Break author guidelines online at www.firstbreak.org/guidelines.
Special Topic overview
January Land Seismic
February Digitalization / Machine Learning
March Reservoir Monitoring
April Underground Storage and Passive Seismic
May Global Exploration
June Technology and Talent for a Secure and Sustainable Energy Future
July Modelling / Interpretation
August Near Surface Geo & Mining
September Reservoir Engineering & Geoscience
October Energy Transition
November Marine Acquisition
December Data Management and Processing
More Special Topics may be added during the course of the year.
The Storage Play Quality Index (SPQI): a multidisciplinary CO2 storage screening methodology
Gregor Duval1*, Robert Porjesz1, Simon Otto1, Carl Watkins1, Mohammad Nassir1, Alina Didenko1, Pablo Cifuentes1 and Carolina Olivares1 present a method for the quantitative assessment of the subsurface suitability of saline aquifer CO2 storage sites using a case study example from the Northern North Sea.
Introduction
The Paris Agreement (UNFCC 2016) and subsequent ratifications (COP26 2021) provided a pathway to reduce global anthropogenic CO2 emissions with the goal of limiting global temperature rise to less than 2 degrees Celsius. An essential part of these agreements is carbon capture and storage (CCS) in geological rock formations. In the IEA Sustainable Development Scenario, CCS accounts for nearly 15% of the cumulative reduction in emissions compared with the Stated Policies Scenario (IEA, 2020). The projections for future CO2 storage requirements, given the continued role of fossil fuels in the energy mix, necessitate a rapid increase in sequestered CO2 volumes; from ~35.8 Mt/ year today (Liu et al., 2023) to around 10 Gt/year by 2070 (IEA 2020;). In order to provide the CO2 storage requirement in a short timeframe, large numbers of safe storage sites have to be identified. In this paper we present a basin-scale CCS screening methodology to help identify and prioritise suitable areas for the geological storage of CO2
Several CCS site screening methodologies have been published including the UK CO2 Stored (Bentham et al. 2014), Norwegian Petroleum Directorate CO2 Storage Atlas (Halland et al. 2013), the European CO2StoP (Poulsen et al. 2015) and DOE-NETL (Levine et al. 2016). All of these focus on high-level storage capacity estimations of the geological formations in the areas of interest and CO2 sources, economic criteria and financial criteria (e.g. Bump et al. 2021; Sun et al. 2021). However, the limiting factor in most geological formations for CO2 storage is not the capacity of the reservoir itself, but the injectivity (the volume of CO2 that can be injected in a given time (Valluri et al. 2021) and the geomechanical properties of the reservoir and seal (Alcalde et al. 2021). Only a small number of published methodologies include these as key factors (e.g. Callas et al. 2024).
The screening process discussed here, developed by the authors, is called the Storage Play Quality Index (SPQI) and uniquely combines geology, stratigraphy, petrophysics, reservoir engineering, geochemistry, geomechanics and data science to provide a quantitative assessment of the suitability and spatial variation of key candidate storage units. The SPQI is applicable
to both saline aquifer storage, and depleted hydrocarbon field storage. It identifies specific prospective areas and storage units within the basin prior to further, more detailed analyses
1 Viridien
* Corresponding author, E-mail: Gregor.Duval@viridiengroup.com
DOI: 10.3997/1365-2397.fb2024084
(including for example prediction of injected CO2 plume migration and detailed site integrity assessments). The methodology has been applied to multiple protractions in the shallow water US Gulf of Mexico, to basins in SE Asia and to the UK and Norway. Here we use an example of a basin-scale assessment of the Northern North Sea Basin covering an area of ~80,000 km2 (Figure 1).
Northern North Sea tectono-stratigraphic evolution
To understand the CCS opportunities in the Northern North Sea it is crucial to understand the geology, which governs the locations, thickness, extent and quality of reservoirs and the presence and effectiveness of seals. The geological history of the Northern North Sea is characterised by major phases of extensional rifting during the Permian, Triassic and Late Jurassic periods and a good summary is provided by Underhill and Richardson (2022). A representative cross section (Figure 2) displays several of the key features in the study area, including the characteristic horst, graben and half graben structures in the pre-Cretaceous. The absence of much of the Upper Triassic and Lower Jurassic, due to the volcanic-related thermal doming that created the Mid-Cimmerian Unconformity, and the transition from active extension at the end of the Jurassic period to thermal subsidence in the Cretaceous is also evident. The latter led
to the development of a thick Late Cretaceous and Cenozoic post-rift succession that overlies the heavily faulted preceding stratigraphy (Figure 2).
Stratigraphy of interest
The Northern North Sea is a prolific hydrocarbon region with multiple reservoirs that are candidates for CO2 storage. For the purposes of this study three ‘plays’ were selected; 1) Paleocene (the Sele and Lista Formations), 2) Late Jurassic Oxfordian (Sognefjord, Brae, Heather and Kimmeridge Clay Formations), and 3) Early Jurassic Pliensbachian (Cook and Drake Formations) (Figure 3). This paper documents the SPQI methodology using examples from the Late Jurassic Oxfordian play interval. Whereas we typically define a storage play as a reservoir-seal couplet, within the UK and European Union carbon storage sites are required to demonstrate an effective secondary seal for containment and assurance purposes (EU Directive, 2009). The play components of reservoir, primary seal and secondary seal are briefly described below.
Late Jurassic Oxfordian reservoirs
There are several lithostratigraphic units which could form suitable storage reservoirs within the Late Jurassic Oxfordian play interval, including the Oxfordian parts of the Sognefjord
Formation, the Brae Formation and sand-prone parts of the Heather Formation. The Oxfordian elements of the Brae Formation predominantly comprise coarse siliciclastics deposited within fan aprons and fan deltas developed in the SW of the study area and derived from a mixture of degrading footwall highs, associated with active extensional faulting, and hinterland erosion. The Sognefjord Formation is developed in the eastern part of the study area and comprises deltaic, delta-front, shoreface and shallow marine deposits sourced from a longlived hinterland drainage system to the east (Patruno et al. 2015). The Sognefjord Formation can be over 150 m thick and thins rapidly to the west, where deposition was strongly influenced by syn-sedimentary extensional faulting. The Sognefjord Formation interfingers with the Heather Formation, which is predominantly composed of mudstone and siltstone, with
subordinate sandstones deposited in deep shelfal environments. Shallow marine shelfal sandstone units and density flow sandstones occur locally and are typically termed ‘Heather Sandstones’ or ‘Intra-Heather Sandstones’.
Late Jurassic primary seal
The Oxfordian reservoir units described above are likely to be intraformationally sealed by the shelfal mudstones of the Heather Formation. However, parts of the Sognefjord Delta persisted into the Kimmeridgian and consequently the Kimmeridgian-Thithonian-aged black shale succession was selected as the primary seal for the Oxfordian reservoirs due to its regional extent, thickness and lithological consistency. These shales form the Kimmeridge Clay Formation and the Draupne Formation on the UK and Norwegian sides of the Northern North Sea, respectively. The Kimmeridge Clay-Draupne (KCD) Formation comprises organic-rich black shales that are the primary oil source rock in the region, and consequently the lateral extent and thickness is well documented. In the northern part of the Northern North Sea Basin the KCD Formation is thick and lithologically consistent, whereas in the south the shales are locally interbedded with sandstones of shallow marine and turbiditic origin, including, for example, the ‘Intra-Draupne’ sandstone unit that forms the main reservoir in the Johan Sverdrup field.
Late Jurassic secondary seal
The geological properties required for an effective secondary seal are similar to those required for a primary seal, that is a thick succession of laterally continuous and consistently impermeable strata. Although there are several potential candidates, the Cromer Knoll Group that comprises several lithostratigraphic formations that are predominantly composed of mudstones deposited in a shelfal depositional environment was identified as the secondary seal for our analysis. The formations include the Asgard, Valhall, Carrack, Sola and Rødby.
SPQI methodology
The SPQI methodology includes a two-stage process, with the first stage involving a targeted filtering process to determine the likelihood of reservoir presence and fundamental depth cut-offs. The second stage comprises a quantitative discipline-specific investigation that includes geology, petrophysics, reservoir engineering, geochemistry and geomechanics data analysis and interpretation (Table 1). In total 15 ‘technical storage components’ were evaluated and individually mapped. Ultimately, the results are combined using a proprietary ranking calculation to generate a final SPQI output map that high-grades areas favourable for storage. The methodologies for the individual disciplines are briefly outlined below and the outputs of some disciplines inform and provide inputs for other disciplines.
To facilitate the integration of data from widely varying data types within a spatial (GIS) framework it was necessary to convert individual technical storage component values into a standardised index value, as outlined in Table 2. The index system consists of five categories (0 to 4) that define a simple traffic light system. The final SPQI value is based on a multiplication of the individual indices and represents an implementation of common risk segment
First pass filtering Description
1 Top depth (m)
2 Reservoir presence
Discipline Technical storage component
Geology
1 Net sand thickness (m)
Storage reservoir should be between 800 and 4000 m TVD
Required storage reservoir should be present
Higher net thickness preferred for increased capacity and injectivity
2 Primary caprock thickness (m) Higher primary caprock thickness favoured to reduce containment risk
3 Secondary caprock thickness (m)
Higher primary caprock thickness favoured to reduce containment risk
4 Primary caprock lithology Suitable facies needed to reduce containment risk (mudstone, shale or evaporites)
5 Secondary caprock lithology Suitable facies needed to reduce containment risk (mudstone, shale or evaporites)
Petrophysics 6 Reservoir effective porosity (%)
7 Reservoir effective permeability (mD)
Reservoir engineering 8 Injectivity
Geochemistry 9 Pressure (Bar)
10 Temperature (C)
11 pH
12 Salinity (mg/L)
Higher porosity preferred for increased capacity and injectivityPetrophysically-derived porosity utilising core and log data
Higher permeability preferred for increased capacity and injectivity –Petrophysically-derived permeability utilising core and log data
Assessment of injectivity test from production data
Reservoir pressure is a control on CO2 dissolution rates and density
Reservoir temperature is a control on CO2 dissolution rates and density
Formation water pH is a control CO2 dissolution rates
Formation water salinity is a control CO2 dissolution rates
Geomechanics 13 Pressure Room (kPa) Pressure room has an impact on ultimate storage capacity and containment
14 Reservoir Shear Strength Level Reservoir SSL indicates risks of existing faults reactivation due to shear stress within the reservoir interval
15 Caprock Shear Strength Level Caprock SSL indicates risks of existing faults reactivation due to shear stress within the reservoir interval
Table 1 List of the inputs for the SPQI methodology and a description of their use. Each technical storage component is itself derived from a methodology which is outlined in the text.
mapping as commonly applied in both the hydrocarbon exploration industry and for CCS (e.g. Bump et al. 2021). Importantly, a ‘zero’ score for any property indicates that the area is considered inappropriate for CO2 storage, regardless of the other scores.
Data
The study utilised a large amount of data selected from more than 8000 exploration, appraisal, development and production wells from the UK and Norway, released by the North Sea Transition Authority and the Norwegian Offshore Directorate respectively. The released data is of variable quality and inconsistent format, reflecting the range of vintages and operators. The data from the
well inventory amounts to hundreds of thousands of individual data files, which are impractical to review manually for a basinscale screening study. Data science workflows developed by Viridien were executed to identify data coverage and to extract and format data into a workable digital database. The well data were used in combination with pre-existing Viridien multi-client datasets and studies, generated over several decades, and similarly converted into a single consistent database (GeoVerse™). Coupled with in-house experience and expertise, these rich and consistent databases formed the starting point for subsequent analyses. The primary data types and wells used for this study are outlined in Figure 4.
sandstone Sandstone or conglomerate Secondary seal lithology Mudstone Sandy mudstone Siltstone Argillaceous sandstone Sandstone or conglomerate
Table 2 Cut-off values for the primary and secondary seal lithology as an example on the conversion of discipline-specific data outputs for direct comparison with other data types.
First-pass criteria
The well database was first limited to the stratigraphic intervals of interest using chronostratigraphic and lithostratigraphic search terms to return wells with data for the identified play elements (reservoirs, primary seals and secondary seals). A depth cut-off was then applied to the reservoirs of interest. At the critical temperature and pressure, 31.0oC and 7.377 MPa respectively (Ringrose et al. 2021), CO2 becomes supercritical and behaves like a gas but with the density of a liquid, occupying just 0.32% of the volume of gaseous CO2 at surface conditions (Ringrose 2020). These temperature and pressure conditions are typically encountered at a depth of approximately 800 m True Vertical Depth (TVD) and beyond, providing an upper depth cut-off to the reservoir data. A lower depth cut-off of 4000 m TVD was applied due to complications associated with pressures and reservoir quality. Interval depth maps were constructed, constrained for key wells by ties to recent multi-client 3D seismic. A guided depth contour algorithm was used to contour the well tops data using the pre-existing mapped contours and fault data as controls.
Geology
New Gross Depositional Environment (GDE) and lithology maps were generated for the reservoir, primary seal and secondary seal using a combination of pre-existing Viridien multi-client data, extracted data from the public domain and published work. The maps identify the distribution within each play of lithologies considered as candidate reservoirs. A similar process was carried out for the primary and secondary seals. In common with all other
data types, the derived data values are converted to index values to facilitate the subsequent multidisciplinary integration. In the case of the primary and secondary seals the mapped lithologies were converted to index scores as shown in Table 2. Integrating the reservoir, primary seal and secondary seal defined a new set of polygons that defined the play-specific focus areas for subsequent analysis.
Petrophysics
Petrophysical data is a bridge between physical rock data, geomechanical and geophysical rock properties. The analyses used in this study incorporated both pre-existing public domain and in-house datasets. QC included integration of core, log and reservoir engineering data and the generation of new petrophysical evaluation on a limited number of key wells to support the generation of geomechanical 1D Mechanical Earth Models (MEMs).
The main petrophysical outputs for the screening study (total porosity, water saturation and permeability constrained by core data) were used to define net reservoir cut-offs with porosity and permeability mapped as technical storage components.
Mean net sand data provided a proxy for net reservoir thickness and was mapped and subsequently converted to an index map, guided by reservoir depth maps, fault data and pre-existing isopach maps. The petrophysics was also used to provide a proxy for ‘net primary seal thickness’ and used to construct net primary seal thickness maps, although a lack of petrophysically determined net to gross data for the secondary seal precluded using this method and consequently the secondary seal is represented by gross thickness.
Reservoir engineering
Reservoir engineering data were collated to support the assessment of injectivity and to provide inputs for geomechanical analysis. Conversion of well test-derived permeability-thickness (KH) to an injectivity index for CO2 (J) was carried out using the method described by Valluri et al. (2021) and the validity of the results was assessed by comparing them with an injectivity index derived from Pressure Transient Analysis (PTA)-derived Productivity Index (PI) and Pressure-Volume-Temperature (PVT) properties of hydrocarbons and CO2. The reservoir engineering data were used to construct an injectivity index map and other properties, including temperature, pressure, LOT and flow test data, used as inputs for the reservoir and seal geomechanical analyses.
Hydrodynamics
Temperature, pressure, water salinity and pH data were collected from the identified key wells and are useful in determining the rate of CO2 solution in the reservoir. The geochemical index cut-offs are nonlinear and arranged differently from the other disciplines, reflecting CO2 phase transition and the effects that pressure and temperature have on CO2 solubility and mineral trapping (Akono et al. 2019). We consider a pressure range between 73.8-600 bar as ‘good’ and a temperature range of 31-128oC ‘very good’ and >128oC as ‘poor’. Salinities of less than 10,000 mg/l are considered ‘very good’ for CO2 dissolution and greater than 70,000 mg/l ‘poor’.
Geomechanics (Pressure room and Shear Strength Level (SSL))
The geomechanical properties of both the reservoir and primary seal are essential for evaluating the risk of containment as, critically, stress in either is considered a red flag for injection operations. Geomechanical properties were assessed using two components; 1) the pressure room within the reservoir, and 2) the Shear Strength Level (SSL) of both the reservoir and primary seal. 1D MEMs were generated at five key well locations.
The pressure room indicates the available (or remaining) pressure before over-pressure and tensile failure and is a proxy for the availability of injection space within the reservoir. It is defined as the minimum stress gradient minus the current pressure gradient, calculated from the 1D MEM’s and makes use of a tuned pressure prediction model and a match to measured stress data (e.g. mini-frac, LOT/FIT). The pressure room was calculated by subtracting the current pressure gradient output map from the minimum stress output map. Shear Strength Level (SSL) provides an indication of how close the rocks are to failure due to shear stress, as defined by the equations of Fjær et al. (2008).
Results
The results of the first pass of the SPQI methodology define a focus area in the Oxfordian reservoir interval that covers approximately 20,500 km2 (black polygons in Figure 5a), reflecting the westward prograding deltaic reservoirs of the Oxfordian-aged Sognefjord Formation. The southernmost part of the basin in the UK sector could provide additional CO2 storage reservoirs in Brae Formation reservoirs. Although these can be thick (>1000 m), they are often deeply buried (>3000 m), display poor reser-
Figure 5 Examples of maps which form the SPQI. a) results of the geological mapping showing reservoir lithology, gross depositional environments, faults, fields in play and control point data. The resulting focus areas are displayed in black and cropped examples over the Sognefjord delta area displayed in figures b-d, b) injectivity index map utilising flow test permeability and perforation reservoir thickness data, c) Reservoir pressure room index map utilising reservoir engineering and geomechanical data, d) Final SPQI map identifying areas with promising storage potential.
voir properties, are of limited lateral extent and may display poor connectivity due to extensive syn-sedimentary faulting. Uplifted areas to the south and west of the basin have been identified as having potential for CO2 storage reservoirs as there is likely to be land-attached shoreface or coastal deposits typically represented by sandstones with good primary and secondary seals.
In total, 15 discipline-specific index maps were generated (Table 1) and Figure 5 shows examples of index maps for both injectivity (Figure 5b) and reservoir pressure room (Figure 5c) for the Late Jurassic over the Sognefjord delta area. Note that pressure room is very good in the west, where the reservoir is thicker, but decreases to the east as the reservoir thins. All 15 of the discipline-specific technical storage components were multiplied using a weighted proprietary ranking calculation to provide a single SPQI map (5d) that highlights specific zones for further investigation (green) or isolates areas as less favourable for CO2 storage (orange and red).
The SPQI map results suggest that the area around and to the south of the Troll gas field are potentially ‘very good’ for CO2 storage. This is considered encouraging as this area is currently being developed as the main storage target for the Northern Lights project (Figure 1). The injection target for the Northern Lights project is the Johansen Formation, which is only marginally deeper than the Sognefjord Formation. This work suggests that the younger Sognefjord Formation may also be a suitable storage reservoir and therefore provide future near-field expansion opportunities for other projects in the area.
Discussion
The basin-scale integrated SPQI methodology presented here utilises well data and interdisciplinary expertise in geology,
petrophysics, geochemistry, reservoir engineering and geomechanics to provide a relatively quick, cost-effective and efficient means of identifying suitable reservoir zones for CCS. The methodology is based on the processing of large amounts of data in a relatively short period of time and allows for basin-scale CO2 storage screening that considers all of the key subsurface risks. The SPQI methodology is differentiated from many other screening tools by including the calculation of an injectivity index and predicting its distribution over geologically- and depth-constrained focus areas. CO2 injection rates are arguably more important in determining sequestration effectiveness than absolute capacity estimations.
Fluid geochemistry can influence the rate of CO2 solubility in formation waters (solubility trapping). The SPQI methodology utilises fluid geochemistry data to predict the water characteristics within the focus areas, which can be used to predict the rates of CO2 solubility. Basin modelling was deemed unnecessary for predicting the water pressure and temperature in the reservoir zones as the ‘good-very good’ pressure and temperature ranges were large and the data were converted to an index score (0-4). However, full basin analysis would provide additional support for pressure and temperature prediction, and more detailed assessment of porosity, permeability and mineral diagenesis. Geomechanical properties of the seal and reservoir are included in the SPQI methodology, including pressure room and SSL calculated for both the reservoir and primary seal. For the Late Jurassic, Oxfordian reservoirs investigated here, both the reservoir and primary seal are well below shear failure. Our full analyses suggests that the geochemical properties of the reservoir water are expected to be of the least concern, whilst the geomechanical properties of the reservoir and primary seal are of critical importance.
The Northern North Sea region contains more than 8000 wells and the data for most of those wells is readily available. However, the number of files and data types means that utilising all of this data is challenging in realistic time frames. The application of automated data science workflows allowed the rapid identification of 1087 key wells, and the extraction and databasing of data to support our workflows. The rapid development of data science workflows including machine learning and AI is allowing more of the data to be used more of the time and these tools are being employed in ongoing applications of our SPQI methodology.
The SPQI methodology provides a means of rapidly screening large areas and multiple stratigraphic targets for their CO2 storage potential. Subsequent more detailed analysis of high-graded areas might include the incorporation of 3D seismic data and detailed site evaluation that builds on the SPQI analysis. It is at this later stage that reliable calculations of CO2 storage capacity estimation and containment risks would be generated and used for ranking criteria such that the most appropriate sites can be selected for potential CCS development.
Conclusions
The SPQI methodology outlined here provides a time and cost-effective tool for CO2 storage screening of large areas based on realistic criteria to assess storage opportunities. The SPQI methodology allows reservoir play intervals across entire basins to be
screened, based on a wide range of interdisciplinary analyses, including geology, geochemistry, petrophysics, geomechanics and reservoir engineering. The resulting data and interpretations are converted into a series of index maps which are combined within a weighted calculation to form a single SPQI map, in a similar method to common risk segment maps, familiar to the petroleum explorationist. This tool helps to highlight specific areas of interest for further detailed storage capacity estimations and risk assessment (e.g. integrating seismic data) to help build towards a portfolio of risked and ranked CO2 storage sites for final investment decision (FID). The SPQI methodology can be applied and adapted to any geographic region and modified to local regulation requirements for CCS. The SPQI methodology can also be tailored for hydrogen storage in porous media, integrated with surface infrastructure and local industrial hubs to optimise storage site selection.
References
Akono, A.T., Druhan, J.L., Dávila, G., Tsotsis, T., Jessen, K., Fuchs, S., … Werth, C. J. [2019]. A review of geochemical–mechanical impacts in geological carbon storage reservoirs. Greenhouse Gases: Science and Technology, 9(3), 474–504. https://doi.org/10.1002/ghg.1870
Alcalde, J., Heinemann, N., James, A., Bond, C.E., Ghanbari, S., Mackay, E.J., … Allen, M. J. [2021]. A criteria-driven approach to the CO2 storage site selection of East Mey for the acorn project in the North Sea. Marine and Petroleum Geology, 133(August), 105309. https:// doi.org/10.1016/j.marpetgeo.2021.105309
Bentham, M., Mallows, T., Lowndes, J. and Green, A. [2014]. CO2 STORage evaluation database (CO2 Stored). The UK’s online storage atlas. Energy Procedia, 63(2014), 5103-5113. https://doi. org/10.1016/j.egypro.2014.11.540.
Bump, A.P., Hovorka, S.D. and Meckel, T.A. [2021]. Common risk segment mapping: Streamlining exploration for carbon storage sites, with application to coastal Texas and Louisiana. International Journal of Greenhous Gas Control, 111, 103457. https://doi. org/10.1016/j.ijggc.2021.103457
Callas, C., Davis, J.S., Saltzer, S.D., Hashemi, S.S., Wen, G., Gold, P.O., Zoback, M.D., Benson, S.M. and Kovscek, A.R. [2024]. Criteria and workflow for selecting saline formations for carbon storage. International Journal of Greenhouse Gas Control, 135, 104138. Directive 2009/31/EC of the European Parliament and of the Council of 23 April 2009 on the geological storage of carbon dioxide and amending Council Directive 85/337/EEC, European Parliament and Council Directives 2000/60/EC, 2001/80/EC, 2004/35/EC, 2006/12/ EC, 2008/1/EC and Regulation (EC) No. 1013/2006
Fjær, E., Holt, R.M., Horsrud, P., Raaen, A.M. and Risnes, R. [2008]. Chapter 12 Reservoir geomechanics. In E. Fjær, R.M. Holt, P. Horsrud, A.M. Raaen, & R.B. T.-D. in P.S. Risnes (Eds.), Petroleum Related Rock Mechanics 2nd Edition, 53, 391-433. https://doi. org/10.1016/S0376-7361(07)53012-8
Halland, E.K., Riis, F., Magnus, C., Johansen, W.T., Tappel, I.M., Gjeldvik, I.T., … Pham, V.T.H. [2013]. CO2 storage atlas of the Norwegian part of the North Sea. Energy Procedia, 37, 4919-4926. https://doi. org/10.1016/j.egypro.2013.06.403.
Levine, J S., Fukai, I., Soeder, D.J., Bromhal, G., Dilmore, R.M., Guthrie, G.D., … Goodman, A.L. [2016]. U.S. DOE NETL methodology for estimating the prospective CO2 storage resource of shales at the
Seismic mini-streamers as a potential method for CO2 storage monitoring
Roya Dehghan-Niri1*, Åsmund Sjøen Pedersen1, Mark Thompson1, Anne-Kari Furre1, Sandrine David2, Harald Westerdahl1 and Tone Holm-Trudeng2 present the results from a series of 2D and 3D mini-streamer operations across the Sleipner CO2 storage site, which are assessed and compared with conventional streamer seismic.
Abstract
Carbon Capture and Storage (CCS) technology is recognised as an important contribution to mitigate climate changes, and monitoring of the injected carbon dioxide (CO2) is an important element of this technology to ensure that the CCS system operates within the required legal and regulatory standards. To be able to offer more flexible monitoring solutions, the potential of mini streamers for overburden and shallow CCS monitoring has been investigated. The results from a series of 2D and 3D mini-streamer operations across the Sleipner CO2 storage site are assessed and compared with conventional streamer seismic. The results show a clear enhancement in overburden imaging and higher detail at the CO2 plume level compared to conventional streamer seismic data. However, the mini streamers also come with limitations related to the acquisition configuration (for example limited fold, offset, etc.).
Introduction
CCS technology has a vital role to play in mitigating climate change. The technology consists of capturing CO2 at the source, such as power plants or factories, and storing it in underground formations. In recent years there has been a significant development in the deployment of large-scale CCS projects, demonstrating a growing recognition of the technology’s ability to address climate change. However, the adoption of CCS needs a strong business case to be successful. To improve the business case, the technology, including monitoring cost, would benefit
from becoming more mature and cost-effective. Monitoring is an essential part of the technology to ensure conformance and containment of the stored CO2. Conformance monitoring involves demonstrating that the CCS system operates within the required legal and regulatory standards. The monitoring of conformance helps to minimise environmental and safety risks, which could otherwise have negative implications for public perception, operational efficiency, and legal compliance. Containment monitoring ensures that the CO2 injected into subsurface formations remains securely stored within the storage complex, with minimal environmental risk. Therefore, through regular monitoring, the integrity of the storage facility is assessed and any potential leaks or escape points that could compromise the effectiveness of the CCS system are identified. In addition, regular monitoring helps to identify potential gaps in performance and assists in making informed decisions to improve the operational efficiency and prevent environmental and safety risks.
To date time-lapse seismic, using conventional seismic streamers, has been the main technology used to image and monitor the subsurface in offshore CO2 storage sites (Furre et al., 2017). Here, we show how we have investigated mini streamers or Extended High Resolution (XHR) seismic as a potentially more flexible and cost-efficient solution for CCS monitoring.
While conventional streamer acquisition is characterised by a multitude of seismic streamers that are several kilometres in
1 Equinor Energy AS | 2 TGS
* Corresponding author, E-mail: rdeh@equinor.com
DOI: 10.3997/1365-2397.fb2024085
Figure 1 Illustration of different application scenarios for the XHR technology. Scenario 1 is similar to the deep-water GOM tests, Scenario 2 is similar to the Barents Sea experiment. Scenario 3 is the one that was investigated through this research and scenario 4 is left for further research.
length, XHR uses significantly shorter streamers with a length typically ranging from tens to a few hundreds of metres.
Originally mini streamers were deployed successfully in the Barents Sea to map the Håkon Mosby Mud Volcano (Berndt et al., 2006) and later their use was demonstrated for time-lapse purposes in the Gulf of Mexico (GoM) to monitor two injection wells in a reservoir at 800-1200 m depth in 2500 to 3000 m water depth (Hatchell et al., 2019). In both cases, the targets were located above the first water bottom multiple. However, the potential for using this technology to monitor deeper targets in shallow water depth where the target falls below the first water bottom multiple was unclear. Figure 1 illustrates different scenarios for the application of the mini-streamers.
Short streamer seismic can potentially help to reduce monitoring costs, increase acquisition efficiency, and improve shallow data imaging, making it a suitable choice for offshore CCS shallow storage and overburden monitoring. It might also be used as a quick triggering inspection system in case other monitoring has implied non-conformance or non-containment, potentially saving a large time-lapse seismic acquisition. In addition, it has potential to be used
Figure 2 The map shows the coverage of different data acquisitions. Red is the conventional seismic survey from 2020, yellow, green and blue are the 2D-XHR lines acquired in 2020 and 2021, while black is the coverage area for 3D-XHR and grey is the coverage area for time-lapse repeatability test from 2022.
in shallow water environments, in areas where access is restricted or in other areas where traditional streamers are impractical.
Equinor has extensive experience monitoring oil and gas fields, including several fields equipped with Permanent Reservoir Monitoring (PRM). Johan Sverdrup is one of the fields enabled with PRM, located approximately 50 km away from Sleipner (Fayemendy et al, 2021). The PRM operations at Johan Sverdrup include once to twice yearly acquisition of active seismic data using a dedicated modular seismic source deployed from a platform supply source vessel (Hibben et al, 2015).
In our study, the potential of utilising a seismic source vessel from PRM operations to acquire seismic XHR data on the Sleipner CO2 field was investigated. This would not only enable the testing of the XHR technology for monitoring deeper targets (down to 2000 m) in shallow water areas (approximately 90 m) but also help evaluating the potential of using PRM facilities for other nearby operations to reduce the operational cost.
Initially two XHR 2D surveys, consisting of a series of 2D lines, were acquired in October 2020 and May 2021 respectively over the Sleipner CO2 storage site, using a PRM source vessel. After promising results from the 2D surveys, a 3D survey was conducted in September 2022 across the site. The latter acquisition also incorporated a series of repeatability tests. These tests were then compared to conventional time-lapse seismic data across the same site.
Sleipner-CO2 storage site
Sleipner Vest field is a natural gas field located in the North Sea, about 250 km offshore the coast of Norway. The natural gas of Sleipner Vest contains high levels of CO2 and this CO2 has been captured and stored in the Utsira formation east of the SleipnerØst production platform. The Utsira formation is a saline aquifer at 800 m to 1000 m depth with a high porosity and permeability sandstone containing thin intra shale layers acting as a buffer for vertical CO2 flow (Furre et al., 2017).
Over the past 27 years, more than 19 Mt (million tons) of CO2 has been stored at Sleipner. Time-lapse seismic data has been an important tool monitoring the CO2 plume over this time, with a total of 10 repeated conventional seismic surveys acquired to date. The CO2 at this depth has a strong amplitude contrast to the brine-filled formation. Given the high amplitude contrast and the relatively shallow CO2 storage reservoir makes Sleipner-CO2 site a suitable candidate to investigate the benefit of mini-streamers for CCS monitoring. During the last 4-5 years the CO2 injection has tapered off significantly due to reduced production. This means that we do not expect to see major changes in the development of the CO2 plume, except potentially some internal rearrangements, with CO2 migrating towards the top of the plume. The latest conventional survey was conducted in 2020, and the time-lapse changes during the XHR tests are assumed to be minimal.
Figure 3 General acquisition layout for the 2D acquisition, indicating how three short XHR mini streamers (dashed black line) were deployed from the PRM source vessel and towed directly from one gun string of each of the three gun- arrays (orange).
Data acquisition 2D tests
Using the PRM source vessel from Johan Sverdrup, additionally equipped with an XHR mini streamer, a series of 2D tests were carried out in 2020 and 2021. A base line survey was acquired in October 2020 and a monitor survey conducted seven months afterwards in May 2021. With such a short period between base and monitor it is not expected to observe a visible time-lapse effect. However, the intention was to verify the repeatability of the technology. Three sail-lines were covering the eastern part of the CO2 plume (Figure 2).
The XHR system consisted of three short streamers, each 75 m long, with a receiver spacing of 3.125 m (Figure 3). Each streamer was towed directly from one gun-string of the triple source array, with an array separation of 50 m, where each array contained two gun-strings. The two gun-strings in an array each had a gun volume of 900 cubic inches with only one gun-string activated for each source location. The streamers were towed at 6 m depth, the same depth as the gun strings, with a minimum offset of 30 m from the last gun in the array. Each source-streamer pair was considered a separate 2D line and sail-lines were acquired in a flip-flop-flap fashion, with a shot point interval of 12.5 m effectively producing a source interval between consecutive shots for each array of 37.5 m, which provided an effective fold of one. This geometry led to a bin grid with 1.5625 m inline and 12.5 m crossline dimensions. The sampling interval for the streamer was 0.5 ms.
3D and time-lapse repeatability tests
A 3D field trial, consisting of 36 prime lines covering a 5x2.5 km2 rectangular area over the Sleipner CO2 plume, was conducted in September 2022 (Figure 3). Additionally, five repeated lines were acquired in the western part of the survey (Figure 3) to assess repeatability.
The XHR system this time consisted of 12 streamers each 150 m long, with a receiver spacing of 3.125 m and 12.5 m streamer separation where the streamers were towed at 11 m depth (Figure 4) deployed from a vessel of opportunity. The vessel employed for this operation was the Sanco Atlantic, which
exceeded the required size for this test. However, it was deemed the most suitable option for conducting the complete set of experiments scheduled for this operation. The source consisted of dual 880 cubic inch arrays towed at 5 m with a source separation of 6.25 m operating in flip-flop mode with a nominal shot point interval of 6.25 m. The bin grid for this 3D geometry had dimension that were 1.5625 m inline and 3.125 m crossline and a fold of six.
Data processing 2D and 3D image processing
Conventional streamer surveys typically involve large offset ranges, large source volumes, and deep tow depths for both sources and streamers. In contrast, site surveys usually have shorter offset ranges, smaller source volumes, and shallower tow depths for both sources and streamers. The acquisition geometries for the 2D and 3D XHR field trials differed from these conventional and site surveys, featuring short offset ranges, large source volumes, and deep tow depths for both sources and streamers, which required stringent quality control.
Given the unique acquisition spread, it was critical that small errors in positioning for both source and streamer were controlled for and corrected. Also, with a relatively large source volume and short offsets, much effort was given to the source de-signature process incorporating both de-bubble and de-ghosting. While swell noise attenuation, seismic interference and tidal statics were addressed, extra close attention was paid to the de-multiple process. The details of XHR data processing are shown in Figure 5.
Previous applications of mini streamers had seen relatively shallow subsurface targets compared to water depth, which eliminated the need for de-multiple for such short-offset data (Hatchell et al., 2019 and Planke et al., 2010). At the Sleipner CO2 storage site the water depth is approximately 90 m and the Utsira formation depth ranges from 800 to 1000 m, combined with the short offsets of the XHR data, requires the need to effectively perform of de-multiple. A combination of two model-based de-multiple techniques, 3D Model-based Water-layer De-multiple (MWD) and 3D Surface-Related Multiple Elimination (SRME) was
applied to handle multiple subtraction. A regional velocity model was used as an initial velocity model in the FWI workflow up to 15 Hz, which was subsequently updated to 60 Hz using the XHR data. The resulting velocity model was used for the Pre-Stack Depth Migration (PSDM) of the XHR data. Some more details of this processing were published by Ryan et al. (2024).
Time-lapse repeatability
The repeated test, from the 2022 3D survey, consisted of five prime acquisition sequences and five repeated sequences recorded two days later. The repeatability processing steps considered the initial swath of five acquisition sequences a baseline, and the five repeat sequences as a monitor. The processing sequence applied for the repeatability test was based on the sequence used in the main 3D processing with the addition of time-lapse specific steps.
An important step was 4D binning with both the baseline and monitor binned onto 1.5625 m (crossline) and 6.25 m (inline)
subsurface grids and traces with source and receiver location variations (DsDr) more than 50 m were discarded before regularisation (Figure 6).
Additionally, spectral matching between monitor and base was applied where global spectral amplitude and phase matching operators were derived between the base and the monitor and applied to the monitor dataset.
Observations
2D and 3D
Figure 7 compares conventional seismic data acquired in 1994 (prior to injection start), in 2020 (the latest conventional repeat) with three sets of XHR data (2D from 2020 and 2021, and 3D from 2022). Blue represents a hardening (e.g. the seabed at approximately 100 ms) and red a softening (e.g. the CO2 plume within the yellow rectangle). The main features (e.g. the strong seabed and CO2 plume reflections) are visible in all datasets, but there are also some notable differences.
e) 3D XHR 2022. The seismic sections have been visually balanced to match the conventional 2020 time-lapse repeat. A decrease in impedance is defined as a red (soft) amplitude. White and yellow solid arrows indicate the location of the top and base of the Utsira storage unit. The CO2 plume shows up as the strong amplitude reflections within the yellow rectangle. The black solid arrows show the area improved in XHR such as glacial valleys while dashed black arrows show the vertical disturbances in the reflections in a deeper area compared with the same reflection in the conventional seismic. The orange arrows show strong amplitude anomalies in the overburden, believed to be related to gas in overlying layers. These anomalies were already in place prior to CO2 injection start. The green arrows show the reflections due to seabed multiples from these and the purple arrows show the disruptions related to pushdown features below the primaries which appears more pronounced on the XHR than on the conventional data. The white and yellow arrows show the weak reflections at the top and base of the Utsira storage unit while the blue arrows show the features that are not well-resolved in the XHR data.
In general, the XHR datasets exhibit greater resolution, being sharper with more details, albeit with higher noise levels (especially for the 2D data). In particular the shallow overburden section (100-200 ms) is much better resolved in the XHR data than in the conventional data, while slightly deeper (250-350 ms) glacial valleys are visible in all datasets (black solid arrows), though with some disturbances below (black dashed arrows), which are most pronounced in the 2D XHR data. Deeper down and for weaker reflections (e.g. between 300-600 ms), not all reflections are as continuous in the XHR data as they are in conventional seismic data.
Note how the time interval from 640-750 ms is characterised by stronger amplitudes, including several strong red over blue amplitude pairs with. These are known from the wider regional area and have been attributed to thermogenic or biogenic gas migration, accumulation, and biodegradation over geological time (Nicoll 2011). These soft amplitudes are observed in both the conventional and 3D XHR datasets, but not all of them are present in the 2D XHR data. Beneath these soft amplitude anomalies, there are also indications of disrupted signals. In the conventional datasets, there are notable reflections with opposite amplitude to the primaries and an arrival time in accordance with the expected first order seabed multiple (green arrows in Figure 7).
In the 3D XHR dataset the disruptions appear more like bands of pushdown features below the primaries (purple arrows in Figure 7). These coincide with pushdowns at the top of the CO2 layer (purple arrows in Figures 7 and 8).
In the section down to the top of the CO2 plume most of the reflections are comparable between the conventional and 3D XHR data. However, weaker reflections at the top and base of the Utsira storage unit (white and yellow arrows) are not as well-resolved in the XHR data, while a shale near the top of the storage unit (blue arrows) is still clearly visible (Figure 7).
The CO2 plume is clearly visible in all repeated seismic sections, and the XHR reflections are sharper and better at resolving the top and base of the CO2 layers than the conventional dataset is capable of. Note how the XHR data has identified an extension of the CO2 that is not observed in the conventional data, as shown by the red arrow on Figure 8. This is attributed to CO2 flowing towards the top of the plume resulting in a slight extension of the topmost layer.
Time-lapse Repeatability
Normalised Root-Mean Square (NRMS) has previously been calculated for prior conventional surveys, using a time window between 500 and 800 ms (Furre and Eiken 2014), representing an interval above the CO2 plume, where it is assumed that time-lapse changes related to CO2 injection will not affect the calculation. NRMS calculations were also carried out on the XHR data from the 2D 2020 and 2021 repeated lines and the later 3D 2022 timelapse repeatability tests.
The 2021 and 2022 XHR datasets, acquired with one year separation, not fully repeated, led to NRMS values of around
Figure 8 Time-lapse amplitude maps representing the uppermost CO2 layer: a) RMS (Root-Mean-Square) extracted from conventional difference data (1994-2020) in a time interval +/-5 ms around the trough corresponding to the top of the Utsira storage unit; b) Maximum Negative Amplitude extracted in the same time interval from the 2022 XHR data. Colour scales, though not directly comparable, are tuned to display similar signal strength between the datasets, with lightest colours representing the strongest amplitudes. The yellow lines show the 2D seismic lines, with the thicker line representing the location of the sections in Figure 7. The white polygon delineates the interpreted extent of the CO2 plume from the RMS map in a), while red arrows highlight locations where the XHR data indicates a slightly larger CO2 plume extent in 2022 than in 2020. Purple arrows highlight areas of delayed signal or pushdown below overburden anomalies.
65%. A high cut filter was applied to the 2D XHR data matching the frequency content to the conventional 2020 data, which resulted in reducing the NRMS to approximately 35%. The 2022 3D XHR survey, with five lines immediately repeated using the exact same acquisition parameters and similar weather conditions, showed an NRMS of approximately 54%.
The values for NRMS seen by the XHR data were similar to those observed with the conventional surveys acquired between 1999 and 2020 (Figure 9).
Discussion
XHR technology, with its short offsets, relatively large source size, deep tow for both source and streamers, and low fold, falls somewhere between conventional towed-streamer and site survey technologies. However, there were concerns about its ability to monitor deeper targets in relatively shallow water depths due to issues related to repeatability, multiple attenuation in shallow waters, and general limited offset ranges.
Despite these concerns, the results of the study demonstrate the potential of XHR data to provide higher resolution and more detailed information, particularly in the shallow overburden section and down to the CO2 plume. Although the XHR data exhibited more noise than conventional seismic data, metrics for repeatability were comparable to previously acquired conventional datasets, especially when the frequency content for the XHR was brought more into line with the conventional data (Figure 9).
Figure 9 NRMS calculated in the overburden above the Utsira Fm (an interval between 500 and 800 ms) for the conventional time-lapse repeats and compared to the XHR 2022 time-lapse repeatability test.
From a data processing perspective, the deeper tow depths for the source and streamer required extra attention, and the limitations of XHR data, which stem from the short offsets inherent in the technology, were initially a concern. The limited offset range of the XHR data makes it susceptible to water bottom multiples, which can obscure the signals from deeper targets. However, this concern was largely addressed through a careful application of model-based de-multiple techniques. The lack of long offsets limits the ability to build velocity models, especially when Full Waveform Inversion (FWI) is considered. This was mitigated by using a velocity model derived from a legacy streamer dataset.
While the XHR data provided higher resolution and more detailed information than conventional seismic data, it was subject to undesired pushdown artifacts, most likely related to the limited offset range of the data, which limits the ability to undershoot shallower disruptive features. Furthermore, for deeper and weaker reflections, these reflections were not as continuous in the XHR data as they were in conventional seismic.
It’s worth noting that this study focused on the ability to image the CO2 plume at Sleipner and reused legacy data where appropriate, with no attention given to amplitude versus offset and describing petro-elastic properties of the subsurface. Future uses for XHR should carefully consider the requirements for offset information and the need to complement XHR with other measurements.
Conclusions
Field trials of the XHR technology were performed on the Sleipner CO2 field, firstly in 2D utilising a PRM seismic source vessel and later in 3D with a dedicated vessel to investigate the potential of this technology for CCS monitoring. Considering the initial concerns related to the short offsets inherent with XHR, the data was successfully processed, interpreted and compared against legacy data.
While the limitations of the XHR data, due to the short offsets, should be recognised, the trials found that the XHR data has good potential to offer more detailed information in the shallow overburden section and down to the CO2 plume compared to conventional seismic data. In addition, time-lapse tests showed that the XHR data can have comparable levels of repeatability to the conventional data.
Use of XHR, for monitoring, requires careful consideration of necessary offset information and the need to complement XHR with other measurements.
Acknowledgements
The authors would like to acknowledge the Sleipner licence operator Equinor Energy AS and Sleipner licence partners PGNiG Upstream Norway AS and Vår Energi ASA for permission to publish the results. We acknowledge TGS for the PRM source operations and Viridien (formerly CGG Services) for processing the seismic XHR data and Gassnova for partial financial support of the operation through CLIMIT program.
The views and opinions expressed in this paper are those of the authors and are not necessarily shared by the licence partners.
References
Berndt, C., Planke, S., Mienert, J., Bunz, S. and Eriksen, F. [2006]. The Plumbing System of the Håkon Mosby Mud Volcano – New Insights from High-Resolution 3D seismic data. AAPG/GSTT Hedberg Conference, Mobile Shale Basins – Genesis, Evolution and Hydrocarbon Systems (Abstract).
Fayemendy, C., Erlandsen, E.P. and Sadikhov, E. [2020]. First Use of a Triple Seismic Source for PRM acquisitions on the Johan Sverdrup Field. Second EAGE Marine Acquisition workshop (Abstract).
Furre, A.K., Eiken, O., Alnes, H., Vevatne, J.N. and Kiær, A.F., 20 years of monitoring CO2injection at Sleipner, 2017, 13th International Conference on Greenhouse Gas Control Technologies.
Furre, A.K. and Eiken, O. [2014]. Dual sensor streamer technology used in Sleipner CO2 injection monitoring, Geophysical Prospecting, 62(5), 1075-1088.
Hatchell, P., Bakku, S. and Yang, Z. [2019]. 4D seismic of deep reservoirs with a low-cost P-cable system. 81st EAGE Conference and Exhibition (Abstract).
Hibben, T. and Burnett, M.J. [2015]. The development of a dual containerized source system. Third EAGE workshop on permanent reservoir monitoring (Abstract).
Nicoll, G.D. [2011]. Evaluation of the Nordland Group overburden as an effective seal for the Sleipner CO2 storage site (offshore Norway) using analytical and stochastic modelling techniques. PhD thesis University of Edinburgh, https://era.ed.ac.uk/handle/1842/ 7813.
Planke, S., Eriksen, O.K., Mienert, J., Bünz, S., Berndt, C., Lie, E. and Eriksen, F.N. [2010]. P-cable High Resolution Seismic Imaging of Shallow Gas in the Barents Sea. 72nd EAGE Conference & Exhibition incorporating SPE EUROPEC.
Ryan, C., Liao, K., Moore, H., Westerdahl, H., Thompson, M., Pedersen, Å.S., Mispel, J., Wierzchowska, M., Dehghan-Niri, R. and Biryaltseva, Y. [2024]. Short streamer acquisition- the potential and the challenges. EAGE GeoTech 2024, 4th EAGE workshop on Practical Reservoir Monitoring.
Innovative Technology for Reservoir Optimization
FIFTH EAGE WELL INJECTIVITY & PRODUCTIVITY IN CARBONATES (WIPIC) WORKSHOP
14-16 APRIL 2025 • DOHA, QATAR
10th ANNIVERSARY
This event offers a great opportunity to connect with industry leaders, learn from top researchers, and dive into the latest advancements of the field.
We invite experts from academia and industry to submit abstracts for the Innovative Technology for Reservoir Optimization: Fifth EAGE Well Injectivity & Productivity in Carbonates (WIPIC) Workshop.
Mapping the potential for carbon storage in mafic and ultramafic rocks
Paul Helps1*, Craig Lang1 and Eena Dadwal2 discuss CO2 mineralisation within mafic and ultramafic rocks, where carbon is incorporated into the structure of the rock through the crystallisation of new, stable carbonate minerals, potentially offering the means to store CO2 safely, rapidly and permanently in large quantities.
Abstract
The necessary increase in carbon sequestration to reach national and global set targets requires significant geological and technological developments to play a role in the mitigation of climate impacts. Therefore, many options are currently being considered for permanent carbon removal.
In this article we discuss CO2 mineralisation within mafic and ultramafic rocks, where carbon is incorporated into the structure of the rock through the crystallisation of new, stable carbonate minerals. This technology potentially offers the means to store CO2 safely, rapidly and permanently in large quantities, but also requires minimal effort to verify and monitor after disposal. We present screening workflow outputs that enable the rapid, global and regional screening of sites that may be prospective for the storage of CO2 through mafic and ultramafic rock mineralisation, in the subsurface or at tailings in mine sites as examples.
Introduction – challenges faced
The annual removal of more than 10 gigatons of CO2 from the atmosphere (‘negative emissions’) will be required by 2050 to keep global warming below 1.5–2°C (Kelemen et al., 2020; National Academies of Sciences, Engineering, and Medicine, 2019; ICPP, 2018).
Carbon Capture and Storage (CCS) schemes, which capture and sequester CO2 from point sources will play a critical role
in reducing atmospheric CO2. The International Energy Agency (IEA) predicts that CCS can support approximately 15% of total cumulative emissions reductions through to 2050 (IEA, 2020). Currently, most existing large-scale CCS projects are based on physically trapping CO2 in a super critical state, in a reservoir, beneath an impermeable sealing unit as part of enhanced oil recovery, in depleted oil and gas fields or within large saline aquifers. Our recent articles by Gravestock et al. (2022), Jennings and Saunders (2022) and Smith et al. (2023) provide a thorough review of these technologies and detail Halliburton’s approach to CO2 storage fairway assessments and potential site screening.
Meeting carbon sequestration targets requires a massive and rapid scaling-up of projects and tackling the hard-to-abate emissions such as those associated with heavy industry and energy generation. To help achieve this, additional means of CCS are being considered and piloted. One of these storage options is CO2 mineralisation within mafic and ultramafic rocks (e.g. Kim et al., 2023; Kelemen, 2019; Kelemen, 2020), where CO2 is incorporated into the structure of the rock through the crystallisation of new, stable carbonate minerals. Such technologies, in theory, not only offer the means to safely and permanently store CO2 in large quantities (Figure 1), but also require minimal effort to verify and monitor after disposal (Krevor et al., 2009). Furthermore, mineralisation is rapid; for example, at the Carbfix pilot project
1Halliburton UK | 2Halliburton India
* Corresponding author, E-mail: paul.helps@halliburton.com
DOI: 10.3997/1365-2397.fb2024086
Figure 1 Comparison of CO2-trapping mechanism timescales for supercritical and dissolved CO2 injections. Left: Sedimentary reservoirs (Modified from Benson and Cook, 2005). Right: Ultramafic reservoirs (Modified from National Academies of Sciences, Engineering, and Medicine, 2019; originally published in Snæbjörnsdóttir et al., 2017).
in southwest Iceland, 95% of the CO2 injected into subsurface basalts was mineralised within a year (Snæbjörnsdóttir et al., 2017). This means that stable storage is much quicker to achieve, and could help to reduce monitoring costs associated with other storage methods.
Globally mafic and ultramafic rocks are widespread (Figure 2 and 3), and theoretically offer great potential, but how to high-grade the best targets (as there are a lot of geological and economic factors to consider) and where might these locations be? In this article, we give an overview of the CO2 mineralisation potential in mafic and ultramafic rocks, and how the Neftex® solution can be used to globally assess the prospectivity of sites to contain the preferred rock types.
CO2 mineralisation in mafic and ultramafic rocks
Carbon mineralisation involves the formation of a variety of solid carbonate minerals through the reaction of CO2, in the form of gas, liquid, dissolved in water, or a supercritical fluid within rocks rich in magnesium and/or calcium. The best sources of Mg and Ca are mafic (e.g. basalt) and ultramafic rocks (e.g. peridotite, dunite, serpentinite), formed either within the mantle or as products of the melting of mantle material. These rocks typically have low silica content (SiO2 < 45 wt %), generally high magnesium (MgO > 18 wt %) and iron (FeO), and are composed of mafic minerals such as olivine, pyroxene and amphibole. Basaltic compositions are less MgO-rich (typically 5–12 %) but their
potential surface and subsurface volumes makes them attractive targets for mineralisation (Ferreira et al., 2024; Gale et al., 2013; Kelemen et al., 2019).
Mineralisation involves CO2 reacting with divalent cations such as Ca2+, Mg2+ or Fe2+, present in mafic minerals to form the stable carbonate minerals magnesite, calcite and dolomite (Table 1). Factors affecting carbon mineralisation rates include mineralogy type and surface area, pH, partial pressure of CO2, water availability, silicate precipitation rates as well as the temperature and pressure regime (Kelemen et al., 2019; Kim et al., 2023).
Carbon mineralisation methodologies are broadly divided into ex situ, surficial and in situ (Table 2). Ex situ methods are where the storage rocks are transported to a site of CO2 capture, ground to small particles, and combined with CO2 in a high temperature and pressure reaction vessel. To offset the expense, a frequently used approach in this process is to produce material with an additional use, such as carbonated concrete, which is attractive due to financial incentives in some locations (Riedl et al., 2023). Surficial includes those where dilute or concentrated CO2 is reacted with the rock source on-site at the surface, for example in mine tailings, which will be discussed later. Enhanced rock weathering is also a form of surficial mineralisation, by powdering mafic or ultramafic rocks and spreading them over agricultural fields or along coastlines, where ambient CO2 reacts with the alkaline minerals
+ 3CO2 3MgCO3 + 2SiO2 + 2H2O
Wollastonite
Pyroxenes
CaSiO3 + CO2 CaCO3 + SiO2
CaMgSi2O6 + 2CO2 CaMg(CO3)2 + 2SiO2
Brucite Mg(OH)2 + CO2 MgCO3 + H2O
Table 1 Chemical reactions associated with carbon mineralisation. The abundance of magnesium and calcium determines the mineralogy of the rock type and, therefore, the subsequent reactions and carbonate products produced. Adapted from Mazotti et al. (2005); National Academies of Sciences, Engineering, and Medicine (2019). Reactions involving olivine and serpentinite are considered to have the most potential in terms of Mg availability for reaction (Styles et al., 2014).
Site Name or Company Country Active or Planned Technique
Carbfix Iceland Active
Wallula Washington, United States Active
Carbon mineralisation – Water injection
Carbon mineralisation – Supercritical injection
Al Qabil Oman Planned Carbon mineralisation
Fujairah United Arab Emirates Pilot - Active
Direct air capture and Carbon mineralisation
Project Hummingbird Kenya Planned Direct air capture and Carbon mineralisation
Heirloom Carbon Technologies California, United States Active Direct air capture
UNDO, various sites Various Active Enhanced rock weathering (Farmland)
Arca, various sites Australia Active Mine tailings
CarbonCure Various Active Concrete
Table 2 A list of select sites or companies involved in carbon mineralsation processes, the project state and the techniques being used. The Silverstone project of Carbfix in Iceland is a somewhat unconventional method of carbon storage due to the lack of required cap rock since the carbonated water sinks after injection as it has a higher density than the surrounding water in the geological formation (Snæbjörnsdóttir et al., 2017; Carbfix, 2024).
and becomes locked away through the same processes as in situ mineralisation. Positive side-effects of using silicate rocks in this way include improving soil health through nutrient release from minerals as they weather, and the alkaline bicarbonate ions captured during enhanced rock weathering help to deacidify the oceans (UNDO, 2024).
In situ methodologies involve the injection of CO2 into mafic and ultramafic rocks at source. The petrophysical properties of these rocks impacts the associated storage potential (Kelemen et al., 2019). The method of injection can vary between dissolving concentrated CO2 in water and then injecting into the subsurface or injecting CO2 in a supercritical state (with a density similar to its liquid form but a viscosity similar to a gas).
Supercritical fluids require significantly less water usage. However, the energy requirements to get the CO2 into the supercritical state should be a consideration (Riedl et al., 2023). Geological conditions, such as pressure and temperature, should also be suitable to maintain supercritical state post injection. The buoyancy of supercritical CO2 also means that any sites need to be assessed for a suitable cap rock, and faults and fractures may act as conduits for leakage. However, when considering the location of emitters, supercritical CO2 is much more cost effective to transport across distances up to 300 km away.
The density of water containing dissolved CO2 is sufficient to enable almost immediate solubility trapping. This means dissolved CO2 projects require no caprock, and fractures are primarily a positive factor that enhance flow. However, a critical factor for the success of dissolution storage is having access to significant amounts of water. The amount of water required for these projects could be a key limiting factor in many locations already struggling with freshwater security. Furthermore, the suitability of transporting CO2 over long distances in a
state of dissolution is low, therefore emitters are required to be proximal to storage locations. To overcome the challenge of water availability, Carbfix has been investigating and piloting the use of seawater in its technology (Carbfix, 2021). Research has shown that carbonation rates using seawater injection are similar to those in fresh water (Voight et al., 2021), although the optimum carbonation temperatures appear slightly lower in seawater injection (<150 °C) compared to freshwater (25–170 °C) (Marieni et al., 2021). Should the promise of using seawater be realised, the use of carbon mineralisation methodologies can be expanded to regions away from those controlled by freshwater availability. Regardless of whether a site’s storage methodology is dissolved or supercritical CO2, the identification of favourable mafic and ultramafic lithologies remains a critical component of site prospectivity, and is the main focus of this article.
Screening for the presence of in situ mafic and ultramafic rocks
The screening workflows briefly outlined below concern in situ mafic and ultramafic rocks due to their preferential storage vs cost potential (National Academies of Sciences, Engineering, and Medicine, 2019). The principal factor is the presence of mafic and ultramafic lithologies. Attempts at mapping their global distribution have taken place (e.g. Kelemen, 2019), albeit commonly on relatively coarse scales owing to the low-resolution of the published products used as input datasets (e.g. Oelkers et al., 2008).
Many pilot or regional screening projects are focused on CO2 mineralisation in mafic basaltic rocks, due to their increased volume and abundance (e.g. Carbfix, Iceland, Snæbjörnsdóttir et al., 2017; Wallula, Washington, McGrail et al., 2016; Paraná flood
Figure 2 Combined global subsurface (based on Phanerozoic tectonic settings derived from an in-house plate tectonic model) and surface map (from global lithology inputs), highlighting areas where ultramafic and mafic rocks are likely to be present. The darker the shade of colour, the more overlapping datasets are present, indicating areas with increased likelihood. The surface lithology dataset (shown in red) permits validation of the subsurface predictions as well as depicting the aerial extent of known ultramafic/mafic rocks. Areas of initial discrepancy are likely to be related to mafic or ultramafic rocks with a different origin than have been captured in the datasets or that are derived from timeframes older than the tectonic model covers.
3 Screening output maps for mafic rock types (a, top), suitable for CO2 prospectivity screening in mafic rocks, and ultramafic rock types (b, bottom). In both maps, darker colours equal increased prospectivity due to the average MgO value of the grid cell. These maps can then be combined with predictions from the tectonics assessment from figure 3, as shown in the case study on Figure 5.
basalts of South America, Ferreira et al., 2024; East African Rift, Okoko and Olaka, 2021). However, experimental studies point to ultramafic lithologies having the most theoretical potential due to their increased MgO, CaO and FeO content (e.g. Al Kalbani et al., 2023; Goff and Lacker, 1998; Kelemen et al., 2020; Styles et al., 2014). Any holistic screening methodology requires both lithology types to be incorporated and assessed.
Even within these litho-types, there is disagreement between the most preferred elements for mineralisation. Kelemen et al. (2020) discuss the value of both Mg and Ca. Styles et al. (2014) and Bide et al. (2014) agree that both Mg and Ca are suitable, but that most of the calcium near the Earth’s surface is already in the form of carbonate, in limestone, and, therefore, Mg is the main candidate as a source of cations.
Lastly, many of the recent global screening attempts focus mainly on surface lithology, which is sufficient if prospectivity understanding is only required for mineralisation projects planned for the near surface. However, to maximise a region’s full potential for CO2 mineralisation, and associated future economic realisation, the subsurface should also be considered. Although focused only on the US, Krevor et al. (2009) showed that a detailed understanding of tectonic setting is crucial to assess the likely occurrence of an ultramafic complex in the subsurface. Our approach to this is discussed below.
Screening methodology
With these challenges in mind, our preliminary screening methodology focuses on Mg-rich lithologies (although the workflow
can be quickly adapted for Ca), utilises geodynamic and tectonic insight from the Neftex Plate Model and associated datasets. This all informs on the likelihood of finding mafic and ultramafic rocks in the subsurface, and considers the spatial distribution of known surface lithologies through public domain global lithology maps (e.g. Hartmann and Moosdorf, 2012). Furthermore, we have also used the Neftex Mineral Deposit dataset to assess the potential of relevant mine tailings associated with different mineral commodities.
Figure 2 shows the combined subsurface (tectonic setting) and surface (global lithology) map, generated at the global scale, and highlights areas with a predicted higher chance of finding mafic or ultramafic rocks in the subsurface or known combined mafic or ultramafic rocks at the surface that could be utilised in the capture and storage of carbon by mineralisation.
Magnesium abundance through whole-rock geochemistry
Further integration of geochemistry data permits even more detailed discrimination of mafic or ultramafic rock types, based on the abundance of elements most important for CO2 mineralisation projects (e.g. Mg). Additionally, because samples are also obtained from wells, boreholes, mines and quarries, this data also provides insight into the nature of mafic and ultramafic
Figure 4 Regional screening outputs for southwest Brazil, around the Paraná flood basalts. At regional scales using the geochemistry data itself (instead of grids) is visually cleaner and can provide enhanced insight of MgO abundance at higher resolutions. Subsurface (tectonic) and surface (lithology) informing outputs permit extrapolation and interpretation away from geochemical data. Wells that penetrate subsurface mafic rocks are shown in green where the shade (light to dark) and size (small to large) are relative to the gross thickness of igneous intervals within them. Emitter data locations are shown by the grey triangles.
rocks that may be present but under superficial cover sediments, which are not depicted on surface geology datasets.
This additional component of the screening workflow uses the Neftex Whole-rock geochemistry dataset, which was initially filtered to igneous or meta-igneous rock types. Due to the focus of pilot mineralisation projects being split between mafic or ultramafic rock types, we further filter the dataset to provide separate screening outputs for both types through analysis of the data and relevant literature, with appropriate geochemical cut-offs selected (e.g. Ferreira et al., 2024; Gale et al., 2013).
Figure 3 shows the global screening output maps for both mafic and ultramafic rock types. The western and eastern US and Canada, the East African Rift, the Paraná Basin of southwest Brazil, Western Australia, southern and western India, northern Scandanavia, South Africa and eastern China are prospective regions in terms of the presence of Mg-rich mafic and ultramafic rocks. Many of these have the additional benefit of being located along coastal regions, should the encouraging experimental and pilot studies into the use of seawater injection technologies expand the applicability to regions where freshwater may be scarce. The subsurface, tectonic-based maps and surface lithology outputs are included for validation and for allowing assessment of the subsurface and/or away from data control.
Figure 5 Graphic showing how CO2 emissions combined with mine tailings undergo carbon mineralisation to produce carbonates and other products which can be used in various sectors (Adapted from Kusin and Molahid, 2023).
Regional-scale screening
For regional-scale screening, the data density of the geochemistry points provides increased resolution, which can give additional critical insight into the nature and spatial distribution of mafic and ultramafic rocks, without the challenges of viewing such data at a global scale. To best utilise this insight, our regional-scale screening outputs include the geochemistry point data, used to style the global-scale cells via their average MgO values. The subsurface, tectonic-based maps and surface lithology outputs are included for validation, interpretation away from data control and enhanced insight. Figure 4 shows the regional screening outputs for southwest Brazil, around the Paraná flood basalts, an area of current interest for CO2 mineralisation (e.g. Ferreira et al., 2024), and which was highlighted as prospective on the global screening outputs (see Figure 3).
The most prospective regions are the north to northeast part of the Paraná flood basalts, as highlighted by the higher abundance MgO geochemistry data points (darker blue, mafic, and darker purple, ultramafic). The constraining point data provides insight into the precise location and distribution of the higher MgO samples. The geochemistry data also confirms the presence of MgO-rich
mafic rocks in central and southern parts of the region. However, the higher MgO abundance in mafic rocks (typically 9–12 wt %) commonly occur in the northern sector. This trend is also borne out in the ultramafic rocks in general, though higher abundance of MgO (typically >30 wt %) is evident, making this the favoured area. The coincidence of the subsurface (tectonic) and surface (lithology) datasets with the geochemistry data, provides confidence to extrapolate and interpret away from the geochemical data. Generally, we would expect locations away from samples in the northern region, to follow the MgO-rich trend. The insight provided and the level of assessments that can be made can be further enhanced by the incorporation of other global datasets. Gross thicknesses of igneous units can be interrogated using lithology data from the Neftex Wells and Outcrops dataset. This shows generally good thicknesses (~20–120 m) across the Paraná flood basalts, with potentially greater thicknesses (up to ~1800 m), in the less prospective (in terms of MgO content) central areas. One of the key considerations of any CCS project is how far away it occurs from emitters; the less transportation of CO2 required, the better. On the regional-scale map, emitters are displayed by grey triangles. The greater density of emitters coincides with the geochemically more prospective north-
ern sector, explaining why this area is undergoing assessment for its potential for CO2 mineralisation projects (e.g. Ferreira et al., 2024).
Mine tailings potential from mineral deposits
As previously discussed, another method of carbon mineralisation, currently being considered, involves the usage of mine site tailings. Essentially crushed up rock, tailings are a by-product of mining – produced via the removal of material to access economic minerals and waste rock left over after ore extraction. Tailings from mining operations, especially those produced from mafic and ultramafic host or country rocks, could potentially sequester between 1.1–4.5 Gt CO2 annually (Bullock et al., 2021).
Predominantly a surficial method, in which CO2-enriched water or air is reacted with broken-up rock fragments to produce carbonates, this process occurs naturally at a slow rate as weathering on exposed rocks. However, using mine tailings expedites this process with a high surface-to-area ratio, which increases the rate of reaction (Kelemen et. al., 2019). Figure 5 depicts how this process can be carried out and the resulting byproducts could be used in several applications to help keep the carbon locked away.
The carbon storage potential of mine sites can be considered via a combination of the estimated tailings produced (Mt yr-1) and the enhanced weathering potential (Epot) of the individual deposit type. Bullock et al. (2021) have ranked different types of mineral deposits based on their carbon storage potential (Mt yr-1), which can then be combined with the Neftex Mineral deposit data to create a first pass global screen of storage potential.
Historic mine sites vs current producing locations
Mines operating in regions with higher amounts of ultramafic and mafic host or country rocks have higher values as compared to other types of deposits. As shown in Figure 6, most regions have potential with both active and historic mine sites that could represent viable storage options with large amounts of rock already crushed on site. Active mine sites may alleviate the emissions associated with the ongoing mining activity, whereas both active and historic tailings may be used to abate nearby industrial emissions. As such, the tailings potential can be combined with emitter locations to create a first pass view of viability. In the example in Figure 6, most of the high potential tailings are in the west of North America, representing a possible storage medium for emitters in California, Arizona and Sonora, whereas the viability of this storage medium in the east of the country is reduced due to a lack of large suitable mine sites (mostly smaller historic mining districts). This is a quick overview example of how different types of data from Neftex can be integrated onto a map to help the user quickly identify higher priority locations for further study.
Summary statement
The necessary increase in carbon sequestration to reach national and global set targets requires significant technological and geological developments to play a role in mitigation of climate impact. Therefore, many options are being considered for carbon sequestration.
The screening work, and associated outputs, undertaken and discussed in this article enables users to rapidly assess sites, at
the global or regional scale, on their prospectivity for the storage of CO2 through mafic and ultramafic rock mineralisation. While the focus of this work has been on the presence of the necessary rock types (MgO-rich mafic and ultramafic lithologies), we also recognise that proximity to CO2 emitters is a critical consideration and have incorporated emitter datasets into our global and regional screening workflows to help further evaluate the prospectivity of sites with suitable lithologies. As outlined in the mine tailings section, we have also begun assessing where suitable mines exist where surficial mineralisation methodologies can take advantage of mine site waste products.
Many of the regions identified in our global screening output maps have the additional benefit of being located along coastal regions (e.g. western US, India, western Australia, Saudi Arabia). Should the encouraging experimental and pilot studies into the use of seawater injection technologies expand the applicability to regions where freshwater may be scarce, the potential of these regions is significantly increased.
We have demonstrated the value of our initial approach, in providing rapid, first-pass assessment. However, we have identified many other data types, geological processes and production, engineering and environmental aspects that will further enhance the insight generated and screening outputs, particularly at the regional scale. Examples of these include the application of depth cut-offs, as a technological constraint, the presence of fault networks to enhance permeability, and, therefore fluid flow, in the typically tight target magmatic rocks, and quantitative assessments of the amount of ultramafic and/or mafic material available for mineralisation in order to therefore quantify the amount of CO2 that can be stored. While we have not included these in the initial work presented here, we have already identified the Neftex datasets and products that will help us to incorporate this insight into future iterations of this evolving screening workflow.
Over recent years, our geoscientists have been focused on adapting traditional oil and gas workflows, gathering new datasets, and investigating stratigraphy to help with CO2 storage identification, several of which are discussed in this article or other linked articles. In this way the Neftex® solution, can provide a shortcut to understanding the subsurface in relation to CO2 storage. The initial screening for suitable carbon mineralisation locations within mafic or ultramafic rocks discussed here is just the latest in our expanding portfolio of workflows to suit all potential CO2 storage requirements.
If you would like to discuss further or have any questions, then please contact us at landmarksupport@halliburton.com.
References
Benson, S. and Cook, P. [2005]. Underground geological storage. In B. Metz, O. Davidson, H. deConick, M. Loos and L. Meyer (Eds.), Carbon Dioxide Capture and Storage, 197-276. Bullock, L.A., James, R.H., Matter, J.. Renforth, P. and Teagle, D.A.H. [2021]. Global Carbon Dioxide Removal Potential of Waste Materials from Metal and Diamond Mining. Frontiers in Climate. Frontiers in Climate, 3 Carbfix [2024]. Carbfix – How it Works, https://www.carbfix.com/ how-it-works.
Carbfix [2021] . Carbfix technology validated using seawater , https://www.carbfix.com/carbfix-technology-and-seawater
Ferreira, A., Santos, R.V., de Almeida, T.S., Camargo, M.A., Filho, J.A., Miranda, C.R., dos Passos, S.D.T.A., Baptista, A.D.T., Tassinari, C.C.G., Rubio, V.A. and Capistrano, G.G. [2024]. Unraveling the rapid CO2 mineralization experiment using the Paraná flood basalts of South America. Scientific Reports. Scientific Reports, 14.
Gale, A., Dalton, C.A., Langmuir, C.H., Su, Y. and Schilling, J. [2013]. The mean composition of ocean ridge basalts. Geochemistry, Geophysics, Geosystems, 14, 489-518.
Goff, F. and Lackner, K.S. [1998]. Carbon dioxide sequestering using ultramafic rocks. Environmental Geosciences, 59(3), 89-101.
Gravestock, C., Jennings J., and Simmons, M. [2022]. Estimating saline aquifer CO2 storage resource in data lean regions. Subsurface Insights, 1-8.
Hartmann, J. and Moosdorf, N. [2012]. The new global lithological map database GLiM: A representation of rock properties at the Earth surface. Geochemistry, Geophysics, Geosystems, 13(12), 1-37.
IEA [2020]. International Energy Agency (IEA), Paris, 174 p.
IPCC [2018]. Special Report – Global Warming of 1.5 ºC, Intergovernmental Panel on Climate Change (IPCC).
Jennings, J. and Saunders, C. [2022]. Accelerate Carbon Capture and Storage Site Screening. Subsurface Insights, 1-5.
Kelemen, P.B., Mcqueen, N., Wilcox, J., Renforth, P., Dipple, G. and Vankeuren, A.P. [2020]. Engineered carbon mineralization in ultramafic rocks for CO2 removal from air: Review and new insights. Chemical Geology, 550, 119628.
Kelemen, P., Benson, S.M., Pilorgé, H., Psarras, P. and Wilcox, J. [2019].
An Overview of the Status and Challenges of CO2 Storage in Minerals and Geological Formations. Frontiers in Climate, 1
Kelemen, P.B., Aines, E., Bennett, E., Benson, S.M., Carter, E., Coggon, J.A., de Obeso, J.C., Evans, O., Gadikota, G., Dipple, G.M., Godard, M., Harris, M., Higgins, J.A., Johnson, K.T.M., Kourim, F., Lafay, R., Lambart, S., Manning, C.E.,Matter, J.M., Michibayashi, K., Morishita, T., Noël, J., Okazaki, K., Renforth, P., Robinson, B., Savage, H., Skarbek, R., Spiegelman, M.W., Takazawa, E., Teagle, D., Urai, J.L. and Wilcox, J. [2018]. In situ carbon mineralization in ultramafic rocks: Natural processes and possible engineered methods. Energy Procedia, 146, 92-102.
Kim, K., Kim, D., Na, Y., Song, Y. and Wang, J. [2023]. A review of carbon mineralization mechanism during geological CO2 storage. Heliyon, 9(12).
Kusin, F.M. and Molahid, V.L.M. [2023]. Geoenvironmental and Geotechnical Issues of Coal Mine Overburden and Mine Tailings. Springer Transactions in Civil and Environmental Engineering, 109-131.
Marieni, C., Voigt, M., Clark, D.E., Gíslason, S.R. and Oelkers, E.H. [2021]. Mineralization potential of water-dissolved CO2 and H2S
injected into basalts as function of temperature: Freshwater versus Seawater. International Journal of Greenhouse Gas Control, 109, 103357.
Mazzotti, M. [2005]. Mineral carbonation and industrial uses of carbon dioxide. In Metz, B., Davidson, O., de Coninck, H., Loos, M., Meyer, L. (Eds.), IPCC Special Report on Carbon Dioxide Capture and Storage, 319-338.
McGrail, B.P., Schaef, H.T., Spane, F.A., Cliff, J.B., Qafoku, O., Horner, J.A., Thompson, C.J., Owen, A.T. and Sullivan, C.E. [2016]. Field Validation of Supercritical CO2 Reactivity with Basalts. Environmental Science; Technology Letters. American Chemical Society (ACS), 6-10.
National Academies of Sciences, Engineering, and Medicine [2019]. Negative Emissions Technologies and Reliable Sequestration: A Research Agenda, Washington, DC: The National Academies Press, 1-510 p. Oelkers, E.H., Gislason, S.R. and Matter, J. [2008]. Mineral Carbonation of CO2. Elements, 4, 333-337.
Okoko, G.O. and Olaka, L.A. [2021]. Can East African rift basalts sequester CO2? Case study of the Kenya rift, 13
Pedro, J., Araújo, A.A., Moita, P., Beltrame, M., Lopes, L., Chambel, A., Berrezueta, E. and Carneiro, J. [2020]. Mineral Carbonation of CO2 in Mafic Plutonic Rocks, I—Screening Criteria and Application to a Case Study in Southwest Portugal. Applied Sciences. Applied Sciences, 10, 4879.
Riedl, D., Byrum, Z., Li, S., Pilorgé, H., Psarras, P. and Lebling, K. [2023] 5 Things to Know About Carbon Mineralization. World Resources Institute.
Smith, J., Jennings, J. and Butt, T. [2023]. Identify CO2 Storage Potential with On-Demand Screening. Exploration Insights Magazine, 1-9.
Snæbjörnsdóttir, S.Ó., Oelkers, E.H., Mesfin, K., Aradóttir, E.S., Dideriksen, K., Gunnarsson, I., Gunnlaugsson, E., Matter, J.M., Stute, M. and Gislason, S.R. [2017]. The chemistry and saturation states of subsurface fluids during the in situ mineralisation of CO2 and H2S at the Carbfix site in SW-Iceland. International Journal of Greenhouse Gas Control, 58, 87-102.
Styles, M.T., Sanna, A., Lacinska, A.M., Naden, J. and Maroto-Valer, M. [2014]. The variation in composition of ultramafic rocks and the effect on their suitability for carbon dioxide sequestration by mineralization following acid leaching. Greenhouse Gases: Science and Technology. Greenhouse Gases: Science and Technology, 4, 440-451.
UNDO [2024]. Enhanced Rock Weathering, https://un-do.com/ enhanced-weathering/ Voigt, M., Marieni, C., Baldermann, A., Galeczka, I.M., Wolff-Boenisch, D., Oelkers, E.H. and Gislason, S.R. [2021]. An experimental study of basalt–seawater–CO2 interaction at 130 °C. Geochimica et Cosmochimica Acta, 308, 21-41.
Geothermal reservoir requirements for closed-loop well solutions to harvest geothermal energy
Kim Gunn Maver1* and Ola Michael Vestavik1 demonstrate that with closed-loop solutions it is possible to significantly impact the decarbonisation of district heating, district cooling, industrial heating requirements, and electricity production moving towards ‘zero’ CO2 emissions with a nearly unlimited resource of heat from the earth’s interior that is both reliable and cost effective.
Introduction
The interest in geothermal energy is rapidly increasing and a significant growth in its usage is predicted in the coming years for district heating, district cooling, industrial usage and electricity generation as part of a green transition and reduction in CO2 emissions (EGEC, 2024).
The conventional doublet hydrothermal well solution uses one well to produce formation water and another well to inject cooled formation water some distance apart, typically at a vertical depth of 2-4 km. The solution is dependent on geothermal reservoirs’ thickness and parameters such as porosity, permeability, and geochemistry to ensure hydrologic connectivity between the wells to maintain heated formation water production. These geological reservoir requirements limit the usage of the solution.
Enhanced Geothermal Systems (EGS) are when there is a requirement to enhance permeability in a conventional system by fracturing the rock and create an artificial reservoir through hydraulic, chemical, and thermal stimulation. However, hydraulic fracturing to enhance injectivity and formation connectivity, carries the risk of compromising groundwater aquifers, damaging the geological formation and inducing seismicity with the potential of damaging surface infrastructure and buildings.
Closed-loop solutions represent the next generation of geothermal energy solutions, known as Advanced Geothermal Systems (AGS), introducing heat extraction from a closed-loop system through conductive heat transfer. It constitutes an innovative approach to geothermal energy extraction, aiming to overcome the challenges and risks related to conventional doublet hydrothermal solutions and it also opens new possibilities for heat storage.
AGS have not the limiting requirements regarding geological properties, thereby providing flexibility when choosing project sites and making geothermal heat harvesting accessible almost anywhere in the world.
Several new innovative closed-loop geothermal well solutions and designs are currently being developed (Think GeoEnergy, 2024) and are in various development stages.
A closed loop geothermal well solution with no interaction between the well and formation water has no conventional
1 Green Therma
* Corresponding author, E-mail: kgm@greentherma.com
DOI: 10.3997/1365-2397.fb2024087
reservoir requirements. However, harvesting heat depends on thermal conduction in the geothermal reservoir and therefore thermal properties as well as temperature of the reservoir section are key parameters.
Mapping and predicting the thermal conductivity and temperature are therefore important for optimising closed-loop solutions to produce the required energy output. A failure in the predictions may lead to a different output than expected, but not in lack of energy production, as can be the case for the conventional systems.
Closed loop geothermal well designs
Geothermal energy extracted through fluid convection is the most effective way, however, with very specific geological requirements and a range of issues.
To significantly reduce the geological requirements and mitigate the doublet hydrothermal well issues, focus is increasingly changing to closed-loop solutions with different designs being proposed (Law et al., 2014), which can be divided into two main categories:
• Single well using the co-axial pipe-in-pipe solution with possible slanted/ horizontal section
• Two or more wells connected at deep intersection points.
Figure 1A, B presents the single well solution, where the circulation of a fluid through the subsurface uses a co-axial, pipe-in-pipe technology, where cold water is circulated down through the outer closed casing and returned as heated water inside the inner tubing.
A key issue in the co-axial solution is that the heat loss of the returning fluid will be high if not properly thermally insulated. For this purpose it has been proposed to use a pipe-in-pipe solution with a continuous vacuum to thermally insulate and minimise the heat loss (Maver et al., 2023).
To improve the heat harvesting some solutions develop a network of proprietary thermally conductive material around the wellbore that is 50 times more thermally conductive than rocks, which is anticipated to allow wellbores to absorb more heat compared to standard geothermal wells (Jacobs, 2024).
To overcome the limitation of thermal conduction compared to fluid convection a long horizontal/slanted section added to the well will significantly improve the heat harvesting area using conventional oilfield technology (Figure 1B), (Maver et al., 2023).
Figure 1C, D presents two other types of closed-loop solutions. These solutions require that two or more wells need to be connected in the subsurface to circulate the fluid.
Currently a large project is being executed in Germany with multilateral drilling that creates parallel boreholes several km long horizontally and are connected to two deep vertical boreholes forming a circuit (Figure 1C). The horizontal multilateral boreholes are uncased but are sealed from the surrounding rock using a paste to create the closed loop (Longfield et al., 2022).
More recently, solutions are proposed with deviated well pairs where legs are deployed from a service well and thereby connect to the injection and production wells to create closed heat harvesting loops (Vouillamoz, 2023).
Solutions, like two abandoned oil and gas wells that are in close enough proximity that it is possible to sidetrack them until their toes intersect enabling single pipe fluid circulation, have also been proposed.
For all the solutions the heated fluid is returned to the surface, and depending on the depth and therefore temperature can have various usages.
Geothermal heat reservoir parameters
In the search for optimum locations and trajectories for the closed-loop geothermal wells, it is important to map the temperature and thermal conductivity of the potential subsurface geothermal reservoir structures.
Thermal conductivity is a major influencing factor on subsurface conductive heat transport and resulting temperature
distribution, which are key parameters in basin modelling for mapping hydrocarbon plays (Hantschel and Kauerauf, 2009) and is an important control on generation of gas and oil in source rocks. There are many publications with relevant information. However, especially for thermal conductivity, it has mainly been literature values that have been used. Furthermore, both the thermal conductivity and temperature are represented on a regional scale and will in many cases be too coarse for a detailed geothermal well plan and prediction of the associated temperature and thermal energy output.
Geothermal gradient
The geothermal gradient varies with geographical location and is typically determined by measuring the bottom-hole temperature after drilling. Temperature logs obtained immediately after drilling can also be used but are in general affected by the drilling and fluid circulation.
Shallow heat flux data can give a direct indication of the existence and magnitude of anomalous heat sources within the crust and also provide a firm basis from which to predict the increase in temperature with depth and shows a correlation in regional mapping (Limberger et al., 2018). However, high heat flux does not always translate into a high geothermal gradient (Beardsmore and Cooper, 2009).
HeatFlow.org (2024) is a repository for data and models related to thermal studies of the earth, which includes the global variation in geothermal gradient for individual countries. The thermal gradient features two distinct distributions depending on whether the measurements are oceanic or continental in origin. For the oceanic crust the median gradient is 64 C/km. However, the geothermal gradient relevant for harvesting heat is from the continental crust with a median gradient of 34 C/km.
The crustal geothermal gradient varies according to the geological structural setting and can show significant variations (Figure 2).
Geothermal gradients from continents show no clear relationships with crustal age but decrease with increasing crustal and lithospheric thicknesses (Kolawole and Evenic, 2023).
For a higher than average geothermal gradient, like a narrow graben mentioned in Figure 2, the Rhine Graben in Germany and France is an example. It is 30-40 km wide and 300 km long and the Rhine river flows through and it has a geothermal gradient of 50-58 C/km (Dezayes et al., 2008).
Fennoscandian Shield constitutes the northwestern part of the East European Craton and dominates in Sweden, Norway, Finland and western-most Russia (Pedersen et al, 2013). Due to the very thick lithosphere all the Fennoscandian Shield is low enthalpy area and is an example of a geothermal gradient below average of 8-15 C/km (Kallio, 2019).
Besides the geological setting, especially extensive rock salt deposits in sedimentary basins activated by halokinesis, creating various salt features in basins locally, influence the geothermal gradient due to properties of rock salt (Raymond et al., 2022). The thermal conductivity of rock salt is 2-4 times higher than that of non-evaporitic sediments and heat is preferentially channelled through the salt, creating positive temperature anomalies around the top of a dome and negative ones at its base. As an example, in northeast Netherlands, temperature differences of up to 25 degrees Celsius close to the top of a salt body are modelled (Daniilidis and Herber, 2017).
Thermal conductivity
Thermal conductivity varies with the composition of the rock and is controlled primarily by the relative effectiveness of heat
Figure 2 Geothermal gradient for different geological settings (From Heatflow.org, 2024).
transport through grain-to-grain paths of the rock. The presence of pores in the rock will therefore limit the heat transport. A rock type has a large range of heat conductivities, depending on the grain size, grain composition, material between the grains, pore fluid composition, pore size and porosity (Robertson, 1988).
Thermal conductivity of rocks in general decreases with increasing temperature and increases with increasing pressure, and the effects of temperature and pressure counteract each other with depth.
The thermal conductivity of rocks can be deduced from available data from existing wells such as core samples, and cuttings analysed in a laboratory with lithological descriptions and geophysical well logs.
The result of correlating thermal conductivity from core data with well log data can be used to infer thermal conductivity for boreholes without appropriate core data that are drilled in a similar geological setting (Hartman et al., 2005).
Laboratory tests have shown a correlation between a thermal conductivity and compressional wave velocity (Pimienta et al., 2014) and there are examples of how this correlation has been used to predict thermal conductivity from seismic interval velocities including a simple linear relationship between thermal conductivity and seismic interval velocity for clastic sedimentary rocks (Duffaut et al., 2018). The application will depend on the quality of the seismic data including frequency content to gain thermal conductivity information at a useable level. However, in many cases the degree of detail is probably not sufficient for geothermal well planning.
Summarised observed thermal conductivity and mechanical properties from 70 best published papers has coal having the lowest thermal conductivity of 0.2 W/(m K) and a sandstone with the highest thermal conductivity of 7.1 W/(m K) (Lee et al., 2015).
Low thermal conductivity such values are characteristic for dry, unconsolidated sedimentary rocks, as gravels and sands. Higher thermal conductivity values are for most sedimentary and metamorphic rocks, while very high values are typical for felsic igneous rocks. Rocks with high quartz content like sandstone and water-saturated rocks, are good thermal conductors (Schön, 2015).
Sedimentary rocks, especially shales, tend to be highly anisotropic, which is why the direction of the thermal conductivity measurement is critical. Thermal conductivity of anisotropic rock-forming minerals have an anisotropy factor from 0.12 to 6.07 measured perpendicular versus parallel to the bedding (Čermák and Rybach, 1982). The anisotropy factor of thermal conductivity in shale rocks has been shown to vary from 1.5 to 3.8 (Labus and Labus, 2018).
Rock salt is characterised by a much more predictable and high thermal conductivity compared to sedimentary and igneous rocks with a high thermal conductivity of >6 W/(m K) at 20 degrees Celsius changing to slightly less than 5 W/(m K) at 160 degrees Celsius (Raymond et al., 2022).
Optimising the stratigraphic level of the geothermal well is important to achieve a thermal conductivity that can ensure an adequate energy output over time. Due to the significant variability of rocks thermal conductivity, assessing the actual thermal conductivity of the subsurface requires mapping of the individual layers of the stratigraphic column and if possible, using sample
measurements from nearby analog wells. If additional thermal conductivity information is required for the final well placement information it may be gathered from the cuttings, while drilling the geothermal well. This can be done using a needle probe method to provide information for the development of a thermal model of the well and hence its final completion.
Geothermal heat reservoir
The thermal power output for the closed-loop system is a function of the in-flow fluid temperature, the original rock temperature, rock thermal conductivity, length of the well completion in the geothermal reservoir section as well as the fluid circulation rate and time.
Figure 3 presents the model results of temperature and thermal power from a well with a trajectory as described in Figure 1B, and completed with a co-axial vacuumised pipe-inpipe solution.
Figure 3A presents the dependency of the thermal conductivity of the rock associated with the main reservoir interval of 1 W/(mk), 2.5 W/(mk) and 5.0 W/(mk), which could represent a bedded shale, a porous saturated sandstone and rock salt respectively. Using the same flowrate for the three scenarios the impact of the thermal conductivity is obvious with the regards to an increasing long-term sustainable surface temperature and thermal energy output.
Figure 3B indicates the importance of the well’s length, i.e. increasing the energy harvest area through a horizontal/ slanted well completion illustrated by extending from 4.0 to 6.0 km both the thermal energy output and surface temperature increases with a constant flow rate. In the US horizontal wells have become the predominant way of drilling for oil and gas and in 2019 75% of newly drilled wells were horizontal and averaged 5.5 km (EIA, 2020).
Figure 3C shows the balance between surface temperature and thermal energy output adjusted through the circulation flow rate, i.e. increasing circulation rate will reduce the output temperature and will also increase the thermal power output. If requiring output temperatures close to the original reservoir temperature, the thermal power output will be limited.
Drilling deeper and achieving a higher virgin temperature will make it possible to either provide a higher long-term surface temperature and/or a higher thermal energy output by increasing the circulation flow rate.
Even though the adjustment of the flowrate makes the solution very flexible, the virgin reservoir temperature always has to be at least slightly higher than the required surface temperature.
There are additional benefits of being able to adjust the circulation flow rate, which is by closing for the circulation flow or even reverse the circulation flow.
The heat energy demand may show seasonality during a year. By reducing the fluid flow rate or even closing the circulation the geothermal reservoir section will partly return to the virgin temperature depending on the duration and therefore be able to provide a higher temperature and/or thermal energy output for the remainder of the year. However, the total energy output on an annual basis will be slightly lower.
As part of closing the circulation for a period to let the reservoir rock reheat, it would also be possible to change the circulation direction by flowing a heated fluid at a higher temperature than the existing temperature at the geothermal reservoir to reheat the reservoir. A heated fluid could be available due to excess electricity that could be used for the heating during the warmer season.
Discussion and conclusion
AGS focuses on minimising environmental and subsurface impact, ensuring efficient heat extraction, and offering versatility in application. As closed-loop solutions don’t circulate fluids within the reservoir section, issues with doublet hydrothermal solutions can be mitigated including the system lifetime, whereby systems can be designed to last more than 100 years (Vouillamoz, 2023; Maver et al, 2024).
Based on the thermal conductivity and temperature and the required thermal output and temperature, there will be a significant cost impact depending on the rock type to be drilled. With an expansion of a dedicated geothermal well industry, using a manufacturing mentality when drilling and developing larger projects to take advantage of a local learning curve, the drilling and completion cost are expected to be reduced significantly in the future, making it possible to increase the use of geothermal energy even further as it will be economical to drill deeper and further horizontally for more energy output (Rasmussen et al., 2024).
The regional temperature can in general be mapped in detail, making it the thermal conductivity the main uncertainty factor in geothermal exploration as it can be highly variable locally. But contrary to doublet hydrothermal solutions, which may fail due to the quality of the reservoir section, a closed-loop solution will always be able to produce thermal energy, but the exact output will depend on the thermal conductivity of the main geothermal reservoir section.
Owing to the produced energy amount, the focus is on drilling onshore close to the end-energy user. However, with extended reach horizontal and slanted drilling it would be possible to drill into the ocean in areas with nearshore thick sediment deposits especially in areas where the sedimentary column is limited onshore.
The geothermal energy has a direct application for district heating and industrial usage. For district cooling an absorption chiller can be used to provide a cold fluid from the heated fluid into a district cooling network as has recently been done in Masdar City, UAE (ADNOC, 2023). If the provided temperature of the heated fluid is not sufficient, heat pumps can be used to lift the fluid temperature for direct usage in district heating. Electricity can be produced directly using steam in case of +150 degrees Celsius and, for lower temperatures, an organic Rankine cycle can be used to convert to electricity.
Even for the most mature application of geothermal energy, the decarbonisation potential of district heating is largely untapped (IEA 2022). With closed-loop solutions with a near global application it would be possible to significantly impact the decarbonisation of district heating, district cooling, industrial heating requirements, and electricity production moving towards
‘zero’ CO2 emissions with a nearly unlimited resource of heat from the Earth’s interior that is both reliable and cost effective.
Acknowledgements
The heat modelling results have been performed by The Institute for Energy Research and the authors would like to thank Magnus Wangen for his important work confirming a key aspect of the closed-loop geothermal well solution as part of the work in the
Figure 3 The impact of thermal conductivity, length of slanted/horizontal well completion, and circulation rate on the thermal energy output and temperature on surface.
HOCLOOP project, funded by the EU Horizon Europe Research programme and work in the Reelwell Geotherm JIP supported by RCN and international sponsors.
References
ADNOC [2023]. ADNOC and Tabreed Advance the First Project in the Region to Harness Geothermal Energy. Press Release, 14 August. https://www.adnoc.ae/en/News-and-Media/Press-Releases
Beardsmore, G.R., and Cooper, G T. [2009]. Geothermal systems assessment – identification and mitigation of EGS exploration risk Thirty-Fourth Workshop on Geothermal Reservoir Engineering Stanford University, Stanford, California, February 9-11, Proceedings, SGP-TR-187.
Cermak. V, and Rybach L. [1982]. Thermal conductivity and specific heat of minerals and rocks. In: Angenheister G, editor. Landolt-Börnstein: numerical data and functional relationships in science and technology. Berlin, Springer, Vol 1a, p. 305–343.
Daniilidis, A. and Herber, R. [2017]. Salt intrusions providing a new geothermal exploration target for higher energy recovery at shallower depths. Energy, Volume 118, 1 January, Pages 658-670.
Dezayes, C., Genter, A., Thinon, I., Courrioux, G., and Tourlière, B. [2008]. Geothermal potential assessment of clastic Triasssic reservoirs (Upper Rhine Graben, France). Proceedings, ThirtySecond Workshop on Geothermal Reservoir Engineering Stanford University, Stanford, California, January 28-30, SGP-TR-185.
Duffaut, K., Hokstad, K., Kyrkjebø, R., and Wiik, T. [2018]. A simple relationship between thermal conductivity and seismic interval velocity. Leading Edge, 37(5), May, p. 322–400.
EGEC [2024]. EGEC geothermal market report 2023. European Geothermal Energy Council.
EIA [2020]. U.S. crude oil and natural gas production in 2019 hit records with fewer rigs and wells. Today in Energy, June 25. US Energy Information Administration.
Hantschel, T., and Kauerauf, A. I. [2009]. Fundamentals of basin petroleum systems modelling. Springer-Verlag Berlin Heidelberg, Hartmann, A., Rath, V., and Clauser, C. [2005]. Thermal conductivity from core and well log data. International Journal of Rock Mechanics and Mining Sciences, 42(7–8), October–December, Pages 1042-1055.
IEA [2022]. District Heating. https://www.iea.org/reports/district-heating.
Jacobs, T. [2024]. Hot Rock Slurry: Developer of Emerging Geothermal Tech Readies for Field Tests. Geothermal Energy, jpt.spe.org.
Kallio, J. [2019]. Geothermal energy use, country update for Finland European Geothermal Congress, Den Haag, 11-14 June.
Kolawole F., and Evenick, J. [2023]. Global distribution of geothermal gradients in sedimentary basins. Geoscience Frontiers, 14(6).
Labus, M., and Labus, K. [2018]. Thermal conductivity and diffusivity of fine-grained sedimentary rocks. Journal of Thermal Analysis and Calorimetry, 132, p. 1669-1676.
Law, R., Bridgland, D. Nicholson, D., and Chendorain, M. (2014): Heat Extraction from Deep Single Wells. Thirty-Ninth Workshop on Geothermal Reservoir Engineering Stanford University, Stanford, California, February 24-26, Proceedings, SGP-TR-202.
Lee, C., Park, J., Park, C., and Park, E. [2015]. Current Status of Research on Thermal and Mechanical Properties of Rock under High-Temperature Condition. Journal of Korean Society For Rock Mechanics, 25(1), p. 1-23.
Limberger, J., Boxem, T., Pluymaekers, M., Bruhn D., Manzella, A., Calcagno, P., Beekman, F., Cloetingh, S., and van Wees, J.-D. [2018]. Geothermal energy in deep aquifers: A global assessment of the resource base for direct heat utilization. Renewable and Sustainable Energy Reviews, 82, 961–975.
Longfield, S., Schwarz, B., Hodder, M., Stuebing, T., Holmes, M., Vany, J., and Mölk, D. [2022]. Eavor Loop Commercial Project at Geretsried, Molasse Basin, Germany. European Geothermal Congress 2022, Berlin, 17-21 October.
Maver, K.G., Vestavik, O.M., Rasmussen, J.P. and Larsen, C-E. [2023].
Closed loop single well geothermal solution. First Break, 41(9), p 83-86.
Maver, K.G., Vestavik, O.M., and Hanna, C. [2024]. Geothermal heat potential for district energy and industrial usage in Europe based on closed-loop well solutions. First Break, 42(1), p 53-58.
Pedersen, H.A., Debaylec, E., and Maupind, V. [2023]. Strong lateral variations of lithospheric mantle beneath cratons – Example from the Baltic Shield. Earth and Planetary Science Letters 383, 164–172.
Pimienta, L., Sarout, J., Esteban, L., and Piane, C.D. [2014]. Prediction of rocks thermal conductivity from elastic wave velocities, mineralogy and microstructure. Geophysical Journal International, Volume 197(2), May, p. 860–874.
Rasmussen, J.P, Maver, K.G., Vestavik, O.M., and Hanna, C. [2024]. Horizontal Closed Loop Geothermal Well Solution For Energy Production. Ocean Technology Conference, Houston. OTC- 35465-MS. Raymond, J., Langevin, H., and Comeau, F-A., and Malo, M. [2022]. Temperature dependence of rock salt thermal conductivity: Implications for geothermal exploration. Renewable Energy, 184, 26-35.
Robertson, E.C. [1988]. Thermal Properties of Rocks, Open-File Report 88-441, US Dept. of the interior Geological Survey.
Schön, J.H. [2015]. Physical properties of rocks: fundamentals and principles of petrophysics (2nd edition). Elsevier, Handbook of Petroleum Exploration and Production, 8, 494.
Think Geoenergy [2022]. Retrieved from https://www.thinkgeoenergy. com/qheat-files-patent-for-geothermal-heat-storage-wells-with-coaxial-flow.
Think GeoEnergy [2024]. Retrieved fromhttps://www.thinkgeoenergy. com/geothermal/an-overview-of-geothermal-resources/ Vouillamoz, N. [2023]. Advanced Geothermal Systems (AGS). Geothermal Transition Summit, Berlin, November 14-15.
Accelerating the energy transition using emerging geoscience skills
Philip Ringrose1*, Lasse Amundsen2 and Martin Landrø1 outline the critical role that geoscientists can play in advancing projects and communicating the risks and benefits of emerging projects to society.
Abstract
How can we speed up the energy transition as part of our response to the climate change challenge? The essential tools for enabling rapid reductions in greenhouse gas emissions are well known, but implementing these vectors of decarbonisation is challenging, partly for economic reasons and partly due to social resistance. We argue that geoscientists have a critical role to play in meeting these challenges: (a) they need to engage technically to enable low-carbon emissions projects to proceed, and (b) they need to communicate and explain the risks and benefits of emerging projects to our society in a more effective way. After reviewing recent progress in reducing global CO2 emissions, we discuss societal responses, identifying some important biases in the social discourse concerning low-emission energy projects. We then present a simple summary of the physics of CO2 as greenhouse gas, to help dispel some typical misunderstandings and to support geoscientists in their discussions about climate change science. Finally, we outline the key role that geoscientists can play, drawing from specific examples in the fields of CO2 storage and marine monitoring.
Summary of the energy transition challenge
Reducing global CO2 emissions to atmosphere is a major challenge. Over the last five years global emissions have flattened but not yet started to fall, and economically viable pathways to significant reductions in emissions remain elusive. Good progress has been made in Europe, where the EU’s net emissions in 2022 were 31% lower than in 1990, while in the UK they were 49% lower. In contrast, emissions in Asia have been steadily growing since 1990, while in the USA emissions continued to rise towards a peak in 2007 but have been reduced by 20% since then (ourworldindata.org/co2-emissions). More aggressive rates of decarbonisation are clearly needed in the coming years, and most countries have now announced their ambitions for reaching net-zero emissions, within 2050 or soon after. Put simply, the main actions which will be used to address these goals are:
i. Addition of new renewable (and nuclear) energy sources, ii. Electrification of power systems, iii. Energy efficiency measures, iv. Increased use of bioenergy, v. Increased use of hydrogen and ammonia vi. Accelerated deployment of CO2 capture and storage (CCS).
Figure 1 Cumulative CO2 emissions reductions in the energy sector in the IEA Sustainable Development Scenario relative to the Stated Policies Scenario (Reproduced with permission; IEA, 2020).
1 Centre for Geophysical Forecasting, Norwegian University of Science and Technology | 2 Equinor Research Centre * Corresponding author, E-mail: philip.ringrose@ntnu.no DOI: 10.3997/1365-2397.fb2024088
While there are some vocal proponents and critics of the viability and effectiveness of some of these options, all options will be needed to some degree if our society is to have any chance of reaching the climate change mitigation goals set out in the Paris agreement. Figure 1 shows an example ‘wedge model’ from the IEA Sustainable Development Scenario (IEA, 2020), showing how these multiple actions could be applied to meet the needed reductions in global CO2 emissions. The global rate of addition of new renewable energy capacity since 2005 has been remarkable, reaching over 7000 TWh in generation capacity by 2020 (BP, 2022). However, this still only represented 4% of global energy demand by 2020. Another promising trend is the growth in electricity supply in Asia. By 2025, Asia will account for half of the world’s electricity consumption and one-third of global electricity will be consumed in China (IEA, 2023). Most of this newly installed supply is from renewables. Using the IEA Sustainable Development Scenario (IEA 2020) as a framework for the necessary components of the energy transition (Figure 1), we can also expect use of bioenergy and hydrogen to play a significant role in reducing emissions, although the growth in these energy vectors have so far been slow. CCS is vital for decarbonising hard-to-abate industrial sectors and needs to handle about 14% of the required emissions reductions by 2050 (Figure 1).
Despite recent acceleration in announced CCS projects, the installed and planned capacity lags well behind the necessary rates of deployment. The current global capacity of operating CCS projects is 42 million tonnes per annum (Mtpa), which could rise to nearly 250 Mtpa if all the CCS projects currently in construction and development were deployed (GCCSI, 2022). However, CCS needs to increase to ~1 Gtpa by 2030 and then to ~7 Gtpa by 2050 (IEA 2020), as illustrated in Figure 2. These decarbonisation vectors will need new resources and materials (i.e. metals, minerals, water resources, porous rock strata, hydrocarbons, and biomass), and this future exploitation of Earth resources needs to be done using more responsible approaches than in the past. Sustainability is an essential component of the
Figure 2 Growth in world CO2 capture by source and period in the IEA Sustainable Development Scenario, 2020-2070. Modified from IEA (2020).
energy transition, as set out in the UN Sustainable Development Goals. Geoscientists will therefore have a very important role to play in the coming decades – sustainable use of the Earth’s resources should be the overarching factor going forward.
Societal responses to the climate challenge so far
Despite widespread support for the need to urgently respond to the challenge of climate change and global warming, we see local resistance to change implementation often driven by the ‘NIMBY’ (not in my backhyard) social discourse. Resistance to change is also evident in public policy and private-sector engagement, where parties find it difficult to move away from the current blend of fossil-dependent energy systems and associated economic assumptions. New deployments of renewable energy systems are generally more positively received, but also often met by local resistance in terms of social acceptance of specific projects (Ellis et al., 2023). The slow rate of deployment of CCS over the last two decades has been largely driven by a negative perception of the technology by the public, with, for example, nearly all the planned European CCS projects proposed in 2004-2008 being cancelled by 2015 (a few were restarted after 2019). In many cases, projects experienced strong protests and opposition by the communities living in their vicinity, notably at Barendrecht in the Netherlands and Beeskow in Germany (Ellis et al. 2023). This social resistance is beginning to thaw, as the urgency of responding to the challenge of climate change grows; however, we still have a dominant socio-political discourse where renewables energy deployment is widely supported while CCS is usually resisted (Figure 3).
Achieving the necessary emissions reductions targets requires all mitigation measures to be applied – it is not a game of ‘pick and choose.’ Nevertheless, it is useful to compare the cost-effectiveness of different options for emissions abatement. The Norway example of government tax incentives for encouraging electric vehicle (EV) usage has not only been very successful (over half of cars sold annually in Norway are EVs, reaching 82% market share in 2023), but it has also been
popular with the public. The initiative also makes sense from an emissions perspective, as Norway has an almost entirely renewables-based electricity system (www.iea.org/reports/ norway-2022). This rapid transition to use of EV’s has been stimulated by considerable financial incentives. Norway’s EV subsidies (amounting to a median of around $12,000 per car in the form of tax rebates) implies an abatement cost of $700-1400/ tCO2, depending on assumptions made for lifetime vehicle use and the LCA assessment (Camara et al. 2021). In Norway we can compare this to the abatement costs for CCS, where the Longship CCS value chain project has an estimated first-phase abatement cost of ~$240/tCO2 (for the initial 0.8Mtpa rate) dropping to ~$110/tCO2 as the system scales up to a stage-4 rate of 10Mtpa (Gassnova, 2020). Investment in CCS is therefore good value for money within the framework of emissions reduction targets (Figure 4). Fortunately, in Norway both government subsidies for EVs and state investment in CCS are generally positively received. However, in many nations state investments in CCS are treated with hostility or suspicion, despite the clear benefits for greenhouse gas emissions mitigation. The essential argument here is that CO2 emissions abatement cost should be an important part of the decision-making process when evaluating energy transition projects and policy frameworks.
In addition to the socio-economic challenges, low-emission projects involving the use of subsurface resources (including
geothermal energy, CO2 storage, and hydrogen storage) also have longer development timescales and are affected by subsurface uncertainties which stakeholder communities find difficult to set in a rational framework. Typical societal fears include concerns about induced seismicity or possible leakage events, which despite having demonstrably low technical risks are still associated with elevated levels of public concern. To quote Kahneman’s (2011) book on bias in human decision making: ‘Consistent weighting of improbable outcomes, a feature of intuitive decision making, leads to inferior outcomes.’ In the context of the energy transition, these irrational fears of improbable outcomes can severely slow down projects which are urgently needed to address the challenge of climate change. We clearly need more rational assessments of risk in support of the energy transition.
Furthermore, the climate change challenge is only one of several planetary limits our modern society is breaching. By 2023, six of nine planetary boundaries assessed by the Stockholm Resilience Centre were assessed as transgressed (Richardson et al. 2023), with the degree of transgression having increased since 2015. The six planetary boundaries in the danger zone are: climate change, biosphere integrity, land system change, biogeochemical flows, fresh water change and novel entities (e.g., microplastics, organic pollutants and nuclear waste). While we focus here on the climate change challenge, it is evident that new ‘energy system’ deployments must also comply with other ecosystem challenges, including biosphere impacts, land use, and pollution. Projects will be expected to conduct life-cycle assessments to evaluate the climate and environmental impacts and the value-chain use of natural resources.
Before discussing the role of geoscientists in developing net-zero energy projects, we will review of the physics of CO2 as a greenhouse gas. This is partly motivational – to be clear on why the energy transition is so important, but also to support our societal engagement around the topics of climate change and the associated risks.
The physics of why CO2 is an important greenhouse gas
The urgency of responding to the climate change challenge is closely linked to a good understanding of climate science. The Earth’s climate system is highly complex, and so it is understandable that there is widespread speculation about the significance of long-term trends and shorter-term fluctuations. Are they significant? Could these heat waves and increasingly severe storm events really be linked to human influences on climate? We cannot review climate science here but argue that all geoscientists should be able to understand how CO2 in the atmosphere acts as a greenhouse gas that absorbs IR radiation from Earth and sends parts of it back to Earth, thus causing a heating effect. Equally important is that geoscientists are actively engaged in explaining the underlying concepts to the wider public.
Let’s start by summarising the physical basis by using descriptions of concepts suitable for heuristics and idealised modelling. Blackbody radiation refers to the behaviour of an object that absorbs all radiation that is incident upon it and then re-radiates energy. Blackbody radiation is determined by Planck’s
radiation law, where the spectral radiance of the object, Bv, which depends only on temperature T and wavenumber v is given by (1)
In equation (1), h and kB are the Planck and Boltzmann constants, and c is the speed of light. By summing the spectral radiation over all wavenumbers, and further integrating with respect to solid angle over the hemisphere into which the surface radiates, one obtains the Stefan-Boltzmann law for the energy flux, F = σSBT 4 The blackbody radiation flux thus depends on only one parameter – the temperature of the blackbody.
Blackbody radiation is manifest in the macroscopic world. The c. 6,000 K surface of the Sun emits blackbody radiation that peaks in the centre of the visible range. On Earth, part of the incoming sunlight is reflected by the atmosphere and the surface. Most of the sunlight, however, is absorbed by the surface, which is warmed by that radiation. The Earth then radiates as a blackbody according to its surface temperature. Planck’s radiation law tells us that the c. 300 K surface of the Earth emits radiation with a peak intensity in the far infrared (IR) range (see Planck 1915 for the original work). Most of the radiant energy emitted by the Earth and atmosphere is in the range 200-2500 cm-1 and is referred to as terrestrial (or longwave) radiation. Note that the average surface temperature on Earth prior to about 1950 was 288 K (15oC) but has rised by more than a degree in recent decades.
Electromagnetic radiation, including infrared radiation, can be described in terms of a ‘stream’ of mass-less particles, called photons, each traveling at the speed of light. Each photon contains a certain amount of energy that is related to its wavenumber; the photon has energy hcv. The photon density is
The terrestrial radiation emitted from the surface of the Earth therefore can thus conveniently be described by photons leaving upwards from Earth’s surface. But ‘watch your step’ – a surface temperature of 15°C yields the total number of 3.63 1022 photons being emitted per second per m2.
If Earth had no atmosphere these photons would be emitted to outer space and cool the Earth to the frigid temperature of 252K, or -21°C. This was indeed the temperature in the early history of the Earth, 4 billion years ago. In fact, it was even lower due to the effects of the solar evolution, and solar radiation was lower, so the temperature at the time was 236K (-37°C).
Next, let’s see what happens to Earth’s IR radiation by looking at satellite measurements.
The Terrestrial Radiation Spectrum
Satellite measurements reveal the real emission spectrum above Earth. An example is shown in Figure 5, where the spectrum is plotted over wavenumbers 400-1600 cm−1 as recorded over a hot Sahara on 5 May 1970 by the infrared interferometer spectrometer IRIS-D on Nimbus 4. Calculated blackbody Planck curves (white lines) for temperature 320K (47°C) and 215K (-58°C) are superimposed.
The spectrum over the IR atmospheric window has the appearance of a blackbody curve at around 320K surface temperature. In this window there is relatively little absorption of terrestrial thermal radiation by atmospheric gases. The greenhouse effect of CO2 is visually manifested by the ‘bite’ taken out of the IR spectrum near 667 cm-1. The trend at the ‘bottom of the dips’ in the curve indicates the effective temperature of the emission where photons are emitted not from the surface but from a cooler atmospheric height, at about the tropopause temperature of 215K (-58°C).
CO2 molecules are infrared-active molecules
CO2 molecules in the atmosphere have the property to absorb and emit Earth’s IR photons. When an IR photon leaves from Earth’s surface it may interact by transferring its energy to the CO2 molecule, thereby raising the CO2 molecule to a higher vibrational state. The CO2 molecule’s absorption of photons at close to 667 cm-1 is of particular interest since those wavenumbers are near the peak radiation wavelength for Earth’s temperature and thus important for terrestrial radiative transfer in the atmosphere. If IR absorption took place only at precisely 667 cm-1 it would have negligible climatic effect. But collisions between CO2 molecules and other molecules remove or add energy during radiative transitions, and this process, called pressure or collisional broadening, allows absorption and emission to take place over a
broader range of photon energies. Therefore, pressure broadening is a key source of IR opacity in the troposphere.
In fact, the CO2 absorption spectrum shown in Figure 6 shows thousands of separate lines between 550 and 800 cm-1. The CO2 absorption cross-section denoted by is a measure for the probability of absorption, or the ability of a CO2 molecule to absorb a photon of a particular wavenumber. The density or number n of absorbing CO2 molecules per unit volume must also affect the probability of absorption.
But excited states are energetically unfavourable – the CO2 molecules want to return to the ground state by giving up energy. Amundsen and Landrø (2023) show that only a small percentage of molecules re-radiate photons and that the majority loose that energy to the surrounding bath of atmospheric molecules by collisions. In turn, the atmospheric molecules collide with CO2 molecules so that they get excited. Only a small percentage of molecules radiate new photons, and the rest lose the energy by collision. So, the story continues. Atmospheric molecules have a stressful life!
The mean distance travelled by a photon before being absorbed by a CO2 molecule
In physics, the mean free path is an important concept that refers to the average distance that a particle travels before colliding with another particle. The concept is also valid for the radiation physics of photons in the atmosphere. When a photon leaves the surface of the Earth the mean free path or the mean distance travelled by a photon before being absorbed can be shown to be (Amundsen and Landrø 2023)
(3)
Here, n is the local CO2 density and σ v is the CO2 absorption cross-section (Figure 6). The local density close to Earth’s surface is n = η[C] molecules/cm3 where η =2.5470 • 1013 and [C] is the CO2 concentration in ppm.
A key observation is that the mean free path length is a function of wavenumber v and the CO2 concentration [C]. For example, assume that [C] = 400 ppm and suppose that the photon is at the centre of the absorption band at wavenumber v = 667.5 cm-1, when being emitted upwards from the surface of the Earth. The mean free path then becomes 2.646m. Suppose instead that the photon leaves Earth’s surface away from the centre of the band, say at its wings at wavenumbers =585.2 or 749.8 cm-1 where σ v has fallen off by several orders of magnitude. Now, the mean free path is 4,014m, which is more than 1500 times larger compared to the centre band photon’s mean free path.
When a photon has travelled the mean free path, it is most likely absorbed by a CO2 molecule. After being absorbed, the photon may be re-emitted, with a 50% probability of being sent upwards in the atmosphere or downwards, back to the Earth. The CO2 molecule may also get rid of the absorbed photon-energy by collisions with other molecules in the atmosphere, but these atmospheric molecules then collide with CO2 molecules so that they get excited; and then these CO2 molecules are allowed to radiate new photons. If the photons go upwards, then they travel another distance before they are absorbed again. The story of absorption and re-emission thus continues in this way.
Photons are ‘seeing’ the atmosphere as ‘layered’ We now introduce a stratified model of the atmosphere, allowing us to use rules of thumb that simplify decision-making and problem-solving. Equation 3 suggests that photons with different wavenumbers are ‘seeing’ the atmosphere very differently. If a photon’s mean free path is small, it has to pass a large number of ‘fictitious layers’ of thickness to reach to outer space. Being absorbed and re-emitted in each layer, the probability is therefore large that the photon will eventually get back to the Earth, where it heats Earth’s surface and ends its life. If a photon’s mean free path is large, the number of fictitious layers is small, and it is likely that the photon eventually may escape into space and cool Earth. Let’s investigate this a bit further in a model of an exponential atmosphere characterised by the scale height L. In the exponential atmosphere, for every L rise in altitude, the density and pressure of air drop by a factor e = 2.7; thus, L provides a measure of the thickness of the atmosphere. It can be shown that L = 8,000m. Now, we may take the number of fictitious layers to be
(4)
For a photon at the centre of the absorption band at wavenumber v = 667.5 cm-1, then M v = 3,024. For a photon at wavenumbers v = 585.2 or 749.8 cm-1 where σ v has fallen off by several orders of magnitude, the number of layers in the atmosphere is 3 (M v =2).
The probability of photons returning to Earth’s surface Assume that a photon that leaves Earth’s surface has travelled one mean distance. In a model of a random walk, with a 50/50% probability of being sent upwards in the atmosphere or downwards back to the Earth, the probability for the photon’s return to Earth is (Wilson and Gea-Banacloche 2012; Amundsen and Landrø 2023):
(5)
A photon leaving Earth’s surface with wavenumber near the centre of the absorption band is virtually certain to make the return to Earth, pv = 0.9997. Or, a photon leaving Earth’s surface away from the centre of the band, at wavenumbers v = 585.2 or 749.8 cm-1 has the probability of returning to the surface pv = 1/2. The probability then for the photon to disappear to outer space is 1-pv = 1/2.
The probability of photons returning to Earth’s surface when the CO2 concentration increases If the CO2 concentration is doubled, the probability of return for a photon near the centre of the absorption band doesn’t change much; it becomes pv = 0.9998. Any CO2 increase has minor effect on the photons in the centre of the absorption band. This part of the band is ‘saturated’. However, when the CO2 concentration doubles, these numbers change considerably for photons having wavenumber at the wings of the absorption band: pv = 3/4 and 1-pv = 1/4. Hence, when the CO2 concentration doubles, the probability of the photon at the two selected wavenumbers at the wings of the CO2 cross-section coming back to Earth increases by 50%, and the probability of ending in outer space is halved.
Clearly, because of the exponential decay of the CO2 cross-section, the effect of a CO2 increase is important mostly around the wings of the CO2 cross-section. In addition, we observe that the mean free path of the photon in our educational model is halved by a doubling in CO2 concentration. This implies that the number of fictitious layers in the atmosphere doubles, so that a large increase in the CO2 concentration widens the range of photon frequencies that are blocked from reaching outer space.
To summarise this ‘physics review’, the reason that an increase in CO2 concentration in the atmosphere has the effect of increasing Earth’s temperature is because proportionally more photons radiated by Earth have the likelihood of returning to the Earth’s surface, thereby heating it. This is the ‘greenhouse gas effect’ of increasing atmospheric CO2 concentrations – as originally identified by Arrhenius (1896) and based on the Stefan–Boltzmann law of black body radiation. We hope this brief explanation of the physics of the processes involved will help readers to appreciate the fundamental reasons why an urgent and concerted response to the global heating challenge is needed. It may also be useful in dispelling some of the myths and misunderstandings which are still commonly shared in discussions of the climate-energy challenge.
The role of geoscientists
Geoscientists working to support the energy transition (by various vectors) have two overall tasks: (a) to technically enable low-carbon emissions projects to proceed, and (b) to communicate and explain the risks and benefits in a more effective way. Communication and engagement in the public arena must go hand-in-hand with the multidisciplinary problem-solving efforts needed to implement sustainable low-emissions energy systems (Figure 7). A good example of this is the question of induced seismicity associated with CO2 storage projects. Technically, projects need to systematically work on assessing the geomechanical and induced-seismicity risks using coupled geomechanics-flow models, rock-testing, well logging and geophysical monitoring, but despite these technical efforts the perceived risks and concerns among the public remain high (e.g. McComas, et al. 2016). CO2 storage project development teams therefore need
to work hard not only to assess the risks thoroughly but also to communicate the risks in a meaningful way.
As an example, Zarifi et al. (2023) show how this question is being addressed in support of the Northern Lights CO2 storage project offshore Norway (Figures 8 A and B). The analysis of historical seismicity can be used to determine the existing stress field and the stress ratio (Figure 8A). While these data are key to assessing potential for induced seismicity (which is expected to be at a very low level), they also reveal that nature of natural seismicity, which includes occasional moderate earthquakes. Communication of these data for the ‘public interest’ is summarised in Figure 8B, where earthquake likelihoods are presented in a relatively simple way, explaining how some felt earthquakes (unconnected with CO2 injection) should be expected in this region.
Figure 8 (A) Example analysis of the stress field around the planned CO2 injection site offshore Norway (Eos well at the Northern Lights project) based on analysis of earthquake focal mechanisms from Tjåland and Ottemöller (2018) with inferred principal axes of the stress field in selected onshore and offshore sectors (from Zarifi et al. 2023). (B) Frequency–magnitude relationship for the offshore Horda platform region (thin brown box in Figure 8A) for the period of 2001-2021 based on the Norway national NNSN catalogue. Colour boxes give ‘public interest’ information about earthquake likelihood in this region. The current Magnitude of completeness (M c) of 1.5 is being improved to reach M c ~1.0 via use of seabed FO sensors (Rebel et al., 2023). Both figures are modified from Zarifi et al. (2023).
Figure 9 An Earth-Ocean-Atmosphere-Space observatory concept (from Landrø et al. 2022), illustrating the multi-purpose use of fibre-optic (FO) sensing using DAS detection for tracking whales, ships, storms and earthquakes, processed in real-time, and fused with other sensing sources such as satellite-based Automated Identification Systems. The upper image, with a North polar stereographic projection, shows the extensive network of existing FO cables (yellow lines) and the lower inset illustrates the key features of the observatory and its capabilities.
Another broader domain of geoscientist engagement in the energy transition is the field of site monitoring. Advanced monitoring systems will be needed for all low-emissions projects, for two main reasons:
a. Technically, monitoring is needed for site selection for new projects and for the operational phases. This activity is focused on safe and effective project operation and is usually self-justified in terms of value to the project. Examples include drone monitoring of offshore wind turbines, seismicity monitoring of fluid injection/extraction projects, time-lapse geophysical surveys, and surface gas detection systems.
b. As a societal activity, monitoring is needed to ensure sustainable developments, to verifying low-emissions value chains, for minimising harm to the environment, for protecting ecosystems, and for maintaining a social licence to operate.
Historically, projects have often only focused on the technical goals of monitoring (business-driven) while frequently failing to cover the societal and environmental needs and requirements. Landrø et al. (2022) show how a vision for an integrated technical and ecological monitoring system could be realised (Figure 9), with a focus on the marine environment where there is a growing awareness of and concerns about ‘conflicts of interest’ between human activities (including shipping, offshore wind
farms, and CO2 storage projects) and marine ecosystems. The authors argue that the existing dense network of fibre-optic (FO) telecommunication cables, covering both ocean and coastal areas around the globe, can be used to create an affordable advanced acoustic sensing system. The same FO cables can be used to track whale populations (Bouffaut et al. 2022) and detect natural or induced earthquakes (Rørstadbotnen et al., 2022; Rebel et al. 2023).
In addition to the challenge of ensuring a social licence for execution of the projects needed to achieve the energy transition, the technical work involved can also be challenging, and there is a long shopping list of skills and insights needed from geoscientists. To summarise some of the most important geoscience-related aspects of the energy transition we can identify the following main arenas where geoscience skills will likely be needed (modified from Stephensen et al. 2019):
1. Geothermal energy systems, including low enthalpy systems (e.g. district heating) and high enthalpy systems for power generation.
2. Subsurface energy storage, including compressed air energy storage, thermal storage and hydrogen storage.
3. Pumped hydroelectric schemes for power generation and energy storage.
4. Carbon Capture and Storage (CCS) projects, including applications for decarbonising fossil fuels, for reducing industrial emissions and for enabling negative emissions technology (i.e. BECCS and DAC).
5. Extraction of raw materials for the energy transition, especially the metals, silicates and rare earths needed for solar photovoltaics, wind turbines, batteries, and electrical power systems.
6. Nearsurface geoscience in support of wind turbine developments offshore and onshore.
7. An emergent hydrogen economy, including the so-called ‘green’ and ‘blue’ hydrogen generation options, and use of ammonia as a fuel or energy carrier.
8. Nuclear energy, in selected nations where nuclear power is still prioritised, and with a geoscience focus on the safe disposal of radioactive waste.
These new/emerging domains for the application of geoscience skills have some common grounds with the legacy of geoscience for exploitation of resources (e.g. mining and petroleum production), but also many new aspects. For example, the shallow subsurface is more in focus than in the past (e.g. for siting offshore wind turbines), such that improved knowledge of the Tertiary and Quaternary stratigraphy will be high on the agenda alongside advanced geophysical imaging of the near surface. CO2 storage projects also require different skills and mindsets when compared with oil and gas developments – storage projects need longer timeframes for forecasting (100s of years) and will have a high focus on storage integrity assessment (Ringrose et al. 2022).
Conclusion
The energy transition presents a major challenge for our society. The main tools for enabling rapid reductions in greenhouse gas
emissions are well known, but implementing these vectors of decarbonisation will be challenging, partly for economic reasons and partly due to social resistance. Geoscientists working to support the energy transition have two overall tasks: they need to engage technically to enable low-carbon emissions projects to proceed, but they also need to engage with society to communicate and explain the risks and benefits of projects in a more effective way. Geoscientists have many of the critical skills needed to support the energy transition, so the future of applied geoscience should be bright. However, challenges with financing of clean energy projects and growing social opposition to new projects means that the road ahead will be ‘rough and rocky’. Geoscientists have a important role in accelerating the energy transition by enabling projects to proceed based on a sound but realistic assessment of risks and benefits. A clear understanding of the physics of the CO2 molecule is good way to start. As climate change is itself a major societal risk, we can work to mitigate that risk by developing new low-emission energy systems. On the overall balance of risks, action is much less risky than inaction.
Acknowledgements
This article grew out of the workshop on ‘Nurturing talent for the energy transition’ held at the EAGE annual conference in Oslo 2024, using material presented at the workshop by Lasse Amundsen and Philip Ringrose. The other workshop convenors (Deyan Draganov, Johan Robertsson, Colin MacBeth, and Mark Thompson) are thanked for their support and contributions, alongside many insights from other participants.
References
Amundsen, L. and Landrø, M. [2023]. From Arrhenius to CO2 Storage with Physicsbased Educational Models for Radiation in the Atmosphere. Bivrost, Trondheim. https://bivrostgeo.no/. Arrhenius, S. [1896]. XXXI. On the influence of carbonic acid in the air upon the temperature of the ground. The London, Edinburgh, and Dublin Philosophical Magazine and Journal of Science, 41, 237-276. Bouffaut, L., Taweesintananon, K., Kriesell, H.J., Rørstadbotnen, R.A., Potter, J.R., Landrø, M., Johansen, S.E., Brenne, J.K., Haukanes, A., Schjelderup, O. and Storvik, F. [2022]. Eavesdropping at the speed of light: Distributed acoustic sensing of baleen whales in the Arctic. Frontiers in Marine Science, 9, 901348.
BP [2022]. Statistical Review of World Energy 2022, 71st edition. Camara, Y., Holtsmark, B. and Misch, F. [2021]. Electric vehicles, tax incentives and emissions: Evidence from Norway. International Monetary Fund.
Ellis, G., Schneider, N. and Wüstenhagen, R. [2023]. Dynamics of social acceptance of renewable energy: An introduction to the concept. Energy Policy, 181, 113706.
Hansel, R.A. et al. [1994]. IRIS/Nimbus-4 Level 1 Radiance Data V001, Greenbelt, MD, USA, Goddard Earth Sciences Data and Information Services Center (GES DISC), https://disc.gsfc.nasa.gov/datacollection/IRISN4RAD_001.html
IEA [2023]. Electricity Market Report 2023, IEA, Paris https://www.iea. org/reports/electricity-market-report-2023.
Gassnova, S.F. [2020]. Potential for reduced costs for carbon capture, transport and storage value chains (CCS). The Norwegian FullScale CCS Demonstration Project, 1-61.
GCCSI [2022]. Global Status of CCS 2022. www.globalccsinstitute.com/ resources/global-status-of-ccs-2022/ Kahneman, D. 2011. Thinking, fast and slow. Macmillan.
Landrø, M., Bouffaut, L., Kriesell, H.J., Potter, J.R., Rørstadbotnen, R.A., Taweesintananon, K., Johansen, S.E., Brenne, J.K., Haukanes, A., Schjelderup, O. and Storvik, F. [2022]. Sensing whales, storms, ships and earthquakes using an Arctic fibre optic cable. Scientific Reports, 12(1), 19226.
McComas, K.A., Lu, H., Keranen, K.M., Furtney, M.A. and Song, H. [2016]. Public perceptions and acceptance of induced earthquakes related to energy development. Energy Policy, 99, 27-32.
Planck, M. [1915]. Eight lectures on theoretical physics: Delivered at Columbia university in 1909, (Ernest Kempton Adams Fund for Physical Research. Publication).
Rebel, E., Bremaud, V., Olsen, P.A., Ringrose, P., Oates, S. and Köhler, A. [2023]. DAS deployed at seabed for Northern Lights induced seismicity monitoring. TCCS conference. Trondheim, Norway: https://www. sintef.no/projectweb/tccs-12/.
Richardson, K., Steffen, W., Lucht, W., Bendtsen, J., Cornell, S.E., Donges, J.F., Drüke, M., Fetzer, I., Bala, G., Von Bloh, W. and Feulner, G. [2023]. Earth beyond six of nine planetary boundaries. Science advances, 9(37), DOI: 10.1126/sciadv.adh2458
Ringrose, P. [2023]. Storage of Carbon Dioxide in Saline Aquifers: Building confidence by forecasting and monitoring. Society of Exploration Geophysicists. doi.org/10.1190/1.9781560803959
Ringrose, P., Andrews, J., Zweigel, P., Furre, A.K., Hern, B. and Nazarian, B. [2022]. Why CCS is not like reverse gas engineering. First Break, 40(10), 85-91.
Rørstadbotnen, R.A., Landrø, M., Taweesintananon, K., Bouffaut, L., Potter, J.R., Johansen, S.E., Kriesell, H.J., Brenne, J.K., Haukanes, A., Schjelderup, O. and Storvik, F. [2022]. Analysis of a local earthquake in the Arctic using a 120 km long fibre-optic cable. In 83rd EAGE Annual Conference & Exhibition (Abstract).
Stephenson, M.H., Ringrose, P., Geiger, S., Bridden, M. and Schofield, D. [2019]. Geoscience and decarbonization: current status and future directions. Petroleum Geoscience, 25(4), 501-508.
Tjåland, N. and Ottemöller, L. [2018]. Evaluation of seismicity in the area between the Troll field and the Øygarden fault. NNSN Project Report, Department of Earth Science, University of Bergen.
Wilson, D. J. and Gea-Banacloche, J. [2012] Simple model to estimate the contribution of atmospheric CO2 to the Earth’s greenhouse effect. American Journal of Physics. 80(4), 306-315.
Zarifi, Z., Köhler, A., Ringrose, P., Ottemöller, L., Furre, A.K., Hansteen, F., Jerkins, A., Oye, V., Dehghan Niri, R. and Bakke, R. [2023]. Background Seismicity Monitoring to Prepare for Large‐Scale CO2 Storage Offshore Norway. Seismological Society of America, 94(2A), 775-791.
A glimpse of the energy transition: Utah’s new energy corridor
Rasoul Sorkhabi1*, Palash Panja1, John McLennan1, Joseph Moore1, Alan Walker1, Robert Simmons1 and Milind Deo1 highlight recent advancements and key features within Utah’s new energy corridor, showcasing the state’s progress toward sustainable energy resources.
Summary
In the past decade, there has been a remarkable growth in renewable energies in the state of Utah, adding new resources to the state’s traditional fossil fuels. Utah’s New Energy Corridor spans between the town of Delta and Cedar City in the Great Basin. This 140-mile stretch is home to a diverse array of clean energy projects, including hydrogen storage, geothermal plants, and wind and solar farms. With its favourable conditions including high geothermal gradiants, high solar irradiance, and a vast desert landscape, Utah’s New Energy Corridor will play a greater role in “coproduction” of renewable energies and clean energy technologies, and already offers field-scale analogs for similar energy transition projects in other parts of the world. The knowledge base and skillsets arising from the development of the new energies in Utah are also valuale contributions to energy science and engineering.
Introduction
The state of Utah, located in the American West, boasts a vast and diverse geography despite its relatively small population of 3.3 million. Covering nearly 220,000 km2, the state is larger than France, Spain, and many other European countries. Historically, Utah has been a significant player in the production of fossil fuels (Sorkhabi 2018, Vanden Berg 2016). Geologically, the state is divided into four distinct tectonic zones (Figure 1): (1) Colorado Plateau, which stretches into neighbouring states of Colorado, Arizona, and New Mexico; (2) Central Rockies, including the Wasatch Range and Uinta Mountains, extending from northern Wyoming; (3) Transition Zone or High Plateaus, a geological extension of the Central Rockies’ fold-and-thrust belt; and (4) Basin-and-Range province, also known as the Great Basin. Utah’s traditional energy corridor, home to its coal, oil, and natural gas fields, is primarily located on the Colorado Plateau (Figure 1).
As the global demand for cleaner energy intensifies, Utah is emerging as a leader in the shift toward renewable energies. This new energy landscape is particularly evident in the southwestern part of the state, within the Great Basin, an area now being referred to as Utah’s ‘new energy corridor’. This article
1 University of Utah
* Corresponding author, E-mail: rsorkhabi@egi.utah.edu
DOI: 10.3997/1365-2397.fb2024089
highlights the recent important developments within Utah’s new energy corridor, showcasing the state’s progress toward sustainable energy resources. For this article, the new energy corridor spans from the town of Delta, located about 130 miles south of the state capital, Salt Lake City, down to Cedar City, some 140 miles further south of Delta (Figure 2). The region hosts a variety of cutting-edge renewable energy projects, including hydrogen storage in salt caverns at Delta, conventional and enhanced geothermal power plants in the vicinity of Milford, and wind and solar farms around Milford and Cedar City.
Figure 1 Utah’s tectronic divisions: Colorado Plateau, Central Rockies (Wasatch Range and Uinta Mountains), Transition Zone (High Plateaus), and Basin-and-Range province (Grea Basin). Utah’s traditional energy corridor hosting its coal, oil and natural gas fields located on Colorado Plateau (Map after Sorkhabi 2018).
Hydrogen storage in a salt dome
Hydrogen, when combusted, produces only water as a byproduct, making it an attractive clean energy source. Its appeal as a fuel has been growing due to its potential applications in a variety of sectors (Karplus and Morgan 2024). Hydrogen is increasingly seen as a key player in clean fuel cells for transportation, long-term energy storage, and as a carrier for electric power. Additionally, it holds significant promise for use in high-temperature industries, such as steel and concrete production, where traditional fossil fuels are currently the norm (Gençer 2024).
Despite its great potential, hydrogen presents unique challenges due to its chemical properties (Epelle et al. 2022). As the lightest element, hydrogen is highly reactive and flammable, making it difficult to find in its pure form in nature. Currently, approximately 95% of hydrogen is produced from fossil fuels, primarily through processes like steam methane reforming. The remaining portion is generated through the electrolysis of water. Recently, there has been growing interest in natural (geologic) hydrogen production from subsurface sources, so-called ‘hydrogen factories’. However, finding subsurface hydrogen concentrations and efficient technologies to extract geologic hydrogen are still in the early stages (Ellis 2023).
Regardless of how hydrogen is produced, the storage and transportation of fugitive and flammable hydrogen poses significant technological challenges. One promising solution lies in subsurface storage in depleted gas reservoirs and salt caverns as underground formations offer the necessary stability and containment for large volumes of hydrogen.
Utah’s sandstone gas fields may play a role in hydrogen storage in the future. However, the largest hydrogen storage project in the state is the Advanced Clean Energy Storage (ACES) project located in Delta. This part of Utah sits atop a large Jurassic-age
salt dome, which provides an ideal environment for hydrogen storage due to its impermeability and ability to withstand high pressures. Utah’s hydrogen is part of the ‘California hydrogen hub’ according to the scheme of national hydrogen hubs designed by the US Department of Energy (Karplus and Morgan 2024).
The ACES project began in 2022 with the backing of a $504.4 million loan from the US Department of Energy, granted to Magnum Development and Mitsubishi Power America. In September 2023, Chevron acquired full ownership of Magnum, becoming the majority stakeholder in ACES, which is poised to be one of the largest hydrogen storage facilities of its kind.
Since its inception, ACES has made significant progress, including the construction of two enormous salt caverns through solution mining. Each cavern is 220 feet wide and 1500 feet long, nearly the size of the Empire State Building, but located some 4000 feet underground at temperatures of about 140°F. These caverns have the capacity to store 5500 metric tonnes of compressed hydrogen each. The surface facilities and a schematic of two salt caverns at ACES are shown in Figure 3. Given that the underground salt dome spans 4800 acres, the potential exists for the creation of dozens more caverns.
The ACES facility is an impressive feat of geoengineering. Above ground, the entire process of hydrogen generation, compression, and injection must be meticulously sealed to ensure safety. Underground, the salt formation is ductile and able to deform and creep. To prevent the shrinkage of these caverns, hydrogen is stored alongside a base or cushion gas, typically methane, under pressures of 1000 pounds per square inch.
ACES works closely with the Intermountain Power Agency (IPA), a utility company that operates two coal-powered plants and is planning to add a natural gas power plant. Hydrogen at the Delta facility is produced through the electrolysis of water, with IPA supplying high-voltage electricity. The stored hydrogen will fuel
an 840 megawatt hydrogen-capable gas turbine, combined-cycle power plant. Starting in 2025, the turbines will operate on a blend of 30% hydrogen and 70% natural gas, with plans to gradually increase the hydrogen ratio, reaching 100% by 2045.
Conventional geothermal power plants
Earth’s interior is a gigantic heat machine, but the heat flow to Earth’s surface varies from place to place because of plate tectonics, mantle plumes, and geomorphic processes (Stein 1995). Seventy-five miles south of Delta lies Milford, a small
town in Beaver County located to the west of Interstate Highway 15, which roughly divides the Colorado Plateau on the east from the Great Basin to the west (Figure 2). Unlike the Colorado Plateau’s 28-mile-thick continental crust, the crust beneath the Great Basin is stretched and thinned to about 18 miles and sits atop a hot magma chamber (Heimgartner et al. 2006). This unique geological setting results in high geothermal gradients averaging about 40 °C per kilometre in the bedrock (Allis et al., 2011). Furthermore, major faults related to the Basin-and-Range extension provide excellent channels for hot water flow.
Utah’s three conventional hot-water power plants are concentrated in Beaver County, which, as shown on the crustal heat map in Figure 4, exhibits high geothermal gradients and significant geothermal potential for energy production due to its more accessible subsurface heat. These geothermal plants provided 8% of the state’s renewable electricity generation in 2023 (US Energy Information Administration 2024). They are briefly described below.
(1) The Blundell plant in the Roosevelt Hot Springs is located 15 miles northeast of Milford and is Utah’s first geothermal plant. This geothermal field was initially planned and explored by Philips Petroleum Company from 1976 to 1984 when PacifiCorp bought and built the plant. It consists of two units built in 1984 (Unit 1) and 2007 (Unit 2) with a combined capacity of 34 megawatts of electricity. The field covers an area of 30,720 acres and production comes from depths of 1253 to 7321 feet with reservoir temperatures of 464 to 514 °F.
(2) The Thermo plant produces 10-14 megawatts and is operated by Cyrq Energy. It was initially drilled and developed by Raser Technologies in 2007. The wells approach depths of 7000 feet with bottom hole temperatures of about 350 °F.
(3) The Cove Fort geothermal plant, located at Sulphurdale, was initially developed by Mother Earth Company and came on stream in 1985. It has a 25-megawatt capacity with production primarily from shallow vapour-dominated wells but also some production from deeper liquid-dominated wells. The plant has changed several hands and is currently owned by Ormat Technologies.
Conventional geothermal power plants utilise the natural heat stored beneath the Earth’s surface to generate electricity. In
regions with high geothermal gradients like the Great Basin, water from underground reservoirs is naturally heated by contact with hot rocks or magma. This hot water or steam is accessed by drilling deep wells, typically several thousand feet deep.
Once tapped, the geothermal fluid is brought to the surface, where it is directed through a series of turbines. The heat from the fluid, often exceeding 300°F, is used to turn the turbine blades, which are connected to a generator. This process converts the thermal energy of the hot water or steam into mechanical energy, and finally, into electrical energy.
There are three main types of conventional geothermal power plants: dry steam, flash steam, and binary cycle. Utah’s conventional geothermal plants use flash steam or binary cycle systems. In flash steam plants, high-pressure hot water from the geothermal reservoir is brought to the surface and allowed to rapidly ‘flash’ into steam by lowering the pressure. The steam then drives a turbine, and any remaining water is either
re-injected into the reservoir to maintain pressure or used again in the process. In binary cycle plants, which are particularly effective in areas where the geothermal water is not hot enough to produce steam directly, the geothermal fluid is passed through a heat exchanger where its heat is transferred to a secondary fluid with a lower boiling point than water, such as isobutane or pentane. The secondary fluid vaporises and drives the turbine, while the cooled geothermal fluid is returned underground to replenish the reservoir. This closed-loop system also minimises the environmental impact, as there is little to no emission of greenhouse gases during the process.
Unlike solar and wind energy, geothermal power plants are not dependent on weather conditions and provide a stable source of baseload electricity.
Enhanced geothermal system
Utah’s most advanced geothermal project is the Frontier Observatory for Research in Geothermal Energy (FORGE), located 12 miles northeast of Milford (Figure 5). Funded with $220 million from the US Department of Energy since 2018 and operated by the University of Utah’s Energy & Geoscience Institute, FORGE is a pioneering effort in the development of Enhanced Geothermal Systems (EGS). Unlike conventional geothermal systems that rely on naturally occurring hot water or steam, EGS taps into deep underground heat resources in ‘hot dry rock’ formations, such as basement granite, where temperatures prevail at 500°F or more (Moore and Simmons 2013). As shown in Figure 6, the FORGE project involves drilling deep deviated wells into granite, and then using hydraulic stimulation to increase the rock permeability, thus allowing water to circulate between the wells and extract heat (Cornwall and Larson 2022, Mclennan et al. 2024).
The areal view in Figure 7 highlights the layout of various wells at the FORGE site, including the injection, production, pilot, and seismic monitoring wells, which are crucial for geothermal energy development and monitoring. In 2020, FORGE drilled an injection well with a vertical depth of 8559 feet and a total measured depth of 10,897 feet, which includes a deviated lateral section. This was followed by the drilling of a production well in 2023. Both injection and production wells were successfully stimulated, with eight stages in the injection well and four stages in the production well. The two wells are parallel, with lateral sections deviating 65 degrees from vertical and spaced 300 feet apart vertically. This configuration is designed to maximise the heat exchange between the two wells, with water injected into the first well circulating through the fractured granite and recovering heat as it travels to the production well.
Both injection and production wells were cored, well-logged, and monitored by fibre-optic cables for seismic events, strain, and temperature. Induced seismicity did not exceed 1.9 magnitude. These operations have thus generated a large amount of analytical data for geoscientists and engineers. The cutting-edge drilling, logging, and monitoring technologies applied to FORGE wells, which are much hotter than normal oil and gas wells, have also provided an important knowledge base for similar operations elsewhere.
In May 2024 FORGE conducted a nine-hour circulation test, validating water communication between the wells with a
recovery efficiency of 70%. In August 2024, FORGE undertook a 30-day circulation test, further validating the system’s capacity to generate energy from hot dry rock formations.
The significance of FORGE goes beyond research. Adjacent to the FORGE site, Fervo Energy launched a 400-megawatt EGS plant called Cape Station in 2023, marking one of the first large-scale commercial applications of enhanced geothermal technology. Part of the electricity produced by Fervo’s plant is already contracted to be supplied to Google, highlighting the commercial viability and growing interest in EGS as a clean, renewable energy source in other regions.
Wind and solar farms
Over the past decade, Utah has witnessed a significant increase in the development and use of wind and solar energy. Since 2016, solar and wind power have surpassed hydropower in terms of electricity generation, now accounting for approximately 18% of Utah’s total electricity production (US Energy Information Administration 2024). Most of these renewable energy plants are concentrated in the New Energy Corridor in the southwestern part
of Utah (Figure 8), where favourable conditions for both wind and solar energy exist.
Milford Wind Farm
Although Utah cannot compete in potential for wind power with states like Texas (Figure 9), parts of Utah offer moderate opportunities for wind power generation. Adjacent to the FORGE lies one of Utah’s largest wind energy projects: the Milford Wind Farm. Initially developed by First Wind, the Milford Wind Farm was constructed in two phases. Phase 1, completed between 2008 and 2009, has a posted capacity of 204 megawatts and features 97 wind turbines. Phase 2, which was constructed from 2010 to 2011, added another 68 turbines, bringing the total capacity to 102 megawatts. Combined, the Milford Wind Farm contributes 306 megawatts of electricity to the grid, making it one of the largest wind projects in the state. Milford Wind Farm is now owned and operated by Longroad Energy.
Solar Farms
Solar power has emerged as a significant player in Utah’s renewable energy sector (Quiroz and Cameron 2012). This growth is largely due to the development of several solar farms in southwestern Utah, where the region’s high solar irradiance (Figure 10) and vast open spaces provide ideal conditions for photovoltaic energy production.
In 2016, SunEdison and Dominion Energy built three solar projects: the Escalante, Enterprise, and Three Cedars solar farms. These projects are now owned and operated by Clearway Energy.
The Escalante Solar Farm is located adjacent to Milford Wind Farm (Figure 8). The facility consists of three 80-megawatt photovoltaic units, with a total capacity of 240 megawatts. Situated about 60 miles south of the Escalante Solar Farm lies the 80-megawatt Enterprise Solar Farm near Cedar City. The Three Cedars Solar Project is located to the west of Cedar City, and consists of three photovoltaic units with a combined capacity of 190 megawatts.
9 Map showing wind power potential in states and countries of the UAS. Area are classified from least efficient (blue) to most efficient (red) (Source: NOAA, USGS, April 21, 2019).
Figure 10 Map showing horizontal solar irradiance in the USA, highlighting in red colour regions with the highest solar power potential including Utah (Source: NREL, February 22, 2018).
Concluding remarks
Utah is renowned for its iconic red sandstone national parks, but the state is quickly emerging as a frontier for renewable energy innovation. This is particualry evident in the New Energy Corridor located in the Greart Basin of the state. The hydrogen storage, geothermal, wind, and solar power projects in this region tap into the Earth’s renewable energy potential without emitting carbon dioxide. Between 2015 and 2023, Utah’s coal-powered electricity generation decreased from 75% to 46% while utility-scale solar power grew from 0.1% to 11% (US Energy Information Administration 2024). Utah’s remarkable developments in renewable energies appear to enjoy public support as well. A 2023 poll reported 73% supporting solar, 72% wind, 59% geothermal, and 47% nuclear, while 55% opposed coal-fired power plants (Brunner and Ryder 2023).
References
Allis, R., Moore, J., Blackett, B., Gwynn, S., Kirby, S., and Sprinkel, D. [2011]. The potential for basin-centered geothermal resources in the Great Basin. Geothermal Research Council Transactions, 35, 683-688.
Brunner, E., and Ryder, S. [2023]. Utahns Strongly Support Renewable Energy Sources Such as Solar and Wind. Utah State University, Utah People and Environmental Poll, Research Brief No. 20233 Cornwall, W. and Larson, E. [2022]. Catching fire. Science, 377(6603), 252-255.
Ellis, G.S. [2023]. The Potential for Geologic Hydrogen for Next-Generation Energy. U.S. Geological Survey. https://www.usgs.gov/news/ featured-story/potential-geologic-hydrogen-next-generation-energy
Epelle, E.I., Obande, W., Udourioh, G.A., Afolabi, I.C., Desongu, K.S., Orivri, U., Gunes, B. and Okolie, J.A. [2022]. Perspectives and prospects of underground hydrogen storage and natural hydrogen. Sustainable Energy & Fuels, 6(14), 3324-3343.
Gençer, E. [2024]. Hydrogen. MIT Climate Portal, Cambridge, MA, USA. https://climate.mit.edu/explainers/hydrogen
Heimgartner, M., Louie, J., Scott, J., Thelen, W., Lopez, C. and Coolbaugh, M. [2006]. The crustal thickness of the Great Basin: Using seismic refraction to assess regional geothermal potential. Geothermal Resources Council Transactions, 30, 1-8.
Karplus, V.J. and Morgan, M.G. [2024]. Moving beyond hype on hydrogen. Issues in Science and Technology Summer 2024, 83-87.
Mclennan, J., Moore, J. and England, K. [2024]. Drilling, Fracturing, and Characterizing Enhanced Geothermal Systems. CEP, American Institute for Chemical Engineers, 8 (June), 1-8.
Moore, J. and Simmons, S.F. [2013]. More power from below. Science, 340(6135), 933-934.
Quiroz, J.E. and Cameron, C.P. [2012]. Technical analysis of prospective photovoltaic systems in Utah (No. SAND2012-1366). Sandia National Laboratories (SNL), Albuquerque, NM, and Livermore, CA.
Sorkhabi, R. [2018]. A history of the petroleum industry in Utah. OilIndustry History, 19, 15-38.
Stein, C.A. [1995]. Heat Flow of the Earth. Global Earth Physics: A Handbook of Physical Constants, 1, 144-158.
US Energy Information Administration [2024]. Utah State Energy Profile. https://www.eia.gov/state/print.php?sid=UT
Vanden Berg, M.D. [2016]. Utah’s Energy Landscape 4th Edition. Utah Geological Survey Circular 121, Salt Lake City.
Accelerated regional stratigraphic framework building for subsurface CO2 storage assessment
Sougata Halder1*, Keyla Gonzalez1, Alex Fick1, Vi Ly1, Ben Lasscock1, Zoltan Sylvester 2 and Cameron Snow3 present a novel workflow for developing a basin-scale stratigraphic architecture for defining the major saline reservoirs and sealing units within a basin.
Introduction
Carbon Capture and Storage (CCS) is a proven and safe technology that involves capturing (purifying) carbon dioxide (CO2) released from point emission sources or directly removed from the atmosphere, compressing it for transportation and then injecting it into a carefully selected subsurface reservoir for permanent storage. The success of CO2 storage relies heavily on the identification and characterisation of suitable subsurface reservoirs for secure and permanent storage. Geologic formations, whether they are depleted hydrocarbon or deep saline reservoirs, present unique challenges and opportunities for CO2 storage. The advantages of saline reservoirs over depleted hydrocarbon reservoirs include potential access to a large volume of available pore space, and a smaller number of well penetrations, which results in reduced risks of potential leakage pathways through these wells. However, the lack of comprehensive reservoir data in saline reservoirs increases uncertainty in defining reservoir confinement, cap rock integrity, and fluid flow behaviour. Therefore, saline reservoir storage assessment requires comprehensive reservoir characterisation and modelling to be carried out before large-scale CO2 storage planning is possible.
Some important parameters to consider for subsurface CO2 storage are depth of injection and density of CO2, which is dependent on subsurface temperature and pressure. The density
of CO2 increases with pressure at temperatures above critical conditions (Klins and Bardon, 1991). At about 1084 psi pressure and 88°F temperature, CO2 reaches a supercritical state (Qi et al., 2010), after which the volume decreases dramatically with depth, along with the increase in CO2 density. These conditions generally correspond to a depth of around 2600 to 3000 ft. In a supercritical state, CO2 acts as a gas-like compressible fluid, resulting in complete pore volume utilisation and mobility within a reservoir (Ketzer et al., 2012), with a liquid-like density. The main advantage of storing CO2 in a supercritical state is that the required storage volume is substantially less than what it would be at surface conditions (Donaldson, 2021).
Most of the onshore and offshore sedimentary basins in North America have sufficient data for subsurface evaluation to identify regional fairways for CO2 storage. Integration of geological, geophysical, and petrophysical assessment from the well log data helps in evaluating deep saline reservoir zones for their storage suitability. The initial step in any subsurface assessment is to accurately map the geological units at the well level. This involves correlating these units along strike and dip-oriented sections to understand their distribution and variability across the basin. Building a basin-scale stratigraphic framework by correlating a large number of geophysical well logs is a crucial but labour-intensive process. This task is especially challenging
1 TGS | 2 University of Texas at Austin | 3 Danomics
* Corresponding author, E-mail: Sougata.Halder@tgs.com DOI: 10.3997/1365-2397.fb2024089
Figure 2 Storage assessment workflow with the dashed-line-box highlighting the focus of this study, the saline reservoir definition.
when dealing with dense well-log datasets, such as those found in many US onshore basins. This calls for the development of an automated approach (Shaw and Cubitt, 1979, Wu and Nyland, 1987) that is scalable and reproducible across various basins. Earlier attempts to use computers for well log cross correlation algorithms used time equivalent sample pairs (Mann & Dowell, 1978; Rudman & Lankston, 1973). Currently, the Dynamic Time Warping (DTW) algorithm is widely used for these purposes, due to its ability to better handle log variabilities (Baville et al., 2022, Grant et al., 2018, Hladil et al., 2010; Wu et al., 2018; Zoraster et al., 2004, Sylvester, 2023).
Building on these foundations, we present a novel workflow for developing a basin-scale stratigraphic architecture for defining the major saline reservoirs and sealing units within a basin. With a sample size of 155,732 subsurface logs from Gulf Coast basin, we demonstrate a comprehensive interactive workflow developed for large-scale regional stratigraphic mapping, providing a basinwide database of well tops for the subsurface geologic units that is required for subsequent reservoir characterisation. Our semi-automated, user-guided workflow enhances the efficiency of the regional stratigraphic mapping significantly and can be scaled up to any other basin.
Study Area
The study area extends across 53 million acres of southern US Gulf Coast of Texas and Louisiana that includes onshore coastal areas and the state waters, including the recent CCS lease areas from the Texas General Land Office (GLO), (Figure 1). Presence of numerous local point emission sources of CO2, with availability of nearby storage opportunities, and existing infrastructure makes the US Gulf Coast an attractive area for subsurface CO2 storage. The availability of an extensive dataset of 155,732 wells
in the study area allows ample opportunity for mapping and characterisation of the key geologic units for subsurface CO2 storage.
Data and methodology
Our subsurface CO2 storage assessment workflow begins with saline reservoir definition, which includes identification of the key saline reservoir and sealing units and map their distribution within the study area, which is the focus of this paper. This is subsequently followed by the petrophysical characterisation of these geologic units for their storage suitability assessment. Figure 2 outlines our CO2 storage assessment workflow, with the saline reservoir definition highlighted to emphasise the focus of this study.
Regional mapping of the subsurface storage and sealing units and defining the depth, thickness of each of these units and mapping their lateral continuity, and variability along the basin is not a trivial task. Manual attempts for basin-scale well log correlation lack the vertical resolution to adequately define individual saline reservoirs and their regional and intra-formational sealing units. Furthermore, incomplete log coverage from the surface to the base of the wellbore in most well locations limits our ability to generate a comprehensive, high-resolution stratigraphic framework for a basin. Our semi-automated workflow allows efficient regional well log correlation and quality control, providing the highest stratigraphic resolution across the basin for identification and mapping of the key geologic units within a basin.
Regional stratigraphic mapping
The first step in our storage assessment workflow is to map the regional geologic units across the study area. We employed a cloud-based web application, which provides integrated data management and facilitates easy visualisation and interactive mapping of the regional geologic units. We used an extensive well-log database, for interpretation and training a machine learning-generated model, Analytics Ready LAS (ARLAS) (Gonzalez et al., 2023), to predict missing logs and/or log intervals within the Gulf Coast area. This approach provides a comprehensive basin-scale database of quad combo log data (actual and imputed) for every well and allows geologists to interpret on any of the logs, inferred or actual. This well-log database is integrated into the cloud-based application with interactive tools for stratigraphic interpretation.
The application enables interpreters to view and interpret data from 155,732 digitised well-logs and ARLAS predictions by annotating cross-sectional views of the basin. An interpreter can visualise up to 1500 wells in a cross-section, with consistent colour-coded log signals. This facilitates identifying and mapping of the major depositional units and allows rapid interpretation of the formation tops with both depth and regional context (Figure 3). This methodology is systematically applied to create strikeand dip-oriented line of sections across the basin, which forms the basis for a basin wide stratigraphic correlation.
The application also allows quality control of the interpreted sections, through interactive selection of log curves from the line of section and manual well top adjustments for quality assurance (Figure 4). The interpreted well top picks from this regional interactive interpretation tool were then exported and incorporated into our standard interpretation software platform Kingdom
Regional cross-sectional view of Spontaneous Potential (SP) logs displaying depositional units for basin-scale mapping. The application enabled interactive interpretation of 12 formation tops across the study area and direct saving of standardised names and cross-section numbers to a cloud database for further quality assurance.
suite, for further quality control through generating structural and isopach maps and iteratively updating the interpreted well tops.
Automated enhancement of stratigraphic picks
The Chronolog python module (Sylvester, 2023) provides automated tools for constructing a high-resolution stratigraphic model from an initial input set of interpreted formation tops that constrains the well-log correlation and extends geological interpretations in between the input set of formations. Chronolog workflow was extended to handle the high volume of well-log and interpreted formation top data (Gonzalez et.al., 2024). To prevent oversampling in regions with adequate data coverage and existing interpretations, we implemented a decimation process. This process allowed the selection of wells from each cross-section, based on a specified distance criterion. We have selected a decimated well set of 43,380 vertical wells from the original database as input to our Chronolog process. Table 1 shows that our study focuses on
155,732 wells in the Gulf Coast area. From there, 102,513 wells have formation tops interpreted from our interactive interpretation platform, and a set of 43,380 wells, selected through a decimation process, had Chronolog tops that were used in our analysis.
We used spontaneous potential (SP) logs in the Chronolog workflow to define unsupervised tops, derived from the stratigraphic framework obtained using the cloud-based application.
wells in Gulf Coast
Wells in Gulf Coast study area with formation tops
Wells with Chronolog tops (selected through decimation process)
Table 1 Well sample size.
First, we constructed well-distance graphs (Figure 5) for each formation to connect proximal wells, facilitating well-to-well correlations. These correlations are conducted using Dynamic Time Warping (DTW) and relative geological time, enabling us to define formation tops at various scales. Understanding the distribution of wells allows us to select suitable distance parameters for representative correlation. Different well networks have been created, based on the spatial distribution of the geologic units within the study area. For instance, Figure 5a (Upper Pliocene Formation) shows that the well network is located only within specific areas of the basin. In contrast, Figure 5b (Frio Formation) reveals dense well coverage across the study area, where a highly connected set of wells is used for the well-to-well correlation. By integrating DTW with relative geological time, we achieve more accurate well-pair relationships and clearer vis-
Figure 5 a) Sparse distribution of wells in the Upper Pliocene Formation. b) Extensive well distribution within the Frio Formation, and a zoomed-in view of an area with dense well distribution.
ualisations of the correlations. Figure 6a showcases these DTW correlations across different formations within the study area, highlighting the distinct SP signal responses. Figure 6b shows a regional cross-section view of the SP logs from the cloud-based interpretation platform, displaying the final set of formation tops, including the unsupervised tops defined between the major hand-picked tops.
To ensure consistency of formation tops across all wells, we employed an iterative method to interpolate any missing tops. This process consists of two main steps: (1) creating an isopach grid between the identified tops and bases, and (2) applying thickness mapping to estimate the missing formation tops (Gonzalez et.al., 2024). In cases where a well log signal is absent, interpreted tops from the interpretation platform are used as control points to guide the interpolator in regions with
Figure 6 (a) Pairwise Dynamic Time Warping (DTW) correlations, illustrating the alignment and comparison of normalised SP log data across various geological formations. (b) Visualisation of the final set of Chronolog tops in the regional cross-section view, along with the major hand-picked tops.
poor coverage. This method ensures that geological features are accurately depicted, avoiding any overlaps and ensuring stratigraphic model continuity.
Petrophysical analysis
The regional mapping of the saline reservoir units is followed by the petrophysical assessment and storage capacity estimation at the well level, currently in progress within the study area. In an assessment of CO2 storage capacity, we need to evaluate the reservoir in much the same manner as with standard oil and gas. However, it does require additional factors such as the irreducible water saturation, residual hydrocarbon saturation, and the reservoir temperature and pressure for evaluating CO2 density.
Figure 7 shows an illustration of the updated petrophysical workflow used for our CO2 storage calculation.
Although the calculations are identical to various interpretations for oil and gas purposes, our usage of them is focused on quantifying the CO2 storage, as shown in Equation 1, modified from Goodman et. al., 2011.
CO2 sc = A * H * Ø * (1 – Swirr – Shc res) * ρCO2 * E,
where, CO2sc= CO2 storage capacity, A= Area, H= Net thickness, φ= Effective Porosity, Swirr= Irreducible water saturation, Shc res= Residual hydrocarbon saturation, ρCO2= CO2 density, E=Efficiency.
Results
The study demonstrates our ability to effectively correlate an expansive, basin-scale well database to define the stratigraphic architecture and delineate the distribution of key geologic units within the basin. We have generated 307,900 formation tops for 102,513 wells within the study area over a three-month timeframe. This was made possible by the combination of the ARLAS, and Chronolog tools, providing a complete and continuous dataset integrated into the interactive interpretation platform for analysis. The dense well distribution enabled precise mapping of structural features within the basin, enhancing our understanding of subsurface geology (Figure 8). We have generated a comprehensive set of interpolated tops, through an iterative process, using thickness/isopach maps, that help to maintain the integrity of the geological model and prevent formation grids from intersecting across unsupervised and interpreted tops. This process ensures that our geological model reflects an accurate and continuous representation of subsurface formations across the basin, providing valuable insights for further analysis and decision-making for subsurface CO2 storage.
Structural distribution and thickness variability of the reservoir units mapped across the study area include Upper and Lower Pliocene, Upper, Middle, and Lower Miocene, Frio, Vicksburg, Upper and Lower Claiborne, Upper, middle and Lower Wilcox,
and Cretaceous. Regional and intra-formational seal units, such as Amph-B shale, Anahuac Shale, and Midway, are also mapped for the purpose of storage integrity assessment. We demonstrate that the prospectivity of the Tertiary section varies significantly across the basin. Regional structure and depositional slopes can be characterised and through extensive mapping, penetrations for stratigraphic surfaces are recognised, allowing for the intelligent subdivision of the basin for petrophysical interpretations. The availability of the expansive well log data, including ARLAS logs and other standardised, pre-processed well data, ensures that our interpretations are based on robust and reliable information, thereby increasing the accuracy and confidence in our saline reservoir definition. These saline reservoir zones are then evaluated for their storage suitability assessment and capacity estimation by generating a basin-wide petrophysical model for the study area.
Figure 9 presents the structure (a) and isopach (b) maps of the Lower Miocene reservoir units, highlighting the variability of reservoir depth and thickness along the basin resulting from the basin architecture. Structural changes impose geologic constraints on the reservoir suitability assessment, highlighting areas with pressure and temperature conditions suitable for CO2 injection. Through extensive mapping, we can characterise the variability of regional structure and depositional slopes. These varying conditions will guide the petrophysical model building for each of the distinct structural settings.
Conclusions
Identifying and mapping CO2 injection units and their regional barriers presents a major challenge in scaling up CO2 storage assessments. Over half of the geoscience effort is dedicated to stratigraphic interpretation when evaluating new basins for saline reservoir suitability. This is largely due to the time- and labour-intensive manual processes involved in well-log correlation and top identification.
Therefore, we introduce an accelerated workflow for basinscale stratigraphic modelling in the US Gulf Coast, leveraging extensive subsurface data, an interactive interpretation workflow, and automation through the ARLAS and Chronolog tools. Our study showcases the effectiveness of interactive visualisation and quality control of the high-frequency Chronolog tops in defining reservoir units and mapping seals across the basin. This methodology condenses up to 1500 well log data into a single section, enabling intuitive interpretation of stratigraphic surfaces. This is crucial for complex basins like the Gulf Coast, where facies variability occurs along both depositional strike and dip direction. By analysing 43,380 well log data, core data, and expert geological and petrophysical interpretations, we have developed a comprehensive regional stratigraphic architecture. This architecture identifies key saline reservoir units, such as the Upper and Lower Pliocene, Miocene, and Frio, and highlights important seals like the Amph-B Shale and Anahuac Shale. This detailed mapping
is vital for assessing storage integrity and supporting successful CO2 storage projects. This integrated approach not only streamlines the stratigraphic interpretation process but also improves the accuracy and efficiency of identifying potential CO2 storage sites. Our continued work involves a petrophysical assessment at the well level, followed by the regional mapping of the key reservoir attributes and estimated storage, which is currently in progress within the study area. Building on the success of our current study, we plan to replicate this workflow across other basins to further validate and refine our methodology. By applying our semi-automated, user-guided process to different geological settings, we aim to assess the adaptability and robustness of our approach in a variety of environments.
References
Baville, P., Apel, M., Hoth, S., Knaust, D., Antoine, C., Carpentier, C. and Caumon, G. [2022]. Computer-assisted Stochastic Multi-well Correlation: Sedimentary Facies Versus Well Distality. Marine And Petroleum Geology, 135, 105371. Https://Doi.Org/10.1016/J. Marpetgeo.2021.10537 .
Donaldson, W.S. [2021]. Carbon Capture And Storage: Criteria For Success Part Ii. Accessed July 2021. https://digest.canadiandiscovery. com/article/8429.
Gonzalez, K., Brusova, O. and Valenciano, A. [2023]. A machine learning workflow for log data prediction at the basin scale. Extended abstracts, SEG Annual Meeting. First Break, 41(2), 73-80. https:// doi.org/10.3997/1365-2397.fb2023015
Gonzalez, K., Sylvester, Z., Valenciano, A. and Lasscock, B. [2024]. From well logs to 3D models: A case study of automated stratigraphic correlation in the Midland Basin. IMAGE 2024 Conference. Retrieved from https://imageevent.aapg.org/portals/26/abstracts/2024/4101544.pdf.
Goodman, A., Hakala, A., Bromhal, G., Deel, D., Rodosta, T., Frailey, S., Small, M., Allen, D., Romanov, V., Fazio, J., Huerta, N., McIntyre, D., Kutchko, B. and Guthrie, G. [2011]. U.S. DOE methodology for the development of geologic storage potential for carbon dioxide at the national and regional scale. International Journal of Greenhouse Gas Control. International Journal of Greenhouse Gas Control, 5, 952-965.
Grant, C.W., Bashore, W.M. and Compton, S. [2018]. Rapid reservoir modeling with automated tops correlation. In Proceedings of the
6th Unconventional Resources Technology Conference. American Association of Petroleum Geologists. https://doi. org/10.15530/ urtec-2018-2904037.
Hladil, J., Vondra, M., Cejchan, P., Vich, R., Koptikova, L. and Slavik, L. [2010]. The dynamic time-warping approach to comparison of magnetic-susceptibility logs and application to lower Devonian calciturbidites (Prague Synform, Bohemian Massif). Geologica Belgica, 13, 385–406.
Ketzer, J.M., Iglesias, R. and Einloft, S. [2012]. Reducing greenhouse gas emissions with CO2 capture and geological storage. In: W.-Y. Chen, J. Seiner, T. Suzuki and M. Lackner (Editors), Handbook of Climate Change Mitigation. Springer US, pp. 1405-1440.
Klins, M. and Bardon, C.P. [1991] Carbon Dioxide Flooding, Institut Francais du Pétrole, 1991.
Mann, C.J. and Dowell, T.P.L. [1978]. Quantitative lithostratigraphic correlation of subsurface sequences. Computers & Geosciences, 4, 295-306. https://doi.org/10.1016/0098-3004(78)90064-X.
Qi, D., Zhang, S. and Su, K. [2010]. Risk assessment of CO2 geological storage and the calculation of storage capacity. Petroleum Science and Technology, 28(10): 979-986.
Rudman, A.J. and Lankston, R.W. [1973]. Stratigraphic correlation of well logs by computer techniques. AAPG Bulletin, 57, 577–588. https:// doi.org/10.1306/819A4306-16C5-11D7-86450 00102C1865D.
Shaw, B.R. and Cubitt, J.M. [1979]. Stratigraphic Correlation of Well Logs: An Automated approach, Geomathematical and Petrophysical Studies in Sedimentology, Pages 127-148. https://doi.org/10.1016/ B978-0-08-023832-6.50017-6.
Sylvester, Z. [2023]. Automated multi-well stratigraphic correlation and model building using relative geologic time. Basin Research, 35, 1961-1984. https://doi.org/DOI: 10.1111/bre.12787.
Wu, Xuanzhi and Nyland, Edo [1987]. Automated stratigraphic interpretation of well-log data. Geophysics, 52, 1665-1676. https://doi. org/10.1190/1.1442283.
Wu, X., Shi, Y., Fomel, S. and Li, F. [2018]. Incremental correlation of multiple well logs following geologically optimal neighbors. Interpretation, 6, T713–T722. https://doi.org/10.1190/ INT-2018-0020.1
Zoraster, S., Paruchuri, R.K. and Darby, S. [2004]. Curve alignment for welltowell log correlation. In SPE Annual Technical Conference and Exhibition, Houston, Texas. SPE. https://doi. org/10.2118/90471-MS.
To serve the interests of our members and the wider multidisciplinary geoscience and engineering community, EAGE publishes a range of books and scientific journals in-house. Our extensive, professional marketing network is used to ensure publications get the attention they deserve.
EAGE is continually seeking submissions for both book publishing and articles for our journals. A dedicated and qualified publishing team is available to support your publication at EAGE.
CALENDAR OF EVENTS
1-4 Oct 18 th SAGA Biennial Conference & Exhibition www.sagaconference.co.za
3-4 Oct Third EAGE Workshop on EOR www.eage.org
3-5 Oct 59 th CEEC Event www.ceecsg.org
6-8 Oct EAGE Workshop on Naturally Fractured Rocks (NFR) www.eage.org
7-9 Oct GeoTerrace 2024 - International Conference of Young Professionals www.eage.org
14-16 Oct Third EAGE Conference on Seismic Inversion www.seismicinversion.org
15-16 Oct EAGE Conference on Energy Excellence: Digital Twins and Predictive Analytics www.eage.org
16-17 Oct Third EAGE Workshop on Advanced Seismic Solutions in the Gulf of Mexico www.eage.org
21-24 Oct GEO 4.0: Digitalization in Geoscience Symposium www.geo4event.com
29-30 Oct EAGE Workshop on Borehole Technologies - Pioneering Sustainable Solutions in Energy www.eage.org
November 2024
3-7 Nov 15 th General Assembly of Asian Seismological Commission www.asc2024.org
4-7 Nov Fifth EAGE Global Energy Transition Conference and Exhibition www.eageget.org
EAGE Carbon Capture and Storage Conference
Part of GET 2024 (Fifth EAGE Global Energy Transition Conference and Exhibition)
EAGE Geothermal Energy Conference
Part of GET 2024 (Fifth EAGE Global Energy Transition Conference and Exhibition)
EAGE Hydrogen and Energy Storage Conference
Part of GET 2024 (Fifth EAGE Global Energy Transition Conference and Exhibition)
EAGE Offshore Wind Energy Conference
Part of GET 2024 (Fifth EAGE Global Energy Transition Conference and Exhibition)
6-8 Nov First EAGE Conference on Energy Opportunities in the Caribbean www.eage.org Port of Spain Trinidad & Tobago
12-13 Nov 2 nd EAGE Workshop on Integrated Subsurface Characterization and Modeling www.eage.org
Kuala Lumpur Malaysia
14-16 Nov GEOSCIENCE International Symposium www.geosymposium.org Bucharest Romania
20-21 Nov Asia Petroleum Geoscience Conference and Exhibition (APGCE) icep.com.my/apgce
25-27 Nov First EAGE/SBGf Conference on The Roadmap to Low Carbon Emissions in Brazil www.eage.org
December 2024
3-5 Dec First EAGE Symposium on Geosciences for New Energies in America www.eagenewenergies.org
EAGE Workshop on Near Surface Geoscience & Mineral Exploration in Latin America Part of First EAGE Symposium on Geosciences for New Energies in America
EAGE Workshop on Geothermal Energy in Latin America
Part of First EAGE Symposium on Geosciences for New Energies in America
EAGE Workshop on Water Footprint
Part of First EAGE Symposium on Geosciences for New Energies in America
3-5 Dec 3 rd SEG/EAGE Workshop on Geophysical Aspects of Smart Cities www.eage.org
February 2025
3-4 Feb EAGE Workshop on Carbon Capture and Storage (CCS) in Basalts www.eage.org
Kuala Lumpur Malaysia
17-19 Feb EGYPES 2025 www.egypes.com Cairo Egypt
18-20 Feb International Petroleum Technology Conference (IPTC) 2025 www.iptcnet.org Kuala Lumpur Malaysia
20-21 Feb GeoTHERM Expo & Congress 2025 www.geotherm-offenburg.de/en Offenburg Germany
27-28 Feb First EAGE Workshop on the Triassic and Jurassic Plays in Northwest Europe www.eage.org Sunbury United Kingdom
March 2025
19-21 Mar 2 nd AAPG/EAGE Papua New Guinea Petroleum Geoscience Conference & Exhibition

CALENDAR OF EVENTS
The Middle East Oil, Gas and Geosciences Show (MEOS GEO) www.meos-geo.com
22-24 Sep Sixth EAGE Borehole Geology Workshop www.eage.org
23-24 Sep EAGE Workshop on Optimizing Upstream Excellence for Oil and Gas Success www.eage.org
23-24 Sep First EAGE Workshop on Geophysical Techniques for Monitoring CO2 Storage www.eage.org
29 Sep1 Oct Second AAPG/ EAGE Mediterranean and North African Conference (MEDiNA) medinace.aapg.org
29 Sep1 Oct Eighth EAGE Borehole Geophysics Workshop www.eage.org
October 2025 Oct Ninth EAGE High Performance Computing Workshop www.eage.org
8-9 Oct First EAGE Workshop on Fiber Optics Sensing www.eage.org
21-23 Oct Second EAGE Conference on Offshore Energy Resources in the South Atlantic www.eage.org
November 2025
3-5 Nov EAGE/AAPG Workshop on Tectonostratigraphy of the Arabian Plate: Structural Evolution of the Arabian Basins www.eage.org

CONFERENCE AND EXHIBITION
CHECK
DATA MANAGEMENT
ENHANCING PREDICTIONS & INVESTMENTS WITH DIGITAL TECHNOLOGIES
BUSINESS PROCESSES AND OBJECTIVES
MODELS, ALGORITHMS & NEW DEVELOPMENTS
ADVANCED TECHNOLOGIES
SUSTAINABILITY AND NEW ENERGY APPLICATIONS
SUBMIT YOUR ABSTRACT
SUBMISSION DEADLINE: 24 DECEMBER 2024