SPECIAL TOPIC

SPECIAL TOPIC
EAGE NEWS Association reveals short courses for Annual INDUSTRY NEWS UK’s first CCUS projects move ahead
TECHNICAL ARTICLE Volumetric assessment of resources in Brazil’s Parnaíba Basin


CHAIR EDITORIAL BOARD
Clément Kostov (cvkostov@icloud.com)
EDITOR
Damian Arnold (arnolddamian@googlemail.com)
MEMBERS, EDITORIAL BOARD
• Lodve Berre, Norwegian University of Science and Technology (lodve.berre@ntnu.no)
Philippe Caprioli, SLB (caprioli0@slb.com) Satinder Chopra, SamiGeo (satinder.chopra@samigeo.com)
• Anthony Day, TGS (anthony.day@tgs.com)
• Peter Dromgoole, Retired Geophysicist (peterdromgoole@gmail.com)
• Kara English, University College Dublin (kara.english@ucd.ie)
• Stephen Hallinan, Viridien (Stephen.Hallinan@viridiengroup.com)
• Hamidreza Hamdi, University of Calgary (hhamdi@ucalgary.ca)
Fabio Marco Miotti, Baker Hughes (fabiomarco.miotti@bakerhughes.com)
Susanne Rentsch-Smith, Shearwater (srentsch@shearwatergeo.com)
• Martin Riviere, Retired Geophysicist (martinriviere@btinternet.com)
• Angelika-Maria Wulff, Consultant (gp.awulff@gmail.com)
EAGE EDITOR EMERITUS Andrew McBarnet (andrew@andrewmcbarnet.com)
PUBLICATIONS MANAGER Hang Pham (publications@eage.org)
MEDIA PRODUCTION
Saskia Nota (firstbreakproduction@eage.org) Ivana Geurts (firstbreakproduction@eage.org)
ADVERTISING INQUIRIES corporaterelations@eage.org
EAGE EUROPE OFFICE
Kosterijland 48 3981 AJ Bunnik
The Netherlands
• +31 88 995 5055
• eage@eage.org
• www.eage.org
EAGE MIDDLE EAST OFFICE
EAGE Middle East FZ-LLC
Dubai Knowledge Village PO Box 501711
Dubai, United Arab Emirates
• +971 4 369 3897
• middle_east@eage.org www.eage.org
EAGE ASIA PACIFIC OFFICE
EAGE Asia Pacific Sdn. Bhd.
UOA Centre Office Suite 19-15-3A No. 19, Jalan Pinang
50450 Kuala Lumpur
Malaysia +60 3 272 201 40
• asiapacific@eage.org
• www.eage.org
EAGE LATIN AMERICA OFFICE
EAGE Americas SAS Av. 19 #114-65 - Office 205 Bogotá, Colombia
• +57 310 8610709
• americas@eage.org
• www.eage.org
EAGE MEMBERS’ CHANGE OF ADDRESS
Update via your MyEAGE account, or contact the EAGE Membership Dept at membership@eage.org
FIRST BREAK ON THE WEB www.firstbreak.org
ISSN 0263-5046 (print) / ISSN 1365-2397 (online)
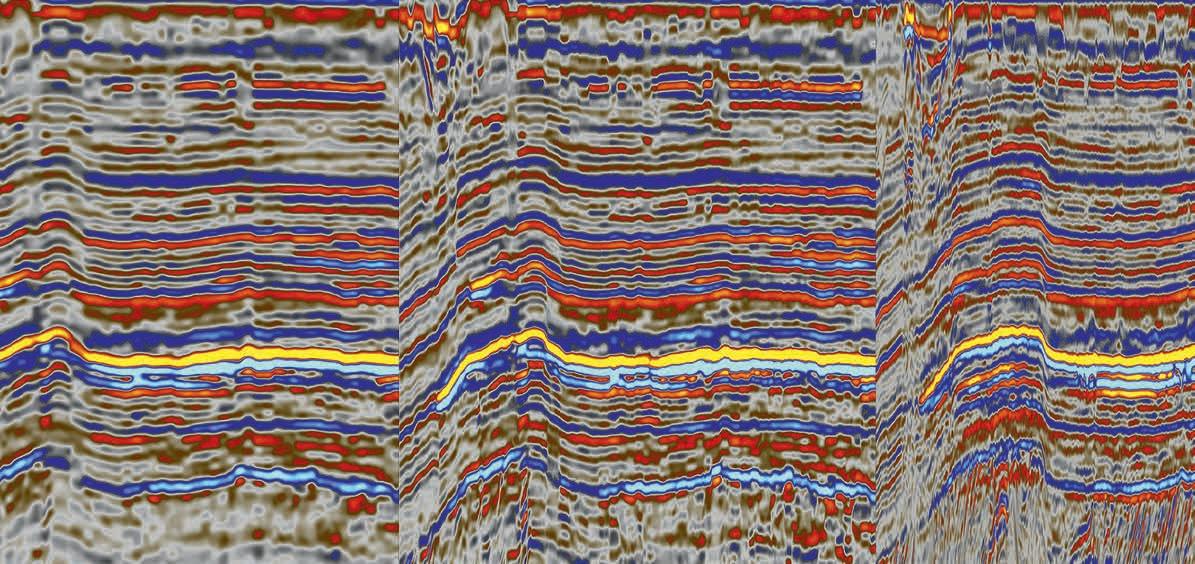
‘Pseudo3D’,
27 Volumetric potential assessment of prospective resources of Devonian and Carboniferous plays in the Parnaíba Basin
C.M. Carvalho, K.S. d’Almeida and P.V. Zalán
35 Legacy insights to modern CCS evaluation: An integrated approach to optimising subsurface suitability analysis
Mike Powney, Jeniffer Masi, Theresia Citraningtyas, Behzad Alaei, Sharon Cornelius, Felix Dias and Pete Emmet
43 Cloud-free question answering from internal knowledge bases: Building an AI for drilling applications
Sergey Alyaev, Liang Zhang Felix James Pacis and Tomasz Wiktorski
51 Revolutionising subsurface evaluation with advanced core digitalisation
Christophe Germay, Tanguy Lhomme and Jenny Omma
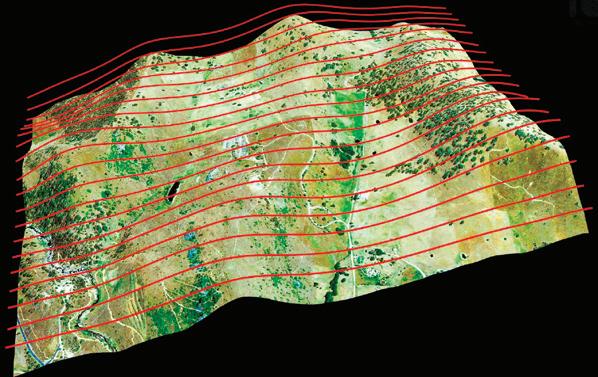
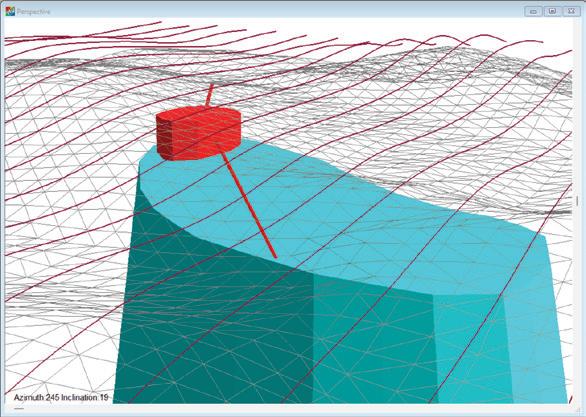
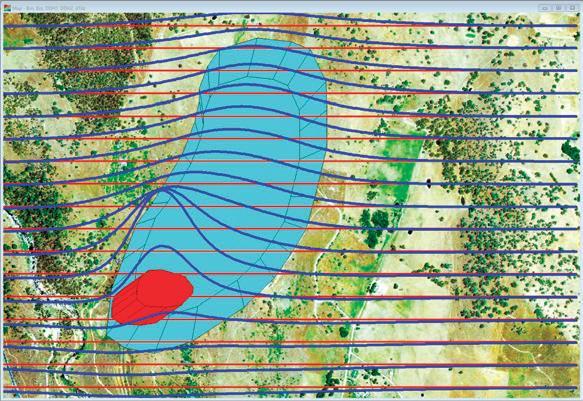
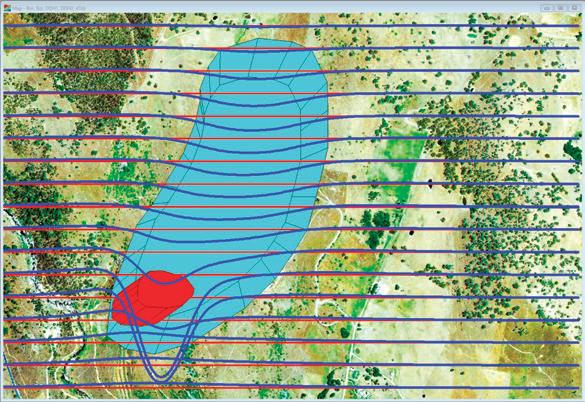
59 ‘Pseudo3D’, a post-stack approach to transforming 2D seismic into 3D D. Markus, K. Rimaila, P. de Groot, and R. Muammar
63 Advancing drilling safety and efficiency: Automated shale shaker and borehole instability monitoring with AI and computer vision
Mario Ruggiero and Ivo Colombo
69 Scaling seismic foundation models
Altay Sansal, Ben Lasscock and Alejandro Valenciano
75 Empowering subsurface experts: Seamless integration of research and data into Petrel workflows with advanced Python tools
Julie Vonnet, Vlad Rotar and James Goldwater
81 Fully automated seismic horizons and surfaces detection
Norman Mark
Features
87 Discussion of paper on the theory of wavefield sampling by Goodway et al. (2024) Gijs J.O. Vermeer
92 The authors of Land 3D acquisition design: Theory of wavefield sampling. Part 1 and 2. Andrea Crook, Bill Goodway, Mostafa Naghizadeh, Michael Hons and Cameron Crook
94 Calendar
cover: Ikon Science’s artist’s impression of the digitally enhanced geoscientist. This month we explore innovations in machine learning and artificial intelligence.


Andreas Aspmo Pfaffhuber Chair
Florina Tuluca Vice-Chair
Esther Bloem Immediate Past Chair
Micki Allen Contact Officer EEGS/North America
Hongzhu Cai Liaison China
Deyan Draganov Technical Programme Officer
Eduardo Rodrigues Liaison First Break
Hamdan Ali Hamdan Liaison Middle East
Vladimir Ignatev Liaison CIS / North America
Musa Manzi Liaison Africa
Myrto Papadopoulou Young Professional Liaison
Catherine Truffert Industry Liaison
Mark Vardy Editor-in-Chief Near Surface Geophysics
Yohaney Gomez Galarza Chair
Johannes Wendebourg Vice-Chair
Lucy Slater Immediate Past Chair
Wiebke Athmer Member
Alireza Malehmir Editor-in-Chief Geophysical Prospecting
Adeline Parent Member
Jonathan Redfern Editor-in-Chief Petroleum Geoscience
Xavier Troussaut EAGE Observer at SPE-OGRC
Robert Tugume Member
Timothy Tylor-Jones Committee Member
Anke Wendt Member
Martin Widmaier Technical Programme Officer
Carla Martín-Clavé Chair
Giovanni Sosio Vice-Chair
SUBSCRIPTIONS
First Break is published monthly. It is free to EAGE members. The membership fee of EAGE is € 80.00 a year including First Break, EarthDoc (EAGE’s geoscience database), Learning Geoscience (EAGE’s Education website) and online access to a scientific journal.
Companies can subscribe to First Break via an institutional subscription. Every subscription includes a monthly hard copy and online access to the full First Break archive for the requested number of online users.
Orders for current subscriptions and back issues should be sent to First Break B.V., Journal Subscriptions, Kosterijland 48, 3981 AJ Bunnik, The Netherlands. Tel: +31 (0)88 9955055, E-mail: subscriptions@eage.org, www.firstbreak.org.
First Break is published by First Break B.V., The Netherlands. However, responsibility for the opinions given and the statements made rests with the authors.
COPYRIGHT & PHOTOCOPYING © 2025 EAGE
All rights reserved. First Break or any part thereof may not be reproduced, stored in a retrieval system, or transcribed in any form or by any means, electronically or mechanically, including photocopying and recording, without the prior written permission of the publisher.
The publisher’s policy is to use acid-free permanent paper (TCF), to the draft standard ISO/DIS/9706, made from sustainable forests using chlorine-free pulp (Nordic-Swan standard).

The EAGE Annual 2025 is set to deliver an exceptional lineup of short courses designed to equip geoscientists and energy professionals with the latest insights and practical skills. The courses cover a diverse range of topics, from seismic processing to hydrogen storage and public engagement, offering participants the opportunity to learn from world-renowned experts.
Compressive sensing, explained and challenged — Sunday, 1 June 2025
Jan de Bruin (JdB VitalSeis) takes an objective look at the promises and limitations of compressive sensing (CS). Participants will gain a grounded understanding of what works, what doesn’t, and how to make informed decisions about implementing CS in practical scenarios. Attendees will earn five CPD points.
Reservoir engineering for hydrogen storage in subsurface porous media — Sunday, 1 June 2025
Gang Wang (Heriot-Watt University) focuses on hydrogen storage in subsurface porous media, exploring the hydrogen value chain, policy, and economic considerations, equipping attendees with insights into one of the key pillars of the energy

transition. Participants will earn five CPD points.
A guided tour of seismic processing of multiples; concepts, applications, trends — Monday, 2 June 2025
Clément Kostov provides an in-depth overview of seismic data processing related to multiples, including adaptive subtraction methods, case studies, and emerging trends. Attendees will earn five CPD points.
Geoscience communication and public engagement — Monday, 2 June 2025
Iain Stewart (University of Plymouth/ Royal Scientific Society of Jordan) offers hands-on experience in crafting impactful messages to bridge the gap between
science and public understanding. Participants will earn five CPD points.
State of the art in full waveform inversion (FWI) — Friday, 6 June 2025
Ian F. Jones explores the principles, methodologies, and applications of FWI, including model estimation, reflectivity generation, and pre-stack attribute analysis, enriched with real-world data examples. Attendees will earn five CPD points.
Don’t miss the chance to enhance your expertise, gain valuable CPD points, and connect with industry leaders. Register now and be part of the future of geoscience and engineering at EAGE Annual 2025!
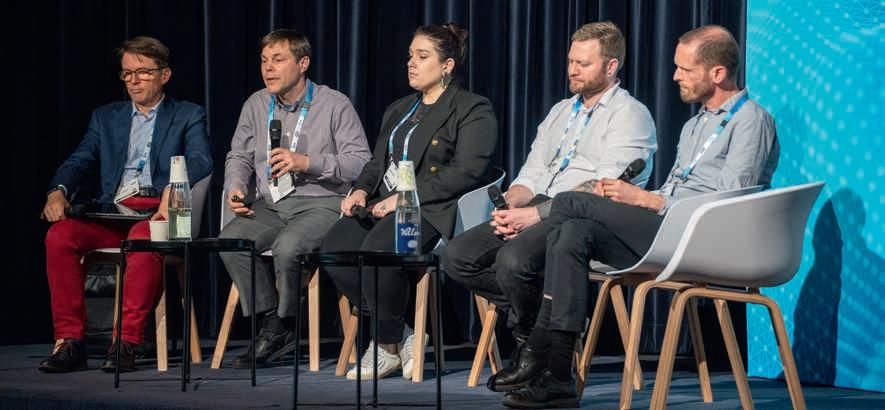
Time to prepare for the Fifth EAGE Digitalization Conference and Exhibition next month on 24-26 March 2025, in Edinburgh, Scotland featuring a major strategic programme of panel discussions exploring three critical themes: the accuracy and value of reliable predictions, the dynamics of innovation cycles in response to shifting priorities, and the integral role of data, technology, and standardisation in boosting predictive capabilities and enhancing investment decisions. Here’s what each day has in store:
Has digital technology made our business more reliable and predictable?
Exploration of how digital advancements are shaping predictions in the oil and gas sector, assessing the impact on investment decisions and forecasting accuracy.
How does the industry demonstrate value from their digital tools?
A review of the past decade’s increase in digital investment, exploring how it has tangibly benefited business efficiency, revenue, and overall success.
How does the energy sector invest wisely in the digital technology stack?
Resource allocation across the technological spectrum will be discussed.
AI value creation: Where are we today and where are we heading?
Current achievements and the future potential of AI in the oil and gas sector will be topic highlight.
What are we learning as we go through the GenAI hype cycle?
Analysis of the evolution of GenAI within the industry, its practical challenges, and the potential for new business models driven by AI.
AI accelerating exploration
Focus on the integration of AI in exploration processes, evaluating its successes, limitations, and areas of most significant potential.
Keeping good ideas moving:
Managing a digital vision through the good times, and the bad
Strategies for maintaining a long-term digital vision, managing through economic cycles and technological changes.
Digital for new energies (faster and cheaper)
How digital innovations are making renewable energy more efficient and reliable, discussing impacts on sustainability and business models.
How can industry realise the benefits of OSDU, and is it guaranteed to succeed?
The benefits and challenges of adopting OSDU standards to enhance data interoperability and analytics in the industry.
Balancing exciting possibilities vs realistic implementations
Use of open source and low-code platforms, focusing on balancing innovation with compliance, security, and business alignment.
How to generate the pull?
Increasing readiness for the next technology
Strategies for improving user engagement with new digital tools and methods, and managing the transition effectively.
The dilemma of the technology manager — how do we balance cloud, on-premise solutions given the different perspectives?
Strategic decisions between using cloud services versus on-premise solutions, tailored to enhance organisational efficiency and cost-effectiveness.
Each session in the strategic programme is designed to prompt in-depth discussion and exchange among experts, aiming to enrich understanding of how digitalization influences the future of energy.
Should you wish to engage in these crucial conversations, reach out to us at europe@eage.org for opportunities to speak. To enjoy discounted registration rates, make sure to sign up at www.eagedigital.org by 10 February.

DUG Elastic MP-FWI Imaging solves for reflectivity, Vp, Vs, P-impedance, S-impedance and density. It delivers not only another step change in imaging quality, but also elastic rock properties for quantitative interpretation and prestack amplitude analysis — directly from field-data input. A complete replacement for traditional processing and imaging workflows - no longer a stretch!
info@dug.com | dug.com/fwi
13-14
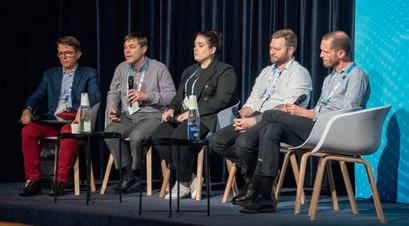
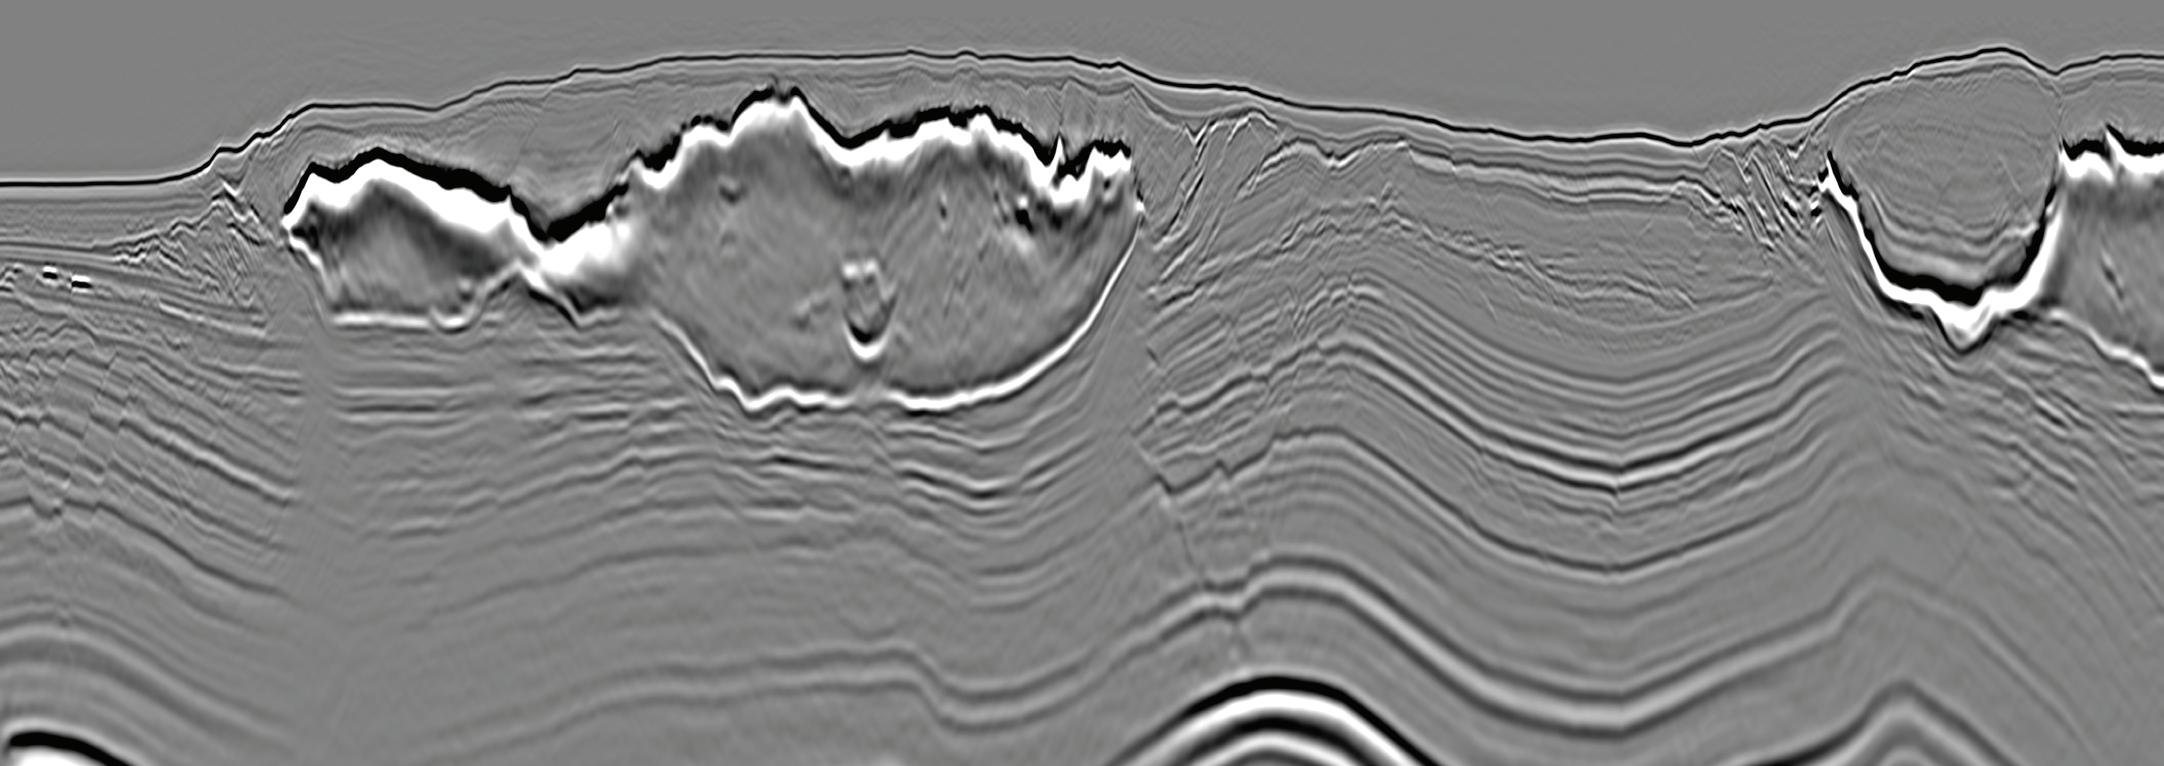
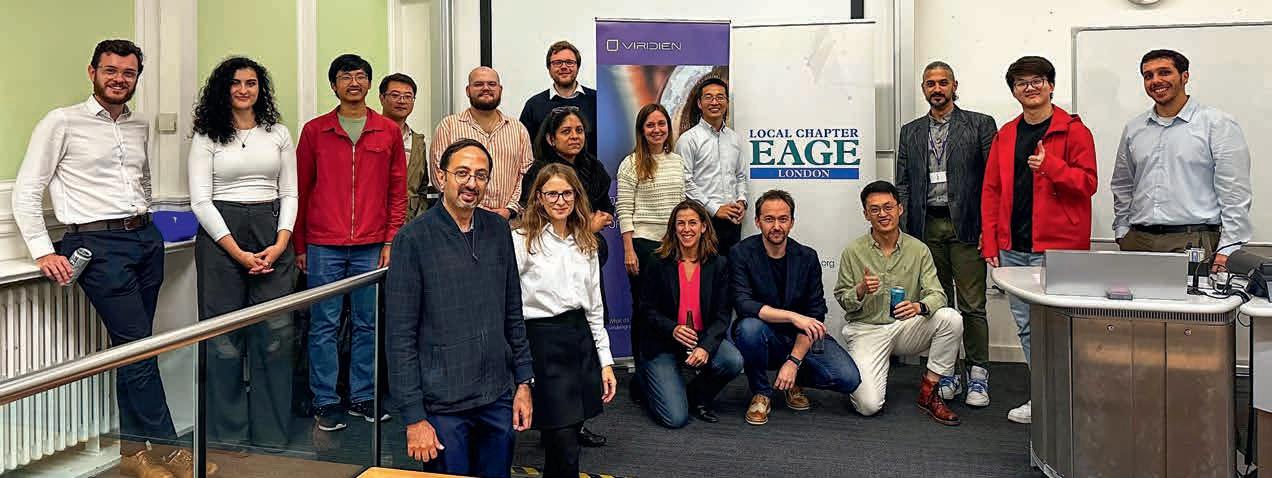
EAGE London Local Chapter community met in September for a lecture given by Kunpeng (KP) Liao from Viridien, an expert in the emerging technology of distributed acoustic sensing (DAS) technology.
He showcased how fibre optic cables have the potential to provide 4D reservoir monitoring and overburden
cessing and interpretation has attracted significant attention in recent years for understanding well conditions and for continuous monitoring. Application of DAS for time-lapse until now lacked robust field testing, did not have confirmation with conventional seismic data or was based only on synthetic testing or modelling.
by the Ocean Bottom Node (OBN) seismic data acquired in the area by permanent reservoir monitoring (PRM) system and conveniently used in this case for benchmarking.
Liao outlined the capability of 3D DAS data for extensive overburden imaging using the down-going wavefield, supported with high quali-
imaging, and with clear learnings about future affordable monitoring technology for Carbon Capture and Storage (CCS) for the energy transition.
Acquiring low-cost seismic data using DAS, coupled with data streaming solutions and advanced imaging algorithms allowing for real-time pro-
In his lecture, Liao showed probably the first proven example of real 4D signals recorded by DAS field data. He explained to the audience the nature of DAS-VSP 4D acquisition, the 4D processing challenges and ultimately showed a comparison of the DAS 4D signals with those obtained
ty data examples. This is another key element for monitoring in CCS.
The presentation was followed by an animated Q&A session exchanging further ideas and expertise in the utilisation of DAS and future developments in time-lapse monitoring.


DIEGO ROVETTA
EAGE Membership & Cooperation Officer
We are incredibly proud of the outreach carried out by our Local and Student Chapters worldwide, connecting new members every day. To further energize their work, we have decided to challenge them into a competition called EAGE Champions . Running through March, this friendly contest encourages Chapters to grow by engaging the community in their area, and I am looking forward to congratulating the four champions”. Your network. Your strength. Being part of EAGE means access to a global community that supports your growth and success. BE PART OF SOMETHING BIGGER STUDENTS CAN APPLY FOR THEIR FIRST YEAR OF MEMBERSHIP FOR FREE (RE)ACTIVATE YOUR MEMBERSHIP TODAY!
LOCAL CHAPTERS 29 STUDENT CHAPTERS 45


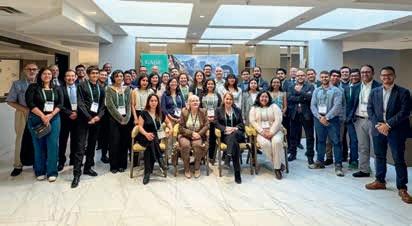
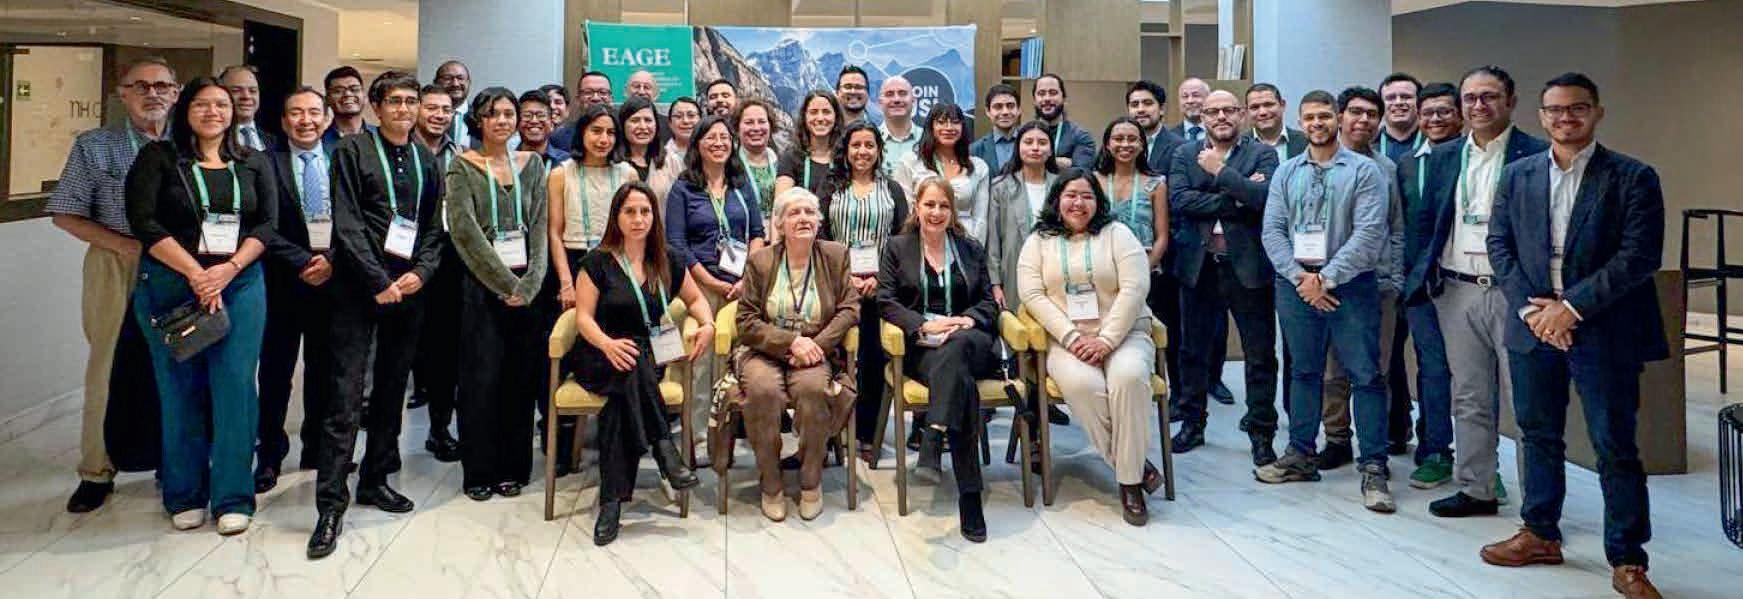
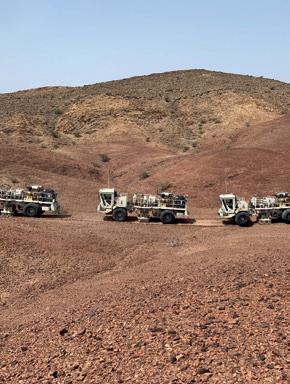
EAGE’s Symposium and Exhibition on Geosciences for New Energies in America was held at Centro Historico in Mexico City on 3-5 December, 2024 addressing geothermal energy, CCS, water management (with a focus on water footprint), and the pivotal role of mineral exploration in driving the energy transition. These are some impressions from a student perspective.
This was an exceptional gathering of industry leaders, professionals, researchers and companies at the forefront of near surface geoscience and mineral exploration in Latin America. It provided an unparalleled opportunity to engage directly with the latest advancements and applications in the rapidly evolving fields relevant to energy transition along with reflections on water resource management.
The participation of renowned companies such as Geotem, GEODEVICE, STRYDE, and Mujeres WIM, along with organisations like the Asociación Geotermica Mexicana and AGEOCOL, highlighted the critical role that industry plays in advancing these sectors.

Some key takeaways
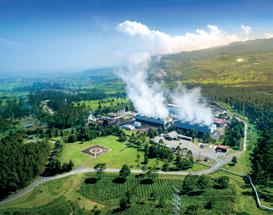
Located in the Pacific Ring of Fire, Mexico possesses significant geothermal resources, including notable fields such as Los Azufres, Los Humeros, and Cerro Prieto. However, the development of geothermal energy has been slow, primarily due to the absence of a specific legal framework. Although the 2014 Geothermal Energy Law was a step forward, it remains insufficient in fully addressing the sector’s needs. As a result, geothermal projects are often subject to broader regulations meant for mining or hydrocarbons, leading to bureaucratic challenges that hinder investment. The symposium highlighted the necessity of creating a tailored legal framework and introducing financial incentives to foster the growth of the geothermal sector in Mexico.
Discussions covered detecting geological structures in the geothermal fields of the region, geothermal assessment of the Mexican central intraplate volcanism province using neural networks, and an on-going project to create a preliminary heat generation map of Mexico.
Recognising the challenges facing geothermal implementation, solutions like vertical seismic profiling for reducing risk in large-scale geothermal urban applications and different exploration practices to promote social acceptance of geothermal projects in Mexico were discussed. The environmental impact implications of converting abandoned oil wells in Southeast Mexico was mentioned along with potential lithium extraction in the Bolivian salt flats. approaches to achieve more precise and effective results.
It was useful to discuss geothermal applications beyond electricity generation, such as direct heating and industrial uses,


broadening its scope as a strategic energy resource. Regarding mineral exploration, geophysics applies to submarine environments opening new frontiers in resource utilisation in hard-to-reach areas. This approach highlighted the importance of technological innovation and the development of specific methodologies for these complex settings.
Collaboration between the oil and mining industries also emerged as an essential component to enhance exploration and the development of strategic minerals. This point provided inspiration to explore how these areas can align with our academic and professional goals, reinforcing the importance of geosciences in transitioning to a more sustainable future.
The symposium offered a unique platform to foster collaboration between students, industry leaders, and organisations like EAGE serving as a bridge between academic knowledge with realworld applications, ensuring that the next generation of geoscientists is well prepared to address current and future challenges.
With the support of the EAGE Student Fund, 11 students from the EAGE Student Chapter UNAM and IPN Mexico had the opportunity to attend this event. They engaged directly with industry leaders and explored the latest advancements, research, and initiatives in the field.

Basin Research (BR) is an international journal which aims to publish original, high impact research papers on sedimentary basin systems. A new edition (Volume 37, Issue 1) will be published in February.
Geophysical Prospecting (GP) publishes primary research on the science of geophysics as it applies to the exploration, evaluation and extraction of earth resources. Drawing heavily on contributions from researchers in the oil and mineral exploration industries, the journal has a very practical slant. A new edition (Volume 73, Issue 2) will be published in February.
Near Surface Geophysics (NSG) is an international journal for the publication of research and developments in geophysics applied to the near surface. The emphasis lies on shallow land and marine geophysical investigations addressing challenges in various geoscientific fields. A new edition (Volume 23, Issue 1) will be published in February, featuring 6 articles.
Petroleum Geoscience (PG) publishes a balanced mix of articles covering exploration, exploitation, appraisal, development and enhancement of sub-surface hydrocarbon resources and carbon repositories. A new edition (Volume 31, Issue 1) will be published in February.
Geoenergy (GE) Geoenergy is committed to publishing impactful research in subsurface geoscience, driving innovation and progress in the sustainable energy transition. A new edition (Volume 3, Issue 1) will be published in February.


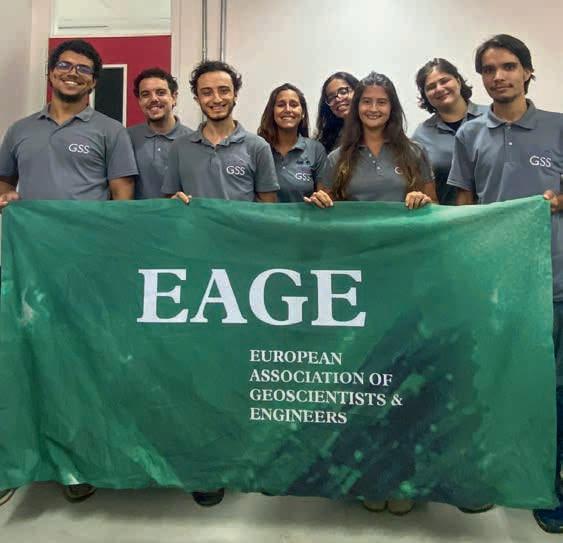
As members of the Brazilian Universidade Federal Fluminense (UFF) Student Chapter, we are thrilled to share the positive impact we have received since introducing our custom designed polo shirts thanks to generous support from the Association. They have already given our Chapter and EAGE greater visibility, unity, and professional engagement.
The design reflects both our values and the global significance of the EAGE brand. Wearing these shirts, we believe, will strengthen our sense of belonging and deepen our connection to the broader geoscience community, inspiring pride among our members. So, to EAGE we offer our grateful thanks.
Below is a photo of members wearing our T-shirts. Maybe it can inspire other student chapters to work on their image!

Listen up all EAGE Student Chapters. It is time to renew your memberships and be sure to enter a team for our Online GeoQuiz Challenge 2025! Renewing your Student Chapter for 2025 means you can strengthen your Chapter’s presence within EAGE’s global community, but have the chance to compete in the Online GeoQuiz, our popular knowledge-based competition that tests your geoscience and engineer expertise and teamwork.
And here’s the exciting part: the top three winning Student Chapters with the highest scores in the Online GeoQuiz will receive three complimentary registrations for three members to attend the EAGE Annual Conference & Exhibition, taking place in Toulouse, France, from 2-5 June

2025. This is more than just a competition, winning is an opportunity to represent your Chapter on a global stage and gain invaluable exposure to the heart of the geoscience industry.
All you have to do is renew your Student Chapter for 2025, ensure your membership is active, and gear up to participate in the Online GeoQuiz. For more information on Chapter renewals and the Online GeoQuiz, please visit https://eage.org/students/establishyour-student-chapter/ or reach out to students@eage.org.
For more information

The undervalued process involved in surface logging technologies will be the subject of a workshop in Paris later this year for which there is a call for papers.
The Surface Logging Workshop: Advancing well construction in the energy transition takes place in the French capital on 12-14 November 2025 and is intended to gather energy professionals to discuss how subsurface logging is increasingly recognised as digitalisation, cross-disciplinary collaboration, and sustainability targets reshape the energy industry.
By providing real-time data that boosts operational safety, efficiency, and overall decision-making, surface logging plays a pivotal role in modern well construction. The workshop will demonstrate how integrating geological, petrophysical, and drilling data optimises well placement, reservoir and overburden evaluation, and hazard detection. Emphasis will also be placed on surface logging’s evolving relevance in unconventional resources, geothermal wells, and new gas exploration such as hydrogen and helium.
Participants will be able to explore how recent advances in surface logging tools and techniques have unlocked new applications, accelerating the technology’s broader adoption. Through presentations of cutting-edge innovations, solutions will be discussed that can improve subsurface understanding and well performance while mitigating operational risks.
Designed for geoscientists, drilling engineers, mud loggers, reservoir engineers, production engineers, and other well-planning professionals, the workshop should offer a rich blend of theory and practical skill-building.

For those interested in submitting a paper, an abstract showcasing your latest research or field experience in surface logging will be welcome. Please send in your submission by 15 June to be considered for a presentation slot at this innovative workshop.

This year there is a chance to experience the extraordinary geology of the breathtaking Argana Valley, nestled in the western High Atlas, just 100 km southwest of Marrakech. The adventure will take you to the heart of the Triassic-Early Jurassic period, offering a rare opportunity to study one of the most exceptional geological wonders in Northwest Africa: the Argana Basin.
This is all possible for those joining the First EAGE Atlantic Geoscience Resource Exploration and Development Symposium Atlantic Conjugate Margins and Their Global Significance In Our Energy Future, on 5-7 May in Marrakech, Morocco
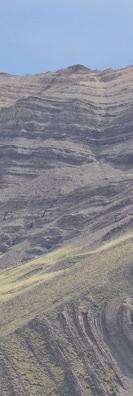
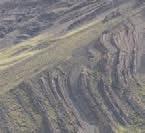
Renowned for its remarkable outcrops, the Argana Basin presents a continuous and complete section of rock formations, unveiling the first tectonic and sedimentary developments of the Central Atlantic Margin. Stretching over 85 km with a width of up to 25 km, this vast rift basin tells a story of ancient transitions — from non-marine to marine environments — etched into its layered rock formations.
Triassic rocks in the basin feature up to 2500 m of coarse to fine-grained red-brown clastic deposits, representing a rich tapestry of geological history. Recent studies have revealed the intricate interplay between tectonic activity and sedimentation, showcasing how shifting depositional conditions shaped the basin over millions of years.
The valley’s unique layout, divided into four sub-basins, makes it an unrivalled natural laboratory for understanding and modelling buried continental rift systems. From base to top, every formation unveils a piece of the puzzle, demonstrating how tectonic reactivations influenced facies distribution and evolution over time.
You could call the Argana Basin a geological masterpiece where history is written in stone. With unparalleled access to its formations, the field trip associated with the conference is perfect for geologists, researchers, and enthusiasts eager to deepen their understanding of rift basin development and the fascinating history of the Central Atlantic Margin.
For more information see Events at www.eage.org.
Our Advanced Seismic Solutions for Complex Reservoir Challenges workshop in Kuala Lumpur on 29-30 April 2025 is being organised to explore the implications of the shift in seismic applications from almost exclusively focusing on fossil fuel exploration to a broader base, including renewable energy and advanced subsurface characterisation for carbon capture and storage.
Addressing the complex challenges in reservoir environments, the technical committee of the EAGE Workshop invites geoscientists, engineers, and industry professionals to come together and explore
these new trends in seismic technology. It is hope that latest and potential future practices in seismic data acquisition and processing will be presented to highlight both legacy and new seismic data developments in land and marine environments.
This year’s workshop promises a comprehensive programme designed to address the latest trends and technologies in seismic solutions. Topics include innovations such as compressive sensing, simultaneous source acquisition, distributed acoustic sensors (DAS), cable-free nodal systems, and marine vibrators as well as machine
learning applications for automated seismic data analysis.
Register now to take the opportunity to connect with leading industry professionals from PETRONAS, PTTEP, SLB, Shearwater GeoServices, TGS, ConocoPhillips, ExxonMobil, Aramco, Shell, and others. Visit the event website using the QR code for more details and secure your spot today.
For more information
The EAGE Student Fund supports student activities that help students bridge the gap between university and professional environments. This is only possible with the support from the EAGE community. If you want to support the next generation of geoscientists and engineers, go to donate.eagestudentfund.org or simply scan the QR code. Many thanks for your donation in advance!

Bjarte Bruheim , best known as a founder of Petroleum GeoServices, is a rare serial entrepreneur in geoscience oil and gas business, not to mention shale. He has been an investor or somehow involved in virtually every significant marine seismic and related technology over four decades, starting operating two seismic vessels with Geco, then PGS 3D data harvesting with Ramform vessels, offshore electromagnetics (EMGS), and ocean bottom nodes (AGS). His first business was a blues/rock band.
Upbringing
I grew up in Foerde, rapidly growing small town on the west coast of Norway. My father was heading up the largest retail business in town and my classmates were from all parts of Norway. In my early teens I was into soccer and track and field, but then music took over. Aged 16, I started my first business, a rock and roll band inspired by American and British music. My first assets were a Gibson SG Standard guitar and a Fender Quad Rewerb amplifier. Playing lead guitar in three different bands, three days a week all summer paid for most of my education.
Academic route
My interest in electronic instruments made my early career choice easy and I obtained my first degree in electronics from Gjoevik engineering school. During those study years, I kind of had a full-time job in the band. For the other band members music was their main income, so we travelled a lot and played 3-5 days a week all summer. I had to plan ahead and be very disciplined when it came to my studies. This paid off and I got the best grades ever and was accepted at NTNU in Trondheim. I took electronics, computer science and physics. My diploma was in fibre-optic sensors. Before starting at NTNU I had to my obligatory military duty in the Norwegian Air Force. I was trained as a radar operator and spent most of the time close to the Russian border.
My first five years at Geco were spent as operations manager for Europe, Africa and
Far East and the next five as VP of operations for North and South America. The professional leadership training I received has helped me a lot during my career. The CEO Anders Farestveit was a hands-on, dynamic leader energising us all. I have absolutely learned what you can and cannot do. During my time the first dual streamer operation was introduced by Geco and paved the way for commercialisation of 3D seismic.
I left Geco after 10 years following the takeover by Schlumberger. For me, the company had become top heavy and slow. I had been arguing strongly for development of technology to expand the multi-client concept with more than two streamers (MC3D). After a year of politics and endless meetings I left and started Precision Seismic with a clear MC 3D strategy. We merged with the 2D MC company Nopec and the navigation company Geoteam, and Petroleum GeoServices (PGS) was born. The team I put together had the right spirit and an endless drive for efficiency and performance. After five years we were building the Ramform purpose-built seismic vessels, six during my time. PGS was to become the first Norwegian technology company to be listed on Nasdaq and NYSE.
As a part of PGS multi-client strategy, we exchanged 3D library data for equity in start-up oil and gas companies. Our success with investment in Houston-based Spinnaker Exploration drilling wells based
on 3D seismic led me to be challenged to find a direct hydrocarbon indicator. Fast forward some years later, I teamed up with Warburg Pincus (who had been PGS financial partner in Spinnaker) to buy EMGS, the pioneering offshore EM company from Statoil (as was). I worked as executive chairman for ten years. Successful in derisking some drilling targets, the company was hampered in the early days by over-optimism, commercial competition and patent disputes.
At PGS I gained my first experience with OBN cables and the potential for the 4D seismic market. In 2016 I was involved in founding an ‘asset light’ seabed seismic services company Axxis Geo Solutions (AGS) and in 2019-2020 we acquired one of the most advanced seismic data sets ever in the North Sea. We used 8000 nodes on the seafloor and shooting data every two seconds for eight months using six sources acquiring a data set of 2.5 petabytes. Unfortunately, the company’s acquisition services closed down because of the Covid pandemic.
We have started a new company Velocitas to operate and continue improve technology, efficiency and lower cost of 3D/4D data sets. We did our first MC proof of concept survey last summer.
I enjoy living and working out of Houston, but spend some time during the summer in Norway to get away from the heat.
BY ANDREW M c BARNET

Mark Zuckberger, CEO of Meta and founder of Facebook, was no doubt sucking up to incoming President Trump when announcing the end of most fact-checking of his organisation’s social media content. In future it will be moderated by everyday users through so-called Community Notes, a system popularised on Elon Musk’s X (previously Twitter).
The decision has generated plenty of hand-wringing in certain quarters because it is regarded as opening the floodgates to more misinformation. That really is a moot point given how many different uncensored social media platforms, messaging apps, podcasts, influencers, etc are out there. You could argue that Zuckerburg is upholding the principle of free speech in a democracy, however disconcerting not to mention threatening this may be.
way suspend disbelief, that news is factual. But that of course begs the question of what constitutes a fact. What is History by E.H Carr (1961) provides the classic takedown of relying on historical facts as the whole truth. Rather they are the arbitrary selection by historians influenced by the period they lived in.
‘Breakdown of the traditional way information is mediated’
What we are really witnessing is the breakdown of the traditional way information is mediated for community consumption. The implications reach into every corner of society, including the siloed worlds of energy and geoscience. It boils down to a question of trust. We may feel comfortable that sufficient knowledge about the activities involving the EAGE is accessible and an accurate reflection of what is going on. However, as we all know, the public perception of the oil and gas industry is increasingly unfavourable as concerns over climate change escalate. Uninformed social media chatter, lies, conspiracy theories, etc simply add fuel to the fire, so to speak. This makes it particularly challenging for professional societies like EAGE to promote understanding of its mission to promote a society founded on sustainable energy deploying the best of science and technology.
Although not often acknowledged enough, everyone has to base their opinions, world view, etc on partial information, even scientific knowledge only represents the best evidence available and is always open to further research.
It is public discourse around our consumption of everyday news which is especially problematic. We assume, or in some
So it is with news. There are countless academic studies describing how news is a social construction. For just how obvious this is, go no further than the observation by comedian/actor Jerry Seinfeld: ‘It’s amazing that the amount of news that happens in the world every day always just exactly fits the newspaper.’ It gets more sinister. One of the first press magnates William Randolph Hearst (model for Orson Welles in the classic movie Citizen Kane) said ‘News is something somebody doesn’t want printed; all else is advertising’. But most damning is the shadow cast over any thought of ethical reporting by Rupert Murdoch, founder of News Corporation and Fox News. ‘Journalism’, he has said with stunning hypocrisy, ‘is a public trust, a responsibility to report the truth with accuracy and fairness. Journalism is also a business, and like any business, it has to attract customers.’
The business imperative is not the only factor distorting news coverage in traditional media (TV, radio and print) although there is no getting away from it being a ‘manufactured’ product. If you start with what makes news, you soon get the idea of the limitations. A popular summary adapted from Shoemaker et al., 1987 recognises these mainly self-explanatory factors in choice of news, e.g., timeliness, proximity (closer means more relevance), importance, impact, or consequence, human interest, negativity (conflict/ controversy sells better), prominence (focus on public figures), and novelty, oddity or the unusual.
The type of media matters. For example, TV news is incredibly limited in the number of items it can cover in a news cast compared with radio and especially print. An overriding criteria is having film. With the exception of live events, such
as Californian wildfires, almost all TV coverage is old news, post happening. There is also a bias towards how accessible any potential item is for camera teams, usually based around big cities. How many times do you hear TV anchors introduce some hapless correspondent reporting ‘live’on location’, hours after the actual event simply to show some film. In passing, this is why local TV media love having animal/pet stories, entertaining and easily planned for a photo shoot/interview.
The decision-making process is of course another whole issue in which journalists are only one consideration. Not just news but all editorial content in conventional media is constrained. Articles have to meet the varying interests of the owner/ stakeholders, advertisers, and editors, thereby immediately introducing bias into the coverage which journalists have to go along with often requiring an element of self-censorship.
‘Rise of social media may provide an unexpected opportunity’
As a product, media coverage is also subject to business principles. Traditional newspapers are in serious if not terminal decline through lack of advertising and falling circulations, and the support for television programming is ebbing in favour of streaming. This affects the depth of news reporting more than many probably realise, and draws attention to one of the major vunerabilities of all news presentation that is rarely addressed, namely the source of news.
You can definitely forget the deep-throat style reporting of the Watergate scandal by Woodward and Bernstein. Media investigations these days are extremely rare: they are costly in resources and staff time, also vulnerable to litigation once published making such exercises an unwarranted risk. A much cheaper option is just to wait and see what comes in, and then have journalists follow up. And this is where reader beware should kick in: just ask yourself how news organisations can start the day with a news agenda already, i.e., anticipating what’s going to happen and planning how it can be reported, no crystal ball needed.
The answer is that much of the material generated to fill news quotients, be it TV, radio or print, comes in without any inquiry needed. If you take news routinely reported such as activity in government, business/financial, entertainment and indeed science/ technology worlds, you can be confident that the first approach to the media was via an annoucement, press release, briefing, direct contact with a journalist, etc. The common denominator is that the source has provided the information and arguably has control of the ‘facts’. Of course the obvious exception should be reporting on an ongoing big event such as a war. But in fact we only get the filtered information that the warring participants allow. In any sensitive incident such as industrial accidents, oil spills, etc, an immediate response for companies involved is to set a PR crisis-handling operation. Furthermore, when reporting journalists tend to provide the view from the top, as more authoritative, i.e., confirmation from a CEO is valued over any old employee, unless it is a rare whistleblower!
This is a topic where Crosstalk can input some personal academic research to verify how sources can influence the media in a manner that has certainly not changed.. A key finding from a study published in the Scottish Journal of Sociology (Nov 1978) entitled ‘The North Sea Oil Story: Government, the oil industry and the press’ by Andrew McBarnet (based on research funded by the UK Social Science Research Council) was that in 1976 at the height of the excitement over North Sea oil, ‘only 14 items received anything like comprehensive coverage in the UK quality and popular national papers … The most striking point about these news columns is that they are all stories which depend on oil industry or government sources making announcements to the press. The press has investigated nothing. In a whole year less than 30 stories were even covered by the four quality papers and of those reports it is difficult to find one which was not prompted by a formal announcement, press conference or some other pre-arranged highly formal, controlled event with the source of newsmaking literally in command of the facts.’
For any organisation such as the EAGE with a credible story to tell, for example, about the value of geoscience in the energy transition era, this media landscape has become even more daunting. It is not a story easy to package to meet conventional media’s news criteria as described here. Plying specialist publications and oil industry news aggregators with information still presents an option. But this is not the audience that the Association would ideally like to tap if it is to accomplish the task of attracting new generations into the geosciences.
Ironically the rise of social media may provide an unexpected opportunity. Pew Research Centre reporting in 2023 showed that in the period 14 April to 4 May 2023, 95% of teens reported using YouTube, 67% TikTok, 62% Instagram 58% Snapchat and only 32% Facebook. The figures in themselves may well have changed and reflect only the US population, but it is known that 59% of EU individuals use social networks, and that in India and China the vast majority of the population engages in some way with social media.
Given this trend, the potential audience of a younger generation may be there for EAGE and others to reach. There are no serious protocols to follow, and no entrenched gatekeepers. Optimising use of social media to get a message across obviously needs research and resources to maintain, and outreach has not in the past been a priority for EAGE or other professional societies. One can imagine the major challenges will be how to stand out from the bewildering number of social media offerings on so many platforms. The biggest followings for podcasts, for example, depend on charismatic individuals. For EAGE to seriously compete outside the cocoon of the geoscience network may require the emergence of an as yet unidentified Mr Geoscience figure!
Views expressed in Crosstalk are solely those of the author, who can be contacted at andrew@andrewmcbarnet.com.


The global offshore wind energy sector set new records for permitting and securing offtake contracts in 2024, underscoring its resilience and adaptability, says TGS’ Q4 2024 Global Market Overview. The report claimed that in 2025 even higher levels of capacity will reach financial close and be secured under offtake agreements.
The fourth-quarter 2024 report highlights how consequential elections and auctions in 2024 have triggered significant changes, with government support gradually catching up with industry cost pressures. Governments globally aimed to lease about 72 GW of new sites this year, with 65.2 GW awarded. However, only 16.6 GW of approximately 30 GW of targeted offtake capacity was secured.
‘While recent auctions have seen mixed success — particularly in Denmark, where an auction received no bids — global growth prospects remain promising, said TGS.
New global key forecasts show that 410 GW of offshore wind projects will start construction by the end of 2035, with the Asia-Pacific market share set to expand significantly, from 7% today to about 16%. Retaining its leadership position, Europe’s share is expected to grow from 44% now to 49% by 2035, leveraging its long development experience to weather supply chain disruptions.
Additionally, China’s role remains dominant, with 26% of global capacity starting
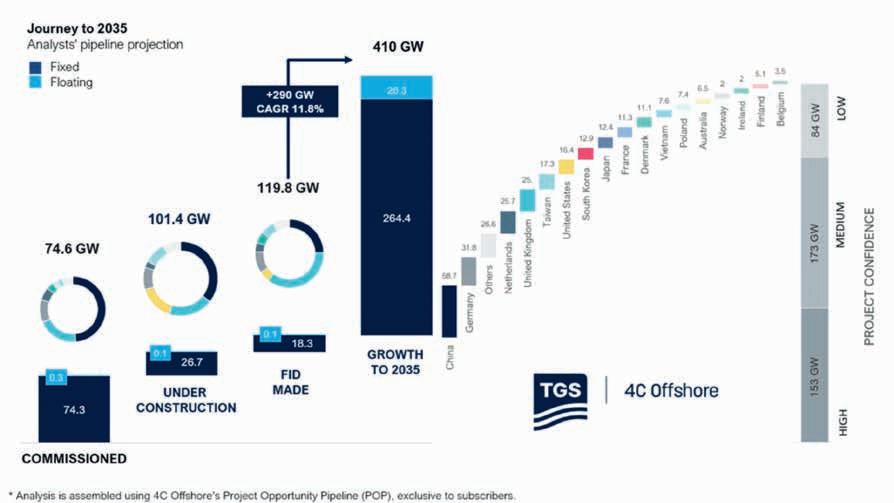
offshore construction by the middle of the next decade.
With this longer-term vision, the UK and US are predicted to be outside the top three markets globally — a consequence of supply chain and policy uncertainty. By contrast, emerging markets outside the top 10 are projected to hold more than 17% of global offshore wind capacity by 2035, a significant increase from 1.1% today.
In the fourth quarter of 2024, Romania and Turkey each published an offshore wind roadmap, Canada took a crucial legislative step with Bill C-49, and Brazil and Colombia advanced their regulatory frameworks. ‘This rapid evolution signals a more diverse and geographically dis-
persed market that extends well beyond traditional industry hubs,’ said TGS.
Overall, developments in 2024 provided a positive long-term direction, said TGS. ‘Governments are raising strike prices, developers are refining strategies to manage risks, and the global market is evolving into a more diverse, geographically dispersed ecosystem. The result is a comprehensive view of an industry at a pivotal juncture, poised to adapt and grow as it heads toward 2035,’ said TGS.
Jamie Bernthal-Hooker, research team lead for 4C Offshore market intelligence at TGS, said: ‘Recent news from around the world, such as Brazil progressing its regulatory framework, shows that offshore
wind still has momentum, even in emerging markets, despite hurdles and uncertainties in the global market. Our forecast reflects an industry that has faced several challenges but with rapid and significant advancements to look forward to in the short and long terms.’
The Q4 2024 Global Market Overview Report covers more than 30 markets
worldwide, while TGS has extended its global outlook for offshore wind to 2035.
Meanwhile, TGS has launched a CO2 Storage Assessment package for the Appalachian Basin in the US, covering 85 million acres. The study provides insights into geological structures, storage capacity and overall suitability of carbon capture and storage (CCS) projects in the region.
Utilising data from 3400 wells and 29 stratigraphic surfaces, the assessment evaluates reservoir quality, sealing integrity and other geological factors critical to the success of CCS projects. Advanced methodologies such as stratigraphic framework, core-calibrated petrophysical evaluations and log curve interpretations were applied to generate these findings.
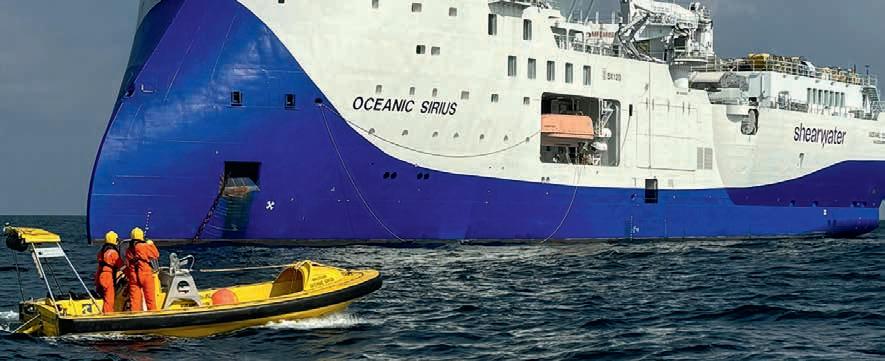
Shearwater Geoservices has started the second season of acquisition for the Pelotas Basin multi-client 3D seismic survey offshore Brazil, conducted in partnership with Searcher Seismic.
The sixth multi-client 3D project for the joint venture will utilise the vessel SW Empress to expand the Pelotas survey area beyond 10,000 km2. ‘By acquiring detailed 3D seismic data, the project will provide explorers with critical insights into the geological structure of the Pelotas Basin, helping to de-risk exploration activities, enable faster decision-making, and pave the way for successful hydrocarbon discoveries,’ said Shearwater in a statement.
‘The Pelotas Basin shares a conjugate margin pairing with the Orange Basin
which is increasingly recognised as an emerging super basin of global significance and is a basin where Searcher and Shearwater lead the way with a significant data library,’ said Searcher.
The survey covers large areas of open acreage expected to be available in the 5th cycle of the Brazilian Open Acreage Release, and acreage awarded in the 4th cycle last year. ‘The survey area holds significant promise due to its geological connection with the Orange Basin in Namibia and South Africa, a globally emerging super basin of great importance. This relationship between the Pelotas Basin and the Orange Basin offers unique opportunities to leverage knowledge and discoveries across the Atlantic Conjugate Margin, enhancing exploration strategies
and maximising resource potential,’ said Shearwater.
Irene Waage Basili, CEO of Shearwater, added: ‘Shearwater has already acquired over 26,000 km2 of multi-client data, further establishing our position in the multi-client space. Shearwater and Searcher Seismic have built a highly successful partnership in one of the world’s most prosperous frontier areas and the new season’s work is a great opportunity to extend this success.’
Shearwater has also received a work order from Petrobras to start one of the two 4D projects in Brazil covering the Jubarte and Tartaruga Verde fields in the Campos Basin area. The eight-month com mitment will utilise Shearwater’s vessel Oceanic Vega.
PetroStrat has completed acquisition of Viridien’s Geology Group, formerly known as Robertson Research.
As part of the deal, 69 people and laboratory facilities will be transferred from Viridien to PetroStrat’s headquarters in Conwy, UK.
PetroStrat specialises in biostratigraphy, reservoir geology, integrated multi-client reports and laboratory services and will now add petrophysics, geochemistry, chemostratigraphy, petroleum systems analysis, lead and prospect generation, seismic interpretation and structural geology to its offer.
This extended range of services and geological expertise will enable PetroStrat to serve both traditional oil and gas projects and energy transition initiatives, such as carbon capture and sequestration (CCS) and geothermal energy, said Paul Cornick, co-founder and managing director at PetroStrat. He added: ‘The opportunity to blend the joint capabilities of two of the leading providers of geological services in the energy sector, creating a business of nearly 200 employees and with a truly global market reach is extremely exciting.’
John Gregory, co-founder and business development director at PetroStrat
said: ‘Other benefits of this acquisition will include new offices in Abu Dhabi and Crawley. PetroStrat’s main markets of Northwest Europe, North America and Gulf of Mexico, Africa, Middle East and Asia will be further enhanced with additional significant contracts covering the Middle East and Africa.’
Peter Whiting, EVP, Geoscience, Viridien, said: ‘It fits well with our strategic direction, and PetroStrat, with its recognised strength worldwide in geological services, provides an excellent home for the people and the best platform for the further growth of the business.’
PXGEO has signed a deal with Aker BP to deploy its MantaRay ocean bottom node technology on the Norwegian Continental Shelf.
Aker BP hailed the seismic tool as ‘an innovative seismic acquisition technology that will enhance the quality and efficiency of its subsurface exploration and development activities’. It added that recent results in seismic imaging and seismic velocity model-building obtained from OBN data on the Norwegian Continental Shelf
demonstrated a quality potential superior to other seismic acquisition methods.
PXGEO operates MantaRay, a hovering autonomous underwater vehicle engineered by Manta to deploy and recover ocean bottom nodes with minimal impact to the ocean floor. ‘The MantaRay technology has the potential to reduce a seismic survey operation time significantly,’ said Aker BP in a statement. ‘This will enable Aker BP to capture more detailed and accurate images of the subsurface, reduce operational risks and environmental footprint, and optimise its exploration and development activities in the Norwegian Continental Shelf (NCS).’
Per Øyvind Seljebotn, senior vice-president exploration and reservoir development at Aker BP, said: ‘We are very excited to partner with PXGEO to deploy this innovative seismic acquisition technology on the NCS. The MantaRay technology will enable us to acquire high-quality seismic data in a cost-effective and environmentally responsible way, and support our ambition to deliver profitable and sustainable growth on the NCS.’
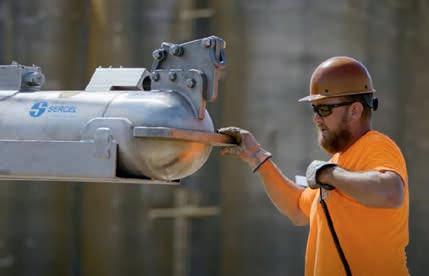
Sercel has signed a contract with a marine geophysical company for the deployment of its Tuned Pulse Source (TPS), a low-frequency broadband marine seismic source. The geophysical company is deploying the TPS solution to acquire an ultralong-offset ocean-bottom node (OBN) survey in the Gulf of Mexico, which started in November.
‘TPS is Sercel’s response to the industry’s need for an enhanced low-frequency marine seismic source that produces a broader bandwidth and has a reduced environmental impact,’ said Sercel. ‘This solution delivers exceptionally low-frequency content and the highest amplitude signals at frequencies below 3 Hz. These are crucial for building accurate velocity models with the latest elastic full-waveform
technology, when targeting complex geologies and deep targets with long offsets.’
Jerome Denigot, CEO, Sercel said: ‘During its deployment on multiple OBN projects over the last two years, TPS has clearly demonstrated greater operational efficiency and reduced environmental impact on marine life compared to other low-frequency sources, while delivering the most accurate data.’
The US Bureau of Ocean Energy Management (BOEM) has published a call for information and nominations for wind energy leasing off the coast of the US Pacific Territory of Guam that will help the Pacific island generate 50% of its electricity from renewable energy sources by 2035 and 100% by 2045.
Equinor’s Empire Wind 1 project in the US has secured more than $3 billion financing. Empire Wind 1 will power 500,000 New York homes and is expected to reach its commercial operation date in 2027.
The UK government has signed the first three hydrogen production contracts under Hydrogen Allocation Round 1 (HAR-1). The West Wales Hydrogen project is at a former oil refinery site in Milford Haven. The Cromarty project is near Invergordon in northeast Scotland and Whitelee is outside Glasgow.
Harbour Energy (40%), INEOS (40%) and Nordsfondon (20%) have have made a final investment decision for the Greensand Future carbon capture and storage (CCS) project in Denmark. The project will store carbon dioxide from Danish emitters in a depleted oil field under the Danish North Sea. The project, which aims to store CO2 in the INEOS-operated Nini field, will become the EU’s first operational CO2 storage facility. Greensand Future aims to capture and will initially store 400,000 tons of CO2 each year.
TotalEnergies and OQ Alternative Energy (OQAE) have signed agreements to develop 300 MW of renewable energy projects in Oman. The JV will deliver the North Solar, a 100 MW solar project in Saih Nihaydah in northern Oman; and Riyah-1 and Riyah-2, two 100 MW wind projects, in Amin and West Nimr fields in southern Oman. Construction will start in early 2025, and electricity production in late 2026. The solar and wind projects will generate more than 1.4 TWh of renewable electricity annually.
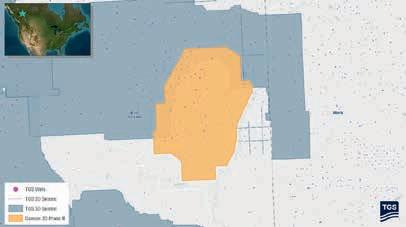
TGS has launched the Dawson Phase III 3D multi-client seismic survey in the Western Canadian Sedimentary Basin, spanning 141 km2
Field recording has just completed, with fast-track data expected in the first quarter of 2025 and final delivery in the second quarter of 2025. The project uses advanced imaging technologies, including multi-survey merging, harmonic noise reduction for slip sweep acquisition and OVT 5D interpretation, which enables precise subsurface imaging and valuable insights for operators developing Montney resources.
‘The Dawson Phase III 3D survey marks an important step as our first new multi-client seismic project in British Columbia since 2019,’ said Kristian Johansen, CEO of TGS. ‘Through the application of modern seismic imaging techniques and close collaboration with First Nations to minimise environmental impact, we continue our commitment to delivering data that supports informed
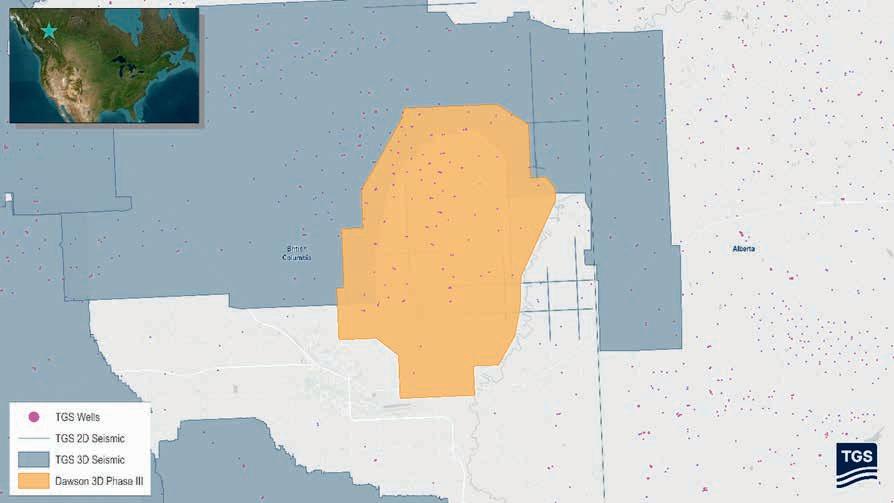
Map showing selected TGS subsurface data coverage in the British Columbia, Canada area, including the Dawson III 3D seismic survey and surrounding well data.
decision-making in one of Canada’s most active formations.’
The new survey will be merged with 121 km2 of seismic data from the existing Dawson Phase II 3D project. The Dawson Phase III 3D seismic survey will also be integrated with existing TGS’ data to offer an expanded dataset for enhanced subsurface understanding in the region. The project incorporates 291 wells and 191 LAS logs.
Rasmussengruppen has increased its ownership stake in Shearwater Geoservices to 88.8% of the shares outstanding. It has converted the interest-bearing convertible loan provided to Shearwater in 2021, which has accrued interest of $110 million and has been converted into 22,203 shares.
Rasmussengruppen has also acquired 30.850 shares in Shearwater from SLB. SLB has been a shareholder since 2018 when Shearwater acquired the marine seismic acquisition assets and operations
of SLB. After this transaction, SLB will hold a 2.5% equity share in Shearwater.
‘Both transactions demonstrate strong support of Shearwater and our strategy by the main owner. The conversion of debt to equity further contributes to strengthening our balance sheet and liquidity,’ said Andreas Hveding Aubert, the CFO of Shearwater.
Meanwhile, Shearwater has placed $300 million of bonds on the Euronext Oslo Børs.
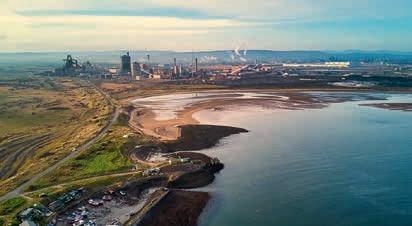
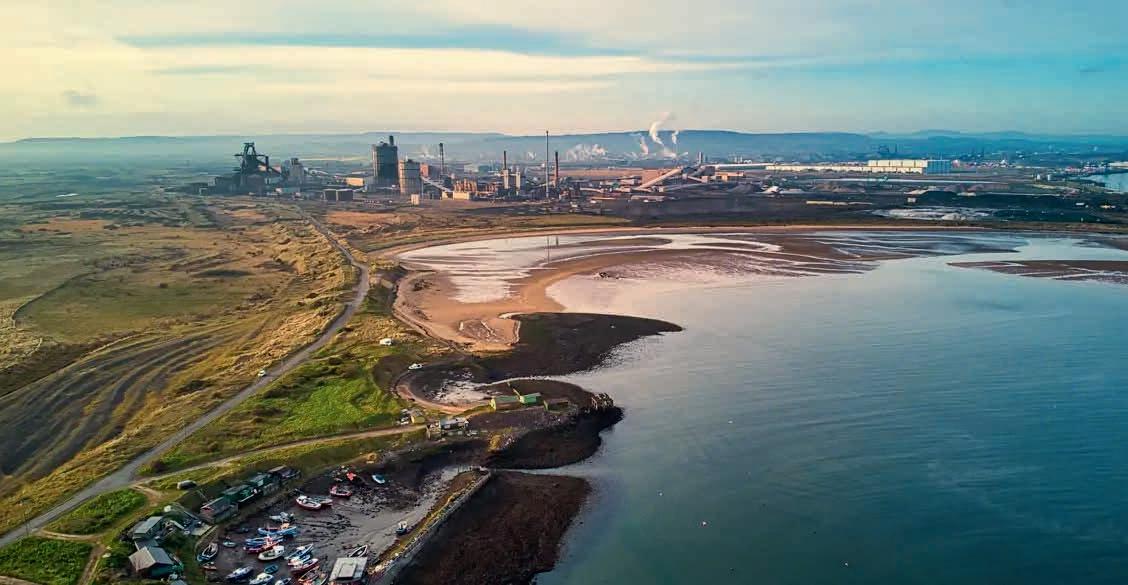
Equinor has taken a final investment decision on two of the UK’s first carbon capture and storage (CCS) projects in Teesside, the Northern Endurance Partnership (NEP) and Net Zero Teesside Power (NZT Power) off the north-east coast of England.
‘This demonstrates how the industry, alongside the UK Government, has progressed a business model for new power supply and carbon capture, transport and storage services to decarbonise the most carbon intensive region in the UK,’ said Irene Rummelhoff, executive vice-president of marketing, midstream and processing at Equinor.
The project expects to commence construction from mid2025 with start-up in 2028. It includes a CO2 gathering network and onshore compression facilities as well as a 145 km offshore pipeline and subsea injection and monitoring facilities for the Endurance saline aquifer around 1000 m below the seabed. It could transport and store up to 4 million tonnes of captured carbon dioxide emissions per year for 25 years from three Teesside projects initially, rising to an average of up to 23 million tonnes by 2035 with future expansion of the East Coast Cluster.
The UK North Sea Transition Authority recently awarded its first ever carbon capture and storage permit to the Northern Endurance Partnership. The UK government has also awarded an economic licence to Net Zero North Sea Gas Storage, enabling
the joint venture of bp, Equinor and TotalEnergies to start installing infrastructure for the project that will include Teesside-based carbon capture projects NZT Power, H2Teesside and Teesside Hydrogen CO2 Capture.
The UK government recently announced £21.7 billion investment into carbon capture and storage projects. It also recently launched a Green Industrial Partnership with Norway. The two countries will identify gaps and challenges to the development of the North Sea as a hub for carbon storage and develop a bilateral agreement on cross-border transport of CO2 under the London Protocol.
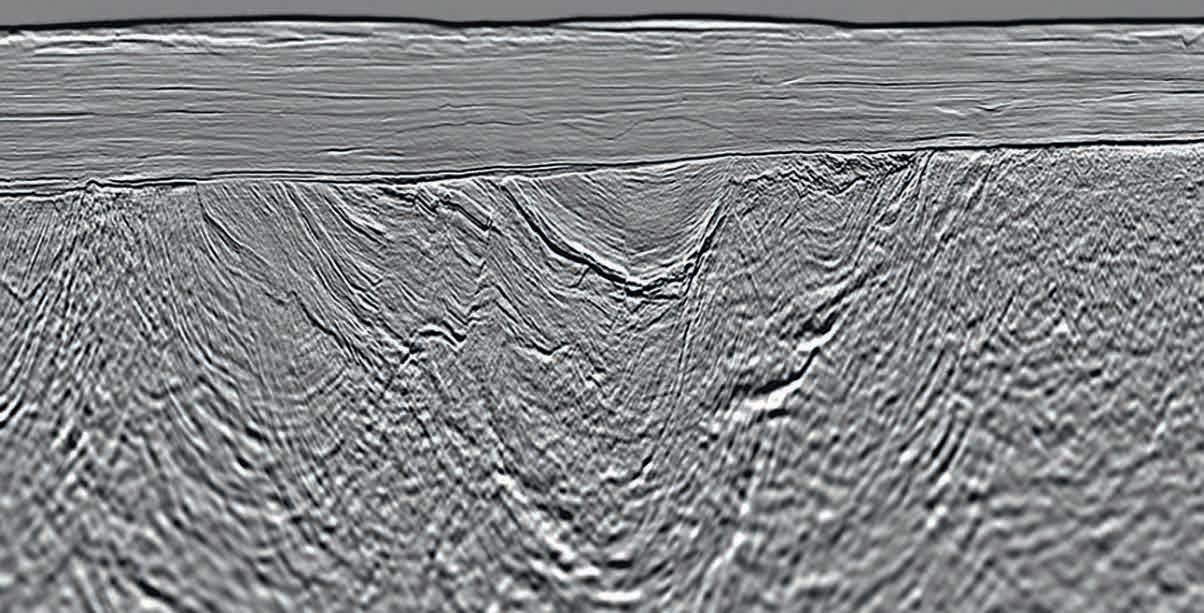
Viridien has completed the seismic imaging for the Selat Melaka multi-client 2D seismic programme, covering the offshore area of the Langkasuka Basin, Malaysia. The newly available final seismic dataset clearly indicates
the presence of a previously unseen Pre-Tertiary fold and thrust belt, extending offshore across the unexplored area, said Viridien.
The high-resolution long-offset dataset provides extensive seismic
coverage and significantly enhanced imaging over this promising area, said Viridien, whose subsurface imaging experts have applied the company’s latest imaging technologies, including full-waveform inversion and Q-tomography, for the first time in the Langkasuka Basin.
Dechun Lin, EVP, Earth Data, Viridien, said: ‘Our first multi-client project offshore Malaysia leverages over 40 years of experience processing seismic data from one of the country’s major basins. We are confident that this ultramodern data set will support the efforts of Petronas in promoting open acreages in Selat Melaka and spur exploration in this frontier area located near proven large discoveries.’
TGS and Viridien have delivered final processed data from the multi-client Sleipner ocean bottom node (OBN) project in the North Sea.
The Sleipner OBN survey, the second of two dense multi-client OBN surveys acquired in the North Sea in 2023, covers 1201 km2 in a mature region that includes the Sleipner East, Sleipner West, Gina Krog, Volve and Utgard fields, along with surrounding near-field exploration acreage – offering potential tiebacks to existing infrastructure.
Conducted between June and September 2023, the survey employed up to three node-handling vessels, three triple-source vessels and additional support vessels. The project recorded approx. 2.8 million shot points into a total of 80,769 node positions.
Viridien applied its advanced imaging technology, including its latest OBN processing techniques and time-lag full-waveform inversion (TL-FWI), to capture subsurface detail at all depths.
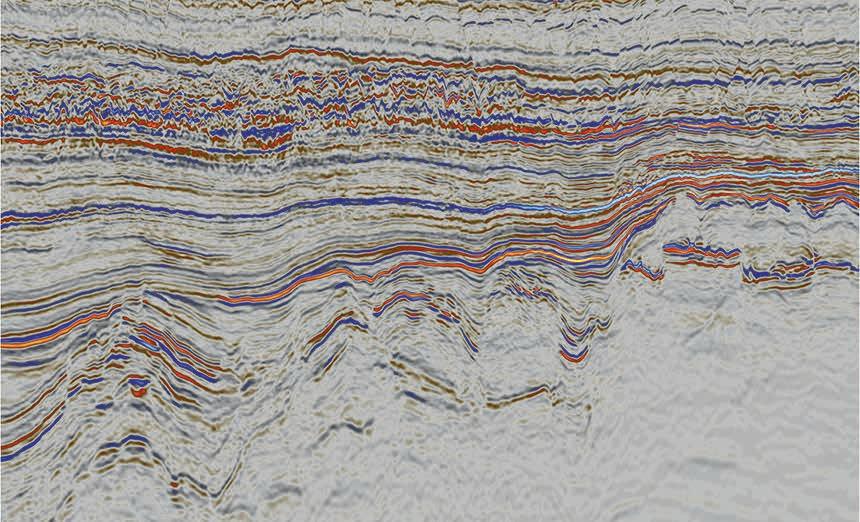
The imaged data shows substantial improvement in resolution and structural clarity over previous datasets, offering crucial insights into the region’s complex geology and reservoirs, said Viridien and TGS.
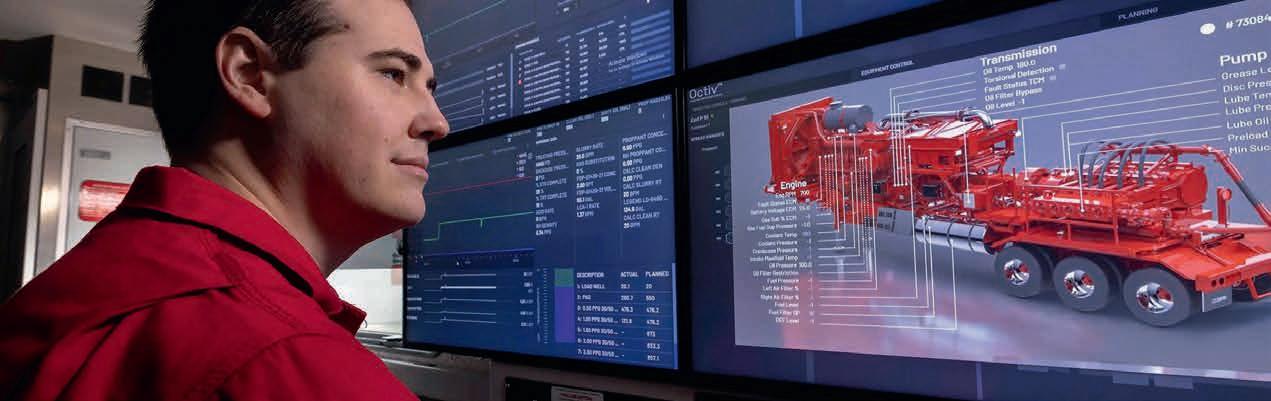
Halliburton and Coterra Energy have launched autonomous hydraulic fracturing technology in North America with the Octiv Auto Frac service, which is part of Halliburton’s ZEUS platform.
‘The Octiv Auto Frac service adds new capabilities to Halliburton’s Zeus intelligent fracturing platform and its leading electric pumping units and Sensori fracuture monitoring service,’ said Halliburton, which added that automation would improve consistency and control. ‘Before this service, fracture decisions were managed man-
ually while pumping. Coterra can now configure the Octiv Auto Frac service to execute designs to their specifications and automate the entire fracture process.’
The initial rollout of the service has led to a 17% increase in stage efficiency, Halliburton said. Based on these results, Coterra deployed the Octiv Auto Frac service to its remaining completion programs that Halliburton executes in the Permian Basin.
Shawn Stasiuk, Halliburton’s vice-president of production enhance-
ment, said. ‘The service ensures that automation delivers consistent fracture execution at every stage while giving our customers the control they demand over their assets.’
Tom Jorden, CEO of Coterra, said:
‘The deployment of intelligent automation for hydraulic fracturing helps us execute stages consistently and provides us with more autonomy and control over the completion process.’
Coterra is the first operator to fully automate and control their hydraulic fracturing design and execution.
Galp (80%, operator), NAMCOR and Custos (10% each), have discovered a column of gas-condensate and another of light oil at the Mopane-2A well (Well #4) in PEL83 offshore Namibia. The drillship is now moving to the Mopane-3X exploration well location (Well #5), targeting two stacked prospects AVO10 and AVO-13.
Operator Harbour Energy and Ithaca Energy have found hydrocarbons at the Jocelyn South prospect (P032) in Block 30/07a in the Central North Sea of the UK Continental Shelf. The top of the Joanne Reservoir was encountered in the well at the depth of 12,620ft TVDSSm with a provisional net pay thickness in the well of 434ft MD.
Arrow Exploration has reached target depth on the Alberta Llanos-1 well on the Tapir Block in the Llanos Basin of Colombia. The well targeted a large, three-way fault-bounded structure with multiple high-quality reservoir objectives. The well, which was drilled to a measured depth of 9960 feet, encountered four main hydrocarbon-bearing reservoirs with a total true vertical depth value of 121 feet, including the C7, Gacheta, Guadalupe, and Ubaque.
Repsol has resumed its exploration activities in the Murzuq Basin in Libya after more than a decade.
The company will test the Memonyat Formation, with the final depth of the well to reach 6050 feet. The well is located 800 km from the capital, Tripoli, and 12 km from the Sharara oil field.
Vår Energi and Equinor have proven oil in appraisal well 7122/8-2 S in the Barents Sea. The well was drilled to delineate the ‘Countach’ discovery near the Goliat field. The discovery is estimated to between 1.6 and 8.3 million Sm3 of recoverable oil equivalent. The objective of the well was to delineate the 7122/8-1 S (Countach) discovery in Lower Jurassic and Middle Triassic reservoir rocks in the Realgrunnen Subgroup and the Kobbe Formation. Well 7122/8-2 S encountered a 35-m oil column in the upper part of the Kobbe Formation in sandstone layers totalling 19 m with good reservoir quality. Sandstone layers totalling 27 m in the middle and lower part of the Kobbe Formation were aquiferous. The reservoir in the Realgrunnen Subgroup had very good to good reservoir quality and a total thickness of 5 m, but was waterfilled. An oil column totalling 217 m was also proven in the Klappmyss Formation, in thin sandstone layers with moderate-to-poor reservoir quality.
Wintershall Dea has proven gas in appraisal well 6507/4-5 S in the
Norwegian Sea, 270 km north of Kristiansund. The discovery in the Lange Formation (‘Sabina’) is estimated between 2.7 and 6.2 Sm3 of recoverable oil equivalent. In the Lysing Formation (‘Adriana’), the well confirms 4-7 million Sm3 of recoverable oil equivalent. In the primary exploration target, the well encountered a 41-m gas column in sandstone rocks totalling 17 m. The well encountered two sandstone layers in the Middle and Lower Lange Formation of around 4 and 21 m, with poor reservoir quality but with traces of hydrocarbons. In the secondary exploration target, the well encountered a 30-m gas column in sandstone rocks totalling 23 m with good-to-very-good reservoir quality.
Equinor and its partners have discovered oil and gas in wildcat well 31/1-4 (‘Ringand’) in the North Sea. Preliminary estimates indicate the size of the discovery is between 0.3 and 2 Sm 3 of recoverable oil equivalent. Well 31/1-4 encountered a 112-m gas column in the Ness, Etive and Oseberg formations, as well as a 16-m oil column in the Oseberg Formation. In addition, a 13-m gas column was encountered in sandstone with moderate reservoir quality in the Drake Formation. The well encountered a 6-m aquiferous sandstone layer.
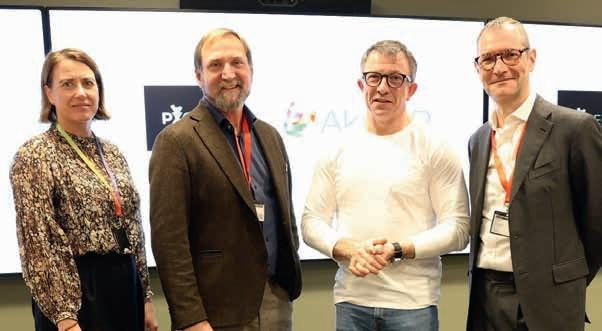
Iraya Energies is collaborating with Petroleum Sarawak Berhad (PETROS) to implement advanced digital solutions aimed at optimising data-asset management. The joint venture is deploying the innovative ElasticDocs Intuitive Knowledge Container, which integrates technologies such as optical character recognition (OCR), auto-image recognition, and natural language processing (NLP). This
solution is set to enhance PETROS’ documentation and data life-cycle management capabilities.
‘The ElasticDocs platform enables the seamless extraction, organisation, and management of unstructured data from various sources,’ said Iraya. ‘Its advanced OCR technology ensures precise digitisation of energy-related documents, while the auto-image recognition feature
processes and geolocates visual data, integrating it with satellite imagery to improve asset tracking.’
PETROS said: ‘By partnering with Iraya, PETROS gains a robust digital toolset to audit and manage new asset data more efficiently, allowing for streamlined evaluation and improved information sharing across its technical and management teams.’
BP and XRG have reached financial close and completed formation testing of their joint venture and international natural gas platform, Arcius Energy, to focus on the development of gas projects in Egypt. Announced in February 2024, Arcius Energy is 51% owned by bp and 49% by XRG, ADNOC’s investment company.
EMGS has won a contract to shoot a CSEM survey offshore India with a contract value of $10 million. The vessel Atlantic Guardian will commence acquisition after completing another survey offshore India.
Shell has made a final investment decision on Bonga North, a deep-water project offshore Nigeria to start up 16 wells. Bonga North currently has an estimated recoverable resource volume of more than 300 million barrels of oil equivalent (boe) and will reach production of 110,000 barrels of oil a day, with first oil anticipated by the end of the decade.
Shell has made a final investment decision on the Phase 3 Silvertip project, comprising two wells at the Shell-operated Perdido spar in the US Gulf of Mexico. The wells in the Silvertip Frio reservoir Shell – 40%, operator; Chevron 60%), are expected to produce 6000 boe a day (boe/d). First production is expected in 2026.
GVERSE GeoGraphix’s 2024.1 TRITON release now integrates directly with TGS’ well data library, providing geoscientists with streamlined access to well header data, deviation surveys, digital logs and raster logs.
The International Chamber of Commerce (ICC) has found that Tullow is not liable for $320 million Branch Profit Remittance Tax (BPRT) in regard to its operations in the Jubilee and TEN fields offshore Ghana. The tribunal found that BPRT is not applicable under the Deepwater Tano and West Cape Three Points Petroleum Agreements. Tullow is fighting two more disputed tax claims..
Norway’s natural gas output set a new record in 2024 with 124 billion Sm3 sold, compared to the previous record of 122.8 billion Sm3 sold in 2022, said the Norwegian Offshore Directorate.
‘The high production in 2024 was caused by high regularity on the fields and increased capacity following upgrades in 2023,’ said NOD.
The Troll field in the Norwegian North Sea produced a record 42.5 billion Sm3 of gas last year, equivalent to about three times Norway’s annual hydropower production/ according to the majority stateowned company.
Equinor, which operates the field, said, ‘This year’s record is the result of high regularity, a year without turnarounds, as well as upgrades that have increased efficiency.’
Troll holds remaining reserves of 624.2 million Sm3 of oil equivalent, from the original recoverable reserves of approximately 1.77 billion Sm3 of oil equivalent. Gas accounts for 606 million Sm3 of oil equivalent of the remaining reserves while natural gas liquids comprise 15.3 million and oil 2.9 million.
Norway’s total oil and gas production last year was the highest since 2009, reaching 240 million Sm3 of oil equivalent. The Troll and Johan Sverdrup fields in the North Sea contribute about 37% of hydrocarbon production on the Norwegian Continental Shelf (NCS), the NOD said. Gas accounts for over half of production in Norwegian waters, it said, adding most of the gas is exported to Europe.
In the third quarter of 2024 Norway continued to be the European Union’s top pipeline gas supplier with a share of 47%, according to the European Commission’s latest quarterly gas market report.
‘Production on the shelf is expected to remain at a stable, high level over the next two to three years, and will then gradually decline towards the end of the 2020s,’ the NOD added.
At the end of last year 94 fields were operating on the Norwegian shelf, according to the directorate. In 2024 the Hanz and Tyrving fields in the North Sea came onstream, while no fields shut down, it added.

The directorate expects the Castberg field on Norway’s portion of the Barents Sea to start production in the first quarter of 2025. ‘This will be important for oil production and further development of the Barents Sea as a petroleum province”, it said.
‘Several new fields are expected to come on stream over the next few years, but many will also shut down. Some previously shut-down fields are now being considered for redevelopment with a simpler development solution.
‘One important reason why production remains at such high levels is that the fields are producing for longer than originally planned. New and improved technology has allowed us to continuously improve our understanding of the subsurface. This has enabled the industry to further develop the fields. New development projects, more production wells and exploration in the surrounding area have helped extend the lifetimes of most fields.’
This year the directorate expects $22.99 billion in investments in Norway’s offshore oil and gas sector. ‘We expect exploration activity and exploration costs to remain about the same as in 2024,’ the directorate added.
‘Measures to reduce emissions and discharges from petroleum activities on the NCS account for a substantial share of the investments leading up to 2030. Despite the high level of activity in the industry, new investment decisions will be necessary to maintain activity in the future.’
Norway is now the top gas supplier for Europe having overtaken Russia. The country holds about 7.1 billion Sm3 of oil equivalent remaining resources in its continental shelf. The figure includes 3.5 billion Sm3 of oil equivalent undiscovered resources.
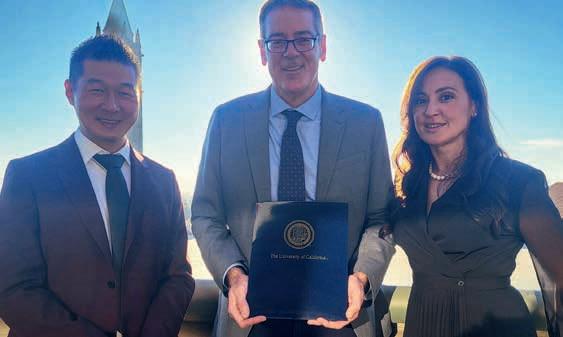
Baker Hughes and the University of California, Berkeley have announced a long-term research partnership to establish the Baker Hughes Institute for Decarbonisation Materials at UC Berkeley’s College of Chemistry.
The institute will connect academic research with commercial innovation to accelerate the deployment and scaling of cost-effective climate technology solutions that drive sustainable energy development.
As part of the agreement, Baker Hughes will fund collaborative research to develop next-generation materials for a range of energy and industrial applications, including carbon capture, utilisation and storage (CCUS), hydrogen, and clean power generation. Baker Hughes will be closely involved from the earliest stages of research to shape the programs based on evolving market and customer needs, as any discoveries may potentially be scaled across the company’s portfolio of climate technology solutions.
The institute will be led by C. Judson King Distinguished Professor and UC Berkeley Professor of Chemistry Jeffrey Long, a globally recognised material’s expert who pioneered the use of metal-organic frameworks (MOFs) for adsorbing carbon dioxide and other molecules from industrial emissions streams.
Baker Hughes’ funding will support Berkeley researchers, with expertise in materials development and discovery, computational chemistry, advanced characterisation, process engineering and techno economics.
Initial research projects will focus on advanced material design, including creating and testing new chemical structures like MOFs, as well as developing gas separation and chemical conversion systems. Additionally, the projects will leverage AI and machine learning to accelerate the discovery and development of improved materials and new technology solutions.
‘Our aim is to make materials that not only adsorb gases more efficiently, but also without high energy requirements,’ said Professor Long, the institute’s executive director. ‘As chemists, we know how to adjust materials at the atomic level, but we need partners like Baker Hughes who can scale and industrialise the technology.’
Viridien is expected to announce full year revenues of more than $1.1 billion with EBITDA of $430 million.
Net cash generation of of $50 million has led to a reduction of net debt to $930 million, exceeding the net cash generation target of $30 million due to earlier than expected client collection. The company’s credit rating from Standard & Poor’s has been updated to B. Viridien has also announced a $60 million of bond buy-back. Its revolving credit facility has been extended until October 2026 as part of preparation for the refinancing of the 2027 bonds.
The company cited ‘strong activity’ in Geoscience, a ‘strong pipeline of projects’ and termination of contractual fees from vessel commitments.
Sophie Zurquiyah, CEO of Viridien, said: ‘We achieved EBITDA growth and
net cash flow generation close to $50 million, exceeding our initial target of $30 million. Additionally, we repurchased $60 million of our own bonds, doubling our $30 million commitment. Our credit rating improved from S&P, and we extended our revolving credit facility in preparation for refinancing our debt.
‘These results were driven by the Data, Digital & Energy Transition (DDE) segment, with strong growth in Geoscience (GEO) activities and the launch of the significant Laconia project. This project enhances the value of the seismic data library of Earth Data (EDA) activities in the Gulf of Mexico.
‘The performance of DDE and the successful execution of the transformation plan for the Sensing & Monitoring (SMO) segment enable us to confidently reaffirm our target of generating
around $100 million in net cash flow in 2025.’
Meanwhile, Viridien has announced that as of 30 April it will temporarily combine the roles of chairman and chief executive officer under the leadership of Sophie Zurquiyah. She will replace Philippe Salle, who will take on the role of lead director and vice-chairman. Salle has chaired the company since 2018, while Zurquiyah has been chief executive since 2018.
Colette Lewiner, chair of the Appointment, Remuneration and Governance Committee, said: ‘Philippe’s continued presence on our board as lead director will ensure continuity and provide a balance of power within a unified governance structure. The Board is already engaged in discussions to restore a separate governance structure in 2026.’
Virtual reality is revolutionising training and operations in the oil and gas industry, according to a report by GlobalData. The report, ‘presents an overview of the adoption of virtual reality in the oil and gas industry”, said: ‘Virtual reality primarily has applications around training across the oil and gas value chain, i.e., from rigs and pipelines to refineries.’
‘Leading oil and gas companies such as Shell, bp, Chevron, and ExxonMobil, have adopted VR to train as well as aid regular workflows in operations,’ the company added. ‘It offers a cost-effec-
reality enhances the operational safety through immersive training programs. It can help to develop safety procedures at production facilities to address smaller accidents as well as for emergency response.
‘Industry technicians work in hazardous environments, such as offshore rigs or at a densely packed equipment maze in a refinery. Virtual reality can be used to relay important information and instructions to the technician onsite, without the need to fly out experts to that location or carry detailed instruction manuals for referencing.’
virtual reality to unlock business value’ for its operations and training programs across the board.
‘These technologies have the potential to enhance safety, reduce our carbon footprint, and improve efficiency across the entire lifecycle of a project, from initial planning through construction to operation,’ the company said.
‘Shell uses virtual reality training modules for various purposes, such as taking engineers on virtual geological field trips and training to respond to extreme events like major leaks or explosions.’

tive means to acclimatise the workforce to various environments through immersive training programs. It also offers safe environment for the workforce to understand the workflows by participating in virtual walk-throughs, without being in proximity of heavy industrial equipment.’
The applications of virtual reality technology in the oil and gas industry includes generating training modules for the workforce and visualising the asset under consideration for planning and decision making. GlobalData added that virtual reality ‘plays a key role in the digital twin set up, helping companies recreate scenarios through detailed simulations’.
Ravindra Puranik, an oil and gas analyst at GlobalData, said, ‘Virtual
Puranik also highlighted ‘various aspects of a production platform can be modelled through virtual reality simulations to enhance the understanding of personnel for on-field tasks. They can simulate the processes using virtual reality before implementing on the operational floor. It thus reduces the scope for human errors during critical operations.’
Puranik added: ‘Besides, designers and engineers can better visualise the layout under development using virtual reality technology. This can potentially help to improve designs, and carefully plan its execution to optimise the project costs.’
Shell said in a statement that it is ‘constantly exploring innovative technologies like augmented reality and
BP said that ‘it is embracing simulation technology as a more efficient and effective tool to train employees in everything from drilling techniques to diversity and inclusion’.
Chevron ‘is creating virtual replicas of some of its facilities to diagnose and predict real-world situations. Called digital twins, these computer-based digital doppelgängers help us assess equipment in real time — whether it’s onsite, in a city or in another country.’
ExxonMobil said: ‘We’re using high-performance computing, advanced data analytics, and increased connectivity to transform how we work at every level of our operations and enhance the way we interact with customers.’
C.M. Carvalho1*, K.S. d’Almeida1 and P.V. Zalán2.
Abstract
A methodological identification and inventory of prospective hydrocarbon resources within contracted and noncontracted areas is key to energy planning. Regarding this purpose, this paper presents a first approach in assessing prospective volumes, as well as scenarios for associated geological exploratory risks in the Parnaíba Basin (onshore basin in northeastern Brazil). In total, 40 leads of Devonian and Carboniferous plays were evaluated, and their volumes aggregated using Monte Carlo simulation. This portfolio is continuously revisited to incorporate new input data, such as seismic and well data, as well as the method being updated through new insights from internal studies and recently published bibliography. Despite uncertainties and assumptions made to obtain these volumes, probabilistic analyses using Monte Carlo simulation quantitatively account for risk in decision-making.
Parnaíba is a Paleozoic intracontinental basin situated in northeastern Brazil (Figure 1), that comprises an area of 674,321 km² encompassing the states of Piauí, Maranhão, Pará, Tocantins, Bahia and Ceará. The sedimentary column can reach up to 3500 m in the basin depocentre, and is intruded by multiple sills, which play a crucial role in the petroleum system (Milani and Zalán 1999). Although exploration started in the early 1950s, no significant discoveries were made before the 2000s, when OGX Maranhão (later ENEVA) declared commerciality of three gas fields with a total volume of gas in place ranging from 36.8 to 45.3 Bm3 (Miranda 2014). The main reservoirs are fluvial-deltaic to shallow marine sand bodies deposited under tidal or wave influence of the Mississippian Poti Formation. In the discovered gas fields reported until 2018 the average porosity is 18% and permeability values can be up to 240 mD within this stratigraphic layer. Another important reservoir interval is the Late Devonian Cabeças Formation with average porosity values of 13% and relatively lower permeability due to diagenetic features. These sandstones are associated with a shallow marine depositional system with storm influence and peri-glacial environments (Miranda et al. 2018).
The petroleum system is atypical with regional intrusions playing a key role in source-rock maturity and acting as both trap and seals (Cunha et al. 2012; Miranda et al. 2018; Fornero et al. 2023). The primary source rock are the organic-rich shales of the Devonian Pimenteiras Formation (Figure 2). The otherwise immature shales were catapulted into the gas window
by direct contact with numerous intruding sills (Miranda 2014). In the Parnaíba Basin, the sills intrude parallel to thick units of shales, usually at the interface between shaly and sandy units, or entirely within shale units. Different geometries besides the typical saucer-shape type occur with special attention being given to the commonly named ‘sill jump’ as a main exploratory target in the basin (Trosdtorf et al. 2018). The gas accumulations already drilled are trapped under diabase sills intruded into the sandstones, shaped in the unusual geometry of a bowler hat (famous Chaplin’s hat. Figures 3, 4 and 5). Two formation mechanisms are considered: one in which a trap would be formed as a result of limb amalgamation of two or more saucer-shaped sills, and another one in which magma movement upwards and downwards, along different levels of neutral buoyancy, during its emplacement would form a three-dimensional closure (Miranda et al. 2018). This last mechanism is here preferred by the authors as the best explanation for the bowler hat structures.
Exploratory effort in the basin has summed up to 239 drilled wells resulting in the commerciality declaration of other eight gas fields, in addition to 2000’s discoveries. All of them were developed by Eneva in its so-called Hawks Park (‘Parque dos Gaviões’, in Portuguese). In addition to these fields, 18 blocks are still in the exploratory period of their concession contracts (ANP 2023a). Therefore, the Parnaíba Basin plays an important role in onshore gas production, exploited through the gas-to-wire model. Present production is in the order of 2.6 MMm3/d (average production in 2023 – ANP 2023d). This production accounts for
1 Energy Research Office (EPE) | 2 ZAG Consultoria em Exploração de Petróleo
* Corresponding author, E-mail: camila.carvalho@epe.gov.br DOI: 10.3997/1365-2397.fb2025010
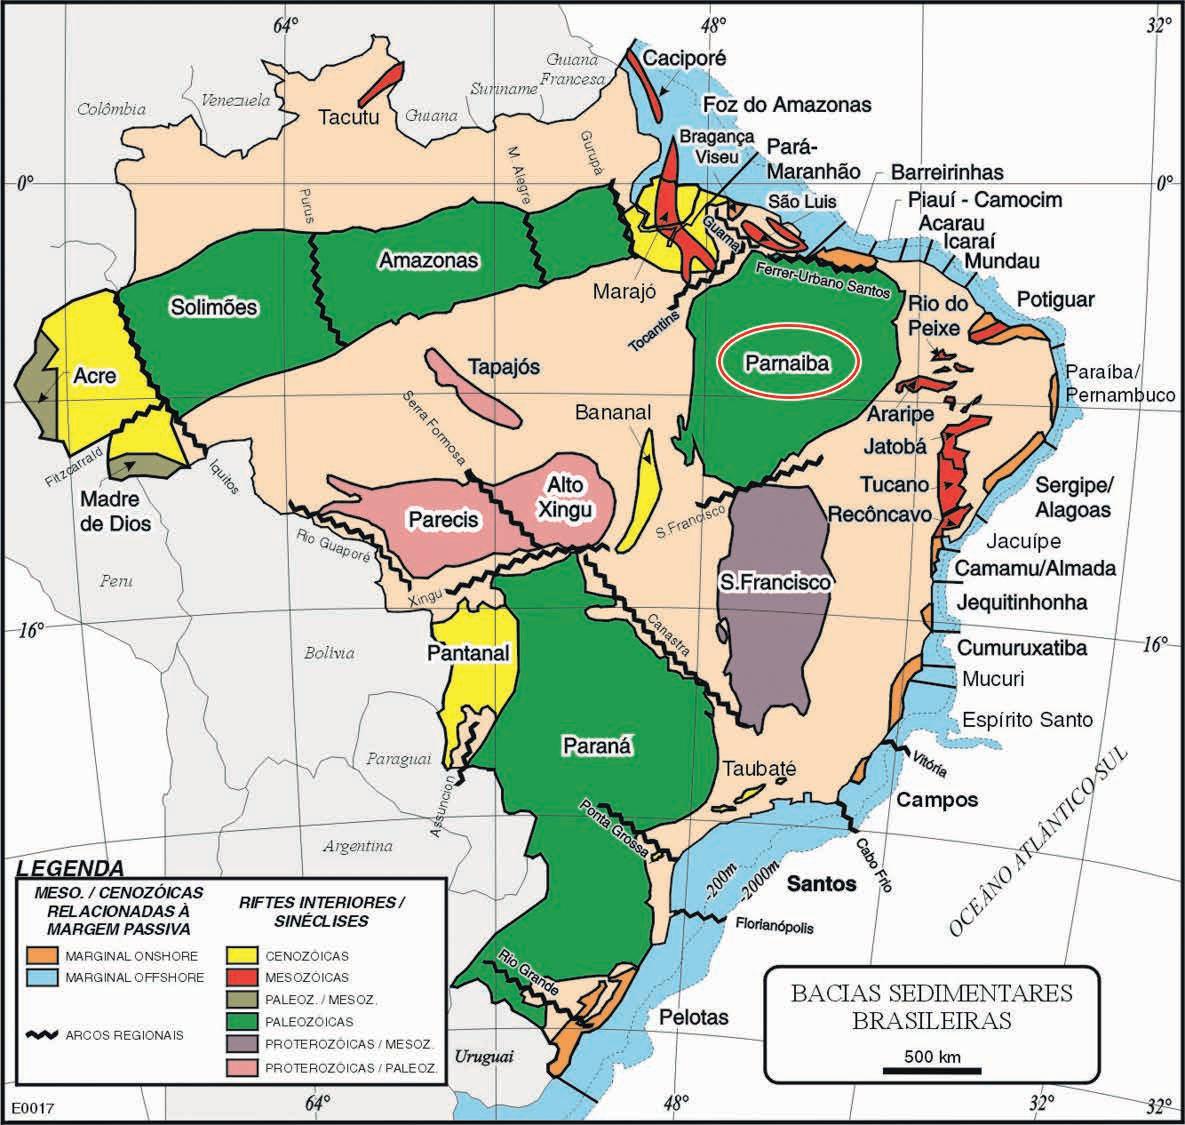
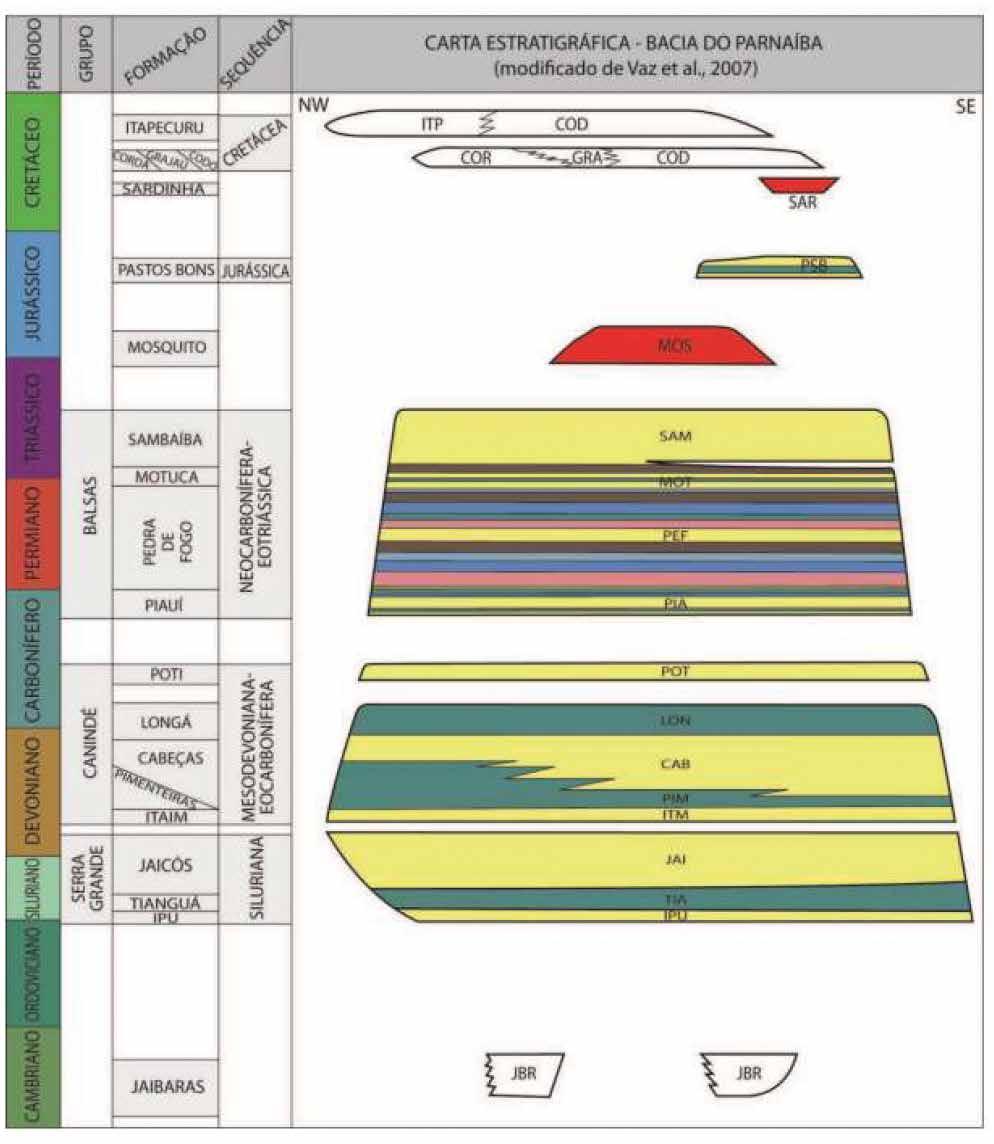
9% of gas-fired power plants installed capacity in Brazil (Eneva 2023a).
Method
The identification and characterisation of leads were accomplished using S&P Global software Kingdom®. Seismic and well data used for this purpose comprise data made public by
Figure 1 Brazil sedimentary basins according to types and ages. Red ellipse indicates the Parnaíba Basin (Zalán, 2023).
the Brazilian National Agency for Petroleum, Natural Gas and Biofuels (ANP) as part of the REATE program to revitalise onshore exploration areas, and available for free download on its website (ANP 2023b).
A first interpretation of prospective resources in the Parnaíba basin was undertaken by the Energy Research Office (EPE in its acronym in Portuguese) in collaboration with ZAG Consultoria em Exploração de Petróleo in 2016. Prospective resources are defined after SPE guidelines as ‘those quantities of petroleum which are estimated, on a given date, to be potentially recoverable from undiscovered accumulations’ (SPE 2001). Maps produced in 2016 have been revisited by EPE in this study in order to assess volumetric potential in the Parnaíba Basin resulting in 40 potential accumulations being evaluated for prospective resource estimation. According to SPE guidelines, these undiscovered accumulations are classified as leads once they are covered only by scarcely spaced 2D seismic data (Figures 3, 5 and 6). These leads have been identified in both exploratory blocks and in areas yet to be under concession agreement between oil and gas companies and ANP, on behalf of the Federal Union. In that sense, they were grouped following EPE’s definition (EPE 2022) of prospective resources as Undiscovered Resources-Company (RND-E) and Undiscovered Resources-Union (RND-U), respectively (Figure 6).
Gas Initially in Place (GIIP) is expressed as a product of a few input parameters, each of them carrying some uncertainty (Equation 1). Gas volumes can then be represented as a distribution assumed to be lognormal. To obtain this distribution we used the Three Point Method described by Otis and Schneidermann (1997). The three points in this method refer to the specification of values corresponding to the 5%, 50%, and 95% probability of
occurrence for each input parameter in volumetric calculations. In this first approach, an average velocity, estimated from sonic well logs, was used to convert leads maps from time domain to depth. Assuming the occurrence of plausible optimistic geological conditions, the last closed contour line for each one of these 40 leads maps was considered ‘max-area’. The Gross
rock volume (GRV) calculation within this area was performed using Kingdom® software built-in tools and assigned to P05. Using GRV instead of area and thickness as input parameters for GIIP has the advantage of avoiding geometric misjudgment when trying to define a geometric factor to account for leads displaying the bowler hat shape (Rose 2001). Similarly, GRV
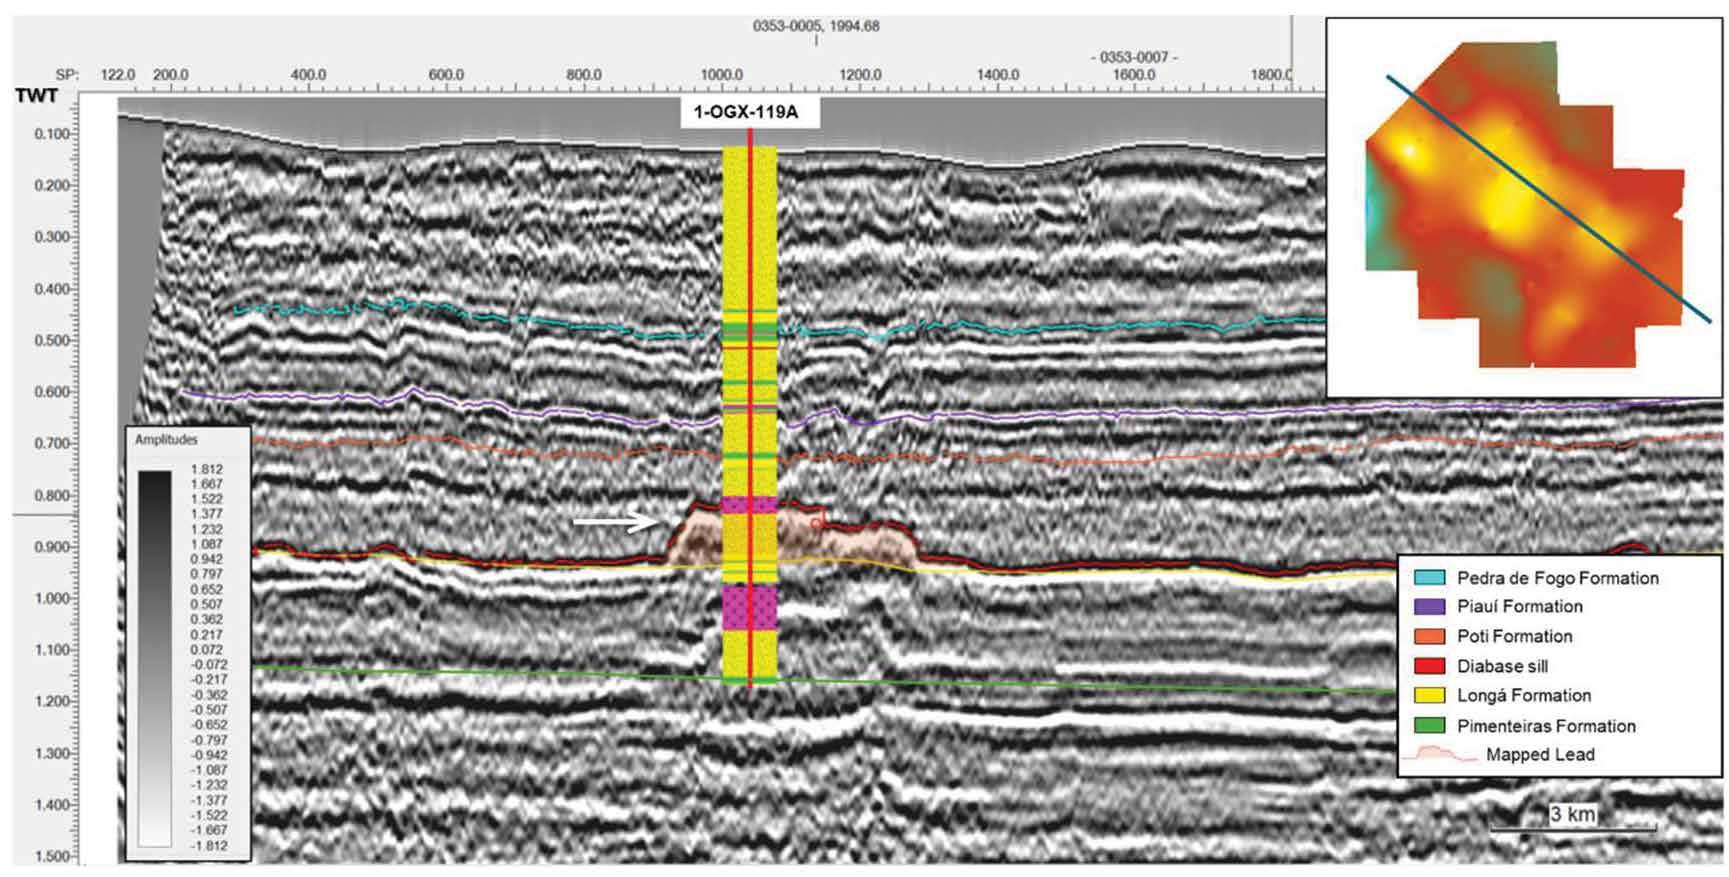
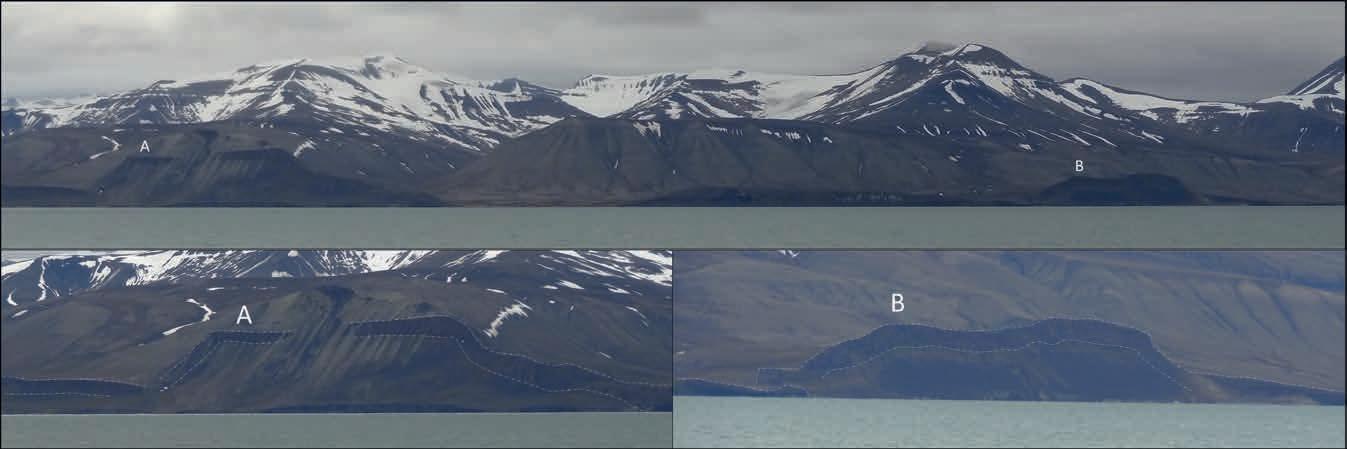
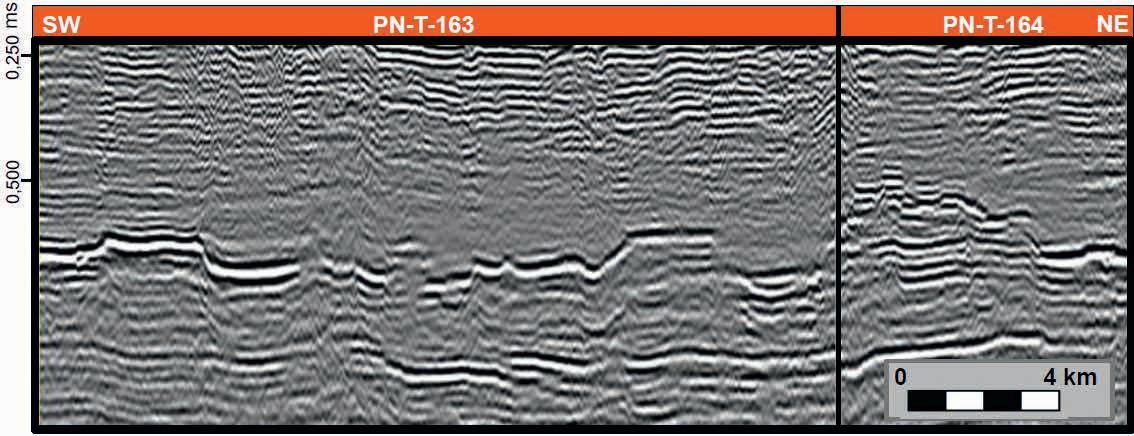
5 2D seismic section (time) in the Parnaíba Basin displaying three bowler hat structures formed by a Jurassic/Cretaceous diabase sill intruding into a Carboniferous sedimentary section. All the circa 20 discoveries of gas in the basin are hosted in structures similar to these.
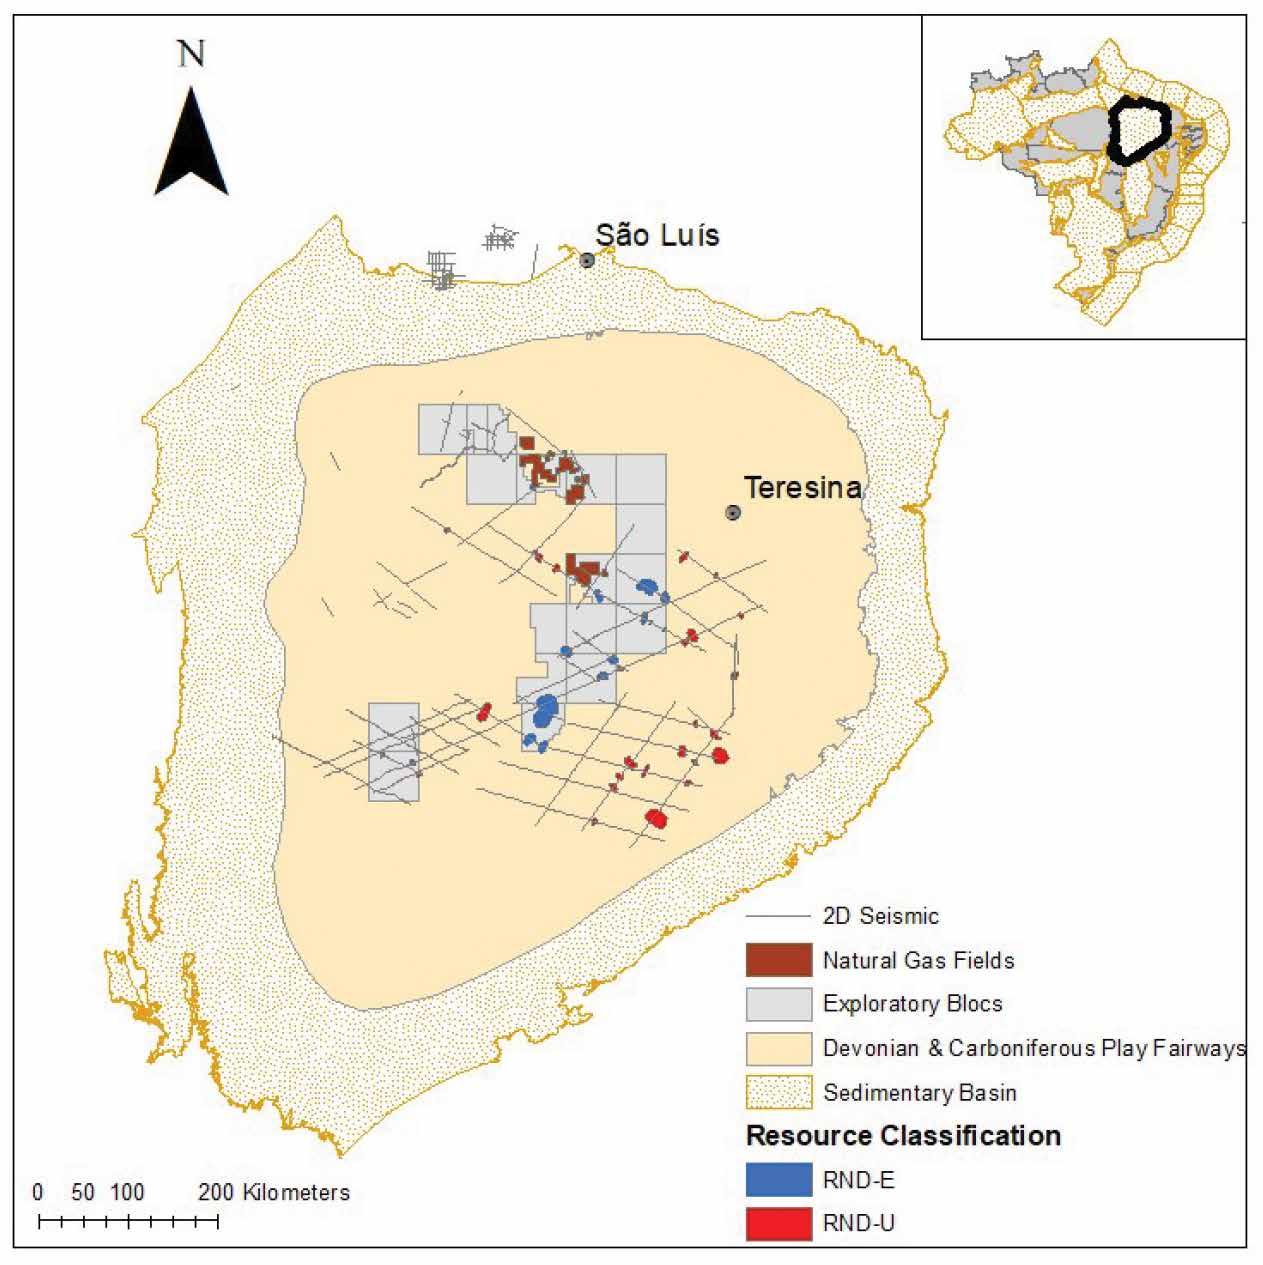
calculation was performed within a pessimist ‘min-area’, picked considering a still reasonable volume to be exploited by one well, and appointed to P95. Finally, GRV within an intermediate area, given the most likely conditions, represents P50.
For the other input parameters, such as net-to-gross ratio, porosity (PHI), water saturation (Sw) and formation volume factor (Bg), we considered, for all 40 leads, the average value presented by Eneva for each scenario (optimistic, most likely, and pessimistic) in one of its development plans in Hawks Park (Eneva 2020). All 40 leads were examined as being potential accumulations of dry gas. (1)
The lognormal distribution addresses uncertainty in volume calculation and in one of its percentiles is the ultimate oil and gas recovered volume in case of an economically viable discovery (Rose 2001). Thus, risk is defined as the probability of a discrete event occurring or not (SPE 2001). Three scenarios for Chance of Success (chance = 1 - risk) were analysed through Monte Carlo Simulation built in Palisade software @Risk.
For the first scenario the leads P50 contours were plotted over HC discovery chance for the Devonian play in the Parnaíba Basin, a map published in EPE’s study called ‘National Zoning of Oil and Gas Resources (ZNMT)’ in its 2019-2021 version (EPE 2021). The Chance of Success for this scenario, henceforth referred as ‘scenario 1’, is the map attribute value in its intersection with each lead (Figure 7a). Although the present work made no distinction between Devonian and Carboniferous play for volumetric assessment, the choice of using only Devonian
chance map and not Devonian (P(A)) and Carboniferous (P(B)) maps combined is because this combination (P(A) U P(B)) would bring with it the danger of high values which are not compatible with petroleum exploration ventures, especially in this context of such scarce data (Costa et al. 2013).
Another value assumed as Chance of Success for these leads was the 30% success rate of wildcats reported by Eneva in its campaign in the Parnaíba Basin (Eneva 2023b). For this scenario, named ‘scenario 2’, all 40 leads have the same Chance of Success of 30%.
For the last scenario, ‘scenario 3’, leads were grouped and assessed for risk in relation to their distance from Hawks Park trend. Following the categorisation summarised by Otis and Schneidermann (1997), the first green boundary in Figure 7b circumscribe leads in adjacent structures to Hawks Park rated with a 0.75 Chance of Success. As mentioned before, all 40 leads target the same play drilled in the known accumulations. Continuing outward from the Hawks Park trend, three other boundaries were drawn to distinguish increasingly distant leads. In shades of orange to red, a second boundary encircles leads within the same play in nearby structures rated with a 0.375 Chance of Success; a third boundary, leads in a new trend rated with a 0.25 Chance of Success; and a last boundary encompasses a region where dry holes have been recently drilled and these leads are rated with a 0.125 Chance of Success.
In order to obtain a volume that represents the total prospective resources expectation within the basin and embeds both uncertainty and risk analyses, leads volumes need to be summed up with respect to Chance of Success. Thus, to obtain the potential prospective resources within Devonian and Carboniferous
plays in the Parnaíba Basin, leads volumes were aggregated using the following equation:
where m is the number of leads; FCi is a Bernoulli variable which takes the value 1 with probability P equal to Chance of Success of ith lead, in the specific chance scenario analysed, and the value 0 with probability 1 - P; and GIIPi is the lognormal volume distribution of the ith lead.
For a reality check, leads GIIP volumes were compared to in place volumes presented by Eneva to ANP for its discoveries made in the Parnaíba basin (ANP 2023c). Figure 8 summarises this comparison with orange circles referring to gas in place volume of Eneva’s accumulations in Hawks Park and blue circles to leads volumes calculated by EPE (Equation 1). For leads volumes, the circle represents distribution P50 and dispersion
bars are limited by P10 and P90. Considering uncertainty beyond the P50, 38 out of the 40 leads present GIIP volumes within the range of Hawks Park accumulations. This indicates that the input parameters considered in this work are in accordance with what is expected in terms of reservoir and fluid characteristics in this basin for the analysed plays. It is worth highlighting that values shown in Figure 8 are values for volumes only, with no risk applied.
Assessing risk (risk = 1 - chance) to account for prospective resources potential volume in the Parnaíba Basin yields a different distribution for each Chance of Success scenario analysed. These volumes were obtained through Equation 2 using Monte Carlo Simulation. Some statistical parameters of these distributions are summarised in table 1 for RND-E and table 2 for RND-U. Since leads identification was restricted by seismic coverage, the studied area (130,000 km2) encloses only about 1/3 of the 400,000 km2 extension of Devonian and Carboniferous play fairways (Figure 9). In order to extrapolate the volume analysis to uncovered areas within the play fairways, RND-U Monte

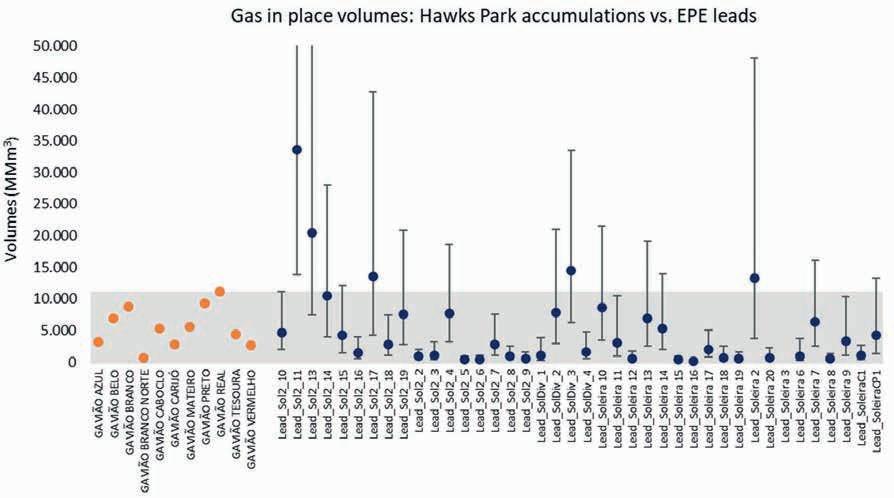
Figure 8 GIIP volumes reported by Eneva in Hawks Park (orange circles – ANP, 2023c) compared to leads GIIP volumes assessed by EPE in the Parnaíba Basin (blue circles).
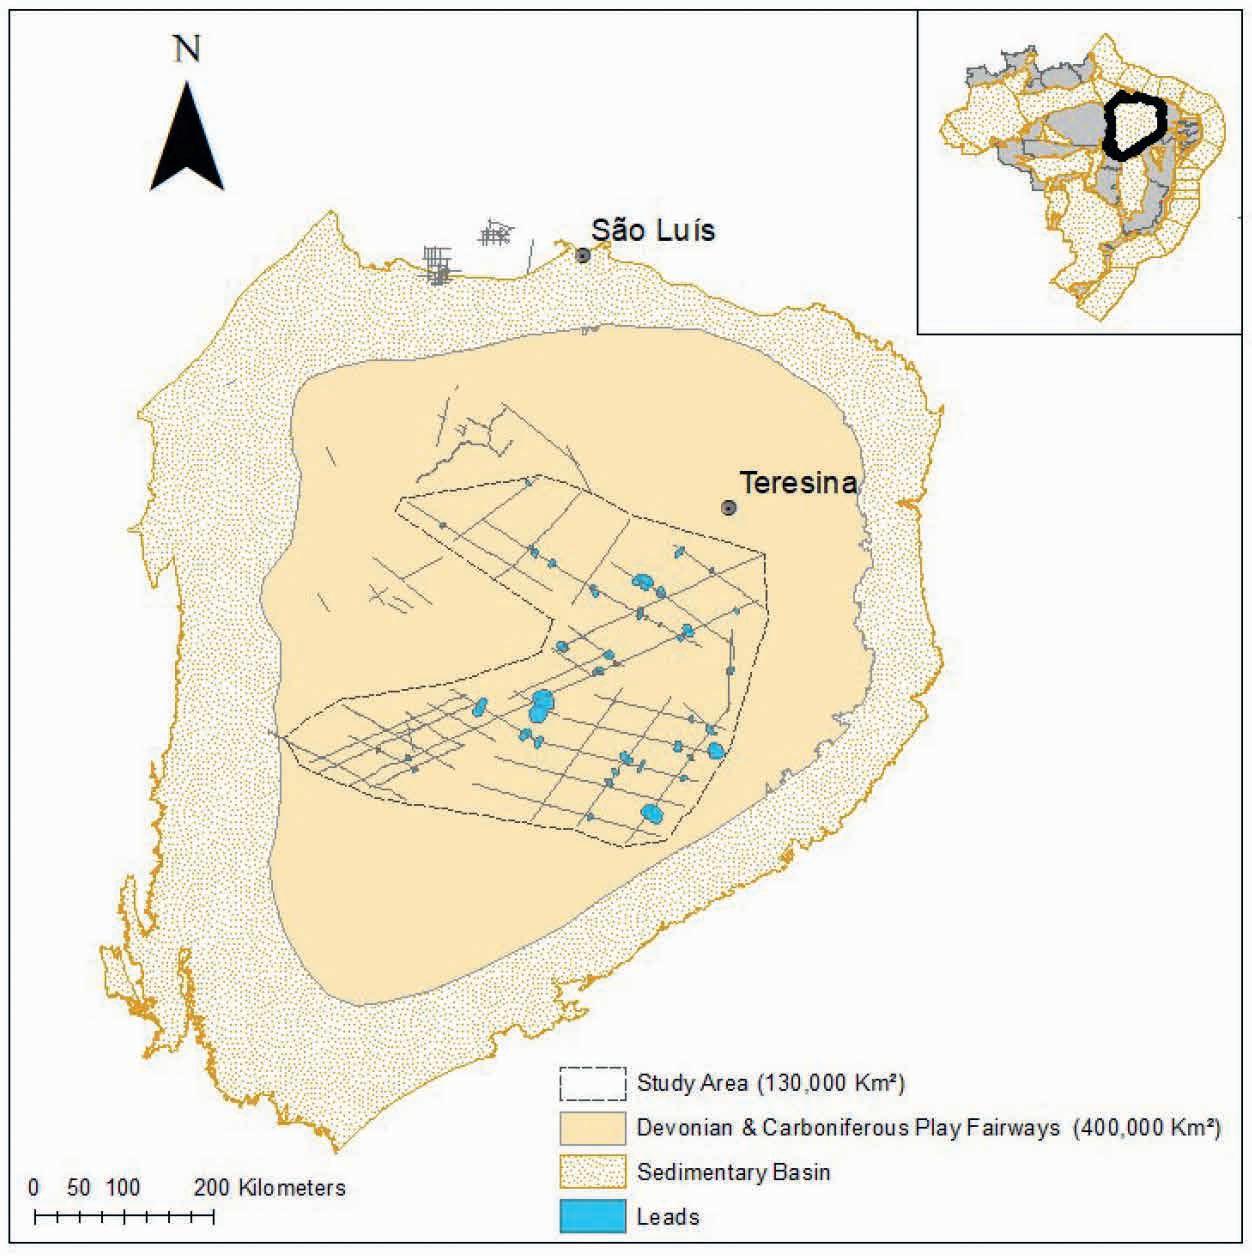
9 Detail of basin area covered by 2D seismic available (ANP, 2023b). Studied area encloses around 1/3 of Devonian and Carboniferous play fairways area.
Table 1 Comparison between scenarios for RND-E risked volumes.
Carlo Simulation results were multiplied by three. The contour of Devonian and Carboniferous play fairways was drawn as the union of these limits as they appear in ZNMT in its 2019-2021 version (EPE 2021).
For both RND-E and RND-U resources scenarios 2 and 3 show similar resulting distributions. In this case, success rate of Eneva wildcats in the Parnaíba basin (scenario 2) could be seen as an approximation for the mean of Chance of Success assessed individually for each lead in scenario 3, bringing both analyses together. On the other hand, higher values shown in scenario 1 are related to a more optimistic evaluation of risk in this scenario in comparison with the other two.
EPE in its mission seeks to carry out studies that contribute positively to reduce information asymmetry and subsidise the adoption of adequate strategies in planning and developing the national energy sector. A methodological identification and inventory of prospective hydrocarbon resources supports future production curves, which will be part of the Brazilian energy matrix planning in the Ten-Year Energy Plan (PDE) and in the National Energy Plan (PNE).
3*
Table 2 Comparison between scenarios for RND-U risked volumes. (*) RND-U volumes multiplied by 3 to account for uncovered areas within the basin.
Uncertainty is a key factor in any future prediction. This task is even more challenging in oil and gas exploration, a well-known high-risk activity. To support decision-making in such an environment, this methodology addresses uncertainty through volumetric distributions and risk through Monte Carlo simulations and scenarios to account for some of the numerous possible outcomes.
Considering all RND-E and RND-U areas together within the Parnaíba Basin, a mean value for total prospective resources of Devonian and Carboniferous plays ranges from 216.4 to 631 Bm3 of gas, 7.64 Tcf and 22.28 Tcf respectively. Minimum and maximum values of these distributions vary according to the uncertainty range of each Chance of Success scenario analysed. Although EPE has just started working with primary data interpretation and the results here presented are first and preliminary, its use is backed by comparison with volumes of accumulations in Hawks Park.
The authors would like to express their deepest gratitude to EPE for allowing these results to be published and its Exploration
and Production Unit team for the insightful discussions. Special thanks goes to Péricles Brumati, Victor Trocate and Nathália Castro for their contribution in reviewing and editing this article. Finally, the authors want to express their appreciation to the anonymous reviewer’s suggestions, which significantly improved the present version of this work.
ANP [2023a]. Tabela de poços. Retrieved July 11, 2023, from https:// www.gov.br/anp/pt-br/assuntos/exploracao-e-producao-de-oleo-egas/dados-tecnicos/acervo-de-dados.
ANP [2023b]. Programa de revitalização da atividade de exploração e produção de petróleo e gás natural em áreas terrestres (REATE). Retrieved February 5, 2023, from https://reate.cprm.gov.br/anp/TERRESTRE.
ANP [2023c]. Painel dinâmico de recursos e reservas de hidrocarbonetos. Retrieved July 8, 2023, from https://www.gov.br/anp/ pt-br/centrais-de-conteudo/paineis-dinamicos-da-anp/paineis-dinamicos-sobre-exploracao-e-producao-de-petroleo-e-gas/painel-dinamico-de-recursos-e-reservas-de-hidrocarbonetos.
ANP [2023d]. Boletim de produção de petróleo e gás natural. Retrieved August 12, 2023, from https://www.gov.br/anp/pt-br/centrais-de-conteudo/publicacoes/boletins-anp/boletins/boletim-mensal-da-producao-de-petroleo-e-gas-natural.
Costa, L.A.R., Zalán, P.V. and De Mendonça Nobre, L.P. [2013]. Estimativa da chance de sucesso exploratório: uma abordagem em três passos consistente com a classificação de recursos petrolíferos Boletim de Geociências da Petrobras, 21(2), 313-324.
Cunha, P.R.C., Bianchini, A.R., Caldeira, J.L. and Martins, C.C. [2012]. Parnaíba Basin – the awakening of a giant. 11th Simpósio Bolivariano – Exploracion petrolera en las cuencas subandinas; Session nuevas fronteras I, Cartagena das Indias, Colômbia. ACGGP.
ENEVA [2020]. Plano de Desenvolvimento do Campo de Gavião Carijó.
ENEVA [2023a]. Nossos negócios: Complexo Parnaíba. Retrieved October 5, 2023, from https://eneva.com.br/nossos-negocios/geracao-de-energia/complexo-do-parnaiba/.
ENEVA [2023b]. Nossos negócios: Exploração e Produção. Retrieved August 8, 2023, from https://eneva.com.br/nossos-negocios/exploracao-e-producao/.
EPE [2021]. Zoneamento nacional de recursos de óleo e gás: ciclo 2019-2021. Brasília, DF: Ministério de Minas e Energia & Empresa de Pesquisa Energética, 127 p. Retrieved February 20, 2023, from https://www.epe.gov.br/pt/publicacoes-dados-abertos/publicacoes/ zoneamento-nacional-de-recursos-de-oleo-e-gas-2019-2021.
EPE [2022]. Previsão de produção de petróleo e gás natural: estudos do plano decenal de expansão de energia 2032. Retrieved February 5, 2023, from https://www.epe.gov.br/sites-pt/publicacoes-dados-abertos/publicacoes/PublicacoesArquivos/publicacao-703/NT-EPEDPG-01-2022_AtualizacaoZNMT2019_2021_Prospectividade_IPATotal_2022.11.17_v1.pdf.
Fornero, S.A., Millett, J.M., Fernandes de Lima, E., Menezes de Jesus, C., Bevilaqua, L.A. and Marins, G.M. [2023]. Emplacement dynamics of a complex thick mafic intrusion revealed by borehole image log facies analyses: Implications for fluid migration in the Parnaíba Basin petroleum system, Brazil. Marine and Petroleum Geology, 155, 106378.
Milani, E.J. and Zalán, P.V. [1999]. An outline of the geology and petroleum systems of the Paleozoic interior basins of South America. Episodes, 22(3), 199-205.
Miranda, F.S. [2014]. Pimenteiras shale: characterization of an atypical unconventional petroleum system, Parnaiba Basin, Brazil. AAPG Datapages/Search and Discovery Article # 10639, AAPG International Conference & Exhibition, Istanbul, September, 22 p.
Miranda, F.S., Vettorazzi, A.L., Cunha, P.R., Aragão, F.B., Michelon, D., Caldeira, J.L. and Andreola, K. [2018]. Atypical igneous-sedimentary petroleum systems of the Parnaíba Basin, Brazil: seismic, well logs and cores. Geological Society of London, Special Publications, 472, 341-360.
Otis, R.M. and Schneidermann, N. [1997]. A process for evaluating exploration prospects. AAPG Bulletin, 81(7), 1087-1109.
Rose, P.R. [2001]. Risk analysis and management of petroleum exploration ventures. AAPG Methods In Exploration Series, 12, 164 p.
SPE [2001]. Guidelines for the evaluation of petroleum reserves and resources: a supplement to the SPE/WPC petroleum reserves definitions and the SPE/WPC/AAPG petroleum resources definitions. Society Of Petroleum Engineers, 141 p.
Trosdtorf Jr., I., Morais Neto, J.M., Santos, S.F., Portela Filho, C.V., Dall Oglio, T.A., Galves, A.C.M. and Silva, A.M. [2018]. Phanerozoic magmatism in the Parnaiba Basin: characterization of igneous bodies (well logs and 2D seismic sections), geometry, distribution and sill emplacement patterns. Geological Society of London, Special Publications, 472, 321-340.
Vaz, P.T., Andrade, N.G.M.R., Ribeiro, J.W.F. and Travassos, W.A.S. [2007]. Bacia do Parnaíba. Boletim de Geociências da Petrobras, 15(2), 253-263.
Zalán, P.V. [2023]. Potencial petrolífero remanescente do Brasil – estado da arte 2023. Derbyana, 44(e788), 52 p.


The seismic industry is being transformed by machine learning and artificial intelligence to produce faster, more accurate and accessible data.
Mike Powney et al present a workflow that will reduce time frames to FID, improve geologic understanding and serve as part of the full value chain that Geoex MCG and associated partners are able to offer.
Sergey Alyaev et al present a specialised, local, open-source chatbot solution that combines fine-tuned AI retrieval and summarisation methods for answering questions from internal documents.
Christophe Germay et al present an innovative non-destructive core digitalisation platform that transforms conventional core analysis by creating high-resolution, multidisciplinary digital logs along the entire length of a core.
Markus, D et al present a new workflow for creating 3D volumes from 2D seismic data using a post-stack, interpretation-guided, data-driven process that combines conventional techniques with deep learning algorithms.
Mario Ruggiero et al present a Computer Vision System for automated and uncrewed shale shaker visual monitoring, coupled with deep learning (DL) artificial intelligence (AI) models, that produces high-frequency objectively interpreted realtime data, recorded and plotted along drilling parameters.
Altay Sansal et al address the complexities of large-scale training on a global dataset of 63 seismic volumes and leverage a cloud-native, digitalised seismic data infrastructure.
Julie Vonnet et al explore how Python APIs facilitate the connection to external data sources, deploying ML models and customised solutions with minimal programming expertise.
Norman Mark presents a method for automated horizon picking from 3D seismic data for the purposes of automating subsurface mapping.
First Break Special Topics are covered by a mix of original articles dealing with case studies and the latest technology. Contributions to a Special Topic in First Break can be sent directly to the editorial office (firstbreak@eage.org). Submissions will be considered for publication by the editor.
It is also possible to submit a Technical Article to First Break. Technical Articles are subject to a peer review process and should be submitted via EAGE’s ScholarOne website: http://mc.manuscriptcentral.com/fb
You can find the First Break author guidelines online at www.firstbreak.org/guidelines.
January Land Seismic
February Digitalization / Machine Learning
March Reservoir Monitoring
April Underground Storage and Passive Seismic
May Global Exploration
June Navigating Change: Geosciences Shaping a Sustainable Transition
July Modelling / Interpretation
August Near Surface Geo & Mining
September Reservoir Engineering & Geoscience
October Energy Transition
November Marine Acquisition
December Data Management and Processing
More Special Topics may be added during the course of the year.
Mike Powney1*, Jeniffer Masi1, Theresia Citraningtyas2, Behzad Alaei2, Sharon Cornelius3, Felix Dias3 and Pete Emmet3 present a post-stack conditioning and machine learning workflow that will reduce time frames to FID for CCS projects, improve geologic understanding and serve as part of the full value chain (site evaluation to monitoring) that Geoex MCG and associated partners are able to offer.
Introduction
Having a well-developed understanding of the subsurface is paramount to selecting sites for carbon capture and storage (CCS). This requirement is well established and, as such, has led to historically explored areas becoming hotspots of activity for potential CCS projects. Not only do these areas have the significant infrastructure in place to allow the transport of CO2 but a plethora of data already exists to begin the subsurface evaluation process. This does, however, raise some considerable challenges such as: how can subsurface teams identify and compare potential carbon storgage sites using seismic with signifcant vintage differences? and most importantly, how can industry leverage all the other existing data, in a concise way to reduce the time to FID on these types of projects? One such area that requires such
considerations is the Gulf of Mexico (GoM). Here, numerous 2D/3D volumes are available from the BOEM website which allows areas of the offshore to be evaluated. However, often too much data can cause issues.
In order to solve these problems, a workflow has been developed by Geoex MCG along with ESA, utilising machine learning, to improve the effectiveness in which these decisions can be made using already existing data. This has significantly improved understanding of the subsurface and assisted with the identification of areas that are possible candidates to sequester CO2. Geoex MCG teams evaluated a regional area of ~31,000 km2 in significantly reduced timeframes and were able to identify a series of sites with CCS potential. A total of 8 x 3D volumes and 3 x 2D volumes were assimilated for the study, ranging in vintage from
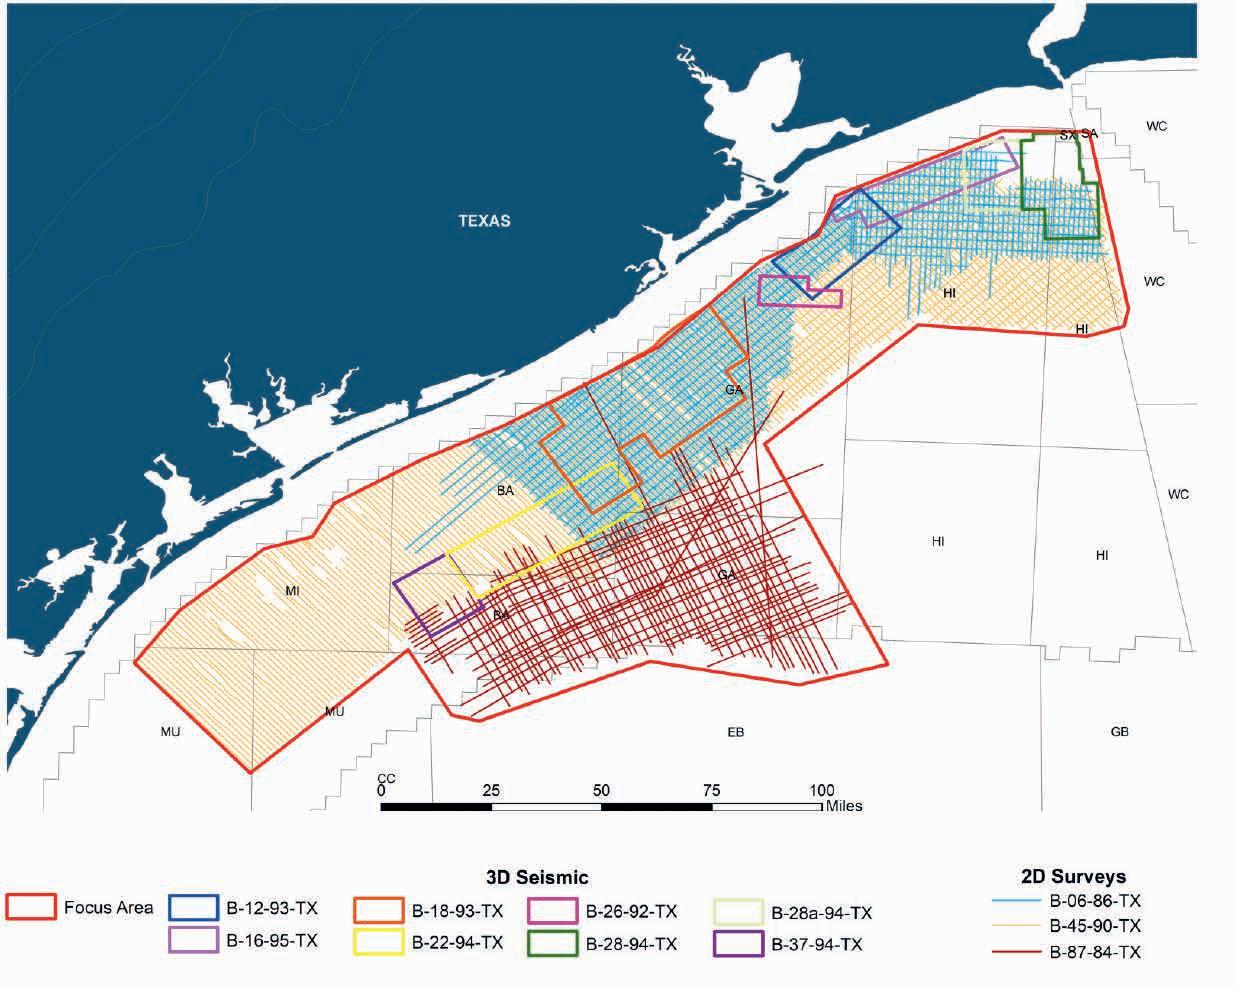
1 Geoex MCG | 2 Earth Science Analytics | 3 Brazos Valley GeoServices
* Corresponding author, E-mail: mike.powney@geoexmcg.com DOI: 10.3997/1365-2397.fb2025011
Figure 1 Location of the study in the GoM.
1984-1995 (Figure 1). This workflow will reduce timeframes to FID, improve geologic understanding and serve as part of the full value chain (from initial suitability studies, to baseline surveys and finally monitoring) that Geoex MCG and associated partners are able to offer.
The Gulf of Mexico is a prolific and well understood oil and gas basin which has been the subject of significant exploration activity. As a result, the geological history, tectonics and deposition is well established and understood, contributing to the development of any potential CCS project. Whilst this article will briefly outline the features that lend themselves to CCS, readers are encouraged to review articles such as Galloway et al. (2008) for a more thorough overview. The first phase of rifting began in the Late Triassic to Early Jurassic period and, as is common in these environments, subsidence followed with basin-wide crustal thinning in the Early to Middle Jurassic. A key feature of this time period was the opening of the margin to the Pacific Ocean which later resulted in the formation of the Louann salt province. Salt deposition would serve as a defining event for the later structural evolution due to its ubiquitous nature throughout the marginal crustal embayments and the thin transitional crust of the AOI.
Following the sag and initial sedimentary deposition, the Late Jurassic marked a key epoch within the Gulf of Mexico as the Yucatan block began to drift southward from the North American plate. As the Yucatan block drifted in a counterclockwise motion, the second phase of rifting was initiated (Pindell & Keenan, 2001).
The aforementioned timing of crustal spreading is enforced by the age of oceanic crust measured in the centre of the GoM. Oceanic crust ranges in age between the Oxfordian (Late Jurassic) to the Late Berriasian- Early Valanginian (Sawyer, 1991).
As the margin approached the end of the Early Cretaceous, the combined deposition of rimmed carbonates platforms amongst the subsiding basin created the morphology of the GoM that is recognised today (Yurewicz et al, 1993, Galloway, 2005b).
The continuing history of the basin is dominated by loading subsidence and intra-basinal gravity tectonics which had significant consequences for Tertiary sediments.
During this period, sediment yields and deposition increased significantly. Very high sediment volumes started to enter the
Northern Gulf of Mexico (Galloway et al, 2011). Deltaic influence continued through the Oligocene to Miocene. This deposition has subsequently led to the formation of key reservoirs for both oil and gas exploration as well as potential CCS sites.
Continued loading stresses resulted in salt excavation and further movement resulting in both local and regional faulting (Hudec et al, 2013b, McBride, 1998). The result of this is the creation of associated roll-over structures and anticlines. Formations such as this provide possible trapping structures in the subsurface and viable targets for CCS injection. A cross section (Figure 2) through a similar location to the AOI shows possible geometries expected in the subsurface. Ages and depositional environments are summarised with the AOI demarcated in red.
The initial areas of interest are targeted below 800 m which will ensure that the CO2 remains in a super-critical state allowing for increased storage capacity. The intended targets are also proposed above the areas of overpressure to ensure operations are more favourable for CCS. Initial geological analysis shows that the area has all of the required components (i.e. infrastructure, reservoir, seals and structure) required for a CCS industry to thrive.
In order for initial screening of suitable areas to be undertaken, vintage seismic volumes provide a valuable insight into the subsurface without having to spend considerable resources on new acquisition. Understanding the optimal locations for sequestration activities requires a geophysical insight whereby legacy seismic can provide a crucial role.
The oil and gas exploration activities in the GoM have been considerable, which has resulted in significant acquisition of seismic throughout the region. As such a carpet of data is available and can be accessed and assimilated via the BOEM which make this seismic data available, 25 years after acquisition. This availability initiated the process of regional screening for suitable CCS sites. These datasets vary considerably in terms of their acquisition and processing parameters and, as such, there are inherent data issues associated with the vintage data both individually and when compared to adjacent surveys. To reprocess all the selected vintage seismic data would be a considerable time and financial commitment which can be mitigated by completing a post-stack reconditioning methodology. As such, Geoex MCG developed a
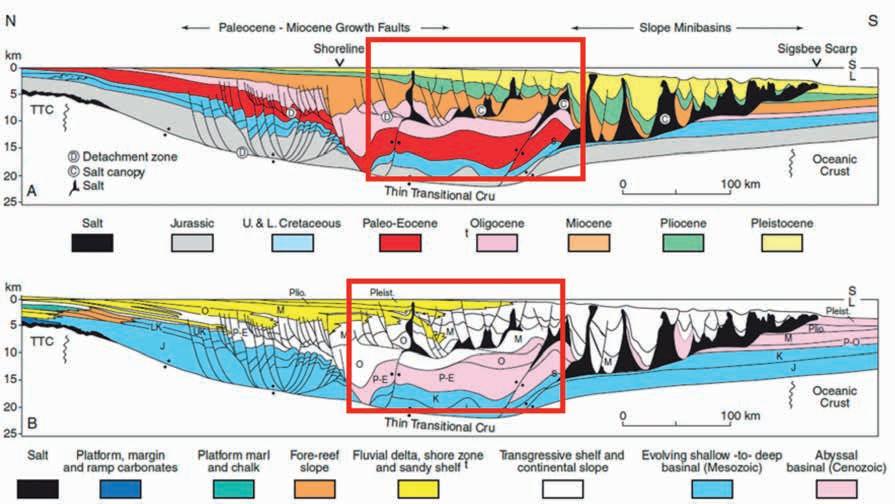
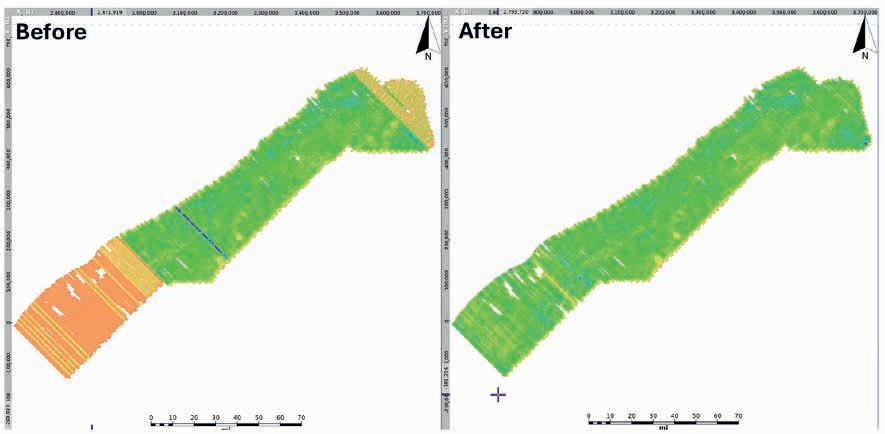
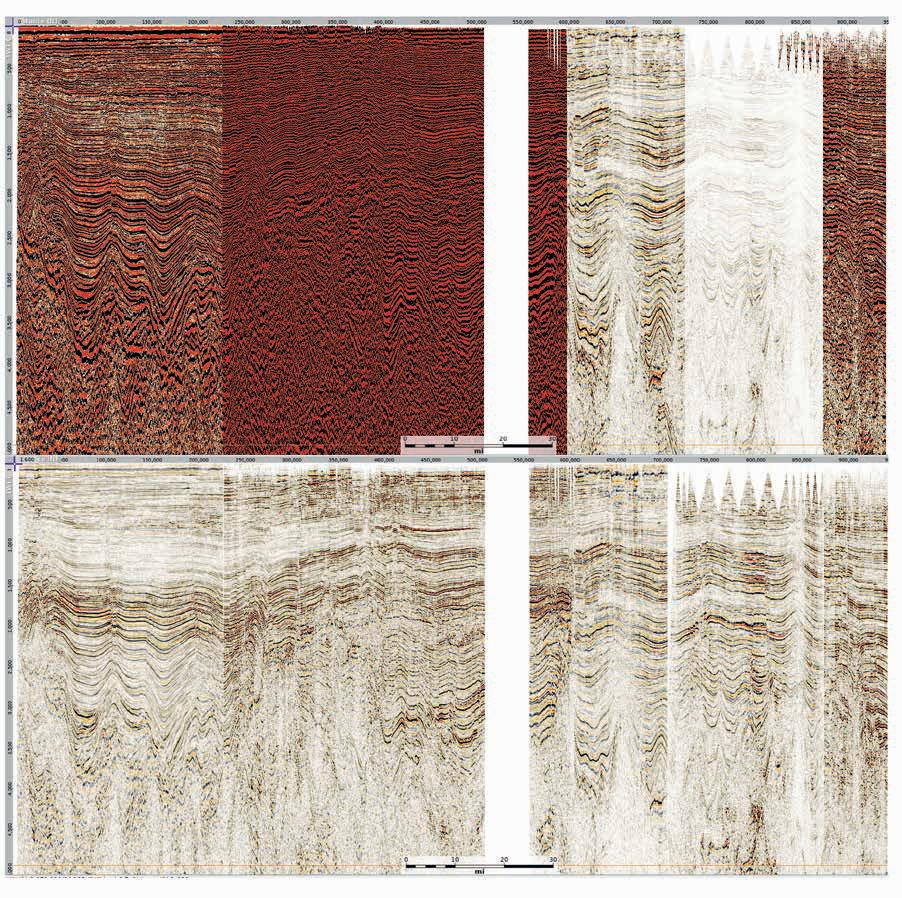
comprehensive workflow to match data in the time, amplitude and phase domain.
The resulting output is a series of 3D volumes which have been merged to form a single interpretable seismic volume with the aim of reducing the uncertainty in CCS prospect evaluation. To perform such an undertaking, the initial volumes had to be QC’d to investigate inherent issues that may exist within the dataset. This varied between each volume but highlighted significant issues that required addressing before progress could be made (Figure 3). A simple RMS extraction highlighted the areas that required addressing to create a balanced survey internally (Figure 3).
Once the surveys had been internally balanced, a reference survey could be selected. The reference survey was selected based on the balance of the frequency spectra compared to the other surveys. Once the optimal volume was selected, seismic volumes could be conditioned in a radial pattern away from the
reference survey. A bulk shift in amplitudes was the first step to establishing comparable amplitudes between the volumes. This was followed by a mis-tie analysis which ensured that the amplitudes were appropriately shifted in the time domain to match amplitudes across adjacent volumes. Due care and attention was taken to ensure that realistic and required changes were undertaken without altering the amplitudes significantly. The next phase of the post stack conditioning workflow involved a time-pair amplitude balancing method. This allowed the amplitudes of specific sections of the legacy volume to be matched with the reference volume providing a flexible approach to altering issues with legacy processing (i.e. lack of Q compensation).
After completion of the time matching process, the section was relatively well balanced but there was often a contrast between the contribution of the high and low frequencies in
the seismic. To account for these differences a True Amplitude Frequency Equalisation (TAFE) was completed to match the frequencies across the volumes. This function manipulates, in a bespoke manor, the frequency spectrum to ensure a better fit to the reference survey. This is useful when high frequencies have been boosted or are particularly prominent in a survey by imposing a scalar which reduces the prominence of the feature or boosts frequencies as required. The gain values between control points are linearly interpolated across values to ensure a seamless blend between frequencies. The selection of this method was predicated on the requirement to have maximum control whilst carrying out the process.
Having completed balancing and matching in the amplitude and time domain, the final fundamental step is wavelet matching across surveys. This process matches the phase to the reference survey. To zero phase the data, a wavelet over a specific window is selected in an area of survey overlap. The extracted wavelet is zero-phased and then convolved to the survey which requires a phase shift, to match the data across the two surveys. This results in an optimal blend across volumes; minimising remaining differences. An example of the before and after conditioning volume is shown in figure 4. This example represents an arbitrary line through different surveys.
With the data conditioned, it was imperative to combine the conditioned seismic into a single useable volume. Interpretation and thus subsurface evaluation could now commence.
With the data zero phased and conditioned, synthetics could subsequently be completed to tie the wells to the seismic. Further analysis of the log suite was then undertaken and extrapolated using machine learning. Over 70 wells were analysed to find locations of preferential reservoir and seal. Well logs such as Gamma Ray, Density, Sonic, Resistivity, Neutron Porosity and CPI were all utilised to improve subsurface understanding. Analysis of these wells equated to a total of 700 miles worth of interpretation. Understanding the well data in the x,y domain as well as the z domain was the initial and vital step to leveraging existing data (Figure 5). This initial QC process assisted with understanding which ‘labels’ were important and key log locations for 1D rock
and fluid property prediction. Labels and features were subsequently selected forming the training and prediction datasets. Once complete, a thorough data QC process was undertaken using either a single or multi semi-automatic QC process. Data quality and issues within the data i.e. unit issues, spikes, interpolation etc. were analysed and subsequently corrected and cleaned to ensure a working dataset.
The machine learning processes could now be undertaken. Wells with significant outliers were often observed and subsequently removed given their unrealistic figures. This process removed ~5-6% of the data. Using a ‘flag’ or parameter, the best hole conditions can be taken for the process which becomes the baseline for further analysis. Further outliers which are less evident are also removed in this process.
With the datasets examined and ‘cleaned’ to ensure outliers are removed, further analysis and data ‘fill-in’ followed. Below in figure 5 the original data points are located on the left-hand side image. By completing this process, the number of wells with reliable density measurements has almost doubled with infill points, almost three times more than the beginning of the process. These points are subsequently QC’d and sense checked to ensure that there is a reliable correlation between points within wells and those extrapolated.
The machine learning model consists of several different models with varying algorithms with multiple features that assists in producing an output of logs. Multiple predictions are made from the different models based on the coverage and reliability. These logs extrapolate information from different wells to create a complete log suite for the well required.
Below in figure 6 is an example of the log suite and lithology predictor from the Machine Learning algorithms. A series of QC steps are completed involving blind testing to compare the ML algorithm with existing logs to see how the algorithm has performed. If the algorithm is able to match existing well logs after a blind test is carried out, the extrapolations are deemed reliable to use and imputed to create the full log suites. As is visible below (Figure 6), several logs are unavailable in the well. However, with imputation, these can be completed or created reliably to obtain a suite of logs.
After the imputation process is complete, an initial site identification process could be undertaken. This is depicted in Figure 7. From the initial results, the best reservoirs and seals are visible from the well information.
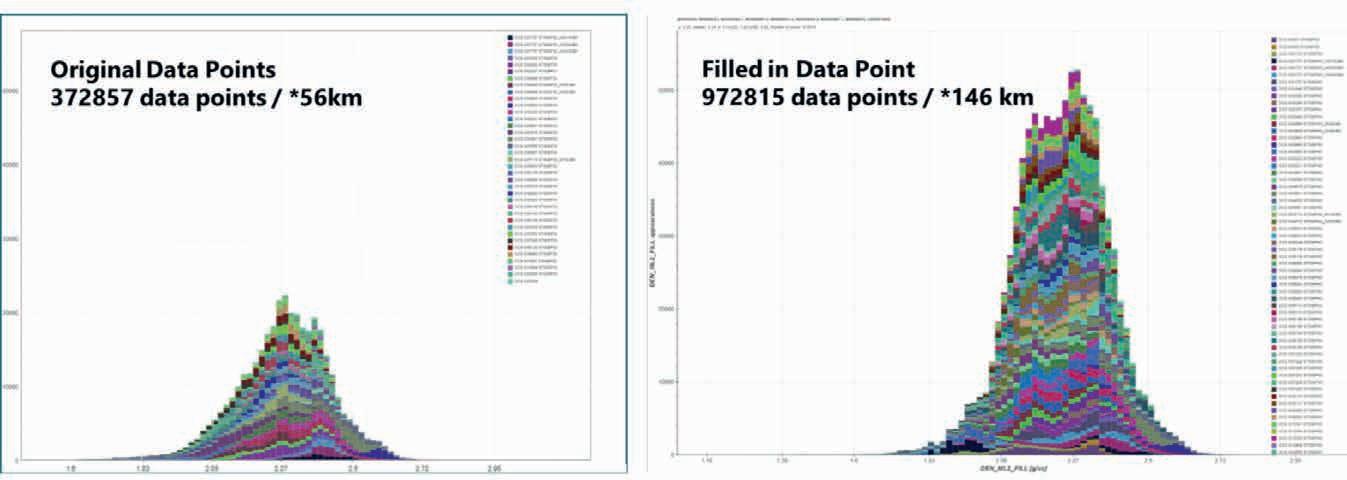
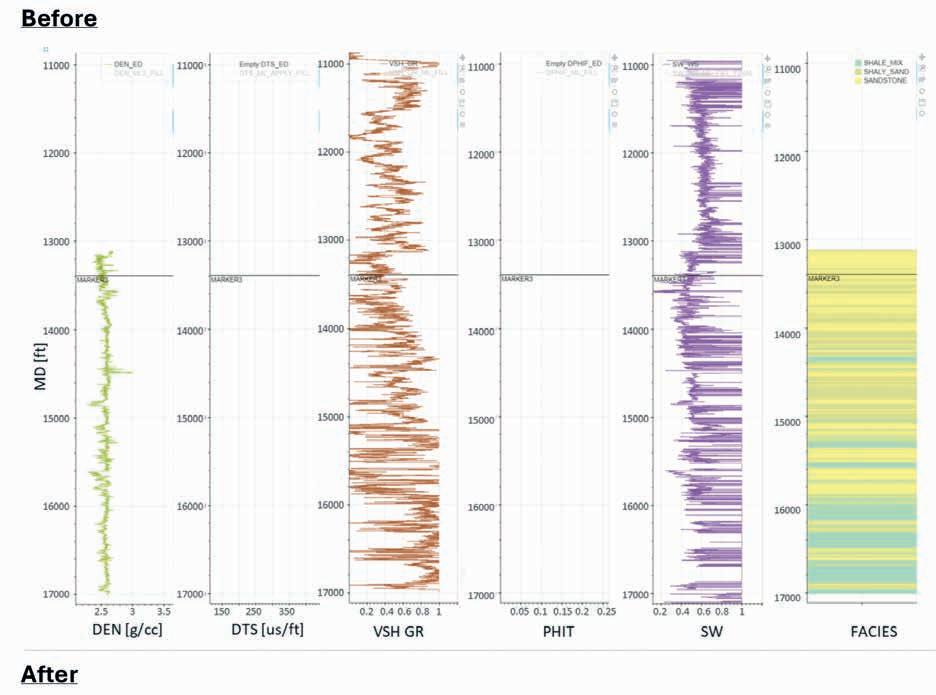
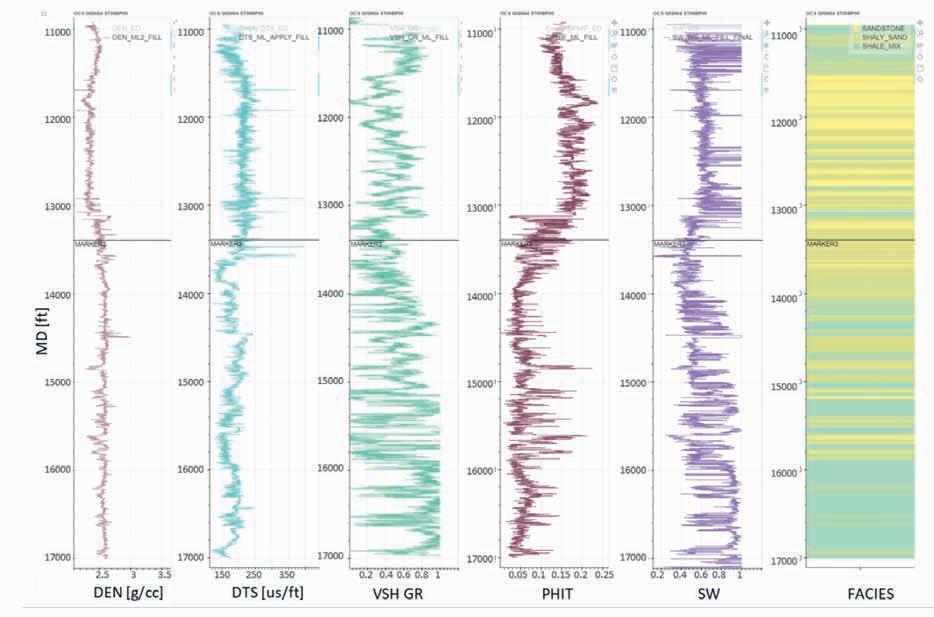
With wells and seismic conditioned into useable formats, interpretation works followed. It was key for regional horizon interpretation that these intervals were consistent throughout the basin. For this study, biostratigraphic information also available though the BOEM have been used to identify a total of five seismic horizons interpreted regionally. These horizons reflect key reservoir and seal lithologies. Tops were imported and analysed, where available, with decisions regarding veracity of stratigraphic markers established. Interpreting the seismic for the entire AOI would have been a significant undertaking and, as such a method was required to complete the process faster without compromising the interpretation quality. This desire for a fast, accurate interpretation was well-suited towards utilising machine learning (ML) workflows developed by ESA. To increase the level of control on the results, a supervised learning approach was deemed to be the most appropriate. Supervised learning is the process in which the
machine learning software provides a series of ‘labels’ or ‘ground truths’ that indicate the character of what needs to be captured. The machine learning models are iteratively trained with the full stack seismic volumes as ‘features’ and horizon interpretation as ‘labels’ or ‘ground truths’. The models are then applied to the seismic volumes, interpreting and finding similar characters on each section until the entire volume is interpreted. For this process, initial label identification for horizon interpretation was completed on every 100 inlines and crosslines which was then provided for the model as the initial input.
Interpreting horizons in the AOI is complex owing to the geological history. With the significant input of the river systems, vast clastics are deposited throughout. This results in terminations of horizons abruptly during transgressive-regressive pairs and significant lateral terminations with the migrating fluvial systems. Combined with salt deposition, these features represent a challenging subsurface environment for interpretation due to
their heterogeneity. In this sense, identifying key horizons and mega-sequences posed a significant challenge. The use of ML in this instance allowed further identification of the possibilities of the horizon and a confidence range that could be attributed to the horizon as they were interpreted away from well control. This enabled the process of horizon picking to be numerically quantified as well as geologically sense checked for a more complete interpretation.
EarthNET, an Earth Science Analytics software, was utilised for the ML process. This software has been trained using horizon picking on global datasets to improve the prediction algorithm and extrapolate horizons with sufficient accuracy. Once the labels have been inputted for our study and the initial model complete, the results were reviewed in a geologic context to assess the overall performance. To achieve the best results, a thorough QC process is undertaken, representing a key stage of the workflow. If the model is sub-optimal, labels are re-assessed, and the density of ‘correct’ labelling is increased if required. A further iteration of the model is then undertaken and subsequently QC’d (Figure 8). This process revealed that deeper horizons in the seismic were sub-regional and correlation confidence in the lower sequences was reduced due to the relationships between overlying sediments and salt as well as faults. Thus, deeper interpreted markers were discarded unless related both specifically and locally to a future site of proposed sequestration.
The model’s internal QC test is extensive and involves testing the model on data without interpretation and comparing it to interpreted seismic in the same location. This is conducted with
a subset of 25% and 50% of the labels to see the impact that an increase or decrease of labels will have on the interpretation. When the model accurately reflects the labels, the model can be considered robust and extrapolated across the dataset but QC’d after every iteration.
Akin to the horizon propagation, fault interpretation was carried out following a similar methodology. The key difference between the horizon and fault interpretation was the use of a pretrained model for generating initial prediction, whereas in the horizon interpretation the models were constructed entirely anew. The pre-trained model was used to predict faults on each of the volumes. Techniques of this nature are similar to coherency volumes although for the models generated for this study, a percentage of confidence is associated with each interpretation. This means that the interpreter can assess the veracity of the fault interpretation. Initial models are likely to contain a certain level of ‘noise’ or false positives. In these scenarios, a fault is interpreted by the machine learning but does not represent a feature in the subsurface. The labels from the model are then extracted and a QC process begins, removing faults that are incorrect which ‘cleans up’ sections of the model (Figure 9). This cleaning process is not required on the entire model but a representative subset, decreasing the time to accurate models. Once complete, another iteration of the model is run with the QC process following. Within our area of interest, false positives were common within the first few iterations. The Louann salt and data quality in the lower sections of the datasets initially caused multiple issues

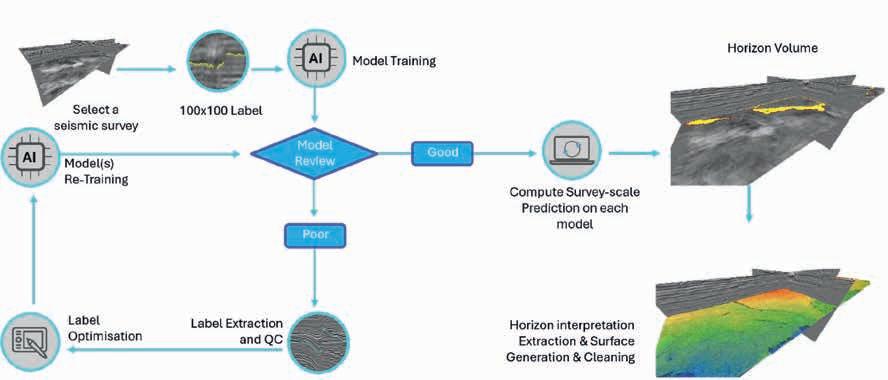
8 Synopsis of the machine learning process whereby labels are provided and extrapolated by the machine learning process.
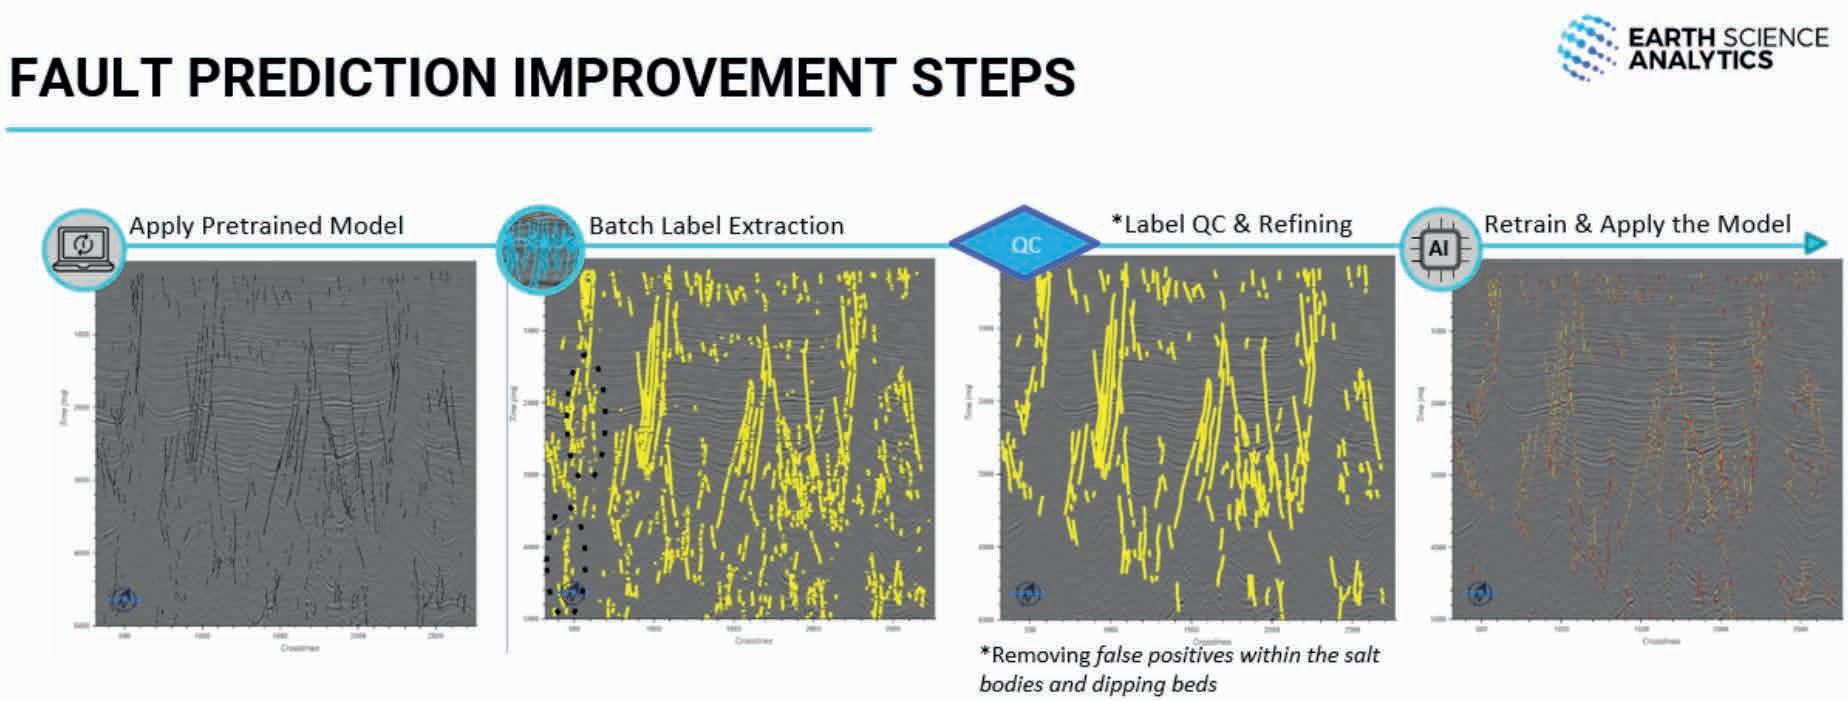
with the model. Further issues arose due to the vintage of the data and the processing sequence that had inherent zones of poor processing etc. These were identified and corrected sufficiently for the final model.
Fault models were originally outputted as probability models for QC. If this resulted in a sub-optimal probability score these were removed from the project. The probability cut off was high to ensure that the model was picking faults clearly and accurately. Fault interpretations of this nature were completed in tandem with the horizons allowing for a much faster interpretation and a reduction in time to investigating structures for injection.
Having successfully identified the subsurface structure of the potential sites as well as the key lithologies, identification of sites could commence. A total of 12 sites were analysed which developed a portfolio of potential areas. These were subsequently risked and ranked with volumetrics completed to further develop the portfolio.
In order for CCS to be successfully completed to the scale required, re-evaluating the subsurface in areas that have been previously analysed for oil and gas will be pivotal. The primary reason for this from a subsurface view is the access to a wealth of data. Whilst this is reviewed as a positive for the evaluation of CCS sites, ensuring that the comparison of different vintage datasets is critical. Within this article, Geoex MCG and its partners have proposed a bespoke post-stack reconditioning technique that is effective in any and all basins where seismic data exists. This methodology allows the users to have a single comparable seismic survey that allows the evaluation across the AOI.
Typically with CCS projects, the initial AOI is a wide area that is then further refined as the investigation progresses. Reducing the timeframes to site selection will be key to implementing the technology and as such interpretation of the regional setting is required in reduced timeframes. By using machine learning, the overall speed of interpretation, for faults, wells and horizon interpretation, has improved significantly whilst not compromising the overall quality. This will lead to a significant reduction to FID compared to more traditional workflows.
Reducing this timeframe will allow companies to make more informed decisions in less time and at less cost. This will allow the focus to transition to baseline seismic acquisition in key areas, identify a timeline to first injection and a subsequent monitoring campaign. Geoex MCG is currently assimilating the full value chain in order to assist operating companies with initial screening, seismic acquisition, injection and monitoring. This will provide a consistent approach to CCS challenges with methodologies such as those described being applicable to global locations. Whilst it is clearly favoured to use broadband seismic with the latest FWI processing, legacy data will still have a significant role to play as we transition to a cleaner future.
Galloway, W.E. [2005b], Gulf of Mexico basin depositional record of Cenozoic drainage basin evolution. Fluvial Sedimentology VII, International Association of Sedimentologists (Special Publication 35), 409-423.
Galloway, W. [2008]. Depositional Evolution of the Gulf of Mexico Sedimentary Basin. In: K.J. Hsu. (Ed). The Sedimentary Basins of the United States and Canada Netherlands: Elsevir. 505-550.
Galloway, W.E., Whiteaker, T.L. and Ganey-Curry, P. [2011], History of Cenozoic North American drainage basin evolution, sediment yield, and accumulation in the Gulf of Mexico basin: Geosphere, 7(4), 938-973.
Hudec, M.R., Norton, I.O., Jackson, M.P.A., and Peel, F.J. [2013b], Jurassic evolution of the Gulf of Mexico salt basin: AAPG Bulletin, v. 97,1683-1710.
McBride, B.C. [1998], The evolution of allochthonous salt along a megaregional profile across the northern Gulf of Mexico basin. AAPG Bulletin, v. 82 part B, 1037-1054.
Pindell, J.L. and Kennan, L. [2001], Kinematic evolution of the Gulf of Mexico and Caribbean, in Gulf Coast Section SEPM 21st Annual Research Conference, 193-220.
Yurewicz, D.A., Marler, T.B., Meyerholtz, K.A. and Siroky, F.X. [1993]. Early Cretaceous carbonate platform, north rim of the Gulf of Mexico, Mississippi and Louisiana, in Simo, J. A. T., Scott, R. W., and Masse, J.-P. eds., Cretaceous carbonate Platforms, AAPG Memoir 56, Tulsa, OK, 81-96.


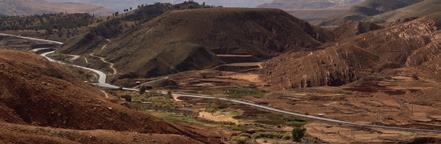
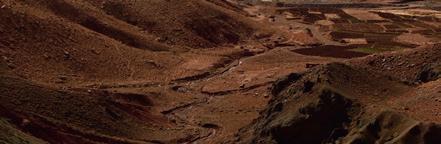


Join us for an unforgettable experience filled with industry leaders, cutting-edge insights, and unparalleled networking opportunities

Register for the Innovative Technology for Reservoir Optimization: Fifth EAGE Well Injectivity & Productivity in Carbonates (WIPIC) Workshop and be part of the conversation!
Early registration deadline: 10 March 2025


Don’t miss out — register now to be part of a transformative experience at the First EAGE Atlantic Geoscience Resource Exploration & Development Symposium, where innovation meets insight!


Liang Zhang1, Felix James Pacis2, Sergey Alyaev1* and Tomasz Wiktorski2,3 present a specialised, local, open-source chatbot solution that combines fine-tuned AI retrieval and summarisation methods for answering questions from internal documents on an example of offshore drilling.
Abstract
Geoscientists and engineers often need quick, reliable answers from confidential or internal documents. Generic cloud-based chatbots struggle to provide accurate, industry-specific information. Moreover, they are not allowed to access internal knowledge bases. To solve this, we developed a local, self-hosted chatbot that uses a local Large Language Model (LLM) combined with an AI-based search system fine-tuned to offshore drilling data. Our setup ensures reliable domain-relevant responses without sending information to external servers and limiting false information generation called ‘hallucination’. By keeping all data in-house and enhancing retrieval accuracy, this methodology offers a practical way to build secure, specialised chatbots for other subsurface applications. We provide open-source code and a setup guide to facilitate reproducibility and adoption.
Introduction
Recent commercialisation and fast growth of LLM-based services showcased their effectiveness in providing accurate and reliable answers to various general questions. (Bhattaru et al., 2024). At the same time, they suffer from the ‘hallucination’ phenomenon, where a model generates factually incorrect answers arising from
insufficient, incomplete, or biased training data (Sakib, 2024). Hallucinations are specifically dangerous for AI applications in industrial settings where factual accuracy is paramount.
Information from niche industries, such as subsurface drilling, is underrepresented when training generic machine learning models. Figure 1 presents a simple data retrieval example in a drilling context. Neither a search engine nor a generic LLM can provide a satisfying answer when specific domain knowledge is required. In comparison, a custom chatbot with search functionality over a relevant knowledge base gives the expected answer and a reference for fact-checking. This approach, where an AI can search a knowledge base and generate answers based on one or several retrieved documents, is called Retrieval-Augmented Generation (RAG) (Lewis et al., 2021).
RAG relies on two systems: document retrieval and text generation, as illustrated in Figure 2. First, a separate retriever system processes the user query and searches for the top relevant documents in a knowledge base. A popular dense retriever would convert the query and documents into unique numerical vector representations that capture their meanings, a process called embedding. It then finds the nearest documents to the query in this numerical representation. The retrieved documents and data
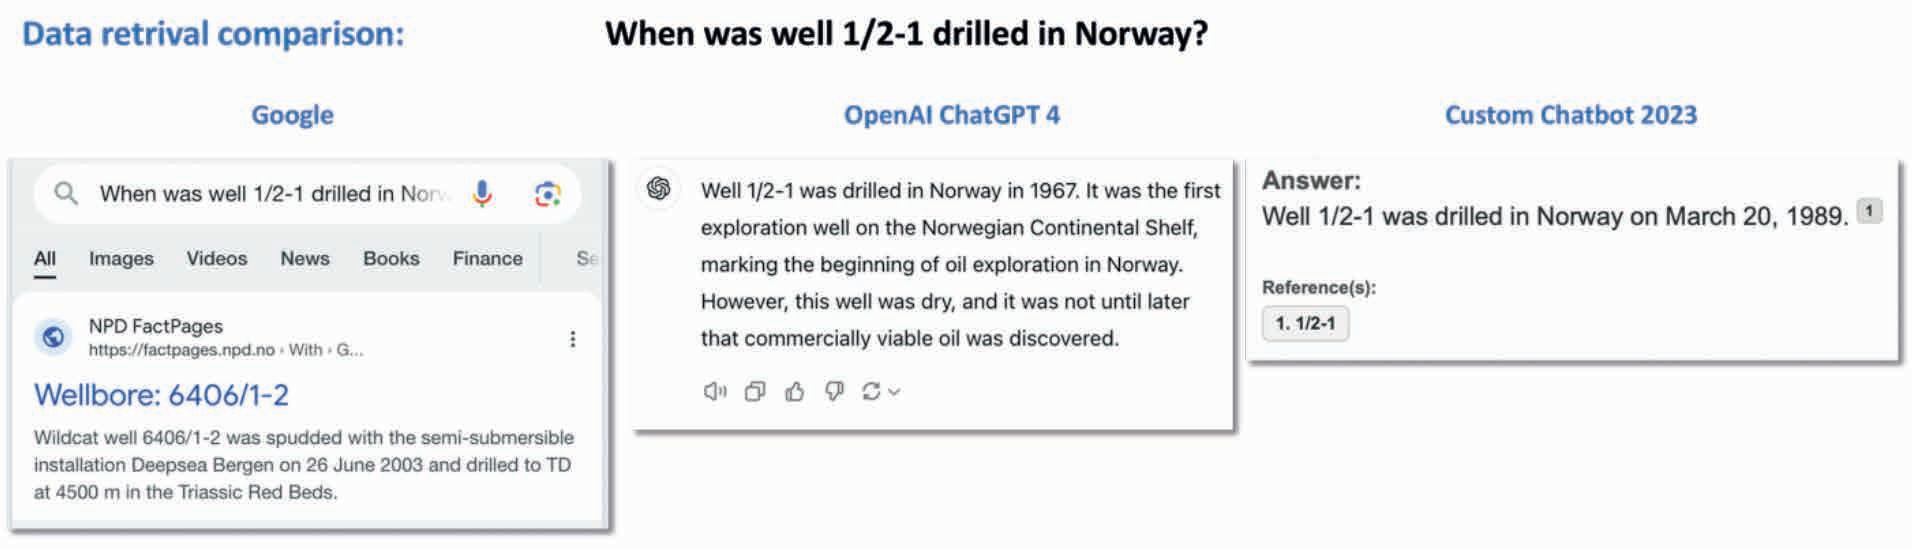
Figure 1 Data retrieval comparison for information about an offshore well: results from Google search, OpenAI ChatGPT 4, and a custom chatbot. Correct answer from NOD (Norwegian Offshore Directorate) Fact Pages: ‘…Wildcat well 1/2-1 was spudded with the semi-submersible installation Ross Isle on 20 March 1989…’ Note: ChatGPT 4 sometimes gives the correct answer when utilising built-in search functionality with a proper query (tested February 2024). ‘Custom Chatbot 2023’ is an early prototype application presented in DigiWells Seminar 2023 by F. Pacis, which uses traditional document search and online services for summarisation.
1 NORCE Norwegian Research Centre | 2 University of Stavanger | 3 Aker BP
* Corresponding author, E-mail: saly@norceresearch.no DOI: 10.3997/1365-2397.fb2025012
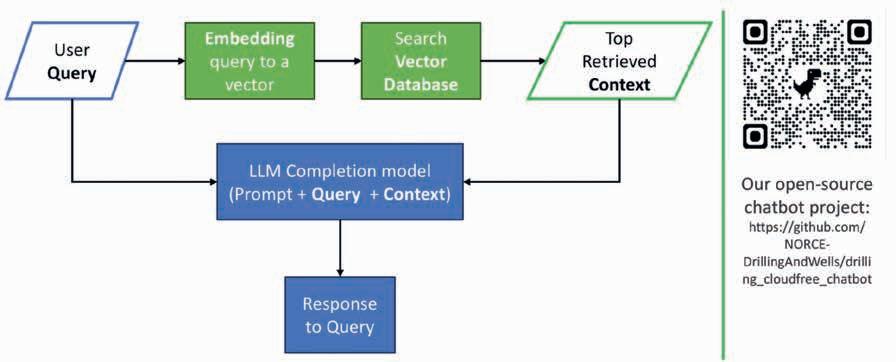
are called the context. The retrieved context is combined with the instruction prompt (general-language task description), and the original user query to form a full prompt to the LLM Completion Model. The generic LLM then generates the answer to the user query based on the context provided.
Given the relevant context, the previous generation of LLMs, from early 2024, can provide reliable question-answering for drilling-related questions (Pacis et al. 2024c). Thus, the retriever plays a crucial role due to limitations on the part of LLM. First, it is impossible to train LLMs with every new dataset (Wu et al., 2023). Second, it is impractical to train a specialised LLM for every domain, especially for niche domains; recent studies (Li et al., 2023) even show that larger generic LLMs can outperform domain-specific ones. Third, LLMs have limits on the length of text they can process (Machlab & Battle, 2024; OpenAI, 2024) – thus requiring a good model for ranking documents that are given as the context. Fourth, LLMs incur computational costs for each token processed, translating to energy consumption or cloud-service fees. Therefore, the retriever, which provides the LLMs with the relevant context, is key to enabling the chatbot to access new and domain-specific information without needing expensive model retraining.
In the drilling industry, although cloud-based chatbots have demonstrated their usefulness (Mosser et al., 2024; Singh et al., 2023), commercial LLMs are not viable options in scenarios where exposing the internal and confidential knowledge bases is unacceptable. Thus, the limited performance of self-hosted LLMs underscores the importance of good retrieval performance.
Multiple methods exist to represent text for measuring similarities during retrieval, such as keyword-based and AI methods. Keyword-based methods include the Term Frequency-Inverse Document Frequency (TF-IDF) (Jones, K. S. 2000) and BM25 (Robertson, S. 2009). These are also known as sparse vector methods, as they use sparse vectors to represent term frequency. Recently, dense-vector embedding methods produced by modified LLMs have drawn researchers’ attention (Karpukhin et al., 2020; Ma et al., 2021). These methods use numerical vector representations to capture the meanings of documents and to distribute the documents in a vector space. Searching the documents nearest to the queries in the vector space performs very well in RAG scenarios (Liu et al. 2024). Pacis et al. (2024b) adapted these retrievers for drilling text data, obtaining 98% correct retrievals on a test dataset.
This paper combines the earlier findings and presents a complete methodology to build a self-hosted local chatbot for question-answering in niche industries. Our open-source
implementation for offshore drilling data is linked in Figure 2. It combines an open offline LLM with an embedding-based retriever model fine-tuned to answer questions about offshore wells. The fine-tuning provides correct contextual information to the system, enabling precise and reproducible question-answering despite a smaller, cheaper model than used by cloud providers.
Information retrieval requires two main components: the representation of raw text and the similarity measurement for searching. A typical process involves first converting the raw text into a formal format, such as sets containing keywords or letters, sparse vectors representing term frequency, or dense vectors representing semantic meaning. Based on these processable formats, similarity measurement can be performed using methods such as cosine similarity, Hamming distance, and Jaccard index (Wang, J 2020).
Among these methods, dense vector-based retrieval has been recently developed with the advance of LLMs (Ma, X. 2021). This method can summarise the meaning of raw text and represent it in a semantic space using dense vectors. Compared to term frequency represented in sparse vectors, where many dimensions are zero, dense vectors are more compact, which is how they get their name. This feature of dense vector-based methods is particularly beneficial as it enables the co-location of similar documents by capturing their semantic meaning.
To improve retrieval, however, it is beneficial to fine-tune the embedding mapping to move the embedding vectors of the questions and the documents containing corresponding answers closer to each other. We can fine-tune the embedding model using the contrastive learning method.
Contrastive learning is a machine learning technique that enables the learning of meaningful representations by contrasting similar and dissimilar data points (Liu et al., 2024; Wang et al., 2024). During contrastive learning, a machine learning model is trained to minimise the distances between data points marked ‘similar’ and maximise the distances between ‘dissimilar’ ones. The method naturally meets the retrieval requirements, making it useful for embedding model training. Among available opensource tools for fine-tuning, Tevatron (Gao et al., 2022) requires training pairs, each with similar and dissimilar data points, termed positive and negative passages in the RAG context. Pacis et al. (2024b) demonstrated the usage of this methodology for drilling data retrieval, and we built on this study to create a self-hosted, cloud-free RAG chatbot.
Building a self-hosted chatbot can be divided into three stages: knowledge preparation, fine-tuning the embedding model, integration, and deployment. The first stage involves preparing specialised knowledge for niche industries, as general LLMs lack niche training. The second stage is the key to improving the retrieval performance. The last stage is to combine the different modules to form a functioning chatbot.
Human experts collect materials containing specialised domain knowledge relevant to their industries. These materials typically include passages from public databases, internal documents, high-quality introductions from the internet, and other relevant sources. These materials need to be chunked into appropriate lengths, considering the token length limitations of LLMs. These chunks or passages should be indexed to make them easily searchable. The proper granularity can affect retrieval performance (Zhong et al., 2024). A fixed-length chunking method is employed in the case study for simplification purposes.
The semantic similarity scores between query and context passages are calculated based on their embedding vectors. Different embedding models generate distinct vectors for the same text, which can influence similarity measurement and, consequently, retrieval performance. Fine-tuning the embedding model aims to adjust the vector generation towards better retrieval performance.
We use the contrastive learning procedure from Pacis et al. (2024b) to fine-tune the embedding model. This approach requires a query and a set of positive and negative passages for text-retrieval tasks. Positive passages contain the answer to the query in question-answering tasks, while negative passages do not. We prepare the query and positive/negative passage triples as detailed here and also visualised in Figure 3:
1. Assign each passage an ID. Note that the ID names will not change the semantic meaning of the passages and thus will not affect the training and the final retrieval performance.
2. Randomly select some passages as the training dataset. In our case study, 1500 out of 5977 passages are selected. If necessary, all the passages can be used for training.
3. Generate a question/query for each training passage using a commercial LLM. The passage serves as the positive passage for the question. An example prompt for this task is ‘You are given a passage. Generate a valid question-answer pair. Ensure the answer is available from the given passage. Be truthful and direct. Be sure the generated question is explicitly mentioned in the passage. We will use the generated query to train machine learning models. The question can be easy or hard as long as it is found on the passage.’
4. Embed all the questions and passages using a good embedding model. This model is only for generating the training data set and is generally different and larger than the model to be fine-tuned.
5. Calculate the cosine similarity score between each question and related passages.
6. Rank the passage IDs, excluding the corresponding passage by similarity score for each question. The corresponding passage for the query is automatically the positive passage.
7. Select the top 10 passages as the negative passages, which means they are close to the positive but not the positive. Thus, each question in the training dataset has one positive and 10 negative passages.
8. Generate the training triples by assembling queries and positive and negative passages.
After preparing the training dataset, fine-tuning based on contrastive learning can be conducted. We use Tevatron (Gao et al., 2022), which takes the training entries and the raw embedding model as input, automatically performing the fine-tuning, and generating files representing the new embedding model. The model is stored as a ‘safetensors’ weights file. The weights file can be loaded by a Python library called Transformers (Huggingface, 2024), enabling a self-hosted embedding model that provides improved retrieval performance for input text (Zhang et al. 2024).
After the first two stages, the fine-tuned embedding model and the knowledge base are prepared. We augment them with an LLM to form a complete chatbot, see Figure 4. The vector database hosts passageID-vector pairs. It can return all vectors or the specific vector mapped to a given passageID upon request. Some vector databases also include similarity calculations, allowing them to return the top passageIDs with vectors similar to the given vector. The knowledge base hosts passageID-passage pairs and is primarily used to return a specific passage given a passageID. The prompt generator assembles the query and context to form a prompt based on a template. For self-hosting, open-source models are recommended for the fine-tuned embedding model and LLM model.
The user asks a question as a query string, which is then embedded into a vector. The similarity calculation module computes the similarity scores between this query vector and all the passage vectors retrieved from the vector database. The top passageIDs are identified by sorting the similarity scores. Then, we retrieve the passages corresponding to the IDs from the knowledge base, which serve as context. With the query and related context, a prompt is generated and sent to the LLM, which generates the answer to the user’s question. Thus, the question-and-answer process between the user and the chatbot is completed.
In our open-source repository (Zhang et al., 2024), we showcase a RAG chatbot for offshore drilling data, building on top of opensource components. The open-source e5-small-v2 embedding model is fine-tuned to generate embedding vectors using another open-source tool, Tevatron (Gao et al., 2022). A llama3 model (Dubey et al., 2024) running locally in an Ollama environment (Ollama, 2024) serves as the LLM for answer generation.
We tested the chatbot for question-answering supported by 5977 text passages scraped from the public Norwegian
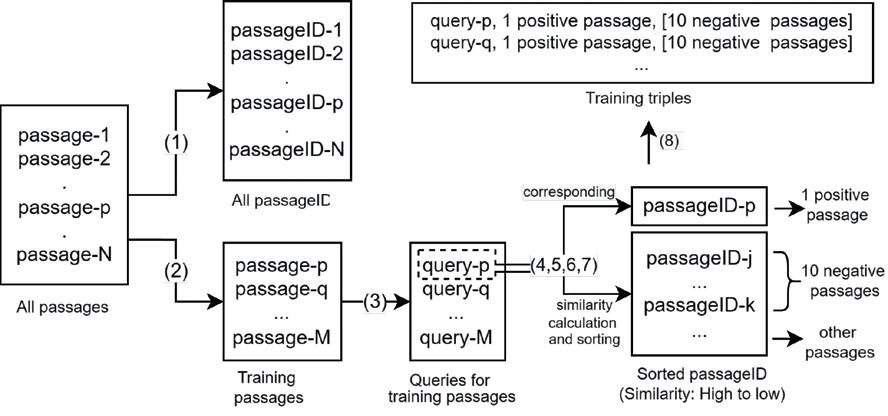
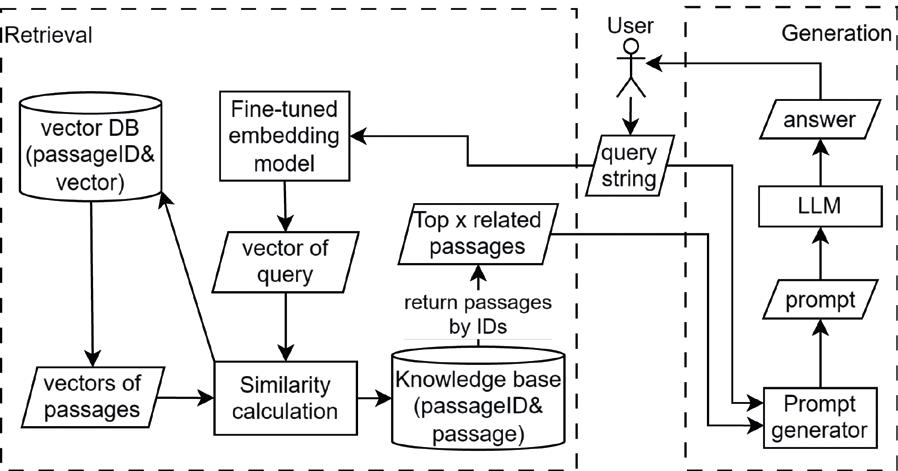
Offshore Directorate (NOD) Fact Pages knowledge base (Pacis 2024a, Pacis et al. 2024b). In the fine-tuning stage, 1500 out of 5977 passages are selected as the training data. The fine-tuning follows the strategy described in Stage 2 of the Approach section. For retrieval validation, we use the queries for the remaining 4477 passages, which are not part of the contrastive-learning fine-tuning.
The final retriever uses the fine-tuned embedding model and cosine distance to identify the closest documents to the queries. For the complete chatbot, the local fine-tuned retriever is connected to an LLM from the llama3 family running in Ollama using its APIs (Zhang et al. 2024). Depending on the host memory capability, one can use either a smaller llama3.1 LLM with 8 billion parameters or a more accurate llama3.3 LLM with 70 billion parameters (Dubey et al. 2024). In our testing, we report the results from llama3.3 executed on Intel® Xeon(R) W-2155 CPU, 64 GB memory, GeForce 4090 GPU (24GB), Ubuntu 20.04.6 LTS.
The complete local chatbot can answer generic offshore-well-related questions using the offline 5977-document knowledge base. Unlike consumer-oriented cloud services, our implementation fixes the random seed used during answer generation, ensuring reproducible results.
The good performance of the RAG-based chatbot stems primarily from the improved retrieval performance. Pacis et al. (2024b) compared five generic embedding models evaluating the retrieval success rates. A successful retrieval is defined as when the
Figure 3 Preparing positive and negative passages. Each training triple contains a question/query that can be answered with a corresponding passage, a positive passage (the corresponding), and 10 hardnegative passages that do not provide the answer to the question.
4
positive passage is among the top 10 retrieved passages according to the similarity scores. The choice of the top 10 is conservative, considering the maximum length of passages in our dataset and the context limit of the evaluated models.
The comparison method is similar to the negative passage selection process. First, vectorise and index all passages using an embedding model. Next, vectorise all queries in the test dataset, compute the cosine similarity scores against each passage, and rank the passages accordingly. Count the number of successful retrievals for the current embedding model. Repeat this process for each generic embedding model. Thus, the retrieval performance for different models can be quantified, as visualised in Figure 5.
Figure 5 shows that the fine-tuned model outperforms other generic ones. The adapted E5 model successfully retrieved the correct passage in 98% of the 4477 test cases, significantly outperforming OpenAI’s Text Embedding 3-Large, which achieved 54.5% (Pacis et al. 2024b). This improvement highlights the effectiveness of fine-tuning a generic model for a specific domain. Fine-tuning allows the model to adjust to the particular structures of drilling data, leading to better contextual understanding and relevance scoring in tasks like document retrieval. Moreover, the performance of other generic models ranged between 50.4% and 54.5%, except for MiniLM-L6-v2, which only achieved 8%. This lower performance may result from a smaller vector dimension and the fact that it was fine-tuned as a sentence transformer from a cross-encoder rather than a bi-encoder. These results align with findings from adapted embedding models in chip design (Liu et al., 2024). We believe that these improvements can enhance the performance in RAG-based applications.
Examples of the chatbot in use
Powered by the LLM, our complete RAG chatbot can answer any question formulation. In this section, we manually challenged the chatbot with questions but kept a well number in each question to align with the fine-tuning of the retriever.
Table 1 shows examples of custom user questions answered by the chatbot deployed locally on a desktop PC. LLM understands the questions and attempts to find the answers within the given context. The answers are precise for queries similar to fine-tuning data (Example Query 1). The chatbot also provides
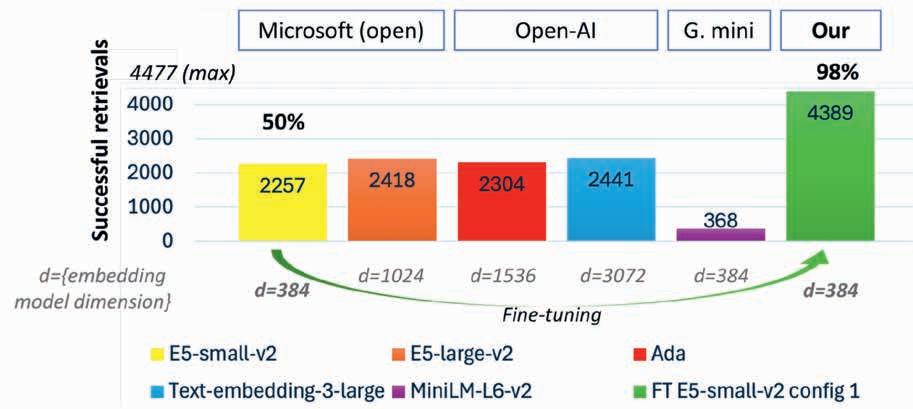
What was the primary objective of well 34/6-3 A?
Full prompt:
Question: What was the primary objective of well 34/6-3 A?. Answer the …Context: [‘Well name: 34/6-3A; Source: Norwegian…
…The primary objective of well 34/6-3 A was to test the hydrocarbon potential in the Akkar prospect, a separate structure located to the west of the Garantiana structure. The primary target was…]
Response:
To test the hydrocarbon potential in the Akkar prospect. (Correct)
Top retrieved results:
[NOD WBH 34/6-3A] [NOD WBH 34/6-6A]
[NOD WBH 34/3-3A] [NOD GI 34/6-6A] [NOD WBH 7/12-3A]
Response time: 22.7s
Example Query 3
Which geology types were observed in well 6201/11-3R?
Full prompt:
Question: Which geology types were observed in well 6201/11-3R?. Answer the question...context: [‘Well name: 6201/11-3R; ... drilled formations with their top and bottom depths: {‘Balder Formation’:..., ‘Jorsalfare Formation’: ..., ‘Kyrre Formation’: ..., ‘Lista Formation’: ..., ‘Lunde Formation’:..., ‘No Formal Name’: ..., ‘Sele Formation’:..., ‘Teist Formation’: ..., ‘Undifferentiated’:..., ‘Utsira Formation’:..., ‘Våle Formation’: ....’”
Response:
Balder Formation, Jorsalfare Formation, Kyrre Formation, Lista Formation, Lunde Formation, No Formal Name, Sele Formation, Teist Formation, Undifferentiated, Utsira Formation, Våle Formation, Zechstein Group.
(Meaningful, but Zechstein Group is not a formation)
Top retrieved results:
[NOD GI 6201/11-3R] [NOD SR 6201/11-3R] [NOD WBH 6201/11-3R] [NOD WBH 6201/11-3] [NOD GI 6201/11-3]
Response time: 45.2s
5 Comparing generic embedding models with the fine-tuned E5 model. The bar plot shows the success rate based on the top 10 documents retrieved. Based on data from Pacis et al. (2024b).
When was well 1/2-1 drilled in Norway?
Full prompt: Question: When was well 1/2-1 drilled in Norway?. Answer the question ... Context: [‘Well name: 1/2-1 ;... Operations and results: Wildcat well 1/2-1 was spudded with the semi-submersible installation Ross Isle on 20 March 1989 and drilled to TD at 3574 m..
Response: 20 March 1989 (Correct)
Top retrieved results: [NOD WBH 1/2-1] [NOD WBH 2/1-1] [NOD GI 1/2-1] [NOD GI 2/2-1] [NOD WBH 2/2-1]
Response time: 18.6s
Example Query 4
What was the CO2 storage potential discovered by 32/4-3S?
Full prompt:
Question: What was the CO2 storage potential discovered by 32/43S?. Answer the question ... Note that not all the context is related to the question. Do not include any explanation or additional information. Context: [‘Well name: 32/4-3S;... “Well name: 32/4-3S;... “Well name: 32/4-3S;... “Well name: 32/4-3S;... “Well name: 32/43S;...]
Response:
The CO2 storage potential discovered by 32/4-3S is not explicitly stated in the provided context.
(Correct based on provided information)
Top retrieved results: [NOD WBH 32/4-3S] [NOD GI 32/4-3S] [NOD SR 32/4-3S] [NOD WBH 30/4-3S] [NOD GI 30/4-3S]
Response time: 28.8s
Table 1 Examples of the custom offline question-answering about Norwegian offshore wells. Abbreviations in references: NOD: Norwegian Offshore Directorate; WBH: WellBore Histories; GI: General Information; SR: Stratigraphic Records.
a correct, direct answer to straightforward questions, such as Example Query 2 from our motivation example in Figure 1, bettering the search engine and generic LLM.
The chatbot can also handle less obvious questions using the LLM’s summarisation abilities. In Example Query 3, the chatbot successfully links the word geology to formations and groups. Although the answer is not perfect, it is meaningful. Notably, the chatbot can provide a responsible response when the answer is not in the given context rather than generating a hallucination, as a generic LLM might. In Example Query 4, the chatbot correctly replies that the information is unavailable after analysing the data about CO2 storage potential from the context retrieved from the knowledge base.
Examining the model performance, we observe that the RAG question-answering process takes between 10 and 50 seconds on stand-alone workstation hardware. Longer processing times are typically associated with generating longer answers. The larger model provided more consistent results for nuanced questions during our testing. However, it exhibited an order of magnitude slower performance and required a minimum of 40 GB of system memory, highlighting a trade-off between accuracy and efficiency.
Our testing reveals that the model’s retrieval and, thus, answering performance are influenced by the similarity between user queries and those used during training. Since our retriever was fine-tuned on queries that include well numbers, it excels with similar inputs. However, queries lacking a well number often result in incorrect retrieval, a trade-off arising from the contrastive learning approach. In the incorrect-retrieval scenarios, the chatbot reliably indicates that a question cannot be answered based on the provided context, underscoring the system’s reliability. In summary, better performance can be achieved when it is possible to align training data with expected query patterns to improve retrieval accuracy.
Further testing is required to validate the chatbot, ensuring that the limitations identified in the case study are distinguished from those inherent to the retrieval-augmented approach itself. A comparison with traditional methods, such as BM25 (Robertson, S. 2009) and graph databases (Peng et al. 2024), would provide a more comprehensive performance evaluation. Finally, we aim to test fine-tuning for answering questions that require simultaneous retrieval from multiple documents.
We have described an approach to developing a self-hosted and locally-run chatbot based on Retrieval-Augmented Generation (RAG) optimised for domain-specific scenarios. We built our chatbot on top of openly available and computationally inexpensive local AI models. The improved performance of our chatbot comes primarily from the fine-tuning method that employs contrastive learning to enhance retrieval performance.
Our chatbot, fine-tuned for offshore drilling data, demonstrates a superior ability to answer well-related questions compared to traditional search engines and generic large language
models (LLMs). The fine-tuning of the embedding model has increased the correct retrieval rate from approximately 50% to 98%, ensuring consistently accurate question answering. Finally, the open-source local implementation provides complete control over the LLM inputs, ensuring consistency and reproducibility in question-answering. The repository with reproducible experiments, can be a starting point for creating chatbots for other geoscience applications.
This work is part of the Center for Research-based Innovation DigiWells: Digital Well Center for Value Creation, Competitiveness and Minimum Environmental Footprint (NFR SFI project no. 309589, https://DigiWells.no). The center is a cooperation of NORCE Norwegian Research Centre, the University of Stavanger, the Norwegian University of Science and Technology (NTNU), and the University of Bergen. It is funded by Aker BP, ConocoPhillips, Equinor, Harbour Energy, Petrobras, TotalEnergies, Vår Energi, and the Research Council of Norway.
The authors used Microsoft Copilot to improve draft paragraphs. The AI-generated text was carefully edited to reflect the authors’ opinions and perceptions. Most text was also processed using Grammarly and its AI Paraphrase Tool to improve formulations and grammar. The authors take full ownership of the study’s content and conclusions.
Bhattaru, A., Yanamala, N. and Sengupta, P.P. [2024]. Revolutionizing Cardiology with Words: Unveiling the Impact of Large Language Models in Medical Science Writing. Canadian Journal of Cardiology
Dubey, A., Jauhri, A., Pandey, A., Kadian, A., Al-Dahle, A., Letman, A. and Ganapathy, R. [2024]. The llama 3 herd of models arXiv preprint arXiv:2407.21783.
Gao, L., Ma, X., Lin, J. and Callan, J. [2022]. Tevatron: An Efficient and Flexible Toolkit for Dense Retrieval (No. arXiv:2203.05765). arXiv. Huggingface [2024]. Transformers. Retrieved December 20, 2024, from https://huggingface.co/docs/transformers.
Jones, K.S., Walker, S. and Robertson, S.E. [2000]. A probabilistic model of information retrieval: development and comparative experiments: Part 2. Information processing & management, 36(6), 809-840.
Karpukhin, V., Oguz, B., Min, S., Lewis, P., Wu, L., Edunov, S., Chen, D. and Yih, W. [2020]. Dense Passage Retrieval for Open-Domain Question Answering. In B. Webber, T. Cohn, Y. He, & Y. Liu (Eds.), Proceedings of the 2020 Conference on Empirical Methods in Natural Language Processing (EMNLP), 6769-6781. Association for Computational Linguistics.
Lewis, P., Perez, E., Piktus, A., Petroni, F., Karpukhin, V., Goyal, N., Küttler, H., Lewis, M., Yih, W., Rocktäschel, T., Riedel, S. and Kiela, D. [2021]. Retrieval-Augmented Generation for Knowledge-Intensive NLP Tasks (No. arXiv:2005.11401). arXiv.
Li, X., Chan, S., Zhu, X., Pei, Y., Ma, Z., Liu, X. and Shah, S. [2023]. Are ChatGPT and GPT-4 General-Purpose Solvers for Financial Text Analytics? A Study on Several Typical Tasks (No. arXiv:2305.05862). arXiv.
Liu, M., Ene, T.-D., Kirby, R., Cheng, C., Pinckney, N., Liang, R., Alben, J., Anand, H., Banerjee, S., Bayraktaroglu, I., Bhaskaran, B., Catanzaro, B., Chaudhuri, A., Clay, S., Dally, B., Dang, L., Deshpande, P., Dhodhi, S., Halepete, S. and Ren, H. [2024]. ChipNeMo: Domain-Adapted LLMs for Chip Design (No. arXiv:2311.00176). arXiv.
Ma, X., Sun, K., Pradeep, R.and Lin, J. [2021]. A Replication Study of Dense Passage Retriever (No. arXiv:2104.05740). arXiv.
Machlab, D. and Battle, R. [2024]. LLM In-Context Recall is Prompt Dependent (No. arXiv:2404.08865). arXiv.
Mosser, L., Aursand, P., Brakstad, K.S., Lehre, C. and Myhre-Bakkevig, J. [2024]. Exploration Robot Chat: Uncovering Decades of Exploration Knowledge and Data with Conversational Large Language Models D011S002R006. SPE Norway Subsurface Conference.
Ollama [2024]. Ollama: AI tools and resources. Retrieved December 20, 2024, from https://ollama.com/. OpenAI [2024]. GPT-4 Turbo and GPT-4. Retrieved December 20, 2024, from https://platform.openai.com/docs/models/gpt-4-turbo-andgpt-4, accessed: 2024.
Pacis, F.J. [2024a]. Improved retrieval for drilling applications [GitHub repository]. Retrieved December 20, 2024, from https://github.com/ fjpax/improved_retrieval_drilling.
Pacis, F.J., Alyaev, S. and Wiktorski, T. [2024b]. Domain-adapted Embeddings Model Using Contrastive Learning for Drilling Text Data. In International Conference on Frontiers of Artificial Intelligence, Ethics, and Multidisciplinary Applications. Springer Nature, In Print.
Pacis, F. J., Alyaev, S., Pelfrene, G. and Wiktorski, T. [2024c]. Enhancing Information Retrieval in the Drilling Domain: Zero-Shot Learning with Large Language Models for Question-Answering. In SPE/


IADC Drilling Conference and Exhibition (p. D011S002R004). SPE.
Peng, B., Zhu, Y., Liu, Y., Bo, X., Shi, H., Hong, C. and Tang, S. [2024]. Graph retrieval-augmented generation: A survey arXiv preprint arXiv:2408.08921.
Robertson, S. and Zaragoza, H. [2009]. The probabilistic relevance framework: BM25 and beyond. Foundations and Trends® in Information Retrieval, 3(4), 333-389.
Sakib, S.N. [2024]. Bane and Boon of Hallucinations in the Context of Generative AI. In Cases on AI Ethics in Business, 276-299. IGI Global.
Singh, A., Jia, T. and Nalagatla, V. [2023]. Generative AI Enabled Conversational Chatbot for Drilling and Production Analytics. ADIPEC.
Wang, J. and Dong, Y. [2020]. Measurement of text similarity: a survey Information, 11(9), 421.
Wang, L., Yang, N., Huang, X., Jiao, B., Yang, L., Jiang, D., Majumder, R. and Wei, F. [2024]. Text Embeddings by Weakly-Supervised Contrastive Pre-training (No. arXiv:2212.03533). arXiv.
Wu, S., Irsoy, O., Lu, S., Dabravolski, V., Dredze, M., Gehrmann, S., Kambadur, P., Rosenberg, D. and Mann, G. [2023]. BloombergGPT: A Large Language Model for Finance (No. arXiv:2303.17564). arXiv.
Zhang, L., Pacis, F.J. and Alyaev, S. [2024]. Cloud-Free Question Answering Chatbot for Drilling Applications. GitHub. Retrieved December, 20, from https://github.com/NORCE-DrillingAndWells/ drilling_cloudfree_chatbot.
Zhong, Z., Liu, H., Cui, X., Zhang, X. and Qin, Z. [2024]. Mix-of-Granularity: Optimize the Chunking Granularity for Retrieval-Augmented Generation (No. arXiv:2406.00456). arXiv.
ADVERTISEMENT


FREE LEARNING
E-Lectures, Distinguished Lecturer Webinars, How-to-Videos


EAGE COURSES
Extensive, Self-Paced, Interactive, EAGE Education Tours


PARTNER COURSES
Online courses provided by EAGE partners


Explore all the courses in our catalogue!


CALL FOR AB STRACTS IS OPEN


31ST EUROPEAN MEETING OF


ENVIRONMENTAL AND ENGINEERING GEOPHYSICS


1ST CONFERENCE ON 7-11 SEPTEMBER 2025 | NAPLES, ITALY


1ST CONFERENCE ON INFRASTRUCTURE PLANNING, MONITORING AND BIM

UXO AND OBJECT DETECTION


4TH CONFERENCE ON


6TH CONFERENCE ON


MINERAL EXPLORATION AND MINING


GEOHAZARDS ASSESSMENT AND RISK MITIGATION


JOIN THE CONVERSATION AT EAGE NSG 2025!
This year, we’re spotlighting new topics in Geohazards Assessment & Risk Mitigation and UXO & Object Detection. Showcase your cutting-edge research and help drive the next wave of innovation in geoscience.


Christophe Germay1*, Tanguy Lhomme1 and Jenny Omma2 present an innovative non-destructive core digitalisation platform that transforms conventional core analysis by creating high-resolution, multidisciplinary digital logs along the entire length of a core.
Abstract
The effective exploration and development of subsurface resources require detailed, continuous rock characterisation to understand reservoir heterogeneity and optimise resource recovery. Traditional core analysis techniques often rely on destructive, fragmented testing, which leaves significant gaps in the spatial resolution of rock properties and can lead to biased interpretations of subsurface conditions. This article introduces CoreDNA™, an innovative non-destructive core digitalisation platform that transforms conventional core analysis by creating high-resolution, multidisciplinary digital logs along the entire length of a core. By integrating advanced imaging, geochemical, petrophysical, and geomechanical data, CoreDNA™ generates a ‘digital twin’ of the core. This approach bridges the gap between broadscale wireline logging and detailed core subsample analyses, enabling precise lithofacies identification, optimised subsample selection, and robust data upscaling. A case study from Well 15/12-20 S in the Norwegian Central North Sea demonstrates how the solution accelerates rock property characterisation, identifies reservoir heterogeneity, and enhances the resolution and reliability of reservoir quality assessments. This cutting-edge workflow reduces uncertainties in reservoir modelling by providing a scalable, objective, and cost-effective methodology for subsurface evaluation. By complementing existing analytical techniques, the tool establishes a new paradigm in core analysis, paving the way for safer and more efficient resource exploration.
Introduction
The safe and efficient exploration of underground resources depends on high-quality, continuous rock characterisation data to inform reservoir analysts about formation heterogeneity along wellbore trajectories. Substantial investments are made to extract and analyse cylindrical cores from exploration wells, providing necessary calibration points for wireline logging methods. Traditional core analysis involves a series of detailed measurements performed on subsamples acquired by each discipline involved in the subsurface characterisation effort. However, these tests are often destructive and provide only scattered snapshots of the rock properties, leaving significant portions of the core unanalysed.
Consequently, this limited sampling consumes core material yet creates spatial gaps that can lead to biased or even incorrect interpretations of key reservoir properties from wireline logs.
CoreDNA revolutionises core analysis through non-destructive, high-resolution logging techniques that create continuous, multidisciplinary core logs (Germay, Lhomme, & Bisset, 2021) (Germay, Lhomme, Perneder, & Cummings, 2022) (Germay, Lhomme, & Perneder, 2023) (Germay, Lhomme, & Perneder, 2023). This approach complements existing core analysis standards in order to produce detailed, consistent representations of reservoir mineralogy, porosity, permeability, and other key characteristics, filling gaps in the mapping of rock properties along the entire core length. By creating a digital twin of the entire core, the solution enables the detection of patterns in reservoir features that traditional, segmented analyses miss.
It bridges the gap between broad-scale wireline logs and detailed core measurements: it enhances objectivity in subsample site selection and reduces uncertainty when scaling plug sample data to wireline logs. With the case study of a heterogeneous clastic reservoir, we show how this innovative workflow allows operators to achieve extremely rapid, precise, and cost-effective rock characterisation.
Data acquisition
CoreDNA is an advanced core digitalisation platform that uses a suite of non-destructive sensors on a compact, transportable, tabletop core scanner to produce continuous, centimetre-scale digital logs while fully preserving core integrity. The only preparation required for the tool testing is levelling the core surface to micrometer accuracy along its length - a process called MiniSlab preparation. The grinding of the core outer surface with a poly-diamond crystal (PDC) blade is a fluid-free process, which protects sensitive shale sections. The displacement of the cutting blade with respect to the rock is automated and controlled with micrometre accuracy, ensuring the smoothness of the resulting surface and preventing damage to the core from excessive cutting forces. With this simple setup, the tool can be deployed on fresh whole cores immediately after extrusion, enabling rapid, non-destructive tests at the start of the core analysis workflow. It applies technolo-
1 EPSLOG | 2 Stratum Reservoir
* Corresponding author, E-mail: christophe.germay@epslog.com DOI: 10.3997/1365-2397.fb2025013
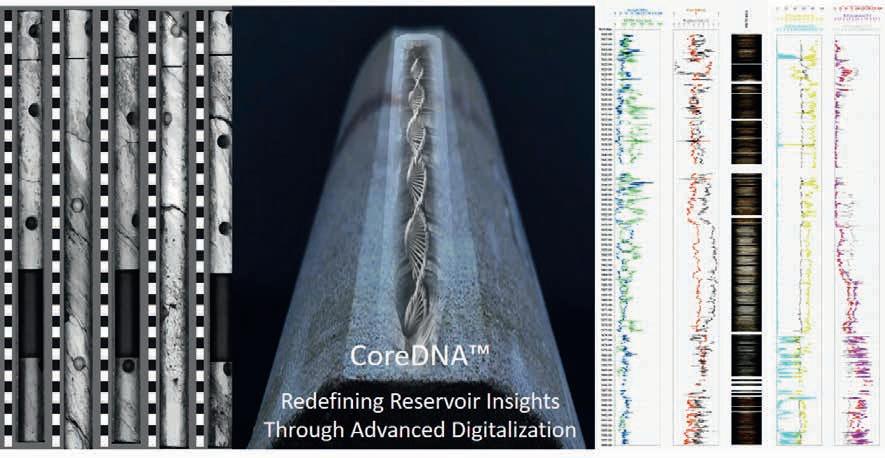
gies such as ultra-high-resolution (UHR) photography, automated grain size distribution mapping, elemental composition logging, probe permeametry, and geomechanical property measurements (including rock strength and ultrasonic wave velocity) along the entire core. The same sensors can digitise a variety of sample types, from fresh whole cores to resin-stabilised biscuits, rotary sidewall cores, and even cuttings. By accommodating diverse core geometries and enabling rapid data acquisition, the data is well-suited to complete any core analysis program, from newly acquired cores in exploration wells to legacy cores in brownfield revitalisation projects. In the next section, we describe our analysis logic, which integrates multidisciplinary results into the core analysis workflow just days after data acquisition is completed. This early integration enhances and optimises conventional core analysis programs from the outset.
CoreDNA leverages AI to deliver fast, objective, and repeatable interpretations of high-resolution core data, illustrated by its automated analysis of ultra-high-resolution images for grain size distribution mapping. This is achieved through the integration of two complementary AI models: one employing segmentation logic to delineate grains, and another utilising classification algorithms to determine the median grain size for every 1 cm-long slice of UHR images taken from the MiniSlab. These AI-driven predictions are further validated and enriched by integrating leads from other analytical streams, such as median grain size data derived from laser topography mapping of the MiniSlab. By introducing redundancy through this multi-stream approach, the platform reconciles discrepancies between models, ensuring a robust and reliable framework for core analysis. This synergy enhances the precision and dependability of the data results, equipping operators with high-fidelity, actionable data for subsurface evaluation.
In this section, we outline how the innovative digital core analysis workflow using CoreDNA contributes to accelerating and augmenting the identification of lithology types along cores. It provides a comprehensive and spatially continuous quantification of
Figure 1 CoreDNA™ transforms cores into continuous, high-resolution logs, digitising critical rock properties for multiple disciplines while maintaining a minimal footprint.
rock property distributions, which begins by organising reservoir heterogeneity into distinct rock facies. These facies, entirely and solely based on CoreDNA data, establish an objective framework for selecting an optimised number of subsample sites for further analyses. An advanced K-means clustering algorithm is applied to the dataset immediately after the end of the data acquisition. Facies present in the studied core interval are represented as clusters in the data space, with each point in a cluster assigned an RGB colour. The RGB values are determined by the distance of the cluster centroid from a fixed reference point. Consequently, clusters with centroids close to one another — relative to the defined heterogeneity scale — will have similar colours in the RGB space, meaning their colours will appear close to one another. Determining the optimal number of facies to capture reservoir heterogeneity is an adaptive process that depends on the scale and objective of the analysis. Heterogeneity is a scalable concept, shaped by the specific goals of the study. For example, it may be necessary to resolve heterogeneity at the centimetre scale to select thin sections accurately, or at the metre scale to differentiate flow units over a tens-of-metres-long reservoir section. In a clustering approach, the heterogeneity scale is defined by the largest distance between two distinct cluster centroids in the data space for the entire depth interval under investigation. A colour stabilisation diagram aids in identifying the optimum number of clusters. This diagram is created by running clustering scenarios for the same core interval with an increasing number of clusters.
Visualising the evolution of the colour scheme across these scenarios highlights key contrasts and transitions in heterogeneity, regardless of whether the interval is a one-metre section or a full core over 100 metres in length. The optimal number of clusters is the smallest number at which the colour scheme stabilises — where adding additional clusters only split existing ones without significantly altering the overall colour distribution.
Once clusters are established, CoreDNA property statistics for each cluster are reviewed. Ideally, the distribution of property values within each cluster should be narrow, allowing each cluster to be interpreted as a distinct facies with simple, well-defined characteristics linked to lithological properties (e.g., grain size, elemental composition as a mineralogy proxy, strength, permeability). The final number of clusters can be adjusted to refine the distribution of property values among facies, facilitating lithological interpretation. If project constraints, such as budget
or time, limit the number of subsamples that can be analysed, the clustering scheme can be adapted to match the number of samples available for subsequent reservoir quality analysis. For multi-well studies, a unified set of lithofacies is proposed, with a consistent colour code to cover all cores in the study.
Statistical properties of lithofacies identified as clusters are shown using the logic depicted in Figure 2.
The vertical axis of the statistic box represents the facies number, while the horizontal axis shows the range of one of the physical properties used in clustering. The topmost line shows the statistics for the physical property displayed by the statistic box for the entire core. Each facies is shown on a separate line below, with a colour specific to that facies, spanning from the 1st to the 99th percentiles of the property. A dot on this bar indicates the median value for the physical property within the facies. The left end of the thick bar shows the 13th percentile while the right hand side of the thick bar shows the 87th percentile.
Although CoreDNA does not directly measure all properties needed for a full assessment of reservoir quality — such as storage potential, specific mineral content, static elastic moduli — many components in its dataset are directly related with these properties. Consequently, the CoreDNA™ facies, which group core intervals with similar characteristics, provide a robust framework for optimising sampling site selection for many branches of reservoir quality assessment studies, ranging from mineralogy and sedimentology, to petrophysics and geomechanics.
In an initial sampling strategy, one sample per facies is selected to represent each CoreDNA facies with minimal sampling. Each sample site is precisely positioned within a core interval that corresponds to the centroid of its respective cluster, thereby maximising the effectiveness of this single sample for representing the entire facies. Sampling site selection is entirely guided by objective criteria derived from precise data, ensuring unambiguous identification of optimal subsample locations along the core and enabling full process automation. This provides substantial support to operator teams by eliminating what would otherwise be a time-consuming and labour-intensive task, often involving arbitrary decisions due to a lack of supportive knowledge.
If further sampling is needed to capture finer details in the distribution of petrophysical and mineralogical properties, additional sample sites can be selected based on the statistical and spatial facies layout along the cores to build on the initial results. Here, the precise knowledge of vectors along core intervals within each facies aids in selecting sites that maximise the likelihood of capturing the full range of heterogeneity for the targeted properties on these new subsamples. By contextualising the subsample selection process, The platform ensures that chosen samples accurately represent the key patterns of reservoir heterogeneity. A data-driven selection approach significantly reduces uncertainty when vertically upscaling detailed mineralogical, petrophysical and geomechanical data from subsample tests, guiding subsample data acquisition to produce only relevant information for propagation to the wireline log scale
The detailed information obtained from subsamples offers valuable insights into reservoir complexity but is insufficient for comprehensive reservoir quality analysis on its own. Upscaling these results to the resolution of wireline logs is essential to achieve complete, continuous coverage of the cored interval and to identify and validate accurate transfer laws for predicting reservoir quality in offset wells. The extensive, high-resolution dataset generated by CoreDNA provides a robust foundation for this upscaling process. The facies combine continuity with multidisciplinary data, making them ideal for uncovering complex correlation patterns and identifying outliers in discrete sample analyses. By associating each centimetre of the core with a facies — where key properties are derived from the most representative subsample — these characteristics can be effectively propagated across the entire cored interval. This continuous, centimetre-scale dataset significantly complements and enhances wireline log interpretation, introducing greater objectivity to reservoir quality assessments and reducing uncertainty in risk evaluations.
This innovative core digitalisation workflow is applied to cores from Well 15/12-20 S, drilled in 2008 by Talisman in the Norwegian Central North Sea. Two cores totalling 81.1 m were taken from the Middle Jurassic Sleipner Formation and the Triassic Skagerrak Formation. In 2018, Repsol relinquished the core samples to Stratum Reservoir and the University of Stavanger. This example represents a typical use case for CoreDNA™ on legacy cores to enhance data integration in heterogeneous clastic reservoirs.
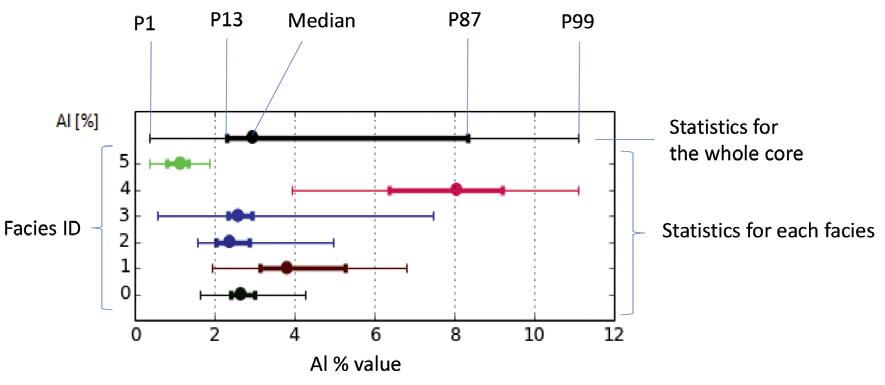
The CoreDNA data acquired on these cores is shown in Figure 3. The facies analysis revealed 14 distinct facies, spatially distributed along the tested core interval as displayed in the 4th and 5th columns from the left. The statistic box of the vectors are shown in Figure 4.
The examination of distributions of the solution’s property values for each of the 14 facies leads to the identification of five distinct families of facies grouped in Table 1, corresponding to actual lithologies listed in the last column on the right-hand side. The first group of four facies amount to of 33% of the total tested core length and includes only clean sandstones, all with limited concentrations of chemical elements, indicative of low clay content and a median grain size ranging from very fine to medium sand. The second group, amounting to 27% of the total tested core length, comprises an AL shale and three clay-rich (denoted by the relatively high Al concentration) sandstones with median grain sizes ranging from very fine to fine sand. The third group covers 20% of the total tested core and includes K-Feldspar rich sandstones, with median grain size either very fine or fine sand. The fourth group consists of two facies that span across 16% of the total tested core length and comprises shale sections characterised by high concentrations
of several clay-marking elements. The two last clusters stand apart as pyrite-rich shale and a carbonate-rich shale, each amounting to a few percent of the total core length.
QEMSCAN (Quantitative Evaluation of Minerals by Scanning Electron Microscopy, a brand name of Thermo Fisher Scientific) is a modern core data acquisition technology that provides detailed mineralogical and textural data of high value for subsurface charactersation (McCormick, et al., 2021). Combining advanced scanning electron microscopy with automated mineral analysis, QEMSCAN delivers highly accurate, quantitative insights into the composition and distribution of minerals within rock samples. Unlike traditional mineralogical techniques, which can be time-consuming and less precise, QEMSCAN rapidly generates high-resolution mineral maps and quantitative data on porosity, grain size, and mineral associations. This level of detail allows geoscientists and engineers to make more informed decisions about reservoir quality, depositional environments, and potential production challenges, offering a powerful tool to support both exploration and production strategies. The QEMSCAN analysis

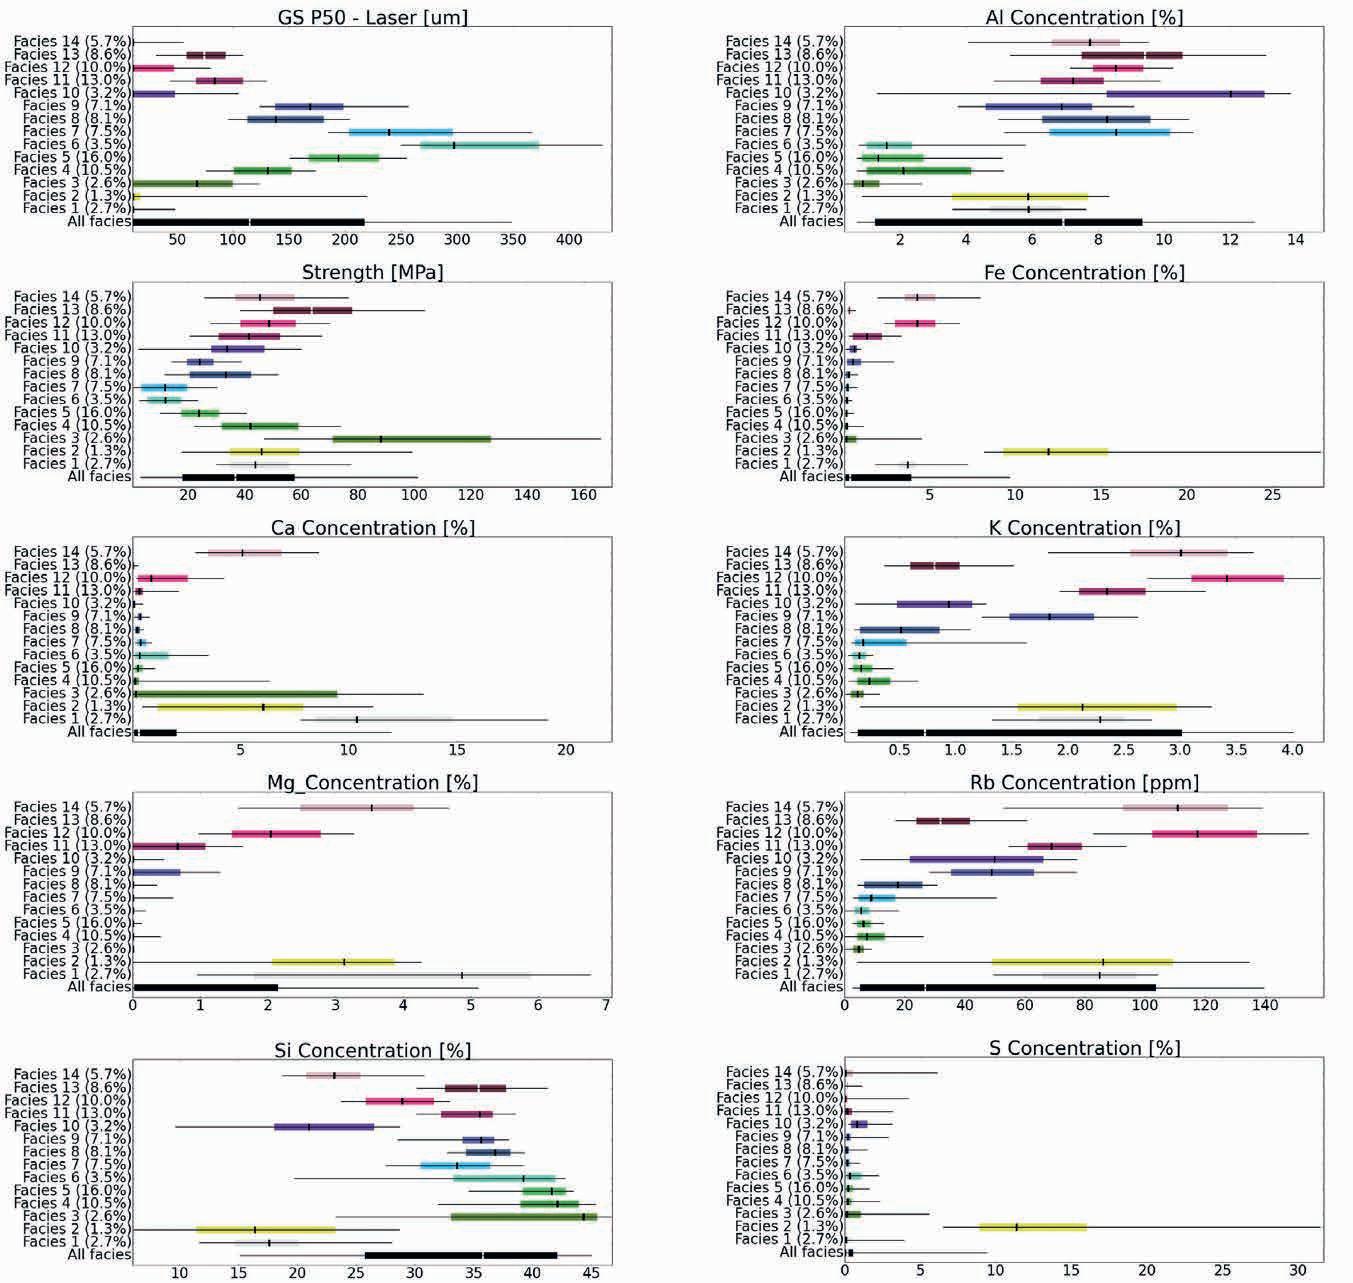
protocol begins with data acquisition and validation, where raw QEMSCAN data — comprising high-resolution maps of elemental compositions — undergoes quality checks to remove noise, correct artifacts, and verify classifications. Next, mineralogical and textural classification assigns minerals to groups using automated recognition, with specialists refining associations, grain sizes, and textures to enhance analytical resolution. Quantitative metrics, such as mineral volume percentages, porosity, and pore size distributions, are then calculated, building a comprehensive profile for each sample. Advanced algorithms and machine learning recognise mineral patterns across samples, enabling more effective upscaling to broader reservoir models. This pattern recognition step produces a continuous representation of mineralogical properties, which is essential for field-scale analysis. By incorporating CoreDNA continuous, high-resolution core logging capabilities, operators can enhance the spatial continuity of QEMSCAN mineralogical insights. The processed data is then correlated with petrophysical
and mechanical properties to connect mineralogy with reservoir characteristics, thereby reducing the uncertainty in the prediction of reservoir behaviour and production potential.
A total of 14 subsamples were selected from intervals corresponding to the centroid of individual CoreDNA clusters and analysed using QEMSCAN to create detailed data on mineralogy, porosity, grain size, pore size, and density representative of each facies. The results of the QEMSCAN analysis are shown for each CoreDNA™ facies in Figure 5.
The facies interpretation and classification into distinct lithological families, based solely on early CoreDNA data, was found to be fully consistent with the later QEMSCAN results obtained on subsamples. QEMSCAN confirmed that the four samples from the clean sandstone facies exhibited high quartz content with minimal clay. The median grain sizes identified by CoreDNA were
Table 1 Grouping CoreDNA™ into lithologies.
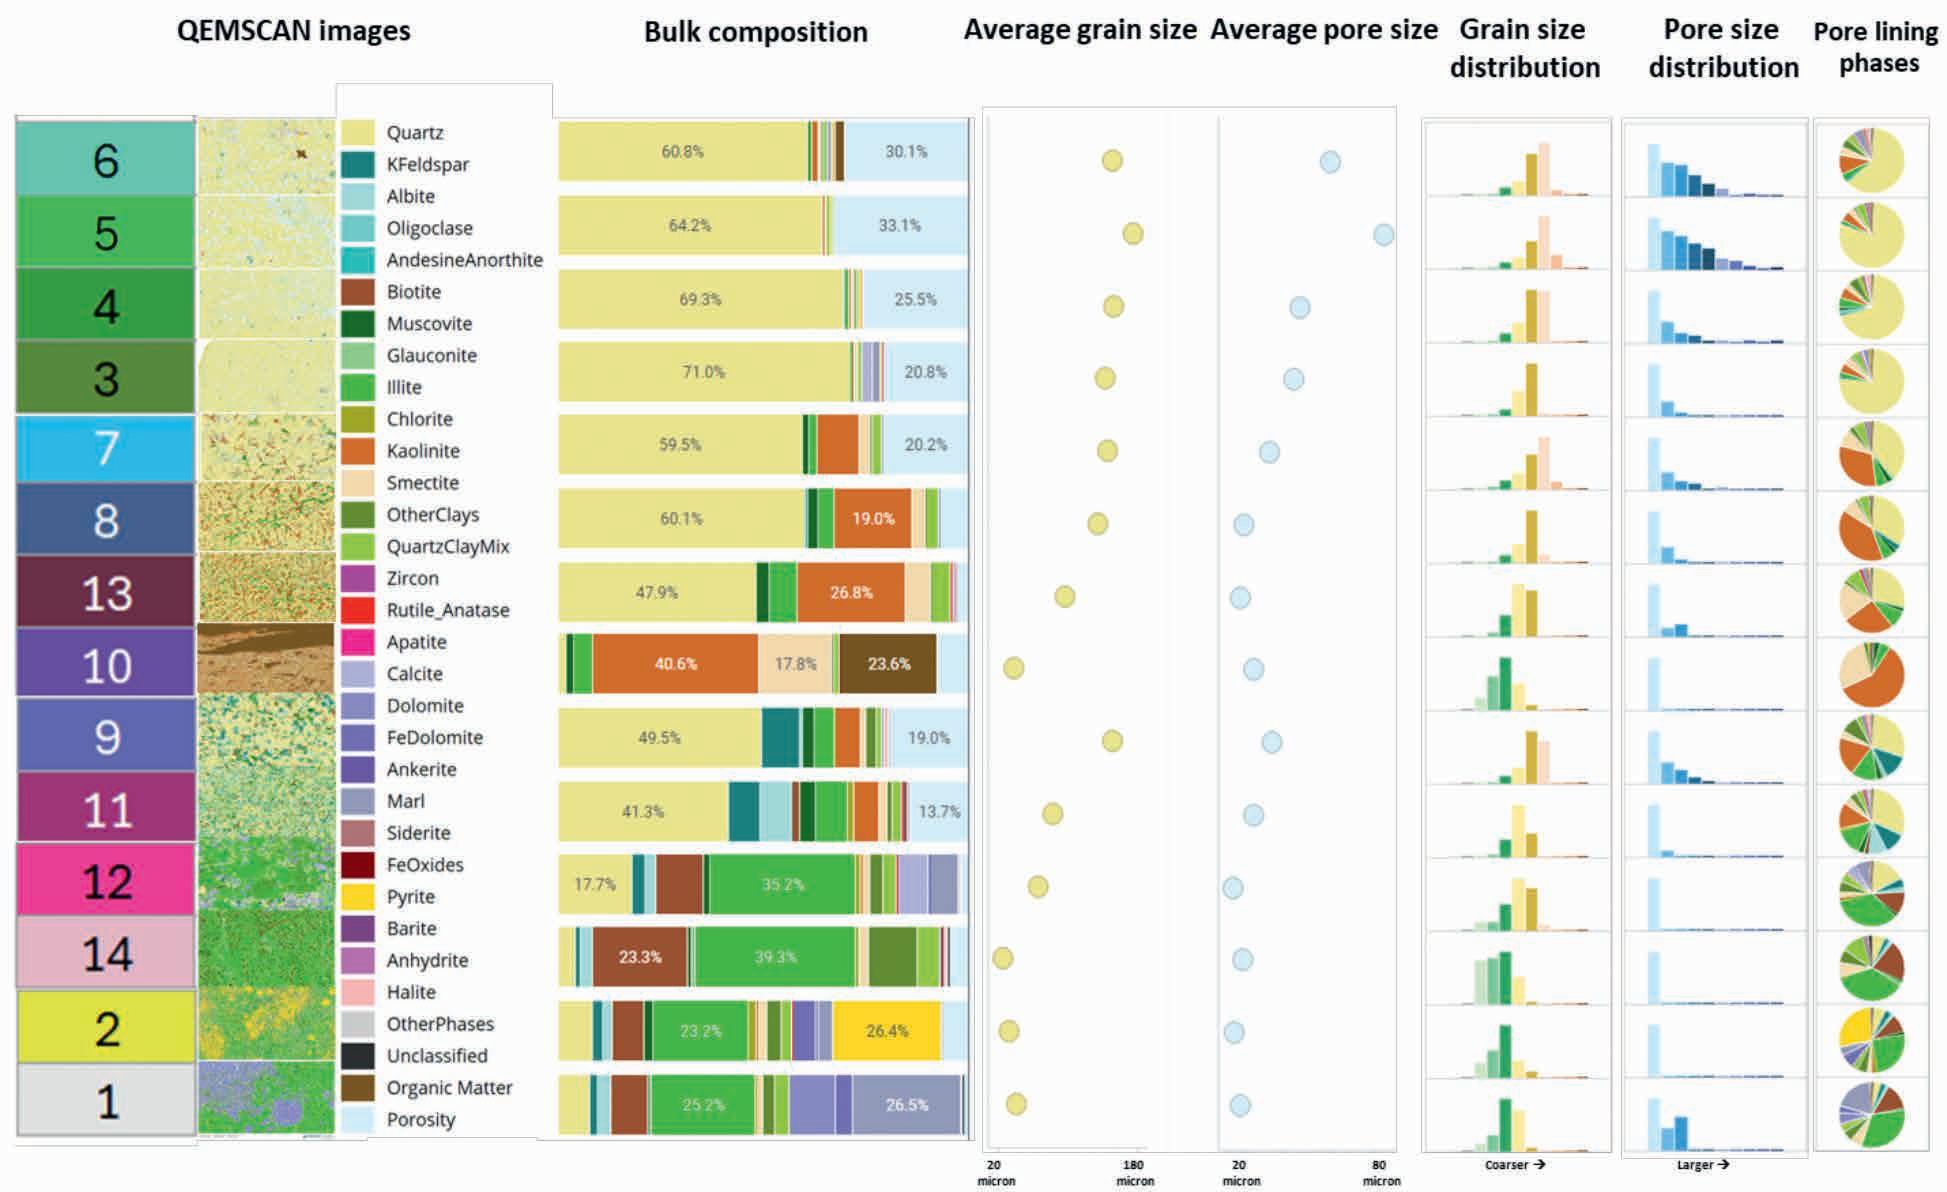
corroborated by QEMSCAN. Samples representing the shaly sandstone facies showed various concentrations of clay minerals combined with high quartz content, except for facies 10, which was a pure shale. The two samples in the third lithology group (high Si and K concentrations) were confirmed by QEMSCAN to be K-Feldspar-rich sandstones. The samples in the fourth
lithology group (moderate Si concentration, relatively high Al concentration) were also confirmed by QEMSCAN results as shaly sands, one with a significantly coarser grain fraction as indicated by the CoreDNA Ultra High Resolution photos. Finally, the facies interpreted from CoreDNA as a pyrite (high S and Fe concentrations) and a carbonate-rich (high Ca concentration) rock
indeed contain pyrite and calcite, respectively, as confirmed by QEMSCAN.
These results validate the effectiveness of using CoreDNA reservoir heterogeneity maps to optimise QEMSCAN and related workflows sampling plans.
The alignment of QEMSCAN results with the CoreDNA facies interpretation confirms the value of using facies distribution along the core to extrapolate QEMSCAN attributes across the entire core length. This approach assigns each subsample
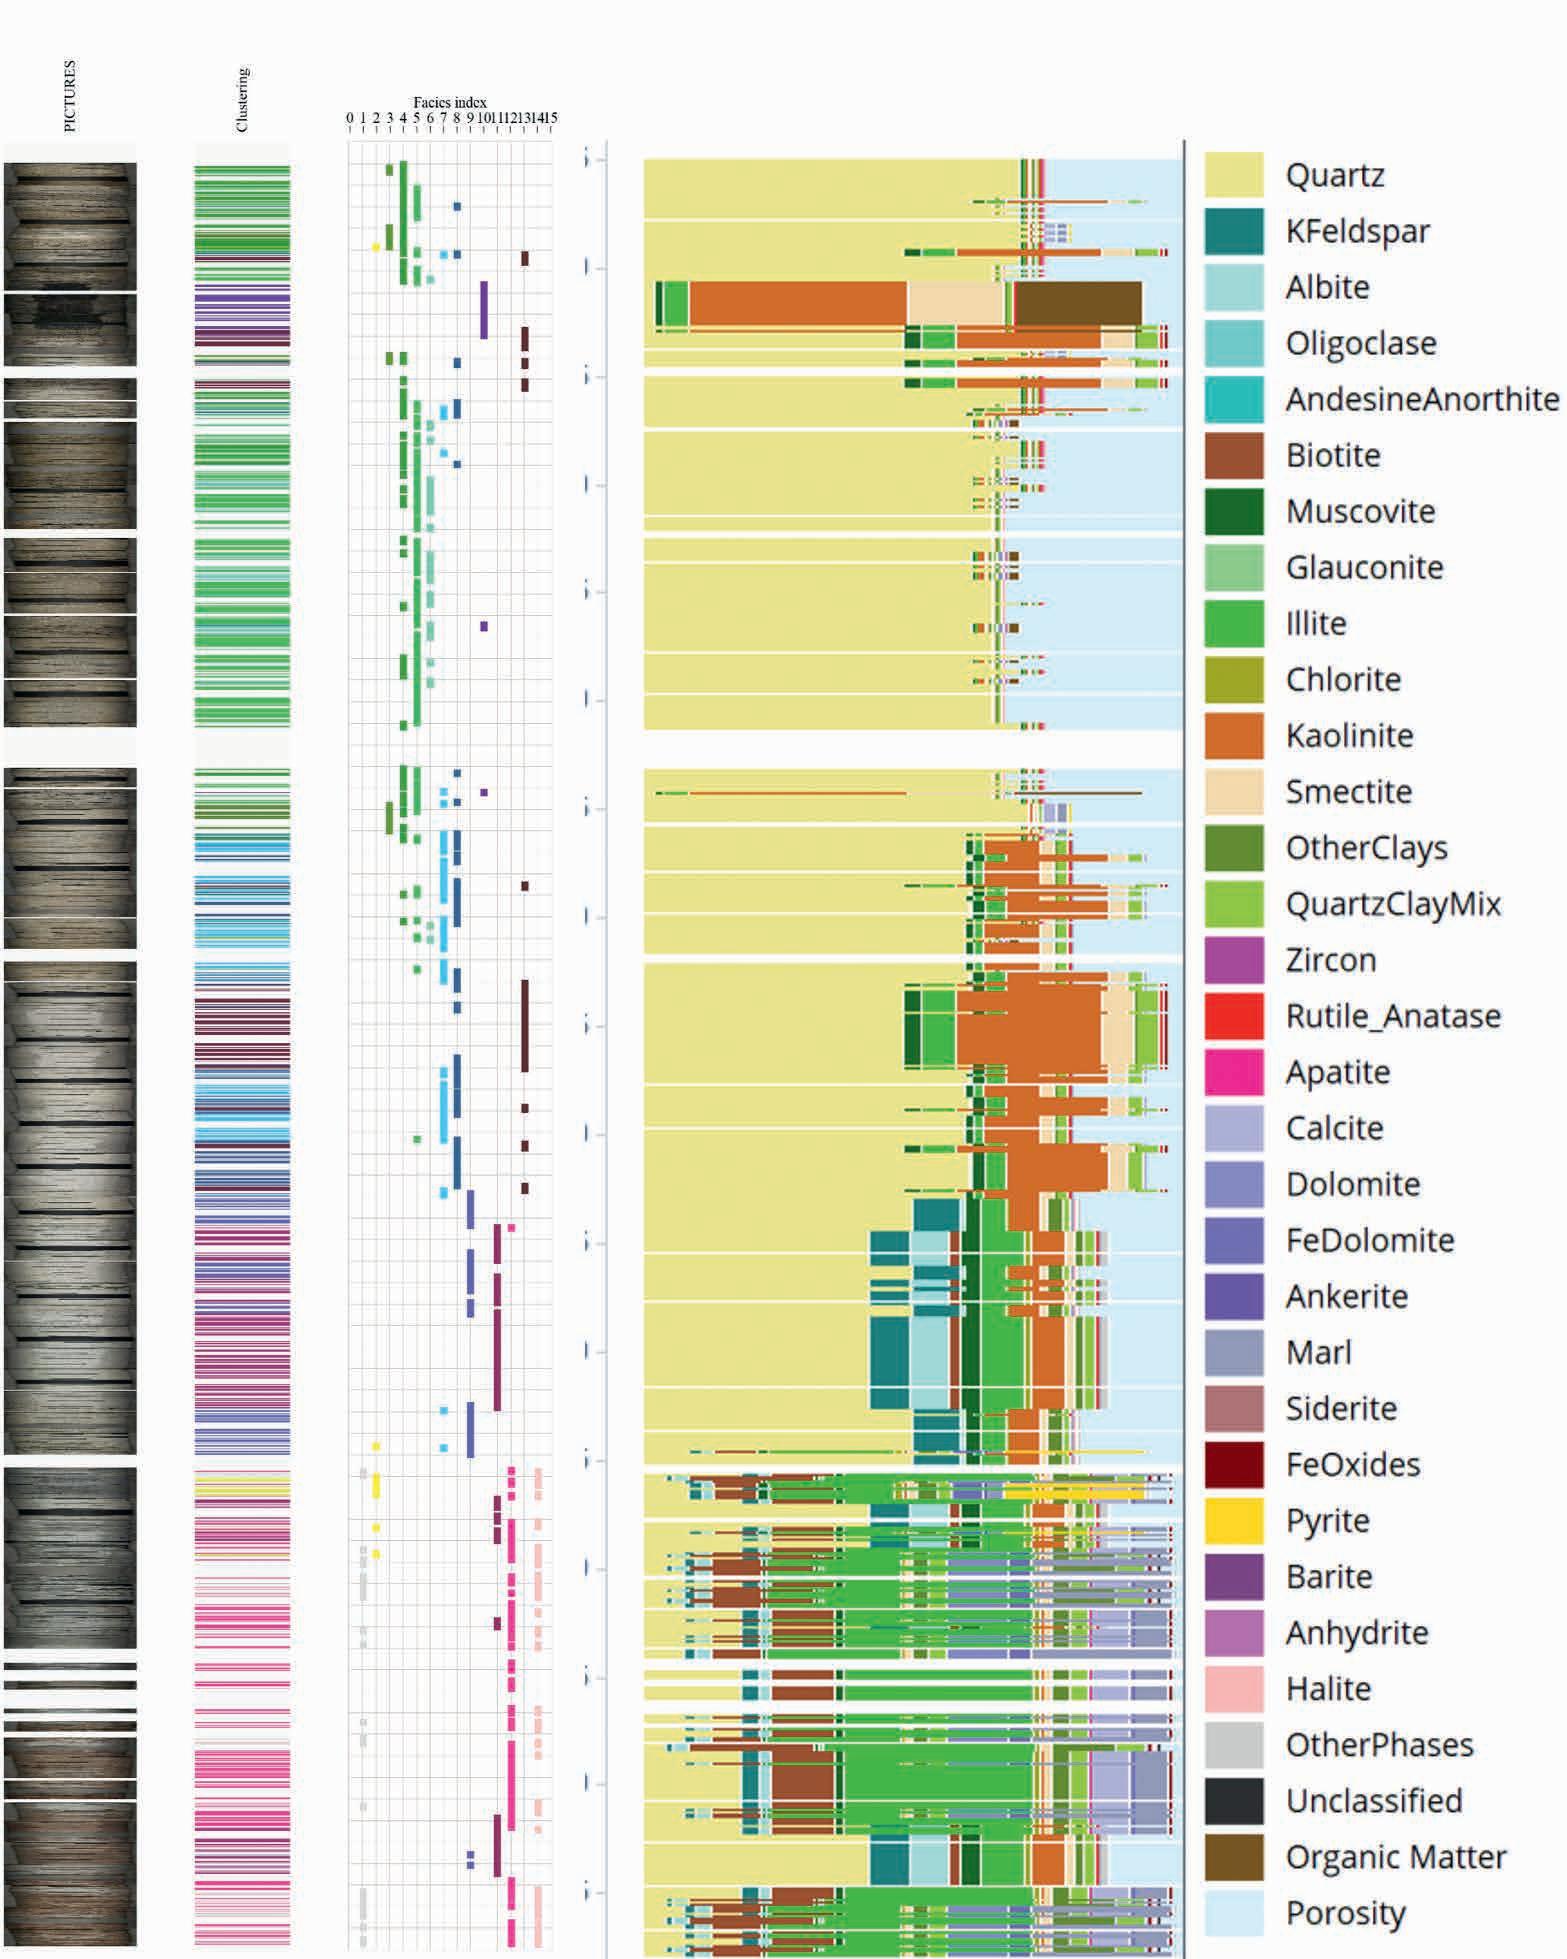
property to all intervals belonging to the corresponding facies. Figure 6 presents the resulting continuous distribution of mineralogical and petrophysical properties derived from QEMSCAN.
CoreDNA redefines subsurface evaluation by delivering continuous, high-resolution core logs that seamlessly integrate with advanced mineralogical and petrophysical analyses. Through its real-time, non-destructive characterisation of core samples, it enhances efficiency, reduces uncertainty, and supports faster and better decision-making across exploration and development workflows. Its scalable design ensures adaptability to various geological settings and resource types, from hydrocarbons to minerals, and carbon capture and sequestration projects, offering operators unparalleled flexibility and precision.
What sets the tool apart is its ability to safeguard the ROI of core analysis while driving innovation in subsurface evaluation. By bridging traditional workflows with cutting-edge digital technologies, it enables faster, more accurate insights that align with the industry’s growing focus on sustainability and operational efficiency. The incorporation of robust, multidisciplinary data streams ensures actionable intelligence, empowering operators to optimise their strategies and stay ahead in an increasingly competitive landscape.
As the industry moves toward more sustainable practices, the platform provides a transformative path forward, integrating precision and adaptability to meet evolving demands. Its ongoing evolution underscores a commitment to reshaping subsurface resource management, delivering tangible value across the entire
lifecycle of resource development. By revolutionising how cores are analysed, CoreDNA ensures operators remain at the forefront of technological advancements, achieving superior outcomes in resource exploration and beyond.
References
Germay, C., Lhomme, T. and Bisset, P. [2021]. Combining high-resolution core data with unsupervised machine learning schemes for the identification of rock types and the prediction of reservoir quality. The 34th International Symposium of the Society of Core Analysts
Germay, C., Lhomme, T. and Perneder, L. [2023]. Core digitalization programme and Artificial intelligence for the automatic recognition of sedimentological features. The 36th International Symposium of the Society of Core Analysts Abu Dhabi.
Germay, C., Lhomme, T. and Perneder, L. [2023]. High-resolution core data and machine learning schemes applied to rock facies classification. (A. Neal, M. Ashton, L. Williams, S. Dee, T. Dodd, & J. Marshall, Eds.) Special Publications of the London Geological Society, 527(Core Values: the Role of Core in Twenty-first Century Reservoir Characterization), 121-135. doi:https://doi.org/10.1144/SP527-2021-19.
Germay, C., Lhomme, T., Perneder, L. and Cummings, J. [2022]. Combining high-resolution core data and machine learning schemes to develop sustainable core analysis practices. The 35th International Symposium of the Society of Core Analysts. Austin.
McCormick, C. A., Corlett, H., Stacey, J., Hollis, C., Feng, J., Rivard, B. and Omma, J. [2021]. Shortwave infrared hyperspectral imaging as a novel method to elucidate multi-phase dolomitization, recrystallization, and cementation in carbonate sedimentary rocks. Sci Rep, 11(21732). doi:https://doi.org/10.1038/s41598-021-01118-4.
D. Markus1*, K. Rimaila1, P. de Groot1, and R. Muammar 2 present a new workflow for creating 3D volumes from 2D seismic data using a post-stack, interpretation-guided, data-driven process that combines conventional techniques with modern deep learning algorithms.
Abstract
Here, we present a new workflow for creating 3D volumes from 2D seismic data. In essence, our method is a post-stack, interpretation-guided, data-driven process. We combine conventional techniques with modern deep learning algorithms to create a so-called Pseudo3D volume. We describe the workflow based on an example from offshore Indonesia.
Introduction
2D seismic data remains an invaluable tool for evaluating the subsurface in a cost-effective manner. Companies in the E&P business assessing new permits or exploring new basins may have to work with legacy 2D data. In the initial stage of exploration, E&P companies may, for economic reasons, decide to acquire new 2D data. Also in offshore windfarm development projects, ultra-high resolution 2D data is nowadays routinely acquired. These data sets serve as input for building geotechnical models for positioning – and designing foundations of wind turbines.
While 2D seismic data remains crucial, the lack of lateral continuity makes these datasets less suitable for appraisal and development stages. Furthermore, interpreting 2D data presents its own set of challenges (i.e. miss-tie and inconsistent amplitude value) effectively introducing elements of uncertainty, whereas interpreting 3D volumes is more robust. The continuous 3D representation eliminates the need to piece together separate 2D sections and 2D horizon information, streamlining the interpretation process. A Pseudo3D volume is suitable for regional interpretation, providing a comprehensive view of the subsurface without the need to acquire 3D seismic data over large areas. This capability is invaluable for understanding of subsurface geology, identifying potential resources, and making well-thought out exploration decisions.
The first workflows to transform 2D seismic into 3D are pre-stack interpolation methods developed in the 1980s. Chilcoat et al. [1983], use space-time filtering for re-gridding and interpolation. French et al. [1987] utilises a Common Reflection Point (CRP) stacking method for the 3D interpolation process. According to Lin and Holloway [1988], this
1 dGB Earth Sciences BV. | 2 Conrad Asia Energy Ltd.
* Corresponding author, E-mail: david.markus@dgbes.com DOI: 10.3997/1365-2397.fb2025014
filtering technique has severe dip limitation due to spectral aliasing but the CRP stacking method makes use of structural dip information to compute the subsurface reflection point as the stacking bin. In their 1988 paper, Lin and Holloway use the apparent dip of 2D lines to reconstruct the true dip of the 3D structure in the interpolation process. Whiteside et al. [2013] propose a de-migration / re-migration method. First, they harmonise seismic surveys from different vintages by matching phase, time, amplitude and frequency. Next, they apply a post-stack de-migration and construct a 3D geologic time model for structurally guided interpolation of the de-migrated 2D seismic data. The final step is a post-stack 3D migration that images seismic events into the correct spatial position. Whiteside et al.’s method is rigorous, but the final results lack geological detail. Moreover, the process is time-consuming and requires a lot of computing power. Para et al. [2018] follow a similar approach to create a 3D seismic volume covering the entire country of Abu Dhabi. They merge numerous 3D data sets with Pseudo3D volumes created from available 2D data. Their Pseudo3D approach differs from Whiteside et al. in that they do not de-migrate and re-migrate the data. Instead, they applied horizon-guided interpolation of the migrated 2D data. At the end of the process, they sometimes (but not all the time) have to apply an additional smoothing filter to remove geometrical artifacts coming from the conversion from grid to volume. As with Whiteside et al.’s method, the end result looks rather smooth but lacks geological details observed in real 3D data.
Against this background, we set ourselves the task of developing a new workflow with the following parameters/constraints:
• Use post-stack data as this is widely available
• Fast turnaround and valid economics for making a business case
• Results comparable to methods requiring re-processing/ re-migration
• Use machine learning to enhance any step where it can provide improved results and accelerated timeframes
• Deliverables that approach the fidelity of real 3D seismic and can be used to guide the planning for 3D seismic acquisition and make economic decisions.
The approach presented in this paper combines conventional techniques for harmonisation, interpolation and filtering with modern machine learning algorithms. The workflow is faster and requires less computing power than pre-stack or de-migration/ re-migration workflows without compromising on the quality.
Pseudo3D method
Our new workflow was developed based on earlier work on machine learning-driven seismic interpolation methods (de Groot and van Hout [2021], de Groot and Huck [2021], Markus et al [2024]). The new workflow consists of five main tasks that have been applied to a real dataset from offshore Indonesia. Here, we have multi-vintage datasets consisting of numerous 2D lines and two small 3D volumes. The main 2D grid exhibits a trace spacing of 6.25 m that was used to set up a 3D survey grid with a bin-size of 6.25 x 6.25 m. We created 2D grids from the 3D volumes and utilised the resulting 2D lines as additional inputs for our workflow. Figure 1 shows a fence diagram of all 2D lines used in construction of the Pseudo3D volume as well as QC for the method against the 3D volumes that overlap the survey.
The five steps of our workflow are:
1. Harmonisation
2. Miss-tie and Time Shift Correction
3. Interpolation
4. Post-Interpolation Processing
5. Spectral Enhancement.
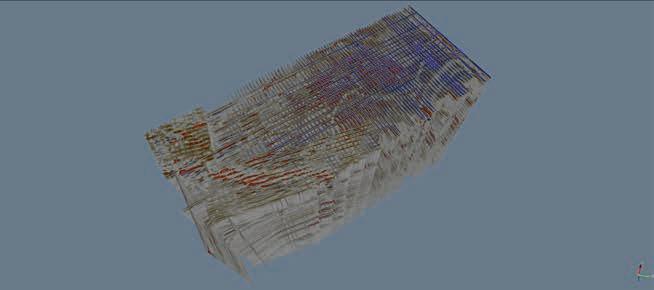
Step 1, Harmonisation. In the harmonisation step we balanced the time-shifts, amplitudes, phases, and frequencies. These are essential when working on multi-vintage datasets, but it can be skipped in single-vintage projects (unless significant over-whitening or aggressive bandwidth extension have been previously applied and needs to be mitigated). In this study we harmonised the 2D seismic survey to match the two 3D surveys. The amplitude, phase, and frequency spectra balancing were carried out in a conventional way by computing and applying a matching filter.
Step 2, Handling of miss-ties and time-shift corrections are almost always necessary; seismic events on perpendicular 2D lines are commonly not well aligned at the intersections if they are dipping, as the time-shift varies with depth as a function of dip; and then also the apparent velocities picked on intersecting lines may differ to the effects of anisotropy and other such complications, resulting in further time-shifts. To avoid interpolation artifacts, the seismic traces at the intersections need to be timealigned. We did this by mapping the main seismic events on the 2D grid and by gridding the time-shift errors at the intersections along the seismic lines, we applied such time-shifts results in seismic traces that are fully aligned at all intersections. After aligning the seismic lines, the mapped horizons were re-snapped to the shifted seismic data.
Step 3, Interpolation. We utilised the re-snapped horizons in a structurally conformal horizon-guided interpolation step to generate a first-pass Pseudo3D volume. Depending on the line spacing, we can either use a machine learning model as interpolator, or a more conventional interpolation algorithm. In this case we used a fast, nearest trace interpolation algorithm. We can create additional horizons between the picked horizons that help us capture structural and stratigraphic details. We can also convert to the Wheeler Domain to ensure that our sequence stratigraphic interpretation is well correlated before performing the structurally conformal interpolation. Ensuring that the number of key horizons is large enough to capture the geologic details evident in the 2D lines allows us to perform the best possible structurally conformal interpolation.
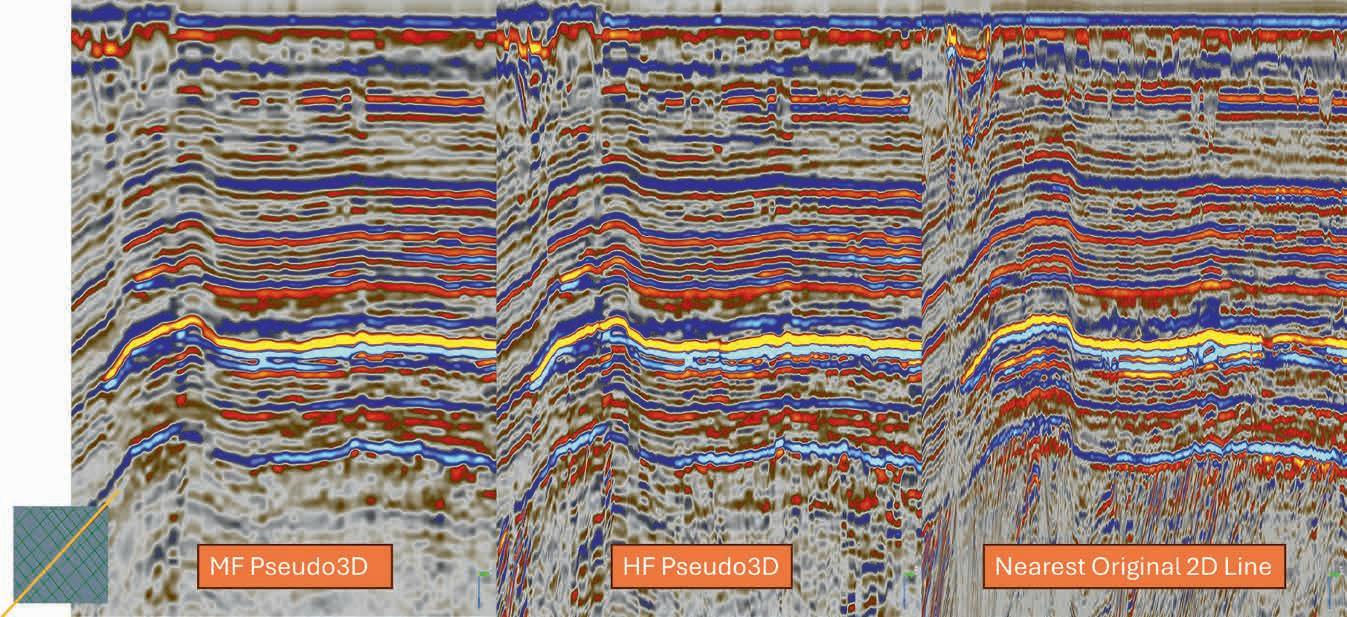
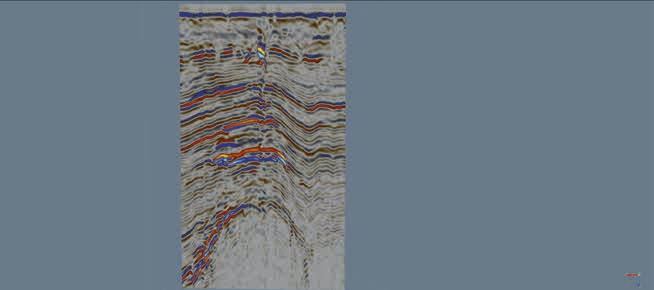
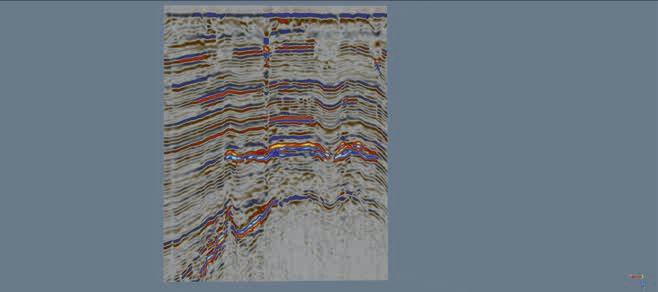
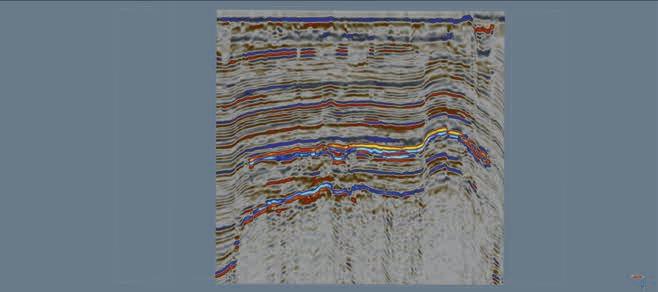
Step 4, Post-processing of the first-pass Pseudo3D algorithm depends on the interpolation algorithm applied in the previous step. Most interpolation algorithms produced artifacts that needed to be removed by some form of smoothing filter. In this study we applied two very fast Recursive Gaussian Smoothing filters back-to-back. The result was a smooth volume we call Medium Frequency (MF) Pseudo3D. This result is comparable in frequency content with results obtained by other workers.
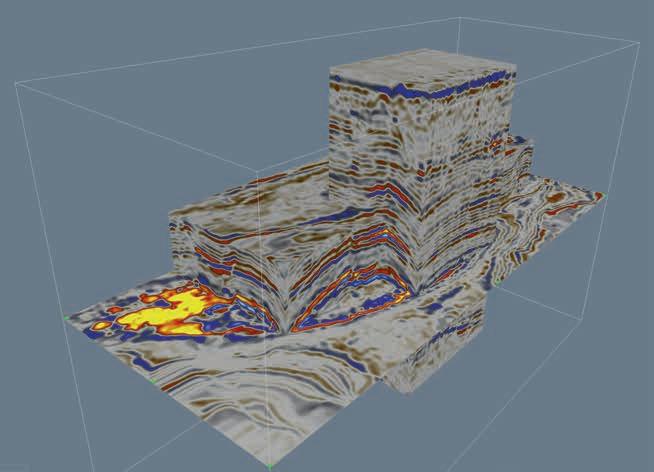
Step 5, Machine learning. In the final step, we applied a machine learning model that transforms the smoothed, interpolated MF Pseudo3D into a high frequency (HF) Pseudo3D volume. The model is a 2D U-Net that we trained on MF Pseudo3D images as input and harmonised 2D seismic as target. Next, we applied the trained model to the MF Pseudo3D volume in both the inline and crossline directions. We then average these results to produce the HF Pseudo3D volume as the final product. Figure 2 compares the MF with HF Pseudo3D with the nearest original 2D line at a position in between two 2D lines (thus at a position where we have the least information available to make the prediction). We can see that the HF Pseudo3D shares many more qualities with the original seismic, and the case can be made that the information is geologically plausible rather than ‘hallucinated’ (whereas hallucinate is a term of art in machine learning referring to ML predictions that contain false or misleading responses that are presented as fact, but ungrounded, and something we wish to mitigate through careful design of models and training regimes). Figure 3 shows 2D transects or random lines extracted from the HF Pseudo3D volume at oblique angles (around 45 degrees). It can be seen
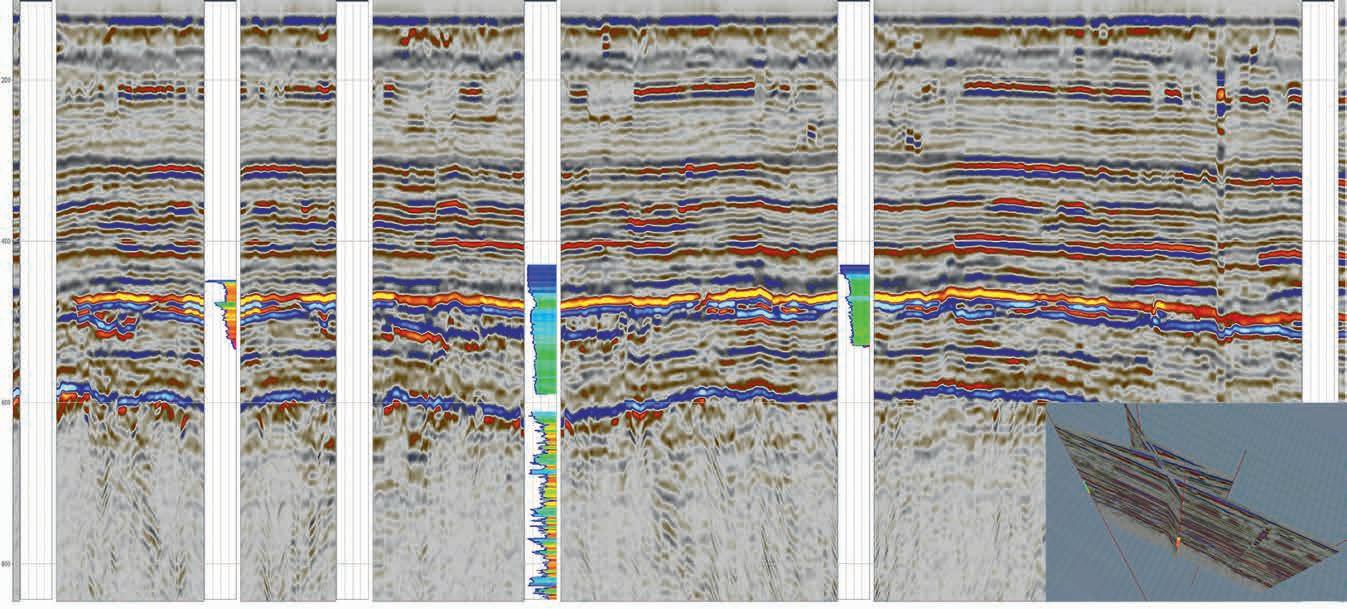
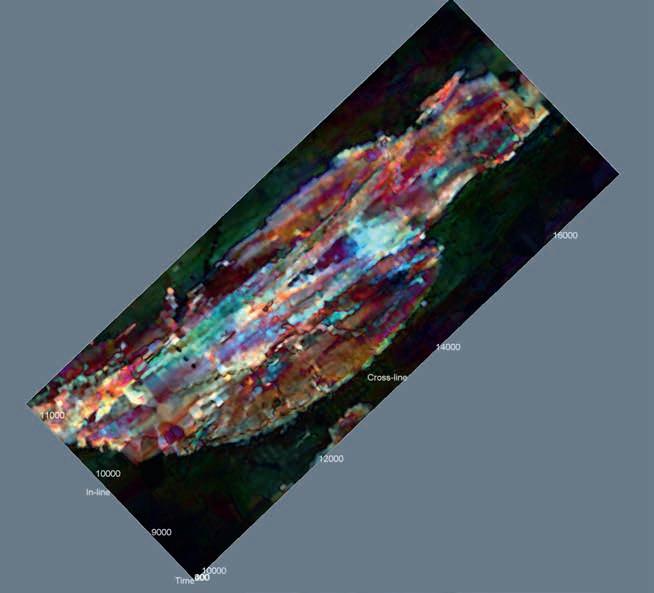
Figure 6 RGB colour blending of three spectral components at a level of interest. Note, the channel features in this image.
that structure is well interpolated in areas that are not flat and contain significant dips and other features. We note that some vertical artifacts remain in low data areas and that the temptation to filter them out should be avoided as they provide a visual cue to uncertainty in the predictions.
Interpretation possibilities
A Pseudo3D volume facilitates a flexible interpretation process, allowing omnidirectional subsurface identification while enabling interpretation workflows that require 3D seismic data. Figure 4 shows a volume rendering of the HF Pseudo3D volume, which can be sliced through in any arbitrary direction. For example, in Figure 5 we created a random transect connecting five wells.
A spectral decomposition volume was derived from the Pseudo3D data as shown in Figure 6. We utilised RGB colour blending of three spectral components to highlight geological features at a level of interest. The result allows an accurate definition of channel and geological boundaries that were found to be very difficult to be mapped with 2D seismic data.
We presented a new post-stack workflow for creating Pseudo3D volumes from 2D seismic data. This workflow combines interpolation algorithms and machine learning to maximise the value of
2D seismic data. Pseudo3D allows for comprehensive subsurface evaluation without the need to acquire 3D seismic data over large areas, reducing the exploration cost. Furthermore, the high frequency Pseudo3D volume can be used for regional geological interpretation as it offers clear and comprehensive subsurface imaging as presented in this case study where it can be observed that the spectral decomposition volume derived from the Pseudo3D allows for accurate delineation of geological features such as channel geometries in the study area, and thus further reducing the subsurface uncertainties.
We would like to thank Conrad Asia Energy Ltd. for its support in developing this workflow and for permission to show these results.
Chilcoat, S. and Wang C.Y. [1983] Three-Dimensional Plane Pass Filtering as a Regridding and Interpolation Technique. 53rd Annual SEG Conference & Exhibition, Las Vegas, 1983.
De Groot, P. and van Hout, M. [2021]. Filling gaps, replacing bad data zones and super-sampling of 3D seismic volumes through Machine Learning. EAGE Annual Conference & Exhibition, Amsterdam, 18-21 Oct. 2021.
De Groot, P. and Huck, A. [2021]. Machine Learning workflows to create pseudo-3D from 2D seismic. SEG Digital Intelligence Series, 2nd edition Artificially Intelligent Earth Exploration, Virtual Workshop, 30 Nov. – 2 Dec. 2021.
French, W.S. and Miller, M.H. Jr. [1987]. Time Slices from 2-D Seismic Surveys. 57th Annual SEG Conference & Exhibition, New Orleans, 1987.
Lin, J. and Holloway, T. [1988]. 3-D Seismic gridding. SEG expanded abstracts, 1301-1304.
Markus, D., Rimaila, K., De Groot, P. and Muammar, R. [2024]. Transforming 2D seismic into Pseudo3D. EAGE Conference on Digital Twins and Artificial Intelligence, Kuala Lumpur, 15-16 October, 2024.
Parra, H., Caeiro, M., Neves, F. and Gomes, J. [2018]. First Abu Dhabi 2D/3D Seismic Merge. Fast Track Approach For Seismic Data Integration at Regional Scale in Exploration Studies. SPE-193066-MS. Abu Dhabi International Petroleum Exhibition and Conference held in Abu Dhabi, UAE, 7-10 November 2018.
Whiteside, W., Wang, B., Bondeson H. and Li, Z. [2013]. Enhanced 3D Imaging from 2D Seismic Data and its Application to Surveys in the North Sea. 75th EAGE Conference & Exhibition incorporating SPE EUROPEC 2013, London, UK, 10-13 June 2013.


Mario Ruggiero1* and Ivo Colombo1 present a Computer Vision System for automated and uncrewed shale shaker visual monitoring, coupled with Deep Learning (DL) Artificial Intelligence (AI) models, that produce high-frequency objectively interpreted real-time data that can be recorded and plotted along drilling parameters.
Abstract
Evaluating the effectiveness of hole cleaning and ensuring wellbore stability is crucial for preventing unwanted events such as kicks or stuck pipes, with consequent minor or major non-productive time (NPT) that, in severe cases, may lead to well abandonment. Beyond the economic implications, these scenarios pose risks of environmental damage and jeopardise the safety of rig personnel. Shale shakers are the first indicator of emerging borehole cleaning and wellbore stability problems and as such, they are a fundamental component of the drilling rig.
Monitoring the shakers and periodically collecting samples are tasks typically assigned to humans. These processes lack continuity in monitoring and rely on subjective interpretation of observed samples, often requiring humans to spend significant time in hazardous zones. Real-time machine learning-based automated detection and interpretation of the shaker screens can substantially improve rig safety by reducing the need for humans to be present in hazardous conditions with fumes and noises when their direct intervention is unnecessary.
A novel Computer Vision System has been implemented for automated and uncrewed shale shaker visual monitoring, coupled with Deep Learning (DL) Artificial Intelligence (AI) models. The system produces high-frequency objectively interpreted real-time data that can be recorded and plotted along drilling parameters. It aims to replace the traditional human-based monitoring approach by giving a continuous objective detection of shaker performance and events and enabling safer and more effective drilling operations.
Introduction
Shale shakers are field-deployed mechanical separators used in the oil and gas sector to remove cuttings from circulating drilling fluids. As the first and most essential step in the solids control system, they ensure the drilling fluid remains clean, reusable, and effective, protecting downstream equipment and optimising drilling efficiency.
1 Geolog Technologies
* Corresponding author, E-mail: m.ruggiero@geolog.com DOI: 10.3997/1365-2397.fb2025015
At the same time, shale shakers also represent the first point where an engineer can observe the material returning out of the well and infer the efficiency of drilling operations and the integrity of the equipment and borehole.
Ensuring effective separation, closely tied to the rheological properties of the drilling fluid, is a critical factor in shale shaker performance. Advanced monitoring technologies, such as cameras, can effectively detect issues like mud overflow, significantly reducing the costs associated with drilling fluids and minimising the need for constant personnel oversight.
Despite advancements in fluid-solid separation technologies, progress in addressing health, safety, and environmental (HSE) concerns for personnel working near shale shakers has been limited. While innovations like sinusoidal screens, flow control enhancements to increase capacity, and multi-deck shakers have been explored, few modern technologies specifically target improving the safety of workers operating close to these machines.
Personnel working near the shale shaker area are currently exposed to high levels of noise and vibration, raising significant HSE concerns with prolonged exposure. Basic Personal Safety Equipment (PSE) can address these issues, but more advanced concerns, such as the release of chemicals as vapour and mist, pose major long-term health risks (Kroken et al., 2013). Vapours including naphthalene, benzene, toluene and xylenes, but also natural gas, CO2 and H2S can affect the eyes, lungs and the central nervous system, while displacing oxygen from the surrounding area. Chemicals added to the drilling fluids, which are then exposed to high pressure and temperature, can lead to varying degrees of chemical concentration in the surrounding area of a shale shaker (Esswein et al., 2016).
In recent years, the oil and gas industry has witnessed a surge in artificial intelligence projects and uncrewed technologies focused on the automation of drilling practices and remote control and monitoring. The main driver consists of enhancing efficiency without fundamentally altering workflows and methodologies. This shift is rooted in the need to standardise and automate measurements and processes
Since geological evaluations are largely performed by field operators, such as intermittently monitoring the shaker area and collecting rock samples from shale shakers, numerous studies have focused on automating sample collection and utilising computer vision for data analysis and event interpretation.
Early systems for automated rock cuttings collection rely on conveyor belts or rotors and pneumatic systems to collect and transport samples (Zamfes, 2002). Tonner et al (2022) propose a robotic mud-logger to enhance the consistency and frequency of sample collection, introducing chemical analysis and minimising human intervention and errors associated with labour-intensive manual sample handling. These systems lack continuity. Reproducing what human mudloggers do, they rely on intermittent data collection rather than continuous monitoring, failing to track shale shaker performance or detect early signs of borehole instability.
Computer vision technology has been utilised at shale shakers since the early 2000s. Guilherme et al. (2011) propose the use of optimum-path forest (OPF), support vector machine (SVM) and fitting function to estimate the morphology of particles. Graves and Rowe (2013) describe a system for capturing a live video stream at the shale shaker and utilising a face recognition model to estimate the size and shape of particles. However, the application of computer vision technology is not well-detailed and focuses only on the granulometric information of the drilled cuttings, leaving most conclusions largely theoretical.
Han et al. (2018) suggest a combination of 2D and 3D computer vision techniques to detect and classify cavings falling from the shale shaker using depth profile calculations. However, the study focuses on a single functionality, with human operator monitoring still required to evaluate shaker performance and other signs of borehole instability.
Torrione (2016) proposes a complete system featuring an adjustable shaker table and two cameras in stereovision mode designed to estimate the volume of returned drill cuttings. Parmeshwar et al (2023) introduce a system utilising a single camera to capture consecutive images of cuttings as they fall from the shaker into the holding tank, analysing their size, shape, and distribution. While these studies focus on granulometry and qualitative volume estimation of the cuttings, they overlook foreign object detection and fail to monitor the shale shaker’s performance and integrity, critical aspects that still depend on human observation and inspection.
Recent advancements in machine learning techniques, for example deep learning and Convolutional Neural Networks (CNN), have enabled the development of highly precise models and algorithms for visual data identification and classification.
The study here presented focuses on the automated detection and classification of various foreign objects (such as metal, rubber, and cavings), as well as the qualitative assessment of cuttings and mud beach traveling on the shale shaker.
The goal is to create a comprehensive understanding of the events occurring at the shakers, which are often in hazardous environments, including toxic fumes and high noise levels to minimise unnecessary human exposure by sending alerts to personnel, prompting them to check the shale shakers only when necessary.
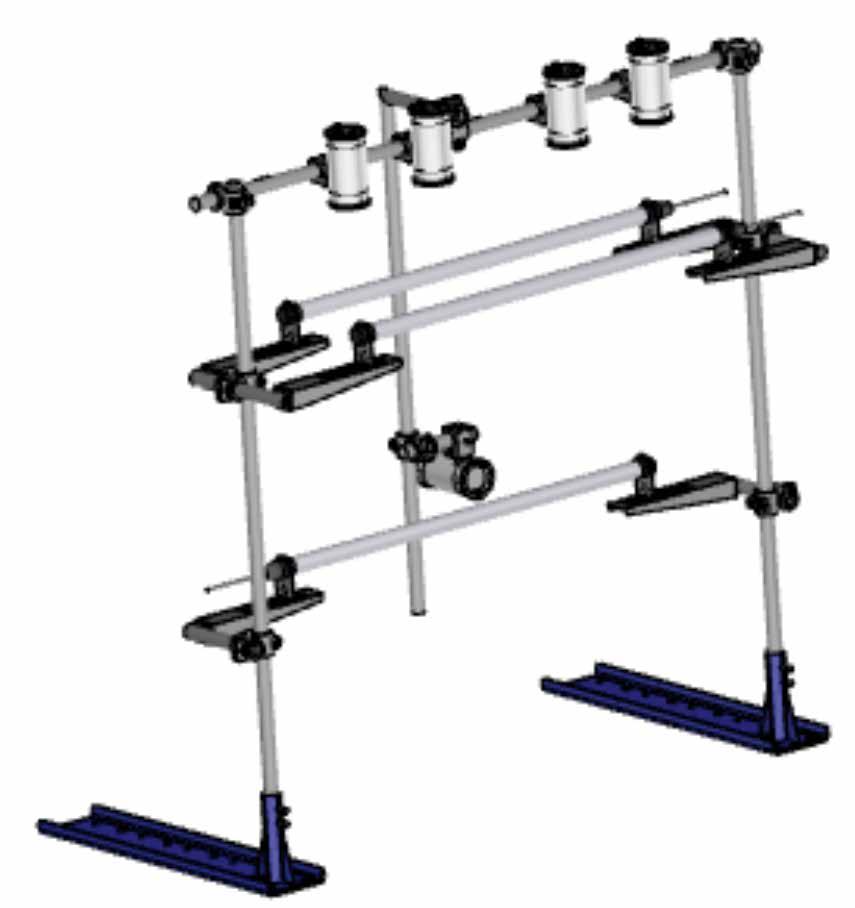
A vision AI extension for shale shakers is proposed. The solution consists of an AtEx certified vision system mounted around a traditional shale shaker, on a modular frame, to accommodate a diverse range of shaker variants and preventing vibration propagation. All sensors, illumination and computing devices are interconnected with each other via network cables that provide both power and high throughput data transfer. The cables are then conveyed into an AtEx connection box and travel through a single fibre optic into a server unit, where data is processed near real-time. The continuous time data output is interpreted to detect 5 different use cases:
• Mud beach level: to monitor and optimise mud circulation practices
• Mud overflow: to prevent costly mud spills associated with economic loss and environmental issues
• Shaker utilisation: to validate borehole cleaning practices and identify early signs of borehole instabilities
• Foreign objects: to promptly detect evidence of drilling equipment and casing damage which could lead to severe issues
• Screen damage: to monitor shale shaker integrity preventing mud contamination and additional residual solids treatment
In the initial experiments several unsupervised machine learning approaches were explored. While these techniques performed well in controlled environments with minimal variation, they were not suitable for the complex and dynamic conditions associated with the field deployment, e.g., varying cutting lithologies, mud types, screen types, and lighting conditions. This limitation was overcome by selecting a supervised learning approach. In this scenario, the models were trained using manually labelled data where the labelling process involved annotating the anomalies of interest for training purposes, resulting in a significant improvement in detection accuracy.
Since the camera setup produces 12MP pictures to allow a detailed analysis of the shale shaker screen, while the classification Convolutional Neural Network (CNN) uses a much smaller resolution (224x224), dividing the image into smaller crops allowed both increased processing speed and mapping of objects position on the screen.
The model generalisation was enhanced by applying basic data augmentation techniques such as flipping, scaling, translations, rotations, and adjustments to contrast and brightness on each image crop as part of the training preparation. As such, the training dataset was drastically enlarged and enriched.
Class balancing was then applied at crop level, to ensure all classes were equally represented in the training dataset and prevent overfitting of model performance on most frequent classes (such as mud and cuttings) at the expenses of sporadically appearing classes (such as foreign objects).
During real-time model evaluation (inference), the system makes prediction on unseen data. Also, during inference the image is cropped, each crop is separately evaluated and post processing is applied to reconstruct full scale image prediction and mapping of objects position.
The full process consists of a continuous flow of vision data from the cameras in AtEx zone, through the network into the computing devices, to a central server where storage and post processing happens. The end user can visualise data trends and organise an alarm system for an automated and unmanned shale shaker performance and borehole instability monitoring.
Results and discussion
Beach level detection
Mud beach level refers to the largest extent that drilling mud travels across the surface of the shale shaker during circulation. A 0% beach level indicates that no mud is reaching the shaker, either due to halted circulation or diversion of mud away from monitored shaker. A 50% level signifies that the mud is being recovered halfway between the possum belly and the edge of the shaker. At 100%,
the mud reaches the edge of the shaker, i.e. overflow condition, and fall into the waste pit, leading to significant economic losses.
From a computer vision perspective, the mud beach level is defined as the furthest horizontal line where mud classification gives positive predictions. This output is determined by combining the predictions from the middle camera, which monitors the rear shaker screens (Figure 2a, 2b 2c) with those from the top cameras, which focus solely on the frontmost screen (Figure 2d). If no mud is detected on the front screen (as per the top cameras), the beach level is determined solely by the middle camera’s outputs. Conversely, if the top cameras detect mud on the front screen, the middle camera must also register positive detections on all preceding screens, indicating that the mud has travelled across the initial three screens before reaching the front screen.
Visual examples are reported below in Figure 2.
Mud Overflow is here defined as the condition where the beach level surpasses a threshold specified by the end user. The detection and monitoring of the beach level allow users to set alerts for potential mud overflow situations based on their desired target levels. The mud overflow feature generates a flag when the beach level exceeds the user-defined threshold, enabling proactive management of drilling fluid circulation.
Shaker utilisation is here defined as the percentage of the shaker screen area covered by cuttings. It provides a qualitative measure of the volume of cuttings being circulated out of the hole.
This metric offers valuable insights into hole-cleaning practices, including the detection of cutting waves travelling across the shale shaker.
Figure 3 provides an example of how an image is processed by the deep learning segmentation model using data from the first filed test well which was drilled with water-based mud (WBM).
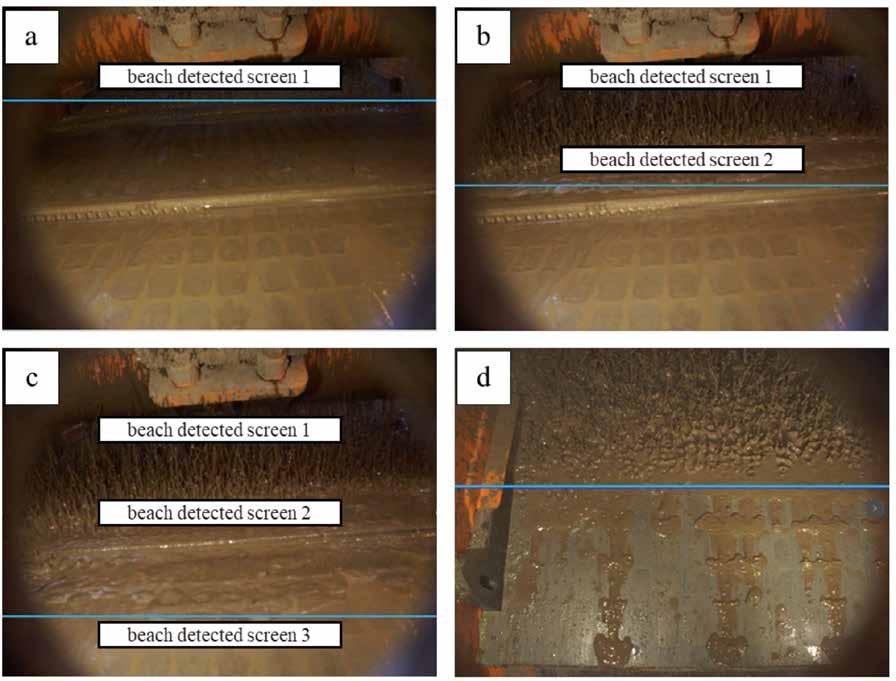
Figure 2 Beach level detection examples. Beach level (light-blue line) detected on the three rear shaker screens by middle camera (a, b, c) and on the front shaker screen by top cameras (d).
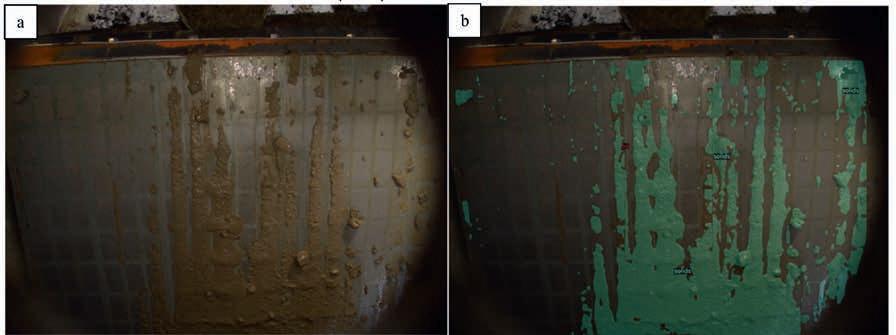
Raw picture (a) vs Shaker Utilisation interpreted by the model in green (b), WBM system. Cuttings are travelling upwards from bottom of the picture (rear) to top (edge of the shale shaker).
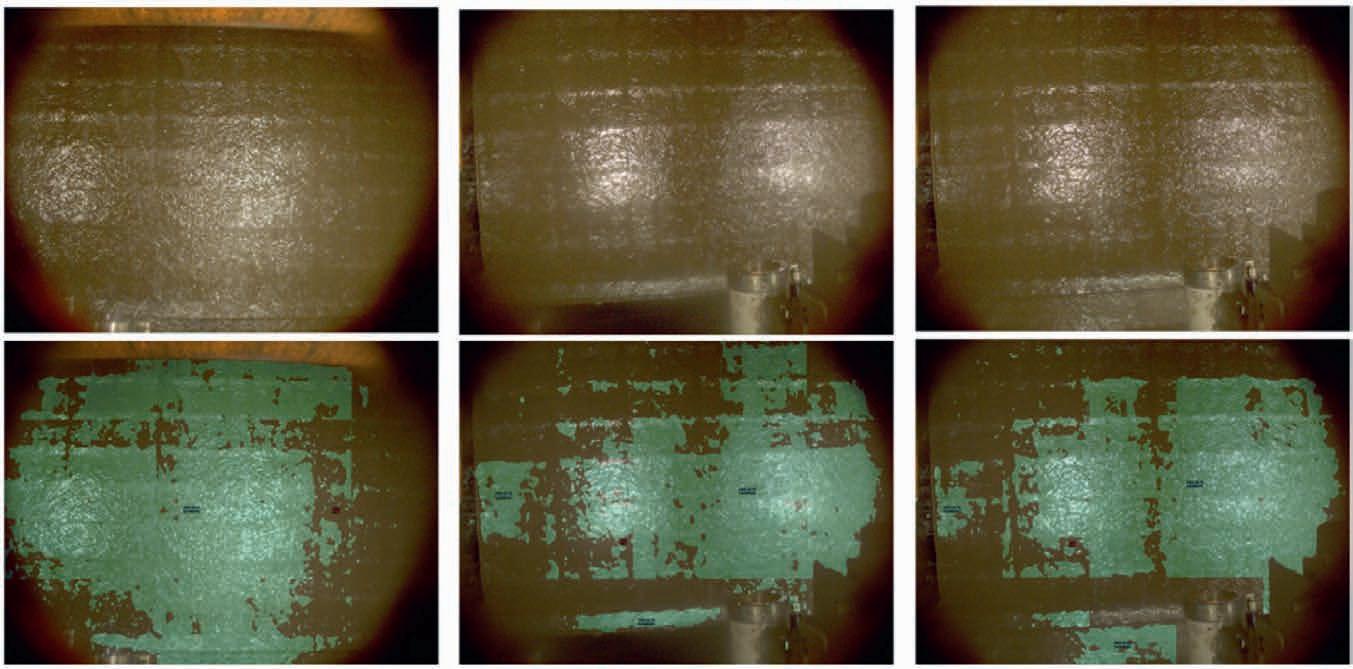
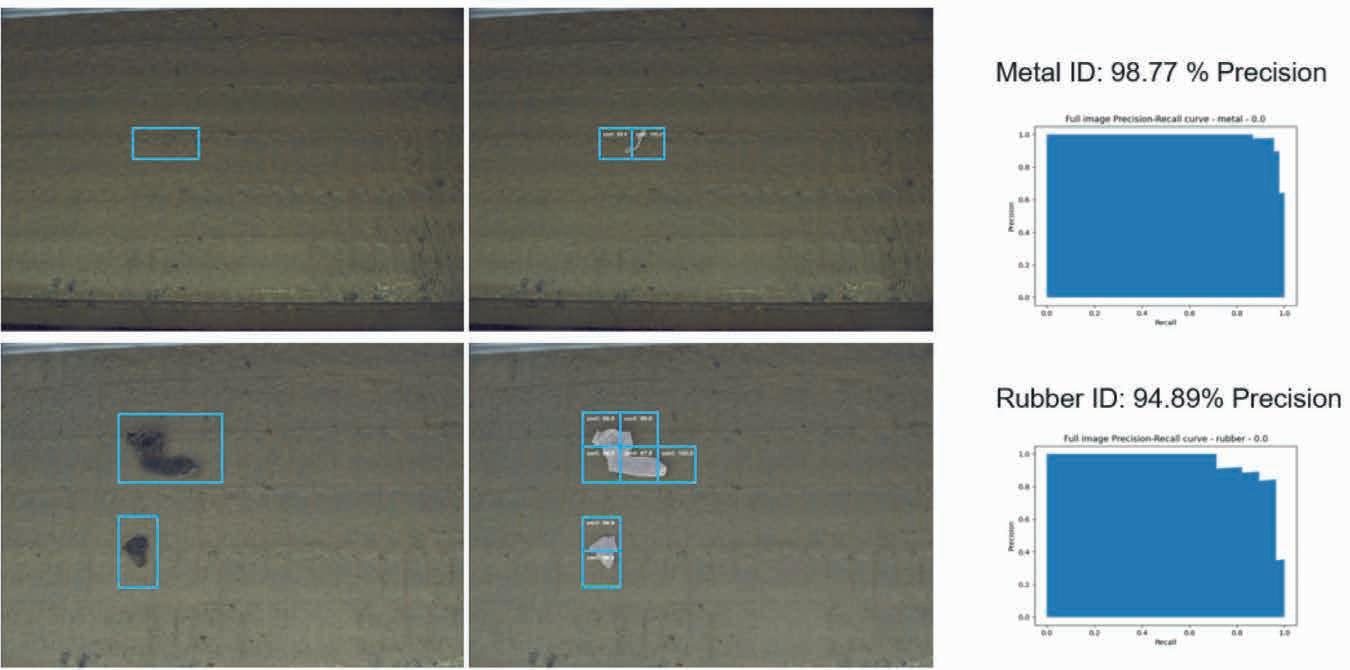
field test, where the picture was acquired while drilling with oilbased mud (OBM).
Foreign objects are here defined as any materials that do not originate from the drilled formation during the drilling activity. For simplicity, this study focuses on two categories of foreign objects: metal and rubber, as depicted in Figure 5. The detection of foreign objects is critical in drilling operations, as they often indicate potential equipment or borehole damage. For instance, the presence of metal fragments could signify casing damage, worn drill pipes, or a damaged drill bit, while rubber debris might suggest wear and tear on the mud motor’s power section.
The methodology outlined in this work employs an approach that is highly adaptable to consider different/additional foreign objects such as casing shoes, float collars, or cement, which can be incorporated into the detection system with relative ease, requiring only the labelling of data for these new categories. This flexibility ensures the system can evolve to meet emerging operational needs.
Drilling operators often struggle with shaker screens management, which frequently require replacement during well drilling. Screen damage negatively impacts the separation of drilling mud from cuttings, leading to substantial economic consequences. A worn screen affects the shaker’s vibration mode and cuttings transport, and it necessitates frequent cleaning. As the damage worsens, more cuttings bypass the screen and enter the active mud pit system, increasing reliance on desanders and centrifuges to maintain mud quality.
Early detection of screen damage, as shown in Figure 6, is therefore critical to preserving drilling mud quality and minimising the need for mud conditioning. Automated screen damage detection offers a benefit in terms of both safety and efficiency as it helps maintain optimal shaker performance and keeps operators away from the hazardous shaker area, where they would otherwise be exposed to toxic fumes and high noise levels while monitoring screens for signs of wear.
The results presented in this study demonstrate that automating most routine monitoring tasks at the shale shakers is achievable, with human intervention only required when responding to a
computer-generated alarm. Advancements in computer vision technology are rapidly evolving, opening up game-changing possibilities that were deemed impossible. The integration of an advanced computer vision system powered by deep learning artificial intelligence models automates the monitoring of both critical and routine events at shale shakers, enabling the measurement of key parameters such as:
• Mud beach level and mud overflow: continuous monitoring of the mud beach level and detection of mud overflow have been successfully implemented. This ensures optimised drilling mud circulation practices, preventing economic losses and mitigating environmental risks associated with mud spills.
• Shaker utilisation: real-time qualitative analysis of drill cuttings on the shale shakers provides valuable insights into borehole cleaning practices. It also helps to identify early signs of borehole instability, enhancing overall drilling efficiency.
• Foreign object detection: reliable identification of foreign objects, such as metal and rubber fragments, enables early warnings of potential issues like equipment damage. This proactive approach contributes to reducing Non-Productive Time (NPT) and improving operational efficiency.
• Shale shaker screen damage: automated detection of shaker screen damage facilitates timely maintenance and replacement. This ensures the effectiveness and safety of the solids-separation process, reducing downtime and preserving mud quality.
The automation of monitoring tasks traditionally carried out by human operators allows for minimising the exposure of personnel to hazardous environments, such as areas with toxic fumes and high noise levels. This not only improves HSE standards but also allows human operators to concentrate on more strategic tasks. Furthermore, this solution enhances borehole stability monitoring by providing real-time, reliable data, enabling immediate action in response to any anomalies detected during drilling. With the reduction of response times to early signs of borehole instability or drilling equipment malfunctions, the system enhances the overall efficiency and safety of drilling operations. It ensures quicker alerts to operators and supervisors regarding critical events, potentially reducing Non-Productive Time (NPT) and Invisible Loss Time (ILT).
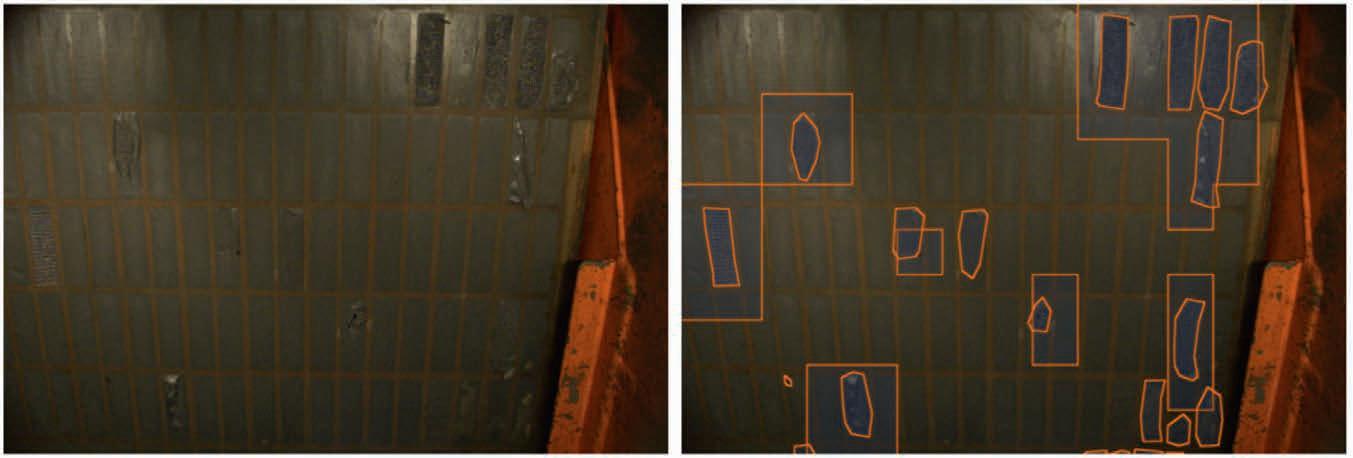
In conclusion, the automated, uncrewed monitoring system proposed in this study marks a significant step forward in drilling operations. The increased reliability, continuous data stream, and improved safety underscore the value of this technology in advancing the modern drilling industry.
References
Esswein, E. J., Retzer, K., King, B. and Cook-Shimanek, M. [2016]:. Occupational Health and Safety Aspects of Oil and Gas Extraction. Environmental and Health Issues in Unconventional Oil and Gas Development.
Graves, W. and Rowe, M. [2013]. Down hole cuttings analysis; patent EP2781086B1.
Guilherme, I., Marana, A., Papa, J., Chiachia, G., Afonso, L., Miura, K., Ferreira, M. and Torres F. [2011]. Petroleum well drilling monitoring through cutting image analysis and artificial intelligence techniques; https://doi.org/10.1016/j.engappai.2010.04.002.
Han, R., Ashok, P., Pryor, M. and Van Oort E. [2018]. Real-Time 3D Computer Vision Shape Analysis of Cuttings and Cavings; SPE Annual Technical Conference and Exhibition, Dallas, Texas, USA. SPE-191634-MS. https://doi.org/10.2118/191634MS.
Kroken, A., Vasshus, J.K., Omland, T. and Aase, B. [2013]. A New Fluid Management System and Methods for Improving Filtration and Reducing Waste Volume, Introducing a Step Change in Health and Safety in the Mud Processing Area (SPE/IADC 163522).
Parmeshwar, V., Orban, J., Arefi, B. [2023]. Shale Shaker Imaging System patent US11651483B2.
Tonner, D., Swanson, A. and Hughes, S. [2022]. Method and apparatus for drill cutting analysis, patent US12012852B1.
Torrione, P. [2016]. System and method for estimating cutting volumes on shale shakers, patent US10954729B2.
Zamfes, K. [2002]. Cuttings sample catcher and method of use, patent US6386026B1.


Altay Sansal1*, Ben Lasscock1 and Alejandro Valenciano1 address the complexities of large-scale training of a seismic foundation model on a global dataset of 63 seismic volumes and leverage a cloud-native, digitalised seismic data infrastructure to address the data engineering challenges, avoiding duplication.
Abstract
Traditional workflows using machine learning interpretation of seismic data rely on iterative training and inference on single datasets, producing models that fail to generalise beyond their training domain. Self-supervised training and scaling of 3D vision transformer (ViT) architectures enables seismic interpretation with improved generalisation across diverse datasets. We address the complexities of large-scale training on a global dataset of 63 seismic volumes using the masked autoencoder (MAE) architecture with the ViT-H model consisting of 660 million parameters. We leverage a cloud-native, digitalised seismic data infrastructure to address the data engineering challenges, avoiding duplication. For a downstream task, a salt segmentation model trained using interpretation labels from the Gulf of Mexico and Brazil demonstrated zero-shot generalisation on a West African survey. These findings underscore the potential of pre-trained foundation models to overcome the limitations of iterative approaches and extend seismic interpretation across diverse basins, marking a significant advancement in scalable machine learning for subsurface challenges.
Introduction
The pre-trained ViT-MAE model is an emerging technology in seismic processing and interpretation [Lasscock 2024, Sheng 2023]. Much like how large language models have been a step change in natural language processing, there is potential for this new way of approaching AI to disrupt geophysical applications. Until now, these studies have been applied to small, open-source datasets with synthetic data and older seismic imaging and processing techniques. [Ordonez 2024] reported an expansive study that high-graded a subset of 60,000 2D crops for pretraining from a larger 20 survey dataset. In each case, these studies have demonstrated the efficacy of pre-training a seismic foundation model (SFM) and then using or fine-tuning it on various downstream tasks, including seismic salt and facies classification. The highly scalable characteristics of the ViT-MAE technology, mainly when applied in 3D [Lasscock 2024], have yet to be explored in geophysical literature. In computer vision, it has been established [Zhai 2022] that larger models pre-trained on large datasets (ImageNet-21k and JFT-300M) achieve better performance in image classification tasks. This study aims to tackle the
1 TGS
* Corresponding author, E-mail: altay.sansal@tgs.com
DOI: 10.3997/1365-2397.fb2025016
problem of scaling ViT-MAE models trained on seismic data to a global corpus of 63 seismic surveys. And evaluate if a subsequent downstream task can be efficiently fine-tuned from these large pre-trained models to outperform existing AI methods regarding their generalisation capacity.
As we train large models, data management becomes a crucial enabling technology, both in need of exploring and curating such a large corpus of data and efficiently saturating large clusters of GPU computing required to train them in a timely manner. Tracking this problem on seismic data presents unique challenges. We will explain how cloud object storage and the MDIO seismic data format [Sansal 2023] are used efficiently in pretraining a 660M parameter 3D seismic ViT-H model. We will address the model’s usefulness by fine-tuning it for salt interpretation. The salt interpretation model builds on our SaltNet dataset, consisting of interpretation from 23 seismic volumes, and we will compare model IoU scores with existing state-of-the-art 2D and 3D U-Net models [Warren 2023, Roberts 2024].
Model Architecture
The model architecture shown schematically in Figure 1 is based on a Masked Autoencoder (MAE) with a Vision Transformer (ViT) backbone, as described by He et al. [2021], modified to process 3D seismic volumes. Input seismic data is divided into overlapping mini-cubes, which undergo augmentations such as inline/crossline flips. The model adapts the ViT-MAE design initially created for 2D images to 3D, projecting 163 patches (visual tokens) to a collection of 1280-length vector embeddings. At each training step, a batch of mini-cubes is selected from the global dataset, 90% of the patches are masked, and the remaining 10% is used to reconstruct the original mini-cube. The learning objective is the pixel space reconstruction accuracy of the masked patches using the mean-squared error (MSE) metric.
One advantage of this self-supervised training is that it is memory-efficient since all the data is used only in the small decoder of the model loss. The large encoder only has to propagate 10% of the patches. This approach is highly scalable to large model sizes without complex distributed training techniques. An advantage of working in the 3D domain of the data over 2D is that a more significant percentage of the data, 90% in this case
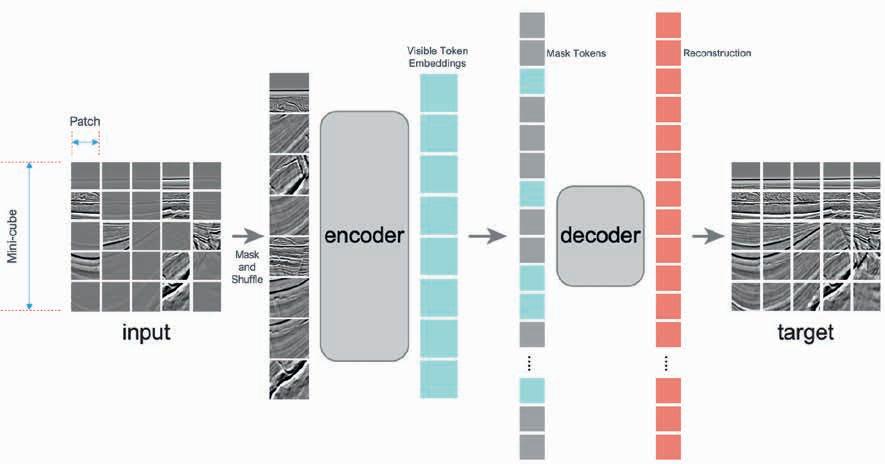
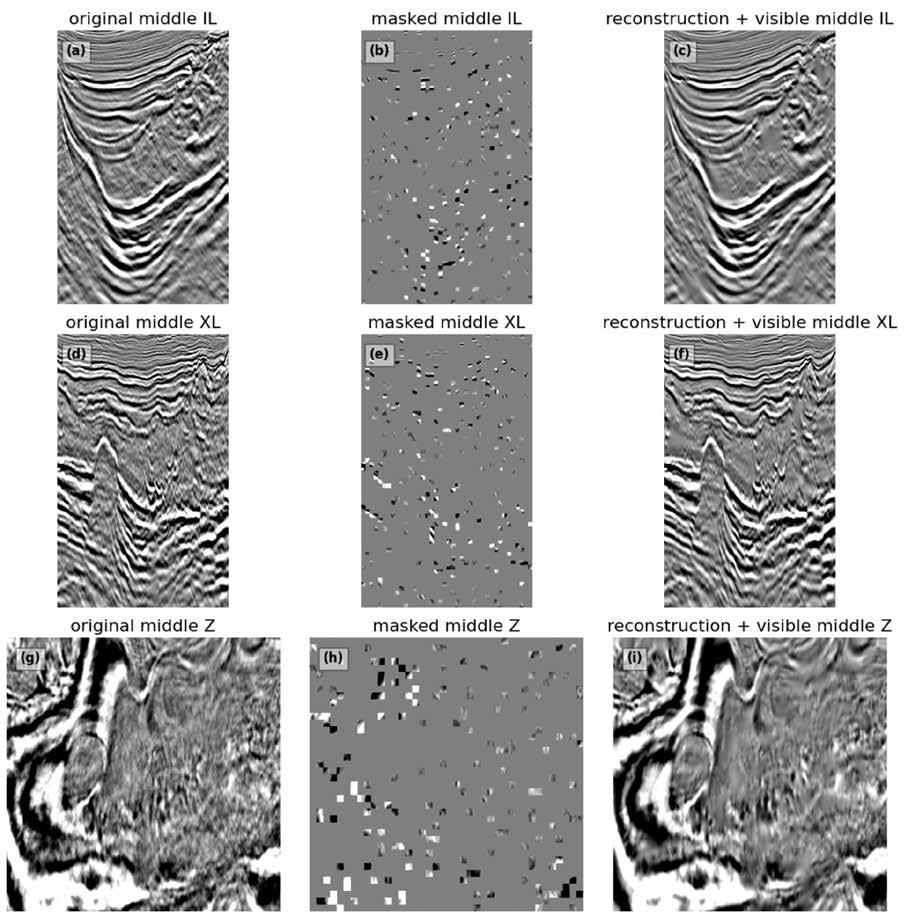
[Feitchtenhofer 2022], can be masked during training. Masking 90% of the data reduces the memory overhead of training and thereby makes the model more scalable. An example of the pre-training is shown in Figure 2; the left column shows a set of inline, crossline, and depth sections from an input mini-cube. The middle column shows a random collection of 163 patches input to the model, and the right column shows the reconstruction. We see qualitatively that the model can reconstruct fine details, including faults and truncations, even from a minimal subset of the input data.
The encoder trained in this study is a generic transformer architecture with a depth of 32 layers, 16 attention heads, an embedding vector size of 1280, and a feedforward dimension of 5120, equivalent to ViT-H model in the literature. This model
Figure 1 A modified schematic view that explains the ViT-MAE pre-training concept [He 2021] is shown in the picture. Large 3D data patches are loaded in batches, 90% of the data is discarded, and the remaining 10% is used to reconstruct the original data from the mask tokens.
Figure 2 A specific example of a sampled 640x640x1024 mini-cube and its reconstruction. (a-c) A mid-point inline slice through the 3D patch showing the original data, the data used in reconstruction, and the reconstructed 3D patch. (d-f) and (g-i) show the equivalent crossline and depth slices, respectively.
has a total of 660M trainable parameters. On the other hand, the decoder is a smaller transformer with eight layers, 16 attention heads, and a feedforward network size of 2048.
The context size of the model is the number of 163 patches (visual tokens) the model can attend to in a mini-cube. The larger the context size, the greater the geological context the model can see, which is important for local and global features. Once pre-training is complete, we fine-tune the model’s context size to accommodate larger seismic mini-cubes. Pre-training is done with 5123 mini-cubes, equivalent to a context size of 32,768. Once pre-training is complete, we fine-tune the model using 640x640x1024 seismic mini-cubes to achieve a context size of 102,400. This means that, based on the bin spacing of the seismic data, the model sees approximately 8-16 km in the lateral direc-
tion and 5-10 km in the depth direction. The context fine-tuning has been done on the same hardware.
This study aims to scale the ViT-MAE concept to a global geological context. For this reason, we assembled a corpus of 63 seismic surveys, sampled from around the world, to use in pretraining. The spatial region, expanding the surveys in the pretraining dataset, is shown in Figure 3. Table 1 summarises the size and contribution to the training data from each region. We train on depth-migrated final stacks, which have been imaged with either reverse time migration (RTM) or Kirchoff depth migration (KPSDM). This dataset has 1.8 billion 163 patches (visual tokens) without overlap. For comparison, our dataset contains an equivalent of 293 million 224x224 2D inline and crossline subset images without augmentation and decimation. We also overlap
mini-cube sampling by 50% to achieve 12 billion visual tokens that augment positional information.
Although the scaling laws of ViT models are not explored in seismic data, studies into vision transformers on natural images suggest that larger models achieve higher accuracy when fine-tuned on image classification tasks and that larger datasets are beneficial when training large models. However, even with limited data, the large models, although requiring more compute resources, perform better than smaller models [Zhai 2022]. For reference, as of the time of writing, the largest published ViT model is ViT-22B, a 22 billion parameter ViT model [Dehghani 2023], which was trained on a proprietary dataset of approximately 4 billion images with 256 visual tokens per image.
The computational cost of pre-training the 3D ViT-MAE model with our configuration is approximately 976 A100 core days, which is significant. For large context fine-tuning, 244 more
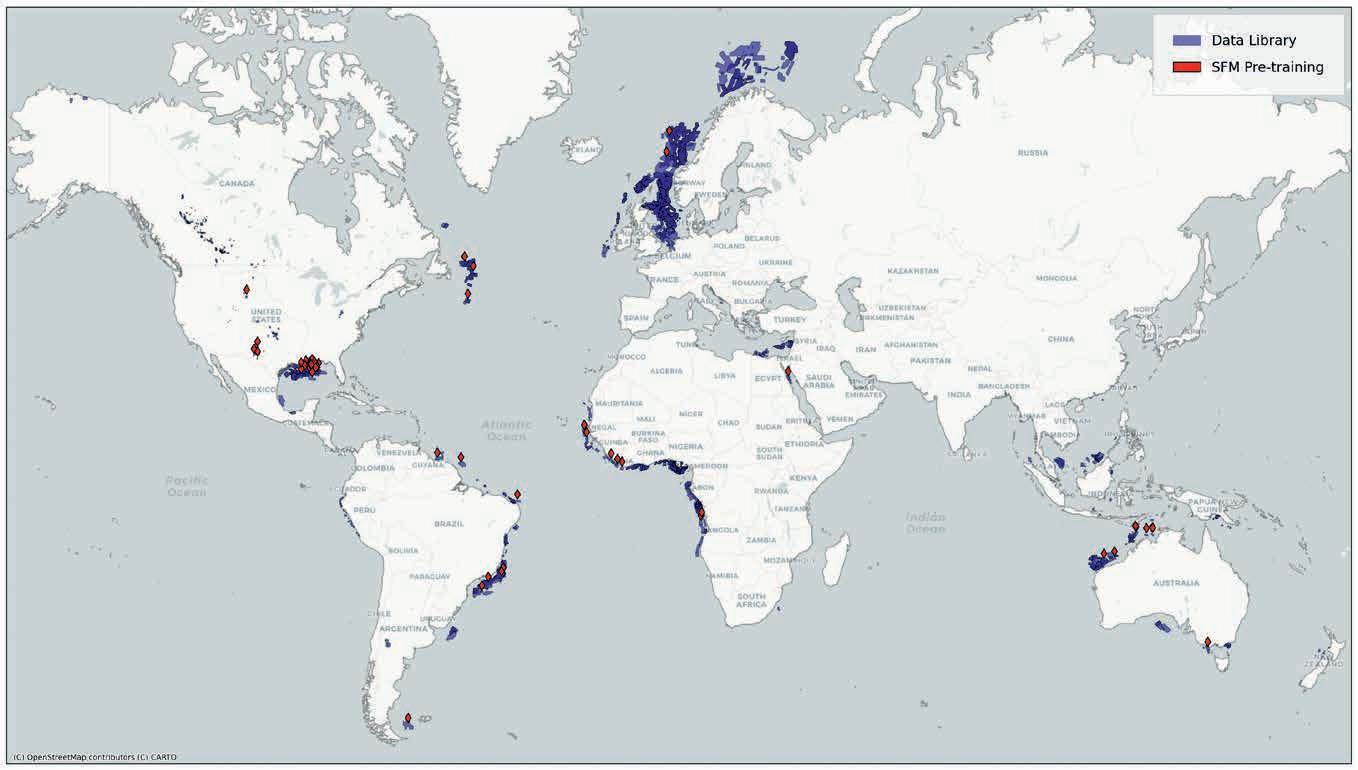
A100 core days are added, totaling 1220 A100 core days. We pre-trained the model using a cluster of A100 GPUs for this study. Keeping the GPUs sufficiently utilised is a critical requirement that makes training a large seismic foundation model on a global scale feasible. Another crucial requirement is that we can co-locate the data with the computer. Otherwise, repeated sampling of this data throughout training would also be inefficient.
This study was made possible by accessing an extensive library of multi-client seismic data hosted on the cloud. A key feature of the data library is that all data is accessible in place, which means that any data in the library can be utilised in training without duplication or any additional overhead of discovery or preprocessing. A key enabling technology is the MDIO open-source format for seismic data [Sansal 2023]. MDIO has the advantage of providing lossless data compression, which minimises network traffic, and more importantly, it is a chunked data format compatible with native cloud storage. Each stack is arranged as a collection of 1283 chunks on a cloud bucket.
The network architecture of the model was chosen to align with the 3D domain of the post-stack data, removing the need to sample data in 3D and then make an arbitrary 2D slice, consequently reducing the I/O overhead. When the model training steps iterate, it samples batches of large amounts of data in desired chunks from surveys across the globe. For example, to fit three 5123 mini-cubes on an 8 GPU node (24 total batch size per node), we are fetching 12GB of seismic data samples at each iteration. Since we are working with 3D data, chunked data formats like MDIO are significantly more capable than sequential formats like SEG-Y, which require indexing and orders of magnitude more requests to read a mini-cube.
We use Dask [Dask Development Team 2016] for multi-process read operations, MDIO as a file format, and the MDIO library to access the data with relevant metadata. This is integrated with PyTorch [Paszke 2019] datasets to provide high-performance I/O, which allows us to keep the GPU cluster fully utilised during training.
In summary, combining these technologies means that all the independent mini-cubes in our data corpus can be randomly sampled into batches and used in training without creating an I/O bottleneck.
To demonstrate the usefulness of the pre-trained model, we train a new decoder for the pre-trained foundation model for salt segmentation. Examples of downstream tasks relevant to geophysics are summarised by [Sheng 2023]. In this study, we fine-tune using an expanded version of the salt interpretation dataset previously used for training salt segmentation U-Net models in 2D and 3D in Roberts [2024] and Warren [2023]. This dataset consists of salt annotations from 20 reverse time-migrated depth stacks from the Gulf of Mexico. For this study, we have added four new interpreted RTM stacks from South America for training and another interpreted RTM stack from Africa for testing (out-of-domain). A ground truth salt label is a binary mask derived from interpretations carried out by expert geophysicists.
As in pretraining, the salt labels are stored in MDIO format. The survey geometry and other metadata are consistent between the seismic labels and underlying seismic data, which is essential for correct training. Both labels and data are accessible in place, removing the need for data duplication.
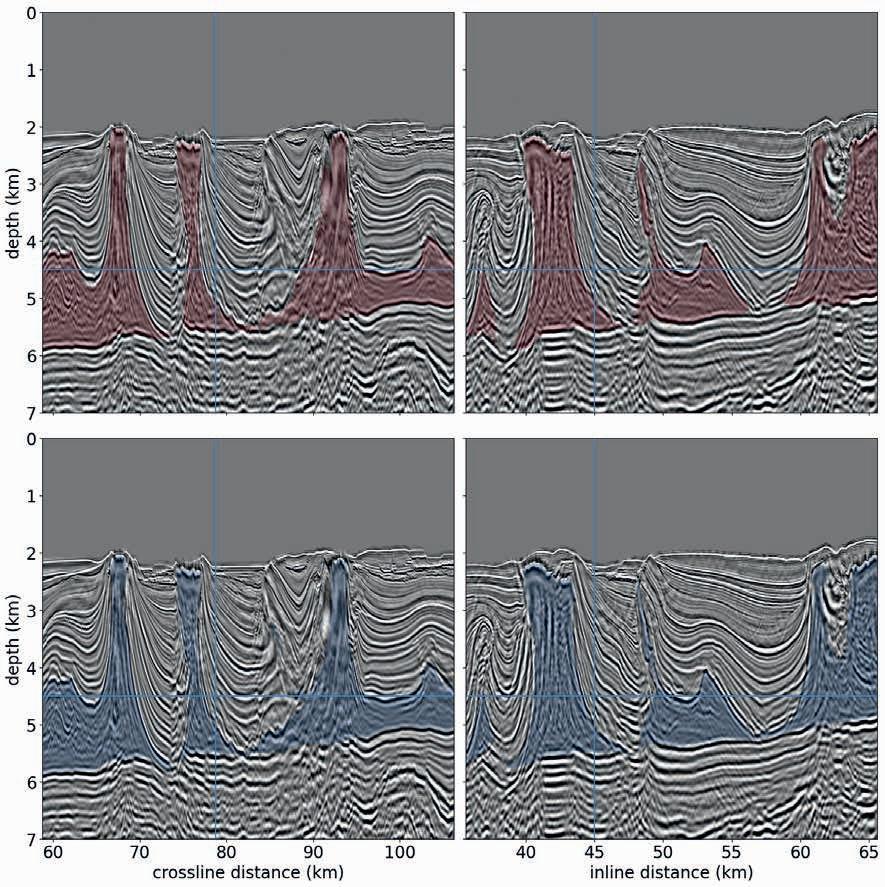
Figure 4 Offshore Africa: (top red) the raw and unprocessed salt label prediction masks for an inline and crossline section, respectively. (bottom blue) The ground truth labels. Guidelines indicate the location of the other orthogonal slices shown for this volume.
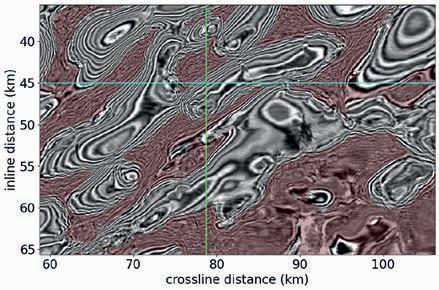
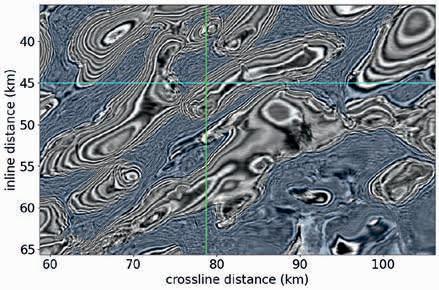
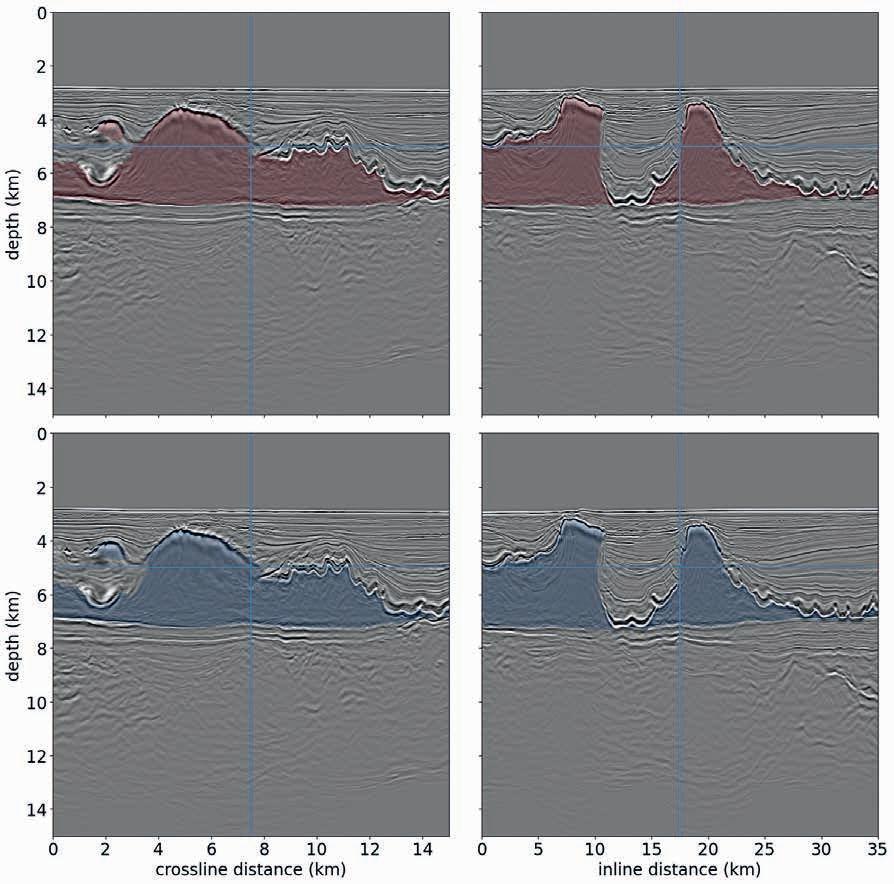
The salt classification network architecture consists of a frozen pre-trained encoder (weights do not need to be updated) with a transformer decoder and a single layer as a classification head. The model’s performance is evaluated in terms of intersection over union (IoU); this gives an immediate comparison with metrics used in previous studies [Roberts, 2024; Warren, 2023; Sheng, 2023].
To evaluate the performance of the fine-tuned model on salt interpretation, an RTM stack offshore South America is held out in both pre-training and for salt classification. This provides a performance comparison analogous to [Roberts 2024 and Warren 2023], where data is held out in the region where the model is trained. To evaluate the potential for the SFM to aid the geologic region generalisation of the salt model, an interpreted stack offshore Africa is used in pre-training but held out in creating the salt model. Table 2 shows the intersection over union (IoU) metrics used to score the model’s performance. With the held-out African dataset, we can test the efficacy of applying the model outside the basin in which it was trained. In
both previous ML salt interpretation studies [Roberts 2024 and Warren 2023], the prediction is evaluated on held-out volumes but within the area where the model is trained. Figures 4 and 5 show example prediction versus ground truth salt masks for the African dataset. The IoU score of 0.83 is consistent with the state-of-the-art results of (0.84, 0.96) for the two GoM datasets evaluated by [Roberts 2024] using 3D U-Nets. The result indicates that we can realise excellent generalisation of the salt model outside of the basins where it has been trained in the case where the underlying dataset was included in pretraining. We also expect strong few-shot generalisation
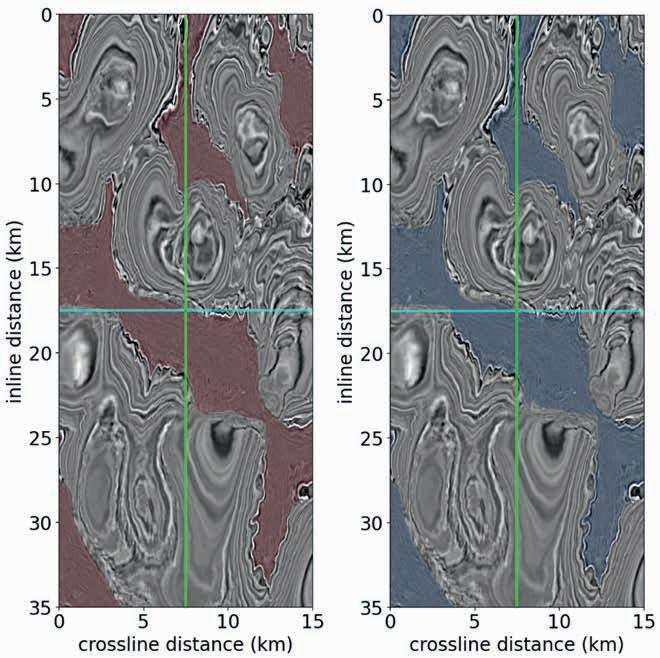
across new areas, achievable with minimal labels and finetuning.
Figures 6 and 7 show analogous examples of salt classification in South American data. This survey was not included in the pre-training or the salt model training. The IoU of 0.93 is at the high end of the range obtained by [Roberts 2024]. This indicates that the ViT-based self-supervised model achieves state-of-the-art performance as seen in the GoM-only U-Net models but is trained across two basins, the GoM, and South America.
This study demonstrates the transformative potential of scaling the Vision Transformer architecture with the Masked Autoencoder training technique (ViT-MAE) to seismic data, achieving state-of-the-art performance in salt segmentation tasks. We highlight the advancements made possible by pretraining a 660-million-parameter model on a global dataset of 63 seismic surveys through efficient data handling and model scalability. The MDIO format enabled high-throughput access to large seismic datasets stored on the cloud, ensuring efficient large-scale data delivery to utilise the power of A100 GPUs during pretraining. This infrastructure is a key enabler of scaling, allowing efficient data management for training large-scale models.
Working in 3D allowed us to use a 90% masking ratio, further enhancing scalability by reducing memory overhead in pre-training and enabling the larger models for a given GPU footprint. This approach effectively reconstructs fine geological details from sparse inputs, showcasing its power in handling 3D seismic data.
Achieving an IoU of 0.83 on a held-out African data and 0.93 on the held-out South American data, the salt segmentation task model demonstrates exceptional generalisation beyond the basins
where it was trained. This aligns with state-of-the-art CNN-based approaches when the ML models are trained and applied to the same basin.
We have demonstrated a highly scalable method of training a seismic foundation model. This work establishes a framework for leveraging large-scale data and cutting-edge architectures for training seismic foundation models, which is scalable beyond a 1-billion parameter model.
References
He, K., Chen, X., Xie, S., Li, Y., Dollár, P. and Girshick, R. [2021]. Masked Autoencoders Are Scalable Vision Learners. ArXiv. https:// arxiv.org/abs/2111.06377.
He, K., Chen, X., Xie, S., Li, Y., Dollár, P., and Girshick, R. [2021]. Masked Autoencoders Are Scalable Vision Learners. ArXiv. https:// arxiv.org/abs/2111.06377.
Zhai, X., Kolesnikov, A., Houlsby, N. and Beyer, L. [2021]. Scaling Vision Transformers. ArXiv. https://arxiv.org/abs/2106.04560.
Dehghani, M., Djolonga, J., Mustafa, B., Padlewski, P., Heek, J., Gilmer, J., Steiner, A., Caron, M., Geirhos, R., Alabdulmohsin, I., Jenatton, R., Beyer, L., Tschannen, M., Arnab, A., Wang, X., Riquelme, C., Minderer, M., Puigcerver, J., Evci, U. and Houlsby, N. [2023]. Scaling Vision Transformers to 22 Billion Parameters. ArXiv. https:// arxiv.org/abs/2302.05442.
Sheng, H., Wu, X., Si, X., Li, J., Zhang, S. and Duan, X. [2023]. Seismic Foundation Model (SFM): A new generation deep learning model in geophysics. ArXiv. https://arxiv.org/abs/2309.02791.
Ordonez, A., Wade, D., Ravaut, C. and Waldeland, A.U. [2024]. Towards a Foundation Model for Seismic Interpretation. 85th EAGE Annual Conference & Exhibition, 2024, 1-5. DOI: https://doi. org/10.3997/2214-4609.2024101119.
Roberts, M., Warren, C., Lasscock, B. and Valenciano, A. [2024]. A Comparative Study of the Application of 2D and 3D CNNs for Salt Segmentation. 85th EAGE Annual Conference & Exhibition, 1-5.
Warren, C., Kainkaryam, S., Lasscock, B., Sansal, A., Govindarajan, S. and Valenciano, A. [2023]. Toward generalized models for machine-learning-assisted salt interpretation in the Gulf of Mexico. The Leading Edge, 42(6), 390-398.
Lasscock, B.G., Sansal, A. and Valenciano, A. [2024, September 17-20].
Encoding the Subsurface in 3D with Seismic [Paper presentation]. IMAGE 2024, Houston, TX, United States.
Sansal, A., Kainkaryam, S., Lasscock, B. and Valenciano, A. 2023. MDIO: Open-source format for multidimensional energy data. The Leading Edge, 42(7), 465-470. https://doi.org/10.1190/tle42070465.1.
Dask Development Team [2016]. Dask: Library for Dynamic Task Scheduling. Available at: http://dask.pydata.org [Accessed: 9 December 2024].
Paszke, A., Gross, S., Massa, F., Lerer, A., Bradbury, J., Chanan, G., Killeen, T., Lin, Z., Gimelshein, N., Antiga, L., Desmaison, A., Kopf, A., Yang, E., DeVito, Z., Raison, M., Tejani, A., Chilamkurthy, S., Steiner, B., Fang, L., Bai, J. and Chintala, S. [2019]. PyTorch: An Imperative Style, High-Performance Deep Learning Library. Advances in Neural Information Processing Systems, 32, 80248035.
Julie Vonnet1*, Vlad Rotar1 and James Goldwater1 explore how Python APIs facilitate the connection to external data sources, deploying ML models and customised solutions with minimal programming expertise.
Abstract
Energy companies are increasingly reliant on their ability to integrate diverse datasets, apply advanced technologies, and incorporate new research findings into their subsurface workflows to maintain a competitive edge. However, integrating machine learning (ML) models, new research, and external data into widely used platforms like Petrel* presents significant challenges for geoscientists, particularly due to the technical complexity and coding expertise required. This complexity slows the adoption of innovative tools and workflows and can quickly become a barrier to optimisation.
A key hurdle lies in enabling geoscientists to leverage ML models and integrate new research directly within Petrel without needing Python coding skills. Many workflows are hindered by the technical expertise needed to develop custom solutions, which can impede the full adoption of advanced workflows or Pythonbased solutions for automation.
This article explores how Python APIs facilitate the connection to external data sources, deploying ML models and customised solutions with minimal programming expertise. Additionally, we examine how the gap between data scientists and geoscientists can be bridged, enabling geoscientists to leverage these customised solutions without any programming expertise. Through practical examples, we demonstrate how these tools can optimise daily operations, automate processes, and allow for better decision-making in subsurface projects. This approach ensures that geoscientists can focus on the data, not the technical complexities, driving innovation and efficiency.
Tackling integration challenges in subsurface workflows
The oil and gas industry, particularly the exploration and production segment, operates within a highly technical and diverse landscape, dealing with data that vary greatly in nature, format, size, and location. Subsurface experts such as geophysicists, geoscientists, and reservoir engineers, rely on a myriad of specialised applications to manipulate, interpret, and analyse this data. These tools often need to be integrated or made to function together to address technical gaps, optimise workflows, and
1 Cegal
* Corresponding author, E-mail: Julie.Vonnet@Cegal.com DOI: 10.3997/1365-2397.fb2025017
enhance efficiency. Applications are not always natively interoperable, and data does not always come in the right format.
To maintain their competitive edge, energy companies increasingly depend on seamlessly integrating these diverse datasets, adopting advanced technologies, and embedding new research into their existing workflows. Yet, geoscientists often encounter significant hurdles when trying to bridge the gap between innovation and daily operations. The integration of machine learning models, new research findings, or external data sources into established platforms like Petrel remains a complex and time-consuming task which limits opportunities for optimisation and innovation.
A major challenge lies in enabling geoscientists to access and deploy ML models directly within Petrel without requiring proficiency in Python coding. As outlined by Rashka et al. (2020), ‘Python continues to be the most preferred language for scientific computing, data science, and machine learning’.
Many workflows are bottlenecked by the technical expertise needed to create and integrate custom solutions. This reliance on specialised skills not only slows down the adoption of advanced tools but also hinders the ability to extend Petrel’s functionality with tailored Python-based plugins for automation or novel workflows.
In addition, geoscientists often face difficulties in connecting Petrel to external data sources, which restricts their ability to fully contextualise interpretations or enhance their models with additional datasets. These barriers collectively stifle the efficiency and innovation potential of subsurface workflows.
This article explores how tools and techniques specifically designed to simplify the integration of ML, recent research results and diverse data types into Petrel, will enable geoscientists to extend functionality, connect to external data sources, and automate workflows — all without requiring programming expertise.
Through practical examples, we will demonstrate how this can be applied to tackle common hurdles, offering actionable insights to help teams improve efficiency and collaboration, drive innovation, and optimise their subsurface projects.
Despite the wealth of new research being published on ML within the subsurface community, there are significant challenges in adopting this research quickly. One key issue is the gap between theoretical models and practical application within existing platforms. New algorithms, research findings, and models often require significant adaptation before they can be effectively deployed in operational workflows. This not only slows down the integration process but also often requires geoscientists to possess advanced programming skills to customise and apply these models.
One way to address these challenges is to use a streamlined interface allowing geoscientists to integrate ML models into Petrel workflows with minimal Python expertise.
Through a Python API, Cegal Prizm enables seamless communication between machine learning models and the Petrel environment, allowing for the direct application of research findings in subsurface interpretation, as shown in the following example.
Example: integrating recent advancements in fault detection from 3D seismic images into Petrel
The recent work done by Wu (2019) about fault detection is an ideal illustration of how research results can be seamlessly incorporated into standard tools. With this method, a model, trained on 200 synthetic 3D seismic images, is capable of accurately predicting faults much faster than conventional methods.
Data scientists now have the possibility to deploy the fault segmentation model directly within Petrel by using Cegal Prizm’s Python API, allowing for faster seismic structural interpretation (Figure 1).
This integration not only accelerates the adoption of new research but also empowers geoscientists to implement advanced methodologies in their workflows, fostering more agile approaches.
Moving forward, another crucial aspect of enhancing subsurface workflows is the effective management and integration of diverse data sets. In geoscience, especially when working with applications such as Petrel, the process of exporting data to Python and then reimporting results back into Petrel presents a series of complex challeng-
es. The intricacies arise from the varied formats and structures of data, necessitating careful conversion to ensure compatibility.
The following section will demonstrate how a Python API such as offered by Cegal Prizm mitigates these challenges by simplifying the retrieval of data from Petrel, converting it into Python-compatible formats, and allowing for seamless reintegration back into Petrel systems.
The 2021 Anaconda State of Data Science survey revealed that data scientists spend nearly half their time (45%) on tasks such as preparing, cleaning, and managing data before they can perform analyses or develop models. Although this analysis was not specific to geoscience or subsurface workflows, the time spent on data import, export, and preparation can be substantial, even for geoscientists.
Managing data import and export between Petrel and Pythonbased environments introduces a range of technical challenges that can hinder geoscientists’ ability to efficiently utilise advanced data science workflows. The first one is the setup of Python environments. Each project may demand specific versions of Python and its libraries and setting this up can be time-consuming and complex, requiring meticulous configuration to avoid conflicts. This particular challenge will be addressed in the next section of this article, as there are easy ways to overcome this hurdle without wasting time.
Once the Python environment is set up, the challenge shifts to exporting data from Petrel. Critical datasets such as seismic volumes, well logs, tops, surfaces, and faults must first be exported. If the Python environment resides in a separate location or platform, this step often necessitates additional data transfer, which is prone to error in addition to being inefficient.
After this export is completed, the data will again need to be reformatted into structures that are compatible with Python, such as NumPy arrays, or Pandas DataFrames, to become consumable by Python routines.
And yet again, after performing any data transformation or analysis in Python, the workflow reverses. Results must be reformatted into a Petrel-compatible structure, saved and manually imported
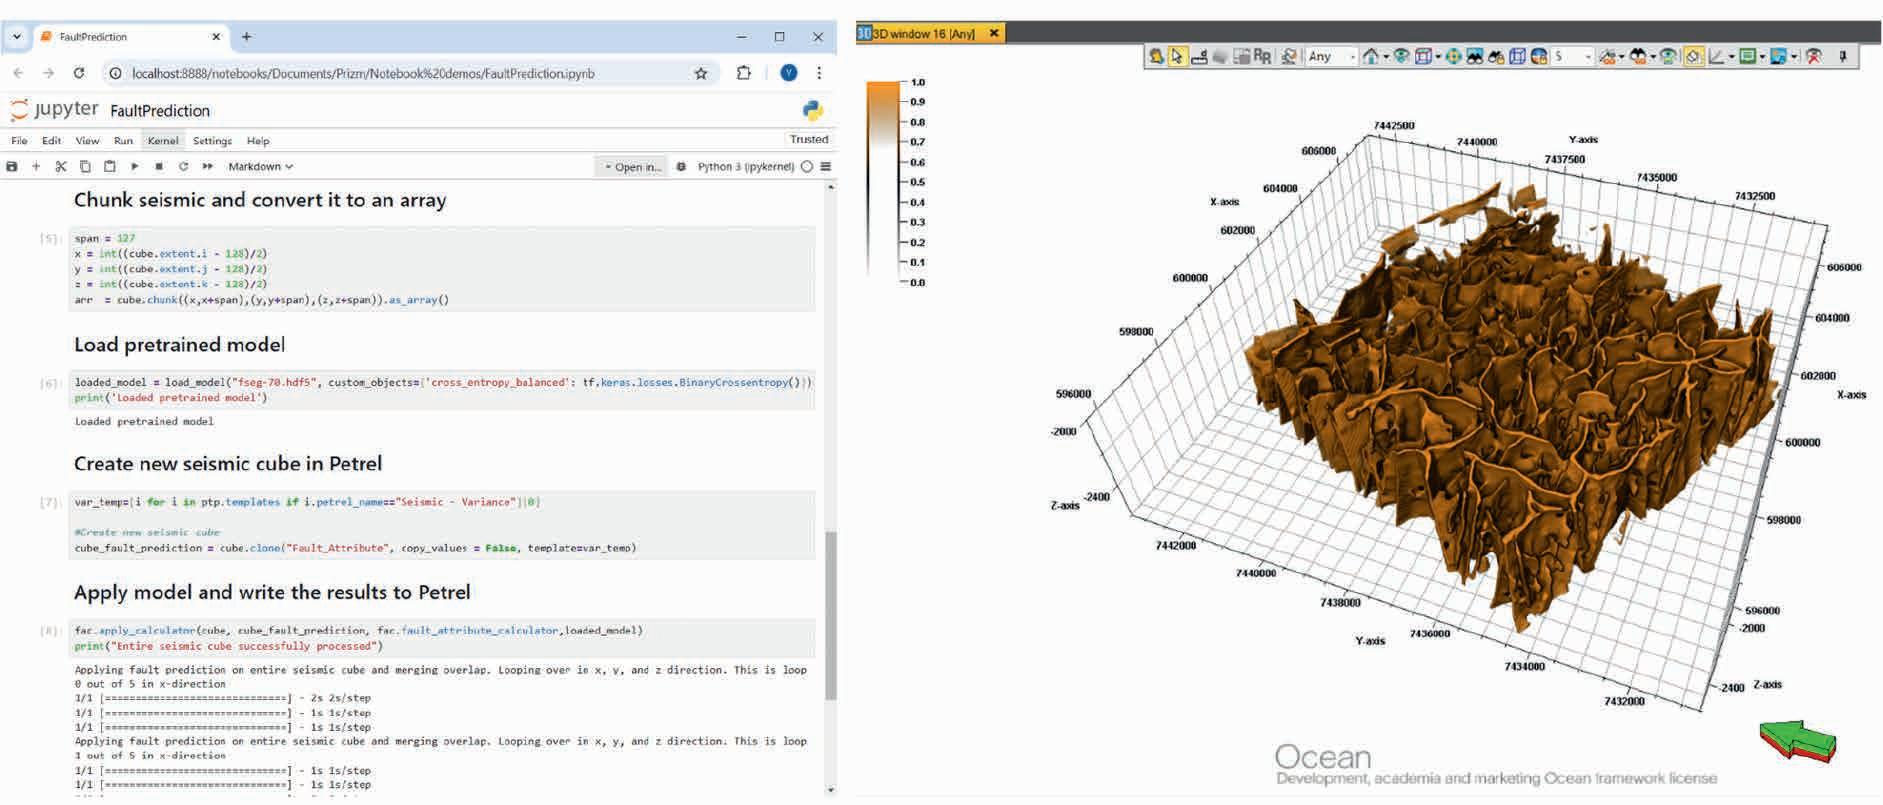
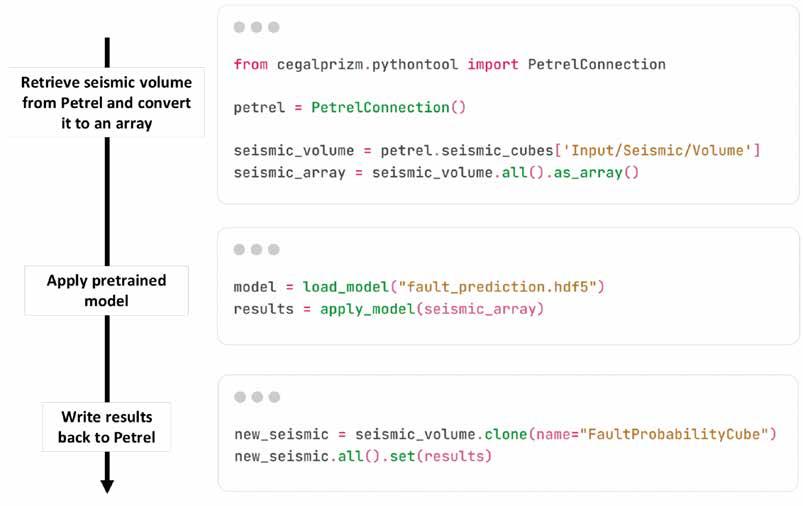
back into Petrel. This back-and-forth adds another layer of complexity, making the entire process time-intensive and error-prone.
Example: retrieving seismic volumes from Petrel, applying a pretrained model in Python, and reintegrating the results back into Petrel
To demonstrate how Cegal Prizm addresses these challenges, let’s revisit the previously shown example where we utilised a pretrained model to predict faults within our seismic cube. Figure 2 illustrates the workflow and showcases the code involved. In the top section, we start by connecting to the Petrel project and using the Cegal Prizm Python API, we retrieve a seismic cube named ‘Volume’ and convert it into a NumPy array. The middle part simplifies the application of a machine learning pretrained model, boiling it down to just two lines of code: one for loading the model and the other for applying it to the seismic data array to generate results. The bottom section outlines the process for reintegrating the results back into Petrel, which involves first creating an empty cube named ‘FaultProbabilityCube’ and then writing the predicted results to this cube.
In conclusion, Cegal Prizm effectively addresses the challenges of integrating ML models into geoscience workflows by streamlining complex processes into simple, user-friendly steps. This approach not only reduces technical barriers but also accelerates the adoption of new tools, enabling geoscientists to focus on generating more valuable insights.
Moving data between Petrel and Python is not the only challenge when working with diverse datasets or integrating non-native tools. Even after successfully deploying new research elements or proprietary workflows, sharing these advancements across a team of geoscientists presents its own difficulties. Ensuring that these innovations are accessible and usable by others is essential to maximise their potential, but this step often introduces new inefficiencies and technical barriers that will now be described further in detail.
As mentioned previously, one significant issue comes from the complexities of Python environments. Data scientists frequently work with distinct Python setups, each tailored to specific projects or libraries. These environments often rely on different Python versions and dependencies, which can lead to compatibility
Figure 2 Integrating seismic data between Petrel and Python: This illustration outlines the steps for retrieving seismic volumes from Petrel, applying a pretrained model in Python, and reintegrating the results back into Petrel.
issues or version conflicts when sharing workflows. Even a minor difference in a library version can break a script, adding unnecessary delays as teams troubleshoot and align configurations.
For domain experts, such as geoscientists, the challenges are even greater. Adopting Python-based workflows requires not only familiarity with the language but also the installation and maintenance of the required Python environments. These steps can represent a steep learning curve for non-programmers. When workflows are shared, each collaborator needs to replicate these setups on their own machine.
The scattered nature of Python libraries, scripts, and workflows is a significant barrier to effective collaboration in data science, as highlighted by the 2020 Anaconda survey. This decentralised environment makes it difficult for teams to track versions, enforce best practice, and ensure alignment across projects.
Cegal Prizm addresses these challenges by facilitating remote deployments, allowing Petrel and the Python environments and scripts to reside in different locations (Figure 3). This means that the Python environments and scripts can be centralised in the cloud or on-premises, simplifying maintenance and ensuring that all team members access the same configurations without needing to replicate them on their individual machines. By centralising these components, Cegal Prizm enhances collaboration and reduces the logistical hurdles associated with deploying and managing workflows, ultimately streamlining processes and accelerating innovation in collaborative environments.
Creating user-friendly user interfaces (UI) to simplify these workflows brings its own challenges. While these UI can mask the complexity of the underlying code, they require significant time and effort to design, build, and maintain.
The Prizm Workflow Runner (Figure 4) effectively bridges the gap between Petrel users and Python developers by offering a streamlined solution that allows geoscientists to run Pythonbased workflows directly within Petrel, without needing coding knowledge.
For Python developers, the Workflow Runner simplifies the process of deploying scripts to end users. By wrapping their existing Python Tool Pro scripts with just a few lines of code, developers can create a UI that mirrors Petrel and allows the focus to remain on geoscience and subsurface modelling.
With this solution, Petrel users can seamlessly run Python workflows without ever interacting with the code. They can
stay within the Petrel environment, executing workflows as they would any other plugin. This eliminates the need to switch between applications or coding environments, significantly improving workflow efficiency.
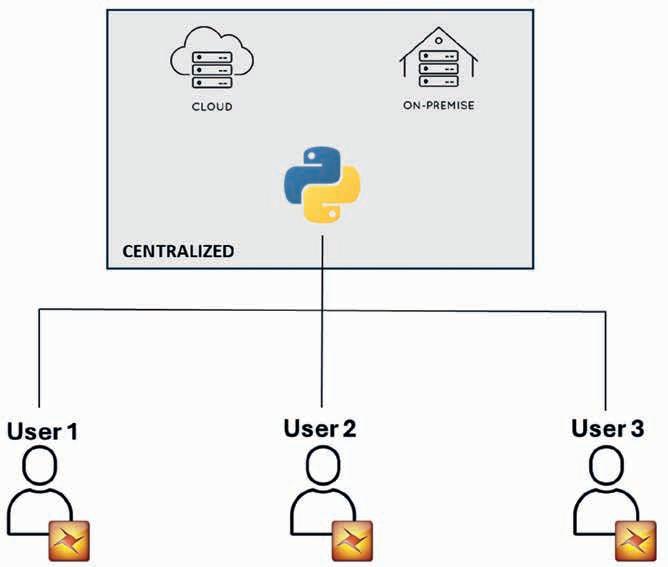
For developers, the Cegal Prizm Workflow Runner provides the freedom to create and deploy custom workflows that can be shared with colleagues. With workflows stored in a central repository, they are easily accessible to all Petrel users, ensuring consistency and collaboration. Furthermore, no additional desktop applications need to be developed or maintained to support the deployment process, which simplifies the adoption of new tools across teams.
Overall, Cegal Prizm enables effortless deployment of Python technology, empowering non-programmers to execute complex workflows and interact with published Python scripts through a familiar and intuitive interface. This approach not only streamlines processes but also fosters innovation, making advanced geoscience workflows more accessible and effective, beyond pre-existing features and tools that are provided by Petrel.
Another common challenge commonly met in geoscience is the integration of third-party applications when no direct links are provided. Different systems use different data formats and require specific steps to convert and transfer information between them. Without the right tools, users face challenges such as data incompatibility, complex file conversions, and the need for manual intervention to ensure the data flows seamlessly between systems. All these steps are yet again severe barriers to productivity and efficiency, and the addition of manual steps is error-prone, time
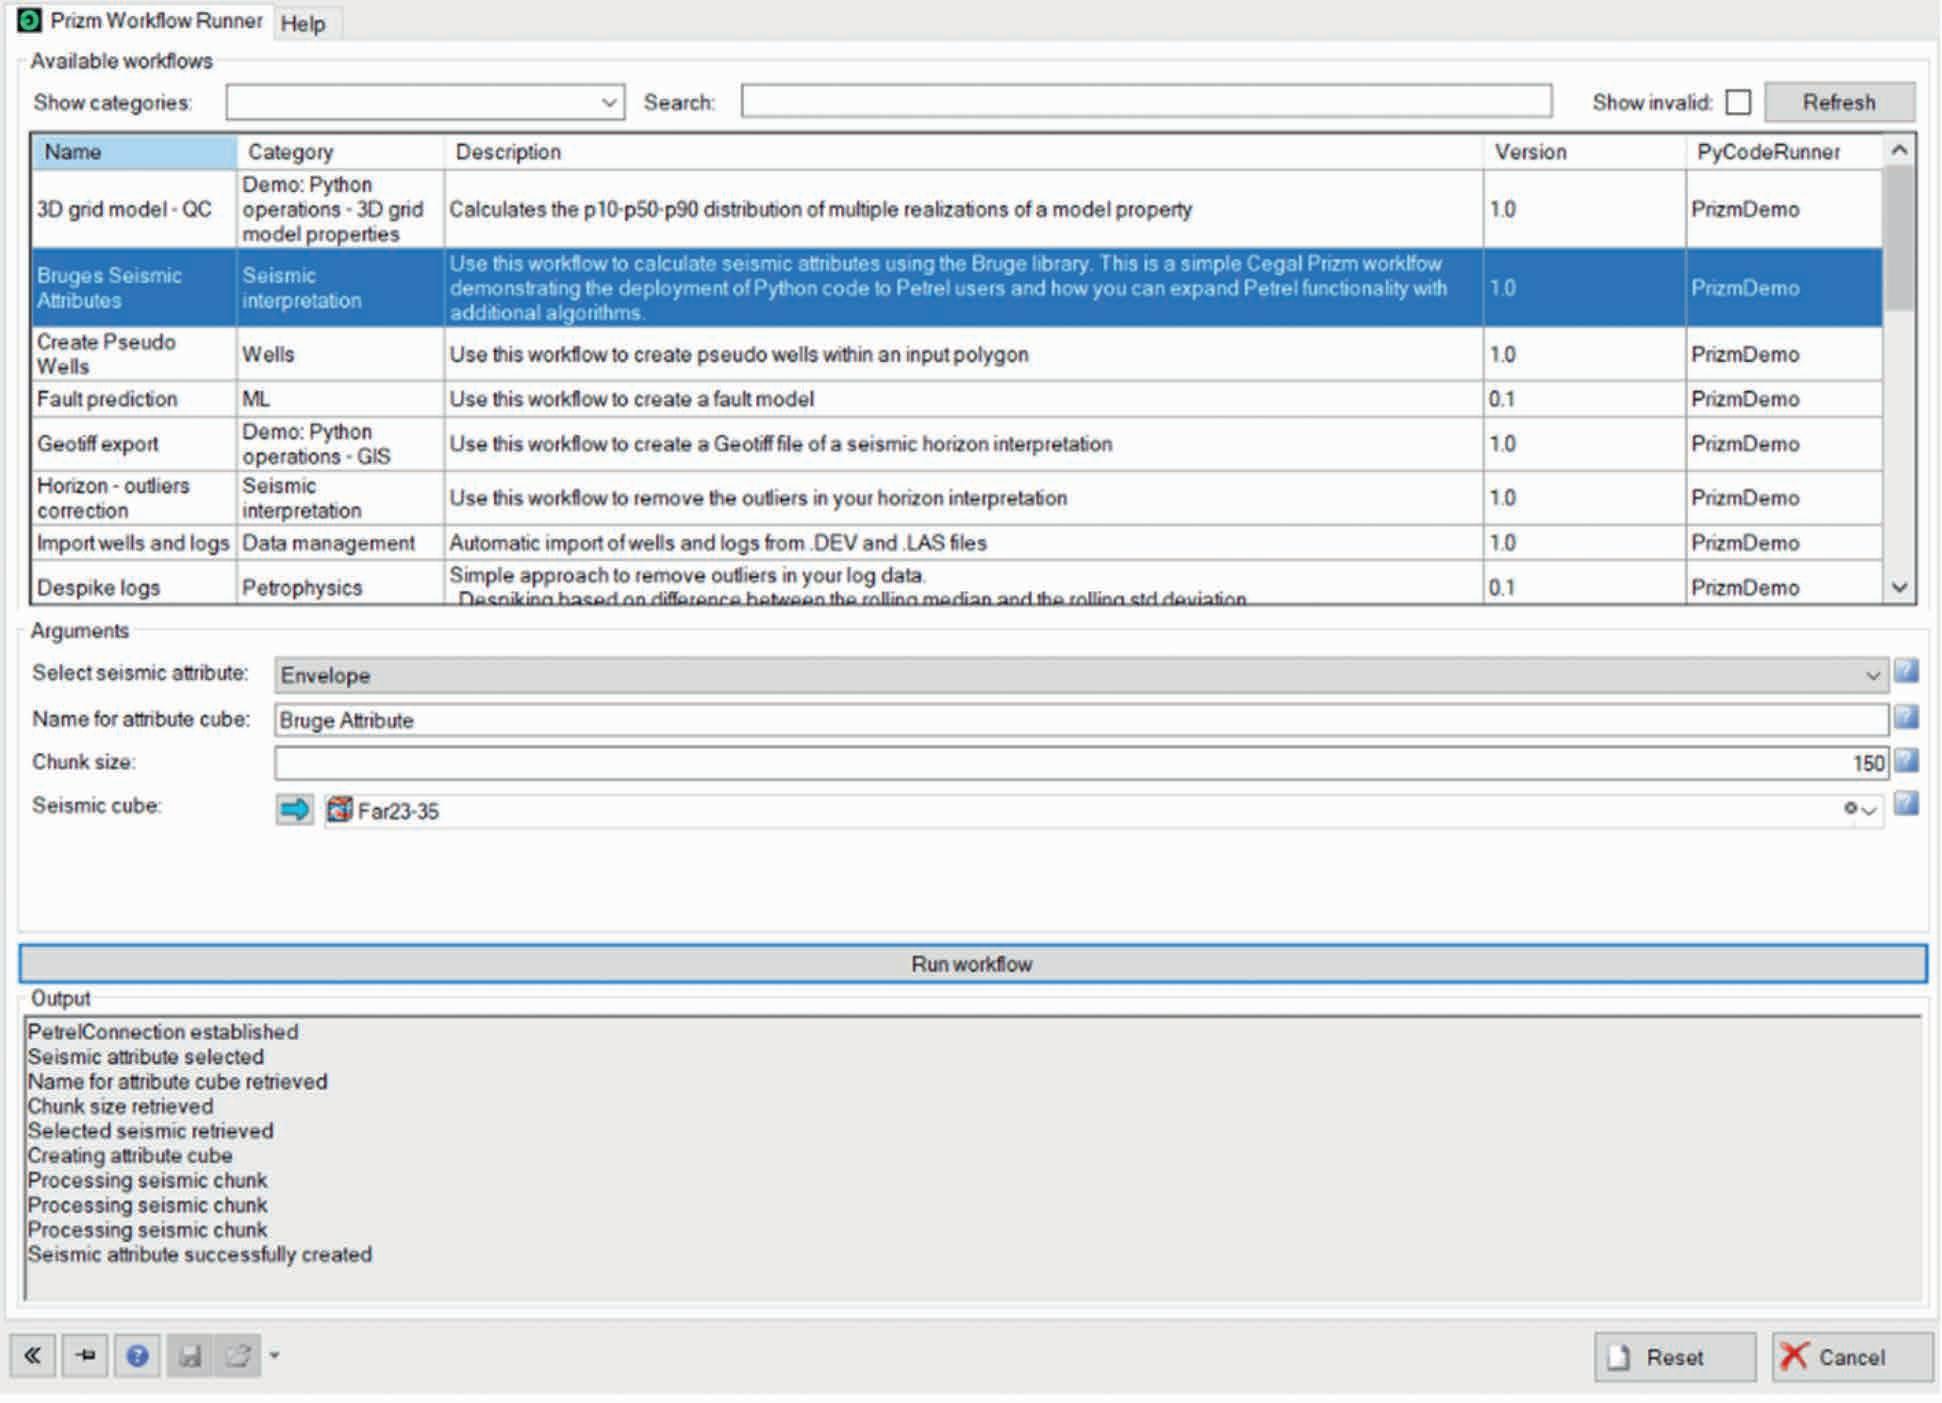
the output
specify a chunk size for


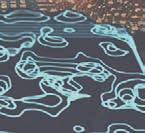


Interested in showcasing your latest research or groundbreaking ideas?
Submit your abstract for the Second EAGE Data Processing Workshop and engage with peers in a collaborative environment!
Abstract Submission Deadline: 19 June 2025


Dive into the forefront of fiber optic sensing innovations and connect with top industry experts and researchers driving the future of energy applications. Join us in vibrant Kuala Lumpur, Malaysia, for this premier workshop, where groundbreaking ideas meet real-world solutions.
Don’t miss your chance — register now and be part of the conversation shaping the next era of energy technologies!
Norman Mark1* presents a method for automated horizon picking from 3D seismic data for the purposes of automating subsurface mapping.
This article is an extension of my work appearing in this publication about two years ago which presented automating horizon picking from 2D seismic data. After accomplishing that I had a long-enduring mental block on how to extend the method to 3D for the purposes of automating subsurface mapping, the most tedious, time-consuming, error-prone and least appreciated processes in all of oil and gas exploration, and arguably the most important: no map, no drilling! Bad map – dry hole (usually). Good map – production (maybe). Maps based on artistic inclinations or sales purposes rather than strictly honouring data have led to legendary O&G financial failures.
Here I present the output of code I wrote which actually does automate 3D seismic interpretation, fully honouring all the data, to your profound disbelief, I suspect – and without any wishful-thinking component built in to the computing.
My decades-long experience working with oil and gas exploration and seismic service companies gave me the foundation and curiosity for pursuing the goal of automating seismic survey data mapping and immunised me against selfpunishment.
The input data used here are from a good quality public domain 3D seismic data volume, Parihaka, offshore New Zealand, and are pushed through my code on a 10-year old Intel(R) Core(TM) i7-5600U CPU @ 2.60GHz laptop. As it has no graphics card I tested it for graphics capacity to learn how much data it could
handle in case I got lucky with my code. The practical upper limit is 30 million points. Forty million points will display but freezes the CPU and graphics. A new high-core computer with a graphics card should work exceptionally faster. Thirty million point prism of 30 layers of 1 million points each — 1000x1000. Going above 30 million to say, 40 milion displays but freezes performance.
An arbitrary data prism of 101 inlines x 101 crosslines – 10201 traces containing 2 seconds of better than average seismic reflection data quality from the Parihaka cube. The sample rate is 3ms. From this sub-volume local maxima reflection times were computed and used in this study. No filters of any kind were applied to these input data. This 101 traces x 101 traces x 2 seconds data prism contains almost 1 million/over 940,000 peak reflection times. Figure 1 contains views of the data at three different depth ranges within my 3D viewer. On the right, the full volume of reflection points is coloured by depth.
Much can be learned about the geologic structure from these views of the data alone without any further computing beyond computing local maxima from SEGY data. This style of data viewing has not been available in the commercial seismic interpretation software I have seen. The 3D viewer makes it easy to quickly identify zones of interest/targets especially with its transparency options. Again, these data are raw peak times – no amplitude information or isolation of surfaces.
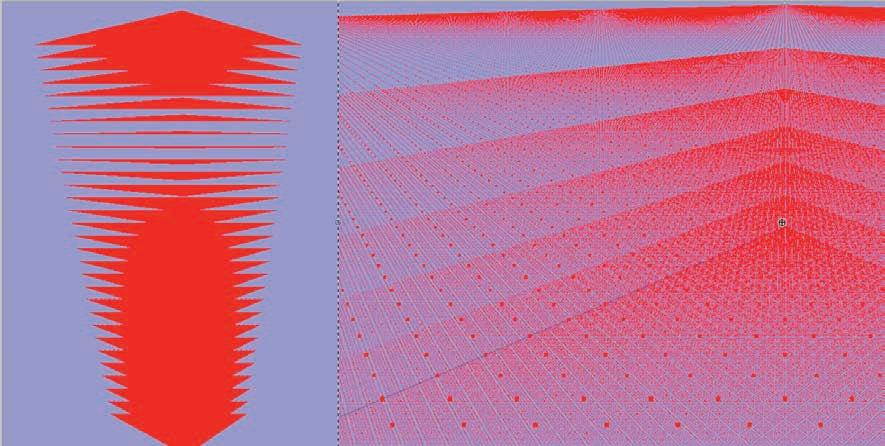
1 Retired geophysical consultant
Figure 1 Testing the graphics capability of my computer, I wrote code to draw a 30 million point cloud. Once displayed it is fairly easy to manipulate but there is some latency and jerkiness in the zooming and panning. 40 million points displays but freezes the graphics and takes minutes to restore itself.
* Corresponding author, E-mail: norm_mark@hotmail.com (phone number: +1 858 2848777) DOI: 10.3997/1365-2397.fb2025018
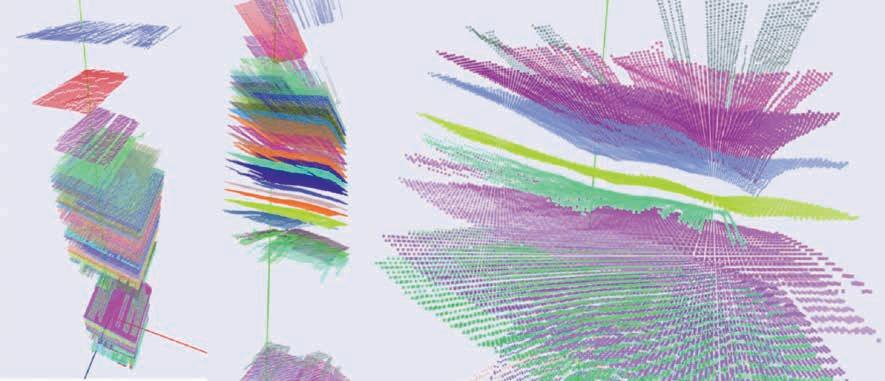
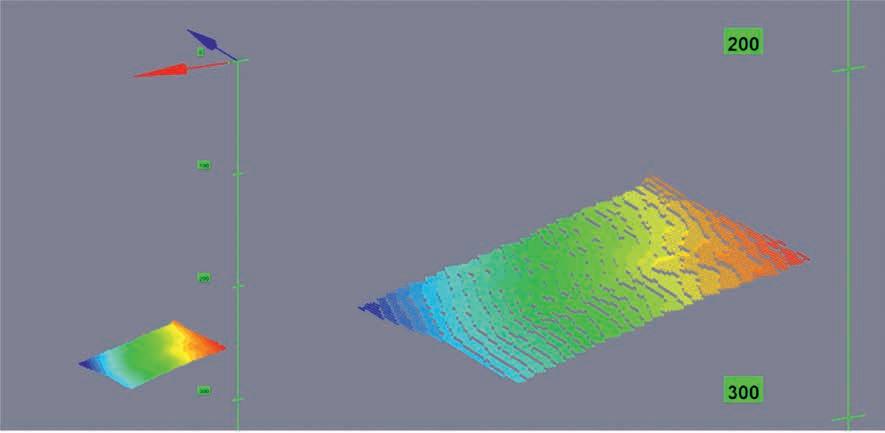
The red axis indicates inline direction and the blue axis indicates crossline direction. The green y axis shows increasing reflection time downward, 0 to 2 seconds.
In another viewer, Figure 5, surfaces are coloured by depth to show structural details.
The output format for the surfaces is nearly identical to the format for the 2D horizons, except that the crossline (z-direction) values vary, as one would expect with surfaces. The output file is a listing of touching/adjacent 2D horizons in text format, easily read by mapping software which reads ASCII files.
Computing hundreds of surfaces took twenty minutes of computing on my 10-year old laptop. Mapping these same surfaces using O&G exploration commercial mapping software would take months!
I am currently seeking to apply my software to interested parties.
The image below is a screen shot of the HTML page which follows. All the images in this paper are from html pages using ThreeJS and JavaScript. ThreeJS is a JavaScript library of WebGL functions to which everyone has access. There is no need to download a language or install an IDE to be able to create a 3D image in a web page very quickly.
The HTML page which follows the image contains many comments about the purposes of the JavaScript syntax, but not everything is commented on. However, one only needs limited fluency in HTML and JS to get a movable image onscreen quickly.
threejs.org is the dedicated website with many breathtaking examples of 3D graphics. It sold me! The views of seismic
4 Different levels of detail (zoom) are shown in the sufaces computed from the 2D horions.
5 Analysing single surfaces is easier programming colour to be a function of depth and adjusting the point size to simulate a surface.
data I created in this article are trivial compared to what can be done in ThreeJS. Learning its full capability takes long and the online manual is cryptic. Further, tedious searching is most often necessary to understand a particular function parameter. Some are straightforward though.
Copy and paste the text below the image into a text editor and name the file with an html suffix, load the file into a browser (I use Firefox) and you will have the below image on your screen and be able to move the data volume and see point coordinates by clicking on them. Give your input data file a name with a txt suffix. The file should contain point format txt as in x1,y1,z1 x2,y2,z2, x3,y3,z3…
<!DOCTYPE html>
<html>
<head>
<title>Read Text File and 3D Viewer</title>
<h1> Read and Plot Data From File Tutorial </h1>
<h3> Select a text file of 3D points data you want to view.</ h3><h3>Its contents will be printed, parsed into points and plotted in 3D.</h3>
<h3>Click on a cube to see its coordinates.</h3>
<style>
/* Set viewer dimensions and border */
#viewer { width: 400px; height: 400px; margin-left: 100px; margin-bottom: 200px; border: 5px solid blue; position: absolute;
const intersects = raycaster.intersectObjects(scene.children, true);
console.log(“Intersections:”, intersects); if (intersects.length > 0) { const intersectedObject = intersects[0].object; if (intersectedObject.geometry && intersectedObject.geometry.type === ‘BoxGeometry’) { const position = intersectedObject.position;
tooltip.style.left = `${event.clientX + 10}px`; tooltip.style.top = `${event.clientY + 10}px`; tooltip.style.display = ‘block’; tooltip.innerHTML = `X: ${position.x.toFixed(2)}, Y: ${position.y.toFixed(2)}, Z: ${position.z.toFixed(2)}`; } } else { tooltip.style.display = ‘none’; } }
// Optional: Hide tooltip on mouse move renderer.domElement.addEventListener(‘mousemove’, () => { tooltip.style.display = ‘none’; });
// Hide the tooltip when the mouse moves away or another point is clicked renderer.domElement.addEventListener(‘mousemove’, () => { tooltip.style.display = ‘none’; });
// Function to add sprite labels for each axis function addSpriteLabel(text, x, y, z) { const canvas = document.createElement(‘canvas’); const context = canvas.getContext(‘2d’); canvas.width = 256; canvas.height = 256; context.font = ‘Bold 75px Arial’; context.fillStyle = ‘rgba(255,0,0,1)’; // Red color for text context.textAlign = ‘center’; context.textBaseline = ‘middle’; context.fillText(text, canvas.width / 2, canvas.height / 2);
const texture = new THREE.CanvasTexture(canvas); const spriteMaterial = new THREE.SpriteMaterial({ map: texture });
const sprite = new THREE.Sprite(spriteMaterial); sprite.scale.set(10, 10, 1); // Make the text larger and more readable
// Set the sprite position sprite.position.set(x, y, z); scene.add(sprite); }
// Call addSpriteLabel for each axis
addSpriteLabel(‘X’, 10, 0, 0); // Position near the end of the X axis
addSpriteLabel(‘Y’, 0, 10, 0); // Position near the end of the Y axis
addSpriteLabel(‘Z’, 0, 0, 10); // Position near the end of the Z axis
// Render the scene animate();
}
// Animate the scene function animate() { requestAnimationFrame(animate); controls.update(); renderer.render(scene, camera);
}
// Initialize the scene init();
// Parse the file’s text into points and print the points in the console document.getElementById(‘inputfile’).addEventListener(‘change’, function() { const fr = new FileReader(); fr.onload = function() { const data = fr.result.trim(); const points = data.split(‘ ‘).map(coord => { return coord.split(‘,’).map(Number);
});
// Print the points to the console console.log(points);
// Display the raw data in the output element document.getElementById(‘output’).textContent = fr.result;
// Add unit cubes at each parsed point points.forEach(point => { const cubeGeometry = new THREE.BoxGeometry(1, 1, 1); const cubeMaterial = new THREE.MeshStandardMaterial({ color: 0x00ff00, transparent: true, opacity: .75 });// for shaded sides const cube = new THREE.Mesh(cubeGeometry, cubeMaterial);
cube.position.set(point[0], point[1], point[2]); scene.add(cube); }); };
fr.readAsText(this.files[0]); });
</script> </body> </html>


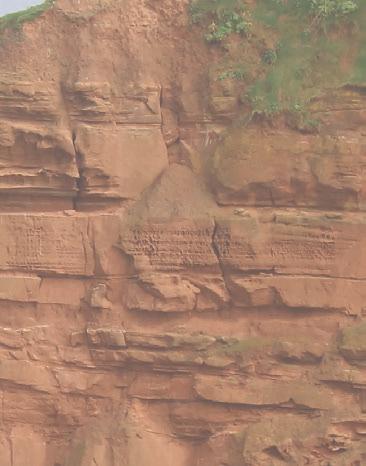


by Gijs J.O. Vermeer1*
Introduction
This paper discusses ideas developed by Goodway et al. (2024) in last September’s First Break. Their new theory on wavefield sampling is highly controversial and deserves some reaction. The authors submit a new sampling law based on Fresnel Zone Binning which should replace the Nyquist theorem. This new insight is challenged.
Another interesting view on 3D seismic survey design being discussed is that a designer must try to achieve an offset distribution that is as close as possible to the stack array that used to be a guiding principle for 2D survey design. This principle (and modern interpolation techniques) leads Goodway et al. (2024) to make a new pitch for the MegaBin geometry. Their comparison of MegaBin with orthogonal geometry leads to a dismissal of orthogonal geometry, because of the build-up of fold as a function of offset as well as in a comparison of data quality. The present discussion paper argues that these ideas perhaps apply to common practice known to the authors, but does not recognise the flexibility and the true power of orthogonal geometry combined with 3D symmetric sampling and various processing techniques to exploit that power.
Fresnel Zone Bin Sampling theory to replace Nyquist?
The run-up to the statement that Nyquist is to be replaced by Fresnel Zone Bin Sampling (FZBS) is quite special. In the Section ‘Theoretical basis for 3D interpolation to recover the full 5D wavefield from under-sampled 3D designs’ the authors first mention that in the 1990s interpolation was not considered a viable method to successfully de-alias coarsely sampled data. They continue with the observation that Spitz (1991) and Claerbout (2004) showed that the spatial Nyquist limit can be overcome, i.e. de-aliased, by assuming that the unaliased, low temporal frequencies share the same linear velocity as the aliased, higher temporal frequencies. Next the authors mention three papers that have further validated the effectiveness of de-aliased seismic data reconstruction methods. The common factor is that all papers have used certain assumptions to allow for successful interpolation beyond Nyquist.
In the following Section ‘Fresnel Zone Bin Sampling theory to replace Nyquist for wavefield reconstruction through interpolation’ the authors write: ‘Despite the initial resistance to the ability of interpolation in principle to overcome Nyquist, in the last few years, pre-stack interpolation has gained wide acceptance, to the point where it is routinely applied to all varieties of land
1 Retired geophysicist
* Corresponding author, E-mail: gijs@3dsymsam.nl
3D designs.’ As an example, they use 5D Minimum Weighted Norm Interpolation (MWNI) described in Liu and Sacchi (2004). (Somewhat inconsistent with this message is the observation in Goodway (2013) that MWNI cannot restore data above Nyquist, see also Cary, 2011). In fact, the first part of this section repeats the message of the previous section with a different example of successful interpolation. Anyway, the results of modern interpolation techniques are too good for the Nyquist criterion to be true; instead this success ‘was not adequately justified until the concept of “Fresnel Zone Binning” (FZB) was introduced by Monk (2009, 2020).’ In other words, the various assumptions used in those papers are not the only cause of their success. As an aside, there are also other reasons for successful interpolation:
1. Modern techniques may seem successful beyond Nyquist because often there is not much energy at and above Nyquist, so that aliasing effects are limited.
2. The term dealiasing is also used to describe successful interpolation results without demonstrating that any aliased frequencies have been recovered.
3. A special case is long-offset infill in marine streamer surveys, where the long offsets have much lower frequency content than the short offsets: for those, data interpolation across quite a number of traces can be successful, especially if the geologic structure is relatively benign.
In a very bold statement the authors claim that the two samples per wavelength restriction of Nyquist is incorrect and should be replaced with the Fresnel Zone theory developed in their paper. They state: ‘With Fresnel Zone Binning, an adequate three samples per Fresnel Zone sample rate replaces and relaxes the strict Nyquist limit of two samples per wavelength for interpolation. Consequently, the correct Fresnel Zone theory for the seismic wavefield sampling comb (Figure 9) replaces the non-applicable, incorrect signal theory Nyquist aliasing equation, which is commonly used to establish the limits to interpolation.’ I call this very bold, because it invalidates the work of generations of researchers and in particular that of Nyquist, Shannon, Petersen and Middleton and many following in their steps. Because of this far-reaching statement, it would have been appropriate to submit this paper to First Break as a (peer-reviewed) Technical Article rather than as a Special Topic (not peer-reviewed).
According to the authors, the width of the Fresnel zone area is linked to the ability to interpolate: the gap that may be interpolated is equal to half the radius of the Fresnel zone.
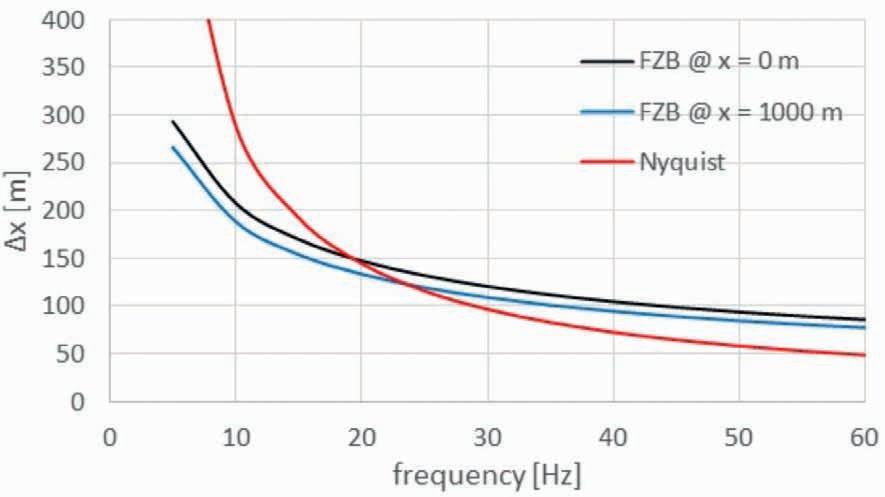
Yet, in the text quoted in the previous paragraph, three samples per Fresnel zone are required. Indeed, Figures 10a and 10b of Goodway et al. (2024) show three samples, two of them on the edges of the Fresnel Zone. However, a sampling comb of three points corresponds to a width of three times the sampling interval (Appendix B in Vermeer, 2012). With three required samples the authors stay on the safe side of their theory. More importantly, the authors claim to provide a proof for their assertion quoted above (in response to a remark in Vermeer, 2022).
The proof begins with stating that according to wavefield diffraction theory Fresnel zones can be represented by a box car in the wavenumber domain. This suggests that the Fresnel zone acts as a spatial anti-alias filter. Why this is, is not explained. Figure 9 and a few lines of text are meant to explain it all. Unfortunately, the captions and scales in Figure 9 are too small to be readable. The line of reasoning is opaque. Yet, one question comes up logically: if the Fresnel zone acts as a high-cut wavenumber filter, those wavenumbers are much more difficult to be recovered; so how can this help interpolation? This law, as drastic as it is, deserves a much more detailed explanation.
However, it is easy to show that the statement ‘an adequate three samples per Fresnel Zone sample rate replaces and relaxes the strict Nyquist limit of two samples per wavelength for interpolation’ is not correct for some situations. The simplest case is just for a horizontal earth: in that case the sampling interval required for Nyquist is infinite, whereas the sampling interval according to the FZB-technique is finite: FZB is stricter than Nyquist.
It may be expected that Nyquist is also less strict for moderate dips. Figure 1 shows the result for a reflector with dip 10° in a medium with constant velocity 2000 m/s for two zero-offset situations: at position x = 0 m and depth 1015 m and at position x = 1000 m with depth 839 m. The diameter F of the (first) Fresnel zone is computed with F = √(D.l), where D is two-way distance to the normal-incidence point and l is the wavelength of a monochromatic wave with frequency f (Figure 6.13 in Sheriff and Geldart, 1995).
For a large range of frequencies FZB requires a smaller sampling interval than according to Nyquist, which shows that the interpolation law stated in Goodway et al. (2024) is not correct. Also, their statement ‘Consequently, the correct Fresnel
Figure 1 Smallest required horizontal sampling interval as function of frequency according to Nyquist (red) and Fresnel zone binning (black and blue). See text for description of geometry.
Zone theory for the seismic wavefield sampling comb (Figure 9) replaces the non-applicable, incorrect signal theory Nyquist aliasing equation’ is incorrect. On the other hand, we have not disproved the rule of three samples per Fresnel zone; it might still be correct, but a better proof is required.
Another question is how to deal with ground roll. In Alberta, Canada, ground roll is not a big issue; yet, in many other places in the world the whole wavefield needs to be properly sampled for optimal ground-roll removal. So, how do you determine sampling requirements with the new theory of Fresnel Zone Bin Sampling for this more complex case?
There is much emphasis in the paper on the importance of getting a stack-array type of offset distribution in CMPs. The authors state: ‘The concept of the interleaved shot equal to receiver half-integer spacing for land seismic data acquisition sampling, termed the “stack array”, is a fundamental criterion and the basis for both 2D and 3D acquisition design.’ Interesting idea, I knew about stack array of course and its relevance for 2D, but in my opinion it is not really relevant for 3D survey design. Already in 2D there is more to design than just the stack array (Vermeer, 1990).
In 2D the stack array is (was) an important criterion of quality (Anstey, 1986). The stack array is based on the use of geophone arrays with length equal to group interval. 2D acquisition should be such as to produce a regular sequence of geophones in all traces that contribute to the stack: the stack array. (This is my understanding of the stack-array approach; the description of ‘interleaved shot equal to receiver half-integer spacing’ used above, achieves the same thing.) In those days the sampling intervals were still too large to allow successful prestack filtering of the data. Vermeer (1990) discusses the next step in 2D data acquisition: 2D symmetric sampling. The reciprocity theorem leads to symmetric sampling, which means that source- and receiver-sampling should be the same with sampling intervals small enough to prevent aliasing in shot- and receiver gathers, thus allowing prestack filtering of the ground roll in shot and receiver gathers and the creation of clean prestack data. This step reduces not only the emphasis on CMP-gathers as in the stack-array approach, but it exploits as well shot and receiver gathers and even common-offset gathers.
The stack-array criterion is not really suitable as a design criterion for 3D, because in 3D acquisition azimuth needs to be sampled as well. That is why for 3D acquisition a useful recommendation is to aim for equal shot and receiver station intervals, equal shot and receiver line intervals and equal maximum inline and maximum crossline offsets (Vermeer, 2012). This recipe fully honours the reciprocity theorem, it produces a regularly sampled offset vector, it enables full 3D illumination of the subsurface and it leads to orthogonal geometry. (MegaBin might also be acquired in a wide-azimuth mode, but that would spoil the stack array).
An alternative implementation of wide-azimuth acquisition is use of an areal geometry with one of two potential implementations: dense shot x and dense shot y intervals (carpeting the area with a dense shot grid) and sparse receiver x and receiver y intervals. In the second implementation the role of shots and receivers is interchanged: dense receivers and sparse shots. These two methods of acquiring areal geometry may be called carpet shooting and carpet recording (e.g. Naranjo et al., 2019). In both cases maximum offsets should be the same in x and y. It depends on the cost of shots and receivers which implementation is selected.
Goodway et al. (2024) emphasise the poor bin-to-bin sampling of an orthogonal grid while comparing it to a full 3D geometry in their Figure 4. For a useful analysis of what happens in a bin, bar charts like Figure 4e and 4g are not suitable, because they only show absolute offset and do not show the azimuth distribution nor the real number of contributing traces due to hidden overlaps (at least in this type of bar chart). Offset azimuth displays as in Figure 4f and 4h give more information, especially if only the endpoints of the offset vectors are displayed instead of the full vectors as in these (spider-chart) figures. Then Figure 4f would show 256 regularly distributed points, whereas Figure 4h would show 16 regularly distributed points. How well the offset-azimuth plane is sampled depends on the total fold (larger is better) and also on the three aspect ratios of the geometry (station interval, line interval, and maximum offset). If all aspect ratios are equal to 1, then the offset-azimuth distribution is best for a given fold.
The bin-to-bin variation is indeed important in a 3D survey; not because it might cause amplitude variations in the stack, which is a requirement of days past. What is important is to have line intervals that are as small as one can afford, because that helps the quality of prestack migration. Small line intervals ensure small bin-to-bin variations.
In Goodway et al. (2024) there is no attention for the minimal data set (MDS) as an important tool in prestack processing. Padhi and Holley (1997) define it as ‘the smallest amount of data that can adequately image a reflector (or at least a reasonable piece of one)’. The most attractive MDS is the common-offset vector (COV) gather, consisting only of traces that all have the same offset vector. Unfortunately, COV-gathers are way too expensive to be acquired, but the data set closest to a COV-gather is the offset-vector tile (OVT) gather, commonly used for prestack velocity analysis and prestack migration. However, the small MDSs are also very useful. In orthogonal geometry the crossspread is a true MDS, especially suitable for prestack removal
of ground roll and for other 3D processes. In carpet shooting and carpet recording one has the 3D receiver gather and the 3D shot gather, respectively. The statement in Goodway et al. (2024) ‘these [orthogonal, GJOV] geometries result in a severe leakage of noise interference due to deficient 3D sampling, thereby degrading the overall 3D pre-stack and post-stack S/N quality’ laments the poor sampling of the bins in orthogonal geometry, but fails to recognise the power of the cross-spread for noise removal instead.
In marine streamer acquisition it is not possible to acquire orthogonal geometry: there, one is confined to parallel geometry with limited azimuthal coverage. In many situations, with rather simple geology, parallel geometry can be very successful, also because there is no ground roll to be dealt with. However, in complex geology, parallel geometry turns out to be too restrictive and various alternative techniques have been developed and implemented to achieve wide azimuthal coverage using streamers. Furthermore, over the past years, there is a strong drive in marine data acquisition to use a sparse grid of nodes combined with a dense grid of shots, thus allowing wide-azimuth acquisition (in combination with long offsets in all directions).
Comparison MegaBin with orthogonal geometry
MegaBin (Goodway and Ragan, 1998) is a parallel acquisition geometry with coincident shot and receiver lines and an inbuilt crossline interpolation requirement. This geometry is typically successful in the Western Canada Sedimentary Basin (WCSB): subhorizontal geology and no strong ground roll. Almost anywhere else, the sampling intervals have to be chosen on basis of what is required for successful ground-roll removal.
To demonstrate the power of the MegaBin technique, the authors make a comparison of two data sets, both extracted from the same full-grid geometry with 70 x 70 m station and 70 x 70 m line intervals. The MegaBin geometry has line intervals of 140 m whereas the orthogonal geometry has shot-line intervals of 420 m and receiver line intervals of 280 m. In my opinion, this is not a fair comparison; the only correct comparison would have been orthogonal geometry with also line intervals of 140 m, but now with orthogonal shot and receiver lines. In that case the trace density (also as a function of offset) of the two datasets would have been about the same, whereas in the compared results the trace density of the MegaBin geometry is some six times larger than the trace density of the orthogonal geometry. Actually, the alternative comparison would not be entirely fair: Regone et al. (2015) have shown that small enough station intervals are more important than small line intervals (see also Vermeer, 2020). In the MegaBin survey the binsize would be 35 x 70 m, whereas in orthogonal geometry it would be 35 x 35 m. Hence, in MegaBin an extra interpolation is required, but that should be no problem: it is part of its design.
Earlier in the paper Goodway et al. (2024) compare fold as a function of offset between MegaBin and Orthogonal. In Figures 6 and 7 the two types of geometry are compared. The parameters used for Figure 6 are not specified but must be somewhat different than in Figure 7 for which parameters are specified. The denominator in the fold formula for MegaBin is 4 * (Line interval * Station interval). The MegaBin parameters in Figure 7 are not
in accordance with the MegaBin recipe (Goodway and Ragan, 1998) that line intervals are equal to two station intervals. Here the line interval of 160 m is more than three times the station interval, quite a challenge for interpolation to square bins. The orthogonal geometry in Figure 7 has station intervals of 50 m (pretty large for most areas) and line intervals of 250 and 350 m. This orthogonal geometry has much slower buildup of fold as a function of offset than MegaBin.
For a fair comparison of MegaBin with Orthogonal we need ‘a closer look’. MegaBin may be characterised with the following rules: select shot and receiver station intervals D, then parallel shot and receiver lines have line intervals 2D (In the MegaBin patent, station intervals of shots are twice that of receivers, whereas line intervals are indeed twice receiver station interval). Orthogonal geometry may be characterised by shot and receiver station intervals D and orthogonal shot and receiver lines with shot line intervals MD and receiver line intervals ND (M, N = 1, 2, ....). With M = N, the unit cells are square. For M = N =1 the geometry is full 3D, which is not necessarily also a good geometry; this depends on a proper choice of D. For M = N =2 orthogonal geometry is quite similar to MegaBin, with the added advantages of square bins with no need for crossline interpolation and with densely sampled crossspreads. In this case, MegaBin and Orthogonal both have square unit cells consisting of 16 bins as in Figure 8b of Goodway et al. (2024), with Orthogonal having the same fold in all bins (in the fullfold part of the geometry).
The comparisons made in Goodway et al. (2024) use much larger line intervals for orthogonal geometry. This is quite understandable, because this is common practice when using orthogonal geometry. Especially, in areas with simple geology it seems justified to use large line intervals. However, as mentioned before, smaller line intervals are better for prestack migration. The tiles in OVT-gathers used in prestack migration may be too large with large spatial discontinuities between adjacent tiles such that those gathers deviate too much from MDSs.
In fact, orthogonal geometry is much more flexible than MegaBin. For shallow targets the line intervals must be chosen small enough for sufficient coverage, whereas for deeper targets larger intervals may be chosen. The quality of both geometries depends strongly on a proper choice of the station intervals: with strong, low-velocity ground roll it may be necessary to select station intervals of 15 m or less. In such cases MegaBin may easily become highly expensive, whereas in orthogonal geometry there is the freedom to choose larger line intervals.
Goodway et al. (2024) claim that the MegaBin geometry was proposed such that ‘the locations of shots and receivers are coincident in one direction, thereby allowing and satisfying the stack-array sampling criterion in at least the in-line direction …’. The term ‘stack array’ is not mentioned in Goodway and Ragan (1998); moreover, the example given in Figure 5c of Goodway et al. (2024) does not satisfy the stack-array criterion. Because of the coincident shots and receivers there are two different CMP offset distributions: one with offsets 0, -2D, 2D, -4D, 4D, etc. and the other with D, -3D, 3D, -5D, 5D, etc., D being the station inter-
val of sources and receivers. Moreover, the pairs of traces with equal absolute offset are reciprocal and virtually identical, which makes the geometry of their Figure 5c in fact a poor geometry (see also Vermeer, 2015). The proper recipe for the stack array is to use centre-spread acquisition with sources and receivers interleaved as in their Figure 1a; interestingly, this recipe is given in the paper as well.
Goodway et al. (2024) do not mention whether they are using shot and/or receiver arrays in their acquisition. In this discussion paper I have assumed that arrays are not used. Of course, if arrays are used, perhaps also to satisfy the stack-array criterion, then higher frequencies tend to be suppressed and this would reduce the aliasing problem to some extent.
The paper discussed here is Part 1 of more to come (on AVO, inversion and environmentally responsible land 3D survey designs, see p.52 of same issue of First Break). At the time of writing this discussion paper, Part 2 was not published yet (Goodway et al, January 2025).
Many innovative interpolation techniques have been developed and continue to appear but without extra knowledge or assumptions it is not possible to interpolate beyond Nyquist. The statement in Goodway et al. (2024) that Fresnel zone binning replaces and relaxes the Nyquist equation is incorrect. Their proof that the radius of the Fresnel zone determines the gap that can be interpolated is not convincing. Moreover, a less strict interpolation rule is not necessary to explain existing results of beyond-Nyquist interpolation, because all methods use additional information to overcome Nyquist.
The authors’ favourite way of designing 3D seismic surveys, the stack-array approach embodied in the MegaBin geometry, may be useful in Alberta, Canada, but has serious shortcomings for application in most other places around the world. Its requirement for interpolation right from the start can be avoided by using orthogonal geometry. Orthogonal geometry has much more flexibility to adapt to the survey requirements such as target depth, whereas processing in the cross-spread being a true, well-sampled 3D volume, is ideal for a first cleanup of the data.
Thanks to the feedback given by Kees Hornman, Jan de Bruin and Gary Hampson this paper has become much more complete and more to the point, to such an extent that it may be considered as ‘peer’-reviewed. It was Kees Hornman’s idea to check FZB versus Nyquist using a simple model.
Anstey, N. [1986]. Whatever happened to ground roll? The Leading Edge, 5(3), 40-45.
Cary, P. [2011]. Aliasing and 5D interpolation with the MWNI algorithm; 81st SEG Annual International Meeting, Expanded Abstracts, 30803084.
Claerbout, J. F. [2004]. Earth Soundings Analysis: Processing versus Inversion: Chapter 8, Missing-data restoration. Note: this reference is missing in Goodway et al. (2024); Claerbout’s book is mentioned in Goodway (2013) in a similar context. Copyright Stanford Univer-
Andrea Crook1*, Bill Goodway 2*, Mostafa Naghizadeh1, Michael Hons1 and Cameron Crook1, have given the following response.
The editors of First Break provided us with an opportunity to review the extensive comments by Vermeer in response to the first part of our article. A full technical response from us will require more time. However, here are our preliminary comments on the motivation behind publishing our results.
First, we are not proposing to replace the signal theory-based Nyquist sampling limit. Instead, we establish a new ‘Fresnel Zone Bin Sampling’ theory for alias protected seismic wavefield recording that theoretically justifies the Fresnel Zone Binning (FZB) criteria of Monk (2009, 2020) and allows for the routine spatial reduction of sparse 3D sampling through 5D interpolation. This new ‘Fresnel Zone Bin Sampling’ theory was motivated by the challenge in the following quote from Vermeer (2022): ‘If true, this (our reference ;Fresnel Zone Binning-FZBMonk 2009, 2020’) is an extremely important new law in (geo) physics. However, nowhere in the Monk papers can a proof of this law (FZB) be found, nor is there any research geophysicist who has taken up the challenge to prove it. Monk (2009, 2020) tries to assess the validity of the FZB idea using an illustrative example, but this really falls short of a proof.’
This updated sampling criteria is needed to set clear limits on how far apart seismic lines can be before interpolation in processing begins to break down. The selection of bin size via Nyquist sampling criteria is well accepted by industry and taught in all basic seismic acquisition courses (Cordsen, 2009, Cooper, 2004, Monk, 2020, Vermeer, 2012, etc.). However, the only surveys that fully meet Nyquist sampling criteria are grid or ‘carpet’ geometries where line intervals are equal to station intervals for both sources and receivers. Due to cost as well as practical limitations, in general, only subsets of this fully Nyquist-sampled arrangement are typically acquired in the field. Despite successful imaging results, Nyquist criteria are routinely violated in these surveys. For example, in symmetrically sampled orthogonal cross-spread geometries, the selection of line intervals is not held to strict Nyquist criteria and is open to interpretation with more vague guidelines in the form of fold or trace density requirements.
Historically, fully Nyquist-sampled grid geometries were not possible due to equipment limitations. With the advent of high-density Vibroseis techniques and modern nodal receivers, grid geometries are now possible and have been shown to have significant benefits due to fully sampling the wavefield in all dimensions (Sx, Sy, Rx, and Ry). Where cost constraints limit the use of grid geometries, operators have chosen to significantly
reduce the line intervals of traditional orthogonal surveys to better sample near offsets, which are critical for accurate attribute analysis. Ourabah et. al. published an excellent study on this effect at the 77th EAGE Conference & Exhibition in 2015.
The challenges faced in Canada are not unique in the world. Limited access, sensitive habitats, and mountainous terrain exist in many jurisdictions. With the increase in seismic for non-petroleum exploration (geothermal, helium, carbon capture and storage, etc.), additional challenges are present. For example, in urban areas, none of the standard (orthogonal, grid) or alternative (linear, parallel, CS, etc.) geometries can be applied directly. This is apparent in Dean’s recently published paper on sparse onshore seismic surveys where the survey is designed based on specific metrics for determining the suitability of the design for regularisation (such as offset and azimuth distribution) due to surface constraints limiting traditional sampling approaches (Dean, 2024).
It is essential that any changes to traditional approaches for designing seismic acquisition geometries be thoroughly vetted. Full grid datasets provide the opportunity to decimate and compare a variety of reduced density geometries – not only to each other, but to the highest-quality answer that the full grid 3D seismic method can provide. These examples are extremely important, as the full grid offers an independent benchmark rather than simply comparing between individual designs. Commonly used geometries are not given any preference and can be scrutinised on costs and benefits without preconceptions. This is the ideal means of comparison since all decimations of the full grid (including all commonly used varieties) will violate Nyquist in some dimensions. Although such decimation studies can be expensive to evaluate, they are needed to assess data from the end user perspective, not just assuming final quality based on simple acquisition metrics.
Tying seismic acquisition geometries directly to processing and/or inversion provides the ultimate validation of a new technology. In this case, that includes providing a practical evaluation of the proposed Fresnel Zone Bin Sampling. This is the goal of our collaborative EcoSeis project (Naghizadeh et. al., 2023) where, with the support of various industry, academic, and government funders, we have thoroughly examined over 35 different geometry iterations (all derived from a full grid dataset of real recorded traces) through processing, interpretation, and inversion. Building on this, we are in the midst of multiple field trials to develop methods
1 OptiSeis Solutions Ltd. | 2 Qeye Labs
* Corresponding authors, E-mail: andrea.crook@optiseis.com, bg@qeye-labs.com
for accurate subsurface imaging while minimising environmental impact (and as a result, potentially lowering cost).
Our two-part paper is intended to expand on the question of how one ensures accurate imaging in real data, providing both a theoretical view and practical decimation tests in the presence of coherent and incoherent noise. Although full grid geometries are the simplest answer, they are frequently impractical and costly. Since they cannot be applied everywhere, all effective alternatives should be evaluated. This is the purpose of part two of our paper published in the January 2025 issue of First Break which provides examples of various geometries and how each geometry impacts AVO attributes. To facilitate further discussion, we invite everyone interested in this important topic to join us at the EAGE’s First Land Seismic Acquisition Workshop in Calgary, AB on 8-9 May, 2025 where we look forward to discussing the ideas presented in our paper with leading industry experts.
With Sincerest Regards, Andrea, Bill, Mostafa, Michael, and Cameron.
References
Cordsen, A., Galbraith, M., Peirce, J. and Hardage, B. A. [2000]. Planning land 3-D seismic surveys. Geophysical Developments Series No. 9 Society of Exploration Geophysicists.


Cooper, N. [2004]. A world of reality—Designing land 3D programs for signal, noise, and prestack migration : Part 1 of a 2-part tutorial; The Leading Edge, 23(10), 1007-1014.
Dean, T. [2024]. The design of ‘opportunistic’ or sparse onshore seismic surveys; The Leading Edge, 43(8), 506-514.
Monk, D.J. [2009]. Fresnel zone binning: Application to 3D seismic fold and coverage assessment; The Leading Edge, 28(3), 288-295.
Monk, D.J. [2020]. Survey design and seismic acquisition for land, marine, and in-between in light of new technology and techniques; SEG, Distinguished Instructor Series, 23
Naghizadeh, M., Vermeulen, P., Crook, A., Birce, A., Ross, S., Stanton, A., Rodriguez, M. and Cookson, W. [2023]. EcoSeis: A novel acquisition method for optimizing seismic resolution while minimizing environmental footprint. The Leading Edge, 42(1), 61-68.
Ourabah, A., Bradley, J., Hance, T., Kowalczyk-Kedzierska, M., Grimshaw, M. and Murray, E. [2015]. Impact of acquisition geometry on AVO/AVOA attributes quality – A decimation study onshore Jordan. Proceedings of the 77th EAGE Conference & Exhibition, Extended Abstracts.
Vermeer, G.J.O. [2002]. 3-D seismic survey design. Geophysical Reference Series No. 12. Society of Exploration Geophysicists.
Vermeer, G.J.O. [2022]. Comments on Fresnel zone binning – Can it be used to determine maximum allowable holes in coverage of long offsets? The Leading Edge, 41(6), 418-422.
ADVERTISEMENT


21-25 Apr RENAG 2025 www.ageocol.org/renag
29-30 Apr EAGE Workshop on Advanced Sesimic Solutions for Complex Reservoir Challenges www.eage.org
2025
5-7 May First EAGE Atlantic Geoscience Resource Exploration & Development Symposium www.eage.org
7-8 May DGMK/ÖGEW Spring Conference 2025 - Subsurface Innovations and Insights www.dgmk.de/en/events/dgmk-oegew-spring-conference-2025
8-9 May First EAGE Workshop on Land Seismic Acquisition www.eage.org
13-15 May 7 th Asia Pacific Meeting on Near Surface Geoscience & Engineering (NSGE) www.eage.org
19-22 May InterPore 2025 www.events.interpore.org/event/56
21-22 May First EAGE/SBGf Workshop on Marine Seismic Acquisition www.eage.org
2-5 Jun 86th EAGE Annual Conference & Exhibition www.eageannual.org
23-25 Jun AAPG/EAGE Geothermal Workshop www.eage.org
30 Jun2 Jul 4th Carbon Capture & Storage Conference Asia Pacific www.eage.org
2025
3-4 Jul 5 th EAGE Workshop on Fiber Optic Sensing for Energy Applications www.eage.org
6-11 Jul Goldschmidt 2025 conf.goldschmidt.info/goldschmidt/2025/meetingapp.cgi

16-18 Sep The Middle East Oil, Gas and Geosciences Show (MEOS GEO) www.meos-geo.com
17-18 Sep First EAGE Workshop on Energy Transition in Latin America’s Southern Cone www.eage.org
22-24 Sep Sixth EAGE Borehole Geology Workshop www.eage.org
23-24 Sep EAGE Workshop on Geoscience in Development Enhancement www.eage.org
24-25 Sep EAGE Workshop on Machine Learning for Geoscience www.eage.org
29 Sep1 Oct Second AAPG/ EAGE Mediterranean and North African Conference (MEDiNA) medinace.aapg.org
29 Sep1 Oct Eighth EAGE Borehole Geophysics Workshop www.eage.org
6-8 Oct Second EAGE Data Processing Workshop www.eage.org
6-8 Oct Empowering the Energy Shift - The Role of HPC in Sustainable Innovation: Ninth EAGE High Performance Computing Workshop www.eage.org
14-16 Oct First EAGE Conference on Challenges and Opportunities in the Future of Mineral Exploration www.eage.org
21-22 Oct First EAGE Workshop on Geophysical Techniques for Monitoring CO2 Storage www.eage.org
21-23 Oct EAGE/AAPG/SEG CCUS Workshop www.eage.org
27-31 Oct 6th EAGE Global Energy Transition Conference & Exhibition (GET 2025) www.eageget.org