SPECIAL TOPIC
Modelling / Interpretation
EAGE NEWS 2024 award winners
CROSSTALK Why CGG is now Viridien
TECHNICAL ARTICLE Noise attenuation on arid model data


EAGE NEWS 2024 award winners
CROSSTALK Why CGG is now Viridien
TECHNICAL ARTICLE Noise attenuation on arid model data
With our 90+ year track record of innovation we continue to open up possibilities, from natural resource and energy transition discoveries to new advances in HPC and infrastructure monitoring. We are Viridien. viridiengroup.com


CHAIR
EDITORIAL BOARD
Clément Kostov (cvkostov@icloud.com)
EDITOR
Damian Arnold (arnolddamian@googlemail.com)
MEMBERS, EDITORIAL BOARD
• Lodve Berre, Norwegian University of Science and Technology (lodve.berre@ntnu.no)
Philippe Caprioli, SLB (caprioli0@slb.com) Satinder Chopra, SamiGeo (satinder.chopra@samigeo.com)
• Anthony Day, PGS (anthony.day@pgs.com)
• Peter Dromgoole, Retired Geophysicist (peterdromgoole@gmail.com)
• Kara English, University College Dublin (kara.english@ucd.ie)
• Stephen Hallinan, Viridien (Stephen.Hallinan@CGG.com)
• Hamidreza Hamdi, University of Calgary (hhamdi@ucalgary.ca)
Gwenola Michaud, GM Consulting (gmichaud@gm-consult.it)
Fabio Marco Miotti, Baker Hughes (fabiomarco.miotti@bakerhughes.com)
• Martin Riviere, Retired Geophysicist (martinriviere@btinternet.com)
• Angelika-Maria Wulff, Consultant (gp.awulff@gmail.com)
EAGE EDITOR EMERITUS Andrew McBarnet (andrew@andrewmcbarnet.com)
PUBLICATIONS MANAGER
Hang Pham (publications@eage.org)
MEDIA PRODUCTION
Saskia Nota (firstbreakproduction@eage.org) Ivana Geurts (firstbreakproduction@eage.org)
ADVERTISING INQUIRIES corporaterelations@eage.org
EAGE EUROPE OFFICE
Kosterijland 48 3981 AJ Bunnik
The Netherlands
• +31 88 995 5055
• eage@eage.org
• www.eage.org
EAGE MIDDLE EAST OFFICE
EAGE Middle East FZ-LLC
Dubai Knowledge Village Block 13 Office F-25 PO Box 501711
Dubai, United Arab Emirates
• +971 4 369 3897 middle_east@eage.org
• www.eage.org
EAGE ASIA PACIFIC OFFICE
UOA Centre Office Suite 19-15-3A No. 19, Jalan Pinang 50450 Kuala Lumpur
Malaysia +60 3 272 201 40
• asiapacific@eage.org
• www.eage.org
EAGE AMERICAS SAS Av. 19 #114-65 - Office 205 Bogotá, Colombia
+57 310 8610709
• +57 (601) 4232948
• americas@eage.org
• www.eage.org
EAGE MEMBERS CHANGE OF ADDRESS NOTIFICATION
Send to: EAGE Membership Dept at EAGE Office (address above)
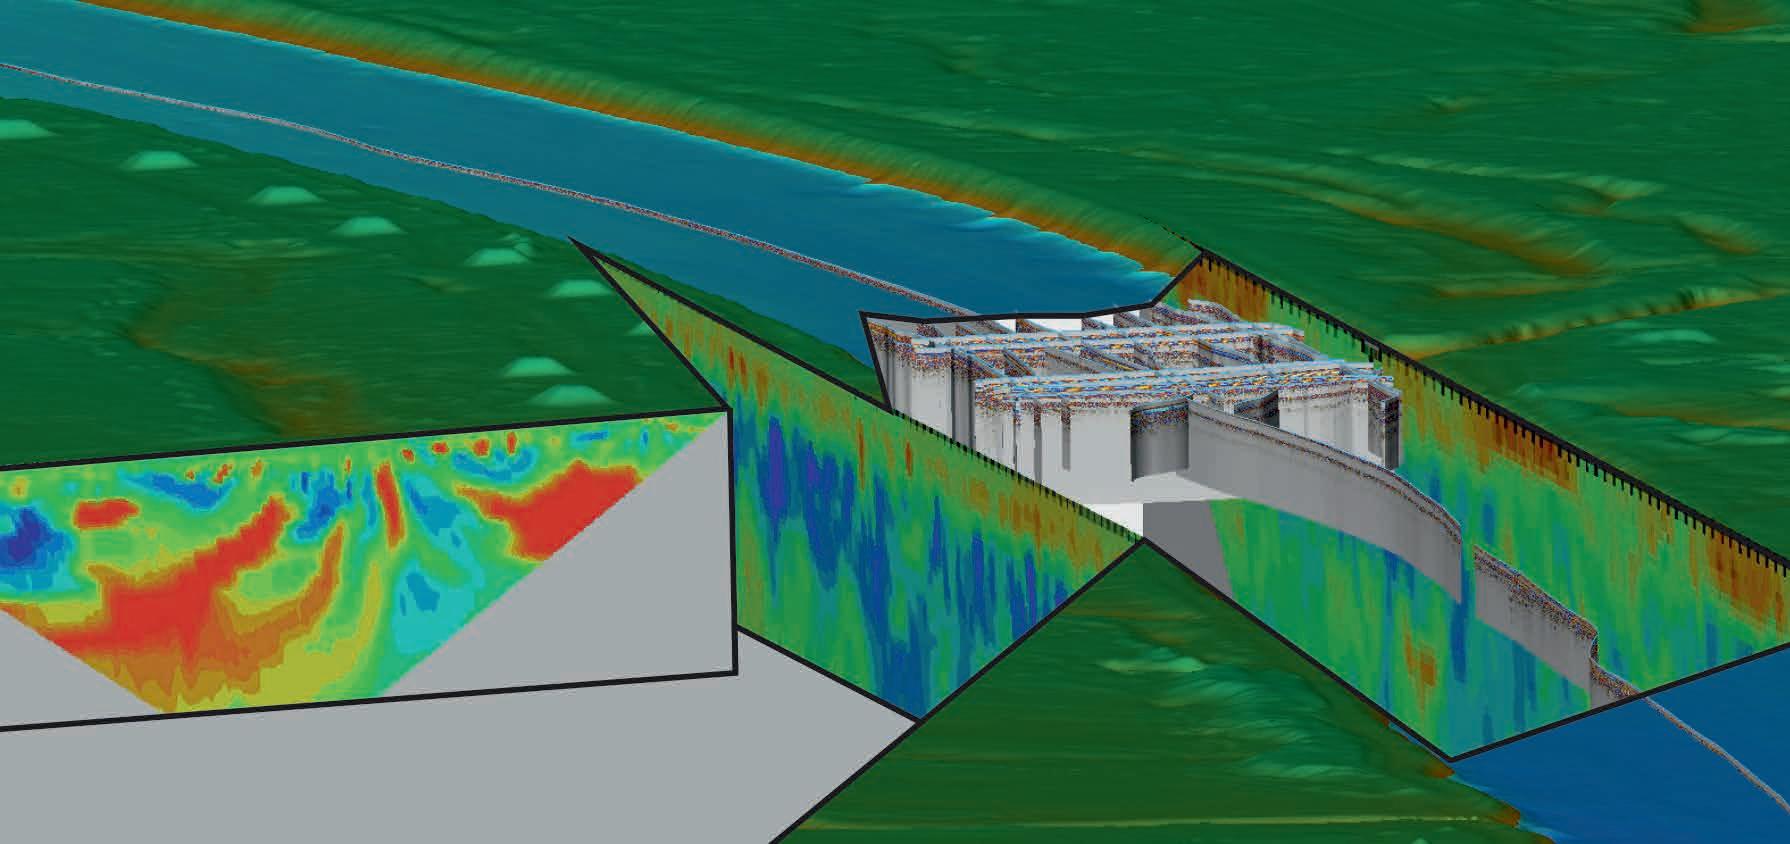
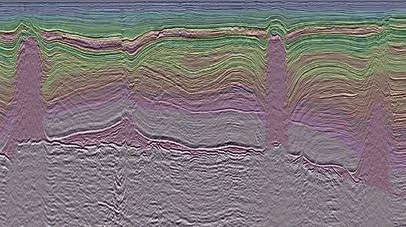
Geophysical description of a groundwater aquifer using the combination of geoelectric measurements and sub-bottom profiling.
(print) /
29 Noise Attenuation on SEAM002 Arid Model data Mamadou S. Diallo and Nacim Brika
37 A novel simulator for probing water infiltration in rain-triggered landslides Cassiano Antonio Bortolozo, Tatiana Sussel Gonçalves Mendes, Daniel Metodiev, Maiconn Vinicius de Moraes, Harideva Marturano Egas, Marcio Roberto Magalhães de Andrade, Tristan Pryer and Luana Albertani Pampuch
45 Revisiting Baranov’s thoughts on mathematics and geophysical interpretation Brian Russell
49 Geophysical description of a groundwater aquifer using the combination of geoelectric measurements and sub-bottom profiling Christoph Georg Eichkitz, Marcellus Gregor Schreilechner and Erwin Heine
55 Delivering sands to Venus and all the traps between: Orange Basin, Namibia Neil Hodgson, Lauren Found and Karyna Rodriguez
59 Integrating regional 2D seismic mapping and 3D seismic spectral decomposition to understand the fairway evolution of offshore Benin Pauline Rovira
65 Deep learning-based Low Frequency Extrapolation: Its implication in 2D Full Waveform Imaging for marine seismic data in the Sadewa Field, Indonesia
Sonny Winardhi, Asido S. Sigalingging, Wahyu Triyoso, Sigit Sukmono, Ekkal Dinanto, Andri Hendriyana, Pongga D. Wardaya, Erlangga Septama and Rusalida Raguwanti
73 Revealing the hidden paleomagnetic information from the airborne total magnetic intensity (TMI) data
Michael S. Zhdanov, Michael Jorgensen and John Keating
79 Application of simultaneous inversion of velocity and angle-dependent reflectivity in frontier exploration
Nizar Chemingui, Sriram Arasanipalai, Cyrille Reiser, Sean Crawley, Mariana Gherasim, Jaime Ramos-Martinez and Guanghui Huang
85 Why numbers matter
Doug Crice
86 Calendar
cover: A 3D spectral decomposition image of the Upper Miocene offshore Benin, revealing a channelised fairway originating from a Niger Delta source to the east. (photo courtesy of TGS)
Andreas Aspmo Pfaffhuber Chair
Florina Tuluca Vice-Chair
Esther Bloem Immediate Past Chair
Micki Allen Contact Officer EEGS/North America
Hongzhu Cai Liaison China
Deyan Draganov Technical Programme Officer
Eduardo Rodrigues Liaison First Break
Hamdan Ali Hamdan Liaison Middle East
Vladimir Ignatev Liaison CIS / North America
Musa Manzi Liaison Africa
Myrto Papadopoulou Young Professional Liaison
Catherine Truffert Industry Liaison
Mark Vardy Editor-in-Chief Near Surface Geophysics
Yohaney Gomez Galarza Chair
Johannes Wendebourg Vice-Chair
Lucy Slater Immediate Past Chair
Wiebke Athmer Member
Alireza Malehmir Editor-in-Chief Geophysical Prospecting
Adeline Parent Member
Matteo Ravasi YP Liaison
Jonathan Redfern Editor-in-Chief Petroleum Geoscience
Robert Tugume Member
Anke Wendt Member
Martin Widmaier Technical Programme Officer
Carla Martín-Clavé Chair
Giovanni Sosio Vice-Chair
SUBSCRIPTIONS
First Break is published monthly. It is free to EAGE members. The membership fee of EAGE is € 80.00 a year including First Break, EarthDoc (EAGE’s geoscience database), Learning Geoscience (EAGE’s Education website) and online access to a scientific journal.
Companies can subscribe to First Break via an institutional subscription. Every subscription includes a monthly hard copy and online access to the full First Break archive for the requested number of online users.
Orders for current subscriptions and back issues should be sent to First Break B.V., Journal Subscriptions, Kosterijland 48, 3981 AJ Bunnik, The Netherlands. Tel: +31 (0)88 9955055, E-mail: subscriptions@eage.org, www.firstbreak.org.
First Break is published by First Break B.V., The Netherlands. However, responsibility for the opinions given and the statements made rests with the authors.
COPYRIGHT & PHOTOCOPYING © 2024 EAGE
All rights reserved. First Break or any part thereof may not be reproduced, stored in a retrieval system, or transcribed in any form or by any means, electronically or mechanically, including photocopying and recording, without the prior written permission of the publisher.
The publisher’s policy is to use acid-free permanent paper (TCF), to the draft standard ISO/DIS/9706, made from sustainable forests using chlorine-free pulp (Nordic-Swan standard).

Every year at the EAGE Annual Conference, the EAGE Awards are presented to honour individuals who have demonstrated outstanding dedication to geoscience, engineering, and the EAGE community. Candidates for the 2024 Awards were nominated by colleagues like you. These nominations were submitted to an international Awards Committee, which diligently worked to select the winners. EAGE is delighted to announce the following exceptional recipients for the 2024 Award winners.
Desiderius Erasmus Award
For lifetime contributions in the field of resource exploration and development.
Presented to Philip Ringrose
For his contributions ranging from characterising reservoir structure to developments in CCS and large-scale CO2 storage projects.
Honorary Membership Award
For highly significant and distinguished contributions to the geoscience community at large or to the Association in particular.
Presented to Leo Eisner

For transferring technology from global seismology to passive seismic applications, for pioneering microseismicity for reservoir monitoirng, and for his continuous support of the EAGE community.
Alfred Wegener Award
For outstanding contribution to the scientific and technical advancement of EAGE’s disciplines, particularly petroleum geoscience and engineering.
Presented to Baojun Bai
For his contributions to petroleum geoscience and engineering, particularly for the development of preformed particle gel for conform ance control and many research activities.
Conrad Schlumberger Award
For outstanding contributions to the sci entific and technical advancement of the geosciences, particularly geophysics.
Presented to Alireza Malehmir
For his contributions to near surface geoscience, particularly to address critical challenges in mineral exploration and CCUS geophysics.
Arie van Weelden Award
For Young Professionals who have made highly significant contributions to one or more of the disciplines in our Association.
Presented to Grazia de Landro

For her work on induced seismicity related to underground industrial activities, critical for energy security and decarbonisation.

EAGE Awards stand at the core of the Association’s mission, promoting innovation and technical progress for inclusive and sustainable development.
We congratulate Prof Mike Stephenson for winning our Best Instructor Recognition 2023 bestowed by the EAGE Education Committee for his outstanding delivery of his course Basics of Carbon Capture. By filling a crucial gap in the education of carbon capture and storage (CCS), Stephenson’s course extends beyond the technical elements to encompass wider scientific, financial, planning, and social aspects. His integral approach addresses the critical issues that can significantly impact CCS projects.
Maren Kleemeyer, EAGE Education Officer, comments: ‘CCS is essential for achieving a low-carbon future. Providing upskilling in this area equips EAGE members with vital knowledge for a sustainable future. We’re delighted to offer attractive courses like Mike Stephenson’s in our short course portfolio.’
Stephenson identified a gap for comprehensive CCS education. ‘There are few courses on the wider science, risks, financing, planning, and social licence
aspects of CCS.’ His course aims to provide geologists, technical civil servants, planners, and investment organisations with a broad understanding of CCS, emphasising the importance of a multi-disciplinary approach.
In his course, participants learn about the global geological carbon cycle and the potential of CCS to contribute to carbon reduction. Through practical exercises and detailed discussions, the course covers the basics of CO2 transport, capture, and storage, as well as the challenges and solutions associated with these processes. Additionally, the course explores the policy and financial aspects of CCS projects, highlighting the importance of social licence including real-world examples of failed projects due to lack of public support.
Having taught the course globally, Stephenson addresses regional misconceptions and challenges. He emphasises the different perspectives on CCS across the world, from the ‘just green transition’ in Africa to the integration with enhanced oil recovery in the USA. By showcasing these diverse approaches, Stephenson helps participants understand the multi-faceted nature of CCS.
To keep his course materials current, Stephenson immerses himself in a wide
range of sources, including peer-reviewed papers, policy documents, regional assessments, and social media posts.
Looking ahead, Stephenson plans to expand his offerings to include courses on the development of decarbonisation clusters. These clusters, comprising groups of industries working together to decarbonise, represent a shift from traditional oil and gas projects to more collaborative and complex ventures. In his view, ‘The stakeholder range and complexity is very different from a normal oil and gas project’. His future courses will explore how these clusters are organised, funded, promoted by governments, and structured to succeed.
Prof Stephenson, now with his own consultancy, was a long time scientist with the British Geology Society (BGS) where he was executive chief scientist (2019-2021) and leader of the BGS ‘Decarbonisation and Resource Management’ Challenge. He has served as an adviser on energy topics to governments in the UK and worldwide.
Find out more about the course at learninggeoscience.org.
Delve into our education portfolio!
BY G. WACH AND M. DUSSEAULT


See the latest jaw dropping DUG MP-FWI IMAGING results for yourself at EAGE 2024.


DUG MP-FWI Imaging completely replaces the conventional processing and imaging workflow, delivering high-resolution reflectivity images for both structural and quantitative interpretation using field-data input. Superior physics. Faster turnaround. Unsurpassed imaging. Now that’s game changing! We’ll be showcasing all the latest results at EAGE 2024 from booth #3200. Reach out to sales@dug.com to connect with our team or drop by to see the daily presentation schedule.
dug.com


Preview our latest showcase for yourself here or visit dug.com
Addressing all students! The 5th EAGE Global Energy Transition Conference and Exhibition (GET 2024) in Rotterdam brings together a global community of geoscientists, engineers, researchers, and industry professionals. This year’s conference is packed with a diverse range of activities, including presentations, workshops, and interactive sessions that are designed to expand your knowledge and inspire innovative thinking.
You will have the chance to attend talks by industry leaders and renowned experts, offering you a unique perspective on the energy transition challenges and opportunities within the geoscience field. Hands-on workshops will provide practical experience with the newest tools and techniques, helping you to bridge the gap between theoretical knowledge and realworld application.
connect with professionals, researchers, and fellow students from around the world. The conference also offers numerous activities specifically designed for students such as the ‘The Geosciences and the Energy Transition Challenge’ course that provides a comprehensive understanding of the Energy Transition’s technical, economic, and societal aspects. Students will develop plans for carbon capture and storage and
geothermal projects, comparing them to oil fields. The course combines lectures, teamwork, and discussions focusing on practical examples. Scheduled during the conference, it will provide valuable insights for earth scientists, engineers, and policymakers. You can also present your research and receive constructive feedback from experienced professionals during dedicated student sessions.
Participate in the student networking session, where you can build meaningful connections in a casual and supportive environment. Engage with industry leaders during interactive Q&A panels, and gain insights that can guide your academic and career choices.
Our student community gains access to all sessions in the registration area, including the Poster Session and Mineral Exploration Symposium, plus entry to the GET Exhibition floor - all for free! We encourage you to secure your spot early, as spaces are limited and highly sought after. To make the most of this incredible opportunity, visit www.eageget.org to register and access detailed information about the event schedule, speakers, and more.


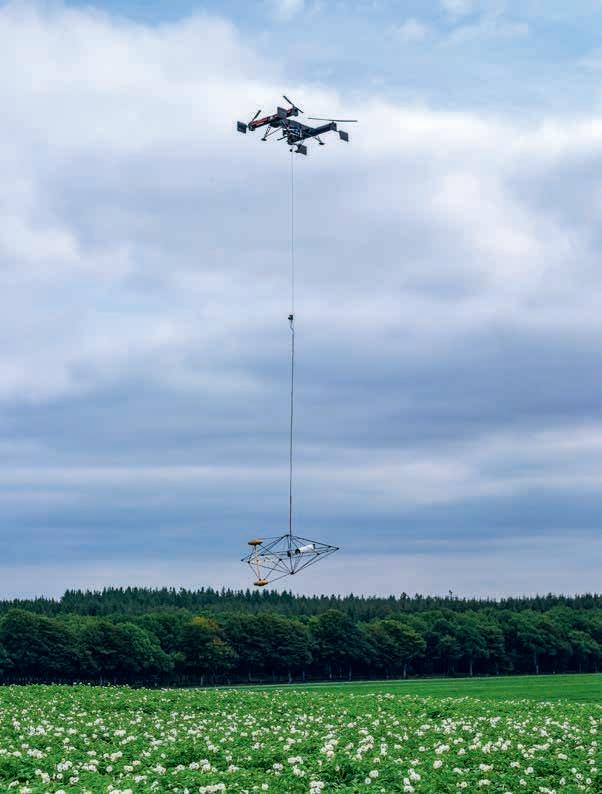
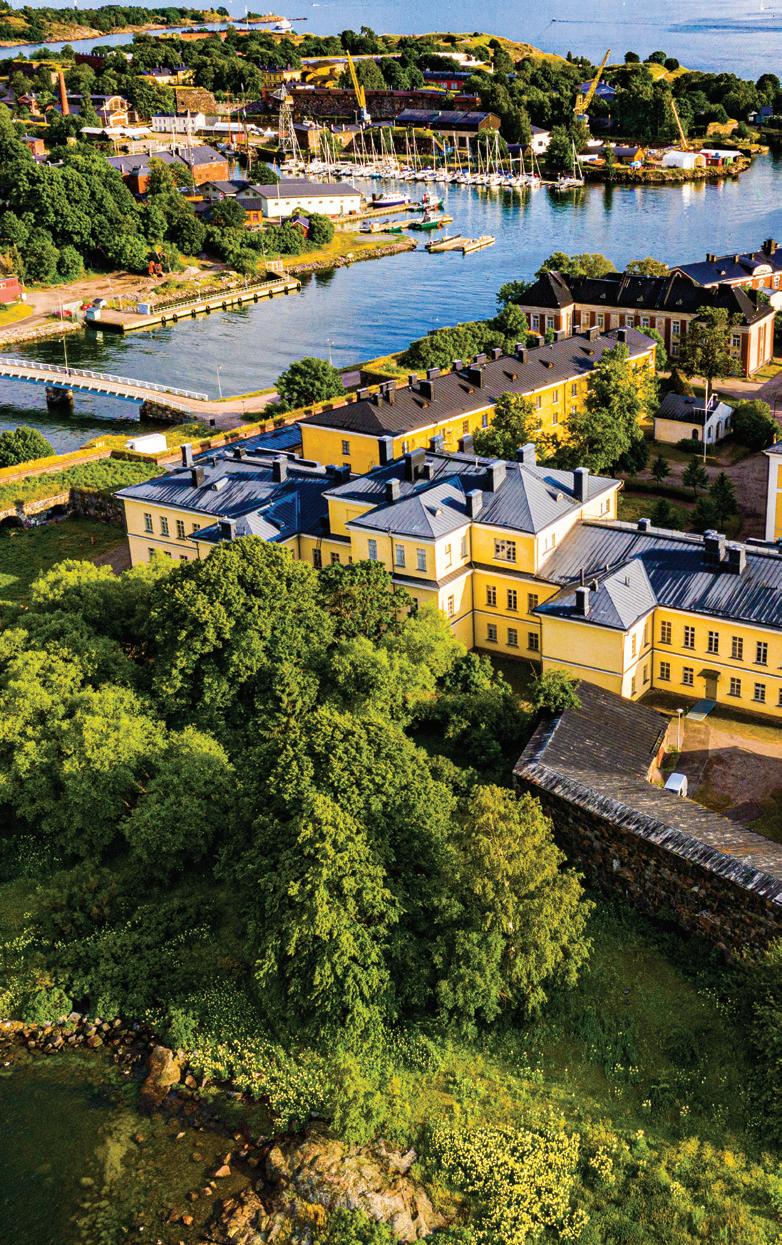
Our 4th Conference on Airborne, Drone and Robotic Geophysics will again be a highlight at the Near Surface Geoscience Conference & Exhibition 2024 (NSG2024)
taking place from September 8-12 in Helsinki. The conference will be one of the three distinct parallel programmes, offering a unique opportunity to explore various areas of geoscience in one place.
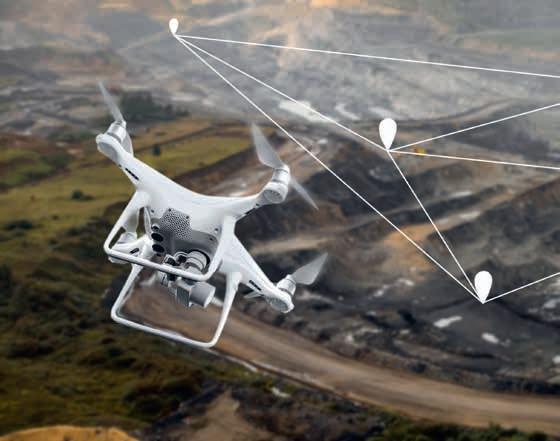
The 4th Conference on Airborne, Drone and Robotic Geophysics is dedicated to exploring the latest innovations and advancements in geophysical acquisition technologies that go beyond traditional ground-based methods. With the rapid development of very-near-surface systems and the introduction of drone- and robotics-based acquisition methods, the gap between ground-based and airborne geophysical techniques is closing. This conference serves as a platform to present success stories, discuss current limitations, and explore future directions for modern geophysics.
Participants can expect to be immersed in cutting-edge technology, with presentations on the latest innovations in hardware and algorithms for airborne and robotic geophysics. Additionally, complex case studies will be discussed, showcasing how these technologies are being applied to overcome the limitations of traditional methods. The conference will cover a
wide range of industry topics, from rock physics of mineral deposits to seismic methods in mineral exploration.
Attending this event offers a unique opportunity for both professionals and students, an excellent occasion for networking and connecting with industry leaders, academics, and peers to share knowledge and experiences.
This is your opportunity to join the vibrant and innovative NSG2024 community in Helsinki. Registration is now open for the conference with an all-access pass. For more information and registration, visit www.eagensg.org.
Are you driven by the possibilities of digital transformation, predictive analytics, and the integration of digital twins in the energy sector? If so, make sure to save the dates of 15-16 October 2024 for the EAGE Conference in Kuala Lumpur on Energy Excellence: Digital Twins and Predictive Analytics.
Spanning a wide array of topics, the conference will immerse you in the latest advancements and best practices in digital excellence. Whether you’re a veteran professional aiming to keep ahead of industry shifts or an emerging researcher looking for inspiration, this event promises to deepen your knowledge and expand your connections within the global energy community.
Seize this unique chance to elevate your professional journey while enjoying the vibrant atmosphere of Kuala Lumpur. Join us in spearheading the digital transformation of the energy sector and positioning yourself at the forefront of innovation

and sustainability. Don’t miss out on this opportunity to make a significant impact in your field.
Learn more about this event and abstract submission information by scanning the QR code.
Scan the QR code!
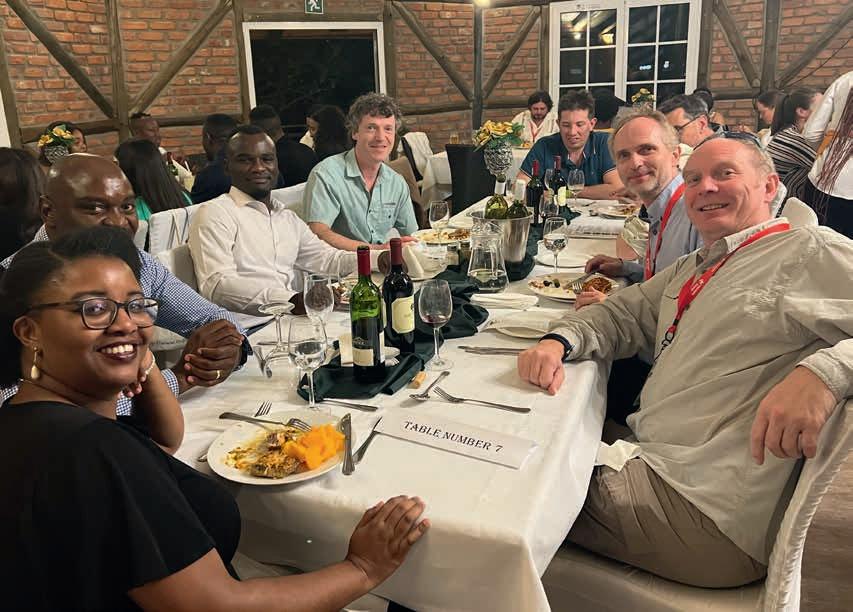
Report on our biannual EAGE Sub-Saharan Africa Energy Forum held on 4-6 March in Windhoek, Namibia.
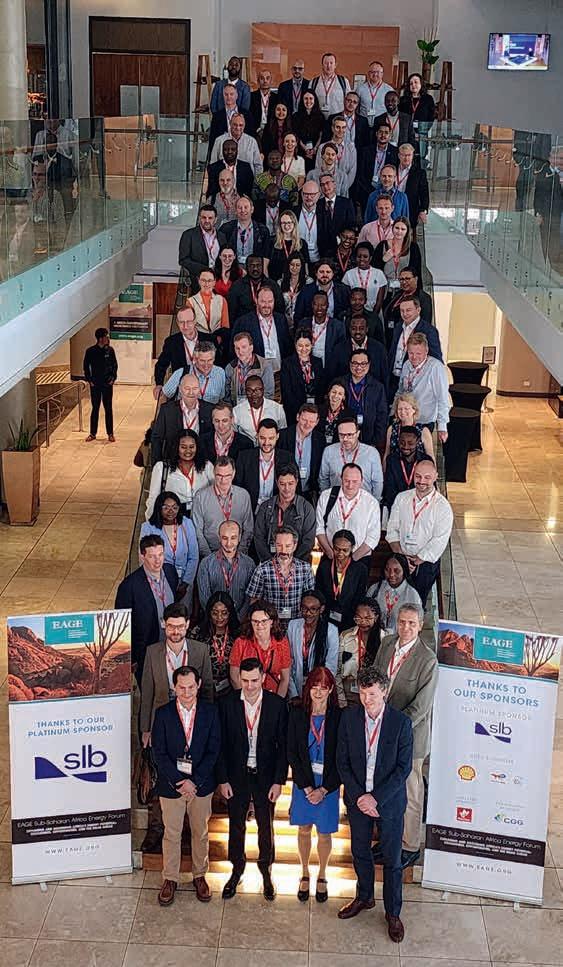
Namibia’s capital city Windhoek was chosen as a dynamic and exciting location to host our forum. Reflecting the high industry interest, sponsorship was generously provided by several key companies active in the region: SLB, Shell, TotalEnergies, Woodside and CGG. Furthermore, the 96 local and international delegates in attendance from a broad range of IOC, NOC, technical contractors, regulatory, consultancy, media and academic backgrounds was a record for this event.
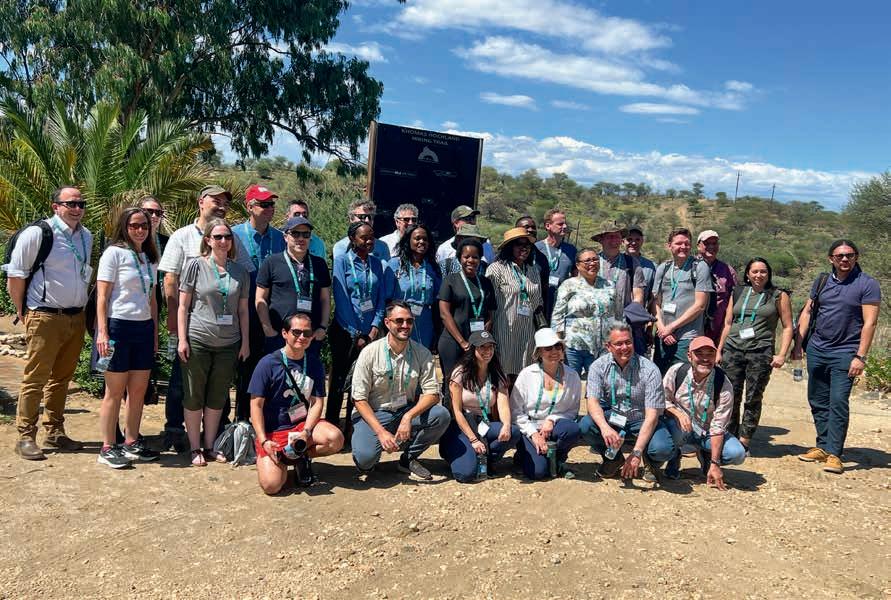
In addition to a memorable Icebreaker involving a safari game drive and sundowners on the plains outside
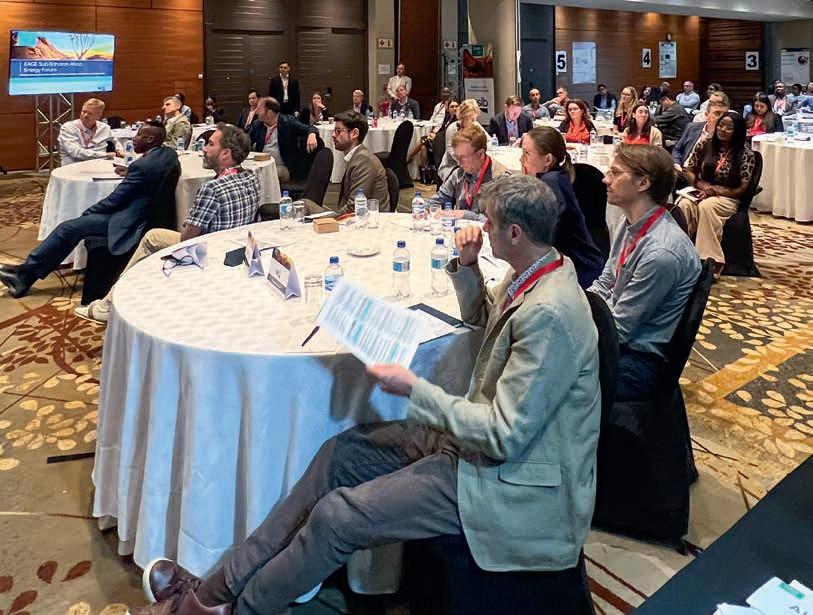
the capital, the delegates enjoyed and actively participated in the three-day technical programme, held in the centrally located Hilton Hotel, covering the extensive Sub-Saharan region. Technical sessions were split geographically into Namibia and related basins, and the wider margins of West and East Africa, with each comprising keynotes, presentations, posters, and moderated panel discussions covering a broad range of exploration and developments topics. These were predominantly subsurface, geological and geophysical focused, including petroleum systems and play evaluation, key wells and projects, latest data, digitalisation and workflows, but also expanded into other non-technical aspects of the energy transition, the future role of frontier exploration in the region, the significant above ground challenges facing some projects, and the wider role of geosciences in the future. These all ensured for a wide range of positive, open debates and discussions throughout the event proceedings.
The event was opened by Victoria Sibeya (executive upstream exploration at Namcor) with a summary of Namibia oil and gas exploration history highlighted by recent discoveries. This opening talk introduced the first session of the forum on ‘Revival of Orange Basin and Beyond’ which lasted the entire day.
The session started with a keynote from Benjamin Gatignol (exploration manager, TotalEnergies) on the recent successes in Namibia including the Venus discovery and upcoming operations. This talk was followed by eight presentations covering the basin history, geologic evolution, and extension of successful plays. A presentation from Westwood entitled ‘From Tupi to Liza and Beyond’ covering significant global exploration drilling results since 2007
gave good context and comparison to the recent Namibian discoveries. According to operators, seismic contractors and academics, similar prospects can be mapped to the north in the Luderitz and Walvis basins as well as across the border in South Africa. It suggests that exploration along the Southern African margin is just getting started.
A second keynote from Adeleye Falade (Shell country chair Namibia) highlighted the recent discoveries and continued impressive operational results of Shell’s exploration and appraisal drilling campaign since the Graff discovery. The session ended with a keynote from Guido Paparoni (Kudu asset manager, BW Energy) on recent learnings and revisions on the geological model of the Kudu field based on a newly acquired 3D survey.
To finish the day Bryan Gill moderated an insightful panel discussion on the Orange Basin. The panellists were Benjamin Gatignol (TotalENergies), Guido Paparoni (BW Energy), Anthony Fieles (PASA), and Aune Amutenya (Namibian Ministry of Mines and Energy). The conversations addressed the specifics of exploring the Orange basin and the companies’ future projects. This proved to be a very well-received format which stimulated more interaction, provided a longer time to explore and link the topics and allowed for a deeper and more meaningful learning experience.
The second day consisted of two sessions covering western Africa: 1) Exploration in mature and frontier West African basins and 2) Digitalisation, New Technology and Modelling. The morning started with a keynote from Lises Salles (TotalEnergies) on a recent Nigerian case study of Ntokon discoveries on OML 102. The talk on Ntokon was a positive example of fast-paced exploration in a mature basin and a great
introduction for Session 2 on ‘Exploration in mature and frontier West African Basins’. The session consisted of eight talks which provided a great update on the most recent operational and technical projects in the region. Exploration driven seismic campaigns in Benin, Nigeria and Angola reveal the extension of deepwater prospectivity into the most outboard domains. There were good examples of stitching 3Ds and integrating with other datasets to build regional play and prospect understanding, and PASA’s presentation on contourite influenced systems in Mozambique demonstrated the use of analogues in understanding prospective reservoirs in South Africa.
The third session was dedicated to Digitalisation, New technologies and Modelling. Several outstanding case studies were presented including CSEM, seismic interpretation using machine learning, 4D processing workflows, and seismic characterisation demonstrating latest technology development to support geoscience projects and decision-makers.
The technical sessions ended with a panel discussion moderated by Peter Elliott (NVentures) on Near Field Exploration and Production in Western Africa. The panellists were Vincent Curinier (TotalEnergies), Musa Jato (NUPRC) and Meciano Lorenzo (Eni).
The last day was dedicated to exploration and development in East Africa (Session 4) and was introduced by a
keynote from Peter Elliott on the oil and gas activities in this region. Six papers addressed the variety of geological settings and their associated challenges. These included onshore, shallow fields such as Tilenga, that require creative use of seismic processing to improve imaging, and examples from deepwater where seismic suggests the existence of untapped reservoirs, with reworking by contour currents and complex tectonic history challenging the interpreters. A review by S&P Global of six ongoing developments highlighted the above ground challenges that remain in the region, and the session ended with an overview by Westwood of key upcoming wells as a view going forward for the wider Africa region
and its clear exploration significance globally.
The event concluded with group discussions on the main themes and points made during the three days, in which delegates grouped according to which topic interested them most, discussed what their key takeaways were, and summarised them to the wider audience. This proved a good way for everyone to gather their thoughts at the end, and effectively distil and collectively encapsulate the diverse, wide-ranging topics covered. Judging by the survey feedback, the event was well received and enjoyed, being in Namibia was a great experience for many, and you could sense the excitement in all going on currently in the region.
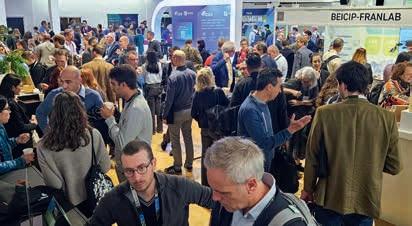
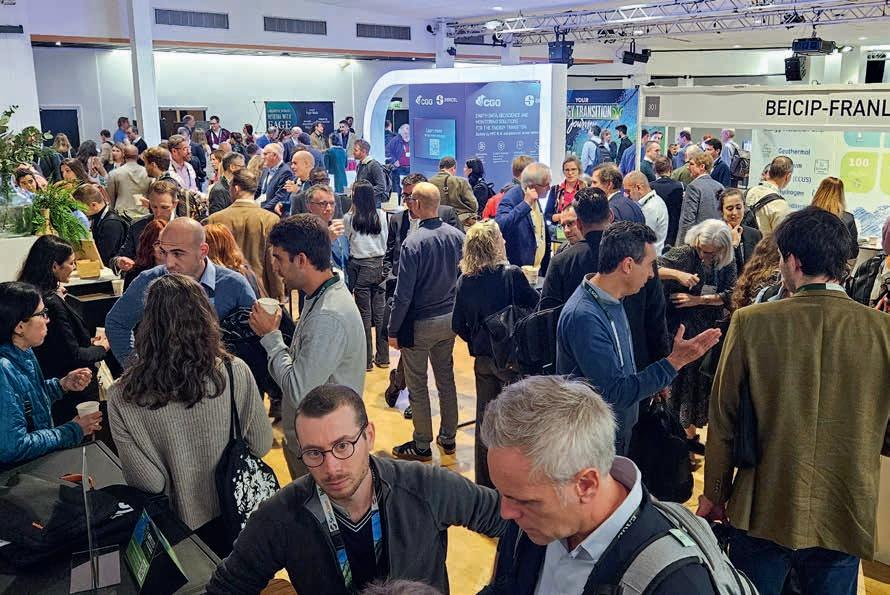
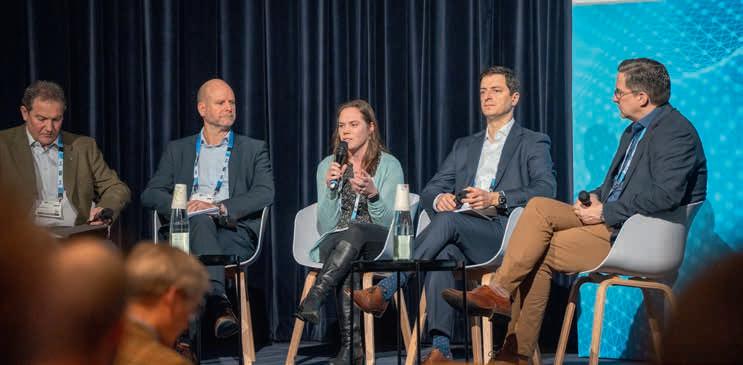
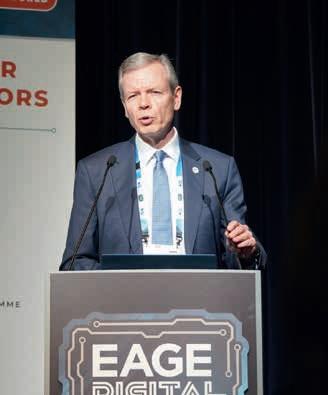
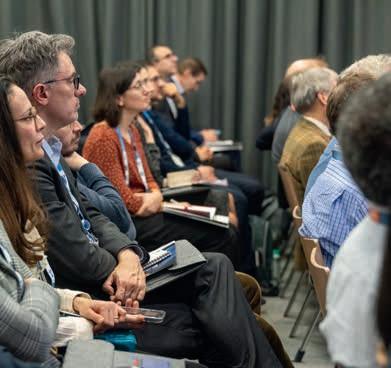
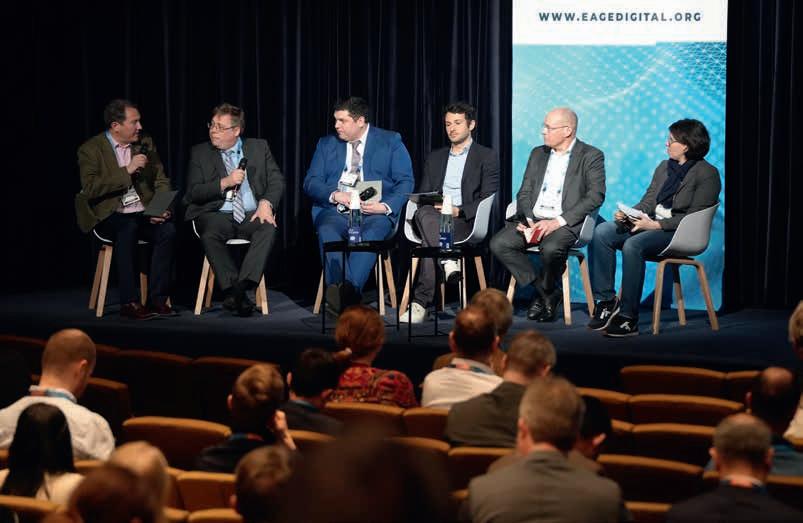
EAGE Digital, our flagship event, addresses the transformative impact of digitalisation, technology, and innovation in the energy sector. The fourth edition of EAGE Digital was successfully held on 25-27 March 2024 in Paris, France, under the theme ‘Delivering energy in a transforming world’.
The event witnessed rapid growth, strong enthusiasm, and ambition for scaling the benefits of digitalisation. Attendees from around the globe gathered to explore, discuss, and collaborate on the latest advancements and challenges in the digital transformation of the energy industry. The vibrant atmosphere was a testament to the collective commitment and excitement within the community. We extend our heartfelt thanks to all participants, sponsors, exhibitors, speakers, and committees for contributing to this year’s success.
Gautier Baudot, vice president exploration excellence & transformation, TotalEnergies, and chair of EAGE Digital 2024, highlighted the importance of the event: ‘EAGE Digital is very important because it’s one of the unique occasions where we can gather all the industry actors, including industry operators and service providers. We also included universities and schools to encompass the whole ecosystem, which is essential for delivering solutions to our challenges. Participating in the digital transformation helps us face these challenges.’
Edward Wiarda, EAGE president 2023-24, said: ‘My key takeaway, something that transpired through all the technical sessions and also the strategic programme was that there is a clear urgency from both the digital realm, the energy sector and all its players to accelerate digital transformation.’
The conference explored digitalisation as a crucial catalyst for innovation and the necessary transformation of the industry through the energy transition. It featured an array of sessions, including keynotes, case stories, panels, and roundtables. Kaveh Dehghan, digital and innovation manager, TotalEner-
gies noted: ‘I see three different topics. The first one is the deployment of low-code platforms for the whole the industry. Integration of data scientists inside geoscience and reservoir teams is also very interesting. The second is the rise of large language models (LLMs) since last year. This is amazing and we can see how this technology can be used to bring in new use cases for our industry. Thirdly, somehow correlated with LLMs, is the very marked accelerated pace of deployment of these solutions. We can see the need to accelerate and this becomes more and more clear.’
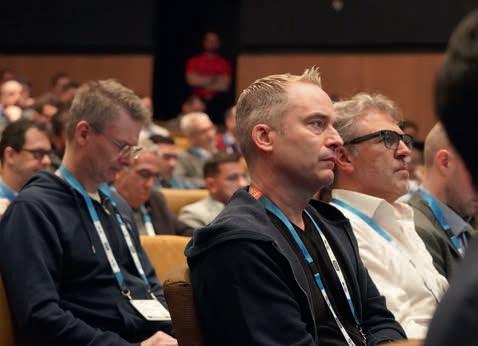

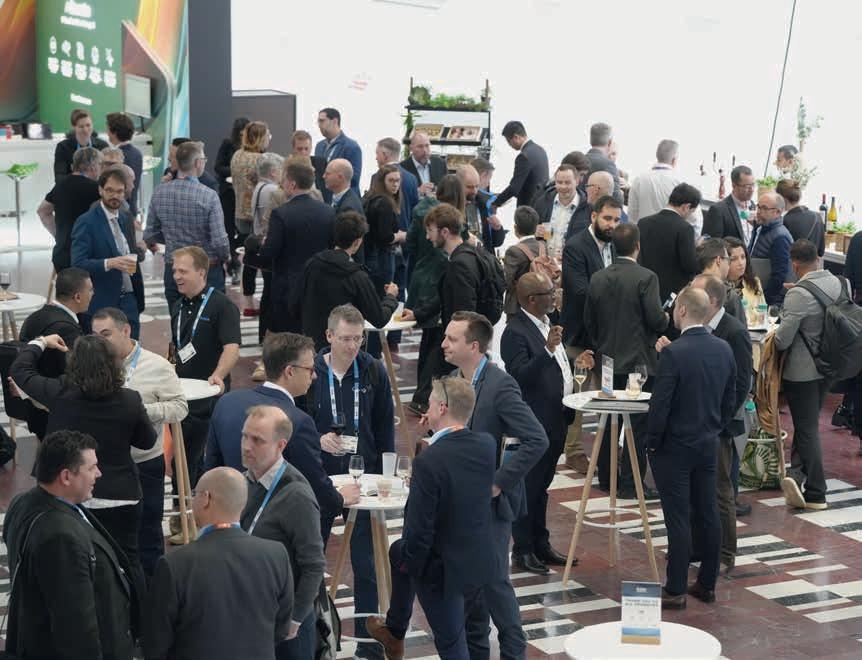
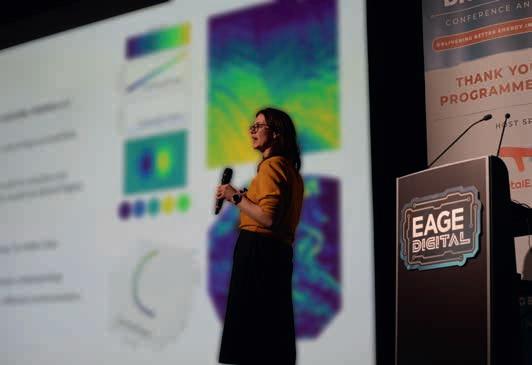
Experts shared their insights on leveraging digital tools and technologies to enhance efficiency, sustainability, and profitability in energy operations. The exhibition served as a specialised marketplace where companies could display their latest technologies, innovative services, and solutions to challenges posed by digital transformation. The bustling exhibition floor was filled with demonstrations and interactive displays, allowing attendees to experience first-hand the innovations driving the industry forward.
Cerys James, VP transformation & change, PGS, remarked that conferences like EAGE Digital are crucial for sharing information, networking, collaborating, and learning what works well and, importantly, what doesn’t, to avoid repetitive mistakes in our industry.’ Over 100 technical presentations provided insights into various digitalisation initiatives at the crossroads of geoscience, engineering, data science, and energy transition. Key topics included applied analytics, machine learning, digital subsurface, carbon capture and storage (CCS), and overall energy transition efforts. Discussions underscored the benefits and challenges associated with integrating digital technologies in these areas, and the importance of partnerships like OSDU data platform.
The Strategic Programme addressed a broad range of organisational and leadership issues. Embracing new technologies in geoscience meant inventing new ways of working and collaborating closely with non-traditional partners to drive innovation and create resilient companies. Discussions were driven by key daily themes, such as new ways of working, data and tools, and empowering people through digital. Leaders from various sectors shared their strategies for fostering a culture of innovation and resilience within their organisations, highlighting the role of leadership in navigating the digital era.
We are already excited for the 5th EAGE Digitalization Conference and Exhibition taking place from 24-26 March 2025 in London, UK, which promises to be yet another extraordinary event that will continue the momentum.

‘The conference was the realisation of just how much is happening in digitalisation that I wasn’t aware of. It’s a massive effort spanning from data preparation and collation to the development of innovative technologies aimed at solving end-user problems efficiently. This process helps us focus more on problem-solving rather than daily data management. This conference covers a broad range of digitalisation topics, from data management to applications for end-users. It’s particularly beneficial for the younger members of our industry who are the ultimate end-users.’
Lindsey Smith Geophysicist, BP
‘My key takeaway for the conference is very much the importance of data foundation. We talked a lot about the power of GenAI, the power of integration, the power of visualisation of data, to really get key insights, to underpin the investment decisions underpin the way we do our reservoir development. But fundamentally, if the data is not in the right shape or of the right quality. Actually GenAI rapidly becomes garbage in, garbage out. So actually really getting this data foundation solid was for me a key takeaway.’
Herlinde Mannaerts-Drew VP subsurface transformation and CCUS, BP
‘This EAGE Digital edition has been very interesting on the strategy side to see what the different companies were thinking, both from the operator side but also from the independent software vendors or even from the cloud providers. This has been a great opportunity to see where all the ecosystem is going and the evolutions through the different years of this conference.’
Camille Msika Principal Solution Consultant, AspenTech

‘I was excited this year to hear a lot about AI and what’s going on in that space. I think as an industry we always need to work faster and collaboration is really the only answer to get us there.’
Patrick Kelly
Product line manager – subsurface data & insights, Chevron
Maria Mutti (University of Potsdam) and Aus Al-Tawil (Aramco) report on the first cross-regional Europe and Middle East Symposium on Carbonates and Mixed Systems held in Palermo, Italy, a collaboration between EAGE and AAPG.
The recent AAPG Europe and Middle East first-of-its-kind cross-regional symposium held in Palermo (Italy), 22-24 April, in collaboration with EAGE, brought together experts from around the globe to discuss carbonates and mixed systems.
The symposium was co-chaired by Maria Mutti and Aus Al-Tawil, supported by a technical committee of experts and industry leaders from both regions. With a thematic focus on modern understanding and frontier applications, the symposium served as a nexus for both industry leaders like Aramco, Shell, ENI and MOL and global experts from academia to converge, discuss and chart pathways, while emphasising the critical role of fundamental concepts, technology, talent in different generations and AI applications in shaping a secure and sustainable energy future.
The event provided a platform for a deep dive into the fundamentals and the applications of carbonates and mixed carbonate systems with a rich and diverse range of presentations from around the world. This included seven plenary talks, 74 oral presentations in three parallel sessions, and 44 poster presentations. Andrea Cozzi (ENI) offered insights into carbonates of the Eastern Mediterranean: from a new hydrocarbon play to the energy transition, while Aus Al-Tawil (Aramco) discussed the future role of stratigraphy in realising subsurface energy resources in the age of sustainability. Cedric John (Queen Mary University of London) addressed how we can leverage computer vision and AI to enhance geological interpretations. Erwin Adams (Shell) discussed deployment and integration of advanced technologies in subsurface carbonate systems. Rick Sarg (Colorado School of Mines) offered unique insights on organic-rich lacustrine rocks encountered in the Green River formation, Western USA, and the pre-salt of Brazil; and Sam
Purkis (University of Miami) discussed recent data acquisition and climate modelling in the Red Sea rift. Christian Wilms (MOL) presented key subsurface engineering insights into carbonate reservoirs, and Attilio Sulli (University of Palermo) gave a full overview of the tectonic history and structural geology of Sicily.
Sessions included carbonate sedimentary systems as archives of earth system processes, carbonate lacustrine systems, organic and inorganic geochemistry, diagenesis, basin analysis, application of cross-disciplinary techniques and new technologies for carbonate fundamentals, integrated workflows, digitalisation and machine learning applications, virtual field trips, 3D visualisation and databases, reservoir management, pore-network characterisation and petrophysics and exploration/characterisation/development case studies and success stories.
A one-day trip to the Jurassic of Sicily preceded the Symposium, emphasising the drowning event in spectacular quarry scale outcrops, while showing textbook examples of Neptunian dikes and large Jurassic Ammonites in these cyclic carbonates. The trip finished with an overview of the geothermal Sciacca field. A half-day trip took participants to the unique Sicilian underground Messinian salt mines during the afternoon of the second symposium day.
A virtual field trip to Malaysia was also presented by Shell and transmitted from its offices to the symposium participants who chose to stay in Palermo. During the same afternoon, a primer course on carbonates was presented by Maria Mutti and Aus Al-Tawil and a workshop on leadership by Anita Csoma. Finally, a one-day field trip took place to the superb Messinian gypsum outcrops and to the Pliocene deep water car-
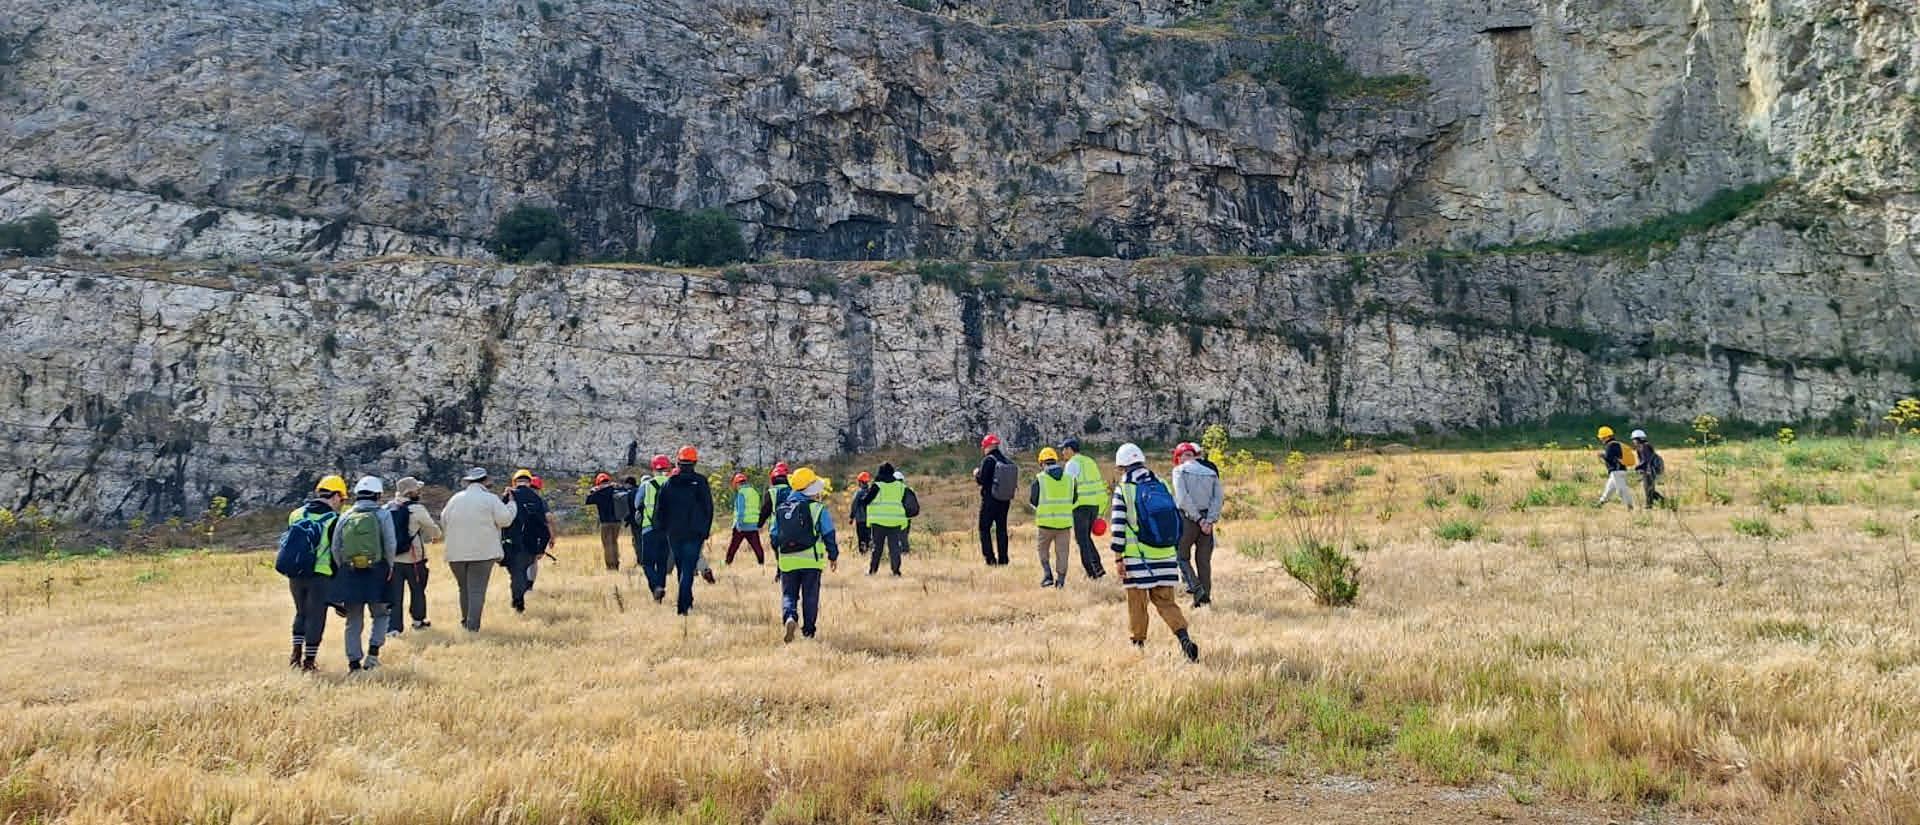
bonates with a complete record of Milankovitch orbital forcing controls.
Discussions highlighted challenges and opportunities, emphasising fundamental concepts and technological advancements as a central theme. Participants showcased innovative approaches from imaging techniques to AI-driven interpretation in basin analysis, diagenesis, and petrophysics. Delegates presented case studies demonstrating the successful application of cutting-edge technologies from a palm-size drone at the outcrop to advanced machine learning, while participants envisioned AI as a bridge between traditional geological fundamentals and emerging technologies, driving innovation towards efficiency, present and future.
The symposium also highlighted the differing applications of subsurface knowledge to the industry in Europe and the Middle East. The discussion highlighted the need for integrating renewable energy solutions to reduce the carbon footprint and promote sustainable development while stressing the continued importance of a broad energy mix to meet growing energy demands and support economic development.
The symposium underscored the critical importance of talent development and knowledge exchange in ensuring a sustainable future for the discipline signalling the need for collaborative efforts between academia and industry to attract students to the geosciences and to nurture a skilled workforce capable of addressing the evolving needs of the energy sector. Mentorship programmes, inter-disciplinary collaborations, and academia-industry partnerships were identified as key mechanisms for attracting and fostering talent development and retention.
A critical takeaway was to continue building a robust community that fosters joint participation from academic and industry experts. Such collaborations are essential for driving forward innovative research and practical applications that can address the multifaceted challenges of this sector. By maintaining a dialogue between academia and industry, it is possible to align research priorities with practical needs. This collaborative community can serve as a breeding ground for new ideas, facilitate the transfer of knowledge, and create opportunities for joint projects that
push the boundaries of current capabilities of the science and applications of carbonates and mixed carbonate systems.
The momentum developed by this first cross regional symposium should become a catalyst for a wider expansion of the community and to achieve all these objectives. Please look for the announcements for the second symposium later this year.
H1/2024
1400+
new event proceedings from 9 Events, including the 2024 EAGE Annual and EAGE Digital
250+
new journal articles from Basin Research, First Break, Geoenergy, Geophyscial Prospecting, Near Surface Geophysics, and Petroleum Geoscience

Geophysical Prospecting (GP) publishes primary research on the science of geophysics as it applies to the exploration, evaluation and extraction of earth resources. Drawing heavily on contributions from researchers in the oil and mineral exploration industries, the journal has a very practical slant. A new edition (Volume 72, Issue 6) will be published in July.
Editor’s Choice article:
Diving waves in acoustic factorized orthorhombic media — Kristoffer Tesdal Galtung and Alexey Stovas
Comparison of elastic anisotropy in the Middle and Upper Wolfcamp Shale, Midland Basin — Colin M. Sayers and Sagnik Dasgupta
Near Surface Geophysics (NSG) is an international journal for the publication of research and developments in geophysics applied to the near surface. The emphasis lies on shallow land and marine geophysical investigations addressing challenges in various geoscientific fields. A new edition (Volume 22, Issue 3) has beeen published in June, featuring 9 articles.
Editor’s Choice article:
Tunnel resistivity deep learning inversion method based on physics-driven and signal interpretability — Benchao Liu et al.
A new book by Tijmen Jan Moser, Geophysical Prospecting immediate past editor-in-chief, and the late Enders Robinson (1930-2022), one of the most distinguished geoscientists of his generation, explores the genius of 17th century Dutch scientist Christiaan Huygens.
In Walking with Christian, From Archimedes’ Influence to Unsung Contributions in Modern Science (History of Physics) published by Springer, Moser and Robinson claim that history has overlooked the groundbreaking contributions made by Hugyens (1629-1695) in the fields of mathematics, physics, astronomy, and geophysics. While two of the most famous achievements in physics are Newton’s theory of gravity and Einstein’s general theory of relativity, the authors argue that insufficient credit has been given to Huygens who provided central elements to these theories. The book sets out to correct that deficit. For example, they show how Huygens used symmetry arguments to derive conservation laws for momentum and for energy, and what Einstein later called the principle of equivalence to derive the formula for centrifugal force.
In 1689, Huygens visited Newton. Together, they walked the streets of London. Newton had recently finished his masterpiece, Principia, expounding his laws of motion and the law of universal gravitation. Huygens had essentially completed his life’s work by then, building on
Archimedes, Leonardo da Vinci, Galileo, Descartes, Fermat, Pascal and his own ingenuity. He had established fame as an instrument maker (telescope, pendulum clock, planetarium). He also independently invented the 31 tone system, pioneered the first principles of remote sensing, discovered the rings of Saturn, and formulated the wave theory of light.
What would walking mentally with Christiaan reveal? The book provides some answers in nine chapters covering spontaneous order, the speed of light, Huygens’ principle, the telescope, the pendulum clock, Huygens-Fresnel principle, special relativity, centrifugal force, and curvature. In addition, there is a chapter titled ‘What Huygens could have written on diffraction’ and a chapter on ‘Huygens and Geophysics’. Mentally walking with Christiaan, browsing his collected works – a true treasure trove for puzzle enthusiasts – and rethinking his ideas creates a vivid impression of scientific life in the 17th century, an appreciation that is remarkably similar to ours, in the process offering an understanding of Huygens’ significant and lasting contributions to science.

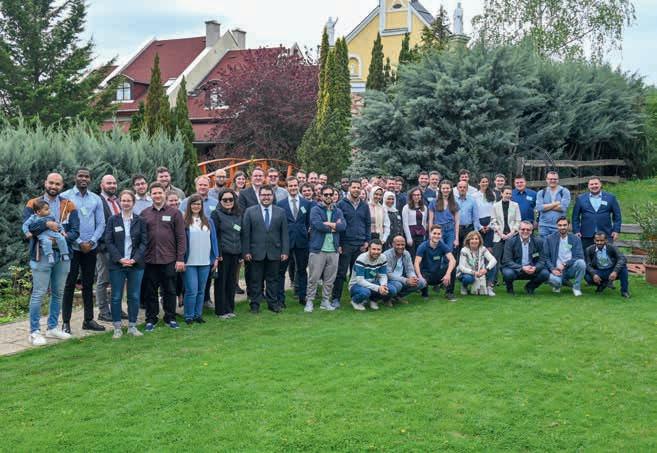
EAGE Local Chapter Hungary, in collaboration with the Association of Hungarian Geophysicists (AHG) and the Hungarian Geological Society (HGS), organised in April the 54th Meeting of Young Geoscientists held in Eger, Hungary – with prizes for the best presentations.
The event attended by some 50 participants set the spotlight on the latest research developed by university students and newly graduated specialists, geologists, and geophysicists (under 35 years of age), through a rich technical programme featuring 28 oral and 14 poster presentations ranging from the possibilities of hydrogen reservoir monitoring and geothermal projects, to rare elements and their mineralogy.
The lectures were evaluated by a six-member jury of recognised specialists. Prize winners were Péter Ábel Polyák (University of Szeged) - first prize oral presentation - theory; Ali Shebl (University of Debrecen), first prize oral presentation - practical, and Bálint Bodor (University of Szeged), first prize poster presentation. Thirteen additional special prizes were awarded by the corporate and non-profit sponsors to outstanding speakers.
The participants had the opportunity to get acquainted with the latest trends in earth sciences, exchange knowledge, and network with fellow colleagues. Thank you all for your participation! Stay tuned as next year’s edition will be announced soon!
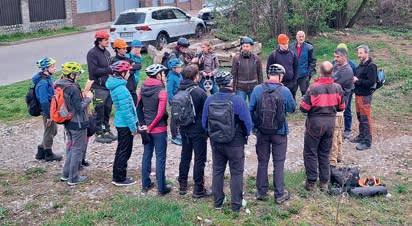
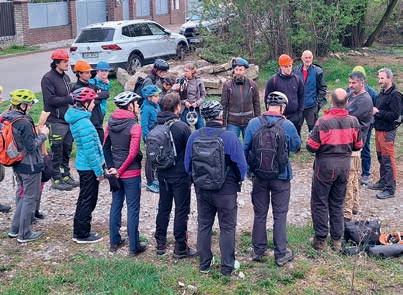
Our Local Chapter Czech Republic organised a special visit to the medieval mine Bílý Kůň located in the Hloubětín district of Prague. Some 20 excited participants gathered with flashlights and helmets in the evening of 3 April, together with a supervisor from the local mining authority.
The cycle helmets visible in the picture do not reflect the nature of this professional outing! But helmets were required by the mining authority to keep safe during the viewing of the abandoned mine.
MSc. Jeroným Lešner (Geotechnik, CZ) shared his personal research of the underground area and explained both the geological as well as the anthropogenic origin of this medieval site. The mine was started probably around the 18th century by sand diggers who found nice clean sand suitable for wood polishing.
The sand was initially mined in large pits but, when it became apparent that significant layers were present, the pits were extended sideways and approximately 12 m in depth. The supporting columns are irregularly spaced as the mining was an unorganised activity, e.g., the underground spaces were dug irregularly resulting in a beautiful underground maze carved in white soft sandstone. In the 20th century the space was partly extended and used as vegetable
storage space. However, the vegetable spiced with sand grains was not tasty enough and so it was shortly abandoned again. Various larger spaces of the cave have their own names and the participants were given a map of the maze and asked to find a way between Tomato and Chamber halls. After successfully completing their tasks, participants were keen to continue the exploration. Unfortunately, due to safety reasons, some of the halls, such as ‘Archive’ and ‘Beers’, were not accessible.
The future of this cave is probably more practical: the maze might be used as a training ground for safety teams.
Next on the agenda for our Chapter is the Vlastislav Červený Student Prize for the best Master or Bachelor thesis in applied geophysics: applications for this competition are currently open until 11 October 2024.
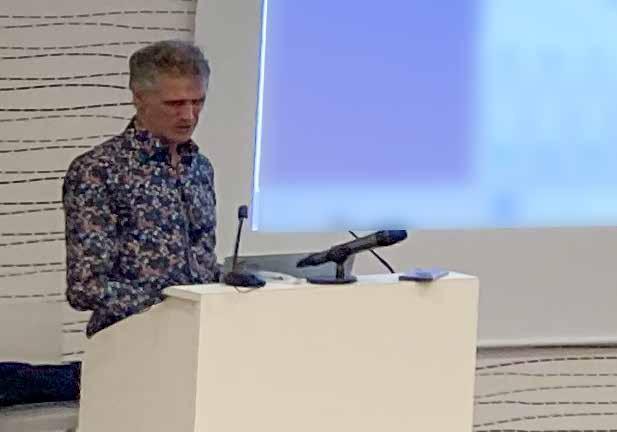
Seismic signal denoising was the topic on 18-19 April when EAGE Local Chapters London, Paris and Pau hosted a joint hybrid event. The speaker was Dr Claudio Strobbia (Realtimeseismic) who provided
who would only have either evening or lunch time slots free. Collective efforts of the three Local Chapters in promoting this event helped to draw the attention of a broad geoscience audience.
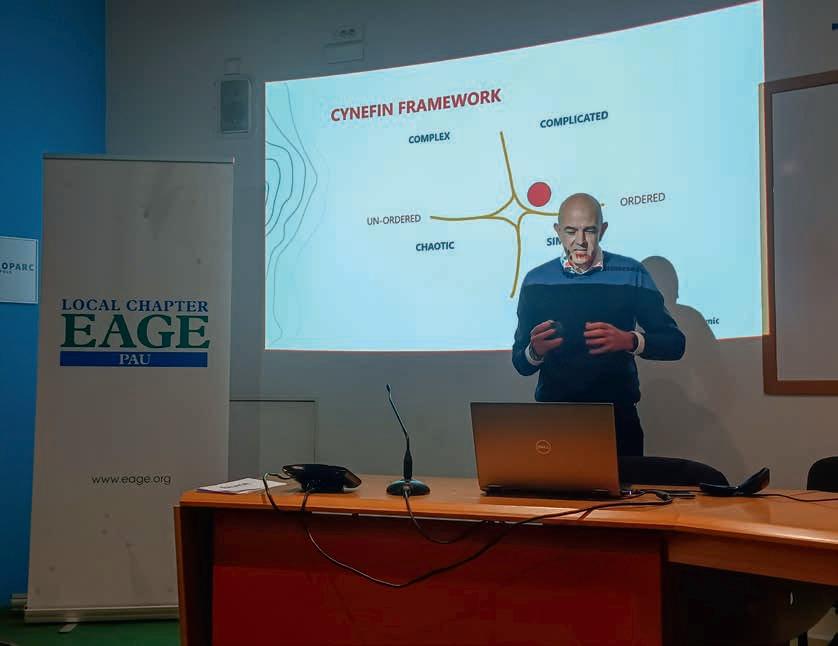
a detailed walk-through focused on ‘true-events and true-amplitudes preservation’ in two sessions, one on Thursday evening, the other on Friday lunchtime.
The local geoscience community in Pau enjoyed the talk in person, whilst the global audience participated online. The idea behind splitting the lecture was to attract people in different time zones and to include those
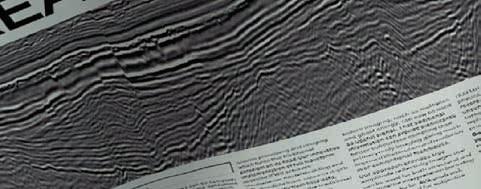
Dr Strobbia, as a global expert in land seismic and signal processing, presented his options for increasing signal to noise ratio with challenging datasets that are lacking continuous reflections, suffering from poor illumination or from many other types of ordered and un-ordered distortions.
He showed what can possibly go wrong with an established processing
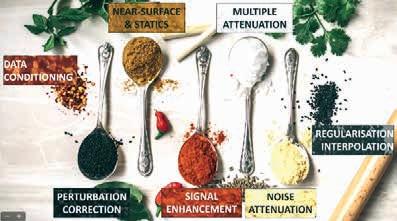
workflow in the presence of coherent or incoherent noise and illustrated the fundamental difference between noise attenuation and signal enhancement in real data examples. There is no silver bullet noise attenuation strategy. Data analysis includes identification of noise types, characterisation of noise properties, its spatial variation, and statistical distribution. Parameter driven signal enhancement and model-based noise attenuation may be appropriate in specific domains.
Altogether, over 70 people attended both sessions. For those who missed the talks or would like a recap, the recording is available on the EAGE’s YouTube channel.
EAGE Local Chapter London acknowledges Celina Giersz, Joseph Sutcliffe, Katie Hubbard, Tiexing Wang and Artem Kashubin. Local Chapter Paris acknowledges Laura Mozga and Emilio Darriba. Local Chapter Pau acknowledges Laure Dissez for organising this double-session event. We are very grateful to Dr Claudio Strobbia for his insightful lecture and detailed answers during the Q&A.
The EAGE Student Fund supports student activities that help students bridge the gap between university and professional environments. This is only possible with the support from the EAGE community. If you want to support the next generation of geoscientists and engineers, go to donate.eagestudentfund.org or simply scan the QR code. Many thanks for your donation in advance!
Today Phuong-Thu Trinh is a youthful senior geophysicist at TotalEnergies Angola. How she got there so early in her career, starting from a humble background in Vietnam, is a remarkable and inspiring story.
I was born in Vietnam at the early time in the renewal period, when the country changed from buying everything with coupons to money. My parents lost their jobs from a cooperative association, and we moved to a new town when I was three years old. I grew up seeing my parents struggling with jobs and money problems, but they never gave up. My mom did multiple jobs as tailor and rice seller. I helped her with sewing in my free time. I think I inherited from them resilience and hardworking traits. I did not have regular internet until university. Fortunately, the Vietnamese school system allowed me to progress.
I was expected to be a mathematician from primary school through the first years of Hanoi University of Science, participating in a number of national and international competitions. Success at these events led me to the ParisTech examination for an engineering degree in France. My English and French were limited, but a positive attitude and a smile won me a place at ESPCI Paris with a scholarship from TotalEnergies. I decided on physics and chemistry as an opportunity to explore new fields while retaining my passion for logic and complex problem solving. Moving to France was a luxury upgrade with a single room for myself. In Vietnam, I had shared a room with 11 girls in the university dormitory.
I found the engineering programme difficult due to my limited French, as well as the new focus on physics and chemistry. Every day I asked for extra time with the
professors. In the end I graduated with fluent French in several technical projects with high grades.
Why did you switch to geoscience?
My interest in geosciences sprang from different internships and industrial visits. Contact with mathematical models revealing the Earth’s structure and behaviour, as well as the effort required to use these models, struck both my inner mathematician and engineer as both beautiful and complex. I found seismic data is very colourful and powerful.
I was conditionally accepted to the MSc petroleum geophysics degree at Imperial College London (ICL) but was required to improve my English. The language barrier was manageable compared with the expensive living cost in London, beyond my savings and sponsorship. I rented a small room with a single bed in a shared flat, close to ICL to avoid the underground cost and travel time. I minimised my expenses by buying £2-vegetable packages from Sainsbury. I was grateful for financial help from the family of a good friend at ESPCI, paying them back later.
I did several academic projects such as photochemical grafting, probabilistic visual learning, experimental soundwave study, industrial internships in 4D seismic acquisition, geostatistics, and a PhD project in full waveform inversion with SEISCOPE consortium and TotalEnergies.
I always enjoyed the problem solving and logical thinking to put different puzzles together to solve a global integrated problem, which is close to my work today.
I am now a senior reservoir geophysicist for the Block 32 Kaombo deep-water offshore project. This combines all my previous experiences and includes well placement, reservoir monitoring and management. I am also learning the reservoir engineering job in parallel with my current geophysicist role. I truly enjoy the dynamic environment with daily operational and technical challenges, which require rapid action, integrated competences and strong teamwork.
Energy transition is urgently needed, especially a sustainable transition, but fossil fuels will still be needed in the next 20-30 years. The O&G industry is carbon intensive, but it also has room for improvement. Many ongoing projects undertaken today might save significant amounts of GHG in the future. Geosciences are crucial to decarbonise energies in the coming years. Geothermal energy, CO2 storage and hydrogen production seem to be promising leads to decarbonise our society. I am trying to play a small part, by helping young people through the EAGE Student Committee.
I am interested in becoming an energy architect, who can design smart energy plans to participate in the future energy transition.


BY ANDREW M c BARNET

Goodbye CGG, Hello Viridien. Just like that, a name that has stood the test of time (over 90 years) was last month consigned to the history books, with the new company look on display for the first time at the EAGE Annual Meeting in Oslo.
This is a big, bold decision. No one understands that better than Richard Branson, who can legitimately claim the Virgin brand launched in 1972 to be one of the most distinctive trading names ever invented. It may be slightly over the top (part of the brand), but he has said: ‘The way a company brands itself is everything. Beyond your products or services, it will ultimately decide whether or not a business survives.’ Branson should know as he has had a few brushes with insolvency over the years.
CGG certainly approached the challenge with enviable bravado. It has effectively appropriated the colour of the moment, green, with a made-up adjective, or at least not one found in standard French or English dictionaries. Artists in Francophone and English-speaking countries know all about viridian green spelt with an ‘a’. It originates from the Latin viridis. The smart trick of Viridien has been to give the ending, ‘-ien’, a French intonation when in fact viridian is a legitimate word with the same meaning in both languages.
In the geoscience business Polarcus, the marine geophysical contractor, launched the company with a series of vessels in a striking green claiming ‘a pioneering environmental agenda’, albeit in the context of finding hydrocarbons. The fleet is now turning blue since acquisition by new owner Shearwater Geoservices. Interestingly, green and blue are next to each other on the spectrum, and the two colours in the English language have at times been colexified, i.e., expressed using a single umbrella term. Wikipedia among other sources lists languages which do not distinguish between the green and blue, for example old Chinese, Thai, old Japanese, and Vietnamese.
‘Approached the challenge with enviable bravado’
From a branding perspective, coming up with invented words is nothing new. In 2018 Norway’s national oil company Statoil changed to Equinor most obviously to rid itself of the ‘oil’ label. There has never been a particularly convincing explanation of the ‘Equi’ part of the new name, but it has a good ring to it.
Viridien is right on the money in expressing an intention to be environmentally conscious. The logo is blue on one side and shades to green on the other. BP started the trend in the oil and gas industry more than 20 years with its green and yellow Helios sun symbol to represent the brand’s renewed environmental awareness and green growth strategy. Unfortunately, the 2010 Deepwater Horizon disaster in the Gulf of Mexico on BP’s watch put a big dent in the company’s green aspirations.
CGG’s new image is said to reflect the company’s transition since 2018. That’s when it decided to go ‘asset light’ and began divesting itself of all data acquisition services especially its operation of marine seismic vesssels, a process due to conclude in 2025. Sophie Zurquiyah, now CEO of Viridien, states that the rebranding ‘connects our company’s history to our future, confidently positioning us for accelerated growth as an advanced technology, digital and earth data company’. The company’s industry-leading high-performance computing, the Sercel seismic acquisition equipment arm, geoscience and earth data services, and sensing and monitoring are key segments plus ‘beyond the core’ new businesses’.
Viridien is of course still wedded to the oil and gas business for the bulk of its revenue, which arguably makes an association with green a stretch. However, its intended focus on supporting the energy transition sphere with its planned growth in low carbon markets, such as carbon capture and storage and minerals and mining, does signal a change of direction. Green does imply fresh and new, among other things
In history, green has been a fickle colour, by no means always carrying positive connotations. Our understanding of green as shorthand for environmentally beneficial policies is of very recent vintage. Unlikely as it may seem, a number of sources suggest
that the modern usage may derive partly from a movement by builders’ labourers around Sydney, Australia in 1970. Known as ‘Green bans’, they refused to work on what was regarded as the socially undesirable spread of office-block skyscrapers, shopping precincts and luxury apartments at the expense of green spaces and affordable housing.
Commentators believe this example of environmental activism influenced the emergence of the first political parties anywhere to run on an environmental platform, namely the United Tasmania Group in an Australian state election and the Values Party in a New Zealand general election, both in 1972. Like-minded political groups sprang up in a number of European countries, but the Green Party of Germany (Die Grünen) was the first specifically called Green to win representation at national level, in the 1983 federal election. From 1998 to 2005 it formed a coalition with the governing Social Democratic Party.
Very much in the same period, a small group of anti-nuclear activists in Vancouver, Canada came up with a crackpot plan to sail an old fishing boat to a proposed US military testing site at Amchitka, a tiny volcanic island off western Alaska. They christened themselves and the boat Greenpeace. During the voyage, a founding member Bob Metcalfe told CBC radio, ‘We call our ship the Greenpeace because that’s the best name we can think of to join the two great issues of our times, the survival of our environment and the peace of the world […] We do not consider ourselves to be radicals. We are conservatives, who insist upon conserving the environment for our children and future generations.’ Inevitably the ship was turned back but a movement was born.
there are plenty of references like the traditional ‘Greensleeves’; Tom Jones warbling about ‘the green, green grass of home’, and Donovan’s lyric ‘Green is the color of the sparkling corn, in the morning, when we rise …’
There is further amusement to be had in identifying and naming the many shades of green beyond your familiar greens such as emerald, olive, hunter, sage, mint, forest, etc. The actual number of shades is almost limitless because in nature greens vary with the light and the changing seasons not to mention how our eyes perceive colours, a science in itself. A question for Viridien is exactly which shade of green has the company adopted.
In art and decoration mixing shades of green has a long history of being problematic. In ancient Egypt, copper mineral malachite was used to paint green on tomb walls, but it was expensive and easily turned black over time. The Romans soaked copper plates in wine to create verdigris, a green pigment that comes after weathering the metal. A modern example is the green hue of the Statue of Liberty, New York which started off as a bright copper bronze when erected in 1886.
‘Green has a long history of being problematic’
Over time more green pigments were developed from natural materials, such as plants, but the colours would eventually fade. Some early Renaissance painters would paint faces with a green undercoat, then add pink. However, over the centuries the pink has faded, making some faces appear a sickly green.
Green over the centuries has not escaped being embroiled in religion and nationalism. These days Ireland’s embrace of green is associated with the Catholic Church and St Patrick of Ireland, although there is a more convoluted story of how Irish republicans also came to adopt green. In her very readable ‘Secret Lives of Colours’, Kassia St Clair notes that green was almost synonymous with paradise for Muslims in times past and was the favourite colour of the Prophet Mohammed. This is why so many predominantly Islamic countries such Iran, Iraq, Saudi Arabia, Pakistan, Libya and Bangladesh incorporate green in their national flags.
Today it is extraordinary how the environmental green has usurped other modern usages. In fact, a fun parlour game would be to come up with all the contexts in which green can be used, e.g., green for go, envy (Shakespeare’s ‘green-eyed monster’ in Othello), sickness, inexperience, hospital green, vegetable greens, green (in golf and other sports), green fingers (gardening), greenbacks (US money), etc. Who would have thought that in Britain, the leather seating in the House of Lords is red compared with the green in the House of Commons, the former regarded in the past as rich and regal and the latter seen as more common. In song,
The big but not entirely beneficial change in green dyes and pigments came with Scheele’s Green, named after a Swedish chemist Carl Wilhelm Scheele. In 1872, he introduced a deadly, bright green hue made with the toxic chemical arsenite. This was rapidly adopted and by the end of the 19th century had replaced previous mineral and vegetable dyes.
Scheele’s Green was used on paper, wall hangings, fabric, and even children’s toys. According to various sources, some 19th century journals reported children becoming ill in bright green rooms, and ladies in green dresses becoming sick from consuming the toxic vapours.
For a French company championing green, it is perhaps unfortunate that various historians attribute the death of Emperor Napoleon Bonaparte in exile on the island of St Helena to the poisonous green wallpaper in his bedroom. Later in the century a similar far more vibrant pigment called Paris Green replaced Scheele’s Green and was used by French Impressionists such as Claude Monet, Paul Cézanne, and Pierre-Auguste Renoir to create their lush green landscapes. But it was equally toxic. It may have been responsible for Monet’s blindness. Queen Victoria got wind of its dangers when a guest complained of feeling ill and had any green rooms redecorated.
Paris Green is no longer in use, but its story underlines the line sung by Muppet character Kermit the Frog – ‘It is not that easy being green’.
Views expressed in Crosstalk are solely those of the author, who can be contacted at andrew@andrewmcbarnet.com.


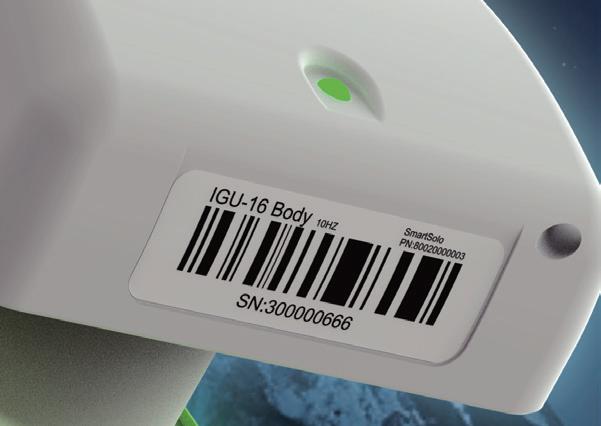


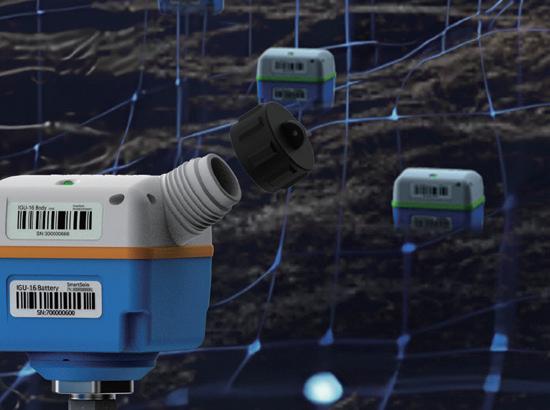
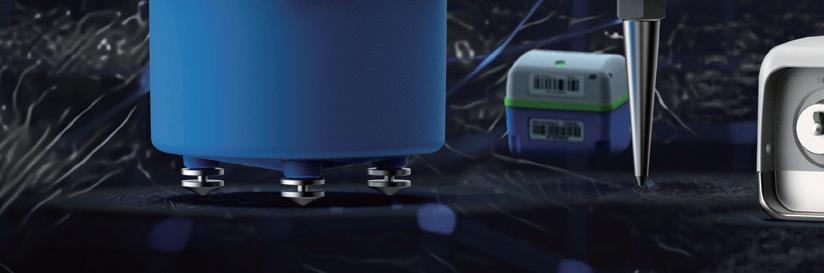
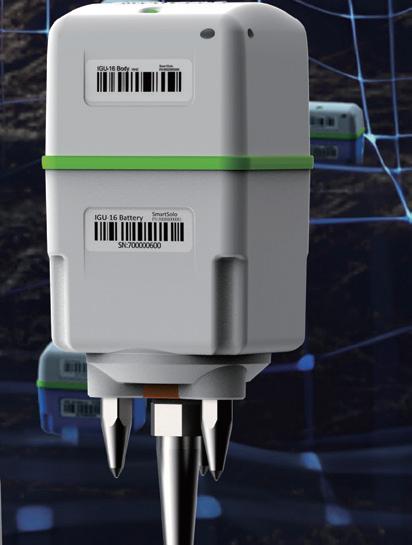
Unleash the power of the next generation seismic. The fully autonomous node has been built to withstand the Earth's extremes in diverse environments and can continuously capture seismic data for up to 30 days, of the next generation seismic. node has been built to withstand can continuously capture seismic data up to 30 days, maintenance free!


The next UK government will have 100 days to save 100,000 jobs in the North Sea energy sector as companies consider pulling investment from the UK.
The 39th Energy Transition Report from Aberdeen and Grampian Chamber of Commerce reveals a sharp decline in work across production, exploration and renewables as investors await the outcome of the UK general election on 4 July.
‘Industry confidence in UK activities has plunged to a record low, according to the long-running survey, with high taxes and a potential exploration ban threatening to bring our world-class domestic oil and gas industry to a premature end,’ says the report.
With a leading investment bank warning that up to half of the direct and indirect jobs supported by the North Sea could be lost inside just five years, the chamber estimates that the party which wins the election has 100 days to restore confidence or face losing investment worth £30 billion.
The chamber is also making fresh calls for an independent body, free from political influence, to oversee the energy transition. The body should be charged with developing recommendations which could command cross-party consensus.
The report also calls for a ‘relentless focus’ on renewable energy job creation in wind power manufacturing and operations, hydrogen, carbon capture and decommissioning.
The chamber’s Energy Transition Survey sponsored by KPMG and ETZ shows that companies expect only around half of their work (51%) to be in renewables by 2030 up from 34% currently. Profitability and the regulatory environment are listed as the biggest barriers to diversification into renewable energy.
The 39th edition also finds that despite the oil price remaining over $80 a barrel, confidence among companies working in the UKCS is now lower than the financial crash and the pandemic when oil prices had slumped to around $16 a barrel.
Tax, the political environment and market stability are the three biggest concerns facing companies based in the UK energy sector, the report says. UK-based companies are increasingly focusing their investment and resources in overseas projects and markets.
More than two-thirds of energy sector companies (77%) believe that none of the UK’s political parties are putting forward the correct strategy for energy transition.
All companies are facing acute recruitment challenges, with half losing more people than usual to retirement. A third are losing more staff than usual to overseas projects.
Russell Borthwick, chief executive at Aberdeen and Grampian Chamber of Commerce, said: ‘The Energy Transition Survey has charted the highs and lows of the UK’s energy sector for the past 20
years, but never before has its findings been so important; and the need for action so urgent. From our survey and listening to focus groups, we believe the next government has just 100 days to convince industry that there is a future in the UK Continental Shelf.
‘Failure to do so will result in the current apathy, which is evident throughout this report, turning to open revolt, where companies move their resources on to countries which offer a less hostile business environment and better returns. Privately, industry leaders are being very clear that this will be the outcome of an extended windfall tax with scaled back allowances. Should this transpire, our path to net zero could look more like a road to nowhere. A road that leaves the UK poorer, less energy secure, and beholden to foreign regimes for the energy we need to keep the lights on and our economy running.’
Paula Holland, office senior partner for KPMG in Aberdeen, said: ‘It is quite clear that political instability in an election year, ever changing tax policy, and uncertainty in the market understandably weigh very heavily on the minds of those who responded, outstripping concerns over the oil price for the first time. This difficult climate is seen as a significant barrier to the speed of UK diversification to renewables and other low carbon sources of energy, something which is closely tied to the investment decisions being made in this region every day.
PGS has started a large 4D seismic acquisition contract over the Barracuda Caratinga fields offshore Brazil for client Petrobras.
The contract was awarded in December 2022 and was expected to start in the summer of 2023 but was delayed. The Brazilian Institute of Environment and Renewable Natural Resources (IBAMA) has now issued the final permit.
To optimise vessel resources during the 2023 summer season, the vessel Ramform Victory was reactivated and earmarked for this project. ‘While permitting was pending she undertook a series of attractive multi-client programs,’ said PGS.
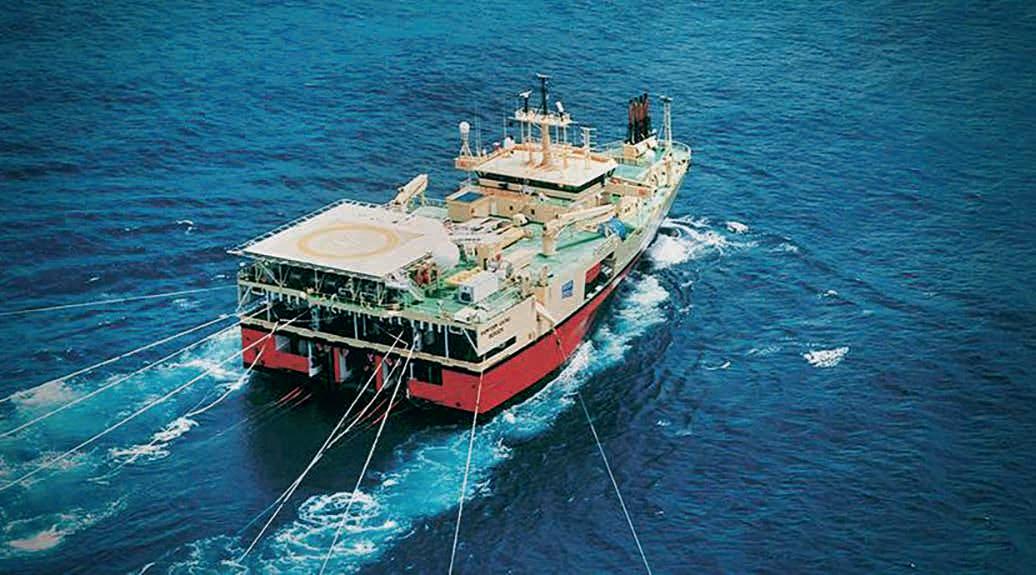
Ramform Victory was expected to start data acquisition for Petrobras in early June. The contract has a duration of approximately eight months and will be completed in 2025. In September Ramform Victory will be joined by the PGS Apollo as a source vessel, to complete the more complex areas of the survey.
‘The operations and sales and services organisations of PGS have been working relentlessly to plan and optimise this project and as with previous large and complex 4D projects in Brazil the team is ready to deliver according to the plan in Barracuda Caratinga. We are happy to see Ramform Victory begin mobilisation,’ said Adrian Burke, PGS vice-president Brazil.
Meanwhile, PGS has won approval to reprocess and expand its Uruguay MC3D dataset.
Originally acquired in 2012 as survey 3DUR12 and covering an area of 15,600 km2, the data provides insights into the Pelotas Basin’s prospectivity.
The reprocessing sequence is designed to unlock further opportunities within these basins, said PGS.
The data rejuvenation will be conducted by a team of geophysicists in the PGS imaging centre in Houston. Innovative technology, including imaging with multiples (SWIM), Full Waveform Inversion (FWI) and Least Squares imaging will elevate the level of resolution and bring the fidelity required to further develop this frontier basin.
CGG is changing its name to Viridien.
Shareholders approved the name change at the company’s Annual General Meeting on 15 May 2024.
Sophie Zurquiyah, CEO of Viridien, said: ‘Our new name, Viridien, connects our company’s history to our future,
confidently positioning us for accelerated growth as an advanced technology, digital and earth data company.’
The company launched the new Viridien brand on 10 June at the EAGE Annual Conference in Oslo, aiming to strengthen its focus across solutions including the
core businesses of geoscience, earth data and sensing and monitoring, as well as new offerings in both the low carbon markets of minerals and mining and CCS, and markets beyond energy in high-performance computing and infrastructure monitoring.
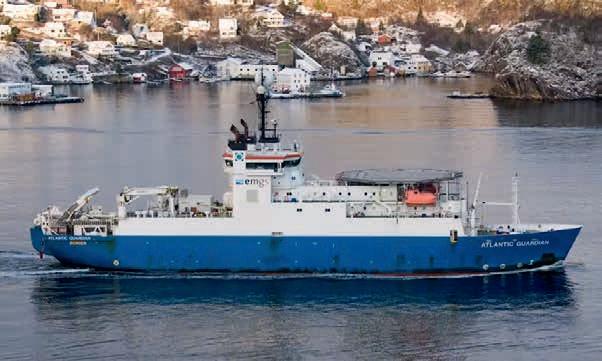
EMGS has signed several late sales licensing agreements related to its existing Norwegian EM multi-client library, with a total combined revenue of approx. $1.3 million.
Meanwhile, the company has reported first quarter revenues of $0.2 million in contract sales, down from $5 million in the first quarter of 2023 and down from $1.1 million in the fourth quarter of 2023. There was no multi-client revenue.
Adjusted EBITDA (including multi-client expenses and vessel and office expenses) was a loss of $3.8 million, down from $2.4 million in the first quarter of 2023.
Free cash decreased by $1.6 million during the quarter, to $8.7 million.
The vessel Atlantic Guardian completed the acquisition of a fully prefunded multi-client survey in the North Sea and started transiting towards Brazil.
Polaris has won a 200-line km 2D seismic project at PEL 93 licence in Namibia for a consortium of Monitor (37.5%), Legend (15%), Namcor (10%) and 88 Energy (37.5%).
The program, expected to commence mid-2024, will focus on confirming the structural closures of the 10 independent leads identified from airborne geophysical methods and partly verified using existing 2D seismic coverage.
The 2D seismic program is expected to be completed in Q3 2024, with processing of the data anticipated to be completed in Q4 2024.
Results from the 2D seismic program will then be incorporated into existing historical exploration data over the acreage and used to identify possible exploration locations for drilling next year in the unexplored 18,500 km2 Owambo basin.
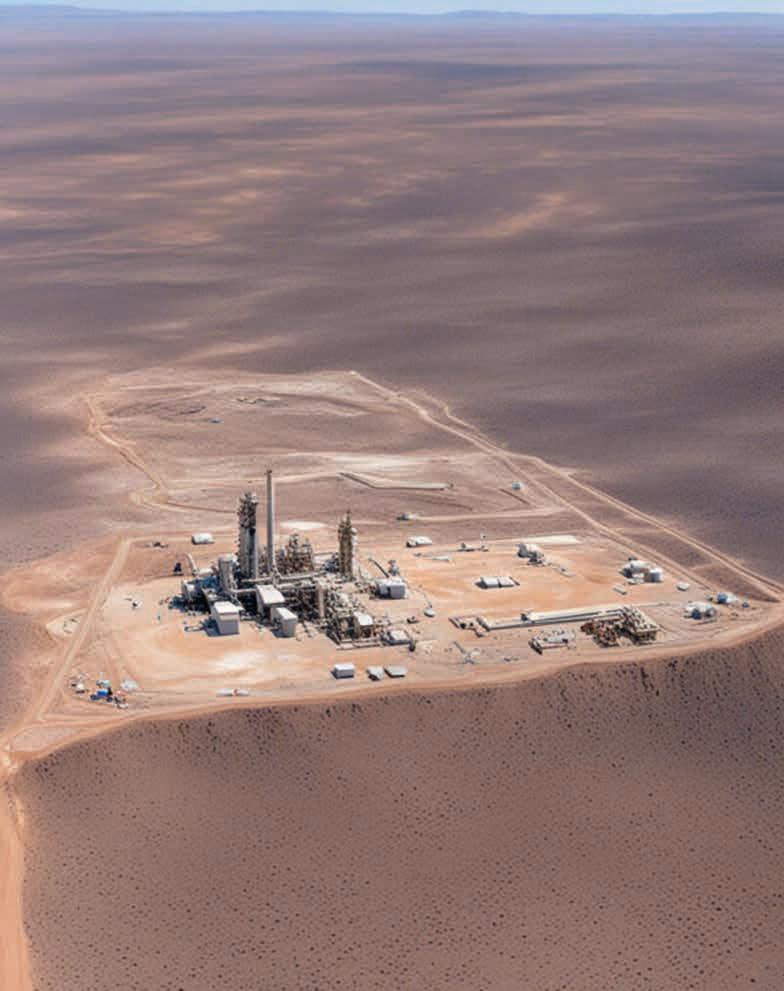
‘Subsurface investigations completed to date on PEL 93 by Monitor have incorporated a range of geophysical and geochemical techniques to assess and validate the significant potential of the acreage,’ said 88 Energy. ‘This included
airborne geophysical methods, reprocessing of existing 2D seismic coverage, as well as measuring methane and ethane concentrations in soil samples over interpreted structural leads, validating the existence of an active petroleum system. Passive seismic anomalies from this work were noted to align closely to both interpreted structural leads and measured alkane molecules (c1-c5) concentrations in soil.’
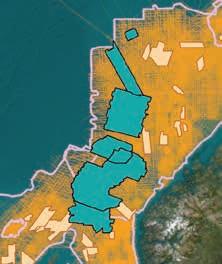
A series of large, anticlinal structures have been identified in the onshore Owambo Basin, collectively expected to represent a resource of equivalent size to recent offshore Namibian discoveries.
Initial exploration in the Owambo Basin has focused on the shallow Karoo Play, but attention has turned to the substantial potential of the deeper and largely untested Damara Play.
The Damara Play resulted from a large fold and thrust episode, providing significant independent targets for exploration of an equivalent size to those discovered offshore Namibia, where there has been a ~88% success rate in exploration (with recent wells discovering oil).
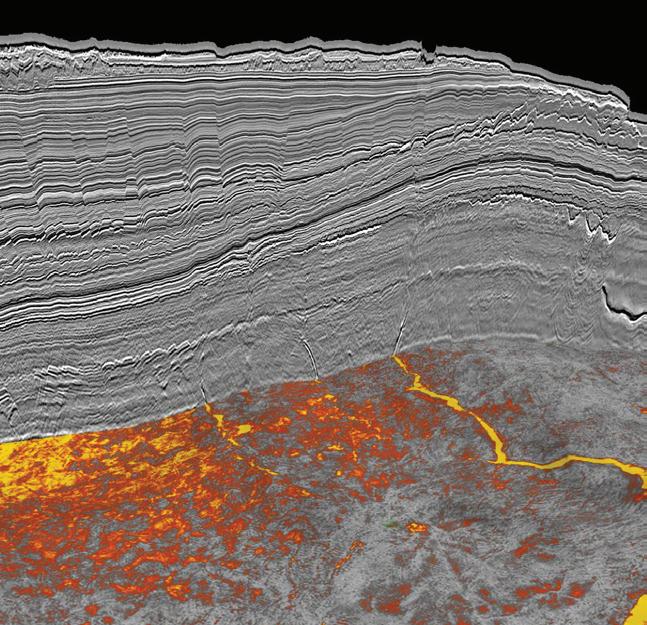
The Damara Play is characterised by several coherent, mappable, large fold and thrust structures which generated 19 prospects and four leads. The target structures observed are up to 25 km in length and 3 to 5 km wide. Reservoirs are expected to be encountered in both the marine/fluvial sandstones of the Mulden formation as well as the fractured carbonates of the Otavi Supergroup. The Otavi group was penetrated in well 6-2 and contained oil shows on mud logs as well as oil saturations in side-wall cores.
The Pre-Rift Karoo play interval is interpreted to be late Neo-Proterozoic to Early Palaeozoic sedimentary rocks, which are analogous to the sediments of the Owambo Basin to the west.
Given their depth, modelled maturation, geological age and geochemical data from wells and seeps, the hydrocarbons are expected to be both light oil and gas.


Shell and Exxon Mobil are reported to be close to an agreement to sell their jointly owned gas fields in the Southern North Sea to independent British producer Viaro Energy.
Chevron is reported to be negotiating a sale of its remaining UK North Sea oil and gas assets, in a move that would mark its exit from the UK after more than 55 years. Chevron’s assets include a 19.4% stake in the BP-operated Clair oilfield in the West of Shetland region, the largest in the British North Sea with production of 120,000 barrels per day.
ConocoPhillips has agreed to acquire Marathon Oil in an all-stock transaction of $22.5 billion, inclusive of $5.4 billion of net debt. Marathon Oil shareholders will receive 0.2550 shares of ConocoPhillips common stock for each share of Marathon Oil common stock, representing a 14.7% premium to the closing share price of Marathon Oil on 28 May.
CNNOC has entered into petroleum exploration and production concession contracts (EPCCs) with the government of Mozambique for five offshore blocks: S6-A, S6-B, A6-D, A6-E and A6-G, located offshore Mozambique. The total area is approx. 29,000 km2, with water depths from 500 to 2500 m. The first stage of the exploration period of the blocks is four years.
Triindad and Tobago has received six bids on four blocks in its Shallow Water Competitive Bidding Round 2023/2024. Of the 13 offshore blocks on offer one bid was received for Block Lower Reserve L from EOG Resources; three bids for Block Modified U(c) from BG International, bp and EOG Resources; one bid for Block NCMA2 from bp and one bid for NCMA4(a) from EOG Resources. Data is available for the bid round via a Virtual Data Room. Production sharing contracts are expected to be awarded later in the year.
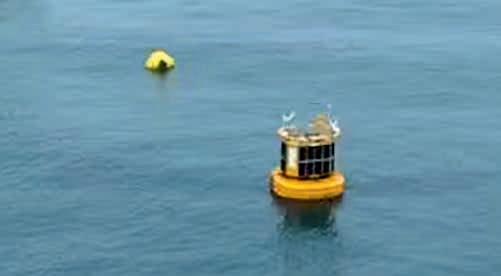
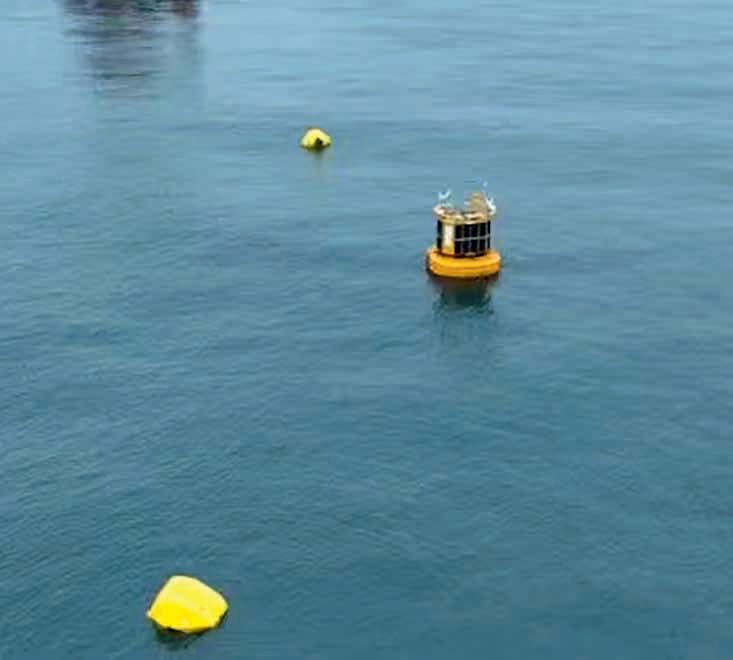
TGS has launched its latest multi-client wind measurement campaign using two LiDAR buoys offshore Germany in the North Sea.
The buoys are equipped with a multitude of sensors, allowing detailed measurements of wind, metocean and environmental data. The collected data is streamed to shore and used to enhance decision-making to support several current and future wind lease rounds in the German Bight.
The buoys offshore Germany, supplied by Green Rebel, will deliver a comprehensive wind data suite over a 24-month measurement campaign. In addition to wind speed measurements, the data package includes 12 months of critical metocean data, such as significant wave heights and ocean current profiles, acquired via Directional Waverider buoys and seabed-mounted Acoustic Doppler Current Profilers. Data will be continuously streamed, quality-controlled, and made available to customers daily through the Wind AXIOM platform, TGS’ site evaluation and wind data analytics tool.
Similar multi-client programs have already been deployed across the east coast of America, where five buoys are currently collecting data; and offshore Norway, where data availability has averaged 96% at 160 m measurement height throughout the deployment.
Kristian Johansen, CEO of TGS, said: ‘Early access to essential wind and metocean data significantly mitigates investment risks, empowers informed decisions, and ensures smooth project implementation across the wind development lifecycle. With this deployment, we can proudly boast eight offshore LiDAR campaigns concurrently collecting critical wind data worldwide, and more deployments are likely to follow as new areas open up globally
Meanwhile, TGS has won an Ocean Bottom Node (OBN) data acquisition contract in North America. The sixmonth-plus contract is expected to enhance a repeat client’s seismic data acquisition capabilities, facilitating more informed decision making.
The UK has offered a further 31 licences in phase 3 of the 33rd oil and gas licensing round. The licences comprise 88 blocks/ part blocks in the Central North Sea, East Irish Sea and Southern Northern Sea.
A total of 82 offers to 50 companies have now been made in the round which attracted 115 bids from 76 companies across 257 blocks and part-blocks.
The licences offered in the round would be expected to add an estimated 600 mmboe up to 2060, or 545 by 2050.
The 33rd UK Offshore Licensing Round opened on 7 October 2022 and closed for applications for licences on 12 January 2023.
On 30 October 2023 the NSTA offered 27 new licences and the merge of six blocks into five existing licences. On 31 January 2024 the UK North Sea Transition Authority offered 24 new licences made up of 74 blocks/part blocks in the West of Shetland, Northern North Sea and Central North Sea.
PGS has enhanced its seismic data interpretation capability through a collaboration agreement with Onward, an Austin-based energy innovation platform.
The collaboration will facilitate on-demand data interpretation provided by Onward to enhance PGS’ existing multi-client and data on demand services and accelerate interpretation workflows.
‘The collaboration between Onward and PGS gives subscribers of PGS’ OnDemand services the option to access Onward’s interpretation services and unlock the subsurface potential of extensive seismic data sets,’ said PGS in a statement. ‘PGS subscribers that engage Onward’s additional services will have
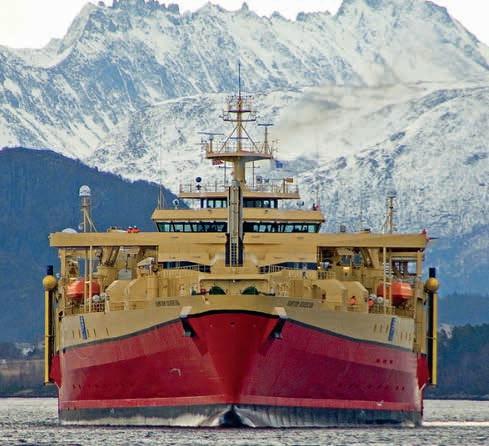
access to Onward’s global community of geoscience and data science experts who leverage analysis tools in a cloud-based environment (subject to certain conditions).’
SeaBird Exploration has won a contract for OBN source work for the vessel Eagle Explorer in the western hemisphere with a repeat client.
The duration of the contract is six months and could be extended by six months. Mobilisation has started and the contract was expected in the second half of June.
‘The company’s backlog currently shows a combined 33 months of OBN
source work including options. Further, we see several opportunities in 2D and are exploring alternative ways of employing the company’s considerable track record and streamer capacity,’ said Ståle Rodahl, executive chairman SeaBird.
Meanwhile, SeaBird has reported first quarter revenues of $10.3 million and operational EBITDA of $4.6 million. Net interest-bearing debt is $13.1 million. Fleet utilisation is 80%.
Viridien has announced two multi-client 3D reimaging programs, CDI24 Phase I (3120 km2) and Phase II (6610 km2) offshore Côte d’Ivoire.
Phase I is starting immediately and Phase II is planned for H1 2025.
The multi-client programs, in association with Côte d’Ivoire’s state energy company Direction Générale des Hydrocarbures (DGH) and Petroci, will be merged with the CDI23 (6430 km2) reimaged data (originally marketed as 2023/2024 PDSM), to create a seamless and contiguous total volume of over
16,000 km2, overlapping the recently announced Calao discovery and adjacent to the Baleine field.
‘Tools, including time-lag FWI, Q-FWI, Q-Kirchhoff and advanced deghosting and demultiple techniques aim to produce clearer images of the deep structural plays not visible in the legacy data, as well as imaging the Calao Cenomanian and Baleine Carbonate fairways at unrivalled resolution, providing a step-change in understanding of the opportunities in the region,’ said Viridien (formerly CGG) in a statement.
UK-based Net Zero Technology Centre and German-based Cruh21 have launched a report on the potential of a green hydrogen collaboration between Scotland and Germany. The ‘Enabling Green Hydrogen Exports: Matching Scottish Production to German Demand’ report analyses hydrogen export and consumption, exploring multi-sector end use, technologies, infrastructure, and regulatory frameworks. The report indicates prospective Scottish hydrogen exports could potentially satisfy 22% to 100% of Germany’s hydrogen import volume by 2045.
Vår Energi has joined the UN-led initiative to improve accuracy and transparency of methane emissions reporting. The company has signed an agreement with OGMP (Oil and Gas Methane Partnership), an initiative of the United Nations Environment Programme (UNEP) in which nearly 140 oil and gas companies are working to improve accuracy and transparency of methane emissions reporting.
The UK North Sea Transition Authority (NSTA) has collected evidence between 4 December 2023 and 26 January 2024 on the potential principles, design and timing of a possible future levy on UK carbon storage licences. The NSTA said that it intends, unless there are major external developments, to introduce a carbon storage levy once the CCS industry is on a more self-sustaining footing.
Norway and Switzerland have signed a ‘declaration of intent’ to strengthen cooperation on carbon capture and storage (CCS) and carbon dioxide removals between the two countries.
Viridien (formerly CGG) has signed a memorandum of understanding with Baker Hughes to explore carbon capture and storage (CCS) solutions. The collaboration intends to support the rapid increase of CCS projects that is underway by providing high-quality and fully integrated end-to-end solutions to screen, select, characterise and monitor potential carbon storage sites worldwide, the companies said in a joint statement.
Norway’s Awards in Predefined Areas in the Barents Sea has been expanded by 34 blocks, featuring ‘good coverage’ as a result of recently released seismic data.
Norway’s Ministry of Energy announced APA 2024 on 8 May, including blocks in the North Sea, the Norwegian Sea and the Barents Sea. The deadline for applications is 3 September.
The expanded area in the Barents Sea is located on the Finnmark Platform and covers an area of just under 9000 km2 The APA area in the Barents Sea has good coverage of 3D and 2D seismic data. Over the last five years alone, vast volumes of data have been released within the predefined areas.
The Norwegian Offshore Directorate has compiled a map of the seismic datasets released between 2019 and 2024.
The directorate pointed to a high density of released 3D and 2D seismic data in the areas west of the Loppa High and around the North Cape Basin. The released data include several modern datasets. They were processed or reprocessed in 2020/2021 and include available data in both time and depth as well as ‘angle/ offset stacks’.
The expanded area on the Finnmark Platform includes several exciting plays that can be mapped for further maturing of prospects. The seismic line from the released 3D dataset FIN13 shows fault structures at basement level with potential structural and stratigraphic traps in the Billefjorden Group, as well as overlying spiculites in the Røye Formation. The Billefjorden Group and the Røye Formation are part of proven plays.
TGS has made a first quarter net loss of $16 million on revenues of $227 million compared to a net loss of $8 million on revenues of $229 million in Q1 2023.
However, operating profit of $40 million was up on operating profit of $25 million in Q1 2023.
Early sales of $78 million were down on $97.5 million in Q1 20223, but late sales of $72 million were up on $45.5 million in Q1. Proprietary sales of $77 million were down on $86 million in Q1 2023.
Organic multi-client investments of $67 million were down from $133 million in Q1 2023. Free cash flow has dropped from $106 million to $10 million. Kristian Johansen, CEO of TGS, said: ‘We are pleased to see late sales of completed multi-client data in Q1 2024 showing good progress, both compared to the preceding quarter and the same quarter of last year. Further, we saw strong sales of surveys in the workin-progress phase, supporting the early sales rate of approximately 116% in the quarter. We continue to show good oper-
ating performance in our OBN business, although the activity level, as expected, remained seasonally low in Q1 2024. The strong start to the year, combined with a continued tight global oil market and increasing exploration ambitions among our customers makes me optimistic for the remainder of the year. With the PGS merger, which we expect to close on or around 1 July 2024, TGS will be perfectly positioned to support our customers’ exploration ambitions and capitalise on what we think will be a multi-year upcycle.’
PGS has launched a 2D 50,000 km reprocessing project in Denmark that will provide a regional screening product for carbon storage sites in Norwegian-Danish Basin aquifers
A proven processing and imaging sequence has been developed based on PGS’ 2023 reprocessing of seven seismic sections from three 2D surveys over the Inez and Hanstholm fields.
The processing and imaging sequence, from pre-processing, through to tomography and final VTI Kirchhoff PSDM, illuminates potential CCS structures, said PGS.
The anticipated main CO2 storage targets are Triassic Bunter Sandstone in the Skagerrak-Gassum Formation and mid-Jurassic Haldager Formation. Aquifer potential in the Oligocene-Miocene is expected in a favourable 800–3000 m depth range. The area has marine shale seal lithology, with a regional chalk seal. Zechstein salt movement-induced structures are seen, with inter-salt mini basins and turtle structures.
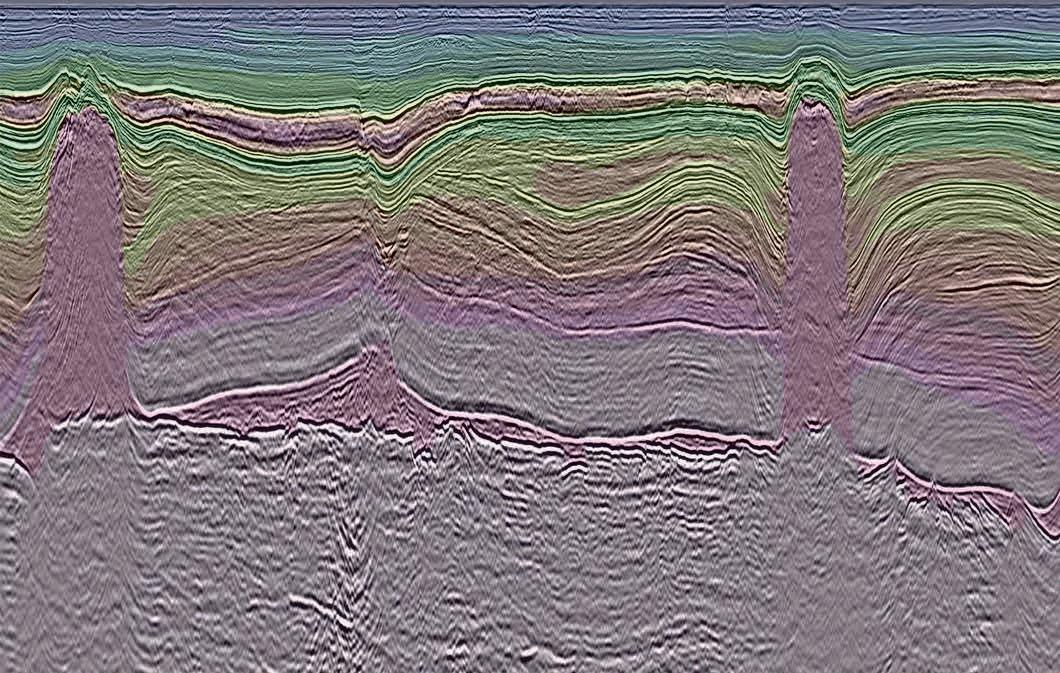
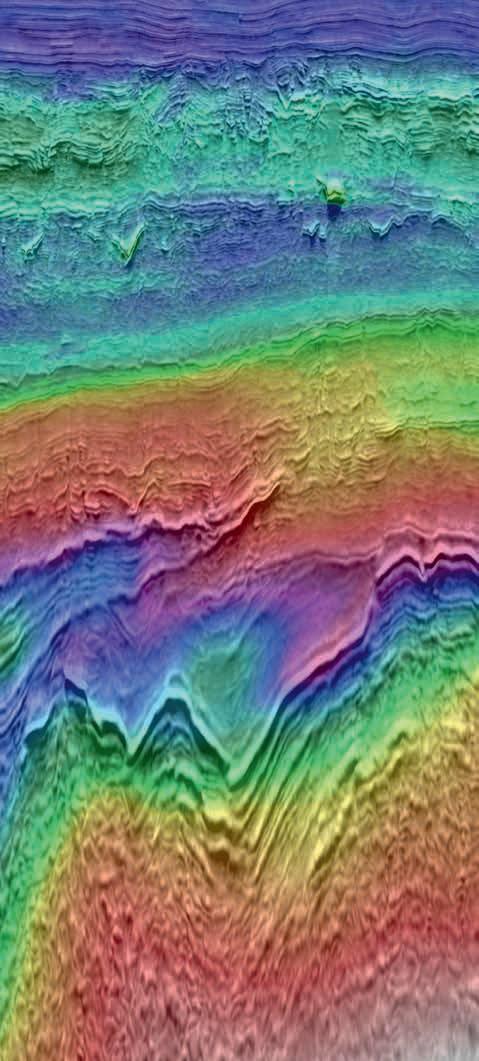
Modelling and interpretation techniques are vital to identifying the hydrocarbons that the world still needs but also for modelling reservoirs for carbon capture, storage and utilisation (CCUS) and other renewable energy sites.
Artificial intelligence and machine learning are leading to advances. The latest high-performance computing and algorithmic innovations aimed at enhancing the quantity and quality of modelling and interpretation are presented here.
Brian Russell explains why an EAGE president’s address over 60 years ago is as relevant as ever.
Christoph Georg Eichkitz et al present survey planning of geoelectric measurements and sub-bottom profiling in the entire area between Spielfeld and Bad Radkersburg in Austria.
Neil Hodgson et al present seismic processing and imaging techniques for building a geologically driven velocity model to successfully explore the basin.
Pauline Rovira discusses how 2D seismic mapping and 3D seismic spectral decomposition demonstrates transform faulting strongly influences fairway orientation throughout the majority of the Cretacious.
Sonny Winardhi et al demonstrate how with Low Frequency Extrapolation the proposed algorithm can reliably extrapolate the low-frequency content of the field data with minimal errors and exhibits good agreement with the deghosting results.
Michael S. Zhdanov demonstrates that the remanent magnetisation of the rocks can be determined remotely from the airborne magnetic data, opening up the possibility of paleomagnetic study on a large scale without extracting specific rock samples from the ground.
Nizar Chemingui et al describe how a simultaneous velocity and angledependent reflectivity inversion workflow can provide accurate and highresolution attributes that could help to derisk frontier exploration.
First Break Special Topics are covered by a mix of original articles dealing with case studies and the latest technology. Contributions to a Special Topic in First Break can be sent directly to the editorial office (firstbreak@eage.org). Submissions will be considered for publication by the editor.
It is also possible to submit a Technical Article to First Break. Technical Articles are subject to a peer review process and should be submitted via EAGE’s ScholarOne website: http://mc.manuscriptcentral.com/fb
You can find the First Break author guidelines online at www.firstbreak.org/guidelines.
January Land Seismic
February Digitalization / Machine Learning
March Reservoir Monitoring
April Underground Storage and Passive Seismic
May Global Exploration
June Technology and Talent for a Secure and Sustainable Energy Future
July Modelling / Interpretation
August Near Surface Geo & Mining
September Reservoir Engineering & Geoscience
October Energy Transition
November Marine Acquisition
December Data Management and Processing
More Special Topics may be added during the course of the year.


TECHNICAL PROGRAMME Includes Oral and Poster Presentations


WORKSHOP AND PANEL DISCUSSION
SOCIAL PROGRAMME
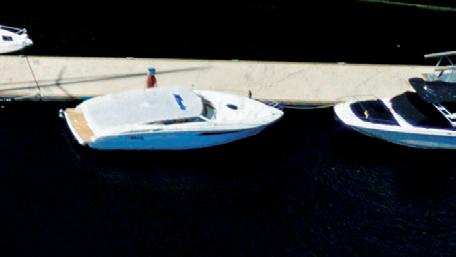
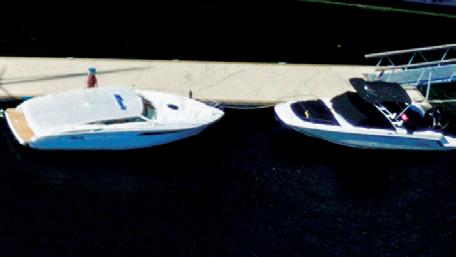

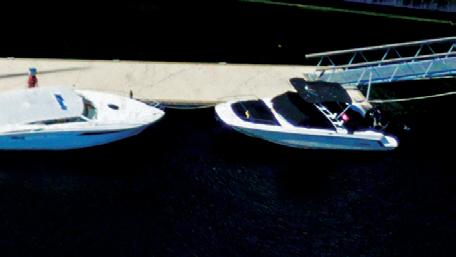
2-5 SEPTEMBER 2024 I OSLO, NORWAY

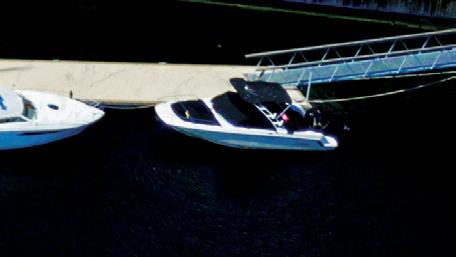


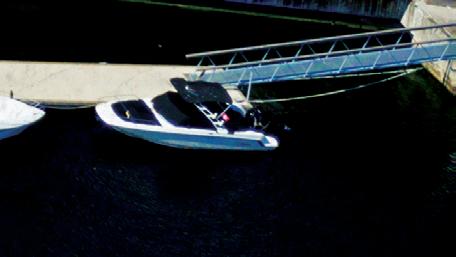
NETWORKING OPPORTUNITIES

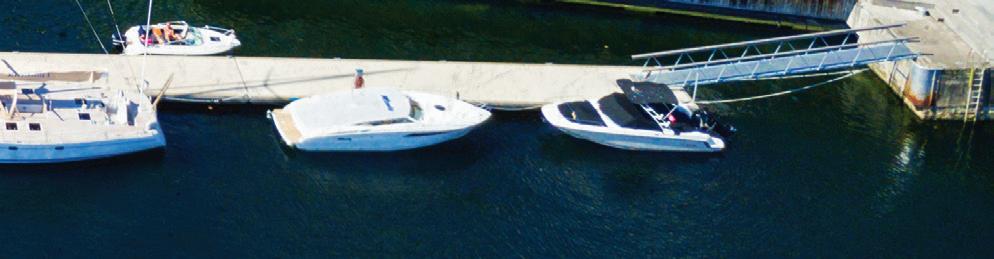


Doug Crice (Geostuff) takes exception to loose use of number conversions.
When you started your college education, if you came up through the engineering track instead of earth sciences, you probably had a lecture about numbers.
It went something like this: ‘The precision of a number is implied by the number of digits used’. For example, if a measurement (not a count) is given by ‘1’, that implies that the item being measured is more than ½ and less than 1½. If you want to be more precise, add some digits. 1.1 means more than 1.05 and less than 1.15. Notice that I am already breaking a rule here by using more precision than is implied.
To make an example another way, assume that you see a 1in long caterpillar. Now you know that caterpillars come in different sizes, and you know that this is an approximate number. But suppose I am writing for a scientific journal where some readers will think in metric, I convert the number and in parentheses say the caterpillar is 2.54 cm long. Obviously we don’t know the typical length of the caterpillar to 0.1 of a millimetre, so it would make more sense to say 2.5 cm, still implying more precision than our little worm justifies, or even better - 2½ cm.
Why am I dwelling on these numbers? Because geophysicists routinely make number conversions that are non-sensical. If a geophysicist is describing a resistivity survey using an array that will measure to a depth of 100 m, as a service to people who think in English units, it will be put in parentheses that the setup will work to depths of 328 ft (even worse, 328.1 ft). This is an actual example from a student’s poster paper at an SEG meeting. Obviously, that conversion is wrong: the depth penetration of a resistivity survey is always an approximate number and not precise to three digits. The correct conversion of that 100 m depth should be 300 ft.
So, the first rule of numbers is to use only enough digits to describe the precision of the measurement, adding some zeros when necessary to show the scale/magnitude.


Lest we think that our student was early in his/her career, let’s use an example from a published paper on soil classification for a seismic site by some experienced scientists:
‘The Vs30 values calculated for the forward and reverse shots are 285.62 m/s and 285.36 m/s, respectively, while the mid-point shot shows a Vs30 velocity of 253.59 m/s’.1
This is egregiously common now that we have replaced our slide rule by computers. Probably many of my readers have never used a slide rule, but it had the advantage that you only got the precision a calculation deserved.
Here’s another example of bad math; in this case from the Nuclear Regulatory Commission: ‘Comparison of WUS U-HS at surface of rock site (solid line) and UHS at free surface with a shear-wave velocity of 914m/sec (3,000 ft/sec) using transfer function corresponding to surface acceleration of 0.483g (Figure 6-170). Modified spectrum represents modification of surface soft rock motions to base-of-soil motions’.2
In this case, the writer started out in English Units with a perfectly reasonable number, 3000 ft/sec, and converted it to metric units. But of course, the shear-wave velocity isn’t known to three-digit precision. The correct conversion is 900 m/sec, not 914. And the legitimacy of calculating the acceleration to 0.001 g is certainly not reasonable.
There are exceptions. An American football field is 300 ft in length, or 91.44 m. In this case, 300 ft is an exact number and the metric conversion is correct.
There are actually precise rules which determine how numbers should be rounded: ‘The number of significant digits retained must be such that accuracy is neither sacrificed or exaggerated’.3
The author hopes that earth science instructors will pass on this simple rule to their students so that future geophysicists won’t be embarrassed by inappropriate use of significant digits in this rather inexact science.
1 Savas¸ Karabulut, Soil classification for seismic site effect using MASW and ReMi methods: A case study from western Anatolia (Dikili -izmir), Journal of Applied Geophysics Volume 150, March 2018, Pages 254-266. https://www.sciencedirect.com/science/article/abs/pii/S0926985117305943
2 Technical Basis for Revision of Regulatory Guidance on Design Ground Motions: Hazard- and Risk-consistent Ground Motion Spectra Guidelines, Risk Engineering, Inc, U.S. Nuclear Regulatory Commission. https://www.nrc.gov/docs/ML0131/ML013100012.pdf
3 The International System of Units (SI) Conversion Factors for General Use. NIST special publication 1038. https://www.govinfo.gov/content/pkg/GOVPUB-C13-f10c2ff9e7af2091314396a2d53213e4/pdf/GOVPUB-C13-f10c2ff9e7af2091314396a2d53213e4.pdf
Views expressed in this article are solely those of the author, who can be contacted at dcrice@geostuff.com

July 2024
30-31 Jul EAGE Workshop on Advanced Petroleum Systems AssessmentsIn Pursuit of Differentiated Barrels www.eage.org
August 2024
12-13 Aug 3 rd EAGE Conference on Carbon Capture & Storage Potential www.eage.org
14-15 Aug 4th EAGE Workshop on Fiber Optic Sensing for Energy Applications www.eage.org
14-15 Aug 1st EAGE/SUT Workshop on Integrated Site Characterization for Offshore Wind in Asia Pacific www.eage.org
18-23 Aug Goldschmidt 2024 conf.goldschmidt.info/goldschmidt/2024/meetingapp.cgi
2024
2-4 Sep Fourth EAGE Marine Acquisition Workshop www.eage.org
2-5 Sep ECMOR 2024 - European Conference on the Mathematics of Geological Reservoirs www.ecmor.org
3-5 Sep SGI - SIMP Congress www.geoscienze.org/bari2024
8-12 Sep Near Surface Geoscience Conference and Exhibition 2024 www.eagensg.org
30 th European Meeting of Environmental & Engineering Geophysics
5 th Conference on Geophysics for Mineral Exploration & Mining 4th Conference on Airborne, Drone & Robotic Geophysics
12-13 Sep First EAGE Workshop on The Role of AI in FWI www.eage.org
16-18 Sep Eighth EAGE High Performance Computing Workshop www.eage.org
17-19 Sep Fourth EAGE Conference on Pre-Salt Reservoir www.eage.org
2-5 SEPTEMBER 2024
www.ecmor.org Oslo, Norway
1-4 Oct 18 th SAGA Biennial Conference & Exhibition www.sagaconference.co.za
3-4 Oct Third EAGE Workshop on EOR www.eage.org
6-8 Oct EAGE Workshop on Naturally Fractured Rocks (NFR) www.eage.org
7-9 Oct GeoTerrace 2024 - International Conference of Young Professionals www.eage.org
14-16 Oct Third EAGE Conference on Seismic Inversion www.seismicinversion.org
15-16 Oct EAGE Conference on Energy Excellence: Digital Twins and Predictive Analytics www.eage.org
16-17 Oct Third EAGE Workshop on Advanced Seismic Solutions in the Gulf of Mexico www.eage.org
21-24 Oct GEO 4.0: Digitalization in Geoscience Symposium www.eage.org
29-30 Oct EAGE Workshop on Borehole Technologies - Pioneering Sustainable Solutions in Energy www.eage.org
4-7 Nov Fifth EAGE Global Energy Transition Conference and Exhibition www.eageget.org
EAGE Carbon Capture and Storage Conference Part of GET 2024 (Fifth EAGE Global Energy Transition Conference and Exhibition)
EAGE Geothermal Energy Conference Part of GET 2024 (Fifth EAGE Global Energy Transition Conference and Exhibition)

Over 75,000 papers and articles covering the main fields of study within geoscience, engineering and energy
All event papers from EAGE Events held around the world, as well as papers from partner associations
Works on all devices, IP address authenticated access from your smart phone, tablet, laptop or PC
Full access to leading scientific journals, including EAGE’s fl agship magazine First Break featuring top-quality submitted and commissioned research articles, news, special monthly topics, industry features and company profiles
Email earthdoc@eage.org to start your FREE TRIAL today!